Embed Size (px)
Citation preview

S t u d e n t I D : 1 1 0 1 3 0 1
A STUDY OF EXPLORING THE CAUSES OF DEVIATION AND
IMPROVING THE DELIVERY OF IT PROJECTS IN THE UAE
FEDERAL GOVERNMENT SECTOR
تكنولوجيا دراسة عن البحث في أسباب الانحراف وتحسين تطبيق مشاريع
دولة الإمارات العربية المتحدة المعلومات للقطاع الحكومي في
BY
MOHAMMED AHMED EL SAID
A dissertation submitted in fulfilment
of the requirements for the degree of
MASTER OF SCIENCE IN PROJECT MANAGEMENT
at
The British University in Dubai
Prof. Halim Boussabaine November 2017

S t u d e n t I D : 1 1 0 1 3 0 2
DECLARATION
I warrant that the content of this research is the direct result of my own work and that any use made
in it of published or unpublished copyright material falls within the limits permitted by
international copyright conventions.
I understand that a copy of my research will be deposited in the University Library for permanent
retention.
I hereby agree that the material mentioned above for which I am author and copyright holder may
be copied and distributed by The British University in Dubai for the purposes of research, private
study or education and that The British University in Dubai may recover from purchasers the costs
incurred in such copying and distribution, where appropriate.
I understand that The British University in Dubai may make a digital copy available in the
institutional repository.
I understand that I may apply to the University to retain the right to withhold or to restrict access
to my thesis for a period which shall not normally exceed four calendar years from the
congregation at which the degree is conferred, the length of the period to be specified in the
application, together with the precise reasons for making that application.
Signature of the student
S t u d e n t I D : 1 1 0 1 3 0 3
COPYRIGHT AND INFORMATION TO USERS
The author whose copyright is declared on the title page of the work has granted to the British
University in Dubai the right to lend his/her research work to users of its library and to make partial
or single copies for educational and research use.
The author has also granted permission to the University to keep or make a digital copy for similar
use and for the purpose of preservation of the work digitally.
Multiple copying of this work for scholarly purposes may be granted by either the author, the
Registrar or the Dean of Education only.
Copying for financial gain shall only be allowed with the author’s express permission.
Any use of this work in whole or in part shall respect the moral rights of the author to be
acknowledged and to reflect in good faith and without detriment the meaning of the content, and
the original authorship.
S t u d e n t I D : 1 1 0 1 3 0 4
ABSTRACT
UAE is consider pioneer in adopting new e-services in the MENA region. This study was
conducted to highlight the importance of e-Services for UAE residents and identifying the causes
that may limit the user of e-Services. Data was collected and analyzed based on based on
quantitative research approach and both factor analysis and regression analysis were implied on
the collected data. Two hypothesis were tested in the following study. First hypothesis was related
to identifying whether the delays in delivery of e-services negatively impacts the effectiveness of
the e-services while the second hypothesis was to test whether shortage of funds, poor decision
making abilities, ineffective communication skills and poor management structure are the primary
causes of delays in delivery of IT services.
After applying the required analysis for the first hypothesis, the results are contrary to our
hypothesis, which means that we have to reject our first hypothesis that delays in delivery of e-
services negatively affect the effectiveness of e-services. The study also show that we have
sufficient evidence that delays in delivery of IT projects are caused by ineffective communication
skills, shortage of funds, poor management structure and poor decision making abilities. Therefore,
we have to accept our second hypothesis.
The future studies should focus on predicting the main factors for delay in IT related projects along
with comparing different software houses to compare the causes and predicting factors for the
delay in IT related projects

S t u d e n t I D : 1 1 0 1 3 0 5
مختصرة نبذة
تعتبر الإمارات العربية المتحدة رائدة في تبني خدمات إلكترونية جديدة في منطقة الشرق الأوسط وشمال
أفريقيا. أجريت هذه الدراسة لتسليط الضوء على أهمية الخدمات الإلكترونية لسكان دولة الإمارات العربية
خدمات الإلكترونية.ال استخدامالمتحدة وتحديد الأسباب التي قد تحد من
تم جمع البيانات وتحليلها استنادًا إلى منهج البحث الكمي وتم تضمين تحليل العوامل وتحليل الانحدار
(Factor Analysis and Regression Analysis ).على البيانات المجمعة
بتحديد ما إذا كان التأخير في تقديم تم اختبار فرضيتين في الدراسة التالية. كانت الفرضية الأولى متعلقة
الخدمات الإلكترونية يؤثر سلباً على فعالية الخدمات الإلكترونية بينما كانت الفرضية الثانية هي اختبار ما
إذا كان النقص في الأموال وضعف قدرات اتخاذ القرار ومهارات الاتصال غير الفعالة وهيكلة الإدارة
.تأخير في تقديم خدمات تكنولوجيا المعلوماتالضعيفة الأسباب الرئيسية لل
مما يعني أنه يجب علينا رفض فرضيتنا،تتعارض النتائج مع الأولى،بعد تطبيق التحليل المطلوب للفرضية
بأن التأخير في تقديم الخدمات الإلكترونية يؤثر سلبًا على فعالية الخدمات الإلكترونية. كما أظهرت الفكرة
أدلة كافية على أن التأخير في تسليم مشاريع تكنولوجيا المعلومات ناجم عن عدم كفاءة الدراسة أن لدينا
علينا قبول لذلك،مهارات الاتصال ونقص الأموال وضعف هيكل الإدارة وضعف قدرات اتخاذ القرار.
.فرضيتنا الثانية
المشاريع المتعلقة يجب أن تركز الدراسات المستقبلية على التنبؤ بالعوامل الرئيسية للتأخير في
إلى جانب مقارنة دور البرمجيات المختلفة لمقارنة الأسباب والتنبؤ بعوامل التأخير المعلومات،بتكنولوجيا
في مشاريع تكنولوجيا المعلومات ذات الصلة.
S t u d e n t I D : 1 1 0 1 3 0 6
Table of Contents DECLARATION ............................................................................................................................................. 2
COPYRIGHT AND INFORMATION TO USERS ............................................................................................. 3
ABSTRACT ....................................................................................................................................................... 4
مختصرة نبذة ...................................................................................................................................................... 5
1. CHAPTER ONE: INTRODUCTION ......................................................................................................... 9
1.1 STUDY BACKGROUND ....................................................................................................................... 9
1.2 STATEMENT OF THE PROBLEM ......................................................................................................... 10
1.3 SIGNIFICANCE OF THE STUDY .......................................................................................................... 11
1.4 STUDY AIMS AND OBJECTIVES ......................................................................................................... 14
1.5 STUDY DESIGN............................................................................................................................... 15
1.6 STUDY STRUCTURE ........................................................................................................................ 15
2. CHAPTER TWO: LITERATURE REVIEW .............................................................................................. 17
2.1 INTRODUCTION .............................................................................................................................. 17
2.2 BENEFITS AND OUTCOMES OF E-GOVERNMENT SERVICES .................................................................... 18
2.3 INFORMATION AND TECHNOLOGICAL ADVANCEMENT IN UAE ............................................................. 19
2.4 E-GOVERNMENT DEVELOPMENT AND E-PARTICIPATION..................................................................... 20
2.5 FACTORS CAUSING DELAY IN IMPLEMENTATION AND ADAPTATION OF E-GOVERNMENT PROJECT ............. 24
2.6 CHANGES DURING THE IMPLEMENTATION PROJECT THAT EFFECT THE TIME FRAME ................................ 33
2.7 PROCEDURE TO IMPROVE PROJECT PERFORMANCE ............................................................................. 37
2.8 CONCLUSION ................................................................................................................................. 38
3. CHAPTER THREE: METHODOLOGY ................................................................................................... 40
3.1 INTRODUCTION .............................................................................................................................. 40
3.2 RESEARCH APPROACH ..................................................................................................................... 40
3.3 RELEVANCE OF THE RESEARCH APPROACH ........................................................................................ 41
3.4 RESEARCH QUESTION ...................................................................................................................... 41
3.5 RESEARCH HYPOTHESIS .................................................................................................................. 42
3.6 SAMPLING TECHNIQUE .................................................................................................................... 42
3.7 DATA COLLECTION ......................................................................................................................... 43
3.8 DATA ANALYSIS ............................................................................................................................. 44
4. CHAPTER FOUR: ANALYSIS ............................................................................................................. 45
4.1 DESCRIPTIVE STATISTICS ................................................................................................................ 45
4.2 IMPORTANCE OF SUCCESSFUL IMPLEMENTATION OF E-SERVICES .......................................................... 47
S t u d e n t I D : 1 1 0 1 3 0 7
4.3 SIGNIFICANCE OF PLANNING IN E-GOVERNMENT ................................................................................. 48
4.4 FACTORS LEADING TO AN INCREASE OF THE USE OF E-SERVICES .......................................................... 49
4.5 BENEFITS OF E-SERVICES ................................................................................................................. 50
4.6 CAUSES LIMITS THE SUCCESSFUL IMPLEMENTATION OF E-SERVICE ...................................................... 51
4.7 FACTORS AFFECTING THE DELAYED DELIVERY OF E-SERVICES ............................................................. 53
4.8 NEED OF COST MANAGEMENT FOR SUCCESSFUL IMPLEMENTATION OF E-SERVICES ................................ 54
4.9 FACTOR ANALYSIS ......................................................................................................................... 55
4.10 REGRESSION ANALYSIS................................................................................................................... 61
4.10.1 TESTING 1ST HYPOTHESIS .................................................................................................................. 61
4.10.2 TESTING 2ND HYPOTHESIS ................................................................................................................. 63
5. CHAPTER FIVE: CONCLUSION .......................................................................................................... 68
5.1 FUTURE RESEARCH ........................................................................................................................ 70
REFERENCES .................................................................................................................................................. 71
APPENDIX ...................................................................................................................................................... 76
List of Figures
Figure 1: UAE Federal eGovernment Evolution, Adapted (Al-Khouri, 2012) ................................................... 12
Figure 2: Percentage of internet populations at different Middle East (Internet World Stats, 2016) .................. 13
Figure 3: E-government initiative in major countries of the Middle East region (Abdelhafez & Amer, 2014) . 22
Figure 4: E-participation index of Middle East countries (UN Report, 2010) .................................................... 23
Figure 5: Respondent’s Age Group .................................................................................................................... 45
Figure 6: Respondent’s Gender .......................................................................................................................... 45
Figure 7: Respondent’s Educational Background ............................................................................................... 46
Figure 8: Respondent’s Work Experience .......................................................................................................... 46
Figure 9: Respondent’s opinion regarding the Importance of Successful Implementation of E-Services .......... 48
Figure 10: Respondent’s opinion regarding the Significance of Planning in E-Government ............................. 49
Figure 11: Respondent’s opinion regarding the factors leading to an increase of the use of e-services ............. 50
Figure 12: Respondent’s opinion regards the benefits of e-services ................................................................... 51
Figure 13: Respondents’ opinion regarding causes that limit successful implementation of e-services ............ 53
Figure 14: Respondents’ opinions regarding delayed delivery of IT services .................................................... 54
Figure 15: Screen Plot ......................................................................................................................................... 58
S t u d e n t I D : 1 1 0 1 3 0 8
List of Tables
Table 1: Information and technological advancement in UAE (Business Monitor International, 2014) ............ 20
Table 2: Development of E-Government services in the UAE (Abdelhafez & Amer, 2014) ............................. 21
Table 3: E-participation index (Abdelhafez & Amer, 2014) .............................................................................. 23
Table 4: Respondent’s opinion regarding the Importance of Successful Implementation of E-Services ........... 47
Table 5: Respondent’s opinion regarding the Significance of Planning in E-Government ................................ 48
Table 6: Respondent’s opinion regarding the factors leading to an increase of the use of e-services ................ 49
Table 7: Respondent’s opinion regards the benefits of e-services ...................................................................... 51
Table 8: Respondents’ opinion regarding causes that limit successful implementation of e-services ................ 52
Table 9: Respondents’ opinions regarding delayed delivery of IT services ....................................................... 54
Table 10: Respondents’ opinions regarding delayed delivery of IT services ..................................................... 55
Table 11: Bartlett's Test ...................................................................................................................................... 56
Table 12: Communalities .................................................................................................................................... 57
Table 13: Total Variance .................................................................................................................................... 57
Table 14: Rotated Component Matrix ................................................................................................................ 59
Table 15: Component Transformation Matrix .................................................................................................... 60
S t u d e n t I D : 1 1 0 1 3 0 9
1. CHAPTER ONE: INTRODUCTION
1.1 STUDY BACKGROUND
The significant advancement in information and communication technologies has occurred on the
basis of the emergence of the internet, web based technologies and international networked
economies. In the presently rising competitive and globalized business environment, e-
technologies play a crucial role in the day-to-day lives. The emergence of e-services has distorted
the technical, economical, political as well as societal backgrounds (Chen & et al., 2006). An
enormous revolution in the technological aspects all over the world is taking place and most
nations adopt technological applications to offer services with the help of these technologies. E-
government offers electronic structures and electronic services instead of conventional systems
and services so that people can be served in better ways (Evans & Yen, 2005). There are many
benefits of e-services and mobile services offered by the government so that wastage of time and
efforts can be reduced. Additionally, in order to enhance the efficiency of the organizations and to
facilitate the allocation of information between the government departments and other sectors, e-
government offers incessant services for citizens (Carter & Belanger, 2004). Moreover, e-
government services help in reduce bribery, ameliorate conviction, and improved safety in
information system. Furthermore, better health and education services can be offered to citizens,
especially those that have special needs (Parent et al., 2004). Collaboration and the supportive
nature of people can be promoted in the organization with the help of e-government services (Hung
et al., 2006). Therefore, it can be stated that a significant improvement is essential information
technology in the government sector of every developing nations as it can offer amplified
opportunities for effort and commercial purpose (Li, 2003). Electronic and mobile services offered
by government departments can persuade citizens to partake in the work and decision making
S t u d e n t I D : 1 1 0 1 3 0 10
process of the government that can facilitate the overall development of the nation. This is a better
way for every government to interact directly with the citizens by abolishing the intervention of
mediators in no time. Thus, it is critical to ensure that projects should not get delayed and this has
enhanced the need for identifying the critical factors that are responsible for delay and
improvement of information technology projects. In this context, the present paper intends to
identify the different success and delaying factors that are responsible for the delivery of mobile
services and e-services projects in the UAE Federal Government Sector.
1.2 STATEMENT OF THE PROBLEM
According to the report of Global Information Technology 2010-2011, United Arab Emirates leads
the MENA region in adopting information technology (NEWCOMBE, 2014). E-government
planning of the UAE government considered as critical step for achieving UAE Vision 2021 as a
principle initiative of the 2012-13 UAE government strategy (Dutta & Mia, 2011). E-services and
mobile services of the UAE government have evolved significantly since 2001. Some of the
popular e-services launched by the government is e-Dirham, e-government program, e-
government strategy, e-government implementation plan and e-government portal. In 2010, the
government has adopted development of the Government Service Development Strategy, which
become the third basic element of the strategy of e-government (Al-Khouri & Bal, 2007). A
significant number of studies have been conducted for identifying the factors that create influence
on the citizens’ intention to adopt e-government services (Baker & Bellordre, 2004). Some of the
important factors that play crucial roles for encouraging citizens for adopting E-government
services are expediency, user-friendliness, trustworthiness, compatibility, external impact, internet
safety and relative advantage (Nysveen et al., 2005). Some studies state that due to lack of
awareness, gender differences, cultural divergences and lack of benefits given to the tax payers of
S t u d e n t I D : 1 1 0 1 3 0 11
online services can hinder the growth process of e-services offered by the government (Parent et
al., 2004). Till this day, a little study have been conducted for exploring the factors that affect the
delay and improvement of the e-services and mobile services by the government in developing
nations, specifically in the Arab world. In spite of the fact that the research studies have examined
elements that identify the acceptance of e-government facilities by employing various models,
namely, the Unified Theory of Acceptance and Use of Technology (UTAUT) model(AlAwadhi &
Morris, 2008), few research has been conducted for identifying the factors which can create
significant impact on the recognition of e-government services and mobile services in developing
nations, such as United Arab Emirates(AlShihi, 2005). The present research study has been made
to fill this gap in literature. The precise objective of the present research study is to achieve insight
about the factors that affect the delay and improvement of e-government services and mobile
services in the United Arab Emirates.
1.3 SIGNIFICANCE OF THE STUDY
With the rapid expansion in the information and technology initiatives, the United Arab Emirates
is recognized as one of the most advanced nation that offer world class information technology
and communication framework. The local initiatives corresponding to the e-government facilities
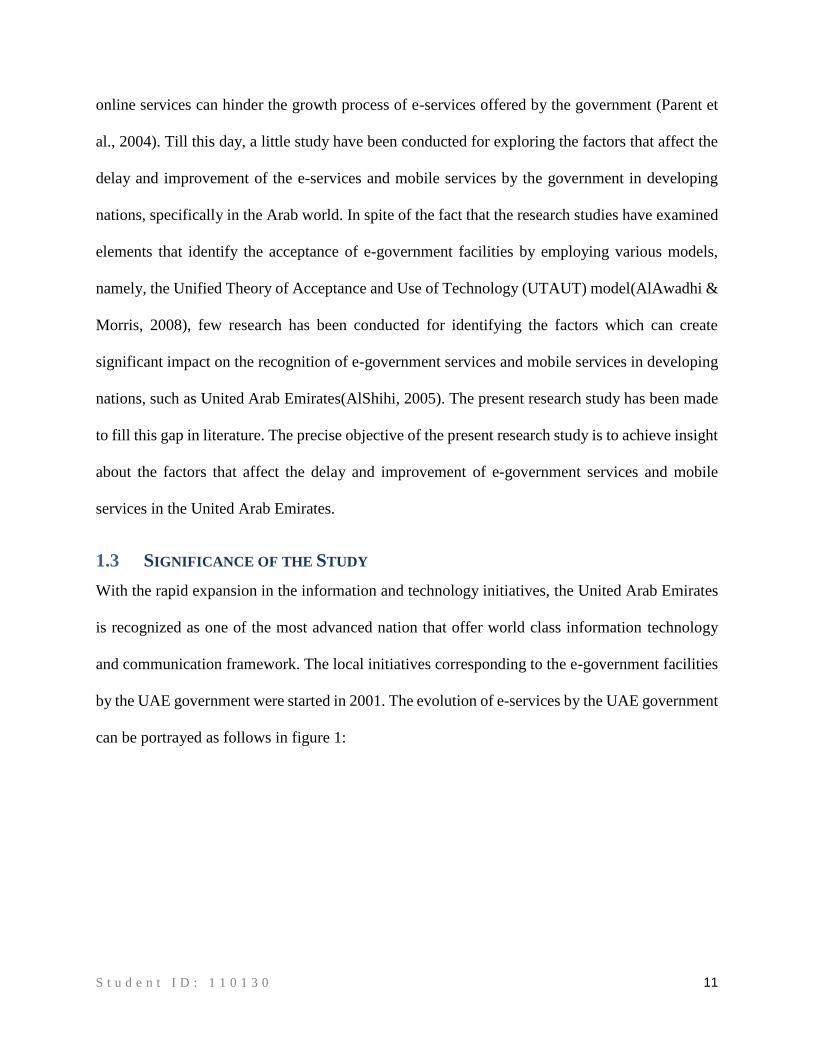
by the UAE government were started in 2001. The evolution of e-services by the UAE government
can be portrayed as follows in figure 1:
S t u d e n t I D : 1 1 0 1 3 0 12
Figure 1: UAE Federal eGovernment Evolution, Adapted (Al-Khouri, 2012)
UAE has achieved a rank of 28 in the 2012 as per the survey against the rank of 49 in the 2010
survey in terms of achieving success in the e-government facilities and services (UNPACS, 2014).
As per the report of the 2010 survey, UAE has acquired a rank of seven in terms of the online
service index (UNPACS, 2014). Recently, the UAE government has proclaimed a revised e-
Government Transformation Strategic Framework by incorporating various strategic proposals at
a federal level so that all government services can be transformed and be made accessible through
S t u d e n t I D : 1 1 0 1 3 0 13
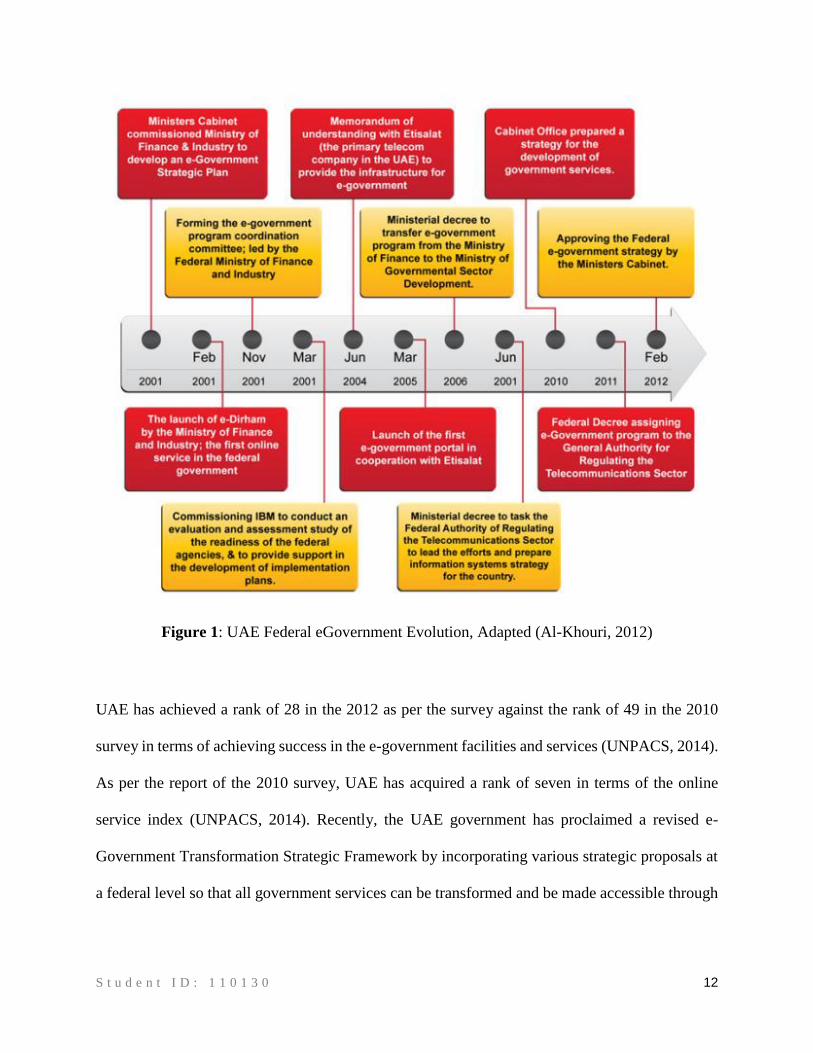
different channels. These strategies have helped penetrate the highest percentage of internet users
among all other Middle East regions. This fact is portrayed as follows in figure 2:
Figure 2: Percentage of internet populations at different Middle East (Internet World Stats,
2016)
The above figure portrays that the United Arab Emirates has the highest percentage of internet
user populations with approximately 70 percent of the people followed by Qatar. The initiation of
e-services in the public sector is the signal for transformation of economic activities from the
conventional information monopolies and hierarchies. However, e-service remains a challenge for
both the citizens and government for almost every developing nation (Nikkhahan et al., 2009). The
government has to take necessary steps not only to maximize the benefits obtained from the online
services but also to mitigate the risks incurred from economical, social and cultural aspects that
are related to rapid technological change. Thus, it is primarily important to focus on identifying
S t u d e n t I D : 1 1 0 1 3 0 14
the factors that can affect the delivery of e-services and mobile services instead of focusing on the
achievements in the technological solutions. The present study is significant in the sense that the
outcomes of the study can increase the speed of delivering for e-services offered by the UAE
government departments. Moreover, it can also remove obstacles that increase the budget of the
federal government. No significant literature studies have been conducted to identify the critical
success factors that can influence the delivery of IT projects in the United Arab Emirates. Thus, it
is expected that the findings and outcomes of the present paper can help policy makers and
government departments to better understand the way to develop and improve the delivery and
quality of e-services in the United Arab Emirates. The identification of the critical success factors
can cover three major dimensions such as environment, readiness and service. It can add rich value
to the recognition of gaps and opportunities in the e-government facilities offered by the UAE
government.
1.4 STUDY AIMS AND OBJECTIVES
The present study principally aims to classify the factors that are responsible for increasing and
deteriorating the delivery of e-services and mobile services by the government of the United Arab
Emirates. To accomplish this aim, the research objectives of the present study are structured as
follows:
Explore the key causes of delay in delivering the electronic services and mobile services
offered by the government of the United Arab Emirates.
Assess the number of changes incurred during the implementation process of the electronic
projects that affect the timeframe of the projects.
S t u d e n t I D : 1 1 0 1 3 0 15
Recommend the best practices for which the adoption of e-services and mobile services
can be implemented effectively by the UAE government sector by reducing the overall
timeframe.
1.5 STUDY DESIGN
The present research study is based on the quantitative research approach. This approach can help
identify the factors responsible for altering the speed of delivering information technology projects
implemented by the UAE government. Quantitative research study is primarily based on the
extensive review of literatures. Secondary information about the electronic services have been
collected from books, peer reviewed journals and research reports including various international
media.
1.6 STUDY STRUCTURE
The entire study is divided into five major chapters: Introduction, Literature review, Methodology,
Data analysis & Findings, and Conclusion and Recommendation.
In the introduction chapter, a brief overview of the study topic has been presented. At first, the
current position and rank of United Arab Emirates has been evaluated in terms of offering e-
services and mobile services to the citizens. In the next stage, the significance of identifying the
factors responsible for delivery of the e-services of the UAE government has been discussed.
In the Literature Review chapter, an extensive review of different literatures has been conducted
through which a deeper insight can be generated on e-services offered by the government. The
critical evaluation of the findings obtained from different literatures can help understand the role
of the planning process, budgetary framework and scope on the timeline of the IT project.
S t u d e n t I D : 1 1 0 1 3 0 16
The Methodology chapter discusses different research approaches that have been adopted to
accomplish the research objectives to identify the factors that can enhance the efficiency of e-
services and mobile services offered by the UAE government.
The data and information collected from various sources have been analyzed in Analysis chapter.
The last chapter Conclusion, presents a summary of the findings obtained from the entire study.
On the basis of the findings, some recommendations have also been made for which the efficiency
and delivery speed of e-services and mobile services can be improved in the UAE Federal
government sector.
S t u d e n t I D : 1 1 0 1 3 0 17
2. CHAPTER TWO: LITERATURE REVIEW
2.1 INTRODUCTION
The E-government initiative can be referred to as the method of using all available information
and communication technologies in order to assist regular administration service of the
government. The administrative service offered by the government through internet helps improve
citizen’s access to the government information activities (Chen & et al., 2006). Moreover, it also
helps to ensure the participation of citizens in the government activities and satisfy the customers
with the services. In a developing nation like the UAE, the e-government service can put up
specific situations, conditions, requirements and hindrances (Dutta & Mia, 2011). The major
problem with the e-government service occurs on account of poor infrastructural facilities and
provisions, corruption, feeble educational structure as well as asymmetrical access to the skills and
technology (Al-Khouri & Bal, 2007). Poor accessibility to available resources and poor
technological advancements is compounded by a lack of accessibility to the proficiency and
information. The e-government services offered through the usage of mobile devices not only
provides economical and consistent services to citizens but it can also help the public sector
reshape into a new form and restructure with full potential (Carter & Belanger, 2004). These facets
can help strengthen the relationship between citizens, enterprises and government by providing
permission for the open communication, involvement and public speeches in the process of prepare
national rules and regulations (Hung et al., 2006). In the current section, the researcher has
conducted an inclusive aggregated analysis of different literatures in order to appraise the e-
government projects offered by the UAE government. The aggregated analysis has been conducted
after reviewing different scholarly articles, books, dissertations and conference proceedings. A few
studies have been conducted to evaluate the IT projects offered by the UAE government and thus
S t u d e n t I D : 1 1 0 1 3 0 18
the present study has tried to fill this gap in literature. The review of the literatures in the present
section focuses on three major segments. First, it aims to evaluate the present status of e-
government projects in UAE. Secondly, it aims to identify the factors that cause delay in
implementing IT projects by the UAE government. Thirdly, it aims to identify ways for which the
UAE government can improve the speed and quality of implementing IT projects.
2.2 BENEFITS AND OUTCOMES OF E-GOVERNMENT SERVICES
The advancement in mobile technology significantly helps expand the capacity and ability of
government so that it can deliver quality and timely services to citizens and business. Mobile
government facilitates a capable and transformational ability to both expand access to existing
administration, and grow the conveyance of new administrations (Bhavnani et al., 2008).
Moreover, it also helps expand the cooperation in government operations, moving past the
underlying grouping of e-government on trade and e-tax assessment and enhancing internal
operations. This helps encourage civic engagement, along with the establishment of translucent
democracy, instructive progression and creative wellbeing administrations (OECD , 2009). The
merger of cell phones as well as innovative media applications can help reinforce immediate access
to coordinated information; location based benefits, and engaged nationals from the foundation of
the rising effect of mobile services. Mobile and electronic technologies help enhance the value of
government services such as the following: Electronic wallet card connected to a cellular telephone
in Bahrain, the United Arab Emirates or the Philippines voting, enlistment and decision making in
Morocco, Kenya, Estonia and Ukraine,supporting the farmers with climate and market price
alarms (United Nations Department of Economic and Social Affairs, 2008). Thus, e-services
supported with simultaneous applications in mobile phones are deemed as being a user-friendly
solution with positive effects on the expected service take-up (European Commission, 2004). In
S t u d e n t I D : 1 1 0 1 3 0 19
fact, e-services have been considered essential for easing out the structural changes in major
organizations, which further gives way to increased flexibility and innovativeness. For instance,
as listed out by Byrd and Turner (2001), numerous dimensions of high-tech flexibility such as data
transparency, compatibility, technology management, technical skills, connectivity, functional
skills, etc. have been associated with such changes. Particularly, Malhotra (2001) has recognized
technology flexibility as the ability to cope with the integration of new e-Business applications
with the existing infrastructures. The multi-focused, multidisciplinary teams, which are created in
context of the introduction of e-services in organizations, are simultaneously associated with the
need to increase mutual understanding among the various individuals involved. The continual
functioning of e-services across organizations mandates an increased level of communication
among the personnel involved, which is further claimed to result in enhanced professional,
interpersonal and management skills through the strategies, resources, and approaches used by
several disciplines (NCPEA).
Another common advantage associated with e-governance services is its high reliability factor,
which lends it greater trustworthiness among other services (European Commission, 2004). As
noted by several researchers including Miyazaki & Fernandez (2001), Bélanger et al., (2002),
Bélanger & Hiller (2005), the e-government research is dominated by the issues pertaining to
‘privacy’ and ‘security’.
2.3 INFORMATION AND TECHNOLOGICAL ADVANCEMENT IN UAE
Government expenditure and investment in cloud computing and business analytics hold up the IT
market segment in the United Arab Emirates (AlAwadhi & Morris, 2008). The expenditure on
information and technological advancement has increased to US$4.7 billion in the year 2013 from
US$3.9 billion in the year 2012. The advancement of the computer business segment improves the

S t u d e n t I D : 1 1 0 1 3 0 20
aggregated equipment incomes to US$ 2.4 billion in the year 2013 from US$ 2.2 billion in the
2012 (UNPACS, 2014). The expenditure on software packages in United Arab Emirates expected
to increase up to US$ 843 million in the 2013, increasing 10% against the previous year (UNPACS,
2014). United Arab Emirates has the third most noteworthy rate of internet users in the Middle
East region. United Arab Emirates has 5.859 million Internet clients, which signifies that the
internet penetration rate is 70.9 percent of the UAE’s population (Enzer, 2011). The United Arab
Emirates has one of the most noteworthy mobile device users all over the world which is 166.9%
toward the end of 2012 and the aggregate number of mobile users has increased to 13.775 million
(Dubai Chamber, 2015). The development status of information technology in United Arab
Emirates is presented as follows:
Table 1: Information and technological advancement in UAE (Business Monitor International,
2014)
The UAE has two operators implementing improvement to their system framework, utilizing the
4G LTE system (Business Monitor Worldwide UAE, 2013b; TRA, 2012).
2.4 E-GOVERNMENT DEVELOPMENT AND E-PARTICIPATION
The e-Government advancement or availability as indicated by the United Nations survey
incorporates online administrations, human capital and telecom frameworks as reflected in table
2. As per the study conducted by the United Nations in 2012, UAE acquired one of the top 25
S t u d e n t I D : 1 1 0 1 3 0 21
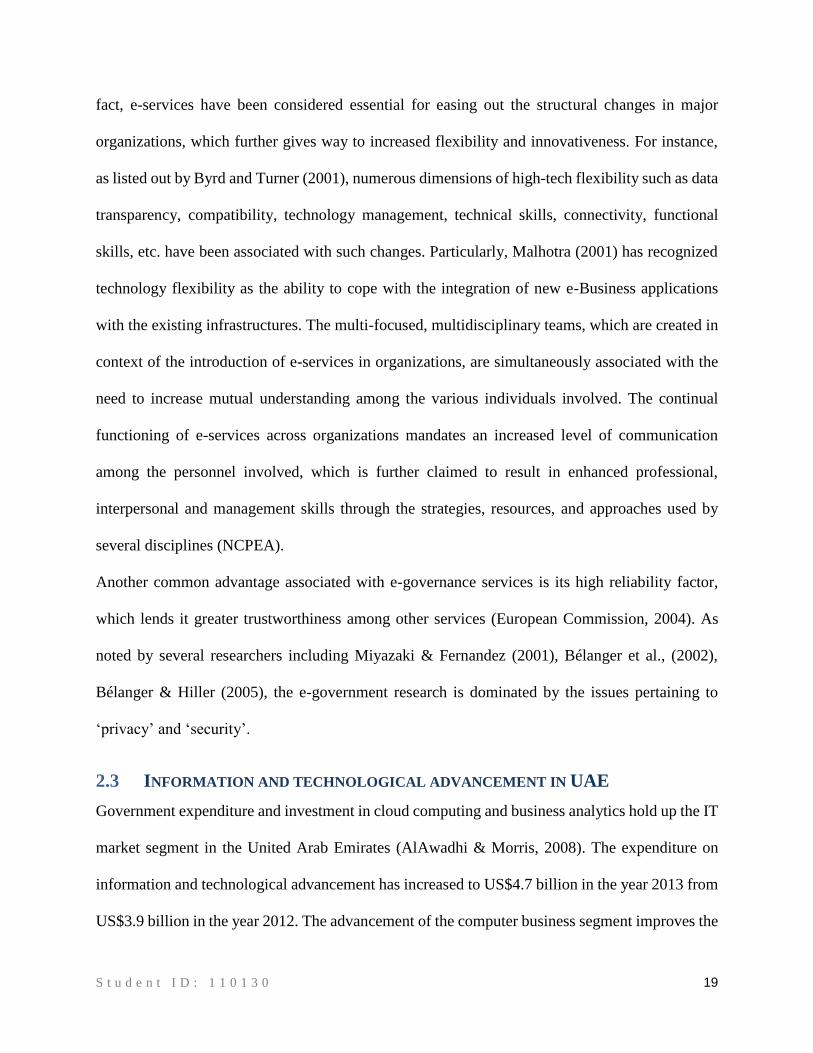
world pioneers in e-Government advancement with a value index of 0.7344 (UNPACS, 2014).
According to the worldwide ranking, UAE propelled 21 points from rank 49 in 2010 to rank 28 in
2012. UAE likewise gained ground in its online administrations with an index value of 0.8627 in
2012 against 0.2503 in 2010 (NEWCOMBE, 2014). The United Arab Emirates' e-government
methodology offers high quality services, customer centric service and integrated government
services. It concentrates on infrastructure development, system availability, service accessibility,
citizen consideration, and improvement of a national identity management framework (Dutta &
Mia, 2011). Moreover, the objective of the e-government gateway is to give better administrations
to customers and embrace them in the government approaches, laws, and public interest activities.
UAE delivers government services through different channels, such as free access to public service
through stands or Wi-Fi and mobile-based networks, such as mobile web application (Al-Khouri,
2012).
Table 2: Development of E-Government services in the UAE (Abdelhafez & Amer, 2014)
The above table shows that Egypt had not shown much improvement in its e-government readiness
as well as the e-government development index. Due to its inability to keep pace with the
development rate of other countries, the global ranking of Egypt has fallen in 2012. Saudi Arabia
also made progress in terms of online services. Considering the readiness index in terms of e-
government development, figure 3 can be considered.
S t u d e n t I D : 1 1 0 1 3 0 22
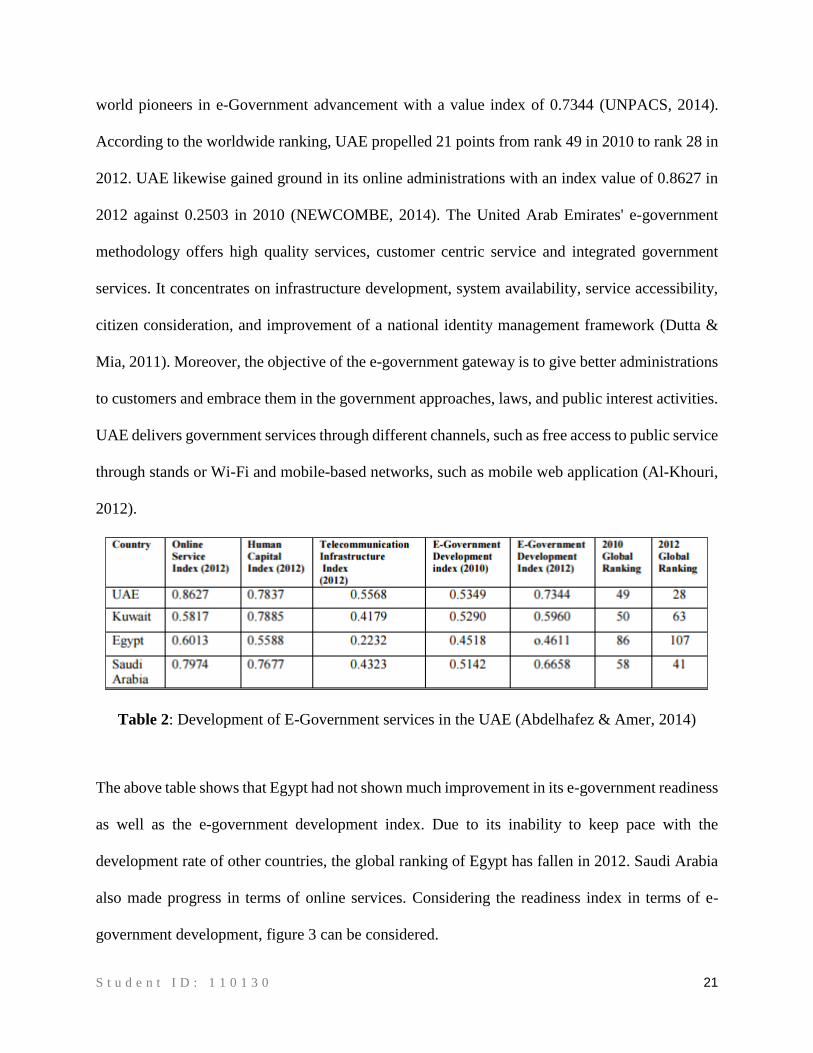
Figure 3: E-government initiative in major countries of the Middle East region (Abdelhafez &
Amer, 2014)
In figure 3, the e-government initiative in the UAE, Saudi Arabia and Kuwait shared exceptional
progression. The governmental gateways of these nations empower numerous resident
transactional services through the web and utilize multi-channels to give the services. Then again,
Egypt shared little advance in its e-government advancement.
E-participation
E-participation is a technique that empowers governments to communicate with their citizens. To
improve the government's capacity to communicate and get feedback from the citizens,
government gateways must have surveys, overviews, or input bases. Therefore, e-participation
evaluates how governments interfacing with citizens utilizing web2.0 techniques, (for example,
web journals, SMS and visit rooms), correspondence advances, (for example, Facebook and
twitter) and other informal community devices (UN Report, 2012). UAE, Saudi Arabia and Egypt
made amazing progress in e-investment as indicated by the UN study 2012 as appeared in figure
6 (UNPACS, 2014).
S t u d e n t I D : 1 1 0 1 3 0 23
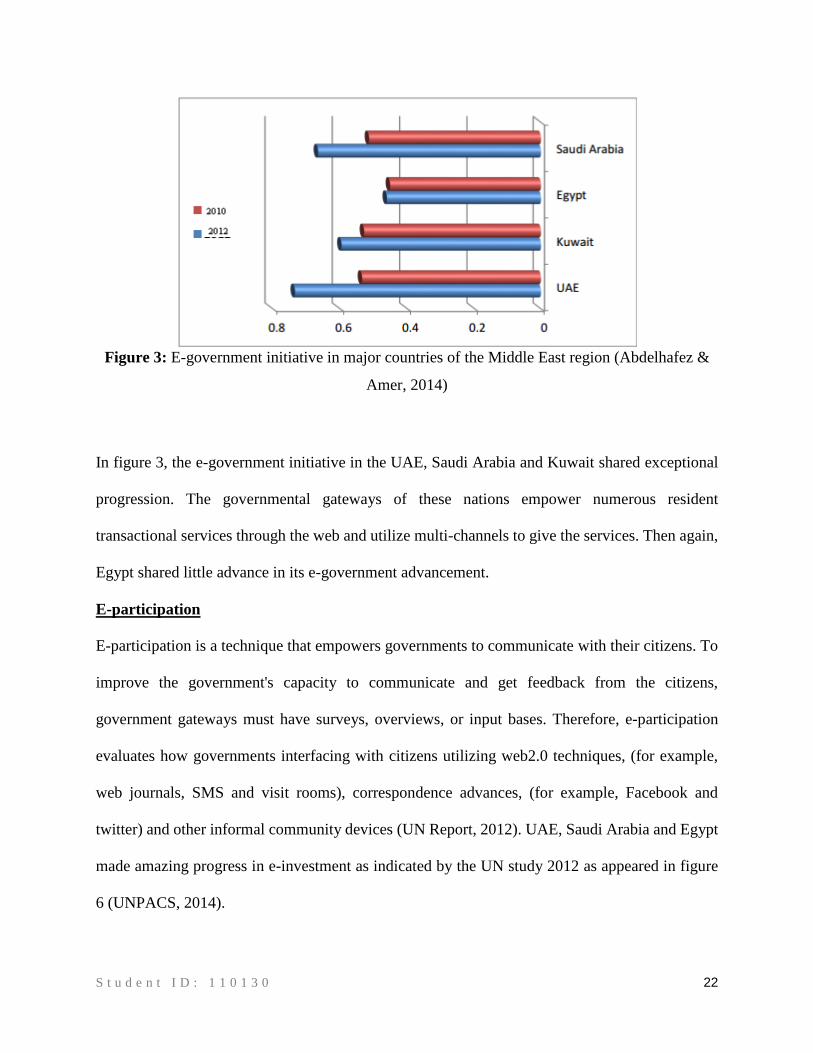
Table 3: E-participation index (Abdelhafez & Amer, 2014)
UAE is one of the best nations performing e-participation and it has captures the sixth position in
global ranking as appeared in table 3. The Emirates government gateway has been connected with
various stages like forums, web journals, blogs, overviews and surveys to encourage successful
correspondence between the government and its citizens.
This gateway has an updated listing of important contact numbers, input channels for government
services and long range informal communication records of the elected elements. The
developmental path for the e-participation index is reflected as follows:
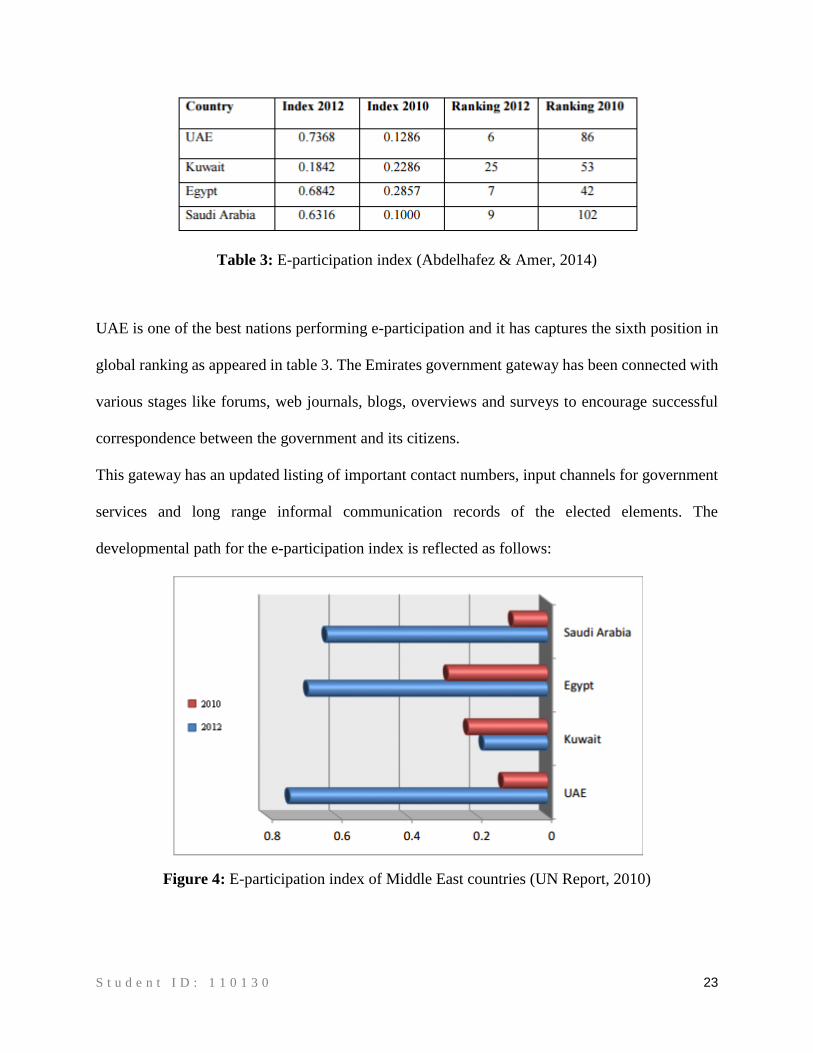
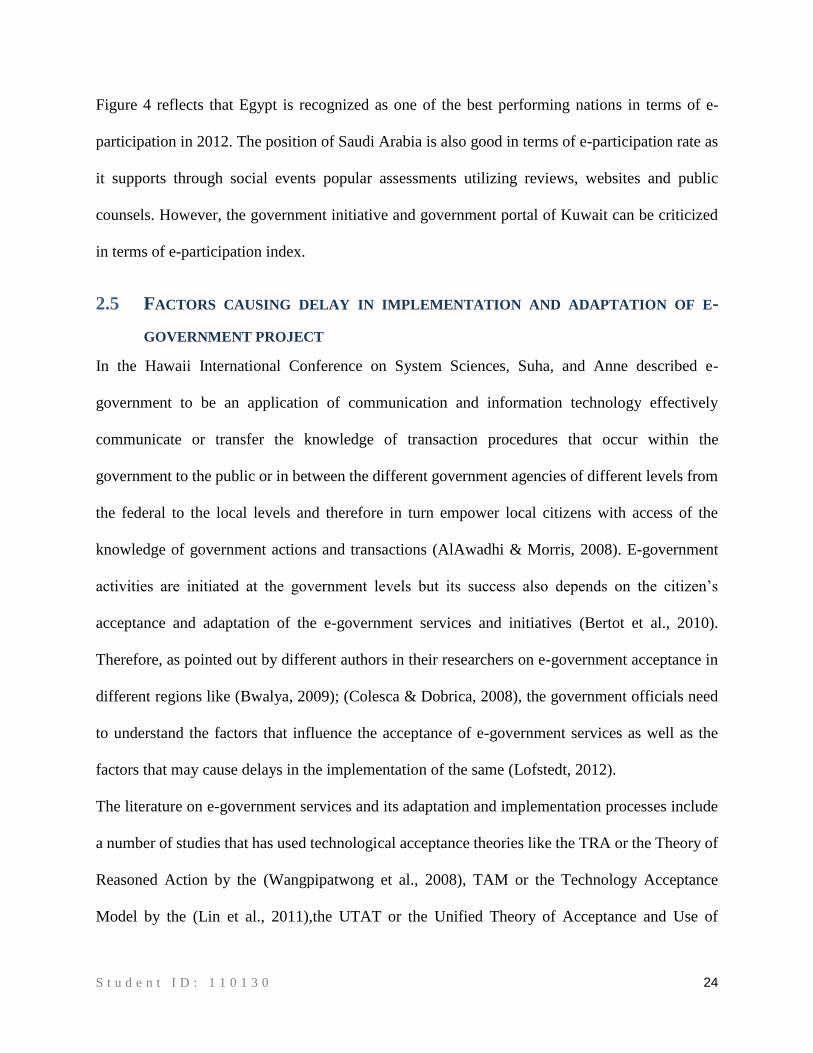
Figure 4: E-participation index of Middle East countries (UN Report, 2010)
S t u d e n t I D : 1 1 0 1 3 0 24
Figure 4 reflects that Egypt is recognized as one of the best performing nations in terms of e-
participation in 2012. The position of Saudi Arabia is also good in terms of e-participation rate as
it supports through social events popular assessments utilizing reviews, websites and public
counsels. However, the government initiative and government portal of Kuwait can be criticized
in terms of e-participation index.
2.5 FACTORS CAUSING DELAY IN IMPLEMENTATION AND ADAPTATION OF E-
GOVERNMENT PROJECT
In the Hawaii International Conference on System Sciences, Suha, and Anne described e-
government to be an application of communication and information technology effectively
communicate or transfer the knowledge of transaction procedures that occur within the
government to the public or in between the different government agencies of different levels from
the federal to the local levels and therefore in turn empower local citizens with access of the
knowledge of government actions and transactions (AlAwadhi & Morris, 2008). E-government
activities are initiated at the government levels but its success also depends on the citizen’s
acceptance and adaptation of the e-government services and initiatives (Bertot et al., 2010).
Therefore, as pointed out by different authors in their researchers on e-government acceptance in
different regions like (Bwalya, 2009); (Colesca & Dobrica, 2008), the government officials need
to understand the factors that influence the acceptance of e-government services as well as the
factors that may cause delays in the implementation of the same (Lofstedt, 2012).
The literature on e-government services and its adaptation and implementation processes include
a number of studies that has used technological acceptance theories like the TRA or the Theory of
Reasoned Action by the (Wangpipatwong et al., 2008), TAM or the Technology Acceptance
Model by the (Lin et al., 2011),the UTAT or the Unified Theory of Acceptance and Use of
S t u d e n t I D : 1 1 0 1 3 0 25
Technology by the (AlAwadhi & Morris, 2008) and the TPB or the Theory of Planned Behavior
by the (Gamal Aboelmaged, 2010). In these studies, the scholars have described the factors that
motivate the adoption of e-government projects and services (AlAwadhi & Morris, 2008).
Likewise it can be said that in the situation that there is a lack of these factors or the influence
levels are low, there occurs a delay in adaptation of the e-government services and projects.
Dillon and Daekins in 2002 described that one of the most important factors that affects the
decision of adaptation of such e-government services and also causes delay due to the citizen’s
indecisiveness is associated with the user’s sense of privacy and security of these services (Deakins
et al., 2010). Moreover, in (Klun et al., 2011), the scholars have described that in 2004, Peterson,
Hart and Bagchi had claimed that the cause of delay and process of adaptation of the e-government
services are also determined by the socio-cultural environment as well. This has also been
confirmed by Chen, Huang, and Russell in their research study on the comparison regarding the
adaptation of e-government services between developing and developed countries, have observed
that culture often poses as a barrier in implementation and adaptation of e-government services
especially in developing countries (Chen et al., 2006).
The delay in the implementation processes has also been researched by other authors who have
pointed out that gender differences play an important role in the adaptation and the implementation
process. Researchers have shown that men are more task-oriented than females and that females
have lower self-efficacy and higher anxiety towards computers and mobiles due to low aptitude
for technology (Celik, 2016); (Ayo et al., 2012).
However, Igbaria in 1993, claimed in his earlier research work that the evidence regarding the
effects of gender difference on the implementation of e-services is equivocal, and there are a
number of studies that have proved that such differences affect and delay implementation
S t u d e n t I D : 1 1 0 1 3 0 26
processes, while other researchers have claimed that gender differences do not affect the same
(Turner et al., 2010).
According to (Choudrie et al., 2012), another factor that affects the adaptation and implementation
processes of e-government and IT services in a society are either collectivism traits or
individualism traits whichever is more dominant in the particular culture. In a collectivistic society,
the relations amongst individuals are stronger than that in an individualistic society. It has also
been observed that the adaptation of IT leads to a fall in the face-to-face interactions, therefore, in
a collectivist society the implementation process of the IT and e-services may take longer and face
restrictions than that in an individualistic society (Klun et al., 2011).
Moreover, Fink and Jaruwachirathanakul in (Jaruwachirathanakul & Fink, 2005), have observed
that in the Thailand culture upholds face-to-face contacts and that personal relations add value to
users or customers experiences especially during financial transactions. This cultural aspect often
delays the implementations process in many cultures. It is also connected to the fact on how much
the society feels threatened by the implementation of new technology.
In (Alghamdi & Beloff, 2016), the researchers have taken in account the findings of Bellordre and
Baker’s research that lack of awareness also affects the appropriation and utilization of IT. Delays
in implementation may also result from the lack of familiarity of the technologies and its
advantages. This has been observed by researchers that delays factors are generally associated with
groups of elderly people, groups of people whose cultural or religious background stops them from
changing any processes, or people with disabilities, who are afraid of change and adaptation
processes. Dimitrova and Chen in (Chen & Dimitrova, 2006), has reported that if the end users are
unaware of the potential advantages of technology and e-services, they will tend to oppose and
delay implementation processes.
S t u d e n t I D : 1 1 0 1 3 0 27
However, in this context, Beynon-Davies has argued in his research that the awareness of
technology and e-services does not imply that there will not be any obstacle in the adaptation
process and delays in implementation of the e-government processes (Beynon-Davies, 2005). In
his research, he has shown that the adaptation of the Inland Revenue e-services has been slow and
delayed although there had been a number of marketing campaigns to motivate and make the users
aware of the online processes. Beynon-Davies concluded that this was due to the fact the online
services failed to benefit the user with additional conveniences than traditional methods, so people
were unwilling to change to e-services even though they were aware of the services.
Evidently there is a lack of research and limited literature content exploring the factors that affect
and delay the adaptation and implementation processes of government e-services especially in the
context of the GCC countries as explained by Alshihi (Alshihi, 2005). There has been a number
of evidence of researchers investigating the factors with the use of the Unified Theory of
Acceptance and Use of Technology model (AlAwadhi & Morris, 2008), but there is an obvious
lack of literature concerning the delay and resistance to accept online government services in
countries like the UAE.
Alshihi in his research had examined the appropriation of e-tax services in Oman, which is one of
the GCC nations (Alshihi, 2005). He interviewed private sectors workers, public sector employees
and workers from different sectors of the society. He observed a number of barriers that delayed
adoption process of e-government services in all these sectors such as the lack of IT knowledge in
end-users, the under-advertising of e-government arrangements and activities, the lack of
awareness and absence of legitimate enactment and laws. The lack of confidence the the
government. According to Alshihi, culture played a negligible role in the implementation process
of e-services while the fore mentioned discoveries demonstrated high impact.
S t u d e n t I D : 1 1 0 1 3 0 28
It has been observed that customarily, all transactions between citizens or business owners with
the government agencies had always occurred in an administration office. With the development
of communication and information technologies, it is conceivable to find easily reachable
government service centers by the users. Many a times, these centers have an automatic kiosk
machine to carry out the process without any human interaction; these services can also be
accessed by the user through their computers at their homes or offices. Subsequently, e-
Government means to make the connection amongst government and local residents/citizens that
is G2C, government and business endeavors (G2B), and between one government agency and
another (G2G) more straightforward, transparent and reasonable .
In any case, it has been observed through the literature study that e-government is the utilization
of IT or Information Technology to enhance the productivity, viability, straightforwardness, and
government’s responsibility (Kraemer & King, 2006). According to many authors, these are
unavoidable change ventures by the government (Anon., 2005), therefore, even if faced with
resistance or delays, the e-government services are inevitable in all nations especially in the era of
information technology and internet solutions (Misuraca, 2009).
There is an increased interest on e-government by researchers and scholars, but the existing
literature has failed to sufficiently tend to two key issues concerning the execution and adaptation
of e-government frameworks:
Clear understanding of the elements affecting the selection and acknowledgment of e-
Government frameworks, and reason for their delay in implementation
Factors that influence the effective usage of the e-services and the relate causes of delays
and failures.
S t u d e n t I D : 1 1 0 1 3 0 29
As mentioned earlier, there has been a growing trend for governments worldwide to implement e-
government services. The reason behind the riding trend, has been addressed by many scholars as
the result of the expected benefits of the adaptation of ICT in the public sector (Alkhaleefah et al.,
2010). The advantages of using e-services and automation in the public sector can be attributed to
the expanded proficiency, cost effectiveness, and improved quality of service. In this manner,
governments are contributing vigorously and setting tight due dates on e-Government ventures
keeping in mind the end goal of the advantages of implementing e-government services
(Evangelidis, 2005). In any case, late studies show that most nations have not been entirely
successful in successfully implementing the e-services in their public sectors (Evangelidis, 2005);
(Lee et al., 2008).
According to (Abu-Samaha & Abdel Samad, 2007), Jordon’s government, one of the developing
GCC nations, has made certain initial efforts in order to redefine governmental services and
facilitate the facilities of submitting tax payments and conduct governmental transactions online.
Jordan plans to profit from e-Government by turning out have a more responsible, straightforward
and beneficial user platform. However, there is a lack of unqualified employees and insufficient
HR administrations, which have been an issue for Jordan and other developing nation, which has
resulted into delays and problems in their implementation processes. As indicated by (Heeks,
2008) almost 35% of electronic government projects have failed especially in developing
economies, 50 percent did not achieve desirable results and just 15 percent have been successful.
The most significant issue behind failure and delays in e-government projects especially in
developing nations as per (Heeks, 2008) is because of the gap between the design (expected) and
outcome (real) in regards to technology, information, objectives, values and procedures, employee
skill sets, management resources, time and cost. Therefore, the failure and success of e-government
S t u d e n t I D : 1 1 0 1 3 0 30
projects has been pointed out by a number of scholars as the extent of gap between the design of
the project and the real scenario of the projects (Alkhaleefah et al., 2010).
Consequently, the developing nation such as the UAE has to develop plans to bridge this gap by
taking advantage of the benefits of implementing e-government projects, as mentioned by a
number of authors. According to (Athmay, 2013), developing nations in the GCC countries like
the UAE are facing challenges and delays in implementing e-services in the public sector
effectively, due to a variety of issues regarding, such as the lack of accountability, bureaucracy,
the lack of participation by the citizens in the processes, and government authority. It has also been
observed by scholars that the UAE has not been able to apply ICT solutions properly in their
projects and therefore they are subjected to delays and failures in the current scenario.
Therefore, this failure and delay of e-government services can be attributed to a number of
elements, given as;
Digital gap or knowledge gap between different communities.
Lack of legitimate enactment and laws.
Absence of national policies regarding technology.
Insufficient application of ICT.
Lack of monetary support.
Presence of technological illiteracy.
Under skilled and technologically inexperienced workforce.
(Alshihi, 2005); (Athmay, 2013); (Heeks, 2008)
Apart from the challenges that are mentioned above, there are a number of internal challenges that
delay the implementation processes within the government processes. According to the mentioned
literatures and scholarly studies, these internal issues are associated with the understanding of the
S t u d e n t I D : 1 1 0 1 3 0 31
vision of the project implementation by all the concerned staff and any failure on the part of the
leader to encourage its followers in motivating and initializing the e-government services and
projects that lead to internal delays. This is clearly associated with the organizational culture and
behavior within the government agency. The outer difficulties incorporate the quick changes in
innovation, and alternate difficulties like individuals who don't have PCs or don't have admittance
to the Internet, and individuals who utilize the online administrations require an insurance of
protection and security where the data gave won't be abused. In this manner, the accomplishment
of e-Government projects is exceptionally reliant on legitimate system for their operations. On the
other hand, the external issues that affect the success and delay of implementation processes are
associated with rapid changing technology, insecurity of citizens in making transactions on the
net, technological illiteracy amongst the mass or the lack of access of internet (Zhao et al., 2012).
Al-Shafi , El-Haddadeh and Weerakkody in their research work (Weerakkody et al., 2011),
examined the different factors that cause delay and problems for e-government project
implementation in case of a developing GCC nation on the basis of its prevalent social, political,
organizational and technological contexts.
Other researchers like Field, Muller, Lao and other contemporary scholars have confirmed e-
government projects are highly beneficial when implemented successfully (Ebrahim & Irani,
2005). The factors affecting this implementation process can be identified with collaboration and
coordination issues within the government agencies and cost issues regarding the implementation
charges. Actualizing ICT, especially in large scales, can majorly affect the quality of services and
can raise various issues, mostly relating to the government operations.
S t u d e n t I D : 1 1 0 1 3 0 32
As indicated by other studies and literature, the absence of technical support on the government
websites and especially the lack of knowledge about the e-government projects and services
offered cause delays and failures for the implementation of these services.
In the exploratory study (Basamh et al., 2014), Qudaih, Basamh and Suhaimi investigated on the
acceptance and implementation processes of Saudia Arabian e-government projects. The study
distinguished computer literacy, accessibility, infrastructure costs, availability, trust issues and
privacy issues as a portion of the significant difficulties and obstructions that hinder the execution
and delays of e-government projects in Saudi Arabia.
Al-Shafi in his study (Al-Shafi, 2009), has researched the key factors that impact e-government
projects’ implementation processes and the variables affecting national appropriation in the
condition of Qatar. ,Lee,Sang and Lee [13] have contemplated on the elements and difficulties that
has led execution and implementation problems which delays in Cambodia. They investigated the
difficulties that are fundamental to actualizing of e-government projects and found problems
resulting from the lack of prioritization, poor infrastructure of ICT, lack of support from the
leadership, illiteracy and lack of technically sound staff (SANG et al., 2009).
In (Bwalya, 2009), Bwalya did research on the implementation challenges of e-services of the
Zambian government. As seen by all the other authors through this literature review, the factors
causing delays and challenges to the implementation process were similar, such as poor
infrastructure of ICT, language barrier, non-contextual government policies, lack of management,
etc. All these factors have been seen by most of the authors as the factors that contribute to the
highest to the delays in proper implementation of e-government projects.
Similarly, Ovio,Markkula and Ahmad investigated on these factors in Pakistan (Ovais Ahmad et
al., 2013). In their research, they found that the difference between expected results and real
S t u d e n t I D : 1 1 0 1 3 0 33
outcomes of e-government projects played a crucial role in effort expectancy and performance
expectancy. Moreover, they have also noted that in developing Muslim countries, the social factors
influence the clients’ adaptation of government e-services which results in hindrance and delays.
In other literature findings, these scholars also pointed out that lack of data privacy, inadequate
leadership support, lack of awareness and technological illiteracy and absence of appropriate
infrastructure hamper the projects.
Maiga and Nbafa in their article (Nabafu & Maiga, 2012), have outlined the requirements that can
help the governments of Uganda in implementing their online services successfully. The
requirements include building ICT infrastructure; motivate the users by showing them the benefits
of acquiring e-services and projects by spreading awareness, financial resource build-up and
spreading technological literacy. On similar note, Rokhman also recognized through his research
the factors that can help the Indonesian government to implement e-projects without delays and
hindrance (Rokhman, 2011), by proposing a model for successful implementation.
Thus, given the increasing incidence of delays in the IT projects and the associated wide range of
causes for such delays, there is an urgent need for ensuring that a proper planning process is
followed for effective functioning of e-governance. This is especially true for the implementation
of ICT related reforms, as in the present case. As stated by Bhatnagar (2004), empirical evidences
have indicated that the ICT related reforms needs to be cautiously planned before their
implementation for achieving an effective and efficient outcome.
2.6 CHANGES DURING THE IMPLEMENTATION PROJECT THAT EFFECT THE TIME
FRAME
Changes during the implementation process pose as a problem. These changes have been observed
by many authors as gap problems between the hard and soft issues. These are similar to the
S t u d e n t I D : 1 1 0 1 3 0 34
problems arising in the case of organizational change. In this case the success of governments’
initiatives relies on the alignment of the government functions and the actual practices. According
to (Ebrahim & Irani, 2005), the public sector needs to reengineer and change processes to
implement the technologies in order to implement e-government projects successfully. On the
similar note in the article (Dada, 2006), the implementation processes require similar tools like
change management strategies and failure to implement these strategies will lead to failure and
delays as the bridge will not be made between the social contexts and new technological
advancements.
Acknowledgment of technological innovations in providing e-services or m-services for regular
day-to-day activities has been widespread but authors have questioned whether the acceptance of
such technology in public sector is readily acceptable by the citizens. It is critical to understand
the obstructions that caused by the changes that are necessary for the successful adaptation and
implementation of mobile or internet service projects especially in the public sector. The
government faces a lot of uncertainty due to all the reasons that have been explained through this
literature review and hesitates to provide huge funds on these projects, which may not be accepted
and used by its citizens. A number of citizens are tech-savvy and can easily accept the shift in the
service dimension but these changes are often resisted by others that lead to delays and failure of
successful implementation (El-Kiki & Lawrence, 2007).
Adopting e-projects or m-services and technologies to deliver services that have been traditionally
delivered face-to-face or through personal transactions, requires change. The traditional systems
have been a habit for citizens for generations therefore, it requires time for them to accept and
change to acquire services online where cause delays. Moreover, many authors have also pointed
S t u d e n t I D : 1 1 0 1 3 0 35
out other factors that make people resist this change and cause delays such as economic factors,
socio-cultural practices, and security concerns of transactions on the internet.
In many cases these resistance to changes often come from within the government offices, as the
employees fear that the online services will take their jobs, as their services will not be required.
The authors have also suggested that these delays in adopting government services can be managed
by increasing employee participation, communication, training, and education of the employees to
learn about technological services. Therefore, the employees will adopt to the changes so that they
can motivate the citizens to do the same and implement the services successfully. By motivating
and supporting the officials to understand the benefits that the change from the traditional process
will bring about, the leadership can eliminate the resistance and delay (Rannu et al., 2010).
It has been seen through this review that the customers that are citizens also create barriers of
change and therefore cause delays and failures of e-projects developed by the government. The
most common electronic device used by citizens is the mobile phones. Therefore, the e-
government services can be made available on the phones through its m-services that will make it
easier for the customers to change from traditional systems to the new age m-service delivery as
they will find it easier to use and make time and cost effective. In any case, marketing of the
services has to be made so that the customers are aware of the benefits of using such m-services.
Moreover, security assurance has to be provided as well. Nevertheless, practices require changing
the mind frames of the citizens through prolonged marketing and advertisements till a sense of
security and awareness is grown. The side effect of this is the loss of time and delay in successful
implementation.
In the study, Carroll, has indicated the following factors that decide whether citizens will change
and adapt to m-government services in time, without delay (Carroll, 2006);
S t u d e n t I D : 1 1 0 1 3 0 36
The ease of use plays an important role in customer’s decision of using the m-services, as
well as value for money, availability of device and infrastructure, efficiency in time and
distance, convenience, quality and reliability of information, usefulness, risk and security
breach, SMS based system or computer online site base system, responsiveness of the site,
etc.
The citizen’s trust on the government services and public sector as well as reliance on the
net providers and mobile service technology.
Self-efficacy also plays an important role for the customer to change.
As confirmed by a number of authors in this review, socio-cultural resistance to e-services and
lack of interest in m-government can also be derived from the lack of confidence on new
technology, as well as bureaucratic mindsets including risk adverseness and failure to think
innovatively (Al-Khouri, 2012); (Bwalya, 2012); (Abdelhafez & Amer, 2014); (Hung et al., 2006).
Finally, the resistance to change and the reason for delay can also be attributed to the inadequate
digital literacy rate of the targeted users. This is one of the main causes that result in delays in the
implementation process, since the end users fail to adopt these changes in public sector service
delivery, even if they are aware of the benefits. Authors worldwide have proposed that
governments should concentrate more on developing m-government and online services to provide
more inclusive public services. In the meantime, educate more and more citizens about its benefits.
By ensuring multi-channeled delivery policies and strategizing to enhance its county’s IT
capacities and skills, the government can manage the resistance and be able to reap the benefits of
m-government.

S t u d e n t I D : 1 1 0 1 3 0 37
2.7 PROCEDURE TO IMPROVE PROJECT PERFORMANCE
Several research studies have been conducted to identify ways which government can enhance its
efficiency to deliver IT projects to its citizens and minimize the delay in operation (Bwalya, 2012).
These steps are discussed as follows:
Managing Strategy and Shareholders
To enhance efficiency of e-government and m-government projects, the government should try to
develop ways in which both the internal and external stakeholders can be managed efficiently.
These stakeholders are IT executives, vendors, associates and regulators (Conklin & Whiet, 2006).
The stakeholders’ concern is important because they can ensure the alignment of the government’s
business strategy with the IT solutions that are being developed. The shareholders can identify
potential risk factors and can have access to the best expertise of the vendors for an extended
period.
Strengthen Technological Advancement
The technical aspects of the IT projects include design and infrastructure, operational trade-offs
excellence assertion, relocation and compress strategy, and project capacity that have to be
developed effectively. Moreover, it is also essential to concentrate proportionately on different
technological issues and objectives by creating a central data warehouse system (Conklin & Whiet,
2006). This strategy can help minimize the inconsistency in commercial finance information,
centralized finance information and risk information. To reduce the number of changes occurred
in the implementation process, the project team has to be focused on purely developing the IT
design resolution corresponding to the data warehouse despite tackling the final objective that was
to control inconsistency occurring in information (Gauld & Goldfinch, 2006).
Building Effective Teams
S t u d e n t I D : 1 1 0 1 3 0 38
The project teams that deliver m-government and e-government services need to have common
vision, communicative procedures and high performance culture (Kramer, 1999). To enhance the
efficiency of project team members, government needs to increase budget allocation for delivering
values services and ensure that it had required business resources to fully utilize the technology
and deliver social values within specific timeframes (McLeod & Pippin, 2009)
Cost Management
E-Governance has been commonly found to be suffering from the problem of unproductive
investments, which urgently require attention through continual monitoring (Misra, 2008).
The huge costs associated with setting up the various components of e-governance, primarily the
Government Data Centre (GDC), involve capital costs for infrastructure, huge operating costs to
be incurred for managing and administering various types of servers, as well as recurring
deployment of multiple applications on distinct platforms (Bhattacharya, 2012). These costs must
be managed effectively so as to access the benefits of e-governance.
This cost management would also enable the timely recognition and management of the new
challenges that come up as a result of e-governance adoption, for lawyers and jurisdiction. Thus,
the governmental activities which are regulated by legal frameworks are well within the legal arena
of work (Asgarkhani, 2005). This also necessitates imbibing or adapting to the legal law so as to
cope with the new technological advances.
2.8 CONCLUSION
Therefore, it can be concluded from this literature review that most of the authors and literature on
this topic point to very similar factors that cause delays and problems in the implementation
process of e-government projects. From the undertaken review, it is apparent that implementation
of m-government and undertaking online services have become an imperative tool for smarter and
S t u d e n t I D : 1 1 0 1 3 0 39
faster public service delivery worldwide. In the case of developing countries and the GCC
countries, m-government and online services are characterized by delays and problems and this
review has provided an overview of the factors that make the e-government projects get delayed
especially in developing nations. The major issue that has been noted by many scholars is the gap
between the actual working system and the expected or proposed design of the service. In any case,
it can be seen through the study of the literature that the prospect of e-services and government
project implementation through the use of mobile technologies has been studies upon in recent
times only, and there is a lack of literature on the same.
S t u d e n t I D : 1 1 0 1 3 0 40
3. CHAPTER THREE: METHODOLOGY
3.1 INTRODUCTION
The methodology chapter aims to discuss different statistical tools and techniques that can be
applied to analyze data and accomplish the research objectives. Before adopting any specific
statistical tools and techniques, it is important to discuss the respective advantages and
disadvantages of the methods. This can help to understand the relevance of the chosen
methodology. Additionally the chapter also compares the various research approaches and
identifies the most suitable approach to conduct the study. Apart from mentioning the research
approaches, the methodology chapter also specifies the sample size, sampling strategy, and data
collection procedure and data analysis methods that have been adopted to conduct the present
research study and draw potential inferences on the research objectives.
3.2 RESEARCH APPROACH
In order to identify the potential causes of delay in the implementation of the e-service and mobile
service projects by the UAE government, a quantitative research methodology approach has been
considered (Crowther & Lancaster, 2008), for which the data has been collected from a web based
survey questionnaire. (Garboan, 2009). The adoption of the quantitative research methodology is
most suitable for conducting the present study as the study seeks to identify the factors that cause
delay, further analysis of these factors to is conducted that help minimize the project delivery time
(Degu & Yigzaw, 2006). This is in line with the established aim of a quantitative research, which
establishes statistically significant conclusions about a population by studying a representative
sample of the population (Creswell, 2003). It thus aims at collecting primary responses from the
chosen sample in quantitative terms to avoid any researcher or interviewee bias, or subjectivity in
the context of the statements recorded.
S t u d e n t I D : 1 1 0 1 3 0 41
3.3 RELEVANCE OF THE RESEARCH APPROACH
The quantitative research approach has been commonly adopted by a number of researches in the
field of natural and social sciences, including physics, biology, psychology, sociology and
geology. The present academic research required a significant amount of responses for fulfilling
its stated objective of providing useful recommendations. However, the sole consideration of the
qualitative approach is not an effective as it considers lesser number of respondents and make it
difficult to structure the responses (Packer and Addison 1989). This, thus, increases the need of
utilizing the quantitative research study.
The quantitative technique helps deliver the outcome of the research in numerical type (Saunders
et al., 2009). The collection of the numerical data helps explain specific facts. The quantitative
research approach is conducted primarily based on a questionnaire survey, verifications, rating
scales and other physiological procedures (Blumberg et al., 2005). As it involves a large number
of respondents, it is more appropriate to generalize the findings of the study. It involves a wide
group of sample and numeral number variables that are examined at one a time (Hair Jr et al.,
2011); (Kothari, 2006). The control and monitoring power for conducting the quantitative study is
higher compared to the qualitative approach (Saunders et al., 2009). In spite of its structured nature,
the major drawbacks of the quantitative data lie on account of complexities in the calculation
process (Ramona 2011). Without the use of software the calculation process of quantitative study
becomes highly time consuming and complex (R. W. Morris 1991). The involvement of multiple
trial and error methods also increases the time required to conduct the study (Morris, 1991).
3.4 RESEARCH QUESTION
To accomplish the research objectives, the research questions for the present study can be
structured as follows:
S t u d e n t I D : 1 1 0 1 3 0 42
1. What are the important factors that can cause delay in the implementation process of the
IT related projects by the UAE government?
2. What is the impact of delayed service periods on the effectiveness of the IT projects
initiated by the UAE government?
3. How can the delay in implementing the IT projects initiated by the UAE government
minimized?
3.5 RESEARCH HYPOTHESIS
The hypothesis testing is considered a crucial technique to enhance the probability of correctness
of the hypothesis (Goldmann 2011). Based on the research questions portrayed in the above
section, the hypothesis for the study can be structured as follows:
H1: The delay in delivery of IT related projects by the UAE government could create
significant negative impact on the effectiveness of these projects.
H2: Poor decision-making abilities, shortage of funds, ineffective communication skills
and poor management structure are the principle reasons for causing delays in
implementation of the IT projects by the UAE.
3.6 SAMPLING TECHNIQUE
To collect the samples, government officials have been chosen from different government
departments on a random basis. In order to choose the respondents, from each of the department,
purposive sampling strategy has been applied (Palys, 2008). The respondents have been chosen on
the basis of their designation, knowledge about the e-service, and association with the launch of e-
service projects (Teddlie & Yu, 2007). These sorting criteria have helped to choose the appropriate
sampling group and infer appropriate findings about the cause of project delays (Curtis et al.,
2000). A total sample size of 150 respondents were chosen for conducting the quantitative study.
S t u d e n t I D : 1 1 0 1 3 0 43
This number of respondents was deemed feasible given the academic nature of the research, and
its associated time and financial constraints. As stated by Zikmund (2001), it is advisable to choose
a sample over the entire census given such restraints. The sample can thus be chosen rationally, to
pose as a statistically identical group to the population from which the conclusions for the sample
can be later inferred to the population.
3.7 DATA COLLECTION
The data collection strategy is primarily concerned with the quantitative data for the present
research. Quantitative data has been collected with the help of a web based survey questionnaire.
These were sent out through the social networking site named LinkedIn, with help received from
a college colleague for easy reach. The government entities were approached through email, while
the university colleagues were sent questionnaires through WhatsApp groups if not available
through emails. The research has rationally chosen the online mode of survey, not only based on
the time and cost restraints, but also aiming at collecting larger number of samples for the research
(Buchanan and Hvizdak, 2009). The researcher further recognizes that, as claimed by Evans &
Mathur (2005), “clear, visible, respondent-friendly privacy policies are imperative” (p. 211) for
online surveys. Thus, in line with this requirement, these self-administered web surveys were
included with an option of anonymity, which was aimed at reducing the social pressure, and thus
reduce the targeted social desirability bias (McLeod, 2008). The responses have been collected on
five point Likert scale basis (Saunders et al., 2009), which consists of an ordinal scale to measure
the level of agreement or disagreement by using a fixed choice response format (Bowling, 1997;
Burns, & Grove, 1997). At first, the e-mail id has been collected from the government departments
after obtaining the required approvals. Then, the survey questionnaire is sent to the respective e-

S t u d e n t I D : 1 1 0 1 3 0 44
ids with the declaration form that consists of a detailed explanation of the research objectives with
a request to contribute and fill in the survey.
The survey data has been collected within a period of 12 weeks. Reminder messages and emails
have been sent to the selected respondents. The questionnaire design contains different questions
pertaining to its set of objectives. Each question has a set of statements that aim at gathering the
necessary views from the respondents. For instance, the first question consists of statements, which
explicitly aim at presenting the viewpoints of the respondents regarding the importance of
successful e-services implementation. It covers the wide range of claims put forward and reviewed
under the literature section. The next question particularly gathers responses relating to the vitality
of planning in e-governance. The third set of statements pertains to the reasons for the increase in
the e-services. The research also aimed at putting forth the perceived benefits from such services,
which is sought after by the next set of statements. However, the research goes one-step forward
by also covering under its purview, the limitations of the present scenario. The next set of
statements deal with the experienced limitations of the same.
3.8 DATA ANALYSIS
The quantitative data has been analysed with the help of inferential statistical techniques. Some of
the inferential statistics applied in the study are descriptive test statistics including frequency
distribution analysis, p-value analysis, and regression analysis (Ghasemi & Zahediasl, 2012).
Descriptive statistical techniques helps to understand the demographics of the respondents. The
most important factors responsible for causing delay in the project implementation process are
determined by regression analysis method by observing the Anova analysis and corresponding p
values of the coefficients.
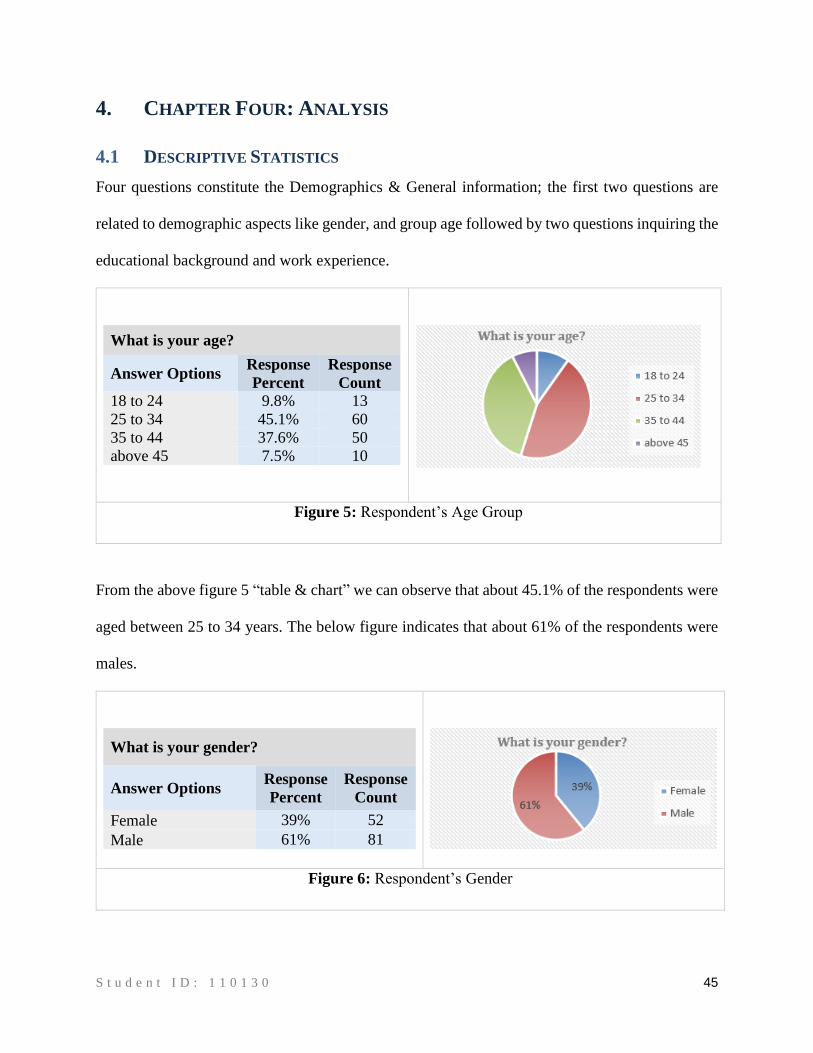
S t u d e n t I D : 1 1 0 1 3 0 45
4. CHAPTER FOUR: ANALYSIS
4.1 DESCRIPTIVE STATISTICS
Four questions constitute the Demographics & General information; the first two questions are
related to demographic aspects like gender, and group age followed by two questions inquiring the
educational background and work experience.
What is your age?
Answer Options Response
Percent
Response
Count
18 to 24 9.8% 13
25 to 34 45.1% 60
35 to 44 37.6% 50
above 45 7.5% 10
Figure 5: Respondent’s Age Group
From the above figure 5 “table & chart” we can observe that about 45.1% of the respondents were
aged between 25 to 34 years. The below figure indicates that about 61% of the respondents were
males.
What is your gender?
Answer Options Response
Percent
Response
Count
Female 39% 52
Male 61% 81
Figure 6: Respondent’s Gender
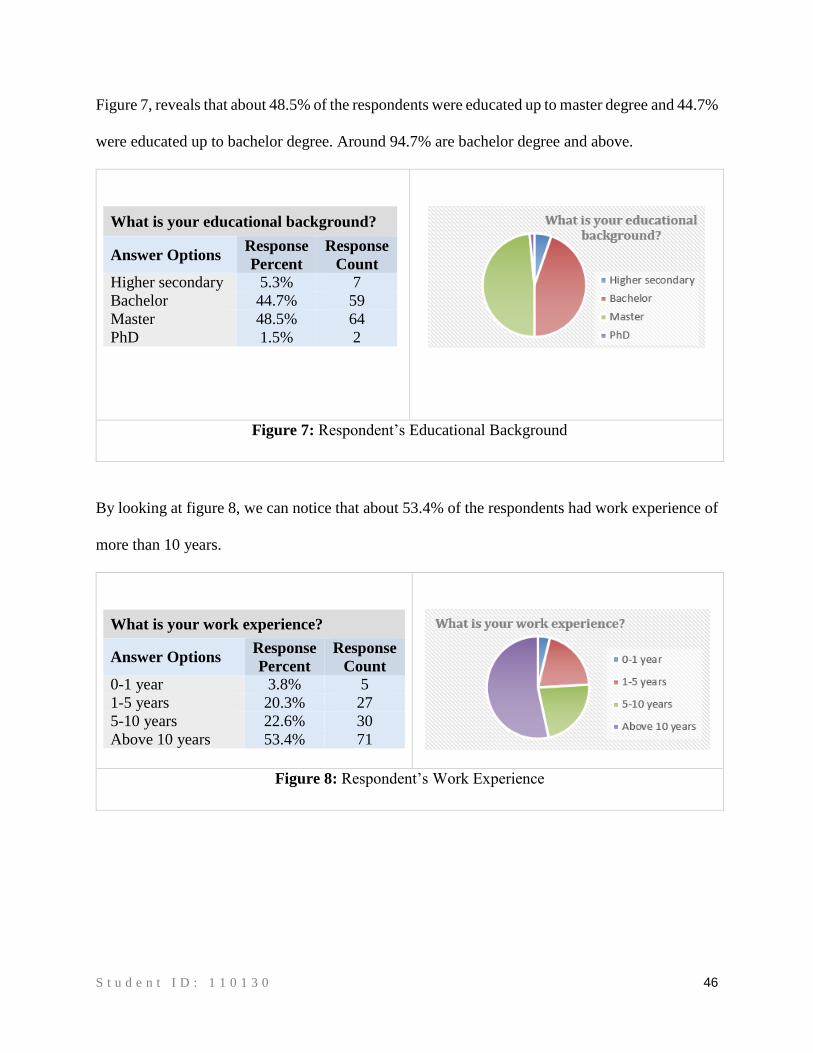
S t u d e n t I D : 1 1 0 1 3 0 46
Figure 7, reveals that about 48.5% of the respondents were educated up to master degree and 44.7%
were educated up to bachelor degree. Around 94.7% are bachelor degree and above.
What is your educational background?
Answer Options Response
Percent
Response
Count
Higher secondary 5.3% 7
Bachelor 44.7% 59
Master 48.5% 64
PhD 1.5% 2
Figure 7: Respondent’s Educational Background
By looking at figure 8, we can notice that about 53.4% of the respondents had work experience of
more than 10 years.
What is your work experience?
Answer Options Response
Percent
Response
Count
0-1 year 3.8% 5
1-5 years 20.3% 27
5-10 years 22.6% 30
Above 10 years 53.4% 71
Figure 8: Respondent’s Work Experience
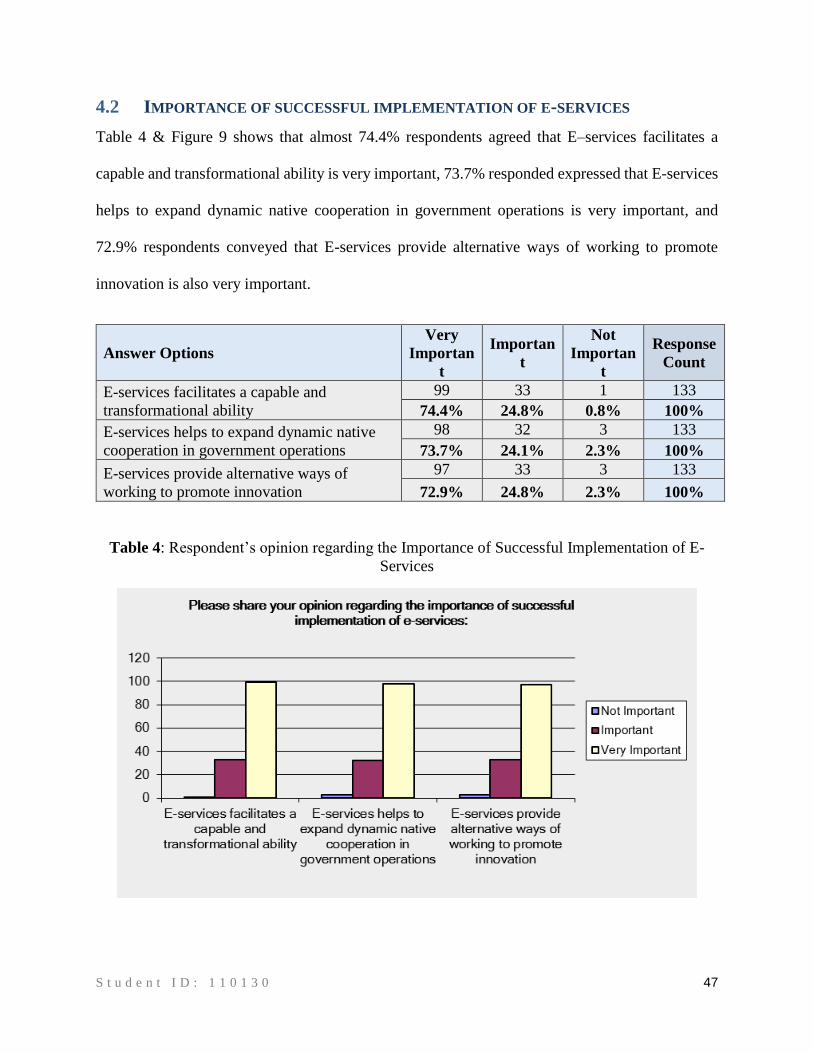
S t u d e n t I D : 1 1 0 1 3 0 47
4.2 IMPORTANCE OF SUCCESSFUL IMPLEMENTATION OF E-SERVICES
Table 4 & Figure 9 shows that almost 74.4% respondents agreed that E–services facilitates a
capable and transformational ability is very important, 73.7% responded expressed that E-services
helps to expand dynamic native cooperation in government operations is very important, and
72.9% respondents conveyed that E-services provide alternative ways of working to promote
innovation is also very important.
Answer Options
Very
Importan
t
Importan
t
Not
Importan
t
Response
Count
E-services facilitates a capable and
transformational ability
99 33 1 133
74.4% 24.8% 0.8% 100%
E-services helps to expand dynamic native
cooperation in government operations
98 32 3 133
73.7% 24.1% 2.3% 100%
E-services provide alternative ways of
working to promote innovation
97 33 3 133
72.9% 24.8% 2.3% 100%
Table 4: Respondent’s opinion regarding the Importance of Successful Implementation of E-
Services

S t u d e n t I D : 1 1 0 1 3 0 48
Figure 9: Respondent’s opinion regarding the Importance of Successful Implementation of E-
Services
4.3 SIGNIFICANCE OF PLANNING IN E-GOVERNMENT
Table 5 & Figure 10 shows that 56.5% respondents strongly agreed that planning enables the
department to efficiently attend to every project by tracking delays, 53.5% strongly agreed and
expressed that Planning helps to attract more customers is very important, 48.1% respondents
conveyed that Planning keeps each and every customer satisfied is strongly required, and 52.7 also
strongly agreed that planning promotes transparency, effectiveness, and efficiency of the E-
services.
What is your opinion regarding the significance of planning in e-government? Please share
your level of agreement against the following statements:
Answer Options Strongly
agree Agree
Neither
agree/
disagree
Disagree Strongly
disagree
Respons
e Count
&
Percent
age
Planning enables the
department to efficiently
attend to every project by
tracking delays
74 55 1 1 0 131
56.5% 42.0% 0.8% 0.8% 0.0% 100%
Planning helps to attract
more customers
69 46 12 2 0 129
53.5% 35.7% 9.3% 1.6% 0.0% 100%
Planning keeps each and
every customer satisfied
63 42 20 6 0 131
48.1% 32.1% 15.3% 4.6% 0.0% 100%
Planning promotes
transparency, effectiveness
and efficiency of the e-
services
69 51 8 3 0 131
52.7% 38.9% 6.1% 2.3% 0.0% 100%
Table 5: Respondent’s opinion regarding the Significance of Planning in E-Government
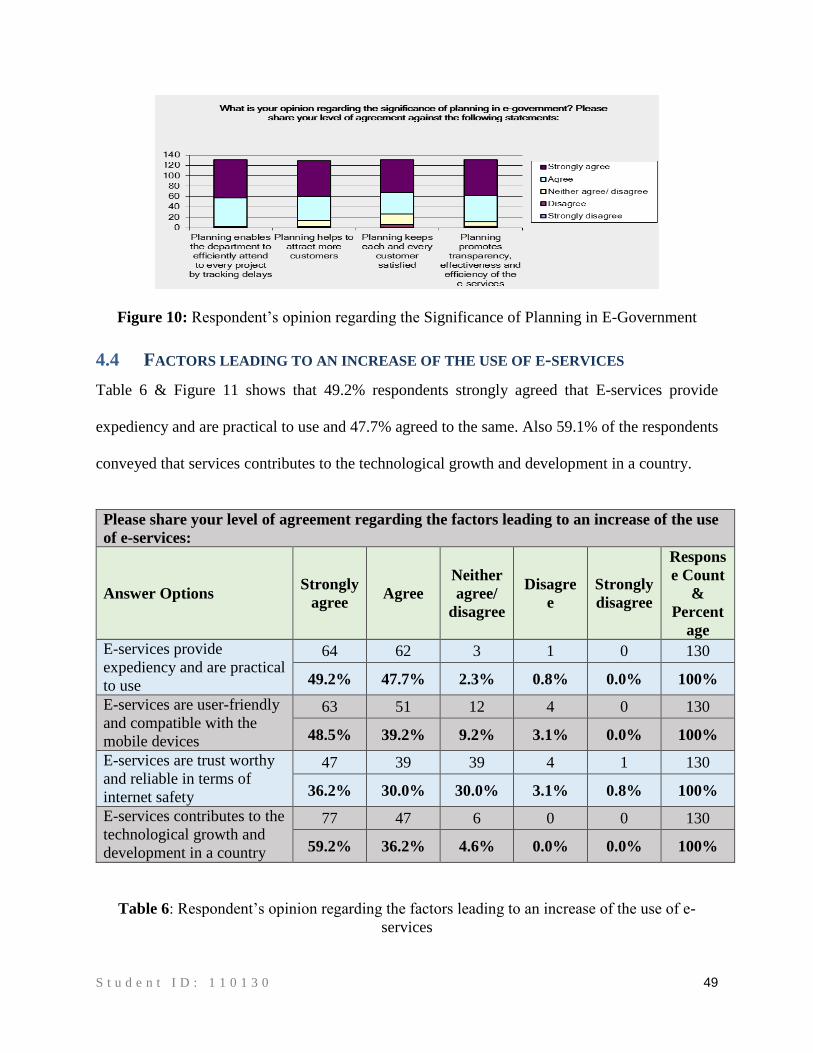
S t u d e n t I D : 1 1 0 1 3 0 49
Figure 10: Respondent’s opinion regarding the Significance of Planning in E-Government
4.4 FACTORS LEADING TO AN INCREASE OF THE USE OF E-SERVICES
Table 6 & Figure 11 shows that 49.2% respondents strongly agreed that E-services provide
expediency and are practical to use and 47.7% agreed to the same. Also 59.1% of the respondents
conveyed that services contributes to the technological growth and development in a country.
Please share your level of agreement regarding the factors leading to an increase of the use
of e-services:
Answer Options Strongly
agree Agree
Neither
agree/
disagree
Disagre
e
Strongly
disagree
Respons
e Count
&
Percent
age
E-services provide
expediency and are practical
to use
64 62 3 1 0 130
49.2% 47.7% 2.3% 0.8% 0.0% 100%
E-services are user-friendly
and compatible with the
mobile devices
63 51 12 4 0 130
48.5% 39.2% 9.2% 3.1% 0.0% 100%
E-services are trust worthy
and reliable in terms of
internet safety
47 39 39 4 1 130
36.2% 30.0% 30.0% 3.1% 0.8% 100%
E-services contributes to the
technological growth and
development in a country
77 47 6 0 0 130
59.2% 36.2% 4.6% 0.0% 0.0% 100%
Table 6: Respondent’s opinion regarding the factors leading to an increase of the use of e-
services
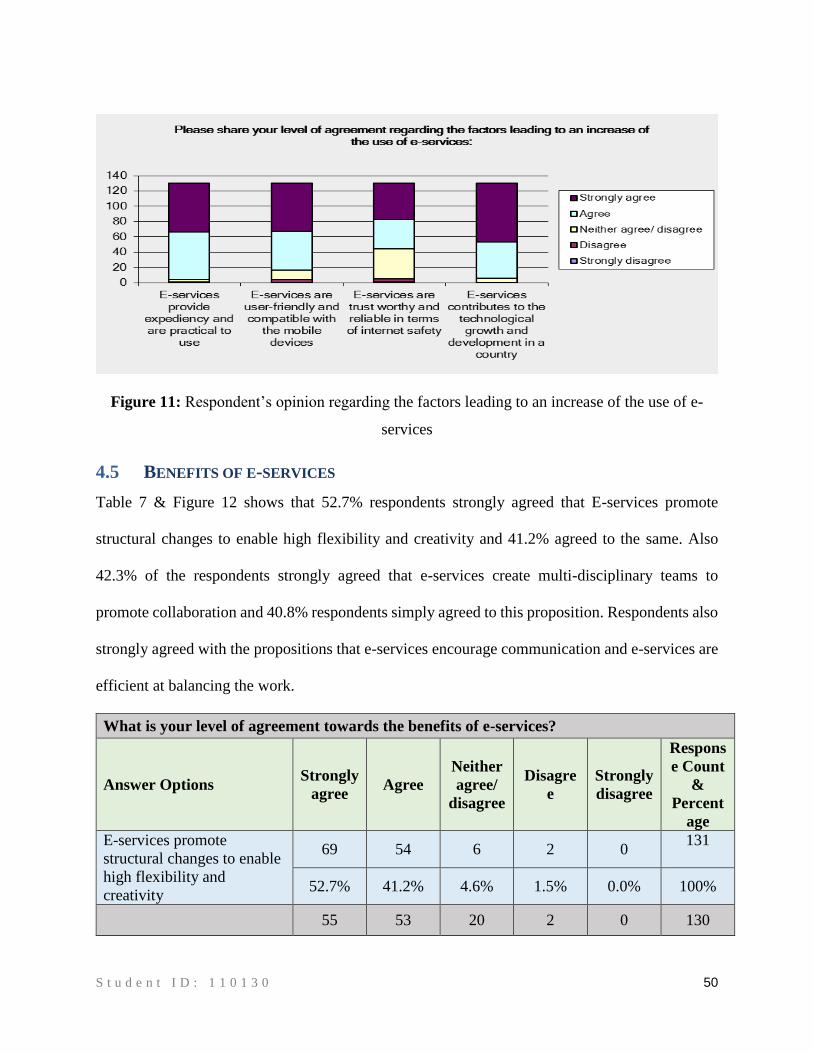
S t u d e n t I D : 1 1 0 1 3 0 50
Figure 11: Respondent’s opinion regarding the factors leading to an increase of the use of e-
services
4.5 BENEFITS OF E-SERVICES
Table 7 & Figure 12 shows that 52.7% respondents strongly agreed that E-services promote
structural changes to enable high flexibility and creativity and 41.2% agreed to the same. Also
42.3% of the respondents strongly agreed that e-services create multi-disciplinary teams to
promote collaboration and 40.8% respondents simply agreed to this proposition. Respondents also
strongly agreed with the propositions that e-services encourage communication and e-services are
efficient at balancing the work.
What is your level of agreement towards the benefits of e-services?
Answer Options Strongly
agree Agree
Neither
agree/
disagree
Disagre
e
Strongly
disagree
Respons
e Count
&
Percent
age
E-services promote
structural changes to enable
high flexibility and
creativity
69 54 6 2 0 131
52.7% 41.2% 4.6% 1.5% 0.0% 100%
55 53 20 2 0 130
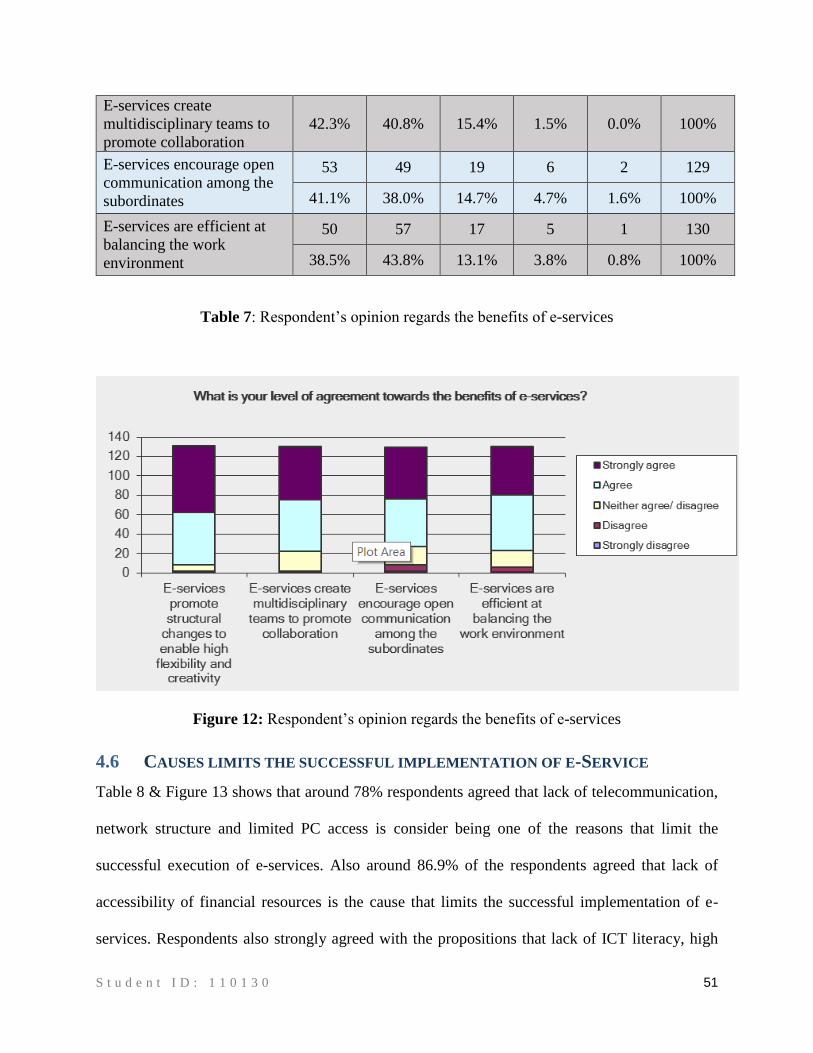
S t u d e n t I D : 1 1 0 1 3 0 51
E-services create
multidisciplinary teams to
promote collaboration
42.3% 40.8% 15.4% 1.5% 0.0% 100%
E-services encourage open
communication among the
subordinates
53 49 19 6 2 129
41.1% 38.0% 14.7% 4.7% 1.6% 100%
E-services are efficient at
balancing the work
environment
50 57 17 5 1 130
38.5% 43.8% 13.1% 3.8% 0.8% 100%
Table 7: Respondent’s opinion regards the benefits of e-services
Figure 12: Respondent’s opinion regards the benefits of e-services
4.6 CAUSES LIMITS THE SUCCESSFUL IMPLEMENTATION OF E-SERVICE
Table 8 & Figure 13 shows that around 78% respondents agreed that lack of telecommunication,
network structure and limited PC access is consider being one of the reasons that limit the
successful execution of e-services. Also around 86.9% of the respondents agreed that lack of
accessibility of financial resources is the cause that limits the successful implementation of e-
services. Respondents also strongly agreed with the propositions that lack of ICT literacy, high
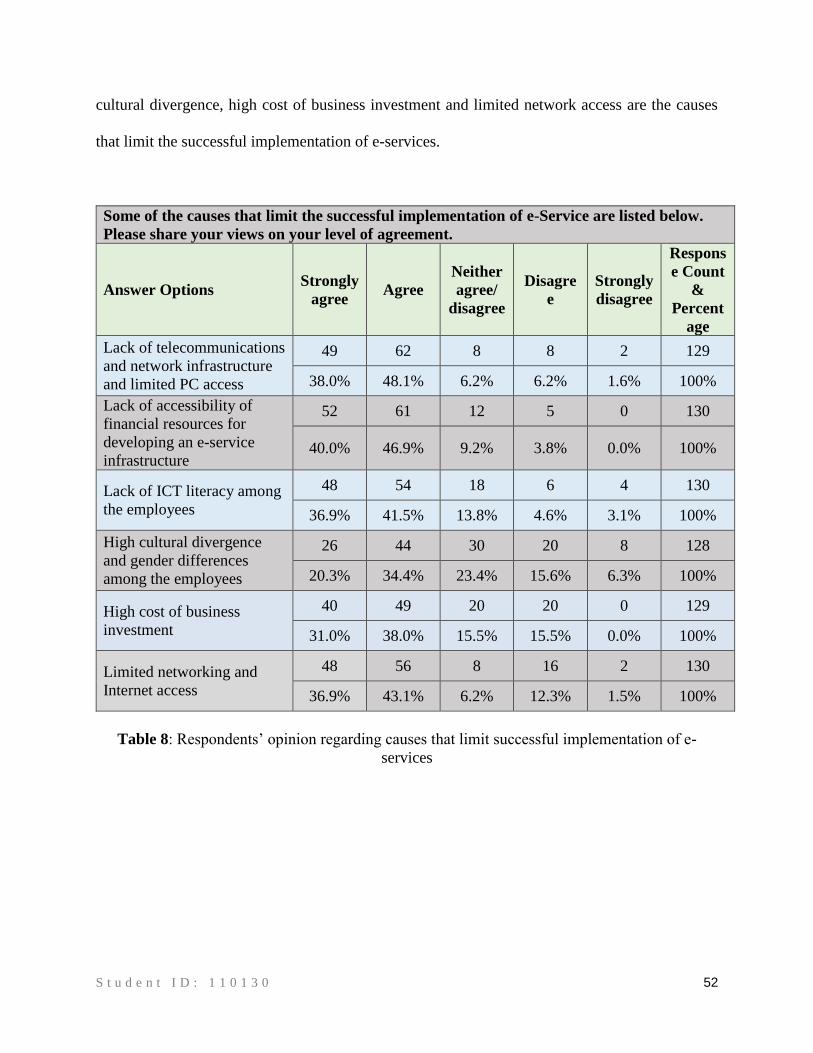
S t u d e n t I D : 1 1 0 1 3 0 52
cultural divergence, high cost of business investment and limited network access are the causes
that limit the successful implementation of e-services.
Some of the causes that limit the successful implementation of e-Service are listed below.
Please share your views on your level of agreement.
Answer Options Strongly
agree Agree
Neither
agree/
disagree
Disagre
e
Strongly
disagree
Respons
e Count
&
Percent
age
Lack of telecommunications
and network infrastructure
and limited PC access
49 62 8 8 2 129
38.0% 48.1% 6.2% 6.2% 1.6% 100%
Lack of accessibility of
financial resources for
developing an e-service
infrastructure
52 61 12 5 0 130
40.0% 46.9% 9.2% 3.8% 0.0% 100%
Lack of ICT literacy among
the employees
48 54 18 6 4 130
36.9% 41.5% 13.8% 4.6% 3.1% 100%
High cultural divergence
and gender differences
among the employees
26 44 30 20 8 128
20.3% 34.4% 23.4% 15.6% 6.3% 100%
High cost of business
investment
40 49 20 20 0 129
31.0% 38.0% 15.5% 15.5% 0.0% 100%
Limited networking and
Internet access
48 56 8 16 2 130
36.9% 43.1% 6.2% 12.3% 1.5% 100%
Table 8: Respondents’ opinion regarding causes that limit successful implementation of e-
services
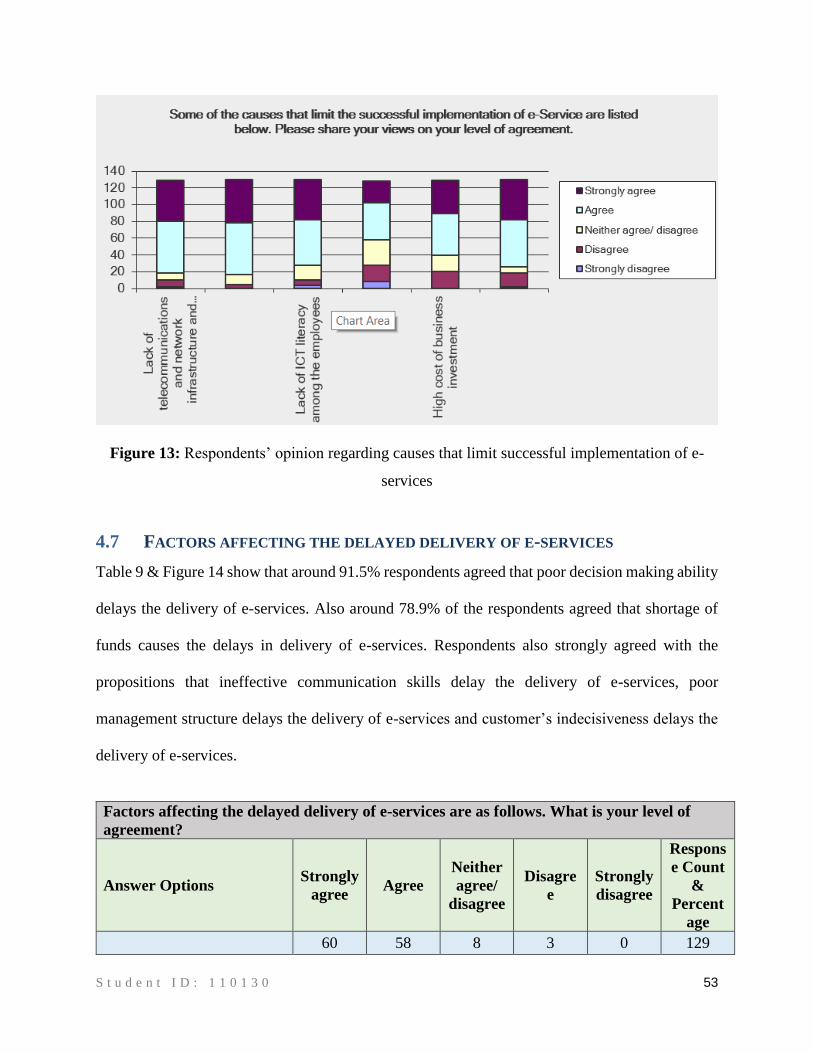
S t u d e n t I D : 1 1 0 1 3 0 53
Figure 13: Respondents’ opinion regarding causes that limit successful implementation of e-
services
4.7 FACTORS AFFECTING THE DELAYED DELIVERY OF E-SERVICES
Table 9 & Figure 14 show that around 91.5% respondents agreed that poor decision making ability
delays the delivery of e-services. Also around 78.9% of the respondents agreed that shortage of
funds causes the delays in delivery of e-services. Respondents also strongly agreed with the
propositions that ineffective communication skills delay the delivery of e-services, poor
management structure delays the delivery of e-services and customer’s indecisiveness delays the
delivery of e-services.
Factors affecting the delayed delivery of e-services are as follows. What is your level of
agreement?
Answer Options Strongly
agree Agree
Neither
agree/
disagree
Disagre
e
Strongly
disagree
Respons
e Count
&
Percent
age
60 58 8 3 0 129
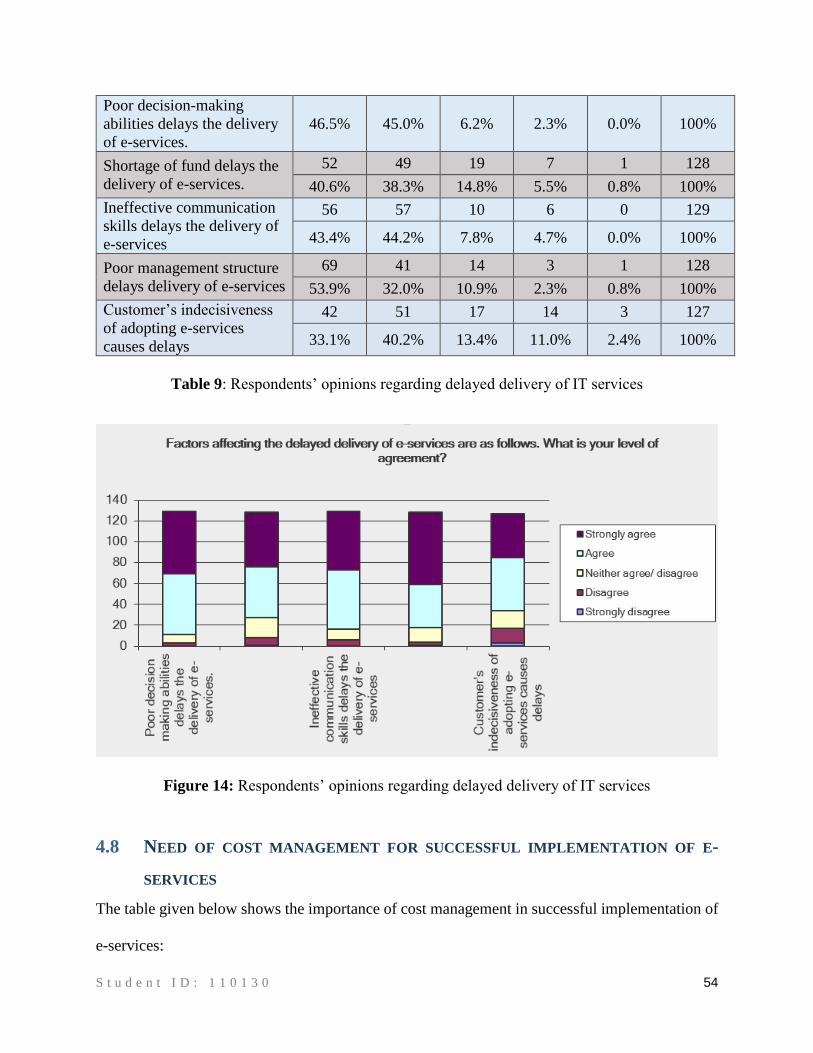
S t u d e n t I D : 1 1 0 1 3 0 54
Poor decision-making
abilities delays the delivery
of e-services.
46.5% 45.0% 6.2% 2.3% 0.0% 100%
Shortage of fund delays the
delivery of e-services.
52 49 19 7 1 128
40.6% 38.3% 14.8% 5.5% 0.8% 100%
Ineffective communication
skills delays the delivery of
e-services
56 57 10 6 0 129
43.4% 44.2% 7.8% 4.7% 0.0% 100%
Poor management structure
delays delivery of e-services
69 41 14 3 1 128
53.9% 32.0% 10.9% 2.3% 0.8% 100%
Customer’s indecisiveness
of adopting e-services
causes delays
42 51 17 14 3 127
33.1% 40.2% 13.4% 11.0% 2.4% 100%
Table 9: Respondents’ opinions regarding delayed delivery of IT services
Figure 14: Respondents’ opinions regarding delayed delivery of IT services
4.8 NEED OF COST MANAGEMENT FOR SUCCESSFUL IMPLEMENTATION OF E-
SERVICES
The table given below shows the importance of cost management in successful implementation of
e-services:
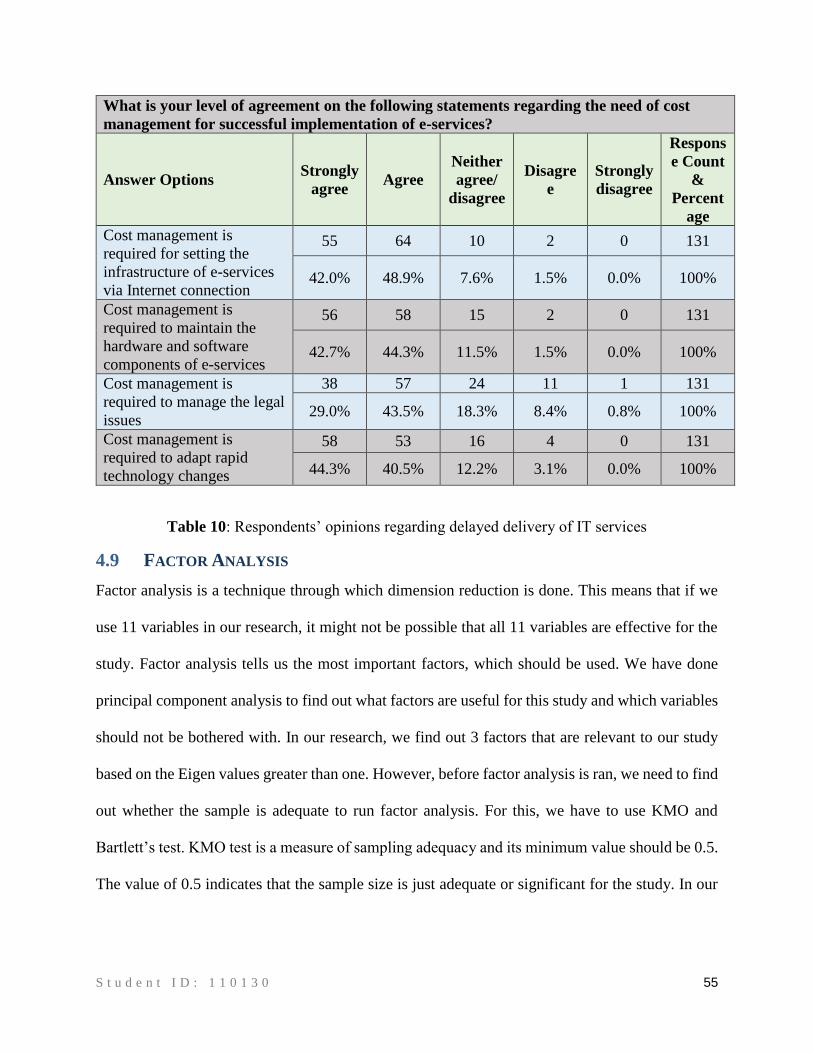
S t u d e n t I D : 1 1 0 1 3 0 55
What is your level of agreement on the following statements regarding the need of cost
management for successful implementation of e-services?
Answer Options Strongly
agree Agree
Neither
agree/
disagree
Disagre
e
Strongly
disagree
Respons
e Count
&
Percent
age
Cost management is
required for setting the
infrastructure of e-services
via Internet connection
55 64 10 2 0 131
42.0% 48.9% 7.6% 1.5% 0.0% 100%
Cost management is
required to maintain the
hardware and software
components of e-services
56 58 15 2 0 131
42.7% 44.3% 11.5% 1.5% 0.0% 100%
Cost management is
required to manage the legal
issues
38 57 24 11 1 131
29.0% 43.5% 18.3% 8.4% 0.8% 100%
Cost management is
required to adapt rapid
technology changes
58 53 16 4 0 131
44.3% 40.5% 12.2% 3.1% 0.0% 100%
Table 10: Respondents’ opinions regarding delayed delivery of IT services
4.9 FACTOR ANALYSIS
Factor analysis is a technique through which dimension reduction is done. This means that if we
use 11 variables in our research, it might not be possible that all 11 variables are effective for the
study. Factor analysis tells us the most important factors, which should be used. We have done
principal component analysis to find out what factors are useful for this study and which variables
should not be bothered with. In our research, we find out 3 factors that are relevant to our study
based on the Eigen values greater than one. However, before factor analysis is ran, we need to find
out whether the sample is adequate to run factor analysis. For this, we have to use KMO and
Bartlett’s test. KMO test is a measure of sampling adequacy and its minimum value should be 0.5.
The value of 0.5 indicates that the sample size is just adequate or significant for the study. In our
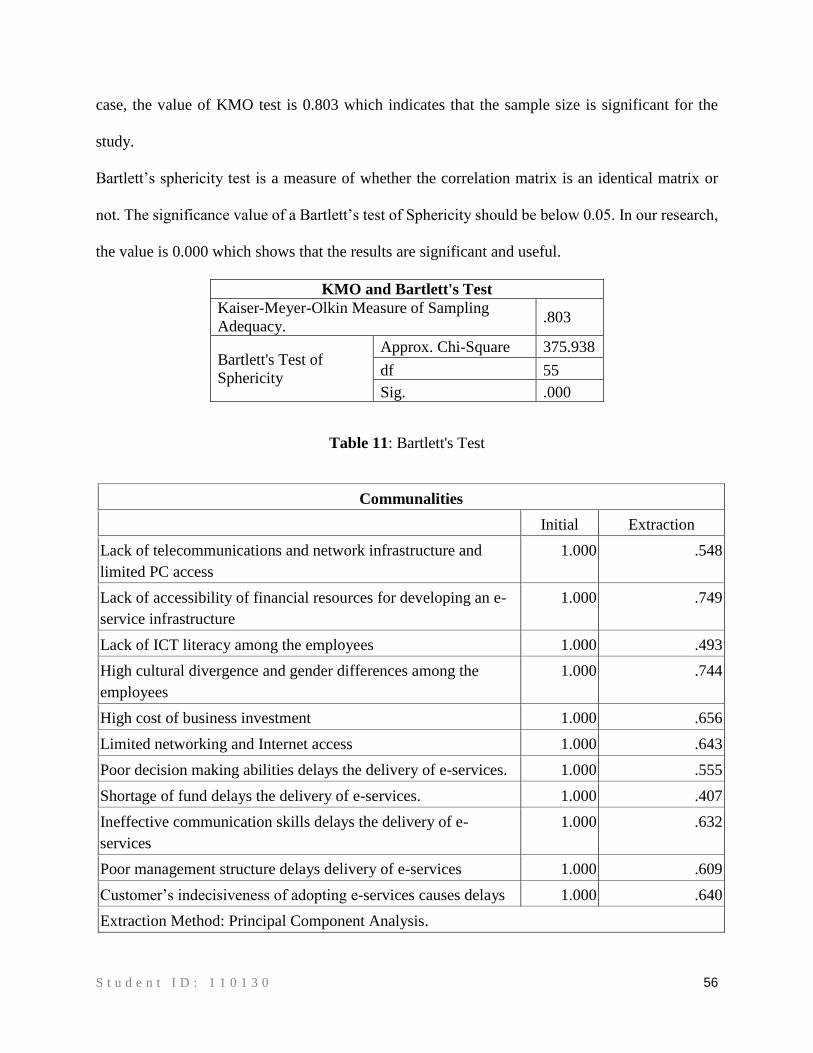
S t u d e n t I D : 1 1 0 1 3 0 56
case, the value of KMO test is 0.803 which indicates that the sample size is significant for the
study.
Bartlett’s sphericity test is a measure of whether the correlation matrix is an identical matrix or
not. The significance value of a Bartlett’s test of Sphericity should be below 0.05. In our research,
the value is 0.000 which shows that the results are significant and useful.
KMO and Bartlett's Test
Kaiser-Meyer-Olkin Measure of Sampling
Adequacy. .803
Bartlett's Test of
Sphericity
Approx. Chi-Square 375.938
df 55
Sig. .000
Table 11: Bartlett's Test
Communalities
Initial Extraction
Lack of telecommunications and network infrastructure and
limited PC access
1.000 .548
Lack of accessibility of financial resources for developing an e-
service infrastructure
1.000 .749
Lack of ICT literacy among the employees 1.000 .493
High cultural divergence and gender differences among the
employees
1.000 .744
High cost of business investment 1.000 .656
Limited networking and Internet access 1.000 .643
Poor decision making abilities delays the delivery of e-services. 1.000 .555
Shortage of fund delays the delivery of e-services. 1.000 .407
Ineffective communication skills delays the delivery of e-
services
1.000 .632
Poor management structure delays delivery of e-services 1.000 .609
Customer’s indecisiveness of adopting e-services causes delays 1.000 .640
Extraction Method: Principal Component Analysis.
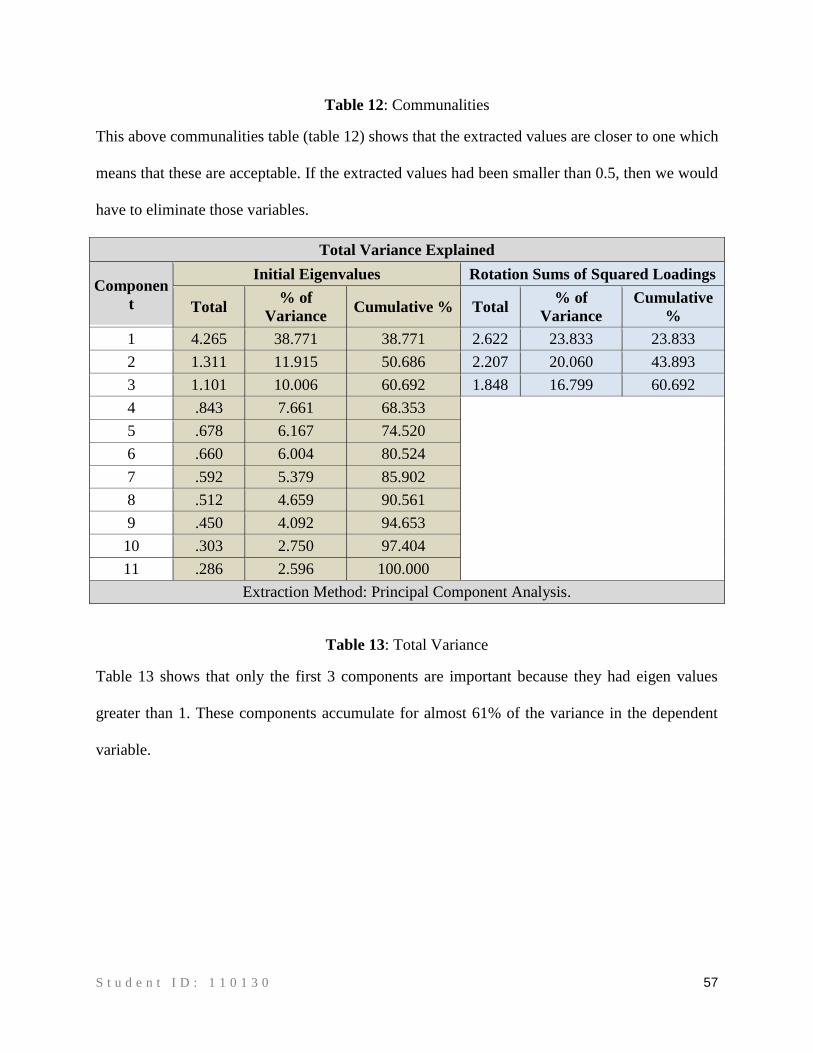
S t u d e n t I D : 1 1 0 1 3 0 57
Table 12: Communalities
This above communalities table (table 12) shows that the extracted values are closer to one which
means that these are acceptable. If the extracted values had been smaller than 0.5, then we would
have to eliminate those variables.
Total Variance Explained
Componen
t
Initial Eigenvalues Rotation Sums of Squared Loadings
Total % of
Variance Cumulative % Total
% of
Variance
Cumulative
%
1 4.265 38.771 38.771 2.622 23.833 23.833
2 1.311 11.915 50.686 2.207 20.060 43.893
3 1.101 10.006 60.692 1.848 16.799 60.692
4 .843 7.661 68.353
5 .678 6.167 74.520
6 .660 6.004 80.524
7 .592 5.379 85.902
8 .512 4.659 90.561
9 .450 4.092 94.653
10 .303 2.750 97.404
11 .286 2.596 100.000
Extraction Method: Principal Component Analysis.
Table 13: Total Variance
Table 13 shows that only the first 3 components are important because they had eigen values
greater than 1. These components accumulate for almost 61% of the variance in the dependent
variable.
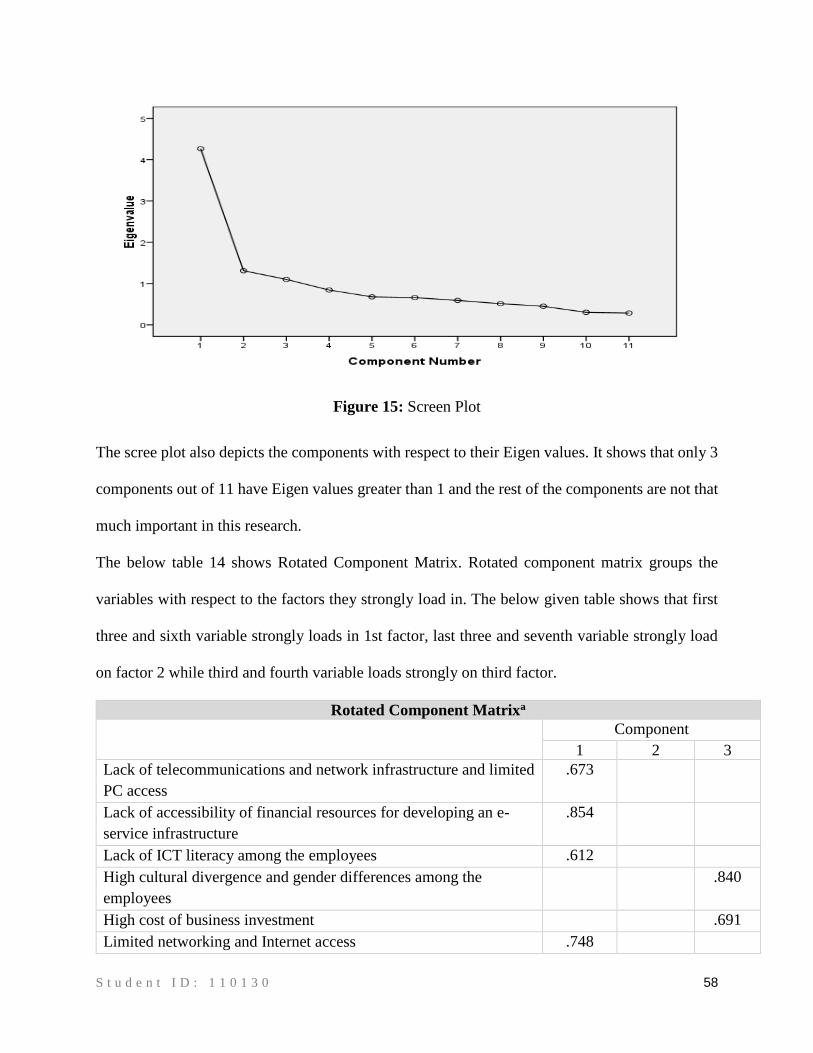
S t u d e n t I D : 1 1 0 1 3 0 58
Figure 15: Screen Plot
The scree plot also depicts the components with respect to their Eigen values. It shows that only 3
components out of 11 have Eigen values greater than 1 and the rest of the components are not that
much important in this research.
The below table 14 shows Rotated Component Matrix. Rotated component matrix groups the
variables with respect to the factors they strongly load in. The below given table shows that first
three and sixth variable strongly loads in 1st factor, last three and seventh variable strongly load
on factor 2 while third and fourth variable loads strongly on third factor.
Rotated Component Matrixa
Component
1 2 3
Lack of telecommunications and network infrastructure and limited
PC access
.673
Lack of accessibility of financial resources for developing an e-
service infrastructure
.854
Lack of ICT literacy among the employees .612
High cultural divergence and gender differences among the
employees
.840
High cost of business investment .691
Limited networking and Internet access .748
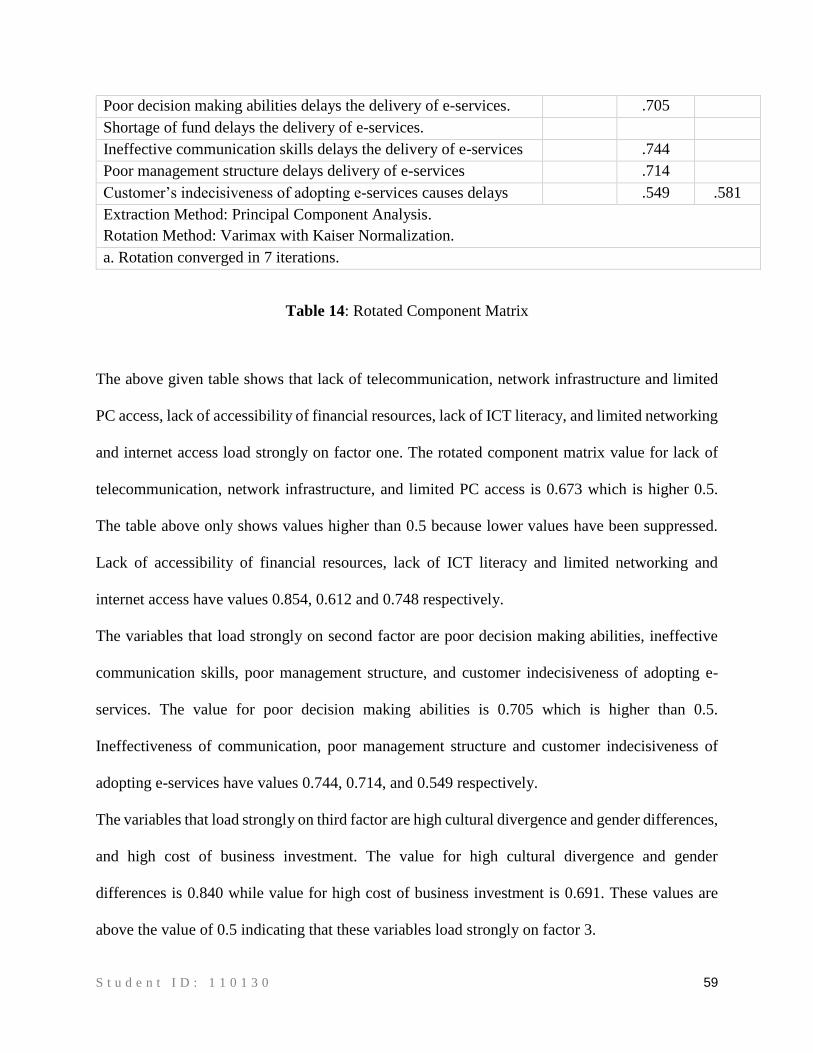
S t u d e n t I D : 1 1 0 1 3 0 59
Poor decision making abilities delays the delivery of e-services. .705
Shortage of fund delays the delivery of e-services.
Ineffective communication skills delays the delivery of e-services .744
Poor management structure delays delivery of e-services .714
Customer’s indecisiveness of adopting e-services causes delays .549 .581
Extraction Method: Principal Component Analysis.
Rotation Method: Varimax with Kaiser Normalization.
a. Rotation converged in 7 iterations.
Table 14: Rotated Component Matrix
The above given table shows that lack of telecommunication, network infrastructure and limited
PC access, lack of accessibility of financial resources, lack of ICT literacy, and limited networking
and internet access load strongly on factor one. The rotated component matrix value for lack of
telecommunication, network infrastructure, and limited PC access is 0.673 which is higher 0.5.
The table above only shows values higher than 0.5 because lower values have been suppressed.
Lack of accessibility of financial resources, lack of ICT literacy and limited networking and
internet access have values 0.854, 0.612 and 0.748 respectively.
The variables that load strongly on second factor are poor decision making abilities, ineffective
communication skills, poor management structure, and customer indecisiveness of adopting e-
services. The value for poor decision making abilities is 0.705 which is higher than 0.5.
Ineffectiveness of communication, poor management structure and customer indecisiveness of
adopting e-services have values 0.744, 0.714, and 0.549 respectively.
The variables that load strongly on third factor are high cultural divergence and gender differences,
and high cost of business investment. The value for high cultural divergence and gender
differences is 0.840 while value for high cost of business investment is 0.691. These values are
above the value of 0.5 indicating that these variables load strongly on factor 3.
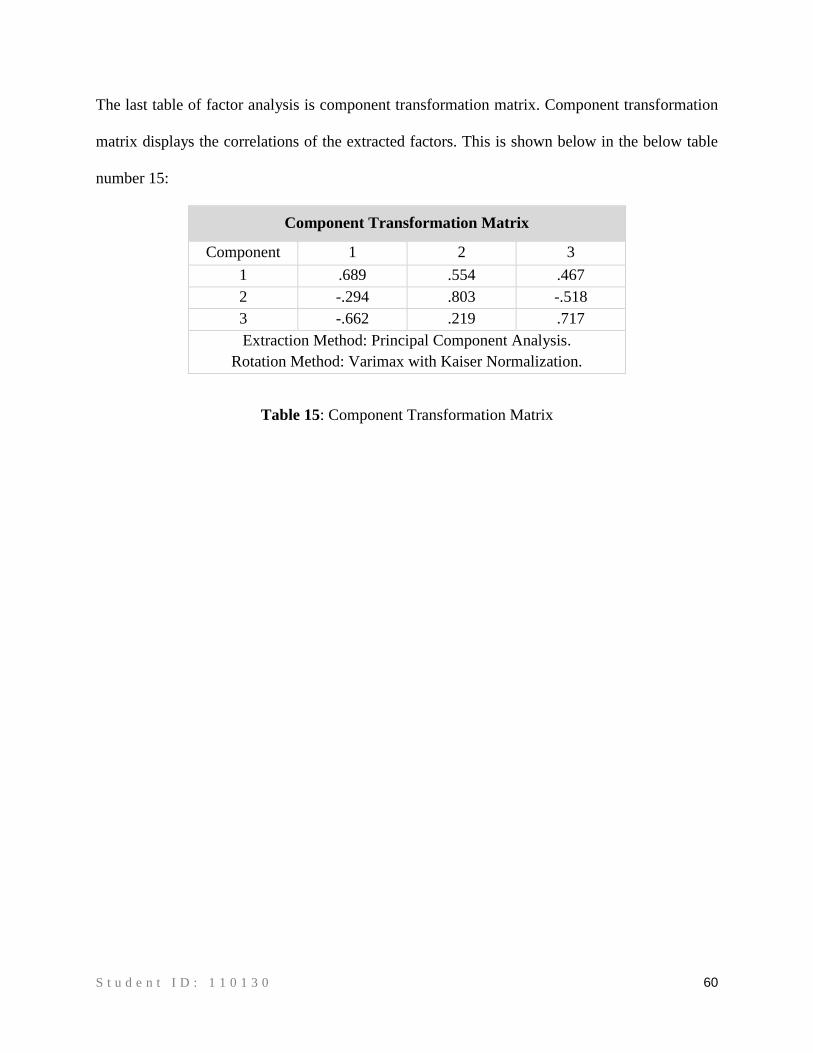
S t u d e n t I D : 1 1 0 1 3 0 60
The last table of factor analysis is component transformation matrix. Component transformation
matrix displays the correlations of the extracted factors. This is shown below in the below table
number 15:
Component Transformation Matrix
Component 1 2 3
1 .689 .554 .467
2 -.294 .803 -.518
3 -.662 .219 .717
Extraction Method: Principal Component Analysis.
Rotation Method: Varimax with Kaiser Normalization.
Table 15: Component Transformation Matrix
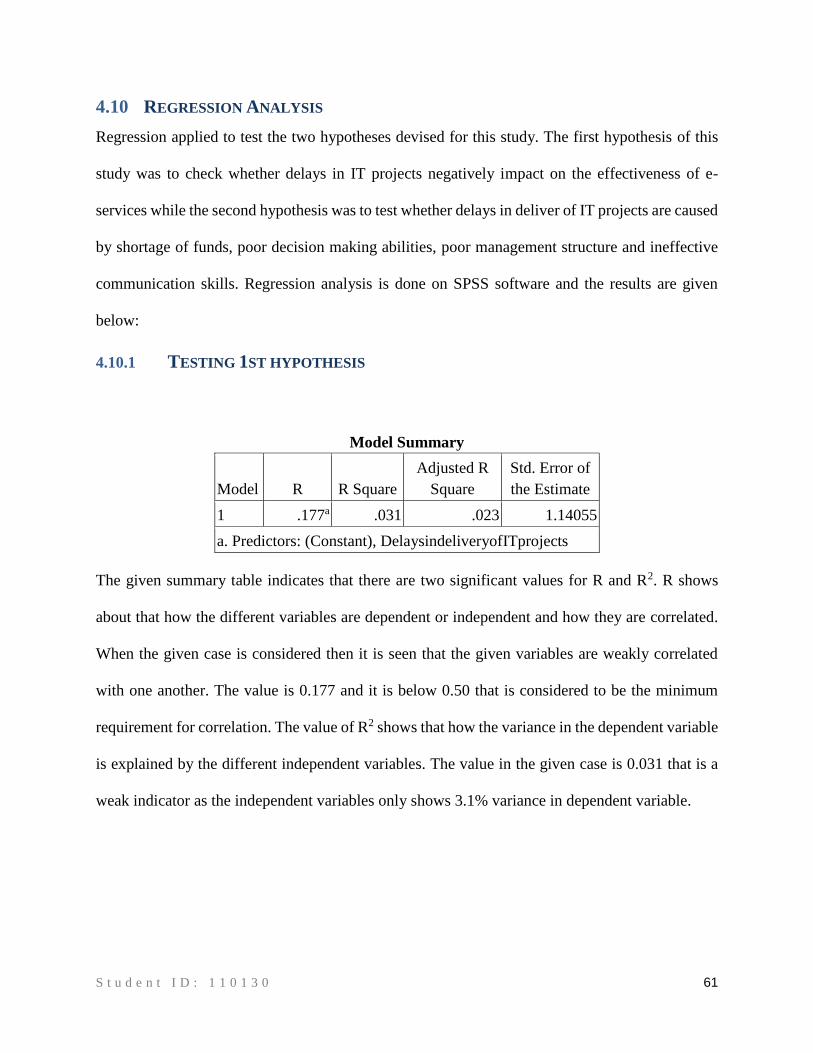
S t u d e n t I D : 1 1 0 1 3 0 61
4.10 REGRESSION ANALYSIS
Regression applied to test the two hypotheses devised for this study. The first hypothesis of this
study was to check whether delays in IT projects negatively impact on the effectiveness of e-
services while the second hypothesis was to test whether delays in deliver of IT projects are caused
by shortage of funds, poor decision making abilities, poor management structure and ineffective
communication skills. Regression analysis is done on SPSS software and the results are given
below:
4.10.1 TESTING 1ST HYPOTHESIS
Model Summary
Model R R Square
Adjusted R
Square
Std. Error of
the Estimate
1 .177a .031 .023 1.14055
a. Predictors: (Constant), DelaysindeliveryofITprojects
The given summary table indicates that there are two significant values for R and R2. R shows
about that how the different variables are dependent or independent and how they are correlated.
When the given case is considered then it is seen that the given variables are weakly correlated
with one another. The value is 0.177 and it is below 0.50 that is considered to be the minimum
requirement for correlation. The value of R2 shows that how the variance in the dependent variable
is explained by the different independent variables. The value in the given case is 0.031 that is a
weak indicator as the independent variables only shows 3.1% variance in dependent variable.
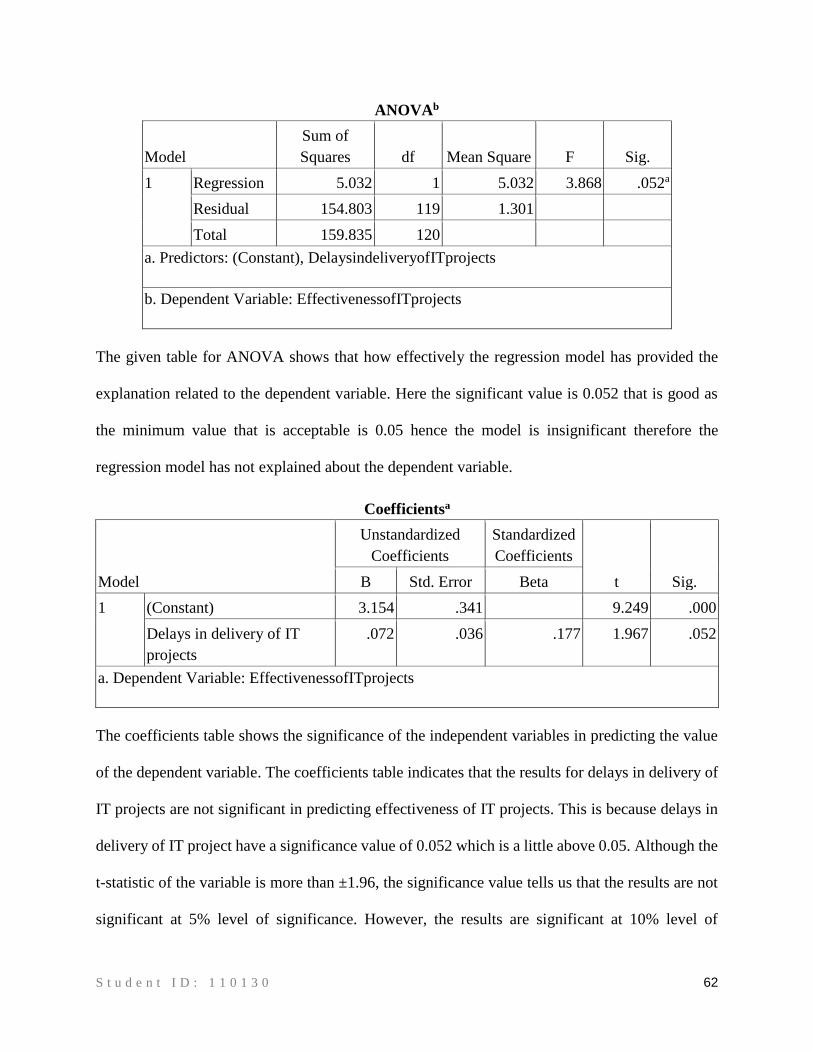
S t u d e n t I D : 1 1 0 1 3 0 62
ANOVAb
Model
Sum of
Squares df Mean Square F Sig.
1 Regression 5.032 1 5.032 3.868 .052a
Residual 154.803 119 1.301
Total 159.835 120
a. Predictors: (Constant), DelaysindeliveryofITprojects
b. Dependent Variable: EffectivenessofITprojects
The given table for ANOVA shows that how effectively the regression model has provided the
explanation related to the dependent variable. Here the significant value is 0.052 that is good as
the minimum value that is acceptable is 0.05 hence the model is insignificant therefore the
regression model has not explained about the dependent variable.
Coefficientsa
Model
Unstandardized
Coefficients
Standardized
Coefficients
t Sig. B Std. Error Beta
1 (Constant) 3.154 .341 9.249 .000
Delays in delivery of IT
projects
.072 .036 .177 1.967 .052
a. Dependent Variable: EffectivenessofITprojects
The coefficients table shows the significance of the independent variables in predicting the value
of the dependent variable. The coefficients table indicates that the results for delays in delivery of
IT projects are not significant in predicting effectiveness of IT projects. This is because delays in
delivery of IT project have a significance value of 0.052 which is a little above 0.05. Although the
t-statistic of the variable is more than ±1.96, the significance value tells us that the results are not
significant at 5% level of significance. However, the results are significant at 10% level of
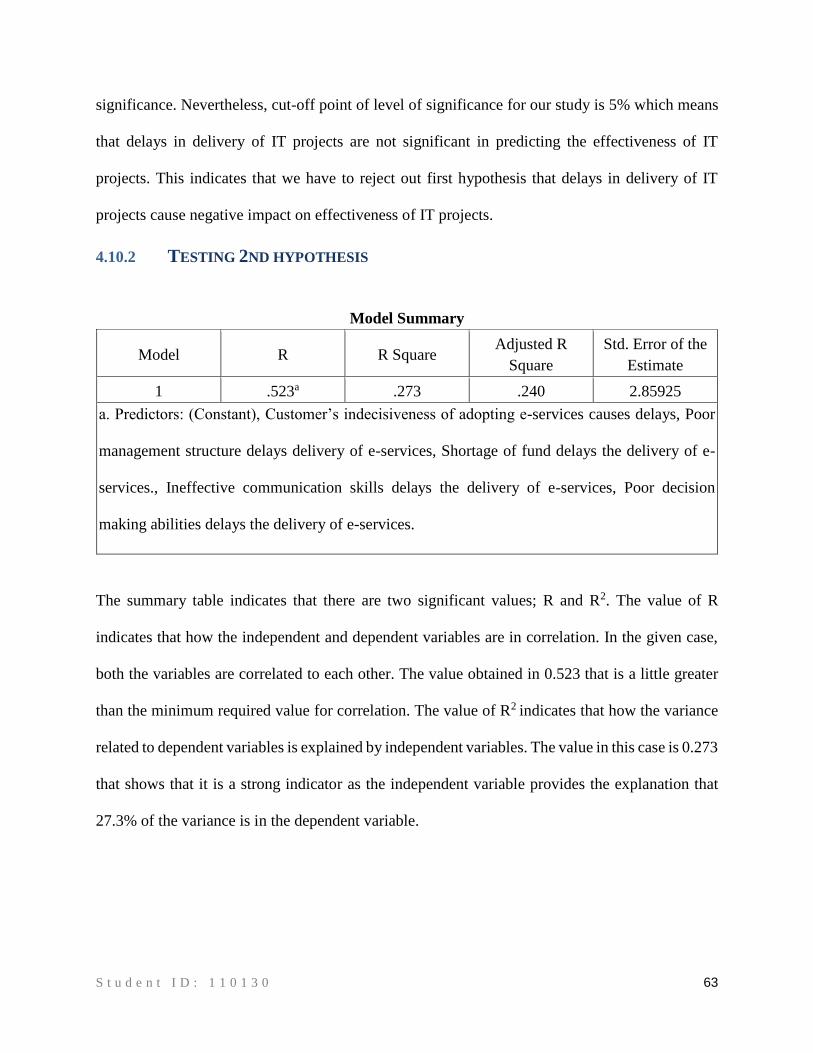
S t u d e n t I D : 1 1 0 1 3 0 63
significance. Nevertheless, cut-off point of level of significance for our study is 5% which means
that delays in delivery of IT projects are not significant in predicting the effectiveness of IT
projects. This indicates that we have to reject out first hypothesis that delays in delivery of IT
projects cause negative impact on effectiveness of IT projects.
4.10.2 TESTING 2ND HYPOTHESIS
Model Summary
Model R R Square Adjusted R
Square
Std. Error of the
Estimate
1 .523a .273 .240 2.85925
a. Predictors: (Constant), Customer’s indecisiveness of adopting e-services causes delays, Poor
management structure delays delivery of e-services, Shortage of fund delays the delivery of e-
services., Ineffective communication skills delays the delivery of e-services, Poor decision
making abilities delays the delivery of e-services.
The summary table indicates that there are two significant values; R and R2. The value of R
indicates that how the independent and dependent variables are in correlation. In the given case,
both the variables are correlated to each other. The value obtained in 0.523 that is a little greater
than the minimum required value for correlation. The value of R2 indicates that how the variance
related to dependent variables is explained by independent variables. The value in this case is 0.273
that shows that it is a strong indicator as the independent variable provides the explanation that
27.3% of the variance is in the dependent variable.
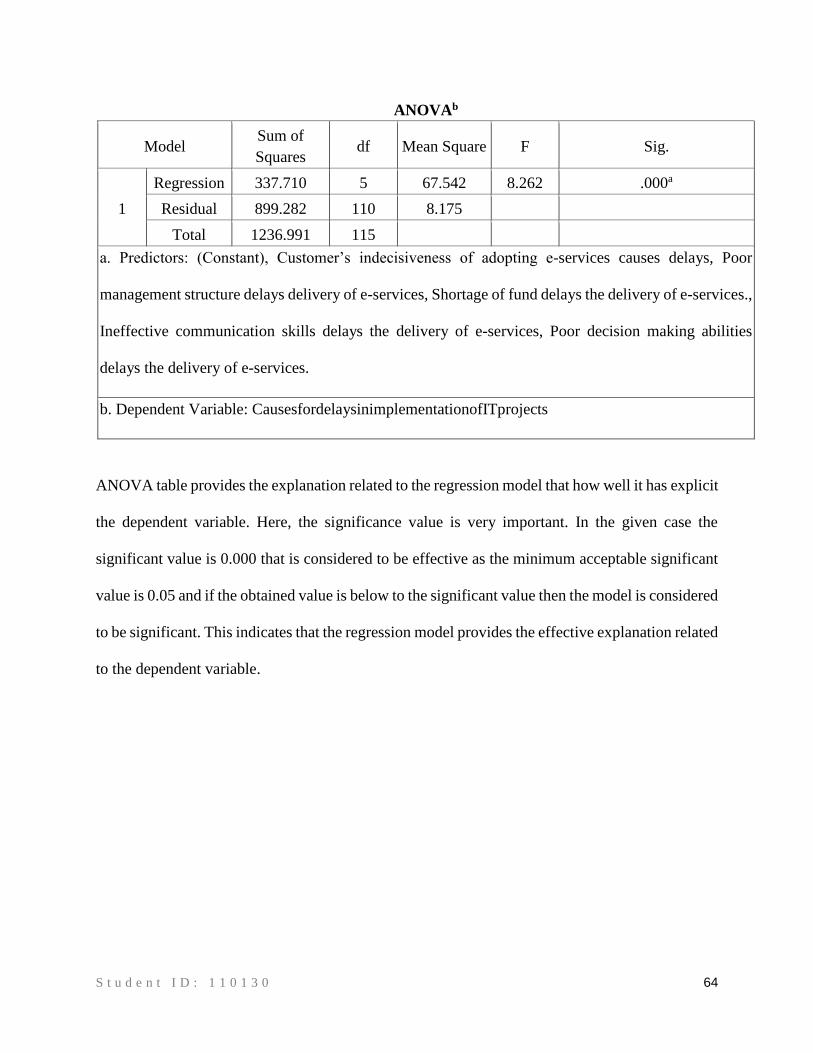
S t u d e n t I D : 1 1 0 1 3 0 64
ANOVAb
Model Sum of
Squares df Mean Square F Sig.
1
Regression 337.710 5 67.542 8.262 .000a
Residual 899.282 110 8.175
Total 1236.991 115
a. Predictors: (Constant), Customer’s indecisiveness of adopting e-services causes delays, Poor
management structure delays delivery of e-services, Shortage of fund delays the delivery of e-services.,
Ineffective communication skills delays the delivery of e-services, Poor decision making abilities
delays the delivery of e-services.
b. Dependent Variable: CausesfordelaysinimplementationofITprojects
ANOVA table provides the explanation related to the regression model that how well it has explicit
the dependent variable. Here, the significance value is very important. In the given case the
significant value is 0.000 that is considered to be effective as the minimum acceptable significant
value is 0.05 and if the obtained value is below to the significant value then the model is considered
to be significant. This indicates that the regression model provides the effective explanation related
to the dependent variable.
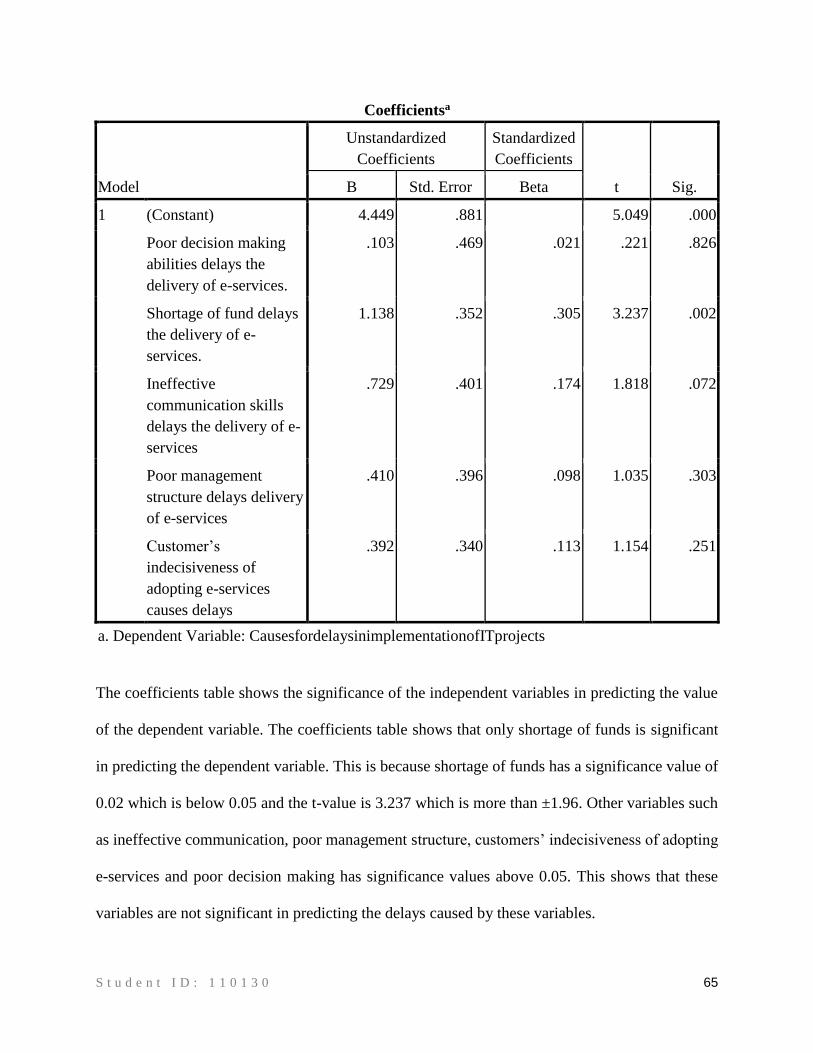
S t u d e n t I D : 1 1 0 1 3 0 65
Coefficientsa
Model
Unstandardized
Coefficients
Standardized
Coefficients
t Sig. B Std. Error Beta
1 (Constant) 4.449 .881 5.049 .000
Poor decision making
abilities delays the
delivery of e-services.
.103 .469 .021 .221 .826
Shortage of fund delays
the delivery of e-
services.
1.138 .352 .305 3.237 .002
Ineffective
communication skills
delays the delivery of e-
services
.729 .401 .174 1.818 .072
Poor management
structure delays delivery
of e-services
.410 .396 .098 1.035 .303
Customer’s
indecisiveness of
adopting e-services
causes delays
.392 .340 .113 1.154 .251
a. Dependent Variable: CausesfordelaysinimplementationofITprojects
The coefficients table shows the significance of the independent variables in predicting the value
of the dependent variable. The coefficients table shows that only shortage of funds is significant
in predicting the dependent variable. This is because shortage of funds has a significance value of
0.02 which is below 0.05 and the t-value is 3.237 which is more than ±1.96. Other variables such
as ineffective communication, poor management structure, customers’ indecisiveness of adopting
e-services and poor decision making has significance values above 0.05. This shows that these
variables are not significant in predicting the delays caused by these variables.
S t u d e n t I D : 1 1 0 1 3 0 66
For the regression analysis, we have transformed the questions related to the causes that limit the
successful implementation of e-services. This transformed variable serves as the dependent
variable for the second hypothesis. Dependent variable in the second hypothesis is delays in the
implementation and delivery of e-services. The transformed variable is named as causes for the
delays in implementation of IT projects. This variable combines all the causes that limit the
implementation of IT projects.
When regressed with independent variables, it tells us whether experts think that causes that limit
the successful implementation are high when poor decision-making abilities, shortage of fund,
ineffective communication skills and poor management structure are evident. The results show
that the causes that limit the successful implementation of IT projects are high only when there is
shortage of fund. The results are only significant for the variable shortage of funds because its
significance value is less than 0.05.
The results for poor decision making abilities, ineffective communication skills, poor management
structure and customer indecisiveness of adopting e-services are not significant with p-values more
than 0.05. The p-value of poor decision making abilities is 0.826; p-value for ineffective
communication skills is 0.072, p-value for poor decision making abilities is 0.303 while p-value
for customer’s indecisiveness of adopting e-services is 0.251. This shows that the results for these
variables are insignificant.
Overall, ANOVA table shows that predictor variables are efficient in predicting the dependent
variable. The ANOVA table results have a significance value of 0.000 below the minimum
threshold of 0.05 which shows significant results. This means that we have to accept our second
hypothesis because sufficient evidence is available to prove that delays in delivery of IT projects
are caused by lack of decision making abilities, ineffective communication among employees,

S t u d e n t I D : 1 1 0 1 3 0 67
shortage of funds, poor management structure and customer indecisiveness of adopting e-services.
Although very little variation in dependent variable is explained by the independent variables,
predictor variables efficiently predict the dependent variable.
S t u d e n t I D : 1 1 0 1 3 0 68
5. CHAPTER FIVE: CONCLUSION
With the rapid expansion of technology and e-services, there was a need to study the importance
of e-services for the govt. of UAE as UAE is considered pioneer in adopting new e-services in the
MENA region. This study was conducted to fill this gap. This research study focused on
identifying whether experts think that e-services provide the expected benefits to UAE or not. This
research was also conducted to identify the causes that limit the successful implementation of the
IT projects and causes for the delays in delivery of e-services.
The research employed quantitative research approach to collect and analyze the data. Factor
analysis and Regression analysis were applied on the data to conclude results. Two hypotheses
were devised for this study. First hypothesis was related to identifying whether the delays in
delivery of e-services negatively impacts the effectiveness of the e-services while the second
hypothesis was to test whether shortage of funds, poor decision making abilities, ineffective
communication skills and poor management structure are the primary causes of delays in delivery
of IT services.
We ran factor analysis to reduce the variables for the delays in delivery of IT services and the
causes for delays in delivery of IT services. The results of factor analysis show that out of the 11
variables included in the study, only three factors are extracted based on the Eigen values greater
than 1. These 11 variables load strongly on these 3 factors. There is no need to use all 11 variables
for the study, three variables can be used which explain the most variance. The total variance
explained table of factor analysis shows that the first factor explains around 20.8% of the variance,
second factor explains 20.1% of the variance while third factor explains 16.8% of the variance.
These three factors cumulatively explain 60% of the variance in the data.
S t u d e n t I D : 1 1 0 1 3 0 69
The second most important thing in the factor analysis is the rotated component matrix table.
Rotated component matrix groups the variables with respect to the factors they strongly load in.
Rotated component matrix table shows that lack of communication, network infrastructure and
limited PC access, lack of accessibility of financial resources, lack of ICT literacy and limited
networking and internet access load strongly on first factor while poor decision making abilities,
poor management structure, ineffective communication skills load strongly on second factor.
Variables that load strongly on third factor include high cost of business investment, and high
cultural divergence and gender differences.
After running factor analysis, we applied linear regression to test the two hypotheses. First
hypothesis of this study was to test whether delays in delivery of e-services negatively impacts the
effectiveness of e-services projects. The results of the regression analysis indicate insignificant
results at 5% level of significance although the results were significant at 10% level of significance.
The p-value of ANOVA table was 0.052, slightly above than 0.05, our cut-off point for 5% level
of significance. This p-value indicates that the results are insignificant and delays in deliver of e-
services cannot any negative impact in the effectiveness of e-services. The results are contrary to
our hypothesis which means that we have to reject our first hypothesis that delays in delivery of e-
services negatively impact the effectiveness of e-services.
Our second hypothesis was to test whether ineffective communication skills, shortage of funds,
poor management structure and poor decision making abilities cause delays in delivery of IT
services. Overall, the results of regression analysis are significant. ANOVA table results show
significant results indicating regression equation is a good predictor of dependent variable which
is delays in delivery of IT projects. The p-value in ANOVA table is 0.000 which is below 0.05
indicating significant results. These results show that regression equation effectively predicts the

S t u d e n t I D : 1 1 0 1 3 0 70
dependent variable. However, the coefficients table shows that only shortage of funds has
significant impact on causing delays in delivery of IT services. The p-value of shortage of funds
is 0.02 which is less than 0.05 and indicates significance in predicting delays in delivery of IT
projects. All other variables have p-values above 0.05 which indicates insignificance in predicting
delays in delivery of IT projects. Based on the regression results, we have sufficient evidence that
delays in delivery of IT projects are caused by ineffective communication skills, shortage of funds,
poor management structure and poor decision making abilities. Therefore, we have to accept our
second hypothesis.
5.1 FUTURE RESEARCH
As the present research only tells us which factors are causing delays in delivery of IT projects
without consideration of any particular industry; there are many recommendations for future
research. The future studies should focus on predicting the main factors for delay in IT related
projects along with comparing different software houses to compare the causes and predicting
factors for the delay in IT related projects. Odds ratio along with CIs should be calculated in future
to see predicting factors for the delay by taking into the consideration the outcome variable that is
Delay in IT related projects.
S t u d e n t I D : 1 1 0 1 3 0 71
REFERENCES
Abdelhafez, H.A & Amer, A.A. (2014). E-government in selected Arab Countries: Analysis &
Challenges. Egyptian Computer Science Journal, vol. 38(2), pp. 67-72.
AlAwadhi, S. & Morris, A. (2008). The use of the UTAUT model in the adoption of e-
government services in Kuwait. In 41st Hawaii International Conference on System Sciences.
Hawaii , 2008.
Al-Khouri, A.M & Bachlaghem, M. (2011). Towards Federated eIdentity Management across
the GCC: A Solution’s Framework. Global Journal of Strategies & Governance, vol. 4(1), pp.
30-49.
Al-Khouri, A.M & Bal, J. (2007). Electronic Government in the GCC Countries. International
Journal of Social Sciences, vol. 1(2), pp. 83-98.
Al-Khouri, A.M. (2012). eGovernment Strategies The Case of the United Arab. European
journal of e-Practice. vol. (17), pp. 126-47.
Al-Shafi, S.H. (2009). Factors affecting e-Government implementation and adoption in the State
of Qatar. Doctoral dissertation. Brunel University.
AlShihi, H. (2005). E-government development and adoption dilemma: Oman case study. In 6th
International We-B (Working for e-Business) Conference. Melbourne, Australia, 2005. Victoria
University.
Baker, P.M.A. & Bellordre, C. (2004). Adoption of information and communication
technologies: key policy issues barriers and opportunities for people with disabilities. In 37th
Hawaii International Conference on System Sciences. Hawaii , 2004.
Bhavnani, A., Chiu, R.W.-W., Janakiram, S. & Silarszky, P. (2008). The Role of Mobile Phones
in Sustainable Rural Poverty Reduction. Working document,. World Bank.
Blumberg, B., Cooper, D.C. & Schindler, P.S. (2005). Business Research Methods. Berkshire:
McGraw Hill.

S t u d e n t I D : 1 1 0 1 3 0 72
Bryman, A. & Bell, E. (2011). Business Research Methods. Oxford : Oxford university Press.
Business Monitor International. (2014). Business Monitor International Catalogue of Products &
Services. UAE: Business Monitor International.
Carter, L. & Belanger, F. (2004). Citizen adoption of electronic government initiatives. In 37th
Hawaii International Conference on System Sciences. Hawaii, 2004.
Chen, Y.N. & et al. (2006). E-government strategies in developed and developing countries: an
implementation framework and case study. Journal of Global Information Management, vol.
14(1), pp. 23-46.
Cheung, G.W. & Rensvold, R.B. (2001). The effects of model parsimony and sampling error on
the fit of structural equations model. Organizational Research Methods, vol. 4(3), pp.236–264.
Cohen, L., Manion, L. & Morrison, K. (2011). Research Methods in Education. 7th ed. London:
Routledge.
Crowther, D. & Lancaster, G. (2008). Research Methods A concise introduction to research in
management and business consultancy. 2nd ed. Oxford: Elsevier.
Curtis, S., Gesler, W., Smith, G. & Washburn, S. (2000). Approaches to sampling and case
selection in qualitative tative research: Examples in the geography of health. Social Science and
Medicine , vol. 50(2000), pp.1001-1014.
Degu, G. & Yigzaw, T. (2006). Research Methodology. Lecture notes. Ethiopia : Ethiopia
Ministry of Health, and the Ethiopia Ministry of Education Ethiopia Public Health Training
Initiative.
Dutta, S. & Mia, I.. (2011). The Global Information Technology Report 2010–2011. Technology
Report. Insead The Business school for the World.
Evans, E. & Yen, D.C. (2005). E-government: an analysis forimplementation: framework for
understanding cultural and social impact. Government Information Quarterly, vol. 22 (3),
pp.345-373.
S t u d e n t I D : 1 1 0 1 3 0 73
Garboan, R. (2009). Concepts of research methods and statistics used in program evaluation.
Transylvanian Review of
Ghasemi, A. & Zahediasl, S. (2012). Normality tests for statistical analysis: a guide for non-
statisticians. International journal of endocrinology and metabolism, vol. 10(2), pp.486-489.
Gliem, R.R. & Gliem, J.A. (2003). Calculating, Interpreting, And Reporting Cronbach’s Alpha
Reliability Coefficient For Likert-Type Scales. In Midwest Research to Practice Conference in
Adult, Continuing, and Community Education., 2003. Ohio State University.
Goldmann, T. (2011). A definition of time by relation of energy and mass. Borstel: Research
Center Borstel.
Hair Jr, J.F. et al. (2011). Essentials of Business Research Methods. 2nd ed. New York: M.E.
Sharpe Inc.
Hung, S.Y., Chang, C.M. & Yu, T.J. (2006). Determinants of user acceptance of the e-
government services: the case of online tax filing and payment system. Government Information
Quarterly, vol. 23, pp.97-122.
Internet World Stats. (2016). MIDDLE EAST [Online]. [Accessed 13 February 2017]. Available
at: http://www.internetworldstats.com/middle.htm
Kothari, C.R. (2006). Research Methodology, Methods & Techniques. 2nd ed. Delhi: New Age.
Li, F. (2003). Implementing e-government strategy in Scotland: current situation and emerging
issues. Journal of Electronic Commerce in Organizations, vol. 1(2), pp.44-65.
Ministry of Health and Prevention (2016). MOBILE SERVICES [Online]. [Accessed 15 February
2017]. Available at: http://www.moh.gov.ae/en/Pages/MobileServices.aspx
Morris, R.W. (1991). Limitations of Quantitative Methods for Research on Values in Sexuality
Education. CANADIAN JOURNAL OF EDUCATION, vol. 16(1), pp.82-95.
NEWCOMBE, T. (2014). The United Arab Emirates: A Rising Star in E-Government.
Newspaper aerticle. UAE: Governing.
S t u d e n t I D : 1 1 0 1 3 0 74
Nikkhahan, B., Aghdam, A.J. & Sohrabi, S. (2009). e-Government Security: A Honeynet
Approach. International Journal of Advanced Science and Technology, vol. 5, pp.75-84.
Nysveen, H., Pedersen, P.E. & Thorbjørnsen, H. (2005). Explaining intention to use mobile chat
services: moderating effects of gender. Journal of Consumer Marketing, vol. 22(5), pp.247-56.
Packer, M.J. & Addison, R.B. (1989). Evaluating an interpretive account. In Addison,
M.J.P.&.R.B. Entering the circle: Hermeneutic investigation in psychology. New York: State
University of New York Press. pp.275-292.
Palys, T. (2003). Research Decisions: Quantitative and Qualitative Perspectives. 3rd ed.
Ontario, Canada: Thomas Nelson.
Palys, T. (2008). Purposive sampling. In L.M. Given, ed. The Sage Encyclopedia of Qualitative
Research Methods. Los Angeles: Sage. pp.697-800.
Parent, M., Vandebeek, C.A. & Gemino, A.C. (2004). Building trust through e-government.
Government Information Quarterly, 22, pp.720-736.
Ramona, S.E. (2011). Advantages and Disadvantages of Quantitative and Qualitative
Information Risk Approaches. Chinese Business Review, vol. 10(12), pp. 1106-1110.
Saunders, M., Thornhill, A. & Lewis, P. (2009). Research Methods for Business Students. 5th ed.
Pearson Education.
Sekaran, U. (2003). Research Method for Business: A Skill Building Approach. 4th ed.
Singapore: John Wiley and Sons, Inc.
Singh, Y.K. (2006). Fundamental of research methodology and statistics. New Delhi: New Age
International (P) Ltd., Publishers.
Teddlie, C. & Yu, F. (2007). Mixed Methods Sampling A Typology With Examples. Journal of
Mixed Methods Research, vol. 1(1), pp.77-100.

S t u d e n t I D : 1 1 0 1 3 0 75
UNPACS. (2014). UN E-Government Development Database. Research report. United Nation:
Department of Economic and Social Affairs Division for Public Administration and
Development Management.
Zikmund, W.G., Babin, B.J., Carr, J.C. & dan Griffin, M. (2010). Business Research Methods.
8th ed. Australia: South Western Cengage Learning.

S t u d e n t I D : 1 1 0 1 3 0 76
APPENDIX
A Study of Exploring the Causes of Deviation and Improving the Delivery of IT Projects in
UAE Federal Government Sector
Questionnaire
1. What is your age?
o 18 to 24
o 25 to 34
o 35 to 44
o Above 45
2. What is your gender?
o Male
o Female
3. What is your educational background?
o Higher secondary
o Bachelor
o Master
o PhD
4. What is your work experience?
o 0-1 year
o 1-5 years
o 5-10 years
o Above 10 years
5. Please share your opinion regarding the importance of successful implementation of
e-services:
S. No Statements Very
Important
Important
Not Important

S t u d e n t I D : 1 1 0 1 3 0 77
1 E-services facilitates a
capable and
transformational ability
2 E-services helps to
expand dynamic native
cooperation in
government operations
3 E-services provide
alternative ways of
working to promote
innovation
6. What is your opinion regarding the significance of planning in e-government? Please
share your level of agreement against the following statements:
S. No Statements Strongly
disagree
Disagree
Neither
agree/
disagree
Agree Strongly
agree
1 Planning enables the
department to efficiently
attend to every project
by tracking delays
2 Planning helps to attract
more customers
3 Planning keeps each and
every customer satisfied
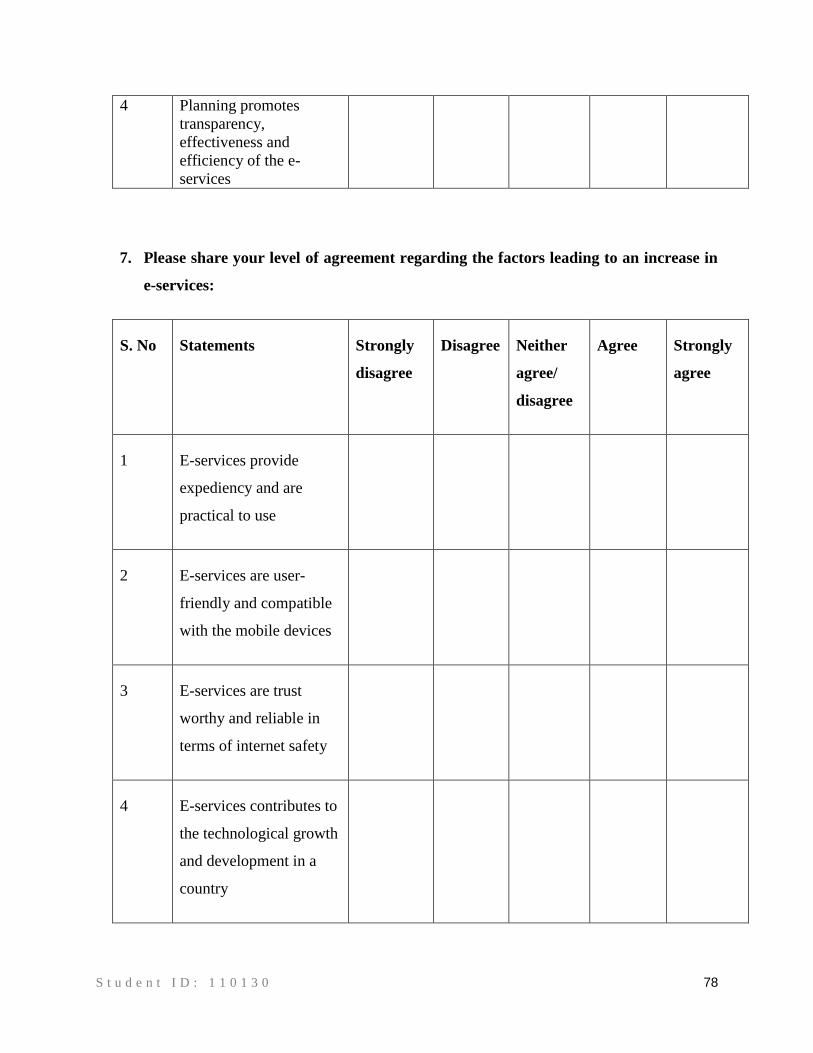
S t u d e n t I D : 1 1 0 1 3 0 78
4 Planning promotes
transparency,
effectiveness and
efficiency of the e-
services
7. Please share your level of agreement regarding the factors leading to an increase in
e-services:
S. No Statements Strongly
disagree
Disagree
Neither
agree/
disagree
Agree Strongly
agree
1 E-services provide
expediency and are
practical to use
2 E-services are user-
friendly and compatible
with the mobile devices
3 E-services are trust
worthy and reliable in
terms of internet safety
4 E-services contributes to
the technological growth
and development in a
country
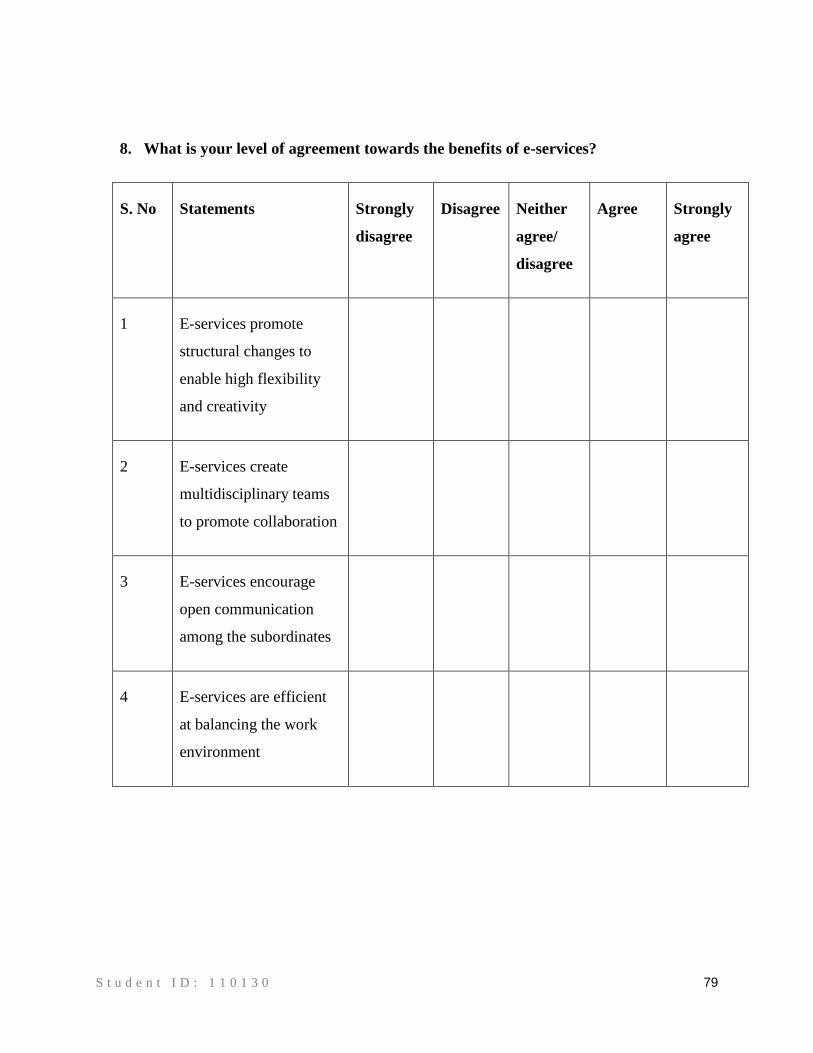
S t u d e n t I D : 1 1 0 1 3 0 79
8. What is your level of agreement towards the benefits of e-services?
S. No Statements Strongly
disagree
Disagree
Neither
agree/
disagree
Agree Strongly
agree
1 E-services promote
structural changes to
enable high flexibility
and creativity
2 E-services create
multidisciplinary teams
to promote collaboration
3 E-services encourage
open communication
among the subordinates
4 E-services are efficient
at balancing the work
environment
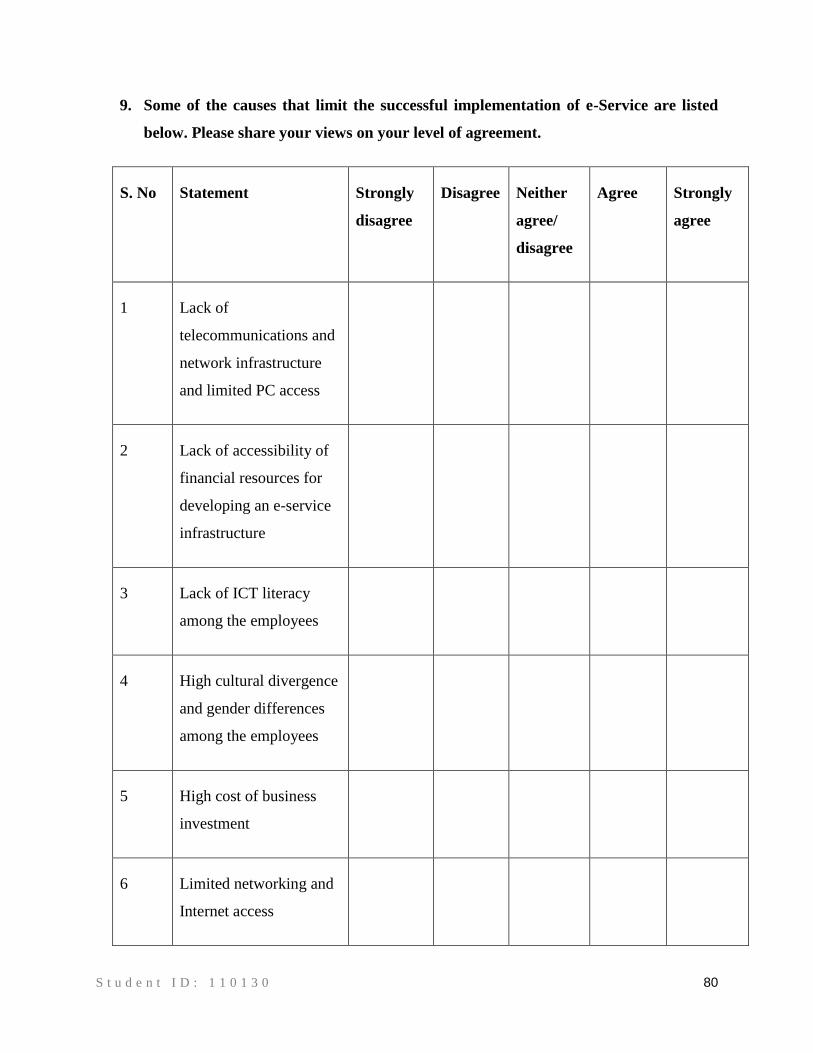
S t u d e n t I D : 1 1 0 1 3 0 80
9. Some of the causes that limit the successful implementation of e-Service are listed
below. Please share your views on your level of agreement.
S. No Statement Strongly
disagree
Disagree
Neither
agree/
disagree
Agree Strongly
agree
1 Lack of
telecommunications and
network infrastructure
and limited PC access
2 Lack of accessibility of
financial resources for
developing an e-service
infrastructure
3 Lack of ICT literacy
among the employees
4 High cultural divergence
and gender differences
among the employees
5 High cost of business
investment
6 Limited networking and
Internet access
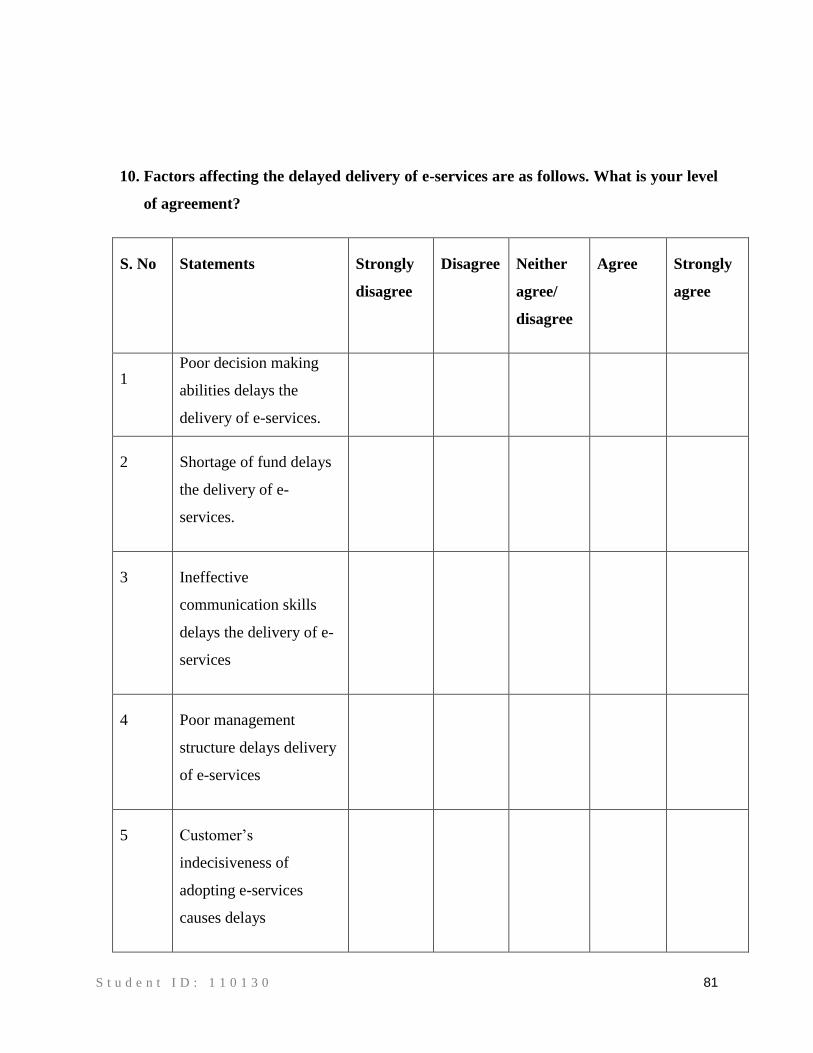
S t u d e n t I D : 1 1 0 1 3 0 81
10. Factors affecting the delayed delivery of e-services are as follows. What is your level
of agreement?
S. No Statements Strongly
disagree
Disagree
Neither
agree/
disagree
Agree Strongly
agree
1 Poor decision making
abilities delays the
delivery of e-services.
2 Shortage of fund delays
the delivery of e-
services.
3 Ineffective
communication skills
delays the delivery of e-
services
4 Poor management
structure delays delivery
of e-services
5 Customer’s
indecisiveness of
adopting e-services
causes delays

S t u d e n t I D : 1 1 0 1 3 0 82
11. What is your level of agreement on the following statements regarding the need of
cost management for successful implementation of e-services?
S. No Statements Strongly
disagree
Disagree
Neither
agree/
disagree
Agree Strongly
agree
1 Cost management is
required for setting the
infrastructure of e-
services via Internet
connection
2 Cost management is
required to maintain the
hardware and software
components of e-
services
3 Cost management is
required to manage the
legal issues
4 Cost management is
required to adapt rapid
technology changes