Embed Size (px)
Citation preview
Exploring the causes of the poor performance by Grade 12 learners in
Calculus-based tasks
by
REUBEN BAFANA DLAMINI
Submitted in accordance with the requirements
for the degree of
MASTER OF EDUCATION WITH SPECIALISATION IN MATHEMATICS EDUCATION
at the
UNIVERSITY OF SOUTH AFRICA
SUPERVISOR: PROF D BRIJLALL
JULY 2017

ii
DECLARATION
I declare that the dissertation titled Exploring the causes of the poor performance
by Grade 12 learners in calculus-based tasks is my own work and that all the sources that I
have used or quoted have been indicated and acknowledged by means of complete references.
I further declare that I have not previously submitted this work, or part of it, for examination
at UNISA for another qualification or at any other higher education institution.
_________________ _____________________
Date
iii
ACKNOWLEDGEMENTS
First and foremost, I would like to thank the Almighty God for providing me with energy and
strength during what ended being one of the toughest times of my life. It was very difficult to
make a balance between my job related duties, family responsibilities and the demands of this
research. However, through His never-ending grace and mercy I managed to complete the
research.
Conducting the research and writing this project report has been a period of intensive learning
for me. The project was so demanding in such a way that I had to get assistance from some
people. Therefore, I would like to reflect on the people who have supported and helped me so
much throughout this period:
I am heartily thankful to my supervisor Prof. D. Brijlall who tirelessly guided me
throughout this research study. His guidance helped me to develop an understanding of
the research
I would like to thank Mr S. B. Msezane for the support and encouragement when I
started. I also thank you for the counselling you gave me when thought of giving up on
my studies
I wish to express my sincere gratitude to the Head of Department of Education in
Mpumalanga Province, Mrs M. O. C. Mohlabane for granting me the permission to
conduct this research in the three schools that were selected for the study
My special gratitude also goes to the District Director of Gert Sibande Department of
Education, Mr P. P. Magagula for endorsing the conducting of this study in his District
I wish to extend my sincere gratitude to the Circuit Manageress of Msukaligwa 1, Mrs E.
S. A. Marais, the Principal of Ithafa Comprehensive School, Mr D. R. Mango; the
Principal of Reggie Masuku Secondary School, Mr M. S. Mahlambi; and the Principal of
Ligbron Academy, Mr D. van Rensburg, for allowing me to conduct this research in their
areas.
iv
I would like to thank my colleagues, Mr A. N. Nkambule and Mr D. J. Ncongwame for
their support and encouragement they gave me and for being there for me while I was
busy with the research.
I am equally grateful to Mrs E. Steyn for editing the language of the final dissertation
I wish to express special thanks to Mr S. S. Gama for assisting in typing this dissertation
I would like to thank my fiancée, Duduzile, for her unending support and love. She was
always there when I needed her, and she encouraged me to do my best. When I would
lose confidence or was ready to give up, she would motivate me to continue
I wish to thank all my children; Fisiwe, Simangaliso, Sisanda, Okuhle, Sinethemba and
Mcebo for being patient and understanding when it looked I have ignored them while I
was busy with this research. I thank them for their endless patience when it was most
required
Last but not the least; I would like to thank both my late parents, for bringing me to this
academic world, raising and supporting me throughout my life
v
DEDICATION
This study is dedicated to the following people:
My late parents, for raising, supporting and loving me from the day I was born to the day
they left this world
All my six children; two girls and four boys for their patience when it looked like I was
ignoring them. You are my source of inspiration.
My fiancée Duduzile for her innumerable love and encouragement throughout this
research
Both my late uncle and aunt Mr Zachariah Sibhebhu Simelane and Mrs Albertinah
Mayovu Simelane for giving me quality secondary school education. This laid a proper
foundation for me and enabled me to survive in this world of academics
vi
ABSTRACT
The study attempted to determine the causes of poor performance among Grade 12 learners in
tasks involving calculus, especially in cubic graphs and the application of differential
calculus. The study was conducted in three schools of the Msukaligwa 1 Circuit in the Gert
Sibande District, Mpumalanga Province in South Africa.
Differential calculus is a branch of mathematics that is concerned mainly with the study of
the rate of change of functions with respect to their variables especially through the use
derivatives and differentials. Students have difficulties in learning and mastering this section
of calculus as is revealed by examiners’ and moderators’ reports year after year. The purpose
of this study was to investigate the possible reasons for the poor performance by Grade 12
learners in calculus-based tasks, especially in cubic graphs and the application in
optimisation.
The study sought to investigate the causes of the poor performance by Grade 12 learners in
tasks based on these two subtopics of calculus. Three schools were selected by means of
purposive sampling: one former model C, one Mathematics, Science and Technology
Academy (MSTA) and one other school that does not fall in either of these two categories.
This enabled the study to have participants from diverse backgrounds.
A qualitative research design was used. Data was collected using learners’ scripts for the
three formal tasks: May common test, June (midyear) and Trial (preparatory) examinations.
Only the questions involving cubic graphs and the application of calculus were part of the
study. Analysis was done in order to determine learners’ challenges, common mistakes, and
misconceptions, but also of good responses given by learners.
vii
CONTENTS
ABSTRACT ............................................................................................................................. .vi
LIST OF TABLES....................................................................................................................xi
LIST OF FIGURES.................................................................................................................xii
TERMINOLOGY ..................................................................................................................xvi
ACRONYMS..........................................................................................................................xvi
CHAPTER 1
BACKGROUND AND PURPOSE OF THE STUDY ......................................................... 1
1.1 Introduction .......................................................................................................................... 6
1.2 Rationale of the study .......................................................................................................... 7
1.3 Research questions ............................................................................................................... 7
1.4 Details of the study .............................................................................................................. 7
1.5 Thesis outline ....................................................................................................................... 8
1.6 Conclusion ........................................................................................................................ 10
CHAPTER 2
LITERATURE REVIEW AND THEORETICAL FRAMEWORK ................................ 11
2.1 Introduction.......................................................................................................................11
2.2 Literature review................................................................................................................11
2.2.1 Mathematics curriculum and performance in other countries ................................. 11
2.2.2 South Africa’s mathematics curriculum and performance ...................................... 20
2.3 Theoretical framework ...................................................................................................... 33
2.3.1 Strands in learning mathematics .............................................................................. 33
2.3.2 Constructivism as a theory of teaching and learning mathematics .......................... 38
2.3.3 Singapore Mathematics – The Mathematical Framework ....................................... 43
2.3.4 APOS theory ............................................................................................................ 46
2.4 Factors that may cause poor performance in mathematics ................................................ 49
2.4.1 Learners’ attitude ..................................................................................................... 54
2.4.2 Textbooks................................................................................................................. 56
2.4.3 Technology .............................................................................................................. 58
2.5 Calculus............................................................................................... ...............................60
2.6 Factors that may cause poor performance in calculus ....................................................... 67
2.7 Difficulties in calculus.......................................................................................................82
2.8 Interventions that may be used to improve performance in mathematics ......................... 83
2.8.1 Use of questions that promote mathematical thinking .............................................. 86
2.8.2 Counter-examples in assisting learners to understand mathematics ......................... 89
2.8.3 Importance of errors in correcting misconceptions .................................................. 91
2.9 Conclusion........................................................................................................................100
viii
CHAPTER 3
RESEARCH METHODOLOGY AND DESIGN ............................................................. 101
3.1 Introduction .....................................................................................................................101
3.2 Research approach ........................................................................................................... 101
3.3 Research method..............................................................................................................102
3.4 Population and sampling .................................................................................................102
3.5 Data collection techniques ...............................................................................................104
3.6 Trustworthiness of a research study.................................................................................104
3.6.1 Credibility ..............................................................................................................105
3.6.2 Transferability .......................................................................................................105
3.6.3 Dependability ........................................................................................................106
3.6.4 Conformability ......................................................................................................106
3.7 Research ethics ................................................................................................................107
3.8 Conclusion .......................................................................................................................108
CHAPTER 4
RESULTS AND DATA ANALYSIS..................................................................................110
4.1 Introduction .....................................................................................................................110
4.2 Question 4 from the May test ..........................................................................................111
4.2.1 Subquestion 4.1.1 ...................................................................................................111
4.2.2 Subquestion 4.1.2 ...................................................................................................120
4.2.3 Subquestion 4.1.3 ...................................................................................................128
4.2.4 Subquestion 4.1.4 ...................................................................................................133
4.3 Questions from the June examination .............................................................................135
4.3.1 Subquestion 10.1.....................................................................................................137
4.3.2 Subquestion 10.2.....................................................................................................138
4.3.3 Subquestion 10.3 ....................................................................................................143
4.3.4 Subquestion 10.4.....................................................................................................146
4.3.5 Subquestion 10.5 ....................................................................................................151
4.3.6 Subquestion 11.1.....................................................................................................157
4.3.7 Subquestion 11.2 ....................................................................................................162
4.4 Questions from the Trial examination ............................................................................167
4.4.1 Subquestion 7.1.......................................................................................................168
4.4.2 Subquestion 7.2.......................................................................................................172
4.4.3 Subquestion 7.3.......................................................................................................177
4.4.4 Subquestion 7.4.......................................................................................................180
4.4.5 Subquestion 7.5.......................................................................................................182
4.4.6 Subquestion 7.6.......................................................................................................184
4.4.7 Subquestion 8.1.......................................................................................................187
4.4.8 Subquestion 8.2.......................................................................................................189
4.4.9 Subquestion 8.3.......................................................................................................190
ix
4.5 Conclusion.......................................................................................................................196
CHAPTER 5
DISCUSSIONS, RECOMMENDATIONS AND CONCLUSIONS ...............................198
5.1 Introduction .....................................................................................................................198
5.2 Discussion of the results .................................................................................................198
5.3 Challenges originating from sections of calculus ...........................................................200
5.3.1 Deriving a function ................................................................................................200
5.3.2 Finding a point of inflection ..................................................................................200
5.3.3 Determining the turning points...............................................................................202
5.3.4 Substituting in the wrong equations.......................................................................202
5.3.5 Calculating the equation of a tangent to the curve.................................................202
5.3.6 Interpreting the meaning of a derivative of a cubic and of a quadratic
function and sketching them...................................................................................203
5.3.7 Comprehending the language used in questions involving application
optimisation ............................................................................................................203
5.3.8 Procedure for calculating maximum area. ..............................................................204
5.4 Poor performance as a result of incompetence in other mathematics topics ...................205
5.4.1 Lack of knowledge and skills in algebra.................................................................205
5.4.1.1 Demonstrated the lack of factorisation skills..............................................205
5.4.1.2 Could not multiply terms containing surds and exponents ........................205
5.4.1.3 Exhibited lack of algebraic manipulation skills .........................................206
5.4.1.4 Incorrect reasoning......................................................................................206
5.4.2 Incompetence in functions ......................................................................................207
5.4.2.1 Failing to sketch the graphs ........................................................................207
5.4.2.2 Lack of knowledge to calculate their x-intercepts.......................................207
5.4.2.3 Using wrong notation in coordinates .........................................................208
5.4.2.4 Swapping x- and y-coordinates when sketching graphs of a given
function.......................................................................................................208
5.4.2.5 Failing to read from the graph the values of k for which
0114 23 kxxx will have only one real root....................................208
5.4.2.6 Failure to read from the graph to determine the value(s) of t for which
g(x)=t will have only one real root .............................................................209
5.4.2.7 Lack of knowledge that the constant term of a function is a
y-intercept. .................................................................................................210
5.4.3 Incompetent in mensuration...................................................................................210
5.4.3.1 Formula for calculating the area of a rectangle .........................................210
5.4.3.2 Difference between area and volume ........................................................211
5.4.4 Incompetence in inequalities..................................................................................212
5.4.4.1 Distinguish between < and > .....................................................................212
5.4.4.2 State the value(s) of x that satisfy the given inequality .............................213
5.5 Poor performance resulting from errors ..........................................................................213
x
5.5.1 Careless mistakes or slips ......................................................................................213
5.5.2 Application error ...................................................................................................214
5.5.3. Procedural error ...................................................................................................214
5.5.4. Conceptual error ..................................................................................................214
5.6 Conclusion........................................................................................................................215
5.7 Limitations of the study ...................................................................................................218
5.8 Recommendations for future researchers ........................................................................218
5.9 Recommendations. ..........................................................................................................219
5.9.1 Challenges originating from sections of calculus....................................................219
5.9.2 Challenges caused by incompetence in other mathematical topics ........................222
5.9.3 Assessment of other mathematical strands..............................................................223
REFERENCES ..................................................................................................................... 224
APPENDICES......................................................................................................................234
Appendix A: Questions used in the May test...................................................….................234
Appendix B: Questions used in the June examination...................................................…...237
Appendix C: Questions used in the Trial examination………………………….………….240
Appendix D: Letter requesting permission from the Head of Department....................…...243
Appendix E: Letter requesting permission from the District Director…..............................247
Appendix F: Letter requesting permission from the Circuit Manager....…………….....….251
Appendix G: Letter requesting permission from the school principals………………...….256
Appendix H: Parent/guardian consent…………………………………………….….....…261
Appendix I: Learners’ assent..................................................................................…......... 263
Appendix J: Editing Certificate..............................................................................................265
Appendix K: Turnitin Report.................................................................................................266
xi
LIST OF TABLES
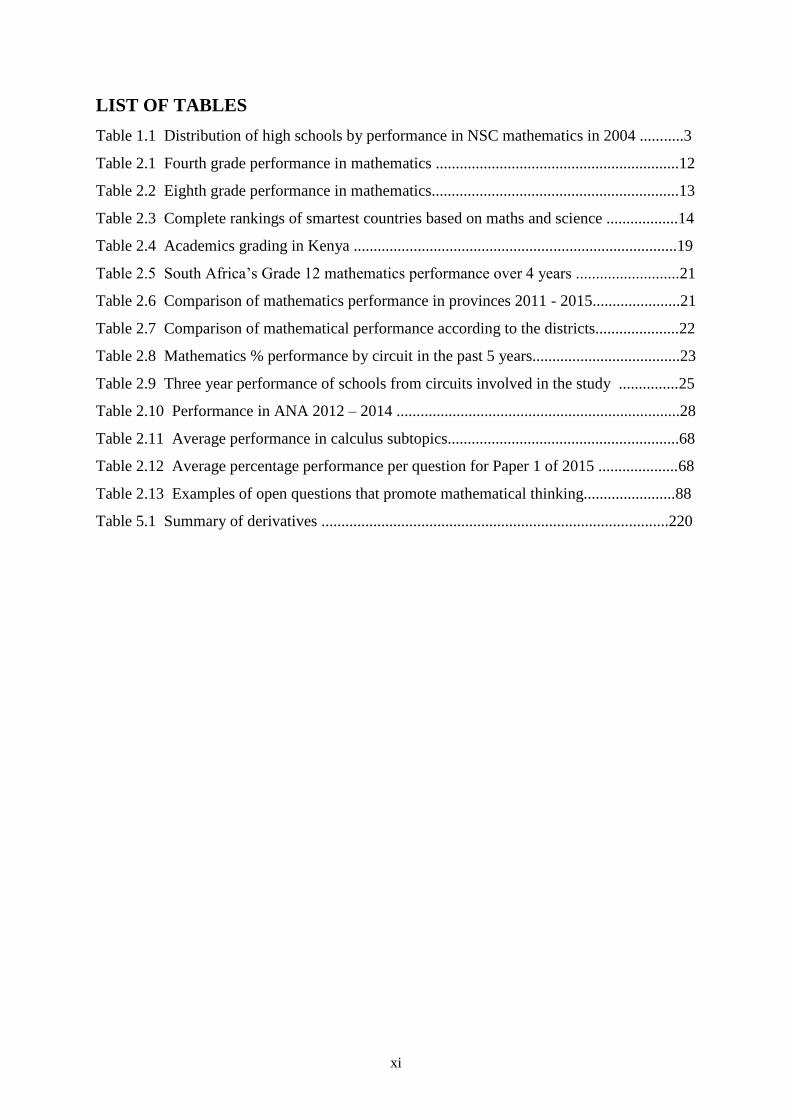
Table 1.1 Distribution of high schools by performance in NSC mathematics in 2004 ...........3
Table 2.1 Fourth grade performance in mathematics .............................................................12
Table 2.2 Eighth grade performance in mathematics..............................................................13
Table 2.3 Complete rankings of smartest countries based on maths and science ..................14
Table 2.4 Academics grading in Kenya .................................................................................19
Table 2.5 South Africa’s Grade 12 mathematics performance over 4 years ..........................21
Table 2.6 Comparison of mathematics performance in provinces 2011 - 2015......................21
Table 2.7 Comparison of mathematical performance according to the districts.....................22
Table 2.8 Mathematics % performance by circuit in the past 5 years.....................................23
Table 2.9 Three year performance of schools from circuits involved in the study ...............25
Table 2.10 Performance in ANA 2012 – 2014 .......................................................................28
Table 2.11 Average performance in calculus subtopics..........................................................68
Table 2.12 Average percentage performance per question for Paper 1 of 2015 ....................68
Table 2.13 Examples of open questions that promote mathematical thinking.......................88
Table 5.1 Summary of derivatives .......................................................................................220
xii
LIST OF FIGURES
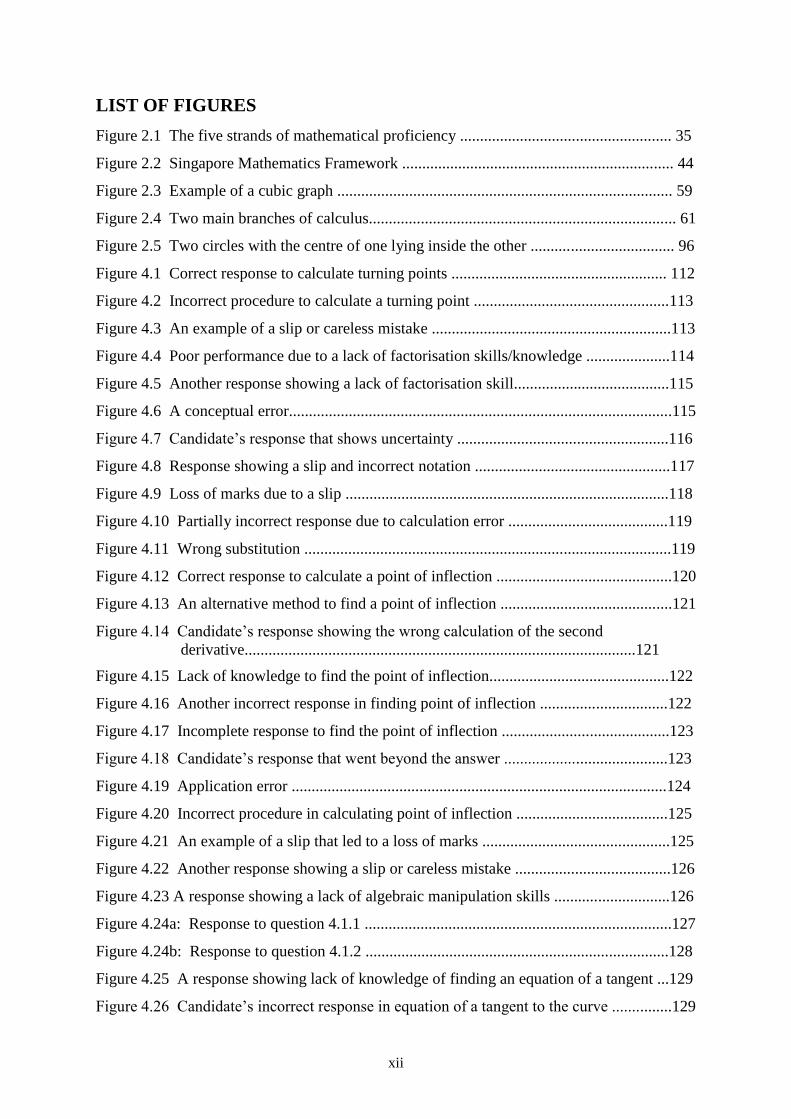
Figure 2.1 The five strands of mathematical proficiency ..................................................... 35
Figure 2.2 Singapore Mathematics Framework .................................................................... 44
Figure 2.3 Example of a cubic graph .................................................................................... 59
Figure 2.4 Two main branches of calculus............................................................................. 61
Figure 2.5 Two circles with the centre of one lying inside the other .................................... 96
Figure 4.1 Correct response to calculate turning points ...................................................... 112
Figure 4.2 Incorrect procedure to calculate a turning point .................................................113
Figure 4.3 An example of a slip or careless mistake ............................................................113
Figure 4.4 Poor performance due to a lack of factorisation skills/knowledge .....................114
Figure 4.5 Another response showing a lack of factorisation skill.......................................115
Figure 4.6 A conceptual error................................................................................................115
Figure 4.7 Candidate’s response that shows uncertainty .....................................................116
Figure 4.8 Response showing a slip and incorrect notation .................................................117
Figure 4.9 Loss of marks due to a slip .................................................................................118
Figure 4.10 Partially incorrect response due to calculation error ........................................119
Figure 4.11 Wrong substitution ............................................................................................119
Figure 4.12 Correct response to calculate a point of inflection ............................................120
Figure 4.13 An alternative method to find a point of inflection ...........................................121
Figure 4.14 Candidate’s response showing the wrong calculation of the second
derivative..................................................................................................121
Figure 4.15 Lack of knowledge to find the point of inflection.............................................122
Figure 4.16 Another incorrect response in finding point of inflection ................................122
Figure 4.17 Incomplete response to find the point of inflection ..........................................123
Figure 4.18 Candidate’s response that went beyond the answer .........................................123
Figure 4.19 Application error ..............................................................................................124
Figure 4.20 Incorrect procedure in calculating point of inflection ......................................125
Figure 4.21 An example of a slip that led to a loss of marks ...............................................125
Figure 4.22 Another response showing a slip or careless mistake .......................................126
Figure 4.23 A response showing a lack of algebraic manipulation skills .............................126
Figure 4.24a: Response to question 4.1.1 .............................................................................127
Figure 4.24b: Response to question 4.1.2 ............................................................................128
Figure 4.25 A response showing lack of knowledge of finding an equation of a tangent ...129
Figure 4.26 Candidate’s incorrect response in equation of a tangent to the curve ...............129
xiii
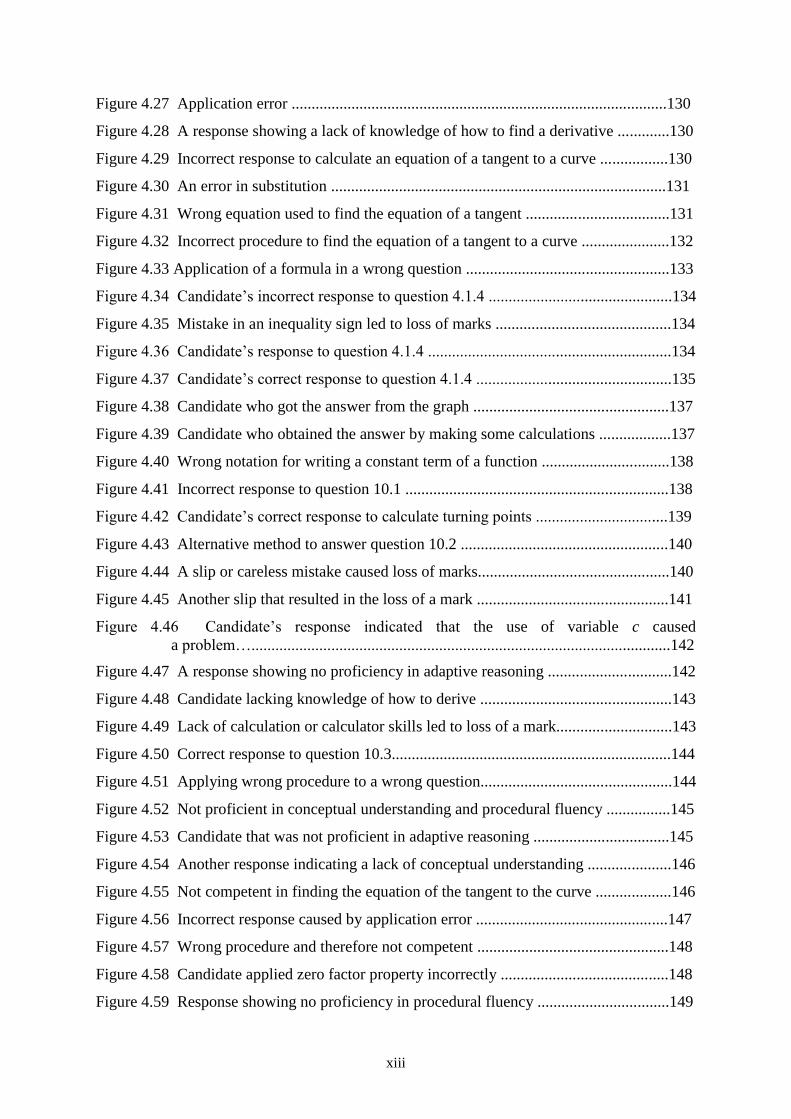
Figure 4.27 Application error ..............................................................................................130
Figure 4.28 A response showing a lack of knowledge of how to find a derivative .............130
Figure 4.29 Incorrect response to calculate an equation of a tangent to a curve .................130
Figure 4.30 An error in substitution ....................................................................................131
Figure 4.31 Wrong equation used to find the equation of a tangent ....................................131
Figure 4.32 Incorrect procedure to find the equation of a tangent to a curve ......................132
Figure 4.33 Application of a formula in a wrong question ...................................................133
Figure 4.34 Candidate’s incorrect response to question 4.1.4 ..............................................134
Figure 4.35 Mistake in an inequality sign led to loss of marks ............................................134
Figure 4.36 Candidate’s response to question 4.1.4 .............................................................134
Figure 4.37 Candidate’s correct response to question 4.1.4 .................................................135
Figure 4.38 Candidate who got the answer from the graph .................................................137
Figure 4.39 Candidate who obtained the answer by making some calculations ..................137
Figure 4.40 Wrong notation for writing a constant term of a function ................................138
Figure 4.41 Incorrect response to question 10.1 ..................................................................138
Figure 4.42 Candidate’s correct response to calculate turning points .................................139
Figure 4.43 Alternative method to answer question 10.2 ....................................................140
Figure 4.44 A slip or careless mistake caused loss of marks................................................140
Figure 4.45 Another slip that resulted in the loss of a mark ................................................141
Figure 4.46 Candidate’s response indicated that the use of variable c caused
a problem….........................................................................................................142
Figure 4.47 A response showing no proficiency in adaptive reasoning ...............................142
Figure 4.48 Candidate lacking knowledge of how to derive ................................................143
Figure 4.49 Lack of calculation or calculator skills led to loss of a mark.............................143
Figure 4.50 Correct response to question 10.3......................................................................144
Figure 4.51 Applying wrong procedure to a wrong question................................................144
Figure 4.52 Not proficient in conceptual understanding and procedural fluency ................145
Figure 4.53 Candidate that was not proficient in adaptive reasoning ..................................145
Figure 4.54 Another response indicating a lack of conceptual understanding .....................146
Figure 4.55 Not competent in finding the equation of the tangent to the curve ...................146
Figure 4.56 Incorrect response caused by application error ................................................147
Figure 4.57 Wrong procedure and therefore not competent ................................................148
Figure 4.58 Candidate applied zero factor property incorrectly ..........................................148
Figure 4.59 Response showing no proficiency in procedural fluency .................................149
xiv
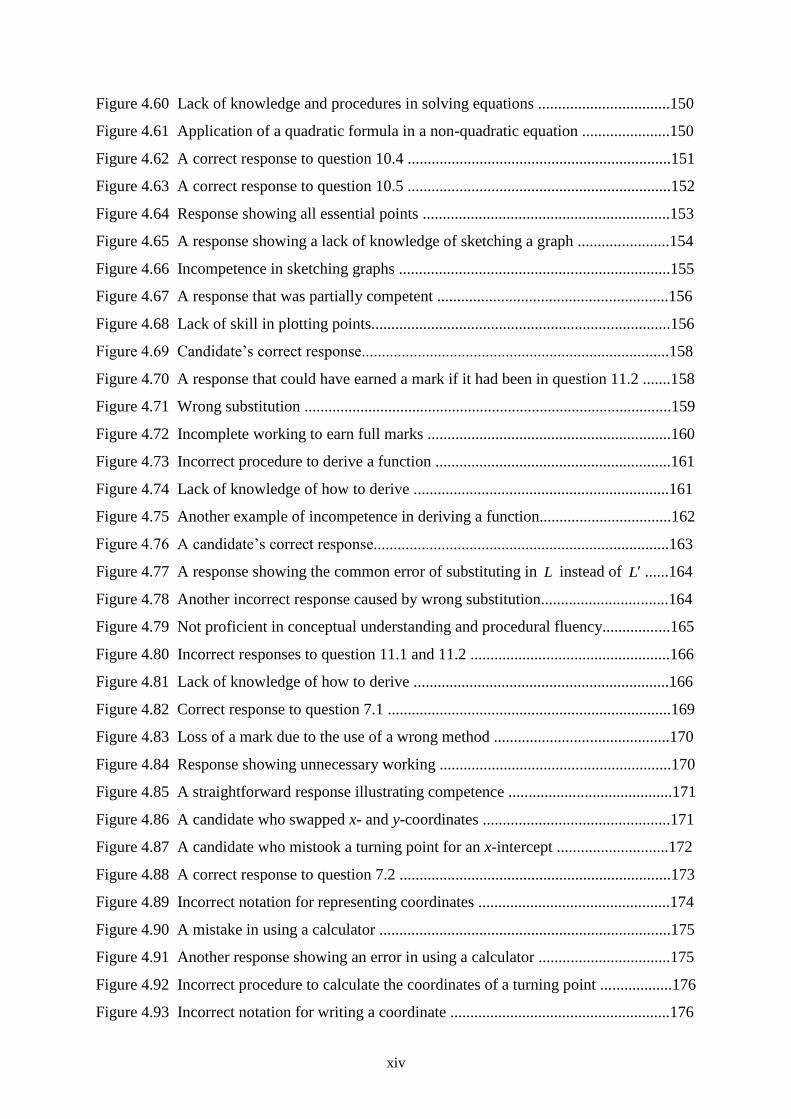
Figure 4.60 Lack of knowledge and procedures in solving equations .................................150
Figure 4.61 Application of a quadratic formula in a non-quadratic equation ......................150
Figure 4.62 A correct response to question 10.4 ..................................................................151
Figure 4.63 A correct response to question 10.5 ..................................................................152
Figure 4.64 Response showing all essential points ..............................................................153
Figure 4.65 A response showing a lack of knowledge of sketching a graph .......................154
Figure 4.66 Incompetence in sketching graphs ....................................................................155
Figure 4.67 A response that was partially competent ..........................................................156
Figure 4.68 Lack of skill in plotting points...........................................................................156
Figure 4.69 Candidate’s correct response.............................................................................158
Figure 4.70 A response that could have earned a mark if it had been in question 11.2 .......158
Figure 4.71 Wrong substitution ............................................................................................159
Figure 4.72 Incomplete working to earn full marks .............................................................160
Figure 4.73 Incorrect procedure to derive a function ...........................................................161
Figure 4.74 Lack of knowledge of how to derive ................................................................161
Figure 4.75 Another example of incompetence in deriving a function.................................162
Figure 4.76 A candidate’s correct response..........................................................................163
Figure 4.77 A response showing the common error of substituting in L instead of L ......164
Figure 4.78 Another incorrect response caused by wrong substitution................................164
Figure 4.79 Not proficient in conceptual understanding and procedural fluency.................165
Figure 4.80 Incorrect responses to question 11.1 and 11.2 ..................................................166
Figure 4.81 Lack of knowledge of how to derive ................................................................166
Figure 4.82 Correct response to question 7.1 .......................................................................169
Figure 4.83 Loss of a mark due to the use of a wrong method ............................................170
Figure 4.84 Response showing unnecessary working ..........................................................170
Figure 4.85 A straightforward response illustrating competence .........................................171
Figure 4.86 A candidate who swapped x- and y-coordinates ...............................................171
Figure 4.87 A candidate who mistook a turning point for an x-intercept ............................172
Figure 4.88 A correct response to question 7.2 ....................................................................173
Figure 4.89 Incorrect notation for representing coordinates ................................................174
Figure 4.90 A mistake in using a calculator .........................................................................175
Figure 4.91 Another response showing an error in using a calculator .................................175
Figure 4.92 Incorrect procedure to calculate the coordinates of a turning point ..................176
Figure 4.93 Incorrect notation for writing a coordinate .......................................................176
xv
Figure 4.94 A slip in the writing of a sign resulted in the loss of marks .............................177
Figure 4.95 Correct response to question 7.3 .......................................................................177
Figure 4.96 Correct response written without much calculation ..........................................178
Figure 4.97 Omitting or skipping some information caused loss of marks .........................178
Figure 4.98 Incorrect response resulting from not reading all the supplied information .....179
Figure 4.99 A response showing that the candidate overlooked given information ............180
Figure 4.100 An extract showing a correct response to question 7.4 ...................................181
Figure 4.101 An alternative method for finding the x-coordinate of the
point of inflection .........................................................................................181
Figure 4.102 A slip or careless mistake contributed to the loss of marks ............................182
Figure 4.103 Correct response to question 7.5 .....................................................................183
Figure 4.104 A response with the correct values of t but incorrect inequality signs ...........183
Figure 4.105 A response with only one correct solution ......................................................183
Figure 4.106 A candidate used variable x instead of t ..........................................................184
Figure 4.107 Correct response to question 7.6 .....................................................................184
Figure 4.108 Candidate’s lack of knowledge of inequality signs ........................................185
Figure 4.109 A response with one correct solution and the other one incomplete ..............185
Figure 4.110 A setup that could have given correct solution if f(x) had been correct .........186
Figure 4.111 An accepted proof that was awarded full marks .............................................188
Figure 4.112 A mark for showing that angle B=60° ............................................................188
Figure 4.113 An extract showing that not any angle of 60° earned a mark .........................188
Figure 4.114 A correct response to question 8.2 ..................................................................189
Figure 4.115 A candidate who did not know the formula for the area of a rectangle ..........190
Figure 4.116 Lack of knowledge of the formula for the area of a rectangle ........................190
Figure 4.117 A correct response to question 8.3 ..................................................................191
Figure 4.118 Lack of multiplication skills evident in this extract ........................................192
Figure 4.119 Not proficient in the procedural fluency strand...............................................193
Figure 4.120 Not competent in procedures for calculating the maximum and minimum
quantities in calculus......................................................................................193
Figure 4.121 Incomplete response to question 8.3................................................................194
Figure 4.122 A diagram for question 8.................................................................................194
Figure 4.123 A candidate who could not multiply surds and powers...................................195
Figure 4.124 Incompetent in multiplying and deriving terms with surds and exponents.....195
Figure 4.125 Lack of knowledge of calculating maximum value using calculus.................196
xvi
TERMINOLOGY
APOS Theory A theory begins with the hypothesis that mathematical proficiency
consists in an individual’s tendency to deal with perceived
mathematical problem situations by constructing mental actions,
processes and objects and organising them in schemas that make sense
of the situations and solve the problems
Constructivism A theory that says people construct their own understanding of the
world, through experiencing things and reflecting on those
experiences.
Differential calculus A branch of mathematics concerned with the determination, properties
and application of derivatives and differentials
Mathematical
proficiency
High skills or expertise in mathematics
Optimisation Getting a maximum or minimum value of a function
ACRONYMS
CAPS Curriculum Assessment Policy Statement
DBE Department of Basic Education
FET Further Education and Training
MSTA Mathematics, Science and Technology Academy
NCS National Curriculum Statement
NSC National Senior Certificate
SBA School Based Assessment
TIMSS Trends in International Mathematics and Science Study
1
CHAPTER 1
INTRODUCTION
1.1 BACKGROUND AND PURPOSE OF STUDY
This chapter gives an overview of this research project study. The background and purpose of
this study is mentioned here. The rationale or logical basis for doing this research, the
significance of this study, the purpose of the study and the dynamic context within which the
study take place are explained in this chapter. The research questions and details of the study
are discussed here. This is followed by summaries of upcoming chapters (thesis outline).
Mathematics is one of the core curriculum subjects taught in all schools in South Africa, from
Grade R to Grade 9. In Grade 10 learners may choose between Mathematics and
Mathematical Literacy. Generally, learning mathematics is not fun for the majority of
learners as they find it difficult to master. This is because the mathematics curriculum
contains specialised knowledge which requires analytical and logical thinking. As a result, a
large number of learners choose to take Mathematical Literacy instead of Mathematics.
There is a worldwide concern about learners’ poor performance in mathematics. In addition,
mathematics is generally considered as the most important school subject all over the world.
This may be due to the fact that it integrates with many subjects at school level, such as
physical science, technology, accounting and technical subjects.
International studies have shown that South Africa has the poorest performance when
compared to other middle-income countries and low-income African countries that
participated in cross-national assessments of educational achievement, especially in
mathematics (Centre for Development and Enterprise [CDE], 2013). The performance of
learners in mathematics is poor when compared to other subjects. Almost every year when
the Grade 12 results are announced, the overall performance in mathematics is the lowest in
relation to other subjects.
The academic performance of Grade 12 learners in South Africa has become a yardstick for
measuring our education system. At the same time these academic performances are used as a
2
standard to determine which learners qualify to further their studies at tertiary institutions.
The major problem is that most tertiary institutions require a good mark in mathematics as an
entry requirement for a career in engineering, medicine, accounting, technology and other
fields that involve science.
Mathematics is a channel to various fields of study. In order to have many opportunities or
choices of fields of study, learners have to do mathematics while at school. Without
mathematics career options will be limited. For a career in science, learners have to pass
mathematics in Grade 12 and achieve at least at level 5. Therefore there is a need to improve
learners’ performance in mathematics so that the number of learners who will pursue careers
that regard mathematics as a prerequisite may be increased. Despite its importance, it is said
that mathematics was used to deprive other races of the chance to pursue careers in fields that
require mathematics. Feza (2013) says mathematics education is one of the subjects used
during apartheid in South Africa to exclude blacks from careers in science, technology and
engineering.
In South Africa, every year when the matric (Grade 12) results are announced, they usually
show that learners performed poorly in mathematics when compared to other subjects.
Former Model C (white) schools also appear to obtain good results when compared to many
black schools. These former white schools obtain good results in all subjects, including
mathematics. However, there are fewer former Model C schools as compared to black
schools. This means very few learners succeed in getting good results in mathematics because
the total number of learners produced by these former white schools is smaller than the
number of learners from black schools.
The differences in terms of performance is said to be caused by many factors such as
resources and others which are related to socio-economic conditions. It remains a fact that the
former white schools were better resourced than other schools during the apartheid era.
However, the impact of resources on learners’ performance does not depend on their
availability at a school, but on how they are used to enhance teaching and learning. For
example, the Mpumalanga Department of Education has provided its high schools with
DVDs to help learners during revision. It is surprising that in some schools these DVDs are
safely stored in the principal’s office or kept by the head of department (subject head).
3
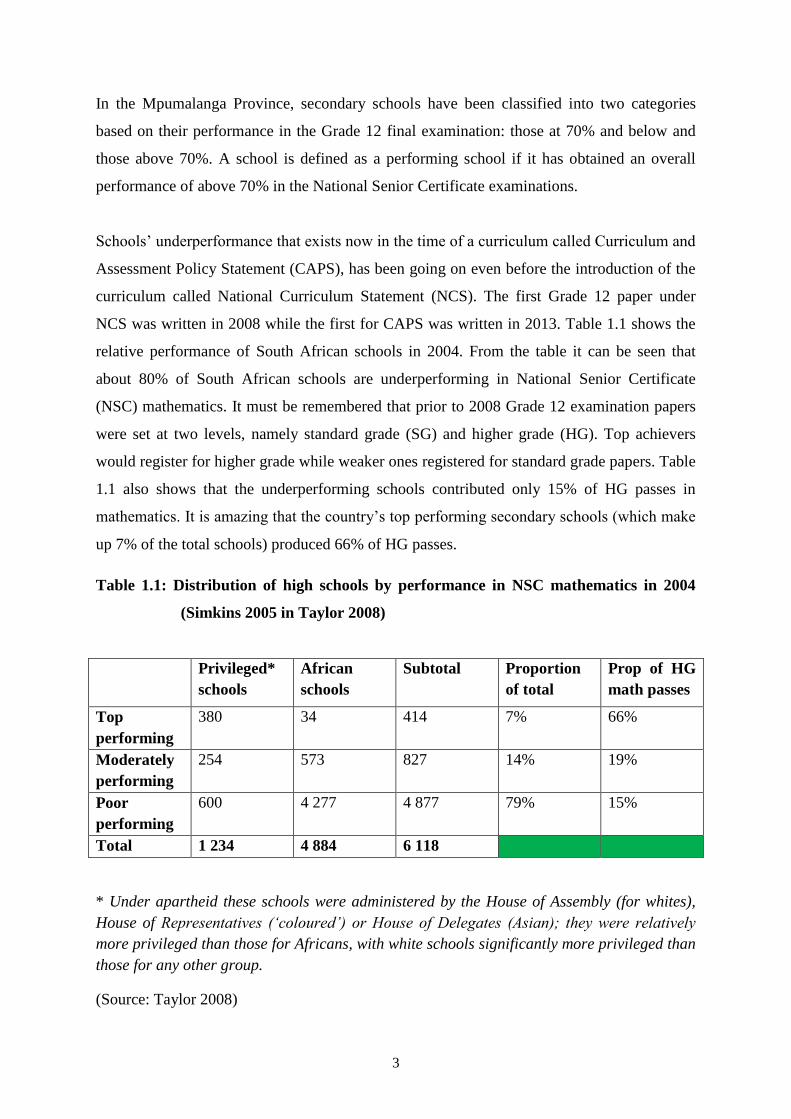
In the Mpumalanga Province, secondary schools have been classified into two categories
based on their performance in the Grade 12 final examination: those at 70% and below and
those above 70%. A school is defined as a performing school if it has obtained an overall
performance of above 70% in the National Senior Certificate examinations.
Schools’ underperformance that exists now in the time of a curriculum called Curriculum and
Assessment Policy Statement (CAPS), has been going on even before the introduction of the
curriculum called National Curriculum Statement (NCS). The first Grade 12 paper under
NCS was written in 2008 while the first for CAPS was written in 2013. Table 1.1 shows the
relative performance of South African schools in 2004. From the table it can be seen that
about 80% of South African schools are underperforming in National Senior Certificate
(NSC) mathematics. It must be remembered that prior to 2008 Grade 12 examination papers
were set at two levels, namely standard grade (SG) and higher grade (HG). Top achievers
would register for higher grade while weaker ones registered for standard grade papers. Table
1.1 also shows that the underperforming schools contributed only 15% of HG passes in
mathematics. It is amazing that the country’s top performing secondary schools (which make
up 7% of the total schools) produced 66% of HG passes.
Table 1.1: Distribution of high schools by performance in NSC mathematics in 2004
(Simkins 2005 in Taylor 2008)
Privileged*
schools
African
schools
Subtotal Proportion
of total
Prop of HG
math passes
Top
performing
380 34 414 7% 66%
Moderately
performing
254 573 827 14% 19%
Poor
performing
600 4 277 4 877 79% 15%
Total 1 234 4 884 6 118
* Under apartheid these schools were administered by the House of Assembly (for whites),
House of Representatives (‘coloured’) or House of Delegates (Asian); they were relatively
more privileged than those for Africans, with white schools significantly more privileged than
those for any other group.
(Source: Taylor 2008)
4
When the setting of two different papers (SG and HG) was abolished, Mathematical Literacy
was introduced to Grade 10 learners in 2006. The low achieving students in Mathematics
were channelled to take this subject. In South Africa, it is compulsory that a learner take
either Mathematics or Mathematical Literacy as required by the National Senior Certificate,
meaning that a learner has to make a choice between the two. At first, the performance in
Mathematical Literacy was promising. However, recently the pass rate has dropped. More
learners are registering for Mathematical Literacy as compared to Mathematics.
Unfortunately, not all universities recognised Mathematical Literacy as an entry requirement.
Even those that do recognise it, require a good pass. For example, where the pass level
required for Mathematics is level 4, they will require a pass level of 5 or more for
Mathematical Literacy. It remains to be seen whether South Africa will continue with the
present situation or go back to the previous situation of having two papers of different
cognitive levels, a standard and a higher grade paper.
The poor learner performance in mathematics is a worldwide concern. Many Departments
and Ministries of Education globally have put more effort and funds in the improvement of
learners’ performance in the subject. South Africa is not an exception. The Department of
Basic Education has been trying hard to come out with strategies that will assist in improving
the performance of learners in mathematics. One strategy, for example, was the Dinaledi
Schools Project. (Dinaledi is a Sotho word for ‘stars’). This is an initiative that provided
focused support to learners and teachers of mathematics and science at selected high schools.
This project focused on four areas: learners, teachers, development of the learning
environment, and teacher education and development. The Dinaledi Schools Project did not
yield good results and as a result the Department of Basic Education has introduced another
initiative in which a certain school may become a Mathematics, Science and Technology
Academy (MSTA). These MSTA schools have been given resources aimed at improving
their results in these three subjects.
It is still early to make any judgement about the success or failure of the MSTA strategy. The
Department of Education has tried hard to improve the results in mathematics and science,
but all the effort done has not yielded the expected results. According to the South African
Non-Government Organisation Network (SANGONET) many interventions have been done
which are aimed at improving mathematics performance in underperforming schools.
5
However, the schools continue to perform poorly as revealed by the matric results every year
(SANGONET 2011).
Hoffmeester (2015) quotes the vice-principal of Research and Innovation and professor of
Mathematics at the University of South Africa, Mamokgethi Phakeng, saying there is a
concern in South Africa about the state of mathematics education. The poor performance by
learners in mathematics has negative consequences for the development of the country. She
made uttered these remarks at the launching of Tshwane-Gauteng Region Maths and Science
Teacher Strategy on 31 January 2015. She said unless South Africa increases the quality and
quantity of learners who can be the country’s future engineers, scientists and technical
specialists, South Africa’s vision for a sustainable democracy will not be realised or
achieved. In her address she mentioned that although South Africa has one of the best school
mathematics curriculums in the world, the major challenge faced by the country is the ability
to implement it. We cannot find proper solutions unless we know the causes of poor
performance in mathematics (Naidu-Hoffmeester 2015).
The performance of learners in mathematics varies from topic to topic. There are topics in
which learners continue to perform poorly and at the same time there are topics where they
perform well. Generally, the overall performance in mathematics is poor. The mathematics
curriculum for Further Education and Training (FET) in South Africa consists of ten main
topics, namely algebra; number patterns, sequence and series; functions; finance, growth and
decay; differential calculus; statistics; probability; trigonometry; Euclidean geometry and
measurement, and finally analytical geometry (Department of Basic Education 2011).
One of the mathematics topics in which learners continue to perform poorly is calculus. In
South Africa calculus is introduced in Grade 12. Only differential calculus is taught in this
grade. The other subtopic, integral calculus, is introduced at tertiary level. The overall
calculus content taught in Grade 12 includes an intuitive understanding of the concept of a
limit, differentiation of specified functions from first principles, use of the specified rules of
differentiation, the equations of tangents to graphs, the ability to sketch graphs of cubic
functions, practical problems involving optimisation and rates of change including the
calculus of motion (Department of Basic Education 2011).
6
Calculus is important to many students at tertiary level because of its widespread use in
science, engineering, economics, business, medicine, industry and many other fields to
understand and apply the concept of change and motion. It is well known that despite the
importance of calculus many learners fail to master it. These learners find that calculus is
very hard and abstract. They do not see its use in real-life situations. They find themselves in
a situation where they are compelled to learn it to pass the examination. In order to pass the
examination, students need to memorise formulae and procedures that have been taught in the
classroom. The task or problems presented during lessons do not have any meaning for them.
The section on sketching the graphs of cubic functions and practical problems involving
optimisation and rates of change, including the calculus of motion, seem to present the South
African Grade 12 learners with the greatest challenges. Each year, when the Mpumalanga
Department of Education makes the Grade 12 results analysis in Mathematics per topic, it is
found that the poorest performance always occurs in cubic graphs and the application of
differential calculus. This research will attempt to determine the causes of this poor
performance and ways how learners can be assisted to improve their performance.
According to the reports made by the Mpumalanga moderators on the 2011 NSC Grade 12
examination in Mathematics, candidates performed very poorly in cubic graphs and the
application of calculus (Mpumalanga Department of Education, 2012). The average
performance of sampled scripts was 11,4% in cubic graphs and 7,6% in the application of
calculus. The poor performance in these two topics occurred again in the 2012 final
examination. The average learner performance in cubic graphs was 24, 96% and 13, 65% in
the application of calculus (Mpumalanga Department of Education, 2013).
1.2 RATIONALE OF THE STUDY
The purpose of the study was to investigate the causes of the poor performance by Grade 12
learners in mathematics topics, namely cubic graphs and the application of differential
calculus, in the Gert Sibande District, Mpumalanga. The poor performance by learners in
Mathematics has made it necessary to investigate the factors that contribute to poor
achievement in Mathematics. The study attempted to reveal reasons for the poor performance
and then looked at possible interventions that would alleviate the situation. This will be done
when an attempt is made to answer the research questions listed in section 1.3.
7
An improvement in mathematics results can be achieved if the factors that cause poor
performance in certain topics can be identified and proper intervention strategies
implemented. Improving mathematics results may mean that more learners will qualify for
entering university programmes that require a mathematics background. Therefore there is a
need to investigate the causes of the poor performance in calculus-based tasks in order to
propose programmes or strategies that may assist in reducing the failure rate in calculus,
especially in cubic graphs and the application of differential calculus. Improvements that can
be made in each topic of mathematics may result in an improved learner performance.
It is hoped that that the information gathered in this study will be able to identify the major
causes of the poor performance in cubic graphs and the application of differential calculus.
Once these are identified, possible strategies to alleviate the challenges will be recommended
that will assist both teachers and learners in improving the teaching and learning of the two
sections of calculus.
1.3 RESEARCH QUESTIONS
In order to explore the causes of poor performance by Grade 12 learners in calculus-based
tasks, the following research questions were developed:
What are the causes of the poor performance in calculus (cubic graphs and the
application of differential calculus)?
What common errors are made by learners when trying to work out these sections of
calculus?
1.4 DETAILS OF THE STUDY
In this study the researcher was interested in determining the possible factors that cause poor
performance in calculus-based tasks, especially in the sections that involve cubic graphs and
the application of differential calculus. In recent years it has been found that learners
achieved low marks in these two subsections of calculus. In other words, this study was
necessitated by the continual poor performance in cubic graphs and the application of
optimisation.
8
At present, the Department of Basic Education is attempting to improve learners’
performance in mathematics throughout the country. The significance of this study will be its
contribution in improving learners’ performance in cubic graphs and the application of
differential calculus, both of which are subtopics of calculus. Learners, teachers and the
Department of Education will benefit from this research since the research aims at
determining the causes of the poor performance in these sections of calculus, and at the same
time at assisting in developing ways that can be used by teachers to improve their teaching
methods. If teachers can know exactly what it is that learners are not doing right or what the
learners’ common errors and misconceptions are when answering questions on calculus, they
will be in a better position to develop relevant interventions that may be used to rectify the
situation and thus improve the performance in mathematics.
The study was conducted in three schools from three different categories of schools. The
three categories were former model C school, a Mathematics, Science and Technology
Academy (MSTA), and one other school not belonging to either of these two categories. It
was conducted in the three schools of Msukaligwa 1 Circuit, in the Gert Sibande District in
the Mpumalanga Province. Msukaligwa 1 was chosen in order to retrieve data from different
categories of schools.. In this Circuit there are former model C schools, MSTA and schools
that do not belong to either category. This allowed the researcher to obtain data from learners
from different backgrounds and settings. In fact, Msukaligwa 1 is the only circuit of the
Ermelo sub-district that can provide two schools in each of the three categories mentioned.
Three schools were eventually involved in the study.
Learners’ scripts for formal tasks that involved questions on calculus, especially cubic graphs
and the application of calculus, were used to analyse learners’ responses. The formal tasks
used were the Grade 12 May test, the June (midyear) examination and the Trial (Preparatory)
examinations.
1.5 THESIS OUTLINE
This outline shows how the research report is divided or arranged and what the content of
each chapter is.
9
Chapter 1: Introduction and background
This chapter consists of the overview of the study. It indicates the background, purpose and
significance of the study. In other words, it is a clear explanation of what the study was about,
why it had to be undertaken and who would benefit from it. The researcher introduces the
problem, states the rationale of the study, gives the details of the study and states the research
question.
Chapter 2: Literature review
In this chapter the conceptual framework guiding the study and a review of some related
literature are presented. It covers all the sources that have a link to the problem being
investigated. In other words, the connection between existing knowledge and the research
problem being investigated is covered.
Chapter 3: Research design and data collection
Chapter 3 describes the procedures for conducting the study. The researcher indicates how
the research was set up, what happened to the subjects/participants, and what methods of data
collection were used. In short, the research design explains in full the procedures of
conducting the study, including when, from whom and under what conditions the data was
collected.
The chapter focuses on the methods used in the study including the research design, sample
selection method, data collection and procedures, data analysis methods and ethical issues of
the study.
Chapter 4: Discussion of results and data analysis
The chapter indicates how the collected data was organised and analysed. The chapter also
explains how the data is presented in the report. The discussion includes an evaluation and
interpretation of the findings.
Chapter 5: Conclusions, recommendations and limitations of the study
10
Conclusions about the findings of the study and possible recommendations are made in this
chapter. Ways and strategies of improving the study are listed in this section.
Recommendations made will have to be realistic, achievable and as specific as possible, and
will have to assist future researchers on the topic to effect improvement.
Possible factors that may be a hindrance in achieving the desired outcomes of the study are
included in this chapter. The challenges or limitations may be a result of factors such as time,
response from participants or the wrong method of sampling the population to be studied.
1.6 CONCLUSION
In this chapter the orientation of the study is established. The study is put into context. The
problem issue on which the study is based, the objective of the study and the significance of
the study are discussed here. It is hoped that once the study is completed it will give results
that will bring about an improvement in the teaching and learning of mathematics, in
particular the sections of calculus covered in this study.
The next chapter deals with the literature that was reviewed for this study. Chapter 2 gives in
detail the complete picture of previous studies conducted by other researchers on work
relevant to this study.
11
CHAPTER 2
LITERATURE REVIEW AND THEORETICAL FRAMEWORK
2.1 INTRODUCTION
In this chapter the literature relevant to the study is reviewed, namely on performance in
mathematics. Other topics discussed in this chapter are mathematical proficiency,
constructivism, APOS theory, Singapore Mathematics and factors causing challenges in
mathematics, in particular calculus.
2.2 LITERATURE REVIEW
Mathematics is a prerequisite for learners who wish to pursue a career in fields such as
engineering, medicine and accounting. Despite its being an important subject, learners
continue to perform below expectations in mathematics (Tachie & Chireshe 2013). Very few
learners achieve good marks in mathematics. This means that only a small number of learners
meet the university entrance requirements to pursue their studies in fields that require good
marks in mathematics.
2.2.1. Mathematics curriculum and performance in other countries
Many countries have made great progress in the teaching and learning of mathematics, while
others are still performing poorly. Countries like Singapore, Japan and the Netherlands are
doing well in mathematics; it is therefore necessary for this study to look at curriculum
transformations made and good practices introduced by these performing countries.
East Asian countries continue to lead the world regarding achievement in mathematics.
Singapore, South Korea, Hong Kong, Taiwan and Japan were the top five performers in
Trends in International Mathematics and Science Study (TIMSS) 2011 in the fourth grade.
The eighth grade top five performers in descending order were South Korea, Singapore,
Taiwan, Hong Kong and Japan (TIMSS 2011).
12
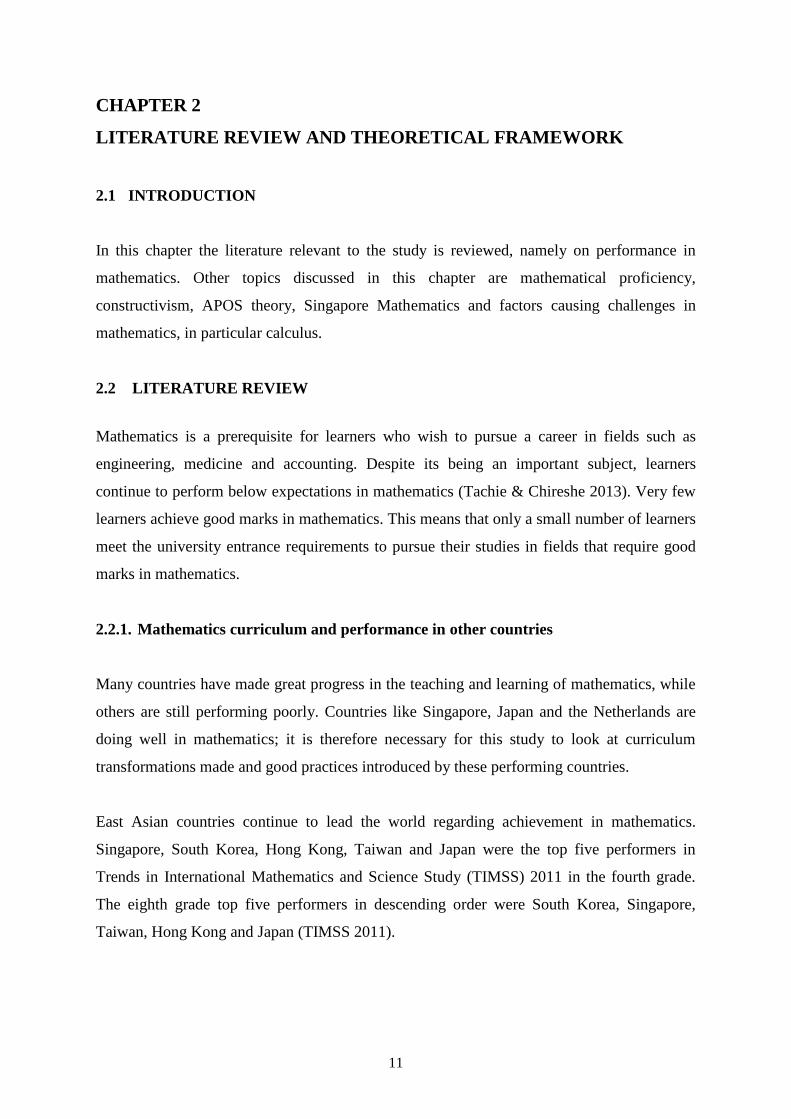
Table 2.1 shows the distribution of student achievement for participants in the TIMSS 1995–
2011 fourth grade assessment, including the average scale score. Fifty-two (52) countries
took part in the TIMSS 2011 assessment in the fourth grade and forty-five (45) in the eighth
grade. None of the African countries managed a position in the top ten in either of the two
grades. From Table 2.1, it can be seen that the fourth-grade learners performed well with
more than six countries having average achievement above the High International Benchmark
of 550.
Table 2.1 Fourth-grade performance in mathematics
TIMSS 1995 TIMSS 2003 TIMSS 2007 TIMSS 2011
Singapore 625 Singapore 594 Hong Kong 607 Singapore 606
South Korea 611 Hong Kong 575 Singapore 599 South Korea 605
Japan 597 Japan 565 Taiwan 576 Hong Kong 602
Hong Kong 587 Taiwan 564 Japan 568 Taiwan 591
Netherlands 577 Belgium 551 Kazakhstan 549 Japan 585
Czech Rep. 567 Netherlands 540 Russia 544 N. Ireland 562
Austria 559 Latvia 536 England 541 Belgium 549
Slovenia 552 Lithuania 534 Latvia 537 Finland 545
Ireland 550 Russia 532 Netherlands 535 England 542
Hungary 548 England 531 Lithuania 530 Russia 542
(Source: TIMSS 2011)
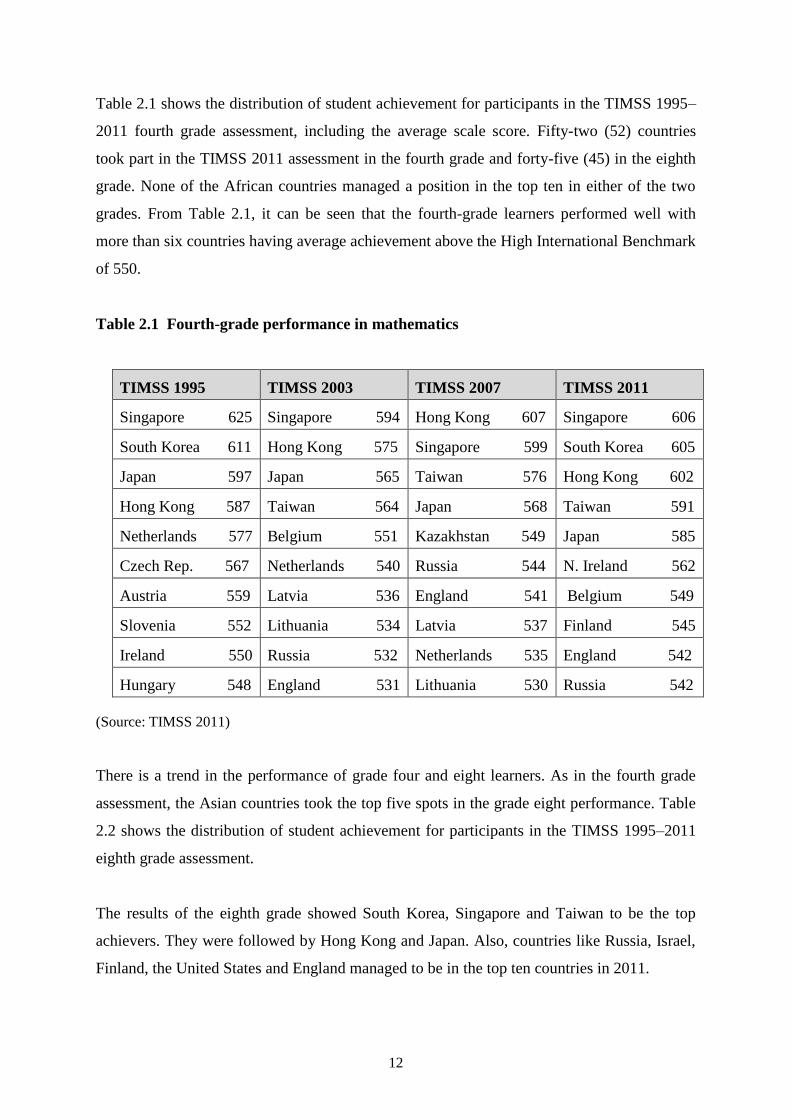
There is a trend in the performance of grade four and eight learners. As in the fourth grade
assessment, the Asian countries took the top five spots in the grade eight performance. Table
2.2 shows the distribution of student achievement for participants in the TIMSS 1995–2011
eighth grade assessment.
The results of the eighth grade showed South Korea, Singapore and Taiwan to be the top
achievers. They were followed by Hong Kong and Japan. Also, countries like Russia, Israel,
Finland, the United States and England managed to be in the top ten countries in 2011.
13
It can be seen from Table 2.2 that the top five spots were occupied by the Asian countries
from the TIMSS 1995–2011. South Korea, Singapore, Taiwan, Hong Kong and Japan had
the highest average achievement in eighth grade mathematics. None of these top five
countries obtained an average score below 570 in the TIMMS 1995–2011.
Table 2.2 Eighth grade performance in mathematics
(Source: TIMSS 2011)
From the last TIMSS results, the TIMSS 2011, it can be seen that Singapore, South Korea,
Taiwan, Hong Kong and Japan are the five countries with the highest average mathematics
achievement at fourth and eighth grade, with an average achievement above the High
International Benchmark of 550 in each case. This means learners from these Asian countries
excelled in mathematics in the two grades, when compared to the other countries in the
world. It can be also seen from Table 2.1 and Table 2.2 that no African country occupied the
top ten positions in terms of learners’ performance in mathematics. This means African
countries are performing poorly in mathematics.
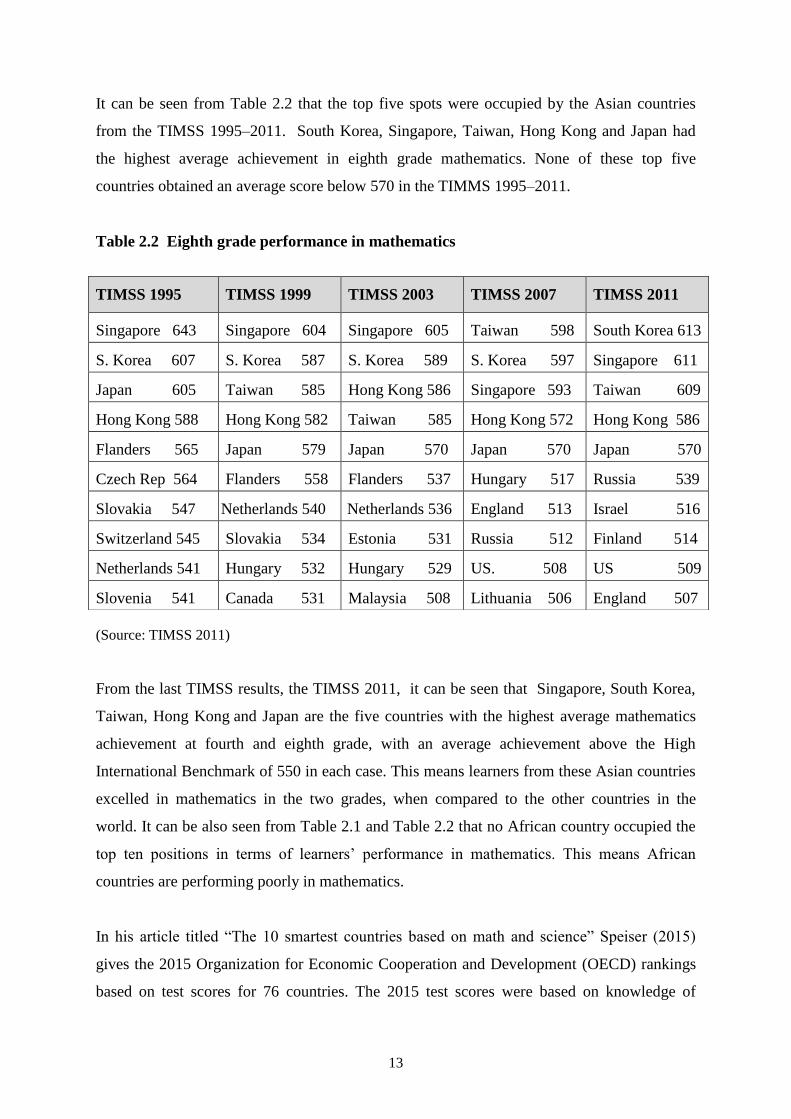
In his article titled “The 10 smartest countries based on math and science” Speiser (2015)
gives the 2015 Organization for Economic Cooperation and Development (OECD) rankings
based on test scores for 76 countries. The 2015 test scores were based on knowledge of
TIMSS 1995 TIMSS 1999 TIMSS 2003 TIMSS 2007 TIMSS 2011
Singapore 643 Singapore 604 Singapore 605 Taiwan 598 South Korea 613
S. Korea 607 S. Korea 587 S. Korea 589 S. Korea 597 Singapore 611
Japan 605 Taiwan 585 Hong Kong 586 Singapore 593 Taiwan 609
Hong Kong 588 Hong Kong 582 Taiwan 585 Hong Kong 572 Hong Kong 586
Flanders 565 Japan 579 Japan 570 Japan 570 Japan 570
Czech Rep 564 Flanders 558 Flanders 537 Hungary 517 Russia 539
Slovakia 547 Netherlands 540 Netherlands 536 England 513 Israel 516
Switzerland 545 Slovakia 534 Estonia 531 Russia 512 Finland 514
Netherlands 541 Hungary 532 Hungary 529 US. 508 US 509
Slovenia 541 Canada 531 Malaysia 508 Lithuania 506 England 507
14
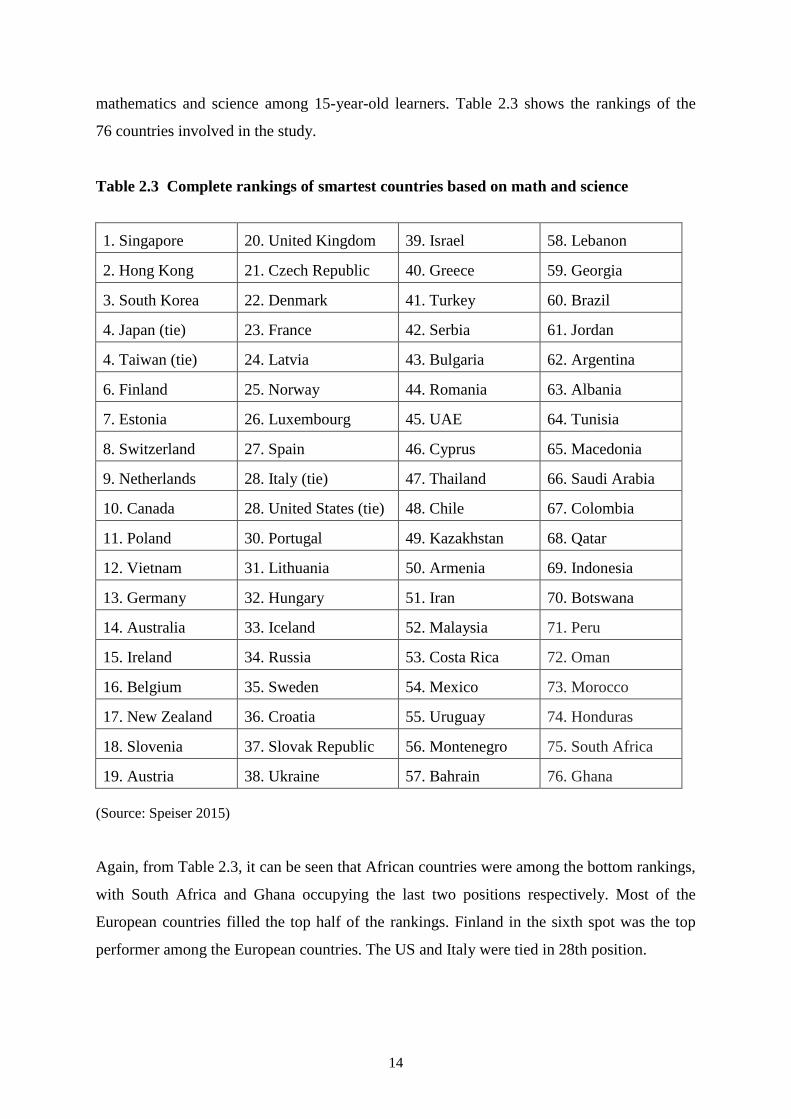
mathematics and science among 15-year-old learners. Table 2.3 shows the rankings of the
76 countries involved in the study.
Table 2.3 Complete rankings of smartest countries based on math and science
1. Singapore 20. United Kingdom 39. Israel 58. Lebanon
2. Hong Kong 21. Czech Republic 40. Greece 59. Georgia
3. South Korea 22. Denmark 41. Turkey 60. Brazil
4. Japan (tie) 23. France 42. Serbia 61. Jordan
4. Taiwan (tie) 24. Latvia 43. Bulgaria 62. Argentina
6. Finland 25. Norway 44. Romania 63. Albania
7. Estonia 26. Luxembourg 45. UAE 64. Tunisia
8. Switzerland 27. Spain 46. Cyprus 65. Macedonia
9. Netherlands 28. Italy (tie) 47. Thailand 66. Saudi Arabia
10. Canada 28. United States (tie) 48. Chile 67. Colombia
11. Poland 30. Portugal 49. Kazakhstan 68. Qatar
12. Vietnam 31. Lithuania 50. Armenia 69. Indonesia
13. Germany 32. Hungary 51. Iran 70. Botswana
14. Australia 33. Iceland 52. Malaysia 71. Peru
15. Ireland 34. Russia 53. Costa Rica 72. Oman
16. Belgium 35. Sweden 54. Mexico 73. Morocco
17. New Zealand 36. Croatia 55. Uruguay 74. Honduras
18. Slovenia 37. Slovak Republic 56. Montenegro 75. South Africa
19. Austria 38. Ukraine 57. Bahrain 76. Ghana
(Source: Speiser 2015)
Again, from Table 2.3, it can be seen that African countries were among the bottom rankings,
with South Africa and Ghana occupying the last two positions respectively. Most of the
European countries filled the top half of the rankings. Finland in the sixth spot was the top
performer among the European countries. The US and Italy were tied in 28th position.
15
Frand (2008) points out that after 1993, Singapore ranked number one in the world and has
continued to hold the top or second place for more than 20 years. Unfortunately, the US
continues to rank low. Singapore is said to have improved in mathematics results because it
had to undergo many changes in the teaching and learning of mathematics. That is to say the
mathematics content was not changed, but what had to be changed was the philosophy about
what has to be emphasised and the pedagogy about how the content is taught. The factors that
make Singapore Math such a strong curriculum are listed below. Note that Singapore Math is
the name given to the mathematics curriculum developed in Singapore. Singapore Math is
said to be now used in many schools and districts in the US. Frand (2008) lists the
developments that made Math Singapore successful as follows:
Singapore Math emphasises the development of strong number sense, excellent
mental-math skills and a deep understanding of place value.
The curriculum is based on progression from concrete experience, use of
manipulatives, use of pictures, and finally to the abstract level or algorithm. This
sequence gives students a solid understanding of basic mathematical concepts and
relationships before they start working at the abstract level.
Singapore Math includes a strong emphasis on model drawing, a visual approach to
solving word problems that helps students organise information and solve problems in
a step-by-step manner.
Concepts are taught to mastery, then later revisited but not re-taught. It is said that the
US curriculum is a mile wide and an inch deep, whereas Singapore’s math curriculum
is just the opposite.
The Singapore approach focuses on developing students who are problem solvers
(Frand 2008).
Again, it is necessary for this study to look at what is done by those countries performing
well in mathematics against activities done in the USA. From Tables 2.1 and 2.2, Singapore,
Japan and the Netherlands are in the top ten positions and therefore a short comparison of
these three countries with the United States had to be made in order to see what it is that the
USA is not doing right. A comparison was made with regard to the following aspects: anxiety
on students’ performance, textbooks, curriculum, tuition time, and culture and parental
involvement.
16
(a) Anxiety and students’ performance
According to Abuja (2006) research studies have revealed that a dislike of or anxiety towards
mathematics has an effect on mathematics performance. These studies have shown that
Singapore students’ dislike for mathematics is much lower than that of their counterparts in
the USA. This may explain why Singapore performed better than the USA in the TIMSS. It
has been suggested that in order to develop a positive attitude towards learning mathematics,
children need to be shown from an early age that mathematics can be fun (Abuja 2006).
(b) Textbooks
Textbooks play an important role in preparing learners to understand mathematics, especially
while in the lower grades. In the article “Mathematics in the school curriculum: an
international perspective” Ruddock (1989) points out that in counties like Japan and
Singapore textbooks are either produced or have to be approved by national or local
Education Ministries. On the other hand, in the Netherlands there is no system for the official
approval of textbooks. In the USA, 21 out of the 50 states have to obtain approval from the
local Ministry of Education. In countries or states where approval is needed, this involves
checking that the prescribed curriculum is being followed. Japan uses a Textbook
Authorisation and Research Council to recommend textbooks to the Minister of Education.
The council comprises school teachers, university lecturers and Ministry officials.
In Singapore, textbooks must adhere to the syllabus, give comprehensive coverage of the
topics in the syllabus, adopt a clear and logical presentation of concepts and offer activities to
enhance the learning experiences of pupils. In the USA, states that use recommended
textbooks have a state textbook adoption programme.
Teachers in Singapore work from a centralised curriculum and books that are prepared by the
Curriculum Division of the Ministry of Education. Every textbook has accompanying
workbooks, especially at the elementary and middle school levels, all prepared and published
by the Curriculum Division. These books are very well presented and include numerous
examples for the teachers to use.
17
(c) Curriculum
In Singapore, problem solving is the central theme of the curriculum. Concepts are taught to
an extent that students master them. The revision of past examination papers and the use of
the problem-solving approach cause Singapore to perform better in international studies. The
curriculum is based on progression from concrete experience to a pictorial stage and finally to
the abstract level or algorithm.
In the Netherlands, the Realistic Mathematics Education (RME) curriculum is mainly driven
by context. This curriculum says mathematics must be connected to reality and at the same
time taken as a human activity. So the real-life contexts are used as starting points.
Gravemeijer & Doorman (1999) said that the role of context problems used to be limited to
the applications that would be addressed at the end of a learning sequence.
In the Netherlands, Singapore and Japan, the curriculum is not wide but it is very deep in
terms of concepts. Topics from the elementary grades are not repeated. This means these
countries teach fewer content areas in any given year than.
According to Cogan and Schmidt (1999), the mathematics curriculum in the USA covers
many topics as compared with other countries that performed well in TIMMS. They say
having few topics helps learners to master the content as compared to learners who have to
cover more work. In their article “What we’ve learned from the TIMSS” Cogan and Schmidt
(1999) explain that in the USA teachers are expected to teach and students to learn more
mathematics topics every year in the first eight grades than do the vast majority of other
TIMSS countries. They say, for example, in grades 5 to 8, the USA expects between 27 and
32 topics to be taught each year. This far exceeds the international median for each of these
grades (21-23 topics per year) and contrasts sharply with the 20-21 topics intended by the
highest achieving TIMSS countries.
(d) Tuition time
Mastrull (2002) said time spent by learners on schoolwork seems to have an impact on
success in mathematics achievement. She said that success of Japanese students in
mathematics does not mean that they are smarter than American students or other students
18
elsewhere in the world, they just work harder. American students attend school an average of
178 days per year as compared to 200 days in Japan. Japanese students go to school Monday
to Saturday, with Saturday a half day (Mastrull 2002).
(e) Culture and parental involvement
The culture of teaching in Japan involves a full partnership with the family. Teachers are to
some extent accountable for their students’ behaviour and well-being both inside and outside
of official school hours. Mastrull (2002) points out that Japanese parents, especially mothers,
take an active role in their children’s education. She said few Japanese women have jobs and
once they get married, their primary measure of success becomes the education of their
children. This means that their children get more support from them in terms of their
education or school work
Although the USA has adopted some of the strategies of Singapore Math, they have applied
them differently from what is done in Singapore (Frand 2008). It is rare that one will find a
classroom in the USA applying all the strategies of Singapore Math.
African countries perform poorly in mathematics when compared to most of the Asian and
European countries. This is shown by Table 2.3. A number of reasons for the poor
performance have been given. A study by Mbugua, Ribet, Muthaa and Nkonke (2012) tried
to investigate the factors that contribute to students’ poor performance in mathematics in
Kenya. Factors that were found to contribute to poor performance included teachers’
workload, overloaded syllabus, parent/guardian level of education and cultural factors. For
example, the study revealed that students who come from unsecure environments caused by
socio-cultural practices such as cattle rustling, early marriages and female genital mutilation
(FMG) show emotional problems at school. They lack concentration in class (Mbugua et al.
2012).
Another important study was done by Sila (2014) in Kenyan schools. The study investigated
the factors that influence students’ academic performance in mathematics in secondary
schools in the Kathonzweni district in Kenya. The findings of this study showed that
students’ performance in mathematics in the Kenya Certificate of Secondary Education
(KCSE) is below average, with most candidates scoring grades D and B. None of the five
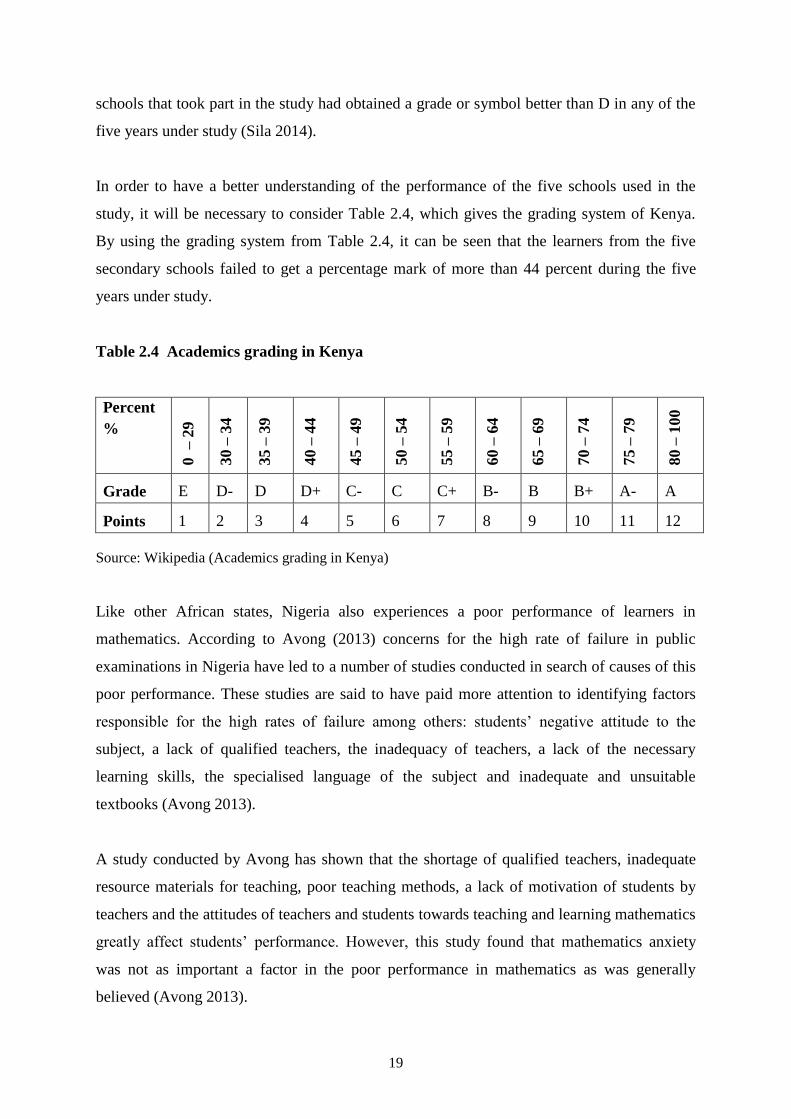
19
schools that took part in the study had obtained a grade or symbol better than D in any of the
five years under study (Sila 2014).
In order to have a better understanding of the performance of the five schools used in the
study, it will be necessary to consider Table 2.4, which gives the grading system of Kenya.
By using the grading system from Table 2.4, it can be seen that the learners from the five
secondary schools failed to get a percentage mark of more than 44 percent during the five
years under study.
Table 2.4 Academics grading in Kenya
Percent
%
0 – 2
9
30 –
34
35 –
39
40 –
44
45 –
49
50 –
54
55 –
59
60 –
64
65 –
69
70 –
74
75 –
79
80 –
100
Grade E D- D D+ C- C C+ B- B B+ A- A
Points 1 2 3 4 5 6 7 8 9 10 11 12
Source: Wikipedia (Academics grading in Kenya)
Like other African states, Nigeria also experiences a poor performance of learners in
mathematics. According to Avong (2013) concerns for the high rate of failure in public
examinations in Nigeria have led to a number of studies conducted in search of causes of this
poor performance. These studies are said to have paid more attention to identifying factors
responsible for the high rates of failure among others: students’ negative attitude to the
subject, a lack of qualified teachers, the inadequacy of teachers, a lack of the necessary
learning skills, the specialised language of the subject and inadequate and unsuitable
textbooks (Avong 2013).
A study conducted by Avong has shown that the shortage of qualified teachers, inadequate
resource materials for teaching, poor teaching methods, a lack of motivation of students by
teachers and the attitudes of teachers and students towards teaching and learning mathematics
greatly affect students’ performance. However, this study found that mathematics anxiety
was not as important a factor in the poor performance in mathematics as was generally
believed (Avong 2013).
20
Different researchers have come up with different reasons that cause learners to perform
poorly in mathematics. Kukogho (2015) quotes Professor Mohamed Ibrahim (Professor of
Mathematics and President of the Mathematical Association of Nigeria) saying that the poor
performance in mathematics in Nigeria has been caused by poorly trained teachers. Ibrahim
has been quoted saying that students have developed “mathematical phobia”, which results in
fear and failure. According to Ibrahim the dislike of mathematics is linked to teachers’
methodology. He also said most teachers in Nigeria cannot use modern technology, such as
computers, which are now commonly used in advanced countries. In these countries learners
are exposed to computer techniques right from primary school.
Kukogho (2015) also cites Ibrahim saying that the training gap has been minimised by
workshops organised by the Mathematical Association of Nigeria (MAN). MAN organises
workshops from time to time to show teachers the latest techniques on how they can teach
effectively from primary school to tertiary level.
In addition, Ibrahim has proposed that the Nigerian government introduce incentives like
bursaries to create interest in mathematics. A special bursary for students that show a love for
mathematics must be introduced. In the case of teachers, government must give them
mathematics allowances (Kukogho 2015).
2.2.2. South Africa’s mathematics curriculum and performance
In South Africa learners’ performance in mathematics is generally poor even though learners
are considered to have passed mathematics if they obtain 30%. Table 2.5 shows the
performance in mathematics of South Africa’s Grade 12 learners in the past four years, from
2012 to 2015. One can see that there was a slight improvement from 2012 to 2013. The
performance dropped again in 2014 and 2015. The table also shows that the overall pass rate
in the past four years (2012 to 2015) has never exceeded 60%. The situation would have been
worse if the pass mark had been 40% because the pass rate would not have exceeded 41% for
the past four years.
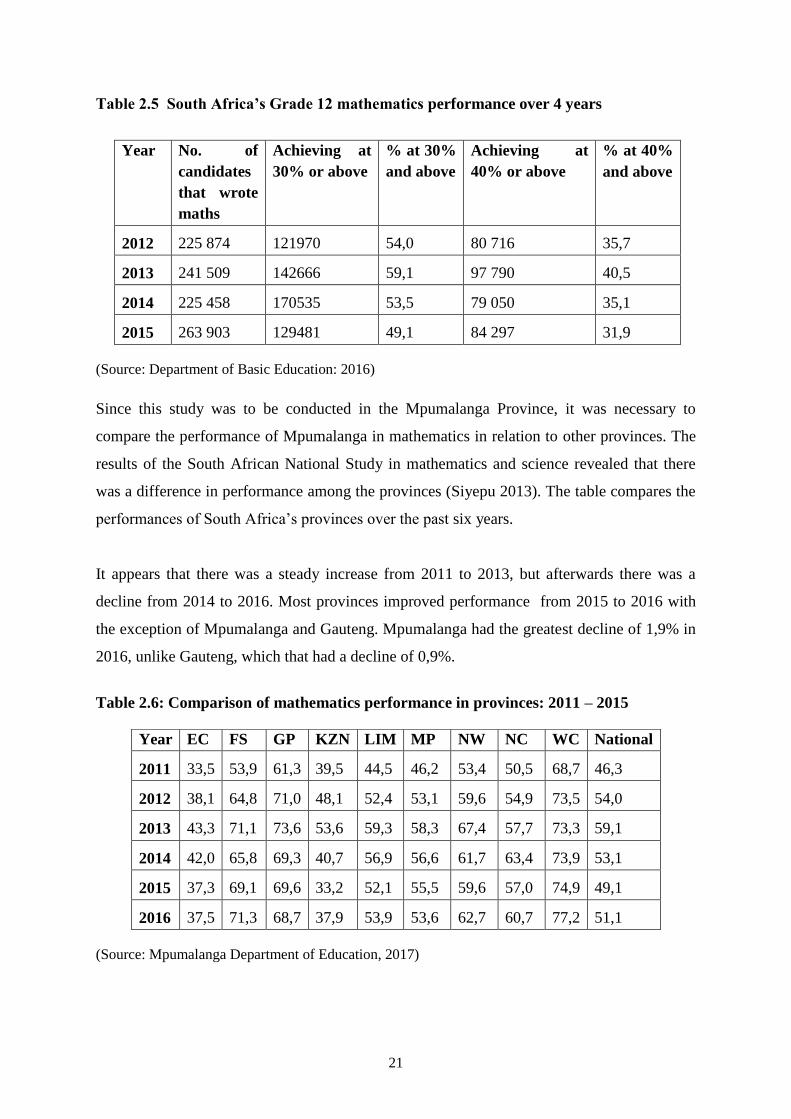
21
Table 2.5 South Africa’s Grade 12 mathematics performance over 4 years
Year No. of
candidates
that wrote
maths
Achieving at
30% or above
% at 30%
and above
Achieving at
40% or above
% at 40%
and above
2012 225 874 121970 54,0 80 716 35,7
2013 241 509 142666 59,1 97 790 40,5
2014 225 458 170535 53,5 79 050 35,1
2015 263 903 129481 49,1 84 297 31,9
(Source: Department of Basic Education: 2016)
Since this study was to be conducted in the Mpumalanga Province, it was necessary to
compare the performance of Mpumalanga in mathematics in relation to other provinces. The
results of the South African National Study in mathematics and science revealed that there
was a difference in performance among the provinces (Siyepu 2013). The table compares the
performances of South Africa’s provinces over the past six years.
It appears that there was a steady increase from 2011 to 2013, but afterwards there was a
decline from 2014 to 2016. Most provinces improved performance from 2015 to 2016 with
the exception of Mpumalanga and Gauteng. Mpumalanga had the greatest decline of 1,9% in
2016, unlike Gauteng, which that had a decline of 0,9%.
Table 2.6: Comparison of mathematics performance in provinces: 2011 – 2015
(Source: Mpumalanga Department of Education, 2017)
Year EC FS GP KZN LIM MP NW NC WC National
2011 33,5 53,9 61,3 39,5 44,5 46,2 53,4 50,5 68,7 46,3
2012 38,1 64,8 71,0 48,1 52,4 53,1 59,6 54,9 73,5 54,0
2013 43,3 71,1 73,6 53,6 59,3 58,3 67,4 57,7 73,3 59,1
2014 42,0 65,8 69,3 40,7 56,9 56,6 61,7 63,4 73,9 53,1
2015 37,3 69,1 69,6 33,2 52,1 55,5 59,6 57,0 74,9 49,1
2016 37,5 71,3 68,7 37,9 53,9 53,6 62,7 60,7 77,2 51,1
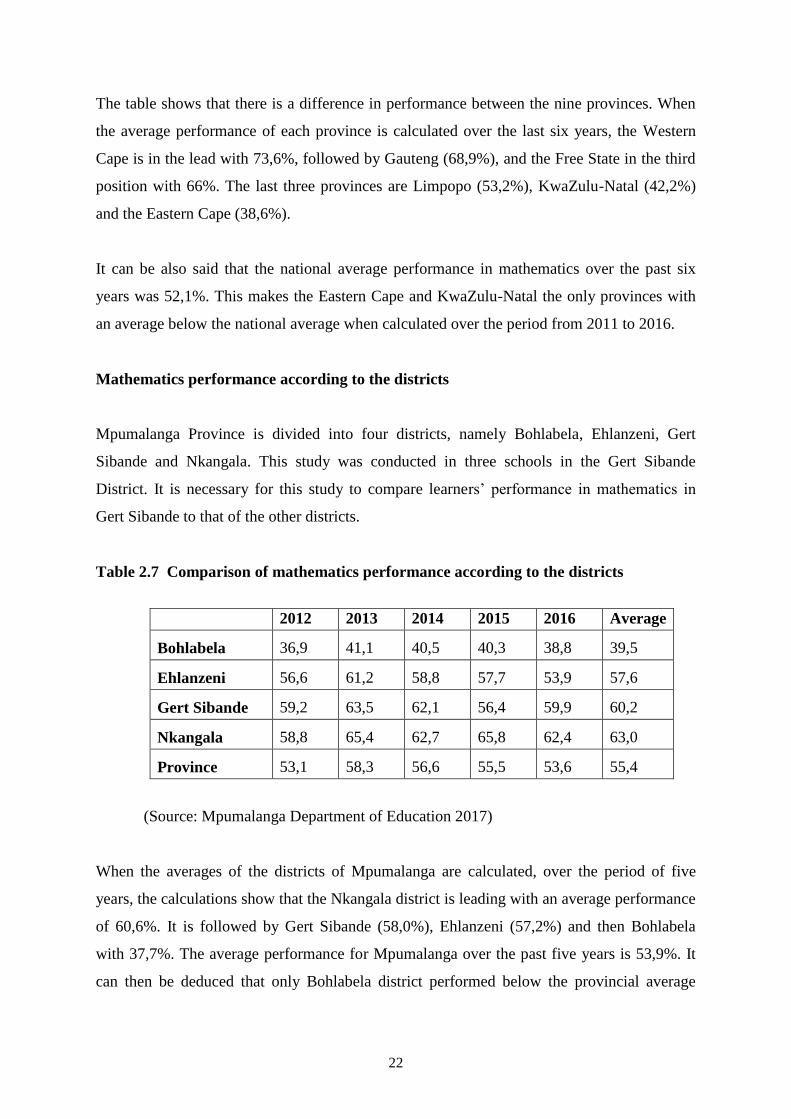
22
The table shows that there is a difference in performance between the nine provinces. When
the average performance of each province is calculated over the last six years, the Western
Cape is in the lead with 73,6%, followed by Gauteng (68,9%), and the Free State in the third
position with 66%. The last three provinces are Limpopo (53,2%), KwaZulu-Natal (42,2%)
and the Eastern Cape (38,6%).
It can be also said that the national average performance in mathematics over the past six
years was 52,1%. This makes the Eastern Cape and KwaZulu-Natal the only provinces with
an average below the national average when calculated over the period from 2011 to 2016.
Mathematics performance according to the districts
Mpumalanga Province is divided into four districts, namely Bohlabela, Ehlanzeni, Gert
Sibande and Nkangala. This study was conducted in three schools in the Gert Sibande
District. It is necessary for this study to compare learners’ performance in mathematics in
Gert Sibande to that of the other districts.
Table 2.7 Comparison of mathematics performance according to the districts
2012 2013 2014 2015 2016 Average
Bohlabela 36,9 41,1 40,5 40,3 38,8 39,5
Ehlanzeni 56,6 61,2 58,8 57,7 53,9 57,6
Gert Sibande 59,2 63,5 62,1 56,4 59,9 60,2
Nkangala 58,8 65,4 62,7 65,8 62,4 63,0
Province 53,1 58,3 56,6 55,5 53,6 55,4
(Source: Mpumalanga Department of Education 2017)
When the averages of the districts of Mpumalanga are calculated, over the period of five
years, the calculations show that the Nkangala district is leading with an average performance
of 60,6%. It is followed by Gert Sibande (58,0%), Ehlanzeni (57,2%) and then Bohlabela
with 37,7%. The average performance for Mpumalanga over the past five years is 53,9%. It
can then be deduced that only Bohlabela district performed below the provincial average
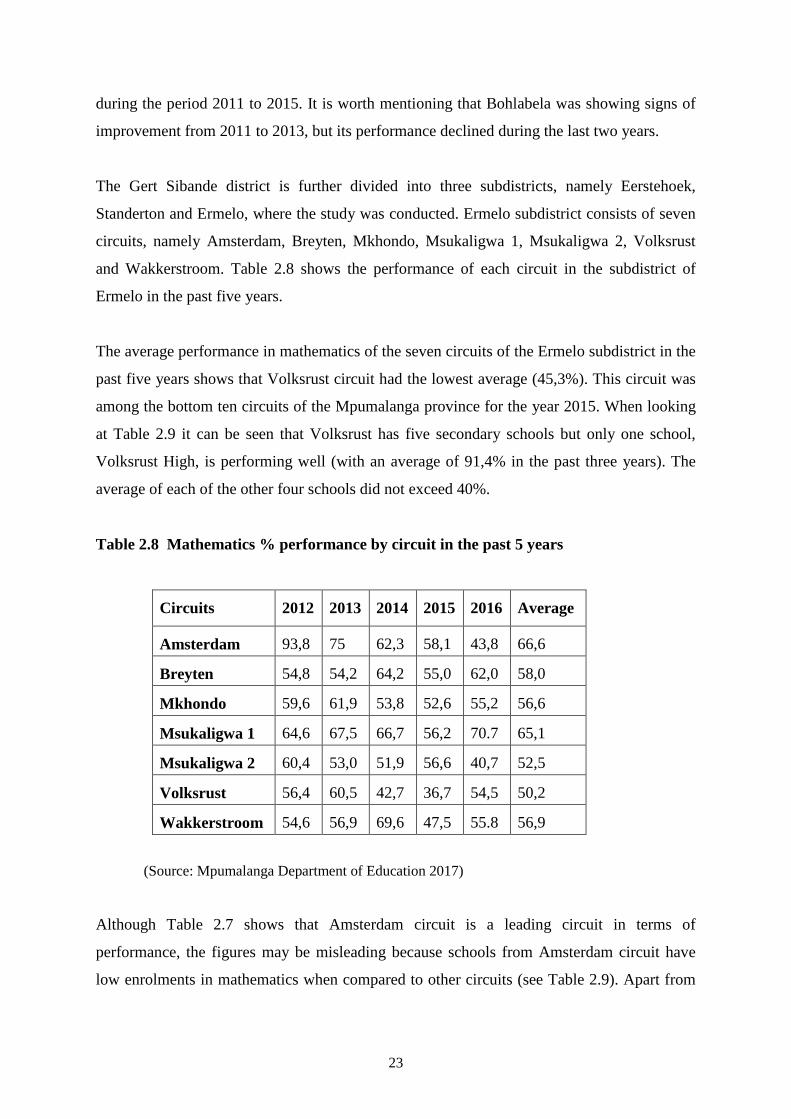
23
during the period 2011 to 2015. It is worth mentioning that Bohlabela was showing signs of
improvement from 2011 to 2013, but its performance declined during the last two years.
The Gert Sibande district is further divided into three subdistricts, namely Eerstehoek,
Standerton and Ermelo, where the study was conducted. Ermelo subdistrict consists of seven
circuits, namely Amsterdam, Breyten, Mkhondo, Msukaligwa 1, Msukaligwa 2, Volksrust
and Wakkerstroom. Table 2.8 shows the performance of each circuit in the subdistrict of
Ermelo in the past five years.
The average performance in mathematics of the seven circuits of the Ermelo subdistrict in the
past five years shows that Volksrust circuit had the lowest average (45,3%). This circuit was
among the bottom ten circuits of the Mpumalanga province for the year 2015. When looking
at Table 2.9 it can be seen that Volksrust has five secondary schools but only one school,
Volksrust High, is performing well (with an average of 91,4% in the past three years). The
average of each of the other four schools did not exceed 40%.
Table 2.8 Mathematics % performance by circuit in the past 5 years
Circuits 2012 2013 2014 2015 2016 Average
Amsterdam 93,8 75 62,3 58,1 43,8 66,6
Breyten 54,8 54,2 64,2 55,0 62,0 58,0
Mkhondo 59,6 61,9 53,8 52,6 55,2 56,6
Msukaligwa 1 64,6 67,5 66,7 56,2 70.7 65,1
Msukaligwa 2 60,4 53,0 51,9 56,6 40,7 52,5
Volksrust 56,4 60,5 42,7 36,7 54,5 50,2
Wakkerstroom 54,6 56,9 69,6 47,5 55.8 56,9
(Source: Mpumalanga Department of Education 2017)
Although Table 2.7 shows that Amsterdam circuit is a leading circuit in terms of
performance, the figures may be misleading because schools from Amsterdam circuit have
low enrolments in mathematics when compared to other circuits (see Table 2.9). Apart from
24
Nganana Secondary, the other four schools have never enrolled more than 15 learners per
year in Mathematics in the last three years.
A good performance by Msukaligwa 1 circuit may be due to the fact that it has two former
Model C schools (Ligbron Academy of Technology and Ermelo High School), which
contribute more than the other schools. These two schools each obtained a 100% pass in the
2013 NSC examination. It is a general trend that the former Model C schools perform better
than the black schools. Siyepu (2013) points out that an analysis of learners’ performance
shows that learners in the former white schools obtained higher scores than those from black
schools.
The Msukaligwa 1 circuit consists of different types of schools. Besides the two former
Model C schools mentioned earlier, it has Mathematics, Science and Technology (MSTA)
schools and others which do not fall in either of the two mentioned categories. The MSTA
project is part of the strategy of the Mpumalanga province, which is in the implementation
phase. The MSTA schools specialise in Mathematics, Science and Technology. The
Mpumalanga Department of Education has selected 100 FET schools and 200 feeder primary
schools to participate in this programme. Already these schools have received more support
than those that are not part of the strategy. It is hoped that these schools will increase mass
production of mathematics and science graduates at Grade 12 level and at the same time
make sure that the passes are of a good quality.
The MSTA schools include all the former Dinaledi schools in Mpumalanga. The Dinaledi
Schools Project was started by the Department of Education in 2001. O’Connell (2009)
explains that the criteria for selecting these schools were based on the potential the schools
have demonstrated in increasing learner participation and performance in mathematics and
science. Schools in this project are provided with resources and support to improve the
teaching and learning of mathematics and science (O’Connell, 2009).
The MSTA schools are in the process of reducing the number of learners in mathematical
literacy and eventually phasing it out. That is to say once this strategy is in full operation,
there will be no learners in these schools that will be doing mathematical literacy. Learners
are expected to take mathematics, physical sciences and languages, and choose the other
subjects from life sciences, agriculture, computer applications technology (CAT), information
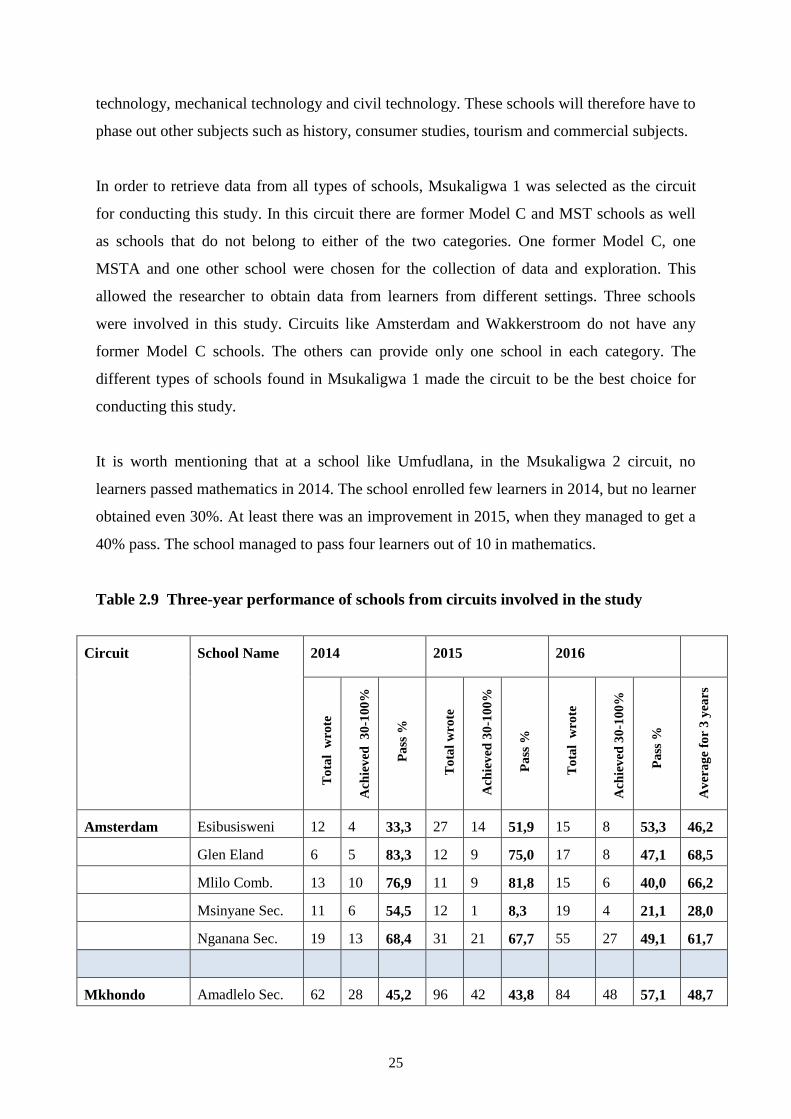
25
technology, mechanical technology and civil technology. These schools will therefore have to
phase out other subjects such as history, consumer studies, tourism and commercial subjects.
In order to retrieve data from all types of schools, Msukaligwa 1 was selected as the circuit
for conducting this study. In this circuit there are former Model C and MST schools as well
as schools that do not belong to either of the two categories. One former Model C, one
MSTA and one other school were chosen for the collection of data and exploration. This
allowed the researcher to obtain data from learners from different settings. Three schools
were involved in this study. Circuits like Amsterdam and Wakkerstroom do not have any
former Model C schools. The others can provide only one school in each category. The
different types of schools found in Msukaligwa 1 made the circuit to be the best choice for
conducting this study.
It is worth mentioning that at a school like Umfudlana, in the Msukaligwa 2 circuit, no
learners passed mathematics in 2014. The school enrolled few learners in 2014, but no learner
obtained even 30%. At least there was an improvement in 2015, when they managed to get a
40% pass. The school managed to pass four learners out of 10 in mathematics.
Table 2.9 Three-year performance of schools from circuits involved in the study
Circuit
School Name
2014 2015 2016
To
tal
wro
te
Ach
iev
ed
30
-100
%
Pa
ss %
To
tal
wro
te
A
chie
ved
30
-100
%
Pa
ss %
To
tal
wro
te
Ach
iev
ed 3
0-1
00
%
P
ass
%
Av
era
ge
for
3 y
ears
Amsterdam Esibusisweni 12 4 33,3 27 14 51,9 15 8 53,3 46,2
Glen Eland 6 5 83,3 12 9 75,0 17 8 47,1 68,5
Mlilo Comb. 13 10 76,9 11 9 81,8 15 6 40,0 66,2
Msinyane Sec. 11 6 54,5 12 1 8,3 19 4 21,1 28,0
Nganana Sec. 19 13 68,4 31 21 67,7 55 27 49,1 61,7
Mkhondo Amadlelo Sec. 62 28 45,2 96 42 43,8 84 48 57,1 48,7
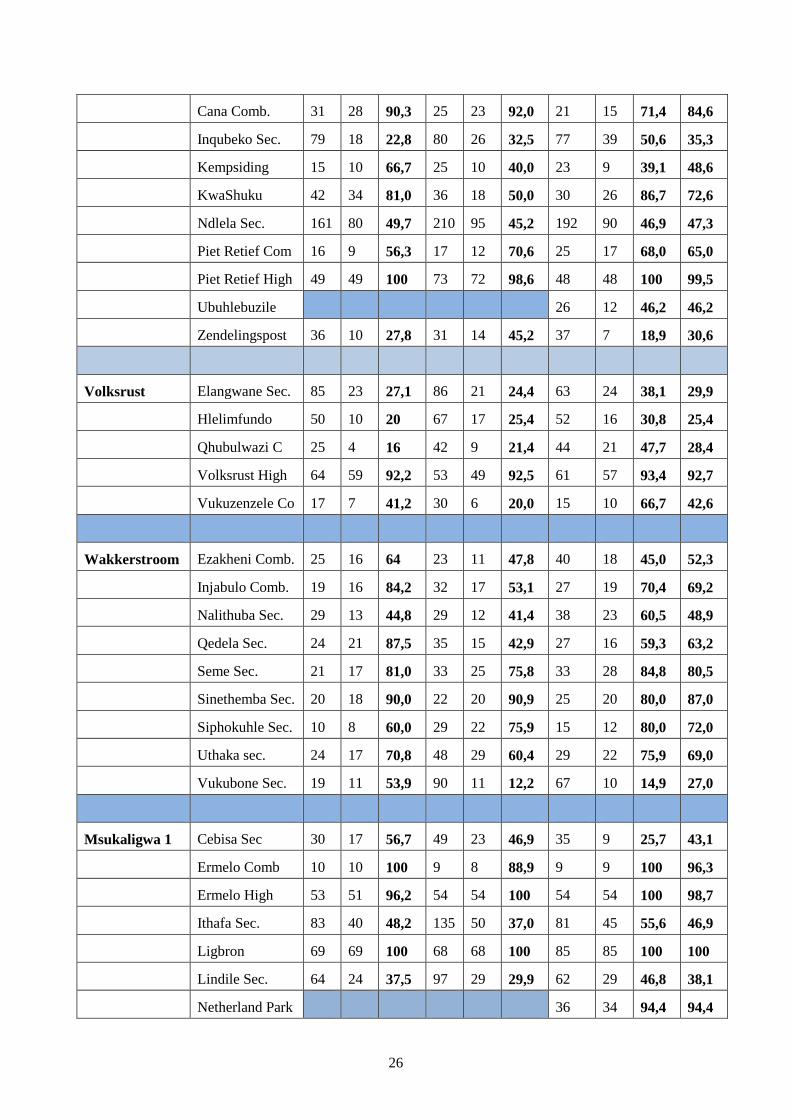
26
Cana Comb. 31 28 90,3 25 23 92,0 21 15 71,4 84,6
Inqubeko Sec. 79 18 22,8 80 26 32,5 77 39 50,6 35,3
Kempsiding 15 10 66,7 25 10 40,0 23 9 39,1 48,6
KwaShuku 42 34 81,0 36 18 50,0 30 26 86,7 72,6
Ndlela Sec. 161 80 49,7 210 95 45,2 192 90 46,9 47,3
Piet Retief Com 16 9 56,3 17 12 70,6 25 17 68,0 65,0
Piet Retief High 49 49 100 73 72 98,6 48 48 100 99,5
Ubuhlebuzile 26 12 46,2 46,2
Zendelingspost 36 10 27,8 31 14 45,2 37 7 18,9 30,6
Volksrust Elangwane Sec. 85 23 27,1 86 21 24,4 63 24 38,1 29,9
Hlelimfundo 50 10 20 67 17 25,4 52 16 30,8 25,4
Qhubulwazi C 25 4 16 42 9 21,4 44 21 47,7 28,4
Volksrust High 64 59 92,2 53 49 92,5 61 57 93,4 92,7
Vukuzenzele Co 17 7 41,2 30 6 20,0 15 10 66,7 42,6
Wakkerstroom Ezakheni Comb. 25 16 64 23 11 47,8 40 18 45,0 52,3
Injabulo Comb. 19 16 84,2 32 17 53,1 27 19 70,4 69,2
Nalithuba Sec. 29 13 44,8 29 12 41,4 38 23 60,5 48,9
Qedela Sec. 24 21 87,5 35 15 42,9 27 16 59,3 63,2
Seme Sec. 21 17 81,0 33 25 75,8 33 28 84,8 80,5
Sinethemba Sec. 20 18 90,0 22 20 90,9 25 20 80,0 87,0
Siphokuhle Sec. 10 8 60,0 29 22 75,9 15 12 80,0 72,0
Uthaka sec. 24 17 70,8 48 29 60,4 29 22 75,9 69,0
Vukubone Sec. 19 11 53,9 90 11 12,2 67 10 14,9 27,0
Msukaligwa 1 Cebisa Sec 30 17 56,7 49 23 46,9 35 9 25,7 43,1
Ermelo Comb 10 10 100 9 8 88,9 9 9 100 96,3
Ermelo High 53 51 96,2 54 54 100 54 54 100 98,7
Ithafa Sec. 83 40 48,2 135 50 37,0 81 45 55,6 46,9
Ligbron 69 69 100 68 68 100 85 85 100 100
Lindile Sec. 64 24 37,5 97 29 29,9 62 29 46,8 38,1
Netherland Park 36 34 94,4 94,4
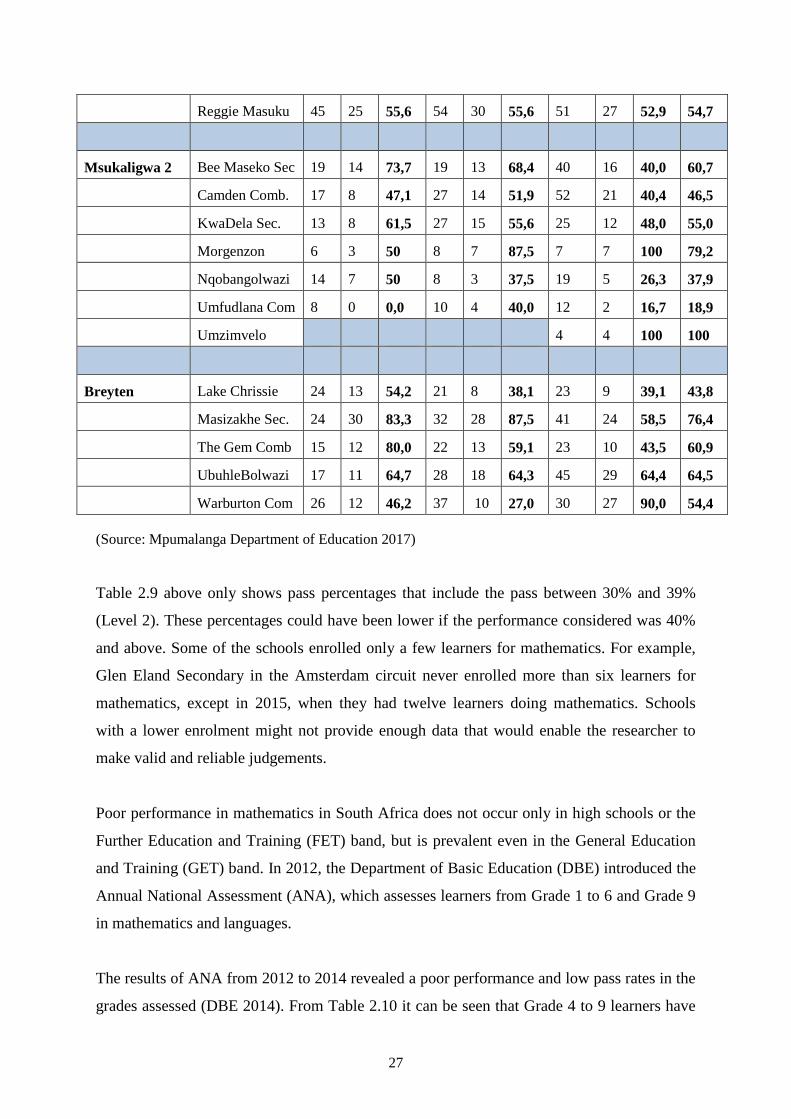
27
Reggie Masuku 45 25 55,6 54 30 55,6 51 27 52,9 54,7
Msukaligwa 2 Bee Maseko Sec 19 14 73,7 19 13 68,4 40 16 40,0 60,7
Camden Comb. 17 8 47,1 27 14 51,9 52 21 40,4 46,5
KwaDela Sec. 13 8 61,5 27 15 55,6 25 12 48,0 55,0
Morgenzon 6 3 50 8 7 87,5 7 7 100 79,2
Nqobangolwazi 14 7 50 8 3 37,5 19 5 26,3 37,9
Umfudlana Com 8 0 0,0 10 4 40,0 12 2 16,7 18,9
Umzimvelo 4 4 100 100
Breyten Lake Chrissie 24 13 54,2 21 8 38,1 23 9 39,1 43,8
Masizakhe Sec. 24 30 83,3 32 28 87,5 41 24 58,5 76,4
The Gem Comb 15 12 80,0 22 13 59,1 23 10 43,5 60,9
UbuhleBolwazi 17 11 64,7 28 18 64,3 45 29 64,4 64,5
Warburton Com 26 12 46,2 37 10 27,0 30 27 90,0 54,4
(Source: Mpumalanga Department of Education 2017)
Table 2.9 above only shows pass percentages that include the pass between 30% and 39%
(Level 2). These percentages could have been lower if the performance considered was 40%
and above. Some of the schools enrolled only a few learners for mathematics. For example,
Glen Eland Secondary in the Amsterdam circuit never enrolled more than six learners for
mathematics, except in 2015, when they had twelve learners doing mathematics. Schools
with a lower enrolment might not provide enough data that would enable the researcher to
make valid and reliable judgements.
Poor performance in mathematics in South Africa does not occur only in high schools or the
Further Education and Training (FET) band, but is prevalent even in the General Education
and Training (GET) band. In 2012, the Department of Basic Education (DBE) introduced the
Annual National Assessment (ANA), which assesses learners from Grade 1 to 6 and Grade 9
in mathematics and languages.
The results of ANA from 2012 to 2014 revealed a poor performance and low pass rates in the
grades assessed (DBE 2014). From Table 2.10 it can be seen that Grade 4 to 9 learners have
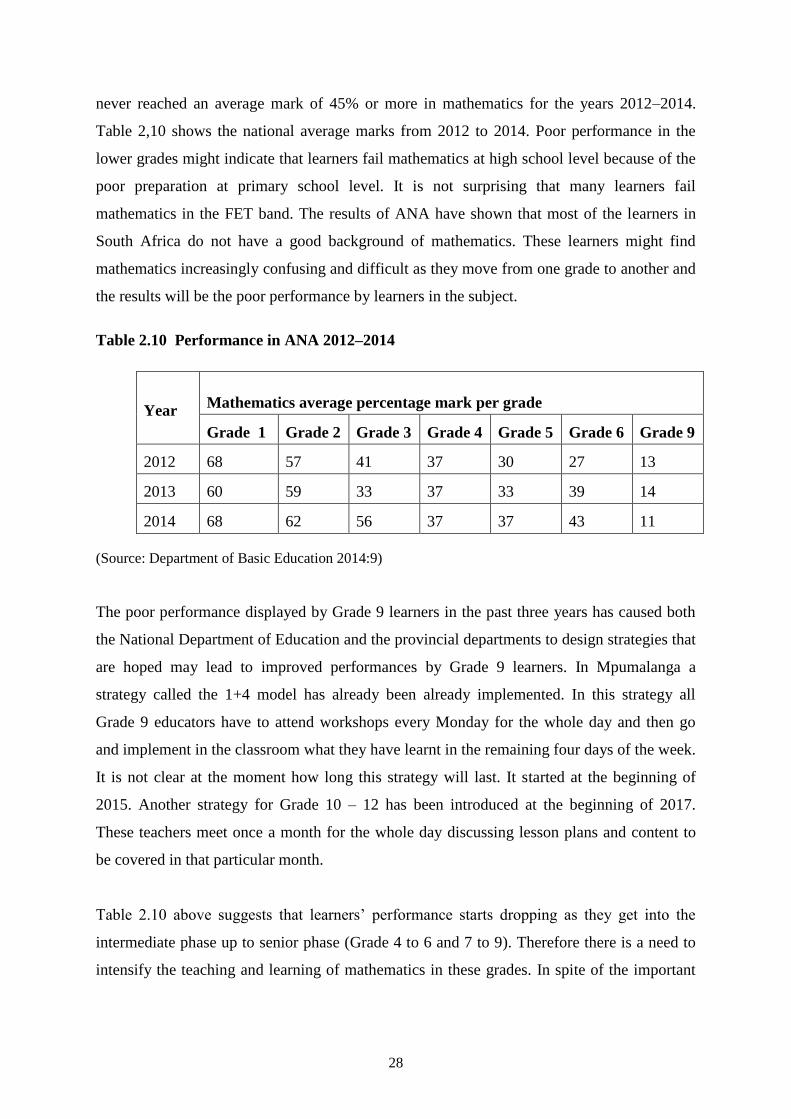
28
never reached an average mark of 45% or more in mathematics for the years 2012–2014.
Table 2,10 shows the national average marks from 2012 to 2014. Poor performance in the
lower grades might indicate that learners fail mathematics at high school level because of the
poor preparation at primary school level. It is not surprising that many learners fail
mathematics in the FET band. The results of ANA have shown that most of the learners in
South Africa do not have a good background of mathematics. These learners might find
mathematics increasingly confusing and difficult as they move from one grade to another and
the results will be the poor performance by learners in the subject.
Table 2.10 Performance in ANA 2012–2014
Year
Mathematics average percentage mark per grade
Grade 1 Grade 2 Grade 3 Grade 4 Grade 5 Grade 6 Grade 9
2012 68 57 41 37 30 27 13
2013 60 59 33 37 33 39 14
2014 68 62 56 37 37 43 11
(Source: Department of Basic Education 2014:9)
The poor performance displayed by Grade 9 learners in the past three years has caused both
the National Department of Education and the provincial departments to design strategies that
are hoped may lead to improved performances by Grade 9 learners. In Mpumalanga a
strategy called the 1+4 model has already been already implemented. In this strategy all
Grade 9 educators have to attend workshops every Monday for the whole day and then go
and implement in the classroom what they have learnt in the remaining four days of the week.
It is not clear at the moment how long this strategy will last. It started at the beginning of
2015. Another strategy for Grade 10 – 12 has been introduced at the beginning of 2017.
These teachers meet once a month for the whole day discussing lesson plans and content to
be covered in that particular month.
Table 2.10 above suggests that learners’ performance starts dropping as they get into the
intermediate phase up to senior phase (Grade 4 to 6 and 7 to 9). Therefore there is a need to
intensify the teaching and learning of mathematics in these grades. In spite of the important
29
findings that resulted from ANA, these tests were not administered in 2015 as teacher unions
disengaged themselves in the continuation of the writing of the tests.
Some European countries have introduced new teaching and learning methods in order to
improve learners’ performance in mathematics. According to a report by Education,
Audiovisual and Culture Executive Agency (2011), research evidence suggested that
effective mathematics instruction involving the use of a variety of teaching methods are now
being used by these countries with the aim of improving achievement in mathematics. At the
same time, there is general agreement that certain methods such as problem-based learning,
investigation and contextualisation are particularly effective for raising achievement and
improving students' attitudes toward mathematics. (Education, Audiovisual and Culture
Executive Agency, 2011). It is hoped that the new approaches may result in learners
performing well in mathematics
In 1994 South Africa became a democratic country. Changes in politics made the country to
change its education system too. The information in education led to the development of a
new curriculum that integrated education and training using the outcomes-based education
(OBE) approach. This curriculum was named Curriculum 2005 because it was hoped that by
year 2005 it would have been completely implemented in all the grades, from Grade 1 to 12.
Malan (2000) lists the main features of the OBE model as follows:
It is needs-driven.
It is outcomes-driven.
It has a design-down approach.
It specifies outcomes and levels of outcomes.
The focus shifts from teaching to learning.
The framework is hostile in its outcomes focus.
As seen in its main characteristics, Curriculum 2005, usually referred to as C2005, shifted the
focus from teaching to learning. This means that the teaching approach changed from being
teacher-centred to being learner-centred. Zhang (2003) describes the learner-centred style as
one that focuses on the student’s cognitive development. In this style, the role of the teacher
changes from provider of information or knowledge to facilitator of learning.
30
Curriculum 2005 faced challenges before it could be fully implemented in all the grades. This
led to the formation of the Curriculum 2005 review committee in 2000. The committee report
indicated that teachers complained that the curriculum was confusing and full of jargon; the
curriculum was overcrowded with insufficient time for the development of effective reading
skills, basic maths and science concepts. There were also a lot of complaints from teachers
that they were not fully trained (Department of Education 2000). The report resulted in the
introduction of another revised curriculum termed the Revised National Curriculum
Statement (RNCS) in Grades R to 9 and the National Curriculum Statement (NCS) in Grades
10 to 12.
Like the previous curricula that had been changed, the National Curriculum Statement was
also challenged. The Minister of Basic Education appointed a task team to look at the
challenges. The committee findings led to the streamlining or strengthening of the NCS,
resulting in its new version called the Curriculum Assessment Policy Statement (CAPS).
When the NCS was introduced in mathematics, topics like Euclidean geometry were
scrapped from FET mathematics and new ones such as linear programming and
transformation geometry were introduced. The format of assessing learners at the end of the
year, namely two papers (Paper 1 and 2), was changed. There were now three papers, with
Paper 3 an optional paper. Very few schools wrote Paper 3 and most of those were former
Model C schools. Topics like Euclidean geometry and probability were examined in Paper 3.
The introduction of CAPS led to the normal setting of two papers, scrapping Paper 3.
Euclidean geometry is back in Paper 2, while probability was moved to Paper 1. This new
format was introduced in 2014. This implies that learners who wrote matric during the period
2008 to 2013 were never taught and assessed on Euclidean geometry and probability, unless
they were in those few schools that wrote Paper 3.
A lot has been done in order to improve performance in mathematics in South Africa. It is
said that South African students continue to perform poorly irrespective of all that has been
done (Feza 2014). The Trends in International Mathematics and Science Study (TIMSS), a
cross-national assessment of the mathematics and science knowledge of Grade 4 and 8
learners reported that achievement in mathematics and science was still low but had
improved from TIMSS 2002 to TIMSS 2011 (TIMSS 2011).
31
In its analysis of mathematics results TIMSS revealed the performance by province in 2011.
The three best-performing provinces were the Western Cape, Gauteng and the Northern
Cape. The three lowest provinces were KwaZulu-Natal, Limpopo and the Eastern Cape.
Although the performance was still poor, a number of provinces had improved their average
scores since 2002 (TIMSS 2011).
A poor performance in mathematics was also seen in the year 2000 when South Africa took
part in the second study conducted by the Southern Africa Consortium for Monitoring
Education Quality (SACMEQ). Fifteen countries from southern and eastern Africa
participated (Moloi [nd: 2]). About 3 400 Grade 6 learners from 168 selected schools were
tested in reading and mathematics (numeracy). The results showed a poor performance in
mathematics.
On 17 April 2013 Sarah Evans from Mail & Guardian reported that South Africa ranked
second last in the world in mathematics and science (Mail & Guardian 2013). This report
was compiled by the World Economic Forum (WEF). The Forum ranked South Africa among
the countries with the poorest mathematics education in the world. South Africa fell behind
countries like Haiti and also below other African countries such as Nigeria, Kenya, Lesotho,
Chad and Zimbabwe. It managed to perform better than only Yemen and Libya (which were
in position 147 and 148 respectively) (News24 2014).
However, the WEF ranking was criticised for not being accurate. The main reasons for the
criticism were that no standardised tests were conducted to assess the quality of maths and
science education in the countries surveyed. Secondly, the ranking was derived from an
annual executive opinion survey carried out by the WEF. This survey was conducted among
unidentified business leaders (Africa Check 2014).
Africa Check said the most comprehensive and most current data was compiled by the
Southern and Eastern Africa Consortium for Monitoring Educational Quality (SACMEQ).
Countries represented in the consortium include Botswana, Kenya, Lesotho, Malawi,
Mauritius, Mozambique, Namibia, Seychelles, South Africa, Swaziland, Tanzania, Uganda,
Zambia and Zimbabwe. SACMEQ is said to have conducted three major education policy
research projects during the periods 1995–1998, 1998–2004 and 2005–2010. South Africa’s
average student mathematics score placed the country in position eight out of the fifteen

32
countries. South Africa managed to be ahead of only Mozambique, Uganda, Lesotho,
Namibia, Malawi and Zambia (Africa Check 2014).
33
2.3 THEORETICAL FRAMEWORK
According to the Concise Oxford Dictionary (1990) the term “theoretical” means “based on
theory rather than experience or practice”. At the same time the term “framework” is defined
as “an essential supporting structure”. From these two definitions one can then say that the
theoretical framework in a research is a structure that helps a researcher to pursue their study
using the existing theories or ideas. Eisenhart (1991) defines a theoretical framework as
a structure that guides research by relying on a formal theory constructed by
using an established, coherent explanation of certain phenomena and
relationships, e.g. Piaget’s theory of conservation, Vygotsky’s theory of
socio-historical constructivism, or Newell and Simon’s theory of human
problem-solving (p 205).
This study attempted to explore the causes of poor performance in the learning of calculus. In
order to get a clear picture of the causes, it was necessary to pay more attention to particular
views and ideas of the teaching and learning of mathematics. Therefore theories that explain
how students learn and acquire mathematical knowledge were of great importance to this
study. Kilpatrick’s five strands in the learning of mathematics (mathematical proficiency),
constructivism, the Singapore Mathematical Framework and APOS theory will now be
discussed to determine their effect on the learning of mathematics.
2.3.1. Strands in learning mathematics
Several studies on how students learn mathematics have been conducted in the past years.
One study worth mentioning was carried out in the United States of America in 1988
(Kilpatrick 2009). According to Kilpatrick the US Department of Education and the National
Science Foundation requested the National Academy of Sciences to establish a committee to
conduct a study on mathematics learning. The main goals of the study were to make
recommendations for improving students’ learning of mathematics from preschool
(kindergarten) up to Grade 8. At that the time there was lot of debate regarding the learning
of mathematics. Some mathematicians were of the opinion that in the learning of
mathematics, understanding preceded skills, while others said that understanding followed
skill or replaced skill in the curriculum.
Kilpatrick (2009) explains that the committee proposed the term “proficiency” to be used in
the learning of mathematics. The committee used the metaphor of a rope woven with five
34
strands. The intertwined strands model of a rope was used to indicate that the five strands for
learning mathematics had no particular order. The recommendation made was that if a learner
was to be successful in learning mathematics, the five strands of mathematics proficiency
should be developed. The five strands and their definitions are as follows:
1. Conceptual understanding: This is defined as the comprehension of mathematical
concepts, operations and procedures (Kilpatrick et al. 2001). Learners with conceptual
understanding are capable of learning new ideas in addition to what they already know
(Kilpatrick et al. 2001).
2. Procedural fluency: This refers to skill in carrying out procedures flexibly, accurately,
efficiently and appropriately (Kilpatrick et al. 2001). In other words, procedural fluency
refers to the knowledge of procedures, knowledge of when and how to use them, and
skills in using them accurately (Kilpatrick et al. 2001).
3. Strategic competence: This is defined as the ability to formulate, represent and solve
mathematical problems (Kilpatrick et al. 2001). Strategic competence is similar to what
is called problem solving and problem formulation. Before trying to solve a problem,
learners have to represent it mathematically, either numerically, by using symbols, in
words, or graphically (Kilpatrick et al. 2001).
4. Adaptive reasoning: This is referred to as the capacity for logical thoughts, reflection,
explanation and justification (Kilpatrick et al. 2001). For a student to say a reason is
correct and valid, they must be able to check all alternatives and apply the knowledge
in order to draw conclusions. Adaptive reasoning is used to go through many facts,
procedures, concepts and solution methods to check if they all fit together to make
sense.
5. Productive disposition: It is defined as the habitual inclination to see mathematics as
sensible, useful and worthwhile, coupled with belief in diligence and one’s own
efficacy (Kilpatrick et al. 2001), that is to say learners must see sense and the need for
doing mathematics, and perceive it as useful and valuable. Once learners develop the
other four strands, they will believe that mathematics are understandable, and can be
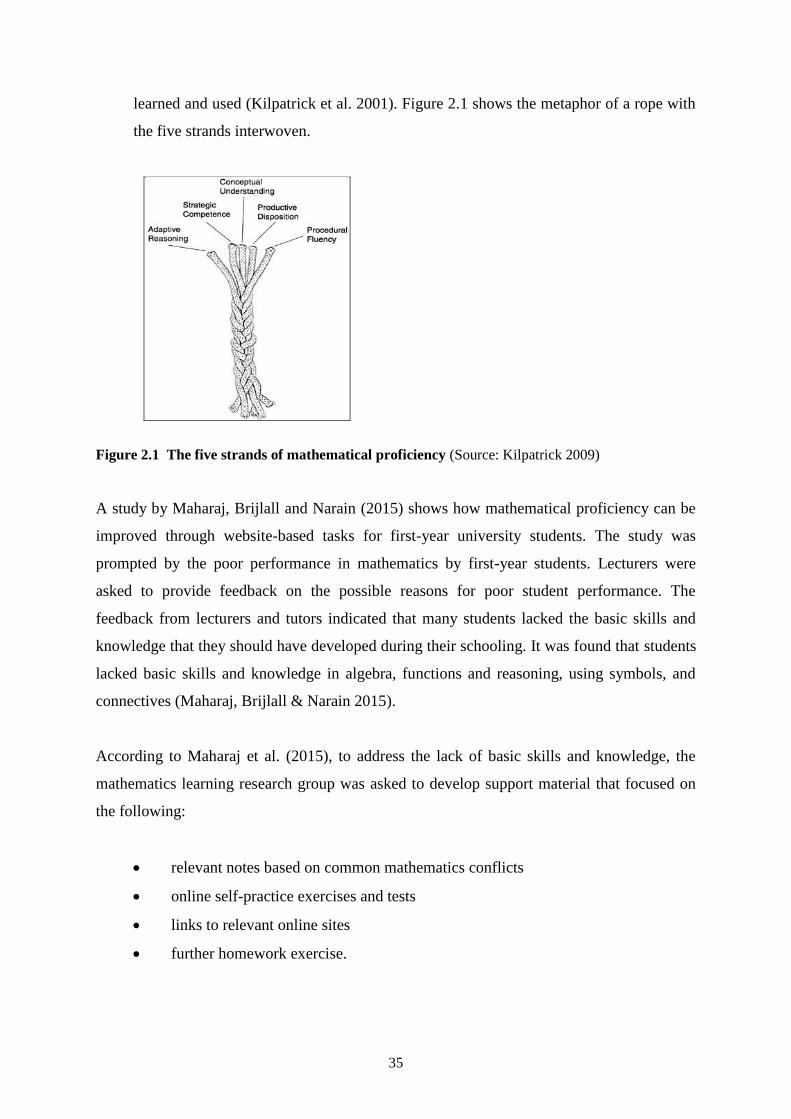
35
learned and used (Kilpatrick et al. 2001). Figure 2.1 shows the metaphor of a rope with
the five strands interwoven.
Figure 2.1 The five strands of mathematical proficiency (Source: Kilpatrick 2009)
A study by Maharaj, Brijlall and Narain (2015) shows how mathematical proficiency can be
improved through website-based tasks for first-year university students. The study was
prompted by the poor performance in mathematics by first-year students. Lecturers were
asked to provide feedback on the possible reasons for poor student performance. The
feedback from lecturers and tutors indicated that many students lacked the basic skills and
knowledge that they should have developed during their schooling. It was found that students
lacked basic skills and knowledge in algebra, functions and reasoning, using symbols, and
connectives (Maharaj, Brijlall & Narain 2015).
According to Maharaj et al. (2015), to address the lack of basic skills and knowledge, the
mathematics learning research group was asked to develop support material that focused on
the following:
relevant notes based on common mathematics conflicts
online self-practice exercises and tests
links to relevant online sites
further homework exercise.
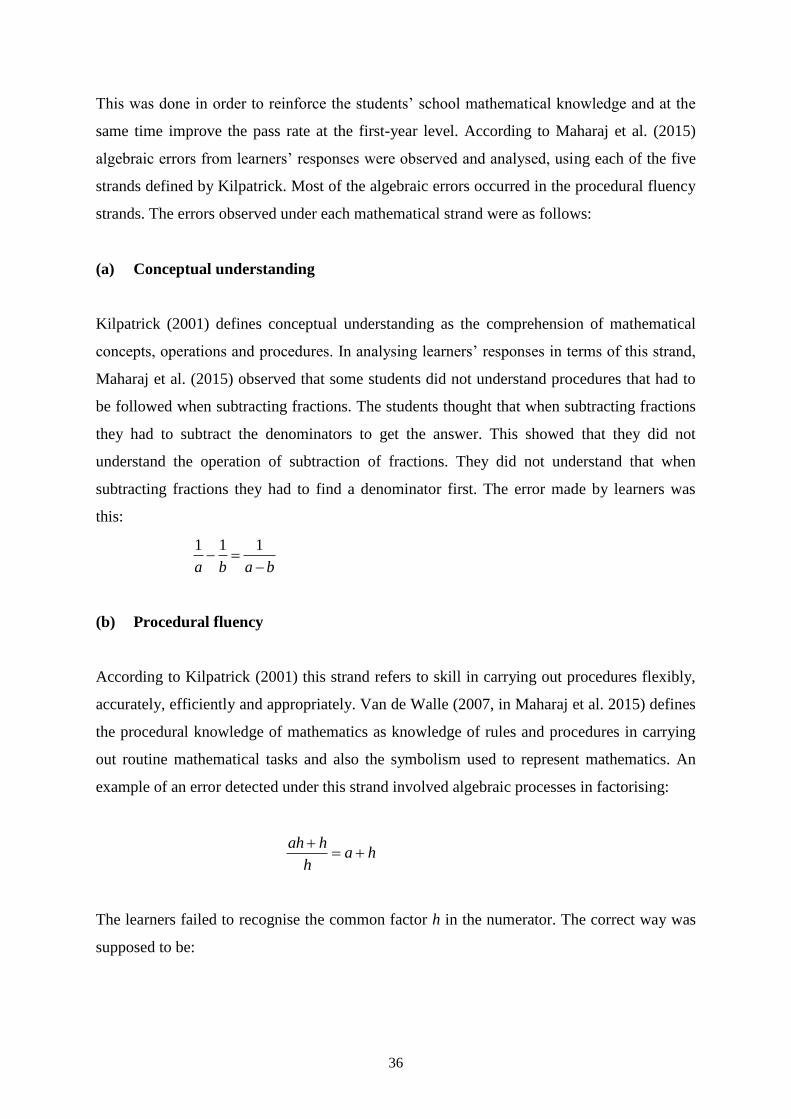
36
This was done in order to reinforce the students’ school mathematical knowledge and at the
same time improve the pass rate at the first-year level. According to Maharaj et al. (2015)
algebraic errors from learners’ responses were observed and analysed, using each of the five
strands defined by Kilpatrick. Most of the algebraic errors occurred in the procedural fluency
strands. The errors observed under each mathematical strand were as follows:
(a) Conceptual understanding
Kilpatrick (2001) defines conceptual understanding as the comprehension of mathematical
concepts, operations and procedures. In analysing learners’ responses in terms of this strand,
Maharaj et al. (2015) observed that some students did not understand procedures that had to
be followed when subtracting fractions. The students thought that when subtracting fractions
they had to subtract the denominators to get the answer. This showed that they did not
understand the operation of subtraction of fractions. They did not understand that when
subtracting fractions they had to find a denominator first. The error made by learners was
this:
baba
111
(b) Procedural fluency
According to Kilpatrick (2001) this strand refers to skill in carrying out procedures flexibly,
accurately, efficiently and appropriately. Van de Walle (2007, in Maharaj et al. 2015) defines
the procedural knowledge of mathematics as knowledge of rules and procedures in carrying
out routine mathematical tasks and also the symbolism used to represent mathematics. An
example of an error detected under this strand involved algebraic processes in factorising:
hah
hah
The learners failed to recognise the common factor h in the numerator. The correct way was
supposed to be:
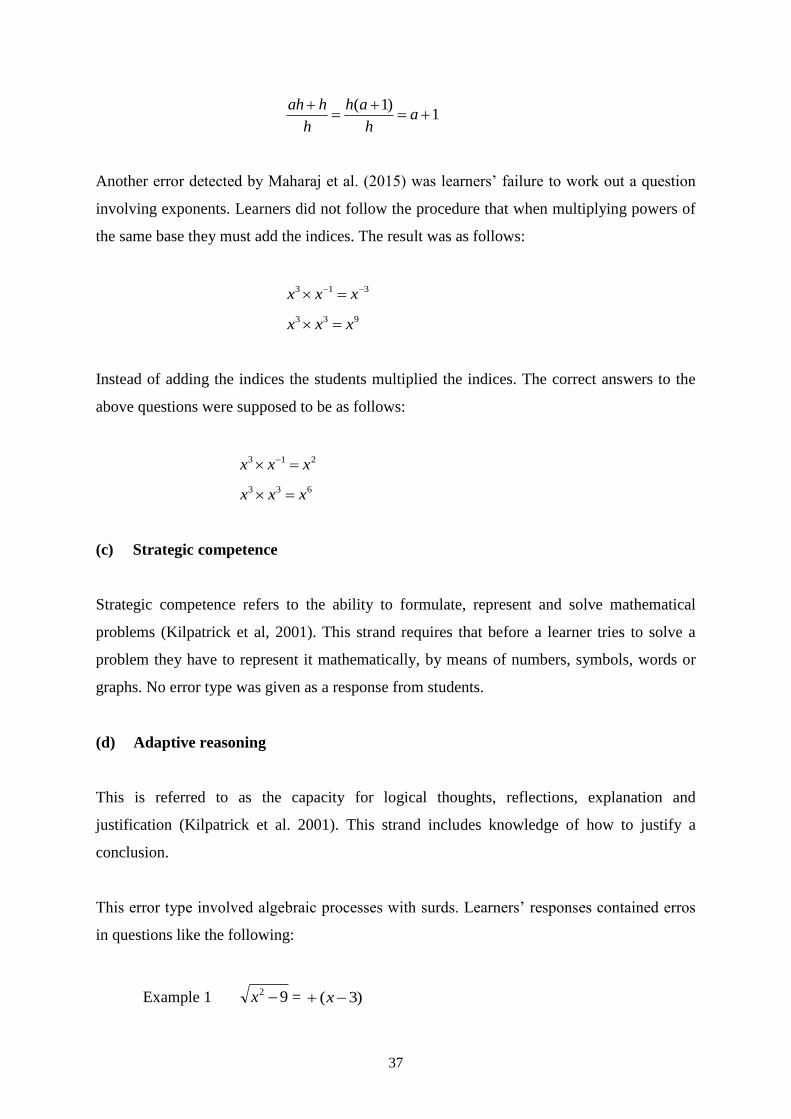
37
1)1(
ah
ah
h
hah
Another error detected by Maharaj et al. (2015) was learners’ failure to work out a question
involving exponents. Learners did not follow the procedure that when multiplying powers of
the same base they must add the indices. The result was as follows:
313 xxx
933 xxx
Instead of adding the indices the students multiplied the indices. The correct answers to the
above questions were supposed to be as follows:
213 xxx
633 xxx
(c) Strategic competence
Strategic competence refers to the ability to formulate, represent and solve mathematical
problems (Kilpatrick et al, 2001). This strand requires that before a learner tries to solve a
problem they have to represent it mathematically, by means of numbers, symbols, words or
graphs. No error type was given as a response from students.
(d) Adaptive reasoning
This is referred to as the capacity for logical thoughts, reflections, explanation and
justification (Kilpatrick et al. 2001). This strand includes knowledge of how to justify a
conclusion.
This error type involved algebraic processes with surds. Learners’ responses contained erros
in questions like the following:
Example 1 92 x = )3( x
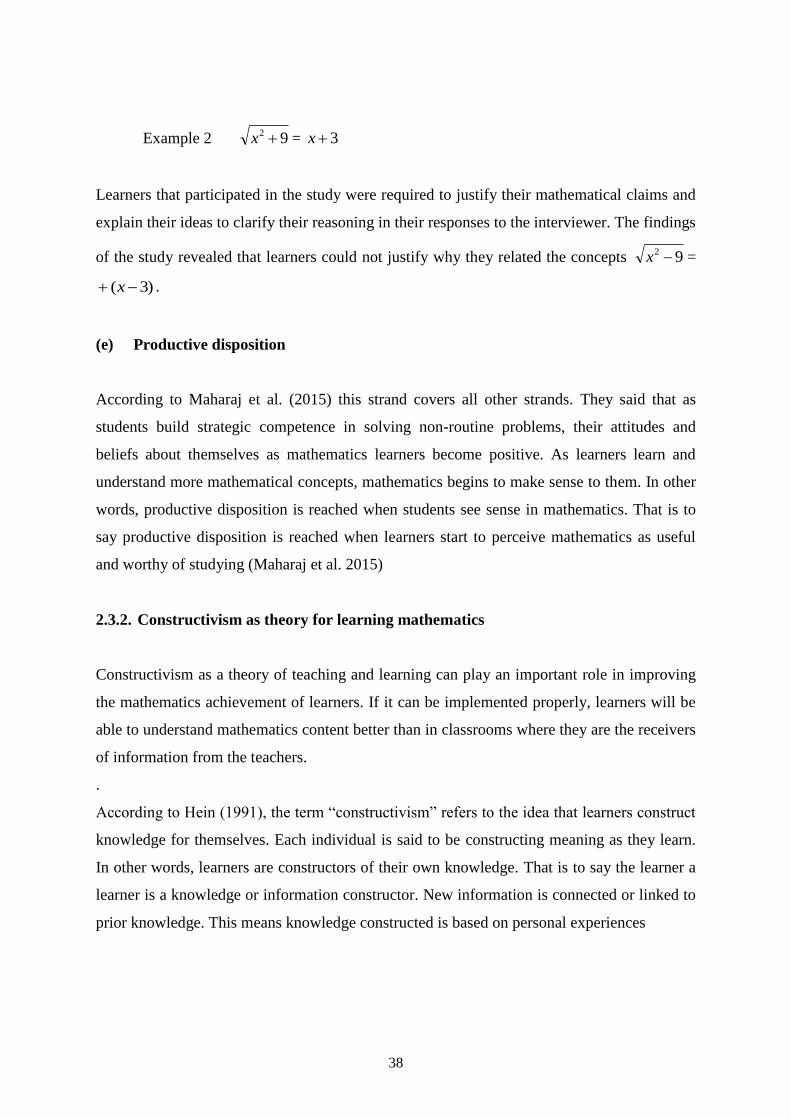
38
Example 2 92 x = 3x
Learners that participated in the study were required to justify their mathematical claims and
explain their ideas to clarify their reasoning in their responses to the interviewer. The findings
of the study revealed that learners could not justify why they related the concepts 92 x =
)3( x .
(e) Productive disposition
According to Maharaj et al. (2015) this strand covers all other strands. They said that as
students build strategic competence in solving non-routine problems, their attitudes and
beliefs about themselves as mathematics learners become positive. As learners learn and
understand more mathematical concepts, mathematics begins to make sense to them. In other
words, productive disposition is reached when students see sense in mathematics. That is to
say productive disposition is reached when learners start to perceive mathematics as useful
and worthy of studying (Maharaj et al. 2015)
2.3.2. Constructivism as theory for learning mathematics
Constructivism as a theory of teaching and learning can play an important role in improving
the mathematics achievement of learners. If it can be implemented properly, learners will be
able to understand mathematics content better than in classrooms where they are the receivers
of information from the teachers.
.
According to Hein (1991), the term “constructivism” refers to the idea that learners construct
knowledge for themselves. Each individual is said to be constructing meaning as they learn.
In other words, learners are constructors of their own knowledge. That is to say the learner a
learner is a knowledge or information constructor. New information is connected or linked to
prior knowledge. This means knowledge constructed is based on personal experiences
39
Hein (1991) suggested some of the guiding principles of constructivist thinking that can be
considered by teachers in their classrooms. These principles are:
Learning is an active process in which the learner uses sensory input and
constructs meaning out of it
People learn to learn as they learn: learning consists both of constructing meaning
and constructing systems of meaning.
The crucial action of constructing meaning is mental: it happens in the mind.
Physical actions, hands-on experience may be necessary for learning, especially for
children, but it is not sufficient; we need to provide activities which engage the mind
as well as the hands.
Learning involves language. The language we use influences learning. On the
empirical level, researchers have noted that people talk to themselves as they learn.
Learning is a social activity and therefore our learning is closely associated with our
connection with other human beings, our teachers, our peers, our family as well as
casual acquaintances, including the people before us or next to
Learning is contextual: we do not learn isolated facts and theories in some abstract
ethereal land of the mind separate from the rest of our lives: we learn in relationship
to what else we know, what we believe, our prejudices and our fears.
One needs knowledge to learn: it is not possible to assimilate new knowledge without
having some structure developed from previous knowledge to build on. The more we
know, the more we can learn. Therefore any effort to teach must be connected to the
state of the learner,
It takes time to learn: learning is not instantaneous. For significant learning we need
to revisit ideas, ponder them try them out, play with them and use them. If you reflect
40
on anything you have learned, you soon realise that it is the product of repeated
exposure and thought.
Motivation is a key component in learning. Not only is it the case that motivation
helps learning, it is essential for learning. This idea of motivation mentioned here
includes an understanding of ways in which the knowledge can be used. Unless we
know "the reasons why", we may not be very involved in using the knowledge that
may be instilled in us. even by the most severe and direct teaching
According to Gray [nd], constructivist teaching is based on a belief that learning takes place
when learners are actively involved in a process of meaning and knowledge construction
rather than passively receiving information. Because of its nature of involving learners
actively, constructivist learning is said to promote critical thinking and create motivated and
independent learners.
Although constructivism is regarded as having the potential of bringing about changes in
mathematics teaching, it has been criticised by some people. They say constructivism does
not provide a guideline on how mathematics should be taught, nor does it not stipulate a
particular model to be followed in teaching mathematics (Simon 1995).
Despite all criticisms directed at it, constructivism has yielded positive results in the teaching
and learning of mathematics. It is said to have provided mathematics teachers with useful
ways to understand learning and learners (Simon 1995). It is for this reason that
constructivism is mentioned in this study. It provides a useful framework for mathematics
learning in the classroom, thus contributing to the effort of reforming classroom mathematics
teaching.
According to Christie [nd] many approaches to teaching commonly used now are grounded in
and derived from constructivist epistemology. She mentions some of these approaches as
problem-based learning/problem-centred approach, generative learning, exploratory learning,
situated cognition and anchored instruction.
Some of these approaches are more relevant to the teaching of mathematics, for example
problem-based learning, sometimes referred as the problem-centred approach. Avenant
41
(1990) refers to the problem-centred approach as a problem-posing educational method. He
describes it as education in which teachers inspire their pupils to make learning meaningful
by the creation of motivating problem situations through which they discover relationships by
collecting data, as well as by reasoning, hypothesis stating, experimenting and the cognitive
processes of comparison, contrasting and classification, and consequently acquire new
knowledge. He further says that this approach is aimed at allowing pupils to investigate,
research and experiment with the aim of finding solutions to the problem.
Woolfolk (2007) defined constructivism as the view that emphasises the active role of the
learner in building understanding and making sense of information. She said there is no
single constructivist theory of learning but most psychologists agree on two Central Ideas:
1. Learners are active in constructing their own knowledge
2. Social interactions are important in this knowledge construction process
Woolfolk (2007) said that in the First Central Idea, psychological constructivists focus on
how individuals’ use information, resources, and even help from others to build and improve
their mental models and problem solving strategies. On the other hand, she said in the Second
Central Idea, social constructivists see learning as increasing our abilities to participate with
others in activities that are meaningful in their culture.
From the Second Central Idea, it can be concluded that this idea is in line with collaborative
learning. Laal and Laal (2012) referred to Collaborative Learning (CL) as an educational
approach to teaching and learning that involves groups of learners working together to solve a
problem, complete a task, or create a product. They said in collaborative learning learners
work in groups to solve a problem or complete a task. As they work together they listen to
different perspectives, and are required to communicate and defend their ideas. In so doing,
the learners begin to create their own unique conceptual frameworks and not rely solely on an
expert's or a text's framework. Srinivas (2011 in Laal and Laal 2012) said in a collaborative
setting, learners have the opportunity to have discussions with peers, present and defend their
ideas, exchange diverse beliefs, question other as they are actively engaged solving a problem
Constructivism, because of its problem-based approach, may be used to improve mathematics
results especially when one looks at the advantages or benefits of the problem-based
42
approach. Teach n’ Kids Learn (2015) lists the five reasons why students benefit from the
problem centred-approach. These benefits are the following:
(a) Enhanced content knowledge and deeper conceptual understanding. It is said
that learners’ mathematical understanding is intensified because when solving
problems, students are creating meaning versus fact collecting. These learners
are working with the mathematics and not procedures and algorithms.
(b) It fosters mathematical communication and keeps a constant flow of
dialogue between teacher and student. Learners’ mathematics vocabulary is
improved because while they are fully engaged in solving problems, discussing
their findings, answering teacher questions, they are communicating both in
writing and orally using mathematics vocabulary and concepts. No longer is
giving a final answer the only thing that needs to be communicated.
(c) Increased requirement of student ownership for the work. Learners are said to
take full responsibility for their own work.
(d) Increased retention and motivation. Students are afforded some freedom in
selecting a solution strategy rather than being forced into a procedure that
may not make sense to them. This results in increased motivation for many
students as well as greater levels of retention because there is meaning behind the
work for each student.
(e) Increase in the connections made between concepts and skills. Learners are
said to be in a position to use prior knowledge more quickly in a problem-centred
classroom. Students are able to more easily see and understand the connections
between multiple concepts and procedures.
43
2.3.3. Singapore Mathematics – The Mathematical Framework
Good performance by Singapore in the international study, Trends in Mathematics and
Science Study (TIMSS), has gained the country worldwide recognition. This good
performance has resulted in many countries, including the United States and Indonesia,
opting to use textbooks from Singapore.
The Singapore Mathematics Framework and the Model Method have played a major role in
the improvement of mathematics results (Sze 2009). However, in this study only the
Mathematical Framework is discussed.
Sze (2009) mentions that the Mathematical Framework (also known as Pentagon Framework)
was introduced in the 1990s. The framework puts more emphasis on the underlying principles
for an effective mathematics programme, stressing both the process and the product in
learning mathematics. It uses a mathematical problem-solving approach and involves the
application of mathematical concepts and skills, the developing of skills such as reasoning
and communicating, developing metacognition in problem solving and positive attitudes
towards learning mathematics.
The Framework is said to be applicable to all levels, from the primary to Advanced Level (A-
level). Teaching, learning and assessment are guided by the Framework (Ministry of
Education Singapore 2006). Figure 2.2 shows the principles followed or contained in the
programme.
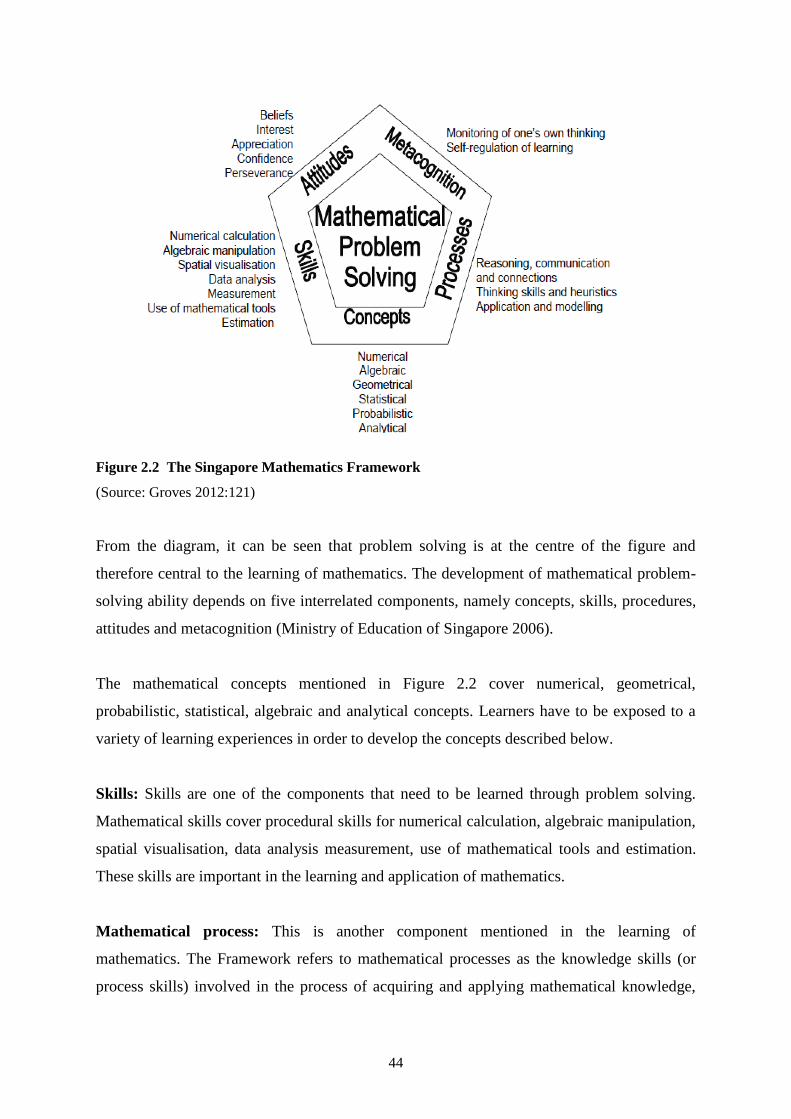
44
Figure 2.2 The Singapore Mathematics Framework
(Source: Groves 2012:121)
From the diagram, it can be seen that problem solving is at the centre of the figure and
therefore central to the learning of mathematics. The development of mathematical problem-
solving ability depends on five interrelated components, namely concepts, skills, procedures,
attitudes and metacognition (Ministry of Education of Singapore 2006).
The mathematical concepts mentioned in Figure 2.2 cover numerical, geometrical,
probabilistic, statistical, algebraic and analytical concepts. Learners have to be exposed to a
variety of learning experiences in order to develop the concepts described below.
Skills: Skills are one of the components that need to be learned through problem solving.
Mathematical skills cover procedural skills for numerical calculation, algebraic manipulation,
spatial visualisation, data analysis measurement, use of mathematical tools and estimation.
These skills are important in the learning and application of mathematics.
Mathematical process: This is another component mentioned in the learning of
mathematics. The Framework refers to mathematical processes as the knowledge skills (or
process skills) involved in the process of acquiring and applying mathematical knowledge,
45
reasoning communication, connections, thinking skills and heuristics, application and
modelling.
Attitudes: Learner attitude is said to be vital in the learning of mathematics. Attitudes
include beliefs about mathematics and its usefulness; interest and enjoyment in learning
mathematics; the appreciation of the beauty and power of mathematics; confidence in using
mathematics; and perseverance in solving problems. Making the learning of mathematics fun,
meaningful and relevant helps in developing positive attitudes to the subject.
Metacognition: This is another component that is essential in learning mathematics
according to Singapore Math. Metacognition or “thinking about thinking” is defined as the
awareness of and the ability to control one’s thinking processes, in particular the selection
and use of problem-solving strategies (Ministry of Education, Singapore 2006:5).
Metacognition is said to include:
Monitoring of one’s own thinking and self-regulation of learning
Exposing learners to problem solving and thinking skills
Encouraging learners to think aloud about their strategies and methods
Providing learners with problems that require planning and evaluation
Encouraging learners to seek alternative ways of solving the same problem and
allowing students to discuss how to solve a particular problem (Ministry of
Education, Singapore 2006).
Problem solving is placed at the centre of the Mathematical Framework. Being placed in the
middle of the Pentagon Model suggests that problem solving is central to the learning of
mathematics. Problem solving is important in understanding the section of calculus called
application or optimisation. Students have to understand the calculus question, represent the
information in the form of an expression or equation, and solve the problem. To be able to
solve these questions, learners have to be also competent in algebra and other topics.
The problem solving that is referred to here is not just the working on mathematics exercises
or activities following the routine procedures or methods explained to the learners by the
teacher. It rather refers to a situation where the teacher may group learners or have them work
in pairs. The teacher will then give them a problem to solve and watch them working, but
46
does not correct or guide them towards a solution. Once finished, the learners have to present
their solutions to the class, explaining all the steps and methods they have used in reaching
the solution. This approach then gives learners the opportunity to construct their own
strategies for solving problems.
2.3.4. The APOS theory
APOS is an acronym for Action – Process – Object – Schema. APOS theory is a framework
for research and curriculum development. Tziritas (2011) defines APOS theory as a
framework for instructional research in mathematics education. This theory appears within a
research framework that has to be conducted in three steps, namely:
Theoretical analysis of the content to be taught and learned
Design and implementation of instruction
Collection and analysis of data
According to Tziritas (2011) these steps are expected to be repeated until satisfactory results
regarding students’ learning and understanding of the content are obtained. The repetition of
steps makes the research process to be cyclical. The continuous analysis of data leads to the
collection of more data or to a redesign of the instructional methods (Tziritas 2011).
Dubinsky and McDonald (2002) explain that the APOS theory begins with the hypothesis
that mathematical knowledge consists in an individual’s tendency to deal with perceived
mathematical problem situations by constructing mental actions, processes and objects and
organising them in schemas to make sense of the situations and solve the problems.
Dubinsky and McDonald (2002) also define the components of APOS theory as follows:
Actions: It is a transformation of objects perceived by the individual as essentially
external and as requiring either explicating or from memory, step-by-step instructions
on how to perform the operation.
47
Process: This is when an action is repeated and the individual reflects upon it so that
they can think of performing the same kind of action, but no longer with the need of
external stimuli.
An object: This is described as what is formed from a process. An individual becomes
aware of the process as a totality and realises that transformations can act on it.
A schema: This is an individual’s collections of actions, processes, objects and other
schemas, which are linked by some general principles to form a framework in the
individual’s mind that may be brought to bear upon problem situations involving
related concepts.
Dubinsky, Asiala, Schwingendorf and Cotrill (1997) said formation of concepts first takes
place as an activity, followed by the process then an object and lastly as a schema. Dubinsky
et al (1997) declared or proclaimed that when learners learn a concept it first happens as an
external activity to which a learner may make little meaning. In the next stage the process
stage, the student perceives the concept as a process which is then encapsulated into objects,
at this stage a candidate now perceives the concepts as an object internalised in his or her
mind. Lastly the object is linked or embodied in the learners’ schema.
In simpler terms, the APOS theory says for the individual to develop a mathematical concept,
he/she must start by using previously constructed mental or physical objects to form actions.
Actions are then interiorised (incorporated within oneself) to form processes which are then
encapsulated (summarised or condensed) to form objects. Objects are then redirected or
decapsulated back to process. Finally, action, process and objects are then organised to form
schemas to apply and solve problems,
According to Dubinsky and McDonald (2000) APOS theory can be used directly in the
analysis of data by a researcher. It is said that a researcher can compare the successes or
failures of students in mathematical tasks with the specific mental constructions they may or
may not have made. The example given is that if two learners who agree in their performance
up to a very specific mathematical point and then one of students takes a further step while
the other cannot, the researcher can explain the differences by pointing to the mental
48
constructions of actions, process, objects and/or schemas that the former learner appears to
have made but the other has not.
Maharaj (2010) points out that in South Africa Grade 12 learners are exposed to an intuitive
understanding of the limit of functions. This is said to occur in the context of the evaluation
of limits of functions when finding derivatives from first principles of basic functions of the
types: 2)(,)(,)( xxfxxfbxf and
xxf
1)( . Learners have to calculate the limit of a
function as x approaches a, However, learners take this as the same as the value of the
function at a. They proceed to find the corresponding function value even when the limit or
the function value does not exist. Maharaj says that this is a clear indication that there is a
need to engage with a study on students’ understanding of the concept of a limit of a function
(Maharaj 2010).
In the study by Maharaj, 868 students were first given tutorials and three weeks later a test
was administered to those students. The questions set were similar to those for the activities
done as homework. The findings of the study confirmed that the concept of limit was one that
students found difficult to understand, and suggested that many students did not have the
appropriate mental structures at the process, object and schema levels (Maharaj 2010).
APOS theory was also used by Ndlovu and Brijlall (2015) in the research in undergraduate
mathematics education. The study was carried out using the assumption that understanding
the mental constructions that the pre-service teachers make when learning matrix algebra
concepts, leads to improved instructional methods (Ndlovu & Brijlall 2015).
Ndlovu and Brijlall (2015) explain that they used APOS theory in their study to describe and
analyse pre-service teachers’ knowledge constructed of matrix algebra concepts. They say
that the APOS theory was used to reveal the nature of the students’ mental constructions, not
to compare students’ performance in matrix algebra concepts. They give examples that
illustrate each of the mental constructions mentioned earlier.
(a) Action: Ndlovu and Brijlall (2015) say an example of this mental construction
could be when students are asked to state the order of a given matrix. The word
49
order should provide a stimulus and trigger the manipulations the individual needs
to engage with.
(b) Process: A process is illustrated when a student is asked to find a determinant of a
matrix. An individual will have to apply their thoughts on the procedure learned in
the minors and cofactors.
(c) Object: At this stage an individual can see the product of two matrices, AB as a
single entity and can make a comparison between AB and BA, if they are defined.
At this stage students are expected to explain whether the product is defined or
not.
(d) Schema: In this stage an individual is expected to bring together various mental
constructions and other schemas to address this task. An individual will need to
have in place a determinant schema, a transpose schema and also a schema for
basic algebra. The basic algebra schema includes the process conceptions of
operations involving real numbers (Ndlovu & Brijlall 2015).
2.4 FACTORS THAT MAY BE RESPONSIBLE FOR POOR PERFORMANCE IN
MATHEMATICS
It has become a trend in South Africa that the former Model C schools obtain good results in
matric (Grade 12) when compared with many black schools. These former white schools
usually obtain good results or symbols in all subjects, including mathematics. There are fewer
Model C schools than black schools. This means very few learners achieve good results in
mathematics because large numbers of learners are found in black schools.
Poor performance in mathematics is said to be caused by many factors. The causes of poor
performance differ from one school to the other, one district to the other, one province to the
other. No single reason may be said to be the cause of poor performance in mathematics.
Various reasons have been given by different authors. Van der Walt, Maree and Ellis (2008)
said
50
the reasons include the poor socio-economic background of learners (little
incentive to study at home), lack of appropriate learner support materials,
general poverty of school environment, general poor quality of teachers
(including poor motivation), language of instruction (often not the same as
learners’ mother tongue), and often inadequate study orientation (p 491).
Reddy 2004 (cited in Siyepu 2013) points out that there is no single cause of South Africa’s
poor and diverse performance. According to Reddy poor performance could be linked to
issues such as poverty, resources and infrastructure of schools, low teacher qualification, poor
culture of learning in schools and language proficiency (Siyepu 2013).
Reddy, Van der Berg, Janse van Rensburg and Taylor (2012) conducted a study in which
they compared the performance of Grade 8 learners who participated in the 2002 TIMSS and
who were later tracked to compare their performance in mathematics in Grade 12. They
examined the relationship between TIMSS mathematics performance and reaching Grade 12,
the subject choice selection of and performance in Grade 12 mathematics, and success rates
in the matriculation examination.
Because the South African school system is made of two historically different subsystems,
Reddy et al. (2012) categorised the schools into two categories, namely schools serving the
middle-class (Subsystem M) and those serving poorer students (Subsystem P, the majority).
Subsystem P schools, which are the majority (80%), refer to schools which historically
served black African students in South Africa during the apartheid era. The subsystem P
schools were provided with the fewest resources and are said to still bear the scars of that
legacy; these schools are located in areas occupied by low-income households. They cater for
a majority of students for whom the language of instruction (English) is their second or third
language (Reddy et al. 2012).
On the other hand, schools which were categorised as subsystem M schools were historically
attended by white students. Reddy et al. (2012) said these schools were better resourced
under apartheid, are generally located in higher-income areas, and the majority of their
students study in English as their first language. They constitute about 14% of the schools in
the country.
51
Lam, Ardington and Leibbrandt (2011, in Reddy et al. 2012) found that grade progression in
the schools typically attended by black students was poorly linked to actual ability and
learning. Further analysis of the results indicated that literacy and numeracy scores strongly
predicted grade progression between Grade 8 and 11 for white schools but weakly predicted
progression for black students. Lam et al. (in Reddy et al. 2012) found that 84% of white
students who were in Grades 8 and 9 in 2002 had successfully advanced three grades by 2005
compared with only 32% of black African students (Reddy et al. 2012).
The study collected mathematics and science achievement data from 8 952 Grade 8 students
in the country and created a record of the name, date of birth and school attended in 2002 for
each student that participated in the study. The Department of Education allowed access to
the matriculation 2006 and 2007 databases. Learners’ performance in Grade 12 (matric) was
compared to the 2002 TIMSS performance. The results showed that the progression rate from
Grade 8 to Grade 12 was approximately 57%.
The study also found that in subsystem M schools, Grade 8 mathematics scores were a good
indicator of who would pass Grade 12, while this relationship was not as strong in
subsystem P schools. The study also revealed that there was a stronger association between
TIMSS Grade 8 scores and subject choice of matric mathematics in subsystem M schools
than in subsystem P schools. There was a strong correlation between Grade 8 mathematics
performance and Grade 12 mathematics achievement.
The contribution made by this study to mathematics education was the revelation that
mathematics performance in the earlier years predicted later mathematics performance. This
means learners’ achievement in mathematics while in the lower grades will determine their
achievement in Grade 12. This may lead to the assumption that if we want to improve
learners’ achievement in mathematics in Grade 12, more focus must be directed to the
improvement of learners’ performance in the lower grades. There is a need to intensify
teaching and learning in the General Education and Training Band (Foundation, Intermediate
and Senior phases). A proper foundation has to be laid earlier so that by the time they reach
Grade 12 they have acquired all the necessary skills and knowledge necessary to do and
succeed in mathematics.
52
Some of the causes of poor performance in mathematics are general and are what we see
daily in our classrooms but we do not take any serious measures to stop them. According to
Harris (2015) problems that lead to students failing mathematics are the following:
1. Not seeking help: A number of children fail to ask for help when they need it.
According to Harris (2015) primary and secondary school teachers ought to
identify struggling students and employ intervention strategies such as requiring
these learners to attend extra classes or calling the parents; however, in reality this
does not happen.
2. Lack of practice: Lack of practice from the learners’ side by doing assignments
or homework is another cause of failing mathematics. Harris (2015) says by
observing the teacher demonstrating, learners often think they understand how to
solve a problem. Learners have to gain experience by completing assignments,
classwork or homework, and even work through extra practice problems in order
to be successful in mathematics.
3. Insufficient prior knowledge: Mathematics is a subject that builds upon
previously learnt concepts. This means it is important for students to have prior
knowledge before beginning to learn a new mathematics topic. Harris (2015)
makes an analogy by saying you can’t run a marathon if you can’t complete a 5-
km race. Many students struggle with algebra because they lack the basic
mathematics skills required to perform algebraic operations.
4. Not asking questions: Harris (2015) says most of the time students in a
mathematics class keep quiet when they don’t understand the information
presented by the teacher. They feel intimidated to raise their hands and ask
questions as this may expose their confusion to the whole class.
5. Difficulty paying attention: It is said that learners have to be more attentive
during the learning of mathematics. Harris (2015) points out that mathematics
requires a tremendous amount of attention, especially when complex, multistep
procedures are being explored. Unfortunately, many students may have easily
detectable attention disorder such as attention-deficit hyperactivity disorder
53
(ADHD), but struggle to remain attentive during maths lessons. Such learners
may miss crucial steps in the problem-solving process, resulting in trouble when
attempting to solve problems on their own.
In a study by Umameh in Nigeria in 2011 regarding the factors responsible for students’ poor
performance in mathematics in selected secondary schools, it was found that factors such as
students’ attitude and commitment, methods of teaching mathematics, use of instructional
materials and the school environment were the influential factors in the students’
performance in mathematics. From the results of the study, the researcher suggested that
there was a need for teachers to develop positive relations with the students, and make use of
classroom activities that promote an active teaching-learning process and students’
participation (Umameh 2011).
Syllabus or content coverage also has an impact on learners’ performance in mathematics. By
not completing the syllabus or work schedule, learners have a limited exposure to a variety of
topics. For example, if learners in Grade 12 in a South African classroom were not taught
counting and probability (which is the last topic in a Grade 12 pacesetter), they are likely to
perform poorly in the topic.
A study by Mosasia, Nakhanu and Wekesa (2012) in Kenya secondary schools revealed that
students who covered the mathematics syllabus had a better mean score than those who failed
to cover the syllabus. It was also found that learners who finished the syllabus early in the
year and spent more time on revision, had an even better mean score than those who covered
the syllabus just before the beginning of the Kenya National Examinations Council (KCSE)
examinations (Mosasia et al. 2012).
From the preceding paragraph one can deduce that subject heads, deputy principals,
principals and subject advisers have to monitor the coverage of the pacesetter. They have to
make sure that all sections/topics have been covered so that learners will be in a position to
attempt all questions in the examination. The monitoring should not be focussed on Grade 12
only, but also on the other lower grades. Learners who were not helped to finish the stipulated
content or syllabuses of the lower grades will suffer a content gap when they have to answer
the Grade 12 final examination questions.
54
Because of the limited scope of this study, not all factors suggested are discussed, but the
researcher found it necessary to discuss in more detail the effect of learners’ attitude,
textbooks and technology on the learning of mathematics.
2.4.1. Learners’ attitude
Learners have a direct influence on the learning of mathematics through their attitudes
towards the subject. Generally, if learners have a love for the subject they try to put more
effort into learning it. Several studies have been cited in this section in order to determine
whether learners’ attitude has an impact or not on the learning of mathematics and eventually
on their achievement.
In the discussion of the Mathematics Framework of Singapore, it was seen that attitude was
one of the five components that assist in the development of mathematical ability. A positive
attitude towards mathematics is said to lead to positive achievement. Students’ attitudes
towards mathematics are influenced or shaped by their learning experiences. Positive
attitudes are built by the creation of learning situations that are fun, meaningful and relevant
(Ministry of Education, Singapore 2006).
In the Mathematical Framework of Singapore, the term “attitude” refers to the affective
aspects of mathematical learning such as beliefs about mathematics and its usefulness,
interest in learning mathematics, appreciation of the beauty and power of mathematics,
confidence in using mathematics and perseverance in solving problems (Ministry of
Education, Singapore, 2006).
Several studies have been conducted to determine whether there is a relationship between
learners’ attitude towards mathematics and their academic achievements. A study conducted
in Portugal among Grade 5 to 12 learners showed that a strong relationship between
motivation and support, which are variables related to attitudes (Mata, Monteiro & Peixoto
2012). When studying attitude, it is essential to consider the variables such as competence
support, autonomy support, expectations and feedback (Mata, Monteiro & Peixoto 2012).
In her article titled “Deconstructing maths anxiety: Helping students to develop a positive
attitude towards learning maths”, Sarah Buckley mentions that research in education has
55
shown that anxiety can lead to a drop in mathematics performance. A high level of
mathematics anxiety can affect an individual’s use of working memory (the memory that
helps to keep information in our head). The long-term impact of mathematics anxiety is said
to result in the development of negative attitudes towards the subject. In the end, learners
with the mathematics anxiety will avoid doing mathematics and pursuing careers that involve
mathematics (Buckley [nd]).
A study by Benjamin Schenkel investigated how students’ and teachers’ attitudes affected the
mathematics performance of the students in the classroom. The responses of the students
indicated that learners were able to do better in mathematics as long as the teachers made
mathematics fun, involved students fully in the lesson, helped help them at their ability levels
and moved with them at their own pace (Schenkel 2009). The study revealed that there was a
positive correlation between students’ attitudes towards mathematics and their success.
A study by Mensah, Okyere and Kuranchie (2013) tried to determine the relationship
between students’ attitude towards mathematics and their performance in the subject. The
samples for the study were 100 students and four mathematics teachers, making a total of
104. The students were randomly selected while the teachers were purposively sampled
respondents. The results of the study established a positive and significant correlation
between teacher attitude and student attitude. The researchers found that when teachers
positively conditioned students towards mathematics, students would have a positive
predisposition for the subject. Again it was found that when teachers demonstrated positive
behaviour and gave good utterances about mathematics, students would imitate that
behaviour and hence develop a positive attitude to the study of mathematics (Mensah, Okyere
& Kuranchie 2013).
Although the study by Mensah et al. (2013) showed that the attitude of teachers did indeed
influence students’ attitude, the study failed to establish a significant link between teacher
attitude and student performance. According to the researchers this could be due to the fact
that the students’ performance depends on a combination of factors rather than just the
attitude of the teacher. Hence, even though the teacher’s attitude does have an influence on
student outcome, it is not the only factor (Mensah, Okyere & Kuranchie 2013).
2.4.2. Textbooks
56
The mathematics textbook is one of the most important resources for the teaching and
learning of mathematics in our schools. In some schools, a textbook is the only resource that
is available to teachers and students. Therefore, the textbook is another factor that can be
considered to have an influence on learners’ performance.
Siyepu (2013) points out that there are complaints about the inappropriateness of textbooks in
the field of mathematics and science in South Africa. Some textbooks have been blamed for
having few learners’ activities while others have been criticised for having lower-order skills,
such as recall, as opposed to higher order skills, like problem solving.
According to Siyepu (2013) many South African textbooks do not give learners opportunities
to make inferences, conjectures and generalisation to understand the strategies used to derive
the formula. In this case, textbooks have been blamed for what is termed the “cookbook”
approach, where formulae are supplied to the learners without their having to derive them
(Siyepu 2013).
In a study carried in high schools in Ghana (Brew 2011) it was found that textbooks had an
effect on learners’ performance, especially where the textbook was the only resource
available. Learners that participated in the study believed that textbooks could help them to
perform much better in mathematics. Having learners with such a perception means that
schools have to be equipped with textbooks that contain activities that will help them to
develop the necessary skills to perform well in mathematics (Brew 2011).
Textbooks are the most commonly used resource in teaching and learning in our schools.
Many teachers, including mathematics teachers, rely heavily on textbooks in their daily
classroom activities. Their dependence on textbooks has caused some teachers to use the
textbook as their teaching plan instead of regarding it as supporting material. Some teachers
have the tendency of following the textbooks page by page. Such cases make it clear that
textbooks have a direct impact on learners’ achievement. This is because a book that has
good activities, arranged in sequence that shows developmental growth, will help learners’
conceptual development as compared to a book with poor exercises or activities of lower
quality.
57
A study by Rezat (2009) has revealed that the mathematics textbook is one of the most
important resources for teaching mathematics. The results of the study have shown that
students use the mathematics textbooks not only when they are told to by their teacher, but
also of their own accord (Rezat 2009).
The study has also shown that learning mathematics with mathematics textbooks can be
categorised into four activities: (1) solving tasks and problems, (2) consolidation, (3)
acquiring mathematical knowledge, and (4) activities associated with an interest in
mathematics. Solving tasks and problems in this case is associated with activities where
students utilise their mathematical textbooks in order to get assistance with solving tasks and
problems. The study also observed that in order to get assistance with solving tasks and
problems, students searched for a heading in the book and then started reading from there
until they found useful information related to a subject at the beginning of a lesson in the
textbook (Rezat 2009).
Consolidation in the study by Rezat (2009) refers to all activities that students perform in
order to improve their mathematical abilities related to subject matter that has already been
dealt with in the mathematical class. To do consolidation, learners use textbooks to learn
rules, recapture teacher-selected tasks and solve tasks that were similar to the tasks selected
by the teachers (Rezat 2009).
The acquisition of knowledge was associated with activities where students used part of the
textbook that had not been discussed in the classroom. The learners were seen using parts
from the proximate lesson in the textbook. This was apparently caused by the belief that the
chronological succession of topics in mathematics would follow the order of the textbook
(Rezat 2009).
It was found that students used parts of their textbook because they thought these were
interesting. The utilisation of these parts was associated with activities related to an interest in
mathematics. Students either looked at the images or read passages that were next to images
or other prominent or noticeable elements (Rezat 2009). From this study it can be seen that
textbooks also play an important role in the learning of mathematics.
58
In South Africa schools choose textbooks on their own from the list or catalogue provided by
the Department of Basic Education. Sometimes teachers have to choose from the list without
having seen a copy of the textbook itself. When the actual copies arrive teachers will detect
the shortcomings of those particular textbooks. However, some publishers send sample
copies to the schools before orders are placed. This helps teachers to order a textbook they
have already seen.
2.4.3. Technology
The learning of mathematics can be challenging, especially in topics like functions, geometry
and calculus. However, with the use of technology the teaching and learning of these topics
can be enhanced. Learning calculus can be challenging as it involves abstract concepts. With
the use of traditional resources, such as textbooks and chalkboard, students’ achievement in
mathematics, particularly in calculus, remains a challenge. The introduction of technology in
the teaching and learning of mathematics is expected to bring about positive results.
Research by Zachariades and Gordon (2004), and Pamfilos, Christou, Maleev and Jones
(2007) (in Parrot & Kwan Eu 2014) has shown that the teaching and learning of calculus can
be challenging as it involves abstract and complex ideas. These researchers suggest that
learners are facing challenges in learning the key concepts of calculus. Gordon (2004) (in
Parrot & Kwan 2014) point out that in the traditional calculus classes the emphasis is on
computational procedures without understanding the concepts.
An extract titled “Calculus: Crisis Looms in Mathematics’ Future” (Science 1988), also
reveals that there are challenges in the teaching and learning of calculus. The researchers felt
that there was a need of calculus reforms. Such reforms were to consider the teaching of
calculus, when to do it, and even why to do it.
The concern of the researchers was that many students entered college or university with a
poor or weak background in calculus, algebra, geometry and trigonometry; consequently the
learners continued to perform poorly in calculus even at higher institutions of learning
(Science 1988).
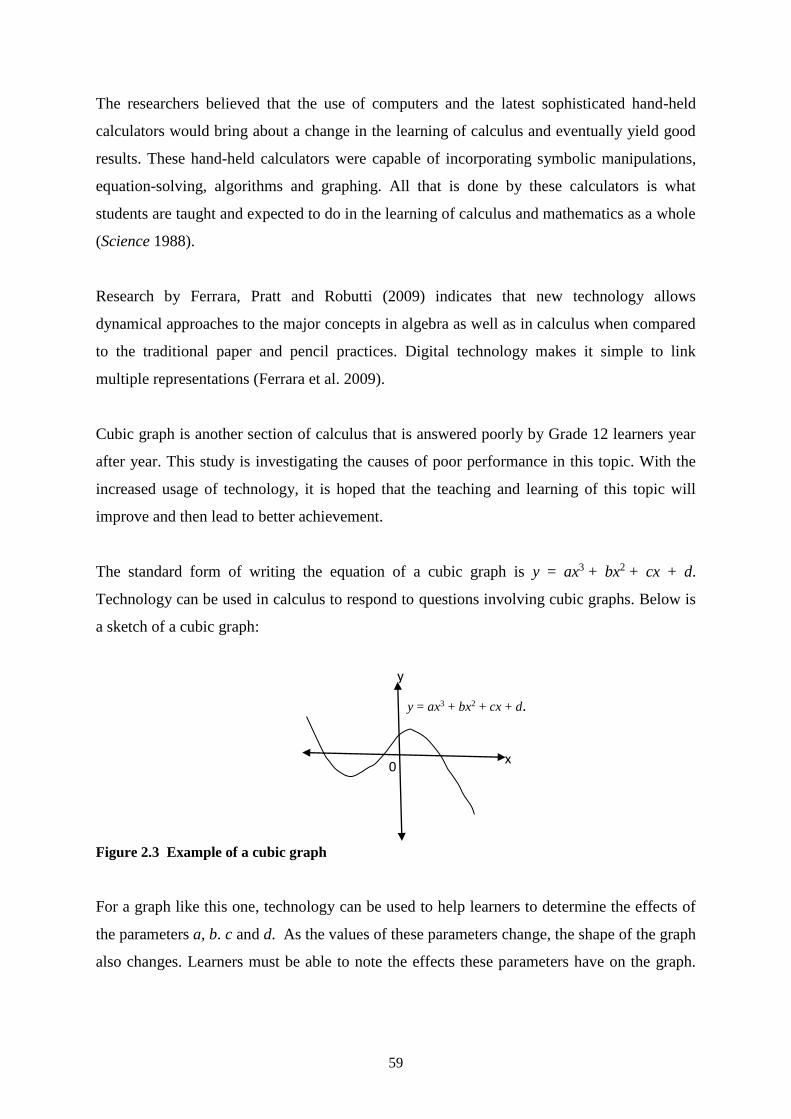
59
The researchers believed that the use of computers and the latest sophisticated hand-held
calculators would bring about a change in the learning of calculus and eventually yield good
results. These hand-held calculators were capable of incorporating symbolic manipulations,
equation-solving, algorithms and graphing. All that is done by these calculators is what
students are taught and expected to do in the learning of calculus and mathematics as a whole
(Science 1988).
Research by Ferrara, Pratt and Robutti (2009) indicates that new technology allows
dynamical approaches to the major concepts in algebra as well as in calculus when compared
to the traditional paper and pencil practices. Digital technology makes it simple to link
multiple representations (Ferrara et al. 2009).
Cubic graph is another section of calculus that is answered poorly by Grade 12 learners year
after year. This study is investigating the causes of poor performance in this topic. With the
increased usage of technology, it is hoped that the teaching and learning of this topic will
improve and then lead to better achievement.
The standard form of writing the equation of a cubic graph is y = ax3 + bx2 + cx + d.
Technology can be used in calculus to respond to questions involving cubic graphs. Below is
a sketch of a cubic graph:
Figure 2.3 Example of a cubic graph
For a graph like this one, technology can be used to help learners to determine the effects of
the parameters a, b. c and d. As the values of these parameters change, the shape of the graph
also changes. Learners must be able to note the effects these parameters have on the graph.
y = ax3 + bx2 + cx + d.
y
x 0
60
Software that can be used in displaying the effect of parameters such as a, b, c and d can be
bought online while others can be downloaded free from search engines like Google.
With such a software, a teacher can let students investigate on their own what happens when
each of these parameters becomes greater or less than zero. It is worth mentioning that if
a > 0, the right arm goes up, and if a < 0, the right arm goes down. Also, learners must be
able to tell that d is a y-intercept. In learning cubic functions using technology, learners need
not to be told what the effects of each parameter will be, but will find this by experimenting
with different values for each parameter. The teacher can only help them by consolidating or
making a summary of the effect of the parameters at the end of a lesson.
With the use of such software, learners will be able to observe that if a, b, c and d are all set
to zero, the graph of the equation of the graph turns to y = 0x3+0x2+0x+0. This simplifies to
be y = 0. Its graph is therefore a horizontal straight line through the origin.
2.5 CALCULUS
Davidson [nd] notes that arithmetic and geometry are the two oldest branches of
mathematics, having originated in ancient times. However, the ancient mathematicians
attempted to do algebra in those days but lacked the language of algebra, namely the
symbols. According to Davidson, the symbols we used today were developed by Hindu and
Arab people.
The major breakthrough in mathematics came when the French philosopher, mathematician
and scientist René Descartes realised that he could describe position on a plane using a pair of
numbers associated with a horizontal axis and a vertical axis. Describing, say, the horizontal
measurement with x’s and the vertical measurement with y’s, enabled Descartes to give
geometric objects such as lines and circles representation as algebraic equations. Descartes is
said to have united the analytical power of algebra with the descriptive power of geometry
into a branch of mathematics he called analytic geometry (Davidson [nd]).
Davidson describes the next major breakthrough in mathematics as the discovery (or
creation) of calculus around the 1670s. Sir Isaac Newton of England and a German, Gottfried
Wilhelm Leibnitz, deserve equal credit for independently coming up with calculus. However,
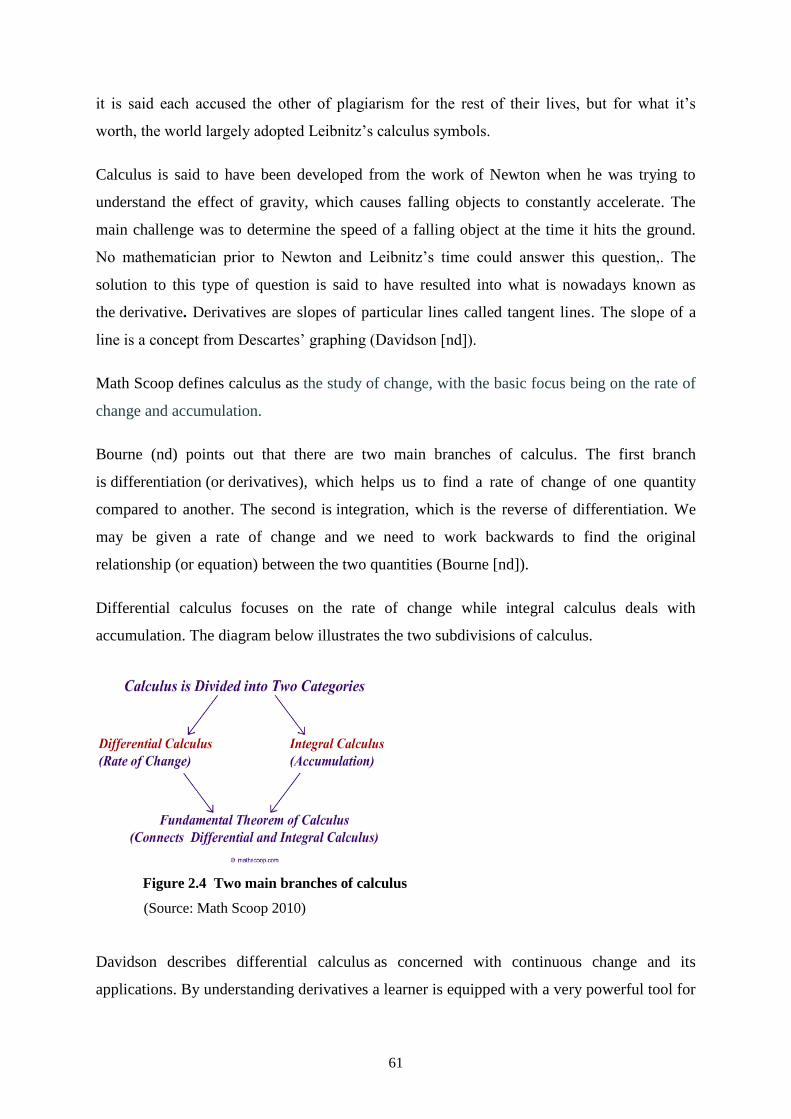
61
it is said each accused the other of plagiarism for the rest of their lives, but for what it’s
worth, the world largely adopted Leibnitz’s calculus symbols.
Calculus is said to have been developed from the work of Newton when he was trying to
understand the effect of gravity, which causes falling objects to constantly accelerate. The
main challenge was to determine the speed of a falling object at the time it hits the ground.
No mathematician prior to Newton and Leibnitz’s time could answer this question,. The
solution to this type of question is said to have resulted into what is nowadays known as
the derivative. Derivatives are slopes of particular lines called tangent lines. The slope of a
line is a concept from Descartes’ graphing (Davidson [nd]).
Math Scoop defines calculus as the study of change, with the basic focus being on the rate of
change and accumulation.
Bourne (nd) points out that there are two main branches of calculus. The first branch
is differentiation (or derivatives), which helps us to find a rate of change of one quantity
compared to another. The second is integration, which is the reverse of differentiation. We
may be given a rate of change and we need to work backwards to find the original
relationship (or equation) between the two quantities (Bourne [nd]).
Differential calculus focuses on the rate of change while integral calculus deals with
accumulation. The diagram below illustrates the two subdivisions of calculus.
Figure 2.4 Two main branches of calculus
(Source: Math Scoop 2010)
Davidson describes differential calculus as concerned with continuous change and its
applications. By understanding derivatives a learner is equipped with a very powerful tool for
62
understanding the behaviour of mathematical functions. Most importantly, this will enable
the learner to optimise functions, which means to find their maximum or minimum values, as
well as to determine other valuable qualities describing functions. In real life, differential
calculus is used in many applications, for example maximising profit, minimising stress,
maximising efficiency, minimising cost, finding the point of diminishing returns, and
determining velocity and acceleration.
The other branch of calculus, according to Davidson, is integral calculus. Integration is a
process which, simplistically, resembles the reverse of differentiation. Integration is used in
finding the area of any planar geometric shape or the volume of any geometric solid
(Davidson [nd]).
Since this study explored the causes of poor performance by Grade 12 learners in tasks
involving differential calculus, more attention was paid to differential calculus than integral
calculus. Although calculus in South Africa is taught in Grade 12, most of the skills and
knowledge needed to solve problems on differential calculus and its application are taught in
the preceding grades. Prior knowledge required to master and succeed in calculus is a good
background of algebra, analytical geometry and measurement.
Algebra skills and knowledge required in calculus include the manipulation of algebraic
expressions by adding, subtracting, multiplying and dividing expressions. Learners should
also know how to apply the laws of exponents, solve linear and quadratic equations and
inequalities, factorise and simplify expressions, and find the roots of a function.
A background of analytical geometry is essential in the study of calculus, especially when
dealing with graphs, including cubic graphs. This is because in analytical geometry learners
learn about the plotting of graphs, sketching graphs showing only important points, and
finding the equations of lines.
Another key topic essential in learning calculus is measurement. At present this topic is
taught in Grade 10 and revised in Grade 11. In measurement students learn about the volume
and surface area of right prisms and cylinders. Most of the time problems on the application
of calculus may ask learners to find the dimension (height, length or width) that will give the
maximum or minimum value of either volume or surface area. The problem below is an
example learners may be asked to solve in the application of differential calculus.
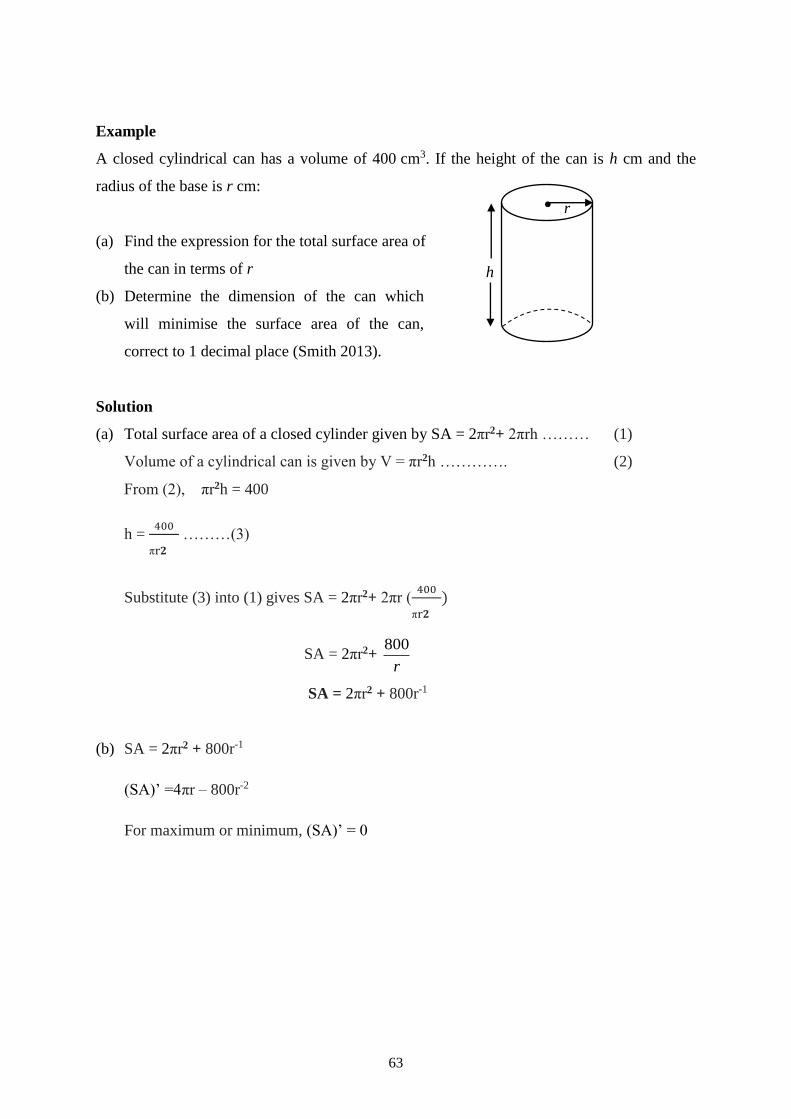
63
Example
A closed cylindrical can has a volume of 400 cm3. If the height of the can is h cm and the
radius of the base is r cm:
(a) Find the expression for the total surface area of
the can in terms of r
(b) Determine the dimension of the can which
will minimise the surface area of the can,
correct to 1 decimal place (Smith 2013).
Solution
(a) Total surface area of a closed cylinder given by SA = 2πr2+ 2πrh ……… (1)
Volume of a cylindrical can is given by V = πr2h …………. (2)
From (2), πr2h = 400
h = 400
πr𝟐
………(3)
Substitute (3) into (1) gives SA = 2πr2+ 2πr (400
πr𝟐
)
SA = 2πr2+ r
800
SA = 2πr2 + 800r-1
(b) SA = 2πr2 + 800r-1
(SA)’ =4πr – 800r-2
For maximum or minimum, (SA)’ = 0
h
7
c
m
r
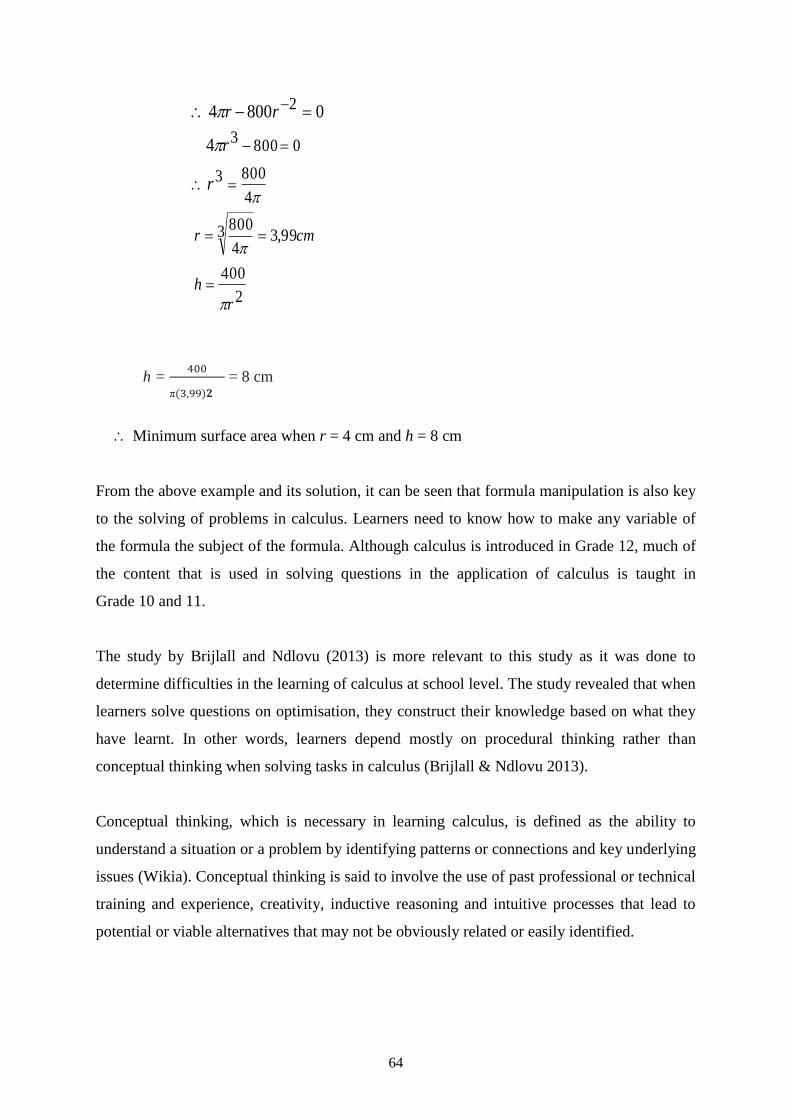
64
2
400
99,334
800
4
8003
08003
2
4
08004
r
h
cmr
r
r
rr
h = 400
π(3,99)𝟐
= 8 cm
Minimum surface area when r = 4 cm and h = 8 cm
From the above example and its solution, it can be seen that formula manipulation is also key
to the solving of problems in calculus. Learners need to know how to make any variable of
the formula the subject of the formula. Although calculus is introduced in Grade 12, much of
the content that is used in solving questions in the application of calculus is taught in
Grade 10 and 11.
The study by Brijlall and Ndlovu (2013) is more relevant to this study as it was done to
determine difficulties in the learning of calculus at school level. The study revealed that when
learners solve questions on optimisation, they construct their knowledge based on what they
have learnt. In other words, learners depend mostly on procedural thinking rather than
conceptual thinking when solving tasks in calculus (Brijlall & Ndlovu 2013).
Conceptual thinking, which is necessary in learning calculus, is defined as the ability to
understand a situation or a problem by identifying patterns or connections and key underlying
issues (Wikia). Conceptual thinking is said to involve the use of past professional or technical
training and experience, creativity, inductive reasoning and intuitive processes that lead to
potential or viable alternatives that may not be obviously related or easily identified.
65
Schwartz (2010) points out that when learners are applying conceptual thinking new ways of
seeing the world and a willingness to explore are developed. If they want to be successful,
conceptual thinkers have to understand that new and unfamiliar ideas need to be nurtured and
supported (Schwartz 2010).
For our learners to achieve better results in mathematics, particularly in calculus, they need to
develop conceptual knowledge rather than procedural knowledge. Schwartz (2010) defines
procedural knowledge in mathematics as when learners are able to find answers to the
problems according to set rules or algorithms. For example, when a learner thinks only of
cross multiplying as a way of approaching problems involving proportion, chances are that
they have learnt only a procedure for solving mathematical proportions (Schwartz 2010).
Conceptual knowledge on the other hand is developed when a person makes a relationship
between the existing knowledge and new information they have just acquired. In other words,
conceptual knowledge can be regarded as a connected web of knowledge. According to
Schwartz (2010) a person who has developed a conceptual knowledge in division can
demonstrate this by doing division problems using a number of different procedures. For
example, a division problem may be solved by repeated subtractions, by repeated addition, by
use of a number line, or by using objects and modelling the action of division. Schwartz says
that one of the benefits of emphasising conceptual understanding is that a person is less likely
to forget concepts than procedures (Schwartz 2010).
The study by Brijlall and Ndlovu (2013) also revealed that learners could not link new topics
to the one they have learnt before. For instance, learners could not link the concept of
maxima/minima that they have learnt in Grade 11 to answer questions on calculus in
Grade 12.
It was also found that learners experienced some difficulty in modelling the problems
(Brijlall & Ndlovu 2013). Mathematical modelling is a key aspect in the learning and
teaching of mathematics, especially during problem solving. Wikipedia, the free
encyclopaedia, defines mathematical modelling as a process of developing a mathematical
model. Furthermore, a mathematical model is said to be a description of a system using
mathematical concepts and language (Wikipedia). A mathematical model can take many
66
forms, such as statistical models and differential equation – in other words, when a learner is
changing a word problem into an equation this is mathematical modelling.
Some researchers are opposed to the teaching of calculus in high schools. They feel that
schools should now stop teaching calculus. It must rather be taught at colleges and
universities only to those students who pursue their studies in fields such as engineering,
technology or science, where calculus is needed (Salzberg 2014).
Salzberg (2014) is one of the researchers who argue that the teaching of calculus in high
schools should stop. According to him courses in geometry, trigonometry and calculus are all
fine, but they do not serve the needs of the 21st century. Learners are living in a world
flooded with data and they need new skills to make sense of it all. The relevant courses that
may be taught to these learners are computer science and statistics. Most high schools in the
United States do not offer these two subjects, and even in those where they are offered they
are taken as electives, and therefore only a few students take them (Salzberg 2014).
Salzberg continues to say that with computers controlling so much of students’ lives, from
their phones to their cars to their online existence, there is a need to teach computer science to
help students understand how their devices work. He says programming will teach them a
form of logical reasoning that is missing in the mathematics curriculum (Salzberg 2014).
According to Salzberg science data is emerging as one of the hottest new scientific areas.
Therefore a basic understanding of statistics will provide a new foundation for a wide range
of 21st-century career paths. He gives an example of doctors as people who really need data
in their field. Doctors are said to be faced with new medical science every day and statistical
evidence is the most common form of proof that a new treatment is effective (Salzberg 2014).
In summary, Salzberg said teaching of calculus in high schools must be stopped and be
replaced by subjects that provide learners with the mathematics skills they really need in the
21st century.
In many countries, for example the United States, calculus was not taught at high school, but
was the first college-level mathematics course taken by mathematically talented students.
Bressoud (2004) points out that the first-year students were well prepared as they were seeing
calculus for the first time and as a result they were mathematically motivated. However,
67
things have changed now as the first-year calculus has become a high school topic for most of
our strongest students. In the USA, learners with high school calculus are credited for
modules/topics done in high school.
According to Bressoud (2004) the introduction of calculus at school level rather than at
tertiary level has some implications. These implications include:
Ensuring that students who take calculus in high school are prepared for the
further study of mathematics
Addressing the particular needs of those students who arrive in college with credit
for calculus
Recognising that the students who take calculus for the first time in college may
need more support and be less likely to continue with further mathematics than
those of a previous generation, who were supported well at the college because
they were doing calculus for the first time. (Bressoud 2004).
Bressoud (2004) advises that since calculus is now taught in schools, learners must also pay
attention to other topics such as algebra, geometry and trigonometry in order to get a good
mathematical background. A solid mathematical preparation is far more important than
exposure to calculus. Bressoud recommends that the calculus that is taught in high school
should be a college-level course. The goal of the course should be to give students the same
breadth of topics and mastery of calculus as that obtained by students taking such a course
in college. It means that calculus should be taught in such a way that students who perform
satisfactorily at school will be able to cope with a college calculus course.
2.6 FACTORS THAT MAY CAUSE POOR PERFORMANCE IN CALCULUS
In South Africa, calculus is part of the content that is examinable only in Grade 12. Learners
performed well in some sections of calculus and poorly in others, especially the section on
cubic graphs and application of calculus. From the Intervention Guides (Mpumalanga
Department of Education 2013), comparison of performance in 2011 and 2012 on subtopics
of calculus can be tabulated as shown by Table 2.11.
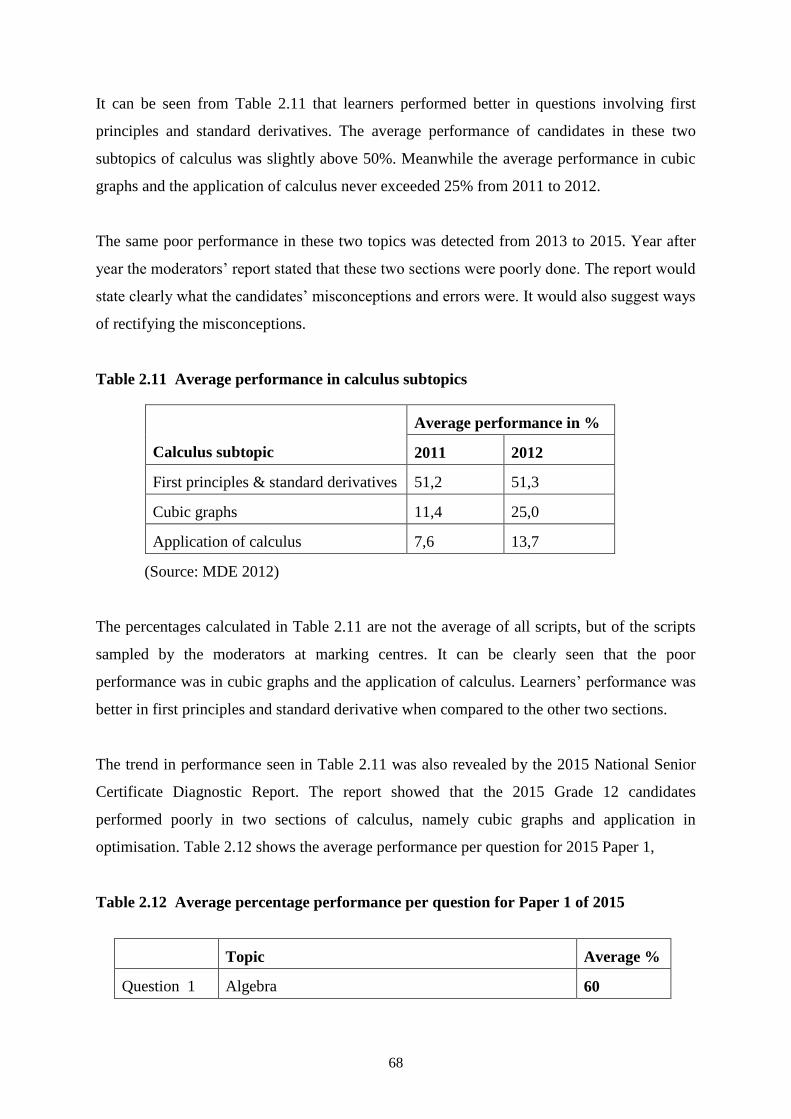
68
It can be seen from Table 2.11 that learners performed better in questions involving first
principles and standard derivatives. The average performance of candidates in these two
subtopics of calculus was slightly above 50%. Meanwhile the average performance in cubic
graphs and the application of calculus never exceeded 25% from 2011 to 2012.
The same poor performance in these two topics was detected from 2013 to 2015. Year after
year the moderators’ report stated that these two sections were poorly done. The report would
state clearly what the candidates’ misconceptions and errors were. It would also suggest ways
of rectifying the misconceptions.
Table 2.11 Average performance in calculus subtopics
(Source: MDE 2012)
The percentages calculated in Table 2.11 are not the average of all scripts, but of the scripts
sampled by the moderators at marking centres. It can be clearly seen that the poor
performance was in cubic graphs and the application of calculus. Learners’ performance was
better in first principles and standard derivative when compared to the other two sections.
The trend in performance seen in Table 2.11 was also revealed by the 2015 National Senior
Certificate Diagnostic Report. The report showed that the 2015 Grade 12 candidates
performed poorly in two sections of calculus, namely cubic graphs and application in
optimisation. Table 2.12 shows the average performance per question for 2015 Paper 1,
Table 2.12 Average percentage performance per question for Paper 1 of 2015
Topic Average %
Question 1 Algebra 60
Calculus subtopic
Average performance in %
2011 2012
First principles & standard derivatives 51,2 51,3
Cubic graphs 11,4 25,0
Application of calculus 7,6 13,7
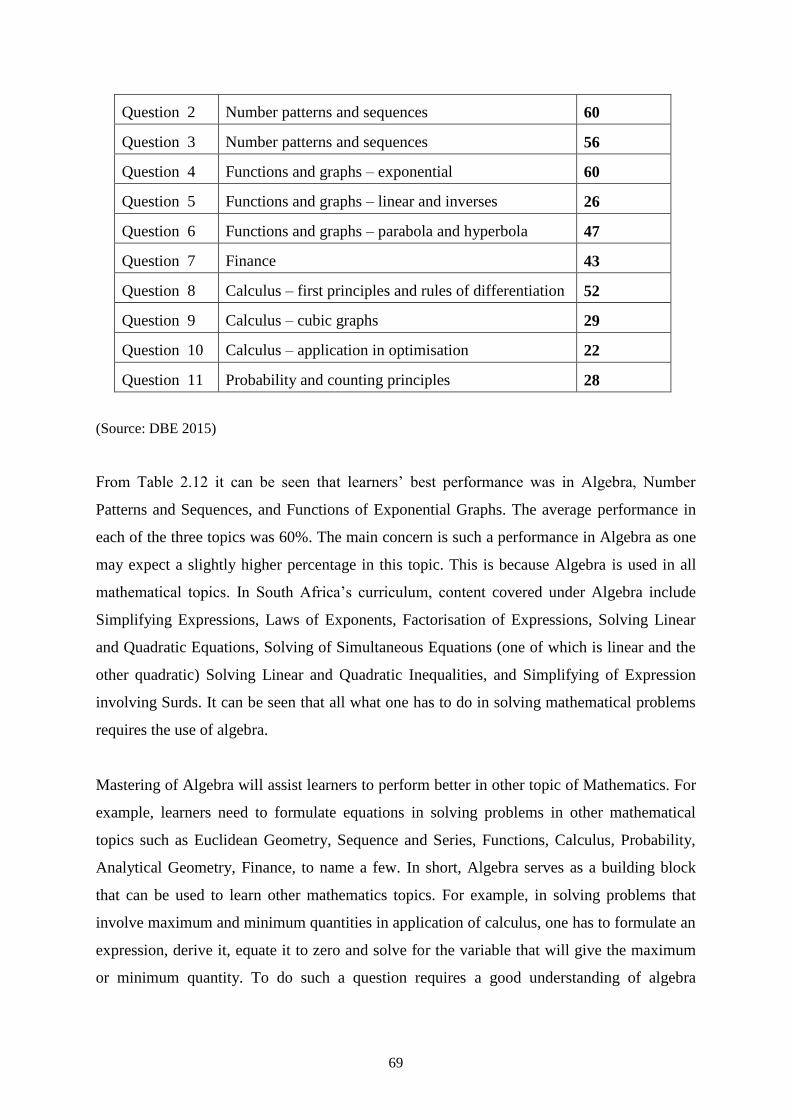
69
Question 2 Number patterns and sequences 60
Question 3 Number patterns and sequences 56
Question 4 Functions and graphs – exponential 60
Question 5 Functions and graphs – linear and inverses 26
Question 6 Functions and graphs – parabola and hyperbola 47
Question 7 Finance 43
Question 8 Calculus – first principles and rules of differentiation 52
Question 9 Calculus – cubic graphs 29
Question 10 Calculus – application in optimisation 22
Question 11 Probability and counting principles 28
(Source: DBE 2015)
From Table 2.12 it can be seen that learners’ best performance was in Algebra, Number
Patterns and Sequences, and Functions of Exponential Graphs. The average performance in
each of the three topics was 60%. The main concern is such a performance in Algebra as one
may expect a slightly higher percentage in this topic. This is because Algebra is used in all
mathematical topics. In South Africa’s curriculum, content covered under Algebra include
Simplifying Expressions, Laws of Exponents, Factorisation of Expressions, Solving Linear
and Quadratic Equations, Solving of Simultaneous Equations (one of which is linear and the
other quadratic) Solving Linear and Quadratic Inequalities, and Simplifying of Expression
involving Surds. It can be seen that all what one has to do in solving mathematical problems
requires the use of algebra.
Mastering of Algebra will assist learners to perform better in other topic of Mathematics. For
example, learners need to formulate equations in solving problems in other mathematical
topics such as Euclidean Geometry, Sequence and Series, Functions, Calculus, Probability,
Analytical Geometry, Finance, to name a few. In short, Algebra serves as a building block
that can be used to learn other mathematics topics. For example, in solving problems that
involve maximum and minimum quantities in application of calculus, one has to formulate an
expression, derive it, equate it to zero and solve for the variable that will give the maximum
or minimum quantity. To do such a question requires a good understanding of algebra
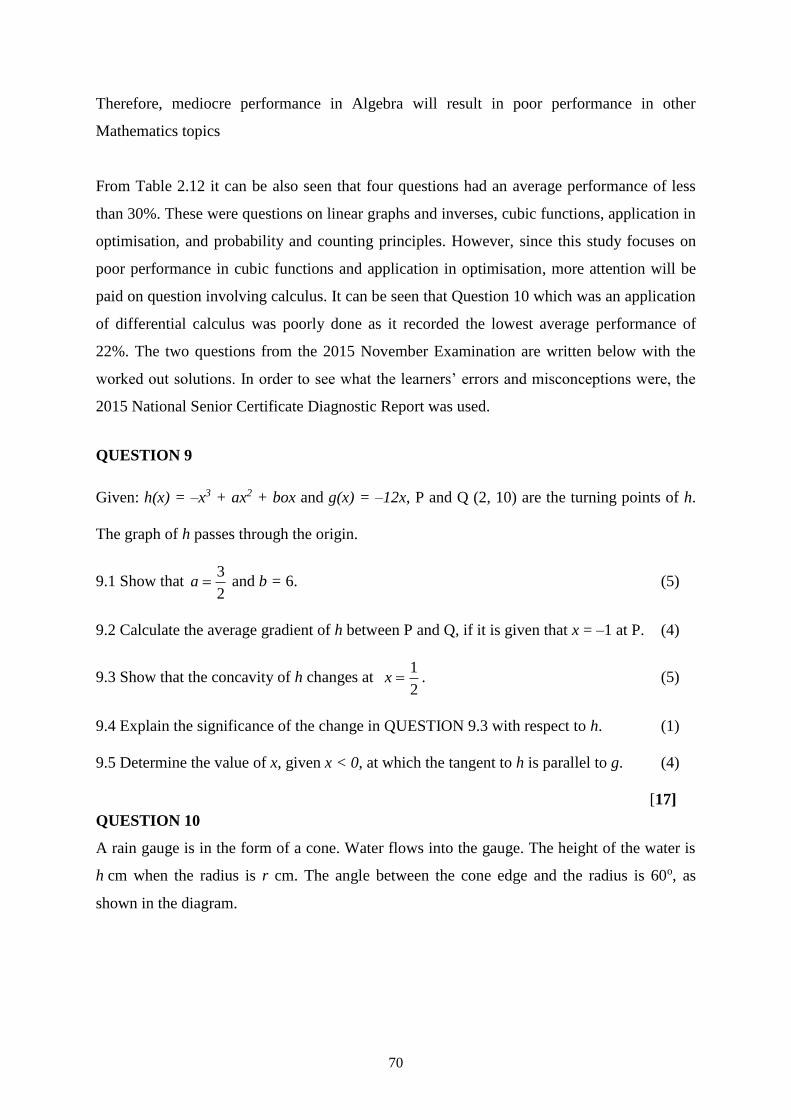
70
Therefore, mediocre performance in Algebra will result in poor performance in other
Mathematics topics
From Table 2.12 it can be also seen that four questions had an average performance of less
than 30%. These were questions on linear graphs and inverses, cubic functions, application in
optimisation, and probability and counting principles. However, since this study focuses on
poor performance in cubic functions and application in optimisation, more attention will be
paid on question involving calculus. It can be seen that Question 10 which was an application
of differential calculus was poorly done as it recorded the lowest average performance of
22%. The two questions from the 2015 November Examination are written below with the
worked out solutions. In order to see what the learners’ errors and misconceptions were, the
2015 National Senior Certificate Diagnostic Report was used.
QUESTION 9
Given: h(x) = –x3 + ax2 + box and g(x) = –12x, P and Q (2, 10) are the turning points of h.
The graph of h passes through the origin.
9.1 Show that 2
3a and b = 6. (5)
9.2 Calculate the average gradient of h between P and Q, if it is given that x = –1 at P. (4)
9.3 Show that the concavity of h changes at 2
1x . (5)
9.4 Explain the significance of the change in QUESTION 9.3 with respect to h. (1)
9.5 Determine the value of x, given x < 0, at which the tangent to h is parallel to g. (4)
[17]
QUESTION 10
A rain gauge is in the form of a cone. Water flows into the gauge. The height of the water is
h cm when the radius is r cm. The angle between the cone edge and the radius is 60o, as
shown in the diagram.
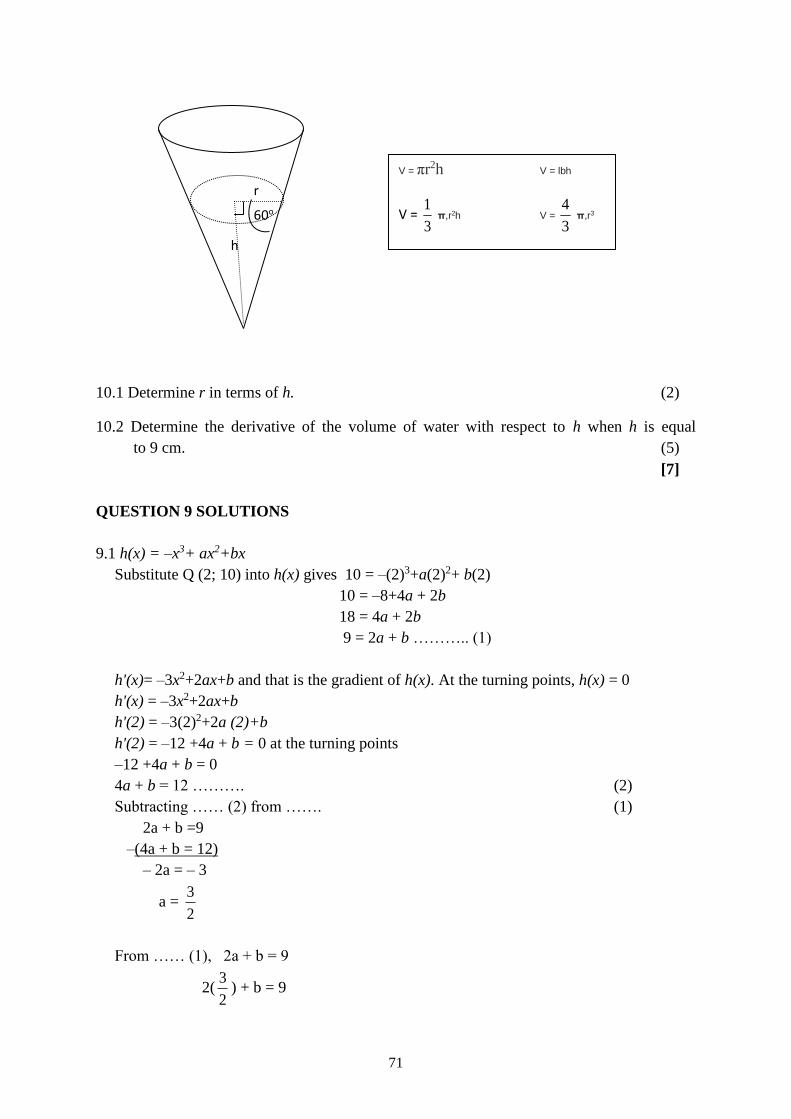
71
10.1 Determine r in terms of h. (2)
10.2 Determine the derivative of the volume of water with respect to h when h is equal
to 9 cm. (5)
[7]
QUESTION 9 SOLUTIONS
9.1 h(x) = –x3+ ax2+bx
Substitute Q (2; 10) into h(x) gives 10 = –(2)3+a(2)2+ b(2)
10 = –8+4a + 2b
18 = 4a + 2b
9 = 2a + b ……….. (1)
h'(x)= –3x2+2ax+b and that is the gradient of h(x). At the turning points, h(x) = 0
h'(x) = –3x2+2ax+b
h'(2) = –3(2)2+2a (2)+b
h'(2) = –12 +4a + b = 0 at the turning points
–12 +4a + b = 0
4a + b = 12 ………. (2)
Subtracting …… (2) from ……. (1)
2a + b =9
–(4a + b = 12)
– 2a = – 3
a = 2
3
From …… (1), 2a + b = 9
2(2
3) + b = 9
r
h
60o
V = πr2h V = lbh
V = 3
1 π,r2h V =
3
4 π,r3
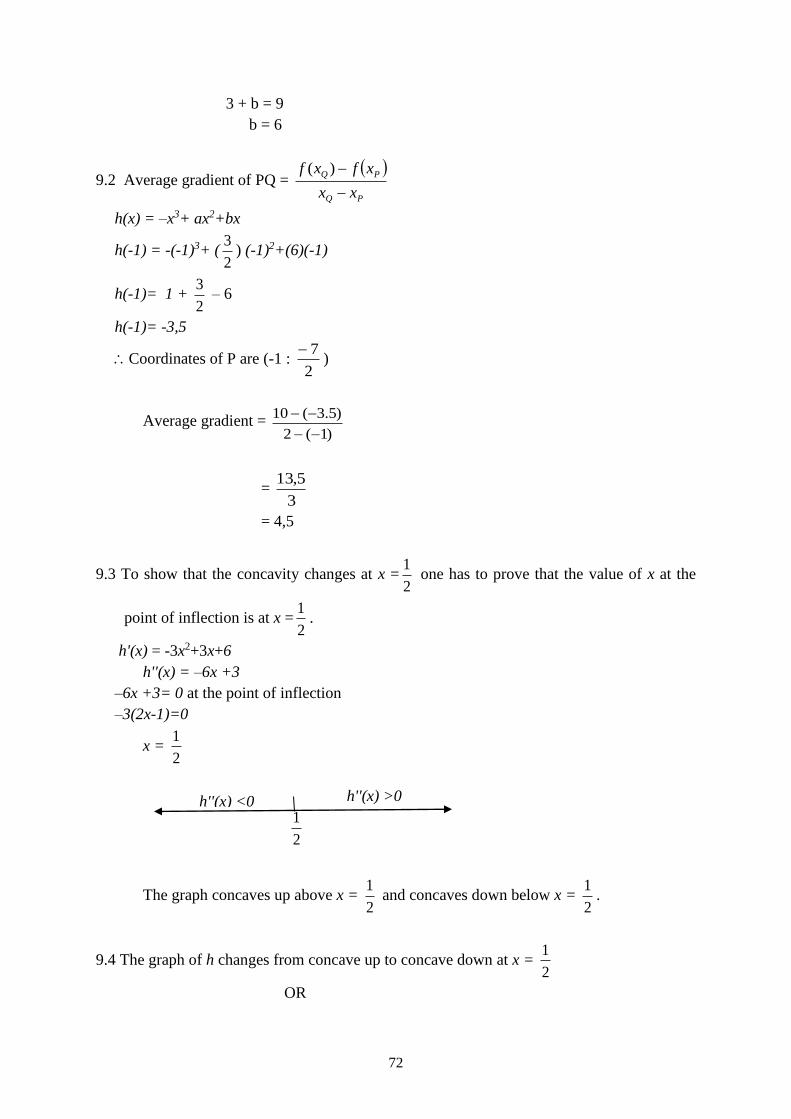
72
3 + b = 9
b = 6
9.2 Average gradient of PQ =
PQ
PQ
xx
xfxf
)(
h(x) = –x3+ ax2+bx
h(-1) = -(-1)3+ (2
3) (-1)2+(6)(-1)
h(-1)= 1 + 2
3 – 6
h(-1)= -3,5
Coordinates of P are (-1 : 2
7)
Average gradient = )1(2
)5.3(10
= 3
5,13
= 4,5
9.3 To show that the concavity changes at x =2
1 one has to prove that the value of x at the
point of inflection is at x =2
1.
h'(x) = -3x2+3x+6
h''(x) = –6x +3
–6x +3= 0 at the point of inflection
–3(2x-1)=0
x = 2
1
The graph concaves up above x = 2
1 and concaves down below x =
2
1.
9.4 The graph of h changes from concave up to concave down at x = 2
1
OR
h''(x) <0
h''(x) >0
2
1
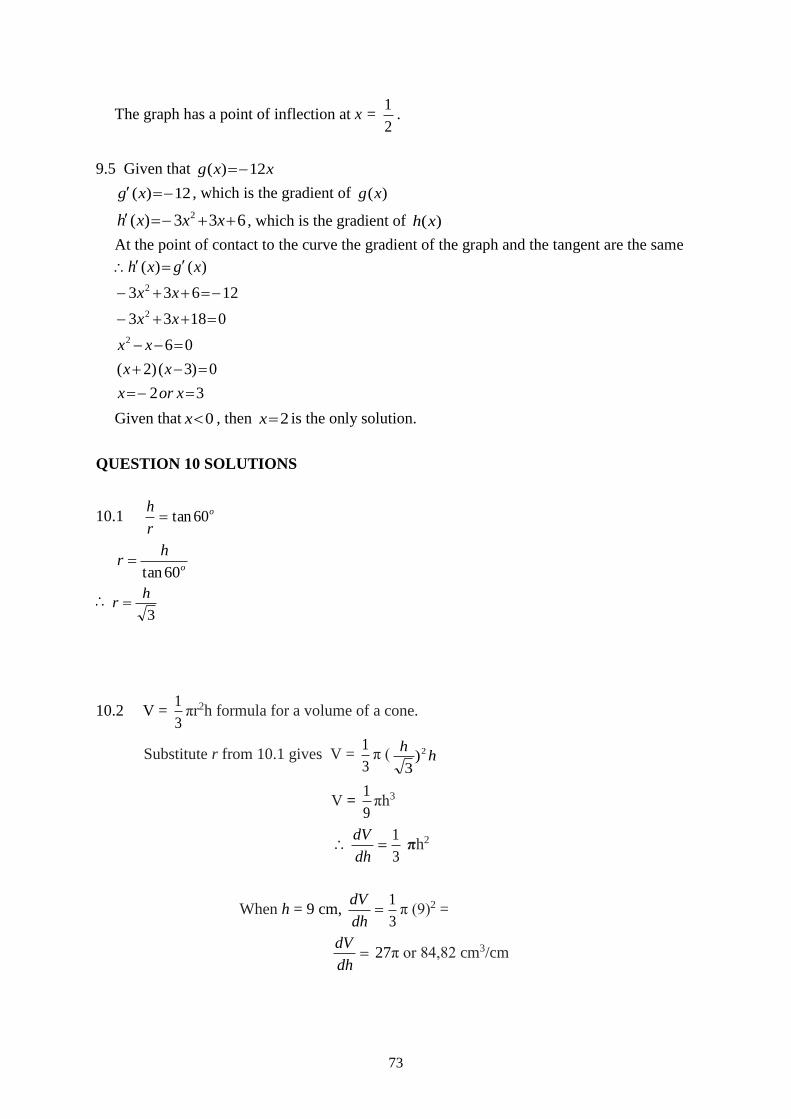
73
The graph has a point of inflection at x = 2
1.
9.5 Given that xxg 12)(
12)( xg , which is the gradient of )(xg
633)( 2 xxxh , which is the gradient of )(xh
At the point of contact to the curve the gradient of the graph and the tangent are the same
32
0)3()2(
06
01833
12633
)()(
2
2
2
xorx
xx
xx
xx
xx
xgxh
Given that 0x , then 2x is the only solution.
QUESTION 10 SOLUTIONS
10.1 o
r
h60tan
o
hr
60tan
3
hr
10.2 V = 3
1πr2h formula for a volume of a cone.
Substitute r from 10.1 gives V = 3
1π ( h
h 2)3
V = 9
1πh3
dh
dV
3
1 πh2
When h = 9 cm, dh
dV
3
1π (9)2 =
dh
dV 27π or 84,82 cm3/cm
74
The total mark for the two questions was 24, which converts to 16%. This means that a
learner who got all 24 marks, needed only another 21 marks from the remaining questions in
order to pass the paper at Level 2 (30%).
According to the 2015 National Senior Certificate Examination Diagnostic Report these two
questions were poorly done. The common errors and misconceptions made by the candidates
in answering Question 9 were as follows:
(a) Candidates struggled to set up the two equations required to be solved
simultaneously. They did not use the first derivative to find the values of a and b.
(b) Incorrect algebraic manipulation was common in this question.
(c) Candidates could not explain concavity. They were able to find the first and
second derivatives (h'(x) and h'''(x)), but could not explain their answers.
(d) They could not identify the gradient from the given line g. Those who managed to
calculate the gradient did not know what to do with it (DBE 2015: 160).
The moderators put forward suggestions that may assist future candidates to do better in
questions similar to the one in Question 9. The suggestions included the following:
(a) Teachers have to emphasise during teaching that if a question states that “show”
or “prove that”, those values may not be used in determining the answer. Instead
learners have to perform calculations and arrive at the same values.
(b) When teaching functions learners have to be exposed to all aspects of functions
such as sketching, interpretation of the equation and the graph, as well as finding
the equation from the given information.
(c) Learners have to be taught to distinguish between a function and its gradient, that
is learners must be taught the difference between f(x)and f'(x).
(d) Teachers have to expose learners to higher order thinking questions and the
interpretation of graphs
(e) It is important for teachers to teach the concepts of concave up, concave down
and the interval at which these occur. These concepts should be linked to the
second derivative. If a function is concave up on an interval then f'''(x)) > 0. If a
function is concave down on the interval, then f''(x) < 0.
75
(f) Teachers must emphasise to the learners that in cubic graphs concavity always
changes at the point of inflection (DBE 2015).
Question 10 was also poorly done. The average percentage obtained by candidates in this
question was 22%. Common errors and misconceptions made by candidates in this question
were as follows:
(a) Candidates used Pythagoras’ theorem to determine r. Where trigonometry was
used, candidates did not express r in terms of h.
(b) A large number of candidates did not understand what was asked. Some used the
incorrect formula or made an incorrect substitution for r. Other candidates
substituted r = 9 before determining the derivative.
(c) It was also found that some candidates were unable to simplify the formula for
volume correctly while others were unable to determine the derivative correctly
(DBE 2015).
Again as in the other questions, moderators had to put forward suggestions for improvement
in this topic, including the following:
(a) Teachers must expose learners to the integration of topics across papers.
(b) Since the section on measurement is done in Grade 10, revision should take place
in Grade 11 and 12. Teachers must make use of models/teaching aids in teaching
this topic.
(c) Learners are expected to select a correct formula from the given list.
(d) Teachers need to expose learners to examples where they have to differentiate
with respect to variables other than x.
(e) This section of calculus is said to be taught towards the end of the year and this
does not give learners sufficient time for revision. Teachers have to organise extra
tuition time so that learners may have ample time to understand the application
fully (DBE 2015).
In order to improve the pass rate in mathematics, special attention must be given to those
topics that give learners difficulties. Calculus was part of the previous curriculum and is still
part of the revised curriculum (CAPS). It has a weighting of 36 ± 3 of 150 marks (24 ± 2%)
76
of Paper 1 (Department of Basic Education 2011), which means it carries a lot of marks that
learners can score if proper interventions are made.
Poor performance by learners in calculus while in secondary school also emerges when they
are at colleges and universities. It is not surprising because the poor performance in Grade 12
is an indication that they have not mastered or acquired all the necessary information that
would assist them at tertiary level. Several studies have been done with university students,
especially in their first year, to find the causes of poor performance in calculus.
A study done by Knill (2005) with college students suggested that poor performance was
caused by common mistakes made by teachers and students when teaching and learning
calculus respectively (Knill, 2005:1). Knill grouped mistakes made by teachers into two,
namely (a) general teachers’ mistakes and (b) mathematics teachers’ mistakes, followed by
(c) mathematics students’ mistakes.
(a) General teachers’ mistakes
According to Knill (2005), general teachers’ mistakes included lack of preparation, relying on
improvisation skills for lectures, assigning too difficult problems to the students as
homework, using politically incorrect problems or jokes (for example, showing slides with
sexist jokes), too long lectures or discussions after class (may delay the start of the next
lesson in another class), teacher coming to class late, teacher having no interaction or
activities that would keep the attention span active, the use of untested equipment/technology
(for example, connecting a data projector to a computer in front of a class), ignoring students’
questions if the answer was difficult or not known, and too much guidance (Knill 2005).
(b) Mathematics teachers’ mistakes
Mathematics teachers’ mistakes included ambiguous notations, use of uncommon notations,
giving learners incorrect definitions of mathematical concepts, giving too difficult problems
without a hint, and stating incorrect theorems (Knill 2005).
(c) Mathematics students’ mistakes
77
According to Knill (2005) learners’ mistakes included the incorrect use of substitution,
improper handling of indefinite integrals, matrix algebra issues (for example, for two
matrices AB, learners would say (A + B)2 = A2 + 2AB + B2), inappropriate commutativity of
composition (for example, students saying )log(log xx or saying xx sin5)5sin( ,
inappropriate cancellation (e.g. 133
x
x or sin
sin
x
x), dividing by zero (for example,
in xxx )1( 2, students would divide both sides by x and get 22 x , which simplifies to
2x ), wrong signs in inequalities (for example, – a < – 3 implies a < 3), and
misconceptions about constants (for example, 12 xxxxdx
d) (Knill 2005).
Another study that revealed the challenges faced by university students when learning
calculus was conducted by Sabella and Redish [nd]. Because of the importance of calculus in
many fields of science and engineering, many research studies in the students’ understanding
of calculus were conducted. These studies showed that students enrolled in the university
calculus class lacked a depth of understanding in many basic concepts in calculus. The
studies blamed the failure of learners in developing a conceptual understanding of calculus on
the rote learning that was used in the introductory course (Sabella & Redish [nd]: 1).
Sabella and Redish [nd] state that the failure of the traditional calculus curriculum has led to
the calculus reform effort. The importance of calculus in many fields is said to have caused a
great deal of research into student learning of calculus. The present studies have shown that
there is a need for curriculum development and reforms in order to improve the present
situation in terms of learner performance. Their study focused on the difficulties experienced
by learners when studying the following four topics of calculus: (a) functions and variables;
(b) limits and continuity; (c) derivatives and (d) integrals.
(a) Functions and variables
Sabella and Redish [nd] point out that functions cover many concepts in calculus such as
limits, derivatives and integrals. Because of the importance of function, much research has
been done in student understanding of this topic. Studies have shown that many students fail
to understand calculus because they lack an understanding of the concepts covered in
78
functions. These students have entered a calculus course unable even to provide a general
definition of a function and when prompted, they are only able to give examples of functions
(Sabella & Redish [nd]).
The study by Dreyfus and Eisenberg (cited in Sabella & Redish [nd]) has shown that learners
interviewed in the study were unable to give a clear definition of a function. Learners said a
relation is a function only when it can be represented by a single formula. The study has also
shown that students view algebraic data and graphical data as separate. The learners that
participated in the study viewed any graphical representation with no formula as something
that has no meaning to them (Sabella & Redish [nd]).
The traditional course development of graphs has been blamed for requiring that students
must master the method of using zeros of derivatives to sketch graphs of quadratic and cubic
functions. These traditional courses are using the general notion of checking functional
behaviour near undefined function values for small well defined sets of functions whose
graphs have linear asymptotes. The instructors are said to have confined graphing
assignments to requiring a sketch for a graph like that of:
252 2 xxy or 13)( 3 xxxf or xx
y 10360
The instructors seldom ask students to draw conclusions on the basis of their graphs or to
comment on the relationship between two different graphs. The traditional calculus courses
have also been criticised for not providing much opportunity to students to develop a deep
conceptual understanding of the graph and for not promoting an understanding of the
connection between an algebraic representation and a graphical representation (Sabella &
Redish [nd]).
A study conducted by White and Mitchelmore (1996) with a group of forty first-year students
from the Australian Catholic University also made a great contribution to determining the
challenges faced by students when doing calculus word problems. The students had to
respond to questions involving the rates of change. Responses were collected on four
occasions during and after 24 hours of concept-based calculus instruction. The group of
students had studied calculus in secondary school.
79
The findings of the study by White and Mitchelmore (1996) revealed that students lacked the
understanding of the concept variable. They treated variables as symbols to be manipulated
rather than as quantities to be related. They also failed to make a difference between a general
relation and a statement of a specific variable. Students did not understand the concept
variable and that made it difficult to identify and symbolise an appropriate variable by
translating one or more quantities and therefore defining a usable variable (White and
Mitchelmore 1996).
(b) Limits
Students faced some difficulties in understanding the concept limit. Heid’s 1988 study (cited
in Sabella and Redish [nd]) showed student difficulty in the understanding of limits by
studying two groups of students. One group was taught using graphical and symbol
manipulation computer programs while the other group was taught by traditional methods.
The results showed that both groups seemed to identify the notion of a limit with a process
rather than a number, focusing on the “getting close to” rather than on the number being
approached. This confusion about a limit intensified their explanations of derivatives as they
described derivatives as approximations for slopes of tangent lines rather than as being equal
to the slope.
80
(c) Derivatives
Studies by Heid’s 1988 and Orton’s 1983 (cited in Sabella and Redish [nd] revealed the most
useful information about students’ understanding of derivatives. The study by Orton with 110
students majoring in mathematics showed that students had little understanding and
fundamental misconceptions about the derivative (Sabella & Redish [sa:4]). Although most
students could perform the routine aspects of differentiation, the worrying situation was that
when they were presented with the function they had not seen before, they made a lot of
errors. This was regarded as an indication that the students relied more on algorithmic steps
without a conceptual understanding. Sabella and Redish pointed out that other areas of
student difficulty were related to the tangent as a limit of a set of secants and to the ideas of a
rate of change at a point versus the average rate of change over an interval.
Heid’s 1988 study (cited in Sabella& Redish [nd]) revealed that the students memorised what
they had been taught and easily forgot it after a certain period (Sabella & Redish [sa:4]). The
study also noted that learners could explain the idea of a derivative as a shape or rate of
change, or of a second derivative as a measure of concavity, but easily forgot all that once
they moved to other sections or topics. This might be due to the fact that the students
memorised procedures for a small number of exercises covered at that particular time
(Sabella & Redish [nd]).
(d) Integrals
Although the Grade 12 mathematics curriculum in South Africa does not cover integration, it
is worth mentioning it here as our students are going to face it as a challenge when they come
across it at universities and other higher education institutions.
According to Sabella and Redish [nd] Orton’s study on integration showed that students were
able to apply the basic technique of integration. When probed further, students indicated that
they possessed a fundamental misunderstanding about the concepts in integration. They failed
to make use of limit process, break up an area or volume, and provide reasons why such a
method worked.
81
Most of the students were able to tell that the area under the curve could be calculated and
gave better and better approximation when the area was divided into more and more
rectangles, but such a procedure would never produce the correct answer. Orton
recommended that in order to help learners to understand the limit process, activities in which
the students could explore the idea of a limit had to be developed. These activities had to
emphasise approximation (Sabella & Redish [nd]).
Another study on learners’ performance in differential calculus was conducted by Jojo,
Maharaj and Brijlall (2013). The study investigated first-year university engineering students’
construction of the definition of the concept of the chain rule in differential calculus at a
University of Technology in South Africa. This study was carried out after lecturers had
noticed that the first-year students were struggling to understand the chain rule in
differentiation. The fact that in South Africa calculus is introduced at high school, does not
prepare learners adequately for mathematics at tertiary level. A large number of learners enter
university not well prepared to do differential calculus, especially the chain rule. Since the
chain rule is not in the South African high school curriculum, many first-year students have
difficulty in understanding the chain rule in differentiation. When students were asked about
the chain rule, most would provide an example of what it is rather than explain how it works
(Jojo, Maharaj & Brijlall 2013).
Jojo et al. (2013) mentioned that some teachers at high school are less comfortable in
teaching calculus and its applications. This prompted a need for the study of students’
understanding of the concept of the chain rule. The chain rule is a rule for differentiating
compositions of functions. A composite function is a function that is composed of two or
more functions.
The chain rule states that if )())(()),(( xgxgfythenxgfy .
The researchers used the APOS approach to explore the conceptual understanding used by
the students in learning the chain rule. Asiala et al. (2004) in Jojo et al. (2013) explain that
the APOS approach begins with a statement of an overall perspective of what it means to
learn and know something in mathematics. Asiala et al. believe that understanding a
mathematical concept begins with manipulating previously constructed mental or physical
objects to form actions; actions are then internalised to form processes, which are then
82
encapsulated to form objects. The objects could be de-encapsulated back to the processes
from which they are formed, which would be finally organised in schemas.
In their study Jojo et al. (2013) analysed the construction of knowledge through reflective
abstraction. According to Dubinsky (1991), reflective abstraction is a concept introduced by
Piaget to describe the construction of logico-mathematical structures by an individual in the
course of cognitive development. Piaget observed that reflective abstraction has no absolute
beginning but is present at the very earliest ages in the coordination of sensori-motor
structures (Dubinsky 1991).
Jojo et al. (2013) used worksheets to collect data from 12 groups of 76 first-year students.
The instructional designs were based on APOS theory and included activities done both
inside and outside the classroom. Students’ responses were analysed in order to detect
(1) connections made by students to other concepts; (2) calculations made using the chain
rule; (3) the chain rule technique used; and (4) mental changes on which the chain rule was
based. The researchers observed that these students would work out the activities as
individuals and later compared their answers. They would debate some of the responses made
by their fellow students and concur with others. They had to explain how they had arrived at
their responses, and in this way they taught each other
2.7 DIFFICULTIES IN CALCULUS
According to Tall (1992) learners find calculus difficult because they are for the first time
confronted with the limit concept, involving calculations that are no longer performed by
simple arithmetic and algebra. In calculus learners are beginning to learn about infinite
processes that can only be carried out by indirect arguments (Tall 1992).
Tall (1992) argues that no matter what teaching approach is used, the major challenge is in
the understanding of the limit concept. In other words, the limit concept is said to be creating
a number of cognitive difficulties, including the following:
difficulties embodied in the language: terms like “limit”, “tends to” or “approaches”
83
the limit process is not performed by simple arithmetic or algebra, infinite concepts
arise and the whole thing becomes “surrounded in mystery”
the process of “a variable getting arbitrarily small” is often interpreted as an
“arbitrarily small variable quantity”, implicitly suggesting infinitesimal concepts even
when these are not explicitly taught
likewise, the idea of “N getting arbitrarily large”, implicitly suggests conceptions of
infinite numbers
students often have difficulties about whether the limit can actually be reached
there is confusion over the passage from finite to infinite, in understanding “what
happens at infinity” (Tall 1992).
There are some suggestions of how the challenges or difficulties in understanding the limit
concept can be eliminated. According to Davis and Vinner (1986, in Tall 1992) the difficulty
caused by the understanding of the limit concept can be eliminated by avoiding the use of the
language of limits in the introductory stage.
Tall (1992) mentions that other students’ difficulties in the learning of calculus may include
the following: difficulties in translating real-world problems into calculus formulation; the
Leibniz notation – a “useful fiction” or a genuine meaning; difficulties in selecting and using
appropriate representations; restricted mental images of functions; algebraic manipulation –
or the lack of it; difficulties in absorbing complex new ideas in a limited time; difficulties in
handling quantifiers in multiply quantified definitions; consequent student preference for
procedural methods rather than conceptual understanding (Tall 1992).
2.8 INTERVENTIONS THAT MAY BE USED TO IMPROVE PERFORMANCE
IN MATHEMATICS
In the article titled “Classroom practices that promote mathematical proficiency for all
students” Suh (2007) suggests practices that can promote the strands of mathematical
proficiency. She says the five strands are interconnected and must all work together for
students to become mathematically proficient. Many traditional classrooms are dominated by
procedural fluency in defining mathematical proficiency. To make learners more proficient in
mathematics there is a need to develop the other strands. Teachers have to use teaching
practices that reflect the interrelated components. Suh mentions these practices as modelling,
84
making mathematics sensible in the real life, solving real-life problems mathematically, and
creating a classroom that promotes thinking and discussion. Each of these practices is
discussed in more detail below.
(a) Modelling maths meaningfully
It is said learners make more meaningful connections when they can represent a
mathematical idea in multiple modes or forms. The different modes can be manipulative,
pictures, real-life contexts, verbal symbols and written symbols. Translation within and
among various modes of representation is useful in making concepts meaningful to students
(Suh 2007).
(b) Making mathematics more sensible in the real life
One strand of mathematical proficiency, productive disposition, is defined as the habitual
inclination to see mathematics as sensible, useful and worthwhile. For the learners to develop
a positive attitude towards mathematics, teachers have to develop this strand and use it in
their daily activities/lessons. Suh (2007) points out that learners always want to know how
mathematics are relevant, sensible and usable in their lives.
(c) Solving of real-life problems mathematically
For students to perform well in mathematics, teachers have to use the real-life problems that
can be solved mathematically. Suh (2007) argues that giving learners more real-life problems
will make them start noticing mathematical moments in their own lives. This will result in
learners bringing their own mathematical problems to share. In such cases, learners develop a
skill of problem posing, as well as problem solving, that is students learn how to formulate a
problem and solve it. A project like building a sports ground at school can lead learners into
exploring measurement of area and perimeter, budgeting money and comparing unit prices.
85
(d) Creating classrooms that promote thinking and discussion
According to Suh (2007) it is important that students be given opportunities to discuss their
mathematical ideas, argue and justify their reasoning. Creating a classroom that values
students’ thinking is a critical feature of a successful learning environment. For educators to
assist learners in developing strategic competence and adaptive reasoning, they have to create
classroom situations that allow students to share and compare their solutions and strategies
and explore alternative solution paths. In order to create meaningful discussions and
arguments educators are advised to emphasise the importance of respecting one another’s
ideas.
By justifying and reasoning students learn that mathematics makes sense, knowledge that in
turn enhances their productive disposition towards mathematics. Plenty opportunities to make
reasoning through verbal and written activities must be provided. Learners need time to make
sense of the mathematics they are learning by making effective deductive arguments.
Davidson (nd) mentions three main conditions that can make one a successful calculus
student. These are:
You must be good at algebra skills. Passing algebra is not enough, but it is important
to remember and understand what you have learnt. If you have to relearn algebra
while learning calculus the burden can overwhelm you.
Memorisation of computational patterns is not enough. Some people can memorise
algebraic steps without understanding them. It is a different case with calculus
because it is a prerequisite that one has to pay attention and learn the concepts in order
to apply them.
You must be dedicated to your studies. Don’t skip any classes unless there is a valid
reason. Take notes. Above all, practising lots of problems will ensure that the
concepts are reinforced and learnt (Davidson [nd]).
Rambi et al. (2013) suggest pedagogical strategies and tactics that can be used by teachers
to help students overcome difficulties in mathematics. These are:
86
(a) Fun learning: Teachers have to create a teaching and learning environment that is
conducive to learning and fun to the students so that they can feel better and avoid
stress.
(b) Communication: Communication between a student and a teacher is key in teaching
and learning. The teacher should have good relations with the students so that they
can be free to ask questions and not be afraid of being scolded.
(c) Problem-based instructions: The questions posed to students should be problem-
based. This will prevent students from memorising the steps, and teach them to do
backwards steps. Learners like to be challenged by being given problem-solving
questions.
(d) Construction approach: Teachers have to guide students based on their prior
knowledge. For a start teachers must give learners simple questions and guide them to
solve their own problems with a little hint. This will enhance learners’ confidence in
solving mathematics problems.
(e) Real-life applications: Teaching and learning with real-life applications will promote
in-depth learning in mathematics. For example, in teaching directed numbers, teachers
are advised to use examples such as the direct purchasing system (debt and pay).
(f) Technology-integrated learning: Learners are said to be benefiting a lot when they
search and find information on their own. The use of ICT (information and
communication technology ) or the internet by learners to obtain information on their
own is important and the teacher has to provide guidance. The use of ICT, internet
and CDs provided by the departments of education plays an important role in
attracting learners’ attention.
(g) Student-centred learning: To master mathematics, learner-centred approaches are
preferred by learners to the teacher-centred approach. Active classrooms where
learners are doing the presentation and expressing their thoughts are most favoured
for in-depth learning in mathematics (Rambi et al. 2013).
2.8.1. Use of questions that promote mathematical thinking
Teachers often use the question and answer method during lessons. The questions are used
for a variety of purposes. According to Swan (2005) the questions are used to keep learners
engaged during an explanation, to assess their understanding, to deepen their thinking or
87
focus their attention on something. To make the questions more effective, Swan advises
teachers to do the following:
Plan questions and arrange them in order of difficulty
Prepare more open questions
Create a climate that makes learners feel safe
Use a “no hands” approach. The teacher chooses who answers or have learners write
down their answers
Prepare probing follow-up questions
Make sure that there is a sufficient “waiting time” between asking and answering a
question
Encourage learners to collaborate before answering.
Encourage learners to ask their own questions (Swan 2005).
However, like any other teaching method, the use of questions has its pitfalls. Swan (2005)
explains that the most common weaknesses of using questions include situations where a
teacher may:
1. ask questions with no apparent purpose
2. ask too many closed questions
3. make a poor sequencing or arrangement of questions
4. ask “Guess what is in my head” questions
5. ask rhetorical questions
6. focus on just a small number of learners
7. ignore incorrect answers
8. not take learners’ responses seriously.
Despite the pitfalls of using questions, they can play an important role in the learning of
mathematics. Table 2.13 shows some examples of open questions that can be used to promote
mathematical thinking.
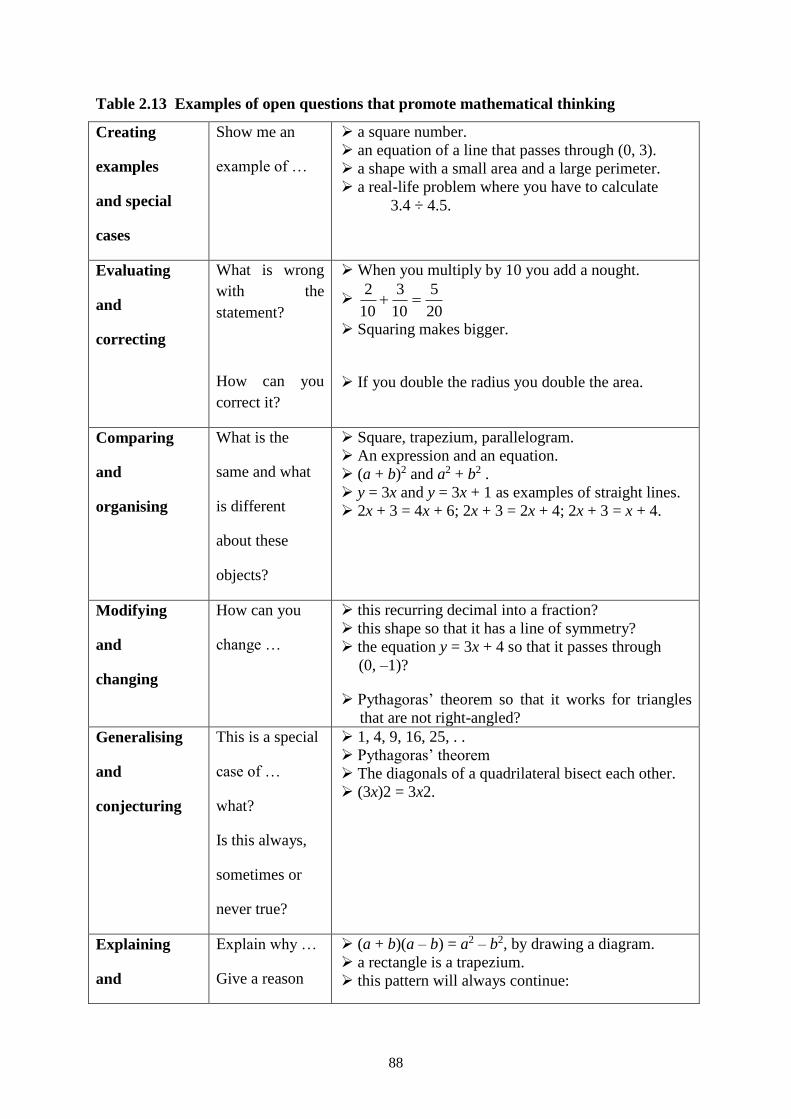
88
Table 2.13 Examples of open questions that promote mathematical thinking
Creating
examples
and special
cases
Show me an
example of …
a square number.
an equation of a line that passes through (0, 3).
a shape with a small area and a large perimeter.
a real-life problem where you have to calculate
3.4 ÷ 4.5.
Evaluating
and
correcting
What is wrong
with the
statement?
How can you
correct it?
When you multiply by 10 you add a nought.
20
5
10
3
10
2
Squaring makes bigger.
If you double the radius you double the area.
Comparing
and
organising
What is the
same and what
is different
about these
objects?
Square, trapezium, parallelogram.
An expression and an equation.
(a + b)2 and a2 + b2 .
y = 3x and y = 3x + 1 as examples of straight lines.
2x + 3 = 4x + 6; 2x + 3 = 2x + 4; 2x + 3 = x + 4.
Modifying
and
changing
How can you
change …
this recurring decimal into a fraction?
this shape so that it has a line of symmetry?
the equation y = 3x + 4 so that it passes through
(0, –1)?
Pythagoras’ theorem so that it works for triangles
that are not right-angled?
Generalising
and
conjecturing
This is a special
case of …
what?
Is this always,
sometimes or
never true?
1, 4, 9, 16, 25, . .
Pythagoras’ theorem
The diagonals of a quadrilateral bisect each other.
(3x)2 = 3x2.
Explaining
and
Explain why …
Give a reason
(a + b)(a – b) = a2 – b2, by drawing a diagram.
a rectangle is a trapezium.
this pattern will always continue:
89
justifying why …
How can we be
sure that …
Convince me
that …
1 + 3 = 22; 1 + 3 + 5 = 32 …
if you unfold a rectangular envelope you will get a
rhombus
(Source: Swan 2005:33)
2.8.2. Counter-examples in assisting learners to understand mathematics
The usage of counter-examples in teaching and learning mathematics can assist in helping
learners understand mathematical topics like calculus. A study by Klymchuk (2012) suggests
that the use of counterexamples can be used as a pedagogical strategy in the teaching and
learning of calculus. Although this study was done with the first-year university students to
enhance the understanding of mathematical concepts, it can be used even with high school
students to eliminate errors and misconceptions.
By counterexamples we mean that for a given statement, theorem or conjecture an opposite
or incorrect statement can be given and learners then asked to prove it. A counterexample can
easily show that a given statement is false. One counterexample is enough to disprove a
statement (Klymchuk 2012). If counterexamples are not provided, it is not easy for learners to
see that the given statements may be true to a certain level (not always true). For example, for
a long time mathematicians thought they had found a formula which generated only prime
numbers. A prime number is a number that has exactly two factors. The two factors of a
prime number are 1 and the number itself. For example, 3 is a prime number because it has
only two factors, 1 and 3. Mathematicians believed that numbers of the form 122 n
where n
is a natural number were always prime until Euler found a counterexample that showed that
when n = 5, that number is composite: 429496729767004176411252 . A composite
number is a number with more than two factors. In this case, the number 4294967297 has
three factors, which are 1; 641 and 6700417.
Klymchuk (2012) mentions that the main challenge of using counterexamples is that it is
sometimes not easy to find the counterexamples. Selden and Selden (1998) and Tall (1991, in
90
Klymchuk 2012) point out that creating examples and counterexamples is neither algorithmic
nor procedural and requires advanced mathematical thinking, which is not often taught in
schools. To come up with examples requires cognitive skills that are different from carrying
out algorithms. Also in our schools, mathematics is taught in such way that special cases are
avoided and students are exposed to simple examples (Klymchuk 2012).
Once learners get used to the counterexamples strategy and understand their roles, they
become interested in creating them. Klymchuk (2012) explains that in developing
counterexamples, learners that took part in the study were forced to pay attention to every
detail in a statement. They had to look at the word order, the symbols used, the shape of
brackets defining the intervals, and whether the statement applied to a point or interval.
In the study, learners were asked to disprove the two statements that looked similar to the
above theorem:
1. If a function f(x) is differentiable and its derivative is positive at a point x = c in
(a; b), then there is a neighbourhood of the point x = c where the function is
increasing.
2. If a function f(x) is differentiable on its domain and its derivative is positive for
all x from its domain, then the function is increasing everywhere on its domain.
Other examples of incorrect statements that were used in this study included the following:
Within a continuous function, i.e. a function which has a value of y which
smoothly and continuously changes for all values of x, we have derivatives for all
values of x.
If the derivative of a function is zero then the function is neither increasing nor
decreasing.
At a maximum the second derivative of a function is negative and at a minimum
positive.
The tangent to a curve at a point is the line which touches the curve at that point
but does not cross it there.
91
Klymchuk (2012) mentions that the above four statements were extracts from some textbooks
on calculus at upper secondary and university level. If the textbooks can give statements such
as these, this must be a concern to many teachers, especially those who rely a great deal on
the textbooks. Mistakes occurring in the textbooks may have a negative impact on the
learning of mathematics by students. Klymchuk (2012) points out that because of incorrect
statements in some textbooks, there is a need of enhancing students’ ability to critically
analyse any given information, not only that written in newspapers but also in mathematics
books.
2.8.3. Importance of errors in correcting misconceptions
According to Brijlall (2012) the detection of errors in mathematics question papers can be
used as a catalyst (a thing that speeds up or accelerates change) for opening meaningful
discussions and mathematical explorations. Errors can be detected from learners’ responses
or from the marking memorandum. They can assist in explaining certain mathematical
concepts and thus strengthen the teaching and learning of mathematics.
In the article “Error detection as mathematical catalyst” Brijlall (2011) shows errors that were
detected from a certain provincial senior certificate trial examination paper in 2010. The
detected errors started email discussions among a number of mathematics educators. The
errors were in the marking memorandum, with two alternative solutions. Both solutions
contained mathematical errors that may mislead teachers who do not check whether the
solutions provided are correct or not. The question and the solutions shown were taken from
an article by Brijlall (2011).
Question
In ΔABC, kA ˆ , pB ˆ , tC ˆ and sin k = 2 sin p sin t. Prove that ΔABC is an isosceles
triangle.
Solution 1
In ΔABC: 180ˆˆˆ CBA
C B
A
p t
k
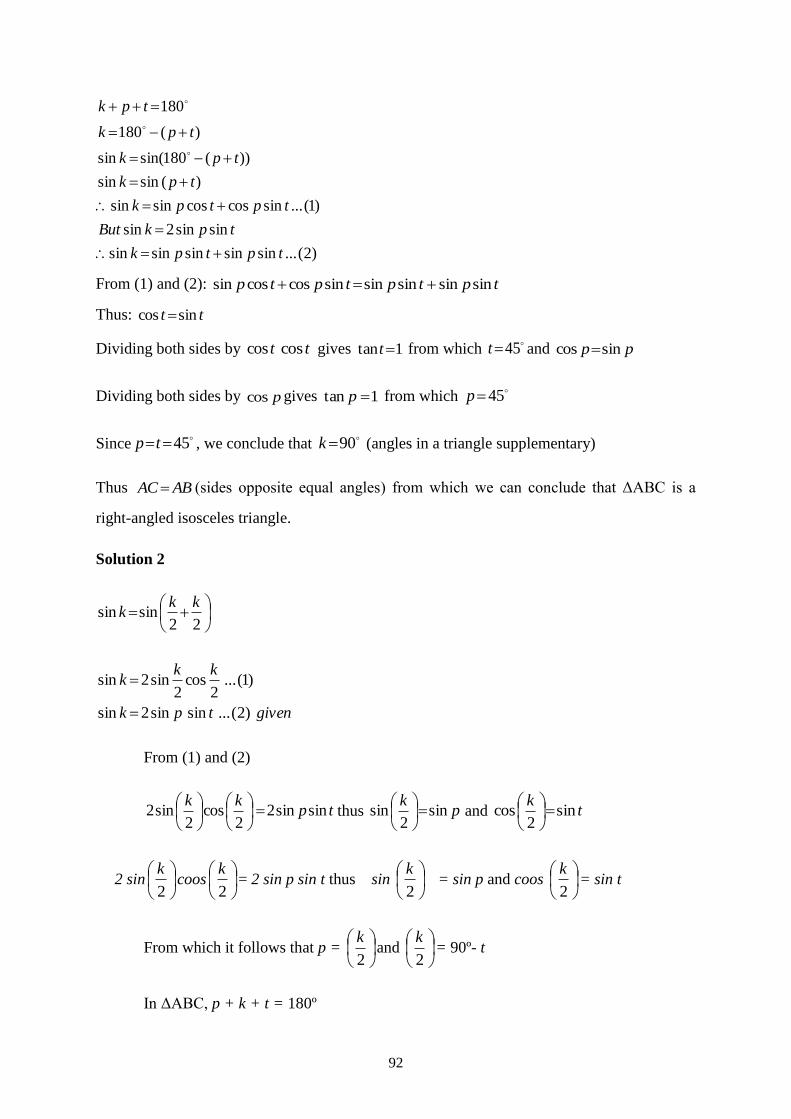
92
)2(...sinsinsinsinsin
sinsin2sin
)1(...sincoscossinsin
)(sinsin
))(180sin(sin
)(180
180
tptpk
tpkBut
tptpk
tpk
tpk
tpk
tpk
From (1) and (2): tptptptp sinsinsinsinsincoscossin
Thus: tt sincos
Dividing both sides by tcos tcos gives 1tan t from which 45t and pp sincos
Dividing both sides by pcos gives 1tan p from which 45p
Since45tp , we conclude that
90k (angles in a triangle supplementary)
Thus ABAC (sides opposite equal angles) from which we can conclude that ΔABC is a
right-angled isosceles triangle.
Solution 2
22sinsin
kkk
giventpk
kkk
)2(...sinsin2sin
)1(...2
cos2
sin2sin
From (1) and (2)
tpkk
sinsin22
cos2
sin2
thus p
ksin
2sin
and t
ksin
2cos
2 sin
2
kcoos
2
k= 2 sin p sin t thus sin
2
k= sin p and coos
2
k= sin t
From which it follows that p =
2
kand
2
k= 90º- t
In ΔABC, p + k + t = 180º
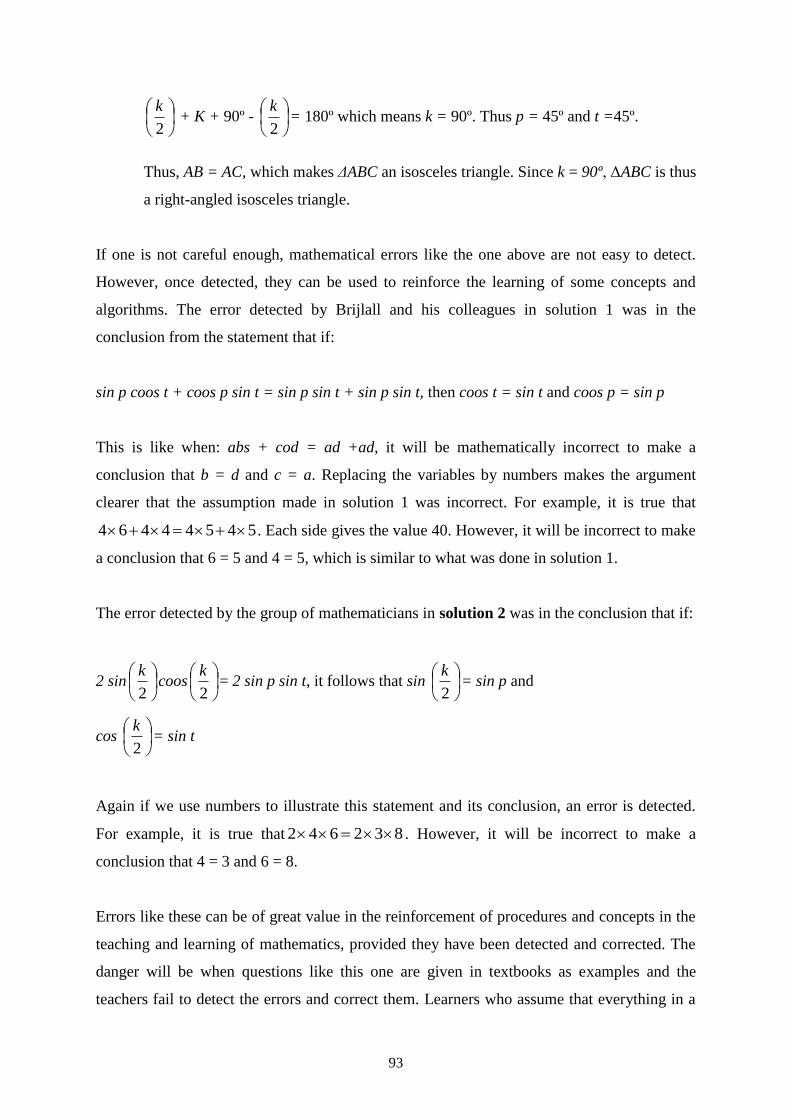
93
2
k + K + 90º -
2
k= 180º which means k = 90º. Thus p = 45º and t =45º.
Thus, AB = AC, which makes ΔABC an isosceles triangle. Since k = 90º, ΔABC is thus
a right-angled isosceles triangle.
If one is not careful enough, mathematical errors like the one above are not easy to detect.
However, once detected, they can be used to reinforce the learning of some concepts and
algorithms. The error detected by Brijlall and his colleagues in solution 1 was in the
conclusion from the statement that if:
sin p coos t + coos p sin t = sin p sin t + sin p sin t, then coos t = sin t and coos p = sin p
This is like when: abs + cod = ad +ad, it will be mathematically incorrect to make a
conclusion that b = d and c = a. Replacing the variables by numbers makes the argument
clearer that the assumption made in solution 1 was incorrect. For example, it is true that
54544464 . Each side gives the value 40. However, it will be incorrect to make
a conclusion that 6 = 5 and 4 = 5, which is similar to what was done in solution 1.
The error detected by the group of mathematicians in solution 2 was in the conclusion that if:
2 sin
2
kcoos
2
k= 2 sin p sin t, it follows that sin
2
k= sin p and
cos
2
k= sin t
Again if we use numbers to illustrate this statement and its conclusion, an error is detected.
For example, it is true that 832642 . However, it will be incorrect to make a
conclusion that 4 = 3 and 6 = 8.
Errors like these can be of great value in the reinforcement of procedures and concepts in the
teaching and learning of mathematics, provided they have been detected and corrected. The
danger will be when questions like this one are given in textbooks as examples and the
teachers fail to detect the errors and correct them. Learners who assume that everything in a
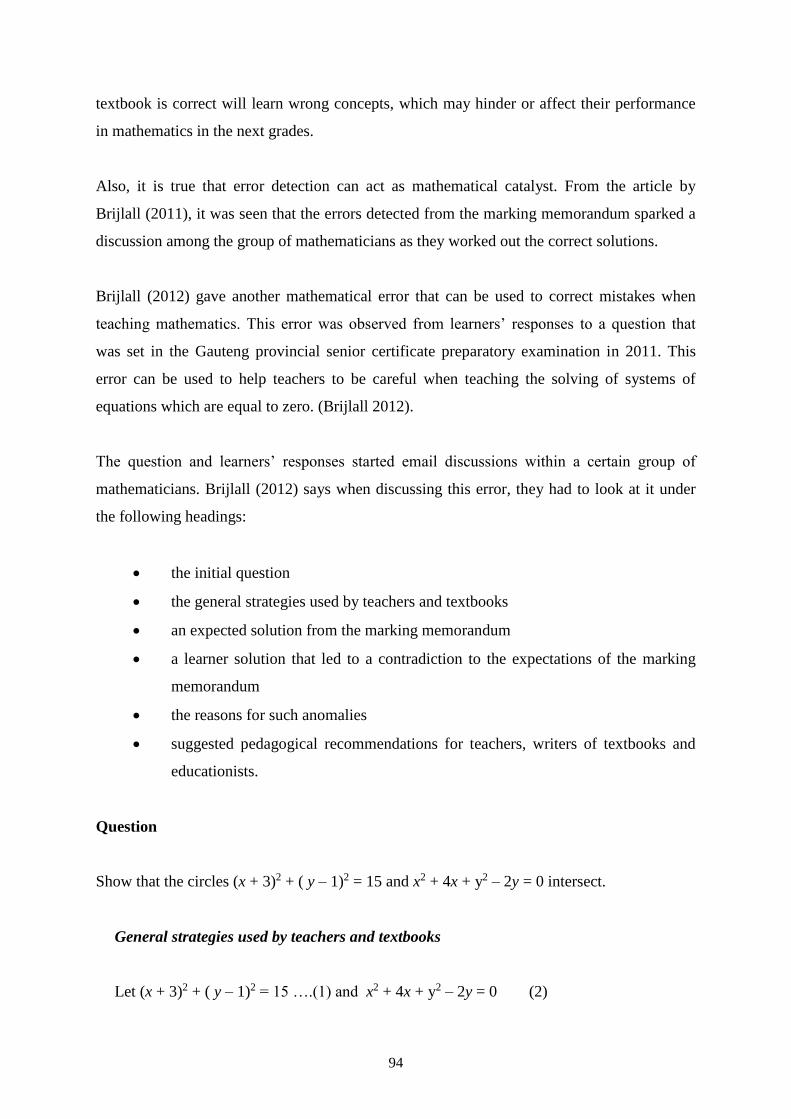
94
textbook is correct will learn wrong concepts, which may hinder or affect their performance
in mathematics in the next grades.
Also, it is true that error detection can act as mathematical catalyst. From the article by
Brijlall (2011), it was seen that the errors detected from the marking memorandum sparked a
discussion among the group of mathematicians as they worked out the correct solutions.
Brijlall (2012) gave another mathematical error that can be used to correct mistakes when
teaching mathematics. This error was observed from learners’ responses to a question that
was set in the Gauteng provincial senior certificate preparatory examination in 2011. This
error can be used to help teachers to be careful when teaching the solving of systems of
equations which are equal to zero. (Brijlall 2012).
The question and learners’ responses started email discussions within a certain group of
mathematicians. Brijlall (2012) says when discussing this error, they had to look at it under
the following headings:
the initial question
the general strategies used by teachers and textbooks
an expected solution from the marking memorandum
a learner solution that led to a contradiction to the expectations of the marking
memorandum
the reasons for such anomalies
suggested pedagogical recommendations for teachers, writers of textbooks and
educationists.
Question
Show that the circles (x + 3)2 + ( y – 1)2 = 15 and x2 + 4x + y2 – 2y = 0 intersect.
General strategies used by teachers and textbooks
Let (x + 3)2 + ( y – 1)2 = 15 ….(1) and x2 + 4x + y2 – 2y = 0 (2)
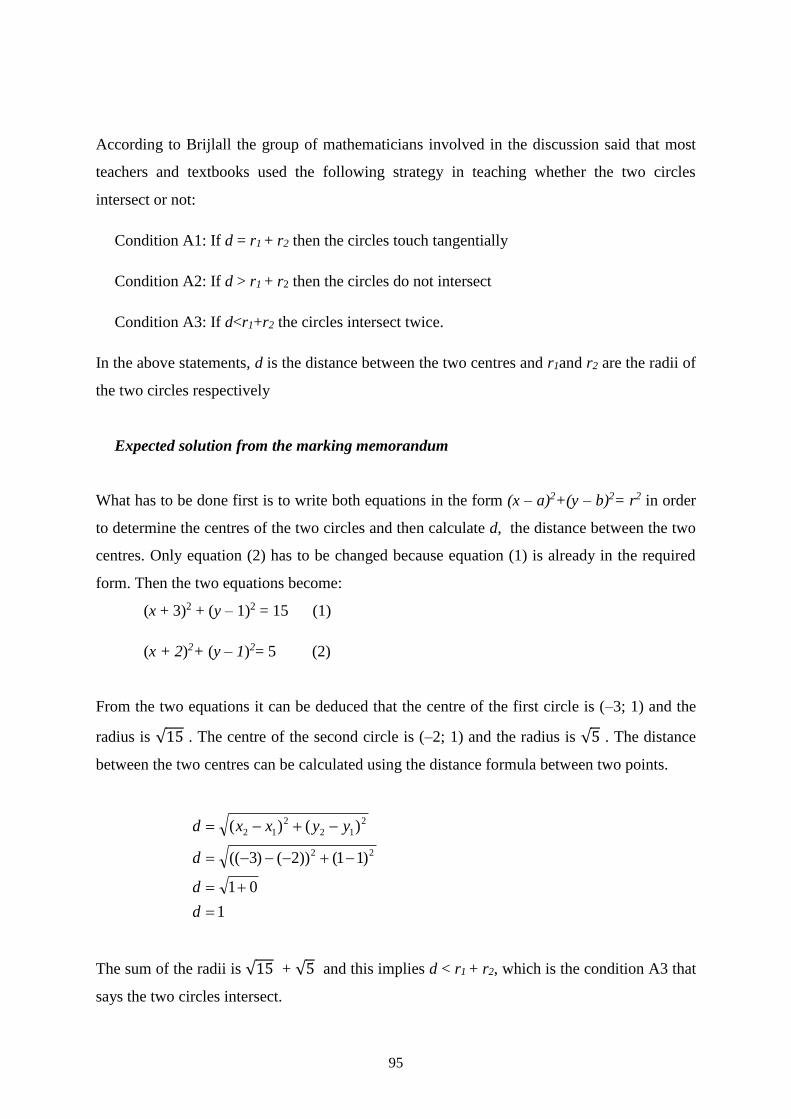
95
According to Brijlall the group of mathematicians involved in the discussion said that most
teachers and textbooks used the following strategy in teaching whether the two circles
intersect or not:
Condition A1: If d = r1 + r2 then the circles touch tangentially
Condition A2: If d > r1 + r2 then the circles do not intersect
Condition A3: If d<r1+r2 the circles intersect twice.
In the above statements, d is the distance between the two centres and r1and r2 are the radii of
the two circles respectively
Expected solution from the marking memorandum
What has to be done first is to write both equations in the form (x – a)2+(y – b)2= r2 in order
to determine the centres of the two circles and then calculate d, the distance between the two
centres. Only equation (2) has to be changed because equation (1) is already in the required
form. Then the two equations become:
(x + 3)2 + (y – 1)2 = 15 (1)
(x + 2)2+ (y – 1)2= 5 (2)
From the two equations it can be deduced that the centre of the first circle is (–3; 1) and the
radius is √15 . The centre of the second circle is (–2; 1) and the radius is √5 . The distance
between the two centres can be calculated using the distance formula between two points.
1
01
)11())2()3((
)()(
22
2
12
2
12
d
d
d
yyxxd
The sum of the radii is √15 + √5 and this implies d < r1 + r2, which is the condition A3 that
says the two circles intersect.
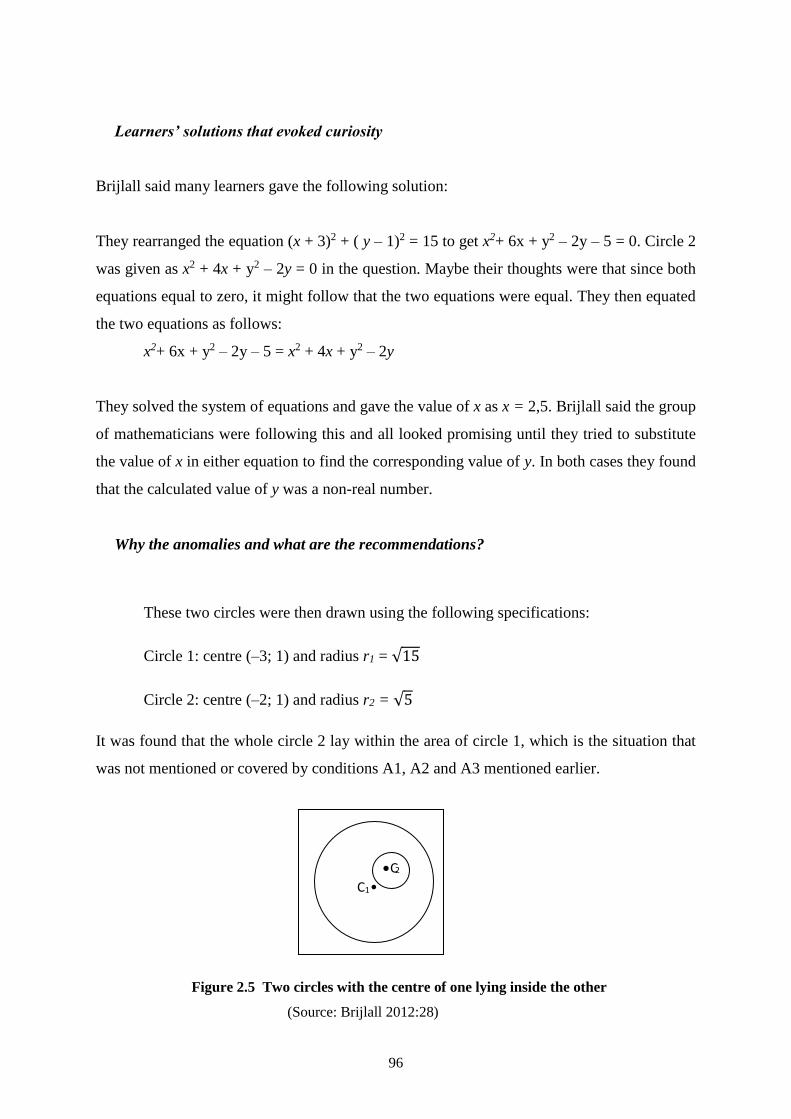
96
Learners’ solutions that evoked curiosity
Brijlall said many learners gave the following solution:
They rearranged the equation (x + 3)2 + ( y – 1)2 = 15 to get x2+ 6x + y2 – 2y – 5 = 0. Circle 2
was given as x2 + 4x + y2 – 2y = 0 in the question. Maybe their thoughts were that since both
equations equal to zero, it might follow that the two equations were equal. They then equated
the two equations as follows:
x2+ 6x + y2 – 2y – 5 = x2 + 4x + y2 – 2y
They solved the system of equations and gave the value of x as x = 2,5. Brijlall said the group
of mathematicians were following this and all looked promising until they tried to substitute
the value of x in either equation to find the corresponding value of y. In both cases they found
that the calculated value of y was a non-real number.
Why the anomalies and what are the recommendations?
These two circles were then drawn using the following specifications:
Circle 1: centre (–3; 1) and radius r1 = √15
Circle 2: centre (–2; 1) and radius r2 = √5
It was found that the whole circle 2 lay within the area of circle 1, which is the situation that
was not mentioned or covered by conditions A1, A2 and A3 mentioned earlier.
Figure 2.5 Two circles with the centre of one lying inside the other
(Source: Brijlall 2012:28)
C1
C
2 •
2
•
97
These new situations made it necessary for the group of mathematicians to look for new
conditions that would cater for conditions not covered by conditions A1, A2 and A3.
Conditions A1, A2, and A3 only covered situations for circles whose centres lie outside each
other.
Brijlall (2012) explains that the group of mathematicians then thought of two possibilities:
one was when the centre of the other lay in the circumference of another, and the second
possibility was when the centre of one circle lay inside the other circle. These possibilities
resulted in the new conditions shown here:
Condition B1: If d = r1 – r2, then the circle touches tangentially.
Condition B2: If d > r1 – r2, then there are two points of intersection.
Condition B3: If d < r1 – r2, then there are no points of intersection.
Learners’ responses did not cover or cater for the new conditions. Instead, they equated the
two equations after making each equation equal to zero. The first equation was given as
(x + 3)2 + (y – 1)2 = 15, but the learners rearranged it to be x2+ 6x + y2 – 2y – 5 = 0. The
second equation was given in the question as x2 + 4x + y2 – 2y = 0. The error started when
learners equated the two equations just because both equalled to zero. It is incorrect to say
that if f(x) = 0 and g(x) = 0, then f(x) = g(x).
Brijlall (2012) illustrates the error made by learners by using two functions,
86)( 2 xxxf and 2410)( 2 xxxg . When each function is equated to zero, solve
for x in each, the solutions are as follows:
(a) 0862 xx (b) 024102 xx
(x + 2)(x + 4) = 0 024102 xx
x = 2 or x = –4 (x – 4)(x – 6) = 0
x = 4 or x = 6
98
From the above solutions, it can be seen that although both functions are equated to zero, they
do not give the same values of x. That is to say f(x) = g(x) is not true for any single value
of x. When f(x) and g(x) are equated and then written in standard form, they give a new
equation 01622 xx
f(x) = g(x)
0162
03242
0248106
241086
2
2
22
22
xx
xx
xxxx
xxxx
Solving 01622 xx using a quadratic formula shows that the discriminant (b2 – 4ac) is
less than zero. From the equation a = 1, b = –2 and c = 16. Therefore the discriminant
(b2 – 4ac) becomes b2 – 4ac = (–2)2 – 4(1) (16) = –60. If the discriminant is less than zero, it
means the equation has no real solution. Brijlall (2012) says this is what led to the
contradiction arrived at by learners when compared to the findings of the expected solution,
since learners started with the statement
x2+ 6x + y2 – 2y – 5 = x2 + 4x + y2 – 2y, which was a false statement.
The error detected in this section may be useful when it comes to the teaching and learning of
analytical geometry that deals with circles. An error like this one has shown educators what
to keep in mind when teaching this section:
(a) To be careful of the way they handle or teach solutions of a system of equations
(b) To be cautious of the location of centres of circles before giving such questions to
learners (Brijlall 2012).
A study conducted by Monthienvichienchai and Melis (2006) has shown that erroneous
examples can be useful; in many subjects to prevent students from making common mistakes
in a particular domain, for example, calculus in mathematics and systems design in computer
science. The study, which was conducted at a United Kingdom university, investigated how
first-year Information System undergraduates learnt through courseware containing real-
world erroneous examples derived from their peers and the obstacles they had to overcome to
implement effective e-learning support for using and creating such support.
99
However, it was found that students continued to make errors that were related to the
erroneous examples already given to them. To rectify this situation, they suggested that the
erroneous examples should actually come from the student population themselves or another
student population that has similar characteristics to the target-student population. Such
examples, compared with those from other sources, would be more grounded in the
experience of the students. The results of the study revealed that students found the
courseware to be very effective in dealing with their personal misconceptions.
The real-world examples are said to have an advantage over a collection of commonly made
mistakes in that they can provide the context for the errors as well as the process that was
actually involved in correcting the misconceptions. It is worth noting that showing the errors
and a corrected version may not address the misconceptions that the students may have, but
only the symptoms of the misconceptions. Students can learn from the experience of other
students once they understand the context of the error and the correction process.
.
Monthienvichienchai and Melis (2006) mention that previous research indicated that
including erroneous examples in a learning experience can serve the following purposes:
Improvement of learners’ motivation and influence on their attitude towards
failure and success
Proper understanding of concepts, which includes conceptual change in case of a
misconception and understanding a concept’s boundaries
Improve reasoning capabilities, e.g. the correct application of rules and the
application of correct rules as well as hierarchical/structured problem solving
Train meta-reasoning, including critical thinking and self-monitoring, and enforce
self-explanation to judge solution steps as correct or faulty
Encourage exploration. The use of erroneous examples help even below-average
students to start questioning and exploring mathematics
Change attitudes. Learners’ attitude of saying “if you can’t solve a problem in a
few minutes, then you can’t solve it at all” is changed (Monthienvichienchai &
Melis 2006).
100
2.9 CONCLUSION
From the literature review done in this study, it can be seen that there are many factors that
cause learners to perform poorly in mathematics and at the same time many things to be done
to correct the situation. Some literature reviewed in this chapter highlighted the cause of poor
performance in mathematics generally, and in calculus in particular.
The next chapter deals with the research design and methodology used in conducting the
study. All major procedures followed in carrying out this research are described in Chapter 3.
101
CHAPTER 3
RESEARCH METHODOLOGY AND DESIGN
3.1 INTRODUCTION
In this chapter the research design and methodology are described. These include sampling,
data collection and data analysis. The researcher outlines the research approach, research
method, population and sampling method, data collection techniques and ethical
considerations.
Research methodology and research design seem similar, but they are different. According to
Jacobs (2005) research methodology focuses on the research process and the kind of tools
and procedures to be used such as document analysis, survey methods and analysis of
existing (secondary) data/statistics. In this research, an analysis of learners’ scripts was used
as a research method.
In terms of research design, Jacobs (2005) explains that it refers to the plan according to
which the study is executed. It refers to all the planning involved regarding the study as well
as all the decisions that the researcher had to make in order to answer the research question as
effectively and efficiently as possible. In other words, research design describes the major
procedure to be followed in carrying out a research. It is a specification of the operations to
be performed.
3.2 RESEARCH APPROACH
The focus of this study was the causes of the poor performance by Grade 12 learners in tasks
based on the application of calculus. It was designed in such a way that it had to try to answer
the research questions mentioned in chapter 1, section 1.3. The data for this research came
from the analysis of learners’ scripts and this made the study qualitative research. Learners’
scripts for the May test, June (midyear) and Trial examinations were used in order to explore
the possible causes of the poor performance in calculus-based tasks. No special tests were set
for the study. The scripts that were analysed were the ones learners used to answer formal
102
tasks for accumulating marks for continuous or school-based assessment (SBA). In short, the
tasks were written under the normal day-to-day conditions.
Creswell (2014) defines qualitative research as an approach for exploring and understanding
the meaning individuals or groups ascribe to a social or human problem. The process of
research involves emerging questions and procedures, data that is collected in the
participant’s setting, data analysis inductively building from particulars to general themes,
and the researcher making interpretations of the meaning of the data (Creswell 2014).
In qualitative research, the main goal is to relate or describe incidents or events of individuals
in their natural setting such as an organisation, a school, workplace or home. That is to say,
qualitative research is conducted in the natural setting for which the study was proposed. In
this study the natural setting was the schools that were involved in the study.
3.3 RESEARCH METHOD
The data for this study was collected from the analysis of learners’ scripts for three formal
tasks, namely the May common test, and the June and Trial examinations. This means the
study used a document analysis method. Bowen (2009) defines document analysis as a
systematic procedure for reviewing or evaluating documents, in both printed and electronic
format. Documents contain text (words) and images that have been recorded without a
researcher’s intervention. Document analysis requires that data to be examined and
interpreted in order to elicit meaning, gain understanding and develop empirical knowledge
(Bowen 2009).
3.4 POPULATION AND SAMPLING
It would be wise to begin this section by stating the difference between the two terms
population and sample. McMillan and Schumacher (2010) define population as a group of
elements or cases that conform to specific criteria and to which the researcher intend to
generalise the results of the research. In other words, a population in a research is the total
group to which results can be generalised. This group of individuals have certain
characteristics that are of interest to a researcher. On the other side, McLeod (2014) defines
sampling as the process of selecting a representative group from the population under study.
103
He then calls the group of people who take part in the research a sample and refers to the
people who take part in the study as participants. Regarding this study it can be said that all
the Grade 12 learners doing mathematics in the Gert Sibande district can be referred to as the
population while the learners taking mathematics in the three selected schools can be termed
as the sample.
The study was carried in one circuit of the Gert Sibande district in the Mpumalanga province.
The Msukaligwa 1 Circuit was chosen because it is a performing circuit and at the same time
it can provide data from former Model C and from other schools. This is the only circuit in
the Gert Sibande district that has more than one former Model C school. Altogether three
schools were involved in the study, one former Model C, one Mathematics, Science and
Technology Academy (MSTA), and one which is neither a former model C nor an MSTA
school. Since all schools offered mathematics, this means any school selected would have
learners that could be chosen as participants. However, not all learners from the selected
schools participated in the study since the participation was voluntary. Altogether, one
hundred and seventy one (171) candidates participated in the study. The numbers were not
distributed equally among the schools. For example, one school had 20, another 57 and the
other 94 candidates. The fact that the researcher had set certain criteria for selecting schools
to participate in the study, compelled him to use purposive sampling. In purposive sampling
the researcher looks for certain people or subjects that would be able to provide information
on the phenomenon being studied. Diversity rather than similarity is sought in the people that
are sampled. In this study the phenomenon was the possible causes of poor performance in
calculus. For this reason the researcher chose schools of different backgrounds and settings.
Etikan, Musa and Alkassim (2016) define purposive sampling or judgment sampling as the
deliberate choice of a participant due to the qualities the participant possesses. Purposive
sampling is a non-random technique that does not need underlying theories or a set number of
participants. In this study the researcher decided on what was to be known and required data
to get information. The researcher then decided on a group of people who could and were
willing to provide the information by virtue of knowledge or experience. Purposive sampling
is typically used in qualitative research to identify and select the information-rich cases for
the most proper utilisation of available resources. This involves identification and selection of
individuals or groups of individuals that are proficient and well-informed with a phenomenon
of interest (Etikan, Musa & Alkassim 2016).
104
The researcher chose the Grade 12 learners who were learning mathematics from schools
with different characteristics so that data would come from learners from different
backgrounds. The fact that the researcher selected learners that had learnt calculus thus
qualified the sampling method to be a purposive one.
3.5 DATA COLLECTION TECHNIQUES
The data for this study was extracted from the learners’ scripts for the May test, and the June
and Trial examinations. Data collection started after the Research Ethics Committee at the
University of South Africa had approved the Research Ethic application and permission was
granted by the District Director and principals of the schools. Parents and learners also had to
give the researcher permission to use copies of learners’ marked scripts.
Teachers at the three schools involved in the study were asked to make copies of the learners’
marked scripts for the formal tasks, namely the May test and the June and Trial examinations.
The portions to be copied were the ones that covered cubic graphs and the application of
differential calculus.
Teachers were asked to erase any form of identification before they made copies. No copy
would bear any learner’s name in order to protect their identities. The researcher then
collected all the copies for analysis after teachers had confirmed that they had finished
marking and making copies. Copies that were made belonged to the learners, whose parents
had agreed that copies of their children’s scripts could be used in the study, and the learners
also agreed to participate in the study.
3.6 TRUSTWORTHINESS OF A RESEARCH STUDY
Any research, whether quantitative or qualitative, has to be of good quality so that its findings
can be trusted. Validity, reliability and objectivity are used to judge the quality of a
quantitative research project. On the other hand, the criteria for judging qualitative research
are credibility, transferability, dependability and confirmability. Since this study entails
qualitative research, more attention was given to the criteria used to judge it.
105
3.6.1. Credibility
McMillan and Schumacher (2010) define credibility as the extent to which the results
approximate reality and are judged to be accurate, trustworthy and reasonable. They explain
that credibility is strengthened or enhanced when the researcher takes into account sources of
errors that may undermine the quality of the research, findings and conclusions. Credibility,
in other words, indicates whether the results represent reality and can be trusted.
Credibility according to Holloway and Wheeler (2002), Macnee and Maccabe (2008, in
Anney 2014) is defined as the confidence that can be placed in the truth of the research.
Anney (2014) mentions that credibility strategies that can be used to make the research
trustworthy. These are prolonged engagement in the field or research site, use of peer
triangulation, negative case analysis, member checks and persistent observations.
To make this study credible the use of peer debriefing was employed throughout. According
to Anney (2014) peer debriefing means that the researcher has to seek support from other
professionals to get guidance. These include members of the academic staff (in this case, the
supervisor), in the postgraduate dissertational department. Anney says that feedback from
peers helps the researcher to improve the quality of the research.
3.6.2. Transferability
According to Bilsch (2005), Tobin and Begley (2004, in Anney 2014), transferability refers
to the degree to which the results of qualitative research can be transferred to other contexts
with other respondents. Bilsch (2005, in Anney 2014) says that the researcher makes
transferability much easier to the potential user by providing a detailed description of how the
investigation and participants were selected purposively.
This study promoted transferability as all the detail why it had to be conducted and how the
participants were selected was provided. The researcher gave a report from data collection,
context from the study, up to the writing of the final report (Shenton 2004 in Anney 2014).
106
A full description helps other researchers to replicate (repeat) the study with similar
conditions in other settings (Anney 2014:278).
Also, it has already been mentioned in this section that transferability can be made much
easier when participants are selected purposively. Purposive sampling is defined as selecting
units (e.g. individuals, groups and institution) based on specific purposes associated with
answering a researcher’s study questions (Teddlie & Yu 2007 in Anney 2014). Since this
study used purposive sampling, this means transferability was facilitated in this study.
3.6.3. Dependability
Bilsch (2005 in Anney 2014) explains that dependability refers to the stability of finding over
time. Dependability involves participants evaluating the findings and the interpretation and
recommendations of the study to make sure that they are all supported by the data received
from the informants of the study.
Teachers of the selected schools were informed of the findings and recommendations. They
had to scrutinise the report to check whether it emanated from the data collected from them.
3.6.4. Confirmability
According to Baxter and Eyles (1997) in Anney (2014), confirmability refers to the degree to
which the results of an investigation could be confirmed by other researchers. Confirmability
is mainly concerned about checking whether the data and the interpretation of the findings are
not the imagination of the researcher, but have been derived from the data. According to
Bowen (2009) in Anney (2014) confirmability in a qualitative research is achieved through a
reflexive journal and triangulation. Belk (1989 in Anney 2014) describes a reflexive journal
as the reflexive documents kept by the researcher in order to reflect on tentatively interpreting
and planning data collection.
Denzin (1970) in Bryman (2003) gives four types of triangulation, namely data, investigator,
and theoretical and methodological triangulation. Data triangulation has been described as the
gathering of data through several sampling strategies so that data is collected at different
times and social situations, as well as on a variety of people (Bryman 2003). In this study,
107
data was collected at different times and different settings (May tests, Mid-year and Trial
examinations), thus applying data triangulation. Cohen, Manion and Morrison (2000) in
Prosser (nd) define triangulation as the use of two or more methods of data collection in the
study of some aspects of human behaviour.
In summary, confirmability ensures that the findings of the study are the results of responses
from participants rather than the opinions and preferences of the researcher. In this study,
confirmability was intensified by the inclusion of some learners’ responses in the findings
(Chapter 4). Data triangulation, where data was collected at different times and in different
settings, made the results of this study reliable and trustworthy.
3.7 RESEARCH ETHICS
Before the research was started, permission to do the study was sought from the Head of the
Provincial Education Department, Mpumalanga, which she granted (Appendix D).
Permission was also asked from the District Director (Appendix E), Circuit Manager of
Msukaligwa 1 circuit (Appendix F) and from the principals of the selected schools (Appendix
G). All the procedures of collecting data were explained to them so that they would know
beforehand that this was not going to disrupt their normal teaching and learning activities.
Learners were going to write their formal tasks in the usual or normal situations.
A further request was made to the parents of learners and learners themselves who
volunteered to participate in the study for permission to use learners’ scripts in the study. The
examples of completed parents’ consent letters and learners’ assent are included as
Appendix H and Appendix I respectively.
In both the consent and assent letters, it was explained that participation in the study was
voluntary and had no impact or bearing on the evaluation or assessment of the learner in any
studies or course while at school. A learner that had decided to participate in the study was
free to stop taking part at any time by notifying the researcher. No one would criticise a
learner for their decision.
When conducting this study, the rights and welfare of the participants were considered. In a
full disclosure of doing this study, the rights and welfare of the participants were taken into
108
account. A full disclosure of the purpose of the study was given to the principals and teachers
of the schools involved. The information would not be given to the learners for fear that a
disclosure to them would affect the validity of the results. They had to write the tasks as
usual, without any fear or anxiety that their performance was going to be used in the study.
The privacy of participants was considered in the research. McMillan and Schumacher (2010)
suggests three practices that can be used by a researcher to ensure privacy, namely
anonymity, confidentiality and the appropriate storage of data.
Anonymity means that the researcher cannot identify the participants from the information
that has been gathered (McMillan & Schumacher 2010). In carrying out this study teachers
were asked to make copies of learners’ scripts only regarding questions involving cubic
graphs and applications of calculus. No names of learners would be shown on the copies and
in teachers’ questionnaires. This was done to protect their rights and welfare. According to
McMillan and Schumacher (2010) one of the limitations of educational research is the legal
and ethical considerations. Since educational research focuses mainly on humans, the
researcher is ethically responsible for protecting the rights and the welfare of the participants.
As mentioned earlier, no learners’ names would appear on the scripts. This was done to
ensure confidentiality. McMillan and Schumacher (2010) explain that confidentiality means
that no one will have access to individual data or the names of participants except the
researcher and the participants. Teachers were asked to erase learners’ names and the name of
the school before they made the copies. In this way the researcher made sure that no name
would be linked to any form of data. Another way of protecting the privacy of participants
was the storage of data. Even though these copies would contain no learners’ names, they
would be kept in a safe place at home. After five years these scripts will be destroyed or
burnt. Any data that is kept or stored as a soft copy will be protected by a secret password
until it is deleted after five years.
3.8 CONCLUSION
This study was conducted at the Gert Sibande District in Mpumalanga. It used a qualitative
research approach. In this research data was collected in a natural setting, which was the
schools involved in the study. The tasks used for the study were written under the
109
uncompromising and firm conditions of writing a test or examination. Questions that
involved cubic graphs and the application of differential calculus were taken from the 2016
Grade 12 May Common Test, the June and the Trial examinations. Also mentioned in this
chapter was the outline of how the research was conducted, the research method, the research
approach, the methods of data collection, the selection of the sample and the ethical
considerations.
The next chapter deals with the results and data analysis. The chapter first reviews questions
on calculus that were used in the study. This is followed by the analysis of learners’ scripts
with the aim of finding possible factors that cause poor performance in calculus-based tasks.
Data that emerged from learners’ scripts is grouped into themes that are supported by data in
the form of excerpts (extracts) from learners’ responses.
110
CHAPTER 4
RESULTS AND DATA ANALYSIS
4.1 INTRODUCTION
This chapter covers the cubic graphs and application of differential calculus questions that
were included in the three formal tasks written by Grade 12 learners in the Mpumalanga
province. This is followed by a data analysis, where learners’ responses to these questions are
analysed using four of the five strands defined by Kilpatrick. Common errors,
misconceptions, lack of understanding of mathematical concepts, lack of skills needed to
solve calculus problems, and challenges posed by language, are revealed in this chapter. The
last part of the chapter deals with data interpretation and discussion.
Three formal tasks were used to collect data for the study. The three formal tasks used are
part of the assessment that contributes to coursework assessment or school-based assessment
(SBA). In South Africa, Grade 12 learners are expected to do seven tasks as part of school-
based assessment and these are composed of three tests, a project or investigation, an
assignment, and the June (midyear) and Preparatory (Trial) examinations.
The assignment and project or investigation is written in a relaxed atmosphere and may be
done outside the classroom. Using these two tasks for the study would not have given an
accurate assessment of learners’ performance because they could be assisted at home by
parents or siblings. This made the researcher opt for a test and the other two examinations
because learners write these under strict supervision where they are not assisted in answering
the questions.
Only questions involving cubic graphs and the application of differential calculus were
extracted from these three tasks because this study intended exploring the causes of poor
performance by Grade 12 learners in these two subtopics of calculus. The main task of the
researcher in analysing learners’ responses was to interpret how learners thought and
responded to different mathematics questions involving calculus. The researcher had to note
common errors, misconceptions and a lack of knowledge in solving certain questions. The
researcher tried to find out, where possible, why learners made those mistakes. Learners’
111
performance varied, with some showing full understanding of what they had to do, others
understood partially, while some candidates were totally lost.
4.2 QUESTION 4 FROM THE MAY TEST
Below is question 4 from the May test written by schools in the Gert Sibande District. No
questions were set on the application of differential calculus, only a section on cubic graphs
was tested in this task. The marking memorandum is also included at the end of the question.
In order to give a picture of what was expected from candidates – that is, learners taking an
examination – in answering the above questions, the marking memorandum for question 4 is
given. It indicates exactly when and where to award a mark. If followed correctly, candidates
would score marks for correct working even if the final answer was incorrect. However, the
marking memorandum could not provide possible alternative methods of finding the
solutions to the questions. There were instances where teachers did not adhere to the marking
memorandum and as a result candidates lost some marks they deserved.
4.2.1. Subquestion 4.1.1
Determine the coordinates of A and B.
The question required from candidates to find the coordinates of points A and B, which are
the turning points of the graph. Candidates had to first find the first derivative of the function,
equate the derivative to zero and then solve for x . They had to take the calculated values of x
and substitute to the original function in order to find the values of y.
Question 4.1.1 required candidates to calculate the coordinates of points A and B, which are
the turning points of the graph. To find the coordinates, they must start by finding the first
derivative of the function and equate it to zero. At the turning point the value of the first
derivative is zero. This is because the gradient of the graph at the turning point is zero,
0/ xf . They had to come out with 01183 2 xx , factorise and solve for x . To find the
y-coordinates, candidates had to substitute the values of x into the original function, xf .
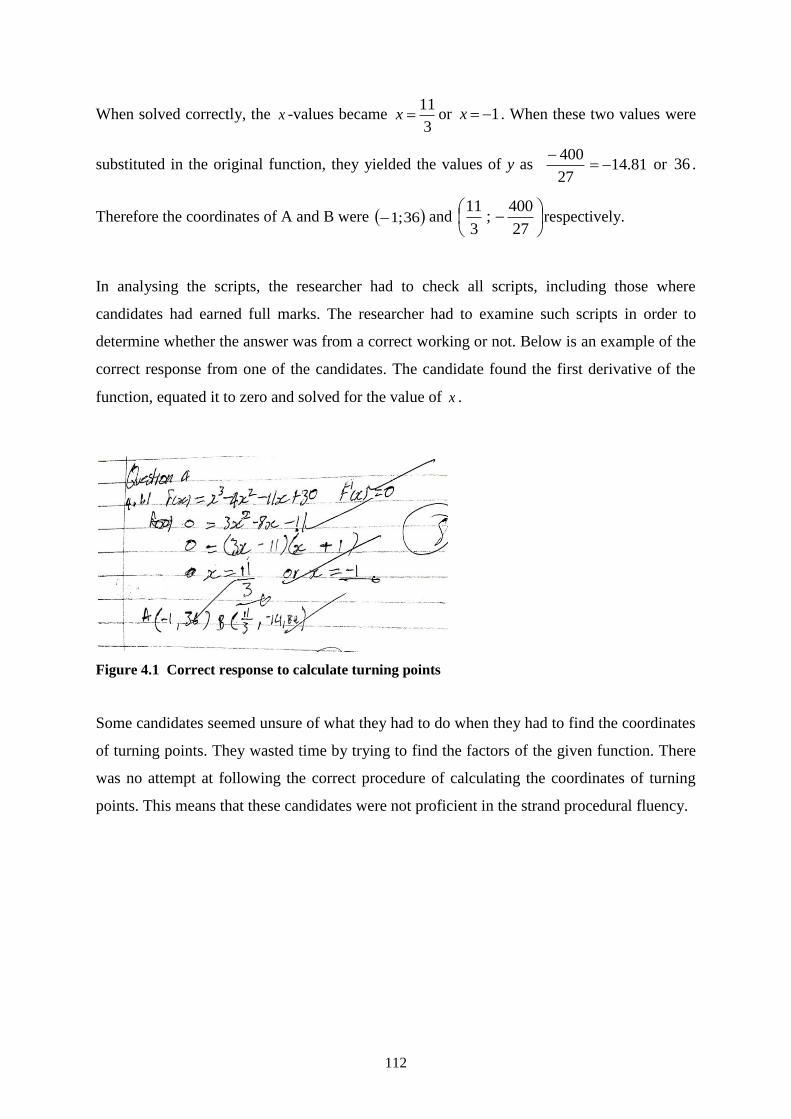
112
When solved correctly, the x -values became 3
11x or 1x . When these two values were
substituted in the original function, they yielded the values of y as 81.1427
400
or 36 .
Therefore the coordinates of A and B were 36;1 and
27
400;
3
11respectively.
In analysing the scripts, the researcher had to check all scripts, including those where
candidates had earned full marks. The researcher had to examine such scripts in order to
determine whether the answer was from a correct working or not. Below is an example of the
correct response from one of the candidates. The candidate found the first derivative of the
function, equated it to zero and solved for the value of x .
Figure 4.1 Correct response to calculate turning points
Some candidates seemed unsure of what they had to do when they had to find the coordinates
of turning points. They wasted time by trying to find the factors of the given function. There
was no attempt at following the correct procedure of calculating the coordinates of turning
points. This means that these candidates were not proficient in the strand procedural fluency.
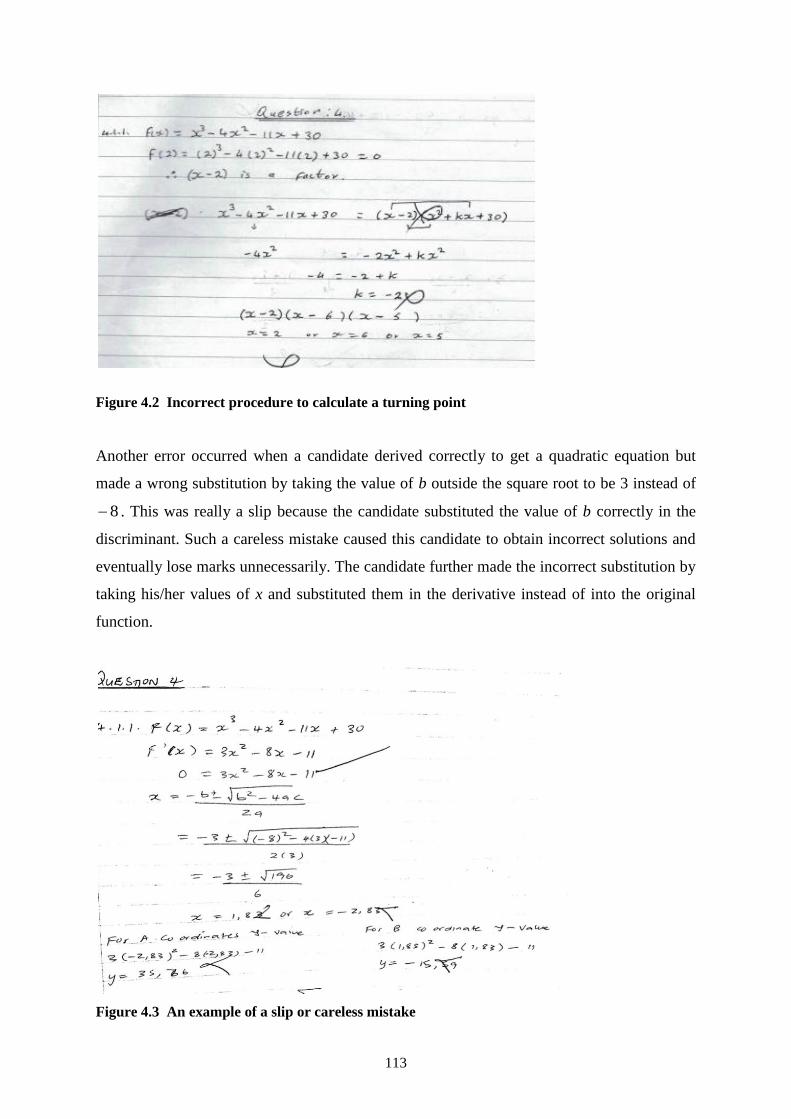
113
Figure 4.2 Incorrect procedure to calculate a turning point
Another error occurred when a candidate derived correctly to get a quadratic equation but
made a wrong substitution by taking the value of b outside the square root to be 3 instead of
8 . This was really a slip because the candidate substituted the value of b correctly in the
discriminant. Such a careless mistake caused this candidate to obtain incorrect solutions and
eventually lose marks unnecessarily. The candidate further made the incorrect substitution by
taking his/her values of x and substituted them in the derivative instead of into the original
function.
Figure 4.3 An example of a slip or careless mistake
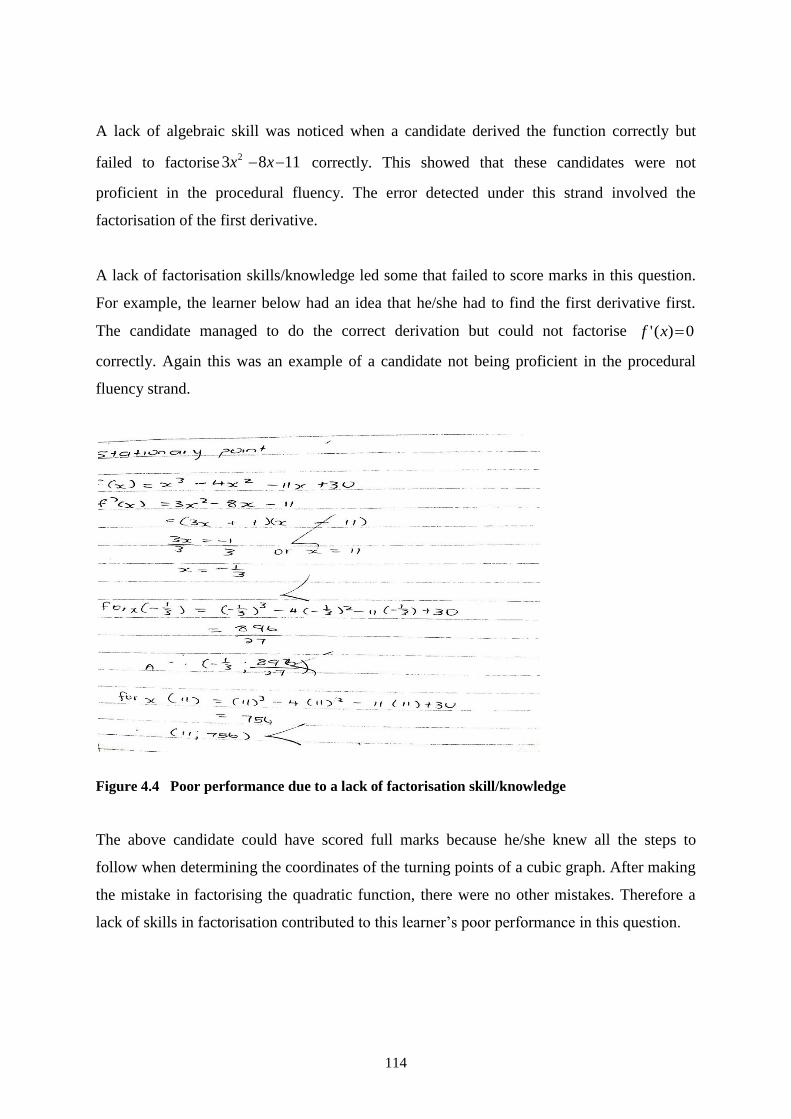
114
A lack of algebraic skill was noticed when a candidate derived the function correctly but
failed to factorise 1183 2 xx correctly. This showed that these candidates were not
proficient in the procedural fluency. The error detected under this strand involved the
factorisation of the first derivative.
A lack of factorisation skills/knowledge led some that failed to score marks in this question.
For example, the learner below had an idea that he/she had to find the first derivative first.
The candidate managed to do the correct derivation but could not factorise 0)(' xf
correctly. Again this was an example of a candidate not being proficient in the procedural
fluency strand.
Figure 4.4 Poor performance due to a lack of factorisation skill/knowledge
The above candidate could have scored full marks because he/she knew all the steps to
follow when determining the coordinates of the turning points of a cubic graph. After making
the mistake in factorising the quadratic function, there were no other mistakes. Therefore a
lack of skills in factorisation contributed to this learner’s poor performance in this question.
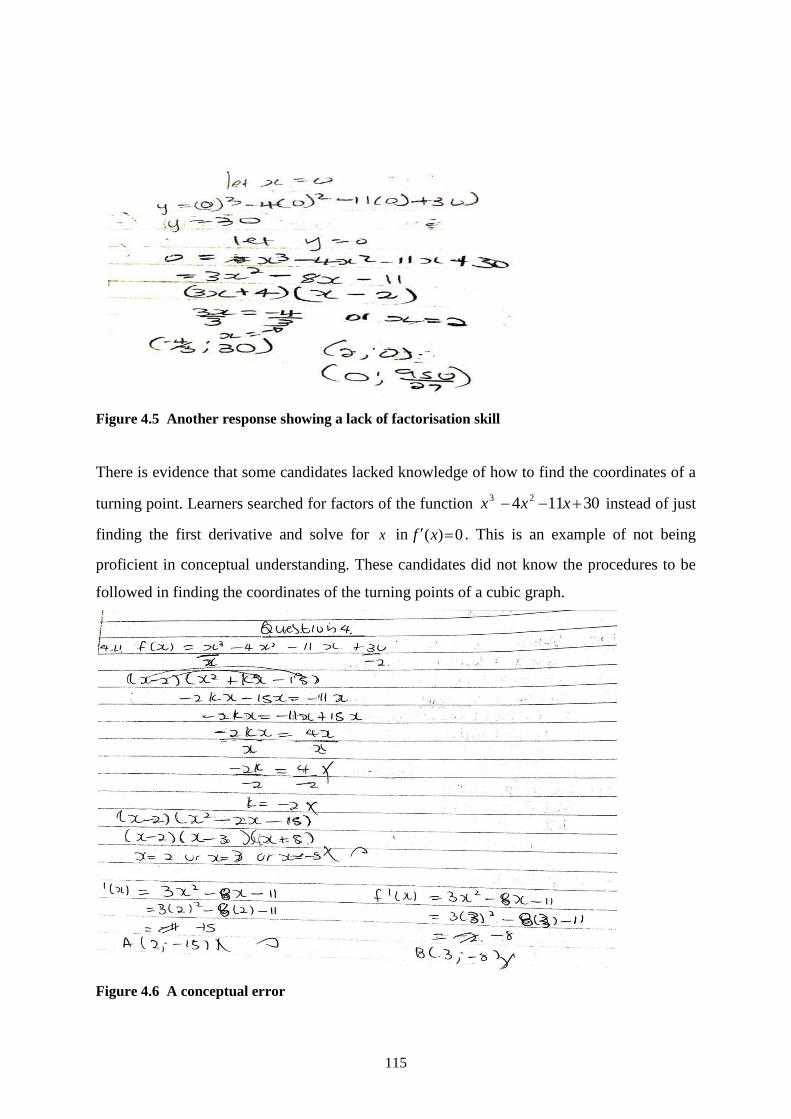
115
Figure 4.5 Another response showing a lack of factorisation skill
There is evidence that some candidates lacked knowledge of how to find the coordinates of a
turning point. Learners searched for factors of the function 30114 23 xxx instead of just
finding the first derivative and solve for x in 0)( xf . This is an example of not being
proficient in conceptual understanding. These candidates did not know the procedures to be
followed in finding the coordinates of the turning points of a cubic graph.
Figure 4.6 A conceptual error
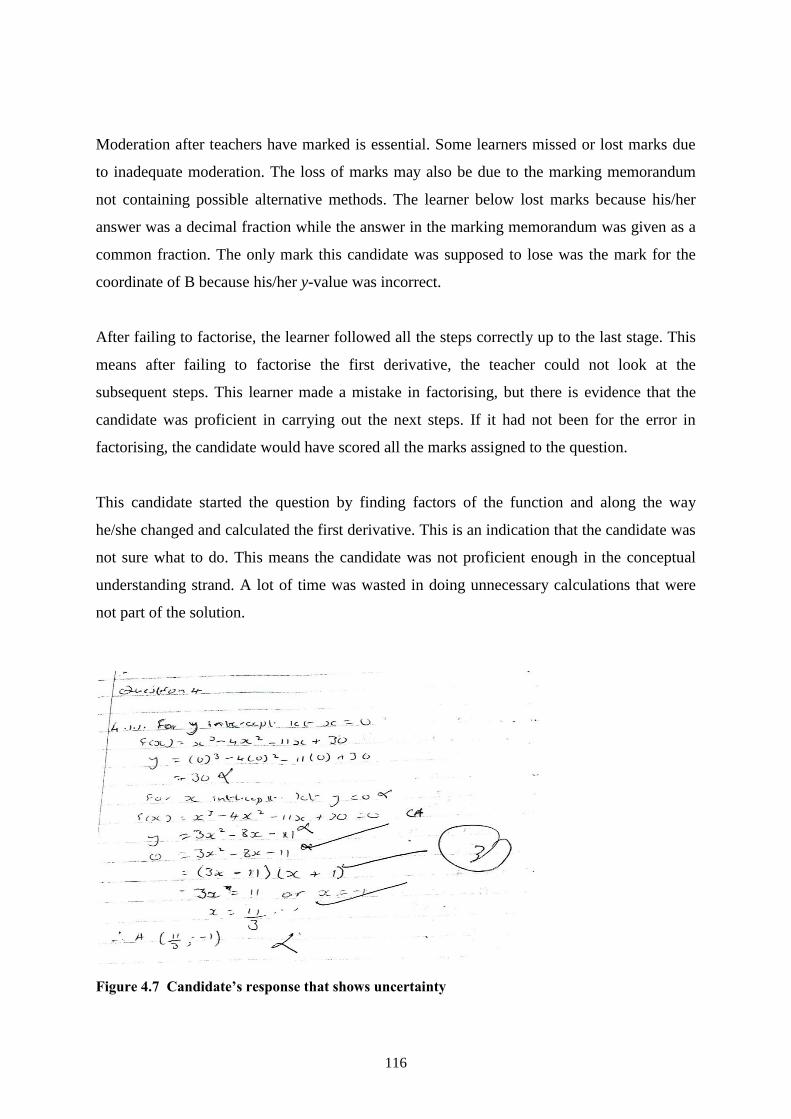
116
Moderation after teachers have marked is essential. Some learners missed or lost marks due
to inadequate moderation. The loss of marks may also be due to the marking memorandum
not containing possible alternative methods. The learner below lost marks because his/her
answer was a decimal fraction while the answer in the marking memorandum was given as a
common fraction. The only mark this candidate was supposed to lose was the mark for the
coordinate of B because his/her y-value was incorrect.
After failing to factorise, the learner followed all the steps correctly up to the last stage. This
means after failing to factorise the first derivative, the teacher could not look at the
subsequent steps. This learner made a mistake in factorising, but there is evidence that the
candidate was proficient in carrying out the next steps. If it had not been for the error in
factorising, the candidate would have scored all the marks assigned to the question.
This candidate started the question by finding factors of the function and along the way
he/she changed and calculated the first derivative. This is an indication that the candidate was
not sure what to do. This means the candidate was not proficient enough in the conceptual
understanding strand. A lot of time was wasted in doing unnecessary calculations that were
not part of the solution.
Figure 4.7 Candidate’s response that shows uncertainty
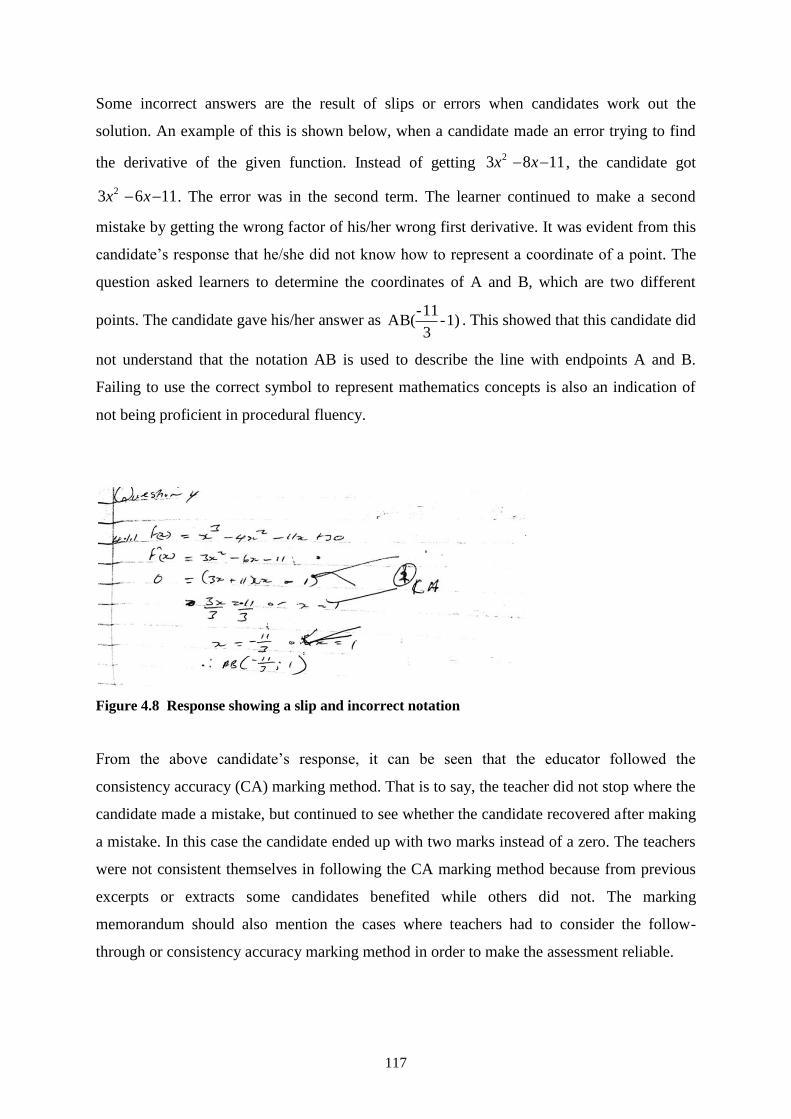
117
Some incorrect answers are the result of slips or errors when candidates work out the
solution. An example of this is shown below, when a candidate made an error trying to find
the derivative of the given function. Instead of getting 1183 2 xx , the candidate got
1163 2 xx . The error was in the second term. The learner continued to make a second
mistake by getting the wrong factor of his/her wrong first derivative. It was evident from this
candidate’s response that he/she did not know how to represent a coordinate of a point. The
question asked learners to determine the coordinates of A and B, which are two different
points. The candidate gave his/her answer as 1) -3
11-AB( . This showed that this candidate did
not understand that the notation AB is used to describe the line with endpoints A and B.
Failing to use the correct symbol to represent mathematics concepts is also an indication of
not being proficient in procedural fluency.
Figure 4.8 Response showing a slip and incorrect notation
From the above candidate’s response, it can be seen that the educator followed the
consistency accuracy (CA) marking method. That is to say, the teacher did not stop where the
candidate made a mistake, but continued to see whether the candidate recovered after making
a mistake. In this case the candidate ended up with two marks instead of a zero. The teachers
were not consistent themselves in following the CA marking method because from previous
excerpts or extracts some candidates benefited while others did not. The marking
memorandum should also mention the cases where teachers had to consider the follow-
through or consistency accuracy marking method in order to make the assessment reliable.
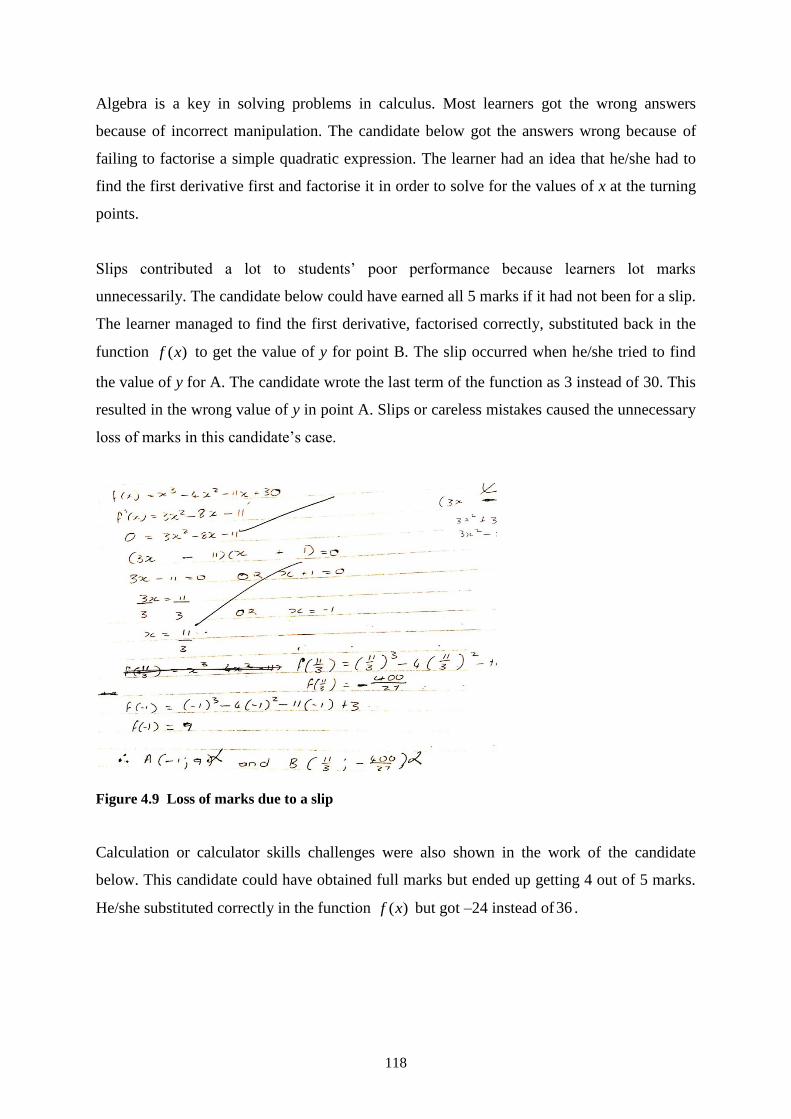
118
Algebra is a key in solving problems in calculus. Most learners got the wrong answers
because of incorrect manipulation. The candidate below got the answers wrong because of
failing to factorise a simple quadratic expression. The learner had an idea that he/she had to
find the first derivative first and factorise it in order to solve for the values of x at the turning
points.
Slips contributed a lot to students’ poor performance because learners lot marks
unnecessarily. The candidate below could have earned all 5 marks if it had not been for a slip.
The learner managed to find the first derivative, factorised correctly, substituted back in the
function )(xf to get the value of y for point B. The slip occurred when he/she tried to find
the value of y for A. The candidate wrote the last term of the function as 3 instead of 30. This
resulted in the wrong value of y in point A. Slips or careless mistakes caused the unnecessary
loss of marks in this candidate’s case.
Figure 4.9 Loss of marks due to a slip
Calculation or calculator skills challenges were also shown in the work of the candidate
below. This candidate could have obtained full marks but ended up getting 4 out of 5 marks.
He/she substituted correctly in the function )(xf but got –24 instead of36 .
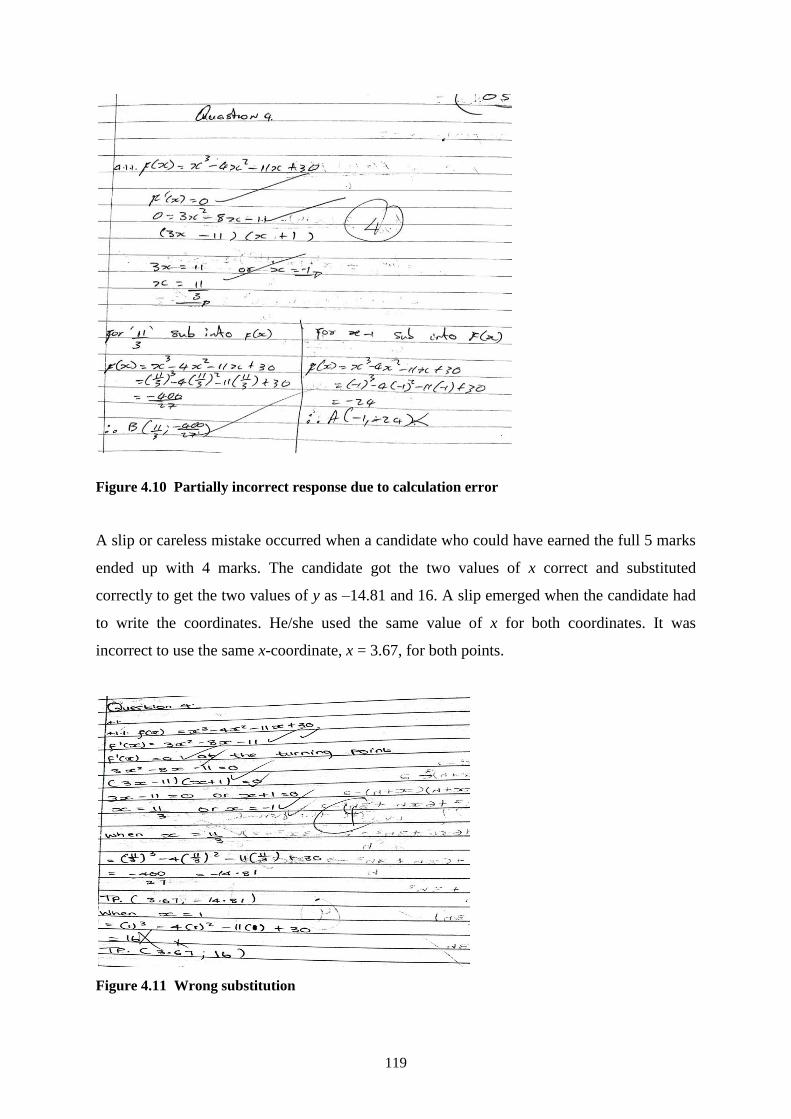
119
Figure 4.10 Partially incorrect response due to calculation error
A slip or careless mistake occurred when a candidate who could have earned the full 5 marks
ended up with 4 marks. The candidate got the two values of x correct and substituted
correctly to get the two values of y as –14.81 and 16. A slip emerged when the candidate had
to write the coordinates. He/she used the same value of x for both coordinates. It was
incorrect to use the same x-coordinate, x = 3.67, for both points.
Figure 4.11 Wrong substitution
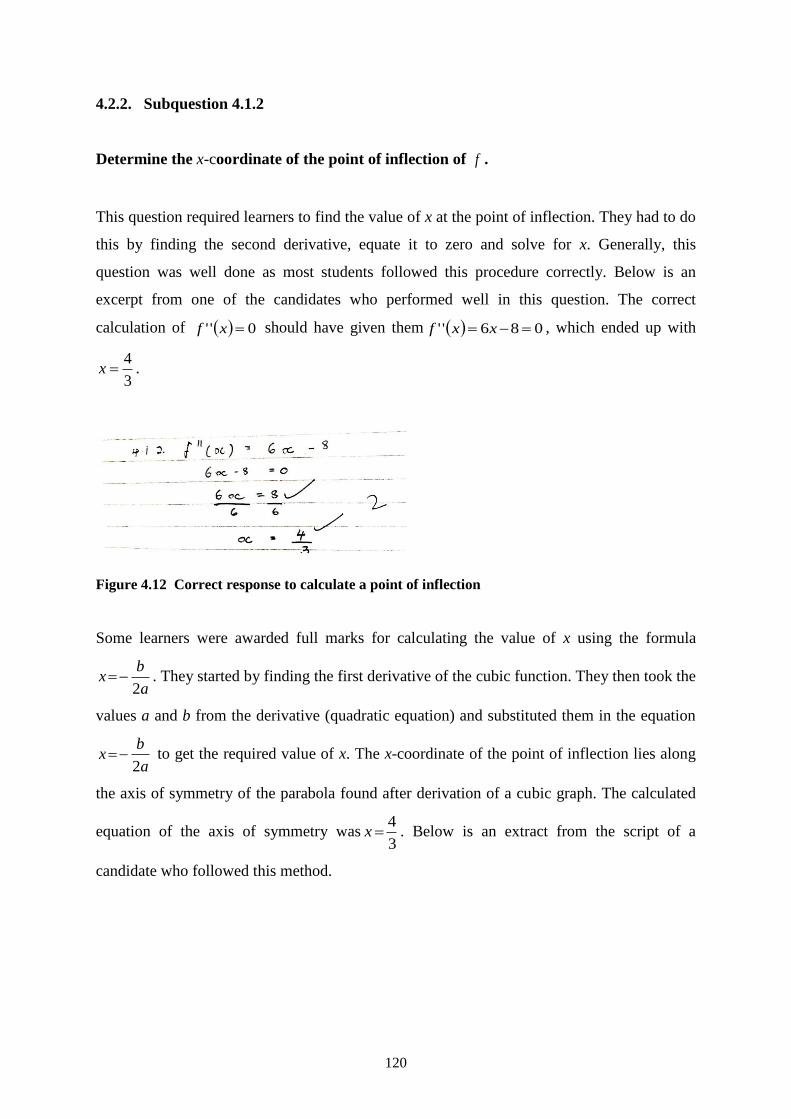
120
4.2.2. Subquestion 4.1.2
Determine the x-coordinate of the point of inflection of f .
This question required learners to find the value of x at the point of inflection. They had to do
this by finding the second derivative, equate it to zero and solve for x. Generally, this
question was well done as most students followed this procedure correctly. Below is an
excerpt from one of the candidates who performed well in this question. The correct
calculation of 0'' xf should have given them 086'' xxf , which ended up with
3
4x .
Figure 4.12 Correct response to calculate a point of inflection
Some learners were awarded full marks for calculating the value of x using the formula
a
bx
2 . They started by finding the first derivative of the cubic function. They then took the
values a and b from the derivative (quadratic equation) and substituted them in the equation
a
bx
2 to get the required value of x. The x-coordinate of the point of inflection lies along
the axis of symmetry of the parabola found after derivation of a cubic graph. The calculated
equation of the axis of symmetry was3
4x . Below is an extract from the script of a
candidate who followed this method.
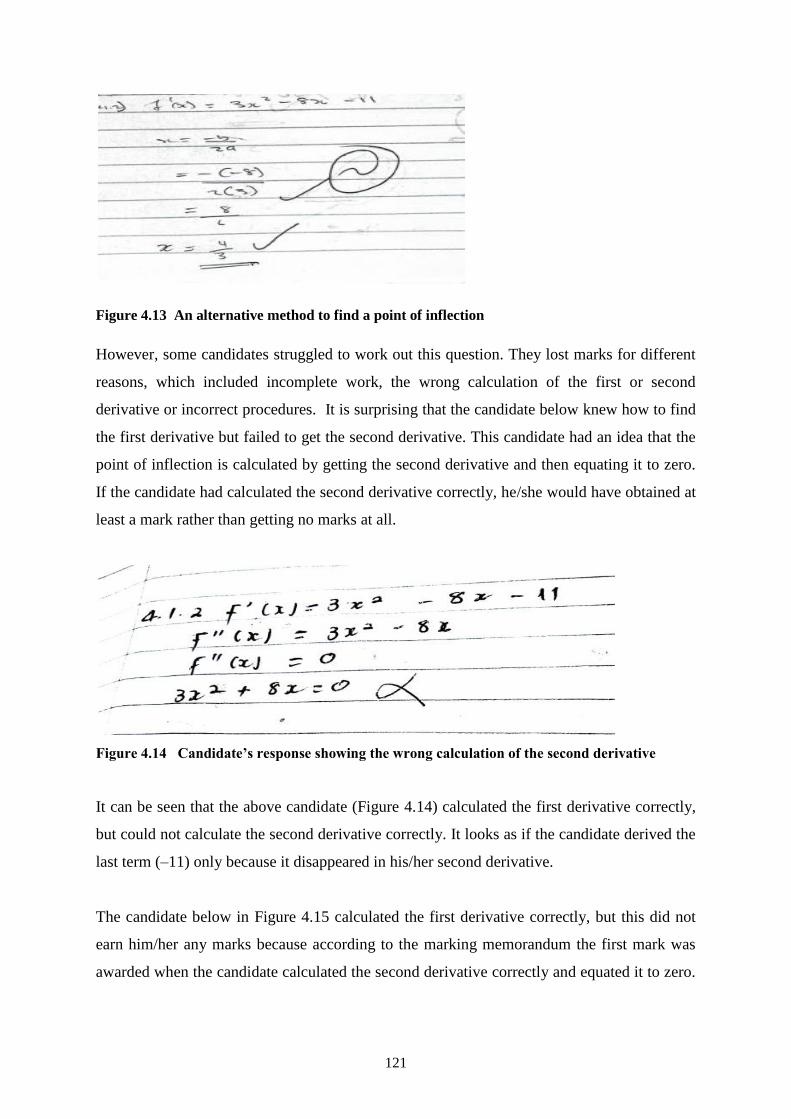
121
Figure 4.13 An alternative method to find a point of inflection
However, some candidates struggled to work out this question. They lost marks for different
reasons, which included incomplete work, the wrong calculation of the first or second
derivative or incorrect procedures. It is surprising that the candidate below knew how to find
the first derivative but failed to get the second derivative. This candidate had an idea that the
point of inflection is calculated by getting the second derivative and then equating it to zero.
If the candidate had calculated the second derivative correctly, he/she would have obtained at
least a mark rather than getting no marks at all.
Figure 4.14 Candidate’s response showing the wrong calculation of the second derivative
It can be seen that the above candidate (Figure 4.14) calculated the first derivative correctly,
but could not calculate the second derivative correctly. It looks as if the candidate derived the
last term (–11) only because it disappeared in his/her second derivative.
The candidate below in Figure 4.15 calculated the first derivative correctly, but this did not
earn him/her any marks because according to the marking memorandum the first mark was
awarded when the candidate calculated the second derivative correctly and equated it to zero.
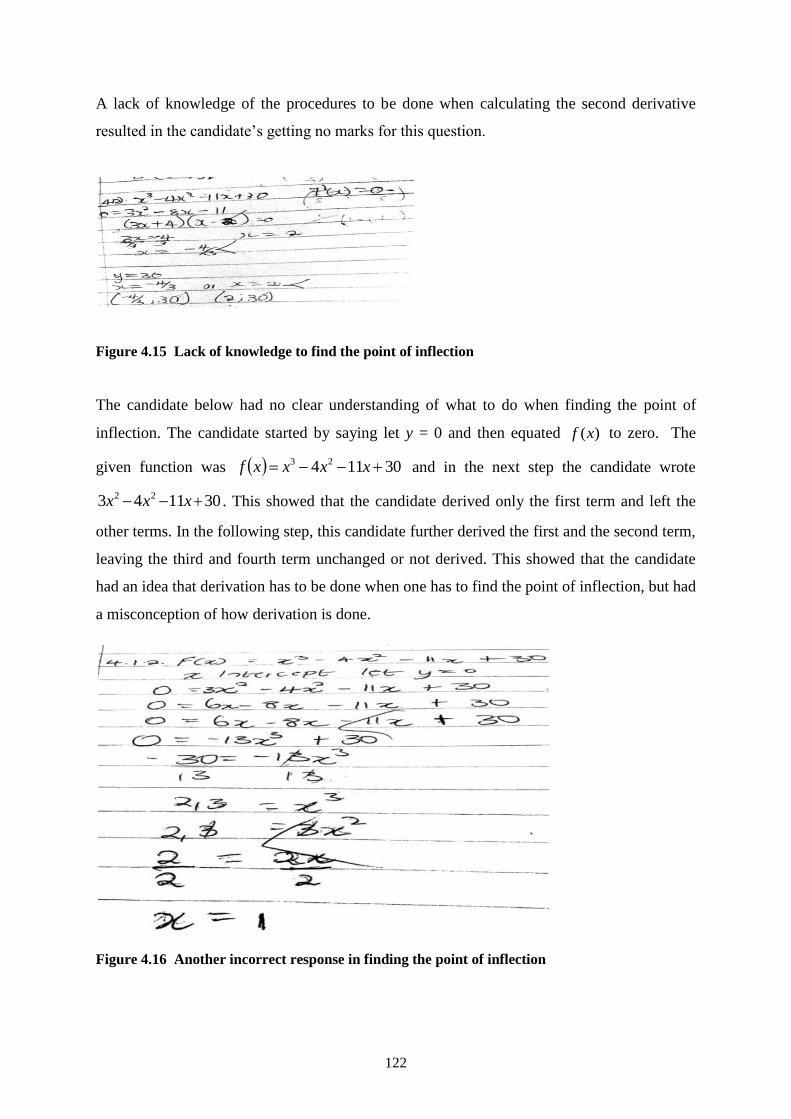
122
A lack of knowledge of the procedures to be done when calculating the second derivative
resulted in the candidate’s getting no marks for this question.
Figure 4.15 Lack of knowledge to find the point of inflection
The candidate below had no clear understanding of what to do when finding the point of
inflection. The candidate started by saying let y = 0 and then equated )(xf to zero. The
given function was 30114 23 xxxxf and in the next step the candidate wrote
301143 22 xxx . This showed that the candidate derived only the first term and left the
other terms. In the following step, this candidate further derived the first and the second term,
leaving the third and fourth term unchanged or not derived. This showed that the candidate
had an idea that derivation has to be done when one has to find the point of inflection, but had
a misconception of how derivation is done.
Figure 4.16 Another incorrect response in finding the point of inflection
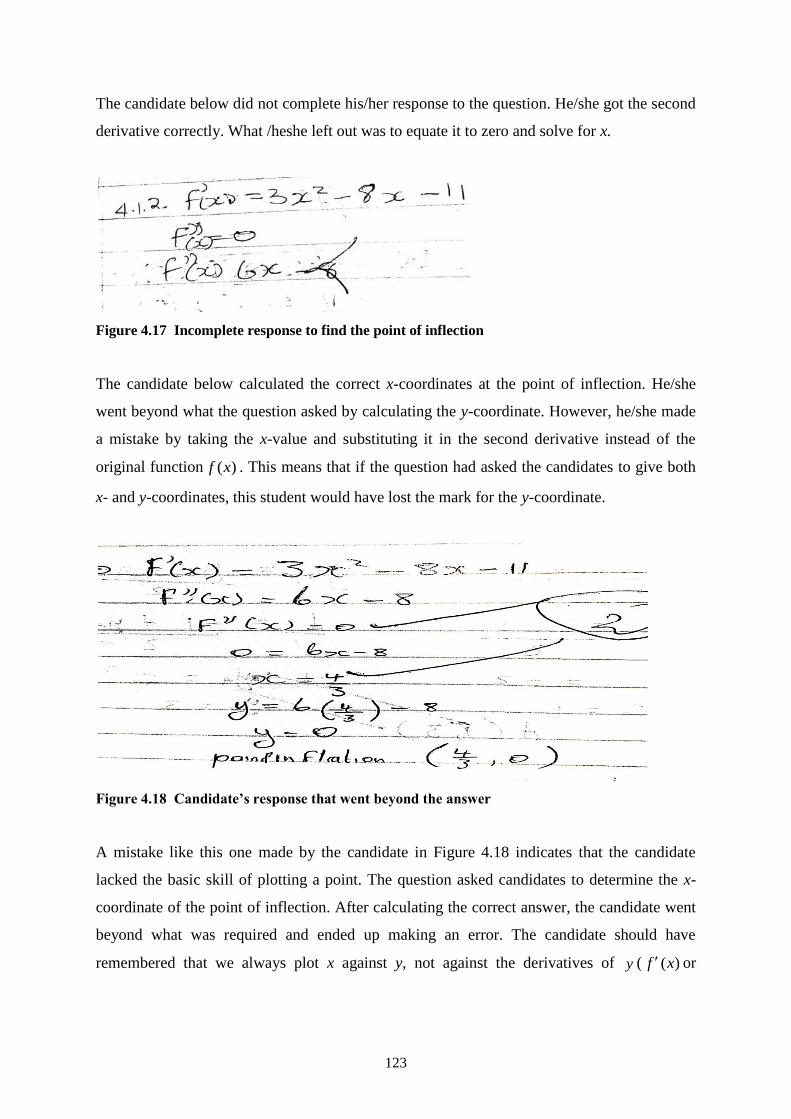
123
The candidate below did not complete his/her response to the question. He/she got the second
derivative correctly. What /heshe left out was to equate it to zero and solve for x.
Figure 4.17 Incomplete response to find the point of inflection
The candidate below calculated the correct x-coordinates at the point of inflection. He/she
went beyond what the question asked by calculating the y-coordinate. However, he/she made
a mistake by taking the x-value and substituting it in the second derivative instead of the
original function )(xf . This means that if the question had asked the candidates to give both
x- and y-coordinates, this student would have lost the mark for the y-coordinate.
Figure 4.18 Candidate’s response that went beyond the answer
A mistake like this one made by the candidate in Figure 4.18 indicates that the candidate
lacked the basic skill of plotting a point. The question asked candidates to determine the x-
coordinate of the point of inflection. After calculating the correct answer, the candidate went
beyond what was required and ended up making an error. The candidate should have
remembered that we always plot x against y, not against the derivatives of y ( )(xf or
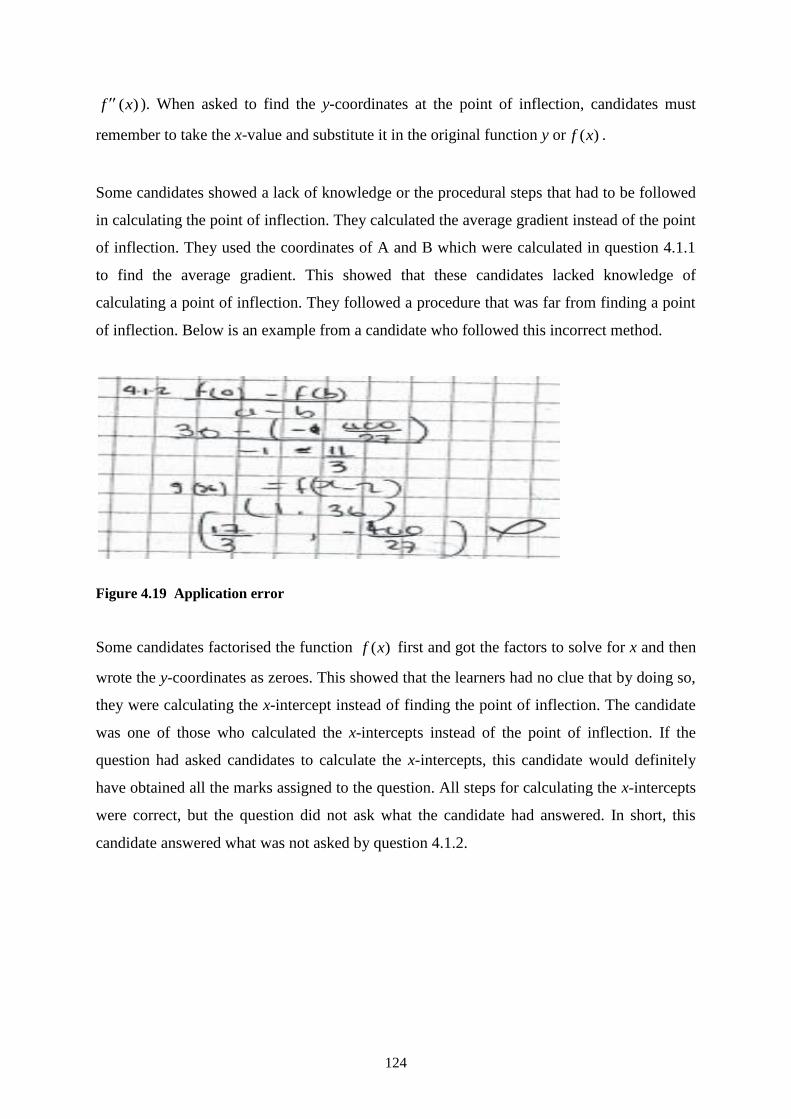
124
)(xf ). When asked to find the y-coordinates at the point of inflection, candidates must
remember to take the x-value and substitute it in the original function y or )(xf .
Some candidates showed a lack of knowledge or the procedural steps that had to be followed
in calculating the point of inflection. They calculated the average gradient instead of the point
of inflection. They used the coordinates of A and B which were calculated in question 4.1.1
to find the average gradient. This showed that these candidates lacked knowledge of
calculating a point of inflection. They followed a procedure that was far from finding a point
of inflection. Below is an example from a candidate who followed this incorrect method.
Figure 4.19 Application error
Some candidates factorised the function )(xf first and got the factors to solve for x and then
wrote the y-coordinates as zeroes. This showed that the learners had no clue that by doing so,
they were calculating the x-intercept instead of finding the point of inflection. The candidate
was one of those who calculated the x-intercepts instead of the point of inflection. If the
question had asked candidates to calculate the x-intercepts, this candidate would definitely
have obtained all the marks assigned to the question. All steps for calculating the x-intercepts
were correct, but the question did not ask what the candidate had answered. In short, this
candidate answered what was not asked by question 4.1.2.
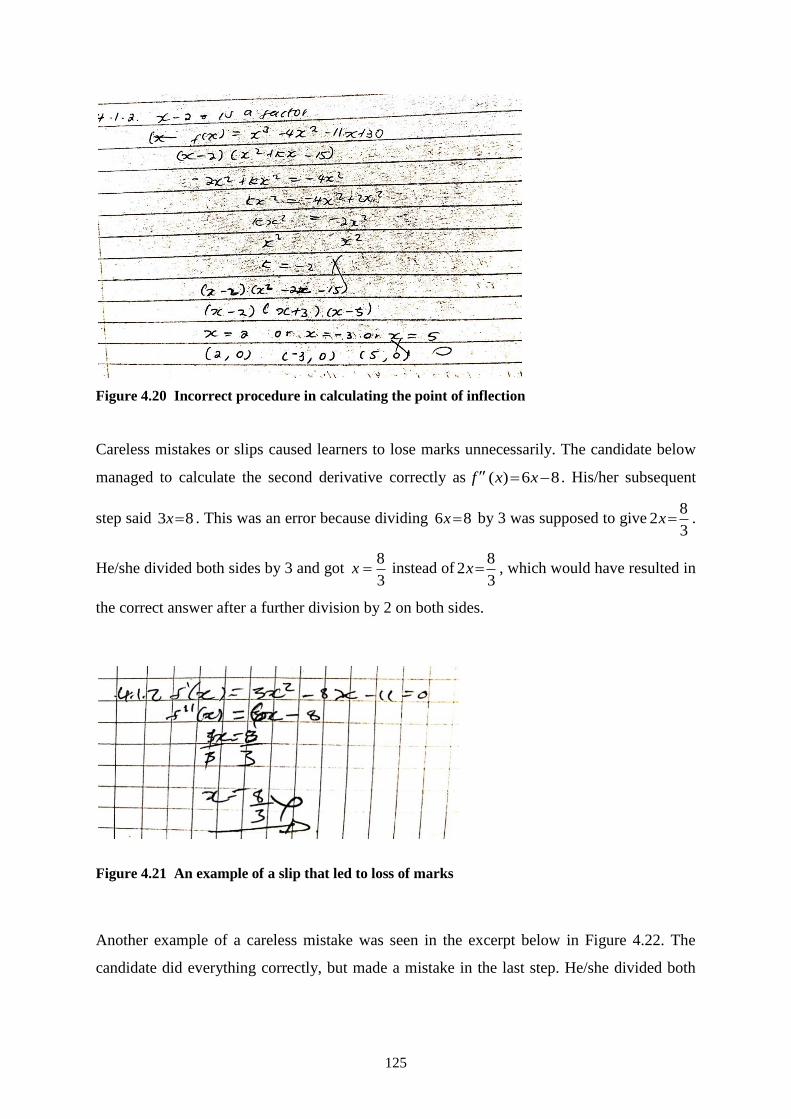
125
Figure 4.20 Incorrect procedure in calculating the point of inflection
Careless mistakes or slips caused learners to lose marks unnecessarily. The candidate below
managed to calculate the second derivative correctly as 86)( xxf . His/her subsequent
step said 83 x . This was an error because dividing 86 x by 3 was supposed to give3
82 x .
He/she divided both sides by 3 and got 3
8x instead of
3
82 x , which would have resulted in
the correct answer after a further division by 2 on both sides.
Figure 4.21 An example of a slip that led to loss of marks
Another example of a careless mistake was seen in the excerpt below in Figure 4.22. The
candidate did everything correctly, but made a mistake in the last step. He/she divided both
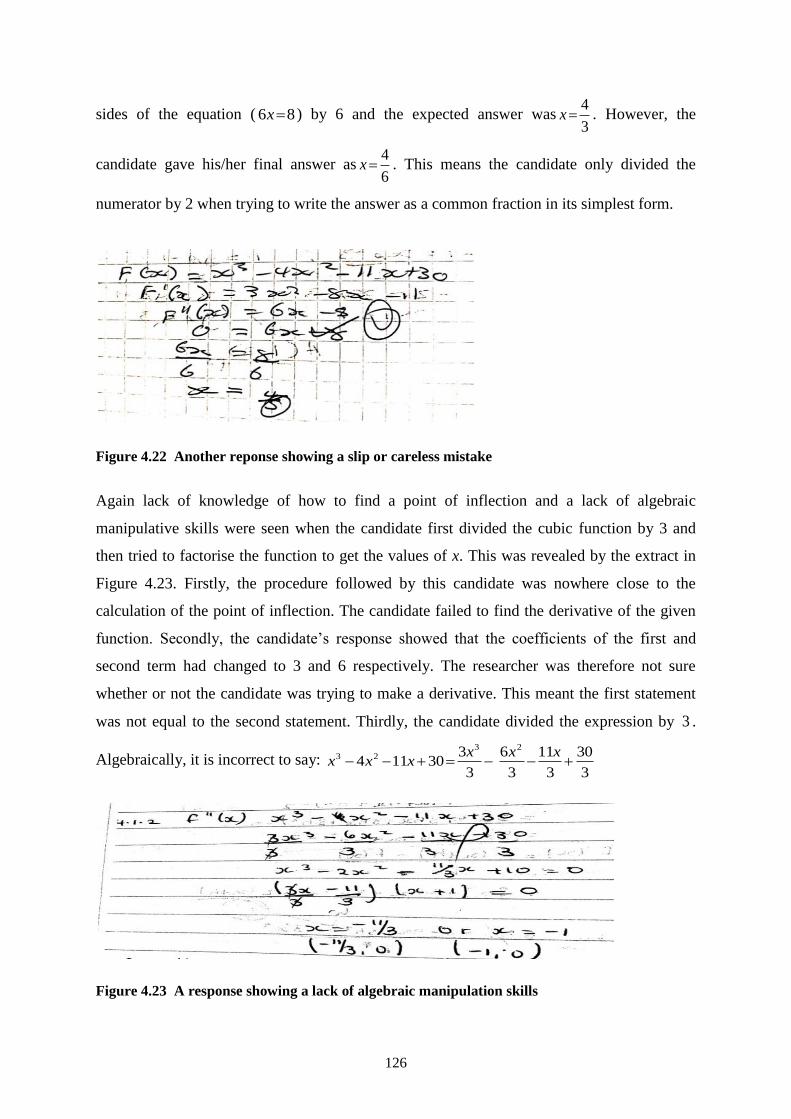
126
sides of the equation ( 86 x ) by 6 and the expected answer was3
4x . However, the
candidate gave his/her final answer as6
4x . This means the candidate only divided the
numerator by 2 when trying to write the answer as a common fraction in its simplest form.
Figure 4.22 Another reponse showing a slip or careless mistake
Again lack of knowledge of how to find a point of inflection and a lack of algebraic
manipulative skills were seen when the candidate first divided the cubic function by 3 and
then tried to factorise the function to get the values of x. This was revealed by the extract in
Figure 4.23. Firstly, the procedure followed by this candidate was nowhere close to the
calculation of the point of inflection. The candidate failed to find the derivative of the given
function. Secondly, the candidate’s response showed that the coefficients of the first and
second term had changed to 3 and 6 respectively. The researcher was therefore not sure
whether or not the candidate was trying to make a derivative. This meant the first statement
was not equal to the second statement. Thirdly, the candidate divided the expression by 3 .
Algebraically, it is incorrect to say: 3
30
3
11
3
6
3
330114
2323
xxxxxx
Figure 4.23 A response showing a lack of algebraic manipulation skills
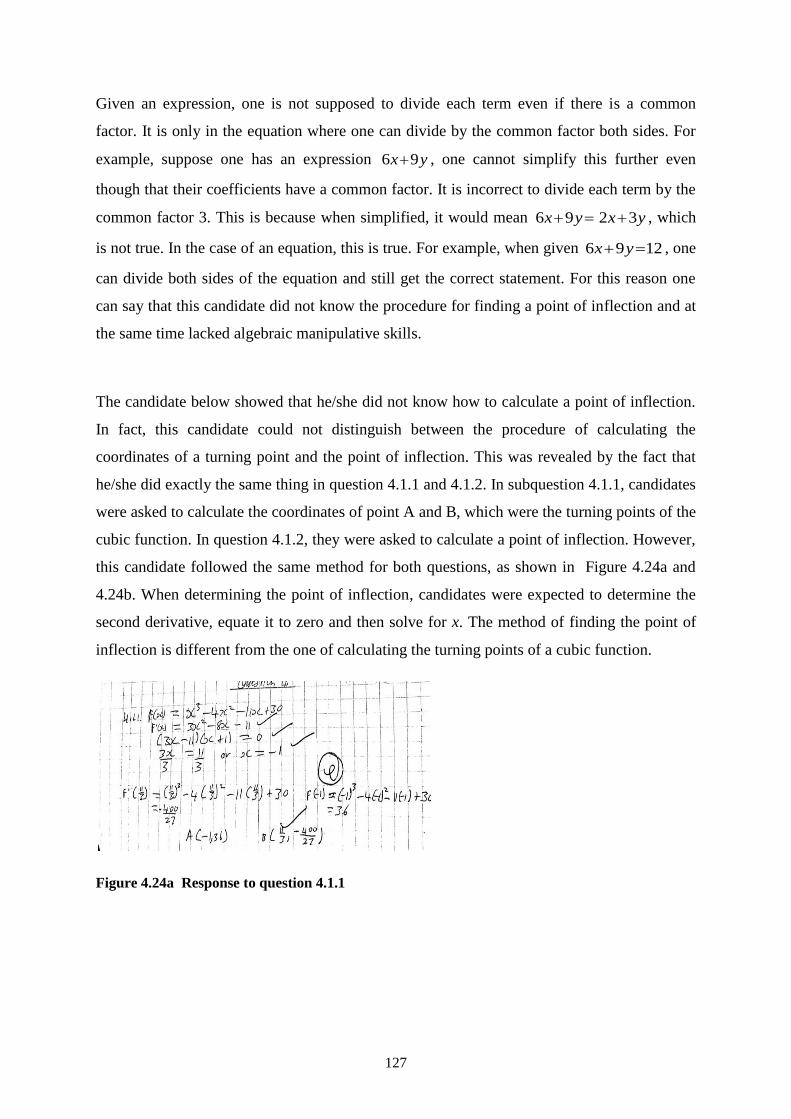
127
Given an expression, one is not supposed to divide each term even if there is a common
factor. It is only in the equation where one can divide by the common factor both sides. For
example, suppose one has an expression yx 96 , one cannot simplify this further even
though that their coefficients have a common factor. It is incorrect to divide each term by the
common factor 3. This is because when simplified, it would mean yxyx 3296 , which
is not true. In the case of an equation, this is true. For example, when given 1296 yx , one
can divide both sides of the equation and still get the correct statement. For this reason one
can say that this candidate did not know the procedure for finding a point of inflection and at
the same time lacked algebraic manipulative skills.
The candidate below showed that he/she did not know how to calculate a point of inflection.
In fact, this candidate could not distinguish between the procedure of calculating the
coordinates of a turning point and the point of inflection. This was revealed by the fact that
he/she did exactly the same thing in question 4.1.1 and 4.1.2. In subquestion 4.1.1, candidates
were asked to calculate the coordinates of point A and B, which were the turning points of the
cubic function. In question 4.1.2, they were asked to calculate a point of inflection. However,
this candidate followed the same method for both questions, as shown in Figure 4.24a and
4.24b. When determining the point of inflection, candidates were expected to determine the
second derivative, equate it to zero and then solve for x. The method of finding the point of
inflection is different from the one of calculating the turning points of a cubic function.
Figure 4.24a Response to question 4.1.1
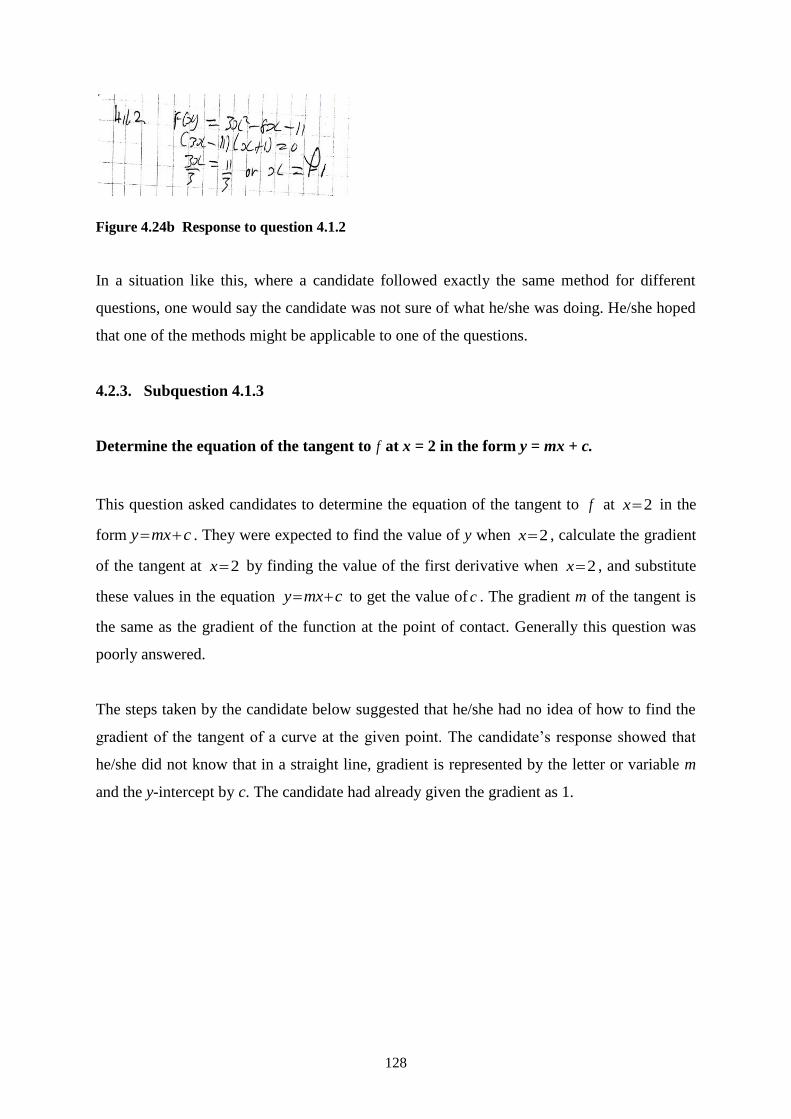
128
Figure 4.24b Response to question 4.1.2
In a situation like this, where a candidate followed exactly the same method for different
questions, one would say the candidate was not sure of what he/she was doing. He/she hoped
that one of the methods might be applicable to one of the questions.
4.2.3. Subquestion 4.1.3
Determine the equation of the tangent to f at x = 2 in the form y = mx + c.
This question asked candidates to determine the equation of the tangent to f at 2x in the
form cmxy . They were expected to find the value of y when 2x , calculate the gradient
of the tangent at 2x by finding the value of the first derivative when 2x , and substitute
these values in the equation cmxy to get the value of c . The gradient m of the tangent is
the same as the gradient of the function at the point of contact. Generally this question was
poorly answered.
The steps taken by the candidate below suggested that he/she had no idea of how to find the
gradient of the tangent of a curve at the given point. The candidate’s response showed that
he/she did not know that in a straight line, gradient is represented by the letter or variable m
and the y-intercept by c. The candidate had already given the gradient as 1.
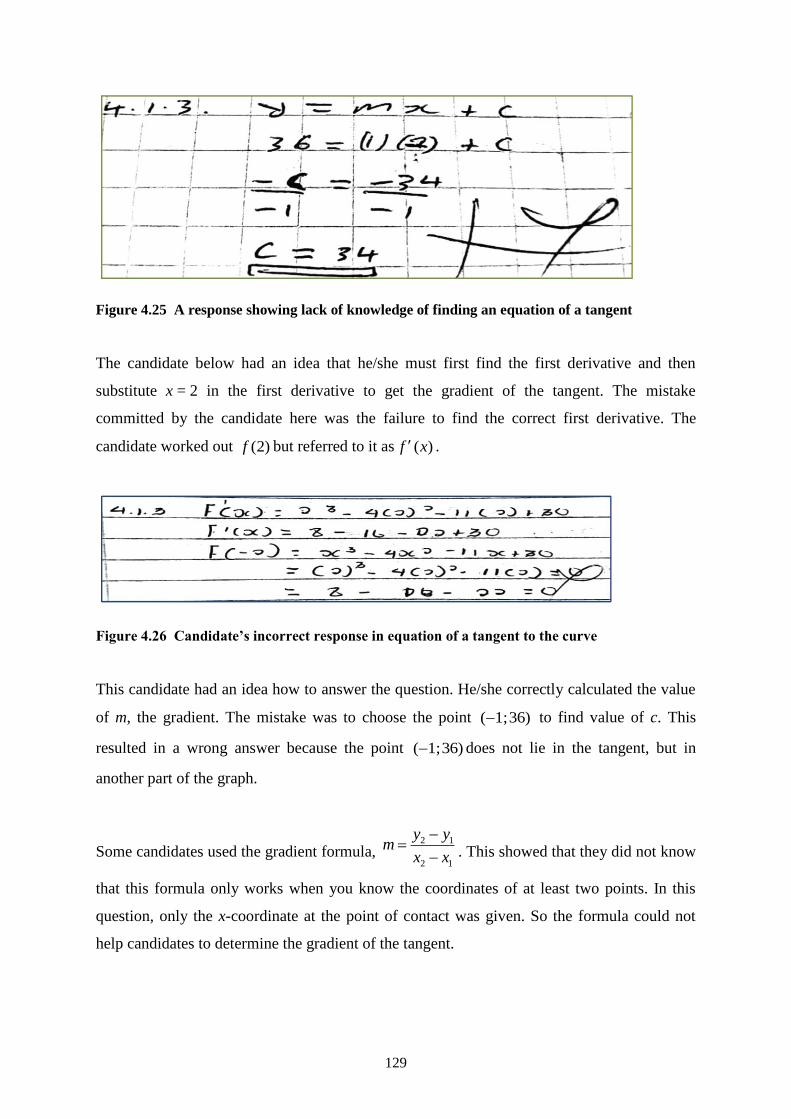
129
Figure 4.25 A response showing lack of knowledge of finding an equation of a tangent
The candidate below had an idea that he/she must first find the first derivative and then
substitute x = 2 in the first derivative to get the gradient of the tangent. The mistake
committed by the candidate here was the failure to find the correct first derivative. The
candidate worked out )2(f but referred to it as )(xf .
Figure 4.26 Candidate’s incorrect response in equation of a tangent to the curve
This candidate had an idea how to answer the question. He/she correctly calculated the value
of m, the gradient. The mistake was to choose the point )36;1( to find value of c. This
resulted in a wrong answer because the point )36;1( does not lie in the tangent, but in
another part of the graph.
Some candidates used the gradient formula, 12
12
xx
yym
. This showed that they did not know
that this formula only works when you know the coordinates of at least two points. In this
question, only the x-coordinate at the point of contact was given. So the formula could not
help candidates to determine the gradient of the tangent.
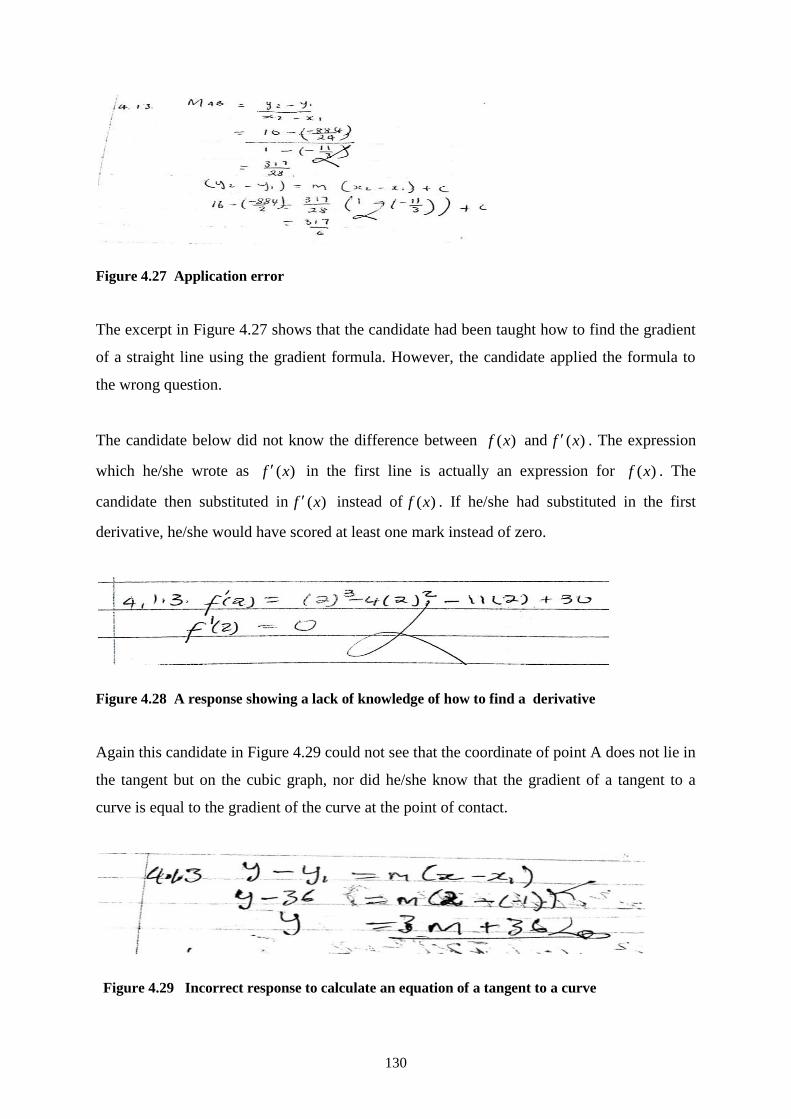
130
Figure 4.27 Application error
The excerpt in Figure 4.27 shows that the candidate had been taught how to find the gradient
of a straight line using the gradient formula. However, the candidate applied the formula to
the wrong question.
The candidate below did not know the difference between )(xf and )(xf . The expression
which he/she wrote as )(xf in the first line is actually an expression for )(xf . The
candidate then substituted in )(xf instead of )(xf . If he/she had substituted in the first
derivative, he/she would have scored at least one mark instead of zero.
Figure 4.28 A response showing a lack of knowledge of how to find a derivative
Again this candidate in Figure 4.29 could not see that the coordinate of point A does not lie in
the tangent but on the cubic graph, nor did he/she know that the gradient of a tangent to a
curve is equal to the gradient of the curve at the point of contact.
Figure 4.29 Incorrect response to calculate an equation of a tangent to a curve
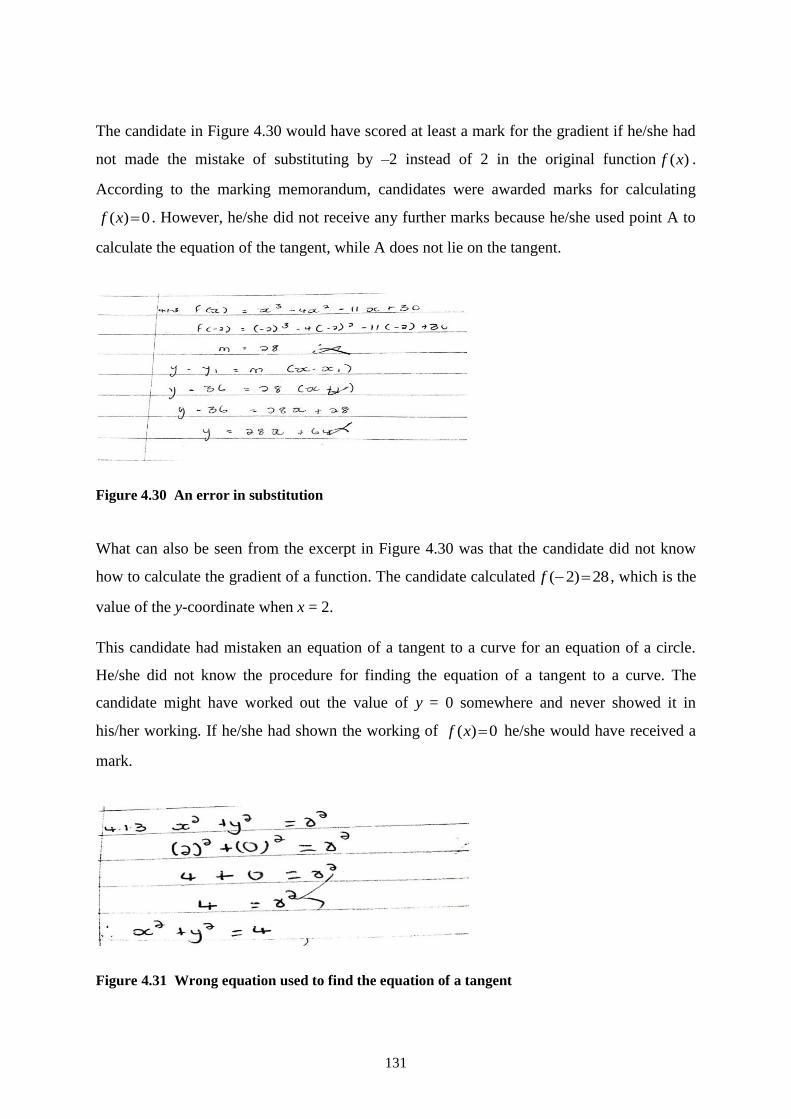
131
The candidate in Figure 4.30 would have scored at least a mark for the gradient if he/she had
not made the mistake of substituting by –2 instead of 2 in the original function )(xf .
According to the marking memorandum, candidates were awarded marks for calculating
0)( xf . However, he/she did not receive any further marks because he/she used point A to
calculate the equation of the tangent, while A does not lie on the tangent.
Figure 4.30 An error in substitution
What can also be seen from the excerpt in Figure 4.30 was that the candidate did not know
how to calculate the gradient of a function. The candidate calculated 28)2( f , which is the
value of the y-coordinate when x = 2.
This candidate had mistaken an equation of a tangent to a curve for an equation of a circle.
He/she did not know the procedure for finding the equation of a tangent to a curve. The
candidate might have worked out the value of y = 0 somewhere and never showed it in
his/her working. If he/she had shown the working of 0)( xf he/she would have received a
mark.
Figure 4.31 Wrong equation used to find the equation of a tangent
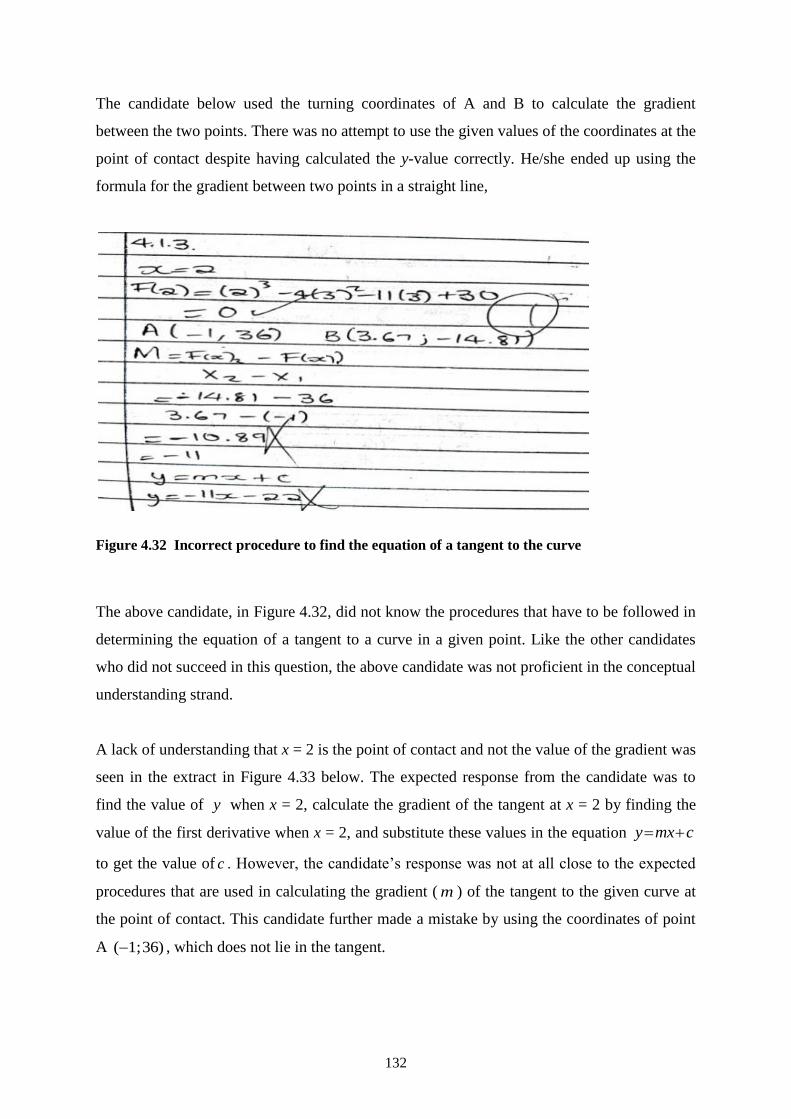
132
The candidate below used the turning coordinates of A and B to calculate the gradient
between the two points. There was no attempt to use the given values of the coordinates at the
point of contact despite having calculated the y-value correctly. He/she ended up using the
formula for the gradient between two points in a straight line,
Figure 4.32 Incorrect procedure to find the equation of a tangent to the curve
The above candidate, in Figure 4.32, did not know the procedures that have to be followed in
determining the equation of a tangent to a curve in a given point. Like the other candidates
who did not succeed in this question, the above candidate was not proficient in the conceptual
understanding strand.
A lack of understanding that x = 2 is the point of contact and not the value of the gradient was
seen in the extract in Figure 4.33 below. The expected response from the candidate was to
find the value of y when x = 2, calculate the gradient of the tangent at x = 2 by finding the
value of the first derivative when x = 2, and substitute these values in the equation cmxy
to get the value of c . However, the candidate’s response was not at all close to the expected
procedures that are used in calculating the gradient ( m ) of the tangent to the given curve at
the point of contact. This candidate further made a mistake by using the coordinates of point
A )36;1( , which does not lie in the tangent.
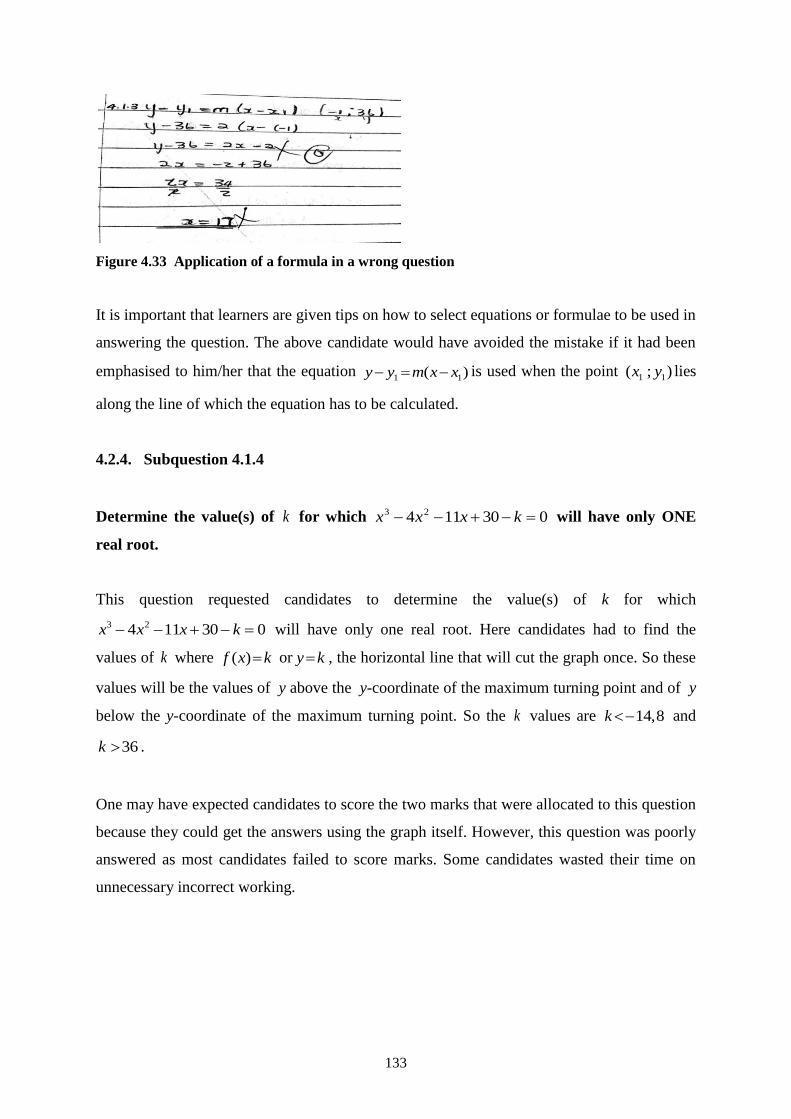
133
Figure 4.33 Application of a formula in a wrong question
It is important that learners are given tips on how to select equations or formulae to be used in
answering the question. The above candidate would have avoided the mistake if it had been
emphasised to him/her that the equation )( 11 xxmyy is used when the point );( 11 yx lies
along the line of which the equation has to be calculated.
4.2.4. Subquestion 4.1.4
Determine the value(s) of k for which 030114 23 kxxx will have only ONE
real root.
This question requested candidates to determine the value(s) of k for which
030114 23 kxxx will have only one real root. Here candidates had to find the
values of k where kxf )( or ky , the horizontal line that will cut the graph once. So these
values will be the values of y above the y-coordinate of the maximum turning point and of y
below the y-coordinate of the maximum turning point. So the k values are 8,14k and
36k .
One may have expected candidates to score the two marks that were allocated to this question
because they could get the answers using the graph itself. However, this question was poorly
answered as most candidates failed to score marks. Some candidates wasted their time on
unnecessary incorrect working.
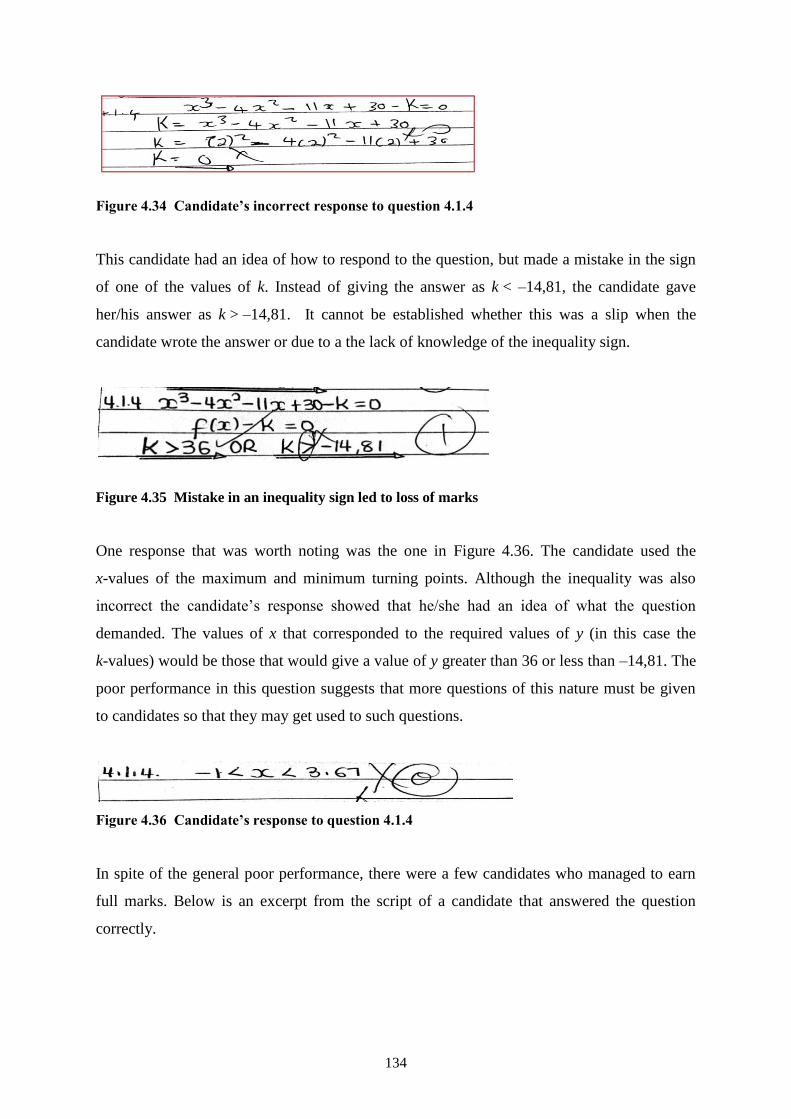
134
Figure 4.34 Candidate’s incorrect response to question 4.1.4
This candidate had an idea of how to respond to the question, but made a mistake in the sign
of one of the values of k. Instead of giving the answer as k < –14,81, the candidate gave
her/his answer as k > –14,81. It cannot be established whether this was a slip when the
candidate wrote the answer or due to a the lack of knowledge of the inequality sign.
Figure 4.35 Mistake in an inequality sign led to loss of marks
One response that was worth noting was the one in Figure 4.36. The candidate used the
x-values of the maximum and minimum turning points. Although the inequality was also
incorrect the candidate’s response showed that he/she had an idea of what the question
demanded. The values of x that corresponded to the required values of y (in this case the
k-values) would be those that would give a value of y greater than 36 or less than –14,81. The
poor performance in this question suggests that more questions of this nature must be given
to candidates so that they may get used to such questions.
Figure 4.36 Candidate’s response to question 4.1.4
In spite of the general poor performance, there were a few candidates who managed to earn
full marks. Below is an excerpt from the script of a candidate that answered the question
correctly.
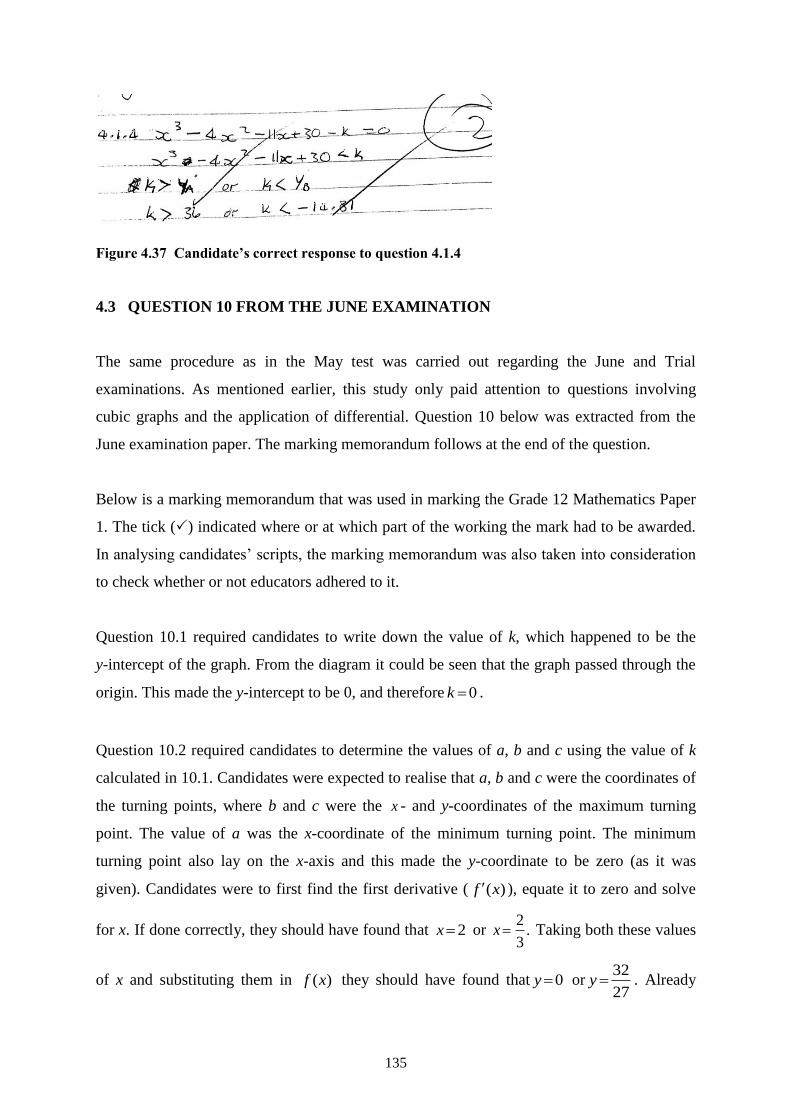
135
Figure 4.37 Candidate’s correct response to question 4.1.4
4.3 QUESTION 10 FROM THE JUNE EXAMINATION
The same procedure as in the May test was carried out regarding the June and Trial
examinations. As mentioned earlier, this study only paid attention to questions involving
cubic graphs and the application of differential. Question 10 below was extracted from the
June examination paper. The marking memorandum follows at the end of the question.
Below is a marking memorandum that was used in marking the Grade 12 Mathematics Paper
1. The tick () indicated where or at which part of the working the mark had to be awarded.
In analysing candidates’ scripts, the marking memorandum was also taken into consideration
to check whether or not educators adhered to it.
Question 10.1 required candidates to write down the value of k, which happened to be the
y-intercept of the graph. From the diagram it could be seen that the graph passed through the
origin. This made the y-intercept to be 0, and therefore 0k .
Question 10.2 required candidates to determine the values of a, b and c using the value of k
calculated in 10.1. Candidates were expected to realise that a, b and c were the coordinates of
the turning points, where b and c were the x - and y-coordinates of the maximum turning
point. The value of a was the x-coordinate of the minimum turning point. The minimum
turning point also lay on the x-axis and this made the y-coordinate to be zero (as it was
given). Candidates were to first find the first derivative ( )(xf ), equate it to zero and solve
for x. If done correctly, they should have found that 2x or .3
2x Taking both these values
of x and substituting them in )(xf they should have found that 0y or27
32y . Already
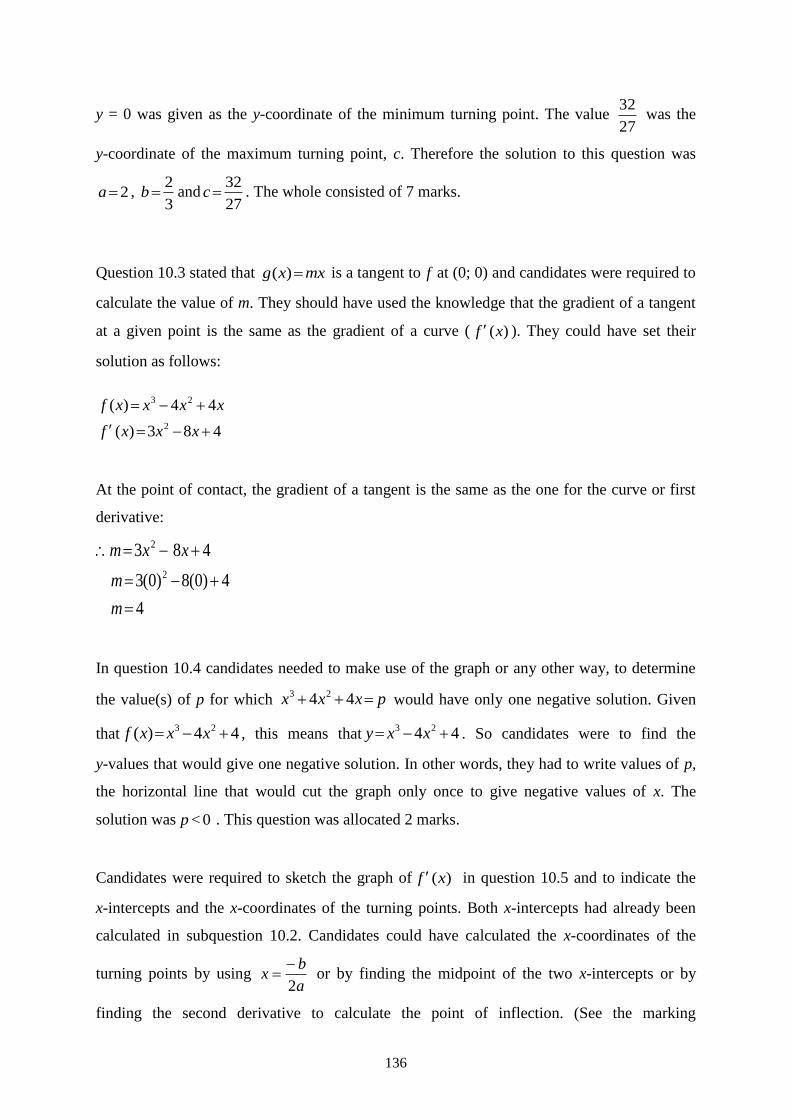
136
y = 0 was given as the y-coordinate of the minimum turning point. The value 27
32 was the
y-coordinate of the maximum turning point, c. Therefore the solution to this question was
2a , 3
2b and
27
32c . The whole consisted of 7 marks.
Question 10.3 stated that mxxg )( is a tangent to f at (0; 0) and candidates were required to
calculate the value of m. They should have used the knowledge that the gradient of a tangent
at a given point is the same as the gradient of a curve ( )(xf ). They could have set their
solution as follows:
483)(
44)(
2
23
xxxf
xxxxf
At the point of contact, the gradient of a tangent is the same as the one for the curve or first
derivative:
4
4)0(8)0(3
483
2
2
m
m
xxm
In question 10.4 candidates needed to make use of the graph or any other way, to determine
the value(s) of p for which pxxx 44 23 would have only one negative solution. Given
that 44)( 23 xxxf , this means that 44 23 xxy . So candidates were to find the
y-values that would give one negative solution. In other words, they had to write values of p,
the horizontal line that would cut the graph only once to give negative values of x. The
solution was 0<p . This question was allocated 2 marks.
Candidates were required to sketch the graph of )(xf in question 10.5 and to indicate the
x-intercepts and the x-coordinates of the turning points. Both x-intercepts had already been
calculated in subquestion 10.2. Candidates could have calculated the x-coordinates of the
turning points by using a
bx
2
or by finding the midpoint of the two x-intercepts or by
finding the second derivative to calculate the point of inflection. (See the marking
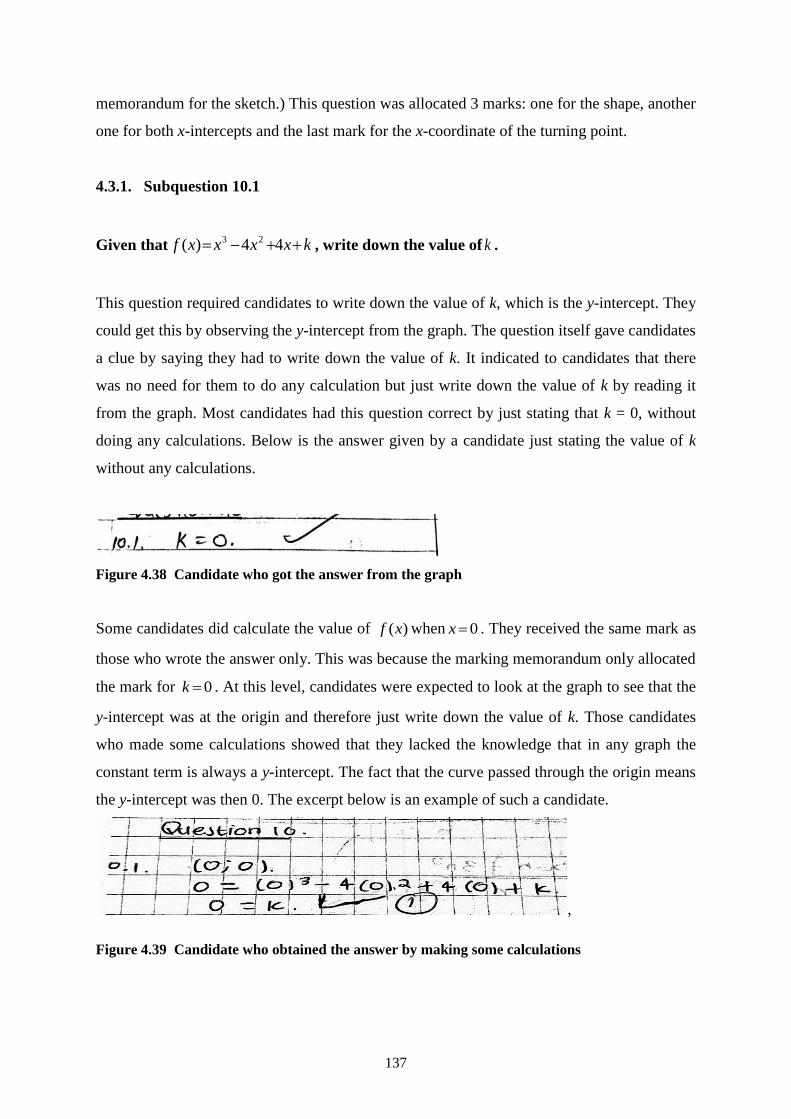
137
memorandum for the sketch.) This question was allocated 3 marks: one for the shape, another
one for both x-intercepts and the last mark for the x-coordinate of the turning point.
4.3.1. Subquestion 10.1
Given that kxxxxf 44)( 23, write down the value of k .
This question required candidates to write down the value of k, which is the y-intercept. They
could get this by observing the y-intercept from the graph. The question itself gave candidates
a clue by saying they had to write down the value of k. It indicated to candidates that there
was no need for them to do any calculation but just write down the value of k by reading it
from the graph. Most candidates had this question correct by just stating that k = 0, without
doing any calculations. Below is the answer given by a candidate just stating the value of k
without any calculations.
Figure 4.38 Candidate who got the answer from the graph
Some candidates did calculate the value of )(xf when 0x . They received the same mark as
those who wrote the answer only. This was because the marking memorandum only allocated
the mark for 0k . At this level, candidates were expected to look at the graph to see that the
y-intercept was at the origin and therefore just write down the value of k. Those candidates
who made some calculations showed that they lacked the knowledge that in any graph the
constant term is always a y-intercept. The fact that the curve passed through the origin means
the y-intercept was then 0. The excerpt below is an example of such a candidate.
,
Figure 4.39 Candidate who obtained the answer by making some calculations
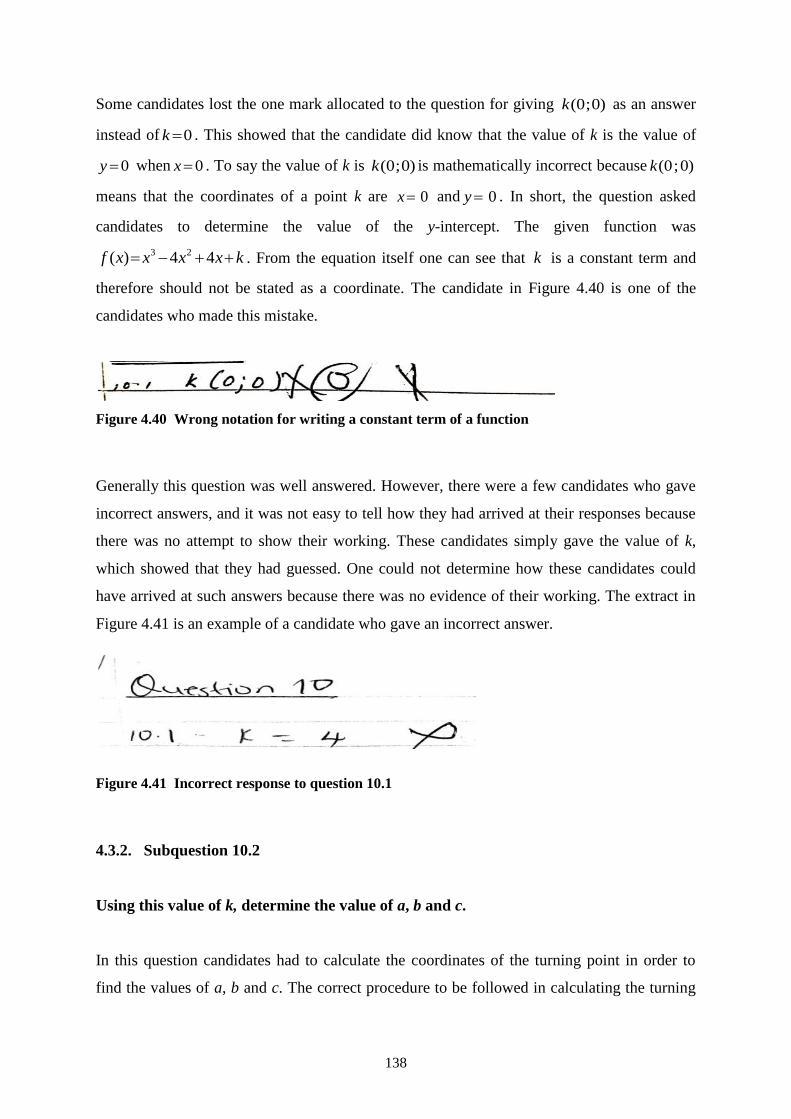
138
Some candidates lost the one mark allocated to the question for giving )0;0(k as an answer
instead of 0k . This showed that the candidate did know that the value of k is the value of
0y when 0x . To say the value of k is )0;0(k is mathematically incorrect because )0;0(k
means that the coordinates of a point k are 0x and 0y . In short, the question asked
candidates to determine the value of the y-intercept. The given function was
kxxxxf 44)( 23. From the equation itself one can see that k is a constant term and
therefore should not be stated as a coordinate. The candidate in Figure 4.40 is one of the
candidates who made this mistake.
Figure 4.40 Wrong notation for writing a constant term of a function
Generally this question was well answered. However, there were a few candidates who gave
incorrect answers, and it was not easy to tell how they had arrived at their responses because
there was no attempt to show their working. These candidates simply gave the value of k,
which showed that they had guessed. One could not determine how these candidates could
have arrived at such answers because there was no evidence of their working. The extract in
Figure 4.41 is an example of a candidate who gave an incorrect answer.
Figure 4.41 Incorrect response to question 10.1
4.3.2. Subquestion 10.2
Using this value of k, determine the value of a, b and c.
In this question candidates had to calculate the coordinates of the turning point in order to
find the values of a, b and c. The correct procedure to be followed in calculating the turning
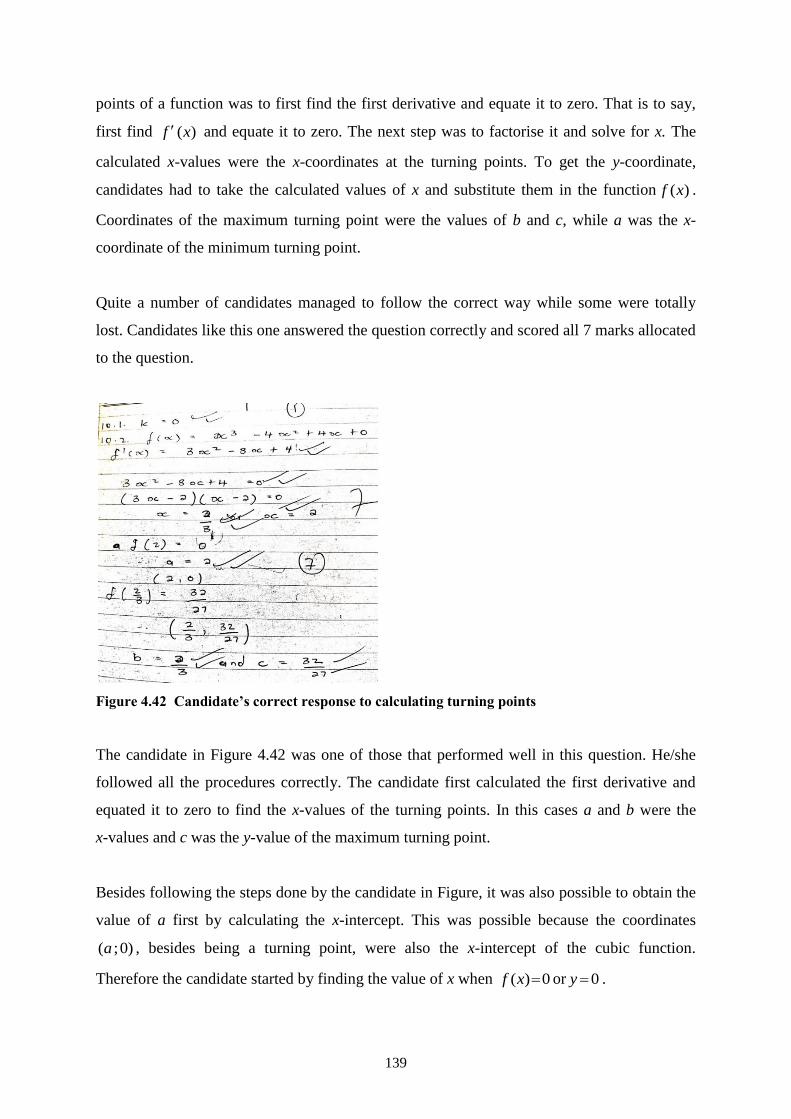
139
points of a function was to first find the first derivative and equate it to zero. That is to say,
first find )(xf and equate it to zero. The next step was to factorise it and solve for x. The
calculated x-values were the x-coordinates at the turning points. To get the y-coordinate,
candidates had to take the calculated values of x and substitute them in the function )(xf .
Coordinates of the maximum turning point were the values of b and c, while a was the x-
coordinate of the minimum turning point.
Quite a number of candidates managed to follow the correct way while some were totally
lost. Candidates like this one answered the question correctly and scored all 7 marks allocated
to the question.
Figure 4.42 Candidate’s correct response to calculating turning points
The candidate in Figure 4.42 was one of those that performed well in this question. He/she
followed all the procedures correctly. The candidate first calculated the first derivative and
equated it to zero to find the x-values of the turning points. In this cases a and b were the
x-values and c was the y-value of the maximum turning point.
Besides following the steps done by the candidate in Figure, it was also possible to obtain the
value of a first by calculating the x-intercept. This was possible because the coordinates
)0;(a , besides being a turning point, were also the x-intercept of the cubic function.
Therefore the candidate started by finding the value of x when 0)( xf or 0y .
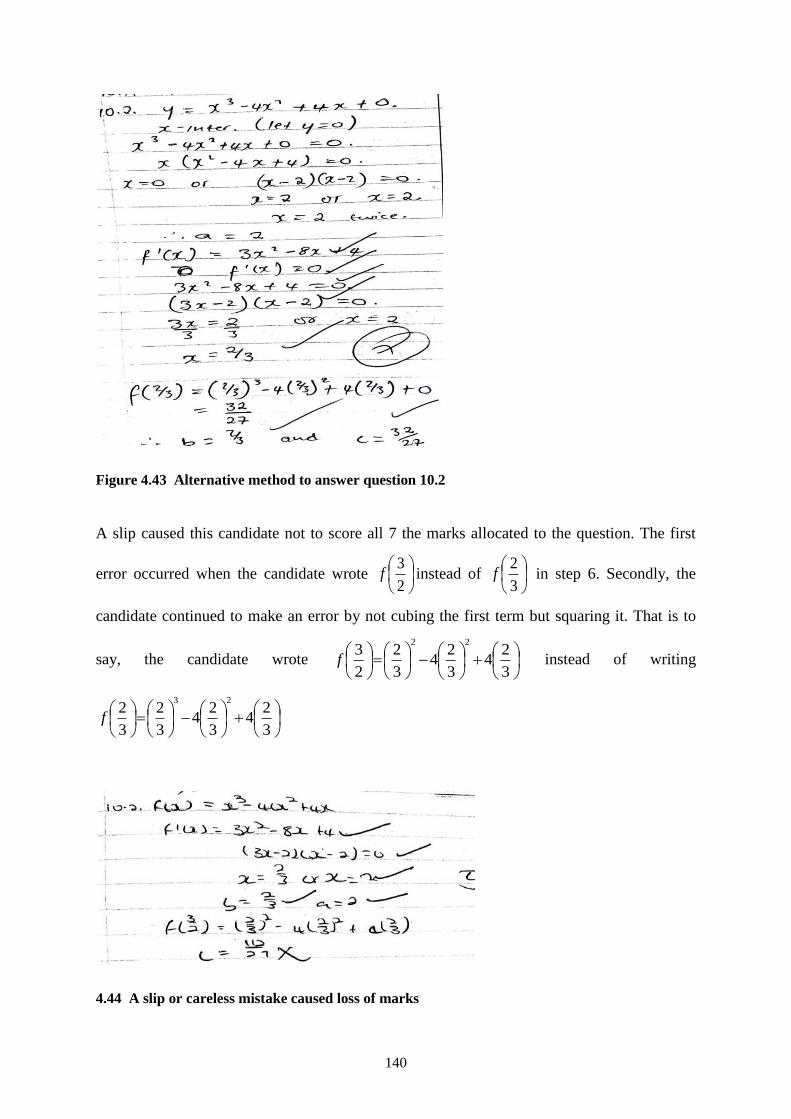
140
Figure 4.43 Alternative method to answer question 10.2
A slip caused this candidate not to score all 7 the marks allocated to the question. The first
error occurred when the candidate wrote
2
3f instead of
3
2f in step 6. Secondly, the
candidate continued to make an error by not cubing the first term but squaring it. That is to
say, the candidate wrote
3
24
3
24
3
2
2
322
f instead of writing
3
24
3
24
3
2
3
223
f
4.44 A slip or careless mistake caused loss of marks
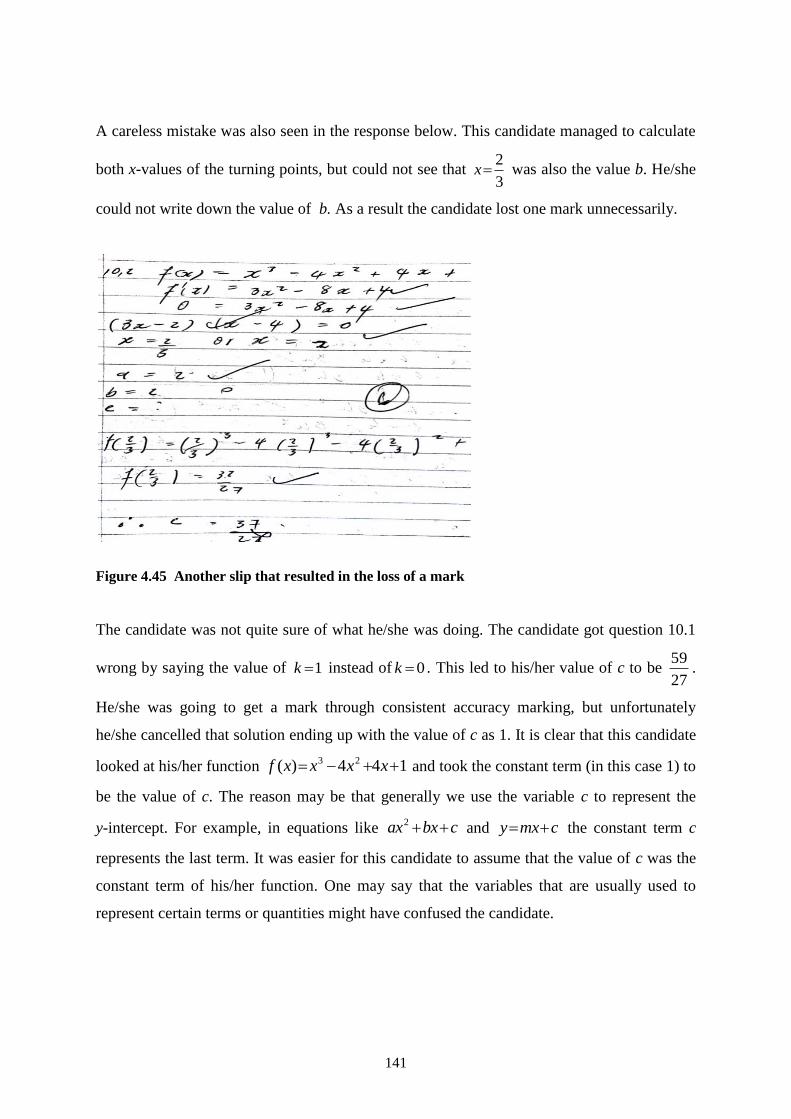
141
A careless mistake was also seen in the response below. This candidate managed to calculate
both x-values of the turning points, but could not see that 3
2x was also the value b. He/she
could not write down the value of b. As a result the candidate lost one mark unnecessarily.
Figure 4.45 Another slip that resulted in the loss of a mark
The candidate was not quite sure of what he/she was doing. The candidate got question 10.1
wrong by saying the value of 1k instead of 0k . This led to his/her value of c to be 27
59.
He/she was going to get a mark through consistent accuracy marking, but unfortunately
he/she cancelled that solution ending up with the value of c as 1. It is clear that this candidate
looked at his/her function 144)( 23 xxxxf and took the constant term (in this case 1) to
be the value of c. The reason may be that generally we use the variable c to represent the
y-intercept. For example, in equations like cbxax 2 and cmxy the constant term c
represents the last term. It was easier for this candidate to assume that the value of c was the
constant term of his/her function. One may say that the variables that are usually used to
represent certain terms or quantities might have confused the candidate.
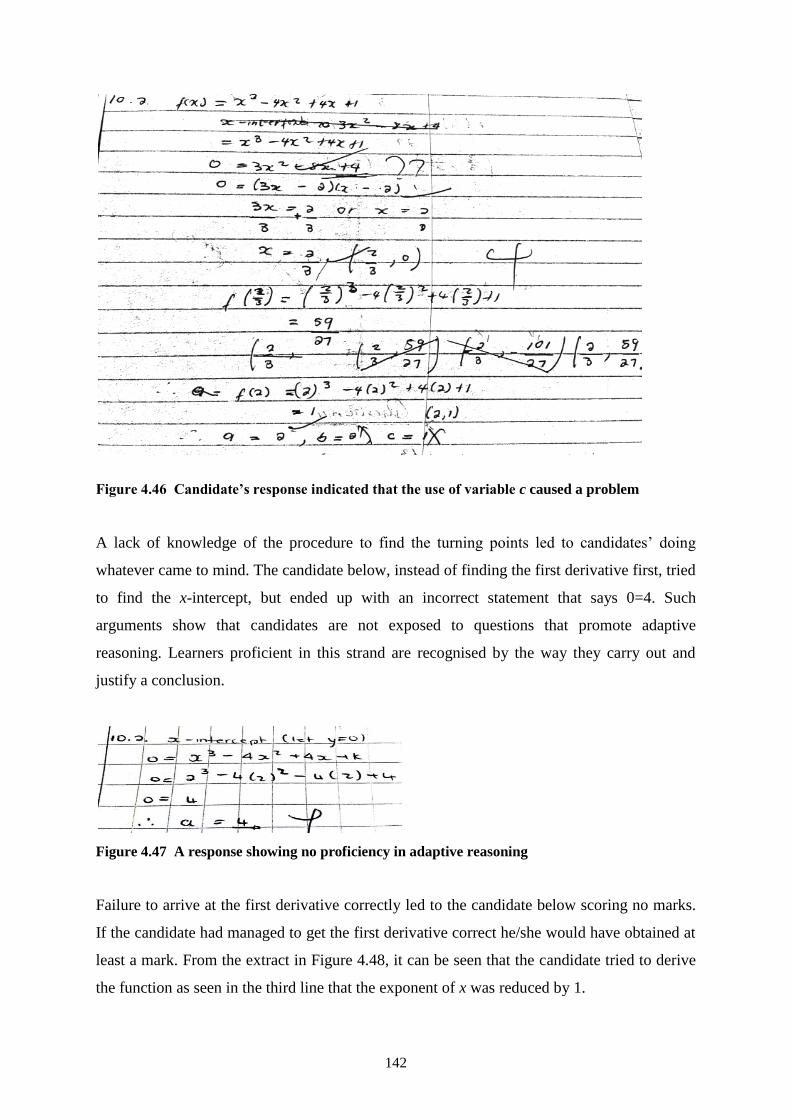
142
Figure 4.46 Candidate’s response indicated that the use of variable c caused a problem
A lack of knowledge of the procedure to find the turning points led to candidates’ doing
whatever came to mind. The candidate below, instead of finding the first derivative first, tried
to find the x-intercept, but ended up with an incorrect statement that says 0=4. Such
arguments show that candidates are not exposed to questions that promote adaptive
reasoning. Learners proficient in this strand are recognised by the way they carry out and
justify a conclusion.
Figure 4.47 A response showing no proficiency in adaptive reasoning
Failure to arrive at the first derivative correctly led to the candidate below scoring no marks.
If the candidate had managed to get the first derivative correct he/she would have obtained at
least a mark. From the extract in Figure 4.48, it can be seen that the candidate tried to derive
the function as seen in the third line that the exponent of x was reduced by 1.
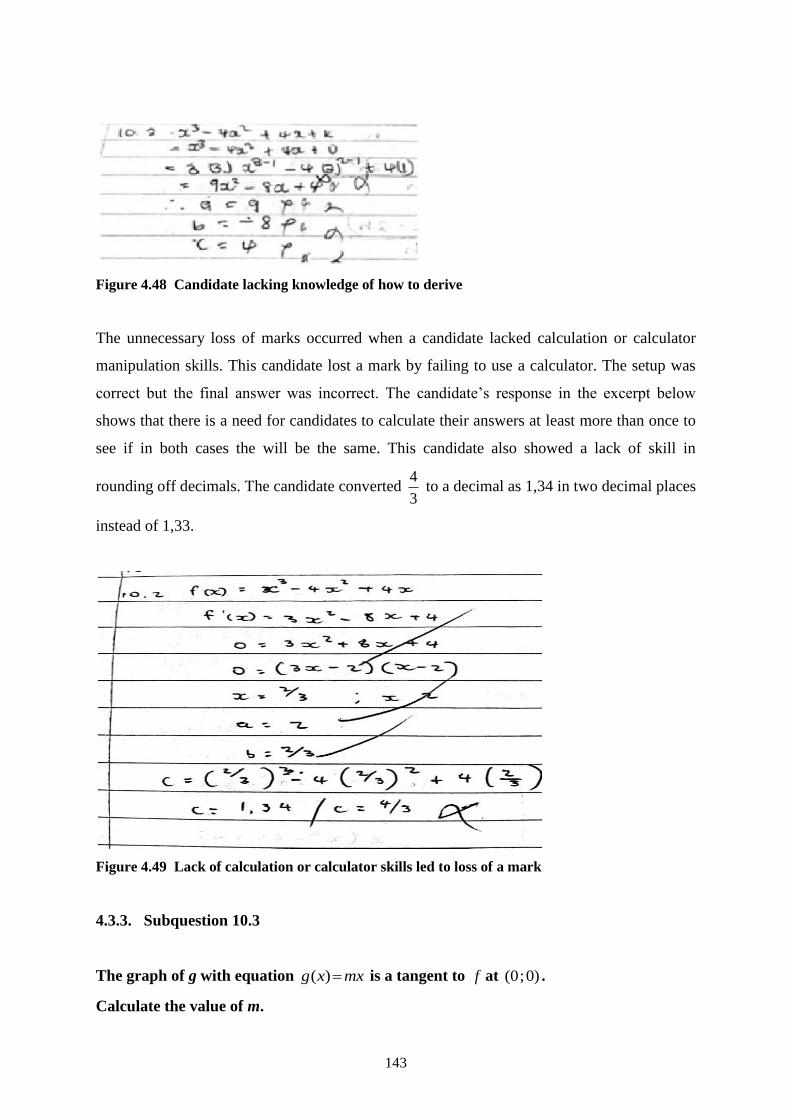
143
Figure 4.48 Candidate lacking knowledge of how to derive
The unnecessary loss of marks occurred when a candidate lacked calculation or calculator
manipulation skills. This candidate lost a mark by failing to use a calculator. The setup was
correct but the final answer was incorrect. The candidate’s response in the excerpt below
shows that there is a need for candidates to calculate their answers at least more than once to
see if in both cases the will be the same. This candidate also showed a lack of skill in
rounding off decimals. The candidate converted 3
4 to a decimal as 1,34 in two decimal places
instead of 1,33.
Figure 4.49 Lack of calculation or calculator skills led to loss of a mark
4.3.3. Subquestion 10.3
The graph of g with equation mxxg )( is a tangent to f at )0;0( .
Calculate the value of m.
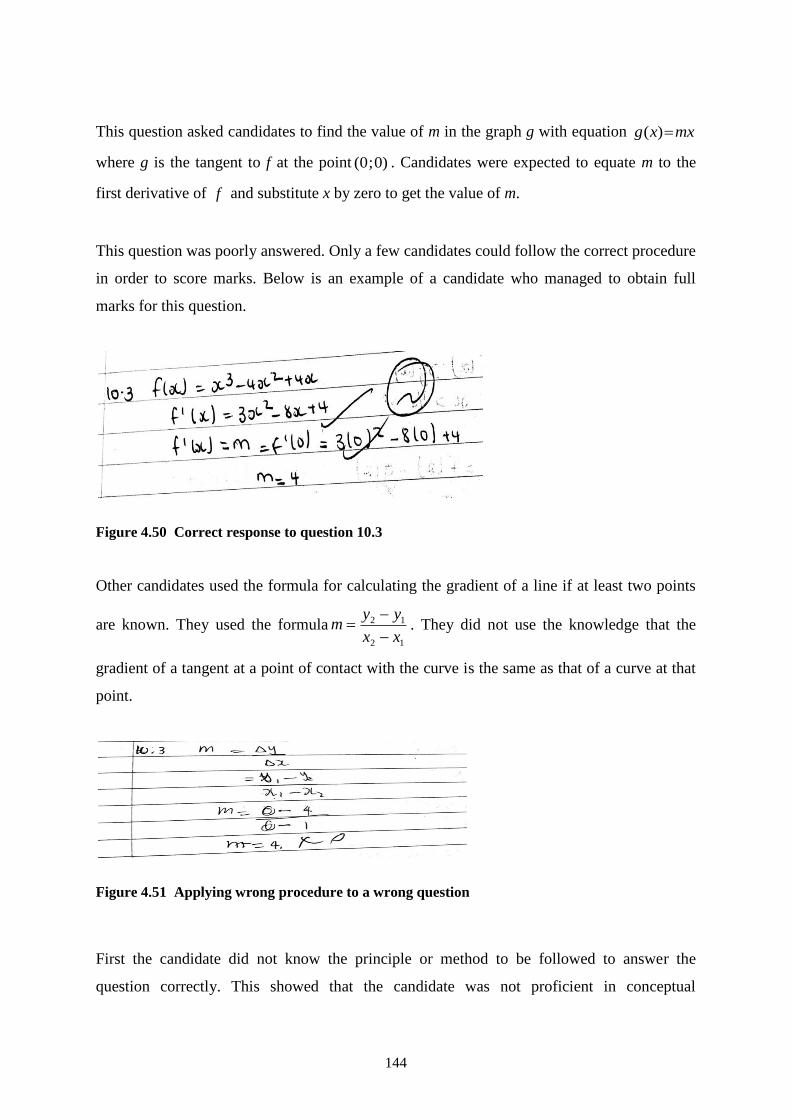
144
This question asked candidates to find the value of m in the graph g with equation mxxg )(
where g is the tangent to f at the point )0;0( . Candidates were expected to equate m to the
first derivative of f and substitute x by zero to get the value of m.
This question was poorly answered. Only a few candidates could follow the correct procedure
in order to score marks. Below is an example of a candidate who managed to obtain full
marks for this question.
Figure 4.50 Correct response to question 10.3
Other candidates used the formula for calculating the gradient of a line if at least two points
are known. They used the formula12
12
xx
yym
. They did not use the knowledge that the
gradient of a tangent at a point of contact with the curve is the same as that of a curve at that
point.
Figure 4.51 Applying wrong procedure to a wrong question
First the candidate did not know the principle or method to be followed to answer the
question correctly. This showed that the candidate was not proficient in conceptual
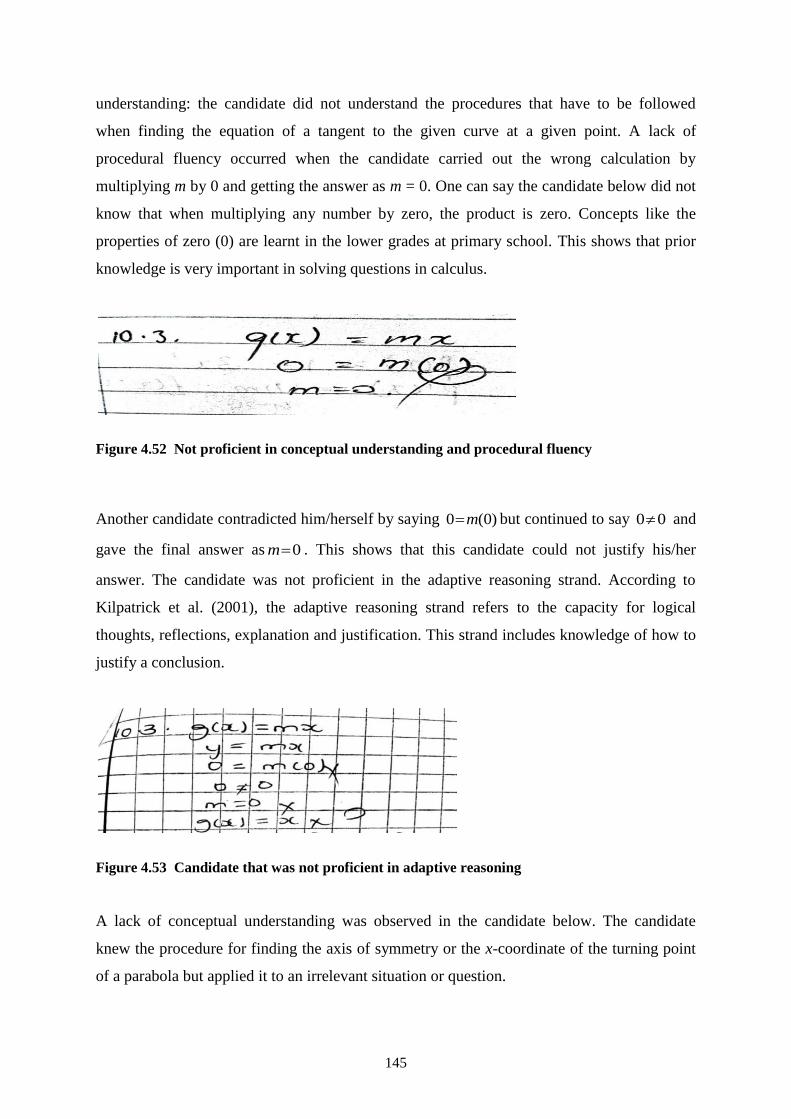
145
understanding: the candidate did not understand the procedures that have to be followed
when finding the equation of a tangent to the given curve at a given point. A lack of
procedural fluency occurred when the candidate carried out the wrong calculation by
multiplying m by 0 and getting the answer as m = 0. One can say the candidate below did not
know that when multiplying any number by zero, the product is zero. Concepts like the
properties of zero (0) are learnt in the lower grades at primary school. This shows that prior
knowledge is very important in solving questions in calculus.
Figure 4.52 Not proficient in conceptual understanding and procedural fluency
Another candidate contradicted him/herself by saying )0(0 m but continued to say 00 and
gave the final answer as 0m . This shows that this candidate could not justify his/her
answer. The candidate was not proficient in the adaptive reasoning strand. According to
Kilpatrick et al. (2001), the adaptive reasoning strand refers to the capacity for logical
thoughts, reflections, explanation and justification. This strand includes knowledge of how to
justify a conclusion.
Figure 4.53 Candidate that was not proficient in adaptive reasoning
A lack of conceptual understanding was observed in the candidate below. The candidate
knew the procedure for finding the axis of symmetry or the x-coordinate of the turning point
of a parabola but applied it to an irrelevant situation or question.
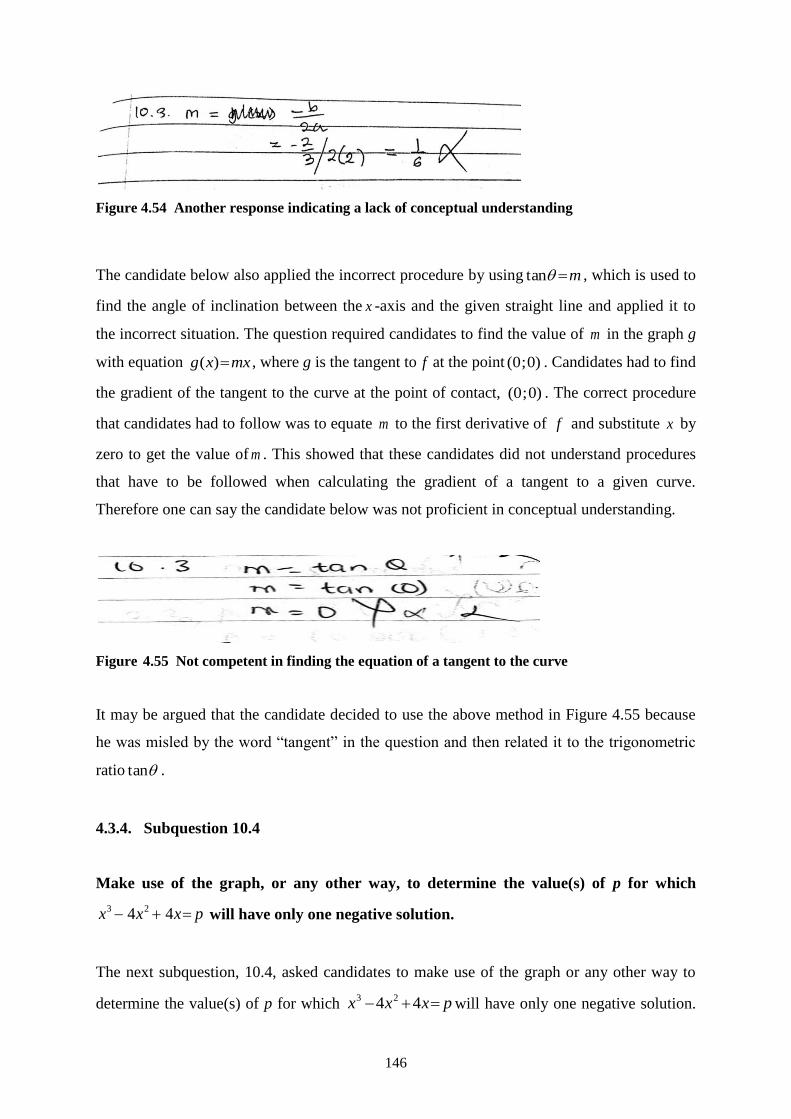
146
Figure 4.54 Another response indicating a lack of conceptual understanding
The candidate below also applied the incorrect procedure by using mtan , which is used to
find the angle of inclination between the x -axis and the given straight line and applied it to
the incorrect situation. The question required candidates to find the value of m in the graph g
with equation mxxg )( , where g is the tangent to f at the point )0;0( . Candidates had to find
the gradient of the tangent to the curve at the point of contact, )0;0( . The correct procedure
that candidates had to follow was to equate m to the first derivative of f and substitute x by
zero to get the value of m . This showed that these candidates did not understand procedures
that have to be followed when calculating the gradient of a tangent to a given curve.
Therefore one can say the candidate below was not proficient in conceptual understanding.
Figure 4.55 Not competent in finding the equation of a tangent to the curve
It may be argued that the candidate decided to use the above method in Figure 4.55 because
he was misled by the word “tangent” in the question and then related it to the trigonometric
ratio tan .
4.3.4. Subquestion 10.4
Make use of the graph, or any other way, to determine the value(s) of p for which
pxxx 44 23 will have only one negative solution.
The next subquestion, 10.4, asked candidates to make use of the graph or any other way to
determine the value(s) of p for which pxxx 44 23will have only one negative solution.
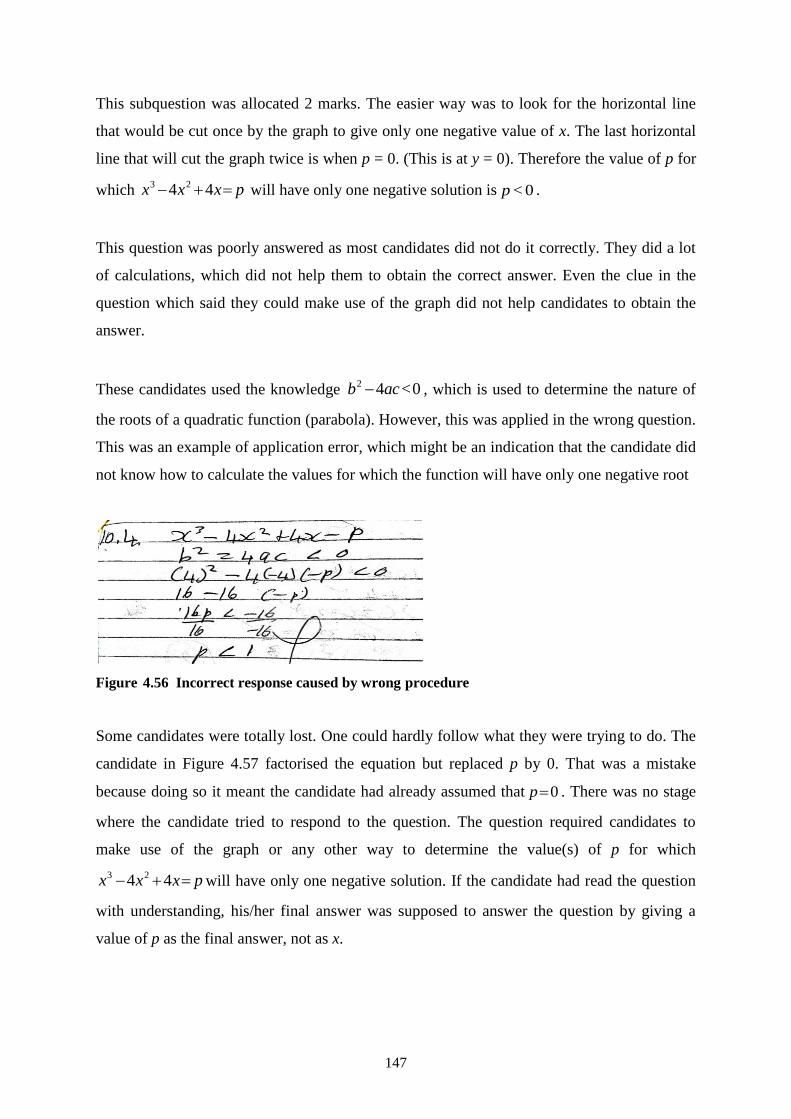
147
This subquestion was allocated 2 marks. The easier way was to look for the horizontal line
that would be cut once by the graph to give only one negative value of x. The last horizontal
line that will cut the graph twice is when p = 0. (This is at y = 0). Therefore the value of p for
which pxxx 44 23 will have only one negative solution is 0<p .
This question was poorly answered as most candidates did not do it correctly. They did a lot
of calculations, which did not help them to obtain the correct answer. Even the clue in the
question which said they could make use of the graph did not help candidates to obtain the
answer.
These candidates used the knowledge 0<42 acb , which is used to determine the nature of
the roots of a quadratic function (parabola). However, this was applied in the wrong question.
This was an example of application error, which might be an indication that the candidate did
not know how to calculate the values for which the function will have only one negative root
Figure 4.56 Incorrect response caused by wrong procedure
Some candidates were totally lost. One could hardly follow what they were trying to do. The
candidate in Figure 4.57 factorised the equation but replaced p by 0. That was a mistake
because doing so it meant the candidate had already assumed that 0p . There was no stage
where the candidate tried to respond to the question. The question required candidates to
make use of the graph or any other way to determine the value(s) of p for which
pxxx 44 23will have only one negative solution. If the candidate had read the question
with understanding, his/her final answer was supposed to answer the question by giving a
value of p as the final answer, not as x.
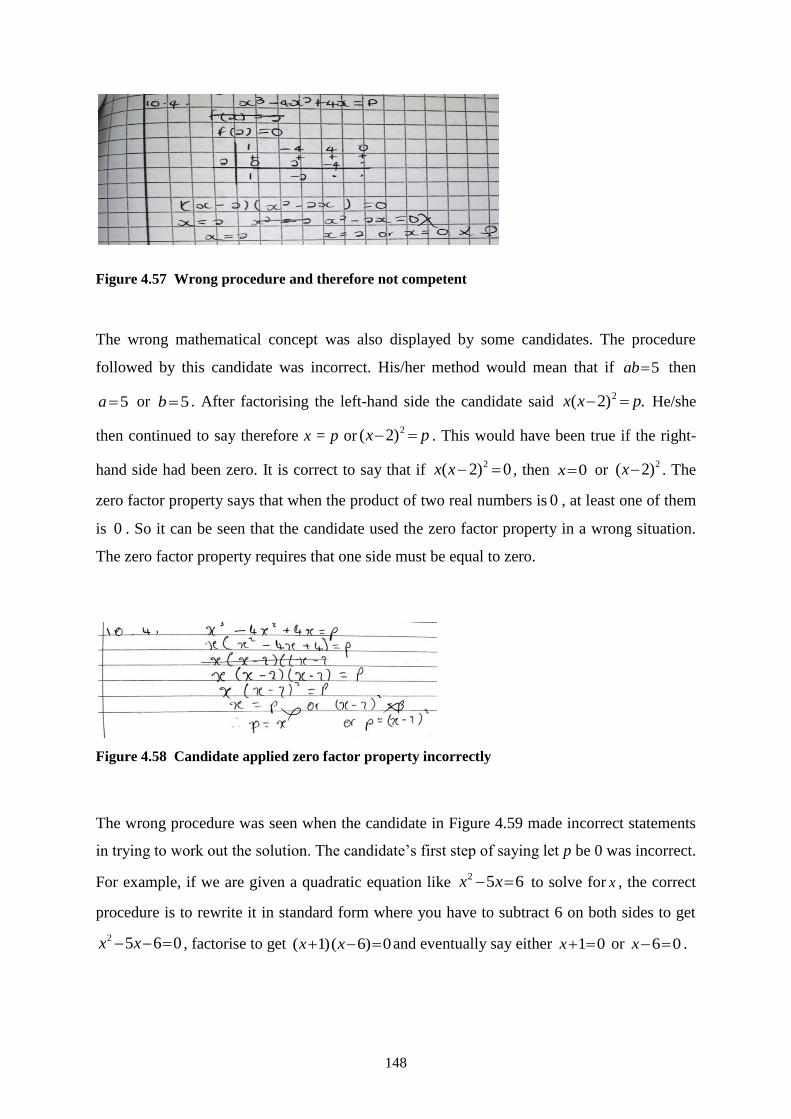
148
Figure 4.57 Wrong procedure and therefore not competent
The wrong mathematical concept was also displayed by some candidates. The procedure
followed by this candidate was incorrect. His/her method would mean that if 5ab then
5a or 5b . After factorising the left-hand side the candidate said .)2( 2 pxx He/she
then continued to say therefore x = p or px 2)2( . This would have been true if the right-
hand side had been zero. It is correct to say that if 0)2( 2 xx , then 0x or 2)2( x . The
zero factor property says that when the product of two real numbers is 0 , at least one of them
is 0 . So it can be seen that the candidate used the zero factor property in a wrong situation.
The zero factor property requires that one side must be equal to zero.
Figure 4.58 Candidate applied zero factor property incorrectly
The wrong procedure was seen when the candidate in Figure 4.59 made incorrect statements
in trying to work out the solution. The candidate’s first step of saying let p be 0 was incorrect.
For example, if we are given a quadratic equation like 652 xx to solve for x , the correct
procedure is to rewrite it in standard form where you have to subtract 6 on both sides to get
0652 xx , factorise to get 0)6()1( xx and eventually say either 01x or 06x .
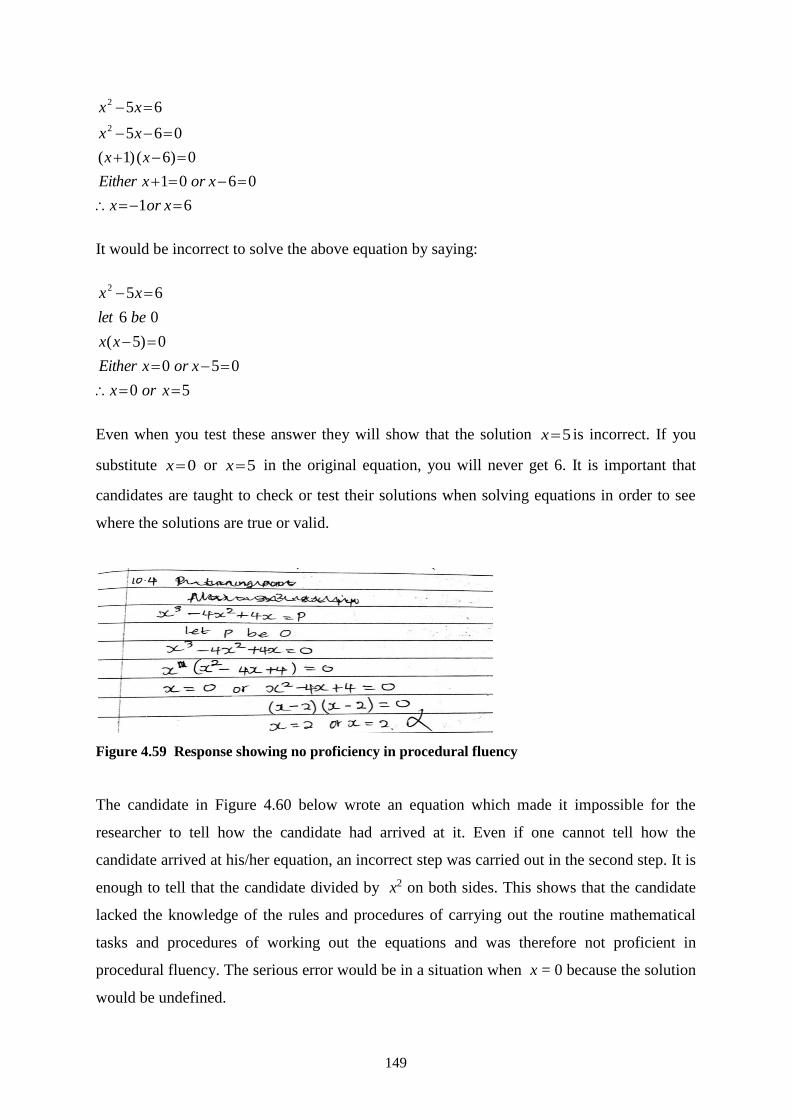
149
61
0601
0)6()1(
065
65
2
2
xorx
xorxEither
xx
xx
xx
It would be incorrect to solve the above equation by saying:
50
050
0)5(
06
652
xorx
xorxEither
xx
belet
xx
Even when you test these answer they will show that the solution 5x is incorrect. If you
substitute 0x or 5x in the original equation, you will never get 6. It is important that
candidates are taught to check or test their solutions when solving equations in order to see
where the solutions are true or valid.
Figure 4.59 Response showing no proficiency in procedural fluency
The candidate in Figure 4.60 below wrote an equation which made it impossible for the
researcher to tell how the candidate had arrived at it. Even if one cannot tell how the
candidate arrived at his/her equation, an incorrect step was carried out in the second step. It is
enough to tell that the candidate divided by x2 on both sides. This shows that the candidate
lacked the knowledge of the rules and procedures of carrying out the routine mathematical
tasks and procedures of working out the equations and was therefore not proficient in
procedural fluency. The serious error would be in a situation when x = 0 because the solution
would be undefined.
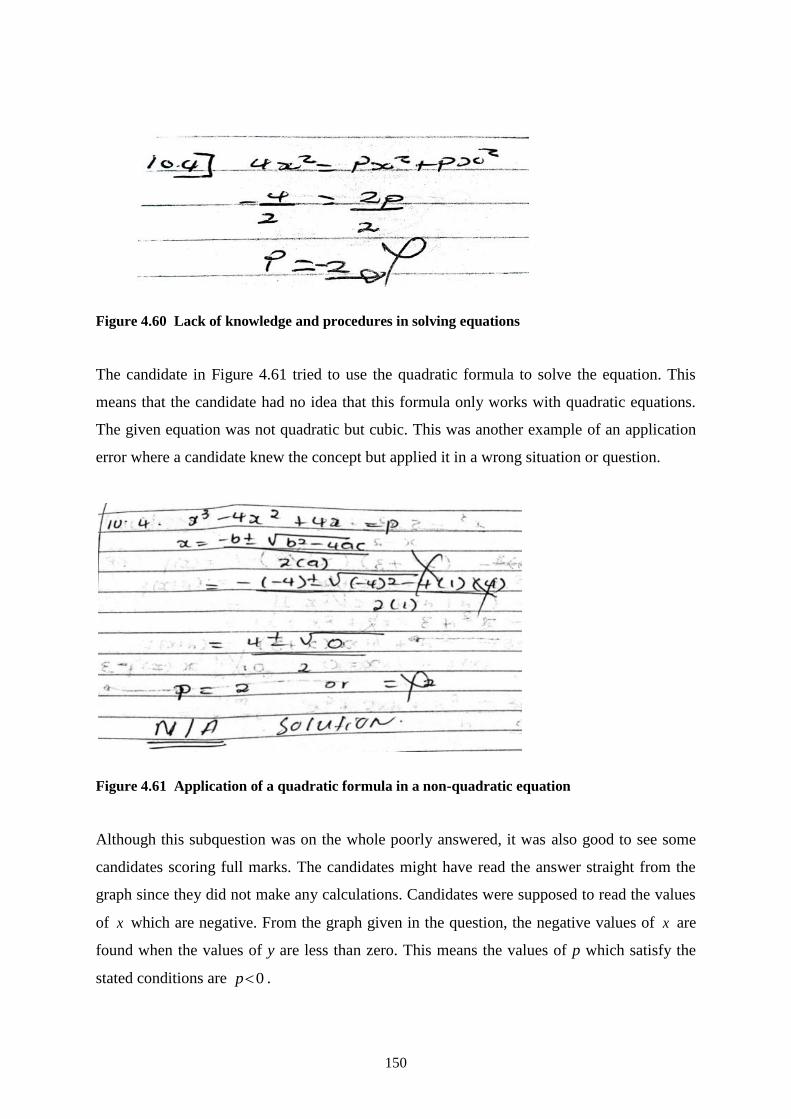
150
Figure 4.60 Lack of knowledge and procedures in solving equations
The candidate in Figure 4.61 tried to use the quadratic formula to solve the equation. This
means that the candidate had no idea that this formula only works with quadratic equations.
The given equation was not quadratic but cubic. This was another example of an application
error where a candidate knew the concept but applied it in a wrong situation or question.
Figure 4.61 Application of a quadratic formula in a non-quadratic equation
Although this subquestion was on the whole poorly answered, it was also good to see some
candidates scoring full marks. The candidates might have read the answer straight from the
graph since they did not make any calculations. Candidates were supposed to read the values
of x which are negative. From the graph given in the question, the negative values of x are
found when the values of y are less than zero. This means the values of p which satisfy the
stated conditions are 0p .
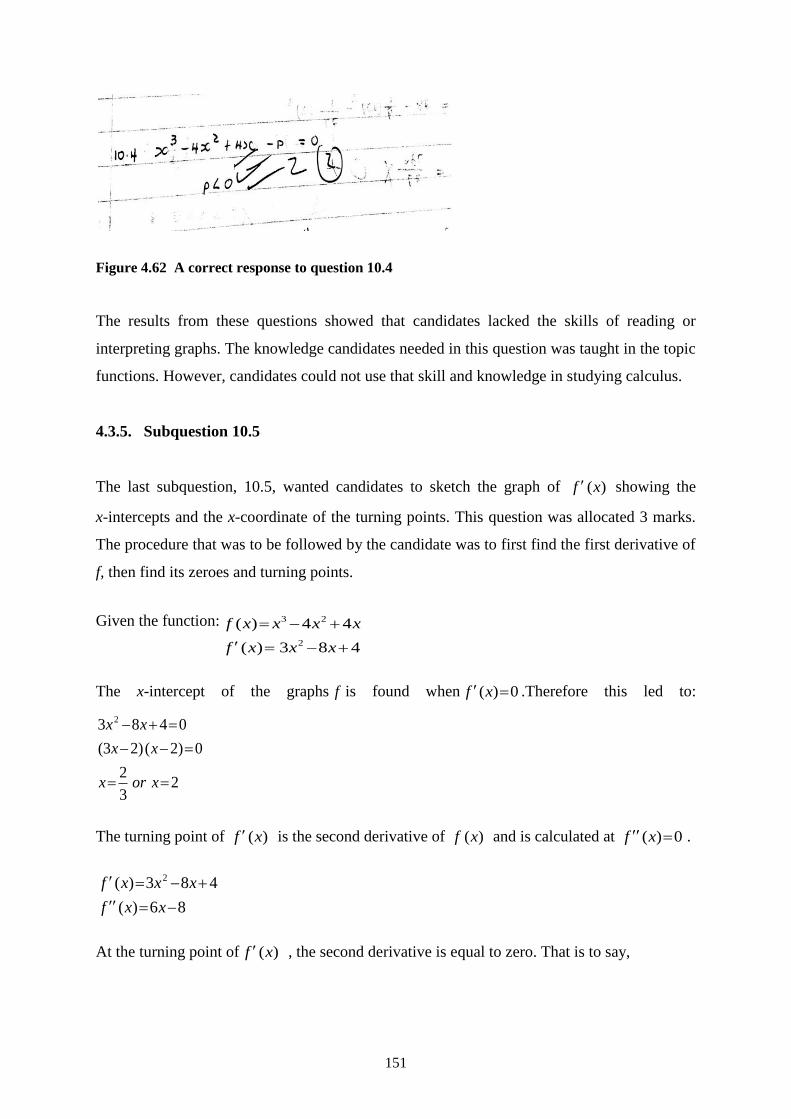
151
Figure 4.62 A correct response to question 10.4
The results from these questions showed that candidates lacked the skills of reading or
interpreting graphs. The knowledge candidates needed in this question was taught in the topic
functions. However, candidates could not use that skill and knowledge in studying calculus.
4.3.5. Subquestion 10.5
The last subquestion, 10.5, wanted candidates to sketch the graph of )(xf showing the
x-intercepts and the x-coordinate of the turning points. This question was allocated 3 marks.
The procedure that was to be followed by the candidate was to first find the first derivative of
f, then find its zeroes and turning points.
Given the function:
483)(
44)(
2
23
xxxf
xxxxf
The x-intercept of the graphs f is found when 0)( xf .Therefore this led to:
23
2
0)2()23(
0483 2
xorx
xx
xx
The turning point of )(xf is the second derivative of )(xf and is calculated at 0)( xf .
86)(
483)( 2
xxf
xxxf
At the turning point of )(xf , the second derivative is equal to zero. That is to say,
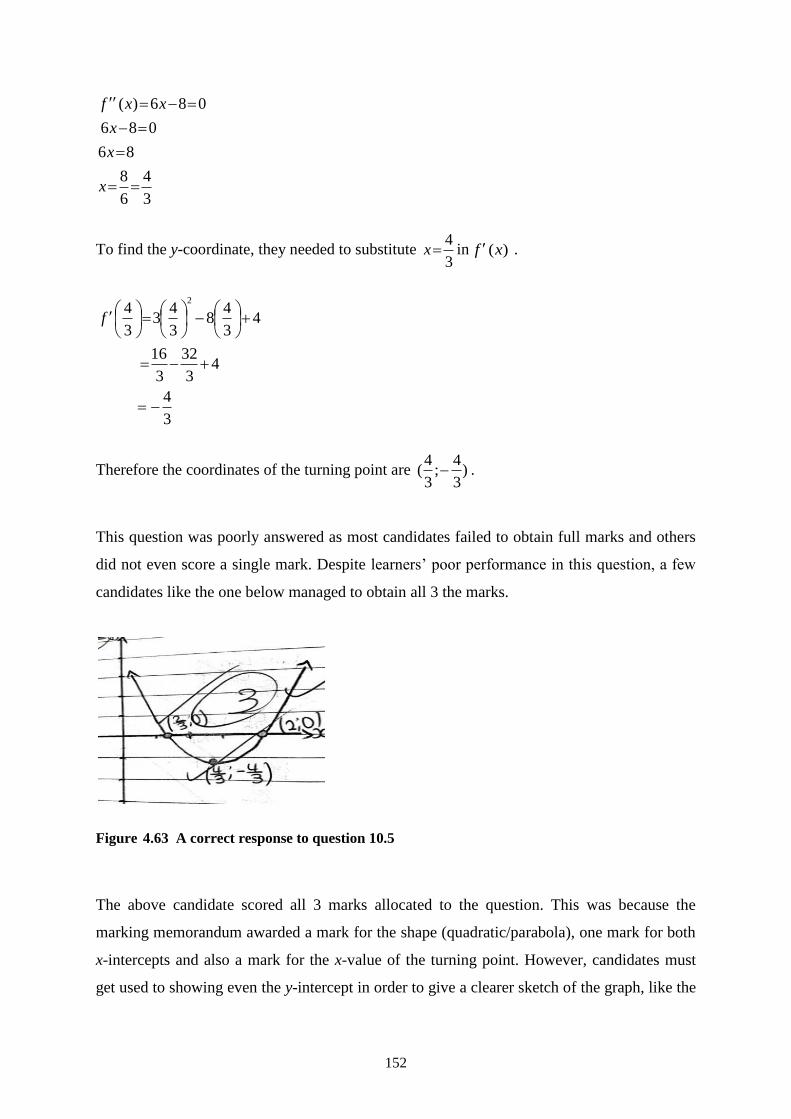
152
3
4
6
8
86
086
086)(
x
x
x
xxf
To find the y-coordinate, they needed to substitute 3
4x in )(xf .
3
4
43
32
3
16
43
48
3
43
3
42
f
Therefore the coordinates of the turning point are )3
4;
3
4( .
This question was poorly answered as most candidates failed to obtain full marks and others
did not even score a single mark. Despite learners’ poor performance in this question, a few
candidates like the one below managed to obtain all 3 the marks.
Figure 4.63 A correct response to question 10.5
The above candidate scored all 3 marks allocated to the question. This was because the
marking memorandum awarded a mark for the shape (quadratic/parabola), one mark for both
x-intercepts and also a mark for the x-value of the turning point. However, candidates must
get used to showing even the y-intercept in order to give a clearer sketch of the graph, like the
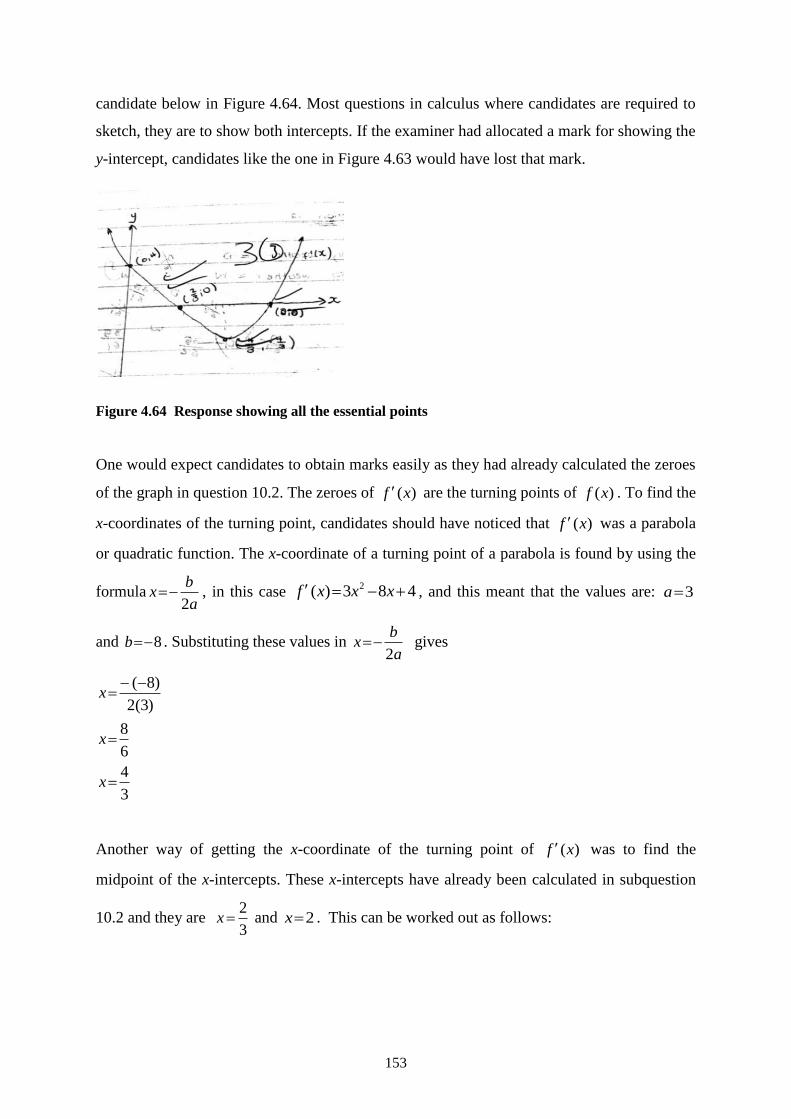
153
candidate below in Figure 4.64. Most questions in calculus where candidates are required to
sketch, they are to show both intercepts. If the examiner had allocated a mark for showing the
y-intercept, candidates like the one in Figure 4.63 would have lost that mark.
Figure 4.64 Response showing all the essential points
One would expect candidates to obtain marks easily as they had already calculated the zeroes
of the graph in question 10.2. The zeroes of )(xf are the turning points of )(xf . To find the
x-coordinates of the turning point, candidates should have noticed that )(xf was a parabola
or quadratic function. The x-coordinate of a turning point of a parabola is found by using the
formulaa
bx
2 , in this case 483)( 2 xxxf , and this meant that the values are: 3a
and 8b . Substituting these values in a
bx
2 gives
3
4
6
8
)3(2
)8(
x
x
x
Another way of getting the x-coordinate of the turning point of )(xf was to find the
midpoint of the x-intercepts. These x-intercepts have already been calculated in subquestion
10.2 and they are 3
2x and 2x . This can be worked out as follows:
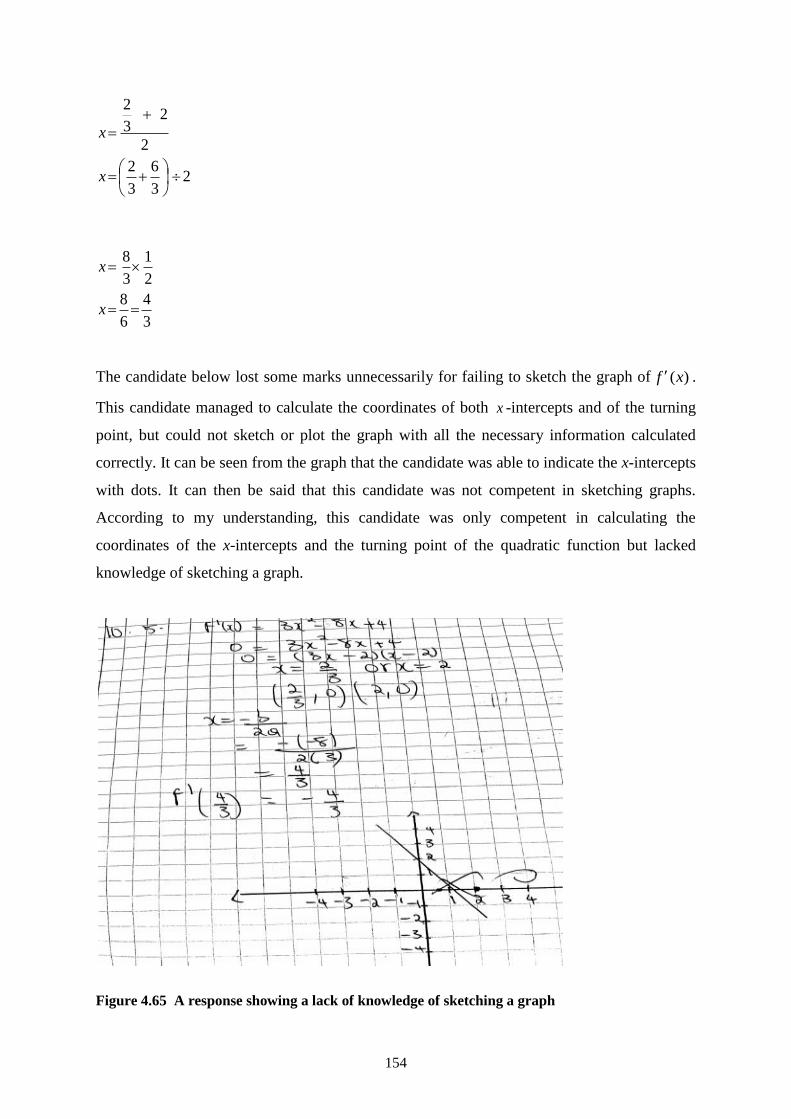
154
23
6
3
2
2
23
2
x
x
3
4
6
8
2
1
3
8
x
x
The candidate below lost some marks unnecessarily for failing to sketch the graph of )(xf .
This candidate managed to calculate the coordinates of both x -intercepts and of the turning
point, but could not sketch or plot the graph with all the necessary information calculated
correctly. It can be seen from the graph that the candidate was able to indicate the x-intercepts
with dots. It can then be said that this candidate was not competent in sketching graphs.
According to my understanding, this candidate was only competent in calculating the
coordinates of the x-intercepts and the turning point of the quadratic function but lacked
knowledge of sketching a graph.
Figure 4.65 A response showing a lack of knowledge of sketching a graph
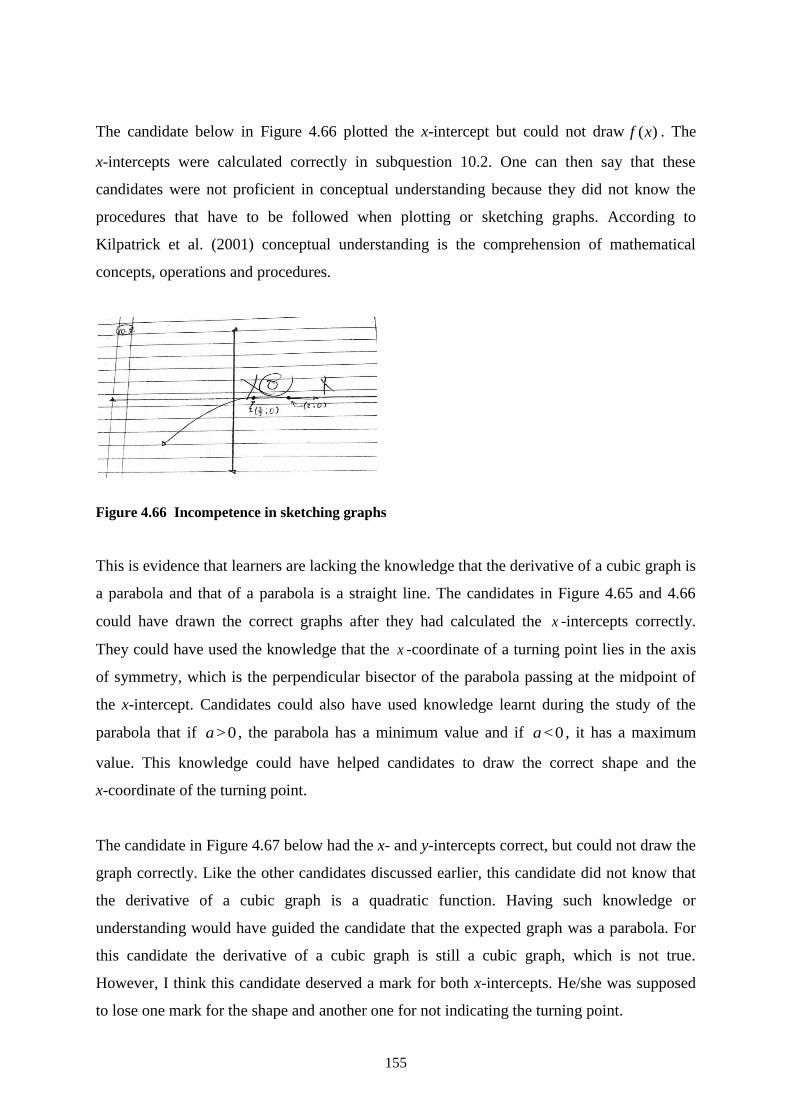
155
The candidate below in Figure 4.66 plotted the x-intercept but could not draw )(xf . The
x-intercepts were calculated correctly in subquestion 10.2. One can then say that these
candidates were not proficient in conceptual understanding because they did not know the
procedures that have to be followed when plotting or sketching graphs. According to
Kilpatrick et al. (2001) conceptual understanding is the comprehension of mathematical
concepts, operations and procedures.
Figure 4.66 Incompetence in sketching graphs
This is evidence that learners are lacking the knowledge that the derivative of a cubic graph is
a parabola and that of a parabola is a straight line. The candidates in Figure 4.65 and 4.66
could have drawn the correct graphs after they had calculated the x -intercepts correctly.
They could have used the knowledge that the x -coordinate of a turning point lies in the axis
of symmetry, which is the perpendicular bisector of the parabola passing at the midpoint of
the x-intercept. Candidates could also have used knowledge learnt during the study of the
parabola that if 0>a , the parabola has a minimum value and if 0<a , it has a maximum
value. This knowledge could have helped candidates to draw the correct shape and the
x-coordinate of the turning point.
The candidate in Figure 4.67 below had the x- and y-intercepts correct, but could not draw the
graph correctly. Like the other candidates discussed earlier, this candidate did not know that
the derivative of a cubic graph is a quadratic function. Having such knowledge or
understanding would have guided the candidate that the expected graph was a parabola. For
this candidate the derivative of a cubic graph is still a cubic graph, which is not true.
However, I think this candidate deserved a mark for both x-intercepts. He/she was supposed
to lose one mark for the shape and another one for not indicating the turning point.
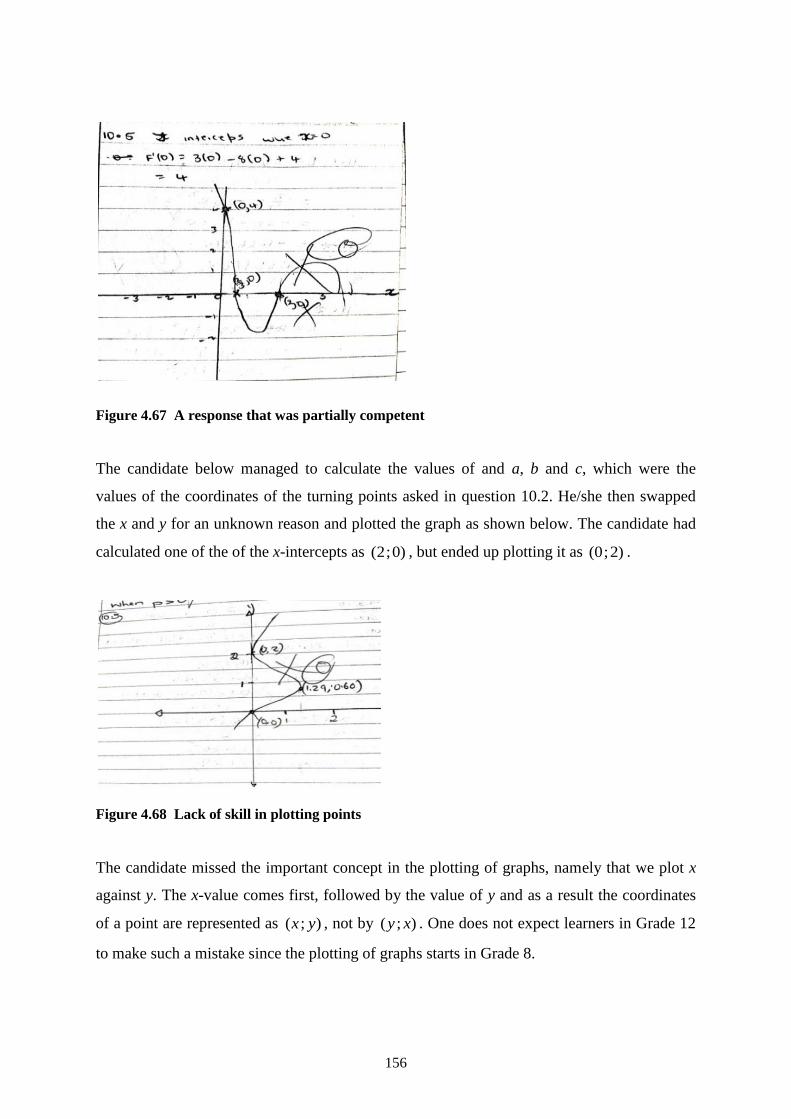
156
Figure 4.67 A response that was partially competent
The candidate below managed to calculate the values of and a, b and c, which were the
values of the coordinates of the turning points asked in question 10.2. He/she then swapped
the x and y for an unknown reason and plotted the graph as shown below. The candidate had
calculated one of the of the x-intercepts as )0;2( , but ended up plotting it as )2;0( .
Figure 4.68 Lack of skill in plotting points
The candidate missed the important concept in the plotting of graphs, namely that we plot x
against y. The x-value comes first, followed by the value of y and as a result the coordinates
of a point are represented as );( yx , not by );( xy . One does not expect learners in Grade 12
to make such a mistake since the plotting of graphs starts in Grade 8.
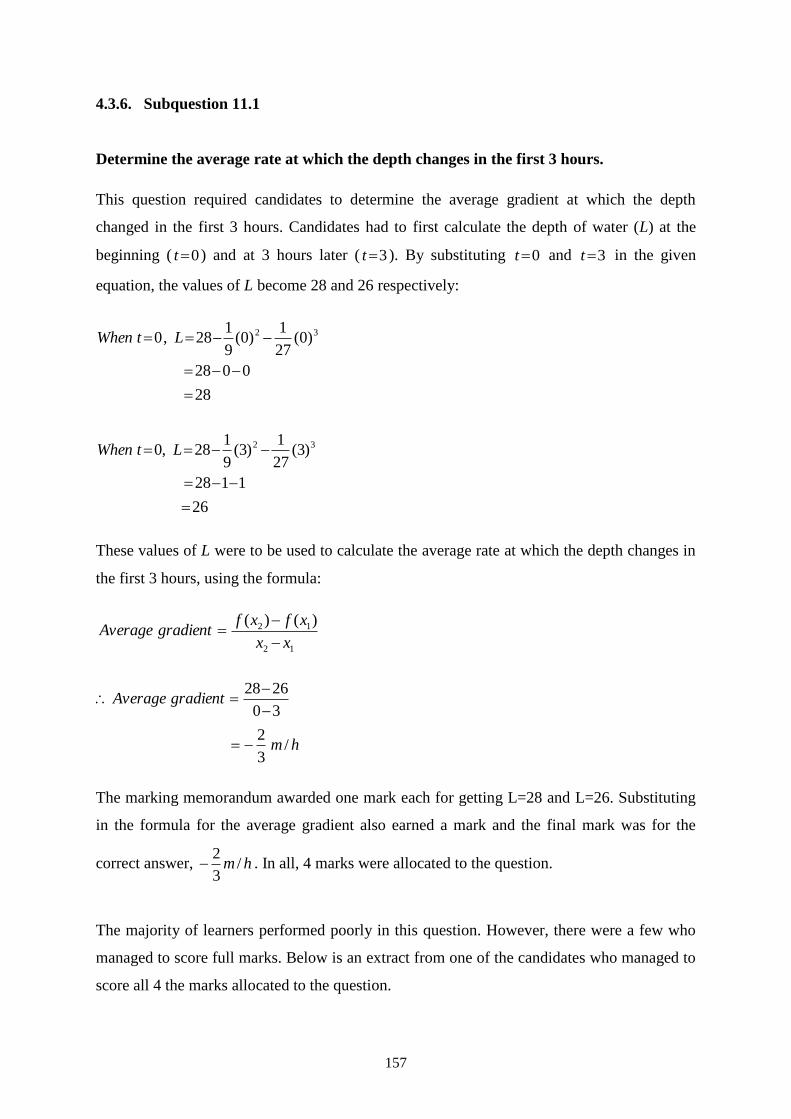
157
4.3.6. Subquestion 11.1
Determine the average rate at which the depth changes in the first 3 hours.
This question required candidates to determine the average gradient at which the depth
changed in the first 3 hours. Candidates had to first calculate the depth of water (L) at the
beginning ( 0t ) and at 3 hours later ( 3t ). By substituting 0t and 3t in the given
equation, the values of L become 28 and 26 respectively:
28
0028
)0(27
1)0(
9
128,0 32
LtWhen
26
1128
)3(27
1)3(
9
128,0 32
LtWhen
These values of L were to be used to calculate the average rate at which the depth changes in
the first 3 hours, using the formula:
12
12 )()(
xx
xfxfgradientAverage
hm
gradientAverage
/3
2
30
2628
The marking memorandum awarded one mark each for getting L=28 and L=26. Substituting
in the formula for the average gradient also earned a mark and the final mark was for the
correct answer, hm /3
2 . In all, 4 marks were allocated to the question.
The majority of learners performed poorly in this question. However, there were a few who
managed to score full marks. Below is an extract from one of the candidates who managed to
score all 4 the marks allocated to the question.
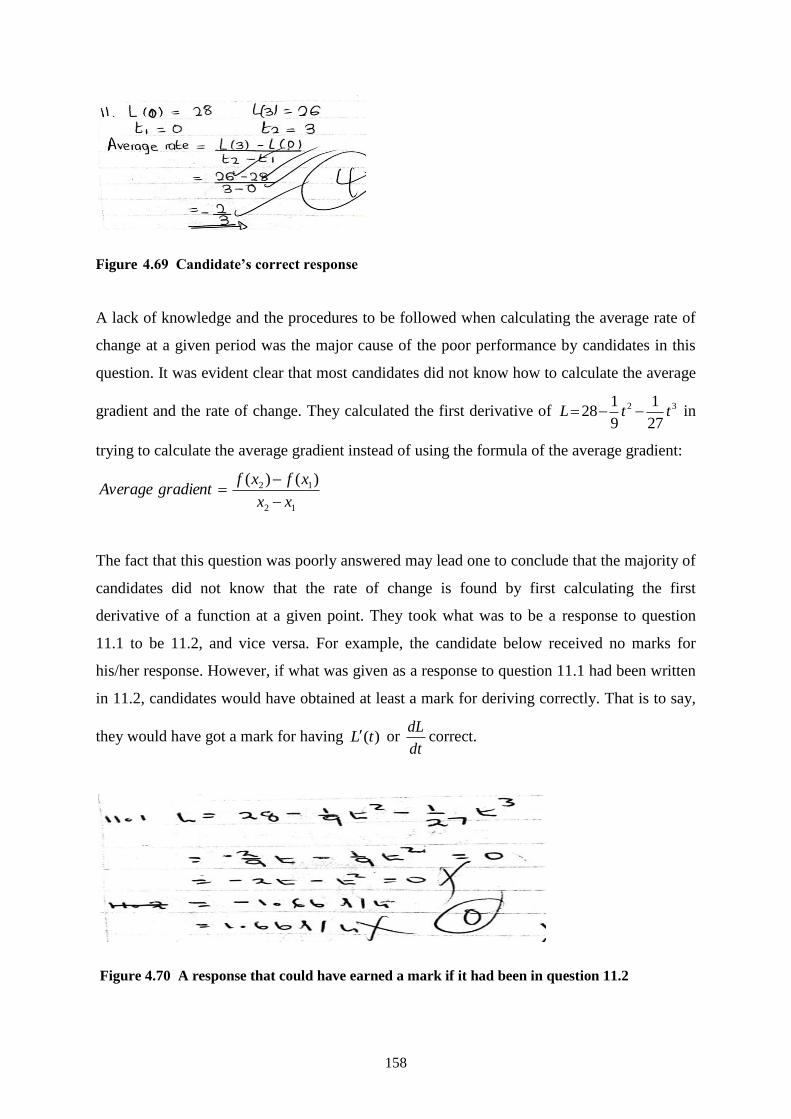
158
Figure 4.69 Candidate’s correct response
A lack of knowledge and the procedures to be followed when calculating the average rate of
change at a given period was the major cause of the poor performance by candidates in this
question. It was evident clear that most candidates did not know how to calculate the average
gradient and the rate of change. They calculated the first derivative of 32
27
1
9
128 ttL in
trying to calculate the average gradient instead of using the formula of the average gradient:
12
12 )()(
xx
xfxfgradientAverage
The fact that this question was poorly answered may lead one to conclude that the majority of
candidates did not know that the rate of change is found by first calculating the first
derivative of a function at a given point. They took what was to be a response to question
11.1 to be 11.2, and vice versa. For example, the candidate below received no marks for
his/her response. However, if what was given as a response to question 11.1 had been written
in 11.2, candidates would have obtained at least a mark for deriving correctly. That is to say,
they would have got a mark for having )(tL or dt
dLcorrect.
Figure 4.70 A response that could have earned a mark if it had been in question 11.2
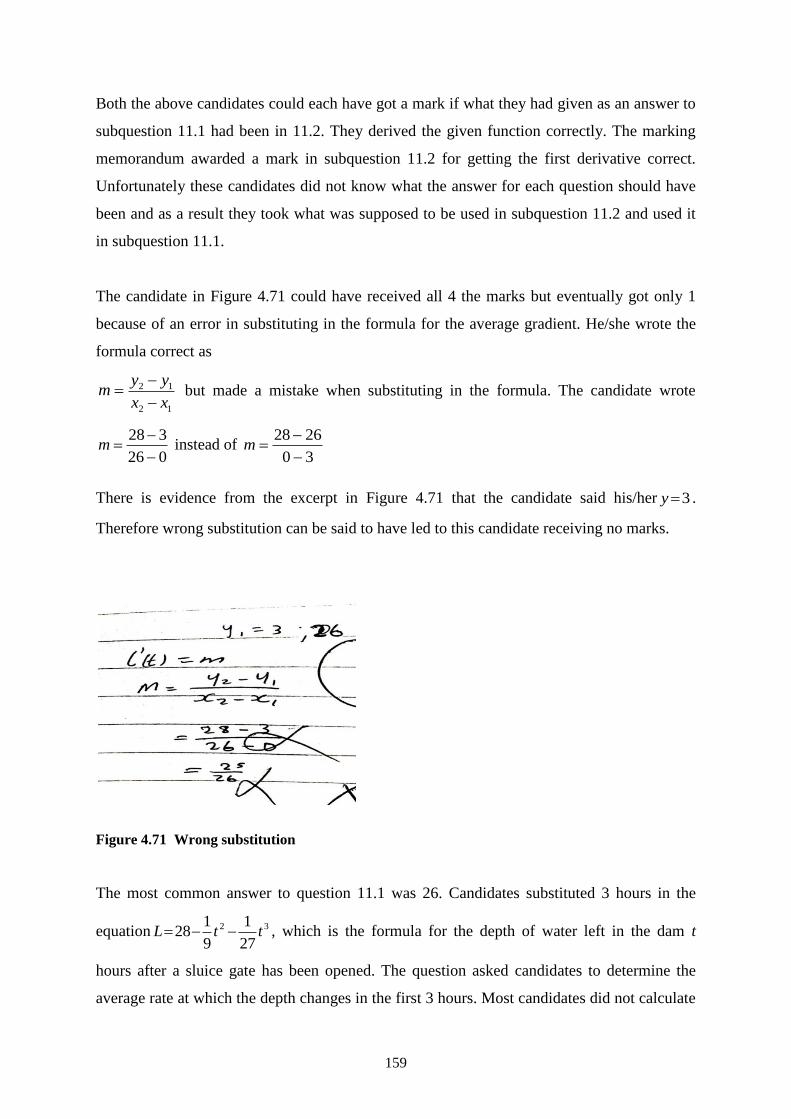
159
Both the above candidates could each have got a mark if what they had given as an answer to
subquestion 11.1 had been in 11.2. They derived the given function correctly. The marking
memorandum awarded a mark in subquestion 11.2 for getting the first derivative correct.
Unfortunately these candidates did not know what the answer for each question should have
been and as a result they took what was supposed to be used in subquestion 11.2 and used it
in subquestion 11.1.
The candidate in Figure 4.71 could have received all 4 the marks but eventually got only 1
because of an error in substituting in the formula for the average gradient. He/she wrote the
formula correct as
12
12
xx
yym
but made a mistake when substituting in the formula. The candidate wrote
026
328
m instead of
30
2628
m
There is evidence from the excerpt in Figure 4.71 that the candidate said his/her 3y .
Therefore wrong substitution can be said to have led to this candidate receiving no marks.
Figure 4.71 Wrong substitution
The most common answer to question 11.1 was 26. Candidates substituted 3 hours in the
equation 32
27
1
9
128 ttL , which is the formula for the depth of water left in the dam t
hours after a sluice gate has been opened. The question asked candidates to determine the
average rate at which the depth changes in the first 3 hours. Most candidates did not calculate
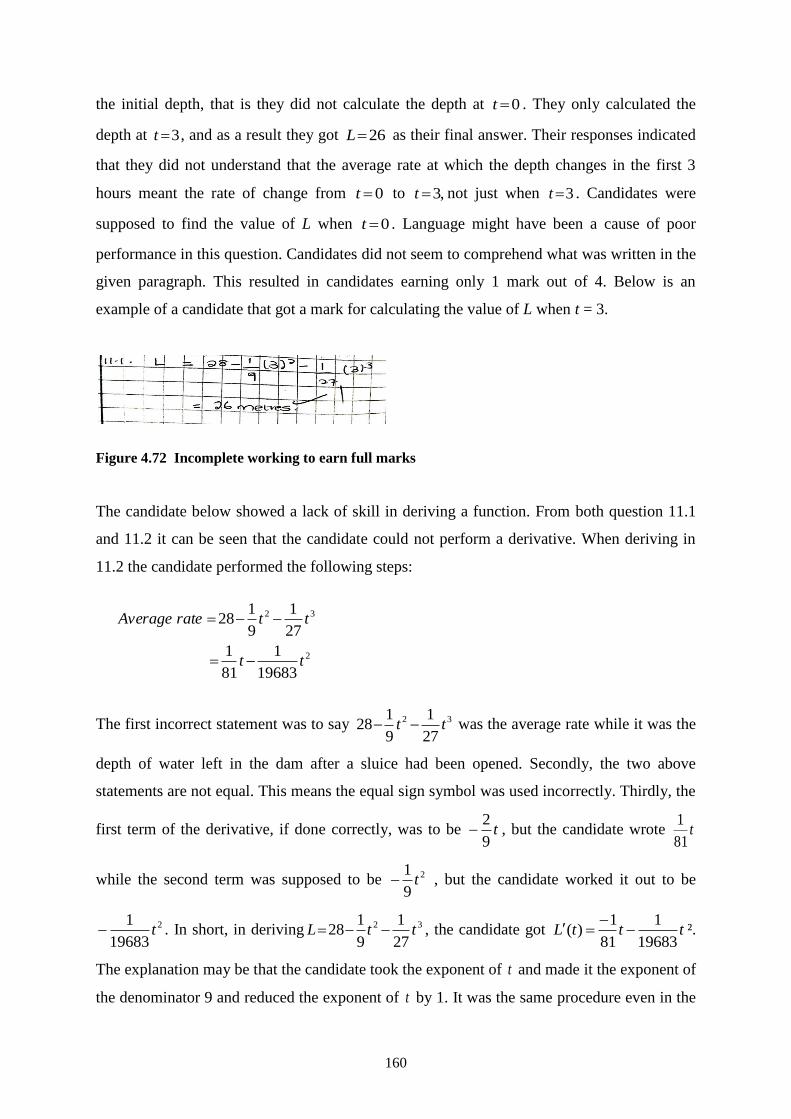
160
the initial depth, that is they did not calculate the depth at 0t . They only calculated the
depth at 3t , and as a result they got 26L as their final answer. Their responses indicated
that they did not understand that the average rate at which the depth changes in the first 3
hours meant the rate of change from 0t to ,3t not just when 3t . Candidates were
supposed to find the value of L when 0t . Language might have been a cause of poor
performance in this question. Candidates did not seem to comprehend what was written in the
given paragraph. This resulted in candidates earning only 1 mark out of 4. Below is an
example of a candidate that got a mark for calculating the value of L when t = 3.
Figure 4.72 Incomplete working to earn full marks
The candidate below showed a lack of skill in deriving a function. From both question 11.1
and 11.2 it can be seen that the candidate could not perform a derivative. When deriving in
11.2 the candidate performed the following steps:
2
32
19683
1
81
1
27
1
9
128
tt
ttrateAverage
The first incorrect statement was to say 32
27
1
9
128 tt was the average rate while it was the
depth of water left in the dam after a sluice had been opened. Secondly, the two above
statements are not equal. This means the equal sign symbol was used incorrectly. Thirdly, the
first term of the derivative, if done correctly, was to be t9
2 , but the candidate wrote t
81
1
while the second term was supposed to be 2
9
1t , but the candidate worked it out to be
2
19683
1t . In short, in deriving 32
27
1
9
128 ttL , the candidate got tttL
19683
1
81
1)(
².
The explanation may be that the candidate took the exponent of t and made it the exponent of
the denominator 9 and reduced the exponent of t by 1. It was the same procedure even in the
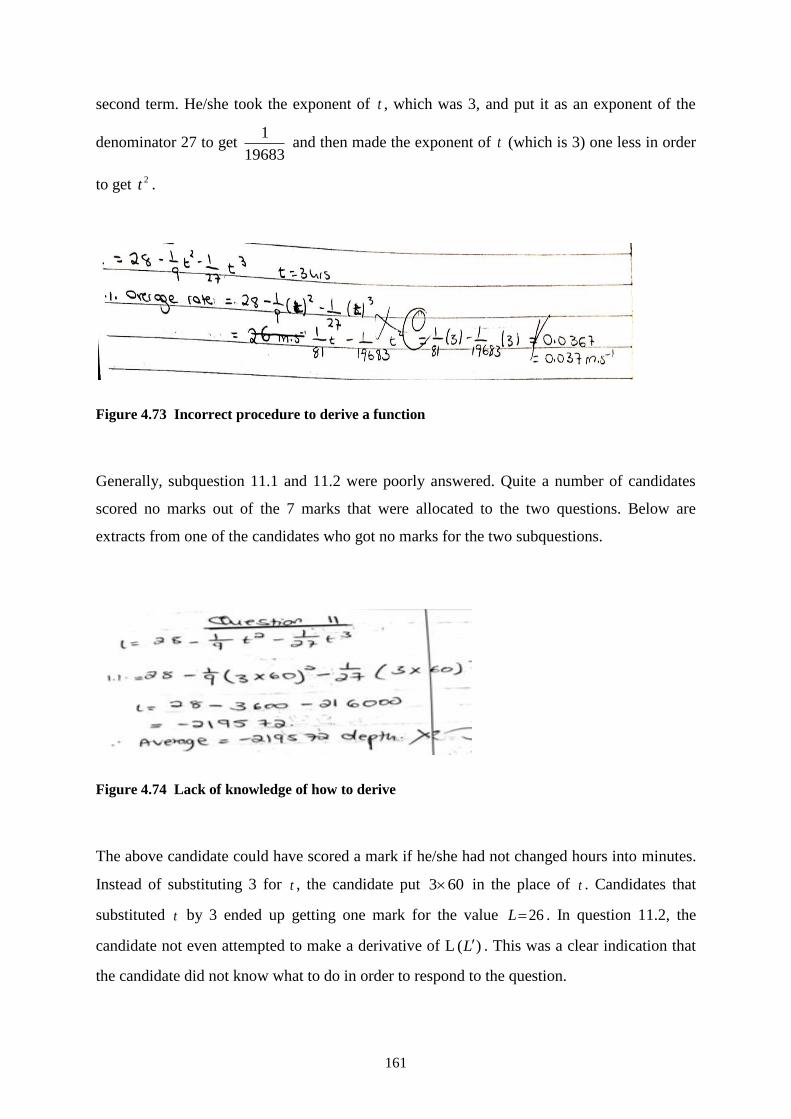
161
second term. He/she took the exponent of t , which was 3, and put it as an exponent of the
denominator 27 to get 19683
1 and then made the exponent of t (which is 3) one less in order
to get 2t .
Figure 4.73 Incorrect procedure to derive a function
Generally, subquestion 11.1 and 11.2 were poorly answered. Quite a number of candidates
scored no marks out of the 7 marks that were allocated to the two questions. Below are
extracts from one of the candidates who got no marks for the two subquestions.
Figure 4.74 Lack of knowledge of how to derive
The above candidate could have scored a mark if he/she had not changed hours into minutes.
Instead of substituting 3 for t , the candidate put 603 in the place of t . Candidates that
substituted t by 3 ended up getting one mark for the value 26L . In question 11.2, the
candidate not even attempted to make a derivative of L )(L . This was a clear indication that
the candidate did not know what to do in order to respond to the question.
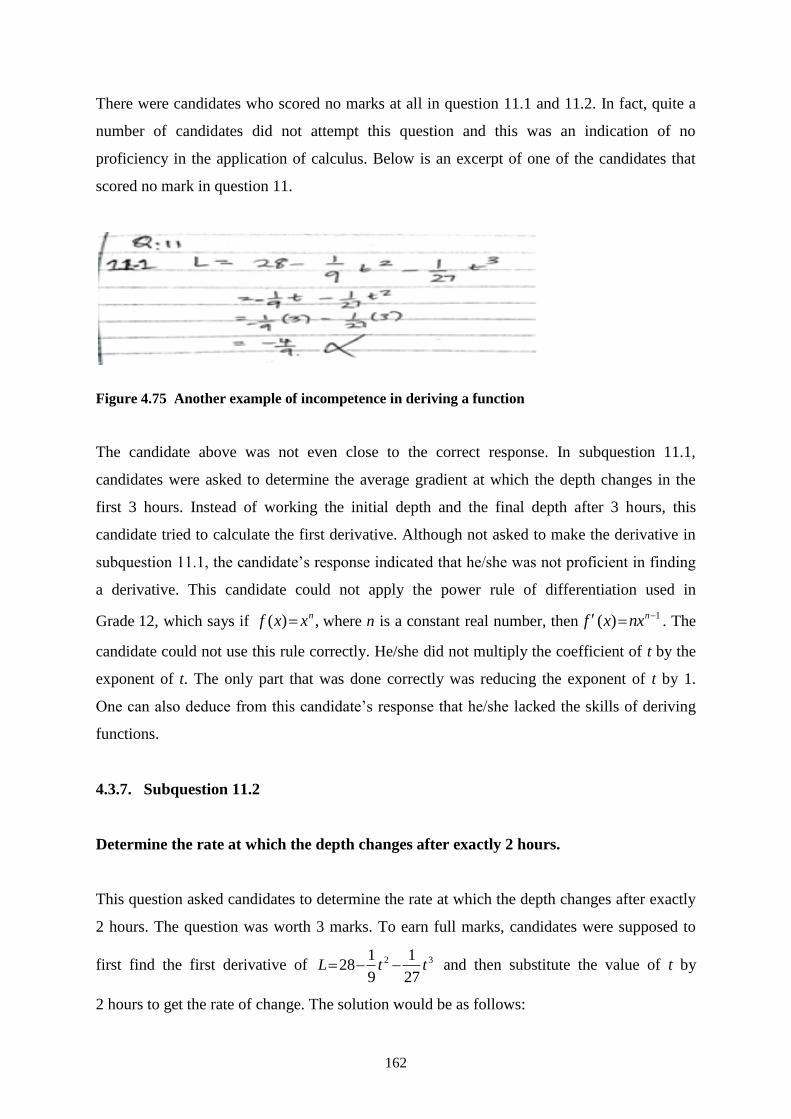
162
There were candidates who scored no marks at all in question 11.1 and 11.2. In fact, quite a
number of candidates did not attempt this question and this was an indication of no
proficiency in the application of calculus. Below is an excerpt of one of the candidates that
scored no mark in question 11.
Figure 4.75 Another example of incompetence in deriving a function
The candidate above was not even close to the correct response. In subquestion 11.1,
candidates were asked to determine the average gradient at which the depth changes in the
first 3 hours. Instead of working the initial depth and the final depth after 3 hours, this
candidate tried to calculate the first derivative. Although not asked to make the derivative in
subquestion 11.1, the candidate’s response indicated that he/she was not proficient in finding
a derivative. This candidate could not apply the power rule of differentiation used in
Grade 12, which says if ,)( nxxf where n is a constant real number, then1)( nnxxf . The
candidate could not use this rule correctly. He/she did not multiply the coefficient of t by the
exponent of t. The only part that was done correctly was reducing the exponent of t by 1.
One can also deduce from this candidate’s response that he/she lacked the skills of deriving
functions.
4.3.7. Subquestion 11.2
Determine the rate at which the depth changes after exactly 2 hours.
This question asked candidates to determine the rate at which the depth changes after exactly
2 hours. The question was worth 3 marks. To earn full marks, candidates were supposed to
first find the first derivative of 32
27
1
9
128 ttL and then substitute the value of t by
2 hours to get the rate of change. The solution would be as follows:
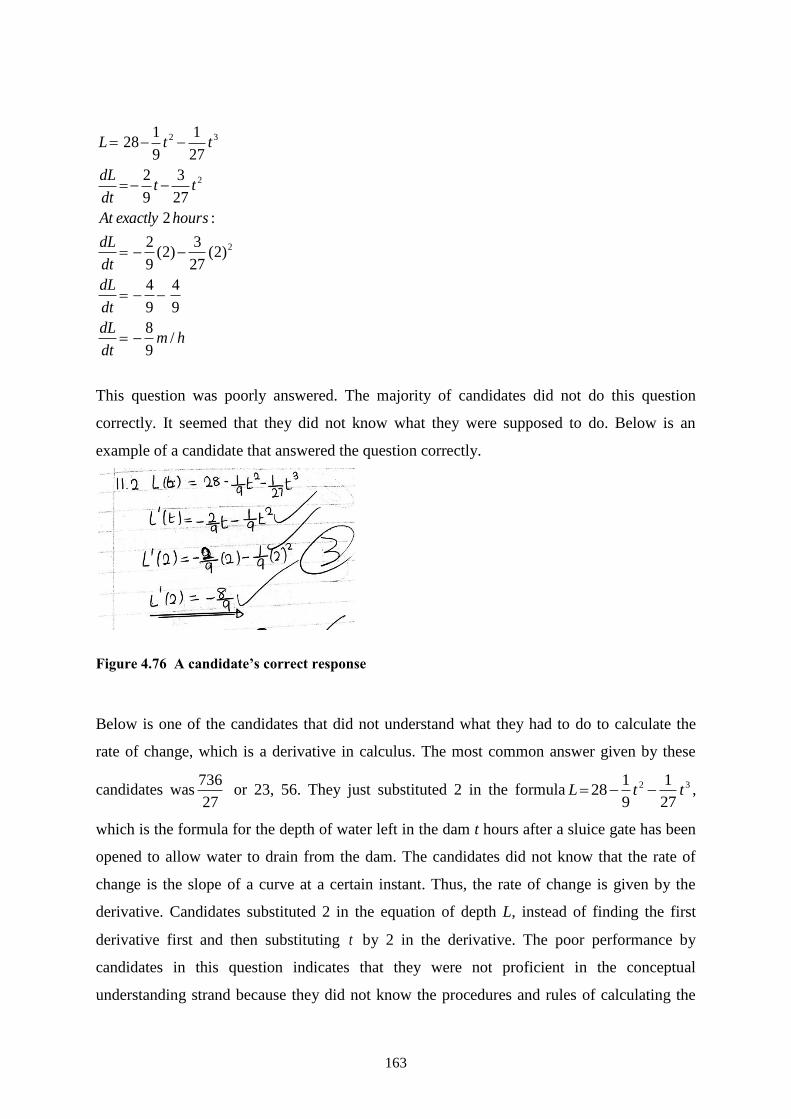
163
This question was poorly answered. The majority of candidates did not do this question
correctly. It seemed that they did not know what they were supposed to do. Below is an
example of a candidate that answered the question correctly.
Figure 4.76 A candidate’s correct response
Below is one of the candidates that did not understand what they had to do to calculate the
rate of change, which is a derivative in calculus. The most common answer given by these
candidates was27
736 or 23, 56. They just substituted 2 in the formula 32
27
1
9
128 ttL ,
which is the formula for the depth of water left in the dam t hours after a sluice gate has been
opened to allow water to drain from the dam. The candidates did not know that the rate of
change is the slope of a curve at a certain instant. Thus, the rate of change is given by the
derivative. Candidates substituted 2 in the equation of depth L, instead of finding the first
derivative first and then substituting t by 2 in the derivative. The poor performance by
candidates in this question indicates that they were not proficient in the conceptual
understanding strand because they did not know the procedures and rules of calculating the
hmdt
dL
dt
dL
dt
dL
hoursexactlyAt
ttdt
dL
ttL
/9
8
9
4
9
4
)2(27
3)2(
9
2
:2
27
3
9
2
27
1
9
128
2
2
32
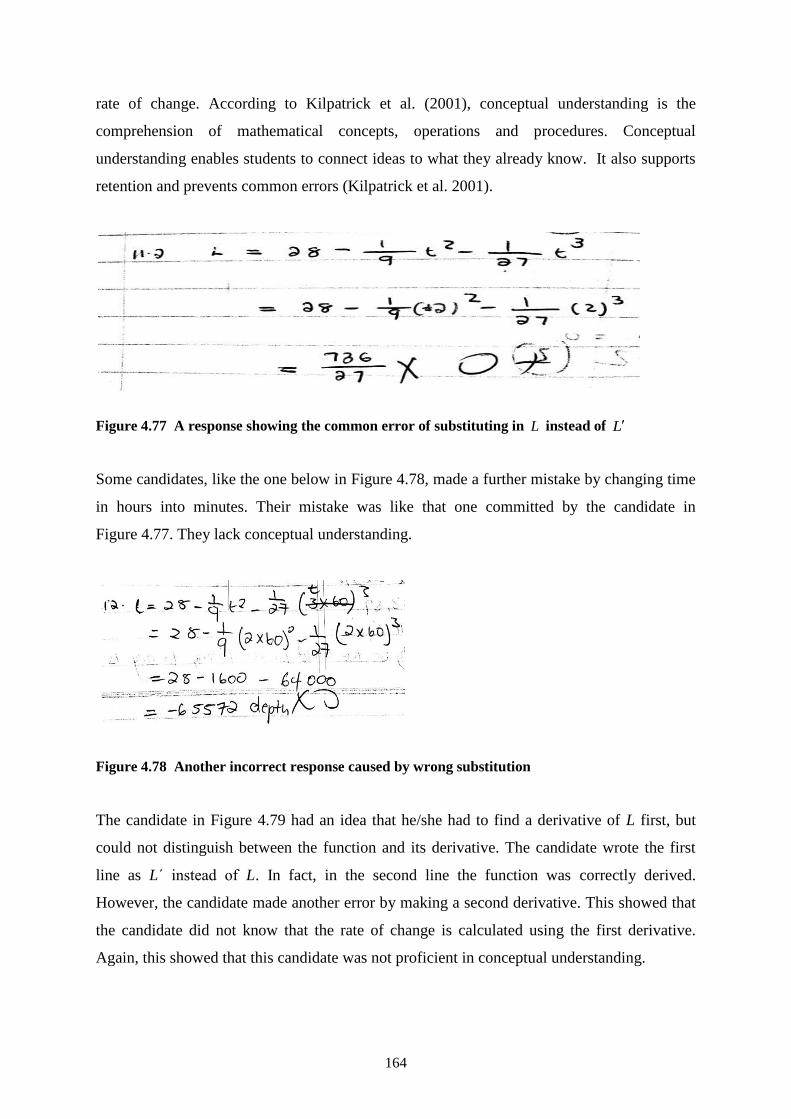
164
rate of change. According to Kilpatrick et al. (2001), conceptual understanding is the
comprehension of mathematical concepts, operations and procedures. Conceptual
understanding enables students to connect ideas to what they already know. It also supports
retention and prevents common errors (Kilpatrick et al. 2001).
Figure 4.77 A response showing the common error of substituting in L instead of L
Some candidates, like the one below in Figure 4.78, made a further mistake by changing time
in hours into minutes. Their mistake was like that one committed by the candidate in
Figure 4.77. They lack conceptual understanding.
Figure 4.78 Another incorrect response caused by wrong substitution
The candidate in Figure 4.79 had an idea that he/she had to find a derivative of L first, but
could not distinguish between the function and its derivative. The candidate wrote the first
line as Lˊ instead of L. In fact, in the second line the function was correctly derived.
However, the candidate made another error by making a second derivative. This showed that
the candidate did not know that the rate of change is calculated using the first derivative.
Again, this showed that this candidate was not proficient in conceptual understanding.
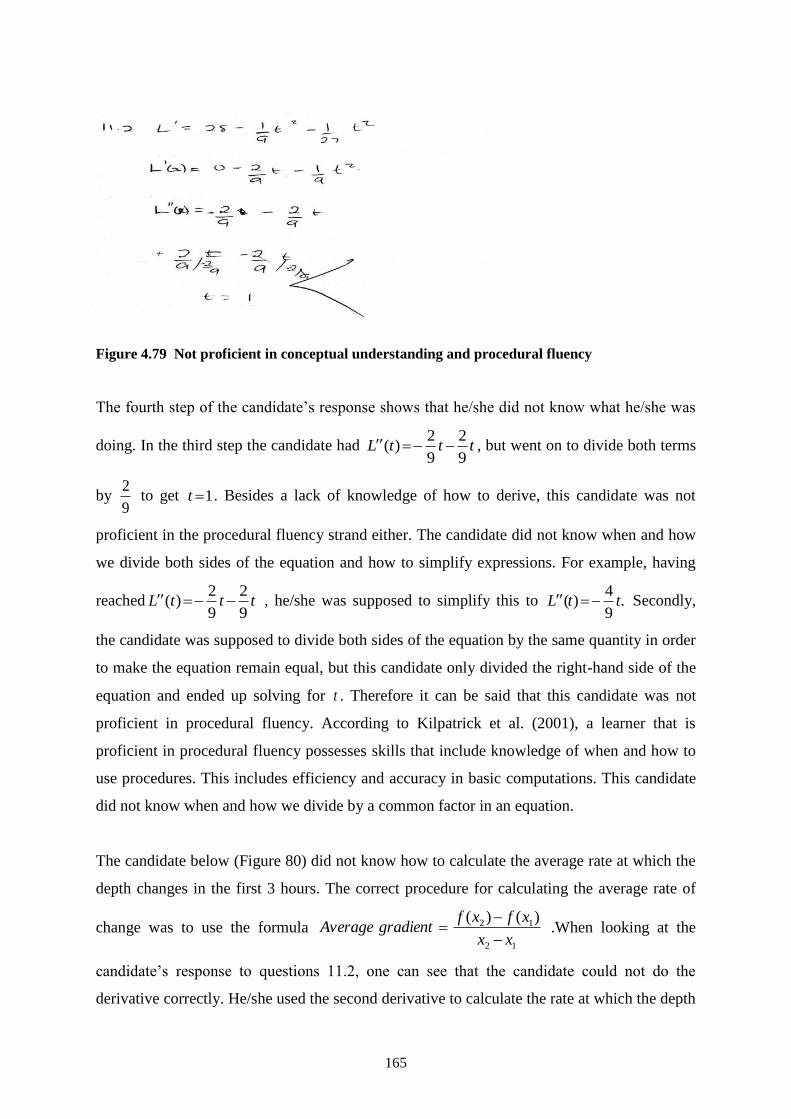
165
Figure 4.79 Not proficient in conceptual understanding and procedural fluency
The fourth step of the candidate’s response shows that he/she did not know what he/she was
doing. In the third step the candidate had tttL9
2
9
2)( , but went on to divide both terms
by 9
2 to get 1t . Besides a lack of knowledge of how to derive, this candidate was not
proficient in the procedural fluency strand either. The candidate did not know when and how
we divide both sides of the equation and how to simplify expressions. For example, having
reached tttL9
2
9
2)( , he/she was supposed to simplify this to .
9
4)( ttL Secondly,
the candidate was supposed to divide both sides of the equation by the same quantity in order
to make the equation remain equal, but this candidate only divided the right-hand side of the
equation and ended up solving for t . Therefore it can be said that this candidate was not
proficient in procedural fluency. According to Kilpatrick et al. (2001), a learner that is
proficient in procedural fluency possesses skills that include knowledge of when and how to
use procedures. This includes efficiency and accuracy in basic computations. This candidate
did not know when and how we divide by a common factor in an equation.
The candidate below (Figure 80) did not know how to calculate the average rate at which the
depth changes in the first 3 hours. The correct procedure for calculating the average rate of
change was to use the formula 12
12 )()(
xx
xfxfgradientAverage
.When looking at the
candidate’s response to questions 11.2, one can see that the candidate could not do the
derivative correctly. He/she used the second derivative to calculate the rate at which the depth
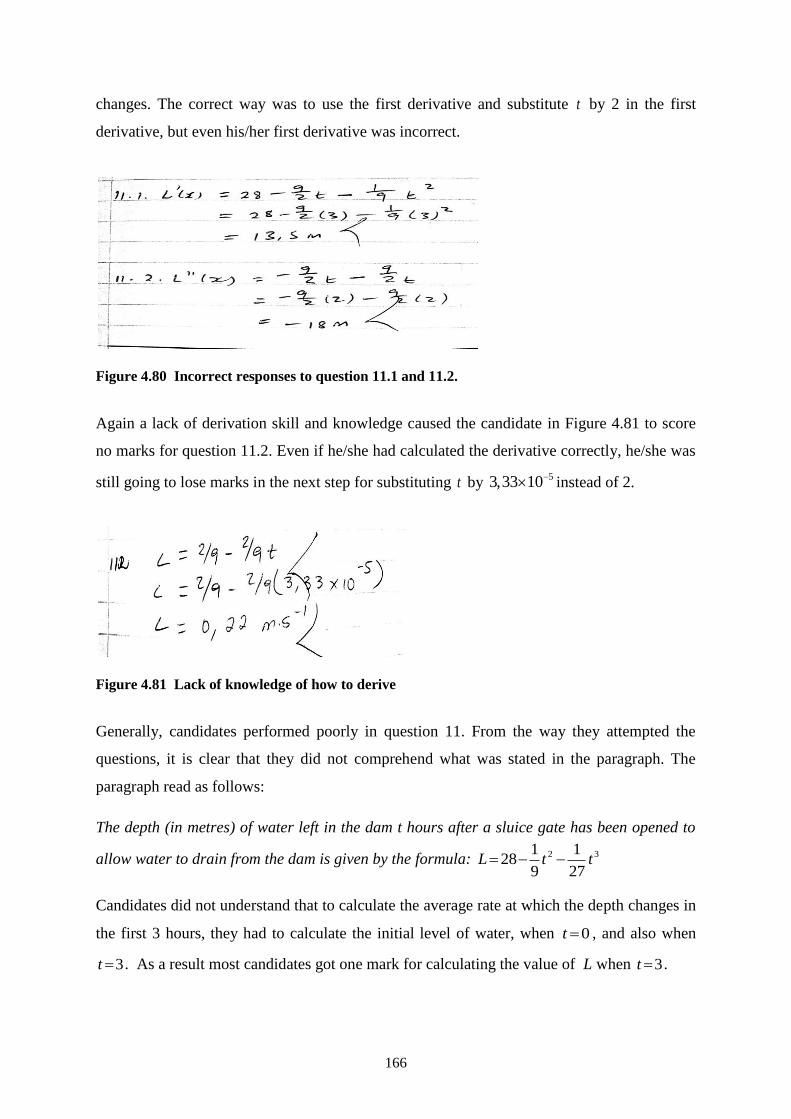
166
changes. The correct way was to use the first derivative and substitute t by 2 in the first
derivative, but even his/her first derivative was incorrect.
Figure 4.80 Incorrect responses to question 11.1 and 11.2.
Again a lack of derivation skill and knowledge caused the candidate in Figure 4.81 to score
no marks for question 11.2. Even if he/she had calculated the derivative correctly, he/she was
still going to lose marks in the next step for substituting t by 51033,3 instead of 2.
Figure 4.81 Lack of knowledge of how to derive
Generally, candidates performed poorly in question 11. From the way they attempted the
questions, it is clear that they did not comprehend what was stated in the paragraph. The
paragraph read as follows:
The depth (in metres) of water left in the dam t hours after a sluice gate has been opened to
allow water to drain from the dam is given by the formula: 32
27
1
9
128 ttL
Candidates did not understand that to calculate the average rate at which the depth changes in
the first 3 hours, they had to calculate the initial level of water, when 0t , and also when
3t . As a result most candidates got one mark for calculating the value of L when 3t .
167
This was also the case in question 11.2, where candidates were required to determine the rate
at which the depth changes after exactly 2 hours. Again most candidates substituted 2 in the
equation for depth instead of finding the first derivative. One may say the poor performance
might have been caused by a poor understanding of the language. They did not see the
difference between “average rate at which the depth changes” and “the rate at which the
depth changes”. In the first phrase, candidates were to calculate the average rate by first
finding the level of water when 0t and also when 3t . The rate at which the depth changes
was to be calculated using the derivative.
4.4 QUESTIONS FROM THE TRIAL EXAMINATION
In the 2016 Trial examination Mathematics Paper 1 for the Mpumalanga Province, the
questions on calculus were question 7 and 8. These questions were as follows:
In question 7.1 candidates were expected to find the coordinates of points A and D, which
were the x-intercepts of the graph. Since the equation had been factorised for them, they only
needed to equate it to zero and then solve for the values of x. The values of x were the x-
coordinates and the y-coordinates were the zeroes.
In question 7.2 candidates were expected to calculate the coordinates of point C, which is the
turning point. The first step was to find the first derivative and equate it to zero to find the x-
coordinate. They had to choose the value 3
4x and ignore 2x because that was the
maximum turning point already used in question 7.1. Candidates were to take the value 3
4x
and substitute it into the original equation to get the value of the y-coordinate. The expected
value of the y-coordinate was 27
500.
Question 7.3 required candidates to write down the equation of the straight line f. Candidates
could have used the information that OB is 6 units. This in short meant that the y-intercept
was – 6. Knowing that the value of c was 6 , they could then have written the equation of
f as 62)( xxf .
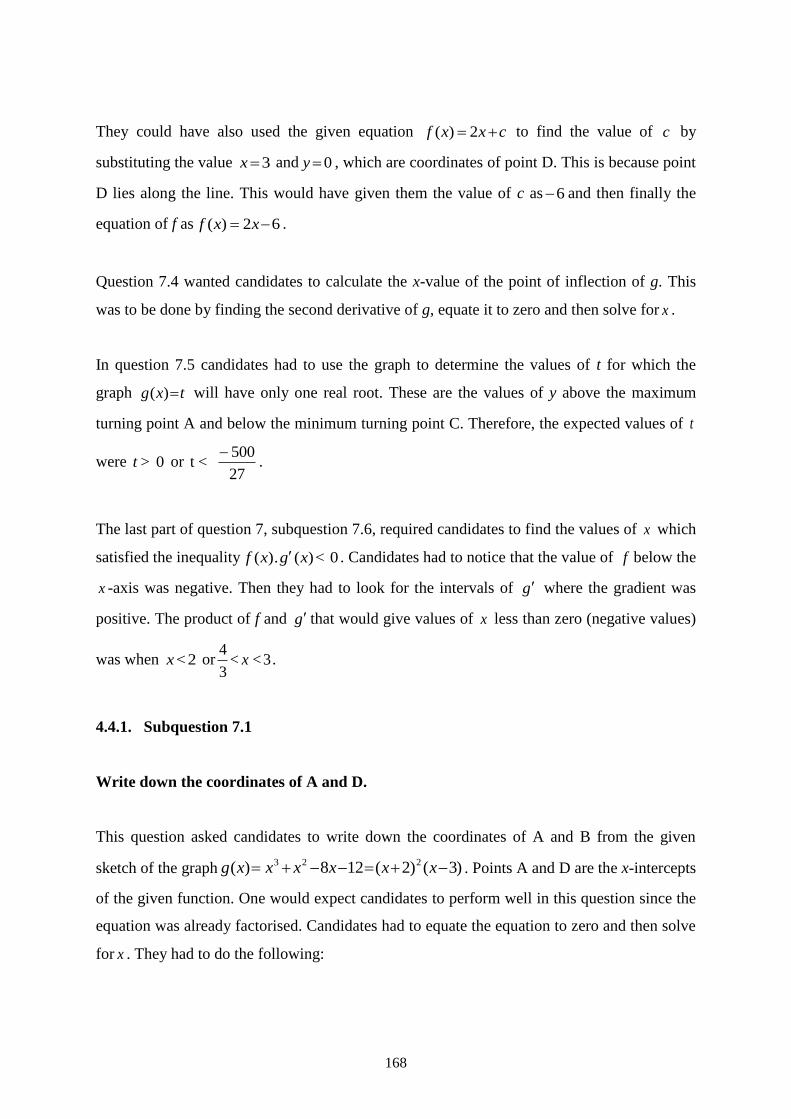
168
They could have also used the given equation cxxf 2)( to find the value of c by
substituting the value 3x and 0y , which are coordinates of point D. This is because point
D lies along the line. This would have given them the value of c as 6 and then finally the
equation of f as 62)( xxf .
Question 7.4 wanted candidates to calculate the x-value of the point of inflection of g. This
was to be done by finding the second derivative of g, equate it to zero and then solve for x .
In question 7.5 candidates had to use the graph to determine the values of t for which the
graph txg )( will have only one real root. These are the values of y above the maximum
turning point A and below the minimum turning point C. Therefore, the expected values of t
were 0 >t or27
500 <t
.
The last part of question 7, subquestion 7.6, required candidates to find the values of x which
satisfied the inequality 0 <)(.)( xgxf . Candidates had to notice that the value of f below the
x -axis was negative. Then they had to look for the intervals of g where the gradient was
positive. The product of f and g that would give values of x less than zero (negative values)
was when 2<x or 3<<3
4x .
4.4.1. Subquestion 7.1
Write down the coordinates of A and D.
This question asked candidates to write down the coordinates of A and B from the given
sketch of the graph )3()2(128)( 223 xxxxxxg . Points A and D are the x-intercepts
of the given function. One would expect candidates to perform well in this question since the
equation was already factorised. Candidates had to equate the equation to zero and then solve
for x . They had to do the following:
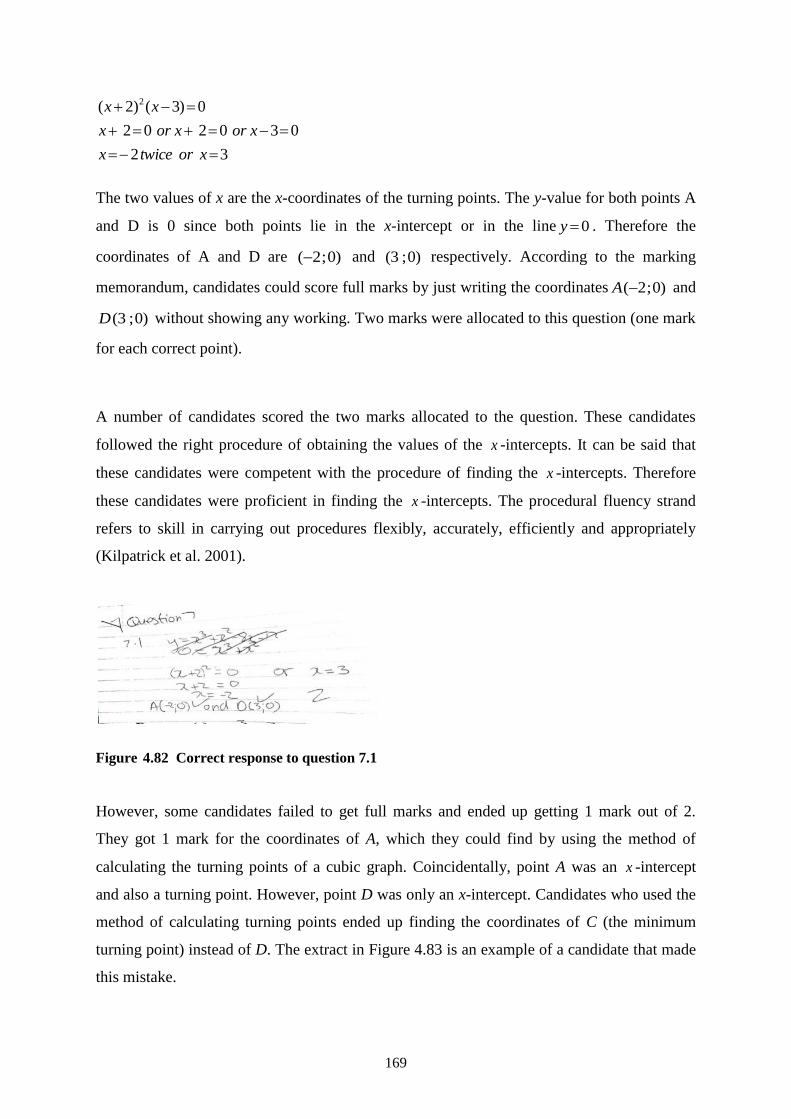
169
32
030202
0)3()2( 2
xortwicex
xorxorx
xx
The two values of x are the x-coordinates of the turning points. The y-value for both points A
and D is 0 since both points lie in the x-intercept or in the line 0y . Therefore the
coordinates of A and D are )0;2( and )0;3( respectively. According to the marking
memorandum, candidates could score full marks by just writing the coordinates )0;2(A and
)0;3(D without showing any working. Two marks were allocated to this question (one mark
for each correct point).
A number of candidates scored the two marks allocated to the question. These candidates
followed the right procedure of obtaining the values of the x -intercepts. It can be said that
these candidates were competent with the procedure of finding the x -intercepts. Therefore
these candidates were proficient in finding the x -intercepts. The procedural fluency strand
refers to skill in carrying out procedures flexibly, accurately, efficiently and appropriately
(Kilpatrick et al. 2001).
Figure 4.82 Correct response to question 7.1
However, some candidates failed to get full marks and ended up getting 1 mark out of 2.
They got 1 mark for the coordinates of A, which they could find by using the method of
calculating the turning points of a cubic graph. Coincidentally, point A was an x -intercept
and also a turning point. However, point D was only an x-intercept. Candidates who used the
method of calculating turning points ended up finding the coordinates of C (the minimum
turning point) instead of D. The extract in Figure 4.83 is an example of a candidate that made
this mistake.
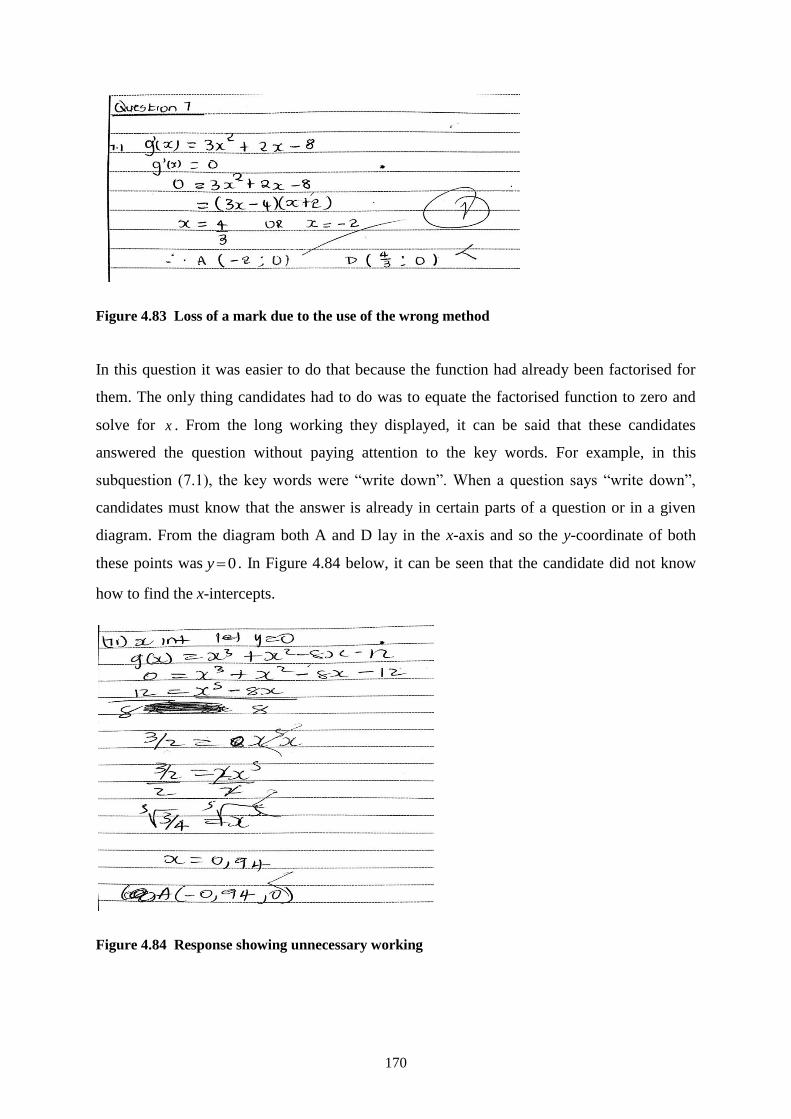
170
Figure 4.83 Loss of a mark due to the use of the wrong method
In this question it was easier to do that because the function had already been factorised for
them. The only thing candidates had to do was to equate the factorised function to zero and
solve for x . From the long working they displayed, it can be said that these candidates
answered the question without paying attention to the key words. For example, in this
subquestion (7.1), the key words were “write down”. When a question says “write down”,
candidates must know that the answer is already in certain parts of a question or in a given
diagram. From the diagram both A and D lay in the x-axis and so the y-coordinate of both
these points was 0y . In Figure 4.84 below, it can be seen that the candidate did not know
how to find the x-intercepts.
Figure 4.84 Response showing unnecessary working
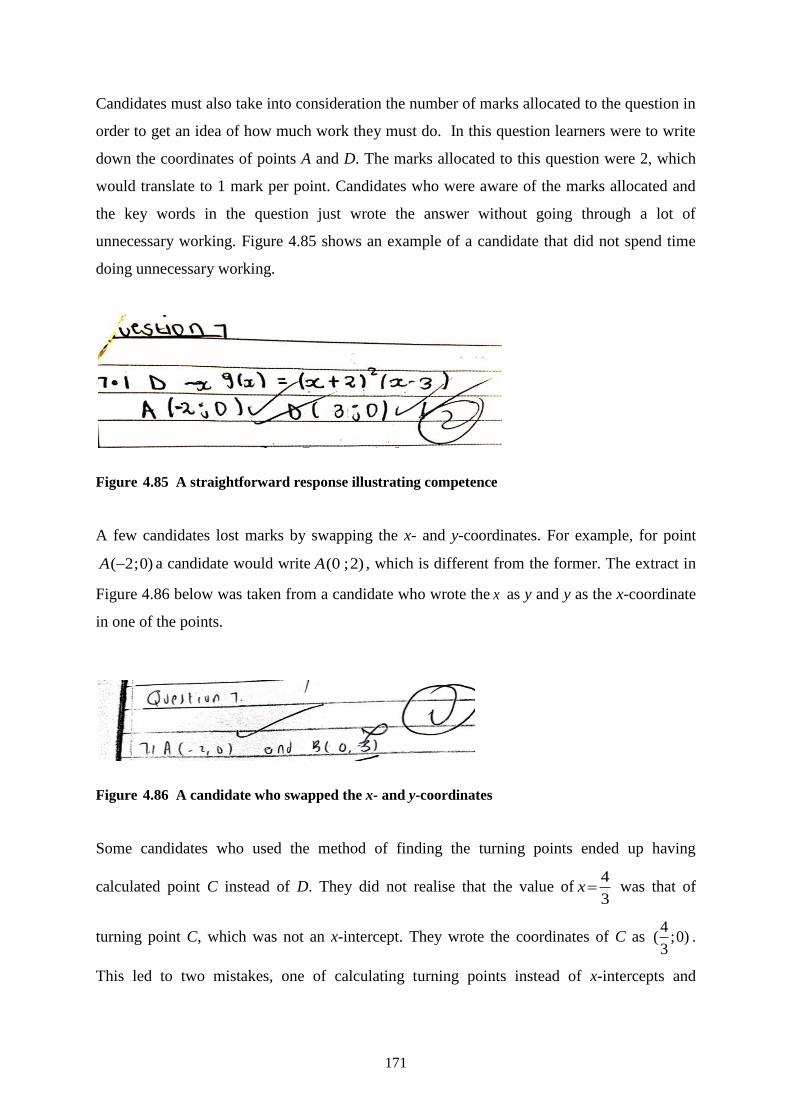
171
Candidates must also take into consideration the number of marks allocated to the question in
order to get an idea of how much work they must do. In this question learners were to write
down the coordinates of points A and D. The marks allocated to this question were 2, which
would translate to 1 mark per point. Candidates who were aware of the marks allocated and
the key words in the question just wrote the answer without going through a lot of
unnecessary working. Figure 4.85 shows an example of a candidate that did not spend time
doing unnecessary working.
Figure 4.85 A straightforward response illustrating competence
A few candidates lost marks by swapping the x- and y-coordinates. For example, for point
)0;2(A a candidate would write )2;0(A , which is different from the former. The extract in
Figure 4.86 below was taken from a candidate who wrote the x as y and y as the x-coordinate
in one of the points.
Figure 4.86 A candidate who swapped the x- and y-coordinates
Some candidates who used the method of finding the turning points ended up having
calculated point C instead of D. They did not realise that the value of3
4x was that of
turning point C, which was not an x-intercept. They wrote the coordinates of C as )0;3
4( .
This led to two mistakes, one of calculating turning points instead of x-intercepts and
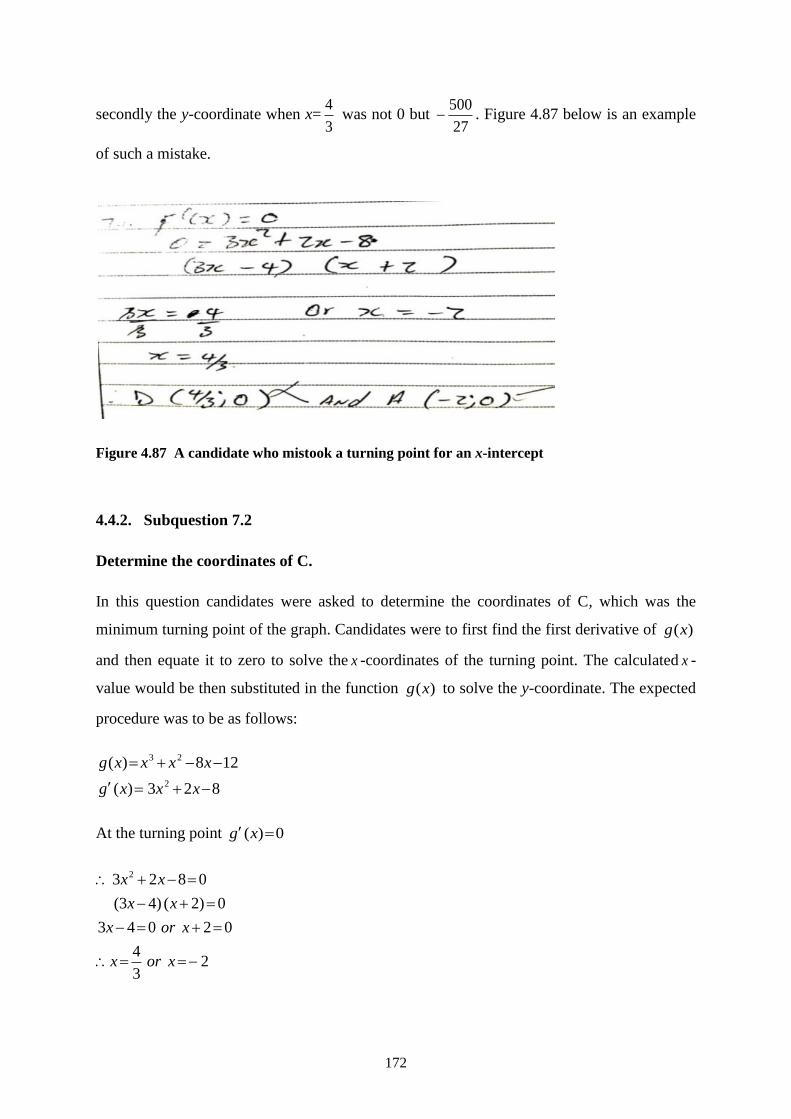
172
secondly the y-coordinate when x=3
4 was not 0 but
27
500 . Figure 4.87 below is an example
of such a mistake.
Figure 4.87 A candidate who mistook a turning point for an x-intercept
4.4.2. Subquestion 7.2
Determine the coordinates of C.
In this question candidates were asked to determine the coordinates of C, which was the
minimum turning point of the graph. Candidates were to first find the first derivative of )(xg
and then equate it to zero to solve the x -coordinates of the turning point. The calculated x -
value would be then substituted in the function )(xg to solve the y-coordinate. The expected
procedure was to be as follows:
823)(
128)(
2
23
xxxg
xxxxg
At the turning point 0)( xg
23
4
02043
0)2()43(
0823 2
xorx
xorx
xx
xx
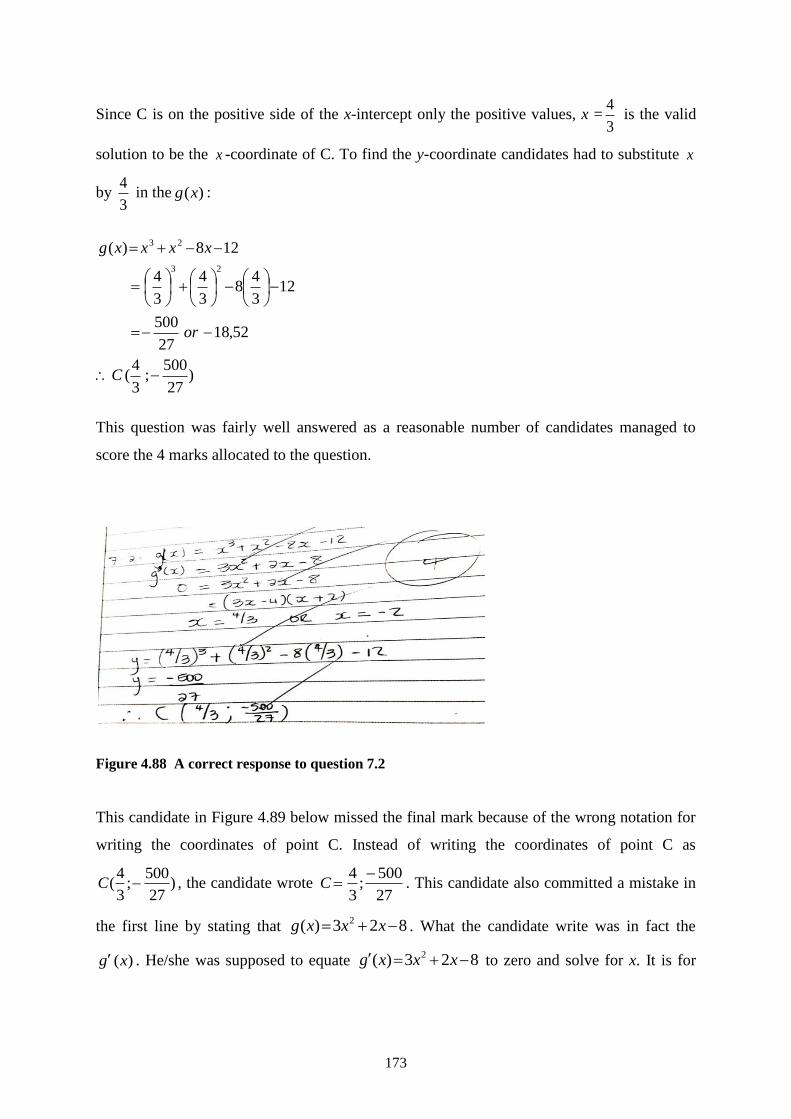
173
Since C is on the positive side of the x-intercept only the positive values, x =3
4 is the valid
solution to be the x -coordinate of C. To find the y-coordinate candidates had to substitute x
by 3
4 in the )(xg :
)27
500;
3
4(
52,1827
500
123
48
3
4
3
4
128)(
23
23
C
or
xxxxg
This question was fairly well answered as a reasonable number of candidates managed to
score the 4 marks allocated to the question.
Figure 4.88 A correct response to question 7.2
This candidate in Figure 4.89 below missed the final mark because of the wrong notation for
writing the coordinates of point C. Instead of writing the coordinates of point C as
)27
500;
3
4( C , the candidate wrote
27
500;
3
4 C . This candidate also committed a mistake in
the first line by stating that 823)( 2 xxxg . What the candidate write was in fact the
)(xg . He/she was supposed to equate 823)( 2 xxxg to zero and solve for x. It is for
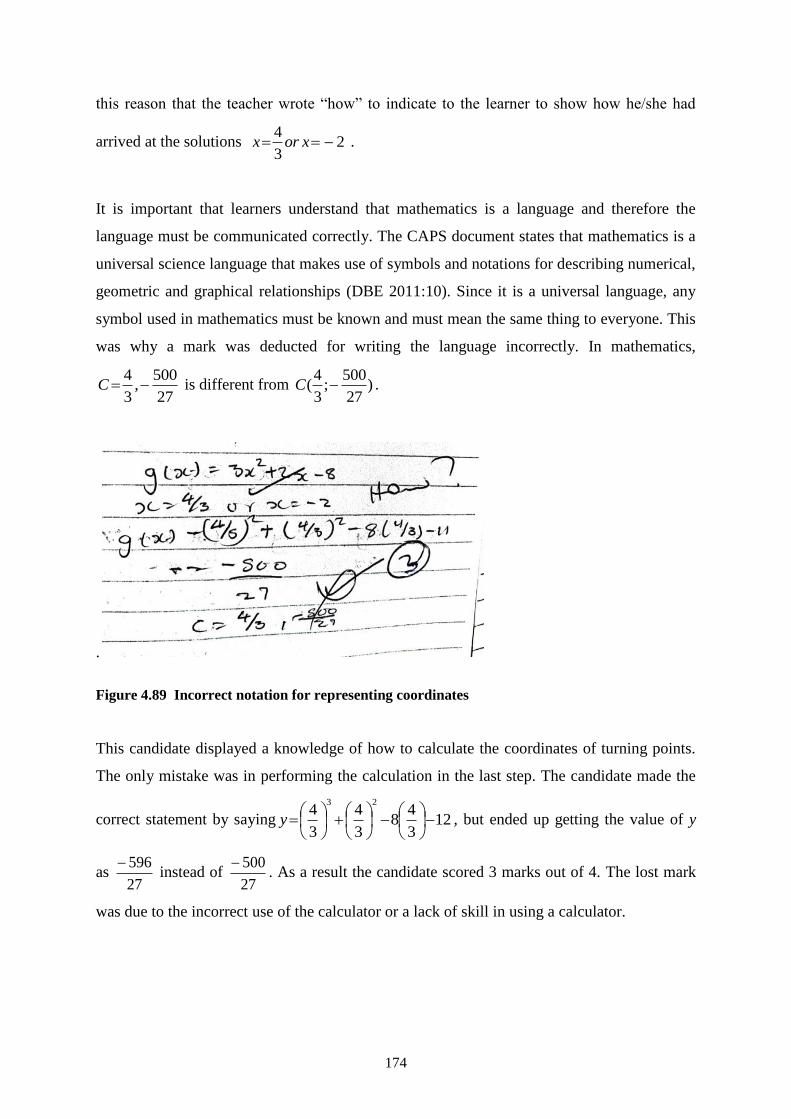
174
this reason that the teacher wrote “how” to indicate to the learner to show how he/she had
arrived at the solutions 23
4 xorx .
It is important that learners understand that mathematics is a language and therefore the
language must be communicated correctly. The CAPS document states that mathematics is a
universal science language that makes use of symbols and notations for describing numerical,
geometric and graphical relationships (DBE 2011:10). Since it is a universal language, any
symbol used in mathematics must be known and must mean the same thing to everyone. This
was why a mark was deducted for writing the language incorrectly. In mathematics,
27
500,
3
4C is different from )
27
500;
3
4( C .
.
Figure 4.89 Incorrect notation for representing coordinates
This candidate displayed a knowledge of how to calculate the coordinates of turning points.
The only mistake was in performing the calculation in the last step. The candidate made the
correct statement by saying 123
48
3
4
3
423
y , but ended up getting the value of y
as 27
596 instead of
27
500. As a result the candidate scored 3 marks out of 4. The lost mark
was due to the incorrect use of the calculator or a lack of skill in using a calculator.
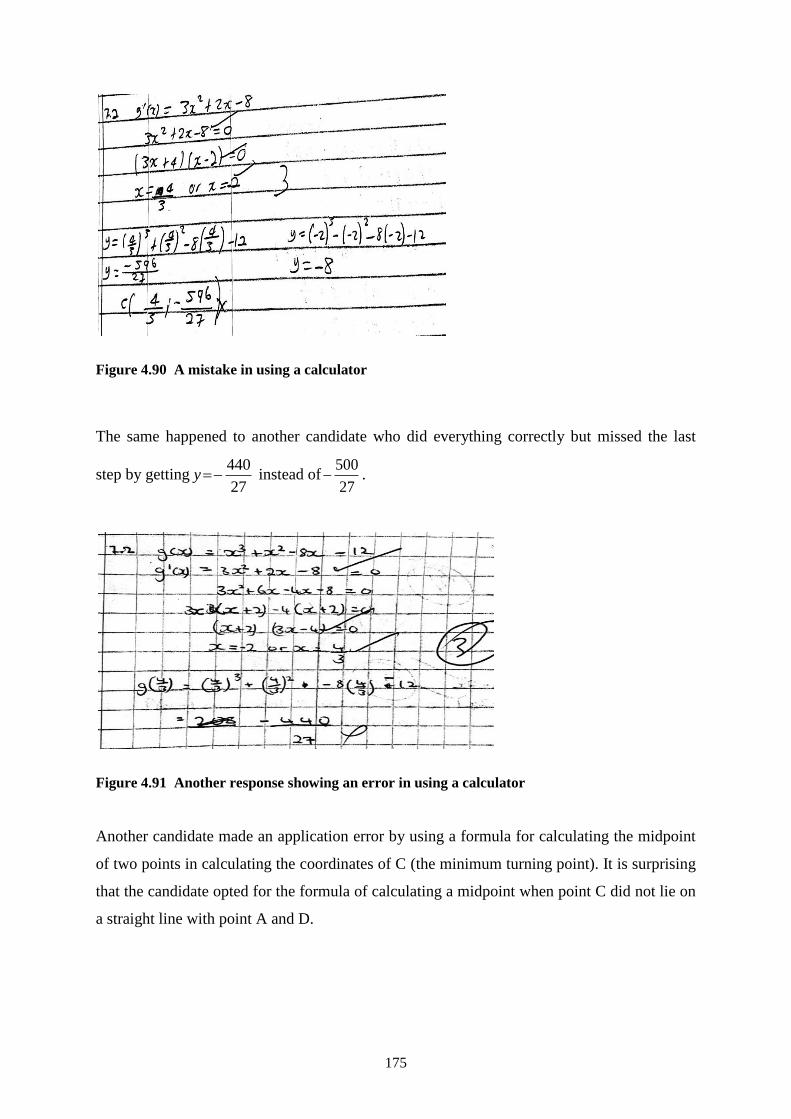
175
Figure 4.90 A mistake in using a calculator
The same happened to another candidate who did everything correctly but missed the last
step by getting27
440y instead of
27
500 .
Figure 4.91 Another response showing an error in using a calculator
Another candidate made an application error by using a formula for calculating the midpoint
of two points in calculating the coordinates of C (the minimum turning point). It is surprising
that the candidate opted for the formula of calculating a midpoint when point C did not lie on
a straight line with point A and D.
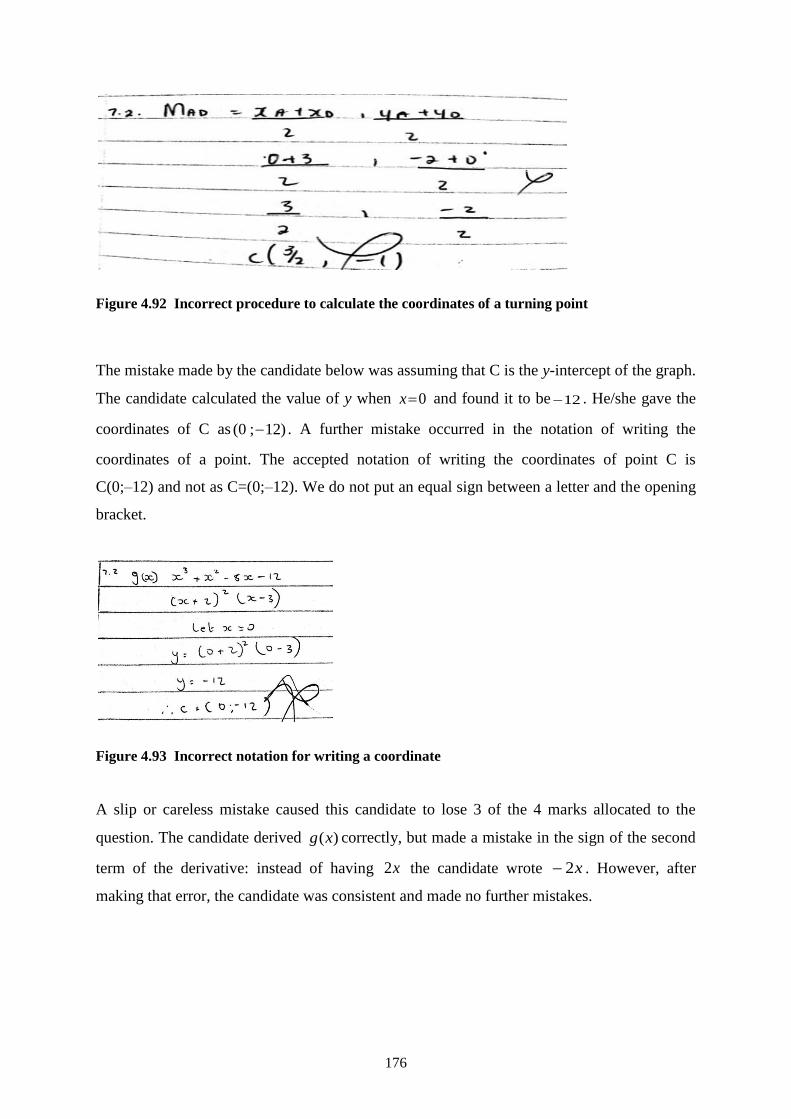
176
Figure 4.92 Incorrect procedure to calculate the coordinates of a turning point
The mistake made by the candidate below was assuming that C is the y-intercept of the graph.
The candidate calculated the value of y when 0x and found it to be 12 . He/she gave the
coordinates of C as )12;0( . A further mistake occurred in the notation of writing the
coordinates of a point. The accepted notation of writing the coordinates of point C is
C(0;–12) and not as C=(0;–12). We do not put an equal sign between a letter and the opening
bracket.
Figure 4.93 Incorrect notation for writing a coordinate
A slip or careless mistake caused this candidate to lose 3 of the 4 marks allocated to the
question. The candidate derived )(xg correctly, but made a mistake in the sign of the second
term of the derivative: instead of having x2 the candidate wrote x2 . However, after
making that error, the candidate was consistent and made no further mistakes.
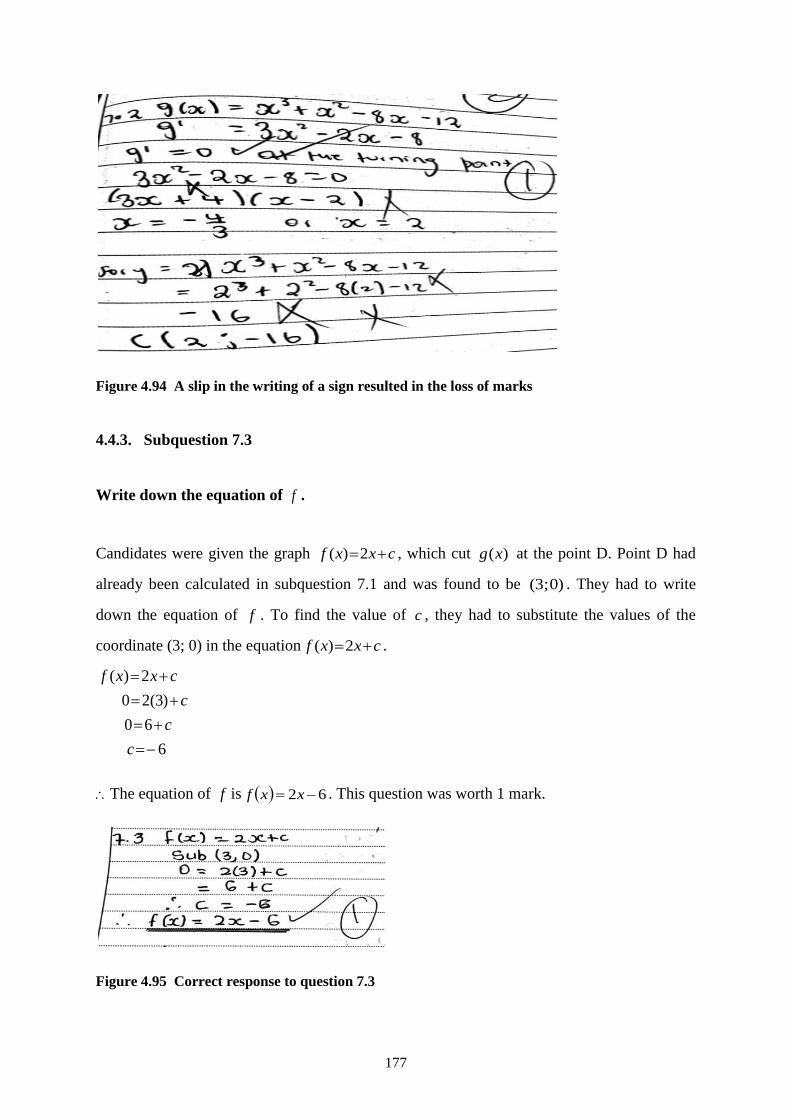
177
Figure 4.94 A slip in the writing of a sign resulted in the loss of marks
4.4.3. Subquestion 7.3
Write down the equation of f .
Candidates were given the graph cxxf 2)( , which cut )(xg at the point D. Point D had
already been calculated in subquestion 7.1 and was found to be )0;3( . They had to write
down the equation of f . To find the value of c , they had to substitute the values of the
coordinate (3; 0) in the equation cxxf 2)( .
6
60
)3(20
2)(
c
c
c
cxxf
The equation of f is 62 xxf . This question was worth 1 mark.
Figure 4.95 Correct response to question 7.3
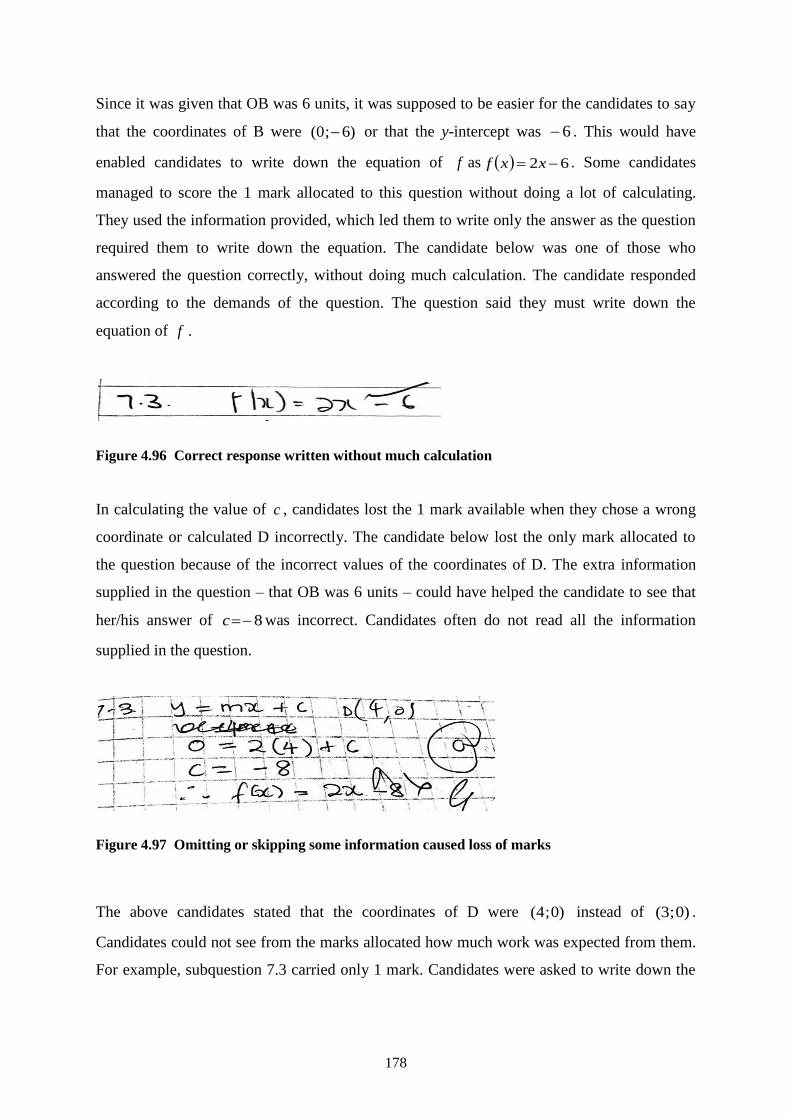
178
Since it was given that OB was 6 units, it was supposed to be easier for the candidates to say
that the coordinates of B were )6;0( or that the y-intercept was 6 . This would have
enabled candidates to write down the equation of f as 62 xxf . Some candidates
managed to score the 1 mark allocated to this question without doing a lot of calculating.
They used the information provided, which led them to write only the answer as the question
required them to write down the equation. The candidate below was one of those who
answered the question correctly, without doing much calculation. The candidate responded
according to the demands of the question. The question said they must write down the
equation of f .
Figure 4.96 Correct response written without much calculation
In calculating the value of c , candidates lost the 1 mark available when they chose a wrong
coordinate or calculated D incorrectly. The candidate below lost the only mark allocated to
the question because of the incorrect values of the coordinates of D. The extra information
supplied in the question – that OB was 6 units – could have helped the candidate to see that
her/his answer of 8c was incorrect. Candidates often do not read all the information
supplied in the question.
Figure 4.97 Omitting or skipping some information caused loss of marks
The above candidates stated that the coordinates of D were )0;4( instead of )0;3( .
Candidates could not see from the marks allocated how much work was expected from them.
For example, subquestion 7.3 carried only 1 mark. Candidates were asked to write down the
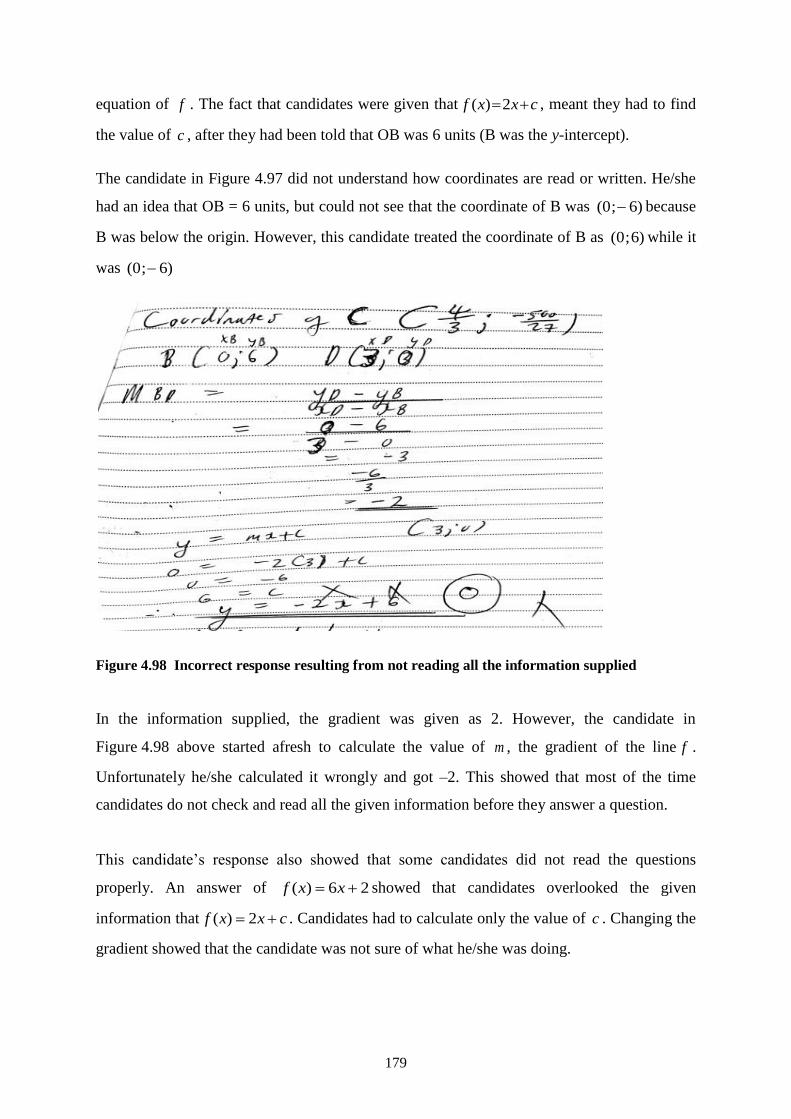
179
equation of f . The fact that candidates were given that cxxf 2)( , meant they had to find
the value of c , after they had been told that OB was 6 units (B was the y-intercept).
The candidate in Figure 4.97 did not understand how coordinates are read or written. He/she
had an idea that OB = 6 units, but could not see that the coordinate of B was )6;0( because
B was below the origin. However, this candidate treated the coordinate of B as )6;0( while it
was )6;0(
Figure 4.98 Incorrect response resulting from not reading all the information supplied
In the information supplied, the gradient was given as 2. However, the candidate in
Figure 4.98 above started afresh to calculate the value of m , the gradient of the line f .
Unfortunately he/she calculated it wrongly and got –2. This showed that most of the time
candidates do not check and read all the given information before they answer a question.
This candidate’s response also showed that some candidates did not read the questions
properly. An answer of 26)( xxf showed that candidates overlooked the given
information that cxxf 2)( . Candidates had to calculate only the value of c . Changing the
gradient showed that the candidate was not sure of what he/she was doing.
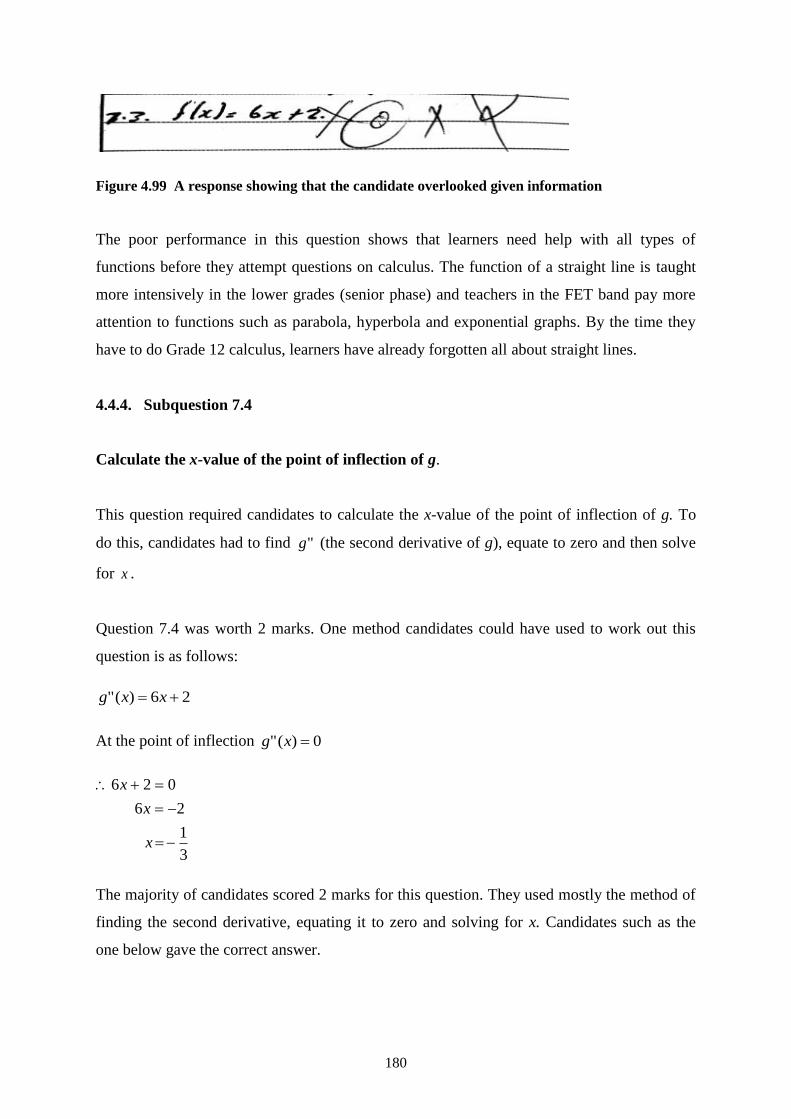
180
Figure 4.99 A response showing that the candidate overlooked given information
The poor performance in this question shows that learners need help with all types of
functions before they attempt questions on calculus. The function of a straight line is taught
more intensively in the lower grades (senior phase) and teachers in the FET band pay more
attention to functions such as parabola, hyperbola and exponential graphs. By the time they
have to do Grade 12 calculus, learners have already forgotten all about straight lines.
4.4.4. Subquestion 7.4
Calculate the x-value of the point of inflection of g.
This question required candidates to calculate the x-value of the point of inflection of g. To
do this, candidates had to find "g (the second derivative of g), equate to zero and then solve
for x .
Question 7.4 was worth 2 marks. One method candidates could have used to work out this
question is as follows:
26)(" xxg
At the point of inflection 0)(" xg
3
1
26
026
x
x
x
The majority of candidates scored 2 marks for this question. They used mostly the method of
finding the second derivative, equating it to zero and solving for x. Candidates such as the
one below gave the correct answer.
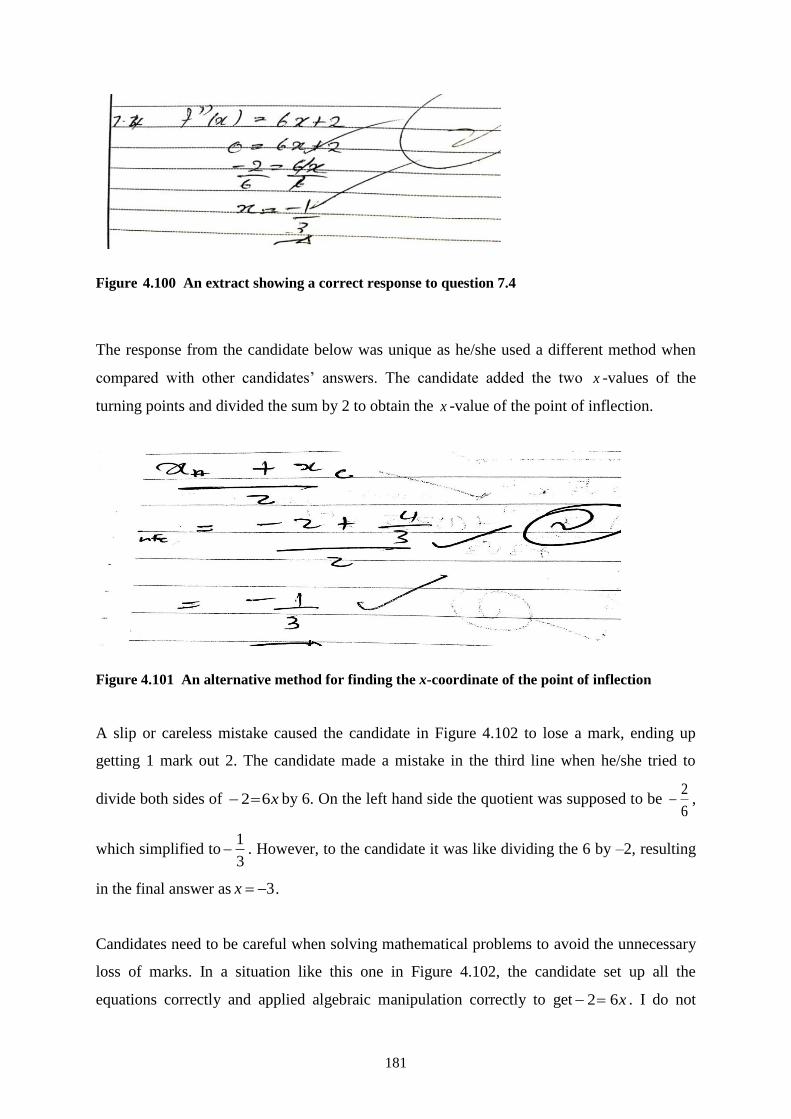
181
Figure 4.100 An extract showing a correct response to question 7.4
The response from the candidate below was unique as he/she used a different method when
compared with other candidates’ answers. The candidate added the two x -values of the
turning points and divided the sum by 2 to obtain the x -value of the point of inflection.
Figure 4.101 An alternative method for finding the x-coordinate of the point of inflection
A slip or careless mistake caused the candidate in Figure 4.102 to lose a mark, ending up
getting 1 mark out 2. The candidate made a mistake in the third line when he/she tried to
divide both sides of x62 by 6. On the left hand side the quotient was supposed to be 6
2 ,
which simplified to3
1 . However, to the candidate it was like dividing the 6 by –2, resulting
in the final answer as 3x .
Candidates need to be careful when solving mathematical problems to avoid the unnecessary
loss of marks. In a situation like this one in Figure 4.102, the candidate set up all the
equations correctly and applied algebraic manipulation correctly to get x62 . I do not
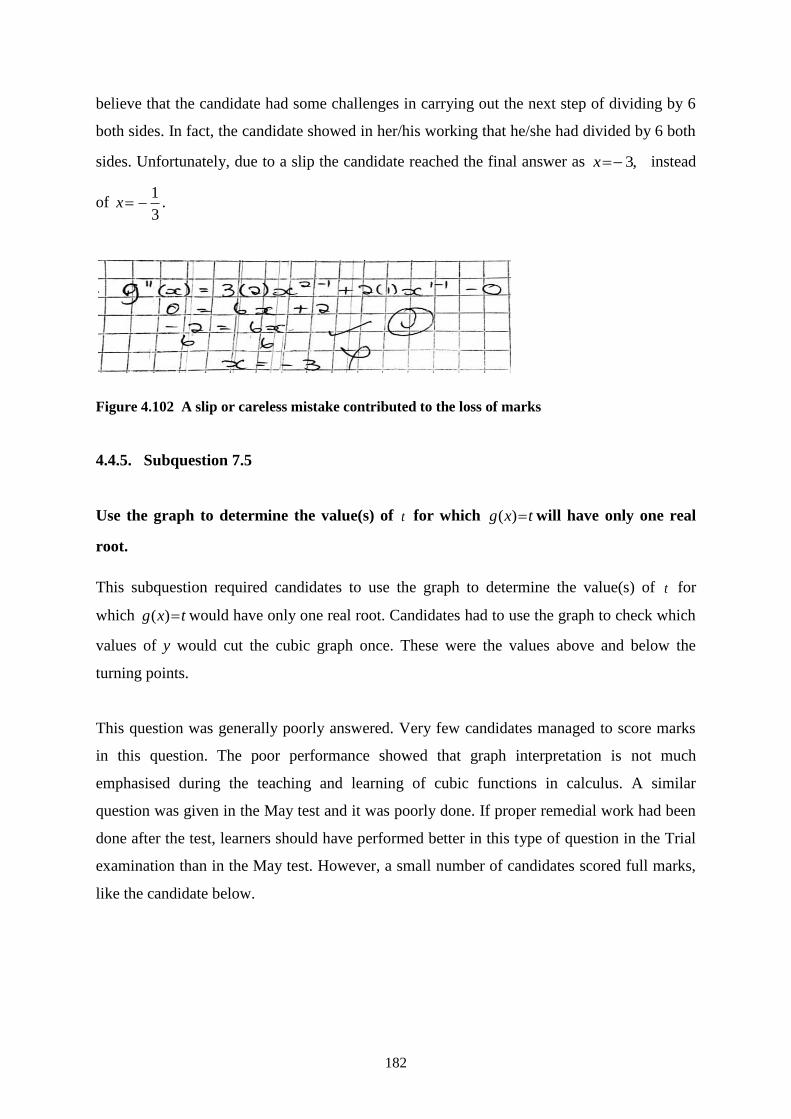
182
believe that the candidate had some challenges in carrying out the next step of dividing by 6
both sides. In fact, the candidate showed in her/his working that he/she had divided by 6 both
sides. Unfortunately, due to a slip the candidate reached the final answer as ,3x instead
of 3
1x .
Figure 4.102 A slip or careless mistake contributed to the loss of marks
4.4.5. Subquestion 7.5
Use the graph to determine the value(s) of t for which txg )( will have only one real
root.
This subquestion required candidates to use the graph to determine the value(s) of t for
which txg )( would have only one real root. Candidates had to use the graph to check which
values of y would cut the cubic graph once. These were the values above and below the
turning points.
This question was generally poorly answered. Very few candidates managed to score marks
in this question. The poor performance showed that graph interpretation is not much
emphasised during the teaching and learning of cubic functions in calculus. A similar
question was given in the May test and it was poorly done. If proper remedial work had been
done after the test, learners should have performed better in this type of question in the Trial
examination than in the May test. However, a small number of candidates scored full marks,
like the candidate below.
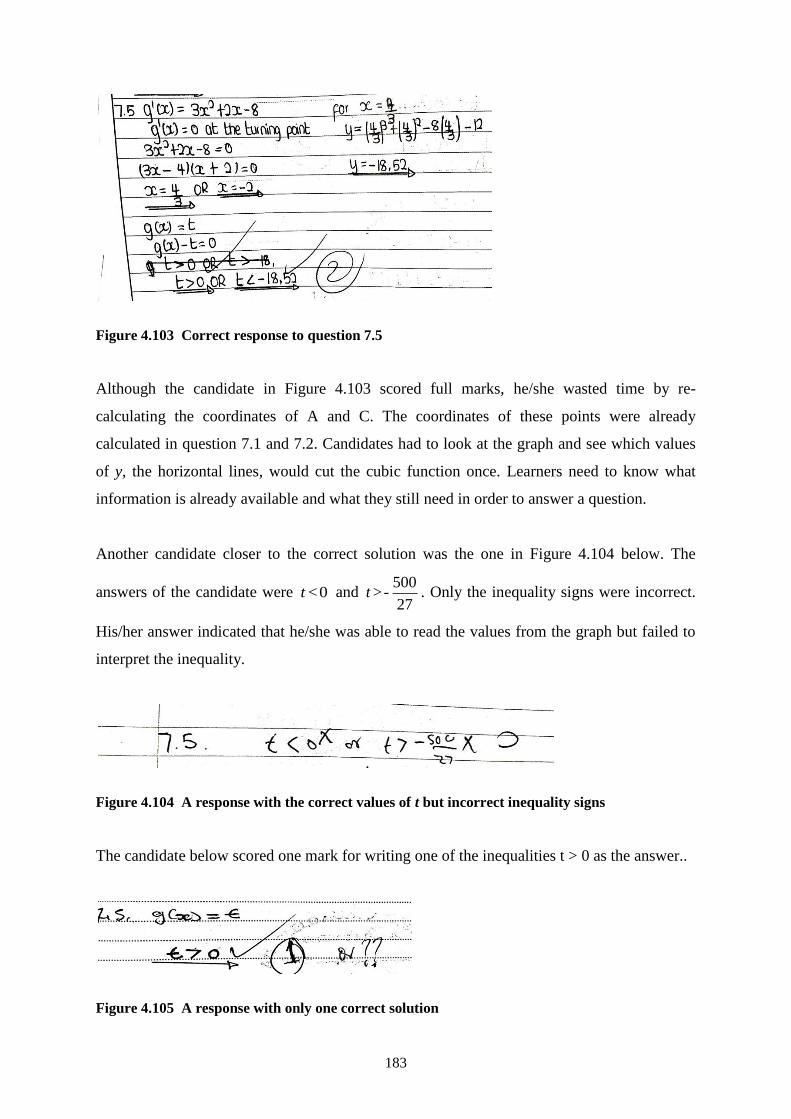
183
Figure 4.103 Correct response to question 7.5
Although the candidate in Figure 4.103 scored full marks, he/she wasted time by re-
calculating the coordinates of A and C. The coordinates of these points were already
calculated in question 7.1 and 7.2. Candidates had to look at the graph and see which values
of y, the horizontal lines, would cut the cubic function once. Learners need to know what
information is already available and what they still need in order to answer a question.
Another candidate closer to the correct solution was the one in Figure 4.104 below. The
answers of the candidate were 0<t and 27
500 ->t . Only the inequality signs were incorrect.
His/her answer indicated that he/she was able to read the values from the graph but failed to
interpret the inequality.
Figure 4.104 A response with the correct values of t but incorrect inequality signs
The candidate below scored one mark for writing one of the inequalities t > 0 as the answer..
Figure 4.105 A response with only one correct solution
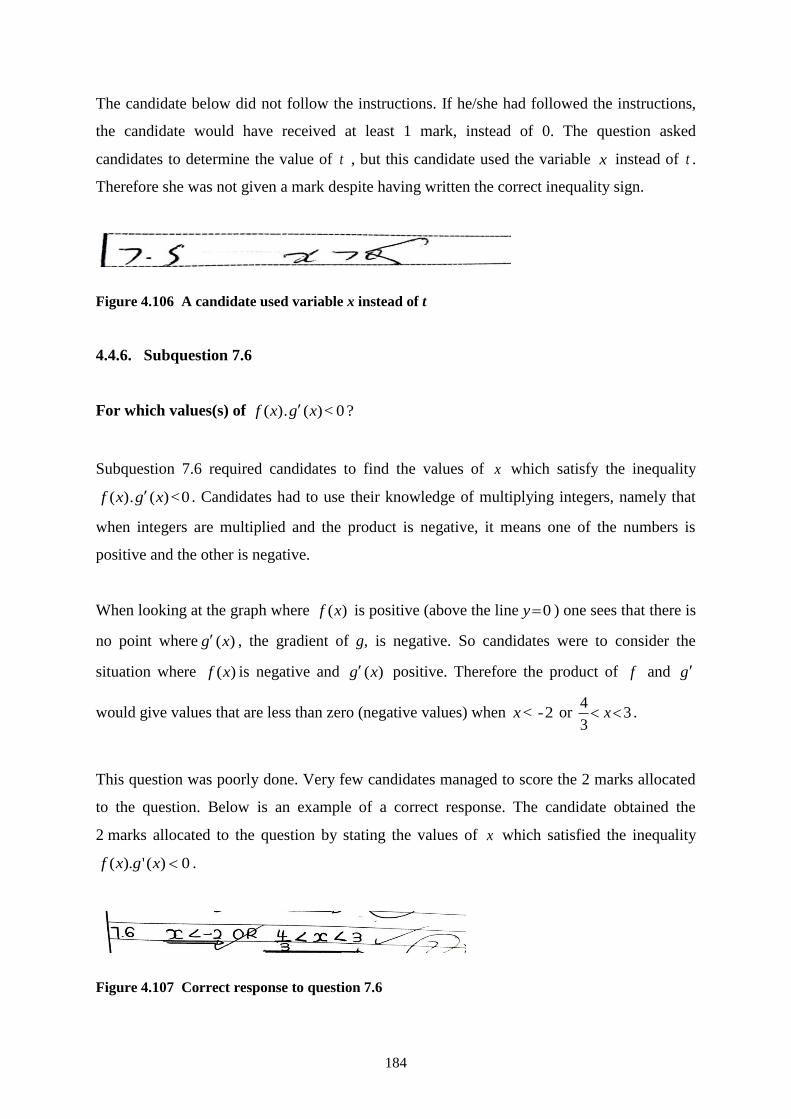
184
The candidate below did not follow the instructions. If he/she had followed the instructions,
the candidate would have received at least 1 mark, instead of 0. The question asked
candidates to determine the value of t , but this candidate used the variable x instead of t .
Therefore she was not given a mark despite having written the correct inequality sign.
Figure 4.106 A candidate used variable x instead of t
4.4.6. Subquestion 7.6
For which values(s) of ? 0 <)(.)( xgxf
Subquestion 7.6 required candidates to find the values of x which satisfy the inequality
0<)(.)( xgxf . Candidates had to use their knowledge of multiplying integers, namely that
when integers are multiplied and the product is negative, it means one of the numbers is
positive and the other is negative.
When looking at the graph where )(xf is positive (above the line 0y ) one sees that there is
no point where )(xg , the gradient of g, is negative. So candidates were to consider the
situation where )(xf is negative and )(xg positive. Therefore the product of f and g
would give values that are less than zero (negative values) when 2- <x or 33
4 x .
This question was poorly done. Very few candidates managed to score the 2 marks allocated
to the question. Below is an example of a correct response. The candidate obtained the
2 marks allocated to the question by stating the values of x which satisfied the inequality
0)(').( xgxf .
Figure 4.107 Correct response to question 7.6
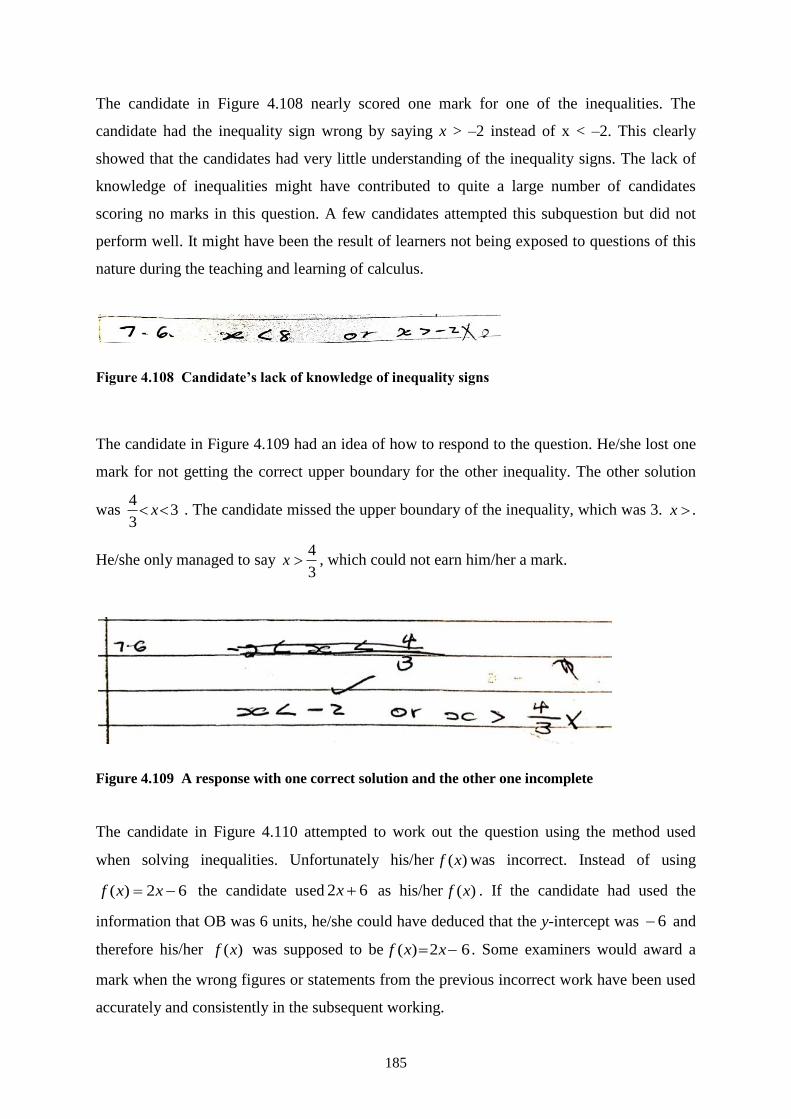
185
The candidate in Figure 4.108 nearly scored one mark for one of the inequalities. The
candidate had the inequality sign wrong by saying x > –2 instead of x < –2. This clearly
showed that the candidates had very little understanding of the inequality signs. The lack of
knowledge of inequalities might have contributed to quite a large number of candidates
scoring no marks in this question. A few candidates attempted this subquestion but did not
perform well. It might have been the result of learners not being exposed to questions of this
nature during the teaching and learning of calculus.
Figure 4.108 Candidate’s lack of knowledge of inequality signs
The candidate in Figure 4.109 had an idea of how to respond to the question. He/she lost one
mark for not getting the correct upper boundary for the other inequality. The other solution
was 33
4 x . The candidate missed the upper boundary of the inequality, which was 3. x .
He/she only managed to say 3
4x , which could not earn him/her a mark.
Figure 4.109 A response with one correct solution and the other one incomplete
The candidate in Figure 4.110 attempted to work out the question using the method used
when solving inequalities. Unfortunately his/her )(xf was incorrect. Instead of using
62)( xxf the candidate used 62 x as his/her )(xf . If the candidate had used the
information that OB was 6 units, he/she could have deduced that the y-intercept was 6 and
therefore his/her )(xf was supposed to be 62)( xxf . Some examiners would award a
mark when the wrong figures or statements from the previous incorrect work have been used
accurately and consistently in the subsequent working.
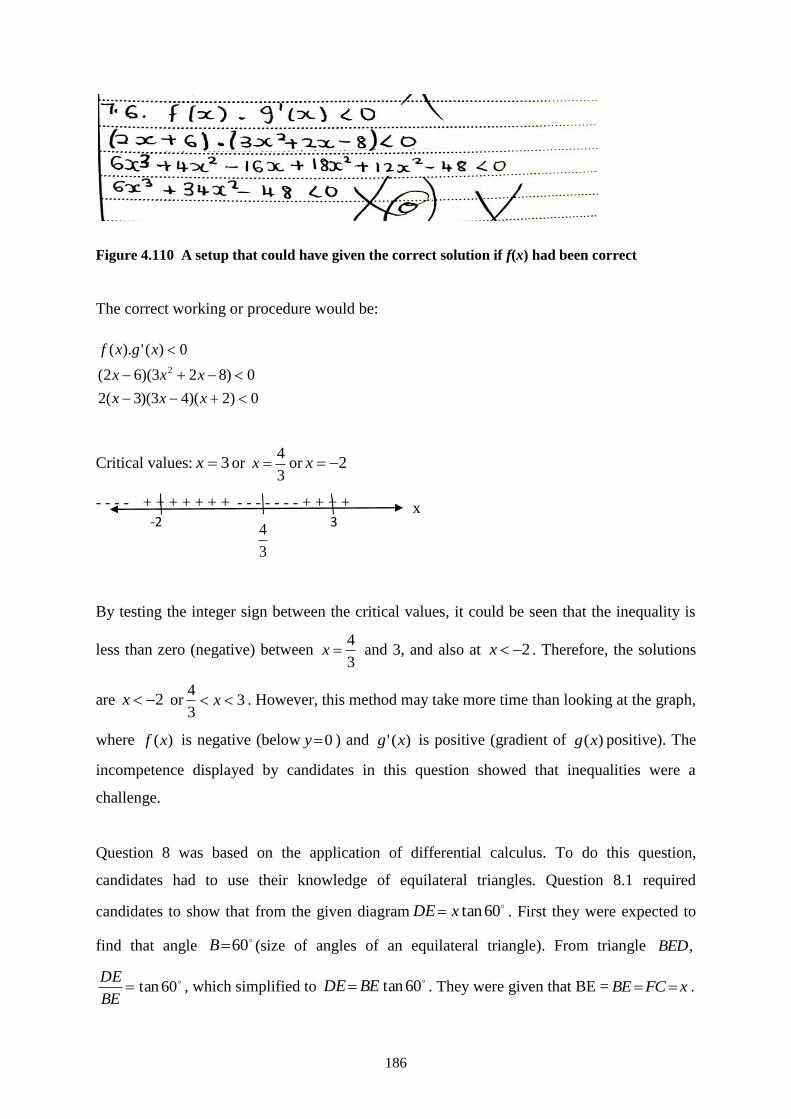
186
Figure 4.110 A setup that could have given the correct solution if f(x) had been correct
The correct working or procedure would be:
0)2)(43)(3(2
0)823)(62(
0)(').(
2
xxx
xxx
xgxf
Critical values: 3x or 3
4x or 2x
- - - - + + + + + + + - - - - - - - + + + +
By testing the integer sign between the critical values, it could be seen that the inequality is
less than zero (negative) between 3
4x and 3, and also at 2x . Therefore, the solutions
are 2x or 33
4 x . However, this method may take more time than looking at the graph,
where )(xf is negative (below 0y ) and )(' xg is positive (gradient of )(xg positive). The
incompetence displayed by candidates in this question showed that inequalities were a
challenge.
Question 8 was based on the application of differential calculus. To do this question,
candidates had to use their knowledge of equilateral triangles. Question 8.1 required
candidates to show that from the given diagram60tanxDE . First they were expected to
find that angle 60B (size of angles of an equilateral triangle). From triangle ,BED
60tanBE
DE, which simplified to
60tanBEDE . They were given that BE = xFCBE .
-2 3 x
3
4
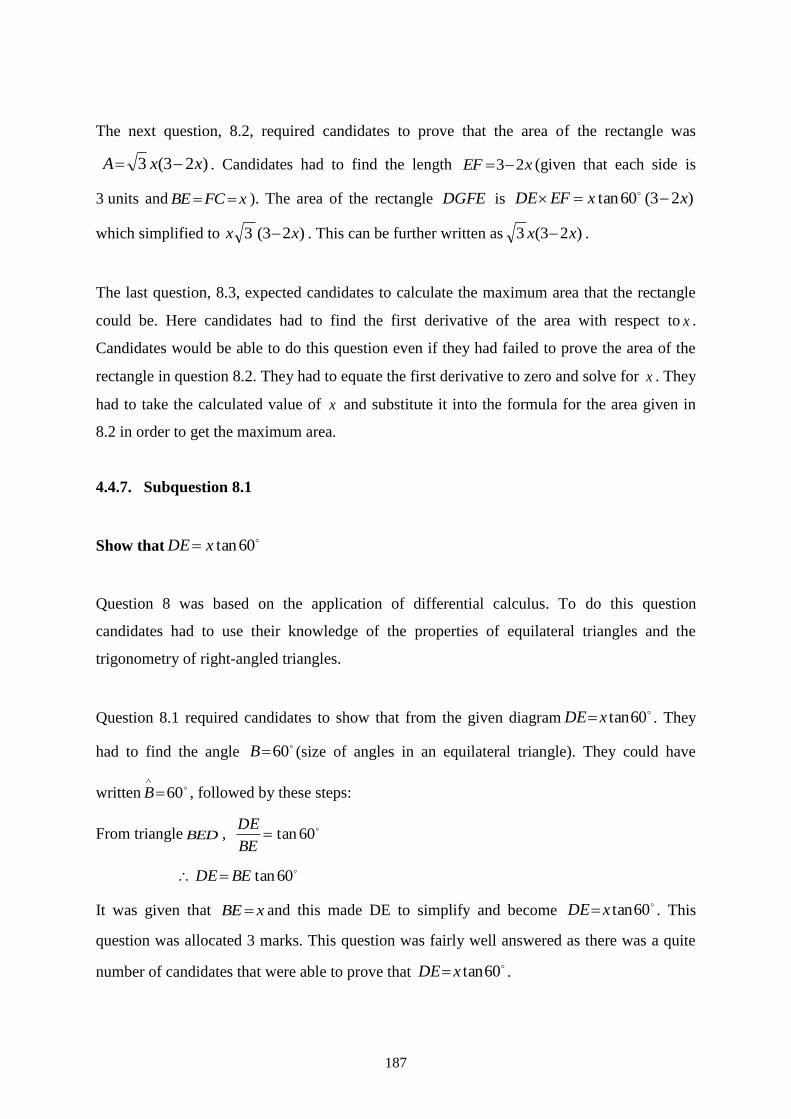
187
The next question, 8.2, required candidates to prove that the area of the rectangle was
)23(3 xxA . Candidates had to find the length xEF 23 (given that each side is
3 units and xFCBE ). The area of the rectangle DGFE is )23(60tan xxEFDE
which simplified to )23(3 xx . This can be further written as )23(3 xx .
The last question, 8.3, expected candidates to calculate the maximum area that the rectangle
could be. Here candidates had to find the first derivative of the area with respect to x .
Candidates would be able to do this question even if they had failed to prove the area of the
rectangle in question 8.2. They had to equate the first derivative to zero and solve for x . They
had to take the calculated value of x and substitute it into the formula for the area given in
8.2 in order to get the maximum area.
4.4.7. Subquestion 8.1
Show that60tanxDE
Question 8 was based on the application of differential calculus. To do this question
candidates had to use their knowledge of the properties of equilateral triangles and the
trigonometry of right-angled triangles.
Question 8.1 required candidates to show that from the given diagram60tanxDE . They
had to find the angle 60B (size of angles in an equilateral triangle). They could have
written 60
B , followed by these steps:
From triangle BED , 60tanBE
DE
60tanBEDE
It was given that xBE and this made DE to simplify and become 60tanxDE . This
question was allocated 3 marks. This question was fairly well answered as there was a quite
number of candidates that were able to prove that 60tanxDE .
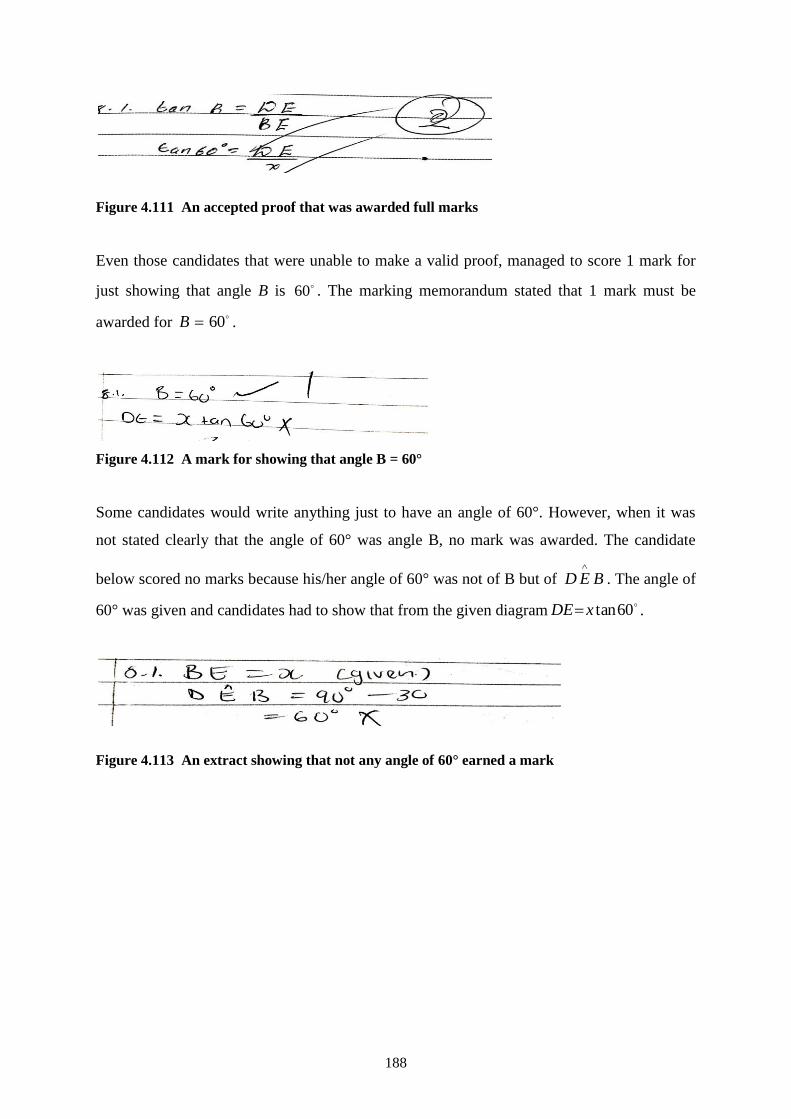
188
Figure 4.111 An accepted proof that was awarded full marks
Even those candidates that were unable to make a valid proof, managed to score 1 mark for
just showing that angle B is 60 . The marking memorandum stated that 1 mark must be
awarded for 60B .
Figure 4.112 A mark for showing that angle B = 60°
Some candidates would write anything just to have an angle of 60°. However, when it was
not stated clearly that the angle of 60° was angle B, no mark was awarded. The candidate
below scored no marks because his/her angle of 60° was not of B but of BED
. The angle of
60° was given and candidates had to show that from the given diagram60tanxDE .
Figure 4.113 An extract showing that not any angle of 60° earned a mark
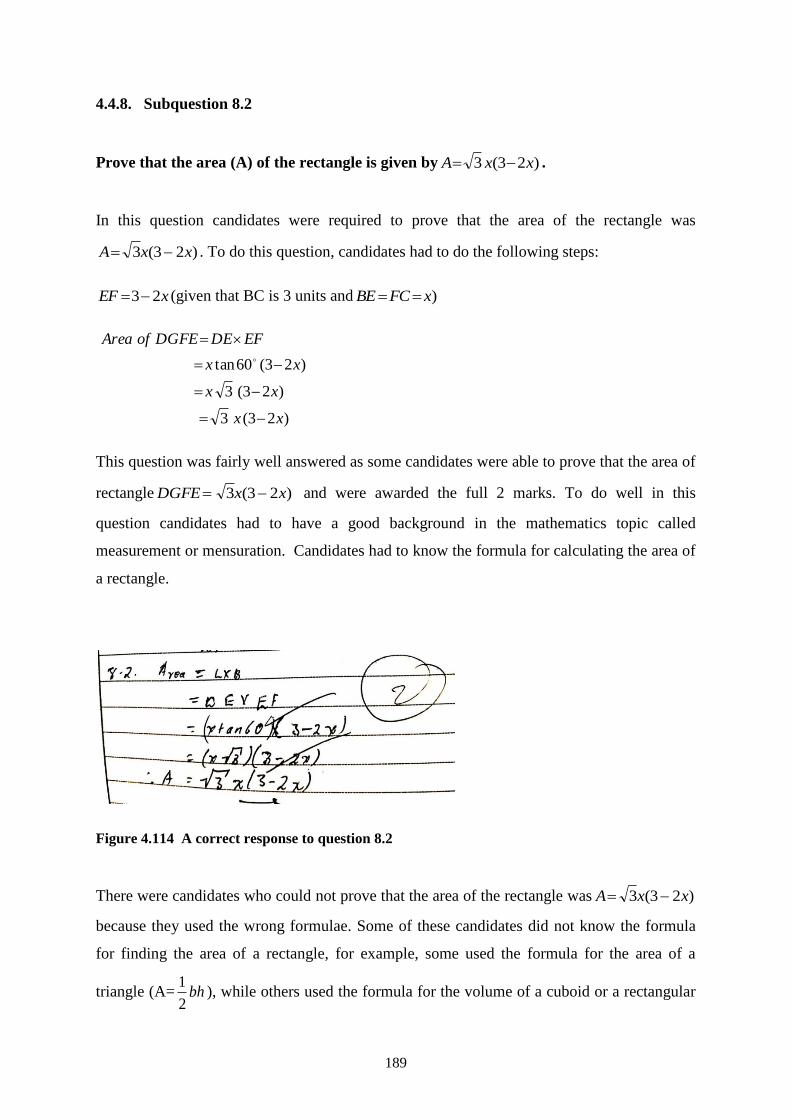
189
4.4.8. Subquestion 8.2
Prove that the area (A) of the rectangle is given by )23(3 xxA .
In this question candidates were required to prove that the area of the rectangle was
)23(3 xxA . To do this question, candidates had to do the following steps:
xEF 23 (given that BC is 3 units and )xFCBE
)23(3
)23(3
)23(60tan
xx
xx
xx
EFDEDGFEofArea
This question was fairly well answered as some candidates were able to prove that the area of
rectangle )23(3 xxDGFE and were awarded the full 2 marks. To do well in this
question candidates had to have a good background in the mathematics topic called
measurement or mensuration. Candidates had to know the formula for calculating the area of
a rectangle.
Figure 4.114 A correct response to question 8.2
There were candidates who could not prove that the area of the rectangle was )23(3 xxA
because they used the wrong formulae. Some of these candidates did not know the formula
for finding the area of a rectangle, for example, some used the formula for the area of a
triangle (A= bh2
1), while others used the formula for the volume of a cuboid or a rectangular
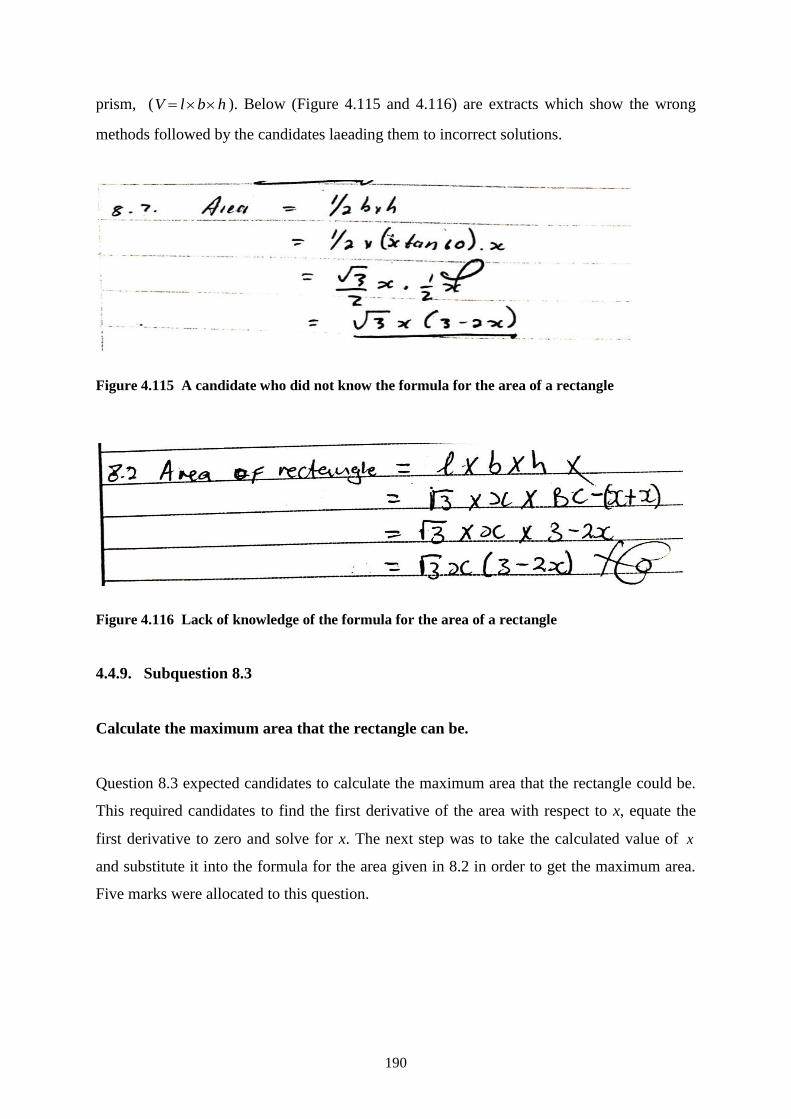
190
prism, ( hblV ). Below (Figure 4.115 and 4.116) are extracts which show the wrong
methods followed by the candidates laeading them to incorrect solutions.
Figure 4.115 A candidate who did not know the formula for the area of a rectangle
Figure 4.116 Lack of knowledge of the formula for the area of a rectangle
4.4.9. Subquestion 8.3
Calculate the maximum area that the rectangle can be.
Question 8.3 expected candidates to calculate the maximum area that the rectangle could be.
This required candidates to find the first derivative of the area with respect to x, equate the
first derivative to zero and solve for x. The next step was to take the calculated value of x
and substitute it into the formula for the area given in 8.2 in order to get the maximum area.
Five marks were allocated to this question.
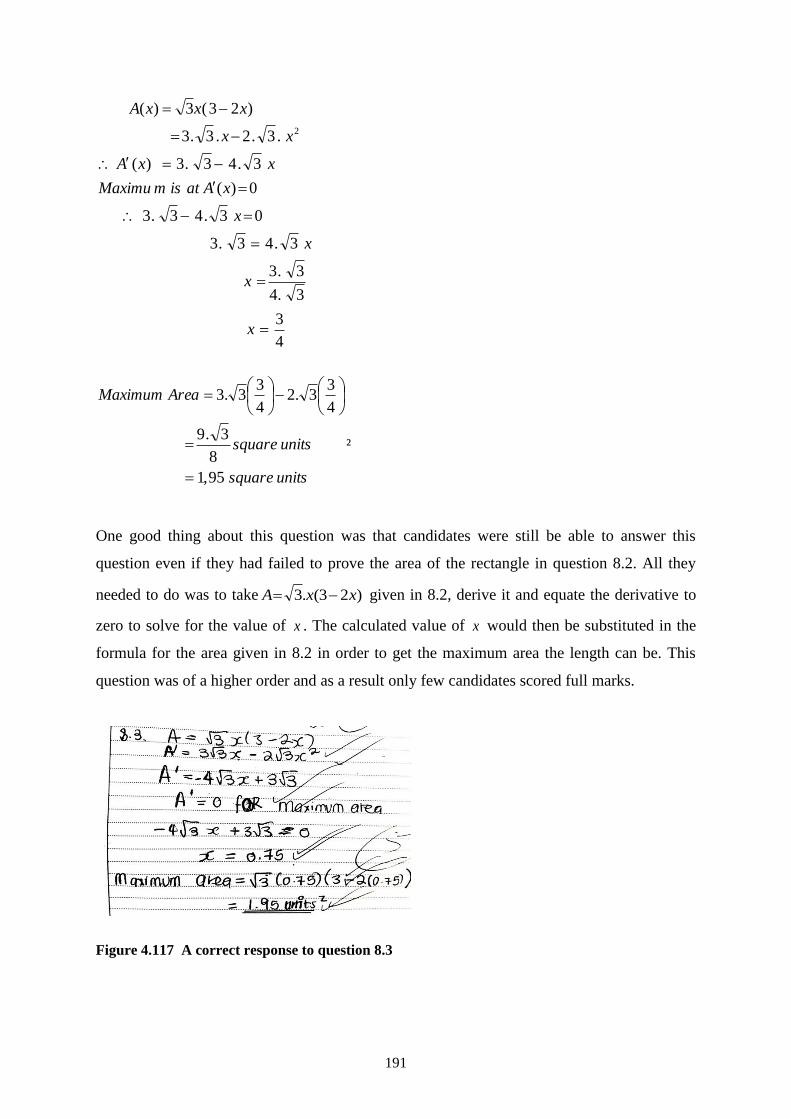
191
4
3
3.4
3.3
3.43.3
03.43.3
0)(
3.43.3)(
.3.2.3.3
)23(3)(
2
x
x
x
x
xAatismMaximu
xxA
xx
xxxA
unitssquare
unitssquare
AreaMaximum
95,1
8
3.9
4
33.2
4
33.3
²
One good thing about this question was that candidates were still be able to answer this
question even if they had failed to prove the area of the rectangle in question 8.2. All they
needed to do was to take )23(.3 xxA given in 8.2, derive it and equate the derivative to
zero to solve for the value of x . The calculated value of x would then be substituted in the
formula for the area given in 8.2 in order to get the maximum area the length can be. This
question was of a higher order and as a result only few candidates scored full marks.
Figure 4.117 A correct response to question 8.3
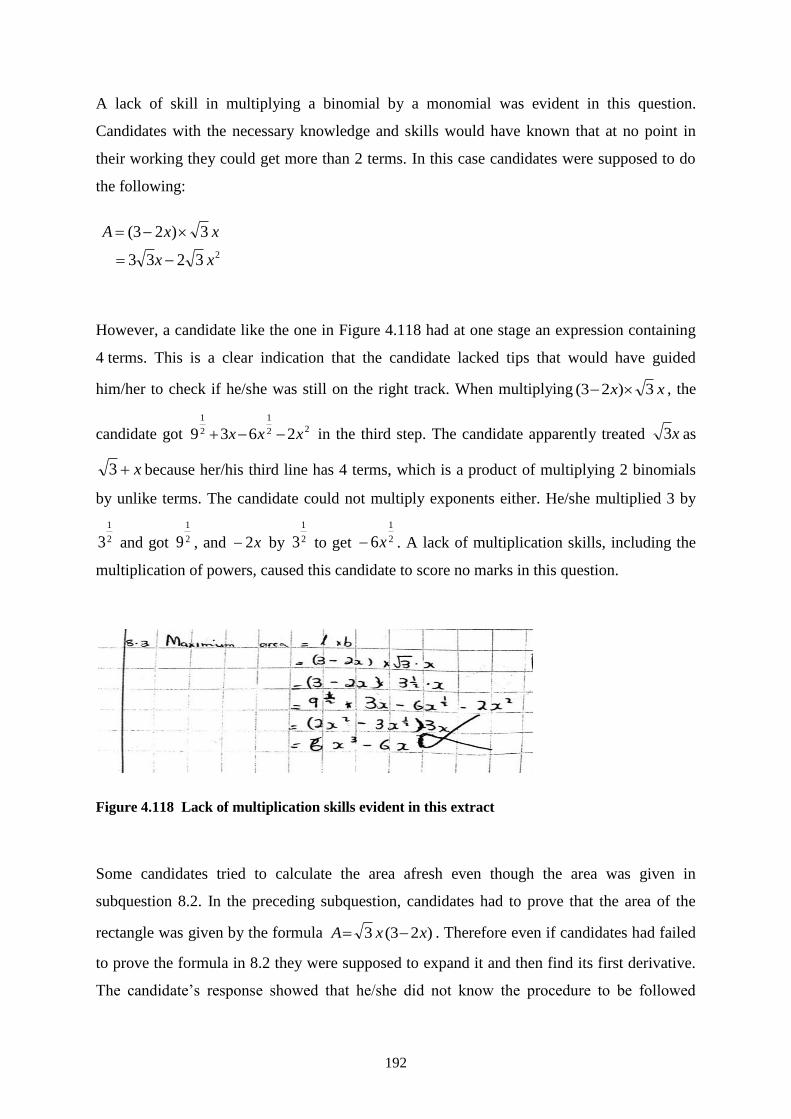
192
A lack of skill in multiplying a binomial by a monomial was evident in this question.
Candidates with the necessary knowledge and skills would have known that at no point in
their working they could get more than 2 terms. In this case candidates were supposed to do
the following:
23233
3)23(
xx
xxA
However, a candidate like the one in Figure 4.118 had at one stage an expression containing
4 terms. This is a clear indication that the candidate lacked tips that would have guided
him/her to check if he/she was still on the right track. When multiplying xx 3)23( , the
candidate got 22
1
2
1
2639 xxx in the third step. The candidate apparently treated x3 as
x3 because her/his third line has 4 terms, which is a product of multiplying 2 binomials
by unlike terms. The candidate could not multiply exponents either. He/she multiplied 3 by
2
1
3 and got 2
1
9 , and x2 by 2
1
3 to get 2
1
6x . A lack of multiplication skills, including the
multiplication of powers, caused this candidate to score no marks in this question.
Figure 4.118 Lack of multiplication skills evident in this extract
Some candidates tried to calculate the area afresh even though the area was given in
subquestion 8.2. In the preceding subquestion, candidates had to prove that the area of the
rectangle was given by the formula )23(3 xxA . Therefore even if candidates had failed
to prove the formula in 8.2 they were supposed to expand it and then find its first derivative.
The candidate’s response showed that he/she did not know the procedure to be followed
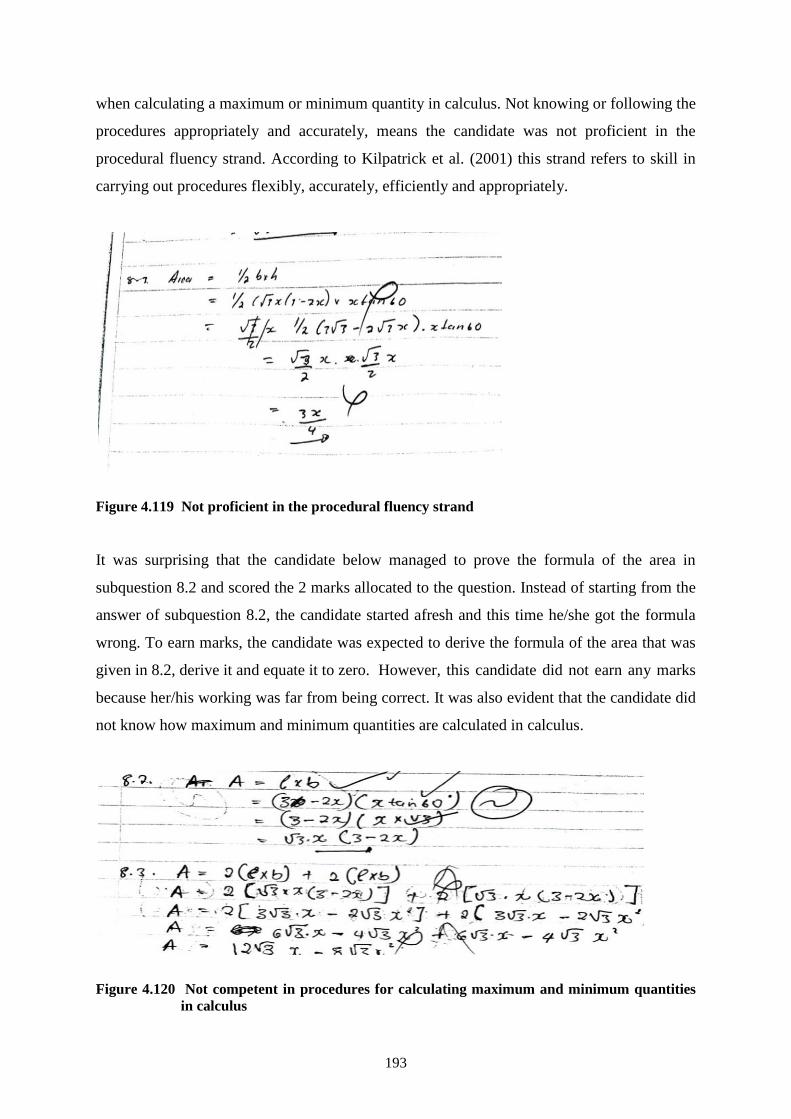
193
when calculating a maximum or minimum quantity in calculus. Not knowing or following the
procedures appropriately and accurately, means the candidate was not proficient in the
procedural fluency strand. According to Kilpatrick et al. (2001) this strand refers to skill in
carrying out procedures flexibly, accurately, efficiently and appropriately.
Figure 4.119 Not proficient in the procedural fluency strand
It was surprising that the candidate below managed to prove the formula of the area in
subquestion 8.2 and scored the 2 marks allocated to the question. Instead of starting from the
answer of subquestion 8.2, the candidate started afresh and this time he/she got the formula
wrong. To earn marks, the candidate was expected to derive the formula of the area that was
given in 8.2, derive it and equate it to zero. However, this candidate did not earn any marks
because her/his working was far from being correct. It was also evident that the candidate did
not know how maximum and minimum quantities are calculated in calculus.
Figure 4.120 Not competent in procedures for calculating maximum and minimum quantities in calculus
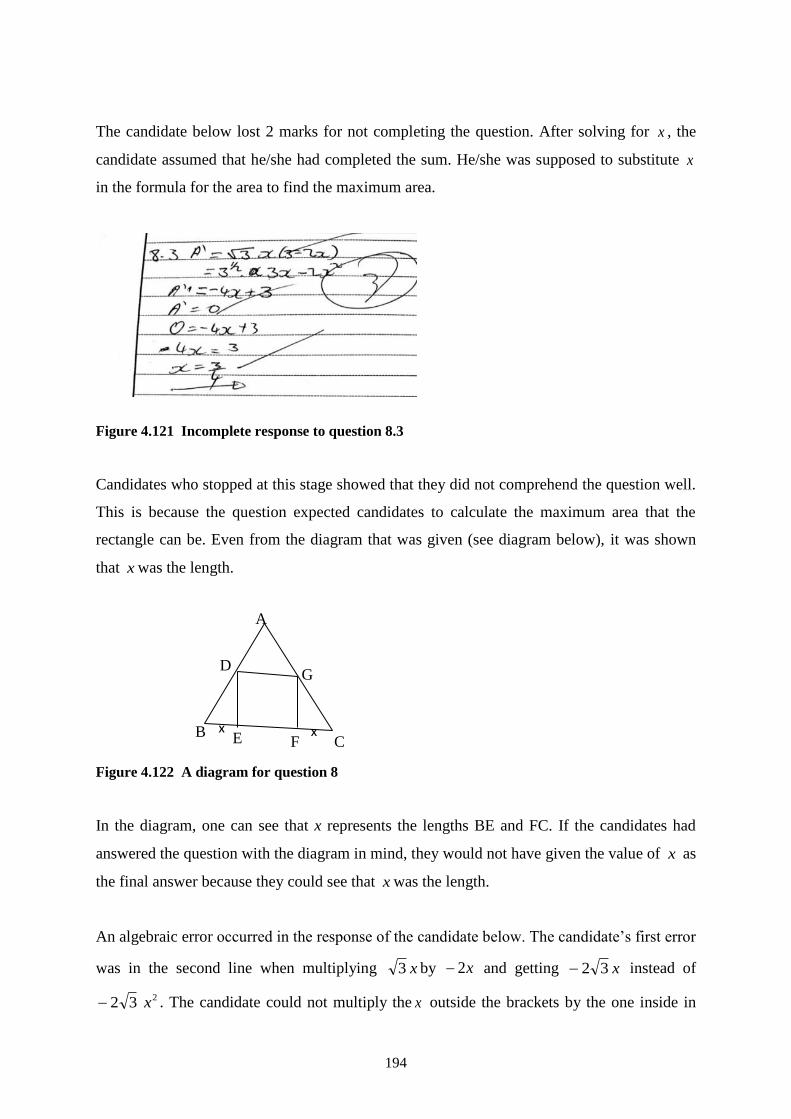
194
The candidate below lost 2 marks for not completing the question. After solving for x , the
candidate assumed that he/she had completed the sum. He/she was supposed to substitute x
in the formula for the area to find the maximum area.
Figure 4.121 Incomplete response to question 8.3
Candidates who stopped at this stage showed that they did not comprehend the question well.
This is because the question expected candidates to calculate the maximum area that the
rectangle can be. Even from the diagram that was given (see diagram below), it was shown
that x was the length.
Figure 4.122 A diagram for question 8
In the diagram, one can see that x represents the lengths BE and FC. If the candidates had
answered the question with the diagram in mind, they would not have given the value of x as
the final answer because they could see that x was the length.
An algebraic error occurred in the response of the candidate below. The candidate’s first error
was in the second line when multiplying x3 by x2 and getting x32 instead of
232 x . The candidate could not multiply the x outside the brackets by the one inside in
B C E F
A
D G
x x
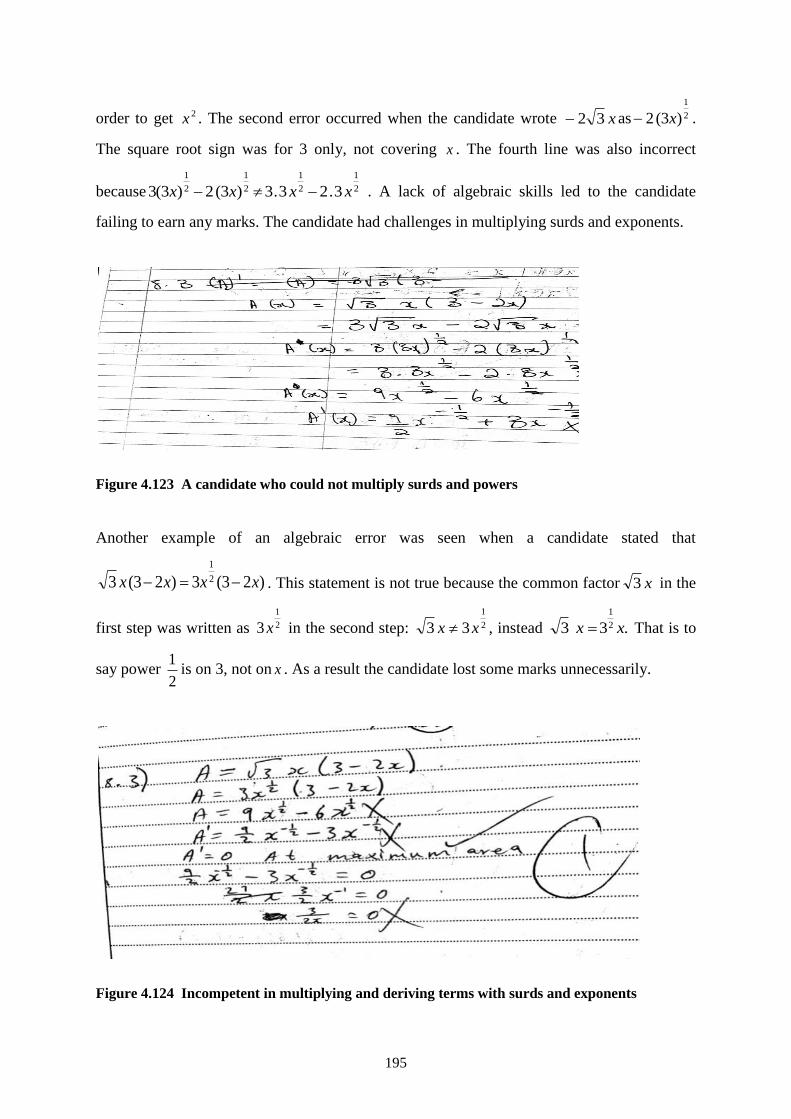
195
order to get 2x . The second error occurred when the candidate wrote x32 as 2
1
)3(2 x .
The square root sign was for 3 only, not covering x . The fourth line was also incorrect
because 2
1
2
1
2
1
2
1
3.23.3)3(2)3(3 xxxx . A lack of algebraic skills led to the candidate
failing to earn any marks. The candidate had challenges in multiplying surds and exponents.
Figure 4.123 A candidate who could not multiply surds and powers
Another example of an algebraic error was seen when a candidate stated that
)23(3)23(3 2
1
xxxx . This statement is not true because the common factor x3 in the
first step was written as 2
1
3 x in the second step: 2
1
33 xx , instead .33 2
1
xx That is to
say power 2
1is on 3, not on x . As a result the candidate lost some marks unnecessarily.
Figure 4.124 Incompetent in multiplying and deriving terms with surds and exponents
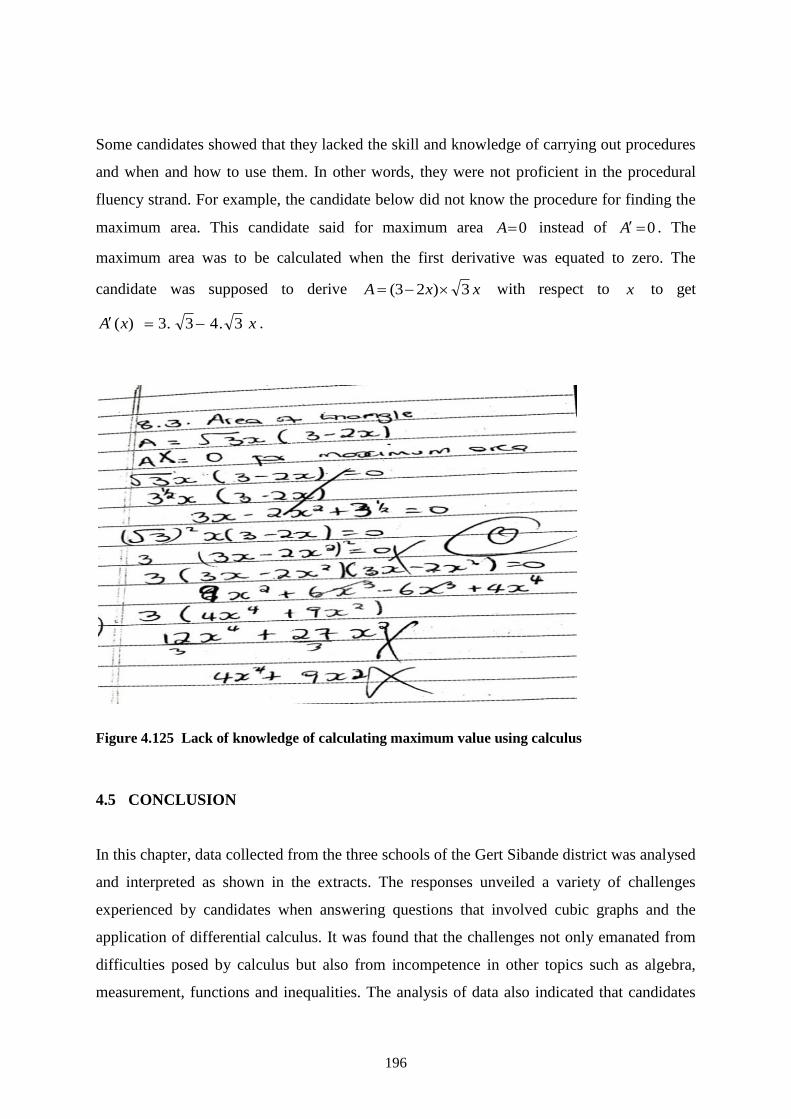
196
Some candidates showed that they lacked the skill and knowledge of carrying out procedures
and when and how to use them. In other words, they were not proficient in the procedural
fluency strand. For example, the candidate below did not know the procedure for finding the
maximum area. This candidate said for maximum area 0A instead of 0A . The
maximum area was to be calculated when the first derivative was equated to zero. The
candidate was supposed to derive xxA 3)23( with respect to x to get
xxA 3.43.3)( .
Figure 4.125 Lack of knowledge of calculating maximum value using calculus
4.5 CONCLUSION
In this chapter, data collected from the three schools of the Gert Sibande district was analysed
and interpreted as shown in the extracts. The responses unveiled a variety of challenges
experienced by candidates when answering questions that involved cubic graphs and the
application of differential calculus. It was found that the challenges not only emanated from
difficulties posed by calculus but also from incompetence in other topics such as algebra,
measurement, functions and inequalities. The analysis of data also indicated that candidates
197
made mathematical errors, which resulted in the loss of marks, leading to a poor performance
in calculus-based tasks.
The next chapter considers the findings of the study. It presents the interpretations and
findings with some recommendations and a conclusion. Recommendations are made to
teachers and the Department of Education that may improve the performance in calculus.
Lastly, the researcher’s recommendations and suggestions for further study are listed.
198
CHAPTER 5
DISCUSSIONS, RECOMMENDATIONS AND CONCLUSIONS
5.1. INTRODUCTION
This chapter examines in detail the findings in candidates’ scripts when answering questions
on calculus tasks that involve cubic graphs and the application of differential calculus. The
chapter links the research aims and the results of the study through an analysis of learners’
scripts. It gives a concise report about what was done in the study and discusses the findings
in relation to the research questions. The researcher also draws a conclusion and makes
recommendations on the basis of evidence that emerged from the data.
5.2. DISCUSSION OF THE RESULTS
In analysing the scripts, it was found that some candidates were able to respond to the
questions correctly and scored all the marks allocated to a particular question. Such
candidates can be said to be proficient in those mathematical questions. Other candidates only
managed to respond to portions of the questions. They earned only a portion of the marks
allocated to the question. These candidates can be said to be partially proficient or yet to
become proficient. At the same time, there were candidates who totally failed to respond to
the demands of the questions. They could not score a mark in particular questions and
therefore these candidates can be said not to be proficient in the calculus-based tasks used in
the study.
In almost all the questions used in the study there were candidates who left blank spaces and
did not make any attempt to respond to the questions. These candidates wrote only the
question number and left blank spaces. This made it difficult for me as a researcher to tell
whether they ran out of time to answer the questions or had some challenges in answering the
questions. If the study had included interviewing the candidates involved in the study as part
of data triangulation, it would have been possible for the researcher to discover reasons why
they had left blank spaces. According to Yeasman and Rahman (2012), triangulation is a
process of verification that increases validity by incorporating several viewpoints and
199
methods. It also refers to the combination of two or more theories, data, sources, methods or
investigators to converge on a single phenomenon to construct, and can be employed in both
quantitative (validation) and qualitative (inquiry) studies.
One would expect candidates to perform better in the Trial examination as compared to their
performance in the May test. The reason for this was that some of the questions in the
Preparatory (Trial) examination were similar in nature to those in the May test. For example,
the first question in each group below required that candidates determine the coordinates of
the turning points that were shown in the graph. However, some candidates struggled to
answer such questions satisfactorily. Below are some of the questions used in the two tasks
that were almost similar in terms of the concepts they were testing.
Some of the questions from the May test
Determine the coordinates of A and B.
Determine the x -coordinates of the point of inflection of f .
Determine the value(s) of k for which 030114 23 kxxx will have only
ONE real root.
Some of questions from the Trial examination
Determine the coordinates of C.
Calculate the x -value of the point of inflection of g .
Use the graph to determine the value(s) of t for which txg )( will have only one real
root.
The findings show that candidates performed differently in certain subsections of the
questions. Some sections were answered better than others while others were poorly done. It
was good for the researcher to analyse candidates’ scripts question by question rather than to
focus on scores since paying attention to scores would have concealed what has been
revealed by the study.
When analysing the scripts, the researcher carefully examined the candidates’ responses. In
the case of correct responses, the researcher noted the procedures followed by the candidates
to see whether the steps done were mathematically correct or whether the answer was just
200
found by chance. In the case of partially correct responses, the researcher tried to determine
what the obstacles might have been. This was also done with responses which were totally
incorrect.
The researcher has found that in most cases where candidates were not mathematically
proficient in cubic graphs and the application of differential calculus, they also lacked
knowledge from other topics such as algebra, functions, mensuration and inequalities.
Through the script analysis, the researcher ascertained the following as the causes of poor
performance in calculus and divided them into three main groups: those emanating from
calculus sections, incompetence regarding other mathematics topics and those stemming from
errors.
5.3. CHALLENGES ORIGINATING FROM SECTIONS OF CALCULUS
The study has found that the poor performance in calculus tasks involving cubic graphs and
the application of differential calculus were caused by a lack of knowledge and skill in:
5.3.1. Deriving a function
Most questions in Grade 12 calculus involve the derivation of functions. A candidate who is
not competent in deriving a function will perform poorly in calculus. Most candidates were
unable to derive a function in question 11.2. Figure 4.79 and Figure 4.81 show extracts from
candidates who failed to derive correctly.
Figure 4.73 shows an example of a candidate’s response showing a lack of knowledge or skill
on how to derive. The candidate took the exponents of t and put them in the denominators of
the coefficients. This was not the correct procedure to be followed when deriving functions.
The candidate in Figure 4.75 followed the correct procedure for an answer that would have
earned marks if it had been question 11.2. However, he/she did not score full marks because
he/she committed a careless mistake by not squaring the second term of the derivative.
5.3.2. Finding a point of inflection
This was one question that was well done. A large number of candidates were proficient in
calculating the point of inflection, but there were some who struggled. Those who struggled
201
lacked the knowledge or procedural steps to be followed when calculating a point of
inflection. Figure 4.19 and Figure 4.20 show extracts of candidates that applied incorrect
methods to find the point of inflection. One candidate used the formula for calculating the
average gradient while the other one followed the procedure used to calculate the x-
intercepts. Therefore some candidates performed poorly because they did not know the
correct method or procedure to be followed in calculating the point of inflection.
When comparing learners’ performance in question involving the calculation of a point of
inflection and the one of calculating an equation of a tangent to the curve at a given point
(Section 5.3.5), one can say learners performed better in calculating a point of inflection. The
reason may be that to calculate a point of inflection is just a routine procedure while to
calculate the equation of a tangent to the curve is a complex procedure. Candidates’ good
performance in routine type questions implies that they were functioning at an action level in
terms of APOS theory. APOS is an acronym for action, process, object and schema.
According to Dubinsky and McDonald (2002) the APOS theory starts with the assumption
that mathematical knowledge consists in an individual’s tendency to deal with perceived
mathematical problem situations by constructing mental actions, process, and objects and
organising them in schemas to make sense of the situations and solve the problems. The
candidates’ poor performance in calculating the equation of a tangent to the curve was the
indications that some features of APOS theory were not functioning fully. It can be seen that
the candidates performed well in questions where they had to follow the routine procedures
they had memorised. For example, candidates knew that to find a point of inflection they had
to work out the second derivative, equate it to zero and solve for the x - coordinate. The
candidates that managed to calculate the equation of a tangent to the curve can be said to
have acquired the process stage of APOS
The candidates that managed to calculate questions which were at cognitive levels complex
procedure and problem solving could be said to have developed the appropriate schema. This
means these candidates they have interiorised the gradient into a process where they showed
understanding that the gradient of a tangent to the curve is the same as the gradient of the
curve at the point of contact.
5.3.3. Determining the turning points
202
The study has revealed that some candidates faced challenges in calculating the turning
points. Some confused the method of finding the turning points with the method of
calculating the turning points. The confusion may have been caused by the fact that in
calculating the turning points one has to first find 0)( xf while in calculating the x -
intercept one has to find 0)( xf . The excerpts in Figure 4.2 and Figure 4.6 show that the
procedures followed by candidates were for calculating the x-intercepts, not the turning
points.
The candidate in Figure 4.7 used both methods for calculating the x-intercepts and the turning
points. This shows uncertainty experienced by the candidates when they had to calculate the
turning points.
5.3.4. Substituting in the wrong equations
The candidate in extract 4.78, even if he/she had managed to get the first derivative correct,
lost marks because of substituting with the incorrect values. The candidate changed t in hours
to minutes. For example, 2 hours was changed to 120 minutes. This yielded incorrect values
because L was calculated using t in hours.
5.3.5. Calculating the equation of a tangent to the curve
This is one of the question that was poorly answered. Candidates did not know that the
gradient of the tangent is equal to the gradient of the curve at the point of contact. The
incompetence in calculating the equation of a tangent was seen when candidates opted for the
formula for the average gradient 12
12
xx
yym
instead of finding the first derivative of the
curve, calculating its gradient at the point of contact and then using the x- and y-coordinate of
the point of contact to calculate the equation of the tangent.
5.3.6. Interpreting the meaning of a derivative of a cubic and of a quadratic function
and sketching them
203
If learners had had the knowledge or understanding of derivatives they would have performed
better because they would have sketched the correct graphs. The fact that the candidates in
Figure 4.65 and 4.66 could not draw proper graphs was due to their not knowing that a
derivative of a cubic graph gives a quadratic function (parabola) and also that the derivative
of a parabola is a straight line. Candidates in Figure 4.65 up to Figure 4.68 would not have
drawn incorrect graphs if they had mastered this information, but would have received at
least a mark for the shape (parabola).
5.3.7. Comprehending the language used in questions involving application and
optimisation
In the tasks used in the study, question 11 seemed to have posed challenges to candidates to
understand the language used. In question 11.1 candidates were asked to calculate the
average rate at which the depth changed in the first 3 hours. In the second question, 11.2, they
had to determine the rate at which the depth changed after exactly 2 hours. These two
subquestions were poorly answered. Some candidates scored no marks in this question while
others left blank spaces. Other candidates could have scored marks if what they gave in 11.1
had been their answer to question 11.2, for example the candidate in Figure 4.70 could have
earned a mark for deriving L correctly. However, this answer would have earned marks if it
had been the four questions 11.2.
In question 11 candidates could not tell the difference between the average rate at which the
depth changed and the rate at which the depth changed. This led to incorrect answers.
Candidates were not aware that in question 11.1 they had to calculate )(' tL when 0t and 3
and then use the calculated values to find the average rate (gradient) using the formula
average gradient =03
)0()3(
LL. In calculating the rate at which depth changed after exactly
2 hours, they had to find the first derivative and then substitute t by 2 to get the rate at which
the depth changed.
In summary, the word “rate” in both subquestions might have contributed to the confusion
that led candidates to give what was supposed to be the answer to 11.2 to be the answer to
question 11.1. In most calculus questions, whenever the word “rate” is mentioned, the
examiners usually test the slope of the line using the first derivative. It was not surprising to
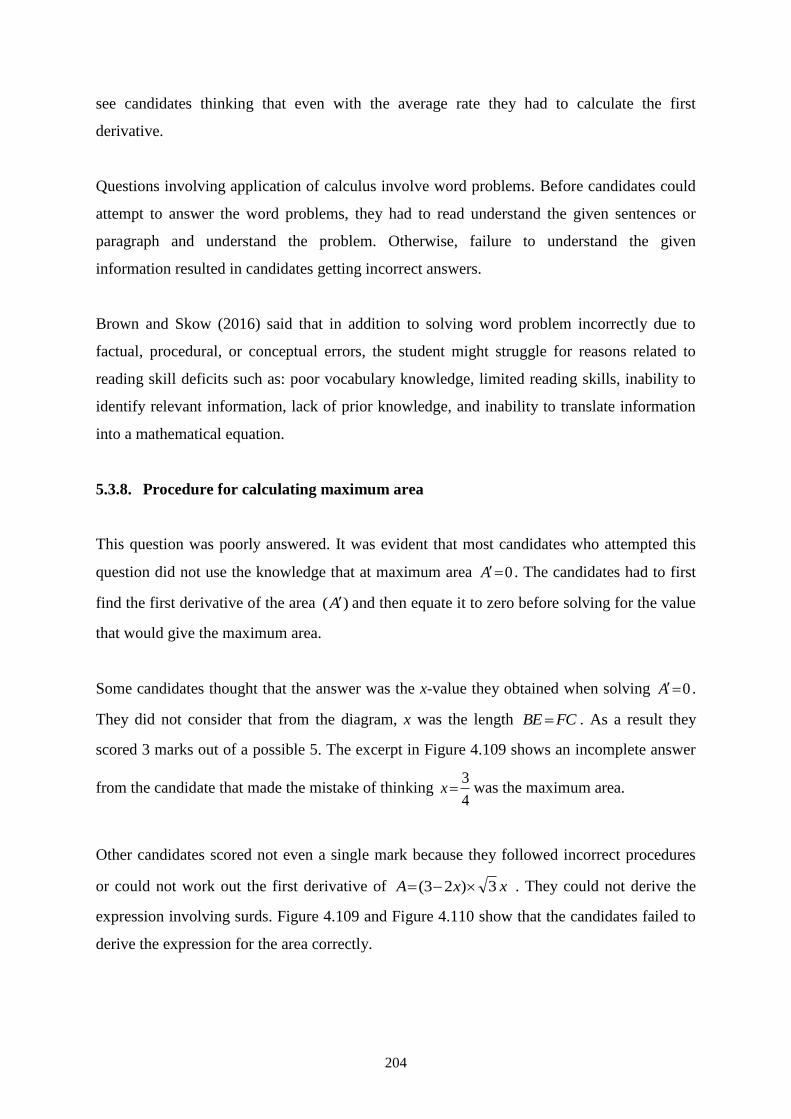
204
see candidates thinking that even with the average rate they had to calculate the first
derivative.
Questions involving application of calculus involve word problems. Before candidates could
attempt to answer the word problems, they had to read understand the given sentences or
paragraph and understand the problem. Otherwise, failure to understand the given
information resulted in candidates getting incorrect answers.
Brown and Skow (2016) said that in addition to solving word problem incorrectly due to
factual, procedural, or conceptual errors, the student might struggle for reasons related to
reading skill deficits such as: poor vocabulary knowledge, limited reading skills, inability to
identify relevant information, lack of prior knowledge, and inability to translate information
into a mathematical equation.
5.3.8. Procedure for calculating maximum area
This question was poorly answered. It was evident that most candidates who attempted this
question did not use the knowledge that at maximum area 0A . The candidates had to first
find the first derivative of the area )(A and then equate it to zero before solving for the value
that would give the maximum area.
Some candidates thought that the answer was the x-value they obtained when solving 0A .
They did not consider that from the diagram, x was the length FCBE . As a result they
scored 3 marks out of a possible 5. The excerpt in Figure 4.109 shows an incomplete answer
from the candidate that made the mistake of thinking 4
3x was the maximum area.
Other candidates scored not even a single mark because they followed incorrect procedures
or could not work out the first derivative of xxA 3)23( . They could not derive the
expression involving surds. Figure 4.109 and Figure 4.110 show that the candidates failed to
derive the expression for the area correctly.
205
5.4. POOR PERFORMANCE AS A RESULT OF INCOMPETENCE IN OTHER
MATHEMATICS TOPICS
The study showed that poor performance in calculus was not only due to the challenging
concepts within the topic itself but also to a lack of prior knowledge regarding other topics
such as algebra, functions, mensuration and inequalities.
5.4.1. Lack of knowledge and skills in algebra
Algebra is very important in all topics of mathematics. This became evident in this study
when it was seen that some candidates obtained incorrect responses not because they were
incompetent in calculus concepts but because of failing to perform algebraic manipulations.
This was evident when candidates:
5.4.1.1. Demonstrated the lack of factorisation skills
This was seen when they could not factorise the first derivative in question 4.1.1 in order to
determine the coordinates of the turning point (Figure 4.4) and as a result they did not score
marks. Factorisation is another mathematical concept used in all mathematics topics. If a
candidate has not mastered it his/her performance in mathematics is at risk. From this study it
was evident that some candidates could not derive the first derivative correctly when
calculating the turning points. For example, candidates in Figure 4.4 and Figure 4.5 failed to
factorise the first derivative and as a result they did not get the correct x-values of the turning
points.
5.4.1.2. Could not multiply terms containing surds and exponents
In question 8.2, candidates had to multiply )23( x by x.3 . Some candidates wrote the surd
in exponential form but experienced challenges when trying to find the solution. The
candidate in Figure 4.123 is an example.
5.4.1.3. Exhibited lack of algebraic manipulation skill
206
The candidate in Figure 4.123 wrote the correct formula for the area of a rectangle but failed
to score even a single mark because he/she could not carry out the multiplication that
involved surds and exponents that were fractions.
5.4.1.4. Incorrect reasoning
Because they had not been exposed to questions that promote adaptive reasoning, some
candidates ended up with contradicting statements such as 40 . Figure 4.47 serves as
evidence of this situation. Another error similar to this one was seen in Figure 4.52, where the
candidates stated that )0(0 m , but went on to give the answer as m = 0. These candidates
missed the key property of zero, which says that when anything is multiplied by zero the
product is zero.
The above candidates indicated that they were not proficient in the adaptive reasoning strand.
According to Kilpatrick et al. (2001), adaptive reasoning strand refers to the capacity for
logical thoughts, reflections, explanation and justification. The strand includes knowledge of
how to justify a conclusion. Adaptive reasoning is used to go through many facts, facts,
procedures, concepts and solution methods to check if they all fit together to make sense. For
example, the above candidate if she/he was proficient in this strand could have seen that it did
not make sense to say )0(0 m and went on to make a conclusion that 0m . In order for the
candidates to be successful in mathematics, they have to be proficient in all the five
mathematical strands
There is a need that the textbooks used in our schools to contain questions that promote
logical thinking, explanations, reflections and justification. This will help candidates to
always check their solutions to see if they make sense. It has been seen in the literature
review that textbooks play an important role in the teaching and learning of mathematics,
especially in situations where teachers depend solely on textbooks as the teaching material.
Some books used in Schools in South Africa have been blamed for various reasons. Some
have been said to contain few learners’ activities while others have been criticised for having
majority of questions of low order (Siyepu 2013)
207
5.4.2. Incompetence in functions
This section of calculus, especially cubic graphs, needs a good background or prior
knowledge of functions. This study showed learners losing marks because they lacked a
proper background on functions. Candidates showed their lack of proficiency in functions by:
5.4.2.1. Failing to sketch the graphs
Some candidates managed to calculate the x-intercepts and the x-value of the turning point,
but could not sketch the correct graph represented by the calculated information. The excerpts
in Figure 4.65 and Figure 4.66 show such situations.
5.4.2.2. Lack of knowledge to calculate the x-intercepts
Some candidates used the wrong methods and as a result they lost marks. In question 7.1
candidates were asked to write down the coordinates of A and D for 2 marks only. Some
candidates did not realise that words like “write down” gave a clue that not much calculation
was expected from them. Well prepared learners would have searched for the answer from
the given information. Having discovered that A and D were x-intercepts candidates were
expected to equate the formula to zero. The function had already been factorised and then
equalling to zero would give 0)3()2( 2 xx . They could even work out mentally that the
x-values were 2x or 3. The y-values at the x-intercepts was 0. Therefore the coordinates
were (–2 ; 0) and (3 ; 0).
Surprisingly some learners opted to use the method of determining the turning points just
because the point A was also a turning point. They lost a mark for point D because it was
only an x-intercept, not a turning point. Figure 4.83 shows an extract of a candidate that
followed this method.
5.4.2.3. Using wrong notations in coordinates
When we write the coordinates of a point, let us say point D, which lies at the point )3;2( , the
correct notation to represent this point is D )3;2( . The study has revealed that some
208
candidates could not use the correct notations. For example, the candidate in Figure 4.89
wrote the point )27
500;
3
4( C as
27
500,
3
4C . This was not the correct notation and as a
result he/she could not score the last mark for the answer.
Figure 4.8 shows another candidate who did not know the correct notation to represent the
coordinates of a point. The question asked candidates to determine the coordinates of A and
B, which were two different points. The candidate gave his/her answer as 1) -3
11-AB( . This
showed that this candidate did not understand the meaning of AB. The notation AB is usually
used to represent a line segment.
5.4.2.4. Swapping x-and y-coordinates when sketching the graph of a given function
Some candidates failed to sketch the correct graphs after they had swapped the x- and y-
coordinates. One may also argue that the swapping was just a slip or carelessness because
candidates that swapped the coordinates were not consistent. For example, the candidate in
Figure 86 swapped coordinates for only one point.
5.4.2.5. Failing to read from the graphs the values of k for which
030114 23 kxxx will have only one real root
This is one of the questions that were poorly done. Candidates did not see that the value of k
was the horizontal lines )'( sky which cut the graph only once. Figure 4.34 shows an
example of a candidate who could not read the values of k from the graph.
5.4.2.6. Failure to read from the graph to determine the value(s) of t for which txg )(
will have only ONE real root
This question was also poorly answered. What is surprising is that a question of this nature
was asked in all three the tasks used in the study, but in each case learners’ performance was
209
always poor (see question 4.1.4 May test, question 10.4 Midyear examination, and question
7.5 of the Trial examination). One would expect candidates’ performance to have improved
by the time they wrote the preparatory examination because they had already been exposed to
such questions several times. Extracts like those in Figure 4.59, Figure 4.61 and Figure 4.99
testify to this poor performance.
Poor performance in questions like the one stated in section 5.4.2.5 and 5.4.2.6 suggested that
the candidates faced challenges when working out problems of higher order. According to the
CAPS document (DBE 2011) a question is said to be at cognitive level problem solving if it
requires the learners to demonstrate the following skills:
Non-routine problems (which are not necessarily difficult)
Higher order reasoning and processes are involved
Might require the ability to break the problem down into its constituent parts
Lacking skills and knowledge to work out questions which are in problem solving cognitive
level will results in poor performance. Singapore, one of top performing countries in
mathematics, has done well when compared to other countries. It uses the mathematical
problem solving approach in all grades (Ministry of Education Singapore 2006)
Therefore, in order to improve the performance of mathematics in South Africa we have to
use the problem solving approach as early as in the lower grade up to secondary school. At
present, the Grade 10 - 12 examination papers have to consist of only 15% of questions that
are at the problem solving cognitive level. Teachers have to give learners more practice
questions ( classwork and homework) that are at this cognitive level. Our learners are lacking
skills and knowledge to deal with questions of higher order
5.4.2.7. Lack of knowledge that the constant term of a function is a y-intercept
One would expect all candidates to get the values of k to be zero since the graph cut the
y-axis at the origin. However, some candidates lost a mark by writing values of k other than
0k . Generally, when one has the equation cmxy or cbxaxy 2 or
210
dcxbxax 23 , the constant term c or d is the y-intercept. Candidates like the one in
Figure 4.4 did not see that the value of 0k .
Our candidates have to use knowledge learnt in the lower grades to solve present problems.
In the Senior Phase, specifically Grade Nine, candidates learnt the effect of c in the equation
cmxy . In Grade Ten they also learnt the meaning of q in the equation qxafy )( where
xxfxxfxxf
1)()(,)( 2 and xbxf )( where 0b and 1b . In all these graphs the
value of q , the constant term was the y intercept.
5.4.3. Incompetent in mensuration
Most questions on the application of calculus involve concepts such as area and volume.
They may include a situation where candidates have to calculate the size of the sides of the
figure that will give either the maximum area or maximum volume. In order for learners to
perform well in calculus, they need to master the concepts of area and volume. Failure to do
so will result in a poor performance in calculus questions on application that involve area and
volume. This was seen in this study when candidates did not know the:
5.4.3.1. Formula for calculating the area of a rectangle
Some candidates did not score marks in question 8.2 because they did not know the formula
for calculating the area of a rectangle. The question required candidates to prove that the area
of the given rectangle was )23(3 xxA . The key or starting point was that candidates had
to know that the area of a rectangle is length multiplied by breadth, blA . Unfortunately
some candidates lost marks because they did not know the formula. The extract in Figure
4.107 shows a candidate who gave the area of a rectangle as hbA 2
1. Consequently the
candidate made the wrong substitution and ended up losing marks.
5.4.3.2. Difference between area and volume
211
Some candidates gave the area of a rectangle as hblA . This was a clear indication that
these candidates did not understand the concepts of area and volume. From the lower grades
up to grade 12, they did not realise that when we calculate area we use two dimensions,
length and breadth. In the case of volume, we use three dimensions, length, breadth and
height. Candidates did not score marks because they also substituted incorrectly. An example
of a candidate that followed the incorrect formula is shown in Figure 4.108.
The failure to write the correct formula for the area may be due to students’ much
dependence on memorising formulas. These learners showed that they have learned the
formulas of area and volume of figures under the topic Measurement, but their main
challenge was to state which formula to use for the area of a rectangle. So one can say these
learners relied much on rote learning, which is just the memorisation technique based on
repetition.
In order to assist learners to learn concepts with understanding and not just memorising and
recalling, teachers have to use meaningful teaching and learning methods such as
constructivism and APOS Theory. Hein (1991) refers to constructivism as the idea that
learners construct knowledge for themselves. The theory of constructivism suggests that
learners construct knowledge out of their experience. One of the benefits of
constructivism in the classroom is that it creates an active, engaging environment
for children. Instead of being passive listeners, children, through discussion and
collaboration, engage in active thinking and understanding and learn to teach
themselves. It is said that students learn better and faster when they work actively
in problem solving rather than through rote memorisation. Also, their retention rate
is improved.
In order the candidates to do better and not confuse the formulae for area and volume,
teachers have to use the constructivism approach in their classroom. It is easier for the learner
to forget when told a concept than when they have discovered things on their own
5.4.4. Incompetence in inequalities
212
Inequalities are also important in questions involving cubic graphs. Candidates who are
incompetent in inequalities experience challenges in answering calculus questions like the
one used in this study. It was seen from the analysis of scripts that many candidates could
not:
5.4.4.1. Distinguish between < and >
Some candidates lost marks because they did not use the correct inequality sign, as is shown
in Figure 4.35 and 4.97. This shows that if candidates had been competent in detecting the
correct sign, they would have done better than the marks they actually achieved in the
questions selected for the study.
Failing to make a distinction between < and > is an indication that such candidates were
performing at an action conception. They depended much on memorising these signs. I was
surprising that Grade 12 candidates could still fail to distinguish the meaning of the two
inequality signs which were taught in primary school
The study showed that learners’ construction of knowledge was mainly based upon isolated
facts and procedures. Failing to get such a simple question might be a result of the way in
which the learners were taught and how learning took place. It might happened that during
teaching and learning educators haab0ut put more emphasis on procedural aspects in working
out problems leaving out the conceptual understanding of the concept. This can be improved
if learners can be taught and learn using new learning theories such as APOS Theory or
Constructivism. Failing to do well in a simple question like the one of comparing quantities
may mean the candidates were operating at an action level. It will be difficult for candidates
to perform good if a number of them are still getting low marks in simple questions. In order
for these candidates to do well, they should be taken beyond the action level
5.4.4.2. State the value(s) of x that satisfy the given inequality
It was evident that candidates had some difficulties in answering question 7.6 in the Trial
examination. The question reads: “For which values(s) of ?0)(.)( xgxf ” From the analysis
of candidates’ scripts, it was clear that very few candidates were able to respond correctly to
213
the question. The poor performance suggests that candidates are not good at reading
information from graphs and making interpretations. Excerpts from Figure 4.101 and Figure
4.103 show that candidates wrote down answers that were difficult to explain. What can be
also said about this question is that very few attempted it. Many would simply leave a space
and this made it difficult for the researcher to explain the reason for the omission.
5.5. POOR PERFORMANCE RESULTING FROM ERRORS
Errors were evident in all of the mathematical content areas covered in the test. They were
prevalent to such an extent that they all warrant attention. Of particular concern is the very
poor performance in items in which the calculation of equation to the gradient and graph
interpretation was involved.
5.5.1. Careless mistakes or slips
Candidates lost marks not because they did not have the required skills and knowledge to
perform a task but because of carelessness or not paying much attention to their work. They
easily became distracted and wrote something they had not intended. These slips or mistakes
contributed to the poor performance in calculus and in mathematics as a whole.
The extract in Figure 4.3 shows an example of a slip where a candidate substituted in the
quadratic formula the value of b outside the discriminate to be 3 while inside the discriminate
the candidate put –8. As a result the candidate ended up losing marks. The candidate in
Figure 4.2.1 got 86 x as part of the working. However, the candidate divided by 3 both
sides of the equation and got 3
8x instead of
3
82 x .
5.5.2. Application error
This error occurs when the candidate knows the concept but cannot apply it to a specific
situation or question, no matter whether they have shown that they know the particular
concept. When they applied it to an incorrect question or situation, they could not be awarded
214
marks. For example, the candidate in Figure 4.55 used the formula for finding the angle of
inclination of a line in trying to find the equation of a tangent to the curve.
It was also seen when a candidate tried to solve a non-quadratic equation using a quadratic
formula. This indicated that the candidate did not know that the quadratic formula worked
only with quadratic equations. This is seen in Figure 4.61.
5.5.3. Procedural error
This error occurred when a candidate did the wrong calculation, for example in Figure 4.2
candidates had to calculate the coordinates of the turning points. However, candidates used
the procedure followed when calculating the x-intercepts. It was also the case with the
candidate in Figure 4.6. Also in Figure 4.19 a candidate used the formula for calculating the
average gradient in trying to calculate the point of inflection. The candidate in Figure 4.31
used the equation of a circle in an attempt to calculate the equation of a tangent.
5.5.4. Conceptual error
Some candidates used a mathematical concept but applied it in the wrong situation. For
example the candidate in Figure 4.57 changed p in the equation pxxx 44 23 and
replaced it by 0, then continued by factorising the left-hand side of the equation to become
.0)2)(2( 2 xxx This resulted in the solutions being 2x twice or 0x . This would
have been correct if the right-hand side had been zero. However, in this equation the left-
hand side was equal to p. What the candidate used here was the zero factor, which says if the
product of two numbers is zero, then at least one of them is zero. You cannot use the factor
when the equation is equated to any other number than zero. As a result the candidate could
not score any mark from the incorrect working.
The candidate in Figure 4.58 made the same mistake, but kept p on the right-hand side. This
candidate came to a situation where he/she stated that pxxx )2)(2( and therefore x = p
or x–2=p. This will not always be true. Such misconception resulted in the loss of marks.
215
The candidates’ scripts were able to provide sufficient information in order for the researcher
to make valid conclusion. The researcher was able to analyse the scripts and make
judgement.
5.6. CONCLUSION
The study explored the causes of the poor performance by Grade 12 learners in calculus-
based tasks in three schools in the Gert Sibande District in Ermelo. The study used the script
(document) analysis method to collect data. The data collected was useful in providing an
understanding of the possible causes of the poor performance in calculus. The study
discovered that learners performed poorly in calculus because of incompetence in other
mathematics topics such as algebra, functions and inequalities, for example, candidates would
fail to factorise a derivative and solve for x.
The findings of the study were able to answer the research questions. The researcher was able
to detect the possible causes of poor performance and types of errors made by candidates
when working out calculus based tasks. Through the analysis of candidates’ scripts, their
mathematical proficiency could be examined. The study has revealed that candidates were
not proficient in all the four strands; conceptual understanding, procedural fluency, strategic
competence and adaptive reasoning, but most were not proficient in conceptual understanding
and procedural fluency. This is compatible to the study made by Maharaj (2015) whose
conclusions were that learners made most algebraic errors in the procedural fluency and
conceptual understanding strands. Being not proficient in these two strands means that the
candidates did not understand procedures that had to be followed when solving problems in
calculus
The study also revealed that the candidates could not do well in questions of higher order.
These are the questions which in terms of four cognitive levels listed in CAPS document fall
under problem solving. The tasks themselves had few questions which fall under this
category. According to Sze (2009) said that Singapore, one of the performing countries in
mathematics, is using problem solving approach which helps in developing skills such as
reasoning and communication. However, in case of this study, candidates responded poorly
to questions belonging to problem-solving cognitive level. This might be the indication that
candidates are used to questions of lower cognitive level. Questions involving applications of
216
differential calculus, usually high order questions, were poorly done. This creates a need for
more emphasis of using problem-solving approach in the teaching and learning of
mathematics
What can be also deduce from the study was that there were few candidates who managed to
score some marks in questions of higher order while others failed to do so. In terms of APOS
Theory, it means these learners were not performing at the same level. Some were at the
action, process, and object or schema level. According to the Dubinsky and McDonald
(2000), if two learners who agree in their s performance up to a certain level, and one of the
students takes a further step while the other cannot, the researcher can explain the difference
by pointing to the mental constructions of action, process, objects and/or schemas that the
former learner appears to have made but the other has not
The study also revealed errors made by learners when working out questions in calculus
based tasks. The findings of this research concur with the results of the study by Maseko, Van
Lelyveld, de Beer, Kakoma, & Ramnarain, (2010). They found that poor performance in
mathematics was caused by misconceptions, mistakes or slips, and errors. Maseko et al
(2010) mistakes or slips result from misreads or incorrect working out. They said that
learners make mistakes unintentionally and can readily correct them by themselves once they
become aware of them. Mistakes can be easily corrected because there is no deep conceptual
understanding linked with them. They said that to correct a mistake is much easier and
uneventful. But they said that unseen mistakes may interfere with performance in
mathematics because if learners cannot correct them in time, they can lose lot of marks
working out long mathematics problems that require earlier results to be used in the later
stages of the question. Mistakes therefore are random, non-systematic and nonrecurring and
are due to performance lapses rather than planning
The study also found that many students were not yet proficient in calculus because of the
number of errors they committed when solving questions on calculus. The errors included
careless mistakes or slips, application errors, conceptual errors and procedural errors.
Careless mistakes were those errors that occurred through their carelessness, when they wrote
a number and in their working they continued with a different number. For example, a learner
217
would work with number 5 in the formula, and suddenly the number was changed to 3
unintentionally. Application errors occurred when candidates knew the mathematical concept
but could not apply it to the relevant question. Procedural errors were seen when candidates
would take a formula and use it in the wrong calculation. For example, a candidate tried to
use a quadratic formula to solve a cubic function. This shows that the candidate did not
understand the term “quadratic” because knowing it would have helped the candidate to
understand that it is only in quadratic functions used. Lastly, conceptual errors were made by
candidates when they did not understand the properties or principles required to answer the
question correctly. This was seen when a candidate used a procedure to calculate x-intercepts
when trying to calculate the turning points. Luckily for candidates one of the turning points
was indeed an x-intercept.
It is evident that all the errors except the careless mistakes occurred as a result of candidates
not being competent in the mathematical concepts that were tested. Thus, in terms of the
mathematical strands defined by Kilpatrick et al. (2001), these candidates were not proficient
in conceptual understanding and procedural fluency. Unfortunately the questions used in the
study did not require candidates to display their competence in strategic competence and
adaptive reasoning.
It was also clear that language presented a challenge to candidates, especially in the question
of optimisation set in the preparatory examination. Candidates did not understand the
difference between average rate of change and rate of change. They did not see that the first
one was the average rate (gradient) between two points while the rate of change was the
gradient at a specific point, for example the gradient of a tangent at the given point.
I do not doubt that this study has done much to help learners, teachers, subject advisers and
the Department of Education in improving learners’ performance in calculus. The study also
satisfied its objectives.
In overall, I can say mathematical proficiency by Kilpatrick et al. (2001) was very key in
determining possible causes that have led to poor performance in Calculus, especially the
following strands; conceptual understanding, procedural fluency, adaptive reasoning and
strategic competence. The fifth strand, productive disposition, could not be determined in this
218
study because this strand is only achieve once learners are successful in mathematics and then
develop love for the subject
5.7. LIMITATIONS OF THE STUDY
One limitation of the study was that not all three of the schools provided scripts that covered
all three of the tasks. For example, at one school the teachers asked the administration clerks
to make the copies. Unfortunately they copied the wrong questions and left out some of the
relevant questions. As a result the data was compromised.
The second limitation was that the researcher used only one form of data collection, the
analysis of candidates’ scripts. The use of more than one method to collect the data would
have strengthened the findings. The interviewing of candidates that participated in the study
would have given a clearer insight to the researcher into what caused them to choose certain
incorrect procedures. The researcher would also have been in a good position to explain why
some candidates left blank spaces. As it is, the researcher could not tell whether they left
spaces because they found the questions challenging or could not complete the tasks because
of a lack of time.
The third limitation was that the researcher could not get the set of the three tasks of all
learners. If the researcher had managed to collect all three the tasks as a set for an individual,
it would have been easier for the researcher to follow any improvement in terms of
performance from the May test to the Trial examination for that particular candidate.
5.8. RECOMMENDATIONS FOR FUTURE RESEARCHERS
To intensify future research into the causes of poor performance by Grade 12 learners in
calculus-based tasks, researchers must:
1. Use more than one method to collect data. This is what is called data
triangulation. The researcher must use other forms of collecting data, like
interviewing learners, observation and classroom visits.
219
2. Compare learners’ performance in other mathematics topics that may influence
learners’ performance in calculus. It would be interesting to see whether there is
any relationship or connection between learners’ performance in these topics.
3. Compare the performance of learners in calculus questions of those doing
mathematics and science to those doing mathematics and accounting, especially
in questions on optimisation. There is a belief that accounting students usually
struggle with questions that have a scientific context, such as velocity and
acceleration.
4. Investigate teachers’ background of Physics to the performance of learners in
questions involving quantities such as displacement, velocity and acceleration
5.9. RECOMMENDATIONS
This study explored the causes of the poor performance by Grade 12 learners in calculus-
based tasks. The analysis of the data pointed to certain factors that contribute to the poor
performance in calculus. Therefore the following recommendations are made based on the
findings of the study:
5.9.1 Challenges originating from sections of calculus
In order for the candidates to master the concepts covered in the calculus content, I
recommend that calculus be introduced early in Grade 11 so that by the time learners
reach Grade 12 they will have mastered certain concepts. At present in South Africa,
calculus is first introduced in Grade 12. Learners have to acquire a great deal of
knowledge within a short time.
I recommend that topics like derivation using the rule 1)( nnxxf and nxf )( ,
where n is a positive integer, should be done in Grade 11, and the derivation where n
is a rational number be done in Grade 12. This will eliminate the present challenge
where learners have to cover a lot of concepts within a short time.
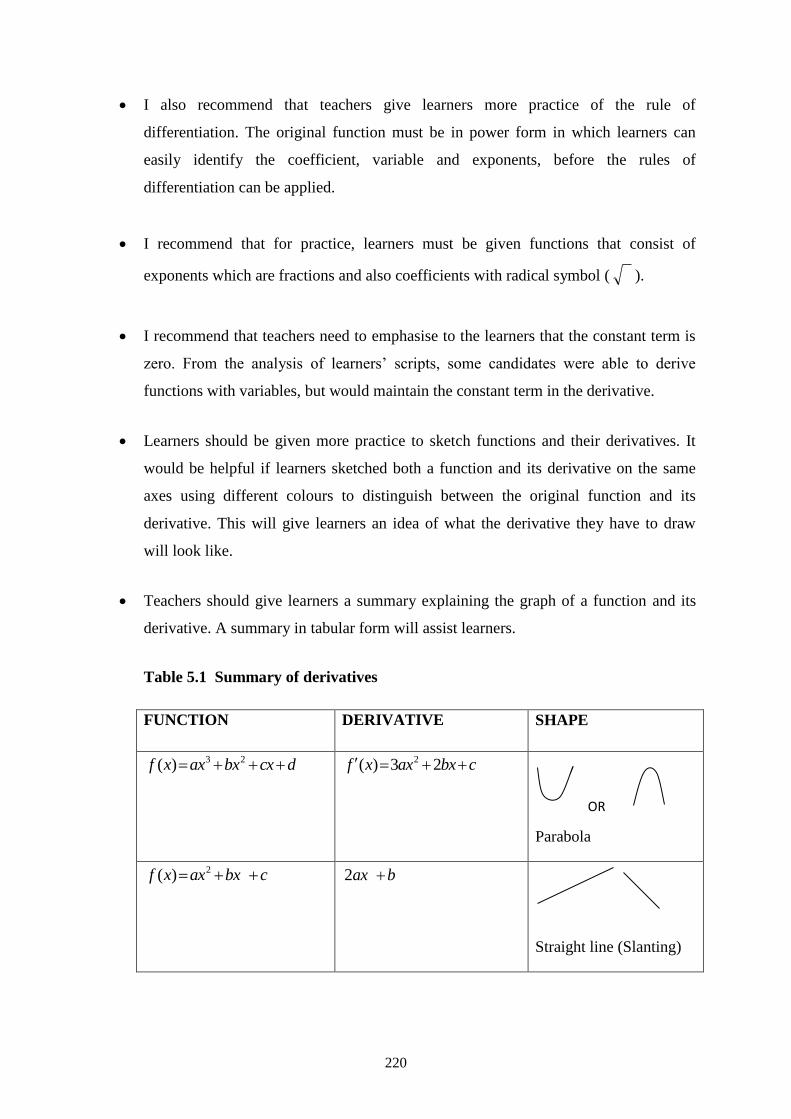
220
I also recommend that teachers give learners more practice of the rule of
differentiation. The original function must be in power form in which learners can
easily identify the coefficient, variable and exponents, before the rules of
differentiation can be applied.
I recommend that for practice, learners must be given functions that consist of
exponents which are fractions and also coefficients with radical symbol ( ).
I recommend that teachers need to emphasise to the learners that the constant term is
zero. From the analysis of learners’ scripts, some candidates were able to derive
functions with variables, but would maintain the constant term in the derivative.
Learners should be given more practice to sketch functions and their derivatives. It
would be helpful if learners sketched both a function and its derivative on the same
axes using different colours to distinguish between the original function and its
derivative. This will give learners an idea of what the derivative they have to draw
will look like.
Teachers should give learners a summary explaining the graph of a function and its
derivative. A summary in tabular form will assist learners.
Table 5.1 Summary of derivatives
FUNCTION DERIVATIVE SHAPE
dcxbxaxxf 23)( cbxaxxf 23)( 2
Parabola
cbxaxxf 2)( bax 2
Straight line (Slanting)
OR
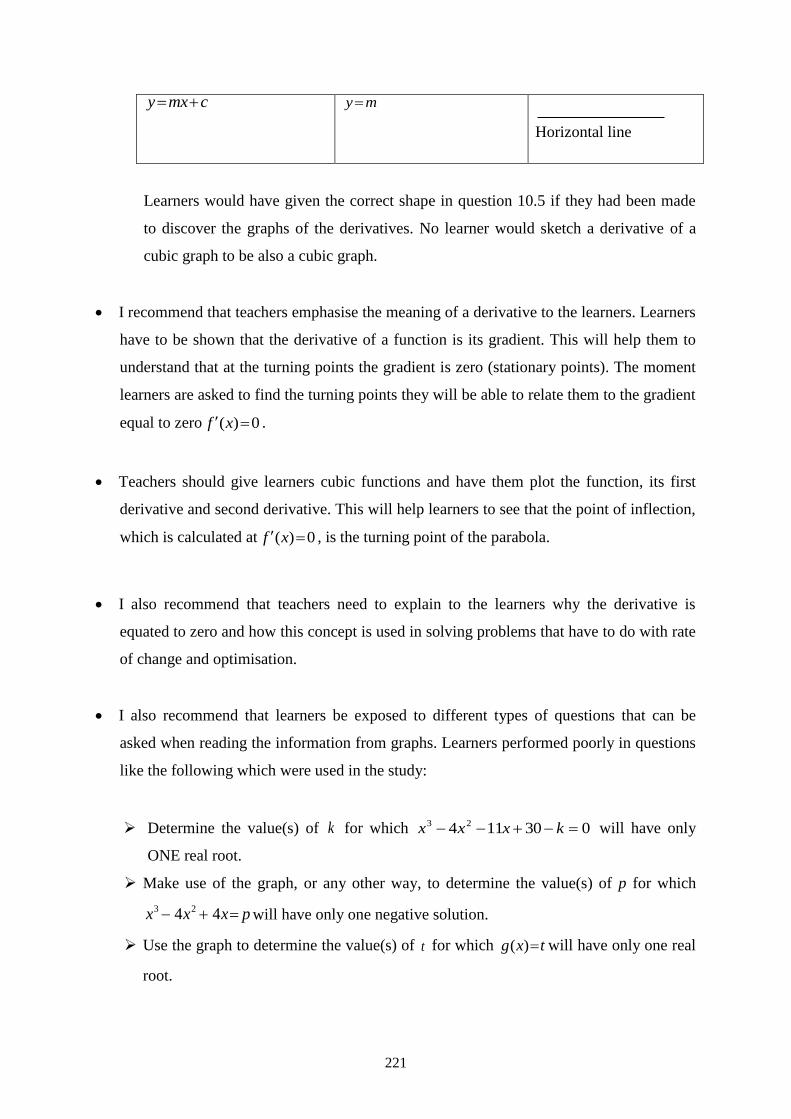
221
cmxy my
Horizontal line
Learners would have given the correct shape in question 10.5 if they had been made
to discover the graphs of the derivatives. No learner would sketch a derivative of a
cubic graph to be also a cubic graph.
I recommend that teachers emphasise the meaning of a derivative to the learners. Learners
have to be shown that the derivative of a function is its gradient. This will help them to
understand that at the turning points the gradient is zero (stationary points). The moment
learners are asked to find the turning points they will be able to relate them to the gradient
equal to zero 0)( xf .
Teachers should give learners cubic functions and have them plot the function, its first
derivative and second derivative. This will help learners to see that the point of inflection,
which is calculated at 0)( xf , is the turning point of the parabola.
I also recommend that teachers need to explain to the learners why the derivative is
equated to zero and how this concept is used in solving problems that have to do with rate
of change and optimisation.
I also recommend that learners be exposed to different types of questions that can be
asked when reading the information from graphs. Learners performed poorly in questions
like the following which were used in the study:
Determine the value(s) of k for which 030114 23 kxxx will have only
ONE real root.
Make use of the graph, or any other way, to determine the value(s) of p for which
pxxx 44 23will have only one negative solution.
Use the graph to determine the value(s) of t for which txg )( will have only one real
root.
222
I recommend that teachers help learners to understand the difference between rate of
change and average rate of change. Candidates could not answer the question on the
application of calculus. Candidates should know that the rate of change is the
derivative of the function evaluated at the single point. On the other end the average
rate is the difference in the function values divided by the difference in the x-values.
That is, the average rate is calculated as:
Average rate of change= 12
12 )()(
xx
xfxf
5.9.2. Challenges caused by incompetence in other mathematical topics
I also recommend that before learners are taught calculus teachers have to carry out a
diagnostic assessment to determine what learners know and do in topics such as
algebra, functions and mensuration (measurement). Candidates could not respond to
questions on the application of calculus in the Trial examination because they did not
know the formula for the area of a rectangle.
I recommend that teachers should do a rigorous or in-depth revision of mensuration or
measurement because this topic is last taught in Grade 11. A thoroughly planned
revision of mensuration before starting with the application of differential calculus
will remind learners of the formulae for surface area and the volume of shapes like
cones, prisms, spheres, etc.
Concepts such as algebraic manipulation, factorisation and skills in using a calculator
should be emphasised throughout the teaching of mathematics, not only in algebra.
5.9.3. Assessment of other mathematical strands
Tasks used for informal tasks (class work and homework) and textbooks must promote
conceptual thinking and test different mathematical strands.
223
If class work and homework are of a poor standard, they will not prepare candidates
to answer questions set for formal tasks (SBA) and examinations. I therefore
recommend that the Department of Basic Education must only approve textbooks that
promote conceptual thinking that is to say the questions for practice must help
learners to understand why something is done.
I also recommend to the Department of Basic Education and Umalusi to make sure
that the questions used in formal school-based assessment (SBA) task consist of
questions that will test the adaptive reasoning strand. Questions that were used in the
study mainly examined the conceptual understanding and procedural fluency strands.
224
REFERENCES
Abuja, O.P. 2006. World-class high quality mathematics education for all K-12 American
students. Department of Mathematical Sciences, Kent State University. [Online]
http://scholarworks.umt.edu/cgi/viewcontent.cgi?article=1051&context=tme (Accessed 11
January 2016).
Africa Check. 2014. Is SA bottom of the class in maths and science? WEF ranking is
meaningless.
https://africacheck.org/reports/is-sa-bottom-of-the-class-in-maths-and-science-why-
ranking-is-meaningless/ (Accessed 26 December 2015).
Anney, V.N. 2014. Ensuring the quality of the findings of qualitative research: looking at
trustworthiness criteria. Scholarlink Research Institute Journals, 2014 (ISSN-2141-6990).
http://jeteraps.scholarlinkresearch.com/articles/Ensuring%20the%20Quality%20of%20the
%20Findings%20of%20Qualitative%20Research%20NEW.pdf (Accessed 12 March
2015).
Applefield, J. M., Huber, R. & Moallem, M (nd). Constructivism in Theory and Practice:
Toward a better understanding. The University of North Carolina at Wilmington
http://people.uncw.edu/huberr/constructivism.pdf. Accessed date: 21 August 2016
Avenant, P.J. 1990. Guidelines for successful teaching (2nd edition). Butterworth’s.
Avong, H.N. 2013. Poor performance in mathematics among senior secondary school
students in Kaduna state: What’s to blame? JORIND 11(2) December, 2013. ISSN1596-
8303.
http://www.transcampus.org/JORINDV11Dec2013/Jorind%20Vol11%20No2%20Dec%2
0Chapter37.pdf. (Accessed 18 December 2015)
Bogdan, R.C. & Biklen, S.K. 2003. Qualitative research for education: An introduction to
theory and methods (4th edition). Syracuse University.
Bourne, M. (nd). Calculus – An introduction. [Online]
http://www.intmath.com/calculus/calculus-intro.php (Accessed 7 June 2016)
Bowen, G.A. 2009. Document analysis as a qualitative research method. Academia.
https://www.academia.edu/8434566/Document_Analysis_as_a_Qualitative_ResearMetho
d (Accessed 16 February 2016).
Brew, L. 2011. Mathematical activities and classroom-based factors that support senior high
school students’ mathematical performance. British Journal of Arts and Social Sciences
ISSN: 2046-9578, 2:1).
http://www.bjournal.co.uk/paper/bjass_2_1/bjass_02_01_02.pdf (Accessed 5 June 2015).
Brijlall, D. 2008. Collaborative learning in a multilingual class. Pythagoras, 68:52-61.
December 2008.
225
Brijlall, D. 2011. Error detection as mathematical catalyst Part 1. Learning and Teaching
Mathematics, 11:35-36.
Brijlall, D. 2012. Error detection as mathematical catalyst: Part 2. Learning and Teaching
Mathematics, 12:27-29.
Brijlall, D. & Ndlovu, Z. 2013. High school learners’ mental construction during solving
optimisation problems in calculus: A South African case study. South African Journal of
Education, 33(2).
http://www.scielo.org.za/scielo.php?pid=
S0256-01002013000200002&script=sci_arttext. (Accessed 4 October 2014).
Brown, J. & Skow, K. 2016. Mathematics: Identifying and addressing student errors.
http://iris.peabody.vanderbilt. edu/case studies/ics_matherr.pdf. (Accessed 12 August
2016).
Bryman, A. 2003. “Triangulation”. Encyclopedia of Social Science Research Methods, 2003.
SAGE Publications 8 Nov. 2011.
http://www.sagepub.com/chambliss4e/study/chapter/encyc_pdfs/4.2 Triangulation.pdf
(Accessed 15 March 2015).
Buckley, S. 2013. Deconstructing maths anxiety: Helping students to develop a positive
attitude towards learning maths. Australian Council for Educational Research
http://research.acer.edu.au/cgi/viewcontent.cgi?article=1016&context=learning_
processes (Accessed 4 May 2015).
Christie, A. (nd). Characteristics of constructivist learning & teaching. [sl]
http://www.cdli.ca/~elmurphy/emurphy/cle3.html. (Accessed 3 June 2015).
Cogan, L.S. & Schmidt, W.H. 1999. What we’ve learned from the TIMSS. Middle School
Math Reform. Middle Matters.
Creswell, J.W. 2014. Research design: Qualitative, quantitative, and mixed methods
approaches. (4th edition). SAGE.
Cubic graph and graph display. Cubic function explorer. Math Open Reference.
https://www.google.co.za/#q=how+to+draw+a+cubic+graph.(Accessed 27 April 2016).
Davidson, J. (nd). What is calculus?
http://www.sscc.edu/home/jdavidso/mathadvising/aboutcalculus.html.
Department of Basic Education. 2011. Curriculum and Policy Statement. Pretoria:
Department of Basic Education.
Department of Basic Education. 2014. Report on the Annual National Assessment of 2014:
Grades 1, 6 and 9. Department of Education. Republic of South Africa
http://www.saqa.org.za/docs/rep_annual/2014/REPORT%20ON%20THE%20ANA%20O
F%202014.pdf (Accessed 13 April 2015).
226
Department of Basic Education. 2016. 2015 National Senior Certificate Examination
Diagnostic Report. January 2016. Pretoria: Department of Basic Education.
Dubinsky, E. & McDonald, M. 2002. APOS: A constructivist theory of learning in
undergraduate mathematics education research
http://www.math.wisc.edu/~wilson/Courses/Math903/ICMIPAPE.PDF.
(Accessed 30 July 2015).
Education, Audiovisual and Culture Executive Agency. 2011. Mathematics in Education in
Europe: Common Challenges and National
Policies,http://eacea.ec.europa.eu/education/eurydice/documents/thematic_reports/132EN.
(Accessed date: 26 October 2017)
Eisenhart, M. 1991. Conceptual Framework for Research circa 1991: Idea from a cultural
anthropologist: Implications for Mathematics Education Researchers. Paper presented at
the Proceedings of the Thirteenth Annual Meeting North American Paper of the
International Group for the Psychology of Mathematics, Blacksburg, Virginia, USA.
http://nepc.colorado.edu/files/Eisenhart_ConceptualFrameworksforResearch.pdf
(Accessed 21 July 2016).
Etikan, I., Musa, S.A. & Alkassim, R.S. 2016. Comparison of convenience sampling and
purposive sampling. American Journal of Theoretical and Applied Statistics, 5(1):1-4.
http://article.sciencepublishinggroup.com/pdf/10.11648.j.ajtas.20160501.11.pdf
(Accessed 25 August 2016).
Feza, N. 2013. Inequities and lack of professionalisation of early childhood development
practice hinder opportunities for mathematics stimulation and realisation of South African
policy on quality education for all. Education and Skills Development.
Human Sciences Research Council, Pretoria, South Africa. International Journal of Inclusive
Education 2013.
https://www.academia.edu/7602910/13603116_2013 (Accessed 7 December 2015).
Frand, J. 2008. An Introduction to Singapore Math.
http://personal.anderson.ucla.edu/jason.frand/math_enrichment/SingaporeMath.ht.
(Accessed 26 December 2015).
Gravemeijer, K. & Doorman, M. 1999. Context problems in realistic mathematics education:
A calculus course as an example. Educational Studies in Mathematics (1999) 39: 111.
https://doi.org/10.1023/A:1003749919816
(Accessed date 23 October 2017)
Gray, A. (nd). Constructivist Teaching and Learning. SSTA Research Centre Report #97 –
07.
http://www.saskschoolboards.ca/old/ResearchAndDevelopment/ResearchReports/Instructi
on/97-07.htm (Accessed 2 June 2015).
227
Groves, S. 2012. Developing mathematical proficiency. Journal of Science and Mathematics
Education in Southeast Asia, 35(2):119-145.
http://www.recsam.edu.my/R&D_Journals/YEAR2012/dec2012vol-
2/susie%20groves%20119%20to145.pd (Accessed 22 April 2015).
Hein, G.E. 1991. Constructivist Learning Theory. Institute for Jarquim.
https://www.exploratorium.edu/education/ifi/constructivist-learning
(Accessed 3 June 2015).
Jacobs, B.M. 2005. Chapter 4: Research Design and Methodology. University of Pretoria.
http://repository.up.ac.za/dspace/bitstream/handle/2263/24200/02chapter4.pdf?sequence=
3&isAllowed=y (Accessed 25 August 2016).
Jojo, Z.M.M., Maharaj, A. & Brijlall, D. 2013. From human activity to conceptual
understanding of the chain rule. Journal of Research in Mathematics Education, 2(1):77-
99, doi: http//doi.dx.org/10.447/redimat.2013.21
Kilpatrick, J. 2009. The mathematics teacher and curriculum change. PNA, 3(3):107-
121.http://www.pna.es/Numeros2/pdf/Kilpatrick2009PNA3(3)TheMathematics.pdf.
(Accessed 26 March 2015).
Kilpatrick, J., Swartford, J. & Findell, B. 2001. Adding it up: Helping children to learn
mathematics. Chapter 4. Washington DC. National Academy Press 115-135
http://www.nap.edu/catalog/9822/adding-it-up-helping-children-learn-mathematics.
(Accessed 14/06/2015).
Klymchuk, S. 2012. Using counter-examples in teaching and learning of calculus: Students’
attitude and performance. Mathematics Teaching-Research Journal [Online]. Auckland
University of Technology, New Zealand.
http://www.hostos.cuny.edu/MTRJ/archives/volume5/volume5issue4full.pdf.
(Accessed 17 July 2015).
Knill, O. 2005. Pitfalls in teaching and learning calculus.
http://www.math.harvard.edu/~knill/pedagogy/calculus_pitfalls/pitfalls.pdf.
(Accessed 17 October/2014).
Kukogho, I.S. 2015. Mathematical Phobia. Pulse. http://pulse.ng/student/mathematical-
phobia-students-fail-math-because-many-teachers-are-not-well-trained-prof-
id3405539.html
(Accessed 3 January 2016).
Laal, M. & Laal, M. 2012. Collaborative learning: what is it?. Procedia - Social and
Behavioral Sciences 31 (2012) 491 – 495
http://www.sciencedirect.com/science/article/pii/S1877042811030217
(Accessed date 04 March 2017
Mail & Guardian. 2013. SA ranks its maths and science second last in the world.
http://www.news24.com/SouthAfrica/News/SA-has-worst-maths-science-education-in-
world-20140602. (Accessed 26 December 2015).
228
Maharaj, A. 2010. An APOS analysis of students’ understanding of the concept of a limit of a
function. Pythagoras: Journal of the Association for Mathematics Education in South
Africa. http://www.pythagoras.org.za/index.php/pythagoras/article/viewFile/6/6
Maharaj, A., Brijlall, D. & Narain, O.K. 2015. Improving proficiency in mathematics through
website-based tasks: A case of basic algebra. International Journal of Educational
Sciences 01/2015; 8(2):369-386.
Malan, S.P.T. 2000. The new paradigm of outcome-based education perspective. Journal of
Family Ecology and Consumer Service, Vol. 28. 2000.
http://www.ajol.info/index.php/jfecs/article/viewFile/52788/41390. (Accessed 18 April
2015).
Maseko, L., Van Lelyveld, K., De Beer, J., Kakoma, L. & Ramnarain, U. 2010. Towards
improving learner performance in the National Senior Certificate examination – Script
Analysis Research Report. University of Johannesburg.
Mastrull, S. 2002. The mathematics education of students in Japan: A comparison with
United States mathematics programs. Bristol Township School
www.cimm.ucr.ac.cr/ojs/index.php/eudoxus/article/download/371/372
(Accessed 17 December 2015).
Mata, M., Monteiro, V. & Peixoto, F. 2015. Attitudes towards mathematics: Effects of
individual, motivational, and social support factors. Child Development Research,
Volume 2012 (2012), Article ID 876028, 10 pages.
http://dx.doi.org/10.1155/2012/876028 (Accessed 12 January 2016).
Math Scoop, 2010. What is calculus?
http://www.mathscoop.com/calculus/what-is-calculus.php. (Accessed 11 December 2015).
Mbugua, Z.K., Kibet, K., Muthaa, G.M. & Nkonke, G.R. 2012. Factors Contributing to
Students’ Poor Performance in Mathematics at Kenya Certificate of Secondary Education
in Kenya: A Case of Baringo County, Kenya. American International Journal of
Contemporary Research, 2(6).
McLeod, S. 2014 Sampling Methods. Simply Psychology
http://www.simplypsychology.org/sampling.html. (Accessed 8 August 2016).
Mensah, J.K., Okyere M. & Kuranchie, A. 2013. Student attitude towards mathematics and
performance: Does the teacher attitude matter? Journal of Education and Practice. ISSN
2222-1735 (Paper) ISSN 2222-288X [Online] Vol. 4(3).
http://pakacademicsearch.com/pdf-files/edu/413/132-
139%20Vol%204,%20No%203%20(2013).pdf. (Accessed 17 April 2016).
Ministry of Education, Singapore. 2006. Secondary mathematics syllabus. Ministry of
Education Singapore. http://ncm.gu.se/media/kursplaner/andralander/singaporegym.pdf.
(Accessed 12 June 2015).
229
Monthienvichiencha, R. & Melis, E. 2006. Implementing courseware to support learning
through real-world erroneous examples: Students’ perceptions of tertiary courseware and
obstacles to implementing effective delivery through VLE.
https://www.google.co.za/#q=Use+of+erroneous+examples+by+Monthienvichien+and+M
elis (Accessed 4 January 2016).
Mosasia, A.M., Nakhanu, S.B. & Wekesa, W.D. 2012. Investigation of Factors That
Influence Syllabus Coverage in Secondary School Mathematics in Kenya. International
Journal of Humanities and Social Science Vol. 2 No. 15; August 2012.
https://www.academia.edu/1854079/Investigation_of_Factors_That_Influence_Syllabus_
Coverage_in_Secondary_School_Mathematics_in_Kenya. (Accessed 19 December 2015).
Mpumalanga Department of Education 2012 Intervention Guide, Mpumalanga Department of
Education.
Mpumalanga Department of Education 2013 Intervention Guide, Mpumalanga Department of
Education.
Mpumalanga Department of Education. 2014 Meeting of the MST Directorate with
Mathematics and Physical Science Teachers. MST Directorate. 26 February 2014.
Mpumalanga Department of Education 2017 Intervention Guide, Mpumalanga Department of
Education
Mpumalanga Department of Finance. 2014. Analysis of 2013 grade 12 & ANA Results in
Mpumalanga. Mpumalanga Provincial Government
http://finance.mpu.gov.za/documents/ea.2013.Gr12.ANA.ResultsAnalysis.MPG.pdf.
(Accessed 29/04/2015).
Mugisha, S. Goufo, D & Mogari, D. 2014. Analysis of the Performance of First Year
Students in Calculus. International Journal of Engineering Education Vol. 30, No. 5, pp.
1095–1109, 201
https://www.researchgate.net/publication/270898664_Analysis_of_the_Performance_of_F
irst_Year_Students_in_Calculus
Naidu-Hoffmeester, R. 2015. A strategy to address school maths and science problems.
February 5th, 2015 | Category: Lead, News
http://www.unisa.ac.za/news/index.php/2015/02/a-strategy-to-address-school-maths-and-
science-problems/ (Accessed 21 November 2015).
Ndlovu , Z. & Brijlall, D. 2015. Pre-service Teachers’ Mental Constructions of Concepts in
Matrix Algebra. African Journal of Research in Mathematics, Science and Technology
Education, DOl: 10,1080/10288457/2015.1028717
News 24. 2014. SA has worst maths, science education in world. 02 June 2014.
http://www.news24.com/SouthAfrica/News/SA-has-worst-maths-science-education-in-
world-20140602. (Accessed 26 December 2015).
O’Connell, B. 2009. The Dinaledi Schools Project.
http://www.eranet.co.za/zenex/files/384_Dinaledi%20Report.pdf.
230
(Accessed 17 May 2015).
Parrot, M. A. S. & Kwan Eu, L. 2014. Teaching and Learning Calculus in Secondary Schools
with the TI-Nspire. The Malaysian Online Journal of Educational Science Volume 2, Issue
1.
http://files.eric.ed.gov/fulltext/EJ1086249.pdf (Accessed 21 September 2015).
Parveva, T. Noorani, S. Ranguelov, S. Motiejunaite, A. & Kerpanova, V. 2011.
Mathematics Education in Europe: Common Challenges and National Policies
Education, Audiovisual and Culture Executive Agency
http://eacea.ec.europa.eu/education/eurydice/documents/thematic_reports/132en.pdf
(Accessed 3 September 2016).
Ramlia, F. Shafie, N. Tarmizia, R.A. 2013. Exploring Students’ in-depth Learning
Difficulties in Mathematics through Teachers’ Perspective Procedia - Social and
Behavioral Sciences 97 (2013) 339 – 345.
http://ac.els-cdn.com/S1877042813036884/1-s2.0-S1877042813036884-
main.pdf?_tid=0e47db00-a5d3-11e5-b75c-
00000aab0f6b&acdnat=1450476340_5288b1b40178804f758d52470ce5886c.
(Accessed 18 December 2015).
Reddy V., Van der Berg S,. Janse van Rensburg D. & Taylor S. 2012. Educational outcomes:
Pathways and performance in South African high schools. S Afr J Sci. 2012; 108(3/4),
Art. #620, 8 pages. http://www.sajs.co.za/educational-outcomes-pathways-and-
performance-south-african-high-schools/reddy-vijay-van-der-berg-servaas-janse.
(Accessed 31 December 2015).
Ruddock G, 1998. Mathematics in the school Curriculum an International Perspective
https://www.nfer.ac.uk/research/centre-for-information-and-
reviews/inca/TP%20Mathematics%20in%20the%20School%20Curriculum%201998.pdf.
(Accessed 10 January 2016).
Sabella, Mel S. & Redish, E.F. (nd). Student understanding of topics in calculus. Physics
Education Research Group.
http://www.physics.umd.edu/perg/plinks/calc.htm. (Accessed 9 July 2015).
Salzberg, S. 2014. Should we stop teaching calculus in high school? Forbes, 17 July 2014.
http://www.forbes.com/sites/stevensalzberg/2014/07/17/should-we-stop-teaching-
calculus-in-high-school/ (Accessed 24 December 2015).
SANGONET 2011. Improving mathematics performance in schools.
http://www.ngopulse.org/article/improving-mathematics-performance-schools
(Accessed 20 November 2015).
Schechter, E. 2009. The most common errors in undergraduate mathematics. Math Forum
Internet Mathematics Library.
http://www.math.vanderbilt.edu/~schectex/commerrs/ (Accessed 12 July 2015).
Schenkel, B. 2009. The impact of an attitude towards mathematics on mathematics
performance. Marietta College. http/etd.ohiolink.edu. (Accessed 11 May 2015).
231
Schwartz, J.E. 2010. A distinction between conceptual knowledge and procedural knowledge.
Pearson Allyn Bacon Prentice Hall.
http://www.education.com/reference/article/distinction-conceptual-procedural-math/
(Accessed 16 May 2015).
Science. 1988. Calculus: Crisis looms in mathematics’ future. Science 21 March 1988. Vol.
239 no. 4847:1491–1492. Research News.
http://www.sciencemag.org/content/239/4847/1491.extract (Accessed 12 July 2015).
Sila, M.P. 2014. Factors influencing students’ performance in mathematics in Kenya
certificate of secondary education (KCSE); A case of Kathonzweni District in Makueni
County, Kenya.
http://erepository.uonbi.ac.ke:8080/bitstream/handle/11295/73558/Sila,%20Makau%20Pat
rick%20%20_%20Factors%20influencing%20students%E2%80%99%20performance%20
in%20mathematics%20in%20Kenya%20certificate%20of%20secondary%20education%2
0(KCSE)?sequence=1&isAllowed=y. (Accessed 17 March 2016).
Simon, M.A. 1995. Reconstructing mathematics pedagogy from a constructivist perspective.
Journal for Research in Mathematics Education. 1995, 26(2):114-115.
Siyepu, S. 2013. The zone of proximal development in the learning of mathematics. South
African Journal of Education, 33(2).
Smith, K. 2013. Maths made easy: A comprehensive guide to Grade 12 mathematics. Maths
Handbook and Study Guide.
Speiser, M. 2015. The 10 smartest countries based on math and science. Business Insider.
http://www.businessinsider.com/the-10-smartest-countries-based-on-math-and-science-
2015-5 (Accessed 29 December 2015).
Strauss, A. & Corbin, J. 1990. Basics of qualitative research: Techniques and procedures for
developing grounded theory. (2nd edition).
http://www.li.suu.edu/library/circulation/Stein/Comm%206020ksStraussCorbinBasicsQua
litativeFall07.pdf (Accessed 24 July 2016).
Suh, J.M. 2007. Tying it all together: Classroom practices that promote mathematical
proficiency for all students. Teaching Children Mathematics, October 2007.
http://mason.gmu.edu/~jsuh4/tenure/part4thru8/papers/Tying_It_All_Together.pdf.
(Accessed 13 December 2015).
Swan, M. 2005. Standards unit. Improving learning in mathematics: Challenges and
strategies. Department for Education and Skills. Success for All.
https://www.ncetm.org.uk/public/files/224/improving_learning_in_mathematicsi.pdf.
(Accessed 11 January 2015).
Sze, T.W. 2009. Education in Singapore: Mathematics. National Library Singapore.
Singapore Infopedia.
http://eresources.nlb.gov.sg/infopedia/index/articles/SIP_1599_2009-10-31.html.
(Accessed 20 April 2015).
232
Tachie, S.A. & Chireshe, R. 2013. Learners’ attributions on mathematics failure. Stud Tribes
Tribal II(1):67-73 (2013) (Accessed 29 May 2015).
Tall, D. 1992. Students’ difficulties in calculus. Plenary presentation in Working Group 3,
ICME, Québec, August 1992. David Tall Mathematics Education Research Centre
University of Warwick. http://homepages.warwick.ac.uk/staff/David.Tall/pdfs/dot1993k-
calculus-wg3-icme.pdf (Accessed 27 January 2016).
Taylor, N. 2008. What’s working in school development. Jet Educational Services.
http://www.eranet.co.za/zenex/files/359_Taylor,%202008%20b.pdf
(Accessed 30 December 2015).
Teach n’ Kids Learn. 2015. 5 reasons why students benefit from a problem-centred class.
Teach n’ Kids Learn Inc.
http://teachnkidslearn.com/5-reasons-why-students-benefit-from-a-problem-centered-class
(Accessed 4 June 2015).
Trends in International Mathematics and Science Study. 2011. Highlights from TIMSS 2011.
The South African Perspective.
http://www.hsrc.ac.za/uploads/pageContent/2929/TIMSSHighlights2012Dec7final.pdf
(Accessed 8 June 2015).
Trends in International Mathematics and Science Study 2011. International Results in
Mathematics (Chapter 1). International Student Achievement in mathematics
http://timss.bc.edu/timss2011/downloads/T11_IR_M_Chapter1.pdf
(Accessed 5 January 2016).
Tziritas, M. 2011. APOS theory as a framework to study the conceptual stages of related rates
problems. Concordia University
http://spectrum.library.concordia.ca/36027/1/Tziritas_MTM_F2011.pdf. (Accessed
01/08/2015).
Umameh, M.A. 2011 A survey of factors responsible for students’ poor performance in
mathematics in Senior Secondary School Certificate Examination (SSSCE) In Idah Local
Government Area Of Kogi State, Nigeria. University Of Benin, Benin City, Nigeria.
https://www.researchgate.net/publication/274069472_a_survey_of_factors_responsible_fo
r_students_poor_performance_in_mathematics_in_senior_secondary_school_certificate_e
xamination_ssce_in_idah_local_government_area_of_kogi_state_nigeria (Accessed
8 January 2016).
Van der Walt, M., Maree. K. & Ellis, S. 2008. A mathematics vocabulary questionnaire for
use in the intermediate phase. South African Journal of Education, 28:489-504
www.ajol.info/index.php/saje/article/download/25170/4369.
(Accessed 8 December/2015).
White, P. & Mitchelmore, M. 1996. Conceptual knowledge in introductory calculus. Journal
for Research in Mathematics Education, Vol. 27, No. 1 (Jan. 1996), pp. 79-95. National
Council of Teachers of Mathematics
233
https://www.researchgate.net/publication/237302997_Conceptual_Knowledge_in_Introdu
ctory_Calculus. (Accessed 19 June 2016).
Woolfolk, A. 2007. Educational Psychology. Global Edition. Eleventh Edition. Boston:
Pearson Education, Inc.
Yeasmin, S. & Rahman, K.F. 2012. Triangulation research method as the tool of social
science research. BUP Journal, Volume 1, Issue 1, September 2012, ISSN: 2219-4851
http://www.bup.edu.bd/journal/154-163.pdf
(Accessed 17 February 2017).
Zhang, B. 2003. Using student-centred teaching strategies in calculus. The China Papers, July
2003 http://science.uniserve.edu.au/pubs/china/vol2/biaozhang.pdf. (Accessed 18 April
2015).
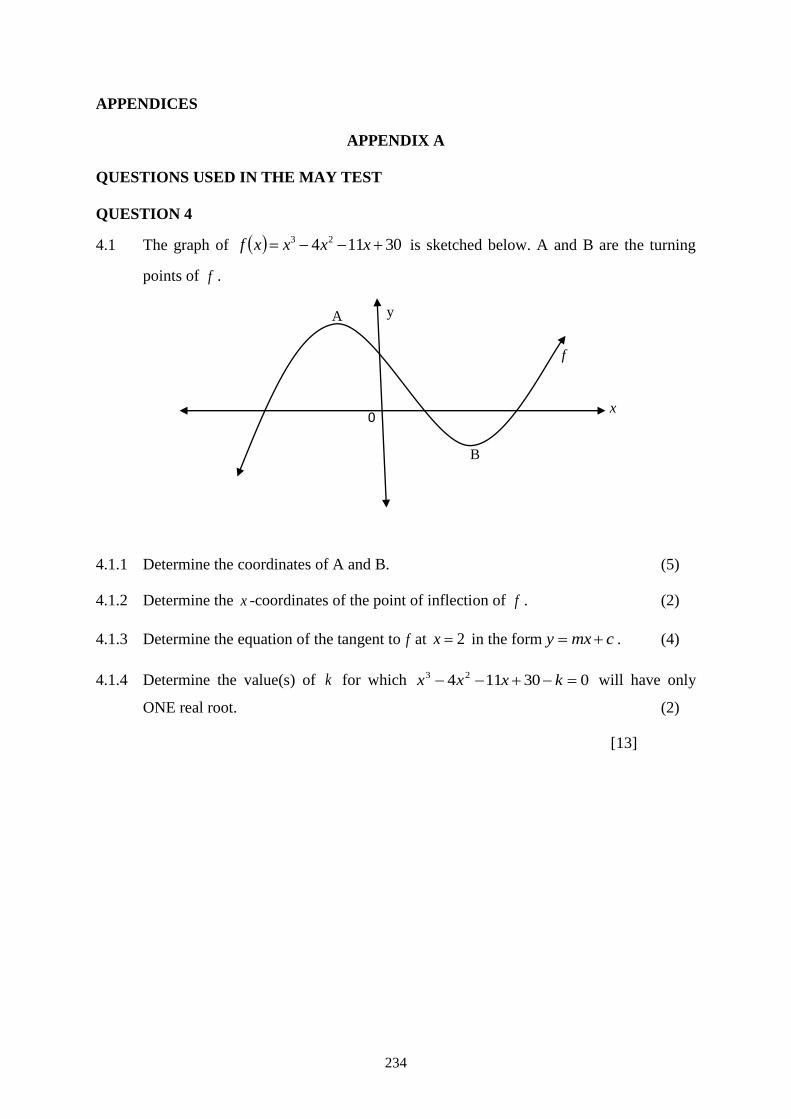
234
APPENDICES
APPENDIX A
QUESTIONS USED IN THE MAY TEST
QUESTION 4
4.1 The graph of 30114 23 xxxxf is sketched below. A and B are the turning
points of f .
4.1.1 Determine the coordinates of A and B. (5)
4.1.2 Determine the x -coordinates of the point of inflection of f . (2)
4.1.3 Determine the equation of the tangent to f at 2x in the form cmxy . (4)
4.1.4 Determine the value(s) of k for which 030114 23 kxxx will have only
ONE real root. (2)
[13]
y
f
x 0
A
B
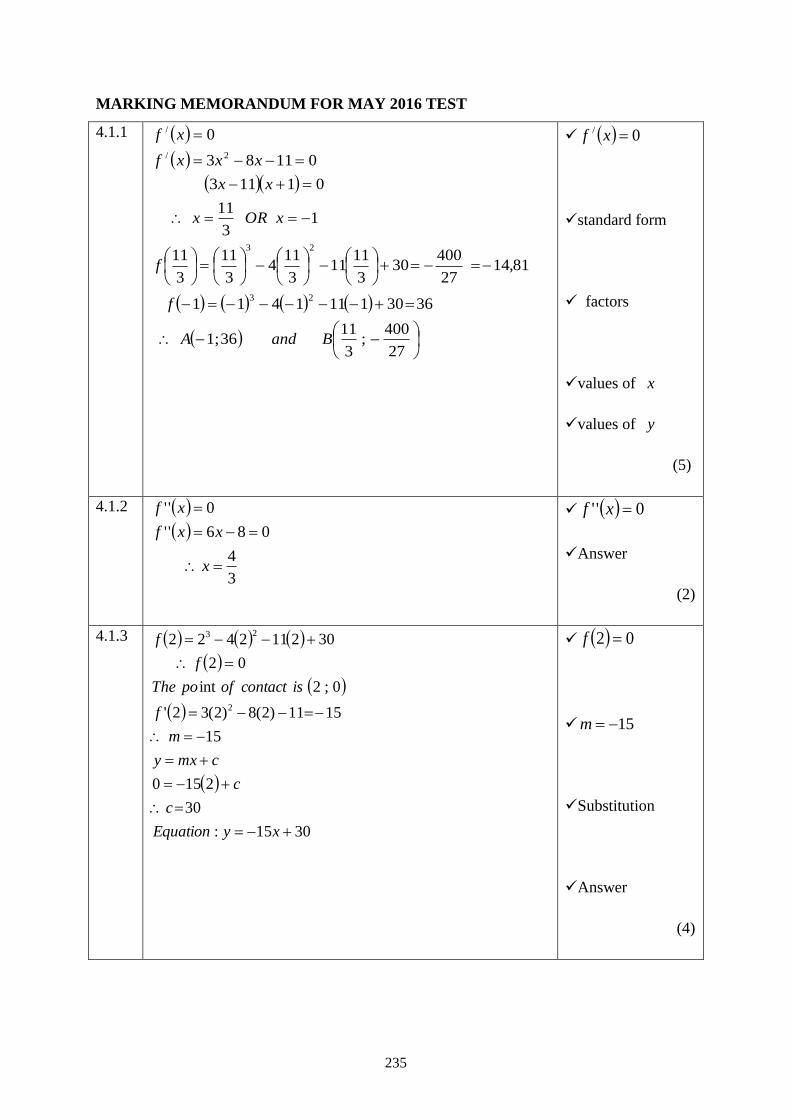
235
MARKING MEMORANDUM FOR MAY 2016 TEST
4.1.1
27
400;
3
1136;1
36301111411
81,1427
40030
3
1111
3
114
3
11
3
11
13
11
01113
01183
0
23
23
2/
/
BandA
f
f
xORx
xx
xxxf
xf
0/ xf
standard form
factors
values of x
values of y
(5)
4.1.2
3
4
086''
0''
x
xxf
xf
0'' xf
Answer
(2)
4.1.3
3015:
30
2150
15
1511)2(8)2(32'
0;2int
02
302112422
2
23
xyEquation
c
c
cmxy
m
f
iscontactofpoThe
f
f
02 f
15m
Substitution
Answer
(4)
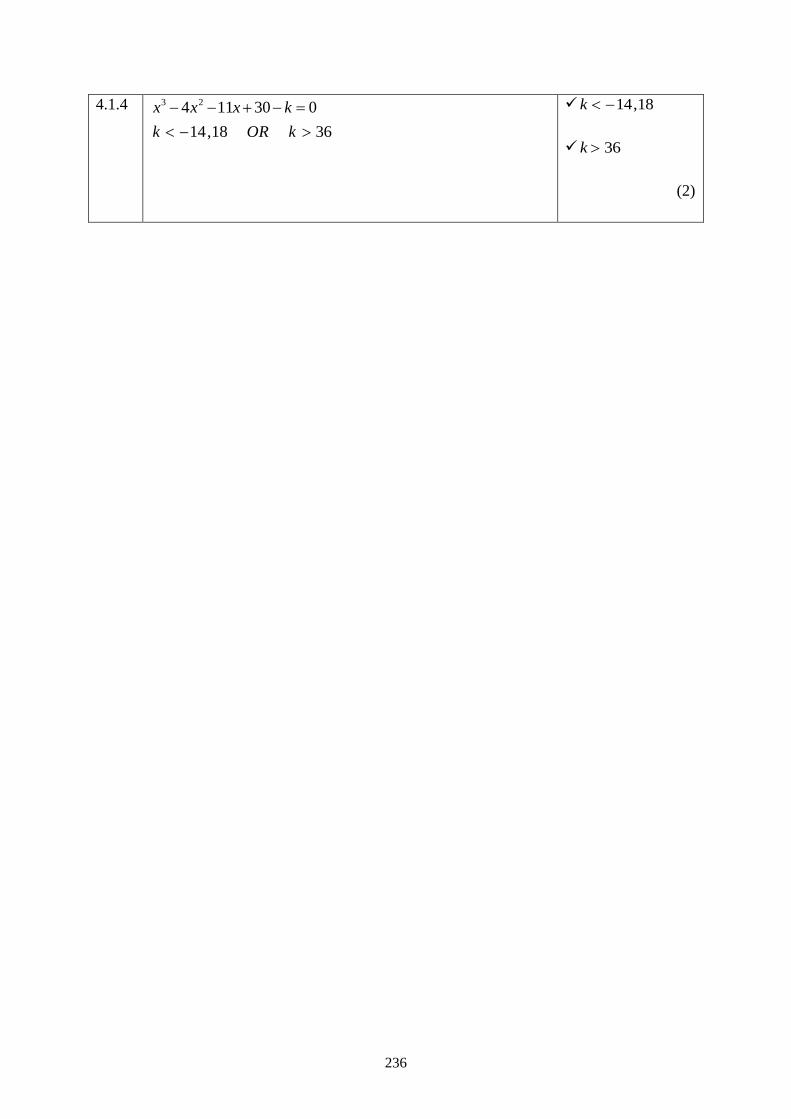
236
4.1.4
3618,14
030114 23
kORk
kxxx
18,14k
36k
(2)
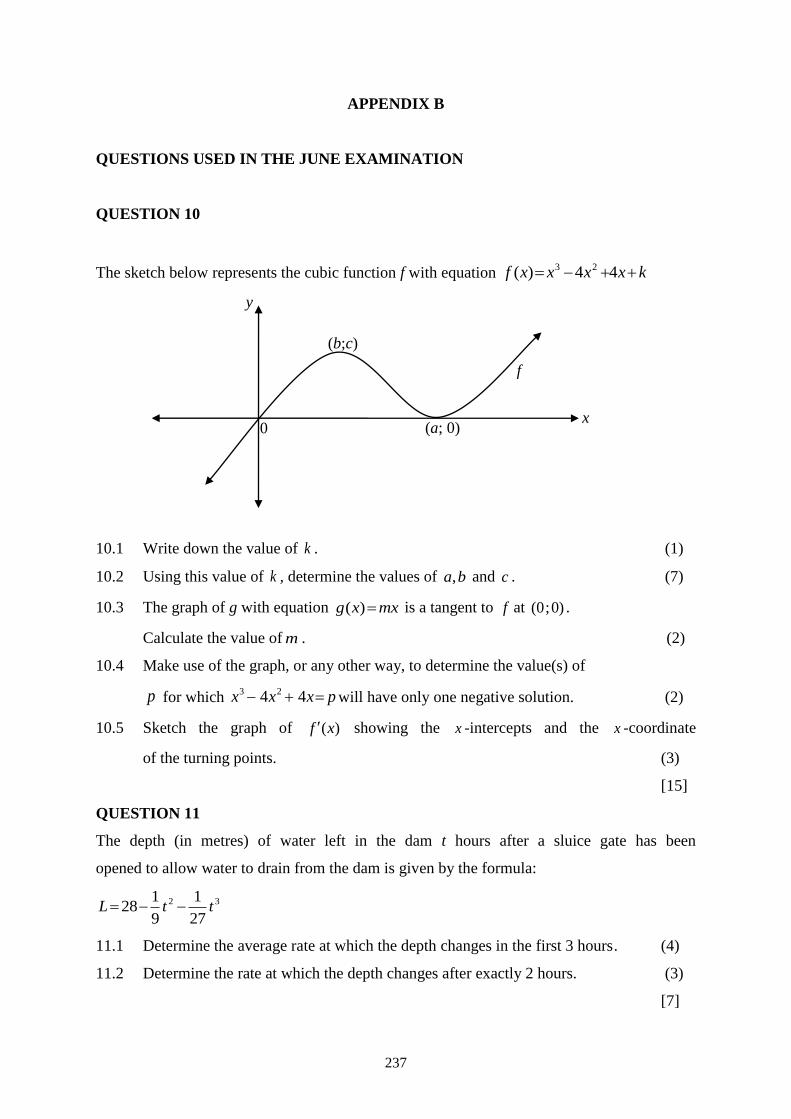
237
APPENDIX B
QUESTIONS USED IN THE JUNE EXAMINATION
QUESTION 10
The sketch below represents the cubic function f with equation kxxxxf 44)( 23
10.1 Write down the value of k . (1)
10.2 Using this value of k , determine the values of ba, and c . (7)
10.3 The graph of g with equation mxxg )( is a tangent to f at )0;0( .
Calculate the value of m . (2)
10.4 Make use of the graph, or any other way, to determine the value(s) of
p for which pxxx 44 23will have only one negative solution. (2)
10.5 Sketch the graph of )(xf showing the x -intercepts and the x -coordinate
of the turning points. (3)
[15]
QUESTION 11
The depth (in metres) of water left in the dam t hours after a sluice gate has been
opened to allow water to drain from the dam is given by the formula:
32
27
1
9
128 ttL
11.1 Determine the average rate at which the depth changes in the first 3 hours . (4)
11.2 Determine the rate at which the depth changes after exactly 2 hours. (3)
[7]
x
y
(b;c)
f
0 (a; 0)
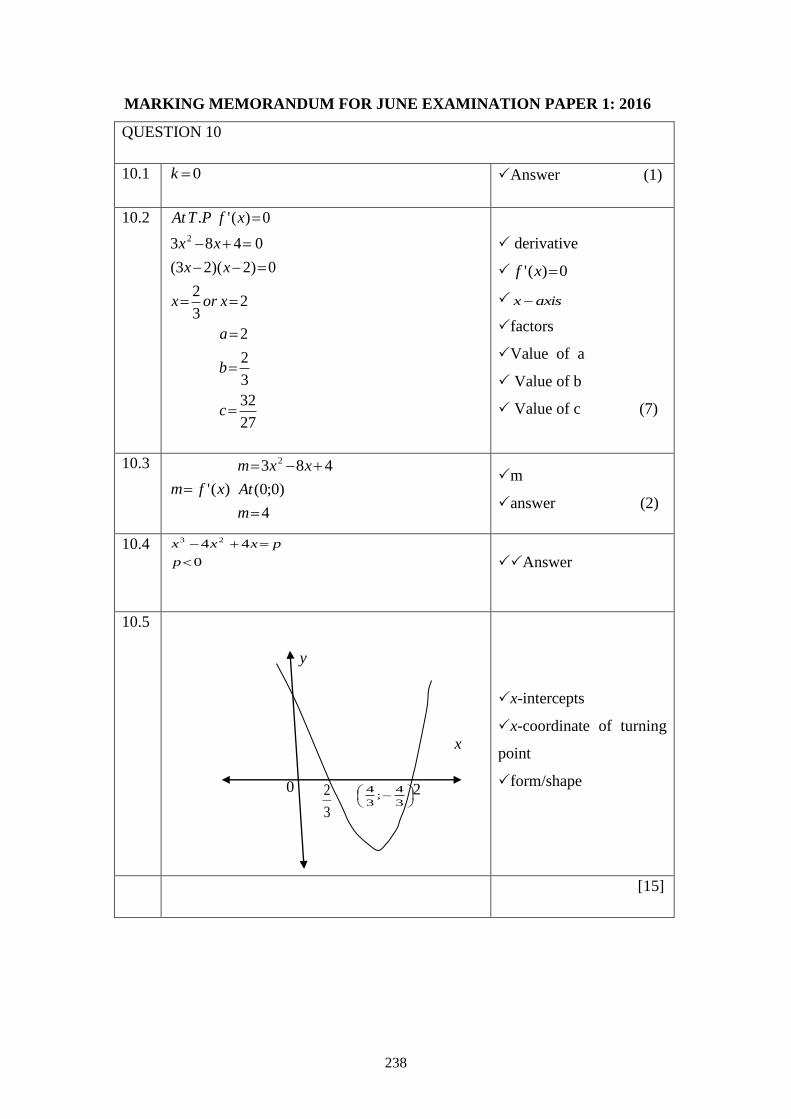
238
MARKING MEMORANDUM FOR JUNE EXAMINATION PAPER 1: 2016
QUESTION 10
10.1 0k Answer (1)
10.2
27
32
3
2
2
23
2
0)2)(23(
0483
0)('.
2
c
b
a
xorx
xx
xx
xfPTAt
derivative
0)(' xf
axisx
factors
Value of a
Value of b
Value of c (7)
10.3
)(' xfm
4
)0;0(
483 2
m
At
xxm
m
answer (2)
10.4 0
44 23
p
pxxx
Answer
10.5
x-intercepts
x-coordinate of turning
point
form/shape
[15]
0 2
3
2
y
x
3
4;
3
4
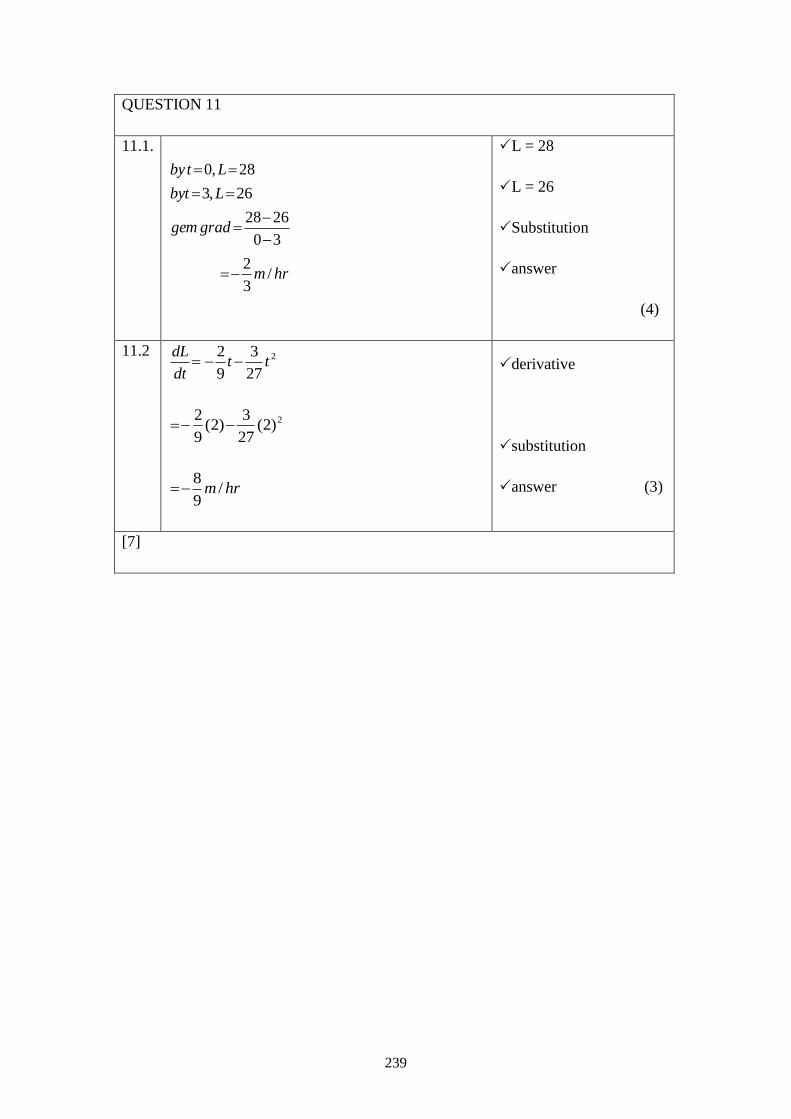
239
QUESTION 11
11.1.
hrm
gradgem
Lbyt
Ltby
/3
2
30
2628
26,3
28,0
L = 28
L = 26
Substitution
answer
(4)
11.2 2
27
3
9
2tt
dt
dL
2)2(27
3)2(
9
2
hrm /9
8
derivative
substitution
answer (3)
[7]
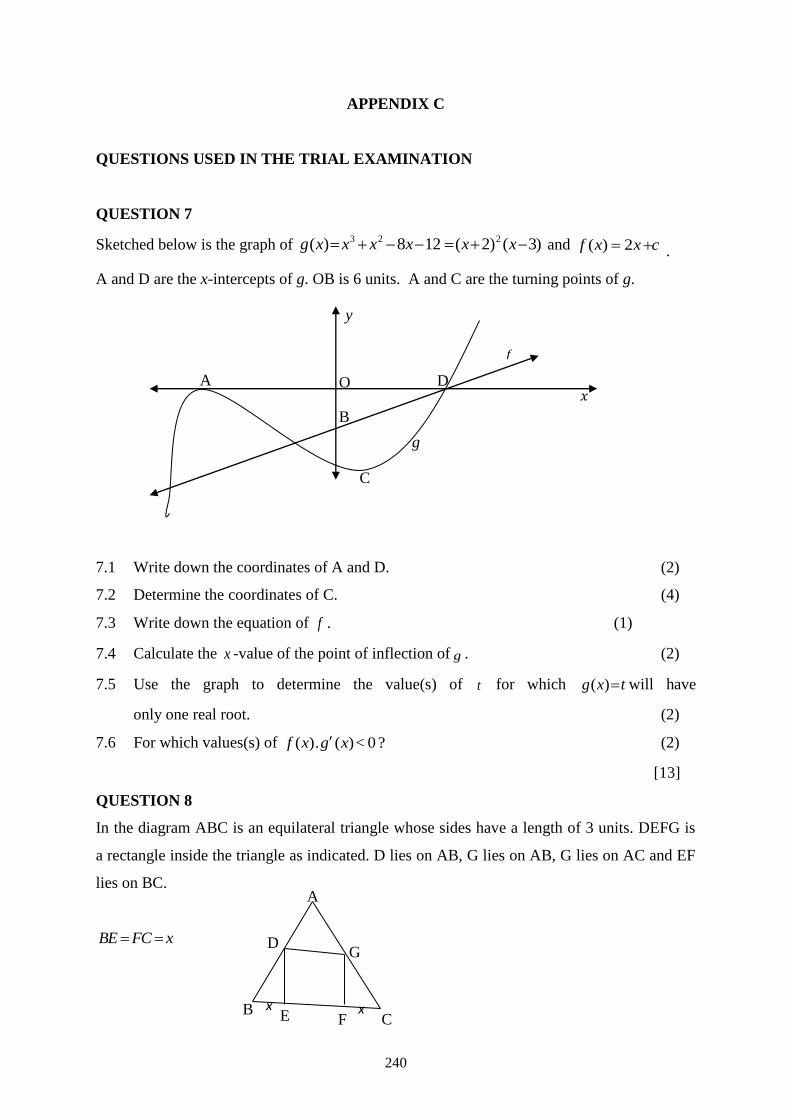
240
APPENDIX C
QUESTIONS USED IN THE TRIAL EXAMINATION
QUESTION 7
Sketched below is the graph of )3()2(128)( 223 xxxxxxg and cxxf 2)( .
A and D are the x-intercepts of g. OB is 6 units. A and C are the turning points of g.
7.1 Write down the coordinates of A and D. (2)
7.2 Determine the coordinates of C. (4)
7.3 Write down the equation of f . (1)
7.4 Calculate the x -value of the point of inflection of g . (2)
7.5 Use the graph to determine the value(s) of t for which txg )( will have
only one real root. (2)
7.6 For which values(s) of ? 0 <)(.)( xgxf (2)
[13]
QUESTION 8
In the diagram ABC is an equilateral triangle whose sides have a length of 3 units. DEFG is
a rectangle inside the triangle as indicated. D lies on AB, G lies on AB, G lies on AC and EF
lies on BC.
g
𝑥
f
O D A
C
B
y
B C E F
A
D G
x x
xFCBE
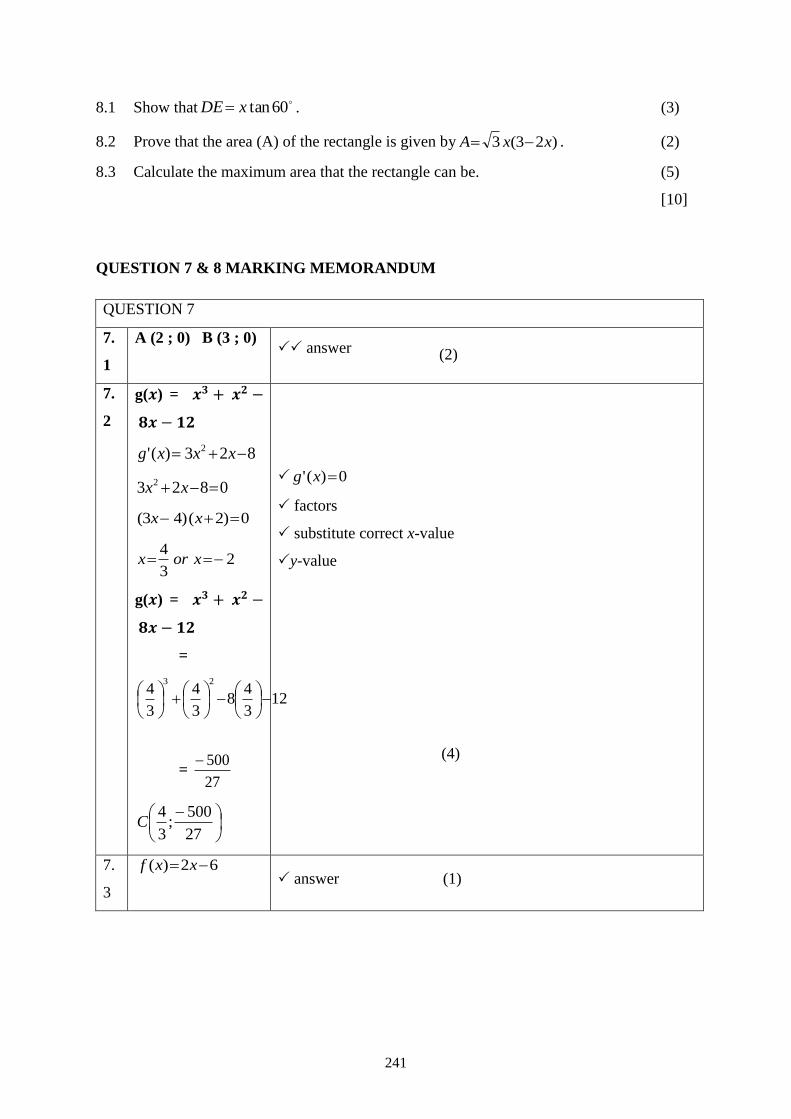
241
8.1 Show that60tanxDE . (3)
8.2 Prove that the area (A) of the rectangle is given by )23(3 xxA . (2)
8.3 Calculate the maximum area that the rectangle can be. (5)
[10]
QUESTION 7 & 8 MARKING MEMORANDUM
QUESTION 7
7.
1
A (2 ; 0) B (3 ; 0) answer (2)
7.
2
g(𝒙) = 𝒙𝟑 + 𝒙𝟐 −
𝟖𝒙 − 𝟏𝟐
823)(' 2 xxxg
0823 2 xx
0)2()43( xx
23
4 xorx
g(𝒙) = 𝒙𝟑 + 𝒙𝟐 −
𝟖𝒙 − 𝟏𝟐
=
123
48
3
4
3
423
= 27
500
27
500;
3
4C
0)(' xg
factors
substitute correct x-value
y-value
(4)
7.
3
62)( xxf answer (1)
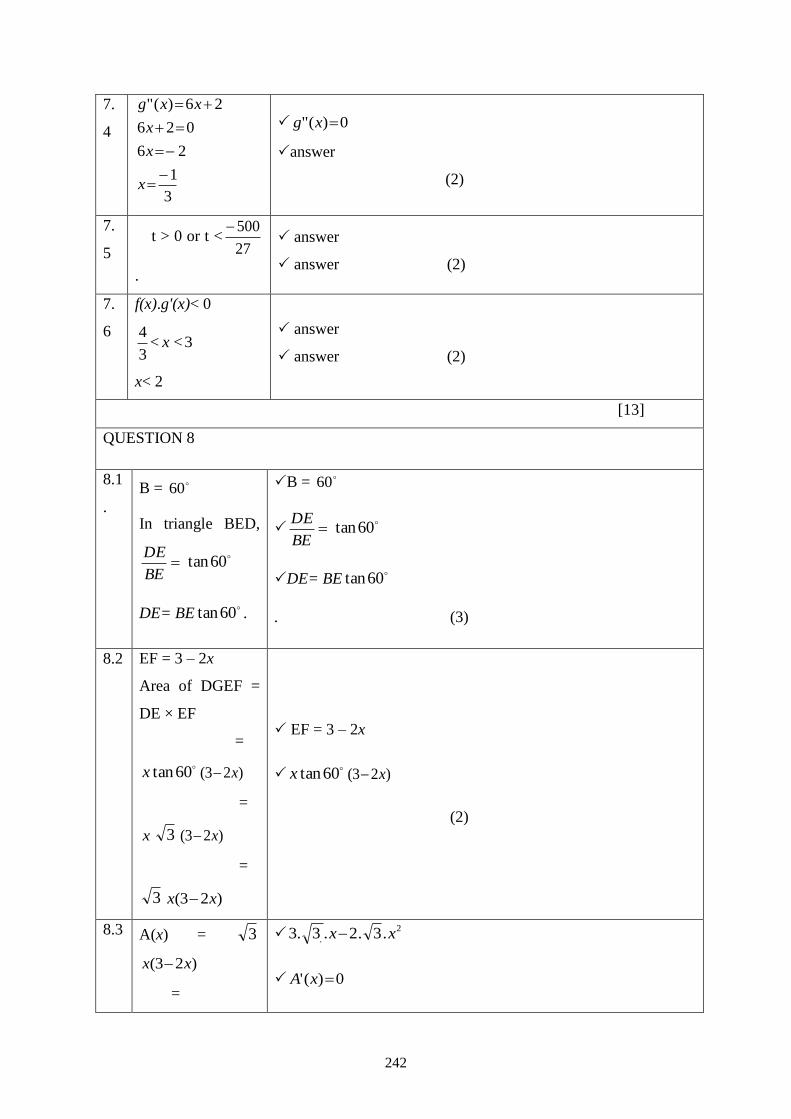
242
7.
4
3
1
26
026
26)("
x
x
x
xxg
0)(" xg
answer
(2)
7.
5 t > 0 or t <
27
500
.
answer
answer (2)
7.
6
f(x).g'(x)< 0
3<<3
4x
x< 2
answer
answer (2)
[13]
QUESTION 8
8.1
.
B = 60
In triangle BED,
BE
DE 60tan
DE= BE60tan .
B = 60
BE
DE 60tan
DE= BE60tan
. (3)
8.2 EF = 3 – 2x
Area of DGEF =
DE × EF
=
60tanx )23( x
=
x 3 )23( x
=
3 )23( xx
EF = 3 – 2x
60tanx )23( x
(2)
8.3 A(x) = 3
)23( xx
=
2
. .3.2.3.3 xx
0)(' xA
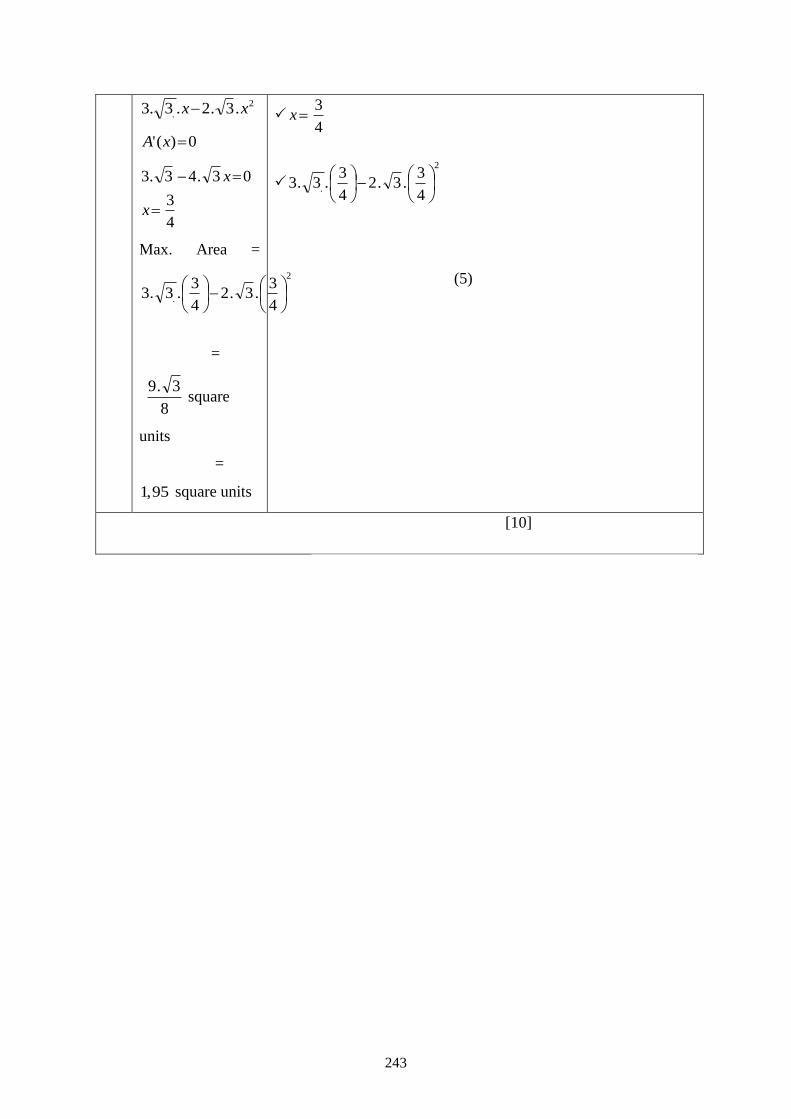
243
2
. .3.2.3.3 xx
0)(' xA
4
3
03.43.3
x
x
Max. Area =
2
.4
3.3.2
4
3.3.3
=
8
3.9square
units
=
95,1 square units
4
3x
2
.4
3.3.2
4
3.3.3
(5)
[10]
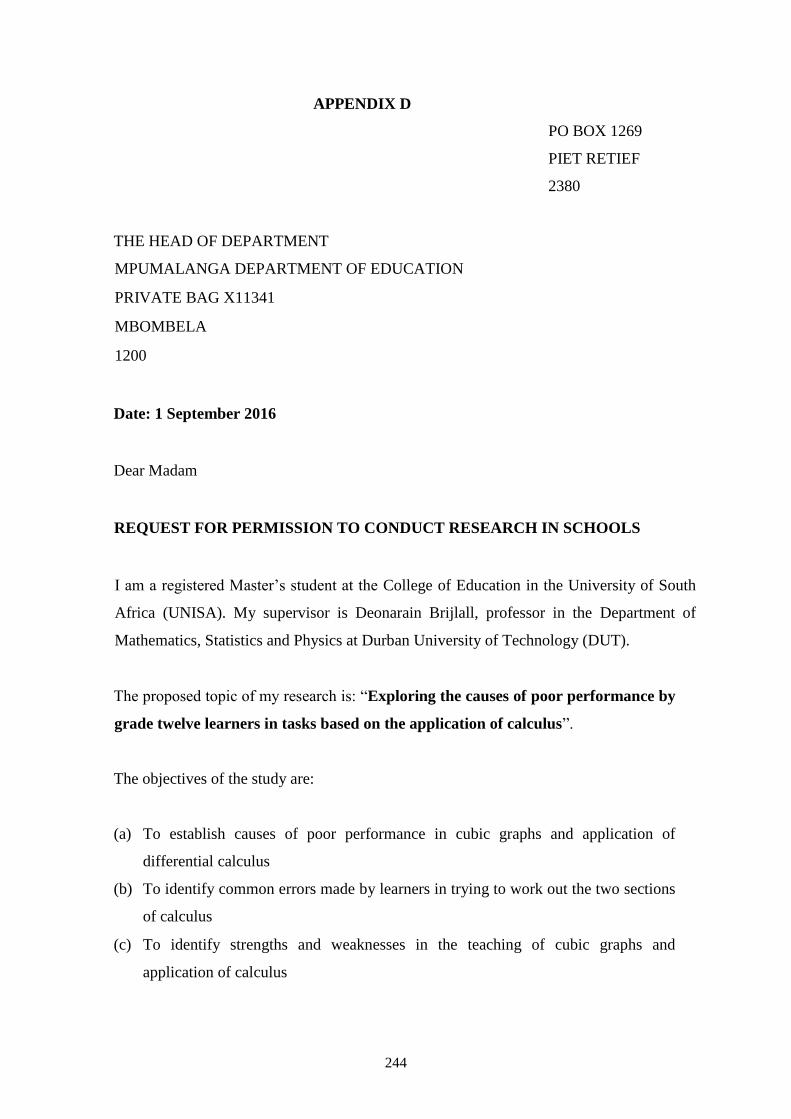
244
APPENDIX D
PO BOX 1269
PIET RETIEF
2380
THE HEAD OF DEPARTMENT
MPUMALANGA DEPARTMENT OF EDUCATION
PRIVATE BAG X11341
MBOMBELA
1200
Date: 1 September 2016
Dear Madam
REQUEST FOR PERMISSION TO CONDUCT RESEARCH IN SCHOOLS
I am a registered Master’s student at the College of Education in the University of South
Africa (UNISA). My supervisor is Deonarain Brijlall, professor in the Department of
Mathematics, Statistics and Physics at Durban University of Technology (DUT).
The proposed topic of my research is: “Exploring the causes of poor performance by
grade twelve learners in tasks based on the application of calculus”.
The objectives of the study are:
(a) To establish causes of poor performance in cubic graphs and application of
differential calculus
(b) To identify common errors made by learners in trying to work out the two sections
of calculus
(c) To identify strengths and weaknesses in the teaching of cubic graphs and
application of calculus
245
(d) To come out with proper intervention programmes that will lead to good
performance
(e) To improve the overall performance in Mathematics as a subject
I earnestly request you to accord me an opportunity to conduct a research in three
schools at Gert Sibande, in Mpumalanga Province and also be given the permission to
make use of the learners’ marked photocopied scripts for the three formal tasks, namely
the 2016 May Test, June and Trial Examinations. The following three schools have
been selected through purposive sampling:
1. Ligbron Academy
2. Ithafa Secondary
3. Reggie Masuku Secondary
Msukaligwa 1 Circuit was chosen because it is performing. That is to say the average pass
percentage in the last five years in mathematics is above 60%. Also the circuit can provide
the study with data from three different types of schools. In Msukaligwa 1, one can get a
former Model C school, a Mathematics, Science, and Technology Academy (MSTA) and
an ordinary school that does not belong to the two already mentioned categories.
Students have difficulties in learning and mastering this section of Calculus as it is
revealed by examiners’ and moderators’ reports year after year. The purpose of this study
is to investigate the possible reasons for the poor performance by Grade 12 learners in
Calculus based tasks, especially in the cubic graphs and application in optimisation. It is
hoped that this study will be able to identify the possible causes of poor performance and
come out with proper interventions to address the challenges faced by learners when doing
Calculus.
The study is not going to disturb teaching and learning in the schools as it will collect data
from the Grade 12 learners’ scripts for May Test, June and Trial Examinations. Teachers
will be asked to make copies of these tasks. Only the questions covering Cubic graphs and
Application of Differential Calculus will be used in the study. The researcher will analyse
learners’ scripts to find out how do they respond to these questions.
246
Should you require any further information, please do not hesitate to contact me or my
supervisor. Our contact details are as follows:
Person to contact Cell Telephone Email address
Mr. R.B. Dlamini
(Student)
078 241 3651 017 826 5703 30721709 @mylife.unisa.ac.za
Prof. D. Brijlall
(Supervisor)
083 555 2390 031 573 2126 [email protected]
The benefit of this study will be its contribution in improving learners’ performance in
Calculus. This is because once the causes of poor performance in Calculus have been
identified, it will be easier to come out with strategies that will overcome the challenges.
Therefore, this study will be beneficial to the learners, teachers and to the Department of
Education.
There is no potential risk that may cause harm or discomfort to the participants as they
will write the assessment during regular classroom activities. The researcher will not be at
the schools during writing, he will only come after tasks have been marked by the teachers
and ask for copies of learners’ responses to questions involving the two subtopics of
Calculus mentioned earlier. Already the 2016 May Test and June examination have been
written, only the Trial examination is remaining. It will be written in September.
Once permission is granted, correspondence will be then sent to the District Director,
Circuit Manageress of Msukaligwa 1 and Principals of the selected schools to ask for
permission to conduct this study. Also consent from parents and assent from learners will
be requested before the study can be conducted.
Feedback procedure will entail providing you and the schools participating in the study
with bound copies of the dissertation.
Your permission to conduct this study will be greatly appreciated.
Yours sincerely
Reuben Bafana Dlamini (Mr)
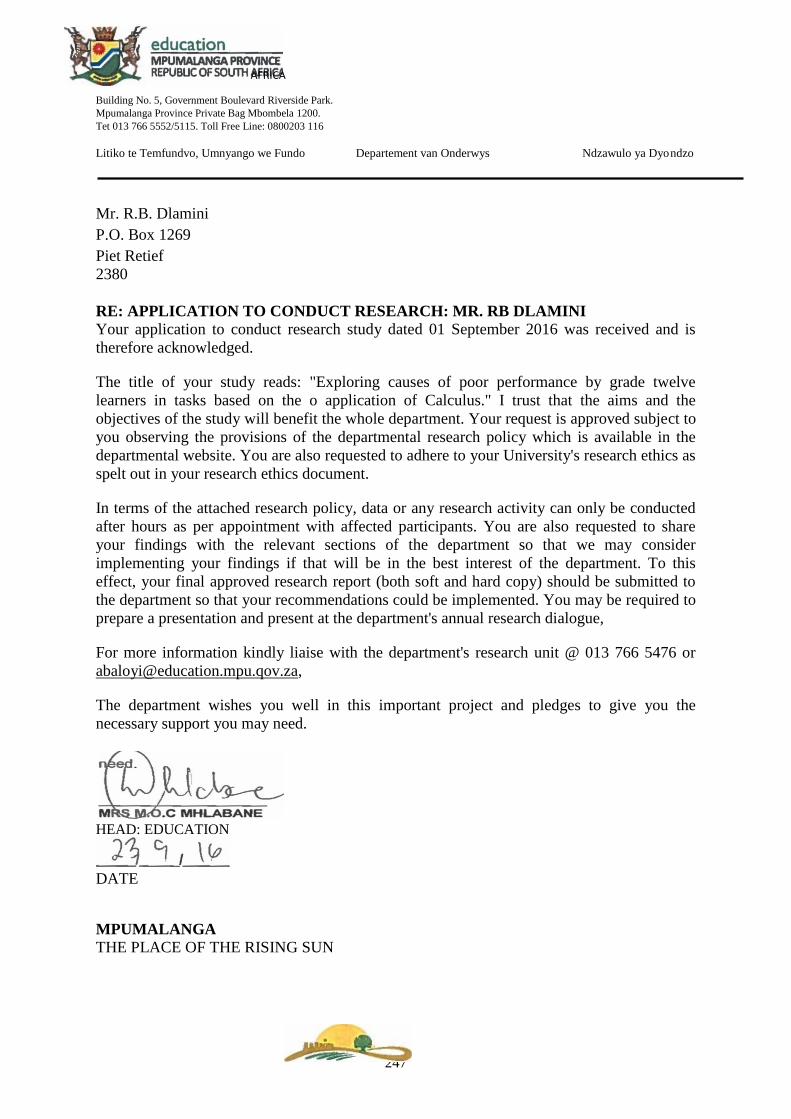
247
Building No. 5, Government Boulevard Riverside Park.
Mpumalanga Province Private Bag Mbombela 1200.
Tet 013 766 5552/5115. Toll Free Line: 0800203 116
Litiko te Temfundvo, Umnyango we Fundo Departement van Onderwys Ndzawulo ya Dyondzo
Mr. R.B. Dlamini
P.O. Box 1269
Piet Retief
2380
RE: APPLICATION TO CONDUCT RESEARCH: MR. RB DLAMINI
Your application to conduct research study dated 01 September 2016 was received and is
therefore acknowledged.
The title of your study reads: "Exploring causes of poor performance by grade twelve
learners in tasks based on the o application of Calculus." I trust that the aims and the
objectives of the study will benefit the whole department. Your request is approved subject to
you observing the provisions of the departmental research policy which is available in the
departmental website. You are also requested to adhere to your University's research ethics as
spelt out in your research ethics document.
In terms of the attached research policy, data or any research activity can only be conducted
after hours as per appointment with affected participants. You are also requested to share
your findings with the relevant sections of the department so that we may consider
implementing your findings if that will be in the best interest of the department. To this
effect, your final approved research report (both soft and hard copy) should be submitted to
the department so that your recommendations could be implemented. You may be required to
prepare a presentation and present at the department's annual research dialogue,
For more information kindly liaise with the department's research unit @ 013 766 5476 or
The department wishes you well in this important project and pledges to give you the
necessary support you may need.
HEAD: EDUCATION
DATE
MPUMALANGA
THE PLACE OF THE RISING SUN
AFRICA
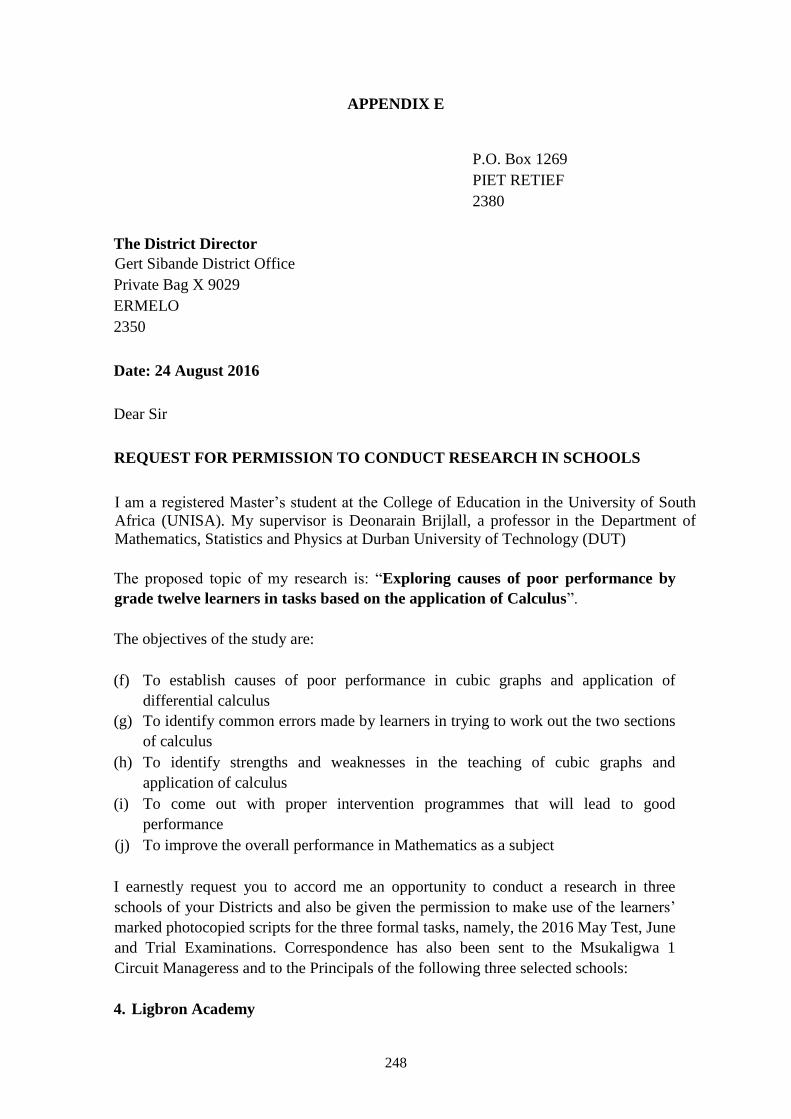
248
APPENDIX E
P.O. Box 1269
PIET RETIEF
2380
The District Director
Gert Sibande District Office
Private Bag X 9029
ERMELO
2350
Date: 24 August 2016
Dear Sir
REQUEST FOR PERMISSION TO CONDUCT RESEARCH IN SCHOOLS
I am a registered Master’s student at the College of Education in the University of South
Africa (UNISA). My supervisor is Deonarain Brijlall, a professor in the Department of
Mathematics, Statistics and Physics at Durban University of Technology (DUT)
The proposed topic of my research is: “Exploring causes of poor performance by
grade twelve learners in tasks based on the application of Calculus”.
The objectives of the study are:
(f) To establish causes of poor performance in cubic graphs and application of
differential calculus
(g) To identify common errors made by learners in trying to work out the two sections
of calculus
(h) To identify strengths and weaknesses in the teaching of cubic graphs and
application of calculus
(i) To come out with proper intervention programmes that will lead to good
performance
(j) To improve the overall performance in Mathematics as a subject
I earnestly request you to accord me an opportunity to conduct a research in three
schools of your Districts and also be given the permission to make use of the learners’
marked photocopied scripts for the three formal tasks, namely, the 2016 May Test, June
and Trial Examinations. Correspondence has also been sent to the Msukaligwa 1
Circuit Manageress and to the Principals of the following three selected schools:
4. Ligbron Academy
249
5. Ithafa Secondary
6. Reggie Masuku Secondary
Students have difficulties in learning and mastering of this section of Calculus as it is
revealed by examiners’ and moderators’ reports year after year. The purpose of this study
is to investigate the possible reasons for the poor performance by Grade 12 learners in
Calculus based tasks, especially in the cubic graphs and application in optimisation. It is
hoped that this study will be able to identify the possible causes of poor performance and
come out with proper interventions to address the challenges faced by learners when doing
Calculus
The study is not going to disturb teaching and learning in the schools as it will collect data
from the Grade 12 learners’ scripts for May Test, June and Trial Examinations. Teachers
will be asked to make copies of these tasks. Only the questions covering Cubic graphs and
Application of Differential Calculus will be used in the study. The researcher will analyse
learners’ scripts to find out how do they respond to these questions
Should you require any further information, please do not hesitate to contact me or my
supervisor. Our contact details are as follows:
Person to contact Cell Telephone Email address
Mr. R.B. Dlamini
(Student)
078 241 3651 017 826 5703 30721709 @mylife.unisa.ac.za
Prof. D. Brijlall
(Supervisor)
083 555 2390 031 573 2126 [email protected]
The benefit of this study will be its contribution in improving learners’ performance in
Calculus. This is because once the causes of poor performance in Calculus have been
identified; it will be easier to come out with strategies that will overcome the challenges.
Therefore, this study will be beneficial to the learners, teachers and to the Department of
Education
There is no potential risk that may cause harm or discomfort to the participants as they
will write the assessment during regular classroom activities. The researcher will not be at
the schools during writing, he will only come after tasks have been marked by the teachers
and ask for copies of learners’ responses to questions involving the two subtopics of
Calculus mentioned earlier. Already the 2016 May Test and June examination have been
written, only the Trial examination is remaining. It will be written in September.
Correspondence has been sent to the Circuit Manageress and Principals of the selected
schools to ask for permission to conduct this study. Also consent from parents and assent
from learners will be requested before the study can be conducted.

250
Feedback procedure will entail providing you and the schools participating in the study
with bound copies of the dissertation.
Your permission to conduct this study will be greatly appreciated.
Yours sincerely
Reuben Bafana Dlamini (Mr)
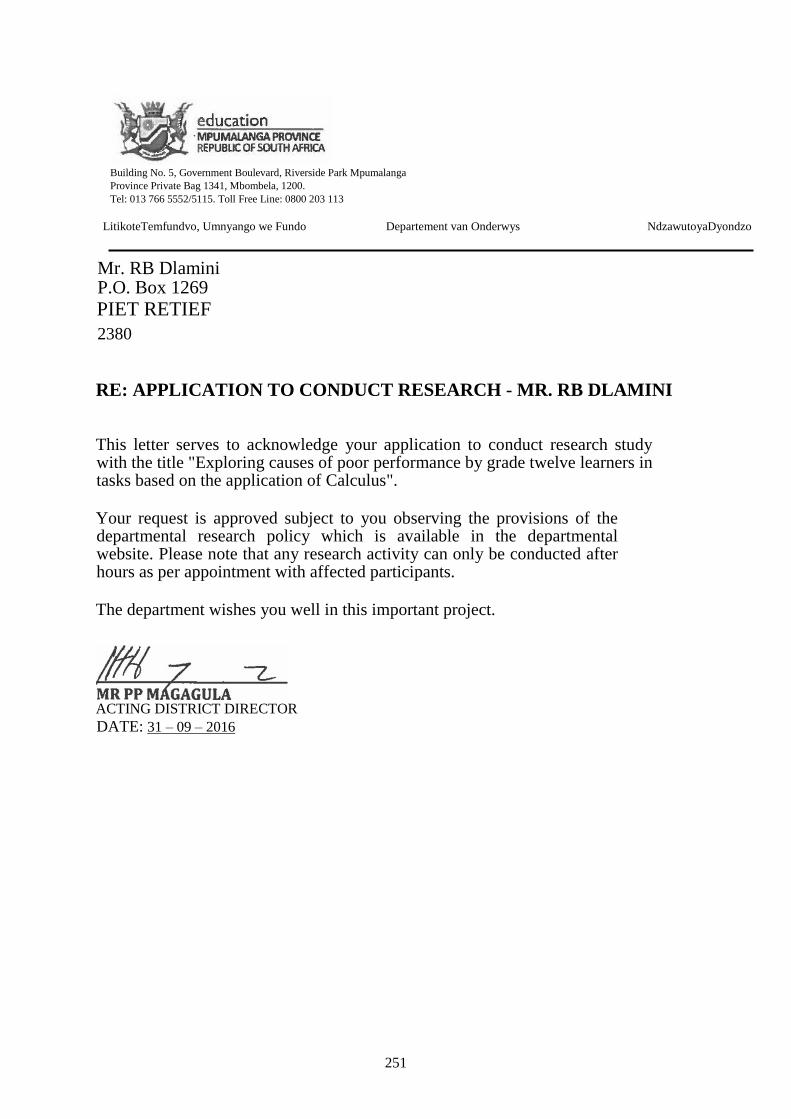
251
Building No. 5, Government Boulevard, Riverside Park Mpumalanga
Province Private Bag 1341, Mbombela, 1200. Tel: 013 766 5552/5115. Toll Free Line: 0800 203 113
LitikoteTemfundvo, Umnyango we Fundo Departement van Onderwys NdzawutoyaDyondzo
Mr. RB Dlamini P.O. Box 1269
PIET RETIEF
2380
RE: APPLICATION TO CONDUCT RESEARCH - MR. RB DLAMINI
This letter serves to acknowledge your application to conduct research study with the title "Exploring causes of poor performance by grade twelve learners in tasks based on the application of Calculus".
Your request is approved subject to you observing the provisions of the departmental research policy which is available in the departmental website. Please note that any research activity can only be conducted after hours as per appointment with affected participants.
The department wishes you well in this important project.
ACTING DISTRICT DIRECTOR
DATE: 31 – 09 – 2016
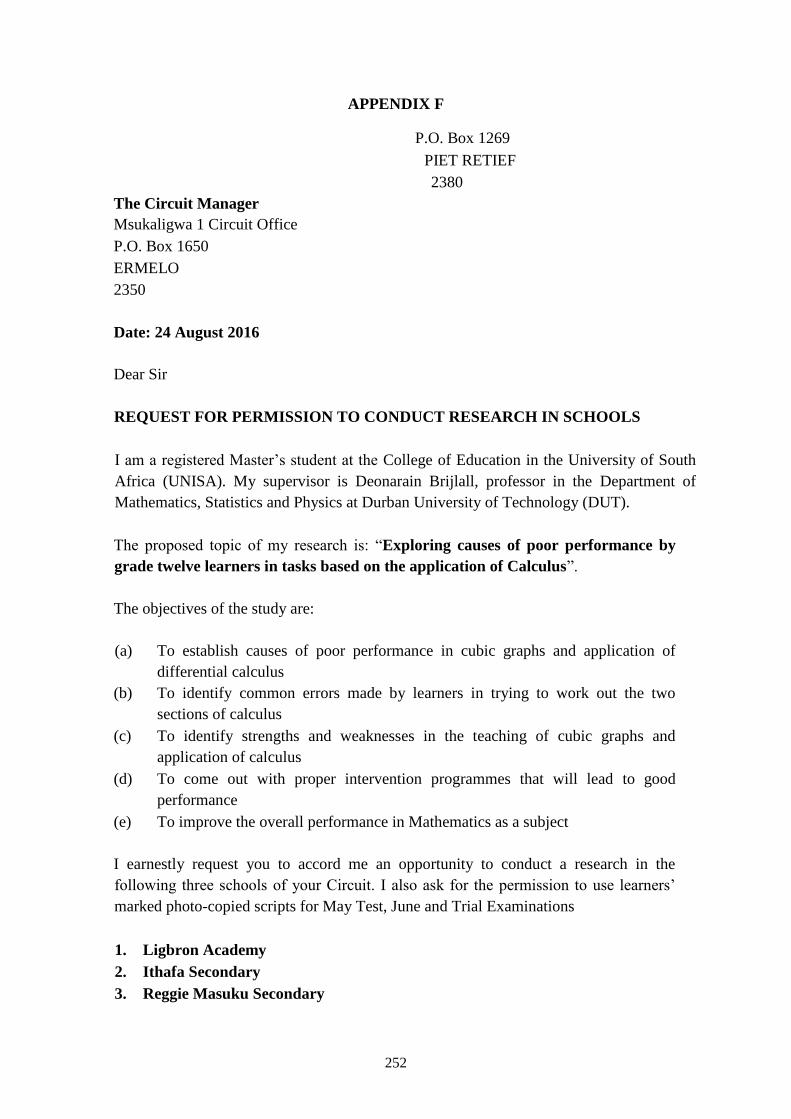
252
APPENDIX F
P.O. Box 1269
PIET RETIEF
2380
The Circuit Manager
Msukaligwa 1 Circuit Office
P.O. Box 1650
ERMELO
2350
Date: 24 August 2016
Dear Sir
REQUEST FOR PERMISSION TO CONDUCT RESEARCH IN SCHOOLS
I am a registered Master’s student at the College of Education in the University of South
Africa (UNISA). My supervisor is Deonarain Brijlall, professor in the Department of
Mathematics, Statistics and Physics at Durban University of Technology (DUT).
The proposed topic of my research is: “Exploring causes of poor performance by
grade twelve learners in tasks based on the application of Calculus”.
The objectives of the study are:
(a) To establish causes of poor performance in cubic graphs and application of
differential calculus
(b) To identify common errors made by learners in trying to work out the two
sections of calculus
(c) To identify strengths and weaknesses in the teaching of cubic graphs and
application of calculus
(d) To come out with proper intervention programmes that will lead to good
performance
(e) To improve the overall performance in Mathematics as a subject
I earnestly request you to accord me an opportunity to conduct a research in the
following three schools of your Circuit. I also ask for the permission to use learners’
marked photo-copied scripts for May Test, June and Trial Examinations
1. Ligbron Academy
2. Ithafa Secondary
3. Reggie Masuku Secondary
253
Students have difficulties in learning and mastering of this section of Calculus as it is
revealed by examiners’ and moderators’ reports year after year.. The purpose of this study
is to investigate the possible reasons for the poor performance by Grade 12 learners in
Calculus based tasks, especially in the cubic graphs and application in optimisation. It is
hoped that this study will be able to identify the possible causes of poor performance and
come out with proper interventions to address the challenges faced by learners when doing
Your Circuit was chosen because it is performing. That is to say the average pass
Percentage in the last five years in mathematics is above 60%. Also your circuit can
provide the study with data from three different types of schools. In Msukaligwa 1, one
can get a former Model C school, Mathematics, Science, and Technology Academy
(MSTA) and an ordinary public school that does not belong to the two already mentioned
categories
The study is not going to disturb teaching and learning in the schools as it will collect data
from the Grade 12 learners’ scripts for May Test, June and Trial Examinations. Teachers
will be asked to make copies of these tasks. Only the questions covering Cubic graphs and
Application of Differential Calculus will be used in the study. No names of learners or of
the schools will appear in the scripts in order to protect the learners’ identities. The
researcher will analyse learners’ scripts to find out how do they respond to these questions
Should you require any further information, please do not hesitate to contact me or my
supervisor. Our contact details are as follows:
Person to contact Cell Telephone Email address
Mr. R.B. Dlamini
(Student)
078 241 3651 017 826 5703 30721709 @mylife.unisa.ac.za
Prof. D. Brijlall
(Supervisor)
083 555 2390 031 573 2126 [email protected]
The benefit of this study will be its contribution in improving learners’ performance in
Calculus. This is because once the causes of poor performance in Calculus have been
254
identified; it will be easier to come out with strategies that will overcome the challenges.
Therefore, this study will be beneficial to the learners, teachers and to the Department of
Education
There is no potential risk that may cause harm or discomfort to the participants as they will
write the assessment during regular classroom activities. The researcher will not be at the
schools during writing, he will only come after tasks have been marked by the teachers and
ask for copies of learners’ responses to questions involving the two subtopics of Calculus
mentioned earlier. Already 2016 May Test and the June examination have been written,
only the Trial examination that is still to be written in September.
Correspondence has been sent to the District Director and Principals of the selected schools
to ask for permission to conduct this study. Also consent from parents and assent from
learners will be requested before the study can be conducted.
Feedback procedure will entail providing you and the schools participating in the study will
bound copies of the dissertation.
Your permission to conduct this study will be greatly appreciated.
Yours sincerely,
Reuben Bafana Dlamini
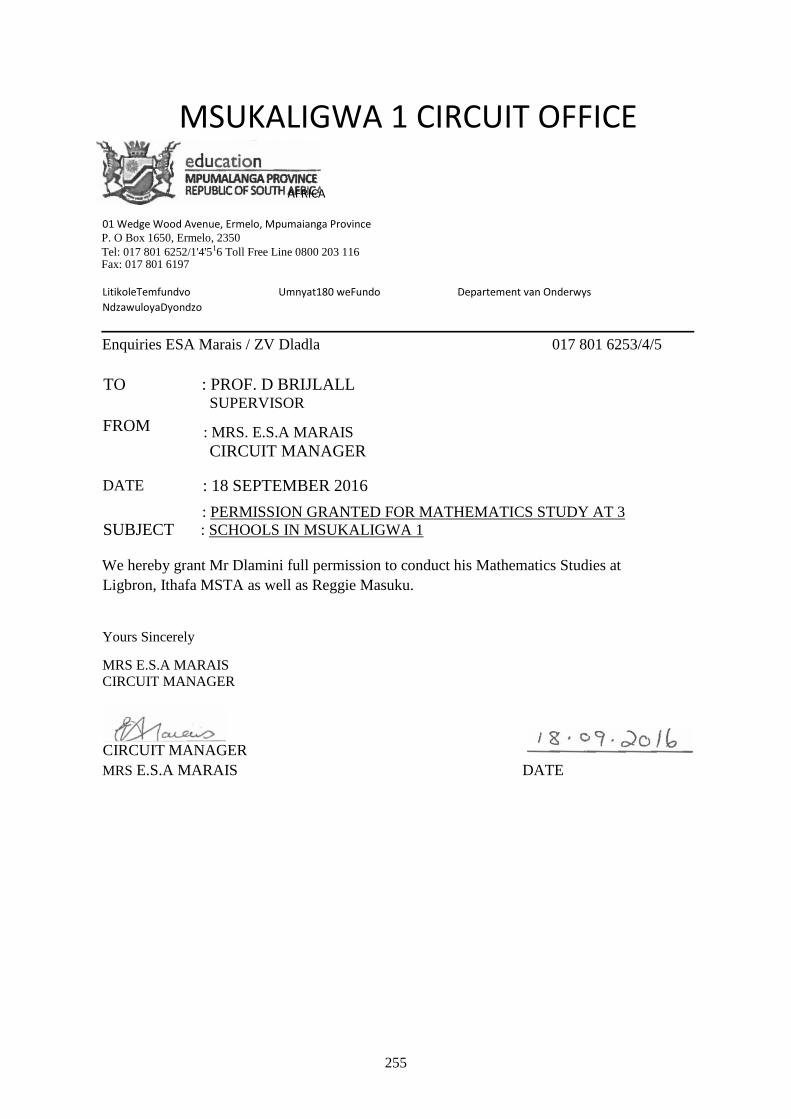
255
MSUKALIGWA 1 CIRCUIT OFFICE
01 Wedge Wood Avenue, Ermelo, Mpumaianga Province P. O Box 1650, Ermelo, 2350 Tel: 017 801 6252/1'4'516 Toll Free Line 0800 203 116 Fax: 017 801 6197
LitikoleTemfundvo Umnyat180 weFundo Departement van Onderwys NdzawuloyaDyondzo
Enquiries ESA Marais / ZV Dladla 017 801 6253/4/5
TO : PROF. D BRIJLALL
SUPERVISOR
FROM : MRS. E.S.A MARAIS
CIRCUIT MANAGER
DATE : 18 SEPTEMBER 2016
SUBJECT
: PERMISSION GRANTED FOR MATHEMATICS STUDY AT 3 : SCHOOLS IN MSUKALIGWA 1
We hereby grant Mr Dlamini full permission to conduct his Mathematics Studies at
Ligbron, Ithafa MSTA as well as Reggie Masuku.
Yours Sincerely
MRS E.S.A MARAIS
CIRCUIT MANAGER
CIRCUIT MANAGER
MRS E.S.A MARAIS DATE
AFRICA

256
257
APPENDIX G
P.O. BOX 1269
PIET RETIEF
3513
The Principal
.............................................................
.............................................................
.............................................................
..............................................................
Date: ...............................
Dear Sir/Madam
REQUEST FOR PERMISSION TO CONDUCT RESEARCH IN THE SCHOOL
I am a registered Master’s student at the College of Education in the University of South
Africa (UNISA). My supervisor is Deonarain Brijlall, professor in the Department of
Mathematics, Statistics and Physics at Durban University of Technology (DUT)
The proposed topic of my research is: “Exploring causes of poor performance by
grade twelve learners in tasks based on the application of Calculus”.
The objectives of the study are:
(a) To establish causes of poor performance in cubic graphs and application of
differential calculus
(b) To identify common errors made by learners in trying to work out the two
sections of calculus
(c) To identify strengths and weaknesses in the teaching of cubic graphs and
application of calculus
(d) To come out with proper intervention programmes that will lead to good
performance
(e) To improve the overall performance in Mathematics as a subject
I earnestly request you to accord me an opportunity to conduct a research in your
school and be given a permission to make use of the learners’ marked scripts for the
three tasks mentioned in the next paragraph.
The study is not going to disturb teaching and learning in the schools as it will collect data
from the Grade 12 learners’ scripts for May Test, June and Trial Examinations. Teachers
will be asked to make copies of these tasks. Only the questions covering Cubic graphs and
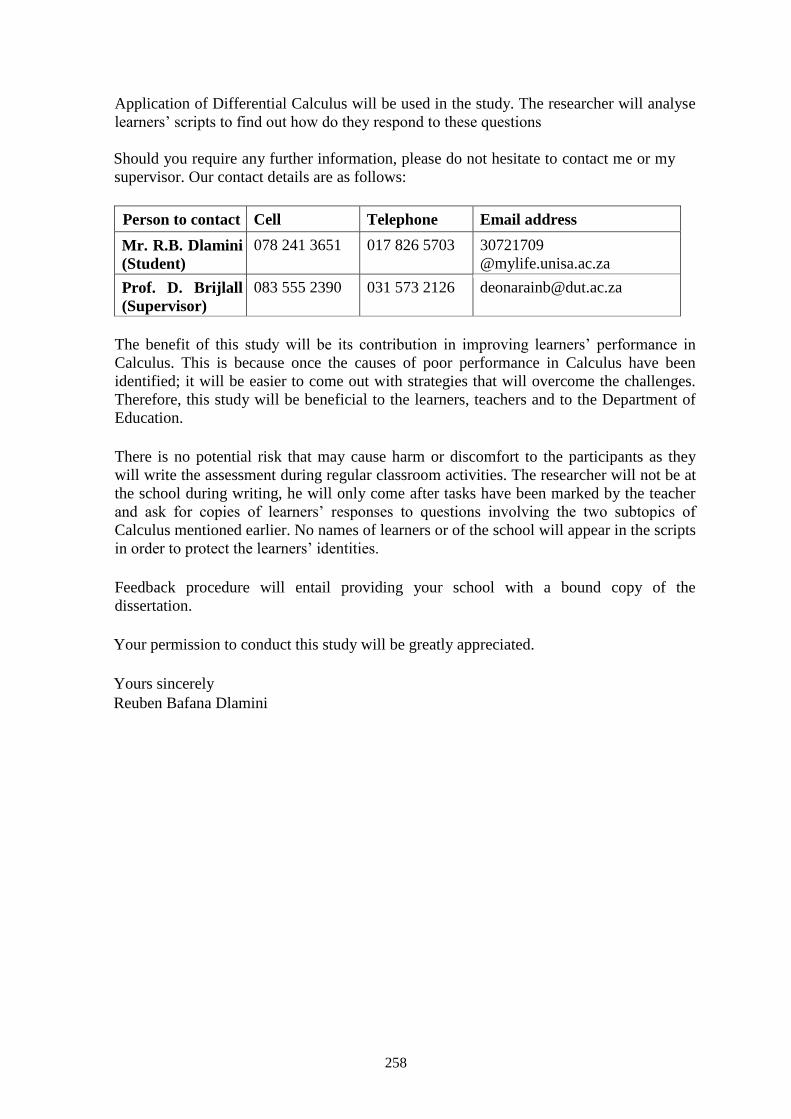
258
Application of Differential Calculus will be used in the study. The researcher will analyse
learners’ scripts to find out how do they respond to these questions
Should you require any further information, please do not hesitate to contact me or my
supervisor. Our contact details are as follows:
Person to contact Cell Telephone Email address
Mr. R.B. Dlamini
(Student)
078 241 3651 017 826 5703 30721709
@mylife.unisa.ac.za
Prof. D. Brijlall
(Supervisor)
083 555 2390 031 573 2126 [email protected]
The benefit of this study will be its contribution in improving learners’ performance in
Calculus. This is because once the causes of poor performance in Calculus have been
identified; it will be easier to come out with strategies that will overcome the challenges.
Therefore, this study will be beneficial to the learners, teachers and to the Department of
Education.
There is no potential risk that may cause harm or discomfort to the participants as they
will write the assessment during regular classroom activities. The researcher will not be at
the school during writing, he will only come after tasks have been marked by the teacher
and ask for copies of learners’ responses to questions involving the two subtopics of
Calculus mentioned earlier. No names of learners or of the school will appear in the scripts
in order to protect the learners’ identities.
Feedback procedure will entail providing your school with a bound copy of the
dissertation.
Your permission to conduct this study will be greatly appreciated.
Yours sincerely
Reuben Bafana Dlamini
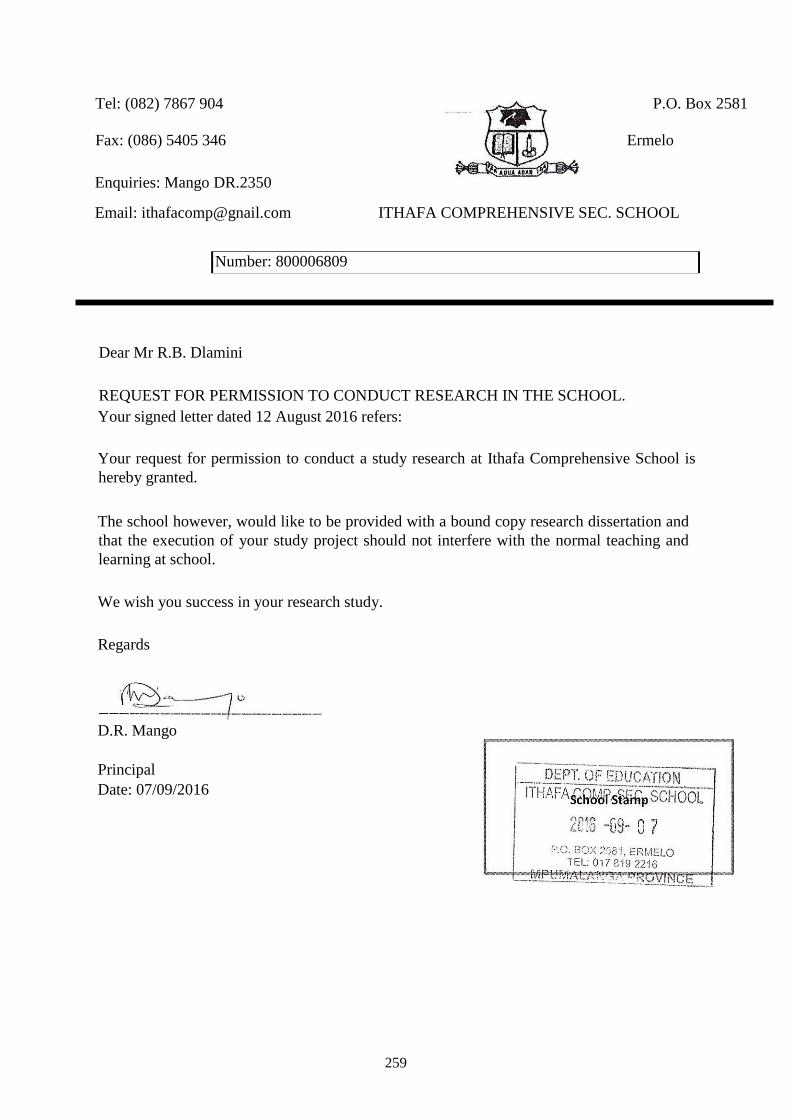
259
Tel: (082) 7867 904 P.O. Box 2581
Fax: (086) 5405 346 Ermelo
Enquiries: Mango DR.2350
Email: [email protected] ITHAFA COMPREHENSIVE SEC. SCHOOL
Number: 800006809
Dear Mr R.B. Dlamini
REQUEST FOR PERMISSION TO CONDUCT RESEARCH IN THE SCHOOL.
Your signed letter dated 12 August 2016 refers:
Your request for permission to conduct a study research at Ithafa Comprehensive School is
hereby granted.
The school however, would like to be provided with a bound copy research dissertation and
that the execution of your study project should not interfere with the normal teaching and
learning at school.
We wish you success in your research study.
Regards
D.R. Mango
Principal
Date: 07/09/2016
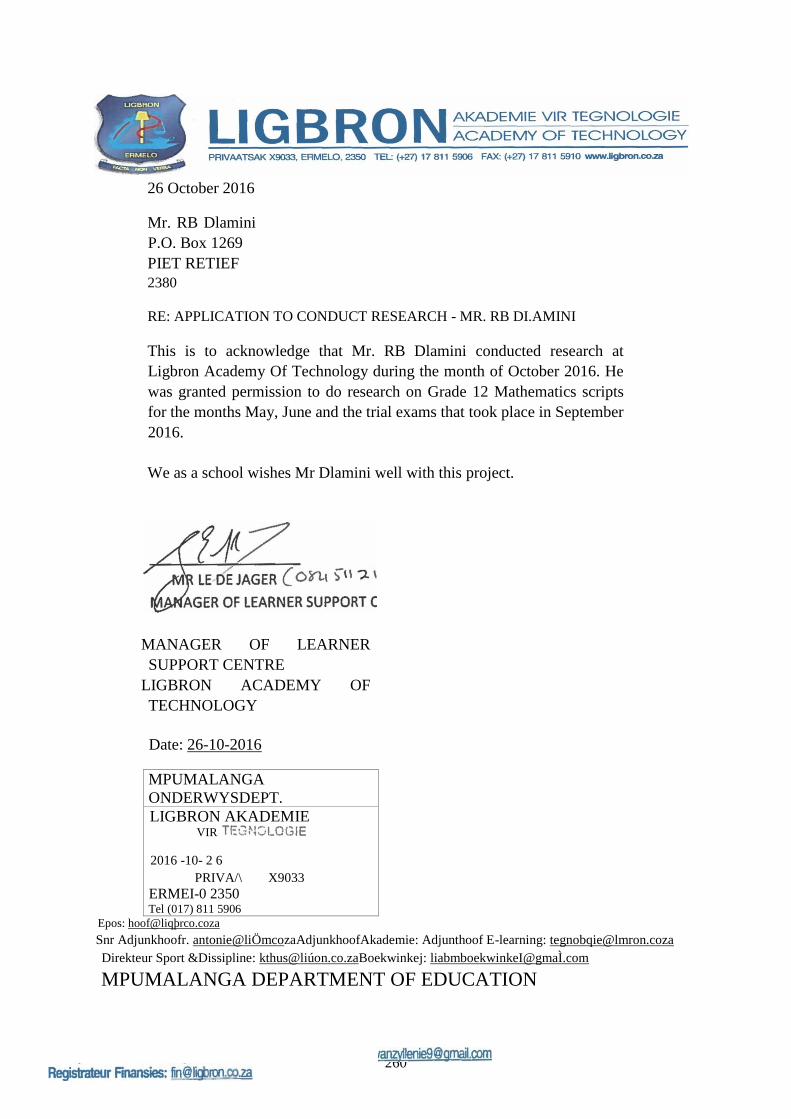
260
26 October 2016
Mr. RB Dlamini
P.O. Box 1269
PIET RETIEF
2380
RE: APPLICATION TO CONDUCT RESEARCH - MR. RB DI.AMINI
This is to acknowledge that Mr. RB Dlamini conducted research at
Ligbron Academy Of Technology during the month of October 2016. He
was granted permission to do research on Grade 12 Mathematics scripts
for the months May, June and the trial exams that took place in September
2016.
We as a school wishes Mr Dlamini well with this project.
MANAGER OF LEARNER
SUPPORT CENTRE
LIGBRON ACADEMY OF
TECHNOLOGY
Date: 26-10-2016
MPUMALANGA
ONDERWYSDEPT.
LIGBRON AKADEMIE VIR
2016 -10- 2 6
PRIVA/\ X9033 ERMEI-0 2350 Tel (017) 811 5906
Epos: hoof@liqþrco.coza
Snr Adjunkhoofr. antonie@liÖmcozaAdjunkhoofAkademie: Adjunthoof E-learning: [email protected]
Direkteur Sport &Dissipline: kthus@liúon.co.zaBoekwinkej: liabmboekwinkeI@gmaÌ.com
MPUMALANGA DEPARTMENT OF EDUCATION
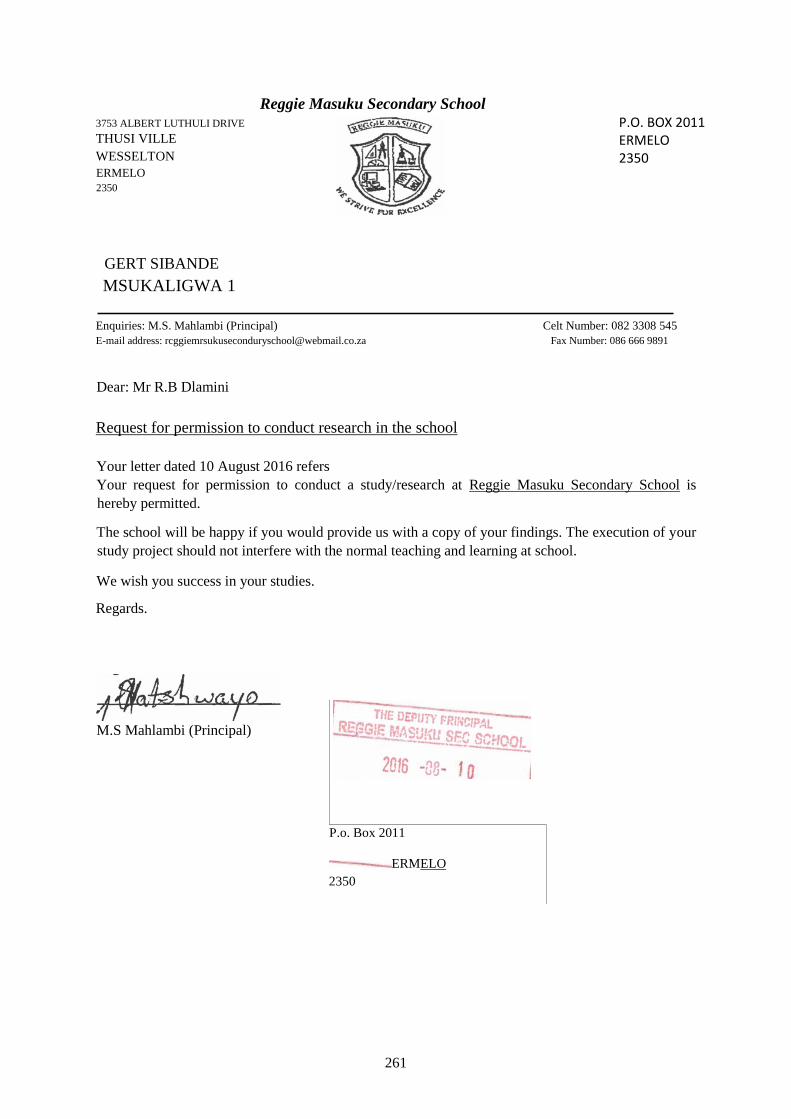
261
Reggie Masuku Secondary School
3753 ALBERT LUTHULI DRIVE THUSI VILLE
WESSELTON
ERMELO 2350
GERT SIBANDE
MSUKALIGWA 1
Enquiries: M.S. Mahlambi (Principal) Celt Number: 082 3308 545 E-mail address: [email protected] Fax Number: 086 666 9891
Dear: Mr R.B Dlamini
Request for permission to conduct research in the school
Your letter dated 10 August 2016 refers
Your request for permission to conduct a study/research at Reggie Masuku Secondary School is
hereby permitted.
The school will be happy if you would provide us with a copy of your findings. The execution of your
study project should not interfere with the normal teaching and learning at school.
We wish you success in your studies.
Regards.
M.S Mahlambi (Principal)
P.o. Box 2011
ERMELO
2350
P.O. BOX 2011 ERMELO 2350
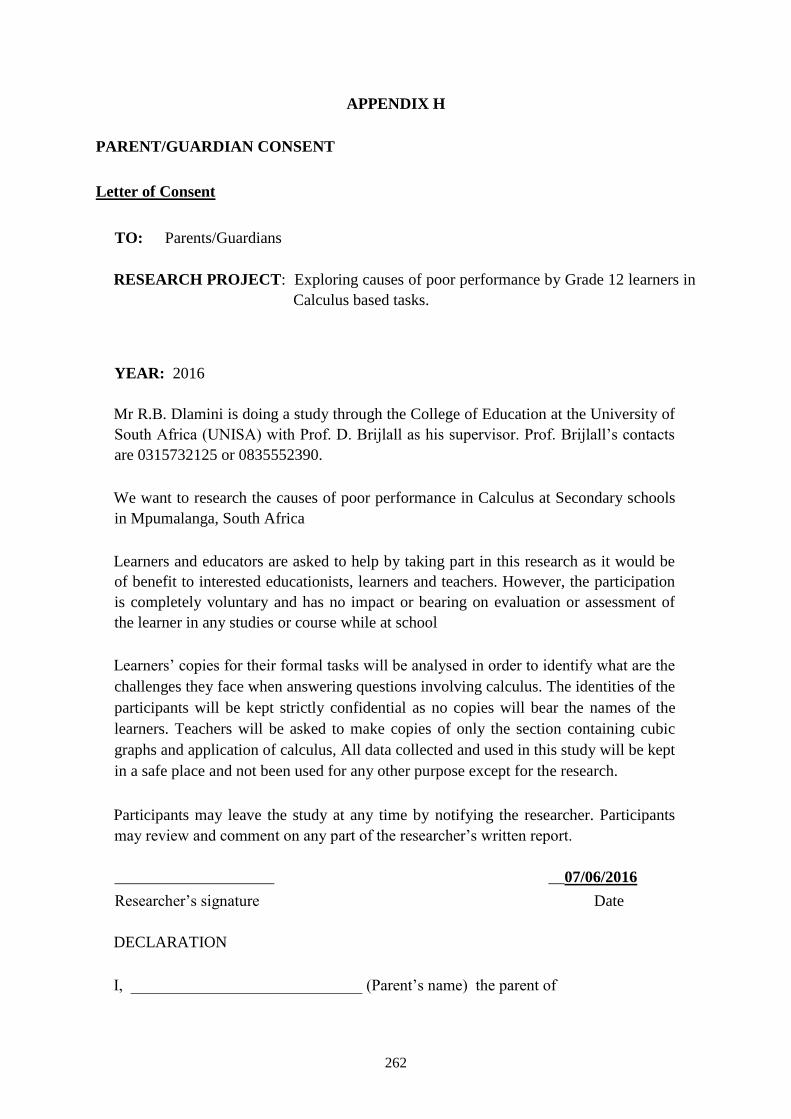
262
APPENDIX H
PARENT/GUARDIAN CONSENT
Letter of Consent
TO: Parents/Guardians
RESEARCH PROJECT: Exploring causes of poor performance by Grade 12 learners in
Calculus based tasks.
YEAR: 2016
Mr R.B. Dlamini is doing a study through the College of Education at the University of
South Africa (UNISA) with Prof. D. Brijlall as his supervisor. Prof. Brijlall’s contacts
are 0315732125 or 0835552390.
We want to research the causes of poor performance in Calculus at Secondary schools
in Mpumalanga, South Africa
Learners and educators are asked to help by taking part in this research as it would be
of benefit to interested educationists, learners and teachers. However, the participation
is completely voluntary and has no impact or bearing on evaluation or assessment of
the learner in any studies or course while at school
Learners’ copies for their formal tasks will be analysed in order to identify what are the
challenges they face when answering questions involving calculus. The identities of the
participants will be kept strictly confidential as no copies will bear the names of the
learners. Teachers will be asked to make copies of only the section containing cubic
graphs and application of calculus, All data collected and used in this study will be kept
in a safe place and not been used for any other purpose except for the research.
Participants may leave the study at any time by notifying the researcher. Participants
may review and comment on any part of the researcher’s written report.
____________________ __07/06/2016
Researcher’s signature Date
DECLARATION
I, _____________________________ (Parent’s name) the parent of

263
___________________ (Learner’s name), agree/disagree
____________________ (Signature) ___________ (Date)
Agree
Disagree
NB. Tick ONE
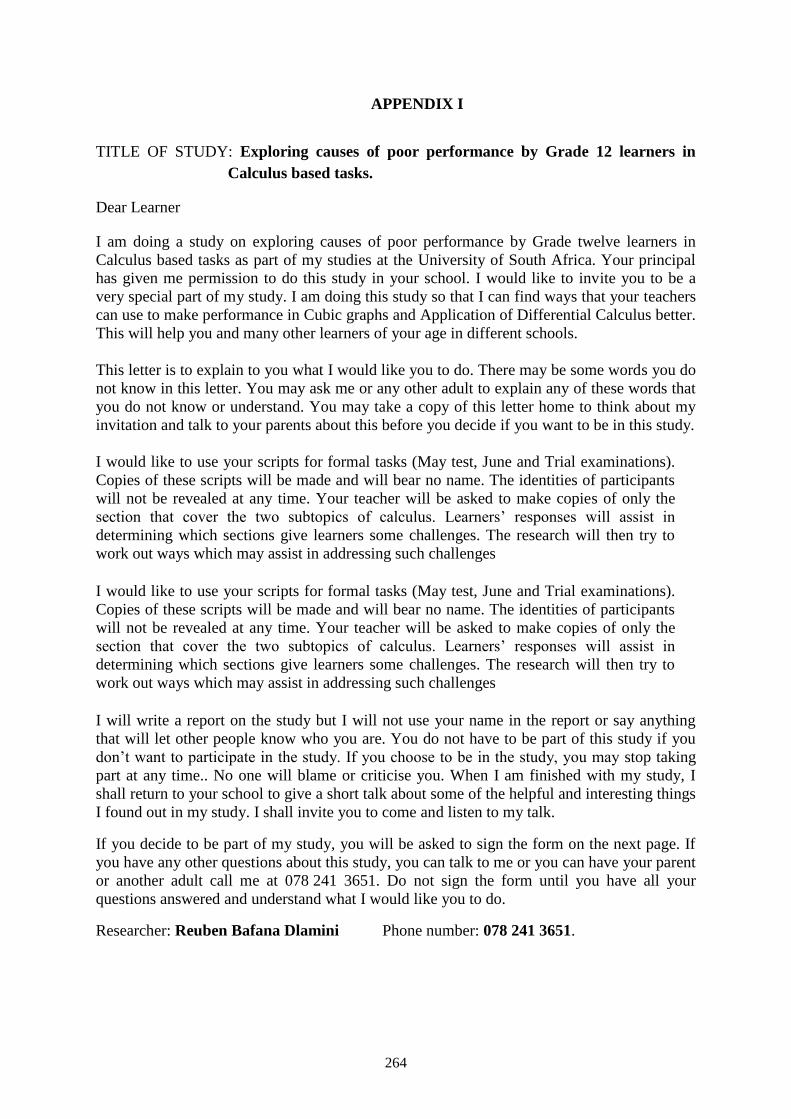
264
APPENDIX I
TITLE OF STUDY: Exploring causes of poor performance by Grade 12 learners in
Calculus based tasks.
Dear Learner
I am doing a study on exploring causes of poor performance by Grade twelve learners in
Calculus based tasks as part of my studies at the University of South Africa. Your principal
has given me permission to do this study in your school. I would like to invite you to be a
very special part of my study. I am doing this study so that I can find ways that your teachers
can use to make performance in Cubic graphs and Application of Differential Calculus better.
This will help you and many other learners of your age in different schools.
This letter is to explain to you what I would like you to do. There may be some words you do
not know in this letter. You may ask me or any other adult to explain any of these words that
you do not know or understand. You may take a copy of this letter home to think about my
invitation and talk to your parents about this before you decide if you want to be in this study.
I would like to use your scripts for formal tasks (May test, June and Trial examinations).
Copies of these scripts will be made and will bear no name. The identities of participants
will not be revealed at any time. Your teacher will be asked to make copies of only the
section that cover the two subtopics of calculus. Learners’ responses will assist in
determining which sections give learners some challenges. The research will then try to
work out ways which may assist in addressing such challenges
I will write a report on the study but I will not use your name in the report or say anything
that will let other people know who you are. You do not have to be part of this study if you
don’t want to participate in the study. If you choose to be in the study, you may stop taking
part at any time.. No one will blame or criticise you. When I am finished with my study, I
shall return to your school to give a short talk about some of the helpful and interesting things
I found out in my study. I shall invite you to come and listen to my talk.
If you decide to be part of my study, you will be asked to sign the form on the next page. If
you have any other questions about this study, you can talk to me or you can have your parent
or another adult call me at 078 241 3651. Do not sign the form until you have all your
questions answered and understand what I would like you to do.
Researcher: Reuben Bafana Dlamini Phone number: 078 241 3651.
265
Do not sign written assent form if you have any questions. Ask your questions first and
ensure that someone answers those questions. If you decide to be part of the study, let your
parent or guardian sign the assent form.
WRITTEN ASSENT
I have read this letter which asks me to be part of a study at my school. I have understood the
information about my study and I know what I will be asked to do. I am willing to be in the
study.
____________________________ ________________________ __________
Learner’s name (print): Learner’s signature: Date:
___________________________ ________________________ ___________
Witness’s name (print) Witness’s signature Date
(The witness is over 18 years old and present when signed.)
___________________________ ________________________ __________
Parent/guardian’s name (print) Parent/guardian’s signature: Date
_________________________ ________________________ __________
Researcher’s name (print) Researcher’s signature: Date
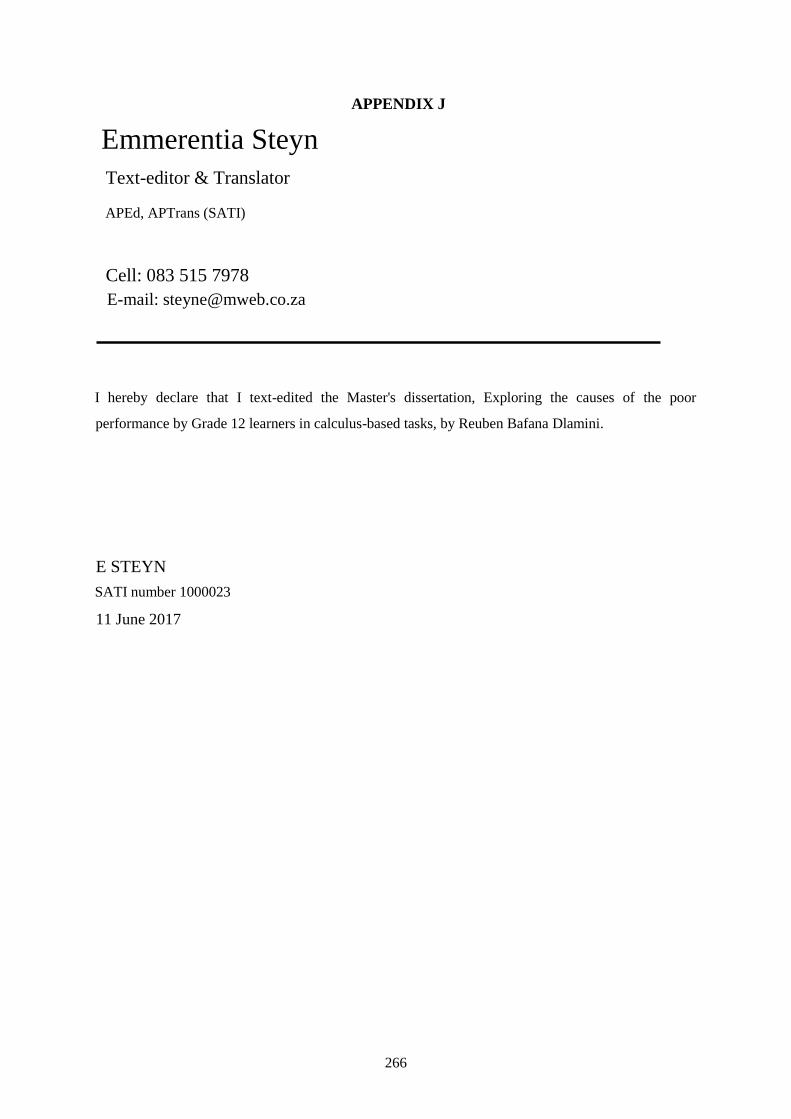
266
APPENDIX J
Emmerentia Steyn
Text-editor & Translator
APEd, APTrans (SATI)
Cell: 083 515 7978
E-mail: [email protected]
I hereby declare that I text-edited the Master's dissertation, Exploring the causes of the poor
performance by Grade 12 learners in calculus-based tasks, by Reuben Bafana Dlamini.
E STEYN
SATI number 1000023
11 June 2017
267
APPENDIX K
EXPLORING THE CAUSES
OF
THE POOR PERFORMANCE
by Reuben Bafana Dlamini
FILE (11.48M)
TIME SUBMITTED 07-JUN-2017 01:26PM WORD COUNT 66794
SUBMISSION ID 822906048 CHARACTER COUNT
370659
268
EXPLORING THE CAUSES OF THE POOR
PERFORMANCE
ORIGINALITY REPORT
%18
SIMILARITY
INDEX
%16
INTERNET
SOURCES
%5
PUBLICATIONS
%7
STUDENT
PAPERS
PRIMARY SOURCES
www.algebra.com
1
uir.unisa.ac.za
Internet Source
soucc.southern.cc.oh.us
269
Internet Source <1
www.edwardsmaths.com
Internet Source <1
ife.ens•lyon.fr
< 1
Submitted to Victoria University
Student Paper
< 1