Embed Size (px)
Citation preview
A Study of Interregional Migration Between Ontario and Atlantic Canada: 1981-1991
Feng Hou and Roderic Beaujot Population Studies Centre Department of Sociology University of Western Ontario London, Ontario N6A SC2
Since the early 1900s, interprovincial migration has been a significant factor in determining the distribution of the Canadian population. Since fertility and mortality have become relatively homogeneous, internal and international migration are clearly dominant in shaping population concentration in Canada (Termote 1987).
Besides affecting the spatial distribution of the population, the distinctive socioeconomic characteristics of migrants bring social and economic change in given regions and cornmunities (Stone 1969: 101; 1979: 13). In view of these demographic, economic and social implications, the role of migration in influencing regional disparities has become a vital national issue (Beaujot 1991; Carel et al. 1988).
The impact of interregional migration on a given region is dependent on the net effect of the in- and out-migration strearns. The difference of volume and socio-demographic composition of the two flows results in the processes of population redistribution and exchange. The net effect of migration flows can be further elaborated through the consideration of various types of migrants in accordance with their previous migration experience: primary migrants are the first time migrants from their initial place of residence to a new place, return migrants are moving back to their previous place of residence, while onward migrants are moving again, but neither to nor from their initial place of residence. These different types have been found to display particular decision making processes, invoke varied criteria for choosing their destinations, and consist of distinctive characteristics (DaVanzo 19761983; Gmelch 1983; Grant and Vanderkamp 1984, 1986; Hou and Beaujot 1994; Long 1988; RicWing 1985).
The decomposition of population movement into these types of migrants
C Canadian Journal of Regional Science/Revue canadienne des sciences régionales, XVill:2 (Summer/été 1995), 147-160. ISSN: 0705-4580 Printed in Canada/Imprimé au Canada
148 HOU AND BEAUJOT INTERREGIONAL MIGRATION BETWEEN ONTARIO AND ATLANTIC CANADA 149
has important implications. Above all, it involves a departure from the dichotomous treatment of movers and non-movers. With the ease of modern communication and transportation, many socioeconomic and behavioral barriers to migration have been crumbling. As a result, the migration system has come to involve "a great variety of movements, usually short-term, repetitive, or cyclical in nature, but all having in common the lack of any declared intentions of a permanent or long-lasting change in residence" (Zelinsky 1974: 144). The large volume of movement which has been shown to characterize the population of Canada is partly attributable to the repeated movement of the same persons. In sorne ways, repetitive migration produces considerable 'inefficiency' in the interregional redistribution process because it tends to counteract the effect of primary migration (Lee 1966; Rogers and Belanger 1990). However, ifvarious types of migrants involve different socio-demographic characteristics, we can also speak of a process of re-selection. Therefore, it is not sufficient to examine the net flow of in- and out- migration, we also have to examine the composition of different types of migration in investigating the net effect of migration upon a specific region.
The purpose of this study is to compare the composition and characteristics of return, onward, and primary migrants among the in- and out- migration flows between Ontario and Atlantic Canada. Given the distinctive features of these two regions, this analysis will contribute to understanding the underlying population distribution and exchange processes.
Previous Studies
In terrns of the effects of migration on sending or receiving regions, most Canadian studies have been based on two theoretical points of view. On the one hand, migration is regarded as a movement of labour. From this perspective, the free movement of workers, just like the free movement of other elements of production, will improve the efficiency of the national economic system. On the other hand, migration can be seen as a process that redistributes the sources of growth. That is, migrants can bring a larger population and greater possibilities of agglomeration economies to the receiving region, and they consequently increase the disparity gap between regions (Carel et al. 1988).
To clarify the actual effect of migration on sending or receiving areas, it is important to compare the volume and variation of socio-demographic composition between in- and out- migration flows and between migrants and nonmigrants. For instance, Stone (1971) found a marked similarity between the composition of in-flow and out-flow in terrns of occupation and education. By implication, this study suggests that the effect of migration on a region is dependent on the net difference in magnitude, rather than in socio-demographic composition, of the in and out migration streams. In a subsequent study, Stone
(1979) provided a further explanation. He found that the educational distribution and occupational composition of a migration stream is a function of characteristics of the areas of origin and/or destination. In particular, whenever migration is taking place between a highly urbanized region and a largely rural one, the characteristics of the urban region is predominant in influencing the occupational composition of the migration stream, regardless of the direction of migration. These results imply that the process of exchange will be dominated by more developed regions (Stone 1979).
Repetitive migration is a significant factor in the regional effect of migration. For example, Rogers and Belanger (1990) observe that the shares of return and other repeat migrants in gross inter-divisional migration streams of the United States have increased from 17.8% and 16.2% in 1935-1940 to 22.4% and 22.9% in 1975-1980, respectively. Lee (1974) found that during the 1955-60 period, migrants returning to their state of birth constituted 17 % of all interstate migrants among whites and 14% among blacks. By the 1965-74 period, these percentages had risen to 20% and 21 %, respectively. In the Canadian context, Newbold and Liaw (1990) observed that during the period 1976-1981 the percentage share of the return migrants in total out-migrant flows ranged from 12.9% in Newfoundland to 37.1 % in British Columbia, while the percentage share of return migrants in the in-migration flows ranged from 58.3% in Newfoundland to 10.4% in Alberta. The interprovincial variation in total net migration was determined mainly by the variation in the primary net migration. In effect, primary net migration dominates the overall redistribution, whereas return net migration weakens the effect of primary net migration.
Sorne studies explore further the relation between return migration and other types of migration at the regional level. For the regions having a long history of net out-migration, return migrants comprise a large share of inmigrants, and this proportion rises as previous out-migrants increase (Lee 1974). This is partly because a losing area has a larger pool of persons who have left and who may return. At the same time, losing areas are also places where opporrunities are limited, providing limited attractiveness to outsiders who lack ties to the area. Therefore, return migration partly makes up for the population loss of areas of net out-migration. On the other hand, regions with a long history of net gain are characterized by low proportions of returnees and they largely gain new migrants (Lee 1974: 299). Rogers and Belanger (1990) also suggest that regions with low out-migration tend to exhibit low return inmigration. By contrast, those with high primary out-migration tend to show high return in-migration.
Besides exarnining the volume of repetitive migration, the research in this area has focused on the decision-making process and the underlying economic motivation for retum migration. There are only a few Canadian studies which analyze the socio-demographic differentiation between interprovincial primary and repetitive migrants. Among these, the results are not consistent. Using the
150 HOU AND BEAUJOT
1971 and 1981 census Public Use Samples, Rosenbaum (1988,1993) found that retum migrants differentiated themselves from other types of migrants only in terms of destination, marital status and family size, while education, occupation and income did not involve statistically significant differences. Similarly, Grant and Vanderkamp (1986) found that differences in occupational distributions appear to have little effect on repeat interprovincial migration in Canada. By contrast, sorne other studies documented that the profiles of retuming and nonretuming migrants tend to be very different. In the analysis of 1981 census data on migration from Ontario and Atlantic Canada, Hiscott (1987) found that returning migrants tend to be older and less-educated than other migrants, and they tend to correspond more closely to the occupational and industrial distributions of the general working population in Atlantic Canada, while non-retuming migrants are more different from the receiving population. A study which considered both the aggregate level in comparing migration across provinces, and the micro level in terms of individual propensity to undertake various types of migration, suggests that return migrants tend to be less educated and less economically motivated (Hou and Beaujot 1994).
Previous studies either neglect the difference among various types of migrants or do not fully consider regional variation in socioeconomic characteristics and direction of migration flows when various types of migrants are compared. When migrants are treated as a homogenous group, the increasing importance of repetitive migration cannot be adequately estimated. Given that migration is by nature a spatial phenomenon, the volume, direction, and associated decisions will be influenced by regional differences in the various pull and push forces. Consequently, the general pattern at the national level may not apply to specific regions, and results based on flows in one direction need not apply to the other direction. Given these considerations, this study compares the importance and socio-demographic composition of different types of migrants in the migration flows (both in and out) of two rather different regions in Canada, Ontario and Atlantic Canada.
Data and Methods
The data for this study are drawn from the 1981, 1986 and 1991 Canadian Census Public Use Sample Tapes (PUSTs). The geographic areas include Ontario and three Atlantic provinces: Newfoundland, Nova Scotia and New Brunswick. We were not able to include Prince Edward Island because it was combined with Yukon and Northwest Territories. Based on the province of birth, the province of residence at census time, and five years before the census, a migration stream for each region can be decomposed into three components: primary, return, and onward migrants (see Note 2 of Table 1 for defmitions). Detailed discussion concerning limitations of the definitions, and
INTERREGIONAL MIGRATION BETWEEN ONTARIO AND ATLANTIC CANADA 151
problems of census migration data, can be found elsewhere (Hou and Beaujot 1994; Vanderkamp and Grant 1988).
We first examine the trend of migration flow in terrns of the composition of return, onward, and primary migrants between Ontario and three Atlantic Canada provinces. This is done by estimating the total number of the three types of migrants, their relative share, and migration rates in 1981, 1986 and 1991. Next, we apply polytomous logistic analyses to compare the socio-demographic characteristics among various types of migrants, and between migrants and local populations, both in the regions of origin and destination. Finally, we directly compare the socio-demographic characteristics of in and out migrants. Since the 1991 census measures interprovincial migration both in five-year period and one year periods, the multivariate analyses are conducted for both time frames.
Findings
Trends in Migration FIows Between Ontario and the Atlantic Region
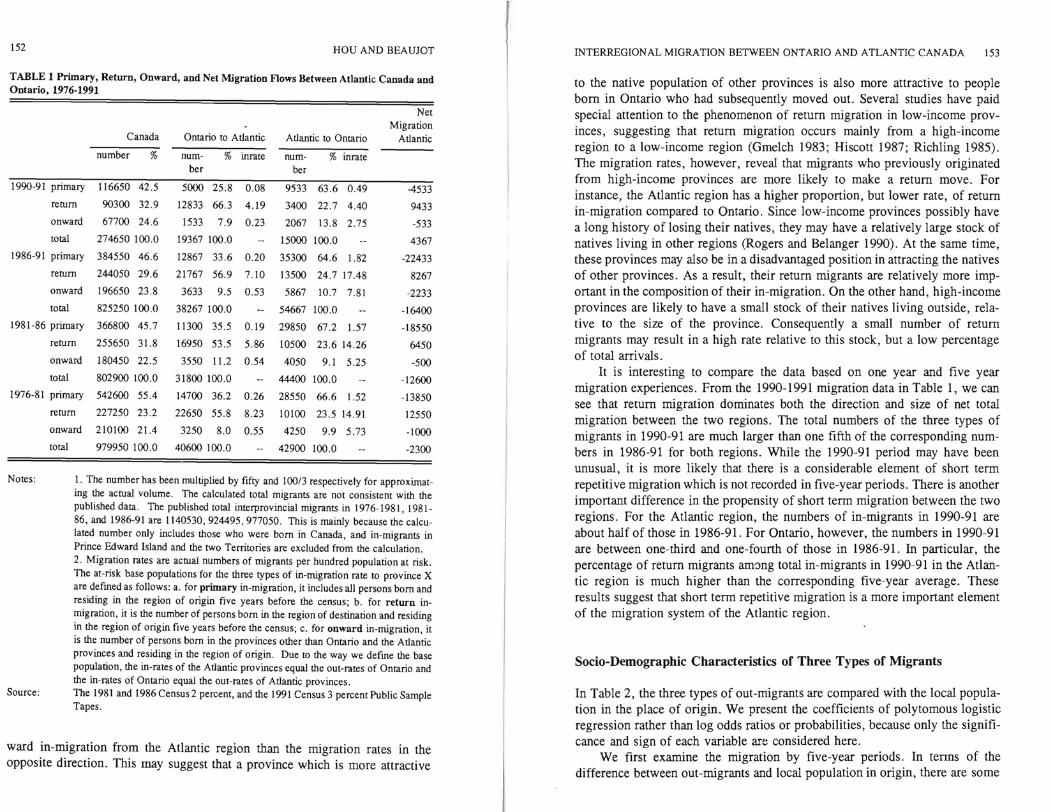
Table 1 presents the volume, composition and migration rates for various types of migrants between Ontario and the Atlantic region. It can be observed that primary migrants are the major component of total in-migration for Ontario, while retum migrants are the most important component for the Atlantic provinces. Return migrants comprise sorne 55 % of total in-migrants in the Atlantic region but less than 25% in Ontario. On the other hand, primary migrants involve sorne 35 % of these in-migrants for the Atlantic region compared to 65 % for Ontario. Among the three types of migrants, onward migrants have the smallest proportions in both regions. Although the composition of in-migration remains relatively stable during the three census periods for both Ontario and the Atlantic region, the percentage ofprimary migrants from Ontario to the Atlantic region has deceased gradually, while the percentage of retum migrants from the Atlantic region to Ontario has increased slightly.
In terrns of volume, the total in-migrants from the Atlantic region has increased continuously for Ontario in the three census periods. In contrast, only the number of onward migrants from Ontario has Ïncreased slightly in the Atlantic region, while the number of total, primary and retum migrants has fluctuated. The Atlantic region has experienced a net loss of primary migrants and onward migrants, but a net gain of retum migrants. The opposite is true for Ontario. Over the three census periods, net primary migrants have determined the direction of net total migration between the two regions. Onward migration tends to enhance the effect of primary migration, while the fluctuations of retum migration are the major force influencing the size of net total migration. Overall, the net total immigration has been continuously unfavourable to the Atlantic region. Ontario has much higher rates of primary, retum, and on
152 HOU AND BEAUJOT
TABLE 1 Primary, Return, Onward, and Net Migration F10ws Between Atlantic Canada and Ontario, 1976-1991
Net Migration
Canada Ontario to Atlantic Atlantic to Ontario Atlantic
number % num % inrate num % inrate ber ber
1990-91 primary 116650 42.5 5000 25.8 0.08 9533 63.6 0.49 -4533 return 90300 32.9 12833 66.3 4.19 3400 22.7 4.40 9433 onward 67700 24.6 1533 7.9 0.23 2067 13.8 2.75 -533 total 274650 100.0 19367 100.0 - 15000 100.0 - 4367
1986-91 primary 384550 46.6 12867 33.6 0.20 35300 64.6 1.82 -22433 return 244050 29.6 21767 56.9 7.10 13500 24.7 17.48 8267 onward 196650 23.8 3633 9.5 0.53 5867 10.7 7.81 -2233 total 825250 100.0 38267 100.0 - 54667 100.0 _. -16400
1981-86 prirnary 366800 45.7 11300 35.5 0.19 29850 67.2 1.57 -18550 return 255650 31.8 16950 53.5 5.86 10500 23.6 14.26 6450 onward 180450 22.5 3550 11.2 0.54 4050 9.1 5.25 -500 total 802900 100.0 31800 100.0 - 44400 100.0 -. -12600
1976-81 primary 542600 55.4 14700 36.2 0.26 28550 66.6 1.52 -13850 return 227250 23.2 22650 55.8 8.23 10100 23.5 14.91 12550 onward 210100 21.4 3250 8.0 0.55 4250 9.9 5.73 -1000 total 979950 100.0 40600 100.0 - 42900 100.0 - -2300
Notes: 1. The number has been multiplied by fifty and 100/3 respectively for approximating the actual volume. The calculated total migrants are not consistent with the published data. The published total interprovincial migrants in 1976-1981, 198186, and 1986-91 are 1140530,924495,977050. This is mainly because the calculated number orny includes those who were born in Canada, and in·migrants in Prince Edward Island and the two Territories are exc1uded from the calculation. 2. Migration rates are actual numbers of migrants per hundred population at risk. The at-risk base populations for the three types of in-migration rate to province X are defined as follows: a. for primary in-migration, it inc1udes all persons born and residing in the region of origin five years before the census; b. for return inmigration, it is the number of persons born in the region of destination and residing in the region of origin five years before the census; c. for onward in·migration, il is the number of persons born in the provinces other than Ontario and the Atlantic provinces and residing in the region of origin. Due ta the way we defme the base population, the in-rates of the Atlantic provinces equal the out-rates of Ontario and the in-rates of Ontario equal the out-rates of Atlantic provinces.
Source: The 1981 and 1986 Census 2 percent, and the 1991 Census 3 percent Public Sample Tapes.
ward in-migration from the Atlantic region than the migration rates in the opposite direction. This may suggest that a province which is more attractive
INTERREGIONAL MIGRATION BETWEEN ONTARIO AND ATLANTIC CANADA 153
to the native population of other provinces is also more attractive to people born in Ontario who had subsequently moved out. Several studies have paid special attention to the phenomenon of return migration in low-income provinces, suggesting that return migration occurs mainly from a high-income region to a low-income region (Gmelch 1983; Hiscott 1987; Richling 1985). The migration rates, however, reveal that migrants who previously originated from high-income provinces are more likely to make a return move. For instance, the Atlantic region has a higher proportion, but lower rate, of return in-migration compared to Ontario. Since low-income provinces possibly have a long history of losing their natives, they may have a relatively large stock of natives living in other regions (Rogers and Belanger 1990). At the same time, these provinces may also be in a disadvantaged position in attracting the natives of other provinces. As a result, their return migrants are relatively more important in the composition of their in-migration. On the other hand, high-income provinces are likely to have a small stock of their natives living outside, relative to the size of the province. Consequently a small number of return migrants may result in a high rate relative to this stock, but a low percentage of total arrivaIs.
It is interesting to compare the data based on one year and five year migration experiences. From the 1990-1991 migration data in Table 1, we can see that return migration dominates both the direction and size of net total migration between the two regions. The total numbers of the three types of migrants in 1990-91 are much larger than one fifth of the corresponding numbers in 1986-91 for both regions. While the 1990-91 period may have been unusual, it is more likely that there is a considerable element of short term repetitive migration which is not recorded in five-year periods. There is another important difference in the propensity of short terrn migration between the two regions. For the Atlantic region, the numbers of in-migrants in 1990-91 are about half of those in 1986-91. For Ontario, however, the numbers in 1990-91 are between one-third and one-fourth of those in 1986-91. In particular, the percentage of return migrants amang total in-migrants in 1990-91 in the Atlantic region is much higher than the corresponding five-year average. These results suggest that short terrn repetitive migration is a more important element of the migration system of the Atlantic region.
Socio-Demographic Characteristics of Three Types of Migrants
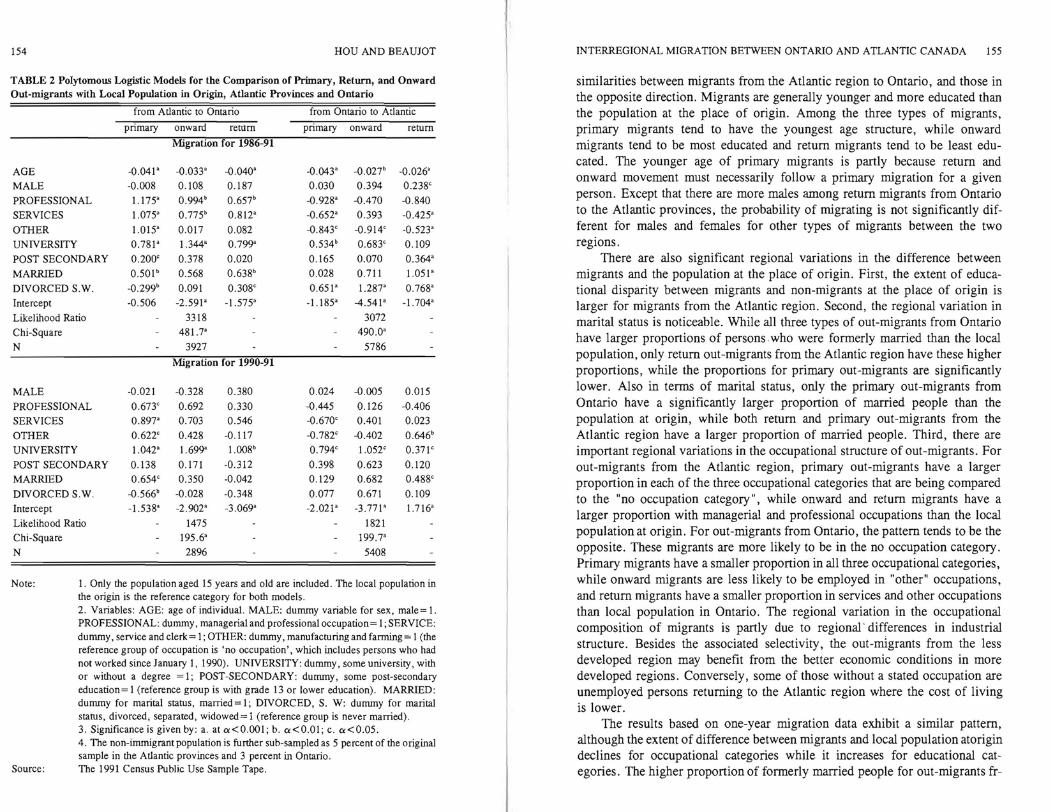
In Table 2, the three types of out-migrants are compared with the local population in the place of origin. We present the coefficients of polytomous logistic regression rather than log odds ratios or probabilities, because only the significance and sign of each variable are considered here.
We first examine the migration by five-year periods. In terms of the difference between out-migrants and local population in origin, there are sorne
154 HOU AND BEAUJOT
TABLE 2 PoIytomous Logistic Models for the Comparison of Primary, Retum, and Onward Out-migrants with Local Population in Origin, Atlantic Provinces and Ontario
from Allantic 10 Ontario from Ontario to Atlantic
primary onward retum primary onward retum
Migration for 1986-91
AGE -0.041' -0.033' -0.040' -0.043' -0.027 b -0.026' MALE -0.008 0.108 0.187 0.030 0.394 0.238'
PROFESSIONAL 1.175' 0.994 b 0.657 b -0.928' -0.470 -0.840
SERVICES 1,075' 0.775' 0,812' -0.652' 0.393 -0.425'
OTHER 1.015' 0.017 0,082 -0,843' -0.914' -0,523'
UNIVERSITY 0.781' 1.344' 0.799' 0,534 b 0.683' 0.109 POST SECONDARY 0.200' 0.378 0.020 0.165 0.070 0.364' MARRlED 0.501 b 0.568 0.638 b 0.028 0.711 1.051 ' DIVORCED S.W. -0.299b 0.091 0.308' 0.651' 1.287' 0.768'
Intercept -0,506 -2.591' -1.575' -1.185' -4.541' -1.704'
Likelihood Ratio 3318 3072 Chi-Square 481.7' 490.0'
N 3927 5786
Migration for 1990-91
MALE -0.021 -0.328 0.380 0.024 -0.005 oms PROFESSIONAL 0.673' 0.692 0.330 -0.445 0.126 -0.406 SERVICES 0.897' 0.703 0,546 -0.670' 0.401 0,023
OTHER 0,622' 0.428 -0,117 -0,782' -0.402 0.646b
UNIVERSITY 1.042' 1.699' l.oo8 b 0.794' 1.052' 0.371'
POST SECONDARY 0.138 0.171 -0.312 0.398 0.623 0.120 MARRIED 0,654' 0.350 -0.042 0.129 0.682 0.488' DIVORCED S,W, -0.566' -0.028 -0.348 0.077 0.671 0.109 Intercept -1.538' -2.902' -3,069' -2.021' -3.771' 1.716'
Likelihood Ratio 1475 1821 Chi-Square 195.6' 199.7' N 2896 5408
Note: 1. Only the population aged 15 years and old are included. The local population in the origin is the reference category for both models. 2. Variables: AGE: age of individual. MALE: dummy variable for sex, male = 1. PROFESSIONAL: dummy, managerial and professional occupation= 1; SERVICE: dummy, service and clerk = 1; OTHER: dummy, manufacturing and farming = 1(the referellce group of occupation is 'no occupation', which includes persons who had not worked since January 1, 1990). UNIVERSITY: durnmy, sorne university, with or without a degree =1; POST-SECONDARY: dummy, sorne post-secondary education = 1 (reference group is with grade 13 or lower education). MARRIED: dummy for marital status, married = 1; DIVORCED, S. W: dummy for marital statuS, divorced, separated, widowed= 1 (reference group is never married). 3. Significance is given by: a. at a<O.ool; b. a<O.OI; c. a<0.05. 4. The non-immigrant population is further sub-sampled as 5 percent of the original sample in the Allantic provinces and 3 percent in Ontario.
Source: The 1991 Census Public Use Sampie Tape.
INTERREGIONAL MIGRATION BETWEEN ONTARIO AND ATLANTIC CANADA 155
similarities between migrants from the Atlantic region to Ontario, and those in the opposite direction. Migrants are generally younger and more educated than the population at the place of origin. Among the three types of migrants, primary migrants tend to have the youngest age structure, while onward migrants tend to be most educated and return migrants tend to be least educated. The younger age of primary migrants is partly because return and onward movement must necessarily follow a primary migration for a given person. Except that there are more males among return migrants from Ontario to the Atlantic provinces, the probability of migrating is not significantly different for males and females for other types of migrants between the two regions.
There are also significant regional variations in the difference between migrants and the population at the place of origin. First, the extent of educational disparity between migrants and non-migrants at the place of origin is larger for migrants from the Atlantic region. Second, the regional variation in marital status is noticeable. While all three types of out-migrants from Ontario have larger proportions of persons ,who were formerly married than the local population, only return out-migrants from the Atlantic region have these higher proportions, while the proportions for primary out-migrants are significantly lower. Also in terms of marital status, only the primary out-migrants from Ontario have a significantly larger proportion of married people than the population at origin, while both return and primary out-migrants from the Atlantic region have a larger proportion of married people. Third, there are important regional variations in the occupational structure of out-migrants. For out-migrants from the Atlantic region, primary out-migrants have a larger proportion in each of the three occupational categories that are being compared to the "no occupation category", while onward and return migrants have a larger proportion with managerial and professional occupations than the local population at origin. For out-migrants from Ontario, the pattern tends to be the opposite. These migrants are more likely to be in the no occupation category. Primary migrants have a smaller proportion in all three occupational categories, while onward migrants are less likely to be employed in "other" occupations, and return migrants have a smaller proportion in services and other occupations than local population in Ontario. The regional variation in the occupational composition of migrants is partly due to regional' differences in industrial structure. Besides the associated selectivity, the out-migrants from the less developed region may benefit from the better economic conditions in more developed regions. Conversely , sorne of those without a stated occupation are unemployed persons returning to the Atlantic region where the cost of living is lower.
The results based on one-year migration data exhibit a similar pattern, although the extent of difference between migrants and local population atorigin declines for occupational categories while it increases for educational categories. The higher proportion of formerly married people for out-migrants fr
156 HOU AND BEAUJOT
TABLE 3 Po1ytomous Logi5tic Models for the Comparison of Primary, Return, and Onward In-migrants with Local Population in Destination, Atlantic Provinces and Ontario
from Atlantic to Ontario - from Ontario to Atlantic
primary onward retum primary onward retum
Migration for 1986-91
AGE -0.043' -0.027b -0.027' -0.041' -0.034' -0.041'
MALE 0.213 0.555' 0.386' -0.093 0.008 0.107
PROFESSIONAL -0.174 0.214 -0.116 0.173 0.034 -0.318
SERVICES -0.116 0.873' 0.081 0.396b 0.183 0.167
OTHER -0.690' -0.790 -0.363' 0.745' -0.212 -0.195
UNIVERSITY 0.636' 0.868b 0.278 0.847' 1.345' 0.805'
POST SECONDARY 0.230 0.146 0.451' 0.371' 0.515' 0.162
MARRIED 0.309 0.954 1.312' 0.179 0.193 0.353
DIVORCED S.W. 0.613' 1.177' 0.709' -0.161 0.210 0.475'
Intercept -1.158' -4.429' -1.609' -0.672' -2.731' -1.722'
Likelihood Ratio 2868 3605
Chi-Square 386.9' 452.3'
N 3404 6301
Migration for 1990-91
AGE -0.046' -0.052b -0.033b -0.045' -O.044b -0.033'
MALE 0.068 0.111 0.056 -0.020 -0.325 0.387
PROFESSIONAL 0.466 0.981 0.425 -0.163 0.026 -0.434
SERVICES -o.ül5 1.007 0.651' 0.286 0.165 -0.031
OTHER -0.397 -0.082 1.006' 0.295 0.192 -0.365
UNIVERSITY 0.712' 0.958' 0.404 1.078' 1.661' 1.012'
POST SECONDARY 0.512' 0.702 0.186 0.154 0.151 -0.321
MARRIED 0.176 0.736 0.620b 0.598' 0.257 -0.089
DIVORCED S.W. -0.227 0.339 -0.164 -0.361' 0.135 -0.153
Intercept -1.998' -3.776' -1.587' -1.828' -3.196' -3.337'
Likelihood Ratio 1758 1611
Chi-Square 202.4' 219.0'
N 3003 5308
Notes: 1. The local population in the destination is the reference category for both models. 2. See notes 2, 3 and 4 in Table 2.
Sources: The 1991 Census Public Use Sample Tape.
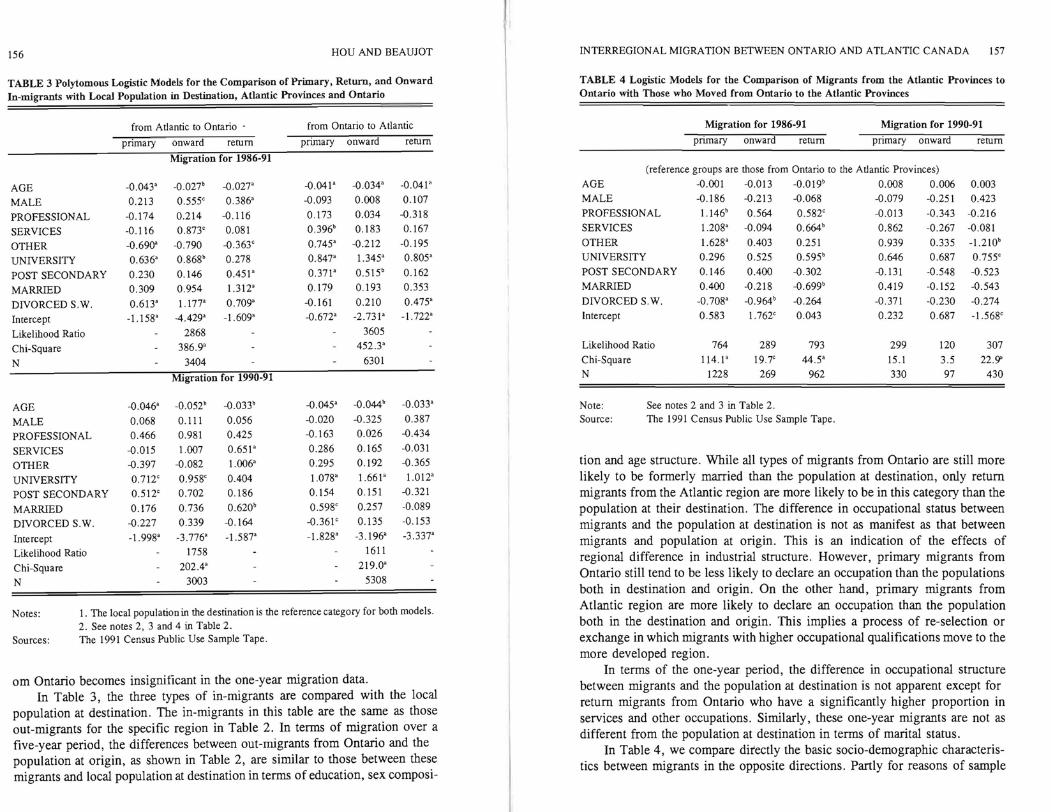
om Ontario becomes insignificant in the one-year migration data. In Table 3, the three types of in-migrants are compared with the local
population at destination. The in-migrants in this table are the same as those out-migrants for the specifie region in Table 2. In terms of migration over a five-year period, the differences between out-migrants from Ontario and the population at origin, as shown in Table 2, are similar to those between these migrants and local population at destination in terms of education, sex composi-
INTERREGIONAL MIGRATION BETWEEN ONTARIO AND ATLANTIC CANADA 157
TABLE 4 Logi5tic Models for the Comparison of Migrants from the Atlantic Provinces to Ontario with Those who Moved from Ontario to the Atlantic Provinces
Migration for 1986-91 Migration for 1990-91
primary onward retum primary onward retum
(reference groups are those from Ontario to the Atlantic Provinces) AGE -0.001 -0.013 -0.019b 0.008 0.006 0.003 MALE -0.186 -0.213 -0.068 -0.079 -0.251 0.423 PROFESSIONAL 1.146b 0.564 0.582' -0.013 -0.343 -0.216 SERVICES 1.208' -0.094 0.664b 0.862 -0.267 -0.081 OTHER 1.628' 0.403 0.251 0.939 0.335 -1.21Ob
UNIVERSITY 0.296 0.525 0.595b 0.646 0.687 0.755' POST SECONDARY 0.146 0.400 -0.302 -0.131 -0.548 -0.523 MARRIED 0.400 -0.218 -0.699b 0.419 -0.152 -0.543 DIVORCED S.W. -0.708' -0.964b -0.264 -0.371 -0.230 -0.274 Intercept 0.583 1.762' 0.043 0.232 0.687 -1.568'
Likelihood Ratio 764 289 793 299 120 307 Chi-Square 114.1' 19.7' 44.5' 15.1 3.5 22.9' N 1228 269 962 330 97 430
Note: See notes 2 and 3 in Table 2. Source: The 1991 Census Public Use Sample Tape.
tion and age structure. While all types of migrants from Ontario are still more likely to be formerly married than the population at destination, only retum migrants from the Atlantic region are more likely to be in this category than the population at their destination. The difference in occupational status between migrants and the population at destination is not as manifest as that between migrants and population at origin. This is an indication of the effects of regional difference in industrial structure. However, primary migrants from Ontario still tend to be less likely to declare an occupation than the populations both in destination and origin. On the other hand, primary migrants from Atlantic region are more likely to declare an occupation than the population both in the destination and origin. This implies a process of re-selection or exchange in which migrants with higher occupational qualifications move to the more developed region.
In terms of the one-year period, the difference in occupational structure between migrants and the population at destination is not apparent except for retum migrants from Ontario who have a significantly higher proportion in services and other occupations. Similarly, these one-year migrants are not as different from the population at destination in terms of marital status.
In Table 4, we compare ditectly the basic socio-demographic characteristics between migrants in the opposite directions. Partly for reasons of sample
158 HOU AND BEAUJOT
size, the one-year migrants in opposite directions are not significantly different from each other. In tenns of five-year migration, however, primary migrants from Atlantic region are more likely to declare an occupation and to work in high status occupations. Meanwhile, return migrants from the Atlantic region are more likely to have an occupation, have higher occupational status, and are more educated than those returning to the Atlantic region. This suggests that the Atlantic region sends out migrants with higher qualifications than those it receives, while those migrants returning to the Atlantic region have lower qualification than those migrants returning from the Atlantic region to Ontario.
Sorne studies suggest that marital disruption may be one of the determinants of return moves (Hou and Beaujot 1994). This is confinned here, since return migrants in both directions are more likely to be fonnerly married than the local population as shown in Table 2 and Table 3. However, primary and onward migrants from Ontario to the Atlantic region are also more likely to be fonnerly married than those in the opposite direction for five-year period migration, as shown in Table 4. This may suggest that primary and onward migrations from the more developed region to the less developed region are more associated with non-economic reasons.
Conclusion
This study has considered the trend and spatial variation of various types of migration, and their impact on the population redistribution system, by examining the migration flows between Ontario and Atlantic Canada. These analyses indicate that primary migrants are the major part of out-migration from the Atlantic region to Ontario, and retum migrants comprise the major part of inmigration from Ontario to the Atlantic region. During the three census periods from 1981 to 1991, the Atlantic region has experienced a net loss in total migrants. However, retum migrants have partially compensated for the net loss. In addition, the net loss for the Atlantic region, or the net gain for Ontario, is not only in numbers but a1so in socio-demographic composition. Primary out-migrants from the Atlantic region, which is the major component of their total out-migration, tend to have higher occupational attainments than primary migrants who moved into the Atlantic region from Ontario, even when the effects of regional difference in industrial structure are considered. On the other hand, return in-migrants to the Atlantic region, which dominate in the region's total in-migration, tend to be less educated and they have lower occupational attainments than those who retumed to Ontario. This re-selection process promotes the concentration of population with higher socio-economic profiles in the more developed region. The movement toward the Atlantic region is more likely to involve persons who do not declare an occupation and persons who are formerly married. This would imply movements around
INTERREGIONAL MIGRATION BETWEEN ONTARIO AND ATLANTIC CANADA 159
retirement as well as returns following unemployment or marital disruption. Retum migrants, together with onward migrants, account for more than
half of the total migrants in Canada in the census periods of 1981-86 and 198691. For the less developed region, retum migration compensates for sorne of the loss. Without retum migrants, the population distribution in Canada would be much more unequal. Return migration also plays a dynarnic role in economic adjustment. The function of migration in economic adjustment, or in the efficient allocation of resources, involves both short-tenn and long-tenn considerations. In the short run, migration occurs more frequently and fluctuates with the changes in the national labour market. When there is a high demand in a given region, total migrants increase, especially primary migrants. When the region shifts to a decline in economic activity, primary migrants decline and many previous migrants retum to their previous province of residence. The regions with large retum migration among their in-migrants act as a reservoir of labour for other regions which would need the labour force in periods of growth. In this sense, far from being inefficient, return migration is indispensable. In the long run, net migration flows into regions that have continuous labour force demands, and is selective of persons with more qualifications.
References
Beaujot, Roderic. 1991. Population Change in Canada: The Challenges of Policy Adaptation. Toronto: McClelland and Stewart.
Carel, Genevieve, William Coffey, and Mario Polèse. 1988. "The Impact of Migration on Regional Development: A Comparison of Two Lines of Thought". Report written for the Review of Demography and Its Implications for Economic and Social Policy. Ottawa: Health and Welfare.
DaVanzo, Julie. 1976. "Differences Between Return and Nonreturn Migration: An Econometric Analysis". International Migration Review, 10: 13-25.
___. 1983. "Repeat Migration in the United States: Who Moves Back and Who Moves On?". The Review of Economies and Statistics, 65: 552-559.
Gmelch, George. 1983. "Who Retums and Why: Retum Migration Behaviour in Two North Atlantic Societies". Human Orga,!ization, 42: 46-54.
Grant, Kenneth and John Vanderkamp. 1984. "A Descriptive Analysis of the Incidence and Nature of Repeat Migration Within Canada, 1968-71". Canadian Studies in Population, Il: 61-78.
___. 1986. "Repeat Migration and Disappointment". Canadian Journal of Regional Science, 9: 299-322.
Hiscott, Robert. 1987. "Retum Migration From Ontario to Atlantic Canada: A Comparison of Retuming and Non-Return Migrants". Canadian Review of Sociology and Anthropology, 24: 586-597.
Hou, Feng and Roderic Beaujot. 1994. "The Differentiation of Determinants
160 HOU AND BEAUJOT
Among Return, Onward and Primary Migrants in Canada". Canadian Studies in Population, 21: 1-19.
Lee, Anne S. 1974. "Return Migration in the United States". International Migration Review, 8: 283-300.
Lee, Everett. 1966. "A Theory of Migration". Demography, 3: 47-57. Long, Larry. 1988. Migration and Residential Mobility in the United States.
New York: Russel Sage Foundation. Newbold, Bruce and Kao-Lee Liaw. 1990. "Characterization of Primary,
Return and Onward Interprovincial Migration in Canada: Overall and AgeSpecific Patterns". Canadian Journal of Regional Science, 13: 17-34.
Richling, Bamett. 1985. "You'd Never Starve Here: Return Migration to Rural Newfoundland". Canadian Review of Sociology and Anthropology, 16: 333-342.
Rogers, A. and A. Belanger. 1990. "The Importance of Place of Birth in Migration and Population Redistribution Analysis". Environment and Planning A, 22: 193-210.
Rosenbaurn, Harry. 1988. "Return Inter-Provincial Migration Canada, 19661971". Canadian Studies in Population, 15: 51-65.
___. 1993. "Selectivity Among Various Types oflnter-Provincial Migrants, Canada 1976-1981 ". Canadian Studies in Population, 20: 85-106.
Stone, Leroy. 1969. Migration In Canada: Regional Aspects. Ottawa: Dominion Bureau of Statistics.
___. 1971. "On The Correlation Between Metropolitan Area In- and OutMigration by Occupation" . Journal ofthe American Statistical Association, 66: 693-701.
___. 1979. Occupational Composition of Canadian Migration. Ottawa: Industry, Trade and Commerce.
Terrnote, Marc. 1987. "The Growth and Redistribution of the Canadian Popu1ation", in W.J. Coffey and M.Polese (eds.). Still Living Together. Ottawa: Institute for Research on Public Policy.
Vanderkamp, John and Kenneth Grant. 1988. "Canadian Internal Migration Statistics: Sorne Cornparisons and Evaluations". Canadian Journal of Regional Science, Il: 9-32.
Ze1insky, Wilbur. 1974. "Selfward Bound? Personal Preferences and the Changing Map of American Society". Economie Geography, 50: 144-179.