Embed Size (px)
Citation preview

A study of protein^carotenoid interactions in the astaxanthin-proteincrustacyanin by absorption and Stark spectroscopy; evidence for the
presence of three spectrally distinct species
StanisIaw Krawczyk a;*, George Britton b
a Institute of Physics, Maria Curie-SkIodowska University, Pl. M. Curie-SkIodowskiej 1, 20-031 Lublin, Polandb School of Biological Sciences, University of Liverpool, Liverpool L69 7ZB, UK
Received 31 July 2000; received in revised form 4 October 2000; accepted 4 October 2000
Abstract
Molecular mechanisms underlying the peculiar spectral properties of the carotenoid astaxanthin in K-crustacyanin, theblue carotenoprotein isolated from the exoskeleton of the lobster Homarus gammarus, were investigated by comparing thebasic electrooptical parameters of astaxanthin free in vitro with those of astaxanthin in the complex. Absorption andelectroabsorption (Stark effect) spectra were obtained for K-crustacyanin in low-temperature glasses to provide informationabout the molecular interactions that lead to the large bathochromic shift of the spectra resulting from this complexation.The low-temperature spectra reveal the presence of at least three spectral forms of K-crustacyanin, with vibronic (0^0)transitions at 14 000 cm31, 13 500 cm31 and 11 600 cm31 (corresponding to approximately 630, 660 and 780 nm, respectively,at room temperature) and with relative aboundance 85%, 10% and 5%. The longer wavelength absorbing species have notpreviously been detected. The changes in polarizability and in permanent dipole moments associated with the S0CS2
electronic transition for all these forms are about 1.5 times larger than for isolated astaxanthin. The results are discussed withreference to the symmetric polarization model for astaxanthin in K-crustacyanin. ß 2001 Elsevier Science B.V. All rightsreserved.
Keywords: Carotenoprotein; Crustacyanin; Astaxanthin; Low temperature; Stark spectroscopy
1. Introduction
Crustacyanins are pigmented proteins frequentlyfound in the exoskeleton of many marine crusta-ceans, and their blue or purple color comes fromthe carotenoid astaxanthin (Scheme 1). This is or-
ange in the free form but speci¢c molecular interac-tions with the protein cause a large bathochromicspectral shift, giving the blue color. The best knownprotein of this type is K-crustacyanin, of molecularmass about 350 kDa, isolated from the carapace ofthe lobster Homarus gammarus. At low ionicstrength, K-crustacyanin dissociates to give eight L-crustacyanin units, each of which is a heterodimer oftwo apoprotein subunits of ca. 19^21 kDa molecularmass, and carries two astaxanthin molecules [1^4].The apoproteins belong to the lipocalin family ofproteins, which are small extracellular proteins that
0167-4838 / 01 / $ ^ see front matter ß 2001 Elsevier Science B.V. All rights reserved.PII: S 0 1 6 7 - 4 8 3 8 ( 0 0 ) 0 0 2 4 2 - 9
* Corresponding author. Fax: +48-81-537-6191;E-mail : [email protected]
BBAPRO 36314 2-1-01
Biochimica et Biophysica Acta 1544 (2001) 301^310www.elsevier.com/locate/bba

bind small hydrophobic molecules, e.g. retinol orbilins, and link the lipocalins structurally with thebiologically important family of polyene^proteincomplexes which include visual pigments such asrhodopsin. As in rhodopsins, the most striking spec-tral property of the crustacyanins is the large shift ofthe absorption spectrum of the chromophore, in thiscase astaxanthin, from about 480 nm in organic sol-vents to 632 nm in K-crustacyanin, i.e. by about 5000cm31. The large shift in the absorption spectrum ofastaxanthin in K-crustacyanin results from a non-co-valent attachment of carotenoid to protein in a waythat causes a perturbation of the electronic states ofthe carotenoid.
Resonance Raman spectra of astaxanthin in K-crustacyanin are signi¢cantly modi¢ed compared tothe spectra of free astaxanthin. The strong Ramanline of free astaxanthin at 1523 cm31, which ismainly associated with the in-phase CNC stretch,is shifted to 1492 cm31 for astaxanthin bound toK-crustacyanin [5^8]. The frequency decrease ob-served for the other strong Raman lines of astaxan-thin, at 1159 cm31 and 1008 cm31, is much smaller(ca. 5 cm31) but the relative intensities of these linesare stronger by a factor of about two under closelysimilar excitation conditions, i.e. with the excitingwavelength always positioned within the 0^0 vibronictransition.
Studies on replacement of astaxanthin in K-crusta-cyanin by di¡erent carotenoids [1,9] showed the nec-essary presence of the keto groups at C(4) and C(4P)in the two L-rings in order for the pigment^proteininteractions to result in the large shift of the absorp-tion spectrum of the reconstituted carotenoid. 13C-nuclear magnetic resonance (NMR) studies of K-crustacyanin reconstituted with labelled astaxanthin[8^10] showed predominantly symmetric changes inthe distribution of electron density in the two halvesof the molecule, with atoms at positions 12, 12P and14, 14P disturbed most strongly. Additionally, somesmaller asymmetrical perturbation was observed, so
that the changes in electronic density for these atomsin the two halves of the molecule are not quantita-tively identical.
Several hypotheses [2,3,5,7,10] have been put for-ward to explain the substantial changes in visibleabsorption, resonance Raman, circular dichroismand NMR spectra in terms of the intermolecularinteractions of astaxanthin in the K-crustacyanincomplexes. Among the interactions that have beenconsidered are exciton interaction between the pig-ment molecules, packing strain in the protein pocket,twisting of the carotenoid or a polarization bycharged groups [3]. Recently, the hypothesis postu-lating a strong polarizing e¡ect due to either inter-molecular interactions or reversible chemical modi¢-cations on the C(4) and C(4P) keto groups ofastaxanthin was examined by resonance Raman, ab-sorption and circular dichroism spectroscopy, and13C-MAS-NMR [8^10]. These spectroscopic studieswere performed in conjunction with carotenoid sub-stitution including both substitution with other car-otenoids with selected structural features and withastaxanthin selectively labelled with 13C. The modelwas additionally substantiated by computationalanalysis by semiempirical methods [7,10]. The analy-sis examined possible e¡ects of protonation of one orboth of the C(4) and C(4P) keto groups, hydrogenbonding and counterion e¡ects. Absorption wave-lengths were successfully reproduced for several typesof molecular modi¢cations, but the most comprehen-sive agreement between model calculations and ex-perimental spectral characteristics and NMR datawas achieved for a model in which the astaxanthinis more or less symmetrically perturbed by protona-tion of both 4-keto functions. This model leavesopen the question concerning the observed asymme-try in electron distribution near the chain center.
Since a modi¢cation of the distribution of elec-trons within the molecule should, in principle, havean e¡ect on molecular parameters like permanentdipole moments and polarizabilities in the groundand excited electronic states, in this study we appliedthe technique of the electrochromism (or electroab-sorption or Stark e¡ect) to investigate further theprotein-induced modi¢cations of the properties ofthe astaxanthin chromophore in K-crustacyanin.The spectroscopic method is based on inducing smallchanges in molecular electronic energy levels of the
Scheme 1.
BBAPRO 36314 2-1-01
S. Krawczyk, G. Britton / Biochimica et Biophysica Acta 1544 (2001) 301^310302

chromophore through its interaction with an externalelectric ¢eld, which result in a change of the absor-bance of the sample. The samples were investigatedat temperatures su¤ciently low to enhance the spec-tral resolution in comparison to spectra recordedpreviously.
2. Materials and methods
K-Crustacyanin was extracted from the carapaceof the lobster H. gammarus and puri¢ed by publishedmethods [11]. It was stored as a precipitate in 50%saturated ammonium sulfate. Samples were preparedin glycerol/bu¡er or ethylene glycol/bu¡er using 10mM KCl, pH 7.0^7.3. For sample preparation, K-crustacyanin was sedimented by centrifugation, dis-solved in glass-forming media and the solution wasapplied to a thin (W0.1 mm) cuvette with glass win-dows coated with an electrically conducting indium-tin oxide layer. The cuvette was then inserted into astream of cold nitrogen vapor inside a transparentdouble-walled glass tube. The samples were mixedand frozen in less than 2 min after addition of thesolvent.
To prevent sample cracking at low temperatures,the spectra were recorded at temperatures about115^130 K. This limitation did not in£uence the re-sults, since deeper cooling of the samples did notresult in a signi¢cant increase of spectral resolution.The increase of the glycerol content from 50% to65% did not noticeably in£uence the spectra, butthe lowest concentration of glycerol was preferredin order to avoid the risk of the e¡ects which occurin the presence of ethylene glycol (see Section 3).
Absorption and quadratic electroabsorption(Stark) spectra were recorded by using light from atungsten halogen lamp, which was dispersed by asingle grating monochromator (SPM2, 0.4 m, CarlZeiss Jena) driven by a stepping motor. The lightintensity transmitted by the sample was detected in20^25 cm31 intervals by a Si photodiode (Hamamat-su S1336 BQ) equipped with a linear I-V converter.The Stark signal (vI) was induced by W1000 V A.C.voltage and was recorded at the second harmonicwith a digital lock-in ampli¢er (SR830, Stanford Re-search Systems) which auxiliary D.C. input was usedto digitize the total transmitted light intensity (I).
The spectrum of absorbance changes, vA(X) =vI/(2.3WI), can be expressed as a linear combination ofthe ¢rst and second derivatives of the absorptionspectrum with respect to the wavenumber X [12]:
vA � a1WD�1� � a2WD�2�; where : D�i� � Xdi�A=X �
dX i
�1�The changes in molecular polarizability and dipolemoment upon electronic excitation, vK and vW, canthen be calculated from the expressions for the twocoe¤cients of ¢t:
a1 � vK
10���2p
hc��3cos2 Q31�cos2 M � 23cos2 Q �F2 �2�
a2 � �vW �210
���2p
h2c2��3cos2 N31�cos2 M � 23cos2 N �F2
�3�The other molecular parameters Q and N are the an-gles the dipole transition moment makes, respec-tively, with the principal axis of largest polarizabilityand with the vector vW. The values of Q and N arederived from the dependence of Stark spectra on theangle M (the angle between electric ¢eld F and theelectric vector of light), that is varied in the courseof the experiment.
3. Results
3.1. Free astaxanthin
The spectra of free astaxanthin in organic solvent,serving as reference data for comparison with thespectra of astaxanthin in K-crustacyanin, are shownin Fig. 1. The absorption and Stark spectra wererecorded for astaxanthin in the glassy solvent ethyl-benzene/toluene (1:1, v/v) at 107 K. The lower panelin Fig. 1 shows the ¢t to the electric ¢eld-induced vAspectrum, obtained by a linear least squares proce-dure according to Eq. 1. As in the case of othercarotenoids [13], both the ¢rst and the second deriv-ative of the absorption spectrum were needed to ob-tain a satisfactory ¢t to the Stark spectrum, and thecontributions from both derivative components areof comparable value. The electrooptical parameters
BBAPRO 36314 2-1-01
S. Krawczyk, G. Britton / Biochimica et Biophysica Acta 1544 (2001) 301^310 303

estimated from Eqs. 2 and 3 for two samples are:
vK � �1360� 100� �A3; vW � �7:4� 0:4� Debye:
The angles N and Q (cf. Eqs. 2 and 3) are within thelimit of 15 þ 6³. This is also similar to the data forother carotenoids, and points to the axial polarizabil-ity of the conjugated carbon chain nearly parallel tothe transition moment.
3.2. Crustacyanin
3.2.1. Natural K-crustacyanin in glycerol glassFig. 2 shows the low-temperature absorption spec-
trum (A) and Stark spectrum (B) of K-crustacyaninin 55% glycerol glass at 113 K. The maximum in thelow-temperature absorption spectrum at 15 250 cm31
(656 nm) is red-shifted by 600 cm31 relative to thatat room temperature. Lowering of temperature to 77K did not result in further band narrowing. Despiteof this persistent spectral di¡useness at low temper-ature, distinct species are discernible from some spec-
tral features. A weak absorption band at 11 600cm31, which is most probably the (0^0) vibronictransition in the most red-shifted pigment species,is readily observable in the spectra of K-crustacyanin.The corresponding (0^1) transition is indicated by aminimum in the second derivative (not shown) at12 750 cm31 from (0^0), i.e. 1150 cm31 like the spac-ing between the strongest bands at higher wavenum-bers. The presence of another spectral componentcan also be inferred from the second derivative atabout 14 000 cm31. The presence of distinct spectralforms of astaxanthin in K-crustacyanin ¢nds supportin Stark spectra.
The Stark spectrum of K-crustacyanin is shown inFig. 2B (points). Its shape partly resembles the ¢rstderivative of the absorption spectrum but the detailsare less pronounced and it is shifted by about 400cm31 toward the lower frequencies. The least squares
Fig. 1. A: Absorption, and B: electroabsorption (Stark) spectraof astaxanthin recorded at normal incidence of the light ontothe sample in ethylbenzene/toluene 1:1. Temperature: 107 K,electric ¢eld strength (r.m.s.) : 87 000 V/cm.
Fig. 2. A: (Points) absorption spectrum of K-crustacyanin at113 K and its three components (lines). B: (Points) Stark spec-trum recorded with electric ¢eld strength (r.m.s.) 85 700 V/cmat normal incidence. The dashed line in B represents the ¢t ac-cording to Eq. 1. Continuous line shows the ¢t obtained withthe derivatives of the three components of absorption spectrum.Both panels show each third experimental point.
BBAPRO 36314 2-1-01
S. Krawczyk, G. Britton / Biochimica et Biophysica Acta 1544 (2001) 301^310304

¢t based directly on the combination of the ¢rst andsecond derivatives of the absorption spectrum isshown with a dashed line in Fig. 2B. Fitting Starkspectra in this way gives the following mean valuesfrom di¡erent samples:
vK � �1650� 300� �A3; vW � �13� 2� Debye units:
However, while an approximate similarity of the ¢t-ting curve to the experimental data can be observedat wavenumbers above 15 000 cm31, a very poor ¢tquality appears towards the red from this point. Thesharp features of the ¢tting curve do not appear inthe experimental spectrum and there is a shift of thepositions of the maxima and minima between thetwo curves. These di¡erences between the ¢ttingcurve and experimental data can be considered tobe indicative of the presence of several spectral formsof astaxanthin in K-crustacyanin. Therefore, in addi-tion to the readily discernible form with (0^0) tran-sition at 11 600 cm31, we assume the presence of atleast one other red-shifted form detectable on thelow-frequency slope of the absorption spectrum, as-sociated with relatively strong positive vA in theStark spectrum in the region 12 000^13 000 cm31,and contributing a negative vA at about 14 000cm31. These di¡erences between the experimentalStark spectrum and the ¢tting curve in the region12 000^15 000 cm31 suggest a contribution from acomponent with the absorption spectrum shifted tothe red by about 400^600 cm31 relative to the maincomponent which dominates at wavenumbers above15 000 cm31. More direct evidence for the presenceof a red-shifted spectral form with the (0^0) transi-tion in this region follows from absorption and Starkdata in ethylene glycol glass (see below).
The comparison of the amplitudes of the measuredabsorbance changes with those calculated as the leastsquares ¢t in Fig. 2B shows that the estimates of vK
and vW given above are too low; they would be ex-pected to be larger in a more accurate ¢t that takesinto account the complex origin of the absorptionspectrum. To improve the estimates of electroopticalparameters for the spectrally inhomogeneous asta-xanthin in K-crustacyanin, we assumed that the ab-sorption spectrum consists of three components iden-tical in shape and applied the following procedurefor their approximate extraction. First, the absorp-tion spectrum was shifted by 2400 cm31 toward thered, then scaled and subtracted from the originalspectrum so as to cancel the weak absorption bandat 11 600 cm31. The resulting di¡erence was shiftedby 1100 cm31 to the red and then subtracted fromitself after appropriate scaling so as to remove theremaining low-energy tail together with a small lobeat about 12 800 cm31. This spectrum, in the follow-ing referred to as spectral form I, together with itstwo copies shifted to the red by 540 cm31 (spectralform II) and by 2500 cm31 (spectral form III) werethen taken to ¢t the original absorption spectrum(see Fig. 2A) by a least squares procedure, whichresults in their relative amplitudes of about 0.86,0.09 and 0.05, respectively. The linear combinationof the ¢rst and second derivatives of these compo-nents adjusted to the experimental Stark spectrum isshown as a continuous line in Fig. 2B. It should bestressed at this point that these values are onlyweakly sensitive to the procedure of extracting thespectral shape common to all three components,and vary signi¢cantly depending on the assumedspectral shift of only the central component (II) rel-ative to the strongest one (I). The estimated range ofspectral shifts is relatively narrow, from 400 cm31 to800 cm31. The mean values of vK and vW for thethree spectral forms are quoted in Table 1.
Measurements with linearly polarized light at dif-ferent angles of incidence (0^55³) have shown thatthe angles the transition dipole moment makes with
Table 1Spectral characteristics (wavenumbers and wavelengths of vibronic (0^0) band) and electrooptical parameters of the three forms of as-taxanthin in K-crustacyanin estimated from the ¢ts to the low-temperature absorption and Stark spectra
Spectral form X(0^0) (cm31) V(0^0) (nm) Approximate content (%) vK (Aî 3) vW (D)
I 14 000 714 85 þ 3 2000 þ 400 13 þ 3II 13 500a 740a 10 þ 2 4800 þ 2000 22 þ 15III 11 600 862 5 þ 2 2200 þ 600 9 þ 2aApproximate value; X(0^0) for the spectral form II was estimated to lie in the range 13 200^13 600 cm31 (see text).
BBAPRO 36314 2-1-01
S. Krawczyk, G. Britton / Biochimica et Biophysica Acta 1544 (2001) 301^310 305
the polarizability axis (Q) or with the di¡erence dipole(N) are both close to zero. The Stark spectra werefound to be of the same shape for di¡erent angles,which indicates that this statement refers equally toall spectral forms.
3.2.2. In ethylene glycol glassSigni¢cant spectral changes occur when K-crusta-
cyanin is dissolved in aqueous ethylene glycol. Arapid change in color to purple^blue occurs immedi-ately after the protein is dissolved. The new absorp-tion spectrum then changes much more slowly andstabilizes, suggesting that an equilibrium is reachedbetween the native form of K-crustacyanin (as ob-served, for example, in aqueous glycerol) and a spe-ci¢cally partly denatured or dissociated form. Thisconclusion is supported by the low-temperature spec-tra. Fig. 3A compares the absorption spectra ob-tained in media containing di¡erent ethylene glycolcontents with the spectrum in the glycerol glass. Asthe ethylene glycol concentration is increased, the
absorption in the range 10 500^16 000 cm31 gradu-ally disappears and a new absorption with a similarbut more broadened shape and shifted by 2800 cm31
toward higher wavenumbers appears. In this trans-formation, the positions of the vibronic bands inspectra of the initial and ¢nal forms, determinedfrom the minima of the second derivative, and indi-cated by vertical lines in Fig. 3 are unchanged. Thereare also remarkable changes in Stark spectra. Theminima observed at 13 900 cm31 and at 15 300cm31 in glycerol shift by 100^200 cm31 toward thered and become deeper in 55% ethylene glycol, de-spite the decrease of absorbance in this spectral re-gion. Their positions now almost exactly coincidewith the second derivative spectrum, and this coinci-dence points to a prevailing contribution from aspectral form in which electrochromism is dominatedby the change in dipole moment on electronic exci-tation. This is consistent with the interpretation, pre-sented above, of the absorption and Stark spectra ofK-crustacyanin in glycerol glass, where the electronicexcitation of spectral form II, with absorption spec-trum shifted to the red by several hundreds of cm31
relative to the main form I, was found to be associ-ated with a substantially larger vW (cf. Table 1). Incontrast to this are the Stark spectra of the formproduced in the presence of ethylene glycol. The po-sitions of vibronic bands at 16 750 cm31 and 18 100cm31 are closer to the slopes in the Stark spectrum,
Fig. 3. A: Absorption, and B: electroabsorption spectra of K-crustacyanin in the bu¡er containing 55% glycerol (dots) or55%, 65% or 75% ethylene glycol. Temperature: 130 K, electric¢eld intensity 70 000 V/cm r.m.s.
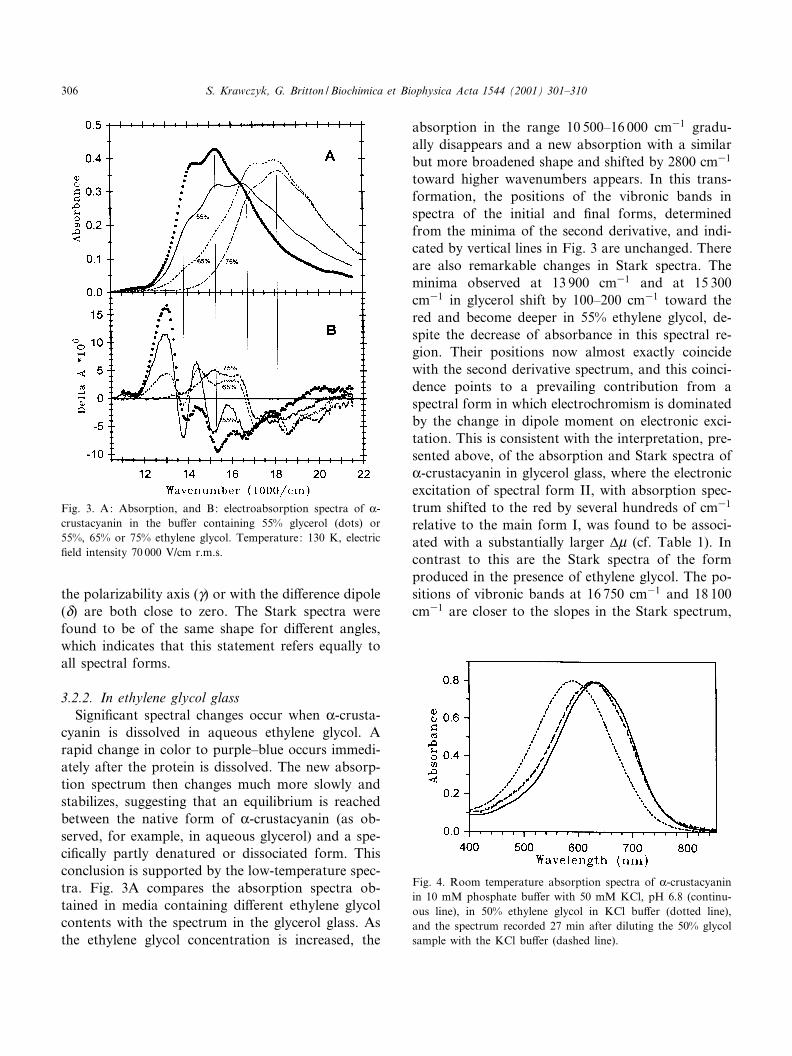
Fig. 4. Room temperature absorption spectra of K-crustacyaninin 10 mM phosphate bu¡er with 50 mM KCl, pH 6.8 (continu-ous line), in 50% ethylene glycol in KCl bu¡er (dotted line),and the spectrum recorded 27 min after diluting the 50% glycolsample with the KCl bu¡er (dashed line).
BBAPRO 36314 2-1-01
S. Krawczyk, G. Britton / Biochimica et Biophysica Acta 1544 (2001) 301^310306
indicating a less signi¢cant contribution from the vW-based mechanism.
The kind of product formed in the presence ofethylene glycol is of special interest, since it couldbe related to the dissociation of K-crustacyanin intocomponent forms such as L-crustacyanin dimers con-taining two astaxanthin molecules or even mono-meric units, consisting of one apoprotein and oneastaxanthin molecule. We performed control experi-ments to test the e¡ect of ethylene glycol at roomtemperature on the spectral changes and stability ofK-crustacyanin. Fig. 4 shows the absorption spectrain the 10 mM phosphate bu¡er, pH 6.8, containing50 mM KCl, in the bu¡er containing 50% ethyleneglycol, and of the latter sample subsequently diluted¢ve times with the bu¡er in order to test the e¡ect ofthen decreasing the concentration of ethylene glycolto 10%. The shift of the whole spectrum from 632nm in bu¡er to 585 nm (at room temperature) in50% ethylene glycol is characteristic of that seenwhen K-crustacyanin is dissociated into L-crustacya-nin dimers by exposure to conditions of low ionicstrength [3,10]. Unlike dissociation produced bylow ionic strength, the e¡ect of ethylene glycol isalmost fully reversible within 30 min even in thepresence of the residual 10% or so ethylene glycol
(cf. Fig. 4). However, for the samples at low temper-ature (Fig. 3) we observed only the conversion of K-crustacyanin into a form absorbing at 18 100 cm31
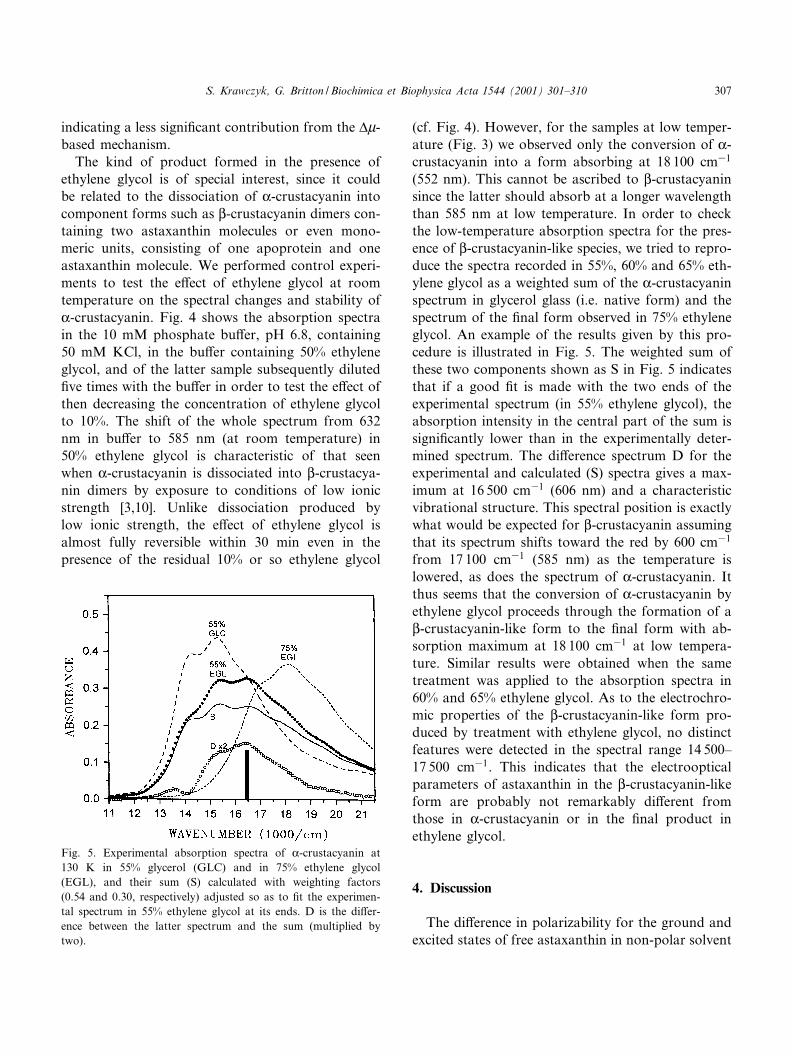
(552 nm). This cannot be ascribed to L-crustacyaninsince the latter should absorb at a longer wavelengththan 585 nm at low temperature. In order to checkthe low-temperature absorption spectra for the pres-ence of L-crustacyanin-like species, we tried to repro-duce the spectra recorded in 55%, 60% and 65% eth-ylene glycol as a weighted sum of the K-crustacyaninspectrum in glycerol glass (i.e. native form) and thespectrum of the ¢nal form observed in 75% ethyleneglycol. An example of the results given by this pro-cedure is illustrated in Fig. 5. The weighted sum ofthese two components shown as S in Fig. 5 indicatesthat if a good ¢t is made with the two ends of theexperimental spectrum (in 55% ethylene glycol), theabsorption intensity in the central part of the sum issigni¢cantly lower than in the experimentally deter-mined spectrum. The di¡erence spectrum D for theexperimental and calculated (S) spectra gives a max-imum at 16 500 cm31 (606 nm) and a characteristicvibrational structure. This spectral position is exactlywhat would be expected for L-crustacyanin assumingthat its spectrum shifts toward the red by 600 cm31
from 17 100 cm31 (585 nm) as the temperature islowered, as does the spectrum of K-crustacyanin. Itthus seems that the conversion of K-crustacyanin byethylene glycol proceeds through the formation of aL-crustacyanin-like form to the ¢nal form with ab-sorption maximum at 18 100 cm31 at low tempera-ture. Similar results were obtained when the sametreatment was applied to the absorption spectra in60% and 65% ethylene glycol. As to the electrochro-mic properties of the L-crustacyanin-like form pro-duced by treatment with ethylene glycol, no distinctfeatures were detected in the spectral range 14 500^17 500 cm31. This indicates that the electroopticalparameters of astaxanthin in the L-crustacyanin-likeform are probably not remarkably di¡erent fromthose in K-crustacyanin or in the ¢nal product inethylene glycol.
4. Discussion
The di¡erence in polarizability for the ground andexcited states of free astaxanthin in non-polar solvent
Fig. 5. Experimental absorption spectra of K-crustacyanin at130 K in 55% glycerol (GLC) and in 75% ethylene glycol(EGL), and their sum (S) calculated with weighting factors(0.54 and 0.30, respectively) adjusted so as to ¢t the experimen-tal spectrum in 55% ethylene glycol at its ends. D is the di¡er-ence between the latter spectrum and the sum (multiplied bytwo).
BBAPRO 36314 2-1-01
S. Krawczyk, G. Britton / Biochimica et Biophysica Acta 1544 (2001) 301^310 307

(vK= 1360 Aî 3) is similar to that for L-carotene (1280Aî 3 [13]), and indicates that the extension of the con-jugated chromophore by the two keto groups (cf.Scheme 1) does not substantially modify the polar-izability. However, the dipole moment di¡erence forastaxanthin in ethylbenzene/toluene, vW= 7.4 D, isabout 1.5 times larger than that of L-carotene (5.2D) determined in the very similar glassy solvent eth-ylbenzene/butylbenzene [13]. For these two carote-noids with very similar polarizabilities measured insimilar solvents, the di¡erence in vW cannot be as-cribed to di¡erences in the internal electric ¢eld gen-erated by permanent dipoles of surrounding solventmolecules. A similar conclusion was reached also forother carotenoids which had electrooptical propertiesthat did not correlate with solvent polarity [13]. Onthe other hand, a keto group at only one end of theconjugated chromophore can induce a large value ofvW. This was shown for spheroidenone in poly(meth-yl methacrylate) ¢lm or in 3-methylpentane solution;a value of vW= 20 D was found, which contrasts withvW6 4.8 D obtained for the corresponding parentmolecule spheroidene which lacks the keto group[14]. On this basis it can be concluded that a signi¢-cant part of the observed vW for free astaxanthin canresult from conformational perturbations whichasymmetrically in£uence the conjugation of the twoketo groups.
The absorption spectrum of K-crustacyanin at lowtemperature consists of vibronic bands not discerni-ble in room temperature spectra. The spacing of the(0^0) and (0^1) vibronic bands, 1100^1200 cm31, issmaller than in the spectrum of the free astaxanthin(Fig. 1A) where it is W1350 cm31. The latter value isalso characteristic for other carotenoid spectra withonly roughly resolved vibronic structure. The (0^1)band is known to consist of mainly two overlappingcomponents of which the stronger one at W1500cm31 corresponds to one-quantum excitation of avibrational mode involving mainly the CNCstretches, and the weaker one at W1150 cm31 isrelated to a complex C^C stretching and C^H bend-ing mode [15,16]. These assignments are consistentwith the Raman spectral data since the intensitiesof corresponding bands in both types of spectra de-pend on the same Franck^Condon factors. In theresonance Raman spectra of astaxanthin in K-crusta-cyanin excited near the (0^0) transition, the intensity
of the C^C band at 1154 cm31 relative to the one forCNC at 1492 cm31 (the frequencies are for theground state) is about two times larger than in theRaman spectra of the free astaxanthin [5^8]. It isthus the relative enhancement of the vibronic transi-tion in the C^C mode in K-crustacyanin which causesthe increase of absorption intensity in the lower-en-ergy component of the (0^1) band and in this waybrings this band closer to the spectral origin (0^0).
Our spectroscopic studies of K-crustacyanin per-formed at low temperature indicate the presence ofat least three species with di¡erent spectral character-istics. Form I, which has the (0^0) vibronic transitionat 14 000 cm31 (714 nm) at low temperature, is themost abundant (W85% of the total) and presumablycorresponds to what is normally considered as natu-ral K-crustacyanin (absorption maximum at 632 nmat room temperature). The other forms, II (W10%)and III (W5%), have (0^0) vibronic transitions at13 500 cm31 and 11 600 cm31, respectively. Theseforms have not previously been detected in naturalcrustacyanin, and correspond to species absorbing at740 nm and 862 nm at low temperature (correspond-ing to ca, 660 and 780 nm, respectively, at roomtemperature, assuming a similar temperature shiftto that of form I). The structural nature of theselong-wavelength absorbing forms is not known.Forms I and III were directly discernible in the ab-sorption and Stark spectra. The properties of form IIcould only be estimated by an indirect procedurebased on an approximate separation of the compo-nent spectra.
The spectral inhomogeneity of astaxanthin in K-crustacyanin deduced from the analysis of absorp-tion and Stark spectra ¢nds support also in the earlyRaman spectra of K-crustacyanin in situ [17]. Thesespectra were obtained at room temperature with theexciting light wavelengths 647.1, 676.4 and 752.5 nm.The frequencies of the two strong Raman bands at1006 cm31 and 1155 cm31 are independent of theexciting wavelength while the CNC stretching vibra-tion was observed at 1494, 1490 and 1497 cm31 forthe three exciting wavelengths, respectively. Accord-ing to our results, these excitation conditions wouldprovide a selective enhancement of resonance Ramanscattering by di¡erent spectral components for whichthe (0^0) transitions, according to our data, are lo-cated on the long-wavelength slope of the absorption
BBAPRO 36314 2-1-01
S. Krawczyk, G. Britton / Biochimica et Biophysica Acta 1544 (2001) 301^310308

spectrum (cf. Fig. 3). This sequence of exciting wave-lengths suggests that the Raman bands with thesefrequencies contain substantial contributions fromthe spectral forms I, II and III, respectively. TheCNC stretch frequency of 1490 cm31, which is thelowest that has been seen in all carotenoid spectrarecorded for crustacyanins [6], would thus corre-spond to form II which seems to be characterizedby the strongest electrochromism (cf. Table 1). Alsoa signi¢cant increase in intensity of the 1155 cm31
band is noticeable in all these Raman spectra, in ac-cordance with vibronic features in absorption spectradiscussed above.
Five discrete subunits are released on dissociationof K-crustacyanin, in the form of di¡erent heterodi-meric combinations (L-crustacyanins) [4]. The signi¢-cance of this for the structure of natural K-crustacya-nin, in terms of the heterogeneity indicated by ourresults, is not known. Our experiments show that inthe presence of ethylene glycol, K-crustacyaninundergoes signi¢cant structural changes as re£ectedby the shift of the absorption maximum at low tem-perature from 15 250 cm31 (656 nm) to 18 100 cm31
(552 nm). The appearance of an intermediate specieswith absorption maximum at 16 500 cm31 (606 nm)at low temperature has been revealed from an anal-ysis of absorption spectra and ascribed to a L-crus-tacyanin-like form. At the low temperature, theabsorption spectrum of K-crustacyanin is batho-chromically shifted by 600 cm31 relative to its po-sition at room temperature. If there is a similartemperature e¡ect for the product absorbing at18 100 cm31, this gives a room temperature absorp-tion maximum at about 18 700 cm31 (535 nm). Thislies within the range of absorption wavelengths (517^565 nm) ascribed to monomeric units containing asingle carotenoid molecule, depending on the type ofcarotenoid and the source of protein [3]. The L-crus-tacyanin dimers that can be isolated absorb at 585 nm[3,8,10]. The results are therefore consistent with theconclusion that ethylene glycol causes dissociation ofK-crustacyanin into a dimeric L-crustacyanin-likeform which then further dissociates into the mono-meric 1:1 apoprotein^astaxanthin form.
The red shift by 600 cm31 of the absorption spec-trum of astaxanthin in K-crustacyanin on loweringthe temperature to about 120 K is signi¢cantly largerthan analogous shifts for other carotenoids in the
photosynthetic antenna complex CP47 (250 cm31)or in polymers (6 200 cm31) cooled down to 77 K[18]. Since the solvatochromic properties of astaxan-thin and L-carotene should be quite similar, this dif-ference could be related to the speci¢c interaction ofastaxanthin that brings about the large spectral shifton its binding with the apoprotein. The thermal shiftfor astaxanthin in K-crustacyanin, however, is small-er than 820 cm31 observed for L-carotene in non-polar isopentane solution on lowering the tempera-ture to 120 K [16], and much smaller than thermallyinduced shifts of absorption and £uorescence spectraof polar dyes in solutions [19] and in proteins [20]which well exceed 1000 cm31 and are due to theincrease in the e¡ective polarity of these media oncooling. The measurements of electrochromism resultin the values of vW for the two directly discerniblespectral forms I and III of astaxanthin in K-crusta-cyanin (W9^13 D) which are not much larger thanthat for the free astaxanthin (W7.5 D). This indi-cates a largely symmetric perturbation of the elec-tronic structure of astaxanthin in spectral forms Iand III by the interaction with the apoprotein. Theseobservations set constraints onto the existing modelsfor the structure of L-crustacyanin and of the mono-meric units [3,21,22], according to which the interac-tion of astaxanthin with the protein in the mono-meric complex should involve only half of theastaxanthin molecule.
The shift of absorption spectrum by 2000 cm31
resulting from the binding of the carotenoid withvKW1500 Aî 3 to monomeric apoprotein is too largeto be explained by solvatochromism or by a simpleelectrochromic e¡ect of neighboring charged groupsin the protein following the formulas:
vX � 12hc
WvK WF20; vW � vK WF0;
since, for this spectral shift, a permanent electric ¢eldF0 of intensity 7 MV/cm in the binding site is needed,which in turn would induce the di¡erence dipolevW= 35 D. Such a prediction for induced vW is fartoo large to be compatible with the experimentaldata (vWW12 D). Analogous arguments also holdfor the total shift of the absorption spectrum of as-taxanthin in K-crustacyanin, i.e. 5000 cm31. Themoderate values of vW for about 90% of the asta-xanthin in K-crustacyanin are in agreement with the
BBAPRO 36314 2-1-01
S. Krawczyk, G. Britton / Biochimica et Biophysica Acta 1544 (2001) 301^310 309

strong but rather symmetric perturbation of the elec-tronic distribution along the polyene chain, as re-vealed by 13C-NMR spectroscopy [8^10]. Togetherwith all other aspects discussed above, this conclu-sion gives support to the symmetric polarization ofastaxanthin chromophore in K-crustacyanin, best de-scribed by the computationally con¢rmed model as-suming double protonation at the two 4-keto groupsof astaxanthin [7,10].
A conspicuous property of astaxanthin in thecarotenoprotein investigated is the substantial in-crease of the di¡erence polarizability, vK, from1360 Aî 3 for free astaxanthin to about 2000 Aî 3 andmore in K-crustacyanin. This large modi¢cation ofmolecular polarizability can be related to the inter-action of transition dipoles in two closely spacedastaxanthin molecules, in analogy with the e¡ectsobserved in Stark spectra of interacting bacterio-chlorophyll molecules in photosynthetic antennaand reaction center proteins [14,23,24]. Such a con-tribution to the electrochromism should be expectedaccording to the model structure of L-crustacyanin asa capsule-like dimer containing two astaxanthin mol-ecules, and is supported by the biphasic circular di-chroism spectra of K- and L-crustacyanins [9] whichare attributed to the interaction of the transition mo-ments of two chromophore molecules situated inclose proximity. However, it will only be possibleto assess the role of this so-called excitonic interac-tion in electrochromism quantitatively on the basis ofa structural model of pigment organization in K- andL-crustacyanin that is gradually emerging from mo-lecular modelling [3,21,22] and crystallographic stud-ies [25].
References
[1] G. Britton, G.M. Armitt, S.Y.M. Lau, A.K. Patel, C.C.Shone, in: G. Britton, T.W. Goodwin (Eds.), CarotenoidChemistry and Biochemistry, Pergamon Press, Oxford,1982, pp. 237^253.
[2] P.F. Zagalsky, in: G. Britton, S. Liaaen-Jensen, H. Pfander
(Eds.), Carotenoids, Vol. 1A, Birkha«user, Basel, 1995, pp.287^294.
[3] P.F. Zagalsky, E.E. Eliopoulos, J.B.C. Findlay, Comp. Bio-chem. Physiol. 97B (1990) 1^18.
[4] R. Quarmby, D.A. Norden, P.F. Zagalsky, H.J. Ceccaldi, R.Daumas, Comp. Biochem. Physiol. 56B (1977) 55^61.
[5] V.R. Salares, N.M. Young, H.J. Bernstein, P.R. Carey, Bio-chim. Biophys. Acta 576 (1979) 176^191.
[6] J.C. Merlin, J. Raman Spectrosc. 18 (1987) 519^523.[7] R.J. Weesie, J.C. Merlin, H.J.M. de Groot, G. Britton, J.
Lugtenburg, F.J.H.M. Jansen, J.P. Cornard, Biospectros-copy 5 (1999) 358^370.
[8] R.J. Weesie, R. Verel, F.J.H.M. Jansen, G. Britton, J. Lug-tenburg, H.J.M. de Groot, Pure Appl. Chem. 69 (1997)2085^2090.
[9] G. Britton, R.J. Weesie, D. Askin, J.D. Warburton, L. Gal-lardo-Guerrero, F.J.H.M. Jansen, H.J.M. de Groot, J. Lug-tenburg, J.P. Cornard, J.C. Merlin, Pure Appl. Chem. 69(1997) 2075^2084.
[10] R.J. Weesie, F.J.H.M. Jansen, J.C. Merlin, J. Lugtenburg,G. Britton, H.J.M. de Groot, Biochemistry 36 (1997) 7288^7296.
[11] P.F. Zagalsky, Methods Enzymol. 111B (1985) 216^247.[12] W. Liptay, Ber. Bunsenges. Physik. Chem. 80 (1976) 207^
217.[13] S. Krawczyk, A. Daniluk, Chem. Phys. Lett. 236 (1995) 431^
437.[14] D.S. Gottfried, M.A. Ste¡en, S.G. Boxer, Biochim. Biophys.
Acta 1059 (1991) 76^90.[15] S. Saito, M. Tasumi, J. Raman Spectrosc. 14 (1983) 310^
321.[16] H. Torii, M. Tasumi, J. Phys. Chem. 94 (1990) 227^231.[17] W.H. Nelson, P.R. Carey, J. Raman Spectrosc. 11 (1981)
326.[18] I. Renge, R. van Grondelle, J.P. Dekker, J. Photochem.
Photobiol. A96 (1996) 109^121.[19] G.U. Bublitz, G.G. Boxer, J. Am. Chem. Soc. 120 (1998)
3988^3992.[20] D.W. Pierce, S.G. Boxer, J. Phys. Chem. 96 (1992) 5560^
5565.[21] J.N. Keen, I. Caceres, E.E. Eliopoulos, P.F. Zagalsky, J.B.C.
Findlay, Eur. J. Biochem. 197 (1991) 401^417.[22] J.N. Keen, I. Caceres, E.E. Eliopoulos, P.F. Zagalsky, J.B.C.
Findlay, Eur. J. Biochem. 202 (1991) 31^40.[23] G.U. Bublitz, S.G. Boxer, Annu. Rev. Phys. Chem. 48
(1997) 213^242.[24] P.O.J. Scherer, S.F. Fischer, Chem. Phys. Lett. 131 (1986)
153^159.[25] N.E. Chayen, E.J. Gordon, S.E.V. Phillips, E.E.G. Sarida-
kis, P.F. Zagalsky, Acta Crystallogr. D52 (1996) 409^410.
BBAPRO 36314 2-1-01
S. Krawczyk, G. Britton / Biochimica et Biophysica Acta 1544 (2001) 301^310310