Embed Size (px)
Citation preview
A STUDY OF THE RELATIONSHIP BETWEEN LEADERSHIP
STYLES AND EMPLOYEE COMMITMENT: AN EMPIRICAL
STUDY OF PRIVATE UN-AIDED B-SCHOOLS OF
MAHARASHTRA.
Dissertation Submitted to the Padmashree Dr. D. Y. Patil University’s,
Department of Business Management
In partial fulfilment of the requirements for the award of the Degree of
DOCTOR OF PHILOSOPHY
IN
BUSINESS MANAGEMENT
Submitted by
MS. PRIYADARSINI KHASTAGIR PODDAR
(Enrolment Number: DYP-Ph.D. - 09001)
RESEARCH GUIDE
PROF. DR. PRADIP MANJREKAR
DEAN
PADMASHREE DR. D.Y.PATIL UNIVERSITY’S,
DEPARTMENT OF BUSINESS MANAGEMENT,
Sector 4, Plot No. 10,
CBD Belapur, Navi Mumbai- 400614
November,2012
A Study of the Relationship between Leadership
Styles and Employee Commitment: An Empirical
Study of Private Un-Aided B-Schools of Maharashtra
DECLARATION
I hereby declare that dissertation entitled, “A study of the Relationship between
Leadership Styles and Employee Commitment: An Empirical Study of Private
Un-aided B-Schools of Maharashtra.” submitted for the Award of the Degree of
Doctor of Philosophy in Business Management at the Padmashree Dr. D.Y.Patil
University’s Department of Business Management, Navi Mumbai is my original work
and the dissertation has not formed the basis for the award of any degree, associate
ship, fellowship or any other similar titles. This study contains research work which is
based on totally personal work and view point of the researcher and no other body
should be held responsible for the same.
Place: Navi Mumbai (Ms.Priyadarsini Khastagir Poddar)
Date: 12th
November’2012 Signature of the Candidate
CERTIFICATE
This is to certify that the dissertation entitles “A study of the Relationship between
Leadership Styles and Employee Commitment: An Empirical Study of Private
Un-aided B-Schools of Maharashtra”, is a bonafide research work carried out by
Ms.Priyadarsini Khastagir Poddar, student of Doctor of Philosophy(Business
Management), at Padmashree Dr. D. Y. Patil University’s Department of Business
Management, Navi Mumbai during the year 2009-2012, in partial fulfilment of the
requirements for the award of the Degree of Doctor of Philosophy in Business
Management and that the dissertation has not formed the basis for the award
previously of any degree, diploma, associate ship, fellowship or any other similar title
of any University or Institution.
Prof. Dr.Pradip Manjrekar Prof. Dr.R.Gopal
Dean & Ph.D. Research Guide Director & HOD
Dept. of Business Management Dept. of Business Management
Padmashree Dr. D.Y. Patil Padmashree Dr. D.Y.Patil
University, Navi Mumbai University, Navi Mumbai
Place: Navi Mumbai
Date:

This Thesis Is Dedicated To My Parents
ACKNOWLEDGEMENT
I am indebted to the Padmashree Dr. D.Y. Patil University, Department of Business
Management, which has provided me with the opportunity to carry out the Doctorate
program.
This dissertation or research study would not have been possible if the Director and
Head of the Department of Business Management of Padmashree. Dr.D.Y.Patil
University, Dr.R.Gopal did not provide me with his constant encouragement,
suggestions, constructive comments, and motivations .His blessings lead to the
completion of the final dissertation.
My sincere thanks and appreciations extended to my guide, Head of the Department
of Business Management of Padmashree Dr.D.Y.Patil University, Dr. Pradip
Manjrekar. His constant inspiration shaped me to a better researcher.
I would also like to thank Dr.A.K.Sengupta, Chairman of Higher Education Forum for
his valuable peer review of my research paper based on the pilot study of my research
work.
In addition, I extend my heartfelt gratitude to all the 47 Directors, all over
Maharashtra for allowing me to collect data from their academic faculties, as well as I
thank all my respondents.
Finally, the blessings of my parents, Late Sri Sitanath Khastagir and Late Smt
Sunanda Khastagir and support and motivation from my husband Mr. Nilanjan Poddar
and my two sons Aryaman and Shauryaman lead to the completion of this research
study .I would also like to express my thanks and appreciation to my sister Tinku
Bhattacharya.
(Ms.Priyadarsini Khastagir Poddar)
Signature of the Candidate
I
TABLE OF CONTENTS
Chapter No. Title Page No. Preliminary Cover Page
Title
Declaration
Certificate
Acknowledgement
Table of Contents I
List of Tables V
List of Figures XIV
List of abbreviations XV
Executive Summary XVI
Chapter – 1 Introduction 1
1.1 Introduction & Background of Leadership Style 2
1.2 Leadership Styles and Employee Commitment 4
1.3 Employee Commitment 5
1.4 The Determinants of Employee Commitment 6
1.5 Affective Commitment 7
1.6 Business School Management Education in India 9
Chapter – 2
Review Of The Literature 14
2.1 Leadership 15
2.2 Leadership Style Theories 17
2.3 Situational Leadership Style Theories 24
2.4 Recent Theories of Leadership Style 27
2.5 Transformational Leadership Style and Employee
Commitment
35
2.6 Summary of Leadership Style Theories 35
2.7 Theoretical Framework on Leadership Style 36
2.8 Leadership styles within academic institutions 38
2.9 Employee Commitment 40
2.10 Conceptualization of Commitment 51
2.11 Dimensions of Employee Commitment 52
2.12 Antecedents of Employee Commitments 56

II
2.13 Employee Commitment within Academic Institution 60
2.14 Literature review on Education Sector with emphasis over
B-Schools.
64
2.15 Research Gap 111
Chapter 3 Education System In India 112
3.1 Introduction To The Education System In India 113
3.2 Structure Of Educational System In India. 114
3.3 Accreditation 119
3.4 Administration of Education 121
3.5 Types of Colleges 121
3.6 Universities: The Organisational Framework 126
3.7 The People Who Manage the Universities 142
3.8 Conclusion 147
Chapter 4 An Overview of the B-Schools of Maharashtra
149
4.1 Introduction to Business Management Education:
150
4.2 Present Situation of Business Management Education in
Maharashtra.
152
4.3 Growth and Meaning of Un-Aided Private B-Schools of
Maharashtra
153
4.4 Norms & Requirements in Private un-aided B-Schools of
Maharashtra as laid down by All India Institute of Technical
Education.
157
4.5 Conclusion 171
Chapter-5 Objectives, Hypothesis And Research Methodology 173

III
5.1 Statement of Research Problem: 174
5.2 Research Questions 175
5.3 Scope of the Study: 175
5.4 Purpose of the Study 175
5.5 Objectives 176
5.6 Statement of Hypothesis 177
5.7 Population and Sample Selection 181
5.8 Sampling Design 182
5.9 Data Source 182
5.10 Pilot Study 184
5.11 Data Collection for the Main Research Study 184
5.12 Measurement of the Data 186
5.13 Reliability of the Study Instrument 192
5.14 Data Analysis Tools 193
5.15 Interpretation and Report Writing 193
5.16 Limitation of the Study 193
Chapter-6 Research Findings 195
6.1 Introduction 196
6.2 Pilot Study Report 196
6.3 Description of Respondent‟s Characteristics 220
6.4 Statistical Results 225
6.5 Testing the Expectations and Hypotheses 230
6.6 Testing the expectations: 231
6.7 Testing the Hypothesis 235

IV
Chapter-7 Discussions And Conclusions 267
7.1 Discussion 268
7.2 Conclusion 280
Chapter 8 Recommendations And Suggestions 283
8.1 Recommendations 284
8.2 Suggestions 286
Bibliography 288
Annexure I 309
Annexure II 321
V
List of Tables
Table
No
Content
Page
No. 1 Dimensions of Employee Commitment within
Multidimensional Models
48
2 Bifurcations of Universities in India 153
3 Number of Private Un-Aided B-Schools of Maharashtra as
per Directorate of Technical Education, Maharashtra State,
with the total number of private un-aided B-schools in the
regions of the research study.
157
4 4(i) gives the intake in the B-Schools of Maharashtra
4(ii) shows the seats available for allotment under CAP for
un-aided private B-Schools in Maharashtra.
159
160
5 5-(i) Gives the Norms for Cadre Ratio (PG) in B-Schools of
Maharashtra.
5-(ii) Gives the essential and desirable Facilities in B-
Schools of Maharashtra
5-(iii) Gives the evaluation guidelines for the teaching and
learning process.
5-(iv) Gives the evaluation guidelines for the teaching and
non-teaching staff of private un-aided B-Schools of
Maharashtra.
163
163
166
168
6 Area vies Collection of the Research Data 186
7 7-(i) shows frequency distribution of respondents by Age. 199

VI
7-(ii) Frequency distribution of Respondent‟s Educational
Level
7-(iii) shows frequency distribution of respondents by
Marital Status.
7-(iv) shows frequency distribution of respondents by
Occupational Status.
7-(v) shows frequency distribution of respondents by Salary
(Monthly income)
7-(vi) shows frequency distribution of respondents by
Length of service.
7-(vii) shows frequency distribution of respondents by
Gender.
200
200
201
201
202
203
8 8(i-a) Correlations of Transformational leadership styles
(perceived) with organizational commitment.
8(i-b) Correlations of Transformational leadership styles
(expected) with organizational commitment.
8(ii-a) Correlations of Transactional leadership styles
(perceived) with organizational commitment.
8(ii-b) Correlations of Transactional leadership styles
(expected) with organizational commitment.
8(iii-a) Pearson‟s Co-relation results of transformational
leadership style and transactional Leadership style on
employee commitment as perceived by the academic
employees of B-schools.
204
205
206
206
207
VII
8(iii-b) Pearson‟s Co-relation results of transformational
leadership style and transactional Leadership style on
employee commitment as expected by the academic
employees of B-schools.
8(iv-a) Correlation of Laissez –Faire Leadership style
(Observed) with Organizational commitment of employees.
8 (iv-b) Correlation of Laissez –Faire Leadership styles
(Expected) with Organizational commitment of employees.
8v (a & b) ANOVA shows relationship between age and
level of organizational commitment of private B-Schools
academic faculties of Navi Mumbai.
8(vi) ANOVA shows relationship between Education and
level of organizational commitment of private B-Schools
academic faculties of Navi Mumbai.
8(vii-a, b) shows relationship between Length of service and
level of organizational commitment of private B-Schools
academic faculties of Navi Mumbai.
8(viii-a, b), shows relationship between occupational status
and level of organizational commitment of private B-
Schools academic faculties of Navi Mumbai.
8 (ix-a, b), shows relationship between pay (salary) and
level of organizational commitment of private B-Schools
academic faculties of Navi Mumbai.
8 (x-a, b), shows relationship between marital status and
level of organizational commitment of private B-Schools
208
209
210
211
212
213
214
215
VIII
academic faculties of Navi Mumbai.
8 (xi-a, b), shows relationship between gender and level of
organizational commitment of private B-Schools academic
faculties of Navi Mumbai.
216
217
9 9-(i). Frequency Distribution of Respondents by Age.
9-(ii) Frequency distribution of Respondent‟s Educational
Level
9-(iii) shows frequency distribution of respondents by
Marital Status.
9-(iv) shows frequency distribution of respondents by
Occupational Status.
9-(v) shows frequency distribution of respondents by Salary
(Monthly income)
9-(vi) shows frequency distribution of respondents by
Length of service.
9-(vii) shows frequency distribution of respondents by
Gender.
9-(viii) shows frequency distribution of respondents by
Internal promotion taken place within the particular time
span.
221
221
222
223
223
224
224
225
10 10-(i). Intercorrelations Among the MLQ Scales and
Organizational Commitment Measure.
10-(ii).Range (%), Mean, Median, and Standard Deviation
of all the Variables
227
229
11 11 – (i). Frequency Distribution of Respondents by their 231
IX
Level of Organizational Commitment.
11 – (ii). Frequency Distribution of Heads/Deans/Directors
According to Their Transactional Characteristics as
Perceived by their sub-ordinate Academic Faculties.
11 – (iii). Frequency Distribution of Transactional
Heads/Deans/Directors According to Their Characteristics
as Expected by their Sub-Ordinate Academic Faculties.
11–(iv). Frequency Distribution of Heads/Deans/Directors
According to Their Transformational Characteristics as
Perceived by their sub-ordinate Academic Faculties.
11–(v). Frequency Distribution of Heads/Deans/Directors
According to Their Transformational Characteristics as
Expected by their Sub-Ordinate Academic Faculties.
233
233
234
235
12 12 (i) shows Regression analysis of Transformational
leadership styles (OBSERVED „OBS‟ or perceived “P”) on
employee commitment.
12(ii) shows Regression analysis of Transformational
leadership styles (Expected “Exp”) on employee
commitment.
12(iii) Correlations of Transformational leadership styles
(Observed „Obs‟/Expected „Exp‟) with employee
commitment.
12 (iv) Correlations of Transformational leadership styles
(Observed „Obs‟) with employee commitment.
12 (v) Correlations of Transformational leadership styles
237
237
238
239
240
X
(Expected „Exp‟) with employee commitment.
12(vi) Correlations of Transformational leadership styles
(with GAP between observed „OBS‟/expected „EXP‟) with
organizational commitment.
240
13 13 (i) shows Regression analysis of Transactional leadership
styles (Observed „Obs‟ Or Perceived “P”) on employee
commitment.
13 (ii) shows Regression analysis of Transactional
leadership styles (Expected „Exp‟) on employee
commitment.
13(iii) Correlations of Transactional leadership styles
(Observed „Obs‟/Expected „Exp‟) on employee
commitment.
13(iv) Correlations of Transactional leadership styles
(Expected „Exp‟) on employee commitment.
13(v) Correlations of Transactional leadership styles
(Observed „Obs‟) on employee commitment.
13(vi) Correlations of Transformational leadership styles
(with GAP between observed „OBS‟/expected „EXP‟) on
employee commitment.
242
242
244
245
245
246
14 14(i) shows the Regression Analysis between
Transformational Leadership (OBS), Transactional
Leadership (OBS), on Employee Commitment.
14(ii) shows the Regression Analysis between
247
248
XI
Transformational Leadership (EXP), Transactional
Leadership (EXP), on Employee Commitment.
15 15(i) shows the Regression Analysis between Laissez-Faire
Leadership (OBS), and Employee Commitment.
15(ii) shows the Regression Analysis between Laissez –
Faire Leadership (EXP),) on Employee Commitment.
15(iii) Correlations of Laissez – Faire leadership styles
(Observed „Obs‟ Or Perceived) with organizational
commitment.
15(iv) Correlations of Laissez – Faire styles (Expected
„Exp‟) with organizational commitment.
15(v) Correlations of Laissez – Faire styles (with GAP
between observed „OBS‟/expected „EXP‟) with
organizational commitment.
249
250
251
251
252
16 Correlations of Transformational/ Transactional leadership
styles (with GAP between observed „OBS‟/expected „EXP‟)
with organizational commitment.
253
17 17(i) shows Regression analysis of Transformational and
Transactional leadership styles (OBSERVED „OBS‟ or
perceived “P”) on employee commitment.
17(ii) shows Regression analysis of Transformational /
Transactional leadership styles (Expected “Exp”) on
employee commitment.
256
256
18 18-(i). Correlation Results of the Level of Education on
Employee Commitment.
257

XII
18-(ii). Regression Results of the Level of Education on
Employee Commitment.
257
19 19-(i). Correlation Results of the Age on Employee
Commitment.
19-(ii). Regression Results of the Age on Employee
Commitment.
258
259
20 20-(i). Correlation Results of the Occupational Status on
Employee Commitment.
20-(ii). Regression Results of the Occupational status on
Employee Commitment.
260
260
21 21-(i). Correlation Results of the Salary (Monthly In-Come)
on Employee Commitment.
21-(ii). Regression Results of the Salary (Monthly In-Come)
on Employee Commitment.
261
261
22 22-(i). Correlation Results of the Marital Status on
Employee Commitment.
22-(ii). Regression Results of the Marital Status on
Employee Commitment.
22-(iii). Mean Difference of the Marital Status on Employee
Commitment.
262
262
263
23 23-(i). Correlation Results of the Gender on Employee
Commitment.
23-(ii). Regression Results of the Gender on Employee
Commitment.
23-(iii). Mean Difference of the Gender on Employee
263
263
264

XIII
Commitment.
24 24-(i). ANOVA for the Internal Promotions on Employee
Commitment.
24-(ii). Regression Results of the Internal Promotions on
Employee Commitment.
24-(iii). Mean Difference of the Internal Promotion on
Employee Commitment.
265
265
265
25 Regression Results of all the Independent Variables on
Employee Commitment
266
XIV
List of Figures
Figure No. Content
Pg.No
1 Predictors and Outcomes of Affective Employee
Commitment
9
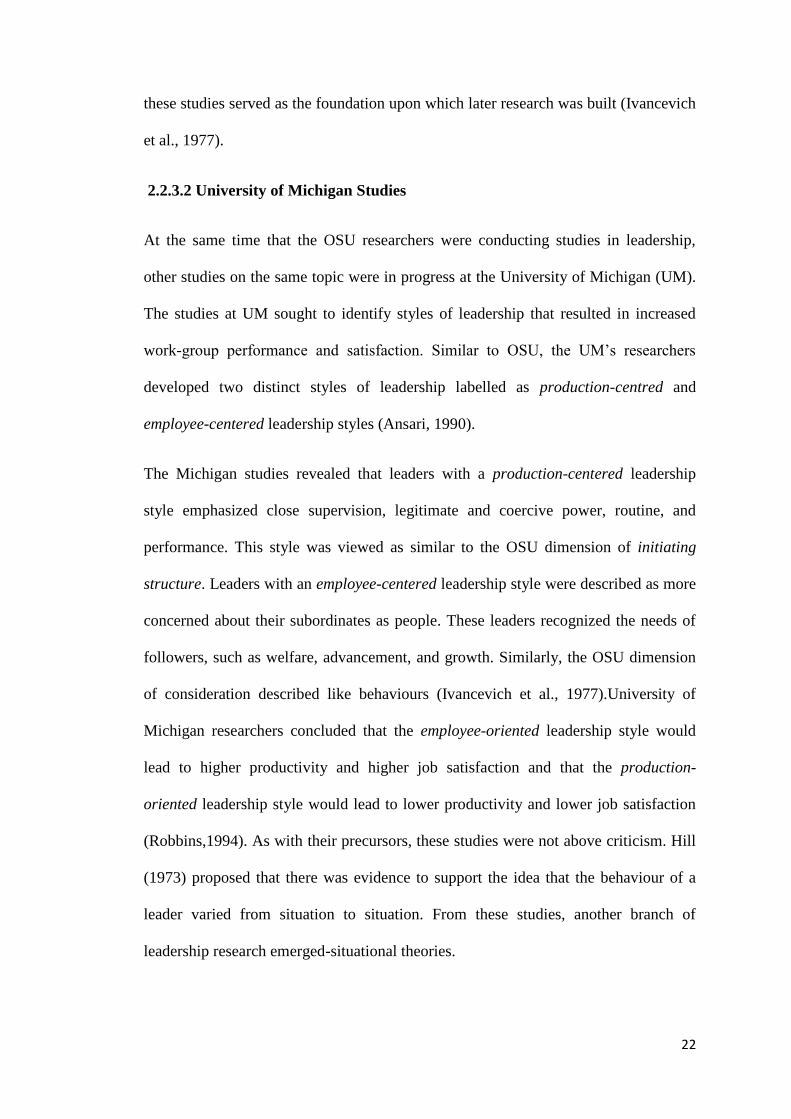
2 The Managerial Grid (adopted from Blake and
Mouton, 1975).
23
3 Model of Theoretical Framework on Leadership
Styles
37
4 General Model of Workplace Commitments
52
5 Hypothesized Antecedents and Outcomes of
Employee Commitment
57
6 Structure of Indian Education System.
114

XV
List of Abbreviations
HCM High Commitment Management
Strategies
OSU Ohio State University
LPC Least-Preferred Co-worker
MLQ Multifactor Leadership Questionnaire
MBE Management By Exception
B.C. Before Christ
PEG Pride, Enjoyment and Growth
OD Organization Development
OCTAPACE Openness, Confrontation, Trust,
Authenticity, Pro Activity, Autonomy,
Collaboration And Experimentation
OCQ Organizational Commitment
Questionnaire
ECQ Employee Commitment Questionnaire
MCom Master of Commerce
MA Master of Arts
OHU Other than Home University
ME Master in Engineering
CAP Centralised Admission Process
XVI
Executive Summary
The purpose of this study was threefold: first, to investigate the effects of
transformational, transactional and laissez-faire leadership styles upon organizational
commitment of employees; second, to determine the gap between the perceived and
expected leadership styles of the heads/directors and deans of the private un-aided B-
Schools of Maharashtra and its impact on employee commitment; and third, to
explore the relationship between selected demographic variables and employee
commitment.
The Objectives of the study were as follows:
1) To study the relationship between the Transformational, Transactional and
Laissez-Faire Leadership Styles of the Heads/Directors and the level of commitment
among the academic faculties of private un-aided B-Schools of Maharashtra.
2) To study the impact of Transformational Leadership Style on the academic
faculties of the selected B-Schools of Maharashtra in comparison to the Transactional
and Laissez-Faire leadership styles of the Heads/Directors.
3) To study the differences in Leadership Styles of HOD/Directors as observed and
expected by the academic faculties of the private un-aided select B-schools of
Maharashtra.
4) To determine the effects of age, level of education, marital status, gender,
educational qualifications and job-related variables (Occupational status, salary and
length of service, internal promotions) on the level of commitment of the private un-
aided selected B-School‟s academic faculties of Maharashtra.
5) To study the level of commitment among the academic faculties of the private
un-aided select B- Schools of Maharashtra.
XVII
Statement of Hypothesis:
H01: The Transformational Leadership Style (as observed and expected) of the Heads
of the Departments has no positive impact on the level of employees‟ commitment of
private un-aided B-Schools of Maharashtra.
H11: The Transformational Leadership Style (as observed and expected) of the Heads
of the Departments/Directors has a positive impact on the level of employees‟
commitment of private un-aided B-Schools of Maharashtra.
H02: The Transactional Leadership Style (as observed and expected) of the Heads of
the Departments/Directors has no positive impact on the level of employees‟
commitment of private un-aided B-Schools of Maharashtra.
H12 : The Transactional Leadership Style (as observed and expected) of the Heads of
the Departments/Directors has a positive impact on the level of employees‟
commitment of private un-aided B-Schools of Maharashtra.
H03: The Transformational Leadership Style (as observed and expected) of the Heads
of the Departments/Directors of private un-aided B-Schools of Maharashtra will not
have a greater impact on the level of employees‟ commitment compared to the
Transactional Leadership Style.
H13 : The Transformational Leadership Style (as observed and expected) of the Heads
of the Departments/Directors of private un-aided B-Schools of Maharashtra will have
a greater impact on the level of employees‟ commitment compared to the
Transactional Leadership Style.
XVIII
H04: The Laissez-Faire Leadership Style of the Heads of the Departments/Directors
has no negative impact on the level of employees‟ commitment of private un-aided B-
Schools of Maharashtra.
H14: The Laissez-Faire Leadership Style of the Heads of the Departments/Directors
has a negative impact on the level of employees‟ commitment of private un-aided B-
Schools of Maharashtra.
H05: There is no difference between the expected and observed leadership styles of the
Heads of the Departments/Directors of private un-aided B-Schools of Maharashtra on
the level of employee‟s organizational commitment.
H15: There is difference between the expected and observed leadership styles of the
Heads of the Departments/Directors of private un-aided B-Schools of Maharashtra on
employee‟s organizational commitment.
H06: Together the Transformational and Transactional Leadership Styles of the Heads
of the Departments/Directors of private un-aided B-Schools of Maharashtra will not
have a greater impact on the employee‟s commitment level, rather than either of the
two separately.
H16 : Together the Transformational and Transactional Leadership Styles of the Heads
of the Departments/Directors of private un-aided B-Schools of Maharashtra will have
a greater impact on the employee‟s commitment level, rather than either of the two
separately.
H07 : There will be no positive relationship with the level of education and the level of
employees‟ commitment of private un-aided B-Schools of Maharashtra.
XIX
H17 : There will be a positive relationship with the level of education and the level of
employees‟ commitment of private un-aided B-Schools of Maharashtra.
H08 : There will be no positive relationship with the age and the level of employees‟
commitment of private un-aided B-Schools of Maharashtra.
H18: There will be a positive relationship with the age and the level of employees‟
commitment of private un-aided B-Schools of Maharashtra.
H09: There will be no positive relationship between occupational status and the level
of employees‟ commitment of private un-aided B-Schools of Maharashtra.
H19: There will be a positive relationship between occupational status and the level of
employees‟ commitment of private un-aided B-Schools of Maharashtra.
H010: There will be no positive relationship between pay (salary) and the level of
employees of private un-aided B-Schools of Maharashtra.
H110: There will be a positive relationship between pay (salary) and the level of
employees‟ commitment of private un-aided B-Schools of Maharashtra.
H011: Married Employees of private un-aided B-Schools of Maharashtra will not be
more committed to their organization than single, divorced and widowed employees.
H111 : Married Employees of private un-aided B-Schools of Maharashtra will be more
committed to their organization than single, divorced and widowed employees.
H012: Male gender of private un-aided B-Schools of Maharashtra will not be more
committed to their organization than the female gender.
H112: Male gender of private un-aided B-Schools of Maharashtra will be more
committed to their organization than the female gender.
XX
H013: Employees undergoing internal promotions of private un-aided B-Schools of
Maharashtra will not be more committed to their organization.
H113: Employees undergoing internal promotions of private un-aided B-Schools of
Maharashtra will be more committed to their organization.
Scope of the Study:
The study is restricted to the level of academic faculties of private un-aided B-Schools
of Maharashtra. It could be extended to the lower levels, concerning the non-teaching
staffs of the private un-aided B-Schools as well as to the higher levels where the
Deans and Directors could judge the leadership styles followed by the trustees. The
study could also be extended to other states of India and globally too.
Research Methodology:
Sampling Design:
This study was conducted in Navi-Mumbai, Mumbai, Pune, Nasik, Aurangabad area
of Maharashtra. The targeted population for the study was the full-time academic
faculties of private un-aided B-Schools of Maharashtra area. There are altogether 390
B-schools in Maharashtra according to DTE Report 2010-2011.The study has been
conducted in 47 B-Schools of the above mentioned regions of Maharashtra. The total
number of sample is 570 academic faculties of selected un-aided private B-Schools of
Maharashtra.
Data Source:
Descriptive Survey:

XXI
Review of literature and other available information from various published and
unpublished reports, journals, and periodicals, books, newspapers, etc. (including
databases like EBSCO, Pro-quest, and others).
Field Survey:
Research Tool:
The research instrument used for collecting primary data was questionnaire. The
Questionnaires used for the final data collection were close ended questionnaires.
Different Questionnaires used for different variables of the study were as follows:
1. Questionnaire for employee commitment.
2. Questionnaire for demographic details.
3. Questionnaire for Leadership Styles - (i) Transformational; (ii) Transactional; (iii)
Laissez-Faire.
Pilot Study:
A total of 150 questionnaires were distributed among the academic faculties of private
un-aided B-Schools of Navi-Mumbai area, out of which 91respondent‟s instruments
were analysed. The final questionnaire had been moderated based on the pilot study.
The reliability test of the questionnaire was made and was found to be good.
Data Collection:
The data for this study were collected through a questionnaire administered to all the
employees of private unaided B-Schools of Maharashtra. The number of completed
and returned questionnaires was 570. Descriptive statistics, Correlational statistics,
XXII
simple and multiple regression analysis, one way analysis of variance (ANOVA), and
Cronbach‟s alpha were used to analyze the data.
Tabulation and Statistical Analysis of Data:
The responses observed from each of the items in the instrument used for primary
data collection were scored and tabulated into a master sheet. The statistical tools used
included Co-relation, Regression technique, Multiple Regression, Anova; Descriptive
Statistics has been applied to draw logical conclusions. The analysis was done using
Statistical Package of Social sciences (SPSS: Version 17).
Interpretation and Report Writing:
The analysed data were finally interpreted to draw the conclusions and reported with
the objective of the study in view.
Major Findings:
The questionnaire used for the study of the respondent‟s characteristics included 8
items. All the respondents were Dean and Academic faculties of B-Schools of
Maharashtra. They were asked about their age, education, marital status, occupational
status, salary (monthly income), and length of services, gender, and internal
promotion. The questionnaire used for the testing of Hypothesis consists of three sets:
1) Employee Commitment 2) Leadership Styles as observed by the employees 3)
Leadership Styles as Expected by the employees from their immediate Heads.
The Hypotheses of this study addressed the field of Leadership and Employee
Commitment and the relationship between the demographic factors and employee
commitment. In the current study there were 13 hypothesis tested. To test this
hypothesis, some appropriate statistical tools such as frequency analysis, analysis of

XXIII
variance (ANOVA), and Pearson‟s correlation techniques, regression techniques,
multiple regression techniques are used. The findings are discussed below:
Transformational Leadership Style: Transformational leadership as “expected” by
the employees of the organisation are found to be positively and significantly
correlated with the employee commitment.
Transformational leadership styles as “observed” by the employees of the
organisation are found to be positively co-related and highly significant with the
employee commitment.
Transactional Leadership Style: Transactional Leadership Style as “expected” by
the employees of the organisation are found to be positively co-related but not
significant with employee commitment.
Transactional leadership styles as “observed” by the employees of the organisation
are found to be positively correlated and highly significant with employee
commitment.
Laissez-Faire Leadership Style : Laissez – Faire Leadership style as “expected” by
the employees of the organisation are found to be negatively correlated and highly
significant with employee commitment.
Laissez – Faire Leadership style as “observed” by the employees of the organisation
are found to be negatively correlated and highly significant with employee
commitment.
Demographic Details:
Age: Age of the employees of the organisation is positively co- related with employee
XXIV
commitment.
Education: Educational qualifications of the employees of the organisation are
positively co-related with employee commitment.
Marital Status: Married employees of the private un-aided B-Schools of Maharashtra
are found to be more committed than the un-married employees.
Occupational Status: Occupational status of the employees of the organisation is
positively co-related with employee commitment.
Monthly Income: Salary of the employees of the organisation is positively and
significantly co-related with employee commitment.
Length of Service: Experience of the employees of the organisation is positively and
significantly co-related with employee commitment.
Gender: Gender of the employees of the organisation is positively co-related with
employee commitment. Male gender is found to be more committed than the female
gender.
Internal Promotion: Internal Promotion is positively and significantly co-related
with employee commitment.
Analysis:
As organizations strive to improve, there is a pressing need to understand the factors
that may directly or indirectly impact individual‟s behaviours in organizations. This
study was concerned with two important issues in the field of organizational
behaviour, organizational commitment and leadership. The literature revealed that
both subjects were considered as major contributors to the success of any
XXV
organization, public or private. Based on the findings of the present study, the
researcher developed the following conclusions:
1. The findings of this study indicated that transactional and transformational
leadership styles positively impacted the level of employee commitment of the
academic faculties of the B-Schools of Maharashtra. Additionally, the findings
showed that the organizational commitment of individuals was negatively
affected by the laissez-faire leadership style. Thus, in terms of organizational
commitment, these results provide support for the cross-cultural applicability
of Bass‟s augmentation theory of leadership, which postulates that successful
leaders are both transformational and transactional. Bass (1996) stated that „
although the model of transformational or transactional leadership may have
needs for adjustments and fine-tuning as we move across cultures, particularly
into non-Western, overall, it holds up as having a lot of universal potential”.
Furthermore, consistent with Bass‟s theory that stressed that successful leaders
are more transformational, the findings of this study demonstrated that the
academic faculties of the B-Schools of Maharashtra keeps an expectation from
their Heads of the Departments and Directors to be more transactional in
nature while dealing their sub-ordinates and confirmed that sub-ordinates of
transformational leaders were more committed to the organization than those
who were under transactional leaders.
2. The results revealed that the majority of the academic faculties of the B-
Schools of Maharashtra were found to be committed to the organization.
3. The majority of the academic faculties of the B-Schools of Maharashtra
perceived/observed their leaders or Heads of the Departments/Directors to
exhibit transformational and transactional characteristics, but keeps an
XXVI
expectation from their Heads to whom they report to be more transformational
in nature and follow contingent reward as well as management by exception-
active when concerning transactional leadership. Management by exception –
passive was not accepted by the B-School academic employees.
4. Consistent with early research studies, the demographic variables of age,
education, monthly income, marital status i.e., married employees had
significant positive impacts on employee commitment. The result also shows
that length of service, internal promotion, occupational status are positively
related to employee commitment but the statistical results are not significant.
The result also shows that both male and female employees are positively
related to employee commitment but their statistical findings showed no
significant difference.
The analysis of this study indicated that the level of employee commitment of the
academic faculties of the B-Schools of Maharashtra was relatively high. With regard
to leadership styles, the results showed that the transformational leadership style had
the greatest positive effect on the employee commitment, followed by the
transactional leadership style, and while the laissez-faire leadership style had a
negative impact on employee commitment to their organization as perceived or
observed by the employees of the B-School. Whereas in the leadership style expected
by the B-School employees, it is found that the employees expect their Leader to
follow transformational leadership style only, while the Laissez-Faire Leadership
style remains the same as the perceived leadership style.
In addition, the relationship between the employee commitment of the employees and
some selected demographic variables was examined. The findings indicated that age,
XXVII
monthly income, internal promotion and length of service had a significant positive
effect on the level of the employee commitment. The findings also indicated that
married employees were found to be more committed to their organization compared
to single, divorced, or widowed employees.
Limitation of the Study:
The study is limited to the state of Maharashtra and that too specifically with Navi-
Mumbai, Mumbai, Pune, Nasik and Aurangabad only. In future with a longer span of
time, similar studies can be carried out in the other states of the country and even
globally. Also, in future few more parameters related to leadership style and employee
commitment may be identified and subsequently, the study may be carried out on
those identified parameters.
Suggestions:
It is suggestive that the Heads of the departments or the Directors under whose
leadership the academic faculties of the private un-aided B-schools of Maharashtra
are working should be more transformational and transactional in nature while dealing
with the academic faculties.
It is even more suggestive that the Heads or the directors should be more
transformational in their leadership styles. They should be more co-operative and
participative in nature. Though they are expected to be transactional in their
leadership styles but they should not devote much time over finding mistakes in their
sub-ordinate faculties.
The Heads and the Directors should not avoid or delay in taking decisions .They
should be more punctual by nature and should not delay in responding to urgent
XXVIII
questions. They should not be absent when needed and should not wait for things to
go wrong before taking actions. Their steady involvement in all the important issues
and problems should be there.
For newly joined faculties orientation programs should be conducted.
Regular communications should be there between the management and highly
educated faculties.
Regular increments as per the HR of the institutions should be there. Whenever new
openings are there, internal candidates should be considered first for the promotions.
Inspirational and motivational training programmes should be there for the faculties.
For good academic achievements or feedback from the students or conducting
National and International seminars or for resource generation for the institute, the
faculties should be rewarded and awarded.
Employees who are working for a considerable period of time and the senior
employees should be given more importance and should be involved in the decision–
making process. Their wisdom and experience can be beneficial to the organisation.

1
CHAPTER 1
INTRODUCTION
2
CHAPTER 1
INTRODUCTION
1.1 Introduction & Background
Many authors have associated leader‘s characteristics with the development of
employee commitment (Bennis and Goldsmith, 1994; Bennis and Townsend, 1995;
Kerfoot, 1998). Bennis and Goldsmith (1994) and Bennis and Townsend (1995),
believe that vision, empathy, consistency and integrity in a leader could foster
development of trust and thereby enhancing the commitment of the employees to their
organization. They also indicate that leaders generate and sustain trust by acting in
ways that produce constancy, congruity, reliability and integrity. Kerfoot (1998) adds
to these availability and accessibility, communicating with candour and a willingness
to invest in employees.
The topic of this study is concerned with two important aspects of organizational
behaviour which address leadership and employee commitment. Leadership has been
viewed by academicians and practitioners as the most important topic within the
realm of organizational behaviour (Rahim 1981). In fact it is considered to be an
essential aspect of successful management. Furthermore it has been argued that
without leadership, successful management cannot be possible (Steers, 1981).
Employee commitment, at the same time, has attracted attention from scholars and
practitioners (Mowday et al, 1982). According to Buchanan (1974A), employee
commitment is no less than a precondition for successful organisation.
In the United States and other developed countries some research has focused on the
study of leadership styles and on the study of organizational commitment among
3
employees. Within this body of research, however, very few studies have been
devoted to examining the relationships between leadership styles and employee
commitment.
The importance of leadership refers to the fact that the success of an organisation is
heavily dependent on the quality of its leaders. These leaders play a major role in
making decisions that determine organizational goals and how these goals can be
accomplished. Their actions are important in influencing the behaviour and potential
of the organization‘s members (Williams, 1978). The drive to globalize implies that
global organizations need managers with a global outlook. Next generation managers
must work effectively with diverse constituencies within and outside their
organizations. Not only is the workforce becoming more diverse by gender, age,
ethnicity, and cultural background, but leaders also must deal with bewilderingly
dispersed and diverse stakeholders – locally, nationally, and globally. These factors
are combining to produce an environment that is rich in leadership challenges (Meena
Surie Wilson and Emily Hoole, 2011, Vikalp).
Employee commitment is a complex concept. Researchers have debated the nature of
this concept and empirical studies have examined the links between both commitment
and other outcomes, and commitment and the antecedents of management and
supervision styles.
This study was designed to investigate the relationships between leadership styles and
employee commitment among the private un-aided B-Schools of Maharashtra.
Therefore, it is necessary to include background information about the state of
Maharashtra and its Higher Education Systems, especially the academic institutions
pertaining to the B-schools. The data for this study were collected by administering
surveys to the academic faculties of private un-aided B-Schools of Maharashtra.
4
1.2 Concept of Leadership Styles and Employee Commitment
Effective Leadership Style enhances Employee Commitment to a greater extent. Kahn
(1990) recognizes the impact of management style, suggesting that a supportive
management style positively affects level of engagement. Kahn (1990) describes this
as a supportive manager as one who allows trial and error, and creates varying
degrees of openness in the environment. This research aims to specifically focus on
Transactional Leadership and Transformational Leadership and Laissez -Faire
Leadership Styles. The instrument of data collection is designed accordingly.
Leadership style ―refers to the pattern or constellation of leadership behaviours that
characterize a given leader‖ (Williams, 1978, p.217).
Transformational Leadership Style is a leadership style that strives to elevate the
desires of individual followers for achievement and self – development, while also
promoting the development of the group and organization (Bass & Avolio, 1990).
Transformational leaders are those who motivate followers to do more than originally
was expected (Bass, 1985).
Transactional leadership Style is a type of leadership based on an exchange process
between leaders and followers (Burns, 1978). Transactional leaders focus on the
clarification of task requirements and the specification of contingent rewards (Bass,
1990).
Employee commitment has been defined as ―the strength of an individual‘s
identification with and involvement in a particular organization‖ (Porter et al. 1974).
Laissez –Faire Leadership style represents a style used by leaders who try to avoid
responsibility and decision-making (Bass, 1997).
5
1.3 Employee Commitment
Gallie and White (1993) measured employee commitment to paid work from a 1990
survey and found that it was relatively high in the workforce as a whole and appeared
to have increased compared with 15 years earlier. There was little difference between
men and women. Only one third of employees exhibited high involvement in their
current job, usually called task commitment. A recent consultancy Report by AON
(2000) claimed, from a survey of 1570 workers, that 39 per cent of UK workers were
committed to continuing in their jobs, usually called continuance commitment.
Other studies have fiercely debated the gender differences in employee commitment.
Hakim‘s1993 division of British women into the full time committed workers and the
part time uncommitted workers have been debated extensively, although a further
third adaptive group have been added (Hakim, 2000). While there are clearly
attitudinal and some behavioural differences between women who work full or part
time, there are many determinants of women‘s orientations to work, over and above
their hours. Age, life cycle, occupations, education, work history and other attitudes
distinguish between women‘s attitudes towards work (Healy, 1999; Dex, 1988). AON
(2000) found that UK women exhibited more commitment than men did to continue
in their jobs. Commitment was also higher in the following groups; among married
people; the middle age groups; and those living outside London; in higher-grade
occupations, especially in teaching and health professions; with longer job tenure; in
the private sector; and in organizations with 1000 to 5000 employees.
The many research studies that have focussed on work commitment have served to
uncover the complexity of this concept to the extent that authors have characterised it
as having no stable meaning (Becker, 1964), elusive (Guest, 1992) and pluralist
(Coopey and Hartley, 1991; Morrow, 1983). Morrow identified 25 forms of
6
commitment although they were able to be reduced to 5 main foci; a value, career,
job, organisation or union focus. The focus of our interest is in organisational
commitment. Even under this heading there are alternative angles on employee
commitment; for example, task commitment (to see the job through), and continuance
commitment (to stay in the organisation), normative or affective commitment
(feelings of loyalty or shared values with the organisation), financial commitment (to
the material rewards), or temporal commitment (to a certain amount or work)
1.4 The Determinants of Employee Commitment
Gallie and White (1993) found that employee commitment was related to personal
characteristics that they called external factors (beliefs, sense of success) and internal
organizational factors including the structure and policies of the organization. Internal
factors that were found to improve commitment included:
the opportunities for personal development;
the higher the extent to which employees felt their skills were utilized;
the greater the access to training;
the greater the extent the organization was seen as a caring employer; and
the existence of teamwork as a form of supervision.
Cohen (1995) and others have also found that so-called non-work domains, the
amounts of outside ties, the organization‘s support for non-work, as well as personal
coping strategies, had significant effects on a sample of nurses‘ organizational
commitment. There are elements of these studies, therefore, that suggest indirectly
that work-life balance policies may be related to employee commitment. There has
been a growing consideration, through econometrics studies, of the assumptions
underlying the high commitment management theories. In these theories, the more
people centered focus of high commitment management strategies (HCM), viewing

7
employees as an asset, has been argued to lead to an increase in employee
commitment. As noted earlier, employee commitment has been viewed as an
intermediate outcome, on the way to improvements in business performance (Huselid,
1995). As Guest et al (2000) note, however, few studies have examined both of these
relationships together and shown the intermediary effects on commitment. Criticisms
have also been made by other researchers that the ‗commitment‘ element was left as
an unexplored ‗black box‘ (Becker et al, 1995; Purcell et al, 1999). Employee
commitment has typically been viewed as the relative strength of an individual‘s
identification with the involvement in an organization as well as his or her willingness
to exert effort and remain in the organization. Commitment as outcome has been
related to leadership (Walumbwa, Orwa, Wang, and Lawler, 2005). One of the aims
of this study is to determine how employee‘s perceptions and expectations of
leadership styles followed by their Heads influence their commitment, and the
meaning of the study will therefore be explained with reference to Meyer and Allen‘s
conceptualisation of organisational commitment.
1.5 Affective Commitment
This research study focuses on affective commitment which is defined as the
employee's positive emotional attachment to the organization. An employee who is
affectively committed strongly identifies with the goals of the organization and
desires to remain a part of the organization. This employee commits to the
organization because he/she "wants to". In developing this concept, Meyer and Allen
drew largely on Mowday, Porter, and Steers's (1982) concept of commitment, which
in turn drew on earlier work by Kanter (1968). According to Nyengane, (2007)
although the relationship is not strong, there is a positive relationship between the
transformational leadership behaviours and commitment. This suggests that,
8
leadership behaviours which involve building trust, inspiring a shared vision,
encouraging creativity and emphasizing development is somewhat positively related
to employee commitment. For affective commitment, the study suggests that these
leadership behaviours are positively related to how employees feel about wanting to
stay with the company. Therefore, using transformational leadership style will
encourage employees to commit highly with their work. Another findings by Viator
and Ralph (2001) is transformational leadership is directly and positively associated
with role clarity, job satisfaction and affective organizational commitment, and
indirectly associated with job performance, across all three functional areas.
Therefore, it is strong that transformational leadership will give a direct impact to the
employee‘s commitment. The significance of mechanisms used by transformational
leaders to influence the followers towards motivation and organizational commitment
is addressed.
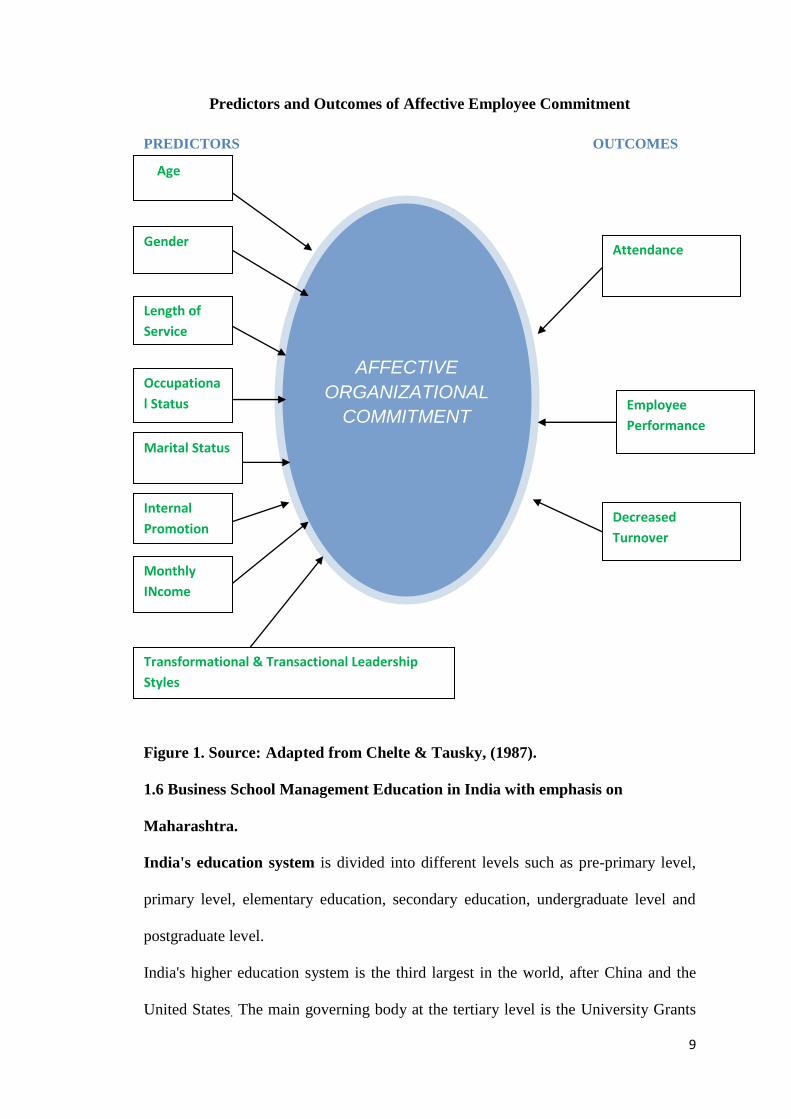
A selected organizational characteristic and other selected personal and work
experience characteristics explained affective organizational commitment among the
academic employees of private un-aided B-Scholl‘s of Maharashtra. Personal
characteristics were gender, age, and length of service (organizational tenure),
monthly income, internal promotion, occupational status and marital status within the
private un-aided B-Schools of Maharashtra. The Leadership styles followed by the
Heads of the Departments/Deans/Directors of the private un-aided B-Schools of
Maharashtra were also perceived. These variables (Figure 1) were examined to
determine the extent to which they explained affective organizational commitment,
the dependent variable.
9
AFFECTIVE
ORGANIZATIONAL
COMMITMENT
Predictors and Outcomes of Affective Employee Commitment
PREDICTORS OUTCOMES
OUTCOMES
Figure 1. Source: Adapted from Chelte & Tausky, (1987).
1.6 Business School Management Education in India with emphasis on
Maharashtra.
India's education system is divided into different levels such as pre-primary level,
primary level, elementary education, secondary education, undergraduate level and
postgraduate level.
India's higher education system is the third largest in the world, after China and the
United States. The main governing body at the tertiary level is the University Grants
Attendance
Employee
Performance
Internal
Promotion Decreased
Turnover
Monthly
INcome
Age
Gender
Length of
Service
Occupationa
l Status
Marital Status
Transformational & Transactional Leadership
Styles

10
Commission (India), which enforces its standards, advises the government, and helps
coordinate between the centre and the state. Accreditation for higher learning is
overseen by 12 autonomous institutions established by the University Grants
Commission. In India, education system is reformed. In future, India will be one of
the largest education hubs.
As of 2009, India has 20 central universities, 215 state universities, 100 deemed
universities, 5 institutions established and functioning under the State Act, and 33
institutes which are of national importance Other institutions include 16000 colleges,
including 1800 exclusive women's colleges, functioning under these universities and
institutions. The emphasis in the tertiary level of education lies on science and
technology. Indian educational institutions by 2004 consisted of a large number of
technology institutes. Distance learning is also a feature of the Indian higher
education system.
Management education in India has come a long way. The history of management
education in India goes back to the pre-Independence era. The first college level
business school in the country was founded in 1913 in Mumbai and was soon
followed by another in Delhi in 1920. These business colleges imparted basic skills
about the principles of trade and commerce to clerks and supervisors from fields as
diverse as banking, transport, and accounting. (Indian Management, Sept 2004). The
first Business School in India was Indian Institute of Social Welfare and Business
Management, Kolkata, which was established in 1953. The All India Institute of
Management and Labour welfare and the department of management, Delhi
University followed suit in 1968.
11
A number of universities set up their MBA programme in 1960s. The IIMs were
patterned on the recommendation of Dean Robbins of the University of California,
which was invited by the planning commission. The first IIM was set up in 1961 at
Kolkata followed by IIMs at Ahmadabad in 1961, Bangalore in 1971 and Lucknow in
1974 and in the late 1990s at Indore and Calicut. The flagship management education
programme, MBA, is widely popular as it offers quick gateway to the riches and to
the top echelon of corporate world. Indian Business School varies widely in terms of
the calibre of the faculties, quality of curriculum and infrastructure, and placement
record. A few of the schools including the Indian Institutes of Management have built
up a reputation of high quality education and their graduates compete successfully for
global placement opportunities. Regarding syllabus content, management schools
over the world have been modifying their curricula. Growing globalisation of business
has led to greater international focus in the curriculum incorporating courses on global
leadership, diversity management, managing across cultures, etc. Moving a little away
from the basic business, compared to some other disciplines wherein knowledge
generation and its dissemination through education sets the direction for application
of knowledge in the field, management as a discipline has been a lot more reactive to
its environment. Much greater emphasis is needed especially in India on basic and
applied research for management education to lead practice.
For bolstering their position good management schools in the country need to keep
the Global best Schools as their loadstars. Blessed with exceptionally bright students,
dedicated faculty, and staff, and a formidable reputation for professionalism, IIMs
have the potential to emerge as global leaders in setting new aspirations for
management education, and showing the way to achieve them. And they need
complete autonomy in determining their salary structures, raising funds etc. It is their
12
autonomy which has brought IIMs this far .For raising management education in the
country to the next level, it is vital that this autonomy of IIMs is protected and
enhanced.
The education sector has changed a lot and as such numerous educational colleges
have come up in the recent times. In respect of colleges, one can come across various
kinds like government, self-financing, aided and unaided colleges. It is with the
advent of globalization that aided and unaided colleges have now dominated the
education sector. When talking of aided and unaided colleges, there are many
differences between them.
One of the main differences between aided and unaided B-Schools is with regard to
funds. A B-School that gets aid from the government is termed as aided B-School
whereas a B-School that does not get any funds or aid from the government is called
as unaided B-School While aided B-School get support from the government, unaided
B-School do not get any support from the government side. The aided B-Schools get
grants from the government for various purposes like infrastructure development,
academic activities.
Another major difference that can be seen between aided and unaided B-School is in
the fee structure. The unaided B-School charges heavy fees from the students whereas
the aided B-School only charges the fees stipulated by the government.
While the government pays the teachers of the aided B-School it is the management
that pays the salary of the unaided B-School teachers. The teachers in aided B-
Schools are protected whereas the teachers have no protection in unaided B-Schools.
13
In terms of autonomy, the unaided B-Schools have great autonomy when compared
to aided B-Schools. This is because the unaided B-Schools, unlike the aided ones, do
not have any liability. Though private managements run these two sectors of colleges,
the unaided colleges have more freedom and liberty than the aided colleges.
The early 90's saw the boom of founding new management schools, most of them in
private sector. In the last three years alone 400 Business Schools came into existence.
Few Business Schools have also established collaboration with some western
Universities. India management institutions produce over 30, 000 full-time MBAs and
10,000 part-time MBAs every year. Many business schools are also running MBA
equivalent program such as distance Post Graduate Diploma in Management
(PGDM), Masters in International business (MIB) etc. Even some of the leading
business houses are establishing their own business schools like Infosys, Birla‘s etc.
Management education gives a holistic picture to the students about how to manage
the four ‗M‘s of any organization i.e. money, material, man and machine. Whether the
knowledge about management principles is obtained through formal study programs
at Universities or internally through on the job training or through external seminars
or programs, it is of the utmost importance for any person in any job in life; even for
the self-employed, entrepreneurs.
In Maharashtra there are nine Universities spread all over Maharashtra with
sanctioned intake capacity for MMS courses around 150000. The number of students
passing MMS / MBA CET is almost 70000, who compete for these seats and about
800 Management schools. Graduates from any discipline (Arts, Science, Commerce,
Engineering, Computer Science and Information Technology) can pursue MMS
PROGRAMME provided they pass any of the CETs: MH – CET, CAT, MAT.
Students are admitted as per the guidelines prepared by DTE in this regard.
14
CHAPTER 2
REVIEW OF THE LITERATURE
15
CHAPTER 2
REVIEW OF THE LITERATURE
2.1 Leadership
Leadership is a universal human phenomenon. The study of Leadership is not a new
phenomenon, but it is an ancient art. The old civilizations of Egypt and Rome showed
examples of leadership practices. Regardless of the culture, leadership occurs
universally among all people (Bass, 1981). From ancient to modern times, scholars,
military generals, politicians, and more casual observers have been interested in
leadership. Leadership styles have been studied extensively; perspectives on
leadership have been written and revised. Despite all these efforts, the issue of
leadership effectiveness is still far from settled (Gordon, 1982).
Even though the word leadership has been used since the beginning of the 19th
century (Stogdill, 1974), there continues to be the absence of a comprehensive
approach to assess cause and effect of successful leadership (Taylor and Rosenbach,
1989).Burns (1978) described this situation by asserting that ―Leadership is one of the
most observed and least understood phenomena on earth‖ (p.2).In fact, the concept of
leadership has been defined by various scholars in almost as many ways. Stogdill
(1974) noted this ambiguity when he observed that ―there are almost as many
different definitions of leadership as there are persons who have attempted to define
the concept‖ (p.7). This proliferation of definitions for leadership is primarily due to
the complexity and elusiveness of the concept. Lassey (1976) described this
complexity by observing that ―there is no clear-cut agreement on the meaning of
Leadership for all circumstances‖ (p.15). In an attempt to resolve the discrepancy of
16
definitions, Chemers (1997) developed what he believed to be an umbrella definition
of Leadership that would earn the acceptance of a majority of theorists and
researchers. Chemer‘s definition describes leadership as ―a process of social influence
in which one person is able to enlist the aid and support of others in the
accomplishment of common task‖.
In the literature, leadership has been a subject of interest since the 18th
century.
However according to Chemers (1997), leadership had not been scientifically studied
until the early 20th
century .Bass (1981) contended that early theorists attempted to
identify leadership through a theoretical approach. He continued with this analysis to
suggest that researchers failed to develop sufficient theories because they could not
consider the interactions between individuals and situational variables. Bass compared
early researchers on leadership to their recent counter parts, concluding that the
former tried to develop comprehensive theories with theoretical bases and not on
empirical research.
In considering the differences between a manager and leader, many scholars agree to
differences, but widely disagree on what the differences are. Schon (1986) argued that
leadership and management are not synonymous terms. It is possible, Schon argued,
to be a leader without being a manager and also to be a manager without being a
leader. Davis and Newstrom (1985) viewed leadership as a part of management. They
argued that managers are concerned with planning and organizing activities while
leaders are involved in influencing others to enthusiastically pursue defined objectives
(p. 158). In this same vein Battern (1989) distinguished between a manager and a
leader by saying that managers push and direct while leaders pull and expect. Bass
(1985) argued that leadership is not only management nor is management only
leadership. According to Schon (1986), managers are generally expected not only top
17
manage, but also to lead. He suggested that they should be criticized if they fail to do
both. Davis and Newstorm (1985) suggested that excellent managers are also
expected to exhibit strong leadership qualities. Finally, Hunt (1991) asserted that the
difference between a manager and a leader is very similar to the
transformational/transactional leadership differences which will be discussed in detail
in subsequent sections.
2.2 Leadership Style Theories
In studying leadership, scholars and theorists have developed many different theories
and approaches in their attempts to explain leadership. It has been noted that until the
20th
century, research on leadership was not based on scientific inquiry (Chemers,
1997).The following sections include a review of the most popular theories and
approaches to leadership.
2.2.1The Great Man Theory
Early research on leadership attempted to identify those traits which differentiated
great persons in history from the general masses (Stogdill, 1974). The concern of 18th
and 19th
century philosophers focused on great men rather than on situations
(Spotts,1964).The Great Man Theory assumes that leaders are endowed with unique
qualities not to be found among the masses (Jabati,1997). It also assumes that ―leaders
are born, not made‖ (Kolb et al., p.239). This theoretical perspective is considered to
be the simplest, oldest, and most widely held notion of effective leadership. The
theory ignores the past achievements of an organization and magnifies the greatness
of executives in the organization. In other words, the theory implies that the success
of an organization depends entirely on the greatness of its executives ( Smith,
1946).According to this theory, it could be assumed that history was shaped solely

18
through the efforts of great men such as Moses, Churchchill, and Lenin( Bass ,1981).
In his study of 14 nations over a long period of time, Woods (1913) mentioned the
influence of the man in the making of a nation. He postulated that the man shaped the
nation in accordance with his abilities. The Great Man Theory, like others, is not
without weaknesses. Among other critics, Smith (1964) criticized the theory in
several ways. First, he asserted that great leaders do not have universal traits in
common. Second, he asserted that different traits are demanded and valued by
different societies. Smith argued further that in the same society, different
organizations demand different traits and that within an organization different
department would demand different traits.
2.2.2Trait Theory
During the first half of the 20th
century, trait theory was considered to be the
dominant theory of leadership (Chemers, 1997; Gordon, 1981).The trait approach
sought to determine the personal, psychological, and physical traits of strong leaders.
The theory held that if leaders were endowed with superior traits or characteristics
that differentiated them from their followers, it should be possible for these traits or
characteristics to be isolated (Bass, 1981).
In a classic review of the literature on leadership, Stogdill (1948) reviewed 124
studies of leadership traits. The purpose of the review was to examine the relationship
between the traits approach and effective leadership. As a result, Stogdill found that
there were some characteristics (intelligence, physical, social background, personality,
and task-related characteristics) that could be used to distinguish leaders from non-
leaders. His results revealed little or no link between other characteristics and
effective leaders. They also led to Stogdill to the realization of the importance of
19
situational variables in determining effective leadership. In general, Stogdill‘s
conclusion did not support the study of trait theory as the sole approach to leadership
research. He concluded that:
A person does not become a leader by virtue of the possession of some combination of
traits, but the pattern of personal characteristics of the leader must bear some
relevant relationship to the characteristics, activities, and goals of the followers.
Thus, leadership must be conceived in terms of the interaction of variables which are
in constant flux and change. The persistence of individual patterns of human
behaviour in the face of constant situational change appears to be the primary
obstacle encountered not only in the practice of leadership, but in the selection and
placement of leaders. (pp. 63-64).
The work of Stogdill and other researchers weakened the argument that trait theory is
a complete explanation of leadership. Hollander and Julian (1969) also criticized trait
theory because of its failure to determine the most important traits that could be
associated with effective leadership. In their argument, they also posited that
leadership effectiveness is not totally dependent on personality factors and that many
other factors, including situational factors, are also important. Gordon (1981)
summarized numerous studies that placed emphasis on leadership traits, citing their
inability to totally explain leadership success. Goulder (1950) reduced the downfall of
the trait approach to two key factors. First, leadership traits that were common to all
good leaders could not be identified. Secondly, it could not be documented that
leaders possess a set of characteristics that are not also possessed by followers.
The numerous shortcomings of the trait approach led many researchers to try to find a
better explanation of leadership ability (Griffin, 1990). Consequently, in the early
20
1950s, researchers had changed their focus from studying the personal characteristics
of leaders to the study of leader‘s observable behaviours (Schermerhorn et al.,
1982).Even so; this shift in the focus of research did not lead to the complete demise
of the trait theory school. The theory is still considered and applied in research in the
1990s (Bryman, 1996).
2.2.3 Behavioural Theory
During the 1950s, once researchers observed that the trait theory was not an adequate
approach to explain leadership effectiveness, they started to focus on behavioural
traits of leaders. Specifically, they began to focus on ―what the leader does and how
he or she does it‖ (Ivancevich et al., 1977, p. 277). This approach assumed that
successful leaders with a particular style of behaviour were expected to be fruitful for
leading persons and groups toward the achievement of specific goals, which
consequently led to high productivity and morale (Ansari, 1990). The behavioural
approach simply aimed to identify certain kinds of behaviours that leader‘s exhibit
and to determine the effects of such behaviours on subordinates. A composite of these
behaviours is referred to as leadership style. Ultimately, researchers were able to
isolate two contrasting styles of the behaviours of leaders, variously called initiating
structure versus consideration, autocratic versus democratic, task-oriented versus
socio-emotional, or production-cantered versus employee- centred( Trice et al.,
1993).
Robbins (1994) observed that behavioural style was the focus of a number of studies
in the decade of the 1950s. The following sections include reviews of the more
popular studies that were conducted at Ohio State University and the University of
Michigan. The Managerial Grid developed by Blake and Mouton is also included.
21
2.2.3.1The Ohio State University Studies
By the late 1940s, some of the most widely known studies had been conducted by
researchers at Ohio State University (OSU). The purpose of their studies was to
determine the types of behaviours leaders display and to determine the effects of
leadership style on work-group performance and satisfaction (Fleishman, 1957). At
the beginning, researchers developed a list of more than 1,000 leadership behaviours.
By using statistical analyses, this list was eventually narrowed into two categories,
initiating structure and consideration (Robbins, 1994).Initiating structure refers to the
behaviour that is concerned with defining and organizing the work, work relationships
and goals. Consideration refers to the behaviour that is concerned with mutual trust,
respect, and rapport between the leader and his subordinates. A leader of the
consideration category was described as one who frequently takes care of the needs of
subordinates. A leader of the consideration category was described as one who
frequently takes care of the needs of subordinates. A leader of the consideration
category was described as one who frequently takes care of the needs of subordinates.
A leader in the initiating category was described as one who was frequently
concerned with structure, task, and routine (Reitz, 1981).
In these studies of the behaviours of leaders, researchers at OSU could not adequately
identify the most effective leadership style. Moreover, the belief that a high
consideration and a high initiating structure lead to effective leadership could not be
proved true in all studies. The results varied, and no single style emerged as the best.
As a result, this approach also received much criticism from researchers in the field.
However, despite obvious weaknesses, the importance of these efforts should not be
diminished. The contributions of OSU provided significant building blocks in the
evolution of a theory that allowed for describing the behaviours of leaders. Indeed,
22
these studies served as the foundation upon which later research was built (Ivancevich
et al., 1977).
2.2.3.2 University of Michigan Studies
At the same time that the OSU researchers were conducting studies in leadership,
other studies on the same topic were in progress at the University of Michigan (UM).
The studies at UM sought to identify styles of leadership that resulted in increased
work-group performance and satisfaction. Similar to OSU, the UM‘s researchers
developed two distinct styles of leadership labelled as production-centred and
employee-centered leadership styles (Ansari, 1990).
The Michigan studies revealed that leaders with a production-centered leadership
style emphasized close supervision, legitimate and coercive power, routine, and
performance. This style was viewed as similar to the OSU dimension of initiating
structure. Leaders with an employee-centered leadership style were described as more
concerned about their subordinates as people. These leaders recognized the needs of
followers, such as welfare, advancement, and growth. Similarly, the OSU dimension
of consideration described like behaviours (Ivancevich et al., 1977).University of
Michigan researchers concluded that the employee-oriented leadership style would
lead to higher productivity and higher job satisfaction and that the production-
oriented leadership style would lead to lower productivity and lower job satisfaction
(Robbins,1994). As with their precursors, these studies were not above criticism. Hill
(1973) proposed that there was evidence to support the idea that the behaviour of a
leader varied from situation to situation. From these studies, another branch of
leadership research emerged-situational theories.
23
2.2.3.3 Managerial Grid
Another influential behavioural approach to leadership/management is the Managerial
Grid developed by Blake and Mouton (1964). This model focuses on task
(production) and employee (people) orientations of managers, as well as combinations
between the two extremes. A grid with concern for production on the horizontal axis
and concern for people on the vertical axis plots five basic management/leadership
styles (see Figure 2). The first number refers to a leader's production or task
orientation and the second, to people or employee orientation. It was proposed that
‗Team Management‘ - a high concern for both employees and production - is the most
effective type of leadership behaviour.
Figure 2: The Managerial Grid (Blake and Mouton, 1964)
24
2.3 Situational Leadership Style Theories
In the 1960s, behavioural theories were found to be insufficient approaches for
studying leadership (Ivancevich et al., 1977). By this time, researchers had come to
recognize that situational factors such as characteristics of leaders and subordinates,
the nature of the task, and group characteristics must be considered in the study of
leadership effectiveness (Ansari, 1990). The implication was that the determination of
successful leadership behaviour depended on the situation (Schermerhorn et al.,
1982). Situational or contingency theories held that there was no universal leadership
behaviour that could be applied to all situations. The current review will highlight the
main contingency theories: Fiedler‘s Contingency Theory, Path-Goal Theory, and the
Vroom-Yetton Model.
2.3.1 Fiedler‟s Contingency Theory
The first comprehensive contingency leadership theory was developed by Fred
Fiedler. The basic tenet of the theory is that group effectiveness is dependent upon the
proper match between the leader‘s personality or style and the demands of the
situation. The model further suggested that task-oriented and employee-oriented were
the two major styles of leadership. To determine whether the leader was task-oriented
or employee oriented, Fiedler developed an instrument called the Least-Preferred Co-
worker (LPC) Questionnaire (Fiedler, 1967). To arrive at an LPC score, the leader is
asked to think of the person with whom he or she has worked least well in
accomplishing some task, using a series of bipolar adjectives rated on an 8-point scale
(e.g., friendly-unfriendly, pleasant-unpleasant). A high LPC leader who describes his
least preferred co-worker in relatively positive concepts is people-motivated. A low
LPC leader who uses relatively negative concepts is task-motivated (Siegel & Lane,
25
1982). According to Fiedler, leaders who are characterized as task-oriented will be
effective in favourable and unfavourable situations. Also, Fiedler assumes that
employee-oriented leaders will be more effective in situations of moderate
favourability than in situations at either extreme. Favourableness was defined by
Fiedler as the degree to which the situation enabled the leader to exert influence over
his group. According to this definition, situational favourableness consists of three
elements: (1) affective leader-member relations, which refers to the degree of personal
relationship between the leader and group members; (2) task structure, which refers to
the extent to which the task requirements are clear and spelled out; and (3) leader
position power, which refers to the degree to which the leader has authority to reward
or to punish followers (Fiedler, 1967). Bryman (1996) pointed out that Fiedler viewed
these elements as changeable and viewed a person‘s personality as an unchangeable
factor. Therefore, the theory resolved that the work situation must be changed to fit
the leader rather than the opposite.
Although many researchers considered the work of Fiedler as a major contribution to
leadership studies, the theory faced criticism (Behling & Schriesheim, 1976).For one
thing, the validity of the model was questioned. The inconsistency between the results
and the model was noted (Bryman, 1986).
2.3.2 Path-Goal Theory
Path- Goal theory is a contingency model of leadership developed by Robert House
and based on the works of the expectancy theory of motivation and on the work of the
OSU group. This theory was promoted as an approach that could explain how a leader
might successfully enhance the satisfaction and performance of his subordinates. The
26
term path-goal is used to indicate the role of a leader in making an effective link
between the follower‘s personal goals and the work goals (House, 1971).
The theory was built upon two propositions. The first proposition was that the
behaviour of the leader would be acceptable and satisfying to subordinates to the
extent that the subordinates perceived it as either an immediate source of satisfaction
or as an instrumental source to future satisfaction. The second proposition was that the
behaviour of the leader would be motivational to the extent that (a) it made the
satisfaction of subordinates contingent upon effective performance and (b) that it
complemented the work environment of subordinates by providing guidance, clear
direction, support, and reward for effective performance. For the purpose of testing
these propositions, House devised four types of leader behaviour: (a) directive, (b)
supportive, (c) achievement-oriented, and (d) participative. According to House, the
use of any of these types of leadership would be situation-dependent.
2.3.3 The Vroom –Yetton Model
Vroom and Yetton (1973) developed a model that was designed to help a leader
through a rational process to choose an appropriate leadership style that fits with a
given situation. The basic premise of the model is that the degree to which the leader
should share decision- making power with subordinates depends on the situation. The
model identified five leadership styles, each of which reflects a behavioural option for
the leader:
AI: The leader makes the decision alone.
AII: The leader asks for information from subordinates but makes the decision alone.
Subordinates may or may not be informed about the situation.

27
CI: The leader shares the situation with the individual. The leader asks subordinates
for information and evaluation, but the leader alone makes the decision.
CII: The leader and subordinates meet as a group to discuss the situation, but the
leader makes the decision.
GII: The leader and subordinates meet as a group to discuss the situation, and the
group (which includes the leader) makes the decision.
Vroom and Yetton (1973) argued that the ultimate effectiveness of decisions could be
judged on the following factors: (1) the quality or rationality of the decision, (2) the
acceptance of the decision by employees, and (3) the amount of time required to make
the decision. The model has been criticized as complex and cumbersome (Field,
1979). However, the work of Vroom and Yetton has been supported by some
researchers and considered as a useful approach of leadership (Landy, 1985;
Schermerhorn, Jr., 1982).
2.4 Recent Theories of Leadership Styles
A new theory of leadership emerged in the 1970s. Transactional and Transformational
leadership styles were first introduced by Burns (1978). A few years later, Bass
(1985) expanded the theory and came up with the Multifactor Leadership
Questionnaire (MLQ). The full range of leadership models that was introduced by
Avolio and Bass (1991) gave more advancement to the theory. This theoretical model
included three styles of leadership: (a) transactional, (b) transformational, and (c)
Laissez- Faire. According to Hartog et al. (1997), Bass‘s theory or the new leadership
approach ―integrates ideas from trait, style, and contingency approaches of leadership
and also incorporates and builds on work of sociologists such as Weber (1947) and

28
political scientists such as Burns (1978)‖(P.19).The three styles of leadership
mentioned above are essential elements in this research and are discussed in greater
detail below.
2.4.1Transactional and Transformational leadership Styles
In distinguishing between transactional and transformational leadership.Burns (1978)
noted that transactional leadership refers to a type of leadership that is based on an
exchange relationship between leader and follower.Burns felt that this exchange could
take different economic, political, or psychological forms. Such leadership, he argued,
does not bring leaders and followers together to pursue higher purposes. According to
Bass (1990), transactional focus on the clarification of task requirements and the
specification of contingent rewards. Transformational leaders interact with their
followers in such a way that both leader and followers raise each other to higher
levels of motivation and morality (Burns, 1978).In Leadership and Performance
beyond Expectations, Bass (1985) expanded the theory of transactional and
transformational leadership. While Burns (1978) had focused on the application of the
theory in political setting, Bass (1985) was concerned with its application to business
organisations. According to Bass (1985), transformational leaders are those who
motivate followers to do more than originally was expected. That could be achieved,
Bass argued,through anyone of the following steps: (1) increasing followers
awareness and consciousness of the importance of designated outcomes and the steps
that lead to these outcomes, (2) encouraging followers to transcend their own self
interests , and (3) expanding or altering followers needs and wants according to
Maslow‘s Hierarchy of Needs .In distinguishing between the Burns and Bass theories
of transformational leadership ,Carlson and Perrewe (1995) stated that:
29
“The main difference between these two theories was that Burns restricts this type of
leadership only to leaders who appeal to positive moral values. On the other hand,
Bass argues that a transformational leader is one who increases commitment
regardless of the final effect on the follower. Regardless, when transformational
leadership is enacted, members of organisations no longer seek merely self interest,
but that which is beneficial to the organisation as a whole.”(p.832)
Fiedler and House (1988) proposed that transformational theories seek to address the
actions of leaders that cause followers to change their values, needs, goals, and
aspirations. In making the distinction between transactional and transformational
leadership forms, Burns (1978) viewed these leadership forms as independent
dimensions. In other words, Burns (1978) viewed Transactional and Transformational
forms of leadership as polar constructs while Bass (1985) viewed them as
complementary constructs. Bass viewed successful leaders as both transactional and
transformational who differ in degrees. In his conclusion, Bass expressed the notion
that ―to be transactional is the easy way out; to be transformational is the more
difficult path to pursue‖ (p.26)
Transactional behaviours involve structuring performance environment to assist
subordinates in achieving organizational objectives and receiving rewards, while
transformational behaviours focus on creating changes in followers` values, self-
perceptions, and psychological needs (Fein et al, 2010). Generally speaking, studies
conducted on transactional and transformational leadership have added important
value into the nature of leadership effectiveness.
In this content, the researcher should differentiate between two concepts: transactional
leadership and transformational leadership. In fact transactional leadership is a
30
process in which the relationship leader-follower is reduced to simple exchange of a
certain quantity of work for an adequate price. Contrary to this, transformational
leadership is far more complex process, the realization of which requires more
visionary and more inspiring figures (Bowditch and Buono, 1990).
Different empirical studies have been conducted to support the effects or
transformational leaders‘ behaviours. A previous study showed that transformational
leadership is positively related to employee satisfaction and to job performance (Bass,
1995). Ozaralli (2003) found that transformational leadership contributes to the
prediction of subordinates‘ self-reported empowerment. Transformational leadership
enhances organizational citizenship behaviours (Koh et al, 1995) and employees‘
commitment (Barling et al, 1996). In addition, transformational leadership mediates
the relationship between leaders‘ emotional intelligence and group cohesiveness
(Wang and Huang, 2009).
2.4.2 Transactional Leadership Style Dimensions
Bass (1989) suggested that transactional leadership involves two distinct dimensions:
(1) the use of contingent rewards, which implies that leaders reward followers in
exchange for attaining the specified performance levels; and (2) management by
exception (MBE), which has the dimensions of Active and Passive. In Active MBE,
leaders monitor their follower‘s performances and take corrective actions as
necessary. In Passive MBE, leaders do not intervene until mistakes or problems occur,
then leaders take corrective actions.
2.4.3 Transformational Leadership Style Dimensions

31
In 1995, a new version of the Multi-factor Leadership Questionnaire (MLQ) was
developed to measure transactional, transformational, and laissez-faire styles of
leadership. For this version, Bass and Avolio (1995) listed five dimensions that refer
to transformational leadership characteristics. The term ‗transformational leadership‘
was first coined by Downton [20], and then emerged as an important approach to
leadership research by Burns [9]. Based on these early works, several theories of
transformational leadership [6, 10] were generated to advance this new leadership
concept. These works broadened the traditional concept of leadership as a relationship
of economic exchange that offers rewards or compensation for a desired behaviour by
viewing leadership as a change process and by exploring the impact of leader
behaviour on followers‘ values, beliefs and higher-order needs [11]. Specifically,
Bass [6] described transformational leadership as leader behaviours that stimulate and
inspire followers to achieve extraordinary outcomes by raising the level of motivation
and morality in both themselves and their followers. Transformational leaders are
effective in promoting organizational commitment by aligning goals and values of the
follower, the group, the leader, and the organization [10, 12, and 21]. Its strong,
positive effects on followers‘ attributes and commitment will then motivate followers
to reach their fullest potential and exceed expected performance [11]. Bass and his
colleagues further conceptualized transformational leadership into four components:
idealized influence; inspirational motivation; intellectual stimulation; and
individualized consideration. Each of the components helps build followers‘
commitment in different ways [6, 19, and 22]. The following texts discuss these
components and their impact on followers‘ organization commitment in detail.
2.4.3.1 Idealized influence, also called charisma, describes transformational leaders
who behave as role models for their followers. Followers usually perceive these
32
leaders as having extraordinary capability, persistence and determination, as well as
high standards of moral and ethical conduct. They deeply admire, respect and trust
these leaders, and thus identify with leaders‘ goals, interests and values [19, 21].
2.4.3.2 Inspirational motivation occurs when leaders motivate and inspire those
around them by providing challenges and meaning to their work. They provide
visions of what is possible and how to attain these goals. More specifically, these
leaders get followers involved in envisioning the future, and then they promote
positive expectations about what needs to be done and demonstrate commitment to
the shared vision[19]. With this dimension, leaders are able to promote followers‘
emotional commitment and excitement to a mission [11].
2.4.3.3 Intellectual stimulation encourages followers to be creative and innovative. In
practice, transformational leaders help others to think about old problems in new
ways, and to continuously question and develop their own beliefs, assumptions and
values. These leaders also jointly work with their followers to deal with problems in
innovative ways. The pride in actions of all those involved and joint success in
overcoming obstacles will reinforce organizational commitment of followers [11, 19].
2.4.3.4 Individualized consideration means understanding and sharing others‘
concern and developmental needs, and treating each individual follower uniquely.
Leaders act as coaches and advisors to not only identify and satisfy each individual
follower‘s current needs, but also to attempt to expand and elevate the needs in order
to assist followers become fully actualized. By emphasizing on followers‘ personal
career needs and providing them with a sense of increased competence to carry out
duties, leaders could further enhance followers‘ commitment [10, 11]. A number of
studies have empirically validated the positive effects of transformational leadership
on followers‘ organizational commitment. For example, transformational leadership
33
was found to be significantly related to organizational commitment and organizational
citizenship behaviour in a study of 864 teachers in Singapore [15]. Rai and Sinha [23]
conducted a test of 261 middle managers from public banking sector in India, and
identified that managers‘ score on transformational leadership accounted for
significant amounts of variances in their commitment to the organizations. In a similar
vein, positive relationships between all components of transformational leadership
and followers‘ commitment were also identified with a total of124 manager from
banking and food industries in U.S. [14]. 124 managers from banking and food
industries in U.S. [14] in the context of family business, however, little empirical
evidence has been provided to support the positive relationship between
transformational leadership and followers‘ organizational commitment [16].
Transformational leaders have charisma, inspiration and intellectual simulation,
inspiration and intellectual simulation (Conger, 1999). Charisma generates the pride,
faith and respect that leaders encourage their workers to have in themselves, their
leaders and their technological organization, while inspiration is the ability to
motivate followers through communication of high-technological expectations
(Garcia-Morales, Matias-Reche and Hurtado- Torres, 2008). Intellectual simulation
refers to the leaders‘ behaviour that leads to promoting employees' intelligence,
knowledge and learning so that they can be innovative.
Transformational leaders have charisma, inspiration and intellectual simulation,
inspiration and intellectual simulation (Conger, 1999). Charisma generates the pride,
faith and respect that leaders encourage their workers to have in themselves, their
leaders and their technological organization, while inspiration is the ability to
motivate followers through communication of high-technological expectations
(Garcia-Morales, Matias-Reche and Hurtado- Torres, 2008). Intellectual simulation
34
refers to the leaders‘ behaviour that leads to promoting employees' intelligence,
knowledge and learning so that they can be innovative.
Transformational leader raises aspiration and shifts people and organizational systems
into new, high-performance patterns. The presence of transformational leadership is
reflected in followers who are enthusiastic about the leader and her or his ideas
(Schermerhorn, 2008). Furthermore, transformational leaders inspire their followers
to think more than their own aims and interests and to focus on greater team,
organizational, national, and also global objectives (Jandaghi et al, 2009).
While transactional and transformational leaders were described as active leaders
(Yammarino & Bass, 1990), laissez- faire leaders were viewed as inactive. Laissez-
faire leaders are characterized by avoiding responsibility and decision–making.
Although such a style under certain conditions (for example, with a group of scientists
or college professors) will be effective (Sutermeister, 1969; Williams, 1978), it was
thought that this particular style of leadership indicated, in fact, the absence of
leadership. Therefore, this type of leadership was considered to be an inappropriate
way to lead (Hartlog et al., 1997).
2.4.4 Laissez-Faire Leadership Style
While transactional and transformational leaders were described as active leaders
(Yammarino & Bass, 1990), laissez-faire leaders were viewed as inactive. Laissez-
faire leaders are characterized by avoiding responsibility and decision–making.
Although such a style under certain conditions (for example, with a group of scientists
or college professors) will be effective (Sutermeister, 1969; Williams, 1978), it was
thought that this particular style of leadership indicated, in fact, the absence of
leadership. Therefore, this type of leadership was considered to be an inappropriate
way to lead (Hartlog et al., 1997).
35
2.5 Transformational Leadership Style and Employee Commitment
Organization will be higher, Lio (1995) concluded that ―workers‘ organizational
commitment is significantly correlated to their perceived job security‖ (p.241).
Management styles can influence the commitment level of employees. Koopman
(1991) studied how leadership styles affected employees and found those employees
who favoured their manager‘s style also favoured the organization more. Though
there was no direct connect between commitments, it could be argued that this would
then affect their levels of commitment to the organization. Nierhoff et al (1990) found
that the ―overall management culture and style driven by the top management actions
are strongly related to the degree of employee commitment‖ (p. 344). These
correlations bring to light the importance of having strong managers and their roles in
the overall organization.
Eisenberger et al (1990) discuss that those employee‘s who feel that they are cared for
by their organization and managers also have not only higher levels of commitment,
but that they are more conscious about their responsibilities, have greater involvement
in the organization, and are more innovative. Managers and organizations must
reward and support their employees for the work that they do because this perceived
support allows for more trust in the organization.
2.6 Summary of Leadership Style Theories
Since the 18th
century, leadership has been a subject of interest. However, the field of
leadership had not been scientifically studied until the early 20th
century. Early
research on leadership attempted to identify leadership through a theoretical approach.
The Great Man Theory assumes that leaders are endowed with unique qualities not to
be found among the masses. The trait theory, which was considered to be the
36
dominate theory of leadership during the first half of the 20th
century, sought to
determine the personal, psychological, and physical traits of strong leaders. During
the 1950s, the theoretical approach was abandoned due to its inability to explain
leadership effectiveness. As a result, the behavioural theory represented by the studies
of Ohio State University and the University of Michigan had taken place. The
behavioural approach simply aimed to identify certain kinds of behaviours that
leader‘s exhibit and to determine the effects of such behaviours on subordinates. In
the 1960s, leadership researchers focused their attention on the situational factors and
their effects on leadership effectiveness. Situational or contingency theories held that
there was no universal leadership behaviour that could be applied to all situations. The
full range of leadership that included three styles (transformational, transactional, and
laissez-faire) is a recent development in the field. This approach integrated ideas from
trait, behavioural, and situational theories and built on these. Transformational leaders
inspire followers to rise above self-interest for the greater good of the group and to do
more than originally was expected. Transactional leaders focus on the clarification of
task requirements and the specification of contingent rewards.
2.7 Theoretical Framework on Leadership Style
The broad fields of this research are Transformational and Transactional leadership.
The transformational leadership has five dimensions or factors that build the subject
and transactional leadership has 3 dimensions or factors that build the subject .(The
five factors of transformational leadership styles are: Idealized influence {attributes
and behaviours}, inspirational motivation, intellectual stimulation, encourage
innovative thinking and individualized consideration). (The three factors of
transactional leadership are: MBE-A: Management-By-Exception: Active, MBE-P:
Management-By-Exception: Passive and CR: Contingent Reward).
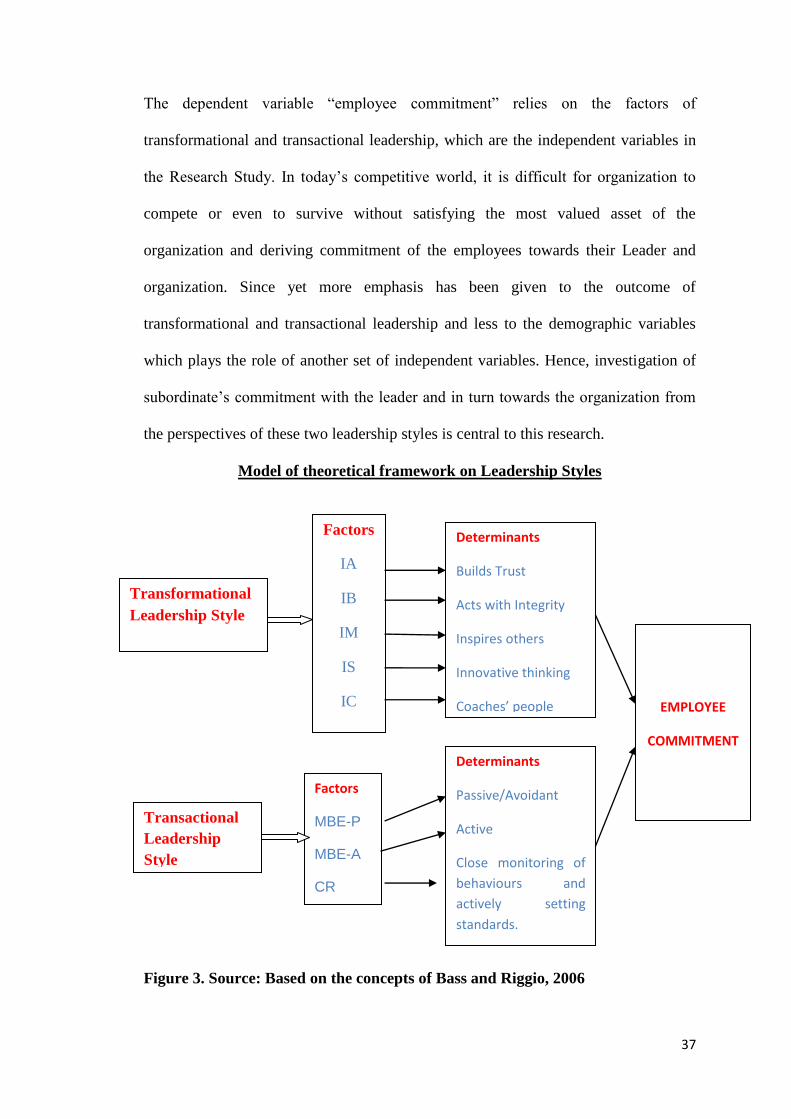
37
The dependent variable ―employee commitment‖ relies on the factors of
transformational and transactional leadership, which are the independent variables in
the Research Study. In today‘s competitive world, it is difficult for organization to
compete or even to survive without satisfying the most valued asset of the
organization and deriving commitment of the employees towards their Leader and
organization. Since yet more emphasis has been given to the outcome of
transformational and transactional leadership and less to the demographic variables
which plays the role of another set of independent variables. Hence, investigation of
subordinate‘s commitment with the leader and in turn towards the organization from
the perspectives of these two leadership styles is central to this research.
Model of theoretical framework on Leadership Styles
Figure 3. Source: Based on the concepts of Bass and Riggio, 2006
Transformational
Leadership Style
Transactional
Leadership
Style
Factors
IA
IB
IM
IS
IC
IS
IC
Determinants
Builds Trust
Acts with Integrity
Inspires others
Innovative thinking
Coaches’ people
EMPLOYEE
COMMITMENT
Factors
MBE-P
MBE-A
CR
CR
Determinants
Passive/Avoidant
Active
Close monitoring of
behaviours and
actively setting
standards.
38
2.8 Leadership styles within academic institutions:
According to Bryman (1992), transformational form of leadership has only recently
become the subject of systematic inquiry in educational contexts, although it has been
studied extensively within business settings. The studies of leadership within an
educational context are important for several reasons. Educational institutions,
especially Higher Education Institutions, which use public funds, are under scrutiny
and are pressurized to produce value for money performance (Bess and
Goldman,2001; Pounder 2001). Expectations are that these institutions should operate
as ―business units‖ making profit. This has led to a tendency to transfer commercial
business models into the educational arena.
As Bess and Goldman (2001) have put it, a new managerial culture, which promotes
economic efficiency and bottom line results, dominates both policy and practice often
overriding most concerns for social goals, quality of teaching and research and
internal human relations, is being adopted in higher education. As a result leaders
within academic institutions struggle to respond to business interests as secondary to
academic freedom.
As a sub-discipline or content area of leadership studies, educational leadership is still
in its infancy. Most of the empirical studies conducted have been done in schools with
a limited number of studies concentrating on higher education (Brown & Moshavi,
2002). While it is acknowledged that the organizational cultural legacies and
leadership within schools and higher education institutions may be different, Bess and
Goldman (2001) point out that professor and teachers have much in common. Both do
work with a significant cognitive and intellectual content, and have substantial
independence and autonomy where they work closely with students and associates

39
with their own peers. Professors and teachers enjoy a tenure system that provides job
security and a buffer that characterizes their profession and the leadership context.
Based on Bess and Goldman‘s (2001) arguments, it is assumed that the common goal
of education pursued by both types of institution might allow for comparisons or
generalizations from one to another.
Educational leadership researchers have drawn selectively from the broader
perspectives or approach to leadership and concentrated mainly on transformational
and charismatic leadership. A review of the literature indicates a limited number of
papers focusing on the efficacy of transformational and transactional leadership in the
context of higher education. In a study of principals of 89 high schools, Koh, Steers
and Telborg (1995), found that transformational leadership behaviours hold an
additive effect on outcomes such as satisfaction and effectiveness. In a more recent
study of 440 university faculty members, Brown and Moshavi (2002) showed that the
idealized influence or charisma factor of transformational leadership was significantly
predictive of desired organizational outcomes. Using the MLQ, they found that the
aggregated measure of transformational leadership is significantly related to the
faculty‘s satisfaction, their perceptions of their organization‘s effectiveness and their
willingness to give extra effort.
Other authors who also believed that leadership is essential in educational institutions
include Rowley (1997) argues that the type of leadership exercised in academic
institutions, which is academic leadership, is unique to higher education. He indicates
that this leadership extends beyond the organization into the wider community served
by higher education and is central to academic excellence. Such Leadership is
important in managers at all levels in higher education and is not only vested in top
management.
40
Ogshabemi (2001) looked at the level of satisfaction that academics derive from the
behaviour of their line managers. Line managers in higher education could be of head
of the department, a dean of a faculty, director of a school or unit or the Vice
chancellor of the institution. He found that approximately half (52.4%) of university
teachers are satisfied with the behaviour of their line managers while about a third
(34.4%) is dissatisfied. Through regression analysis, he found that the age and the
length of service in higher education were important in explaining an academic‘s
satisfaction or dis-satisfaction with the behaviour of their line managers.
The literature review of leadership in academic institution indicates that leadership is
as essential as it is in other organizations and that it has an influence on employee‘s
work attitudes.
2.9 Employee Commitment:
No organizations in today‘s competitive world can perform at peak levels unless each
employee is committed to the organisation‘s objectives and work as an effective team
member. It is no longer good enough to have employees who come to work faithfully
everyday and do their jobs independently. Employees now have to think like
entrepreneurs while working in teams, and have to prove their worth. However they
also want to be a part of successful organisation which provides a good income and
the opportunity for development and secured employment.
In the past, organizations secured the loyalty of their employees by guaranteeing job
security. However many organizations have responded to competitive pressures by
downsizing, restructuring and transformation and thus created a less secure
organizational climate. A growing number of employees therefore feel that they are
victims of broken promises. One of the challenges facing modern organizations

41
involves maintaining employee commitment in the current business environment.
These organizations can achieve by developing a new ―work contract‖. In today‘s
workplace, employees face more ambiguity in their daily activities and decreased job
security (Bergmann, Lester, De Meuse and Grahn, 2000). With no assurance of
continued employment, workers have now raised their expectations in other areas. For
instance, the employees expect employer to demonstrate their commitment in terms of
pleasant working conditions, access to training and development, provision of a safe
working environment and a balance between work and employee‘s commitment
outside the workplace.
Organizations are faced with ever increasing competition and as they prepare for new
challenges, one of the key components of survival is maintaining and upgrading the
organization‘s ability to use human resources effectively and efficiently. According to
Katz (1964), employee behaviour essential for organizational effectiveness includes
employee‘s (1) entering and remaining with the organisation, (2) carrying out specific
role requirements and (3) engaging in innovative and spontaneous activity that goes
beyond role prescriptions. The appointment of good workers is thus critical, but of
even greater significance is the organisation‘s ability to create a committed workforce.
Hence the need for managers to understand the concept of commitment – what it is
how it operates, and most importantly, which behaviours are displayed by employees
committed to the organisation?
The importance of employee commitment is quite evident if one considers prior
research into the relationship between commitment and job satisfaction (Bateman and
Organ, 1983), trust in and loyalty to the leader (Deluga, 1994) and perception of
supervisor‘s fairness (Nierhoff & Moorman 1993). It is an important concept in the
management and behavioural sciences. It is concerned with the relationship between
42
an organization and its employees. The roots of organizational commitment of
employees go back to the human relations movement of the early to mid-20th
century.
At that time, the concept was reflected in focusing on the feelings and behaviours
among employees toward the organizations they worked for (Baruch, 1998).
The importance of organizational commitment of employees refers to its presumed
relationship with important organizational outcomes such as turnover, absenteeism,
and performance (Mowday, Porter, & Steers, 1982). Committed employees are
expected to identify with and to feel loyal toward their organization; to feel the
importance of the agency‘s values, goals, and mission; and also to feel that their job
responsibilities are compatible with their personal values and ethics (Romzak, 1990).
It has been reported that ―Organizational commitment should be of great interest to
managers, because employees with strong commitment tend to be highly productive
and loyal, while those with low levels tend to have higher incidence of turnover,
absenteeism, stress-related health claims, and other workplace problems‖ (Ward &
Davis, 1995, p.35). In addition to all of this, committed employees are thought to act
without basing their actions on any calculation of what they have invested.
Committed employees are also thought to believe that the values they share with the
organization will provide them with a sense of personal satisfaction (Romzek,
1990).Buchanan (1974a) viewed commitment as ―no less than a precondition for
successful social organization‖ (p.340). In general, for both individuals and agencies,
employee commitment is believed to be a positive factor (Romzek, 1990).
Many authors associate the development of organisational commitment with
variables such as the personal characteristics of the employee, organisational
characteristics and work characteristics (Mowday et al.,1979; Nijhof et al., 1992).The
influence of personal characteristics on organisational commitment has been
43
extensively studied with the focus on demographic variables such as age, gender,
occupational status, length of service, salary, internal promotion period, marital status,
educational level,( Nijhof et al .,1992). The organisational characteristics that have
been studied include leadership and management style and various Demographic
details. In our attempt to understand organisational commitment, we need to
understand how these various variables fit together and lead to the development of
organisational commitment.
In the literature, there is no universal definition of organizational commitment of
employees. Researchers with different theoretical perspectives have defined the
concept of employee commitment in various ways. Buchanan (1974b) observed that
there is little consensus about the definition of commitment or its measurement.
Morrow (1983) reviewed the literature on commitment that has been written since
1965 and found more than 25 employee commitment concepts and measures.
Grouping these concepts and measures, Morrow discerned five distinct types:
commitment to work, the organization, the job, the career, and the union. The present
study was concerned with only commitment to the organization.
Organizational researchers agree that a consensus has not yet been reached over the
definition of organizational commitment of employees (Scholl, 1981; Benkhoff,
1997a; Mowday 1998; Suliman and Isles, 2000a, 2000b; Zangaro, 2001). Scholl
(1981) indicates that the way employee commitment is defined depends on the
approach to commitment that one is adhering to. Accordingly employee commitment
is defined either as an employee attitude or as force that binds an employee to an
organization. According to Suliman and Isles (2000a), there are currently four main
approaches to the conceptualization and exploring organizational commitment. There
44
is the attitudinal approach, the behavioural approach, the normative approach and the
multi-dimensional approach.
Mowday et al. (1979) pointed out that most researchers‘ defined organizational
commitment in terms of either a behavioural perspective or an attitudinal perspective.
Alpander (1990) distinguished between the attitudinal and behavioural approaches to
commitment and described how commitment has been viewed differently from the
two perspectives. The former, Alpander (1990) argued, views commitment as an
internal state, but the latter views it as ―the state of being bound to the organization by
personal investment‖ (p.53). Mowday et al. (1982) proposed that a cyclical
relationship exists between the two types in which commitment attitudes lead to
committing behaviours which, in turn, reinforce commitment attitudes. An important
observation is that, throughout the literature, commitment has been viewed as a more
active and positive attitude toward the organization from both perspectives (Johnston
et al., 1990).This study focused on employee commitment as an attitude.
The attitudinal approach views commitment largely as an employee attitude or more
specifically as a set of behavioural intentions. The most widely accepted attitudinal
conceptualization of organizational commitment is that by Porter and his colleagues
who define organizational commitment is that by Porter and his colleagues who
define organizational commitment as the relative strength of an individual‘s
identification with and involvement in a particular organization (Mowday et al.,
1979).They mention three characteristics of employee commitment: (1) a strong
belief in and acceptance of the organization‘s goals and values, (2) A willingness to
exert a considerable effort on behalf of the organization and (3) a strong intent or
desire to remain with the organization. Within this approach, the factors associated
with commitment include positive work experiences; personal characteristics and job
45
characteristics while the outcomes include increased performance, reduced
absenteeism and reduced employee turnover.
The second approach refers to organizational commitment of employee‘s behaviour
(Suliman and Isles, 2000b; Zangaro, 2001). The focus of research according to the
behavioural approach is on the overt manifestations of commitment. The Behavioural
approach emphasizes the view that an employee continues his/her employment with
an organization because investments such as time spent in the organization,
friendships formed within the organization and pension benefits, tie the employee to
the organization. Thus an employee become committed to an organization because of
―sunk costs‖ that is too costly to lose. Becker‘s (1960) side bet theory forms the
foundation of this approach. According to him employee commitment is continued
association with an organization that occurs because of an employee‘s decision after
evaluating the costs of leaving the organization. He emphasizes that this commitment
only happens once the employee has recognised the cost associated with
discontinuing his association with the organization. In a similar vein, Kanter (1968)
defined organizational commitment as ―profit‖ associated with continued participation
and a ―cost‖ associated with leaving. That is, an employee stands to either profit or
lose depending on whether he/she chooses to remain with the organization. Whereas
the attitudinal approach uses the concept of commitment to explain performance and
membership, the behavioural school uses the concept of ―investments‖ as ―a force that
ties employees to organizations‖, to explain organizational commitment (Scholl,
1981).
The Normative approach is the third approach, which argues that congruency between
employee goals and values and organizational aims make the employee feel obligated
to his/her organization (Becker, Randall, & Reigel 1995).From this point of view,
46
organizational commitment has been defined as ―the totality of internalized normative
pressures to act in a way which meets organizational goals and interests‖ (Weiner,
1982).
The last approach, the multidimensional approach, is relatively new. It assumes that
organizational commitment is more complex that emotional attachment, perceived
costs or moral obligations. This approach suggests that organizational commitment
develops because of the interaction of all these three components. Several studies
according to Suliman and Isles (2000b) have contributed to this new
conceptualization of organizational commitment. They credit Kelman (1958) as the
earliest contributor to the multidimensional approach. Elman lay down the foundation
for the multidimensional approach when he linked compliance, identification and
internalisation to attitudinal change. Another earlier contributor is Etzioni (1961) who,
as cited by Zangaro (2001), describe organizational commitment in terms of three
dimensions; moral involvement, calculative involvement and alimentative
involvement, with each of these dimensions representing an individual‘s response to
organizational powers. Moral involvement is defined as a positive orientation based
on an employee‘s internalisation and identification with organisational goals.
Calculative involvement is defined as either a negative or a positive orientation of low
intensity that develops due to an employee receiving inducements from the
organization that match his/her contributions. Alienative involvement on the other
hand is described as a negative attachment to the organization. In this situation,
individuals perceive a lack of control or of the ability to change their environment and
therefore remain in the organization only because they feel they have no other
options. Etzioni‘s three dimensions incorporate the attitudinal, behavioural and
normative aspects of organizational commitments of employees.
47
O‘Reilly and Chatman (1986) also support the notion that organizational commitment
should be seen as the multi-dimensional construct. They developed their multi-
dimensional approach based on the assumption that commitment represents an
attitude toward the organization, and the fact that various mechanisms can lead to
attitudes development of attitudes. Taking Kelman‘s (1958) work as their basis, they
argue that commitment could take three distinct forms that they called compliance,
identification and internalisation. They believed that compliance would occur when
attitudes and corresponding behaviours are adopted in order to gain specific rewards.
Identification would occur when an individual accepts influence to establish or
maintain a satisfying relationship. Lastly, internalization would occur when the
attitudes and behaviours that one is encouraged to adopt are congruent with one‘s own
values.
The most popular multi-dimensional approach to employee commitment is that of
Meyer and his colleagues. In 1984, Meyer and Allen, based on Becker‘s side-bet
theory, introduced the dimension of continuance commitment to the already existing
dimension of affective commitment. As a result, organizational commitment of
employees was regarded as a bi-dimensional concept that included an attitudinal
aspect as well as behavioural aspect. In 1990 Allen and Meyer added a third
component, normative commitment to their two dimensions of organizational
commitment. They proposed that commitment as a psychological attachment may
take the following three forms: the affective, continuance and normative forms.
Meyer and Allen (1984) defined affective commitment as ―an employee‘s emotional
attachment to, identification with, and involvement in the organization‖, continuance
commitment as ―commitment based on the costs that employees associate with
leaving the organization‖, and normative commitment as ―an employee‘s feelings of
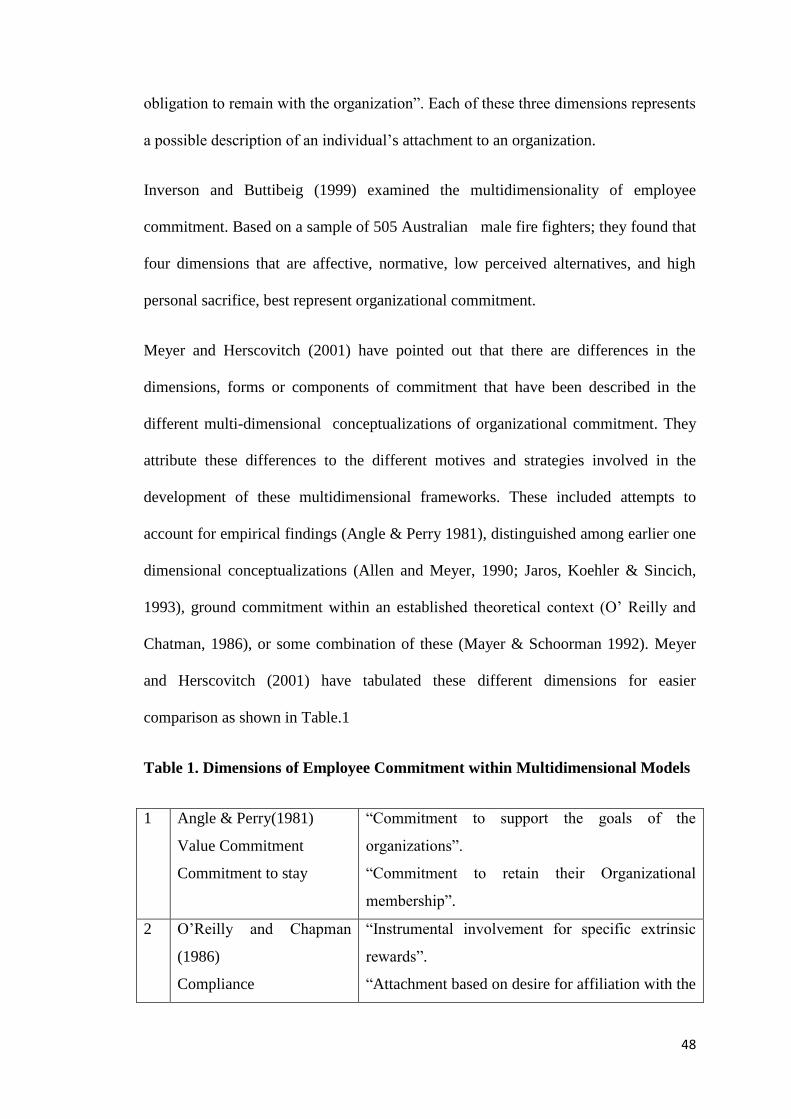
48
obligation to remain with the organization‖. Each of these three dimensions represents
a possible description of an individual‘s attachment to an organization.
Inverson and Buttibeig (1999) examined the multidimensionality of employee
commitment. Based on a sample of 505 Australian male fire fighters; they found that
four dimensions that are affective, normative, low perceived alternatives, and high
personal sacrifice, best represent organizational commitment.
Meyer and Herscovitch (2001) have pointed out that there are differences in the
dimensions, forms or components of commitment that have been described in the
different multi-dimensional conceptualizations of organizational commitment. They
attribute these differences to the different motives and strategies involved in the
development of these multidimensional frameworks. These included attempts to
account for empirical findings (Angle & Perry 1981), distinguished among earlier one
dimensional conceptualizations (Allen and Meyer, 1990; Jaros, Koehler & Sincich,
1993), ground commitment within an established theoretical context (O‘ Reilly and
Chatman, 1986), or some combination of these (Mayer & Schoorman 1992). Meyer
and Herscovitch (2001) have tabulated these different dimensions for easier
comparison as shown in Table.1
Table 1. Dimensions of Employee Commitment within Multidimensional Models
1 Angle & Perry(1981)
Value Commitment
Commitment to stay
―Commitment to support the goals of the
organizations‖.
―Commitment to retain their Organizational
membership‖.
2 O‘Reilly and Chapman
(1986)
Compliance
―Instrumental involvement for specific extrinsic
rewards‖.
―Attachment based on desire for affiliation with the

49
Identification
Internalization
organization‖.
―Involvement predicted on congruence between
individual and organizational values‖.
3 Penley and Gould (1988)
Moral
Calculative
Alienative
―Acceptance of and identification with
organizational goals‖.
―A commitment to an organization which is based
on the employee‘s receiving inducements to match
contributions‖.
―Organizational attachment which results when an
employee no longer perceives that there are
rewards commensurate with investments; yet
he/she remains due to environmental pressures‖.
4 Meyer and Allen (1991)
Affective
Continuance
Normative
―The employee‘s emotional attachment to,
identification with and involvement in the
organization‖.
―An awareness of the costs associated with leaving
the organization‖.
―A feeling of obligation to continue employment.‖
5 Mayer and
Schoorman(1992)
Value
Continuance
―A believe in and acceptance of organizational
goals and values and a willingness to exert
considerable effort on behalf of the organization‖
―The desire to remain a member of the
organization‖.
6 Jaros et al.(1993)
Affective
Continuance
Moral
―The degree to which an individual experiences a
sense of being locked in place because of the high
costs of leaving‖.
―The degree to which an individual is
psychologically attached to an employing
organization through internalization of its goals,
values and missions‖.
50
Mowday et al. (1979) pointed out that most researchers defined employee
commitment in terms of either a behavioural perspective or an attitudinal perspective.
Alpander (1990) distinguished between the attitudinal and behavioural approaches to
commitment and described how commitment has been viewed differently from the
two perspectives. The former, Alpander (1990) argued, views commitment as an
internal state, but the latter view it as ―the state of being bound to the organization by
personal investment‖ (p.53). Mowday et al. (1982) proposed that a cyclical
relationship exists between the two types in which commitment attitudes lead to
committing behaviours which, in turn, reinforce commitment attitudes. An important
observation is that, throughout the literature, commitment has been viewed as a more
active and positive attitude toward the organization from both perspectives (Johnston
et al., 1990). This study focused on employee commitment as an attitude.
One of the aims of this study is to determine how employee‘s perceptions and
expectations of Leadership Styles followed by their Heads influence their
commitment, and the meaning of the concept will therefore be explained with
reference to Meyer and Allen‘s one of the three component‘s conceptualisation of
organisational commitment. The importance of employee commitment, the factors
affecting it and how organisations should build employee commitment will also be
discussed.
Organisational commitment researchers can be divided into two major camps, those
who view organizational commitment as an attitude and those who view it as
behaviour (Meyer & Allen 1991; Jaros et al., 1993). Meyer and Allen (1991) regard
attitudinal commitment as the way people feel and think about their organisations,
while behavioural commitment reflects the way individuals have become locked into
the organisation. The attitudinal approach regards commitment as an employee
51
attitude that reflects the nature and quality of the linkage between an employee and an
organisation (Meyer and Allen, 1991).
2.10 Conceptualization of Commitment
O‘Reilly and Chatman (1986) developed their multi-dimensional framework on the
basis of the assumption that commitment represents an attitude towards the
organization. According to these authors, commitment takes on three distinct forms,
which they labelled compliance, identification and internalisation.
Compliance occurs when attitudes and corresponding behaviours were adopted in
order to gain specific rewards .Identification occurs when an individual accepts
influence to establish or maintain a satisfying relationship. Finally internalization
occurs when influence is accepted because the attitudes and behaviours one is being
encouraged to adopt are congruent with existing values. Employees thus become
committed to organizations with which they share values. Figure 4 provides a
schematic representation of a general model of workplace commitment.
P.T.O

52
GENERAL MODEL OF WORKPLACE COMMITTMENT.
EMPLOYEE BEHAVIOUR
Figure 4. Source: Adapted from Meyer & Herscovitch (2001: 320)
In conclusion, employee commitment is defined as an individual‘s identification with
and involvement in a particular organization. It is characterized by a strong belief in
and acceptance of the organization‘s goals and values, a willingness to exert
considerable effort on its behalf, and a strong desire to maintain membership of it.
2.11 Dimensions of Employee Commitment
Among the proponents of attitudinal approach, researchers have started to view
employee commitment as a multi dimensional concept that has different factors
associated with it, outcomes and implications for human resources management
(Meyer and Allen, 1997). Meyer and his colleagues (Allen and Meyer, 1990; Meyer
COMMITMENT
Affective(Desire) -Bases (identity
relevance,shared values,personal
involvment)
Continuance(cost) -Bases(Investment ,lack
of alternatives)
Normative(Obligation) - Bases(Internalizations of orms,psychological contract,benefits and
reciprocity norms)
53
and Allen, 1991; Meyer and Allen 1997; Meyer and Herscovitch, 2001) have been at
the forefront of the multi-dimensional approach. Their three component model of
organisational commitment incorporates affective, continuance, and normative as the
three dimensions of organisational commitment.
2.11.1 Affective Commitment
Allen and Meyer (1990) refer to affective commitment as the employee‘s emotional
attachment to, identification with, and involvement in the organisation. Affective
commitment involves three aspects: (1) the formation of an emotional attachment to
an organization, (2) identification with, (3) and the desire to maintain organisational
membership. Allen and Meyer (1990) argue that an individual will develop emotional
attachment when he/she identifies with the goals of the organisation and is willing to
assist the organisation in achieving these goals. They further explain that
identification with an organisation happens when the employees own values are
congruent with the organisational values and the employee is able to internalise the
values and goals of the organisation. With this, there is a psychological identification
with and a pride of association with the organisation.
Jaros et al. (1993) suggest that affective commitment is the most widely discussed
form of psychological attachment to an employing organisation. This could probably
be because affective commitment is associated with desirable organisational outcome.
Meyer and Herscovitch (2001) report that affective commitment has been found to
correlate with a wide range of outcomes such as turnover, absenteeism, job
performance and organisational citizenship behaviour.
54
2.11.2 Continuance Commitment
The next dimension of employee commitment is continuance commitment (Allen and
Meyer, 1990) which is based on Becker‘s (1960) side bet theory. The theory speaks of
that as an individual remains in the employment of an organisation for longer periods;
they accumulate an investment, which becomes costly to lose the longer the
individual is attached to the organisation. These investments includes time, job,
efforts, organisational specific skills that might not be transferable or greater cost of
leaving the organisation that discourage them from seeking alternative employment,
work friendships and political deals.
Allen and Meyer (1990) describe continuance commitment as a form of psychological
attachment to an employing organisation that reflects the employee‘s perception of
the loss he/she would suffer if they were to leave the organisation. They explain that
continuance commitment involves awareness on the employee‘s part of the costs
associated with leaving the organisation. This then forms the employee‘s primary link
to the organisation and his/her decision to remain with the organisation is an effort to
retain the benefits accrued.
Romzek (1990) describes this type of attachment as a transactional attachment. He
argues that employees calculate their investment in the organisation based on what
they have put into the organisation and what they stand to gain if they remain with the
organisation. For example, an individual might choose not to change employers
because of the time and money tied up in an organisation‘s retirement plan. Such an
employee would feel that he/she stands to lose too much if he/she were to leave the
organisation.
55
In addition to the fear of losing investments, individuals develop continuance
commitment because of a perceived lack of alternatives. Allen and Meyer (1990) and
Meyer and Allen (1991) argue that such an individual‘s commitment to the
organisation would be based on his/her perceptions of employment options outside
the organisation. This occurs when an employee starts to believe that his/her skills are
not marketable or that he does not have the skill required to complete for the positions
in the field. Such an employee would feel tied to the organisation. People who work
in environments where the skills and training they get are very industry specific can
possibly develop such commitment. As a result, the employee feels compelled to
commit to the organisation because of the monetary, social, psychological and other
costs associated with leaving the organisation. Unlike affective commitment which
involves emotional attachment, continuance commitment reflects a calculation of the
costs of leaving versus the benefits of staying.
2.11.3 Normative Commitment
The third dimension of employee‘s commitment in an organization is normative
commitment, which reflects a feeling of obligation to continue employment.
Employees with a high level of Normative Commitment feel they ought to remain
with the organisation (Allen and Meyer, 1990). Researchers have overlooked this
view of employee commitment as relatively few studies explicitly address normative
commitment. Randall and Cote (1990) Allen and Meyer (1990) and O‘Reilly,
Chatman, Caldwell (1991) are some of the few who have attempted to differentiate
normative commitment from the other commitments of the employee‘s organisational
commitment.

56
(Randall and Cote) regard normative commitment in terms of the moral obligation the
employee develops after the organisation has invested in him/her. They argue that
when an employee starts to feel that the organisation has spent either too much time
or money developing and training him/her, such an employee might feel an obligation
to stay with the organisation. For example, an employee whose organisation paid his
tuition while he/she is improving qualifications might believe that he or she can
reimburse the organisation by continuing to work for it. In general normative
commitment is most likely when individuals find it difficult to reciprocate the
organisation‘s investment in them.
2.12 Antecedents of employee commitments
The concept of employee commitment has been conceptualized and measured in
different ways by many researchers. Many researchers on the topic of employee
commitment have used many different variables as possible antecedents of
commitment and have assigned these variables to categories (Mowday et al., 1982).
Steers (1977) proposed a dichotomy that he believed explains antecedents and
outcomes of organisational commitment. The argument associated with antecedents
was built heavily on previous research. Steer‘s view was that the antecedents of
commitment were the three categories of personal characteristics, role-related
characteristics, and work experiences. Mowday et al. (1982), in their review of
empirical studies conducted on the topic of organisational commitment, found that
most of the studies of this nature were correlation. Mowday et al., extended the model
proposed by Steers (1977) and came up with another model. As shown in the given
figure 5 below, the new model included four categories of antecedents of
organisational commitment: personal characteristics, role-related characteristics,
structural characteristics, and work experiences.
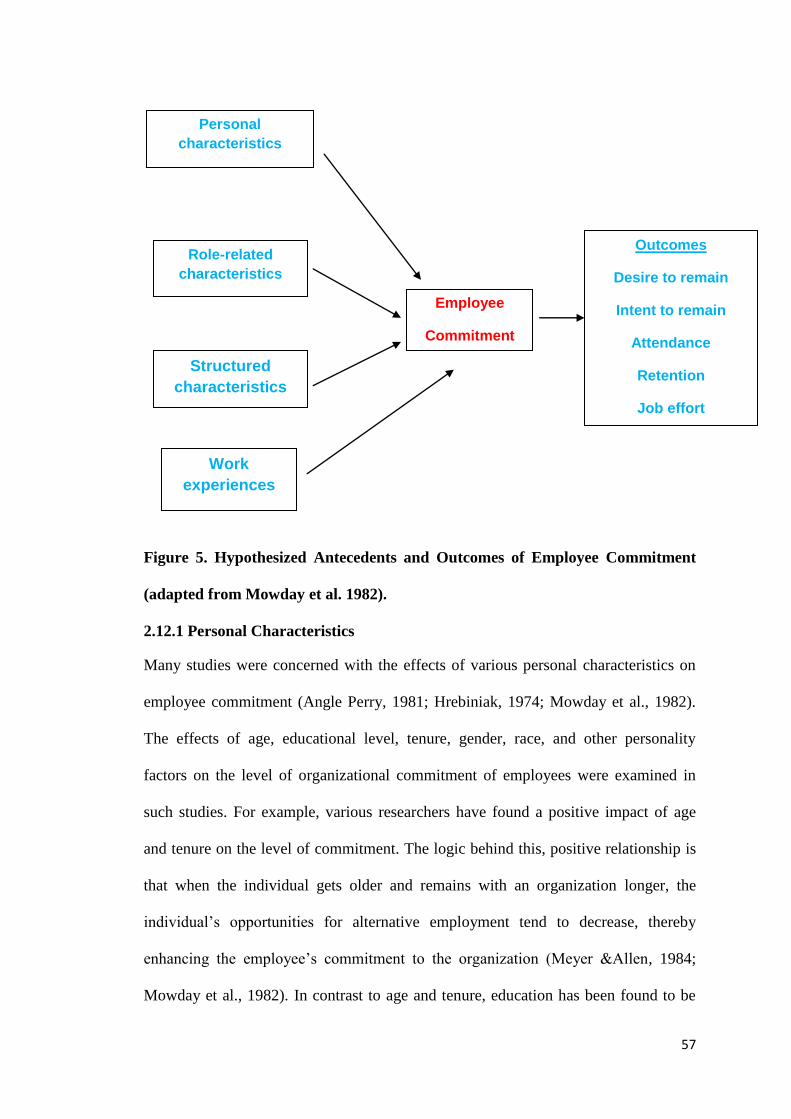
57
Figure 5. Hypothesized Antecedents and Outcomes of Employee Commitment
(adapted from Mowday et al. 1982).
2.12.1 Personal Characteristics
Many studies were concerned with the effects of various personal characteristics on
employee commitment (Angle Perry, 1981; Hrebiniak, 1974; Mowday et al., 1982).
The effects of age, educational level, tenure, gender, race, and other personality
factors on the level of organizational commitment of employees were examined in
such studies. For example, various researchers have found a positive impact of age
and tenure on the level of commitment. The logic behind this, positive relationship is
that when the individual gets older and remains with an organization longer, the
individual‘s opportunities for alternative employment tend to decrease, thereby
enhancing the employee‘s commitment to the organization (Meyer &Allen, 1984;
Mowday et al., 1982). In contrast to age and tenure, education has been found to be
Personal
characteristics
Role-related
characteristics
Structured
characteristics
Work
experiences
Outcomes
Desire to remain
Intent to remain
Attendance
Retention
Job effort
Employee
Commitment
58
inversely related to commitment (Mathieu & Zajac, 1990; Mowday et al., 1982;
Steers, 1977). It can be assumed that employees with higher levels of education may
have higher expectations which makes it difficult for an organization to meet such
expectations and results in less committed employees (Steers,1977). Marital status
and gender also have effects upon organizational commitment of employees.
Kawakubo (1987) and Lincoln & Kalleberg (1990) argued that marital status was
found to be a significant factor in employee commitment. According to Kawakubo, it
was found that married and separated persons were committed to organizations more
than were single persons. The logic behind that could be that married and separated
persons have more responsibilities than single persons (Lincoln &Kalleberg,
1990).With respect to gender, Angle and Perry (1981) and Mathieu and Zajac (1990)
found that females were more strongly committed to their organizations than were
males.
2.12.2 Role Related Characteristics
Mowday et al. (1982) were concerned with the relationship between job
characteristics and commitment: job scope or challenge, role conflict, and role
ambiguity. They indicated that increased job scope would lead to an increase in
commitment. Regarding role conflict and role ambiguity, Mowday et al. reported that
where there is role ambiguity and role conflict, and role ambiguity. They indicated
that increased job scope would lead to an increase in commitment. Regarding role
conflict and role ambiguity, Mowday et al. Reported that where there is role
ambiguity and role conflict, employee commitment tended to decrease. Austin and
Gammon (1983) reviewed the literature on the work experiences of academic
administrators and the link to employee commitment. They found that compensation
is critical to commitment. They stated that, ―If administrators feel that they are not
59
valued for their contributions and are not rewarded to at least some reasonable degree,
their commitment may be threatened‖ (p.61). Occupational status has also been
identified as a significant factor in occupational commitment. Wiener and Vardi
(1980) found that employees who occupy managerial positions tend to be more
committed to their organizations than those who do not occupy managerial positions.
They contended that this is due to the difference in prestige and pay among the two
groups.
2.12.3 Structural Characteristics
Within the body of literature on organizational commitment of employees, researchers
have investigated the influence of structural characteristics on commitment. Stevens
et al. (1978) found that organization size, span of control, union, presence, and
centralization of authority were not related to commitment. Later, Morris and Steers
(1980) conducted a study to determine what effects of structural characteristics such
as formalization, functional dependence, supervisory span of control, span of
subordination, decentralization, and work group size had on commitment. They found
commitment to be positively related to employee participation, decentralization,
functional dependence, and formalization. When individuals participate at every level
in the organization, their ego involvement is enhanced which eventually leads to
increased commitment. Employees who experience greater decentralization, greater
dependence on the work of others, and greater formality of written rules and
procedures were reported to be more committed to their organizations than employees
experiencing these factors to a lesser degree (Mowday et al., 1982).

60
2.12.4 Work Experiences
Work experience is viewed as a major socializing force and important antecedent of
commitment. This category of antecedents related to employee commitment
represents the nature and quality of an employee‘s work experiences that occur during
his or her tenure with the organization (Steers, 1977). In the literature, several work
experiences variables were found to be related to employee commitment (Mowday et
al., 1982). For example, organizational dependability which has been defined as ―the
extent to which employees felt the organization could be counted upon to look after
employees‘ interest‖ (p.34) was found to have a significant and positive effect on
organizational commitment of employees (Steers, 1977). In addition, research by
Buchanan (1974) found that when employees feel that their co-workers maintain
positive attitudes toward the organization, their organizational commitment increases.
2.13 Employee Commitment within Academic Institution
Many studies were conducted to determine the organisational commitment of both
educators and administrator in academic institutions and both of them shows
organisational commitment. In a survey of general and special academicians,
Billingsley and Cross (1992) determined the predictors of teacher‘s commitment.
Their cross- validated regression results suggested that work-related variables such as
leadership support, role conflict, role ambiguity, and stress are the best predictors of
commitment of academicians. They concluded that increasing administrative support
and principal‘s behaviour such as feedback , encouragement , acknowledgement , use
of participative decision making and collaborative problem solving are important in
building a committed and satisfied teaching staff.

61
(Chiefo,1991;Billingsley & Cross 1992; Richards ,Arkyod ,& O‘Brien,1993; Raju and
Srivastava, 1994; Thornhill et al.,1996; Borchers and Teahen ,2001;Richards,O‘ Brien
& Arkyod, 2000;Wolverton ,Montez,Guillory and Gmelch,2001).Chieffo (1991)
found that mid-level administrators in higher education are fairly committed to their
organizations largely because they are proud of what they are doing and the
autonomy of their work. Her results also showed a significant correlation between
leadership behaviours (.60 to .70, p < .0001) such as, vision, influence orientation,
people orientation, motivational orientation and values orientation, and organizational
commitment. She also positively linked factors such as participation in decision
making meetings and the organizational structure with higher levels of employee
commitment.
In a study of the factors related to the employee commitment of college and
University auditors, Colbert and kwon (2000), found that organizational
characteristics such as organizational dependability (R2 = 1.75, p< .01), and
instrumental communication (R2
= 2.09, p <. 01) were significantly related to
employee commitment. They also found a significant positive relationship between
organizational commitment and organizational tenure (R2 = 2.06, p< .05), and skill
variety (R2 = 1.51, p< .01).
Wolverton et al., (2001) found that organizational commitment of Deans seemed to
increase with Age (t=2.46, p < .05), number of years in the position (t = 3.00, p < .05),
and the level of overall job satisfaction (t=2.69, p < .05). They also found that if
Deans believed they worked for Universities that exhibited high academic quality (t =
2.88, p < .01) and good environment quality (t = 4.19, p < .01) they tended to be more
committed to the organization. In addition, they found that deans who were inside
62
hires also seemed more committed to their Universities than those who were brought
in from outside.
Celep (1992) tried to determine the level of organisational commitment of teachers
with regard to the commitment to the school, to teaching work, to work group and to
the teaching profession. Teacher‘s commitment to the school was tested with such
factors as exerting efforts on behalf of the school, among others. His results indicated
a direct relationship between the teacher‘s organisational commitment and having
proper pride to belong to the school (t=7.13,p<.01 ) and work group (t= 13.25, p <
.05).
The interest in the commitment of educators has extended to the study of
organizational commitment of part-time faculty. In a study of 479 full-time and part
time academics at two mid-western universities, Borchers and Teahen (2001) found
that the level of organizational commitment does not vary significantly between
faculty members who are part-time on ground, part- time on-line, full-time on –
ground and full-time on line. These findings indicate that despite employment status
educators are equally committed to their organization.
Thornhill et al. (1996) have showed that communication with employees is
significantly related to the organisational commitment of higher education
institutions. They found that communication in terms of information flow down the
organisation, information flow up the organisation and leadership or management
style were important in the context of Higher Education of the employees, who
believed that management made a positive effort to keep staff well informed, 68%
indicated that they felt part of the institution, 88% reported that it was a good place to
work and 85% reported that their organisation had a great future.
63
In a study to explore the ability of extrinsic and intrinsic work related rewards to
predict the employee commitment to health occupations educators, Richards et al.,
(1993) found that two intrinsic and one extrinsic work related rewards significantly
predicted organizational commitment. Significance involvement and general working
conditions were significant at the 0.1 level with standardized beta weights of .2411,
.2135, and .1591, respectively. Similar results were found by Richards et al (2002)
when they predicted the organizational commitment of marketing education teachers.
They found that six of the eight work related rewards entered the stepwise Multiple
Regression. The variables that were significant at the .01 level were supervision
(.2188), significance (.2158), involvement (.2137), promotion (.1592), and co-workers
(.1258)
From this analysis of studies of organisational commitment within academic
institutions, it can be seen that the development of commitment is dependent on
several personal and organisational factors such as Leadership, management policies
and practices.
The idea that organizational commitment is important for the realization of
organizational goals and professional goals of educational institutions has remained
un-tapped by researchers. Organizational Commitment research can possibly provide
practical results for academic institutions by providing insights into the commitment
profiles of their professional employees. From the employing organization‘s stand
point, it is useful to identify which factors motivate academic‘s desire to remain with
the organization.
64
2.14 Literature Review on Education Sector with Emphasis over B-Schools.
The present education system in India mainly comprises of primary education,
secondary education, senior secondary education and higher education. Elementary
education consists of eight years of education. Each of secondary and senior
secondary education consists of two years of education. Higher education in India
starts after passing the higher secondary education or the 12th standard.
India has a long history of higher education. The early Gurukul system of education
flourished in the Vedic and Upnishadic periods in India, and a huge university was set
up at Takshashila in the sixth century BC which was situated at the place now called
Taxila, in Pakistan. Two other universities, namely Nalanda and Vikramshila, were
established in the fourth and fifth centuries AD, respectively (Dogra and Gulati,
2006). The modern higher education system was established in the mid-1850s when
the first three universities were set up in 1857 under British rule. The thrust of
development then was mainly on a liberal arts education. The rate of development
was slow, as in a period of 90 years only 18 universities were established in India.
Most of these followed the model of the three original universities at Bombay,
Calcutta and Madras. When India became independent of Britain in 1947, it had 20
universities and 500 colleges located in different parts of the country. The present
higher education system is the second largest in the world and is perhaps the most
complex in terms of the geographical area covered and the profile of students and
teachers, in terms of their linguistic, social, cultural and economic background. The
number of state and central universities rose from 133 (at the end of the Ninth Five
Year Plan from 1997-2002), to 206 in March 2005, to 339 during the Tenth Five Year
Plan (up to December 2006), and in 2007 it reached 378. Thus, between 1950
and2007, universities in the country increased from 20 to 378, colleges from 500 to18,

65
064 and teachers from 15,000 to 480,000. The number of students enrolled in higher
education too has increased from 100,000 in 1950, to over 11.2 million in
2005(Thorat, 2007). By 2008, India has 413 universities – 251 of which are state
universities, 24 central universities, 100 ―deemed‖ universities (i.e. they do not offer
degrees themselves, but are affiliated to larger universities for awarding degrees), five
are institutions established under State Legislation and there are 33 institutes of
national importance established by Act of Parliament. In addition, there are now20,
677 colleges including 2,166 that are women-only colleges. At the beginning of the
academic year 2007-2008, the total number of students enrolled in the universities and
colleges in India was 116.13 lakhs (11.6 million), of which about 40 per cent were
women. This has, in turn, enhanced access to higher education, as the enrolment ratio
has increased from less than 1 per cent in 1950 to about 10 per cent in 2008. These
developments notwithstanding, the gross enrolment ratio (GER) in relative terms
compares quite poorly with 60 per cent in the USA and Canada, to over 40 per cent in
several European countries and more than 20 per cent in many developed and
developing countries. The Planning Commission, (Government of India) is also
targeting a GER from10 per cent in 2006 to 15 per cent by 2015 (Government of India
Planning Commission, 2006). Such a substantial increase in enrolment would require
a multi-pronged strategy. In order to ensure that the facilities for higher education are
available in enough quantity for all who aspire to it, the federal government decided
to establish more universities in the Eleventh Five Year Plan (2007-2012). Some
announcements have already been made in this regard. These include the
establishment of 30 new central universities and a new Indian Institute of Technology
and Indian Institute of Management. Besides, capacity increase will also have to be
attempted by strengthening and increasing the intake capacity of existing colleges and
66
the universities through an increase in places on existing courses as well as by
introducing new courses. The Government of India has set up the National
Knowledge Commission (NKC) to seek ideas on how it can modernise and expand its
educational institutions and make them worthy of world-class status. According to its
website (http://knowledge commission.gov.in/), the NKC is: A high-level advisory
body to the Prime Minister of India, with the objective of transforming India into a
knowledge society. It covers sectors ranging from education to e- governance in the
five focus areas of the knowledge paradigm:
Access – easy access to knowledge.
Concepts – all levels and forms of education.
Creation – effective creation of knowledge.
Applications of knowledge systems.
Services like e-governance.
The NKC has suggested the setting up of 1,500 universities by 2015. The Chairman of
NKC (Mr Sam Pitroda) has also suggested setting up an Indian Institute of Library
and Information Science to boost the research and development of library systems in
India. (http://knowledgecommission.gov.in/downloads/recommendations/Libraries
LetterPM.pdf).
2.14.1 UGC-Infonet Digital Library Consortium:
Background:
The UGC-Infonet Digital Library Consortium was initiated in 2004. The UGC funds
all state, ―deemed‖ and central universities excluding those covering engineering,
medicine and agriculture which are funded by other agencies. Unlike many other
Consortia, members‘ libraries access scholarly journals without paying the
subscription from their library budget. The entire subscription cost is paid to the

67
publisher by INFLIBNET as agreed in a deal finalised by the National Steering
Committee (NSC). In essence, the funding for this consortium is top-sliced from UGC
funds and offers high quality publishers/aggregators to the academic community,
comprising faculty, staff, researchers and students. In terms of the number of users, it
is the largest consortium in India and by 2007, 179 universities, as well as several
thousand colleges affiliated to these universities, qualified for gaining access to the e-
resources. About 100 universities are currently (mid-2008) members of the
consortium. The consortiums a trend-setter in a thoughtfully adopted e-only model
without any links to the current print holdings by its member universities. There is no
formal membership structure of the consortium. All academic institutions that come
under the purview of the UGC are members of this consortium. Keeping in view the
large number of universities, it is planned to implement the new system in various
phases as described later. The consortium can take credit for investing significant time
in the evaluation of resources for selection and obtaining the best pricing terms and
models from the publishers. Before extending the access, INFLIBNET is ensuring
network connectivity to these institutions in another major project called UGC-
Infonet.
The entire programme is carried out with a systematic approach. The universities and
resources were classified under three different categories. In the first phase (2004), 50
of the larger universities were given access to scholarly journals from 16 major
publishers, subsequently in 2005 another 50 universities were included and
subscriptions to more resources were taken out. In the third phase, there are 70 more
universities. (Prem Chand and Jagdish Arora, 2008).
68
2.14.2 Institutional Development:
The quality of education and innovation in the system depends primarily on the
institution. (Ishwar Dayal, 2002) The needed areas of development are discussed at
three levels:
The University System
The Support Systems at Macro Level (The Academic Content, Faculty
Development, The Monitoring System, Support for Research, National Testing
Service) needs to be supported by Government/AICTE/UGC.
Development Approaches at Institutional Level
Institutional development as discussed by Ishwar Dayal rests on two distinct but
related areas which are as follows:
• The administrative arrangements and the institutional leadership; and
• The approaches to institutional development.
In his article “Towards an Educated India: Innovations in education”, in the
Free Press Journal, Dr. R. Gopal expressed that to make the B-School pass outs
of India employable, the teaching methodologies adapted by the B-School
faculties should be innovative in nature to make them industry – fit. Dr. Gopal
stated that, ‗Specific innovations in the areas of teaching pedagogy will be of
great use. Some of these areas could be conduct of one week 'appreciation'
programme at the beginning of the session, involving the students in creating
posters specific to social needs for instance, anti ragging poster competition,
debates, etc, reverse teaching, guest lectures, case studies, live projects, industrial
visits - national and international, use of select films to stimulate the mind for
discussions, organising socially involved projects like blood donation camps,
celebrating festivals with members of an old age homes, children's homes etc,
69
strengthening the hands of mahila groups and self-help groups, etc., Guest
lectures given to students by industry experts could be another way to let them
know the ways of corporate world and culture, involving senior leaders from
industries in the governing council of institution, live-projects in conjunction
with industry personnel etc., can aim to raise the educational bar and make the
students employable.
2.14.3 Knowledge Management in Higher Education Institutions:
Knowledge management (KM) is an essential consideration in higher educational
institutions (HEIs) to ensure that knowledge flows efficiently between the people and
processes. The practical implications of KM initiatives in HEIs include the
enhancement in the overall effectiveness and efficiency. A KM system should be
integrated into the institution‘s processes and work environment. Significant work has
been done in the area of KM in higher educational system and many new
requirements have been proposed by different people in this field.
Kidwell, et al.(2000, pp. 28-33) discussed why KM is vital to higher education
systems and how an institution wide approach to KM can lead to exponential
improvements in knowledge sharing – both explicit and tacit and the subsequent surge
benefits. The work deals with the benefits of various knowledge management
applications on educational institution processes such as research, curriculum
development, student and alumni services, administrative services and strategic
planning.
Ranjan and Khalil (2007,pp. 15-25) have argued that in order to build and develop a
robust and thriving knowledge environment the institutes need to look beyond
technology and develop the overall culture of accessing, collaborating and managing
knowledge.
70
Yeh (2005,pp.35-42) presented the KM multi-modelling framework to propose four
organizational strategies for higher education – culture, leadership, technology and
measurement and three academic KM strategies – individual, institutional and
network.
Nagad and Amin (2006, pp.60-65) concluded that effective KM may require
significant change in culture and value, organizational structures and reward systems.
In order to apply KM, knowledge and expertise must be readily accessible,
understandable and retrievable.
Sedziuviene, Vveinhardt, J.(2009, pp. 79-90) concluded that to create a KM system
in higher educational institutions it is necessary to point out the valuable knowledge,
to create a methodology for receiving, transforming and consolidating knowledge, to
activate and optimize the process of knowledge formation, transmission and
evaluation, to perform spread of knowledge among the staff and students, to
constantly perform knowledge monitoring and make decisions accordingly and to
generate new knowledge and new technologies for knowledge transmission.
Rowley (2000, pp. 325-333) in the study on KM in higher education said that KM
challenges lie in the creation of a knowledge environment and the recognition of
knowledge as intellectual capital. Effective KM in higher education requires
significant change in the culture and values, organizational structures and reward
systems.
HEIs in India are facing the pressures for enhanced performance for the reasons
argued by Ashish and Arun (2006) and others –
1 Increasing competition among higher educational institutions
2 Growing awareness about alternate opportunities and value for money among
the students and parents
71
3 Accountability to stakeholders and the accreditation and affiliating bodies
4 Increasing industry demands as employers for recruitments of graduates and
Post graduates
5. Industry expectations for industry-institution partnerships.
In view of the pressures from the stakeholders and the present scenario in HEIs it
becomes pertinent to look for solutions which will make an impact on the existing
systems. A blend of KM and IT techniques can offer an appropriate tool to meet this
challenge (Kumar and Kumar, 2005).
Large number of organizations have implemented KM principles and methods in their
routine activities for enhanced collaborating of knowledge on inter and intra
organizational platforms. However HEIs have not taken much interest in introducing
KM approaches even though from the academic learning point of view KM by its
nature is essential for HEIs (Ranjan and Khalil, 2007). Today HEIs behave like
educational markets. They have to adjust themselves and develop strategies to
respond rapidly to the increasing demands of stakeholders and market pressures.
A KM approach in HEIs is a conscious integration of all human resources and
academic and administrative processes for the acquisition, structuring and sharing of
institutional knowledge. Emphasis is required on sharing of knowledge at the
institutional level and not the individual level (Ranjan and Khalil, 2007)
Higher educational institutions create knowledge during their academic and
administrative processes. Knowledge is created at various levels in different forms
and is required at each level in a different form. The processes of teaching,
examination, evaluation, admissions, counselling, training and placement and research
and consultancy result in numerous beneficial experiences and studies which may be
72
defined as knowledge in the context of higher educational institutions (Ranjan and
Khalil, 2007).
Knowledge Acquisition – It is the mechanism through which knowledge is gathered
and stored from the members of the institution and other resources (Schwartz, et al.,
2000). According to Tiwana (2000), knowledge acquisition is the development and
creation of insights, skills and relationships supported by information technology.
Knowledge acquisition consists of codifying explicit knowledge, modulating tacit
knowledge to explicit knowledge and codifying the explicit knowledge and acquiring
tacit knowledge in the form of explicit Meta knowledge i.e. knowledge about
knowledge. The explicit Meta knowledge about tacit knowledge contains information
about ―who knows what‖ and about how to contact the experts. The purpose of
codification is to make it easy to organize, locate, share, store and use knowledge
(Davenport and Prusak, 1998).
Knowledge may be created and acquired, but if not organized and structured, the
organization will not be able to take action on that knowledge or actualize all of its
potential value (O‘Leary, n.d.). This will result into limited use of the institutional
knowledge and its impact on the institution. Knowledge has to be structured into a
form which can be used directly in the institutional processes and functions to ―fit‖
into the institution‘s way of doing things.
Institutions need to put the knowledge into specific forms viz. documents, databases,
pictures, graphs, rules, case based reasoning (CBR) and frequently asked questions
(FAQs). It includes organizing, indexing and formatting the acquired knowledge
(Schwartz, et al., 2000) for reuse and leverages it in other ways and makes it broadly
available in the institution.
73
The knowledge is transformed into appropriate form as used and sought for by the
stakeholders and stored in knowledge bases called knowledge repositories. A
knowledge repository is a structured collection of the knowledge generated in an
organization. The value of organizational knowledge increases when it is available in
storage repositories for present and future use (Jasimuddin, 2005). The knowledge
repository ensures the availability of related knowledge quickly and efficiently at the
same place. According to Natali and Falbo (n.d.), the primary requirement of the
knowledge repository is to prevent the loss of knowledge and enhance accessibility to
organizational knowledge in the form of a centralized well structured resource.
Knowledge Dissemination – The stored knowledge, if not transferred for further use
within the organization, leads to wastage of organizational resources (Jasimuddin,
2005). According to Schwartz, et al. (2000), knowledge dissemination constitutes
retrieval of the relevant knowledge for use at the right time. It supports the flow of
knowledge in the institution. Knowledge dissemination can be pull based or push
based as either the user can search for the required knowledge or the knowledge
management system can offer knowledge that seems relevant for the user‘s task
(Abecker, et al., 1998). Proactive knowledge dissemination becomes particularly
important when users are not motivated to look for information, are too busy or
unaware that relevant knowledge exists or are ignorant of the need for information in
the first place (Natali and Falbo, n.d.).
The practical implications of IT based KM initiatives in HEIs imply that the
framework should be useful to the institutions in many ways namely –
Enhanced ability to develop strategic plans
Enhanced quality of programs and processes by identifying and leveraging best
practices
74
Enhanced ability to monitor and sustain ongoing change (Petrides, 2004)
Enhanced faculty development efforts
Improved teaching learning processes
Improved effectiveness and efficiency of administrative services
Improved sharing of internal and external information to minimize redundant
efforts
Reduced effort and turnaround time for actions
Reduced operational costs
To gain user acceptance, a knowledge management system must be integrated into the
organization‘s process, allowing collecting and storing relevant knowledge as it is
generated in the processes and functions of the organization (Natali and Falbo, n.d.).
Consequently it should also be integrated to the existing work environment (Abecker,
et al., 1998).
2.14.4 Data Envelopment Analysis in Higher Education:
Management studies originally established in the USA were adopted in Europe in
the1960s. Since then it has gathered a global acceptability. Large numbers of
management schools are operating around the globe and they encounter a strong
competition for students. Management is an area where the individuals are developed
within the area of management. The aim of MBA programme is to prepare their
graduates for managerial roles, help them to acquire a better understanding of the
industrial and business world and enriching them with relevant skills and
competencies for their careers. In other words it is generally agreed that management
education adds value to a student. However, in management education what kinds of
values are added has not been resolved in a widely accepted manner.
75
In his article „ Towards an Educated India: Academia – Industry Partnership”,
(2010) in the Free Press Journal , Dr. R.Gopal expressed that extremely dynamic
business world, and the rapidly developing knowledge based services economy
have put in an increased demand for professionals to merge the business
effectively. This is precisely the reason why amongst the various fields of
knowledge, the desire for acquiring management qualifications is growing
rapidly both amongst the fresh graduates and working executives. It is in this
context that the proposal corporate- academic tie up becomes crucial.
Boyatzis and Renio (1989) indicate some positive attributes gained from MBA
studies. Espey and Batchelor (1987) report how the company gained from the students
carrying out projects and writing reports relating to the needs of the company, thus
making the graduates better managers. Yet despite all the rhetoric, few signs of
substantive change are evident in most of the B-schools. Fiekers et al. (2000)
discussed how to benchmark the postgraduate admission process in their paper. Wan
Endut et al. (2000) discussed the benchmarking process of higher educational
institute. Shaw and Green (2002) and Laugharne (2002) discussed the benchmarking
process of academic process and the PhD programme respectively.
Data envelopment analysis employs mathematical programming to obtain ex post
facto evaluation of the relative efficiency of management accomplishments, however
they may have been planned and evaluated (Banker et al., 1984). The aim of a central
unit is to allocate resources in such a way that the overall goals of the organization are
satisfied as well as possible, or specifically, the amount of the total outputs of the
units will be maximized (Korhonen and Syrjanen, 2004). DEA model is used to
evaluate the relative efficiency of a group or units of decision-making units (DMUs)
in their use of multiple inputs to produce multiple outputs where the form of
76
production is neither known nor specified as in the case of parametric approach
(Shammari and Salimi, 1998). As a consequence, the DEA efficiency score for a
specific decision making unit (DMU) is not defined by an absolute standard, but it is
defined relative to the other DMUs in the specific data set under consideration. Farrell
(1957) is known as the pioneer to develop DEA to solve the problem, which requires
careful measurement but also has a limitation of combining the measurements of
multiple units to measure the overall performance. Later on Charnes et al. (1978)
generalized Farnell‘s framework and popularised the concept. Berger et al. (1997) and
Seiford (1996) confirmed of DEA application in previous research and other DEA
works that contain more than 1,000 DEA contributors in the past two decades
(Sueyoshi, 1999). The two most frequently applied models used in DEA are the CCR
model – after Charnes et al. (1978) and the BCC model – after Banker et al. (1984).
The basic difference between these two models is the returns to scale (RTS). While
the latter takes into account the effect of variable returns- to- scale (VRS), the former
restricts DMUs to operate with constant returns- to- scale (CRS). Charnes et al.
(1978) developed DEA to evaluate the efficiency of public sector non-profit
organizations. DEA aims to measure how efficiently a DMU uses the resource
available to generate a set of outputs and DMUs can include manufacturing units,
departments of big organizations such as universities, schools, bank branches,
hospitals, power plants, police stations, tax offices, defence bases, a set of firms or
even practising individuals like medical practitioners etc.
In India, the existing monitoring organization All India Council for Technical
Education (AICTE) is responsible for evaluating the performance of the institutions
through the process of accreditation. The evaluation process is based on a set of
broad-based criteria and these criteria serves to assess the principal feature on the
77
institutional activities and programme effectiveness. Emphasis is given on entry
qualification, intake of the students, duration of the course, structure of the
programme, examination rules and regulations, infrastructure norms like computer
facilities, library, teaching aids, etc. However, these norms and rules do not help to
measure the performance of any institutions. Harris (1994) presented a generic
approach to higher education. Primarily, a customer oriented approach where the
service to students is promoted through training and development. Secondly, a staff
focus approach which tries to enhance the contribution of all the member of staff to
the effectiveness of the institute and finally focus on service agreement. This
definition reflects the unique characteristic of the education. An education process
involves input, output and several others factors. Education process is a multi
dimensional activity and only one indicator cannot assess it. Leaving the few top
institutions in India, rest of them can be categorised into private and government
owned B-schools. Since intake of these colleges is not of high quality and the
objective of the management is to make quick money by spending least. Therefore,
the focus on quality value addition becomes a necessary step. A performance measure
helps in monitoring strategic achievements and controlling the strategic movements of
the institutions as it is strongly related to objectives of the institutions. There are very
few papers available in the literature for measuring the performance of the
management institutions. Haksever and Muragishi (1998), Dreher et al. (1985),
Hamlen and Southwick (1989) studied the quality and value of management
education.
(Roma Mitra Debnath, 2009) attempts to measure the efficiency of 20 B-Schools
quantitatively and rank them. It has been argued in her paper that efficiency can be
measured by using the inputs and outputs which are intangible in nature. Although
78
some of the management schools are analysed in the paper, however the paper
focused on the measurement of the value in management education. Many institutes
are being able to charge a high fee for their management programme. However they
are not able to maintain their status and rank in the various rankings. The paper tried
to answer the question. The result draws to a clear and specific conclusion that an
efficient institute is able to use all its resources in an optimum way to produce the
maximum output.
2.14.5 Financing Higher Education in India:
It is unambiguous that Policy of the Government of India now encourages
augmentation of resources for covering a larger portion of cost of higher education.
Recent policy changes in India often favour to divert resources from higher to primary
level of education and favours for full cost recovery from students even in public
higher education institutions. Cost recovery measures comprising of increase in fees,
student loans currently operated by commercial banks and privatisation will
exacerbate inequality in the society. Indeed, there seems to be a nexus between the
present student loan scheme and full cost recovery. Increasing reliance on student
fees, student loans and privatisation without considering the low-income groups may
produce regressive effects in the society. Under the deep waves of globalisation and
competition, important economic rationale for government funding especially for
higher education is neglected. Public support for higher education remains essential to
ensure a balanced achievement of educational and social missions, apart from
surviving in the knowledge-based society. It is essential that funding sources must be
diversified but cost-sharing with students has social and political limits, and excessive
commercialization of higher education should be forbidden (P. Geetha Rani).
79
Dunn and Bradstreet one of the leading consulting houses had elicited
Dr.Gopal‟s views on the Indian Education (2011) especially w.r.t B - schools. He
expressed that the institutes should be freed from the concept of “fix the fees”
and the institutes should be allowed / encouraged to charge whatever fees they
want. In the long run, each B School would stabilize at its own level of fees – the
market will automatically regulate the fees for ever institute.
Knowledge is the driving force in the rapidly changing globalised economy and
society. Quantity and quality of highly specialized human resources determine their
competence in the global market. Emergence of knowledge as driving factor results in
both challenges and opportunities. It is now well recognised that the growth of the
global economy has increased opportunities for those countries with good levels of
education and vice versa (Carnoy, 1999; Tilak, 2001; Stewart, 1996; Ilon, 1994).
Though the higher education system and the pattern of financing higher education
vary a great deal across countries in terms of their size and strength and degree of
diversification of higher education institutions, yet they all face a severe financial
crisis in the public finances available for higher education. With macro economic
reforms resulting in severe cuts on the education budget on the one hand, hand, the
government directs the shift of resources from higher to primary accomplishing the
long cherished goal of universal elementary education on the other education. It can
be noticed from the approach paper to the Tenth Five-year Plan and Tenth plan
document that, ―Since budget resources are limited, and such resources as are
available, need to be allocated to expanding primary education, it is important to
recognise that the universities must make greater efforts to supplement resources from
the government‖ (Government of India, 2001, 2002-2007).
80
In a federal polity like India, education being concurrent subject since 1976, the
commitment of the centre equally at all levels of education is important. In secondary
education, centres‘ share of expenditure is minimal ranging around 5 per cent.
However, federal role in elementary education is on the rise since the middle of
1980s.Whereas for the Higher Education As a result of all these efforts and initiatives
by the federal government, the flow of plan transfers from central to states in
elementary education have improved since the late 1980s. It is to be realised that
while primary education is fundamental to the nation, higher education determines its
economic and technological progress in the globalised era, which are the necessary
and sufficient conditions for growth and development respectively. Even for very low
enrolment ratios in higher education in India, it is increasingly realised that public
budgets cannot adequately fund higher education, particularly when sectors of mass
education are starved of even bare needs. Hence, the resources from higher education
are being diverted to the development of primary education. But it is stressed that
while it is mandatory that the nation achieves universal elementary education and total
literacy, it cannot at the same time afford to relegate to a neglected position to achieve
global standards in higher education (UGC, 1993). The funds for higher education in
India come mainly from three different sources, viz. government, fee income from
students and other sources of income from philanthropy industry, sale of publications,
etc. Higher education has been largely a state funded activity with about three-
quarters of the total expenditure being borne by government. The relative shares of
non-government sources such as fees and voluntary contributions have been
declining. Only 7 per cent of the population in the age group 17 to 24 attended higher
educational institutions in India, as against 92 per cent of the eligible age-group
population attending higher educational institutions in USA, 52 per cent in UK and 45
81
per cent in Japan. Even for these very low enrolment ratios in India, it is being
increasingly realised that public budgets cannot adequately fund higher education,
particularly when sectors of mass education are starved of even bare needs. Hence, in
the recent decade, the need for experimentation with several alternatives such as
student fees, student loans, graduate tax and privatization is intensified. In the eighth
plan it financially self-supporting higher education has been advocated that
―expansion of higher education in an equitable and cost-effective manner, in the
process, making the higher education system financially self-supporting‖
(Government of India, 1992). The approach paper to the Ninth Five-year Plan says,
―Emphasis will be placed on consolidation and optimal utilisation of the existing
infrastructure through institutional networking and through open university system.
Grants-in-aid will be linked to performance criteria to improve quality and inject
accountability. Fees will be restructured on unit cost criteria and paying capacity of
the beneficiaries. Additional resources will be generated by involving industry and
commerce and through contribution from community‖ (Government of India, 1997,
pp.82).
Distinct signals from the government towards hike in fees and shift of resources from
higher to primary education can be noticed from the approach paper to the Tenth
Five-year Plan, ―Since budget resources are limited, and such resources as are
available, need to be allocated to expanding primary education, it is important to
recognise that the 7 universities must make greater efforts to supplement resources
from the government. University fees are unrealistically low and in many universities
have not been raised in decades. A substantial hike in university fees is essential
(emphasis added)‖ (Government of India, 2001, pp.37). The Tenth Five-year Plan
document as well notes that it is important to recognise that the universities must
82
make greater efforts to supplement resources apart from the government (Government
of India, 2002-2007, p.17).
Dunn and Bradstreet one of the leading consulting houses had elicited
Dr.Gopal‟s views on the Indian Education especially w.r.t B - Schools. He
expressed that there are a large number of opportunities for the Indian Business
School. The market for B Schools is quite large and is growing rapidly perhaps
at double digit rate. Consequently one can see a large amount of competition –
what with new B Schools proliferating at every nook and corner. This will
automatically spur the Indian B Schools to innovate – introduce new course and
new program, new methods of pedagogy, use of simulation techniques, increase
the institute industry interaction, research papers and so on. The key area of
success is the need for the Indian B Schools to transform themselves from a mere
teaching/ coaching class to a full fledged Business University/Business School.
(S.J.Dhopte, 2011)
It should be noted that higher education institutions play an important role in setting
the academic standard for primary and secondary education. They are responsible for
not only providing the specialised human capital in order to corner the gains from
globalisation, but also for research and development, training inside the country,
provide policy advise, etc. It is to be realized that ‗Higher Education is no longer a
luxury; it is essential to national, social and economic development‘ (UNESCO,
2000).
The adverse impact of economic reforms reflects upon various revenue
diversifications measures such as hike in student fees, student loan programmes
operated by commercial banks and privatisation. Various revenue-raising measures
take place in the form of:

83
A. raising tuition fee as a significant source of revenue for the support of instructional
cost
B. full cost recovery of other fees such as institutionally provided room and board
C. Sale
It needs to be noted that the maximum income that can be raised from fees is on an
average around 25 per cent of the total recurring expenditure in a span of ten years.
Further, it is important to notice that self-financing courses are short term in nature
and heavy reliance on them will have repercussions on the equity, balance and quality
of education system in the long run. This will also lead to lack of teachers and
researchers in pure and basic disciplines in the near future as it is being experienced in
United Kingdom. Increasing reliance on student fees, student loans and privatisation
without considering the low-income groups may produce regressive effects in the
society. Hence, an alternative student loan scheme specifically for the weaker sections
should be evolved. Such a programme must be flexible enough to suit their
requirements, which may involve government guaranteed loans, subsidised interest
rates, liberal terms of repayment, waivers for those students with less future incomes,
etc, in addition to a strong student support system. Effective financial management at
institutional level is mandatory. It is essential that funding sources must be diversified
but cost-sharing with students has social and political limits, and excessive
commercialization of higher education should be forbidden (P. Geetha Rani, National
Institute of Educational Planning and Administration).
Many research studies show that the benefits of higher education are largely
appropriated by the students belonging to the upper and middle income groups, and
those who belonged to the forward communities. Thus, the benefits of liberal
government grants/subsidies are largely cornered by the already rich sections of
84
society, whereas the tax receipts, particularly from the indirect taxes - the stable tax
resources of state – used to finance higher education expenses mainly fell on the
lower income groups. It can be safely stated that the higher education of privileged
sections of society is liberally financed out of the revenue extracted from the poor and
such a policy is bound to be perpetuating educational and income inequalities in the
society (Psacharopoulos, 1994; World Bank, 1994; Psacharopoulos, 1997; Mingat and
Tan, 1986; Jimenez, 1987, 1994; World Bank, 2000).
However, the debate of increasing grants/subsidies on one hand or rightsizing/ no
grants/subsidies to higher education on the other hand has been intensified recently
(Hinchiffe, 1993).
2.14.6 Cost of Education: Studies Related to India:
The cost of education has attracted researchers‘ attention at the very early stage.
These studies deal with the national education sector as well as that of the individual
states of the country. Day‘s study (1963) focuses mainly on the costs of education.
For this, he prepared a detailed list of items of expenditure on education and grouped
these into six categories: (i) direct expenditure; (ii) meals and tiffin; (iii) students‘
health service; (iv) training of teachers; (v) administration and inspections; and (vi)
transport services. During the pilot enquiry on the provision of public education, the
planning division of the Indian Statistical Institute collected some data on the cost of
education for the period 1963 in Madhya gram, an urbanized village in the district of
24 Parganas (West Bengal); ten km away from the Calcutta city. The study presented
data on the cost of secondary education, which was collected from five schools in the
area. It gives the detailed analysis of receipts and payments, income and expenditure,
etc. A consolidated list of assets has been prepared for estimating the depreciation.
The main purpose of the study was to estimate the cost of education of each unit of
85
product. Panchamukhi (1965) measures the public expenditure on education in India.
The study estimated the total cost of education for the period 1950-51 to 1959-60 and
concluded that total cost of education constituted 6.2 per cent of GNP in 1959-60. The
study also calculated the various components of private and institutional costs of
education, foregone earnings for males and females, village and town pupil
separately. The study estimated that foregone earnings constituted major proportion of
total factor cost of education. The total cost of education was found to stand between5
per cent and 6.5 per cent of national income in 1960-61 and not 2.5 per cent of
institutional cost alone. Pandit (1969) measures the unit cost of education and
efficiency of educational expenditure. The study divides the total cost of education
into three categories such as institutional cost, students‘ cost and opportunity cost.
Dutt (1969) tries to measure the recurring unit cost of education in Haryana on the
basis of sampled 28 colleges of which 24 colleges were private and four were
government owned. It found main factors affecting the unit cost of education: age of
the college; student enrolments; average pay of teacher; and ratio of non-teacher to
total teachers. Among all the four component of unit cost of education, salary
emerged as the main component. For measuring of all the four variables, regression
and correlation analysis were carried out. Regression analysis reveals separate results
both for the private and all colleges together. In the case of private colleges, only
enrolment and age of the college had a negative impact on unit cost, and average pay
of the teacher and ratio of non-teacher to the total cost had a positive impact. On the
other hand, correlation analysis of all colleges suggests that, if other variables remain
constant, student enrolment was found to be significantly correlated with unit cost
followed by average pay of teacher. Neither age of the college nor ratio of non teacher
to total cost have significant impact. One thing which is very much clear in the study
86
is that the cost of education of state and private women colleges was more than their
income from all sources. However, in other private colleges, their total income from
all sources was more than that of their cost of education.
The study by Shah (1969) analyzes the unit cost of higher education. The study has
divided the cost of education into two main components: (a) social cost, (b)
opportunity cost. Social cost is again divided into student cost and institutional cost.
In student cost, he points out the possibility of double counting in fee and scholarship
because at one time it is the income of the institution and at the same time it is also
the part of institutional cost. Further, he also feels that there is different unit cost of
education of hostellers and day-scholars. Institutional cost can be divided into two
parts, recurring cost and non-recurring cost. In non-recurring cost, the main
components of cost are capital (land on rent and building) and equipment and in
recurring cost they are divisible and non-divisible. He also points out the
complications of calculating unit cost due to the administrative organization. The
study suggests that the recurring cost and expenditure should be done very carefully
Sharma (1969) highlights the significance of unit costs in the planning process. The
study takes into account the nature and different types of unit costs required at
different levels of education with special reference to Indian conditions, the nature of
available statistics, their coverage gap and their limitations. A method has been
developed to measure the cost per student at different levels. Various suggestions
were available for improvements in the methodology for the estimation of costs, etc.
Rao (1969) puts the main attention on the analysis of the various concept of the cost
of education, particularly the higher education, in the developing countries like India.
He discussed the economic aspect of the education. In order to study the cost of
education, he adopted several approaches. In one approach, the main component was
87
the cost borne by the students. In other approach it is divided into three parts: (i)
institutional cost, (ii) student‘s cost and (iii) opportunity cost. Kulkarni‘s study (1969)
also estimates the unit cost of education from the period1962-66 at current prices. It
shows that the change in pupil-teacher ratio affects the unit cost of education. The
decline in pupil-teacher ratio increases the work load of the teachers during the period
which also leads the teachers to leave the profession. Another study by Shah (1969)
analyzes the unit cost of elementary education under two components: tuition and
non-tuition expenditure. It was found that Non-tuition expenditure of poor students is
low as compared to the rich students. This paper points out that there are disparities in
the educational standard of private and municipal schools. It suggests that this gap can
be reduced only either by reducing the burden of tuition cost or improving the quality
of teaching. The study concludes that educational expenditure at constant prices
increased at a lower rate as compared to current prices.
Pandit (1972), in his study, described the social and private cost of the resources used
in the educational process. This was the first study in India where the capital cost of
education has been measured by calculating the stock of physical capital. The study
also analyzed the share of direct cost and opportunity cost in the total private cost, and
found that the share of direct cost (tuition and non-tuition) in the total private cost had
declined, while the share of opportunity (income foregone) cost had risen. It shows
that the students‘ contribution is becoming more and more prominent in the private
cost of education. As far as institutional cost is concerned, per unit current cost had
risen while the capital cost remained constant. Thus, increase in the social cost and
that of the share of private cost in the social cost indicated the increasing participation
of private sector in education.
88
Kamat (1973) made a detailed study of arts, science, commerce and technical
education. It also compares the unit recurring cost of education at various levels in the
University of Poona and found that unit recurring cost of science education is more
than the arts and commerce education. In commerce, arts and science degree courses
the unit costs were about Rs 1200, Rs. 1500 and Rs. 1800 respectively. The cost of
science courses was higher due to the cost of laboratories and equipments. Similarly,
cost of PG courses was four or five times more than degree courses. The cost of
technical and professional education like the engineering and medicine at the degree
level was four or five times higher than that of the general higher education. Kamat
made a very good attempt of comparing the cost of general higher and professional
education. This is one of the best analyses of the unit recurring cost of higher
education. Chalam (1978) analyzed the cost of education in colleges of Andhra
University. The study calculated the institutional and private cost in the colleges. And,
it was observed that institutional cost per student was almost double in the science
faculty as compare to the arts. The comparative study of cost in both faculties has
proved that major component of costs in science faculty was related with the common
services. In arts, however, the teaching cost was the major component of unit cost.
Similarly, private cost of former is less and social cost is more and private
expenditure of the students was mostly influenced by socio-economic background of
the students. Ramanujan (1979), while making a comparative study of the per student
cost in the institution of Jammu and Kashmir found that more than 80 per cent of the
total expenditure of university is consumed by salaries and very less was spent on
library and laboratories.
Prakash (1978) has developed a detailed methodology for the calculation of the unit
cost of education. Moreover, he has developed input-output models of education with

89
an application to the Indian data. He has made estimates of cost of higher education in
the country. He has tried to develop the educational deflators by using various inputs
and their prices over the time. In the case of education, no separate educational
deflators are available and most of the time the consumer price index or income
implicit deflators are used. He identified various determinates of cost of education and
developed the cost of education function. Among others, the major determinants were
the academic costs, particularly the salary level, structure of providing basic
instructions, research guidance and supervision. The availability of public resources
helps in reduction of educational costs by the process of subsidization of institutional
cost of service providers. Tilak (1979) on the basis of data on higher education in
India relating to the year 1975-76, computed the unit cost of education by various
components for the different states/union territories in India. It is also attempted to
formulate a cost function with an objective of explaining differences in unit cost
between different states/union territories. The wide differences have been found in
unit cost of different type of higher education such as general, professional and other
types. Similar differences are also found in the analysis of component-wise unit cost
among different states/union territories as well as for different types of education. In
the general education, the average salary of the teacher varies between Rs. 19,546 in
Lakshadweep and Rs.975.64 in Tamil Nadu. The student-teacher ratio ranges from 61
in U.P. to 6 in Sikkim and Pondicherry. The size of institution varies between 64 in
Tamil Nadu and 2,387 in U.P. Similar picture emerged in the case of professional
education. The average salary of the teacher in Chandigarh was more than Rs. 30,000
and Rs. 3,871 in Mizoram. The student-teacher ratio varies between 6 in Mizoram and
Pondicherry compared to 35 in Meghalaya. The range in size is also quite big the
lowest figure was 30 in Mizoram with 803 in Chandigarh. Wider inequalities persist
90
in the case of other education. In West Bengal, average salary of the teacher was Rs.
1990.50 while Rs. 716 in Manipal.
Sharma (1980) in order to assess the cost and efficiency in Indian university system,
made a unit cost study of the universities located in Delhi. The study also compared
per unit cost of general and professional courses for the period 1974-75 to1976-77.
The per unit current cost was estimated under the four heads: teaching; student
welfare; supporting services; and examination, and the capital cost were classified
into four categories: buildings; equipments; libraries; and others. The study concluded
that operating cost per student in affiliating universities was higher compared to that
of residential universities. Subrahmanyam (1982) by studying the expenditure and
financing pattern of Andhra University, shows that on the expenditure side, major
proportion was consumed by the teaching departments(between 40 per cent and 69
per cent). Further, in per pupil cost, larger differences were found in the non-tuition
components of the cost (general administration 20 per cent to 30 per cent, library 2.58
per cent to 9.12 per cent) rather than in the tuition cost among the students belonging
to the different income strata‘s of the society.
The study done by George (1982) measured the private and social costs of higher
education in Tamil Nadu for the period 1960-76. He found that private expenditure on
professional education was higher than that of general education. He also points out
that the poor communities lagged behind than the urban based families who were
enjoying the maximum benefits of higher education. Gupta (1982) and Shah (1987)
estimated private costs of college education and found that among the main
components of private cost, fee consisted of a very small proportion of the total
private cost.
91
Todaro (1985) discussed the issues of demand for and supply of education and
concluded that private costs of education are inversely related to the demand for
education. Private costs are high at low level of education because of the low
government subsidies. Nair (1990), in his study, described the various types of costs
and their return in the case of higher education. In the case of private cost of
education, the study estimated the average per year expenditure on higher education
in Kerala and showed that tuition fees accounted for minor proportion in the
postgraduate courses during 1985-86.
Rajkumari (1986) presents the vital points in the theoretical reconstruction of cost and
benefit analysis of college education. In cost analysis, the three main components
were student cost, institutional cost and opportunity cost. In the institutional cost
(excluding value of college buildings), mainly three headings were undertaken. They
were: (i) maintenance expenditure; (ii) non-recurring expenditure; and (iii) students-
fund expenditure. After detailed analysis of cost of college education, it was noted
that average cost of all the three attributes were different. The behaviour of cost per
institution for all the colleges on different attributes was also in different order.
Taking all colleges together, the institutional cost has increased by 47 per cent during
the study period. The study also shows that among the total cost, opportunity cost has
made a big contribution, followed by student cost, and institutional cost.
Ramachandran (1987) attempted to analyze the problems of higher education in India
with special reference to the Kerala state for the period 1952-75. The study revealed
huge growth in students‘ enrolment, number of institutions and expenditures during
the study period. But the growth of expenditure was found to be higher as compared
to enrolment and institutions. The bulk of public expenditure on higher education was
spent on development and maintenance of arts and science colleges in Kerala, and the
92
salary constituted the largest component in the total cost of education. While
analyzing the cost of education, Kiranmayi (1989) studies the role of organizational
structure, financial management and their weaknesses in the universities. It discussed
the pattern of income and expenditure of the universities and suggested that there was
an urgent need to evaluate their financial management. Ramamurthy (1989), in his
study, tried to analyze in the case of Delhi University the impact of introducing
computer system on its financial management. For this, the study take into account
the financial performance, resource allocation, per student cost of different
departments and percentage of expenditure of different heads. It indicates the
possibility of better cost management in the university system.
Sharma (1992) gives the state-wise detailed analysis of recurring and nonrecurring
expenditure of the central, deemed and state universities for higher general institutions
from the period 1982-85. The study reveals the income pattern, budgeting and
accounting of finances of the university level institutions in India. And, he suggested
following recommendations: (i) the universities should be given financial autonomy;
(ii), the heads of departments should be delegated adequate financial powers; and (iii)
the universities must prepare an accounts for themselves.
Dutt (1995) analyzed the cost of education of 12 colleges affiliated to the Delhi
University for the period 1976-77 and 1987-88. It was found that educational
expenditure as a proportion to income has risen from 1.26 per cent in 1950-51 to 3.30
per cent in 1992-93, but in total plan outlay, it declined from 7.8 per cent in the First
Five Year Plan (1951-56) to 4.5 per cent during the Sixth Five Year Plan (1980-85),
while the plan-wise expenditure on the university education rose from 9 per cent in
the First Five Year Plan to 19 per cent in Sixth Five Year Plan (1980-85). The average
cost per student was worked out to be Rs. 4,994. Christo‘ study (1996) held that the
93
cost of medical education in a self-financing college, without any government
subsidy, was about Rs.2.25 lakh per annum. Similarly, the average cost of medical
education at the Manipal Academy of Higher Education, for the year 1993-94 to1996-
97, was about Rs. 1.60 lakh per annum for the post-graduate degrees and diplomas.
Regarding the public, private and social costs of higher education on per unit basis,
Salim‘s study (1997) is of worth quoting. It also enquires about the extent of
government subsidization of higher education to the students according to their
socioeconomic backgrounds with special reference to Kerala. This review revealed
very interesting results regarding the cost estimates of higher education courses. The
results show that during 1989-90, per student capital cost of engineering education
was more than two-and-a half times higher than that of the general education.
During1976-90, per pupil capital cost had declined marginally in the case of
engineering education, while it increased in the case of general education, in spite of
the steady rise in enrolment of students. Further, unit capital cost of government
engineering college was higher than that of the private engineering college whereas
that of the government art and science college is low in relation to its counterpart in
the private sector. Among the various components of the unit capital cost, during
1989-90, the buildings and equipments together constituted almost 75 per cent of the
cost of engineering colleges and 65 per cent of arts and science colleges. Over the
period of fourteen years, per pupil share of equipments and books had increased in the
engineering colleges, while it was the share of buildings and books which rose in the
general education colleges. Over this period, salary remained as the major component
in pushing up the recurring cost of education. Almost 66 per cent of the recurring cost
of technical education and 61 per cent of general education was taken by this item.
Regarding the estimation of private cost, according to the socio-economic background
94
of the students, it was found that total private cost of engineering education was 21
per cent higher than that of general education. Interestingly, out of the total private
cost, almost 50 per cent in the technical education and 61 per cent in the general
education was allocated to incidental items of expenditure. Across the different
components of academic costs, the college fee, private tuition and books expenditure
earmarked for hostel expenses, travel and clothing. Further all students particularly
played a significant role. In the case of incidental expenses, the largest share was the
substantially reduced the costs borne by their households. PG engineering students
received considerable amount of money by way of subsidies surprisingly, the net
private cost of engineering education, which gives larger private benefits, was
considerably lower than that of the general education. Finally, a regression analysis of
factors influencing private cost of higher education showed household income as the
major determinant. The estimates of social cost revealed that only about one-fifth of
the social cost of engineering education was borne by the students, while nearly one-
half of the social cost of general education was incurred by them. The remaining part
of the social cost was borne by the government/institution. The contribution of fees in
the institutional cost was only marginal and moreover, it was declining over the time
period.
Heggade (1998) studied the resource allocation and pattern of expenditure on
education in Karnataka state during 1981-90. It also measured the institutional cost of
higher education and studied the management as well organizational problem of
higher education in the state. Sood (2003), while estimating recurring cost of
education, concludes that teachers cost account more than 90 per cent of recurring
cost of school level education in India. In his study, Kumar (2004) measures the
private cost of MBBS course in Kerala in 2000. It showed that pre-admission
95
expenditure was Rs. 8,817 per student and the average post-admission annual private
expenditure Rs. 13,703 including the hostel expenses. Further, the study shows that,
the share of private cost was just 12.3 per cent in the total cost. However, institutional
cost shares a whooping proportion of 87.70 per cent. The study also shows that major
section of the students comes from the high income strata. And fees charged from
students form only a minor component of private educational expenses of medical and
para - medical courses in Kerala. Nearly, 90 per cent of the cost was incurred on non-
fee expenses.
Garg (1985) argued that the unit cost is most often expressed in terms of per student
enrolled, but these can be expressed in other definable units such as per student
graduated. The main classification of educational costs by the incidence of burden
was (a) institutional costs which is sum of (i) current or recurring or operating costs
and (ii) capital costs; (b) household or private costs which include (i) net tuition costs,
i.e. fee paid minus financial aid received by a student and (ii) non-tuition costs; (c)
social costs which is sum of (i) institutional costs (current costs and capital costs), (ii)
private costs (non-tuition costs) and (iii) earning foregone. The major components of
recurring costs in the study were: teachers‘ cost, non-teaching cost, consumable
material cost, scholarships, and maintenance cost of infrastructure (playgrounds,
repair and maintenance of capital assets, durables, unspecified items or
miscellaneous) and organization of literary activities, recreation and cultural
activities. The components of capital costs were the buildings and other capital
installation, equipments apparatus, teaching aids, library books, periodicals,
newspapers, etc. However, the private costs consisted of the tuition cost, non-tuition
cost (it includes: additional cost of living in hostels, uniform cost, transport cost) and
96
opportunity cost. This was the first study which calculated per unit cost of higher
education both at the institutional and private levels in Punjab. The main conclusions
of study were: (i) unit cost of education both at current and capital level had shown an
upward trend; (ii) science departments had higher unit cost than that of others; (iii
salary component constituted the major proportion of recurring cost in each
department; (iv) subsidization of unit costs from public funds had increased over a
periods of time; (v) economic status of university students was better than that of
affiliated colleges; and (vi) demand for higher education was high from the
households belonged to the administrative and professional services. Another
significant study produced by Ghuman, Singh and Brar (2005) measures per unit
recurring cost of higher education (general and professional) for Punjab. It measures
the unit cost, financing and recovery of colleges and university level higher education.
The study shows that there has been a strong growth of private initiative in higher
education particularly in the professional higher education. It found that overall per
unit recurring cost in the case of general higher education was Rs. 13,508 during
2004-05. Per unit recurring cost was higher in the urban areas colleges (Rs. 13,506)
compared to the rural areas colleges (Rs. 10,118). However, ownership-wise, its level
was the highest in the aided private colleges (Rs. 14,600), followed by the
government colleges (Rs. 12,053), and the lowest in the unaided private colleges (Rs.
10,118). Component-wise, teachers‘ cost dominates across the ownership and
locational categories. However, administrative cost was the second highest
component of recurring cost, where it constituted between 18.16 per cent and33.22
per cent of unit recurring cost. In professional education, per unit overall recurring
cost was Rs. 1, 17,555. Out of this, teachers‘ cost was Rs. 56,967 (48.50 per cent) and
other costs Rs. 60,488 (51.49 per cent). Thus, like the general education, teachers‘
97
cost and administrative cost constituted the substantial proportion of recurring cost
across all the trades/courses of professional education in Punjab. The analysis of cost
recovery of general and professional education in Punjab shows that its level was
quite higher in the professional education than that of the general education. The share
of total receipts in recurring cost was 95.72 per cent in general education, and 134.27
per cent in professional education. Moreover, fees and funds alone constituted 77.38
per cent of recurring cost of general education, and 97.34 per cent in professional
education.)
2.14.7 International trends and private higher education in India:
Of late, the debate initiated around the neo-liberal themes of privatization,
deregulation, denationalization made its inroads into the realm of higher education
with the advent of new political economy based on ―economic politics‖ applied to
―political markets‖.( Asha Gupta)
Higher education is not an exception to these trends worldwide (Gupta, 2007). With
the emergence of knowledge based and technology driven economies, we find a surge
in the demand for highly skilled and technologically competent workforce.
Worldwide 84 million students attend regular higher education institutions and about
66 million adults, including the working adults, attend some form of continuing
education and training under Life Long Learning program. Whereas the demand for
higher education is constantly rising, likely to be 160 million by 2025, the state
support in terms of funding per student as unit, is declining (Glakas, 2003). We find
shifts in expenditure from the state to the market and from the market to the
household. In some cases, household is spending up to 33 per cent on higher
education as it is seen as an embodiment of personal growth, social and global
98
mobility and political and economic power. It has already become a US $3.2 trillion
enterprise in itself. For example (Glakas, 2003):
Worldwide 84 million students attend 20,000 colleges and universities.
A total of 66 million adults and more than 50 per cent of the working people
participate in some form of continuing education now.
Higher education constitutes a US$3.2 trillion market.
The entire developing world has only 15 per cent of the share.
The global demand for higher education is likely to reach 160 million by
2025.
India and China will be the two biggest countries seeking higher education.
Demand is growing at the rate of 20 per cent per annum in India.
Higher education is no longer elitist. It has become more accessible now.
There is an increase in the role of household, private and corporate sector in
higher education.
We find a surge in online and for-profit private higher education.
In 2000, global IT companies certified 1.6 million students worldwide with
2.4 million certificates in information technology itself.
Higher education is no longer seen as solely state-funded socio-political priority but
also as a service and trade in the wake of changing nature of the labour market and
technological innovations. There is a surge in online and for-profit private in the wake
of massification of higher education consumption due to the hyper-mobility in the
wake of globalization and need for trained personnel having the ability of working
comfortably in multi-cultural, multi-lingual and multi-ethnic settings(Asha
Gupta,2008).
99
In his article „ Towards an Educated India: Academia – Industry Partnership”,
in the Free Press Journal, Dr. R.Gopal expressed that extremely dynamic
business world, and the rapidly developing knowledge based services economy
have put in an increased demand for professionals to merge the business
effectively. This is precisely the reason why amongst the various fields of
knowledge, the desire for acquiring management qualifications is growing
rapidly both amongst the fresh graduates and working executives. It is in this
context that the proposal corporate- academic tie up becomes crucial.
International Trends:
Whereas some studies have been carried out on the need for higher education reforms,
in general and privatization, in particular, not much has been published on the
mushroom growth of private higher education during the last three decades except
some studies such as Private Prometheus: Private Higher Education and Development
and Private Higher Education: A Global Revolution by P.G. Altbach, Higher
Education and State in Latin America: Private Challenges to Public Domain and the
Unanticipated Explosion: Private Higher Education‘s Global Surge by Daniel C.
Levy, Private Higher Education in Malaysia by M.N. Lee, Minban Education in China
by F. Yan, Private Higher Education in Post-communist Countries: In Search of
Legitimacy by S. Slantcheva, Private Sectors in Higher Education by R.L. Geiger,
Earnings from Learning: the Rise of for-Profit Universities by Breneman, Pusser and
Turner, Rethinking Public-Private Mix in Higher Education by Z. Gilani et al.
2.14.8 Private Higher Education in India:
India has a long tradition of private higher education dating back to the Gurukul
system 700 to 500 years before Christ. India has the reputation of having ―medieval
cosmopolitan universities‖, especially at Taxila and Nalanda 2000 years ago and at
100
Vikramshila during the fourth and fifth centuries (Joshi, 1998), catching the attention
of all those who had keen interest in diverse cultures and ―knowledge for the sake of
knowledge‖. During colonial rule, it imbibed the British system of higher education
and values. The first three universities, modelled on the University of London, were
set up in 1857 at Mumbai, Chennai and Kolkata. The British Parliament was
persuaded to authorize an expenditure of£10,000 annually to promote English
literature, knowledge and science among the inhabitants of the British territories in
India as early as 1813 (Mukherjee, 1971, quoted from Chitnis and Altbach, 1993, p.
376). Some of the institutions were also set up by foreign missionaries, such as, the St
Stephens College in Delhi, Presidency College in Kolkata, St Joseph‘s College in
Trichi, St Xavier‘s College in Chennai, etc. The main motive of such missionaries
was to promote Christianity and western culture on the one hand and prepare Indian
nationals for government employment, on the other. The Muslims too started Dar-al-
ulum at Deoband in 1887 (Rudolph and Rudolph, 1972, p. 19). The prime objective
behind such private initiatives was social transformation and not economic gains. At
the time of independence in 1947, India inherited 20 universities and 496 colleges
with 237,546 students (Basu, 2001, p. 171) and the private sector and the households
played a substantial role in supporting higher education. During 1950-1951, the share
of Indian government in higher education was just 49.4 per cent. It rose to
approximately 80 per cent in early 1980s (Tilak, 1999, p. 129). The private sector
comprised 57 per cent of the total higher education system by the 1980s and up to 75
per cent by 1990s (Patrinos, 2002). A private university could be established through
a central or a state act by a sponsoring body, such as, a society registered under the
Societies Registration Act of 1860, or a public trust or a company under section 25 of

101
Company‘s Act of 1956. Though there were many private colleges prior to
independence, there was not a single private university per se. Even today only 350
universities have the power to accord degrees and the rest are affiliated to them
(Agarwal, 2006, p. 4645).
International trends and private higher education in India:
Of late, the debate initiated around the neo-liberal themes of privatization,
deregulation, and denationalization made its inroads into the realm of higher
education with the advent of new political economy based on ―economic politics‖
applied to ―political markets‖.( Asha Gupta)
Higher education is not an exception to these trends worldwide (Gupta, 2007). With
the emergence of knowledge based and technology driven economies, we find a surge
in the demand for highly skilled and technologically competent workforce.
Worldwide 84 million students attend regular higher education institutions and
about66 million adults, including the working adults, attend some form of continuing
education and training under Life Long Learning program. Whereas the demand for
higher education is constantly rising, likely to be 160 million by 2025, the state
support in terms of funding per student as unit, is declining (Glakas, 2003). We find
shifts in expenditure from the state to the market and from the market to the
household. In some cases, household is spending up to 33 per cent on higher
education as it is seen as an embodiment of personal growth, social and global
mobility and political and economic power. It has already become a US $3.2 trillion
enterprise in itself. For example (Glakas, 2003):
Worldwide 84 million students attend 20,000 colleges and universities.
A total of 66 million adults and more than 50 per cent of the working people
participate in some form of continuing education now.

102
Higher education constitutes a US$3.2 trillion market.
The entire developing world has only 15 per cent of the share.
The global demand for higher education is likely to reach 160 million by 2025.
India and China will be the two biggest countries seeking higher education.
Demand is growing at the rate of 20 per cent per annum in India.
Higher education is no longer elitist. It has become more accessible now.
There is an increase in the role of household, private and corporate sector in
higher education.
We find a surge in online and for-profit private higher education.
In 2000, global IT companies certified 1.6 million students worldwide with
2.4 million certificates in information technology itself.
Higher education is no longer seen as solely state-funded socio-political priority but
also as a service and trade in the wake of changing nature of the labour market and
technological innovations. There is a surge in online and for-profit private in the wake
of massification of higher education consumption due to the hyper-mobility in the
wake of globalization and need for trained personnel having the ability of working
comfortably in multi-cultural, multi-lingual and multi-ethnic settings(Asha
Gupta,2008).
In his article „Measuring Effectiveness of Management Education in B School –
Caring out Niche, creating Competitive Advantage “ Published in a journal
Edutech, Dr. R. Gopal stated, the need to satisfy consumers in any commercial
enterprise is obvious , more so in today‟s context. One doubts whether there is
any need to establish, the importance of creating „Customer Centric
Organization, Well, there is, Customer‟s satisfaction is true not only for any

103
organization, but also for provider of management education – the Business
School (B-School).
International Trends:
Whereas some studies have been carried out on the need for higher education reforms,
in general and privatization, in particular, not much has been published on the
mushroom growth of private higher education during the last three decades except
some studies such as Private Prometheus: Private Higher Education and Development
and Private Higher Education: A Global Revolution by P.G. Altbach, Higher
Education and State in Latin America: Private Challenges to Public Domain and the
Unanticipated Explosion: Private Higher Education‘s Global Surge by Daniel C.
Levy, Private Higher Education in Malaysia by M.N. Lee, Minban Education in China
by F. Yan, Private Higher Education in Post-communist Countries: In Search of
Legitimacy by S. Slantcheva, Private Sectors in Higher Education by R.L. Geiger,
Earnings from Learning: the Rise of for-Profit Universities by Breneman, Pusser and
Turner, Rethinking Public-Private Mix in Higher Education by Z. Gilani et al.
Private Higher Education in India:
India has a long tradition of private higher education dating back to the Gurukul
system 700 to 500 years before Christ. India has the reputation of having ―medieval
cosmopolitan universities‖, especially at Taxila and Nalanda 2000 years ago and at
Vikramshila during the fourth and fifth centuries (Joshi, 1998), catching the attention
of all those who had keen interest in diverse cultures and ―knowledge for the sake of
knowledge‖. During colonial rule, it imbibed the British system of higher education
and values. The first three universities, modelled on the University of London, were
set up in 1857 at Mumbai, Chennai and Kolkata. The British Parliament was
persuaded to authorize an expenditure of£10,000 annually to promote English

104
literature, knowledge and science among the inhabitants of the British territories in
India as early as 1813 (Mukherjee, 1971, quoted from Chitnis and Altbach, 1993, p.
376). Some of the institutions were also set up by foreign missionaries, such as, the St
Stephens College in Delhi, Presidency College in Kolkata, St Joseph‘s College in
Trichi, St Xavier‘s College in Chennai, etc. The main motive of such missionaries
was to promote Christianity and western culture on the one hand and prepare Indian
nationals for government employment, on the other. The Muslims too started Dar-al-
ulum at Deoband in 1887 (Rudolph and Rudolph, 1972, p. 19). The prime objective
behind such private initiatives was social transformation and not economic gains. At
the time of independence in 1947, India inherited 20 universities and 496 colleges
with 237,546 students (Basu, 2001, p. 171) and the private sector and the households
played a substantial role in supporting higher education. During 1950-1951, the share
of Indian government in higher education was just 49.4 per cent. It rose to
approximately 80 per cent in early 1980s (Tilak, 1999, p. 129). A private university
could be established through a central or a state act by a sponsoring body, such as, a
society registered under the Societies Registration Act of 1860, or a public trust or a
company under section 25 of the Company‘s Act of 1956. Though there were many
private colleges prior to independence, there was not a single private university per se.
Even today only 350 universities have the power to accord degrees and the rest are
affiliated to them (Agarwal, 2006, p. 4645).
2.14.9 Faculty Retention:
Teacher attrition has been a topic in the Education literature for many years. It has
been claimed that teacher attrition is a major problem in our schools and that between
20% and 50% of beginning teachers decide to leave the profession in the first three to
five years (Ewing, 2001; Ewing & Smith, 2002). Teaching is usually considered a
105
vocation, one involving a long term career path. Manuel (2003, p. 142) states that
teaching isn‗t usually a ―drop in, drop out or revolving door type profession.
Huberman as early as 1989 established that those who leave the profession usually do
so in the first five years of entering the profession. For beginning teachers, how they
survive the first year, if they do, can be a significant factor in decisions about
remaining in or leaving the profession (Lang, 1999). For example, a 2003 Victorian
Department of Education and Training Report reported that in the United States, a
third of teachers leave the profession within three years and almost half within five
years. In Britain, a 2003 survey by the University of Buckingham found that 30 per
cent of British teachers who left teaching that year had been in the profession for less
than five years (Hogan, 2007). The problem of faculty turnover has afflicted all
disciplines, particularly in the last ten to twenty years. The market for Ph.D.s outside
academia has grown along with the dispersion of knowledge-based activity
throughout the economy (Bowen and Schuster, 1986). Those with advanced degrees
have proven their employability in a variety of fields. Considering that professors are
paid roughly 25 to 30% less than similarly educated professionals, there is cause to
worry that an increasing number of faculty will leave for the private sector (Bell,
2001). The benchmark study of faculty mobility was conducted by Caplow and
McGee and published in 1958 as ‗The Academic Marketplace‘. Thirty years later,
Burke replicated their study, producing ‗The New Academic Marketplace‘ in 1988.
Burke found that the market for professors had become radically different over those
three decades. Beginning teachers are leaving their jobs at an alarming rate that harms
both the school, especially urban ones, and student performance (Ingersoll & Smith,
2003; Howard, 2003). Remaining employees are often forced to shoulder increased
workloads without a rise in pay. Heightened turnover often has a demoralizing effect
106
on those who remain, as well as a negative effect on prospective employees. More
concretely, high turnover is associated with low job satisfaction, poor productivity,
and high stress among employees (Olsen, 1993).
In his article “Towards an Educated India: Sustainable Strategies for a B-School
in India”, in the Free Press Journal, Dr. R. Gopal expressed that faculty is the
back bone of any B-School. Faculty shortages are the order of the day inspite of
the 6th pay commission. Today commitment and loyalty from the faculty
towards the student and the organization lacks. Co-creation of the faculty, 360
degree faculty feedback, treating the faculty as family members by celebrating
their Birthdays and picnic etc., could retain the faculty pool.‟
In the research paper, Does Academic Leaders Influence Staffs‟ Commitment to
Service Quality in Malaysia?, Raemah Abdullah Hashim from University of
Management and Technology and Rosli Mahmood from University Utara Malaysia―
discussed the relationship between leadership style of transformational and the
commitment to service quality among academic staffs in public and private Malaysian
Universities. It has been argued that excellent service quality performance is one of
the key factors in building niche and having competitive edge that separates one from
its competitors nationally and globally. Total useable questionnaires were 387 with a
response rate of 36 percent. The result revealed that there is a significant relationship
between transformational leadership style and commitment to service quality among
academic staff at the Malaysian universities. This study implies to the policy makers
and academic leaders at the universities that they should focus in developing their
academic staff, by tapping their potentials, inspiring them, promoting collaboration,
motivating and reinforcing positive attitudes towards commitment to service quality.
107
Nienhuis (1994) describes faculty as mobile, loyal to the discipline rather than the
institution. Considering the indications of an upward swing in both components, it is
safe to assume that faculty turnover is causing greater problems for many
administrators. Faculty who leave voluntarily tend to be characterized by a high
achievement orientation (Barnhart, 1995) Bowen and Schuster‗s American
Professors: A National Resource Imperilled, combining several studies, reports a 4%
annual rate of attrition in early 1980s. Their definition of attrition, distinct from
turnover, indicates the number of faculty who leave academia each year for reasons
other than retirement. This figure does not include those faculties who departed for
other postsecondary institutions; the rate of turnover as defined here must have been
higher than the 4% attrition rate. Based on their studies, Bowen and Schuster
predicted that attrition (not turnover) might average 4% per year into the late 1990s
and might even reach 6% by 2000. They added that if faculty positions become less
economically attractive compared to positions in private industry, the rate of attrition
could rise substantially. Though faculty salaries do lag considerably behind those of
industry, a fairly large supply of PhDs in most fields has made faculty positions
highly prized, thus potentially reducing turnover. Chairpersons wishing to retain
faculty are aware that they cannot simply throw money at dissatisfied employees.
Salary does not always provide adequate recognition or ensure contentment
(Nienhuis, 1994). One study found that higher compensation levels increased the
retention of assistant and associate professors, but had no effect on retaining full
professors (Gill et al., 1992). The same study reported that six of the top seven
reasons for departing were intangible benefits such as research opportunities.
Naturally, faculty compare not only their salaries to those in other professions, but to
other professors, in and outside of their institutions. Universities and college
108
administrators must be keenly aware of the salary and benefits packages offered by
comparable institutions, but they must also watch out for disparities between and
especially within their own departments. Serious morale and collegiality problems are
posed when salary ranges are wide, and especially if junior faculty is paid higher than
senior faculty. One study found that 27% of universities had used this particular tactic
in an effort to recruit rising stars (Gill et al., 1992). In general, some research suggests
that perceived equity of pay may be a more important determinant of commitment and
satisfaction than basic level of pay (Mowday et al., 1982). Administrators should
watch for this issue of fairness and not the simple economic bottom line. There is also
non-salary incentives that can help recruit and retain faculty without raising salaries.
One is to speed up the tenure clock. The promise of lifetime job security is certainly
alluring, and can compensate for lower pay.
Dunn and Bradstreet one of the leading consulting houses had elicited
Dr.Gopal‟s views on the Indian Education especially w.r.t B- Schools. He
expressed that every faculty should be encouraged to attend Faculty
Development Programs, write research papers, and attend conferences. Faculty
should be encouraged to enrol him / her for the PhD program and incentives
given-like reduction in teaching load. Feedback should be taken from the
students on a periodically basis and this must be communicated to the faculty
concerned. This helps in improving the quality of teaching. Consultancy and
Management Development programs should also be encouraged by the Institute.
(S.J.Dhopte, 2011)
In addition to early promotion, institutions can offer more generous research
allowances, more frequent leaves of absence, and reduced teaching loads (Bowen &
Sosa, 1989). While each of these tactics has economic consequences, a careful

109
combination of incentives and salary can end up saving money and retaining more
faculties. Also, empirically, programs of communication intervention can improve job
satisfaction, which directly supports the link between communication and job
satisfaction. The crux of the teaching profession lies in communication, and
communication is a significant and integral component of teacher job satisfaction
(Miller et al., 1988), but one major gap is the paucity of research directly dealing with
how communication variables affect teacher job satisfaction. Teacher job satisfaction
is often cited and rendered important in both research on teacher attrition and teacher
retention (Roach, 1991; Voke, 2002; Stockard & Lehman, 2004). First, some
researchers and scholars tried to understand the high teacher turnover rate among
beginning teachers by investigating the reasons and causes behind both teacher
retention and teacher attrition (Connolly, 2000; Ingersoll, 2003; Ingersoll & Smith,
2003; Howard, 2003; Inman & Marlow, 2004; Heller, 2004; Stockard & Lehman,
2004). Moreover, teacher job satisfaction is frequently associated with burnout, work
quality and professionalism. Some scholars have focused exclusively on burnout in
the teaching profession (Ebeling, 1983; Starnaman & Miller, 1992; Evan, 1999; Ven
Der Doef & Maes, 2002). Researchers try conducting model tests and examine
hypotheses of communication, burnout, organizational stressors and outcomes, and
they discover that role stressors, workloads, work assessments, and professionalism
influence teachers‘ perceptions and attitudes towards their job satisfaction. There are
many other ways institutions can actively seek to retain more faculty members. One is
to address quality of life issues more thoroughly, which could mean providing
assistance with housing or sponsoring faculty clubs. Collegiality is an often-
overlooked part of the turnover equation, although majorities of the faculty who leave
voluntarily cite personal factors such as relationships with colleagues as reasons for
110
their departure (Johnsrud & Heck, 1994). Other strategies that have met with success
include spousal hire programs, formalized training programs for department chairs,
formal mentoring programs for all probationary faculties, and explicitly written
guidelines for tenure (Harigan, 1999).An oft-missing component of graduate
education is preparation for the day-to-day life of the professor. That is, graduate
students learn to be scholars, with little attention given to the other tasks a professor
must complete. Increased attention to this matter in graduate training, along with
orientation programs for new faculty, should make professors expectations for their
careers more realistic, and reduce their interest in changing jobs. High levels of stress
characterize the early years of academic appointment, but through the efforts of
colleagues and superiors, they can be reduced. Deans, chairs, and senior faculty need
to perceive support of new faculty as an investment in the success of the individual,
the department, and the institution (Olsen, 1993).
Recruiting top faculty is a major challenge for both newer schools and established
institutions. Even though the demand for business education has been growing
steadily over the last decade, the production of PhD-trained faculty has not risen to
satisfy that demand. On the contrary, it has been declining, making it increasingly
difficult for business schools to increase their faculty to meet the demand for business
programs. Presently, the biggest challenge faced by technical educational institutions
in India is the acute shortage of qualified and competent faculties (Times News
Network, 2006). The genesis of this lies in rapid mushrooming of technical
institutions on account of surging demand of technically trained manpower by fast
growing industrial sector of Indian economy; and abysmally low number of PhDs
/Fellows in technical disciplines from premier institutions opting for the teaching
careers on account of possibility of higher incomes from the non-academic career
111
options (Rosenfield & Jones, 1988). Further the problem of faculty shortage has been
accentuated due to the entry of foreign universities in the India post to enactment of
provisions of GATS Agreement to education sector in India in April 2005. This has
resulted in a scenario where technical institutions in India are competing with each
other to attract & retain for them the best available faculty talent. While most higher
education institutions, especially professional institutes and colleges are able to
develop the needed skills in students for success in the working world, experience
shows that the management of upcoming technical and management institutions has
failed to be just and fair in the treatment of their faculties. (Rachit gupta*; Hemant
Chauhan**; Palki setia***, 2011) Teacher job satisfaction is often cited and rendered
important in both research on teacher attrition and teacher retention (Roach, 1991;
Voke, 2002; Stockard & Lehman, 2004). Hence it is required to manage talents and
make them feel belonging and valuable towards institution. Lynn (2002) supported
the idea that educational leaders should provide professional learning and growth
opportunities in order to motivate teachers and to enhance their performance so that
business schools can strategically manufacture the quality products in this competitive
era of today and teacher could excel in their expertise areas.
2.15 Research Gap
The study is one of its kinds. The mentioned literature of leadership styles within
academic sector and employee commitment within academic institutions as well as
the thorough literature on the education sector as given in the research study itself is
the evidence that no literature was found on the relationship between leadership styles
and employee commitment, especially in the academic sector of the Indian Sub-
continent.
112
CHAPTER 3
EDUCATION SYSTEM IN INDIA
113
CHAPTER 3
EDUCATION SYSTEM IN INDIA
3.1 Introduction to the Education System in India:
India is one of the world‘s oldest civilisations, dating back to 2,500 B.C. Aryan tribes
from the northwest invaded the country in about 1,500 B.C.; their merger with the
earlier Dravidian century and Turkish in the twelfth century were followed by those
of European traders, beginning in the late fifteenth century. By the nineteenth century,
Great Britain had assumed political control of virtually all Indian lands. Mohandas
Gandhi and Jawaharlal Nehru helped end British colonialism through non-violent
resistance. India achieved independence in1947. The Republic of India was
established in 1947 and comprises 32 states and Union Territories, the latter
controlled by the central government. The country covers about 3.3 million square
kilometres with a population of 1.029 billion and dominates southern Asia. It is
slightly larger than one-third the size of the United States. India is home to 17% of the
world‘s total population, accommodated in an area that is 2.4% of the world‘s total
area. India has the world‘s twelfth largest economy and the third largest in Asia
behind Japan and China, with a total GDP of around $570 billion. Services, industry
and agriculture account for50.7%, 26.6% and 22.7% of GDP respectively. The United
States is India‘s largest trading partner. Bilateral trade in 2003 was $18.1 billion.
There are some 16 official major languages and 844 dialects. Among these languages,
English enjoys associate status, but is the most important language for national,
political, and commercial communication. Hindi is the national language and primary
tongue of30% of the people. The other official languages are Bengali, Telugu,
Marathi, Tamil, Urdu, Gujarati, Malayalam, Kannada, Oriya, Punjabi, Assamese,
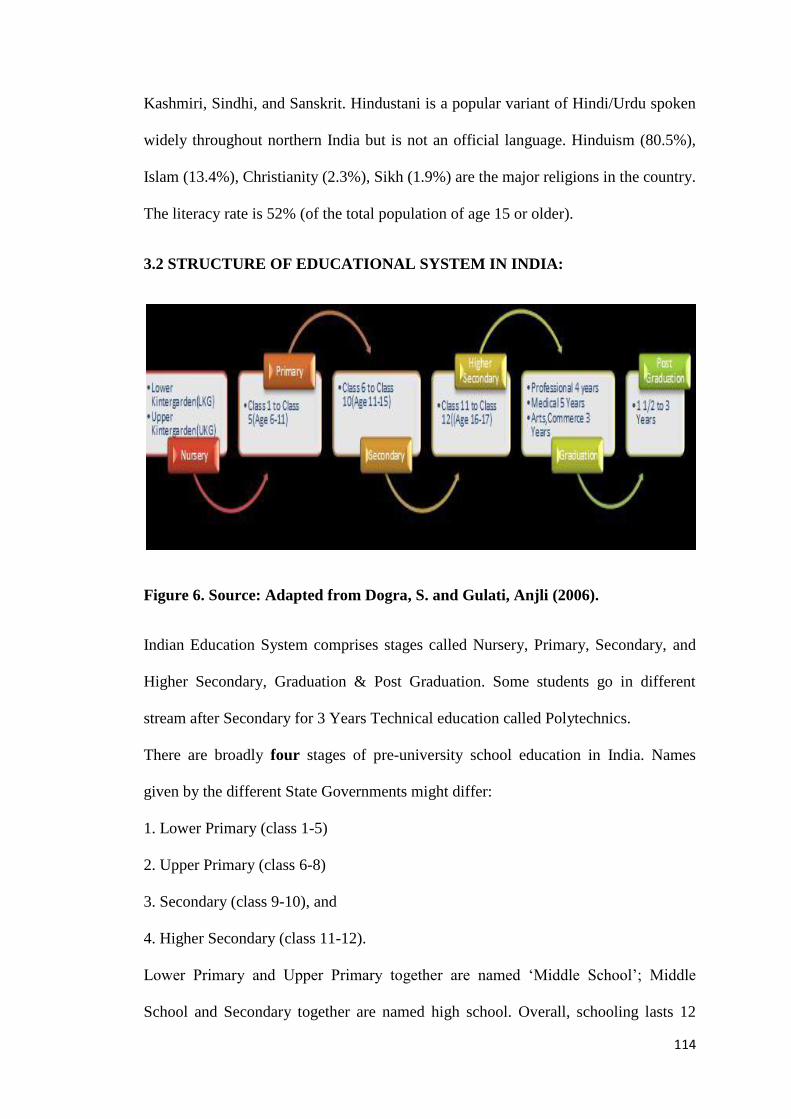
114
Kashmiri, Sindhi, and Sanskrit. Hindustani is a popular variant of Hindi/Urdu spoken
widely throughout northern India but is not an official language. Hinduism (80.5%),
Islam (13.4%), Christianity (2.3%), Sikh (1.9%) are the major religions in the country.
The literacy rate is 52% (of the total population of age 15 or older).
3.2 STRUCTURE OF EDUCATIONAL SYSTEM IN INDIA:
Figure 6. Source: Adapted from Dogra, S. and Gulati, Anjli (2006).
Indian Education System comprises stages called Nursery, Primary, Secondary, and
Higher Secondary, Graduation & Post Graduation. Some students go in different
stream after Secondary for 3 Years Technical education called Polytechnics.
There are broadly four stages of pre-university school education in India. Names
given by the different State Governments might differ:
1. Lower Primary (class 1-5)
2. Upper Primary (class 6-8)
3. Secondary (class 9-10), and
4. Higher Secondary (class 11-12).
Lower Primary and Upper Primary together are named ‗Middle School‘; Middle
School and Secondary together are named high school. Overall, schooling lasts 12
115
years, following the "10+2 pattern". However, there are considerable differences
between the various states in terms of the organizational patters within these first 10
years of schooling. The government is committed to ensuring universal elementary
education (primary and upper primary) education for all children aged 6-14 years of
age.
Primary school includes children of ages six to eleven, organized into classes one
through five. Upper Primary and Secondary school pupils aged eleven through fifteen
are organized into classes six through ten, and higher secondary school students ages
sixteen through seventeen are enrolled in classes eleven through twelve. In some
places there is a concept called Middle/ Upper Primary schools for classes between
six to eight. In such cases, classes nine to twelve are classified under high school
category. Higher Education in India provides an opportunity to specialize in a field
and includes technical schools (such as the Indian Institutes of Technology), colleges,
and universities. In India, the main types of schools are those controlled by:
• The state government boards like SSC, in which the vast majority of Indian School-
children are enrolled,
• The Central Board of Secondary Education (CBSE) board,
• The Council for the Indian School Certificate Examinations (CISCE) board,
• National Open School and
• "International schools." These schools mimic the schools in the West in pattern and
syllabi and are considerably more expensive than regular schools. The exams
conducted have the syllabus of anyone of the above-mentioned Councils or Boards.
Overall, according to the latest Government Survey undertaken by NUEPA (DISE,
2005-6), there are 1,124,033 schools.
116
3.2.1 Pre-primary Education:
Pre-primary education in India is not a fundamental right, with a very low percentage
of children receiving preschool educational facilities. The largest source of provision
is the so called Integrated Child Development Services (or ICDS); however, the
preschool component in the same remains weak. In the absence of significant
government provisions, private sector (reaching to the relatively richer section of
society) has opened schools. Provisions in these kindergartens are divided into two
stages- lower kindergarten (LKG) and upper kindergarten (UKG). Typically, an LKG
class would comprise children3 to 4 years of age, and the UKG class would comprise
children 4 to 5 years of age. After finishing upper kindergarten, a child enters Class 1
(or, Standard 1) of primary school. Often kindergarten is an integral part of regular
schools. Younger children are also put into a special Toddler/Nursery group at the age
of 2–2½. It is run as part of the kindergarten. However, crèches and other early care
facilities for the underprivileged sections of society are extremely limited in number.
There are some organized players with standardized curriculums such as the
Shemrock Preschools which cover a very small share of the population. Overall, the
% enrolment is pre-primary classes to total enrolment (primary) is 11.22 (DISE, 2005-
06).
3.2.2 Elementary Education
During the eighth five-year plan, the target of "universalizing" elementary education
was divided into three broad parameters: Universal Access, Universal Retention and
Universal Achievement i.e., making education accessible to children, making sure that
they continue education and finally, achieving goals. As a result of education
programs, by the end of 2000, 94% of India's rural population had primary schools
within one km and 84% had upper primary schools within 3 km. Special efforts were
117
made to enrol SC/ST and girls. The enrolment in primary and upper-primary schools
has gone up considerably since the first five-year plan. So has the number of primary
and upper primary schools. In 1950-51, only 3.1 million students had enrolled for
primary education. In 1997-98, this figure was 39.5 million. The number of primary
and upper primary schools was 0.223 million in 1950-51. This figure was 0.775
million in 1996-97. In 2002/2003, an estimated 82% of children in the age group of 6-
14 were enrolled in school. The Government of India aims to increase this to 100% by
the end of the decade. To achieve this Government launched Sarva Shiksha Abhiyan.
The strategies adopted by the Government to check drop-out rate are:
• Creating parental awareness
• Community mobilization
• Economic incentives
• Minimum Levels of Learning (MLL)
• District Primary Education Programme (DPEP)
• National Programme of Nutritional Support to Primary Education (Mid-day
Meals Scheme)
• The 86th Constitutional Amendment Act was passed by the parliament to make
The Right to Elementary Education a fundamental right and a fundamental duty.
• National Elementary Education Mission
• A National Committee of State Education Ministers has been set up with the
Minister of Human Resource Development as the Chairperson of the committee.
• Media publicity and advocacy plans.
• Sarva Shiksha Abhiyan
However, the poor infrastructure of schools has resulted in fairly high dropout rates.
Thus, according to the DISE 2005-6 data 9.54% of the schools remain single
118
classroom schools and 10.45% schools lack classrooms. The average pupil teacher
ratio for the country is 1:36, with significant variations to the upper end and 8.39%
schools are single teacher schools and 5.30% schools have more than 100 children for
each teacher; 30.87% schools lack female teachers. Only 10.73% schools have a
computer. While the education system has undoubtedly undergone significant
progress, a lot still needs to be done to enhance the learning of children from
scheduled caste (or Dalit) families, scheduled and primitive tribes and religious
minorities. Girls' enrolment continues to lag behind that of boys.
3.2.3 Non-graduation market
While availability of primary and upper primary schools has been to a considerable
extent been created, access to higher education (especially in rural areas) remains a
major issue in rural areas (especially for girls). Government high schools are usually
taught in the regional language, although some (especially urban) schools are English
medium. These institutions are heavily subsidised. Study materials (such as textbooks,
notebooks and stationary) are sometime but not always subsidised. Government
schools follow the state curriculum. There are also a number of private schools
providing secondary education. These schools usually either follow the State or
national curriculum. Some top schools provide international qualifications and offer
an alternative international qualification, such as the IB program or A Levels.
Indian Education System comprises stages called Nursery, Primary, Secondary, and
Higher Secondary, Graduation & Post Graduation. Some students go in different
stream after Secondary for 3 Years Technical education called Polytechnics. Higher
Education in India provides an opportunity to specialize in a field and includes
technical schools (such as the Indian Institutes of Technology), colleges, and
universities. (Rachit Gupta*; Hemant Chauhan**; Palki Setia***, 2011)
119
3.2.4 Higher Education
Higher education in India has evolved in distinct and divergent streams with each
stream monitored by an apex body, indirectly controlled by the Ministry of Human
Resource Development and funded by the state governments. Most universities are
administered by the States, however, there are 18 important universities called Central
Universities, which are maintained by the Union Government. The increased funding
of the central universities gives them an advantage over state competitors. The Indian
Institutes of Technology were placed 50th in the world and 2nd in the field of
Engineering (next only to MIT) by Times Higher World University Rankings
although they did not appear in the Shanghai Jiao Tong University Academic Ranking
of World Universities. The National Law School of India University is highly
regarded, with some of its students being awarded Rhodes Scholarships to Oxford
University, and the All India Institute of Medical Sciences is consistently rated the top
medical school in the country. Indian School of Business, Hyderabad and the Indian
Institutes of Management (IIMs) are the top management institutes in India. The
private sector is strong in Indian higher education. This has been partly as a result of
the decision by the Government to divert spending to the goal of universalisation of
elementary education.
3.3 Accreditation
Accreditations for universities in India are required by law unless it was created
through an act of Parliament. Without accreditation, the government notes "these fake
institutions have no legal entity to call themselves as University/Vishwvidyalaya and
Academic/employment purposes." to award ‗degree‘ which are not treated as valid for
The University Grants Commission Act 1956 explains, "the right of conferring or
granting degrees shall be exercised only by a University established or incorporated
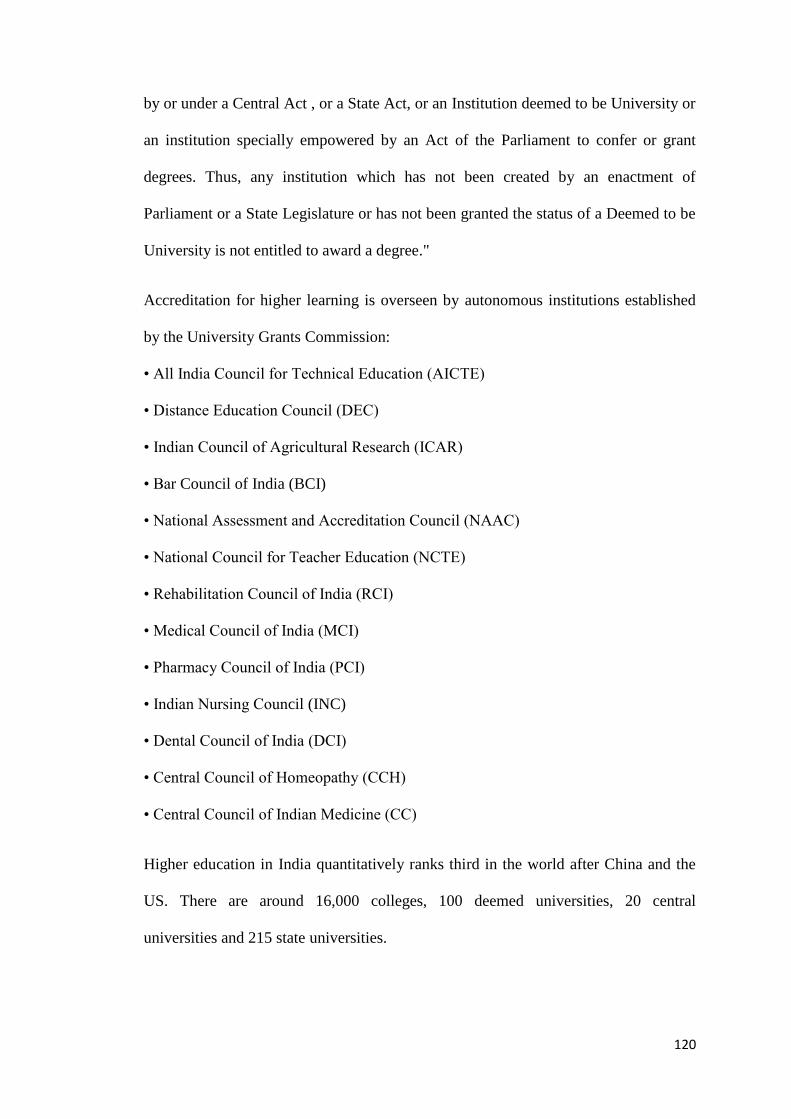
120
by or under a Central Act , or a State Act, or an Institution deemed to be University or
an institution specially empowered by an Act of the Parliament to confer or grant
degrees. Thus, any institution which has not been created by an enactment of
Parliament or a State Legislature or has not been granted the status of a Deemed to be
University is not entitled to award a degree."
Accreditation for higher learning is overseen by autonomous institutions established
by the University Grants Commission:
• All India Council for Technical Education (AICTE)
• Distance Education Council (DEC)
• Indian Council of Agricultural Research (ICAR)
• Bar Council of India (BCI)
• National Assessment and Accreditation Council (NAAC)
• National Council for Teacher Education (NCTE)
• Rehabilitation Council of India (RCI)
• Medical Council of India (MCI)
• Pharmacy Council of India (PCI)
• Indian Nursing Council (INC)
• Dental Council of India (DCI)
• Central Council of Homeopathy (CCH)
• Central Council of Indian Medicine (CC)
Higher education in India quantitatively ranks third in the world after China and the
US. There are around 16,000 colleges, 100 deemed universities, 20 central
universities and 215 state universities.

121
3.4 Administration of Education
The central and the state governments have joint responsibility for education, with
freedom for the state governments to organise education within the national
framework of education. Educational policy planning is under the overall charge of
the central Ministry of Human Resource Development which includes the Department
of Elementary Education and Literacy and the Department of Secondary and Higher
Education. The Ministry is guided by the Central Advisory Board of Education
(CABE) which is the national level advisory body. The education ministers of all the
different states are members of the board. The National Council of Education
Research and Training (NCERT) (1961) defines the National Frame Curriculum for
classes I - XII. It also functions as a resource centre in the field of school development
and teacher education. State Councils of Educational Research and Training (SCERT)
are the principal research and development institutions in all the states. At secondary
level, school boards at state level affiliate schools and set examination standards in
accordance with the national framework. The Central Board of Secondary Education
(CBSE) and Council for Indian School Certificate Examinations (CISCE) cover all
India besides the National Institute of Open Schooling (NIOS).
3.5 Types of Colleges:
Colleges were mainly established by the governments or private trusts or societies. A
government college is one directly established by a state government. It functions like
any their government department. The expenditure of the college is met directly by
the government, through appropriations voted by the legislature; all the personnel
working in the college, including teachers, are government employees. All their terms
and conditions of service are the same as those applicable to the civil service
(recruitment, promotion, and retirement and staff benefits. Perhaps, the major
122
departure from the regular civil servants is that teachers in government colleges have
vacations. A private college is established by a Trust or a Society registered under the
relevant laws in the country. This registration is essential to give the college a legal
status. The management of the college then vests in the Trustees, or the governing
body of the society. The Trust Deed or the Memorandum of Association of the society
would provide for the composition of the Board of Trustees or the Governing body,
and the manner of administering the college and its properties. The promoters (the
Trust/Society) make the initial investments (land, buildings, equipment and staff) and
generally seek some support from the concerned state government for maintaining the
college in later years, as education remains a state responsibility (the notion here is
that private initiatives are only to supplement the state efforts). There is a third
category of colleges, called the University Colleges. These are established and
maintained by the universities themselves either on their own campuses or elsewhere
in their jurisdiction. Such university colleges will have a management scheme decided
by the university which appoints a Managing Committee or a Governing Body. For all
practical purposes, these colleges are integral parts of the university which provides
the funding and controls its work though they have a technically differentiated
management structure. These colleges are also known as constituent colleges.
3.5.1 Colleges and the Universities:
Almost one hundred and sixty years ago, the British said that the purpose of
establishing universities in India was to encourage education in European languages
and science by conferring degrees on those who have shown evidence of having
pursued a course of study in an affiliated institution and passed the required
examination. It is unfortunate that this notion of passing an examination and securing
a degree continues to dominate the psyche of many Indian students who enrol in

123
colleges. It is this relationship between the university and the college is what is known
as 'affiliation'. Most Indian Universities require the fulfilment of the following
conditions for affiliation:
The college should have a legal status (the management should be by a
Government, or a registered Trust or Society).
It should be providing instruction for courses of study prescribed by the
University.
It should have the infrastructure and staff to organise and conduct
teaching according to the standards prescribed by the university.
Teachers should have qualifications laid down by the university.
The management should undertake to meet all the expenditure required for
the maintenance of the college.
There could be a long list of these conditions going into minute details of several
requirements. It is the fulfilment of these requirements that earns for the college the
status of affiliation. And once affiliated, all that the college has to do is to teach the
courses prescribed by the university according to the syllabi set by it. After
completing the prescribed period of study, the college can present the students at the
university held examinations, and those who qualify will get the degrees. In this
scheme, teachers in colleges have not initiative left to them to decide what to teach
and how. This situation often leads to lack of enthusiasm in teaching and indifferent
teacher-student interaction. These in turn have serious consequences for the quality of
education.
3.5.2 Autonomous colleges:
It was to remedy some of these inadequacies of the affiliating system that a proposal
to convert several colleges into autonomous institutions was seriously canvassed in

124
the National Policy on Education 1986. The substance of this proposal was a
transformation of the existing university - college relationship in which colleges could
take up a lot more initiative while maintaining their affiliated status. The proposal
involved: the university concerned declares selected colleges as autonomous colleges
after satisfying itself about the record of its performance, its commitment to quality,
teachers' qualifications and attainments, the quality of management and its capacity to
raise resources; on such declaration, the college would be free to prescribe its own
courses of study, design the curricula, determine the teaching methods and practices,
hold its own examinations and decide its own evaluation systems; the university
concerned will award the degrees. The response to this scheme was less than
enthusiastic. Though it was envisaged that about 500 colleges would become
autonomous during the period up to 1990, the figure has reached 150 marks at the end
of 1999. The reasons for this tardy progress are:
college teachers see the proposal as a device to break their collective strength
by separating the managements of several colleges from the existing unified
management structure of the affiliating university;
teachers and employees feel that the managements of colleges (government
and private) will become arbitrary as they will go out of the governing
discipline of the university;
teachers apprehend an increase in their workload with no corresponding
benefits;
students fear that their load will also increase as they will have more to learn;
Some universities are reluctant to lose their more prestigious institutions from
their hold.
125
Whatever the reasons, the fact remains that a necessary and innovative reform which
would have brought the college' teachers centre stage in higher education is
languishing for want of support from those for whom it was designed and developed.
Managing higher education institutions in India is just like a junction, how to show
the path to the future nation builder of our country. There are very hue and cry
situations/difficulties in present Indian higher education about what to do and what
not to do. It becomes so sensitive that it creates conflict in inter and intra management
of higher education institutions. In recent years there have been debates and
controversies regarding management of higher education institutions so as to improve
their efficiency. And this has attracted the attention of academics and researchers in
the field of higher education. One cannot use a single parameter to identify the best
way of managing an institution of higher learning effectively and efficiently. However
researchers have identified a set of principles for the above mentioned purpose. We
very often use the word ―organization‖ and ―institution‖ we must however, make
distinction between the two. While an organization is both a system of consciously
coordinated activities and a rational instrument engineered to do a job, an institution is
a responsive, adaptive organism which is the natural product of social needs and
pressures. An organization is an artificially created system which strives to maximise
the attainment of objectives and of efficiency in management. The organization, in
this sense, continues to be outside the culture of the society in which it functions. An
institution is ―infused with values‖ and it comes to symbolise the community‘s
aspirations. If we look into this definition of an institution there will be general
consensus that any institution of higher learning, be it a college or university, has to
play a very broad spectrum of societal role. Hence, before building up the argument
on the managerial components of higher education institutions, we must not forget
126
these fundamental aspects. (A Report: Management of Higher Education: Institutional
Level)
3.6 Universities: The Organisational Framework:
The birth of the modern university took place in India in 1857. For almost half a
century, the main functions that universities performed were to grant affiliation to
colleges, to hold examinations and to award degrees. It was only in 1904 that Indian
universities (there were only four of them) were given the power to establish
departments of teaching, appoint teachers and provide for the instruction of students
directly enrolled by them. It meant that the number of new colleges seeking affiliation
came down; it also paved the way for the establishment of new teaching universities.
Some of these new universities at Dacca, Aligarh, Banaras, Rangoon, Patna and
Nagpur were established as teaching and residential universities. This was soon
followed by similar universities set up by several princely states that comprised
British India before independence. Around the same period, a number of institutions,
founded primarily to promote a nationalist system of higher education (as against the
modern university modelled on the British pattern) also came up in several parts of
the country. These institutions functioned outside the formal structure of the
university system during the British period, and were co-opted into the formal system
after independence.
The constitutional dispensation did not permit the central government to establish
universities till it was revised in1977. Nevertheless, it was inevitable that certain
special institutions were required to be set up by the central government, and a chain
of new institutions called 'Institutions of National Importance' were soon set up. The
Indian Institutes of Technology, the All India Institute of Medical Sciences, etc. come
in this category, adding to the variations in structures.
127
3.6.1 Structure of universities:
India has central and state universities, unitary, federal and affiliating universities,
institutions of national importance, institutions deemed to be universities and open
universities. The typical pattern, however, is of a state university with major financial
support from a state government and support for its developmental programmes from
the central government via the University Grants Commission (UGC) or the AICTE.
On a functional basis, institutions of higher education consist of multi-faculty
universities, single faculty universities (e.g. agricultural, technological and medical
universities,) and institutions of national importance like IITs, AIIMs, etc. in addition
to institutions deemed to be universities (BITS, IISc) and specialized universities like
women's universities, language universities, Ayurveda universities, etc. The
institutions of higher learning existing at present in India fall into the following broad
categories: Universities established under Acts of Parliament and state legislatures are
generally known as Central Universities and State Universities respectively (there are
only 15 Central Universities in India in 1999). Almost all these Universities are either
affiliating-cum-teaching or only teaching universities. They are also called federal or
unitary universities. Besides general universities which are engaged in teaching and
research in all the traditional disciplines, there are universities devoted to clusters of
specialised disciplines like agriculture, medicine, technology, languages and law. The
pattern and structure of governance of most of these universities are similar; the
management responsibility vesting with an Executive Council (also known as
syndicate or Board of Management) and the academic responsibility vesting with the
Academic Council (also known as Senate or Academic Senate). Following are the
different types of universities functioning in India on the basis of their structural
patterns.
128
3.6.1.1. Affiliating universities
The affiliating types of universities have a number of colleges affiliated to a single
university after satisfying the conditions laid down by the universities. The majority
of Indian universities are primarily of the affiliating type. In the affiliating system, the
university concerned prescribes the courses of study, holds the examinations and
awards the degree while all the teaching is done by the colleges. The university has
very little to do with appointment of teachers, and the adrninistration of day-to-day
academic functioning of the colleges. All it does is to periodically review the facilities
available to them on the basis of which affiliation is renewed; the major
preoccupation of the affiliating university continues to be conducting examinations.
The teachers in the affiliated colleges have very little say in the framing of courses for
long, such universities remained only affiliating and examining bodies with no
teaching and research The University Act of 1904 made provision for teaching in the
universities as well as the appointment of the teachers by the university. Thus the
model of teaching and affiliating universities emerged at the beginning of this
century. This model accommodated not only the affiliation of colleges but also
teaching students in the university departments and its constituent colleges. Research
has also been an important activity of this type of universities. With the multiplication
of the number of universities, it became necessary to assign to each of them specific
temporal limits so that there are no jurisdictional conflicts in the matter of granting
affiliation to colleges. This statutory assignment of jurisdiction (normally a group of
districts) really meant that colleges located in those areas did not have any choice in
seeking affiliation to a university. Their affiliation to the university in whose
jurisdiction they were located became compulsory. In the case of universities which
were purely teaching this problem did not arise as their operations did not go beyond
129
the campuses on which they were functioning. Nevertheless, their legislation still
defined a jurisdiction, corresponding to the campus area, so that the territorial limits
within which the universities can exercise their authority and perform their functions
are clearly specified.
3.6.1.2 Unitary Universities:
These are of relatively recent origin in India; they are modelled after the European
universities or their more contemporary counterparts in the United States. They are
essentially teaching campuses where post graduate studies and research or sometimes
undergraduate as well as post graduate classes are held. It directly controls all aspects
of curriculum transaction, including curriculum planning, teaching and examinations.
A typical unitary university comprises of several schools or faculties, each of which,
in turn comprises several departments. The school, faculty and departments are not
loose administrative units. They are more academic than administrative organs.
All the teachers are appointed by the university, and they have greater representation
on the university bodies and serve much greater role in shaping the academic
decisions of the university. It is much easier in such universities to introduce
innovative changes in terms of courses and other curricular and examination practices.
It must, however be admitted that although these universities have, perhaps,
responded to a large extent to the need for attaining excellence, their response to the
demand for access for a greater number of students, has not been as impressive as in
the affiliating universities.
3.6.1.3 Federal Universities:
These universities do not affiliate colleges; instead they have constituent colleges,
whose academic as well as administrative functions are clearly the responsibility of
the university. The university controls the design of courses, selection of teachers, and
130
supervision of teaching activities and conduct of examination in constituent colleges.
Teachers in the constituent colleges have greater representation on the university
bodies in comparison with those in affiliated colleges. With the pressure of the
number of colleges, this model has over time become ineffective. For example, Delhi
University used to be largely a federal university, but now it has a more complicated
structure with both constituent as well as affiliated colleges in addition to its post
graduate campuses.
3.6.2 Universities according to role functions:
The functional types of the universities in India:
3.6.2.1 Agricultural Universities:
‗Soon after independence, Indian policy makers recognised the need for
modernisation of the agricultural sector. This essentially meant creating an
infrastructure for preparation of trained professionals in the field and for generating
new and vital technologies related to agriculture through research and development
and for making this know how accessible to farmers. Creation of agricultural
universities was primarily to institutionalize the response to the demands on Indian
higher education. The first agricultural university was the GB Pant University of
Agriculture and Technology at Pant Nagar, Uttar Pradesh. At present, 27 agricultural
Universities provide education at undergraduate and postgraduate levels and
undertake research in agricultural and veterinary sciences. In fact extension work is
increasingly being considered as the legitimate responsibility of the university in
India, and credit for this should go mainly to the model set by the agricultural
universities. The Indian Council of Agricultural Research (ICAR) does most of the
funding for these universities. Most agricultural universities are single campus

131
institutions, though in some cases there is more than one campus. Some of them have
agricultural and veterinary colleges affiliated to them.
3.6.2.2 Technological Universities
These again are universities specialising in a single faculty area of engineering and
technology. The genesis of this category of universities is in the conversion of
established colleges of engineering into autonomous institutions. The first of its kind
was established in 1949 when the prestigious Thomson College of Engineering
(established in 1857) was raised to the status of a full-fledged university called the
University of Roorkee in Uttar Pradesh. In more recent times, and especially in the
last three decades, some state governments took the initiative in setting up exclusive
technological affiliated institutions of different universities within their states. They
also organised their teaching programmes. The States of Andhra Pradesh and Tamil
Nadu pioneered this movement and several others followed this example. Some of
these technological universities are among the best in the country in teaching and
research.
3.6.2.3 Medical Universities
As in the case of technological universities, the establishment of medical universities
also followed a similar pattern. To begin with, such universities were established
primarily to bring together all the medical colleges in a state affiliated to different
universities under one umbrella. Such universities were also established first in Tamil
Nadu and then in Andhra Pradesh.
3.6.2.4 Deemed Universities
Section 3 of the UGC ACT provides that an institution of higher education other than
a university which is doing work of very high standard can be declared as an
institution deemed to be a university. This provision in the UGC Act enabled the

132
central government to notify, on the recommendations of the UGC, several
institutions which had made significant contributions to Education and research
outside the established university system, as institutions deemed to be universities,
these institutions were required to redesign their academic and executive management
structures to conform to the pattern of the formal universities. Such institutions enjoy
the academic status and privileges of the university and are able to strengthen
activities in the field of their specialization. Some of the prestigious institutions like
the Indian Institute of Science, Bangalore, the Birla Institute of Technology and
Science, Pilani, the Tata Institute of Social Sciences, Mumbai, the Gujarat
Vidyapeeth, Ahmedabad, and the Central Institute of English and Foreign Languages,
Hyderabad are institutions deemed to be universities. There were as many as 39 such
institutions in 1996.
3.6.2.5 Open Universities
With the purpose of democratising higher education and making it widely accessible
especially to those sections of the society which had had no opportunities for higher
education due to socio-economic or geo-demographic reasons or who had missed
higher education to enter the world of work early in life, a few open universities have
been established since the eighties. Andhra Pradesh Open University was the first of
its kind to be established in India. At the national level the Indira Gandhi National
Open University (IGNOU) was established in 1985. We shall take a detailed look at
these universities later in this course.
3.6.2.6 Institutions of National Importance
The primary responsibility for education was that of the states. Only the state could
establish universities; the centre did not have the power to do so. However, the centre
had the explicit responsibility to establish and maintain institutions and facilities
133
which were of national importance. In pursuance of this power, the central
government established, under Acts of Parliament the five Indian institutes of
Technology as centres of excellence in engineering and technology education. Two
similar institutions were set up in medical education, the All India Institute of Medical
Sciences in New Delhi and the Post-Graduate Institute of Medical Education and
Research in Chandigarh. Another major institution in this category is the Indian
Statistical Institute at Calcutta. The total number of such institutions in the country is
only 12. All these are highly specialised centres with state-of- the-art facilities and
high quality expertise. Most of them are devoted to education and research and admit
students on the basis of all India selection. The Acts empower them to award their
own degrees. Most of them are funded directly by the central government and have a
governance structure comparable to that of the universities though their Governing
Bodies have a fair proportion of people nominated by the government on them.
3.6.3 Governance of Universities:
The experience of universities in the country varies depending upon the type of the
university, the period for which it has been in existence and whether it has been under
the control of the union government or a state government. One thing, however, is
common to all Indian universities and that is, that they have all been established under
legislation, central or state, and that they are all intended to function as autonomous
institutions. In addition to the state- established universities, there is another category,
namely, those which are ‗deemed to be universities'. There are quite a number of
them. They do not belong to a uniform pattern and their governance structure also
varies from institution to institution.
Briefly stated, autonomy of a university is its freedom to organize and administer its
affairs as a corporate body in accordance with the law by which it is established. The

134
autonomous character of the university is reflected in its internal management, the
freedom with which it can decide its policies and programmes, appoint its personnel,
(both teaching and non-teaching), determine their relationship with one another and
facilitate their smooth functioning with a view to realizing their objectives.
Obviously, a university exists primarily for its students and scholars and, through
them and their work, for the society at large. It provides them learning opportunities
in a variety of ways through teachers in the class- rooms, books in the libraries and
laboratories, opportunities of interaction with other students in seminars, experimental
facilities in the field or in the tutorials, group projects or in numerous other forums
and activities based in hostels, clubs and associations. An important source of learning
is actual experience of social and environmental realities first hand, investigation of
phenomena and situations and actual participation in activities of a creative and
developmental nature.
The university should have facilities, structures, management, and above all,
programmes available in sufficient variety so that each student can learn according to
his or her inclination, aptitude and need. It is only thus that the student can get the
best out of the university and the nation gets sustenance from its human resource
developed through the university system.
The concept of education and hence of educational institutions has undergone a great
change in recent years. Education is no longer just creation and dissemination of
knowledge. Education also has social concerns, and must grapple with the problems
of contemporary life outside its immediate areas of concern. Students and institutions
have to be involved in study, work and services related to national development which
have come to be called the third dimension of education. Research and creative
activities of the students and institutions are channelled for tackling specific problems
135
of regional and national development. This new concept has great potential for
making education an investment rather than merely a social service. It should be able
to attract far more funds for its programmes and to pay back to society hands or lay
dividends through not only human resources development, but also participation and
intervention in the whole process of socio-economic and cultural development.
Through its linkages with research institutions, industry, agriculture, and the
government, the university should be in a position to enrich academic programmes
and offer a variety of services to the society.
3.6.4 Constitution of Universities:
Since the university is a creation of the legislature and legislation is always the
preserve of the government of the day, it is for the governments to decide what all
should go into the legislation when establishing a university. It is these provisions in
the Act that will ultimately determine the nature and extent of autonomy that a
university will enjoy. It should be emphasised again that autonomy is not a legal or
constitutional concept. It is the Committee on Governance of Universities said in
1971 "an ethical and an academic concept". This concept does not question the
sovereignty of the legislature to make laws or to discuss and determine the nature and
structure of universities, as well as their right and their obligations.
University autonomy does not suggest that universities are a state within a state, and a
law unto themselves. The university cannot claim autonomy as a matter of privilege,
but as a condition necessary for it to discharge its duties and obligations. The two
conditions on which university autonomy is predicated are (i) autonomy within the
university, and (ii) autonomy in relation to agencies and authorities external to it,
particularly the government. Much will depend on how the decision-making bodies of
the university are constituted and what their composition is. At this point, it is
136
important to remember a major, and perhaps, a unique feature of the functions
associated with the management of universities.
Universities fall into two categories, namely, (i) functions and processes associated
with the administration of the institution, and (ii) the teaching- functions (which
management' and administration of personnel, finance, infrastructure), the second
category is all in the realm of academic management (curriculum design, instructional
system, teaching, student assessment). This latter category of functions does not
always lend itself to conventional styles and methods of management.
These two distinctive types of managerial functions are reflected in the governance
structure of universities. Every university has two important decision-making bodies.
The Executive Council (Board of Management or Syndicate) is the principal
executive body dealing with all the functions of the first category, and the Academic
council (in some cases called the Senate) is the principal academic body, taking all the
decisions in areas falling in the second category. This duality in the decision-making
processes is the unique feature of university management.
It does not follow that the broad areas of concern assigned to these two bodies are
mutually exclusive, and that there are no overlaps between them. Further, the decision
taken by one body may have implications for the other. For instance, if the Academic
Council were to decide to launch an entirely new programme, the Executive Council
will have to arrange for personnel, finances and infrastructure. On the other hand, if
the Executive Council finds that due to shortage of resources, some of the current
programmes require to be reviewed, the Academic Council will have to look at the
issues. In other words, it is necessary for the health of the university that the two
bodies function organically, with mutual respect and co-ordination though in practice
it is not unusual to see conflicts arising between the two. It is inherent in the nature of
137
functions of the universities that there is always some tension between the academics
and the administrators, sometimes also institutionalised in terms of the conflicts
between the Executive and Academic Councils. Normally, while prescribing the
specify the composition and functions of these two bodies, the legislation also takes
care to matters on which, and the manner in which, either body consults the other.
However, since execution of any decision requiring funds, people and facilities is in
the domain of the Executive Council, this body is perceived to have an edge over the
Academic Council in terms of power and authority. With this understanding of a
significant complexity in the structure and pattern of governance of universities, we
shall now proceed to take a close look at the institution of these bodies, the functions
they perform and the power they exercise.
3.6.4.1 The executive council:
The Executive Council (also called Syndicate or Board of Management) is the
authority that takes all executive decisions and implements them. All administrative
and financial powers are exercised by this body. Generally the Executive Council
consists of the Vice-Chancellor as its Chairman, a Pro- Vice-Chancellor, two Deans,
three or four representatives of teachers, two or three representatives (generally
Heads) of colleges or institutions affiliated to the university, three or four nominees of
the government, and two or three members of the Senate who are external members.
There could be minor variations in this broad pattern of composition from university
to university. The significant point is that it has the majority of its members from
within the university, and an adequate representation of interests from outside. The
internal and external representation is generally in the ratio of 3:2 with the total
membership ranging between 15 and 20. The important functions of the Executive
Council are: making statutes and ordinances which govern the conduct of all the sub-
138
systems of the university, control of the finances and properties, management of
personnel (recruitment, promotion, conditions of service, welfare), supervision over
the management of institutions/colleges affiliated to the university redressal of
grievances of teachers, staff and students. It should be noted however that the power
of legislation (rule-making) in all academic matters can be exercised only after
consulting the Academic Council and its views are obtained.
3.6.4.2 The academic council:
The Academic Council is the principal academic authority of the university. All
decisions on programmes, courses, teaching methods, evaluation systems, academic
standards, creation of new departments, etc fall within the purview of the Academic
Council. However, as we have said in the previous section, the scheme of university
management envisages a sharing of powers and authority between the External
Council and the Academic Council, with the former enjoying a slight edge over the
latter. The Academic Council is essentially a body comprising the academics of the
university. It is chaired by the Vice-Chancellor and consists of the Pro-Vice-
chancellor(s), all Deans, all Heads of Departments, representatives of the Heads of
affiliated institutions and colleges, and representatives of all categories of teachers
both from the Department and the affiliated institutions, and in several cases also of
representatives of students. Depending upon the 250 members where the number of
teachers is large, representation is provided normally through the method of election,
and where the number of teachers is small, a system of nomination or rotation is
followed: The important functions of the Academic Council are: 'laying down the
academic policies of the university; supervision of the academic policies and giving
directions on methods of instruction, evaluation of research and improvements in
academic standards; inter-faculty coordination for joint projects, programmes, etc.;

139
recommending statutes/ordinances concerning academic matters like establishment of
departments, laboratories, research centres, committees for admission and
examination, qualification of teachers, award of degrees, diplomas and other
qualifications, conduct of examinations, institution of scholarships and fellowships,
student fees, etc. Generally, the universities will also have a set of academic
regulations that provide for procedures to be followed in various matters like
admission, examination, declaration of results, etc. These regulations are also framed
by the Academic Council. To the extent statutes/ordinances/regulations are internal
legislations, they require the approval of the Executive Council. As knowledge
expands, and the number of disciplines and specialisations within them multiply, it
becomes difficult for large bodies like the Academic Council to usefully devote
attention to all the academic problems of all the disciplines. As a measure of
decentralisation of the academic decision - making processes, most universities have
constituted faculties or schools to take care of these problems leaving the Academic
Council only to exercise a broad supervisory function. The Faculties/Schools
generally comprise related or cognate departments and subjects and function with a
broad measure of autonomy. Usually, a Faculty/School consists of the discipline or
subjects assigned to it by the Academic Council and consists of the Dean, all
Professors in the Faculty, all Heads of Departments, representatives of different
categories of teachers (Readers and Lectures), representatives of teacher from other
faculties, and a small number of external experts. The major functions of the
Faculty/School are: coordination of teaching and research in the departments assigned
to the faculty; promotion of inter-disciplinary teaching and research; prescribing
courses of study and their syllabi; appointment of Boards of Studies and Committees
for undertaking research projects; recommending the scheme of examinations and the
140
methods of assessment of student performance. The Faculties consisting of the
members mentioned above generally function as the Boards of Studies in the
concerned disciplines. Wherever new programmes and courses are proposed, the
recommendations of the Faculty/School go to the Academic Council for approval
ratification. In that sense, the Faculty/School should be considered as a sub-system of
the Academic Council with no independent authority or power of its own.
3.6.4.3 The court (senate):
The structure of governance described above is the pattern that has emerged in the last
three decades or so in India. Prior to that, most universities in the country had a Court
(for Central Universities) and Senate (for State Universities). This body was the
complexity in the functioning supreme authority of a university. It worked in the older
days, but with the growing of universities, there has been a review and reformulation
of the composition, functions and powers of this body. Traditionally, the Court Senate
consisted of a cross section of the academic community (teachers, administrations and
students) and representatives of different sections of the general community outside
the university (legislators, civil servants, representatives of business/industry, the
learned professions, former students, and so on). All decisions taken by organs of the
university were subject to ratification by this body. Over a period of time, this practice
became difficult to follow as Court's ratification of all decisions could not be taken for
granted. Where the Courts disapproved decisions, friction followed and the smooth
functioning of the university became impossible. Nevertheless, the significance of
such a body, consisting as it does, of a cross section of the larger society and members
of the university community were not lost sight of. After all, a university existed for
the society, and the needs, requirements and aspirations of that society should find
fulfilment in the activities of the university. A body like the court (senate) did
141
precisely that: on the one hand, it reflected the society's expectations through the
member‘s opportunity to the university community to inform the general society
about its policies, programmes and problems. This function of building bridges, of
reviewing programmes and policies on the basis of informed views and making them
responsive to social needs was considered a vital function for the management of the
university.
In recognition of this role, the Court (Senate) in later legislations were designated as a
'deliberative' body reviewing policies and programmes, making suggestions for
improvements and development, and to express views on the overall performance of
the university on the basis of its annual performance reports. With this major change
in its powers and functions, the Court (Senate) continues to be a body provided in the
Acts of most Universities in the country. Their composition as indicated above also
remains more or less unchanged. With this change in the functions and powers of the
Court (Senate), it is no more saddled with the burden of having to over-rule decisions
of the university. For that reason, some of the more recent legislations have altogether
dispensed with the provision to constitute a Court (Senate) for universities established
under them.
3.6.4.4 Finance committee:
All universities have Finance Committees which prepare the budget, set the ceilings
of expenditure and manage the university fund. It decides on investment of funds
which are not required for immediate expenditure, considers and recommends
purchases of equipment and stores, construction of buildings, considers and makes
recommendations on the annual accounts, and so on. The Finance Committee of a
University is not an independent decision-making body. It can only make
recommendations on financial matters to the Executive Council which alone can take
142
decisions on them. Some Acts provide that certain matters which involve continuing
financial commitments like creation of new positions and revision of pay scales
should not be considered by the Executive Council unless the Finance Committee has
considered them in the first place, and made its recommendations. The Finance
Committee is chaired by the Vice-Chancellor. But its most important members are the
nominees (mostly officers) of the government which provide the finances. There are,
in addition, one or two members of the Executive Council and one or two external
members on the Finance Committee. In actual practice, however, the nominees of the
funding agencies play a dominant role in the proceedings of the Finance Committee.
3.7 The People Who Manage the Universities:
In the previous sections, we have looked at the corporate structure of the university,
and the powers and functions of its decision-making bodies; by their very nature,
these bodies cannot be expected to run the day-to-day affairs of the university and to
remain responsible and accountable for all that it does. This responsibility vests with
the officers of the university. We shall now consider who these people are, how they
are appointed and what functions they perform in the management of the university.
3.7.1 The Visitor Chancellor:
We have seen in the previous unit that the state performs a broad supervisory function
over the universities it has set up. However, in the exercise of this supervisory
function, an effort is made to distance the political executive from the university
management. This objective is achieved by vesting the supervisory function with the
Head of State, President of India in the case of Central Universities and Governors of
States in the case of State Universities. The University legislations make these
provisions. The Visitor Chancellor performs the following functions:
appointment of the Visitor Chancellor,
143
nomination of the specified number of members on the Executive Council of
Syndicate,
approval/disapproval of statutes and ordinances or amendments to them,
institution of inquiries into mismanagement, if any
adjudication of appeals against the decisions of the university which are
perceived to be in violation of the university law.
These functions are vested in an authority outside the university to ensure objectivity
and fairness in their performance. Distancing the political executive from the
processes associated with the performance of these functions strengthens this view.
Nevertheless, to the extent that the Head of State has to perform his or her functions
on the advice of the Council of 94. Ministers, the distance remains more symbolic
than real. At any rate the Visitor Chancellor cannot be conceived as officers of the
university in the sense that they belong to the category of people who manage the
universities. Then, who are the real managers? We shall now turn to them.
3.7.2 The Chancellor
The Central Universities have a statutory office of Chancellor who is the head of the
University. An eminent person in public life is appointed to this office by the Visitor
on the recommendation of the Executive Council. He presides over the meetings of
the court and the convocations of the university. He is not vested with any other
functions or powers. The State Universities do not have a corresponding statutory
office. The Governor, who is the Chancellor, also performs these roles. To that extent,
he is deemed to be an officer of the university. This duality in the role of the
Chancellor's office in State Universities has often caused considerable ambiguity and
confusion.
144
3.7.3 The Vice-Chancellor
The vice-chancellor is the administrative and academic head (Chief Executive
Officer) of the university. He/she is actually a scholar administrator. He or she is the
keeper of the university's conscience, as mentioned in the University Education
Commission Report 1948-49. And as stated by the Kothari Commission (1964-68),
he/she should be committed to the universities pursuit of scholarship and of truth. He
or she has a crucial role to play in the successful functioning of the university. The
term of appointment of a vice- chancellor is generally for a period of three years in
most of the state universities and five years in central universities. In a few states, it is
four years. It is seldom that a Vice Chancellor gets a second term. The main functions
of a vice-chancellor of a university are the following:
The vice-chancellor is ex-officio the Chairman of the Executive Council
(Syndicate or Board of Management) and the Academic Council as well as the
Finance Committee and other statutory bodies like Planning Board and
Selection Committees.
As the Chief Executive, he or she is responsible for ensuring that the
university functions in accordance with the provisions of the Act, statutes,
ordinances, and regulations.
He she is responsible for ensuring discipline among teachers, staff and
students.
In an emergency, he she can exercise any power of any authority and report
the matter to the authority concerned for ratification of the decision.
He she can delegate his powers to other officers.
The vice-chancellor of Indian universities is appointed by the Visitor/Chancellor from
a panel of names recommended by a Committee of eminent persons specially

145
constituted for this purpose. These committees normally have three members - two
nominated by the Execution Council, and one by the Visitor Chancellor. The
Committee recommends a panel of three or more persons from whom the Visitor
Chancellor selects one. Generally, the person to be appointed is recommended by the
Government to the Visitor Chancellor.
3.7.4 The Pro-Vice-Chancellor / Rector
The Pro-Vice-Chancellor/Rector is the second level executive officer in a
university, who is appointed by the Executive council on the recommendations of the
vice-chancellor. In most cases he or she is selected from amongst the senior
Professors of the University though appointments from outside the university are also
possible. He or she exercises the powers and performs the duties that are prescribed
by the university or delegated by the vice-chancellor. The term of office of the
PVC/Rector is generally laid down by the Executive Council. It is normally three
years and is co-terminus with the term of office of the vice-chancellor. The Rector is
expected to share the responsibilities of the vice-chancellor in the areas assigned to
him/her. He/she also officiates for the vice-chancellor when the latter is either away
from the headquarters on official business or on leave. Hence, the prime function of
the Rector is a kind of partnership with the vice-chancellor to ensure the effective
functioning of the university.
3.7.5 The Deans
Dean of Faculty is the Head of the faculty and is responsible to the Vice- Chancellor
for the organisation of the teaching and research programmes as well as maintenance
of the standards of teaching, research and extension functions in the faculty. A Dean
is normally appointed from among the Professors in the Departments that comprise

146
the faculty for a period of 2-3 years through a system of rotation according to
seniority.
3.7.6 The Registrar
The position of Registrar who is the head of the administrative wing of a university is
a key position. He leads the university's civil service, is the custodian of all university
records, and represents the university in all its dealings with the outside world. He is
ex-officio, the Secretary of all the statutory bodies of the university, issues notices for
their meetings, prepares the agenda, and also the minutes of the meetings. These key
functions of the Registrar enable him/her to occupy a position of pre-eminence in the
university management. He is privy to all discussions at the meetings of the various
bodies, and has easy and quick access to all records which together96 make him /her
most knowledgeable person as far as the university management is concerned. For
that reason, he/she is in a position to render useful advice to the vice-chancellor and
members of various authorities. The Registrar is normally appointed by the Executive
Council (Syndicate) on the recommendation of a Selection Committee presided over
by the vice- chancellor. Once appointed, he/she holds office till retirement. However,
in recent times, appointment to this office is also being made for short tenures of 5
years at a time. Although this method of appointment continues to be in vogue in
several universities, the State Governments in some cases have taken over the
responsibility for appointment of Registrars. Where, in a state, there are several
universities, a system of transfer of the Register from one university to another is also
in vogue.
3.7.7 The Finance Officer:
The Finance Officer is the manager of the University's funds and properties. The
financial management practices in the universities in India were traditionally confined
147
to judiciously managing the expenditure since the largest single source of income was
95% of the total income. This required proper preparation of the grants given by the
government almost 90- budget, setting the ceilings for every item of expenditure, and
ensuring that the expenditure did not exceed the ceilings. The pre-occupation of
university Finance Departments was thus more on accounting and monitoring the
observance of procedures than mobilising resources and managing the finances. Since
the Finance Officer was a key functionary in university management, and was
responsible mainly for managing government funds, an officer from the government
used to be appointed on deputation to this position by the universities. In recent times,
some state governments have taken it upon themselves to appoint the finance officer
who then was not an employee of the university. Though this practice amounted to the
university's loss of the freedom of choice of its Finance Officer, given the dependence
on the state for funds, it had to go by the wishes of the government. (Annual Report,
Ministry of Human Resource Development, 2006-2007).
3.8 Conclusion:
There is no clear consensus on the overarching purpose of higher education with it
being a ―contested issue because [it] underpins academic values‖ (Watty, 2006: 26).
Kapur and Crowley (2008: 87) point out: ―Indeed, what is striking about higher
education is the weakness of the analytical frameworks on even the most fundamental
questions: what is the purpose of higher education? To train people for a labour force
or train a labour force that is in turn trainable by employers? To create a middle class?
Is the goal of higher education to provide a ladder for social mobility or create
national elites? To influence and mould the minds of young people‖? The answer, ―all
of the above‖, merely shifts the analytical burden.‖ The foundational principles of
higher education in the United States (US) were related to ―public benefits and civic
148
virtues, in addition to the economic gains achievable by individual students‖. The
founders of Yale University in the early eighteenth century saw their task as preparing
youth for public employment in the church and the state. Thomas Jefferson in
establishing the University of Virginia saw his task as training America‘s aristocracy
for national positions of leadership (Bloom, Hartely and Rosovsky, 2007). Research
undertaken by UNESCO poses the question: ―Is the role of universities limited to
technical skills or do they have a role in shaping and modelling behaviour to shape
particular student attitudes?‖ (Burnett, 2007: 288) Heuser (2007) answers
affirmatively. He believes that whilst there will be variation between different higher
education institutes, all of them should place a priority on forming the ―professional
and attitudinal values‖ of students whilst they are pursuing higher education. Barnett
(2009a and 2009b cited in Watty, 2006) refers to dominant and marginal perceptions
of higher education. The dominant perceptions are those that are systems-based with
an external purpose focussed on the provision of skilled people for the labour market;
whilst marginal perceptions look at the internal purpose of the education process
focussing on the development of individual students‘ attitude, values and behaviour.

149
CHAPTER-4
AN OVERVIEW OF THE PRIVATE UN-AIDED B-
SCHOOLS OF MAHARASHTRA
150
CHAPTER-4
AN OVERVIEW OF THE PRIVATE UN-AIDED B-SCHOOLS OF
MAHARASHTRA
4.1 Introduction to Business Management Education:
Indian business management educational landscape as well as the global has become
increasingly turbulent. Competition is much stronger than before; more b-schools are
joining the market. Changing management education landscape, nationally and
globally, has encouraged the development of a market culture among business
schools. B-schools are now in a position where they have to compete for scarce
resources such as finances. To survive in this competitive environment, institutions
must have an advantage. This means that a business management institution must
provide its target market with more value than its competitors.
In a churning global marketplace, understanding the fundamental connections
between business, the environment, and society has become essential. The roles and
responsibilities of business as a global force are becoming more urgent and complex,
and concepts related to societal responsibility and sustainability are gaining
recognition as essential elements in business management. Increasing complexity and
interdependence require new approaches. Companies need integrative management
tools that help embed environmental, social, and integrative management tools that
help embed environmental, social, and governance concerns into their strategic
thinking and daily operations. They need support as they internalize and integrate
these issues into the core of businesses, engage in dialogue with stakeholders, and
report their conduct. They require talented and ethical leaders who can not only
151
advance organizational goals and fulfil legal and fiduciary obligations to shareholders,
but who are also prepared to deal with the broader impact and potential of business as
a positive global force in society. Any meaningful and lasting change in the conduct
of corporations toward societal responsibility and sustainability must involve the
institutions that most directly act as drivers of business behaviour, especially
academia. Academic institutions help shape the attitudes and behaviour of business
leaders through business education, research, management development programs,
training, and other pervasive, but less tangible, activities, such as the spread and
advocacy of new values and ideas. Through these means, academic institutions have
the potential to generate a wave of positive change, thereby helping to ensure a world
where both enterprises and societies can flourish. The Management programmes help
aspiring managers to become effective decision makers in their fields through up
gradation of knowledge and managerial skills. The programme broadens the overall
perspective of the students so that they can become catalysts for change. It develops
conceptual, interpersonal and management awareness for implementation of new
structures and strategies. It also improves managerial effectiveness and prepares
managers for more senior positions. Management education trains candidates to
resolve conflicting business issues, asked to take management decisions and see the
business effects of such decisions, soon thereafter. Candidates learn to win and in
seeking to win they imbibe new forms of competitive behaviour that are ideal for
today‘s highly chaotic business conditions. The competition urges students to learn
willingly and enhance the pace of learning. The excitement of managing a company
from top downwards ensures that the learning elements are retained with candidates
longer. Management education is specifically designed to develop the business
decision- making skills of managers. Conflicting situations induce the students to take
152
decisions under predetermined criteria. These situations closely resemble business
events and are indistinguishable from real life events. For the candidates, the objective
of learning is to understand complex business situations and solve problems. They
learn to take operative and strategic decisions. Competition enhances their abilities
not merely to survive, but also to emerge as leader, for their organisations. A major
learning gain is that they learn to cooperate with each other and work in teams.
Besides integrating subjects the use of simulation demonstrates the complexity of
business in terms of the dynamic interactions between functions, products and
markets. The pedagogy of Management education provides an opportunity to test
understanding and organise knowledge in a competing environment. In the era of
Globalization, students of Management will have to develop skills of quick learning
and equally quick decision making. As Managers, one will be exposed to business
without physical boundaries of the nations.
4.2 Present Situation of Business Management Education in Maharashtra
Today managers are in great demand in every sector of economy. Maharashtra needs
a huge reservoir each year of people who are trained for business and for management
and demands is to last for coming years. But it is matter of concern whether the
demand is for what they have been taught. In management education, quality has
become a necessity. To make Maharashtra an intellectual capital of the world, we
have to create a dynamic environment, which can encourage superior quality
management education colleges and effort should be made to breathe life into
management education.
P.T.O

153
4.3 Growth and Meaning of Un-Aided Private B-Schools of Maharashtra:
Universities
Higher education in India has evolved in distinct and divergent streams with each
stream monitored by an apex body, indirectly controlled by the Ministry of Human
Resource Development and funded by the state governments. In India, most
universities and nearly all research institutions are public. There are some private
undergraduate colleges (mostly engineering schools) and the majority of these are
affiliated to a public university. Few others private colleges are partially-aided by the
state and central governments.
Table: 2 Bifurcations of Universities in India
TYPES OF INSTITUTIONS
NUMBER
NUMBER
State Universities 243
State Private Universities 53
Central Universities 40
Deemed Universities 130
Institutions of National Importance
(Under Acts of Parliament)
33
Institutions establishes under State
legislations
5
Total 504
Other Colleges 25,951
SOURCE: MHRD Annual Report, 2009-10
154
As of March 2009, there are 504 higher education institutions and 25,951 other
colleges in India. Most of these educational institutions need recognition by a
competent body / regulatory authority that are supported by the Government of India,
State Governments or by Societies. The universities of India can be classified in
various categories like Central Universities, State Universities, Deemed Universities,
Private Universities, Agricultural universities, National Institutes of Importance and
Open Universities. Out of which 243 institutions are State Universities; 53 institutions
are State Private Universities; 40 Central Universities; 130 are the Deemed
Universities; Under Acts of Parliament 33 are Institutions of National Importance
while 5 institutions are established under State legislations. Since the State
Governments establish and plan for the colleges and universities in the states and the
Central Government does it for the Central Universities, it is essential that there is
adequate cooperation between the State Governments and the Central Government in
the field of higher education. The Central Advisory Board of Education (CABE) has
therefore been constituted to assist in the functioning of the two Governments and
ensure that parity is maintained. (Dhopte, 2011)
Regulatory System
The University Grants Commission of India (UGC) is a body of the central
government that provides support to the government-recognized universities and
colleges with funds. The University Grants Commission of India provides recognition
to the universities in India.
The All India Council for Technical Education (AICTE) is a body that is involved
in the systematic planning and organized development of the technical education
155
system in the country. Presently there are a total of 1,346 engineering colleges all over
India, which have been approved by the All India Council of Technical Education.
Other Statutory Authorities like BCI, MCI, DGCA, ICAR, VCI etc. are catering
specific specialized areas. These agencies issue licenses, regulate standards, conduct
inspections and control curriculums.
The Director General of Employment and Training (DGET) under Ministry of
labour & employment is granting affiliation to ITIs and ITCs. NCVT is granting
affiliation to trades/units of ITIs/ITCs.
At present, educational institutions in India can be set up only by trusts, societies or
companies. Under Section 25 of the Companies Act 1956, the government is
planning to permit corporate houses to set up higher educational institutions — like
multi-disciplinary universities and colleges — by floating a separate not-for-profit
entity. A not-for-profit entity is one that does not distribute its surplus funds to owners
or shareholders. It, instead, reinvests these in the institute. Many private universities
in India have been set up under Section 25 of the Companies Act. However, deemed
universities are not covered by the Act. Section 25 of the Act, on the other hand,
comes under the Central Board of Direct Taxes, thus reinforcing the control of the
Centre and not the state over the manner in which the institutions are run and
financed.
The private sector is strong in Indian higher education. This has been partly as a
result of the decision by the Government to divert spending to the goal of
universalisation of elementary education. State universities and colleges are funded by
the respective states. There are also some other sources of funding. Self-financed or
private universities are not common in India although many colleges are financed by

156
non-governmental sources. Only universities established or incorporated by or under a
Central Act, Provincial Act or State Act, an institution deemed to be a University
under Section 3 of the University Grants Commission Act or an institution specially
empowered by an Act of Parliament have the right to confer degrees in India.
A business school is normally a university-level institution that teaches topics such
as accounting, finance, marketing, organizational behaviour, strategic planning,
quantitative methods, etc. These include schools of "business", "business
administration", and "management". It must also make students aware of application
software such as ERP, POS, Simulation, SCM & logistics. In addition to this they
must also get to learn of the actual running of an enterprise. A business School is an
entity by itself and cannot be run as a department of a technical school now. Business
school must have a branding and that can come from the quality of teaching and their
richness. The alumni bring prestige to the school. Placement is a sequel to quality of
teaching staff and education provided in the school.
The education sector has changed a lot and as such numerous b-schools have come up
in the recent times. In respect of colleges, one can come across various kinds like
government, self-financing, aided and unaided B-Schools. It is with the advent of
globalization that aided and unaided B-Schools have now dominated the education
sector.
“Un-aided Management Institute‖ means an institute which is run by a private
management without the support of any grants from the State or the Central
Government.
The growth of industries in the Country, just after independence, also demanded the
need for qualified professionals in other fields, such as Business Management,
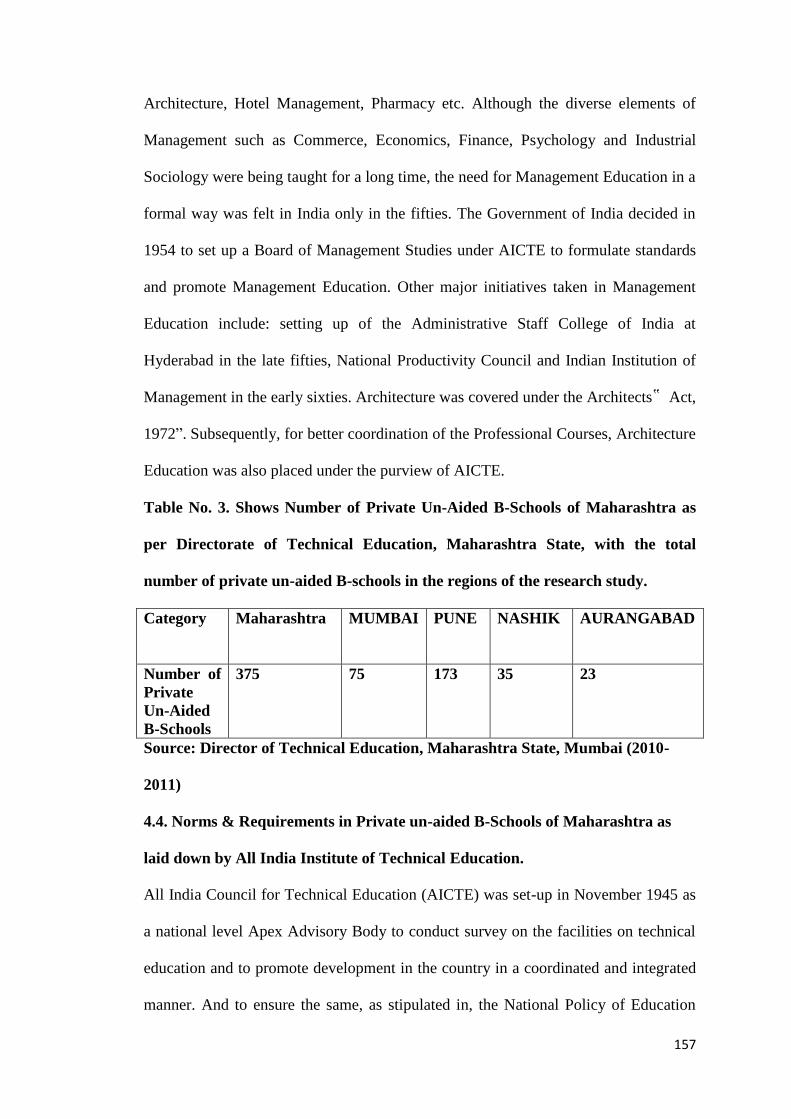
157
Architecture, Hotel Management, Pharmacy etc. Although the diverse elements of
Management such as Commerce, Economics, Finance, Psychology and Industrial
Sociology were being taught for a long time, the need for Management Education in a
formal way was felt in India only in the fifties. The Government of India decided in
1954 to set up a Board of Management Studies under AICTE to formulate standards
and promote Management Education. Other major initiatives taken in Management
Education include: setting up of the Administrative Staff College of India at
Hyderabad in the late fifties, National Productivity Council and Indian Institution of
Management in the early sixties. Architecture was covered under the Architects‟ Act,
1972‖. Subsequently, for better coordination of the Professional Courses, Architecture
Education was also placed under the purview of AICTE.
Table No. 3. Shows Number of Private Un-Aided B-Schools of Maharashtra as
per Directorate of Technical Education, Maharashtra State, with the total
number of private un-aided B-schools in the regions of the research study.
Category Maharashtra MUMBAI
PUNE NASHIK AURANGABAD
Number of
Private
Un-Aided
B-Schools
375 75 173 35 23
Source: Director of Technical Education, Maharashtra State, Mumbai (2010-
2011)
4.4. Norms & Requirements in Private un-aided B-Schools of Maharashtra as
laid down by All India Institute of Technical Education.
All India Council for Technical Education (AICTE) was set-up in November 1945 as
a national level Apex Advisory Body to conduct survey on the facilities on technical
education and to promote development in the country in a coordinated and integrated
manner. And to ensure the same, as stipulated in, the National Policy of Education
158
(1986), AICTE be vested with statutory authority for planning, formulation and
maintenance of norms and standards, quality assurance through accreditation, funding
in priority areas, monitoring and evaluation, maintaining parity of certification and
awards and ensuring coordinated and integrated development and management of
technical education in the country.
The purview of AICTE (the Council) covers programmes of technical education
including training and research in Engineering, Technology, Architecture, Town
Planning, Management, Pharmacy, Applied Arts and Crafts, Hotel Management and
Catering Technology etc. at different levels.
4.4.1. Approved Nomenclature of Post Graduate (PG) in Management Courses
The list (Refer: Annexure II) covers approved nomenclature for the current academic
year. If any Institution / University wish to propose any new course, prior
concurrence, by the Council for the same shall be necessary. For such concurrence,
Technical Institution, with due endorsement by the Registrar of affiliating
University/Board shall submit detailed syllabus content and its nomenclature to the
Council. Provided that if any Institution wishes to propose any new Course, prior
concurrence, as the case may be, by the Council for the same shall be necessary.
For such concurrence, Registrar of such affiliating University / board or Technical
Institute, with due endorsement by the Registrar of affiliating University / Board shall
submit detailed syllabus content and its nomenclature to the Council.
The Technical Institutions shall follow Norms for Intake & Number of Courses /
Divisions in the Technical Institution at Post Graduate Degree Program, Diploma
Programs, Post Diploma Programs and Post Graduate Diploma Programs level as
given below in Table.
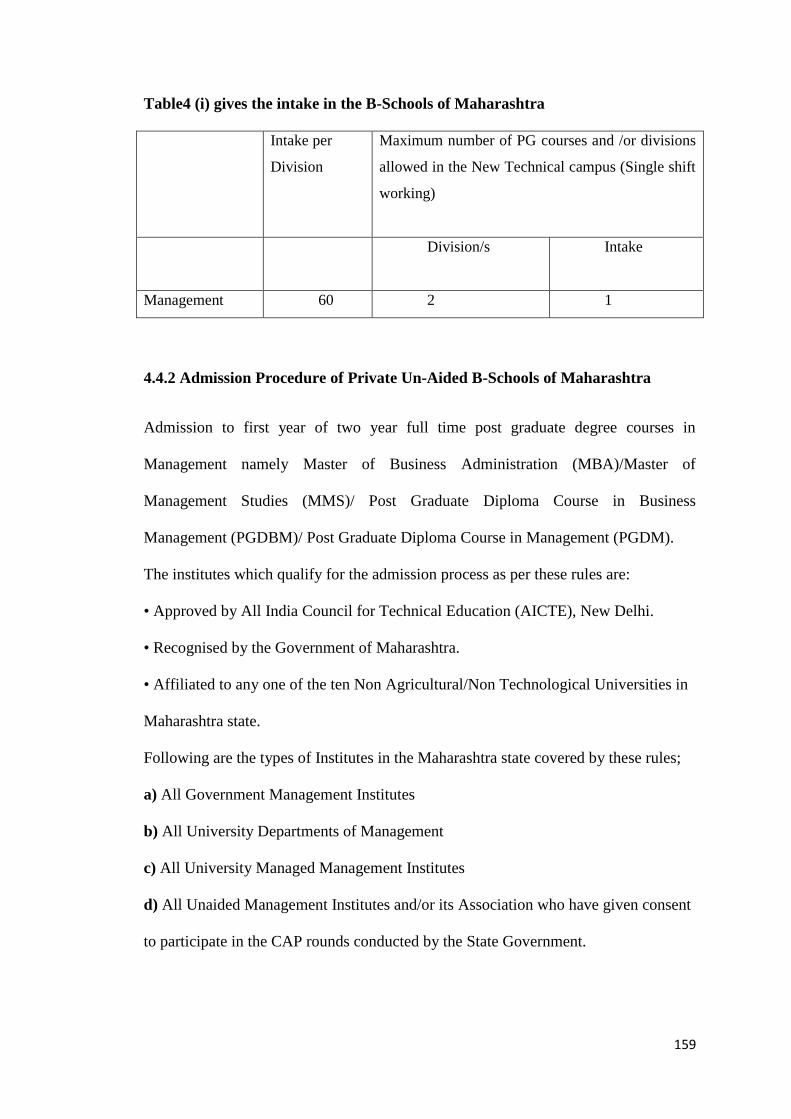
159
Table4 (i) gives the intake in the B-Schools of Maharashtra
Intake per
Division
Maximum number of PG courses and /or divisions
allowed in the New Technical campus (Single shift
working)
Division/s
Intake
Management 60 2 1
4.4.2 Admission Procedure of Private Un-Aided B-Schools of Maharashtra
Admission to first year of two year full time post graduate degree courses in
Management namely Master of Business Administration (MBA)/Master of
Management Studies (MMS)/ Post Graduate Diploma Course in Business
Management (PGDBM)/ Post Graduate Diploma Course in Management (PGDM).
The institutes which qualify for the admission process as per these rules are:
• Approved by All India Council for Technical Education (AICTE), New Delhi.
• Recognised by the Government of Maharashtra.
• Affiliated to any one of the ten Non Agricultural/Non Technological Universities in
Maharashtra state.
Following are the types of Institutes in the Maharashtra state covered by these rules;
a) All Government Management Institutes
b) All University Departments of Management
c) All University Managed Management Institutes
d) All Unaided Management Institutes and/or its Association who have given consent
to participate in the CAP rounds conducted by the State Government.
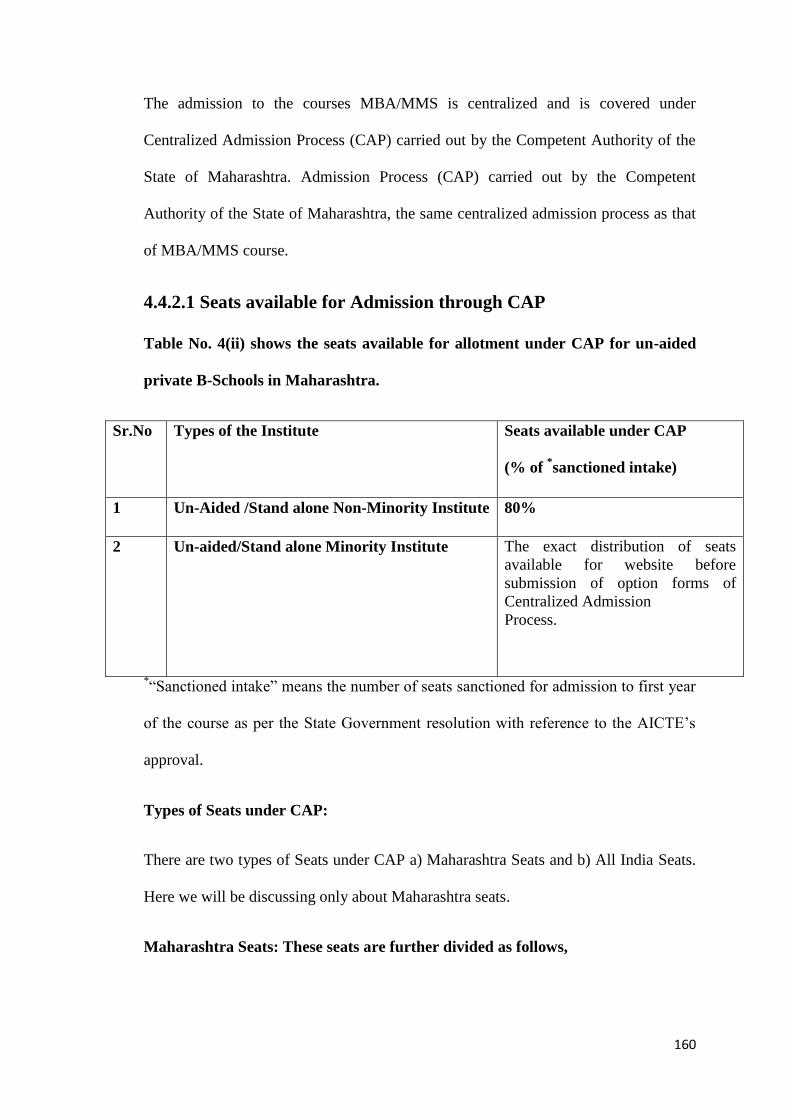
160
The admission to the courses MBA/MMS is centralized and is covered under
Centralized Admission Process (CAP) carried out by the Competent Authority of the
State of Maharashtra. Admission Process (CAP) carried out by the Competent
Authority of the State of Maharashtra, the same centralized admission process as that
of MBA/MMS course.
4.4.2.1 Seats available for Admission through CAP
Table No. 4(ii) shows the seats available for allotment under CAP for un-aided
private B-Schools in Maharashtra.
Sr.No Types of the Institute Seats available under CAP
(% of *sanctioned intake)
1 Un-Aided /Stand alone Non-Minority Institute 80%
2 Un-aided/Stand alone Minority Institute The exact distribution of seats
available for website before
submission of option forms of
Centralized Admission
Process.
*―Sanctioned intake‖ means the number of seats sanctioned for admission to first year
of the course as per the State Government resolution with reference to the AICTE‘s
approval.
Types of Seats under CAP:
There are two types of Seats under CAP a) Maharashtra Seats and b) All India Seats.
Here we will be discussing only about Maharashtra seats.
Maharashtra Seats: These seats are further divided as follows,
161
1. Home University (HU) seats: Certain percentage of seats of every institute is
reserved for Home University i.e. for the University under the jurisdiction of which
that institute is located. Home University seats are available for allotment through
CAP only for the Maharashtra candidates having their Home University status as of
that University.
2. Other than Home University (OHU) Seats: Certain percentage of seats of every
Institute is reserved for Other Universities i.e. for the Universities other than the
University under the jurisdiction of which that institute is located. Such seats are
called as OHU seats. OHU seats of an Institute are available for allotment through
CAP only for the Maharashtra candidates belonging to Universities in Maharashtra
State other than the University under the jurisdiction of which that institute is located.
Candidates can opt for the seat of any other University (excluding his/her home
university) under this provision of OHU seats.
Statutory reservations for candidates belonging to backward class categories as per
the relevant rules and resolutions of the Government of Maharashtra will be
applicable for admissions against the Maharashtra seats available only to the
candidates of backward class categories belonging to Maharashtra State. In Unaided
Minority Institutes, there is no reservation for backward class category candidates;
however reservation for backward class candidates can be implemented under CAP
provided that the management of the institute gives the written consent.
4.4.2.2 Eligibility Criteria:
Basic Qualification: In order to secure admission to first year of two-year full time
MBA/MMS/PGDBM/PGDM course, the candidate should fulfil the following
eligibility criteria:

162
Passed with minimum of 50% marks in aggregate* ( 45% in case of candidates of
backward class categories belonging to Maharashtra State only) in any Full Time
Bachelor‘s degree of minimum three years duration in any discipline recognised by
the Association of Indian Universities
OR
Appeared** for the final year examination of any Full Time Bachelor‘s degree of
minimum three years duration in any discipline recognised by the Association of
Indian Universities. Such candidates can be considered for provisional admission
subject to passing the Degree exam with minimum of 50% marks in aggregate* (45%
in case of candidates of backward class categories belonging to Maharashtra State
only).
Eligibility Criteria for admission to Maharashtra State candidates
1. Candidate should be an Indian National and should possess basic qualification.
2. Scored 30 or more marks in the MAH-MBA/MMS-CET 2010 and appeared for the
GD & PI conducted by the Competent Authority of the Maharashtra State for the
academic year 2010-11.
4.4.2.3 Assignment of merit number:
Merit Number:
Maharashtra State Seats: Each Maharashtra State candidate who has secured 30
marks or more in the MAH-MBA/MMS-CET 2010 and appeared for the GD &
PI will be assigned a State level Merit Number, a Home University area Merit
number, Category merit no. (As applicable) etc.
4.4.2.4 Age limit:
There is no age limit for admission to first year of two year post graduate course in
Management viz. MBA / MMS / PGDBM / PGDM.
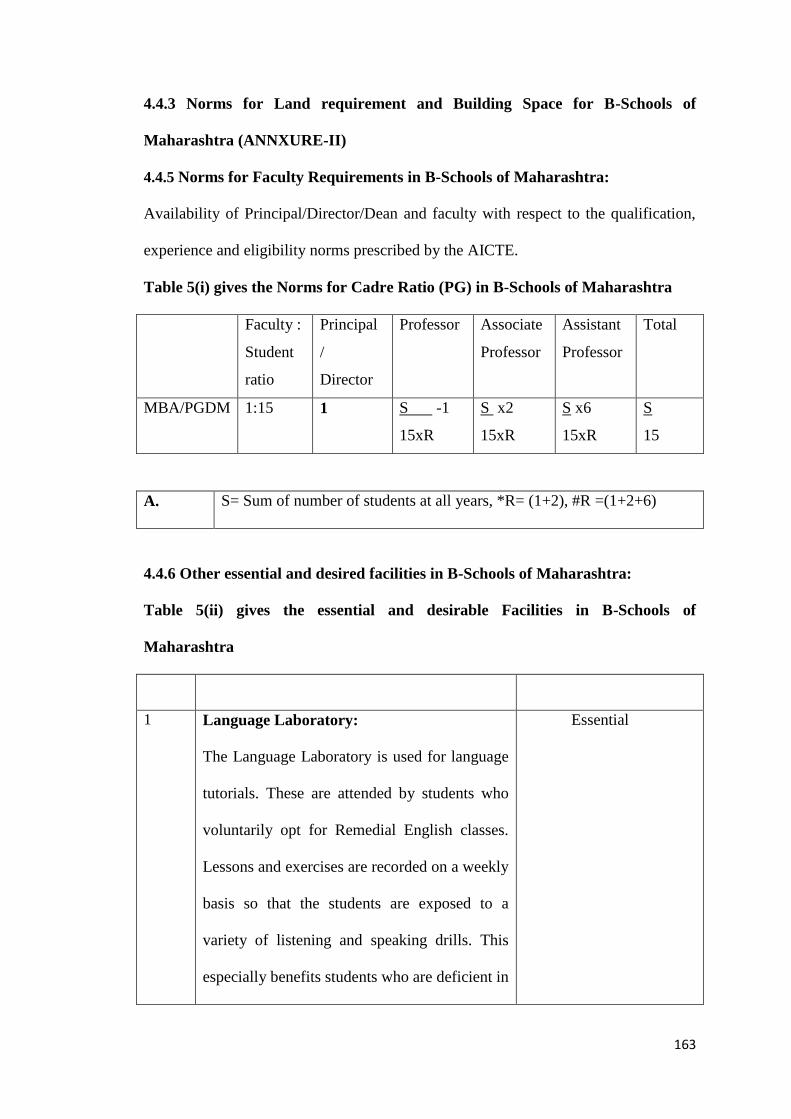
163
4.4.3 Norms for Land requirement and Building Space for B-Schools of
Maharashtra (ANNXURE-II)
4.4.5 Norms for Faculty Requirements in B-Schools of Maharashtra:
Availability of Principal/Director/Dean and faculty with respect to the qualification,
experience and eligibility norms prescribed by the AICTE.
Table 5(i) gives the Norms for Cadre Ratio (PG) in B-Schools of Maharashtra
Faculty :
Student
ratio
Principal
/
Director
Professor Associate
Professor
Assistant
Professor
Total
MBA/PGDM 1:15 1 S -1
15xR
S x2
15xR
S x6
15xR
S
15
A. S= Sum of number of students at all years, *R= (1+2), #R =(1+2+6)
4.4.6 Other essential and desired facilities in B-Schools of Maharashtra:
Table 5(ii) gives the essential and desirable Facilities in B-Schools of
Maharashtra
1 Language Laboratory:
The Language Laboratory is used for language
tutorials. These are attended by students who
voluntarily opt for Remedial English classes.
Lessons and exercises are recorded on a weekly
basis so that the students are exposed to a
variety of listening and speaking drills. This
especially benefits students who are deficient in
Essential
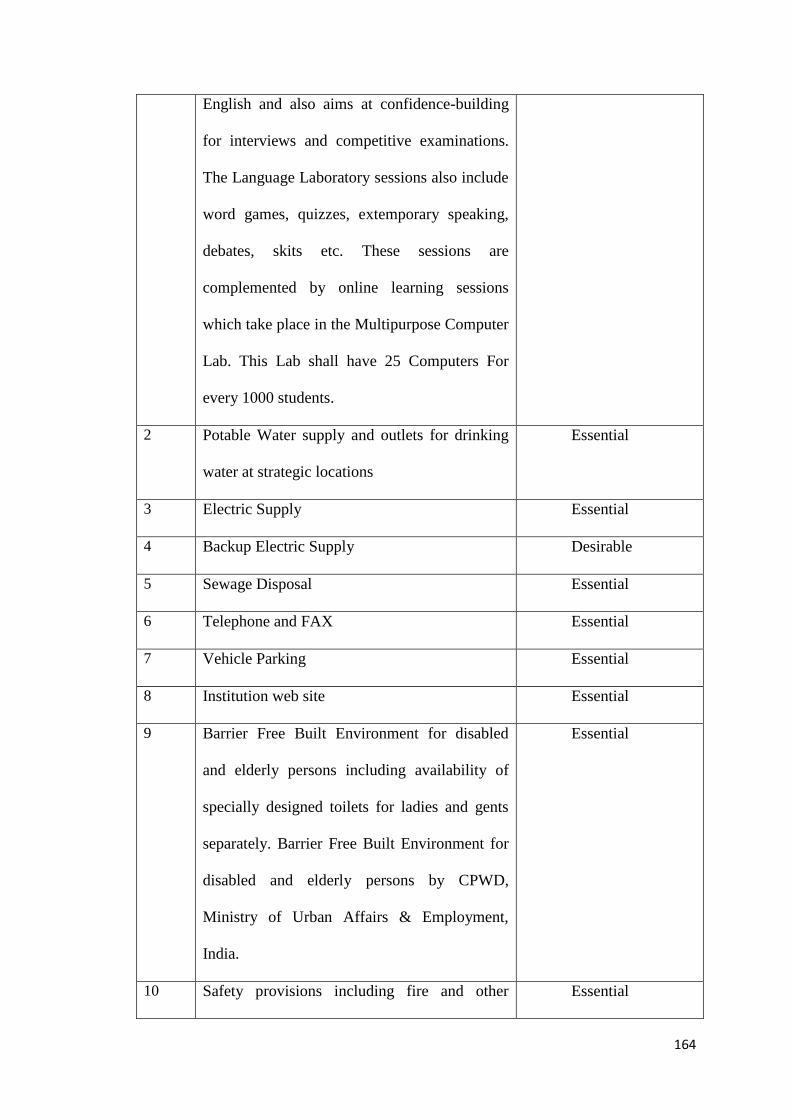
164
English and also aims at confidence-building
for interviews and competitive examinations.
The Language Laboratory sessions also include
word games, quizzes, extemporary speaking,
debates, skits etc. These sessions are
complemented by online learning sessions
which take place in the Multipurpose Computer
Lab. This Lab shall have 25 Computers For
every 1000 students.
2 Potable Water supply and outlets for drinking
water at strategic locations
Essential
3 Electric Supply Essential
4 Backup Electric Supply Desirable
5 Sewage Disposal Essential
6 Telephone and FAX Essential
7 Vehicle Parking Essential
8 Institution web site Essential
9 Barrier Free Built Environment for disabled
and elderly persons including availability of
specially designed toilets for ladies and gents
separately. Barrier Free Built Environment for
disabled and elderly persons by CPWD,
Ministry of Urban Affairs & Employment,
India.
Essential
10 Safety provisions including fire and other Essential
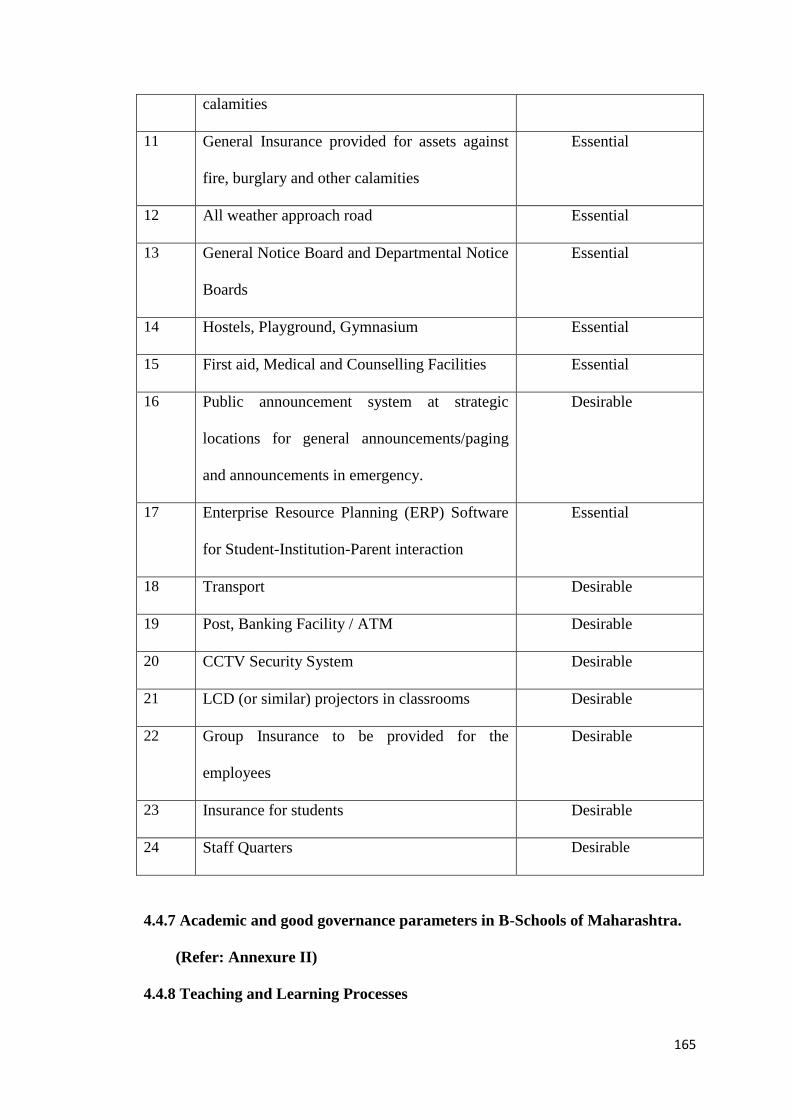
165
calamities
11 General Insurance provided for assets against
fire, burglary and other calamities
Essential
12 All weather approach road Essential
13 General Notice Board and Departmental Notice
Boards
Essential
14 Hostels, Playground, Gymnasium Essential
15 First aid, Medical and Counselling Facilities Essential
16 Public announcement system at strategic
locations for general announcements/paging
and announcements in emergency.
Desirable
17 Enterprise Resource Planning (ERP) Software
for Student-Institution-Parent interaction
Essential
18 Transport Desirable
19 Post, Banking Facility / ATM Desirable
20 CCTV Security System Desirable
21 LCD (or similar) projectors in classrooms Desirable
22 Group Insurance to be provided for the
employees
Desirable
23 Insurance for students Desirable
24 Staff Quarters Desirable
4.4.7 Academic and good governance parameters in B-Schools of Maharashtra.
(Refer: Annexure II)
4.4.8 Teaching and Learning Processes
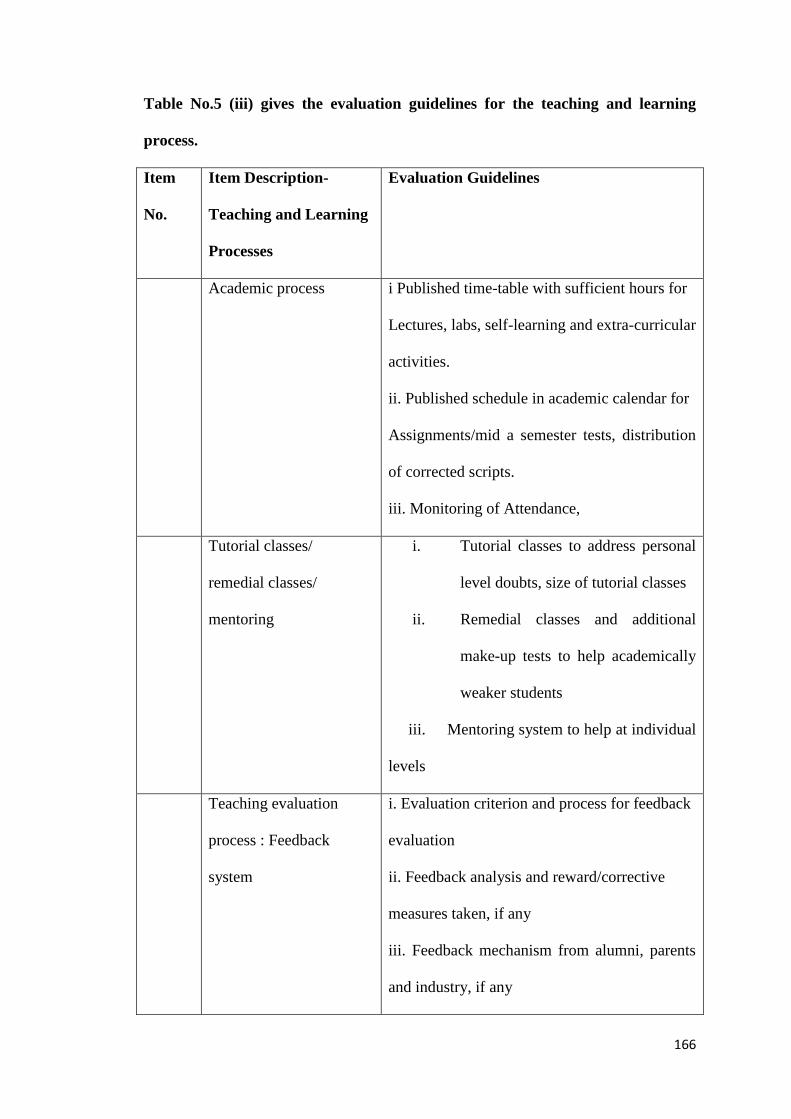
166
Table No.5 (iii) gives the evaluation guidelines for the teaching and learning
process.
Item
No.
Item Description-
Teaching and Learning
Processes
Evaluation Guidelines
Academic process i Published time-table with sufficient hours for
Lectures, labs, self-learning and extra-curricular
activities.
ii. Published schedule in academic calendar for
Assignments/mid a semester tests, distribution
of corrected scripts.
iii. Monitoring of Attendance,
Tutorial classes/
remedial classes/
mentoring
i. Tutorial classes to address personal
level doubts, size of tutorial classes
ii. Remedial classes and additional
make-up tests to help academically
weaker students
iii. Mentoring system to help at individual
levels
Teaching evaluation
process : Feedback
system
i. Evaluation criterion and process for feedback
evaluation
ii. Feedback analysis and reward/corrective
measures taken, if any
iii. Feedback mechanism from alumni, parents
and industry, if any

167
Self Learning and
Learning beyond
syllabus
i Flexibility in academics with scope for self
learning- provisions for advanced level and
reading courses.
ii. Generation of self-learning facilities, and
availability of materials for learning beyond
prescribed curriculum
iii. scope and mentoring mechanisms for
learning beyond prescribed curriculum
Career guidance,
Training, placement
and Entrepreneurship
cell
i. Assessment : Effectiveness, Efficiency and
Productivity
ii.Career guidance services including
counselling for higher studies
iii. Training and placement facility with
training and placement officer (TPO), industry
interaction for training/internship/placement.
iv. Entrepreneurship cell and incubation facility
Co-curricular and
extracurricular
activities
i.Co-curricular and extra-curricular activities,
e.g., NCC/ NSS, cultural activities etc.
ii. Sports grounds, facilities and qualified sports
instructors
4.4.9 Quality of Faculty & Supporting Technical Staff in B-Schools of
Maharashtra

168
Table No.5 (iv) gives the evaluation guidelines for the teaching and non-teaching
staff of private un-aided B-Schools of Maharashtra.
Item
No.
Item
Description
Evaluation Guidelines
Performance
Appraisal
i. Evaluation of Teachers by Authorities
ii. Feedback mechanism and Evaluation of
Teachers by Students
iii. Online and web based regular feed back
mechanism
iv. Mid course corrections
v. Analysis of feedback and implementation of
corrective measures
Faculty
Development
Initiatives
i. Organization participation in seminars/
conferences etc.
ii. Research Grant
iii. Career path
iv. Whether sabbatical provided
v. Other service benefit
vi. Whether faculty adequately provided financial
and administrative and Professional development
allowances / support
vii. International conferences
viii. Reward /recognition for journal publication /
patents
ix. Support for quality improvement programme and
higher studies
Faculty Retention i. Rate of attrition
ii. Percentage of faculty with beginning of
University
iii. Percentage of faculty joined within one year
iv. % vacancy against required faculty
Faculty Research i. Number of faculty members having publications

169
Publications in the relevant field
ii. Faculty Research Publications in number
iii. Quality of the research papers published in the
past 3 years.
iv. Impact factor of the journals
v. Citation of the papers and H-Index
The research papers considered are those (i) which
can be located on Internet and/or are included in hard-
copy volumes/ proceedings, published by well known
publishers, and (ii) the faculty member's affiliation, in
the published paper is of the current institution.
Faculty
Intellectual
Property Rights
(IPR)
i. Number of patents filed
ii.IPR\Patents granted IPR includes awarded
national/international patents, books and copyrights.
Faculty R & D
Consultancy Work
&
Testing
i. Number of R&D Projects sanctioned
ii. The amount of the funds and/or the contributions
made.
iii. Joint collaborative research projects with other
institutes
iv. Participation in nationally co ordinate projects
v. Amount of consultancy & Testing earned
vi. Rules for distribution
Faculty Exposure
to other
institutions
and Industry
i. Interaction with a well known Institution abroad,
ii. Interaction with Institution of Eminence in India
or National Research Labs, industry
iii. Interaction with State Level Institutions and
others.
iv. MOUs with reputed institutions/ organizations
Technical Support
Staff
i. Availability of adequate and qualified technical
supporting staff for programme specific labs
ii. Incentives, skill-up gradation and professional
advancement
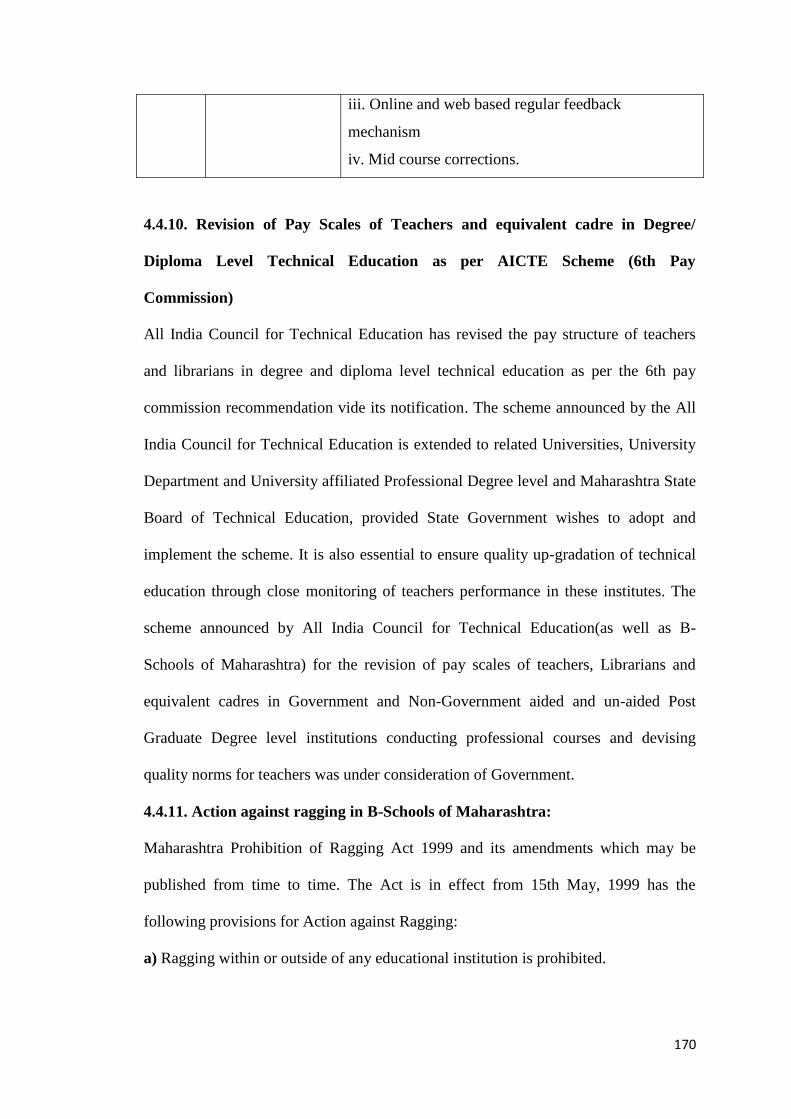
170
iii. Online and web based regular feedback
mechanism
iv. Mid course corrections.
4.4.10. Revision of Pay Scales of Teachers and equivalent cadre in Degree/
Diploma Level Technical Education as per AICTE Scheme (6th Pay
Commission)
All India Council for Technical Education has revised the pay structure of teachers
and librarians in degree and diploma level technical education as per the 6th pay
commission recommendation vide its notification. The scheme announced by the All
India Council for Technical Education is extended to related Universities, University
Department and University affiliated Professional Degree level and Maharashtra State
Board of Technical Education, provided State Government wishes to adopt and
implement the scheme. It is also essential to ensure quality up-gradation of technical
education through close monitoring of teachers performance in these institutes. The
scheme announced by All India Council for Technical Education(as well as B-
Schools of Maharashtra) for the revision of pay scales of teachers, Librarians and
equivalent cadres in Government and Non-Government aided and un-aided Post
Graduate Degree level institutions conducting professional courses and devising
quality norms for teachers was under consideration of Government.
4.4.11. Action against ragging in B-Schools of Maharashtra:
Maharashtra Prohibition of Ragging Act 1999 and its amendments which may be
published from time to time. The Act is in effect from 15th May, 1999 has the
following provisions for Action against Ragging:
a) Ragging within or outside of any educational institution is prohibited.

171
b) Whosoever directly or indirectly commits, participates in, abets, or propagates
ragging within or outside any educational institution shall, on conviction, be punished
with imprisonment for a term up to 2 years and / or penalty, which may extend to ten
thousand rupees.
c) Any student convicted of an offence of ragging shall be dismissed from the
educational institution and such student shall not be admitted in any other educational
institution for a period of five years from the date of order of such dismissal.
d) Whenever any student or, as the case may be, the parent or guardian or a teacher of
an educational institution complaints, in writing, of ragging to the head of the
educational institution, the head of the educational institution shall, without prejudice
to the foregoing provisions, within seven days of the receipt of the complaint, enquire
into the matter mentioned in the complaint and if, prima facie, it is found true,
suspend the student who is accused of the offence, and shall, immediately forward the
complaint to the police station having jurisdiction over the area in which the
educational institution is situated, for further action. Where, on enquiry by the head of
the educational institution, it is found that there is no substance, prima facie, in the
complaint received; he / she shall intimate the fact, in writing, to the complainant. The
decision of the head of the educational institution shall be final.
e) If the Head of the educational institution fails or neglects to act in the manner
specified in section ―d‖ above when a complaint of ragging is made, such person shall
be deemed to have abetted the offence and shall, on conviction, be punished as
provided for in section ―b‖ above.
4.5 Conclusion:
The State of Maharashtra is one of the prosperous States with a developed Industrial
network and rich agricultural production, the state has a high perceptive income. Each

172
B - School has its 'benchmarks' and unique culture which have evolved over a period
of time which has helped in the grooming and training process of students. That is
why TISS has its own eminent position amongst the B- Schools; ISB offering one
year programme has emerged as one amongst the best B-Schools, though unapproved
and the honourable HRD Minister presided over their convocation. It is the market
forces and the competition among the Schools, which will enhance the quality
standards. It is the spirit in the minds of the educationists to innovate and excel which
will accelerate the quality standards in management education and not the enforced
laws which are framed arbitrarily. It is high time that true leaders are brought in at
helm of affairs so that the conflicts, the confusions and uncertainty amongst the B-
Schools are eliminated as concerning the present area of research study. Control
system has never succeeded in the long run.
The mindset of the nation can be aptly described from the words of what Anna Hazare
said recently in Delhi, "There is no faith left in politicians and bureaucrats and it is
time that people be allowed to decide what they want".
173
CHAPTER-V
OBJECTIVES, HYPOTHESIS AND RESEARCH
METHODOLOGY
174
CHAPTER-V
OBJECTIVES, HYPOTHESIS AND RESEARCH
METHODOLOGY
5.1 Statement of Research Problem:
The concept of leadership (Kotter, 1988) and organisational commitment (Mathies &
Zajac, 1990; Mowday, Porter, & Steers, 1982; Steers, 1977) have been key areas of
research for theorists and researchers in the field of organizational behaviour for
decades. However, the roles of leadership and organizational commitment have not
been clearly articulated or documented.
There is a widespread notion that if employees are not committed to their
organization, the success of the organisation is at risk. Despite the importance of the
subjects of leadership and employee commitment to any organization, the two
subjects have been almost neglected by researchers in India. In reviewing the
Literature, the researcher did not find any study that examined the relationship
between leadership and employee commitment in the Indian setting. Therefore the
researcher focused on both these areas – leadership styles and employee commitment.
It also investigated the relationship between these variables and determined the effects
of selected demographic factors upon the level of commitment among the academic
faculties of the private un-aided B- Schools of Maharashtra. In doing so, this study
will contribute to the literature in the field of organizational behaviour, in general, and
leadership and organizational commitment in particular.

175
5.2 Research Questions:
1) To what extent are faculties of private unaided B-Schools of Maharashtra
committed to their organizations?
2) What Leadership characteristics do Deans/Directors of private un-aided B-
Schools of Maharashtra possess as interpreted by the faculties under them?
3) What are the effects of the Dean‘s and Director‘s perceived leadership
characteristics on the level of employee‘s organizational commitment?
4) Is there a difference in the level of commitment among academic faculties on
the basis of demographic and job related variables?
5) Is there a difference of Leadership styles perceived and expected by the
academic faculties from their respective Deans and Directors?
5.3 Scope of the Study:
The study is restricted to the level of academic faculties of private un-aided B-Schools
of Maharashtra. It could be extended to the lower levels, concerning the non-teaching
staffs of the private un-aided B-Schools as well as to the higher levels where the
Deans and Directors could judge the leadership styles followed by the trustees. The
study could also be extended to other states of India and globally too.
5.4 Purpose of the Study:
The results of the study would help the Heads and the Directors of the B-Schools to
determine the types of leadership styles to adopt in order to induce and maintain trust
and organizational commitment from their employees.
This study examined the relationship of each of the three leadership styles identified
by Bass and Avolio (1985) with the level of employee commitment among the
176
academic faculties of the B-schools of Maharashtra. Specifically the aims of the study
were as follows:
1) To study the level of commitment among the academic faculties of the B- Schools
of Maharashtra.
2) To study the relationships between the transformational, transactional, and laissez-
faire leadership styles and the level of employee commitment among the academic
faculties of the private unaided B-Schools of Maharashtra.
3) To study the difference between employees expected leadership style from their
superiors and as observed by them in their superiors.
4) To study the effects of age, level of education, marital status, and job-related
variables (internal promotion, occupational status, salary, and length of service) on the
level of commitment of the academic faculties of private un-aided B-schools of
Maharashtra.
5) To study the impact of transformational leadership style on the academic faculties
of the B-Schools of Maharashtra in comparison to the other two leadership styles.
5.5 Objectives:
The research objectives were:
1) To study the relationship between the Transformational, Transactional and
Laissez-Faire Leadership Styles of the Heads/Directors and the level of commitment
among the academic faculties of private un-aided B-Schools of Maharashtra.
2) To study the impact of Transformational Leadership Style on the academic
faculties of the selected private un-aided B-Schools of Maharashtra in comparison to
the Transactional and Laissez-Faire leadership styles.
177
3) To study the differences in Leadership Styles of HOD/Directors as observed and
expected by the academic faculties of the private un-aided select B-schools of
Maharashtra.
4) To determine the effects of age, level of education, marital status, gender,
educational qualifications and job-related variables (Occupational status, salary and
length of service, internal promotions) on the level of commitment of the private un-
aided selected B-School‘s academic faculties of Maharashtra.
5) To study the level of commitment among the academic faculties of the private
un-aided select B- Schools of Maharashtra.
5.6 Statement of Hypothesis:
H01: The Transformational Leadership Style (as observed and expected) of the Heads
of the Departments has no positive impact on the level of employees‘ commitment of
private un-aided B-Schools of Maharashtra.
H11: The Transformational Leadership Style (as observed and expected) of the Heads
of the Departments/Directors has a positive impact on the level of employees‘
commitment of private un-aided B-Schools of Maharashtra.
H02: The Transactional Leadership Style (as observed and expected) of the Heads of
the Departments/Directors has no positive impact on the level of employees‘
commitment of private un-aided B-Schools of Maharashtra.
H12 : The Transactional Leadership Style (as observed and expected) of the Heads of
the Departments/Directors has a positive impact on the level of employees‘
commitment of private un-aided B-Schools of Maharashtra.

178
H03: The Transformational Leadership Style (as observed and expected) of the Heads
of the Departments/Directors of private un-aided B-Schools of Maharashtra will not
have a greater impact on the level of employees‘ commitment compared to the
Transactional Leadership Style.
H13 : The Transformational Leadership Style (as observed and expected) of the Heads
of the Departments/Directors of private un-aided B-Schools of Maharashtra will have
a greater impact on the level of employees‘ commitment compared to the
Transactional Leadership Style.
H04: The Laissez-Faire Leadership Style of the Heads of the Departments/Directors
has no negative impact on the level of employees‘ commitment of private un-aided B-
Schools of Maharashtra.
H14: The Laissez-Faire Leadership Style of the Heads of the Departments/Directors
has a negative impact on the level of employees‘ commitment of private un-aided B-
Schools of Maharashtra.
H05: There is no difference between the expected and observed leadership styles of the
Heads of the Departments/Directors of private un-aided B-Schools of Maharashtra on
the level of employee‘s organizational commitment.
H15: There is difference between the expected and observed leadership styles of the
Heads of the Departments/Directors of private un-aided B-Schools of Maharashtra on
employee‘s organizational commitment.
H06: Together the Transformational and Transactional Leadership Styles of the Heads
of the Departments/Directors of private un-aided B-Schools of Maharashtra will not
179
have a greater impact on the employee‘s commitment level, rather than either of the
two separately.
H16 : Together the Transformational and Transactional Leadership Styles of the Heads
of the Departments/Directors of private un-aided B-Schools of Maharashtra will have
a greater impact on the employee‘s commitment level, rather than either of the two
separately.
H07 : There will be no positive relationship with the level of education and the level of
employees‘ commitment of private un-aided B-Schools of Maharashtra.
H17 : There will be a positive relationship with the level of education and the level of
employees‘ commitment of private un-aided B-Schools of Maharashtra.
H08 : There will be no positive relationship with the age and the level of employees‘
commitment of private un-aided B-Schools of Maharashtra.
H18: There will be a positive relationship with the age and the level of employees‘
commitment of private un-aided B-Schools of Maharashtra.
H09: There will be no positive relationship between occupational status and the level
of employees‘ commitment of private un-aided B-Schools of Maharashtra.
H19: There will be a positive relationship between occupational status and the level of
employees‘ commitment of private un-aided B-Schools of Maharashtra.
H010: There will be no positive relationship between pay (salary) and the level of
employees of private un-aided B-Schools of Maharashtra.
H110: There will be a positive relationship between pay (salary) and the level of
employees‘ commitment of private un-aided B-Schools of Maharashtra.

180
H011: Married Employees of private un-aided B-Schools of Maharashtra will not be
more committed to their organization than single, divorced and widowed employees.
H111 : Married Employees of private un-aided B-Schools of Maharashtra will be more
committed to their organization than single, divorced and widowed employees.
H012: Male gender of private un-aided B-Schools of Maharashtra will not be more
committed to their organization than the female gender.
H112: Male gender of private un-aided B-Schools of Maharashtra will be more
committed to their organization than the female gender.
H013: Employees undergoing internal promotions of private un-aided B-Schools of
Maharashtra will not be more committed to their organization.
H113: Employees undergoing internal promotions of private un-aided B-Schools of
Maharashtra will be more committed to their organization.
The major purpose of this study was to examine the effects of the leadership styles of
the Heads and the Directors of the private un-aided B-Schools of Maharashtra
(transformational, transactional and/or laissez – faire) as perceived by their academic
faculties on the level of organizational commitment of employees. Another purpose
was to determine the level of organizational commitment and the prevailing
leadership style among the B-School employees. The final purpose was to examine
the effects of a number of relevant variables (satisfaction with the leader, age, level of
education, marital status, occupational status, salary, length of employment and
internal promotion) on the level of organizational commitment. This chapter presents
a detailed description of the population and sample selection, measurement, data
collection, and data analysis tools.
181
5.7 Population and Sample Selection
This study was conducted in Maharashtra, India. The targeted population for the study
was the full-time academic faculties of private un-aided B-Schools of Maharashtra
who are subjected to the field of education. The official number of the academic
faculties of the B- Schools of Maharashtra were approximately 4950.There are some
reasons behind the selection of the academic faculties of the B-Schools of
Maharashtra as the subjects for the current study. First, the researcher had time
limitations which prevented the inclusion of other academic faculties of B-Schools
belonging to other states of the country. Second, the academic faculties who are
supposed to be building the future managers for the corporate and industrial sector
represent the pillar of the modern business world. These academicians can bring in
change in shaping the future business world through their researches and imparting
their knowledge to the future managers which might percolates through the system for
the betterment of future business world. Third, B-Schools from the last two decades
turn out to be the most important academic qualification for holding managerial
position in corporate sector. Students from all streams be it Engineering, Commerce,
Arts, Science take up management course to hold managerial position in their service
life. Employers also preferred candidates having management degrees for managerial
positions. Fourth, since the researcher had previously worked for one of the private
un-aided B-Schools of Navi Mumbai, it was more attractive subject of interest to her
than any other sector. Lastly, so far no study was made in Indian sub-continent in the
academic sector, subject to leadership and employee commitment.
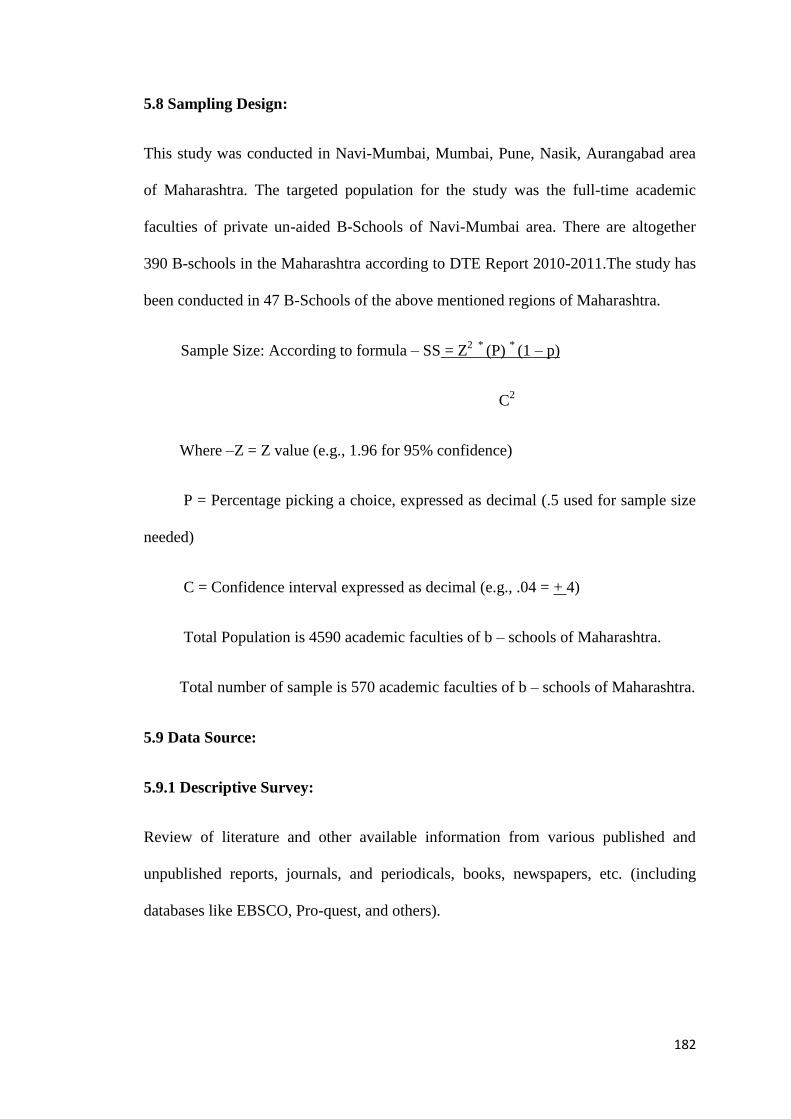
182
5.8 Sampling Design:
This study was conducted in Navi-Mumbai, Mumbai, Pune, Nasik, Aurangabad area
of Maharashtra. The targeted population for the study was the full-time academic
faculties of private un-aided B-Schools of Navi-Mumbai area. There are altogether
390 B-schools in the Maharashtra according to DTE Report 2010-2011.The study has
been conducted in 47 B-Schools of the above mentioned regions of Maharashtra.
Sample Size: According to formula – SS = Z2 *
(P) * (1 – p)
C2
Where –Z = Z value (e.g., 1.96 for 95% confidence)
P = Percentage picking a choice, expressed as decimal (.5 used for sample size
needed)
C = Confidence interval expressed as decimal (e.g., .04 = + 4)
Total Population is 4590 academic faculties of b – schools of Maharashtra.
Total number of sample is 570 academic faculties of b – schools of Maharashtra.
5.9 Data Source:
5.9.1 Descriptive Survey:
Review of literature and other available information from various published and
unpublished reports, journals, and periodicals, books, newspapers, etc. (including
databases like EBSCO, Pro-quest, and others).

183
5.9.2 Field Survey:
5.9.2.1 Research Tool:
The research instrument used for collecting primary data was questionnaire. The
Questionnaires used for the final data collection were close ended questionnaires.
Different Questionnaires used for different variables of the study were as follows:
5.9.2.1 Questionnaire for employee commitment.
Questionnaire for demographic details: Age; Educational Qualifications; Marital
Status; Occupational Status; Monthly Income(Salary);Length of Service; Gender;
Internal Promotion..
5.9.2.2 Questionnaire for Leadership Styles:
(a) Transformational
(b) Transactional
(c) Laissez-Faire.
The following are the criteria‘s for Multi factor leadership questionnaire for
Transformational leadership style:
Builds Trust (IA- Idealized Attributes) -Transformational
Acts with Integrity (IB- Idealized Behaviours) -Transformational
Inspires Others (IM- Inspirational Motivation) -Transformational
Encourages Innovative-Transformational
Thinking (IS- Intellectual Stimulation) –Transformational
Coaches People (IC- Individual Consideration) 5-TransformationalI'
The following are the criteria‘s for Multi factor leadership questionnaire for:
184
Transactional leadership style: 2.10
Rewards Achievement –Transactional
(CR- Contingent reward) - Transactional
Monitors Mistakes Transactional
(MBE-A: Management-By-Exception: Active )Transactional
(MBE-P: Management-By-Exception: Passive) - Transactional
Avoids Involvement –Laissez Faire (LF)
5.10 Pilot Study:
A total of 150 questionnaires were distributed among the academic faculties of private
un-aided B-Schools of Navi-Mumbai area, out of which 91respondent‘s instruments
were analysed. The final questionnaire had been moderated based on the pilot study.
The reliability test of the questionnaire was made and was found to be good.(For
Reliability Test refer Annexure II).
5.11 Data Collection for the Main Research Study
Data Collection began after the approval has been acquired from the dissertation
committee particularly from Dr.R.Gopal (Director of the Department of Business
Management) and Dr.Pradip Manjrekar (Dean of Business Management
Department, Padmashree Dr.D.Y.Patil University). In Maharashtra where the study
was conducted, the researcher seek permission from the directors of each B-schools
before conducting the data collection by distributing the questionnaire among the
academic faculties of the departments of each of the private un-aided B- Schools. The
questionnaire was validated and the reliability of the questionnaire was measured too.
Each questionnaire included a cover letter containing statements assuring the

185
respondent of anonymity and confidentiality. The letter also included clear and
specific directions to fill up the instrument of the study.
To help solicit the sample and prevent management intervention, the researcher
distributed and collected the entire questionnaire herself. The department helped the
researcher by providing her the necessary information needed in the data collection.
Some of the B-Schools also assigned an office for the researcher which facilitated the
process of distributing and collecting the questionnaire. The researcher also explained
the purpose and benefit of the study and encouraged the respondents to complete the
questionnaire.
Before distributing any questionnaire, the researcher met with the Heads/Director of
the departments of the selected B-Schools of Maharashtra and explained the
distribution and collection plan. To obtain a high response rate and more accurate
results, the researcher requested that each department head allow her to distribute the
questionnaire to all the academic faculties. It should be noted that a small percentage
of the targeted population did not participate in the study for various reason. For
example, the employees who were on vacation or participating in training or
MDP/FDP programmes outside the college were absent during the study. In addition a
few faculties refused to participate and answer the questionnaire. Departments Heads
left while the survey was conducted and were not present when they were returned to
the researcher.
Within a year 850 questionnaires were distributed out of which 690 were returned
back. 120 questionnaires were excluded because they were incomplete. Hence the
final number of completed questionnaire was 570.
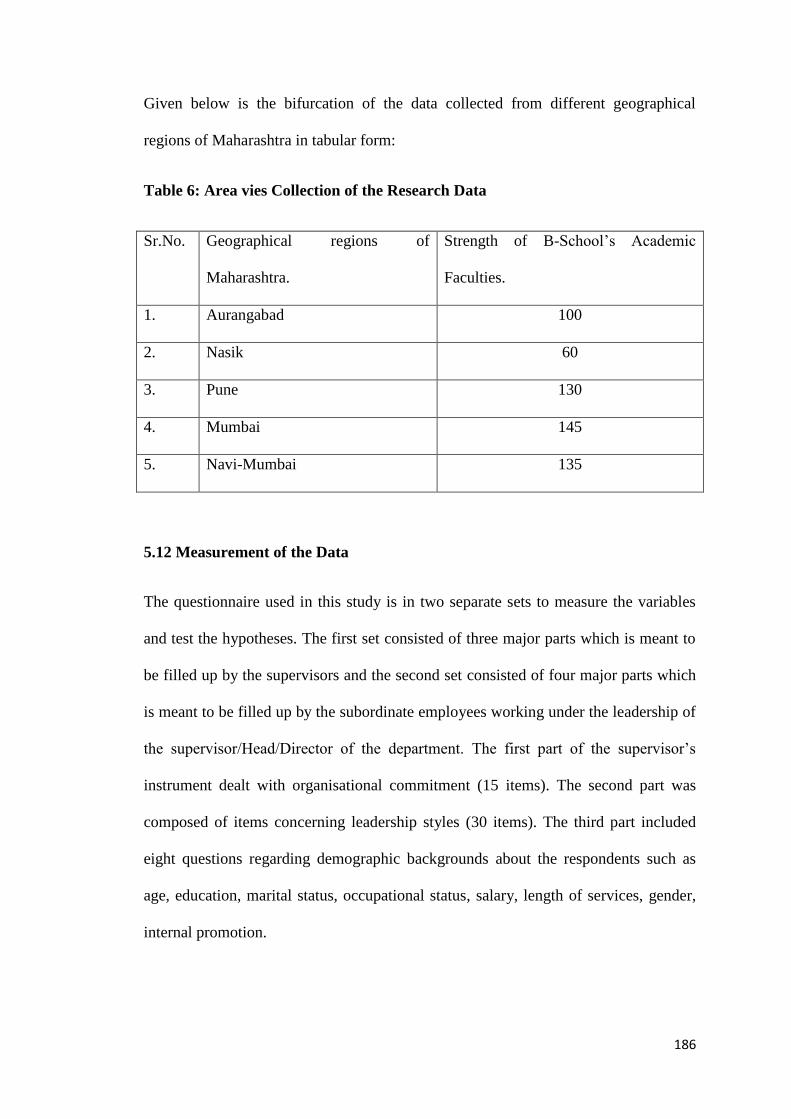
186
Given below is the bifurcation of the data collected from different geographical
regions of Maharashtra in tabular form:
Table 6: Area vies Collection of the Research Data
Sr.No. Geographical regions of
Maharashtra.
Strength of B-School‘s Academic
Faculties.
1. Aurangabad 100
2. Nasik 60
3. Pune 130
4. Mumbai 145
5. Navi-Mumbai 135
5.12 Measurement of the Data
The questionnaire used in this study is in two separate sets to measure the variables
and test the hypotheses. The first set consisted of three major parts which is meant to
be filled up by the supervisors and the second set consisted of four major parts which
is meant to be filled up by the subordinate employees working under the leadership of
the supervisor/Head/Director of the department. The first part of the supervisor‘s
instrument dealt with organisational commitment (15 items). The second part was
composed of items concerning leadership styles (30 items). The third part included
eight questions regarding demographic backgrounds about the respondents such as
age, education, marital status, occupational status, salary, length of services, gender,
internal promotion.

187
5.12.1 Organizational Commitment of Employees
Organizational commitment of employees was measured using the organisational
commitment questionnaire (OCQ)developed by Porter and his associates in 1974.This
instrument was designed to measure the relative ―strength of an individual‘s
identification with and involvement in a particular organisation‖(Pg.604). According
to this definition, organizational commitment could be characterized by at least three
factors: (1) a strong belief in and acceptance of the organization‘s goals and values;
(2) a willingness to invest considerable effort on behalf of the organization; and (3) a
strong desire to maintain membership in the organization (Mowday et al.1982). The
OCQ consists of 15 items, and each item was measured on a seven point Likert scale,
ranging from 1 (strongly disagree) to 7(strongly agree). To reduce response bias, six
items(item 3,7,9,11,12 and 15)in the instrument were negatively phrased and reverse
scored. To arrive at a summary indicator of employee commitment, scores for all
items are were summed and divided by 15. The higher the score, the greater the
individual‘s commitment to the organization.
Mowday et al. (1982) reported the results of the administration of the OCQ to 2,563
employees working in a wide variety of jobs in nine different types of organizations.
The results indicated that the questionnaire showed sufficient validity and reliability.
Reliability has been defined as ―a matter of whether a particular technique, applied
repeatedly to the same object, would yield the same result each time‖ (Babbie 1995.
P.124). Validity ―refers to the extent to which an empirical measure adequately
reflects the real meaning of the concept under consideration‖ (p.127). Many
researchers suggested using the OCQ. For example, Morrow (1983) supported the use
of the OCQ and argued that the questionnaire has received substantial support
regarding its reliability and validity. Mowday et al. (1979) conducted a study using

188
the OCQ. Their results showed a consistently high coefficient alpha, ranging from .82
to .93. They added that the questionnaire has demonstrated good psychometric
properties and has been widely used by researchers. It has been used in at least 100
published studies, of which 17 were international in scope (Mathieu & Zajac, 1990).
Further, the popularity of the questionnaire led Reichers (1985) to suggest that the
ECQ has become the approach to Organizational commitment.
5.12.2 Leadership Styles
Leadership styles were measured using the latest version of the Multifactor
Leadership Questionnaire (MLQ)(Form -5x-short)developed by Bass and Avolio
(1995). This questionnaire (MLQ),which has been tested and revised over the years, is
often used to measure transformational, transactional and Leissez-faire Leadership
style. The central thesis of the MLQ is derived from Bass‘s (1985) augmentation
theory of transactional and transformational leadership. According to Bass and Avolio
(1990), transformational leadership is a leadership style that strives to elevate the
desires of individual followers for achievement and self-development, while also
promoting the development of the group and organization. Further, transformational
leadership ―goes beyond exchanging inducements for desired performance by
developing, intellectually stimulating, and inspiring followers to transcend their own
self-interests for higher collective purpose, mission, or vision‖(Howell &
Avolio,1993,p.891).With regard to transactional and laissez-faire leadership styles,
Burns (1978) viewed transactional as a type of leadership based on an exchange
process between leaders and followers. Laissez-faire leadership represents a style
used by leaders who try to avoid responsibility and decision-making (Bass, 1997).
189
In developing the MLQ (Form-5x), Bass and Avolio (1995) wanted to create a survey
instrument that could adequately explain the ‗full range‘ of leadership styles, which
includes highly transformational leaders at one end to those which are highly avoidant
at the other end. In addition, the development of the MLQ (Form-5x) occurred as a
response to criticisms of the old version of the MLQ (MLQ Form-5R) raised by
several scholars. According to Bass and Avolio (1995), over the last four years, the
MLQ (Form-5x) has been used in about 200 research programs, master theses, and
doctoral dissertations around the world. They also stated that the instrument has been
into German, French, Spanish, Arabic, Chinese, Hebrew, and Korean for use in
different research projects.
In the present study, employees were asked to rate their immediate supervisors (Head
of the department / Director of the institute). It has been found that in many of the B-
schools in spite of the designated HOD of the department, the employees are found to
be directly reporting to the Director of the institute. The questionnaires for
measurement were taken into account as per the applicability. This set of
questionnaire which is meant for the sub-ordinate employees were having two sets of
MLQ. One set defining the Observed Leadership style of the Director and the other
set defining the expected leadership style from the director by the employees.
Therefore, the MLQ rater form (5x-short) was used to measure the transformational,
transactional and Leissez-faire leadership style as followed and as perceived and
expected by the employees. In addition to measuring these characteristics, the MLQ
Rater Form (5X-Short) was used to assess employees level of satisfaction with the
leadership behaviour exhibited by their supervisors. The current study included only
30 items relating to 10 scales out of 45 items relating to 12 scales of MLQ. The scales
related to Transformational Leadership were idealized influence (attributed), idealized
190
influence (behaviour), inspirational motivation, intellectual stimulation, and
individual consideration. Contingent rewards, management exception (active),
management by exception (passive), were associated with Transactional Leadership
scales. The remaining two scales indicated laissez –faire leadership and satisfaction
with leader. While all the leadership style scale has four items, satisfaction with the
leader scale has only two items. Each item was rated on a Five point frequency scale
ranging from 1 (not at all) to 5 (frequently, if not always). The MLQ scores are the
average score from the items on the scale. The score can be derived by summing the
items and dividing by the number of items that make up the scale.
The validity and reliability of the MLQ have been empirically established. Based on
the results of nine studies conducted on various organizations and using the
experimental form of the MLQ (5X), the questionnaire showed a satisfactory level of
internal consistency. Further, the reliability for the total items and for each leadership
factor scale ranged from .74 to .94 (Bass & Avolio, 1995) and exceeded the standard
reliability cut-off of.70 recommended by Fornell and Larcker (1981). In general, the
MLQ (5x-Short) ―appears to be an adequate test with good construct validity,
adequate reliability, and a good research base‖ (Jabati, p.39).
5.12.3 Age
This variable was measured by asking the respondent to choose the category for his
age range. Three categories were included. The first category was 20-29 years, the
second category was 30-39 years, the third category was 40years and above.
P.T.O
191
5.12.4 Level of Education
Level of education was measured by asking the respondent to select the category that
indicated his educational level. There were four categories, ranging from graduation
through various streams (BA/BCom/BSc/BE), Master Degree (MA/MCom/MSc/ME
along with MABA/MMS to a doctorate degree.
5.12.5 Marital Status
Marital status was measured by asking the respondents to mark the category that
described their situation. Married (Coded 1), divorced (coded 2), single (coded 3), and
widowed (Coded 4) were the categories to choose among. (See Annexure-II).
5.12.6 Occupational Level
This variable was measured by asking the respondent to select the category that
indicated his occupational position. The occupational level scale consisted of four
categories. The first category (coded 1) included the lecturers, the second category
(coded 2) included the Assistant Professor, the third category included the Associate
Professors and the fourth category included the professors. (See Annexure-II).
5.12.7 Salary
Salary (monthly income) was measured by asking the respondents to select the
category that reflected their salary range. The salaries were broken into five
categories. The first category (coded 1) included salaries above 45K,the second
category included salaries ranging from 35-44K,the third category included salaries
ranging from 25-34 K, and the fourth category included salaries between 15-24
K.(See Annexure-II)
192
5.12.8 Length of Service
Length of service was measured by asking the respondents to select the category that
indicated the number of years of their employment in the B-Schools they were
currently in service. The categories were coded as follows: 1 = Upto 5 years, 2 = 6 to
10 years and 3 = more than 10 years.
5.12.9 Gender
Gender was measured by asking the respondents to select the category that indicated
the male and female status of the respondents. The first category (coded 1) included
the male and the second category (coded 2) included the female.
5.12.10 Internal Promotion
Internal promotion was measured by asking the respondents to select the category that
reflected their internal promotion. The period of the internal promotion of the
respondents were broken into three categories which indicated the promotion taken
place within the time span of the respondent‘s career in a particular institute. The first
category (coded 1) indicated the period ranging from 0-2 years, the second category
indicated the period ranging from 3-6years, the third category included the period
ranging from 7-10 years.
5.13 Reliability of the Study Instrument
In this study, reliability tests were performed to assess the internal consistency of each
measure. Cronbach‘s Alpha coefficients were reported as follows: .83 for the
Organizational Commitment Questionnaire, .91 for the MLQ Leadership Style
Questionnaire. (Refer Annexure-IIA)
193
5.14 Data Analysis Tools
To analyze the collected data and test the expectations and hypotheses, the Statistical
Package for Social Sciences (SPSS: Version 17 &20) for Windows 2007 was utilized.
A number of Statistical tools were used. These included descriptive statistics to
describe different characteristics of the respondents. Simple individual regression
analysis was utilized to analyze the relationships between the dependent variable
(organizational commitment) and each of the selected independent variables. Multiple
regression analysis was used to determine the magnitude of the relationship between
the dependent variable (organizational commitment) and all the independent variables
used in the study Correlational statistics were used to describe and explore the
relationships between all the variables used in the study. Finally, one way analysis of
variance (ANOVA) was performed to test the differences in the level of
organizational commitment among groups on the basis of the employee‘s
demographic details such as age, educational qualifications, marital status,
occupational status, monthly income salary, length of service, gender, internal
promotion.
5.15 Interpretation and Report Writing:
The analysed data were finally interpreted to draw the conclusions and reported with
the objective of the study in view.
5.16 Limitation of the Study:
The study is limited to the state of Maharashtra and that too specifically with Navi-
Mumbai, Mumbai, Pune, Nasik and Aurangabad only. In future with a longer span of
time, similar studies can be carried out in the other states of the country and even
194
globally. Also, in future few more parameters related to leadership style and employee
commitment may be identified and subsequently, the study may be carried out on
those identified parameters.
195
CHAPTER-6
RESEARCH FINDINGS
196
CHAPTER-6
RESEARCH FINDINGS
6.1 Introduction
This chapter presents the results of the study. It is divided into four sections. The first
section includes the pilot study report. The second section includes a description of
the respondent‘s characteristics of the main research study. The third section contains
statistical results of the correlation analyses of the items in the two instruments used,
the Multifactor Leadership Questionnaire (MLQ) Rater Form (5x-Short) developed by
Bass and Avolio (1995), and the Employee Commitment Questionnaire (ECQ)
developed by Porter and his associates (1974). Also, the third section includes the
range, mean, median, and standard deviation of all the scales used in the current
study. Results of the expectations and hypotheses testing and the complete regression
model are presented in the fourth section.
6.2 Pilot Study Report
A total of 150 questionnaires were distributed as mentioned earlier among the
academic faculties of private un-aided B-Schools of Navi-Mumbai area, out of which
91respondent‘s instruments were analysed. The final questionnaire had been
moderated based on the pilot study. The reliability test of the questionnaire was made
and was found to be good.
6.2.1 Population and Sample Selection of Pilot Study:
This study was conducted in Navi-Mumbai area of Maharashtra. The targeted
population for the study was the full-time academic faculties of B-Schools of Navi-
197
Mumbai area. There are altogether 15 B-schools in the Navi-Mumbai area. A Total
sample size of 110 academic faculties was studied out of 6 – B-Schools of Navi
Mumbai. The names of the B-School of Navi –Mumbai under study are as follows:
1. Padmashree D.Y.Patil University, Department of Business Management,CBD,
Belapur
2. Bharti Vidyapeeth's Institute of Management Studies & Research, Navi
Mumbai
3. Agnel Charities Agnel Seva Sangha's Fr. C. Rodrigues Institute of
Management Studies, Navi Mumbai
4. NCRD's Sterling Institute of Management Studies, Navi Mumbai.
5. Gahlot Institute of Management Studies and Research, Navi Mumbai
6. SIES College of Management Studies, Nerul
6.2.2 Data Collection:
Data Collection began after the approval has been acquired from the dissertation
committee particularly from Dr.R.Gopal (director of the department of business
Management) and Dr.Pradip Manjrekar (Dean of Business management
department, Padmashree Dr.D.Y.Patil University). In Navi-Mumbai area where the
study was conducted, the researcher took permission from the directors of each B-
schools before conducting the data collection by distributing the questionnaire among
the academic faculties of the departments of each of the B- Schools. The
questionnaire was validated and the reliability of the questionnaire was measured too.
Each questionnaire included a cover letter containing statements assuring the
respondent of anonymity and confidentiality. The letter also included clear and
specific directions to fill up the instrument of the study.
198
Within a two months time 150 questionnaires were distributed out of which 130 were
returned back .Thirty one questionnaire were excluded because they were incomplete.
Hence the final number of completed questionnaire was 91.
6.2.3 Measurement of the Data:
The questionnaire used in this study is in two separate sets to measure the variables
and test the hypotheses. The first set consisted of three major parts which is meant to
be filled up by the supervisors and the second set consisted of four major parts which
is meant to be filled up by the subordinate employees working under the leadership of
the supervisor/Head/Director of the department. The first part of the supervisor‘s
instrument dealt with organisational commitment (15 items). The second part was
composed of items concerning leadership styles (36 items). The third part included
eight questions regarding demographic backgrounds about the respondents such as
age, education, marital status, occupational status, salary, length of services, gender,
internal promotion.
6.2.4 Results
Description of respondent‟s characteristics with Hypotheses testing result:
The questionnaire used for this study included 8 items concerning the respondent‘s
characteristics. All the respondents were Dean and Academic faculties of B-Schools
of Navi Mumbai. They were asked about their age, education, marital status,
occupational status, salary (monthly income), and length of services, gender, and
internal promotion.
6.2.4.1 AGE:
The age range of the respondents are 20-50years and above.
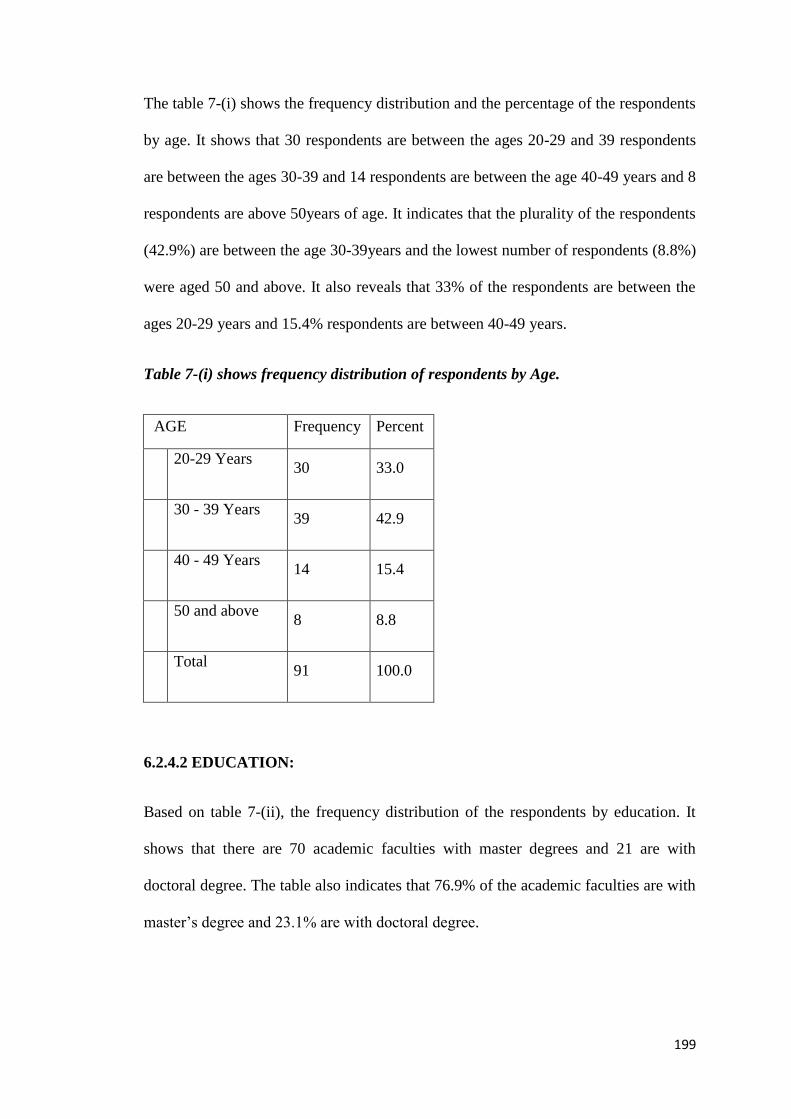
199
The table 7-(i) shows the frequency distribution and the percentage of the respondents
by age. It shows that 30 respondents are between the ages 20-29 and 39 respondents
are between the ages 30-39 and 14 respondents are between the age 40-49 years and 8
respondents are above 50years of age. It indicates that the plurality of the respondents
(42.9%) are between the age 30-39years and the lowest number of respondents (8.8%)
were aged 50 and above. It also reveals that 33% of the respondents are between the
ages 20-29 years and 15.4% respondents are between 40-49 years.
Table 7-(i) shows frequency distribution of respondents by Age.
AGE Frequency Percent
20-29 Years 30 33.0
30 - 39 Years 39 42.9
40 - 49 Years 14 15.4
50 and above 8 8.8
Total 91 100.0
6.2.4.2 EDUCATION:
Based on table 7-(ii), the frequency distribution of the respondents by education. It
shows that there are 70 academic faculties with master degrees and 21 are with
doctoral degree. The table also indicates that 76.9% of the academic faculties are with
master‘s degree and 23.1% are with doctoral degree.

200
Table 7-(ii) Frequency distribution of Respondent‟s Educational Level
EDUCATION
Frequency Percent
Master Degree 70 76.9
Doctorate 21 23.1
Total 91 100.0
6.2.4.3 MARITAL STATUS:
Based on table 7-(iii), shows the frequency distribution of the respondents by their
marital status. It shows that there are 66 academic faculties, that is the majority of the
respondents(72.5%) who are married and 25 respondents (27.5%) are un-married i.e.
,single, none are divorced and widowed.
Table 7-(iii) shows frequency distribution of respondents by Marital Status.
Marital
Status
Frequency Percent
Married 66 72.5
Single 25 27.5
Total 91 100.0
6.2.4.4 OCCUPATIONAL STATUS:
Table 7(iv) shows frequency distribution of respondents by their occupational status.
Table 7(iv) shows that the pluralities of respondents (53.8%) are in the middle level
category that is the Assistant Professors, followed by 15.4% of respondents who are

201
lecturers; 11% are Sr.Lecturer and 9.9% are the Head of the Departments and 3.3%
are Directors.
Table 7-(iv) shows frequency distribution of respondents by Occupational Status.
Frequency Percent
Director 3 3.3
Head of the
Department 9 9.9
Professor 6 6.6
Asst.Professor 49 53.8
Sr.Lecturer 10 11.0
Lecturer 14 15.4
Total 91 100.0
6.2.4.5 SALARY (MONTHLY INCOME):
Respondents are asked about their monthly income or salary. The respondents are
asked to choose the category indicating their monthly income. Table 7(v) indicates
that the majority of respondents (73.9%) falls within low to middle income group that
is between 15-44K per month, only 22% of the respondents had middle high and high
salaries.
Table 7-(v) shows frequency distribution of respondents by Salary (Monthly
income)
Frequency Percent
1 lakh 4 4.4
80-90 6 6.6
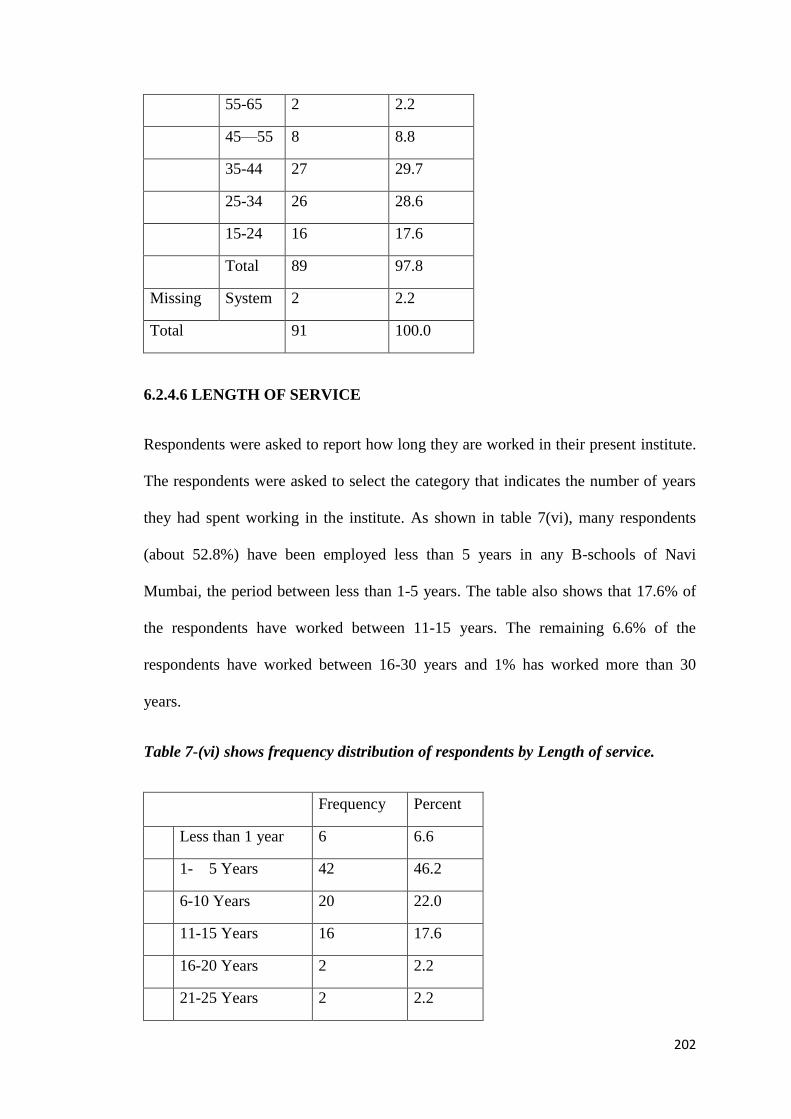
202
55-65 2 2.2
45—55 8 8.8
35-44 27 29.7
25-34 26 28.6
15-24 16 17.6
Total 89 97.8
Missing System 2 2.2
Total 91 100.0
6.2.4.6 LENGTH OF SERVICE
Respondents were asked to report how long they are worked in their present institute.
The respondents were asked to select the category that indicates the number of years
they had spent working in the institute. As shown in table 7(vi), many respondents
(about 52.8%) have been employed less than 5 years in any B-schools of Navi
Mumbai, the period between less than 1-5 years. The table also shows that 17.6% of
the respondents have worked between 11-15 years. The remaining 6.6% of the
respondents have worked between 16-30 years and 1% has worked more than 30
years.
Table 7-(vi) shows frequency distribution of respondents by Length of service.
Frequency Percent
Less than 1 year 6 6.6
1- 5 Years 42 46.2
6-10 Years 20 22.0
11-15 Years 16 17.6
16-20 Years 2 2.2
21-25 Years 2 2.2
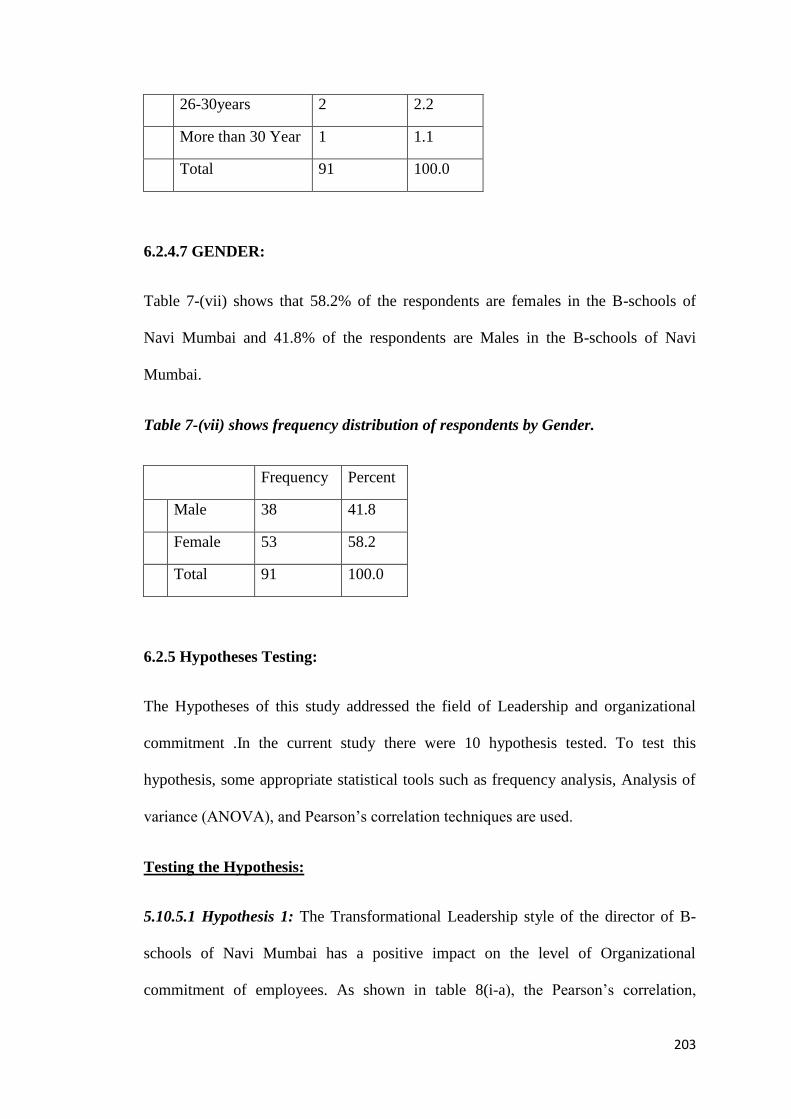
203
26-30years 2 2.2
More than 30 Year 1 1.1
Total 91 100.0
6.2.4.7 GENDER:
Table 7-(vii) shows that 58.2% of the respondents are females in the B-schools of
Navi Mumbai and 41.8% of the respondents are Males in the B-schools of Navi
Mumbai.
Table 7-(vii) shows frequency distribution of respondents by Gender.
Frequency Percent
Male 38 41.8
Female 53 58.2
Total 91 100.0
6.2.5 Hypotheses Testing:
The Hypotheses of this study addressed the field of Leadership and organizational
commitment .In the current study there were 10 hypothesis tested. To test this
hypothesis, some appropriate statistical tools such as frequency analysis, Analysis of
variance (ANOVA), and Pearson‘s correlation techniques are used.
Testing the Hypothesis:
5.10.5.1 Hypothesis 1: The Transformational Leadership style of the director of B-
schools of Navi Mumbai has a positive impact on the level of Organizational
commitment of employees. As shown in table 8(i-a), the Pearson‘s correlation,
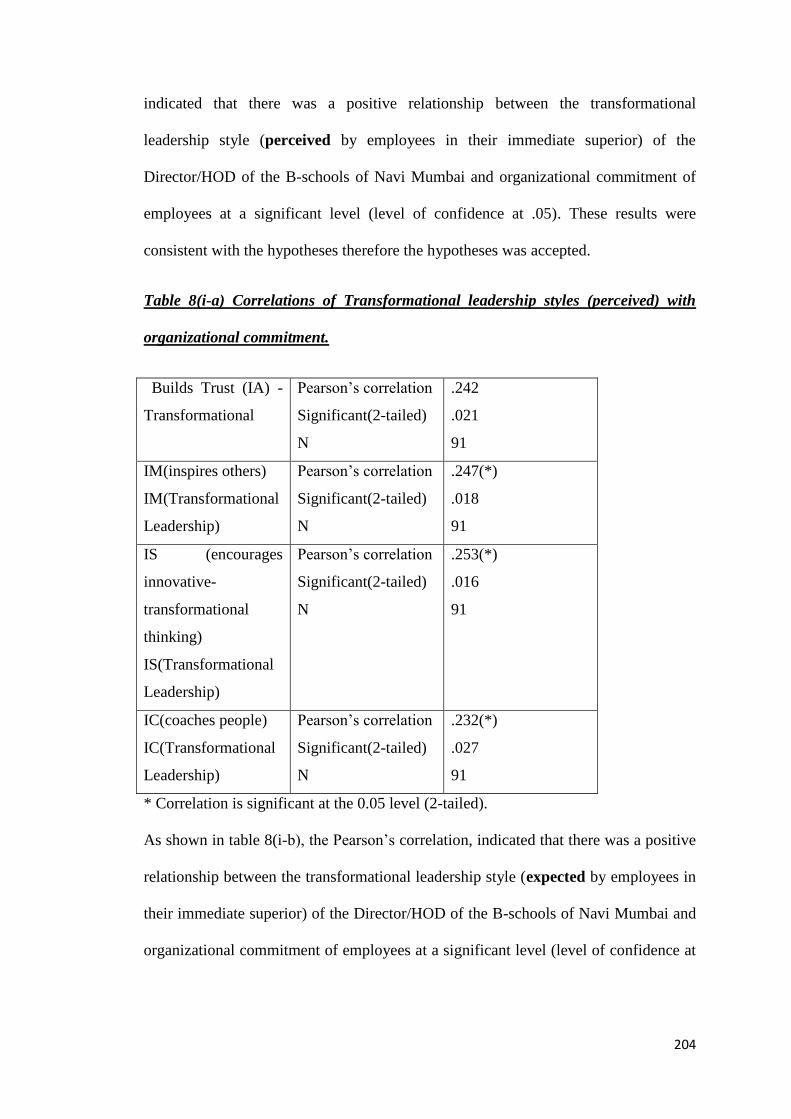
204
indicated that there was a positive relationship between the transformational
leadership style (perceived by employees in their immediate superior) of the
Director/HOD of the B-schools of Navi Mumbai and organizational commitment of
employees at a significant level (level of confidence at .05). These results were
consistent with the hypotheses therefore the hypotheses was accepted.
Table 8(i-a) Correlations of Transformational leadership styles (perceived) with
organizational commitment.
Builds Trust (IA) -
Transformational
Pearson‘s correlation
Significant(2-tailed)
N
.242
.021
91
IM(inspires others)
IM(Transformational
Leadership)
Pearson‘s correlation
Significant(2-tailed)
N
.247(*)
.018
91
IS (encourages
innovative-
transformational
thinking)
IS(Transformational
Leadership)
Pearson‘s correlation
Significant(2-tailed)
N
.253(*)
.016
91
IC(coaches people)
IC(Transformational
Leadership)
Pearson‘s correlation
Significant(2-tailed)
N
.232(*)
.027
91
* Correlation is significant at the 0.05 level (2-tailed).
As shown in table 8(i-b), the Pearson‘s correlation, indicated that there was a positive
relationship between the transformational leadership style (expected by employees in
their immediate superior) of the Director/HOD of the B-schools of Navi Mumbai and
organizational commitment of employees at a significant level (level of confidence at

205
.05) These results were consistent with the hypotheses therefore the hypotheses was
accepted.
Table 8(i-b) Correlations of Transformational leadership styles (expected) with
organizational commitment.
Encourages Innovative-
Transformational Thinking
(IS) -Transformational
(Expected)
Pearson‘s correlation
Significant(2-tailed)
N
.194(*)
.037
91
Coaches People (IC) 5-
Transformational
(Expected)
Pearson‘s correlation
Significant(2-tailed)
N
.209(*)
.027
91
* Correlation is significant at the 0.05 level (2-tailed).
6.2.5.2 Hypotheses 2: The transactional leadership style of the director of B-schools
of Navi Mumbai has a positive impact on the level of Organizational commitment of
employees.
As shown in table 8(ii-a), concerning the relationship between transactional
leadership style of the director of B-schools of Navi Mumbai and organizational
commitment level of the academic faculties working under him, the Pearson
correlation result demonstrated that the relationship between the two variables are
positive and significant also (level of confidence at.05).The results were consistent
with the hypotheses therefore the hypotheses was supported.
Pearson’s Co-relation results of transactional Leadership style on employee
commitment.
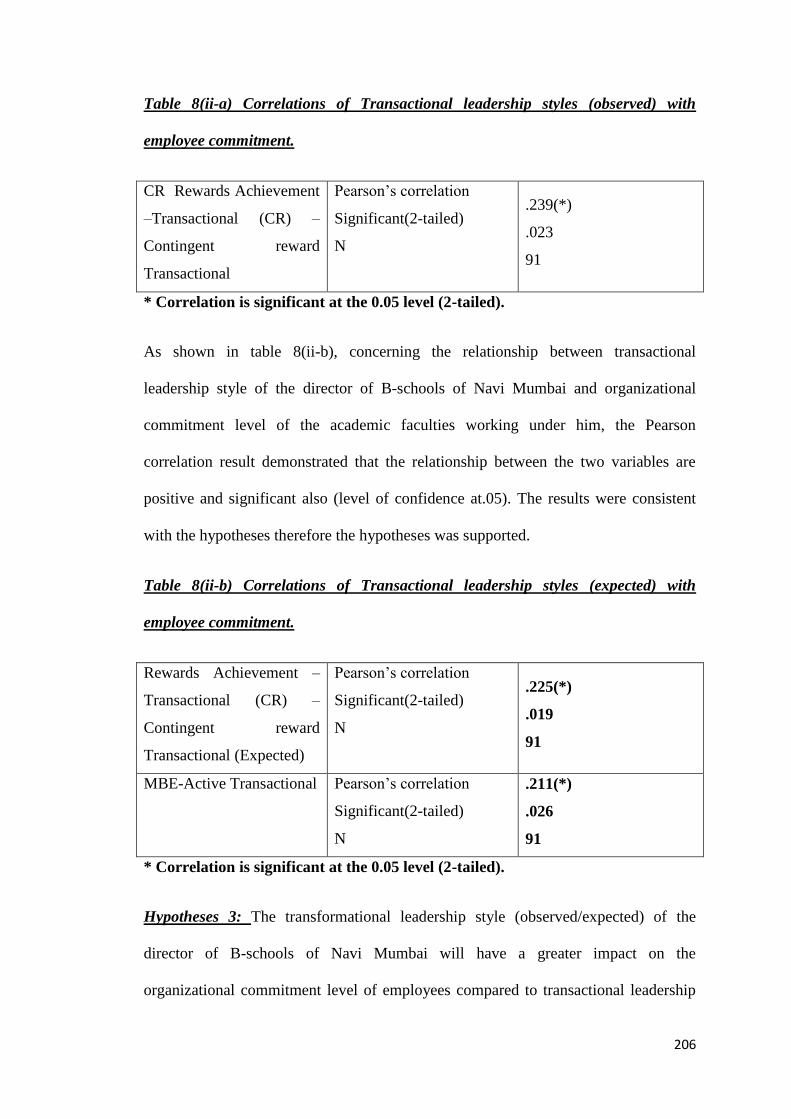
206
Table 8(ii-a) Correlations of Transactional leadership styles (observed) with
employee commitment.
CR Rewards Achievement
–Transactional (CR) –
Contingent reward
Transactional
Pearson‘s correlation
Significant(2-tailed)
N
.239(*)
.023
91
* Correlation is significant at the 0.05 level (2-tailed).
As shown in table 8(ii-b), concerning the relationship between transactional
leadership style of the director of B-schools of Navi Mumbai and organizational
commitment level of the academic faculties working under him, the Pearson
correlation result demonstrated that the relationship between the two variables are
positive and significant also (level of confidence at.05). The results were consistent
with the hypotheses therefore the hypotheses was supported.
Table 8(ii-b) Correlations of Transactional leadership styles (expected) with
employee commitment.
Rewards Achievement –
Transactional (CR) –
Contingent reward
Transactional (Expected)
Pearson‘s correlation
Significant(2-tailed)
N
.225(*)
.019
91
MBE-Active Transactional Pearson‘s correlation
Significant(2-tailed)
N
.211(*)
.026
91
* Correlation is significant at the 0.05 level (2-tailed).
Hypotheses 3: The transformational leadership style (observed/expected) of the
director of B-schools of Navi Mumbai will have a greater impact on the
organizational commitment level of employees compared to transactional leadership
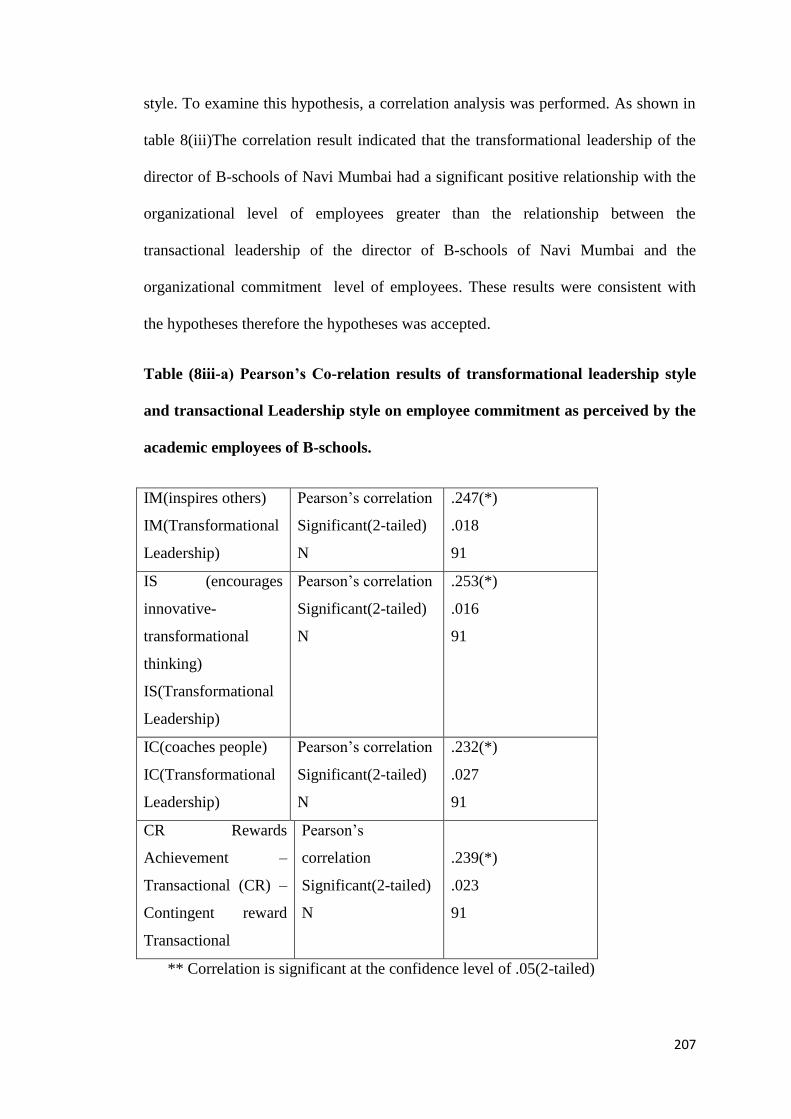
207
style. To examine this hypothesis, a correlation analysis was performed. As shown in
table 8(iii)The correlation result indicated that the transformational leadership of the
director of B-schools of Navi Mumbai had a significant positive relationship with the
organizational level of employees greater than the relationship between the
transactional leadership of the director of B-schools of Navi Mumbai and the
organizational commitment level of employees. These results were consistent with
the hypotheses therefore the hypotheses was accepted.
Table (8iii-a) Pearson‟s Co-relation results of transformational leadership style
and transactional Leadership style on employee commitment as perceived by the
academic employees of B-schools.
IM(inspires others)
IM(Transformational
Leadership)
Pearson‘s correlation
Significant(2-tailed)
N
.247(*)
.018
91
IS (encourages
innovative-
transformational
thinking)
IS(Transformational
Leadership)
Pearson‘s correlation
Significant(2-tailed)
N
.253(*)
.016
91
IC(coaches people)
IC(Transformational
Leadership)
Pearson‘s correlation
Significant(2-tailed)
N
.232(*)
.027
91
CR Rewards
Achievement –
Transactional (CR) –
Contingent reward
Transactional
Pearson‘s
correlation
Significant(2-tailed)
N
.239(*)
.023
91
** Correlation is significant at the confidence level of .05(2-tailed)
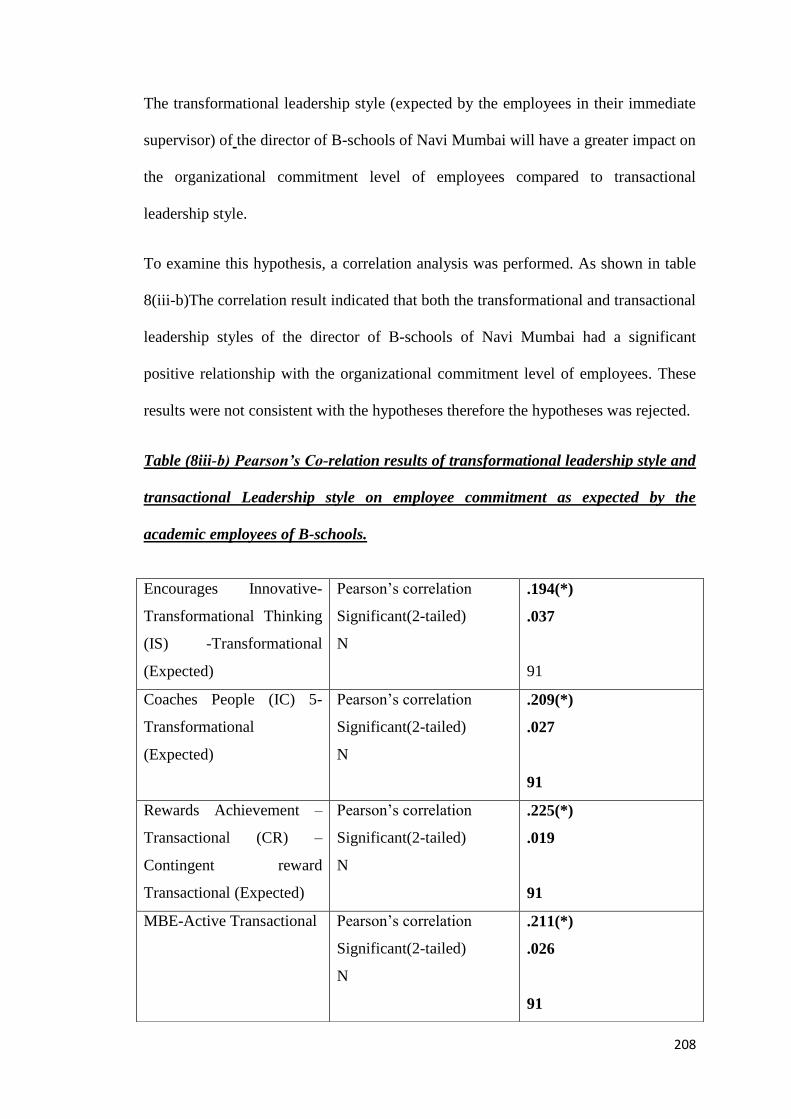
208
The transformational leadership style (expected by the employees in their immediate
supervisor) of the director of B-schools of Navi Mumbai will have a greater impact on
the organizational commitment level of employees compared to transactional
leadership style.
To examine this hypothesis, a correlation analysis was performed. As shown in table
8(iii-b)The correlation result indicated that both the transformational and transactional
leadership styles of the director of B-schools of Navi Mumbai had a significant
positive relationship with the organizational commitment level of employees. These
results were not consistent with the hypotheses therefore the hypotheses was rejected.
Table (8iii-b) Pearson‟s Co-relation results of transformational leadership style and
transactional Leadership style on employee commitment as expected by the
academic employees of B-schools.
Encourages Innovative-
Transformational Thinking
(IS) -Transformational
(Expected)
Pearson‘s correlation
Significant(2-tailed)
N
.194(*)
.037
91
Coaches People (IC) 5-
Transformational
(Expected)
Pearson‘s correlation
Significant(2-tailed)
N
.209(*)
.027
91
Rewards Achievement –
Transactional (CR) –
Contingent reward
Transactional (Expected)
Pearson‘s correlation
Significant(2-tailed)
N
.225(*)
.019
91
MBE-Active Transactional Pearson‘s correlation
Significant(2-tailed)
N
.211(*)
.026
91
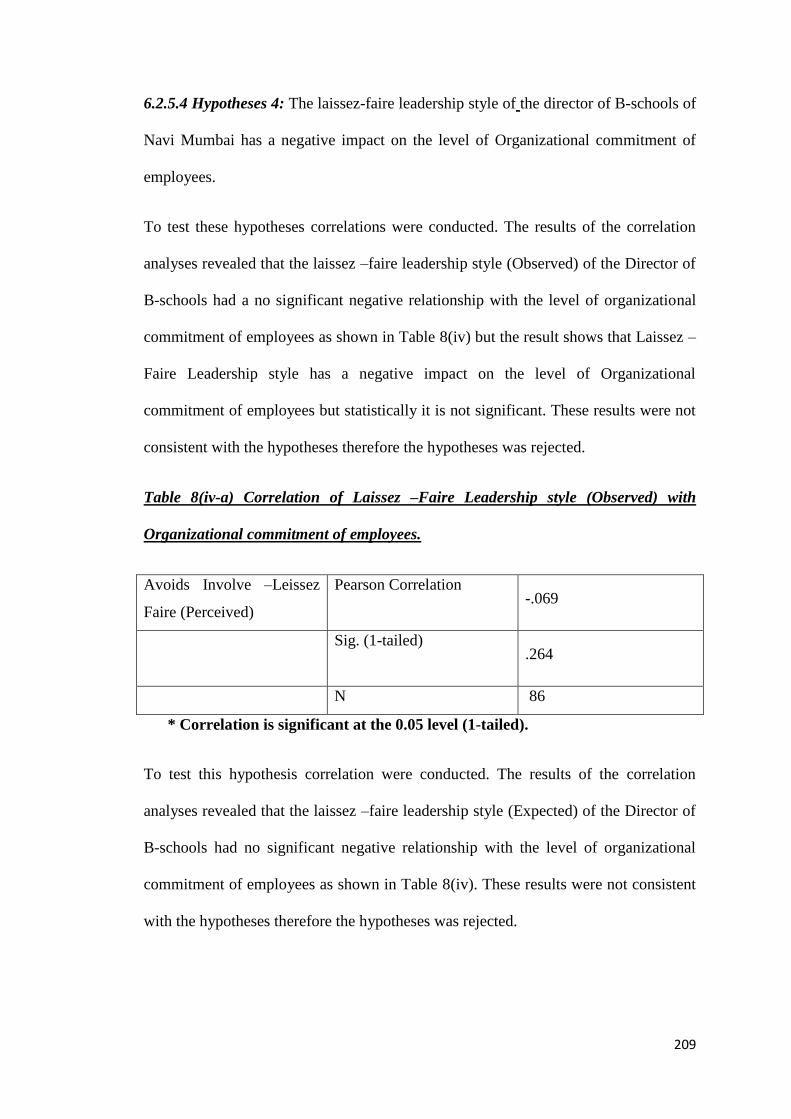
209
6.2.5.4 Hypotheses 4: The laissez-faire leadership style of the director of B-schools of
Navi Mumbai has a negative impact on the level of Organizational commitment of
employees.
To test these hypotheses correlations were conducted. The results of the correlation
analyses revealed that the laissez –faire leadership style (Observed) of the Director of
B-schools had a no significant negative relationship with the level of organizational
commitment of employees as shown in Table 8(iv) but the result shows that Laissez –
Faire Leadership style has a negative impact on the level of Organizational
commitment of employees but statistically it is not significant. These results were not
consistent with the hypotheses therefore the hypotheses was rejected.
Table 8(iv-a) Correlation of Laissez –Faire Leadership style (Observed) with
Organizational commitment of employees.
Avoids Involve –Leissez
Faire (Perceived)
Pearson Correlation
-.069
Sig. (1-tailed)
.264
N 86
* Correlation is significant at the 0.05 level (1-tailed).
To test this hypothesis correlation were conducted. The results of the correlation
analyses revealed that the laissez –faire leadership style (Expected) of the Director of
B-schools had no significant negative relationship with the level of organizational
commitment of employees as shown in Table 8(iv). These results were not consistent
with the hypotheses therefore the hypotheses was rejected.
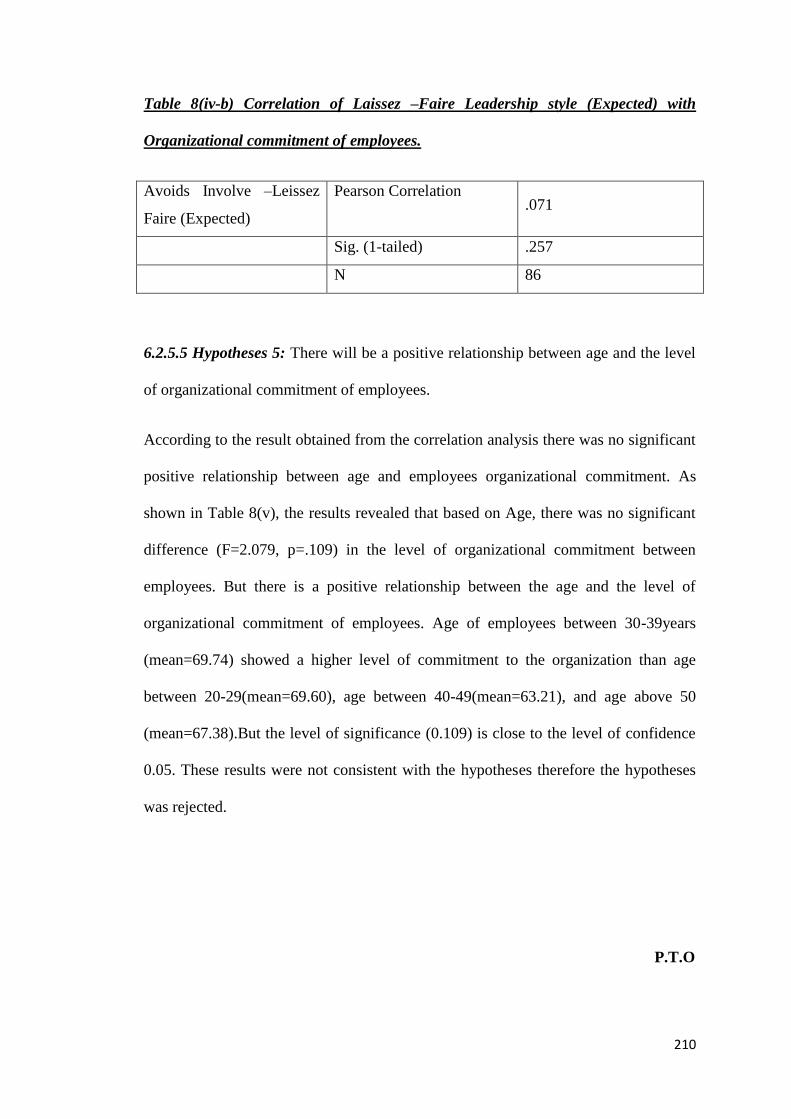
210
Table 8(iv-b) Correlation of Laissez –Faire Leadership style (Expected) with
Organizational commitment of employees.
Avoids Involve –Leissez
Faire (Expected)
Pearson Correlation .071
Sig. (1-tailed) .257
N 86
6.2.5.5 Hypotheses 5: There will be a positive relationship between age and the level
of organizational commitment of employees.
According to the result obtained from the correlation analysis there was no significant
positive relationship between age and employees organizational commitment. As
shown in Table 8(v), the results revealed that based on Age, there was no significant
difference (F=2.079, p=.109) in the level of organizational commitment between
employees. But there is a positive relationship between the age and the level of
organizational commitment of employees. Age of employees between 30-39years
(mean=69.74) showed a higher level of commitment to the organization than age
between 20-29(mean=69.60), age between 40-49(mean=63.21), and age above 50
(mean=67.38).But the level of significance (0.109) is close to the level of confidence
0.05. These results were not consistent with the hypotheses therefore the hypotheses
was rejected.
P.T.O
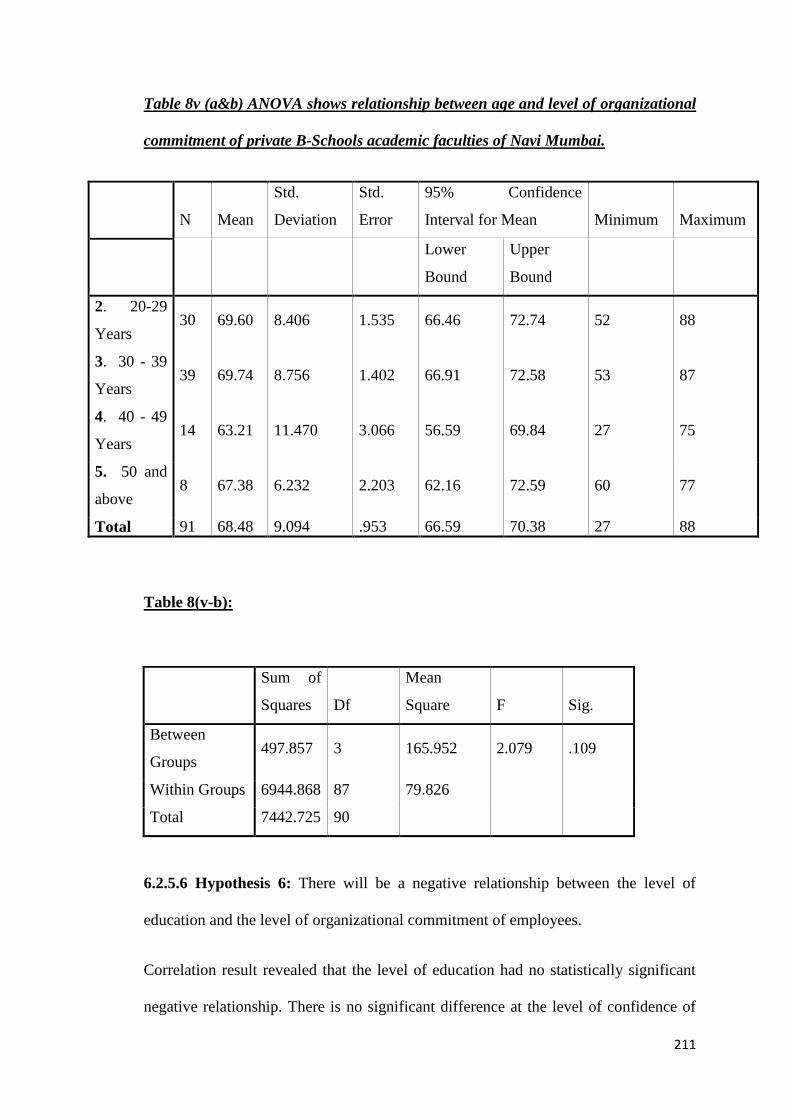
211
Table 8v (a&b) ANOVA shows relationship between age and level of organizational
commitment of private B-Schools academic faculties of Navi Mumbai.
N Mean
Std.
Deviation
Std.
Error
95% Confidence
Interval for Mean Minimum Maximum
Lower
Bound
Upper
Bound
2. 20-29
Years 30 69.60 8.406 1.535 66.46 72.74 52 88
3. 30 - 39
Years 39 69.74 8.756 1.402 66.91 72.58 53 87
4. 40 - 49
Years 14 63.21 11.470 3.066 56.59 69.84 27 75
5. 50 and
above 8 67.38 6.232 2.203 62.16 72.59 60 77
Total 91 68.48 9.094 .953 66.59 70.38 27 88
Table 8(v-b):
Sum of
Squares Df
Mean
Square F Sig.
Between
Groups 497.857 3 165.952 2.079 .109
Within Groups 6944.868 87 79.826
Total 7442.725 90
6.2.5.6 Hypothesis 6: There will be a negative relationship between the level of
education and the level of organizational commitment of employees.
Correlation result revealed that the level of education had no statistically significant
negative relationship. There is no significant difference at the level of confidence of
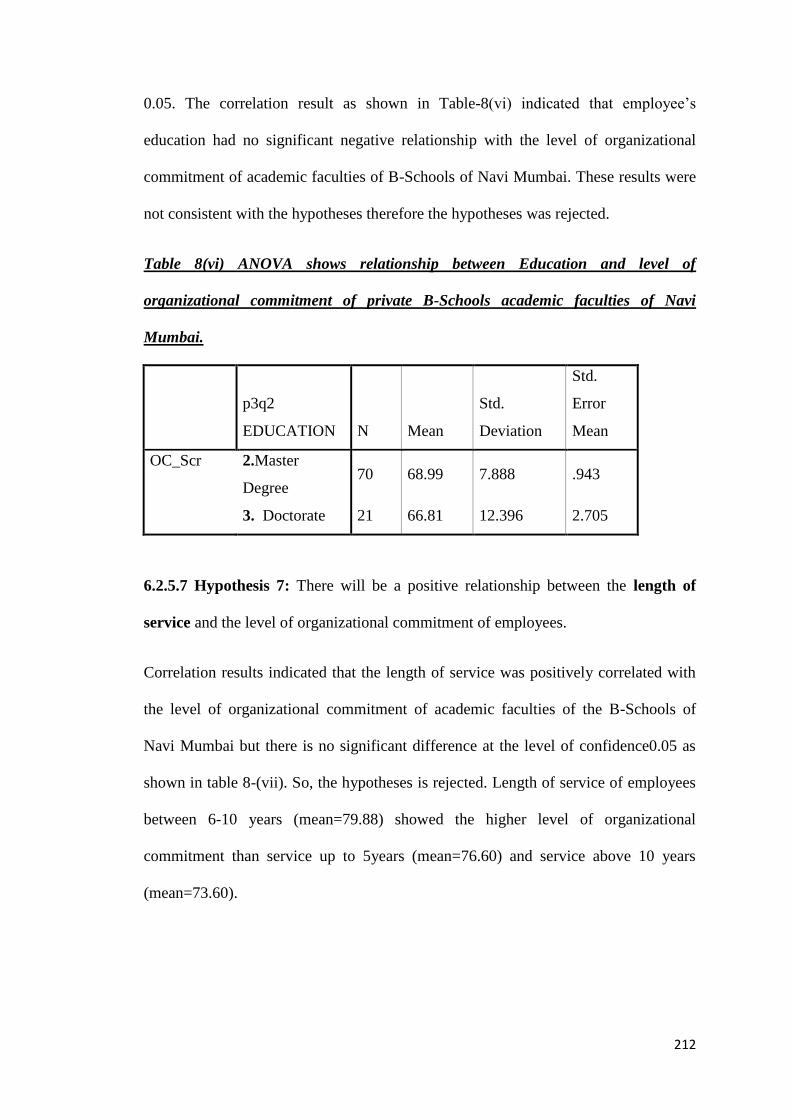
212
0.05. The correlation result as shown in Table-8(vi) indicated that employee‘s
education had no significant negative relationship with the level of organizational
commitment of academic faculties of B-Schools of Navi Mumbai. These results were
not consistent with the hypotheses therefore the hypotheses was rejected.
Table 8(vi) ANOVA shows relationship between Education and level of
organizational commitment of private B-Schools academic faculties of Navi
Mumbai.
p3q2
EDUCATION N Mean
Std.
Deviation
Std.
Error
Mean
OC_Scr 2.Master
Degree 70 68.99 7.888 .943
3. Doctorate 21 66.81 12.396 2.705
6.2.5.7 Hypothesis 7: There will be a positive relationship between the length of
service and the level of organizational commitment of employees.
Correlation results indicated that the length of service was positively correlated with
the level of organizational commitment of academic faculties of the B-Schools of
Navi Mumbai but there is no significant difference at the level of confidence0.05 as
shown in table 8-(vii). So, the hypotheses is rejected. Length of service of employees
between 6-10 years (mean=79.88) showed the higher level of organizational
commitment than service up to 5years (mean=76.60) and service above 10 years
(mean=73.60).
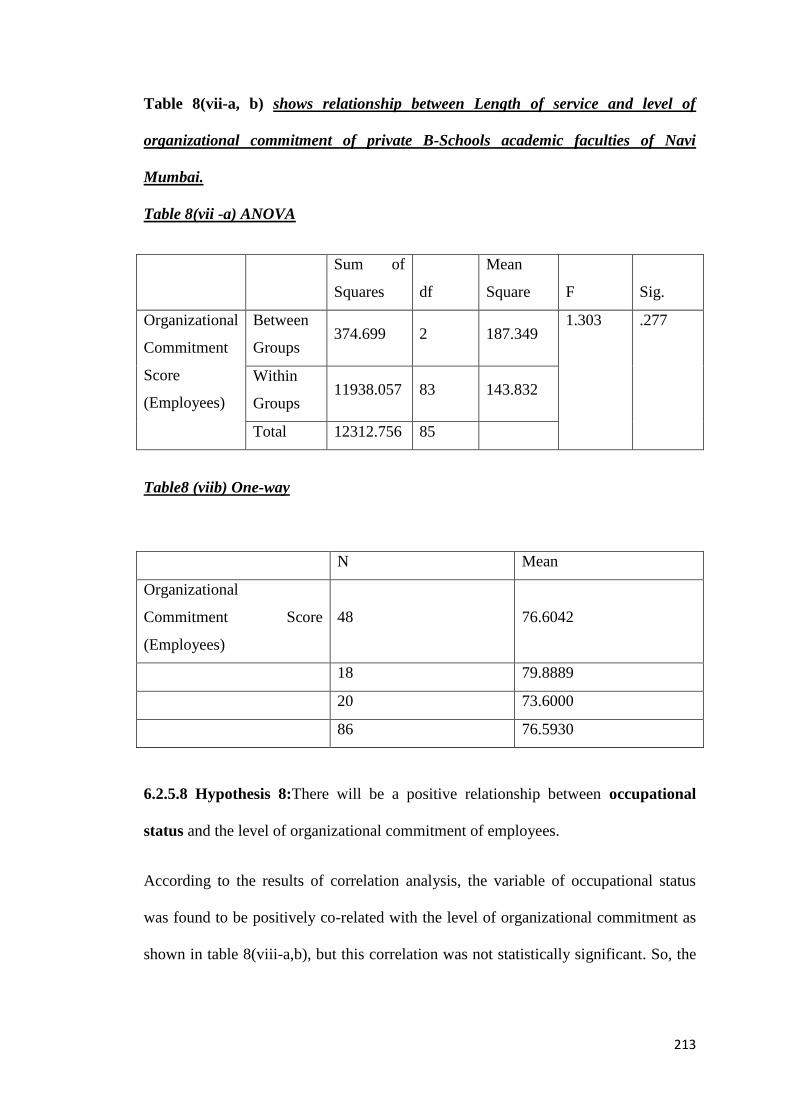
213
Table 8(vii-a, b) shows relationship between Length of service and level of
organizational commitment of private B-Schools academic faculties of Navi
Mumbai.
Table 8(vii -a) ANOVA
Sum of
Squares df
Mean
Square F Sig.
Organizational
Commitment
Score
(Employees)
Between
Groups 374.699 2 187.349
1.303 .277
Within
Groups 11938.057 83 143.832
Total 12312.756 85
Table8 (viib) One-way
N Mean
Organizational
Commitment Score
(Employees)
48 76.6042
18 79.8889
20 73.6000
86 76.5930
6.2.5.8 Hypothesis 8:There will be a positive relationship between occupational
status and the level of organizational commitment of employees.
According to the results of correlation analysis, the variable of occupational status
was found to be positively co-related with the level of organizational commitment as
shown in table 8(viii-a,b), but this correlation was not statistically significant. So, the
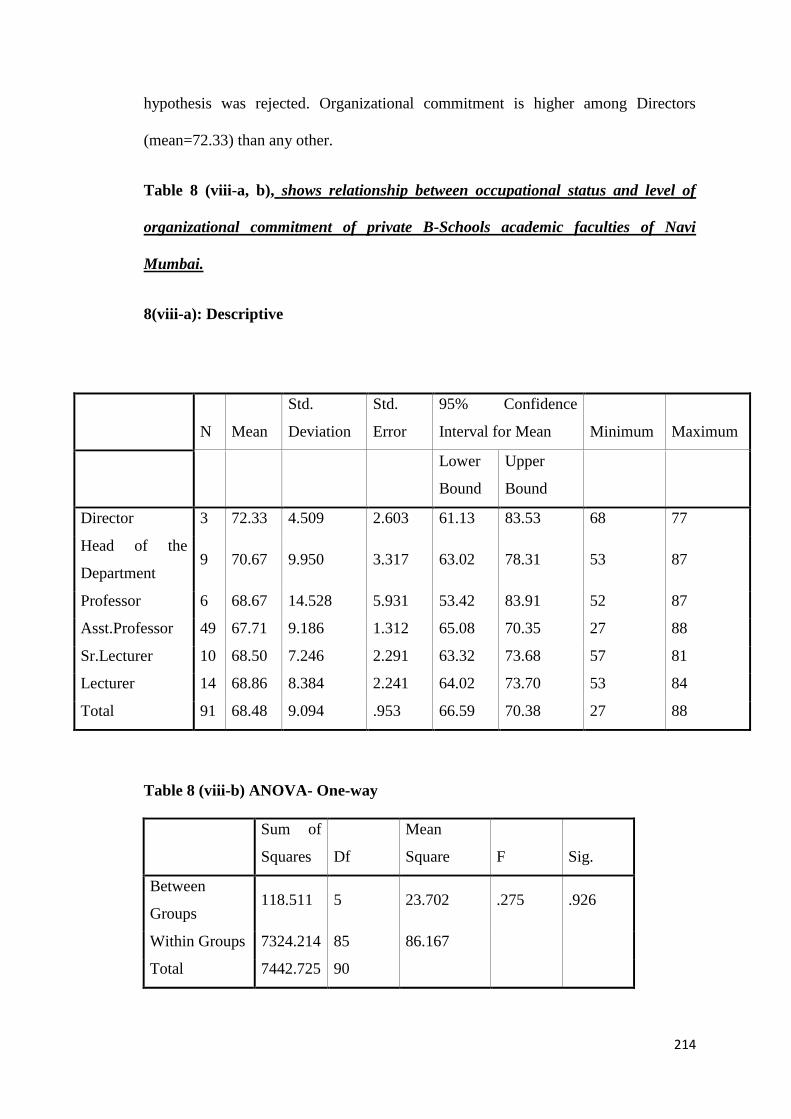
214
hypothesis was rejected. Organizational commitment is higher among Directors
(mean=72.33) than any other.
Table 8 (viii-a, b), shows relationship between occupational status and level of
organizational commitment of private B-Schools academic faculties of Navi
Mumbai.
8(viii-a): Descriptive
Table 8 (viii-b) ANOVA- One-way
Sum of
Squares Df
Mean
Square F Sig.
Between
Groups 118.511 5 23.702 .275 .926
Within Groups 7324.214 85 86.167
Total 7442.725 90
N Mean
Std.
Deviation
Std.
Error
95% Confidence
Interval for Mean Minimum Maximum
Lower
Bound
Upper
Bound
Director 3 72.33 4.509 2.603 61.13 83.53 68 77
Head of the
Department 9 70.67 9.950 3.317 63.02 78.31 53 87
Professor 6 68.67 14.528 5.931 53.42 83.91 52 87
Asst.Professor 49 67.71 9.186 1.312 65.08 70.35 27 88
Sr.Lecturer 10 68.50 7.246 2.291 63.32 73.68 57 81
Lecturer 14 68.86 8.384 2.241 64.02 73.70 53 84
Total 91 68.48 9.094 .953 66.59 70.38 27 88
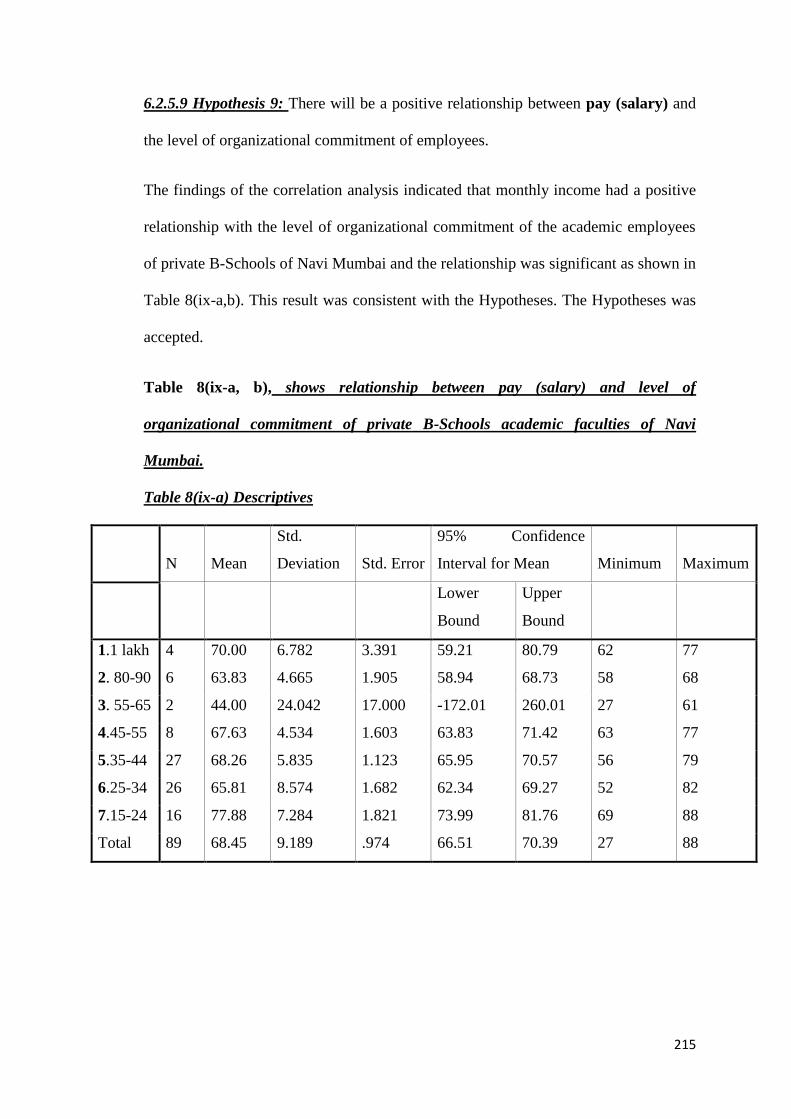
215
6.2.5.9 Hypothesis 9: There will be a positive relationship between pay (salary) and
the level of organizational commitment of employees.
The findings of the correlation analysis indicated that monthly income had a positive
relationship with the level of organizational commitment of the academic employees
of private B-Schools of Navi Mumbai and the relationship was significant as shown in
Table 8(ix-a,b). This result was consistent with the Hypotheses. The Hypotheses was
accepted.
Table 8(ix-a, b), shows relationship between pay (salary) and level of
organizational commitment of private B-Schools academic faculties of Navi
Mumbai.
Table 8(ix-a) Descriptives
N Mean
Std.
Deviation Std. Error
95% Confidence
Interval for Mean Minimum Maximum
Lower
Bound
Upper
Bound
1.1 lakh 4 70.00 6.782 3.391 59.21 80.79 62 77
2. 80-90 6 63.83 4.665 1.905 58.94 68.73 58 68
3. 55-65 2 44.00 24.042 17.000 -172.01 260.01 27 61
4.45-55 8 67.63 4.534 1.603 63.83 71.42 63 77
5.35-44 27 68.26 5.835 1.123 65.95 70.57 56 79
6.25-34 26 65.81 8.574 1.682 62.34 69.27 52 82
7.15-24 16 77.88 7.284 1.821 73.99 81.76 69 88
Total 89 68.45 9.189 .974 66.51 70.39 27 88

216
Table8 (ix-b) ANOVA
Sum of
Squares Df
Mean
Square F Sig.
Between
Groups 2942.340 6 490.390 8.961 .000
Within Groups 4487.682 82 54.728
Total 7430.022 88
6.2.5.10 Hypothesis 10: Single Employees will be more committed to their
organization than married employees.
To examine this hypothesis an Anova was performed. As shown in table 8(x-a) and
8(x-b), the result revealed that based on marital status, there was no significant
difference (F=1.479 and p=.228) in the level of organizational commitment between
the academic employees of the private B-Schools of Navi – Mumbai. Single
employees (mean=70.36) showed a higher level of commitment towards organization
than married employees (67.77) but this correlation was not statistically significant.
So the hypothesis was rejected.
Table 8(x-a, b), shows relationship between marital status and level of
organizational commitment of private B-Schools academic faculties of Navi
Mumbai.
N Mean
Std.
Deviation Std. Error
95% Confidence
Interval for Mean Minimum Maximum
Lower Bound
Upper
Bound
Married 66 67.77 9.283 1.143 65.49 70.05 27 87
Single 25 70.36 8.465 1.693 66.87 73.85 53 88
Total 91 68.48 9.094 .953 66.59 70.38 27 88

217
Table8(x-b) ANOVA
Sum of
Squares Df
Mean
Square F Sig.
Between
Groups 121.374 1 121.374 1.475 .228
Within Groups 7321.351 89 82.262
Total 7442.725 90
6.2.5.11 Hypothesis 11: Female Gender will be more committed to their organization
than the Male Gender.
To examine this hypothesis an Anova was performed. As shown in table 8(xi-a) and
8(xi-b), the result revealed that based on gender, there was no significant difference
(F=.746 and p=.390) in the level of organizational commitment between the academic
employees of the private B-Schools of Navi – Mumbai. This result was not consistent
with the Hypotheses. The Hypotheses was rejected. Male gender showed
(mean=69.55) higher level of organizational commitment than the female counterparts
(mean=67.72)
Table 8 (xi-a, b), shows relationship between gender and level of organizational
commitment of private B-Schools academic faculties of Navi Mumbai.
Table 8 (xi-a) T-Test
Group Statistics:
p3q7
Gender N Mean
Std.
Deviation
Std.
Error
Mean
EC_Scr Male 38 69.55 9.543 1.548
Female 53 67.72 8.769 1.205

218
Table 8(xi-b) Independent Samples Test
6.2.6 Conclusion:
Consistent with what this study hypothesized, the results revealed that both
transformational and transactional leadership styles had a positive impact on the level
of organizational commitment of employees. These findings support the results of
other scholarly studies. Bass and Avolio (1994) stated that both transformational and
transactional leadership style enhance the level of commitment to the organization
among employees. In other research, the positive relationship between
transformational leadership style and the level of organizational commitment was
emphasized.(Bateman & Strasser,1984;Bycio et al.,1995;Michael &
Sector,1982;Morris and Sherman,1981). The effects of both styles on organizational
commitment were consistent with Bass‘s augmentation theory of leadership. Bass‘s
augmentation theory of leadership postulates that successful leaders are both
Levene's Test
for Equality
of Variances t-test for Equality of Means
F Sig. t df
Sig.
(2-
tailed)
Mea
n
Diffe
rence
Std.
Error
Differen
ce
95% Confidence
Interval of the
Difference
Lower Upper
OC_Scr Equal
variance
s
assumed
.746 .390 .949 89 .345 1.83
6 1.934 -2.007 5.679
Equal
variance
s not
assumed
.936 75.638 .352 1.83
6 1.961 -2.071 5.743
219
transformational and transactional .Based on this theory transformational and
transactional leadership styles should have positive effects on level of organizational
commitment of employees and this is what this study demonstrated. The findings
showed that transformational and transactional leadership styles positively affected
organisational commitment. The results also indicated that transformational
leadership styles had a greater impact on the level of organizational commitment of
employees compared to transactional leadership style. This could be attributed to two
factors; first, the transformational leadership focuses more on the human side of
individuals and second, the transformational leadership component s may be more in
practice among the educational institutes than other service industries. In relation to
this, Carlson and Perrewe (1995) stated that, ―When transformational leadership is
enacted, members of organization no longer seek merely self interest, but that which
is beneficial to the organization as a whole‖ (P.832).
The findings of this study revealed that there was a significant positive relationship
between pay (salary) and the level of organizational commitment of employees. A
logical explanation for such a relationship is that pay or monthly income is one of the
most important factors that examines employees attitude towards their organization.
This finding supports previous research studies (AL-Khatany, 1998; Angle and Perry,
1983; Becker, 1960). An explanation of this finding could be that since money being
one of the main criteria to keep one committed to the service and reduce attrition and
the raising expenses due to consumerism, the monthly income (salary) plays a major
in maintaining the organizational commitment of the employees. Individuals satisfied
with their salaries are likely to develop more positive attitudes toward their
organization including organizational commitment.
220
To conclude, the complete model demonstrated the importance of this study through
its explanation of more of the total variation in the level of organizational
commitment of B-schools employees of Navi- Mumbai. In addition the model
suggested that the most committed employee is the one who is older, is educated with
the degree which just satisfy the UGC norms with no higher doctoral degrees, is in
higher grade, has a higher salary, has served longer, is married, and works under a
leader who is more transformational, more transactional, less laissez- Faire, and uses
leadership methods that satisfy followers.
6.3 Description of Respondent‟s Characteristics of the main Research Study
The questionnaire used for this study included seven items concerning the
respondent‘s characteristics. All the respondents were academic faculties of B-
Schools of Maharashtra. They were asked about their age, education, marital status,
occupational status, salary (monthly income), length of service and internal
promotional period.
6.3.1Age
The age range of the respondents was from 20 to 50 years and above. Table 9-(i)
shows the frequency and percentages of the respondents by age. It indicates that the
plurality of respondents (58.6%) were between the ages of 20 and 29, and the lowest
numbers of respondents (9.3%) were aged 40 or above. It also reveals that 32.1% 0f
the respondents were between the ages of 30 and 39.
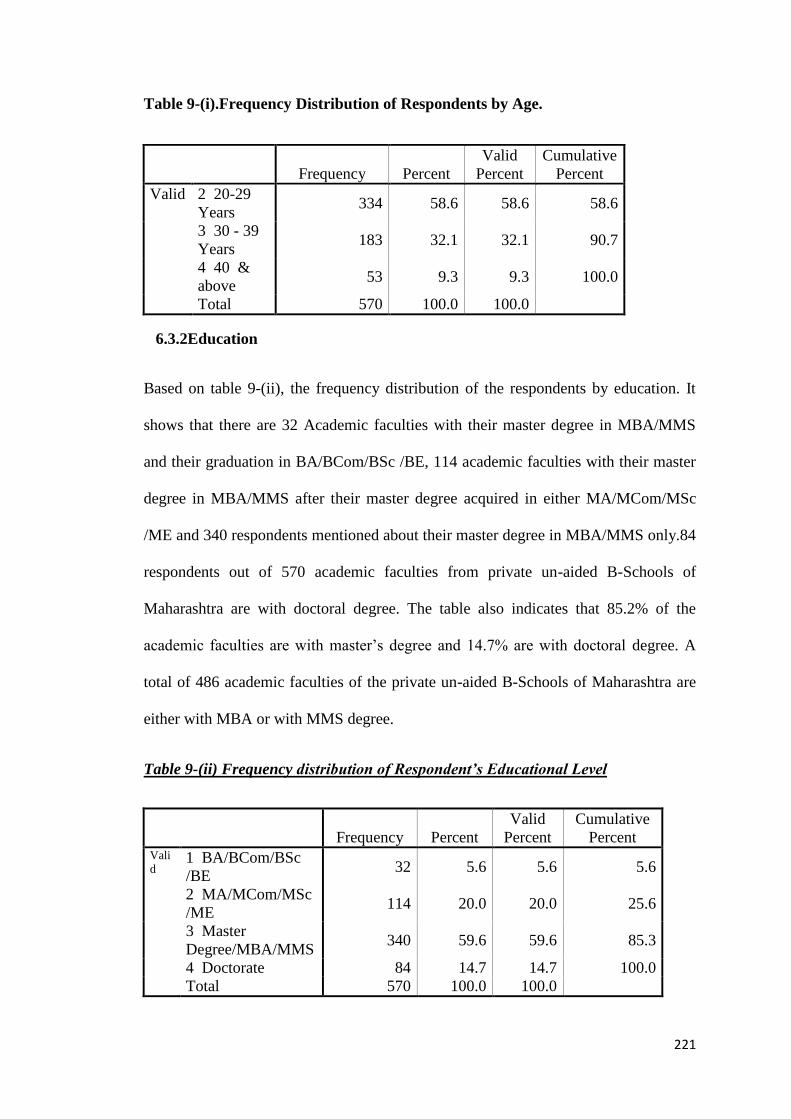
221
Table 9-(i).Frequency Distribution of Respondents by Age.
Frequency Percent
Valid
Percent
Cumulative
Percent
Valid 2 20-29
Years 334 58.6 58.6 58.6
3 30 - 39
Years 183 32.1 32.1 90.7
4 40 &
above 53 9.3 9.3 100.0
Total 570 100.0 100.0
6.3.2Education
Based on table 9-(ii), the frequency distribution of the respondents by education. It
shows that there are 32 Academic faculties with their master degree in MBA/MMS
and their graduation in BA/BCom/BSc /BE, 114 academic faculties with their master
degree in MBA/MMS after their master degree acquired in either MA/MCom/MSc
/ME and 340 respondents mentioned about their master degree in MBA/MMS only.84
respondents out of 570 academic faculties from private un-aided B-Schools of
Maharashtra are with doctoral degree. The table also indicates that 85.2% of the
academic faculties are with master‘s degree and 14.7% are with doctoral degree. A
total of 486 academic faculties of the private un-aided B-Schools of Maharashtra are
either with MBA or with MMS degree.
Table 9-(ii) Frequency distribution of Respondent‟s Educational Level
Frequency Percent
Valid
Percent
Cumulative
Percent Vali
d 1 BA/BCom/BSc
/BE 32 5.6 5.6 5.6
2 MA/MCom/MSc
/ME 114 20.0 20.0 25.6
3 Master
Degree/MBA/MMS 340 59.6 59.6 85.3
4 Doctorate 84 14.7 14.7 100.0 Total 570 100.0 100.0

222
6.3.3Marital Status
Based on table 9 (iii), which shows the frequency distribution of the respondents by
their marital status. It shows that 424 of the respondents of the private un-aided B-
Schools of Maharashtra were married and 143 of the respondents were un-married. A
very low score of 3 respondents were divorced and none are widow. In other words it
states that 74.4% of the population from whom the data were collected are married,
25.1% are un-married and 5% are divorced.
Table 9-(iii) shows frequency distribution of respondents by Marital Status.
Frequency Percent
Valid
Percent
Cumulative
Percent Valid 1
Married 424 74.4 74.4 74.4
2 Single 143 25.1 25.1 99.5 3
Divorced 3 .5 .5 100.0
Total 570 100.0 100.0
6.3.4 Occupational Status
Table 9(iv) shows frequency distribution of respondents by their occupational status.
Table 9(iv) in detail shows that the pluralities of respondents (51.6%) are in the
middle level category, that is the Assistant Professors, followed by 29.5.% of
respondents who are lecturers;111.4% are Associate Professors and 7.5% belong to
the Professor category. In other words, the majority of the respondents i.e., 294 of the
population of the academic faculties of private un-aided B-Schools of Maharashtra
belong to the category of Assistant Professor, 168 were Lecturer, 65 of them were
Associate Professors and 43 of them were Professors.

223
Table 9-(iv) shows frequency distribution of respondents by Occupational Status.
Frequency Percent
Valid
Percent
Cumulative
Percent
Valid 1 Lecturer 168 29.5 29.5 29.5
2 Assistant
Professor 294 51.6 51.6 81.1
3 Associate
Professor 65 11.4 11.4 92.5
4 Professor 43 7.5 7.5 100.0
Total 570 100.0 100.0
6.3.5 Salary (Monthly Income)
Respondents are asked about their monthly income or salary. The respondents are
asked to choose the category indicating their monthly income. Table 9(v) indicates
that the majority of respondents (76.3%) falls in high income group that is 45K per
month and above, 15.8%% of the respondents falls within 35k-44k per month, 4.9%
falls within the earning of 25k-34k per month and a very low percentage of 3% falls
within 15k-24k as their monthly income. In other words 435 respondents gets a
monthly salary above 45k per month,90 respondents gets within 35k-44k per month
as their salary,28 respondents gets a salary within 25k-34k per month, and only 17
respondents gets salary within 15k-24k per month.
Table 9-(v) shows frequency distribution of respondents by Salary (Monthly
income)
Frequency Percent
Valid
Percent
Cumulative
Percent
Valid 1 45 k and
above 435 76.3 76.3 76.3
2 35-44 k 90 15.8 15.8 92.1
3 25-34 k 28 4.9 4.9 97.0
4 15-24k 17 3.0 3.0 100.0
Total 570 100.0 100.0

224
6.3.6 Length of Service
Respondents were asked to report how long they worked in their present institute. The
respondents were asked to select the category that indicates the number of years they
had spent working in the institute. As shown in table 9(vi), many respondents (324)
about 56.8% have been employed up to 5 years in private un-aided B-schools of
Maharashtra, The table also shows that 31.8%% of the (181) respondents have
worked for 6-10 years. The remaining 11.4% of the (65) respondents have worked for
10years and above in the currently employed private un-aided B-Schools of
Maharashtra.
Table 9-(vi) shows frequency distribution of respondents by Length of service.
Frequency Percent
Valid
Percent
Cumulative
Percent Valid 1 Upto 5 yrs 324 56.8 56.8 56.8 2 6-10 yrs. 181 31.8 31.8 88.6 3 10+ 65 11.4 11.4 100.0 Total 570 100.0 100.0
6.3.7 Gender
Table 9-(vii) shows that 44.7% of the respondents are males in the private un-aided B-
Schools of Maharashtra of the study and 55.3. % of the respondents was Females in
the private un-aided B-Schools of Maharashtra. In other words out of the 570
respondent‘s data analysed for the study, 255 were males and 315 were females
working in the private un-aided B-Schools of Maharashtra as the academic faculty .
Table 9-(vii) shows frequency distribution of respondents by Gender.
Frequency Percent
Valid
Percent
Cumulative
Percent
Valid 1 Male 255 44.7 44.7 44.7
2
Female 315 55.3 55.3 100.0
Total 570 100.0 100.0

225
6.3.8 Internal Promotion
Table 9-(viii) shows that 52.8% of the academic faculties have experienced internal
promotion within a period of 0-2 years in their currently pursued employment in the
private un-aided B-Schools of Maharashtra,13.3% have experienced internal
promotion within the time span of 3-6years and .7% have experienced internal
promotion within the time span of 7-10years.In other words 301 academic faculties
had promotion within 0-2years,76 employees within 3-6years and 4 faculties within 7-
10years of service in the currently employed private un-aided B-School of
Maharashtra.
Table 9-(viii) shows frequency distribution of respondents by internal promotion
taken place within the particular time span.
Frequency Percent
Valid
Percent
Cumulative
Percent
Vali
d
1 0-2 years 301 52.8 79.0 79.0
2 3-6 years 76 13.3 19.9 99.0
3 7 - 10 years 4 .7 1.0 100.0
Total 381 66.8 100.0
Mis
sing
System 189 33.2
Total 570 100.0
6.4 Statistical Results
In order to examine the validity of using regression techniques in this study, the
correlations among the independent variables were computed. The results of the
present study indicated that all independent variables of the Multifactor Leadership
Questionnaire (MLQ) and Organizational Commitment Questionnaire utilized in this
study did not reach the level of correlation of .8.According to Lewis – Beck (1980),
multicollinearity is not a problem if the highest correlation among independent
variables is less than .8. In addition, correlation analysis among all the sub-scales of
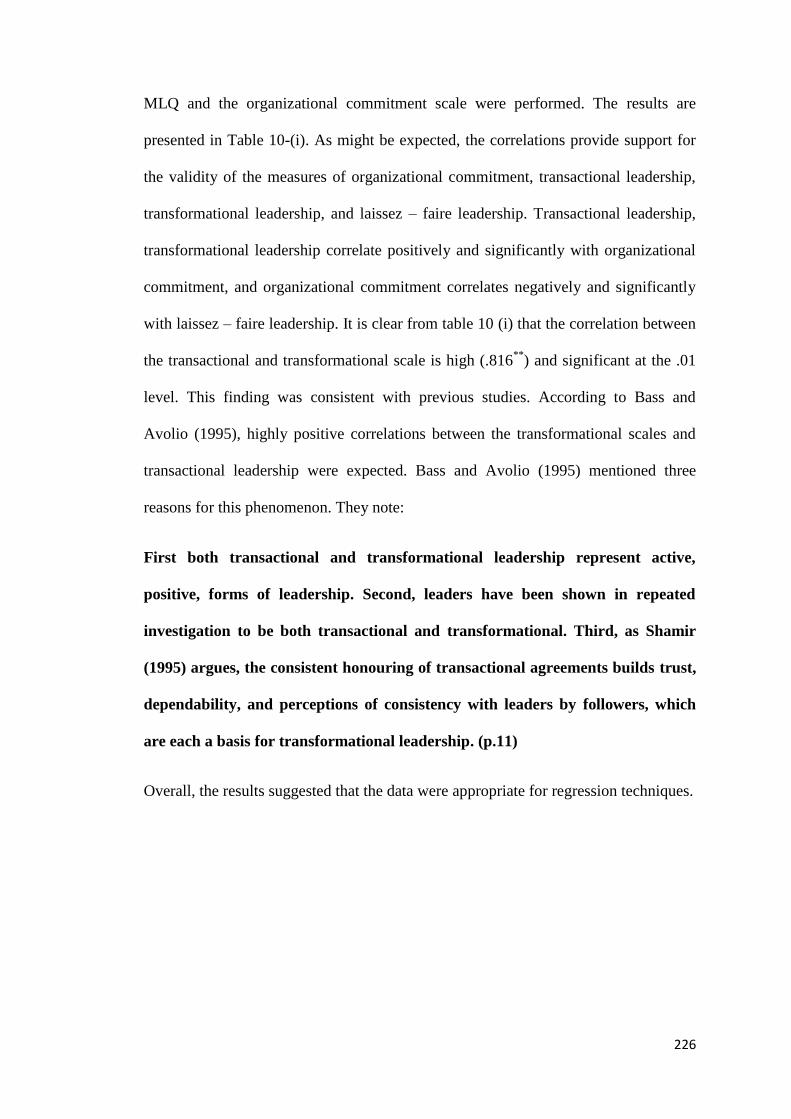
226
MLQ and the organizational commitment scale were performed. The results are
presented in Table 10-(i). As might be expected, the correlations provide support for
the validity of the measures of organizational commitment, transactional leadership,
transformational leadership, and laissez – faire leadership. Transactional leadership,
transformational leadership correlate positively and significantly with organizational
commitment, and organizational commitment correlates negatively and significantly
with laissez – faire leadership. It is clear from table 10 (i) that the correlation between
the transactional and transformational scale is high (.816**
) and significant at the .01
level. This finding was consistent with previous studies. According to Bass and
Avolio (1995), highly positive correlations between the transformational scales and
transactional leadership were expected. Bass and Avolio (1995) mentioned three
reasons for this phenomenon. They note:
First both transactional and transformational leadership represent active,
positive, forms of leadership. Second, leaders have been shown in repeated
investigation to be both transactional and transformational. Third, as Shamir
(1995) argues, the consistent honouring of transactional agreements builds trust,
dependability, and perceptions of consistency with leaders by followers, which
are each a basis for transformational leadership. (p.11)
Overall, the results suggested that the data were appropriate for regression techniques.
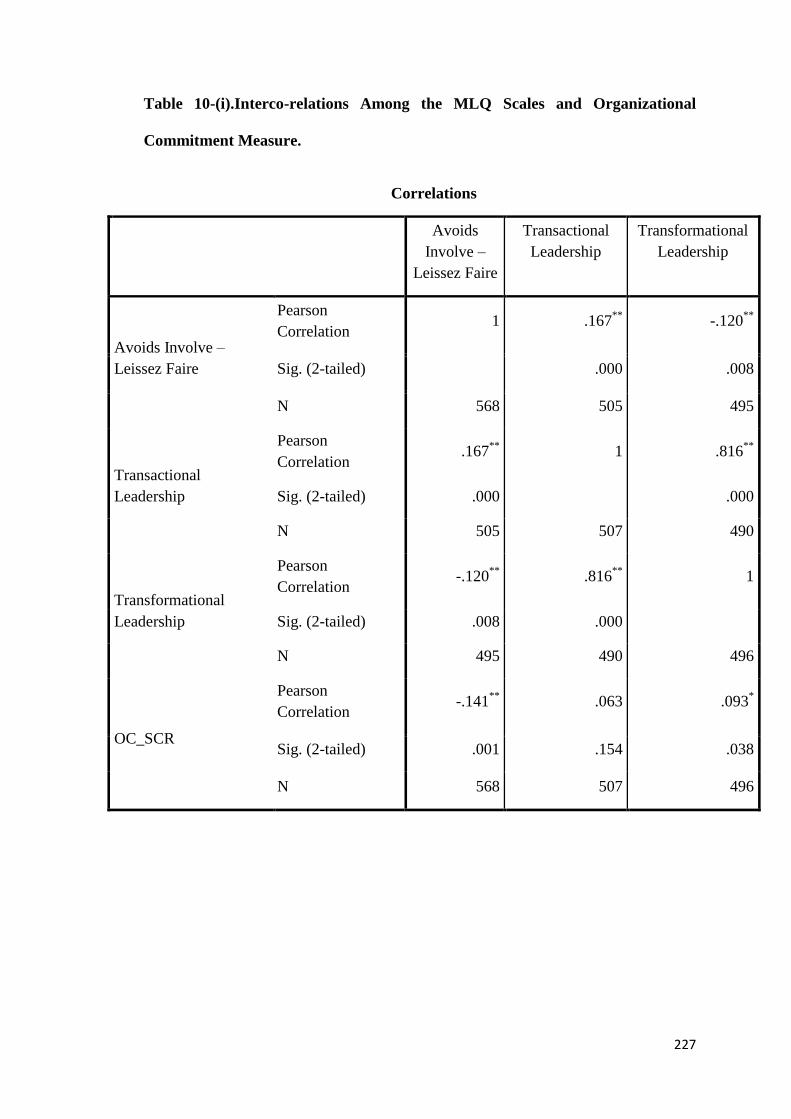
227
Table 10-(i).Interco-relations Among the MLQ Scales and Organizational
Commitment Measure.
Correlations
Avoids
Involve –
Leissez Faire
Transactional
Leadership
Transformational
Leadership
Avoids Involve –
Leissez Faire
Pearson
Correlation 1 .167
** -.120
**
Sig. (2-tailed) .000 .008
N 568 505 495
Transactional
Leadership
Pearson
Correlation .167
** 1 .816
**
Sig. (2-tailed) .000 .000
N 505 507 490
Transformational
Leadership
Pearson
Correlation -.120
** .816
** 1
Sig. (2-tailed) .008 .000
N 495 490 496
OC_SCR
Pearson
Correlation -.141
** .063 .093
*
Sig. (2-tailed) .001 .154 .038
N 568 507 496
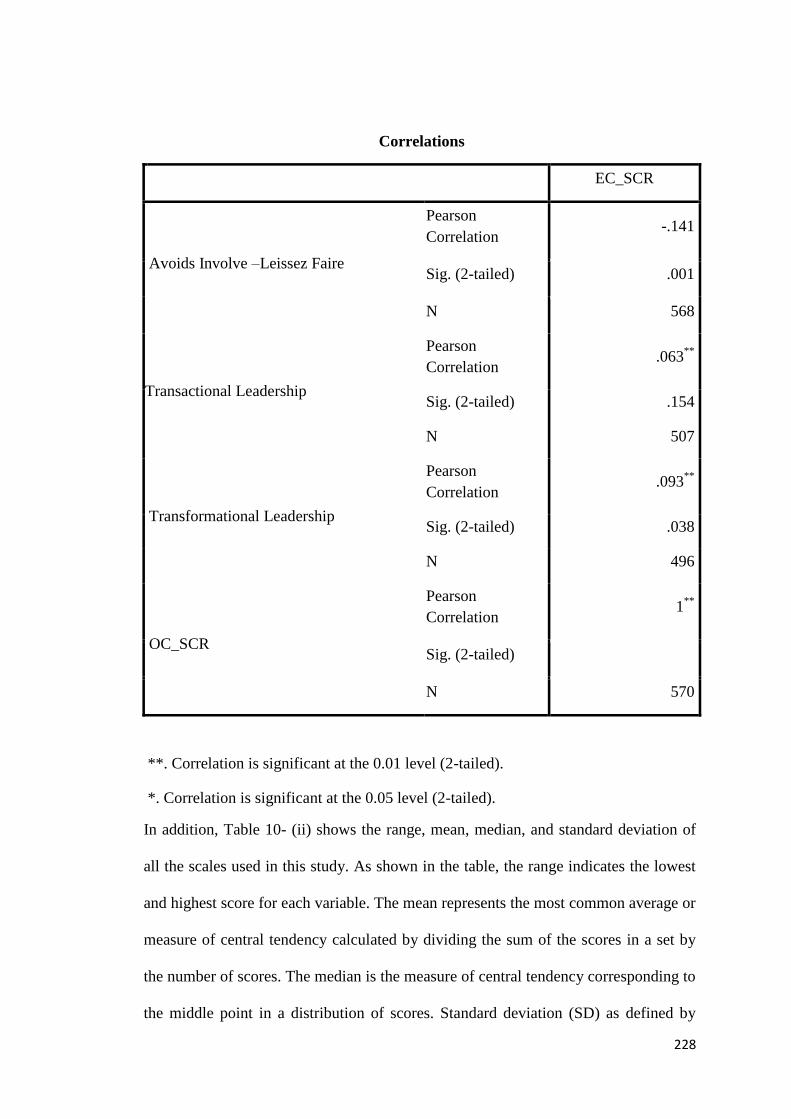
228
Correlations
EC_SCR
Avoids Involve –Leissez Faire
Pearson
Correlation -.141
Sig. (2-tailed) .001
N 568
Transactional Leadership
Pearson
Correlation .063
**
Sig. (2-tailed) .154
N 507
Transformational Leadership
Pearson
Correlation .093
**
Sig. (2-tailed) .038
N 496
OC_SCR
Pearson
Correlation 1
**
Sig. (2-tailed)
N 570
**. Correlation is significant at the 0.01 level (2-tailed).
*. Correlation is significant at the 0.05 level (2-tailed).
In addition, Table 10- (ii) shows the range, mean, median, and standard deviation of
all the scales used in this study. As shown in the table, the range indicates the lowest
and highest score for each variable. The mean represents the most common average or
measure of central tendency calculated by dividing the sum of the scores in a set by
the number of scores. The median is the measure of central tendency corresponding to
the middle point in a distribution of scores. Standard deviation (SD) as defined by

229
Gall et al. (1996) is ―A measure of the extent to which the scores in a distribution
deviate from their mean‖ (p.770).
The transactional leadership scale consisted of 08 items representing three subscales,
contingent rewards, and management by exception (active), and management by
exception (passive). The scoring range in the instrument for this variable was between
one and five. Therefore, the lowest score for transactional would be 8 and the highest
score would be 40. Specifically; the Heads/Deans/Directors of the private un-aided B-
Schools of Maharashtra were categorized based on their percentage scores as follows:
Between 0 and 20 they were not transactional, between 21 and 40 they were rarely
transactional, between 41 and 60 they were little transactional, between 61 and 80
they were fairly transactional and between 81 and 100 the leaders were highly
transactional.
Table 10-(ii).Range (%), Mean, Median, and Standard Deviation of all the
Variables
Commitment
Transfor
mational
(Exp)
Transactiona
l (Exp)
Transfor
mational
(P)
Transacti
onal (P)
N
Valid 570 570 570 570 570
Mean 63.3860 83.8070 57.7827 72.4759 54.8709
Median 64.4444 85.0000 58.3333 73.7500 55.5556
Std. Deviation 13.06520 11.71606 8.65627 15.24665 12.69931
Range 83.33(15-
105)
58.75(18
-90) 69.44(8-40) 83.75 88.89
Since the transformational leadership scale consisted of 18 items scored between one
and five, the range was between 18-90 (as shown in Table 10-(ii).The higher the
percentage score ,the more transformational the Heads/Deans/Directors, and the
lower score, the less transformational the Heads/Deans/Directors. Specifically
230
according to their percentage scores, the Heads/Deans/Directors were characterized as
follows: Between 0 and 20 they were not transformational, between 21 and 40 they
were rarely transformational, between 41 and 60 they were little transformational,
between 61 and 80 they were fairly transformational and between 81 and 100 the
leaders were highly transformational.
The laissez – faire leadership scale consisted of four items with each item having a
score between one and five. Therefore, the range for this style was between 4 and
20.The higher the score, the more laissez-faire the Head of the Institute, and the lower
the score the less laissez-faire the Head/Dean/Director. Finally, the scale that
measured organizational commitment was made up of 15 statements. Each statement
had a score of between 1 and 7. Therefore, the range was between 15 and 105.The
employees who had a score less than33 were considered to be less committed to the
institute. Those who had a score between 34-66 are moderately committed to the
institute. And the academic faculties of the private un-aided B-Schools of
Maharashtra who had a score above 66 were considered to be highly committed to the
Institute.
6.5 Testing the Expectations and Hypotheses of the main Research Study
The research expectations and hypotheses of this study addressed the field of
leadership and employee commitment. This section deals with testing these
expectations and hypotheses. In the current study, there were 4 expectations and 13
hypotheses tested. To test these expectations and hypotheses, some appropriate
statistical tools such as frequency analysis, Correlation Analysis, Analysis of Variance
(ANOVA), and simple individual regression techniques were used.
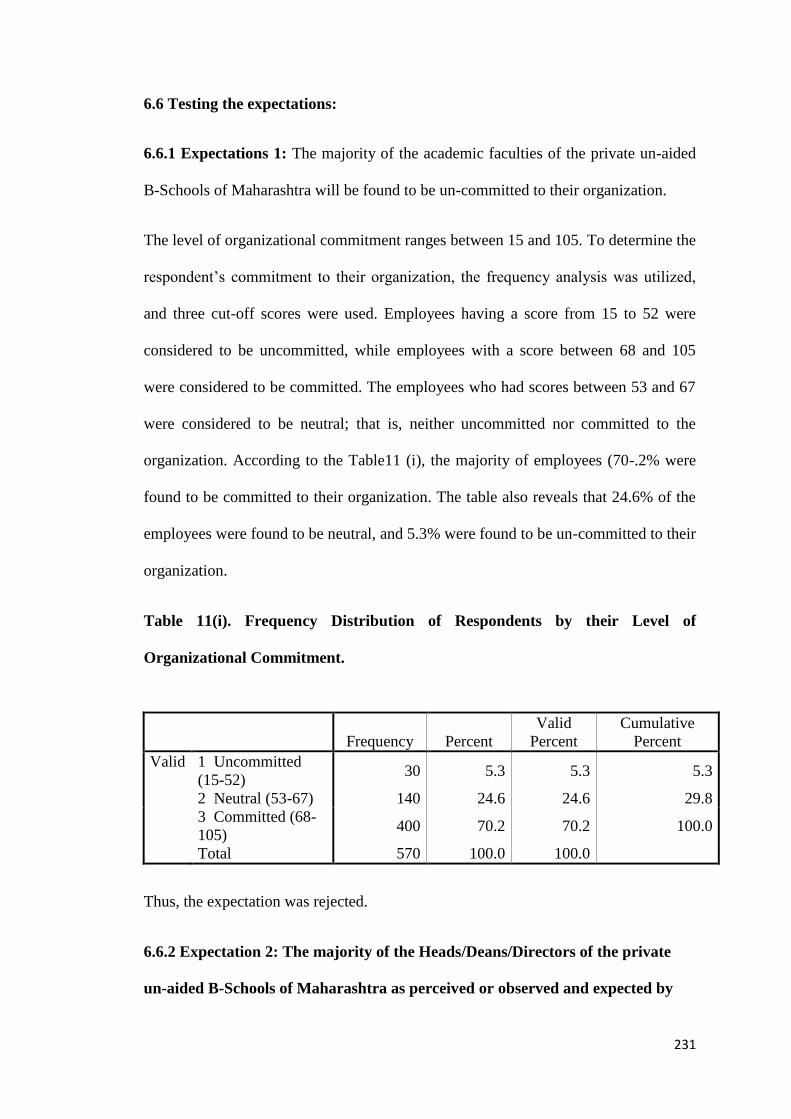
231
6.6 Testing the expectations:
6.6.1 Expectations 1: The majority of the academic faculties of the private un-aided
B-Schools of Maharashtra will be found to be un-committed to their organization.
The level of organizational commitment ranges between 15 and 105. To determine the
respondent‘s commitment to their organization, the frequency analysis was utilized,
and three cut-off scores were used. Employees having a score from 15 to 52 were
considered to be uncommitted, while employees with a score between 68 and 105
were considered to be committed. The employees who had scores between 53 and 67
were considered to be neutral; that is, neither uncommitted nor committed to the
organization. According to the Table11 (i), the majority of employees (70-.2% were
found to be committed to their organization. The table also reveals that 24.6% of the
employees were found to be neutral, and 5.3% were found to be un-committed to their
organization.
Table 11(i). Frequency Distribution of Respondents by their Level of
Organizational Commitment.
Frequency Percent
Valid
Percent
Cumulative
Percent
Valid 1 Uncommitted
(15-52) 30 5.3 5.3 5.3
2 Neutral (53-67) 140 24.6 24.6 29.8
3 Committed (68-
105) 400 70.2 70.2 100.0
Total 570 100.0 100.0
Thus, the expectation was rejected.
6.6.2 Expectation 2: The majority of the Heads/Deans/Directors of the private
un-aided B-Schools of Maharashtra as perceived or observed and expected by
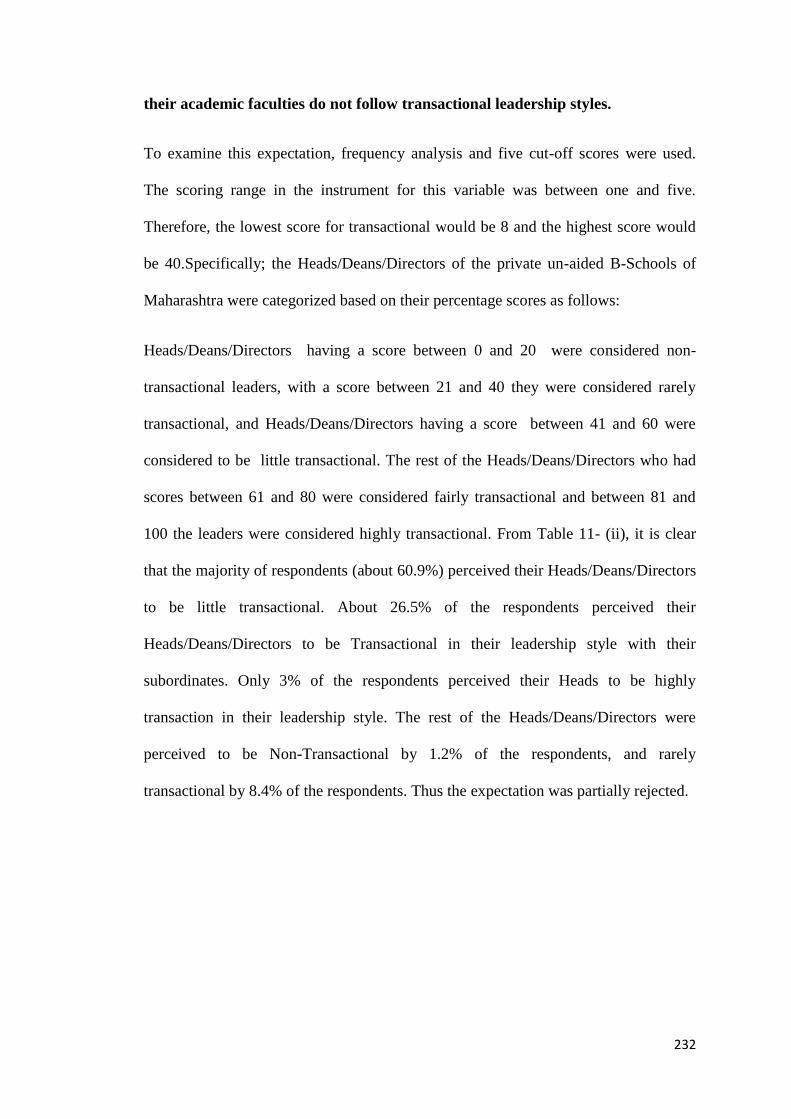
232
their academic faculties do not follow transactional leadership styles.
To examine this expectation, frequency analysis and five cut-off scores were used.
The scoring range in the instrument for this variable was between one and five.
Therefore, the lowest score for transactional would be 8 and the highest score would
be 40.Specifically; the Heads/Deans/Directors of the private un-aided B-Schools of
Maharashtra were categorized based on their percentage scores as follows:
Heads/Deans/Directors having a score between 0 and 20 were considered non-
transactional leaders, with a score between 21 and 40 they were considered rarely
transactional, and Heads/Deans/Directors having a score between 41 and 60 were
considered to be little transactional. The rest of the Heads/Deans/Directors who had
scores between 61 and 80 were considered fairly transactional and between 81 and
100 the leaders were considered highly transactional. From Table 11- (ii), it is clear
that the majority of respondents (about 60.9%) perceived their Heads/Deans/Directors
to be little transactional. About 26.5% of the respondents perceived their
Heads/Deans/Directors to be Transactional in their leadership style with their
subordinates. Only 3% of the respondents perceived their Heads to be highly
transaction in their leadership style. The rest of the Heads/Deans/Directors were
perceived to be Non-Transactional by 1.2% of the respondents, and rarely
transactional by 8.4% of the respondents. Thus the expectation was partially rejected.
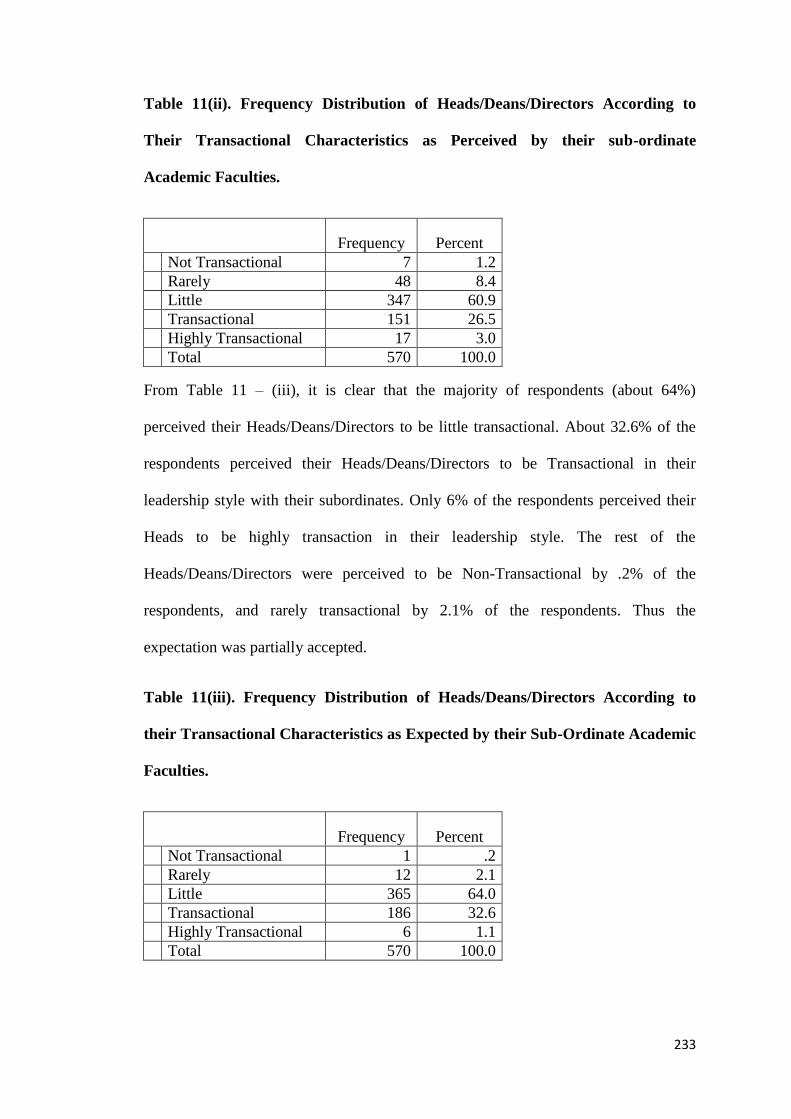
233
Table 11(ii). Frequency Distribution of Heads/Deans/Directors According to
Their Transactional Characteristics as Perceived by their sub-ordinate
Academic Faculties.
Frequency Percent Not Transactional 7 1.2 Rarely 48 8.4 Little 347 60.9 Transactional 151 26.5 Highly Transactional 17 3.0 Total 570 100.0
From Table 11 – (iii), it is clear that the majority of respondents (about 64%)
perceived their Heads/Deans/Directors to be little transactional. About 32.6% of the
respondents perceived their Heads/Deans/Directors to be Transactional in their
leadership style with their subordinates. Only 6% of the respondents perceived their
Heads to be highly transaction in their leadership style. The rest of the
Heads/Deans/Directors were perceived to be Non-Transactional by .2% of the
respondents, and rarely transactional by 2.1% of the respondents. Thus the
expectation was partially accepted.
Table 11(iii). Frequency Distribution of Heads/Deans/Directors According to
their Transactional Characteristics as Expected by their Sub-Ordinate Academic
Faculties.
Frequency Percent
Not Transactional 1 .2
Rarely 12 2.1
Little 365 64.0
Transactional 186 32.6
Highly Transactional 6 1.1
Total 570 100.0
234
6.6.3 Expectation 3: The majority of the Heads/Deans/Directors of the private
un-aided B-Schools of Maharashtra as perceived or observed and expected by
their academic faculties follow transformational leadership styles.
The results as shown in Table 11 – (iv& v) reveal, on the one hand, that a plurality
(about 47.2%) perceived/observed and (about 61.9%) expected their immediate
supervisor as transformational and highly transformational respectively. On the other
hand, (about 31.4%) perceived/observed and (about 34.4%) expected their immediate
supervisors to be Highly Transformational and Transformation in their leadership
respectively. Respondents who reported that their Heads/Deans/Directors are little
transformational as in both perceived and expected were 18.1% and 3.7%
respectively. Respondents who perceived/observed that their Heads/Deans/Directors
are rarely transformational totalled 3.0%, while .4% rated their
Heads/Deans/Directors as Not-Transformational. The score expected by the
respondents for rarely and not Transformational was nil.
P.T.O
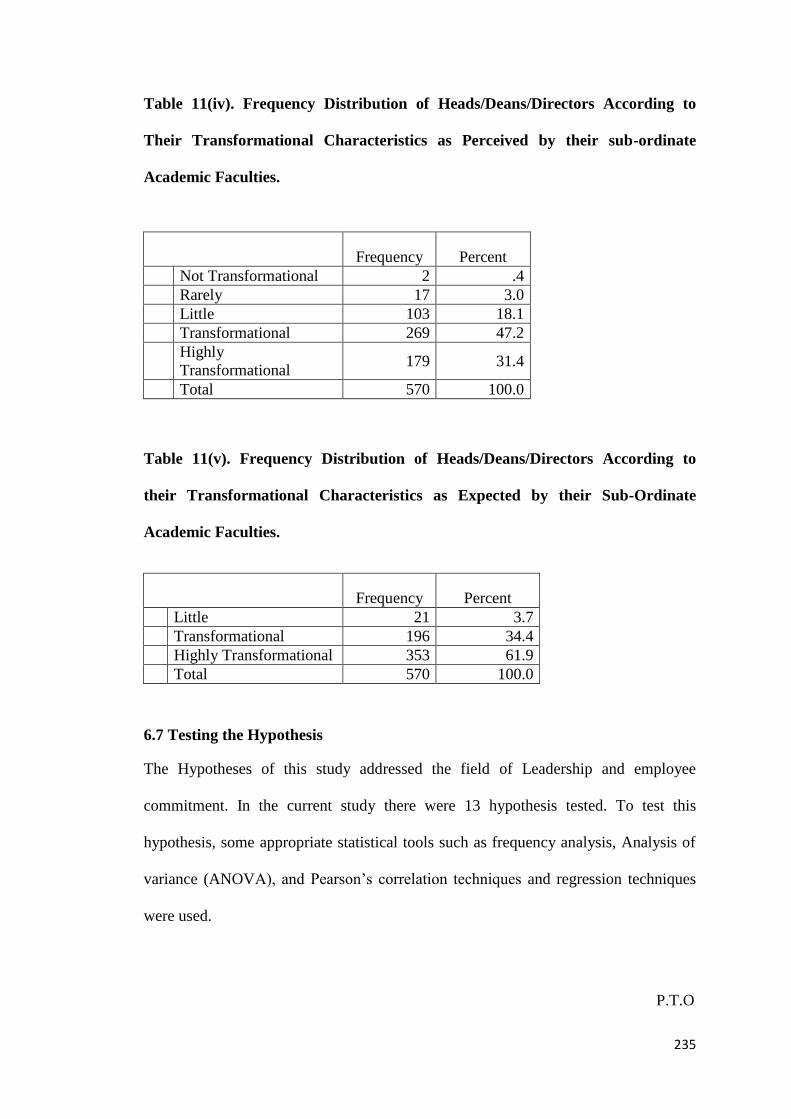
235
Table 11(iv). Frequency Distribution of Heads/Deans/Directors According to
Their Transformational Characteristics as Perceived by their sub-ordinate
Academic Faculties.
Frequency Percent
Not Transformational 2 .4
Rarely 17 3.0
Little 103 18.1
Transformational 269 47.2
Highly
Transformational 179 31.4
Total 570 100.0
Table 11(v). Frequency Distribution of Heads/Deans/Directors According to
their Transformational Characteristics as Expected by their Sub-Ordinate
Academic Faculties.
Frequency Percent Little 21 3.7 Transformational 196 34.4 Highly Transformational 353 61.9 Total 570 100.0
6.7 Testing the Hypothesis
The Hypotheses of this study addressed the field of Leadership and employee
commitment. In the current study there were 13 hypothesis tested. To test this
hypothesis, some appropriate statistical tools such as frequency analysis, Analysis of
variance (ANOVA), and Pearson‘s correlation techniques and regression techniques
were used.
P.T.O

236
Hypothesis Testing 1
6.7.1 H11: The Transformational Leadership Style (as observed and expected) of the
Heads of the Departments/Directors has a positive impact on the level of employees‟
commitment of private un-aided B-Schools of Maharashtra.
As shown in Table 12-(i), the regression coefficient (B) indicated that there was a
positive relationship between the transformational leadership style of the
dean/director/heads as perceived or observed by the academic faculties of private un-
aided B-Schools of Maharashtra and organizational commitment of employees at a
significant level (t=4.516, p=.000). For each increment in one standard deviation unit
of the level of the transformational leadership Dean‘s/head‘s/director‘s style, the
expected value of the level of employee‘s organizational commitment increases by a
standard deviation of .186. The results were consistent with the hypothesis. Therefore,
the hypothesis was accepted.
But according to Table 12-(ii) , the regression coefficient (B) indicated that there was
a positive relationship between the transformational leadership style of the
dean/director/heads as expected by the academic faculties of private un-aided B-
Schools of Maharashtra and organizational commitment of employees at a significant
level (t=1.978, p=.048). For each increment in one standard deviation unit of the level
of the transformational leadership Dean‘s/head‘s/director‘s style, the expected value
of the level of employee‘s organizational commitment increases by a standard
deviation of .083.The result confirm the hypothesis, therefore the hypothesis gets
accepted.
P.T.O
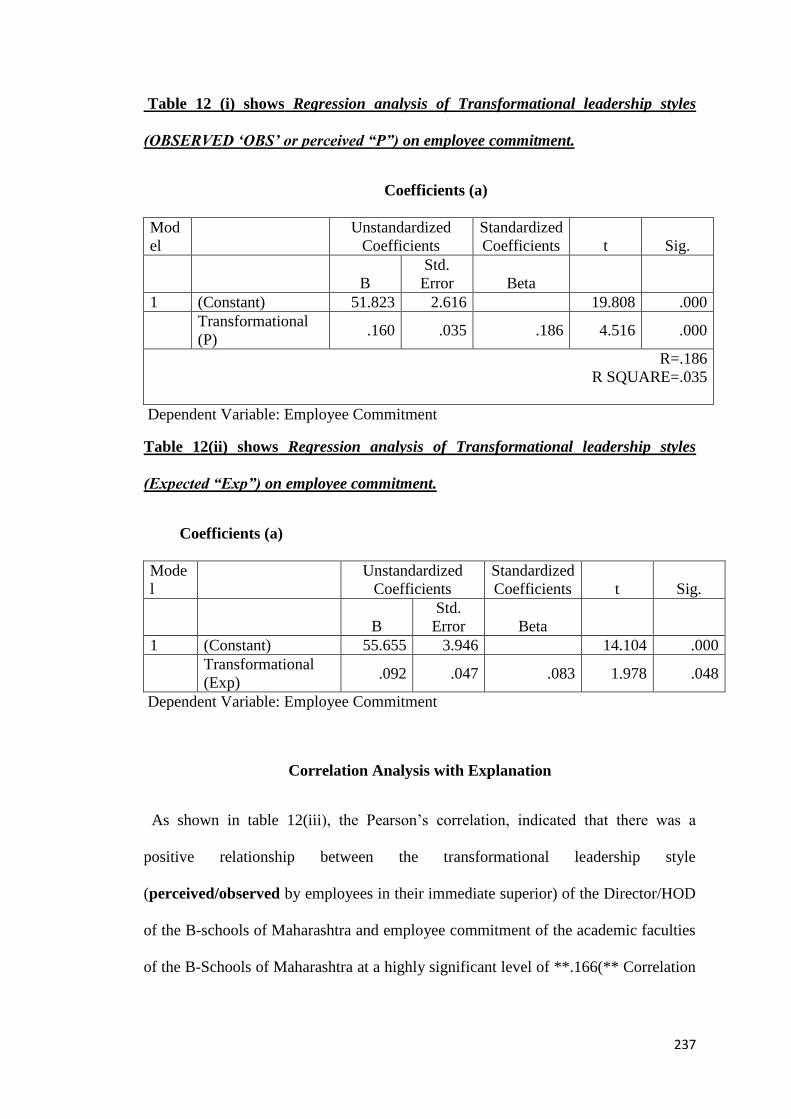
237
Table 12 (i) shows Regression analysis of Transformational leadership styles
(OBSERVED „OBS‟ or perceived “P”) on employee commitment.
Coefficients (a)
Mod
el
Unstandardized
Coefficients
Standardized
Coefficients t Sig.
B
Std.
Error Beta
1 (Constant) 51.823 2.616 19.808 .000
Transformational
(P) .160 .035 .186 4.516 .000
R=.186
R SQUARE=.035
Dependent Variable: Employee Commitment
Table 12(ii) shows Regression analysis of Transformational leadership styles
(Expected “Exp”) on employee commitment.
Coefficients (a)
Mode
l
Unstandardized
Coefficients
Standardized
Coefficients t Sig.
B
Std.
Error Beta
1 (Constant) 55.655 3.946 14.104 .000
Transformational
(Exp) .092 .047 .083 1.978 .048
Dependent Variable: Employee Commitment
Correlation Analysis with Explanation
As shown in table 12(iii), the Pearson‘s correlation, indicated that there was a
positive relationship between the transformational leadership style
(perceived/observed by employees in their immediate superior) of the Director/HOD
of the B-schools of Maharashtra and employee commitment of the academic faculties
of the B-Schools of Maharashtra at a highly significant level of **.166(** Correlation
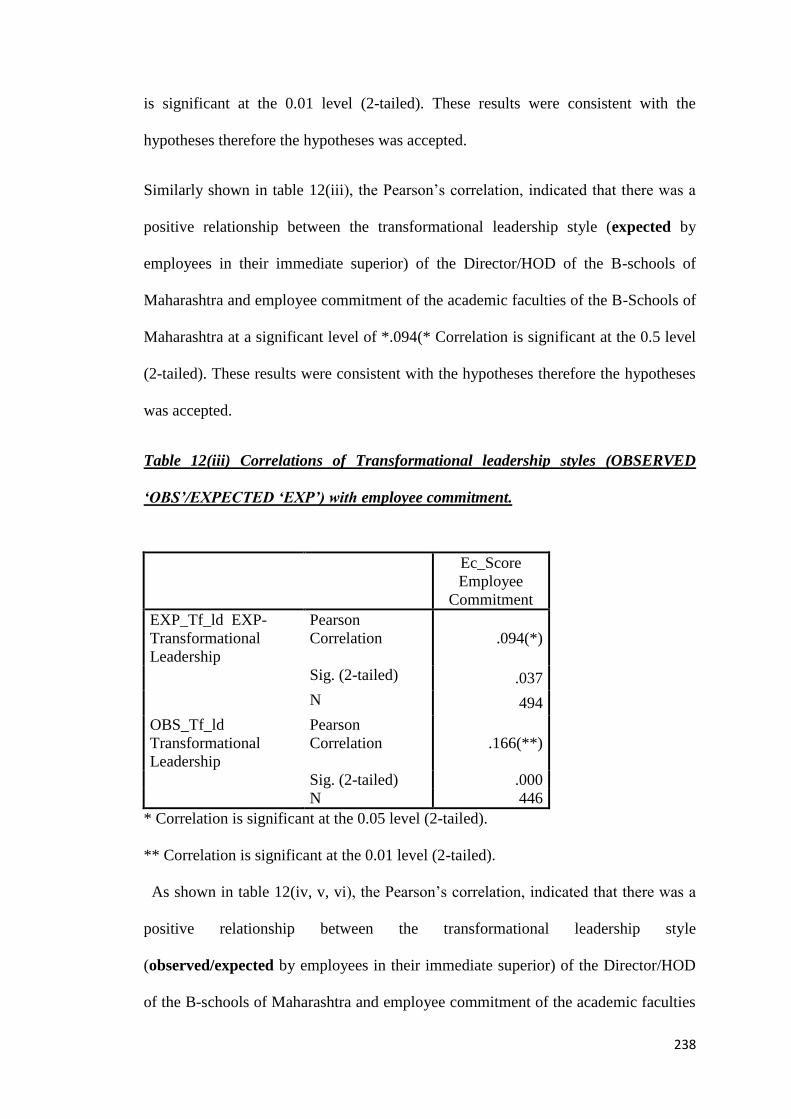
238
is significant at the 0.01 level (2-tailed). These results were consistent with the
hypotheses therefore the hypotheses was accepted.
Similarly shown in table 12(iii), the Pearson‘s correlation, indicated that there was a
positive relationship between the transformational leadership style (expected by
employees in their immediate superior) of the Director/HOD of the B-schools of
Maharashtra and employee commitment of the academic faculties of the B-Schools of
Maharashtra at a significant level of *.094(* Correlation is significant at the 0.5 level
(2-tailed). These results were consistent with the hypotheses therefore the hypotheses
was accepted.
Table 12(iii) Correlations of Transformational leadership styles (OBSERVED
„OBS‟/EXPECTED „EXP‟) with employee commitment.
Ec_Score
Employee
Commitment
EXP_Tf_ld EXP-
Transformational
Leadership
Pearson
Correlation .094(*)
Sig. (2-tailed) .037
N 494
OBS_Tf_ld
Transformational
Leadership
Pearson
Correlation .166(**)
Sig. (2-tailed) .000
N 446
* Correlation is significant at the 0.05 level (2-tailed).
** Correlation is significant at the 0.01 level (2-tailed).
As shown in table 12(iv, v, vi), the Pearson‘s correlation, indicated that there was a
positive relationship between the transformational leadership style
(observed/expected by employees in their immediate superior) of the Director/HOD
of the B-schools of Maharashtra and employee commitment of the academic faculties
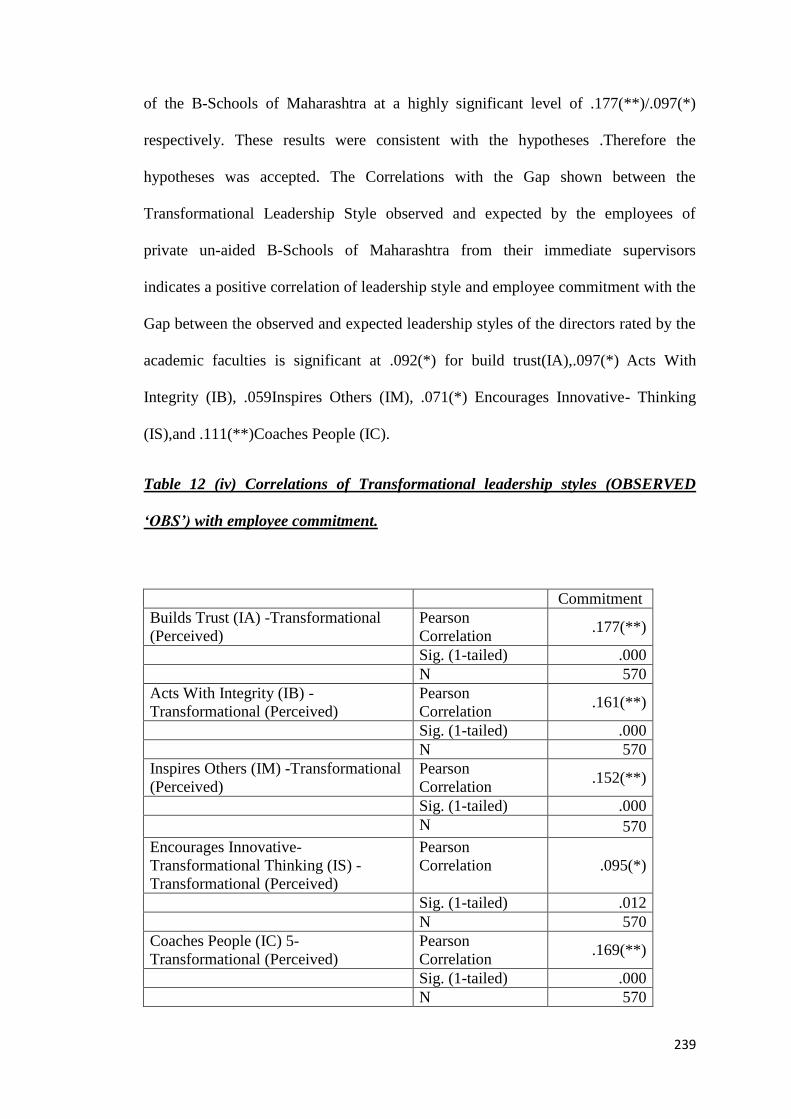
239
of the B-Schools of Maharashtra at a highly significant level of .177(**)/.097(*)
respectively. These results were consistent with the hypotheses .Therefore the
hypotheses was accepted. The Correlations with the Gap shown between the
Transformational Leadership Style observed and expected by the employees of
private un-aided B-Schools of Maharashtra from their immediate supervisors
indicates a positive correlation of leadership style and employee commitment with the
Gap between the observed and expected leadership styles of the directors rated by the
academic faculties is significant at .092(*) for build trust(IA),.097(*) Acts With
Integrity (IB), .059Inspires Others (IM), .071(*) Encourages Innovative- Thinking
(IS),and .111(**)Coaches People (IC).
Table 12 (iv) Correlations of Transformational leadership styles (OBSERVED
„OBS‟) with employee commitment.
Commitment
Builds Trust (IA) -Transformational
(Perceived)
Pearson
Correlation .177(**)
Sig. (1-tailed) .000
N 570
Acts With Integrity (IB) -
Transformational (Perceived)
Pearson
Correlation .161(**)
Sig. (1-tailed) .000
N 570
Inspires Others (IM) -Transformational
(Perceived)
Pearson
Correlation .152(**)
Sig. (1-tailed) .000
N 570
Encourages Innovative-
Transformational Thinking (IS) -
Transformational (Perceived)
Pearson
Correlation .095(*)
Sig. (1-tailed) .012
N 570
Coaches People (IC) 5-
Transformational (Perceived)
Pearson
Correlation .169(**)
Sig. (1-tailed) .000
N 570
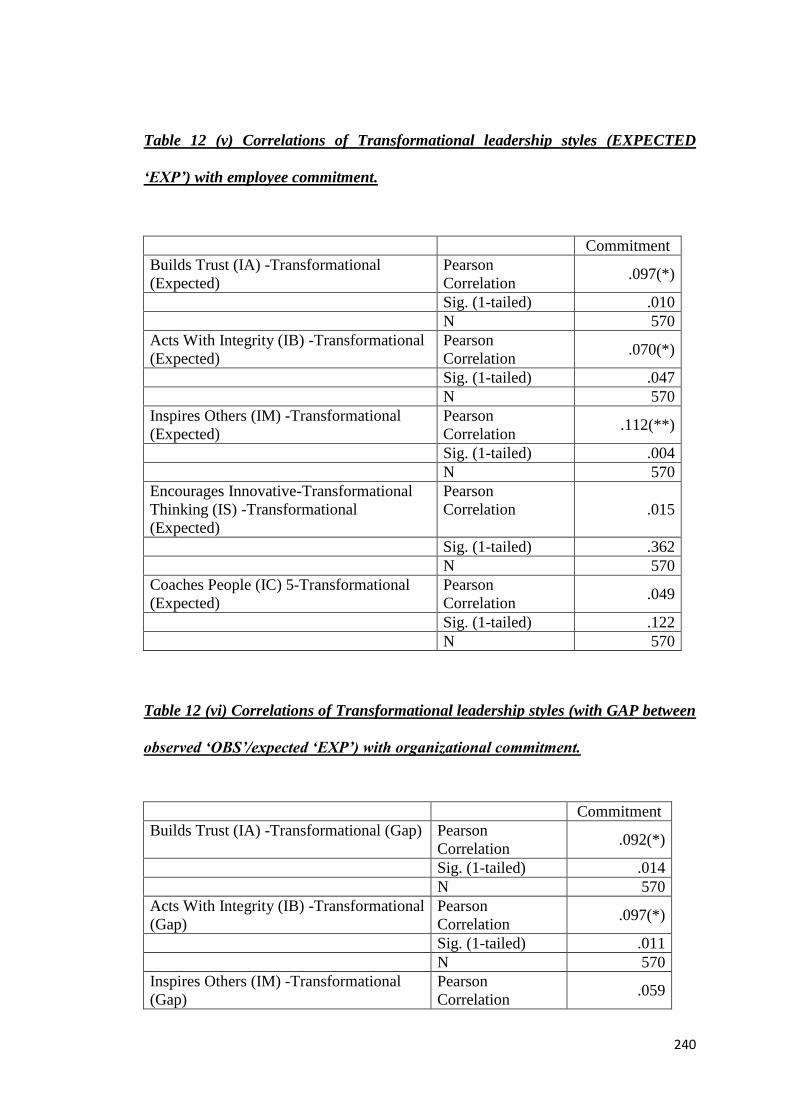
240
Table 12 (v) Correlations of Transformational leadership styles (EXPECTED
„EXP‟) with employee commitment.
Commitment
Builds Trust (IA) -Transformational
(Expected)
Pearson
Correlation .097(*)
Sig. (1-tailed) .010
N 570
Acts With Integrity (IB) -Transformational
(Expected)
Pearson
Correlation .070(*)
Sig. (1-tailed) .047
N 570
Inspires Others (IM) -Transformational
(Expected)
Pearson
Correlation .112(**)
Sig. (1-tailed) .004
N 570
Encourages Innovative-Transformational
Thinking (IS) -Transformational
(Expected)
Pearson
Correlation .015
Sig. (1-tailed) .362
N 570
Coaches People (IC) 5-Transformational
(Expected)
Pearson
Correlation .049
Sig. (1-tailed) .122
N 570
Table 12 (vi) Correlations of Transformational leadership styles (with GAP between
observed „OBS‟/expected „EXP‟) with organizational commitment.
Commitment
Builds Trust (IA) -Transformational (Gap) Pearson
Correlation .092(*)
Sig. (1-tailed) .014
N 570
Acts With Integrity (IB) -Transformational
(Gap)
Pearson
Correlation .097(*)
Sig. (1-tailed) .011
N 570
Inspires Others (IM) -Transformational
(Gap)
Pearson
Correlation .059
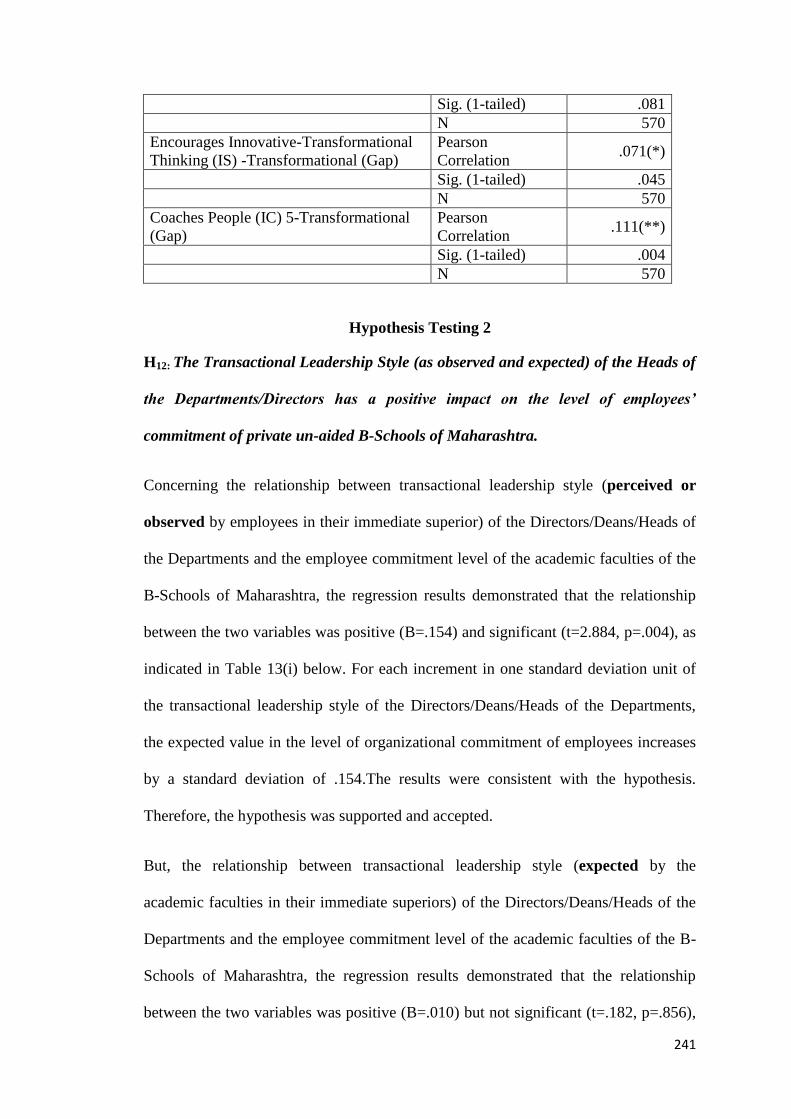
241
Sig. (1-tailed) .081
N 570
Encourages Innovative-Transformational
Thinking (IS) -Transformational (Gap)
Pearson
Correlation .071(*)
Sig. (1-tailed) .045
N 570
Coaches People (IC) 5-Transformational
(Gap)
Pearson
Correlation .111(**)
Sig. (1-tailed) .004
N 570
Hypothesis Testing 2
H12: The Transactional Leadership Style (as observed and expected) of the Heads of
the Departments/Directors has a positive impact on the level of employees‟
commitment of private un-aided B-Schools of Maharashtra.
Concerning the relationship between transactional leadership style (perceived or
observed by employees in their immediate superior) of the Directors/Deans/Heads of
the Departments and the employee commitment level of the academic faculties of the
B-Schools of Maharashtra, the regression results demonstrated that the relationship
between the two variables was positive (B=.154) and significant (t=2.884, p=.004), as
indicated in Table 13(i) below. For each increment in one standard deviation unit of
the transactional leadership style of the Directors/Deans/Heads of the Departments,
the expected value in the level of organizational commitment of employees increases
by a standard deviation of .154.The results were consistent with the hypothesis.
Therefore, the hypothesis was supported and accepted.
But, the relationship between transactional leadership style (expected by the
academic faculties in their immediate superiors) of the Directors/Deans/Heads of the
Departments and the employee commitment level of the academic faculties of the B-
Schools of Maharashtra, the regression results demonstrated that the relationship
between the two variables was positive (B=.010) but not significant (t=.182, p=.856),
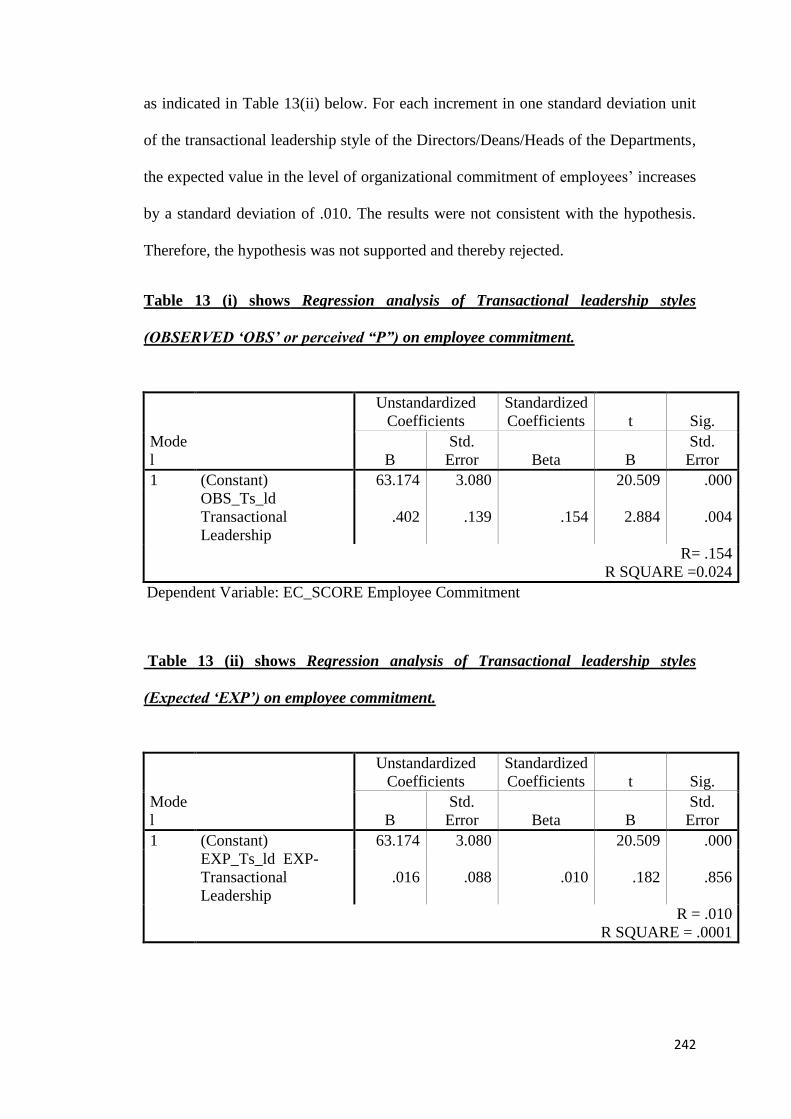
242
as indicated in Table 13(ii) below. For each increment in one standard deviation unit
of the transactional leadership style of the Directors/Deans/Heads of the Departments,
the expected value in the level of organizational commitment of employees‘ increases
by a standard deviation of .010. The results were not consistent with the hypothesis.
Therefore, the hypothesis was not supported and thereby rejected.
Table 13 (i) shows Regression analysis of Transactional leadership styles
(OBSERVED „OBS‟ or perceived “P”) on employee commitment.
Mode
l
Unstandardized
Coefficients
Standardized
Coefficients t Sig.
B
Std.
Error Beta B
Std.
Error
1 (Constant) 63.174 3.080 20.509 .000
OBS_Ts_ld
Transactional
Leadership
.402 .139 .154 2.884 .004
R= .154
R SQUARE =0.024
Dependent Variable: EC_SCORE Employee Commitment
Table 13 (ii) shows Regression analysis of Transactional leadership styles
(Expected „EXP‟) on employee commitment.
Mode
l
Unstandardized
Coefficients
Standardized
Coefficients t Sig.
B
Std.
Error Beta B
Std.
Error
1 (Constant) 63.174 3.080 20.509 .000
EXP_Ts_ld EXP-
Transactional
Leadership
.016 .088 .010 .182 .856
R = .010
R SQUARE = .0001
243
Correlation Analysis for Transactional Leadership Styles:
As shown in table 13(iii), concerning the relationship between transactional
leadership style(perceived/observed by employees in their immediate superior) of
the director of B-schools of Maharashtra and employee commitment level of the
academic faculties working under him, the Pearson correlation result demonstrated
that the relationship between the two variables are positively correlated and highly
significant .132(**) at the level of confidence .01(2 tailed).The results were consistent
with the hypotheses therefore the hypotheses was supported.
Similarly as shown in table 13(iii), the Pearson‘s correlation, indicated that there was
a positive relationship between the transactional leadership style (expected by
employees in their immediate superior) of the Director/HOD of the B-schools of
Maharashtra and employee commitment of the academic faculties of the B-Schools of
Maharashtra are positively correlated but not significant .063(* Correlation is
significant at the 0.5 level (2-tailed). Therefore it shows that Transactional Leadership
Style was positively correlated with employee commitment but there is no significant
difference. Therefore the hypothesis was partially accepted.
P.T.O
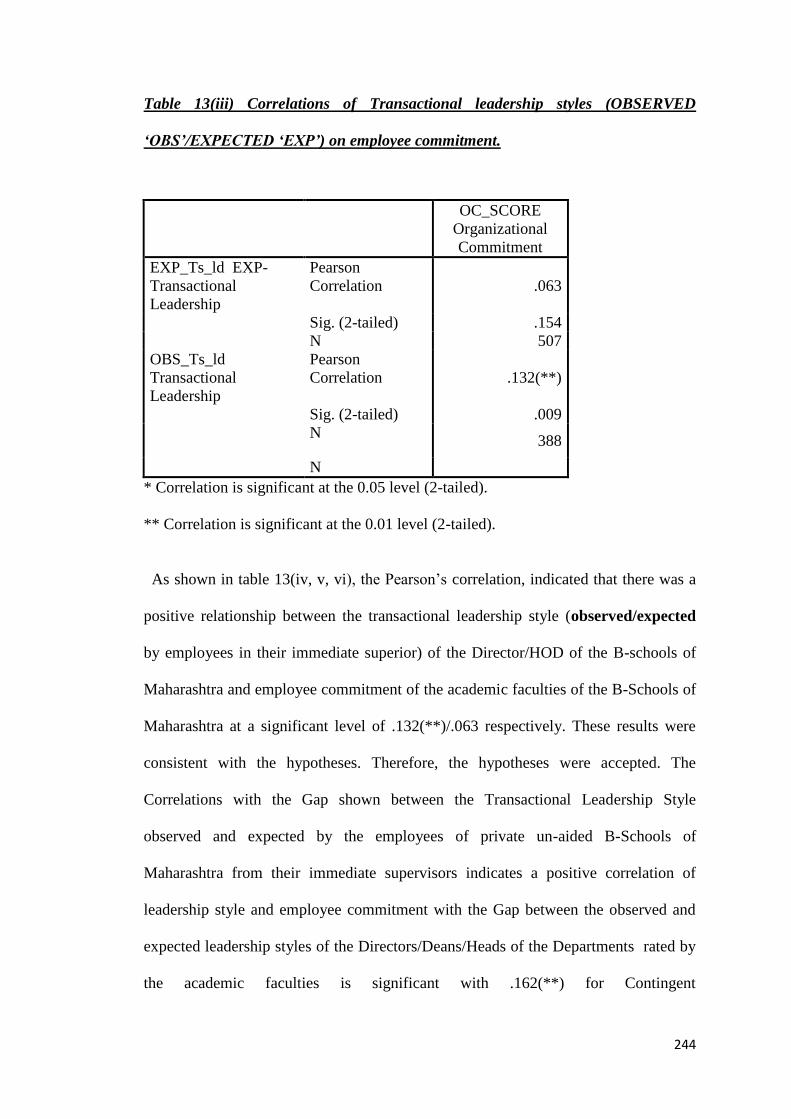
244
Table 13(iii) Correlations of Transactional leadership styles (OBSERVED
„OBS‟/EXPECTED „EXP‟) on employee commitment.
OC_SCORE
Organizational
Commitment
EXP_Ts_ld EXP-
Transactional
Leadership
Pearson
Correlation .063
Sig. (2-tailed) .154
N 507
OBS_Ts_ld
Transactional
Leadership
Pearson
Correlation .132(**)
Sig. (2-tailed) .009
N 388
N
* Correlation is significant at the 0.05 level (2-tailed).
** Correlation is significant at the 0.01 level (2-tailed).
As shown in table 13(iv, v, vi), the Pearson‘s correlation, indicated that there was a
positive relationship between the transactional leadership style (observed/expected
by employees in their immediate superior) of the Director/HOD of the B-schools of
Maharashtra and employee commitment of the academic faculties of the B-Schools of
Maharashtra at a significant level of .132(**)/.063 respectively. These results were
consistent with the hypotheses. Therefore, the hypotheses were accepted. The
Correlations with the Gap shown between the Transactional Leadership Style
observed and expected by the employees of private un-aided B-Schools of
Maharashtra from their immediate supervisors indicates a positive correlation of
leadership style and employee commitment with the Gap between the observed and
expected leadership styles of the Directors/Deans/Heads of the Departments rated by
the academic faculties is significant with .162(**) for Contingent
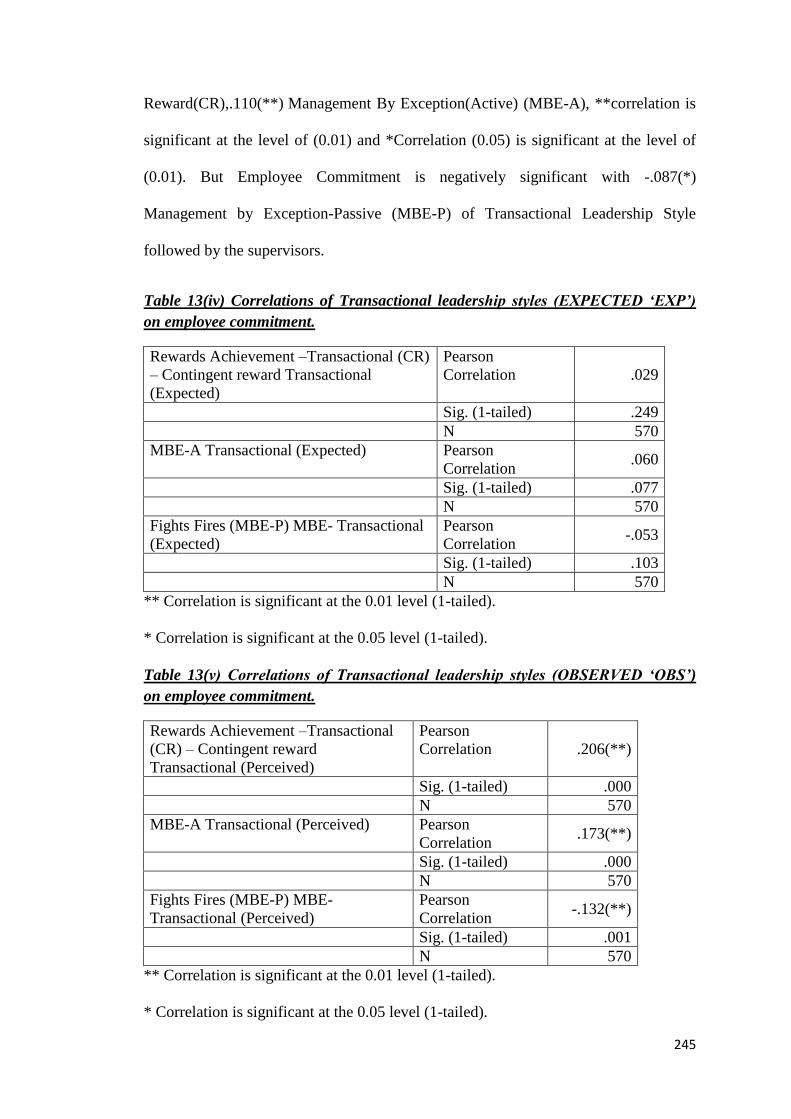
245
Reward(CR),.110(**) Management By Exception(Active) (MBE-A), **correlation is
significant at the level of (0.01) and *Correlation (0.05) is significant at the level of
(0.01). But Employee Commitment is negatively significant with -.087(*)
Management by Exception-Passive (MBE-P) of Transactional Leadership Style
followed by the supervisors.
Table 13(iv) Correlations of Transactional leadership styles (EXPECTED „EXP‟)
on employee commitment.
Rewards Achievement –Transactional (CR)
– Contingent reward Transactional
(Expected)
Pearson
Correlation .029
Sig. (1-tailed) .249
N 570
MBE-A Transactional (Expected) Pearson
Correlation .060
Sig. (1-tailed) .077
N 570
Fights Fires (MBE-P) MBE- Transactional
(Expected)
Pearson
Correlation -.053
Sig. (1-tailed) .103
N 570
** Correlation is significant at the 0.01 level (1-tailed).
* Correlation is significant at the 0.05 level (1-tailed).
Table 13(v) Correlations of Transactional leadership styles (OBSERVED „OBS‟)
on employee commitment.
Rewards Achievement –Transactional
(CR) – Contingent reward
Transactional (Perceived)
Pearson
Correlation .206(**)
Sig. (1-tailed) .000
N 570
MBE-A Transactional (Perceived) Pearson
Correlation .173(**)
Sig. (1-tailed) .000
N 570
Fights Fires (MBE-P) MBE-
Transactional (Perceived)
Pearson
Correlation -.132(**)
Sig. (1-tailed) .001
N 570
** Correlation is significant at the 0.01 level (1-tailed).
* Correlation is significant at the 0.05 level (1-tailed).

246
Table 13(vi) Correlations of Transformational leadership styles (with GAP between
observed „OBS‟/expected „EXP‟) on employee commitment.
Rewards Achievement –Transactional
(CR) – Contingent reward Transactional
(Gap)
Pearson
Correlation .162(**)
Sig. (1-tailed) .000
N 570
MBE-A Transactional (Gap) Pearson
Correlation .110(**)
Sig. (1-tailed) .004
N 570
Fights Fires (MBE-P) MBE- Transactional
(Gap)
Pearson
Correlation -.087(*)
Sig. (1-tailed) .019
N 570
* Correlation is significant at the 0.05 level (1-tailed).
**Correlation is significant at the 0.01 level (1-tailed).
Hypotheses Testing 3
6.7.3 H13 : The Transformational Leadership Style (as observed and expected) of
the Heads of the Departments/Directors of private un-aided B-Schools of
Maharashtra will have a greater impact on the level of employees‟ commitment
compared to the Transactional Leadership Style.
To examine this hypothesis a correlation analysis was performed. As shown in Table
14-(i),the correlation results indicated that the transformational leadership
style(observed by the academic faculties) followed by the Directors/Deans/Heads of
the Departments had a significant positive relationship (r = .166,p = .000) with the
organizational level of employees greater than the relationship between the
transactional leadership style of the Directors/Deans/Heads of the Departments of the
private un-aided B-Schools of Maharashtra and the employee commitment of the
academic faculties working under them (r = .131,p=.010). Furthermore, the regression
analyses as mentioned earlier in Tables 12(i) and 13(i) showed that the
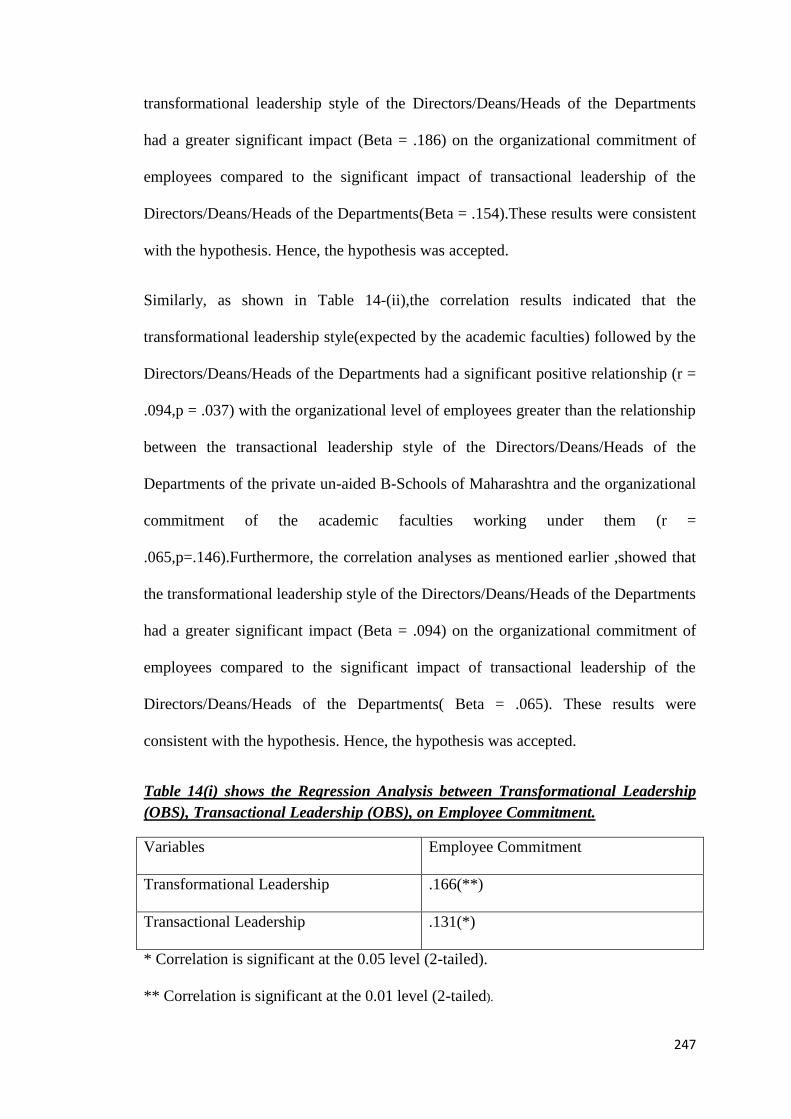
247
transformational leadership style of the Directors/Deans/Heads of the Departments
had a greater significant impact (Beta = .186) on the organizational commitment of
employees compared to the significant impact of transactional leadership of the
Directors/Deans/Heads of the Departments(Beta = .154).These results were consistent
with the hypothesis. Hence, the hypothesis was accepted.
Similarly, as shown in Table 14-(ii),the correlation results indicated that the
transformational leadership style(expected by the academic faculties) followed by the
Directors/Deans/Heads of the Departments had a significant positive relationship (r =
.094,p = .037) with the organizational level of employees greater than the relationship
between the transactional leadership style of the Directors/Deans/Heads of the
Departments of the private un-aided B-Schools of Maharashtra and the organizational
commitment of the academic faculties working under them (r =
.065,p=.146).Furthermore, the correlation analyses as mentioned earlier ,showed that
the transformational leadership style of the Directors/Deans/Heads of the Departments
had a greater significant impact (Beta = .094) on the organizational commitment of
employees compared to the significant impact of transactional leadership of the
Directors/Deans/Heads of the Departments( Beta = .065). These results were
consistent with the hypothesis. Hence, the hypothesis was accepted.
Table 14(i) shows the Regression Analysis between Transformational Leadership
(OBS), Transactional Leadership (OBS), on Employee Commitment.
Variables Employee Commitment
Transformational Leadership .166(**)
Transactional Leadership .131(*)
* Correlation is significant at the 0.05 level (2-tailed).
** Correlation is significant at the 0.01 level (2-tailed).

248
Table 14(ii) shows the Regression Analysis between Transformational Leadership
(EXP), Transactional Leadership (EXP), on Employee Commitment.
Variables Employee Commitment
Transformational Leadership .094(*)
Transactional Leadership .065
* Correlation is significant at the 0.05 level (2-tailed).
Hypothesis Testing 4
6.7.4H14: The Laissez-Faire Leadership Style of the Heads of the
Departments/Directors has a negative impact on the level of employees‟
commitment of private un-aided B-Schools of Maharashtra.
To test this hypothesis, both correlations and regression analyses were conducted. The
results of the regression analysis revealed that the laissez-faire leadership style of the
Directors/Deans/Heads of the Departments of the private un-aided B-Schools of
Maharashtra(as perceived or observed by the respondents, the academic faculties)
had a significant negative relationship with the level of organizational commitment of
employees ( r= -.106, p = .011). Likewise, the results of regression analysis indicated
that the regression coefficient (B) demonstrated that the variable of laissez-faire
leadership style of the Directors/Deans/Heads of the Departments had a significant
negative effect on the level of employee commitment of the academic faculties of the
B-Schools of Maharashtra as shown in Table 15(i).For each increment in one standard
deviation unit of the laissez-faire leadership style of the Directors/Deans/Heads of the
Departments, the expected value in the level of employee commitment decreases by a
standard deviation of -.106.The results were consistent with the hypothesis. Therefore,
the hypothesis was accepted.
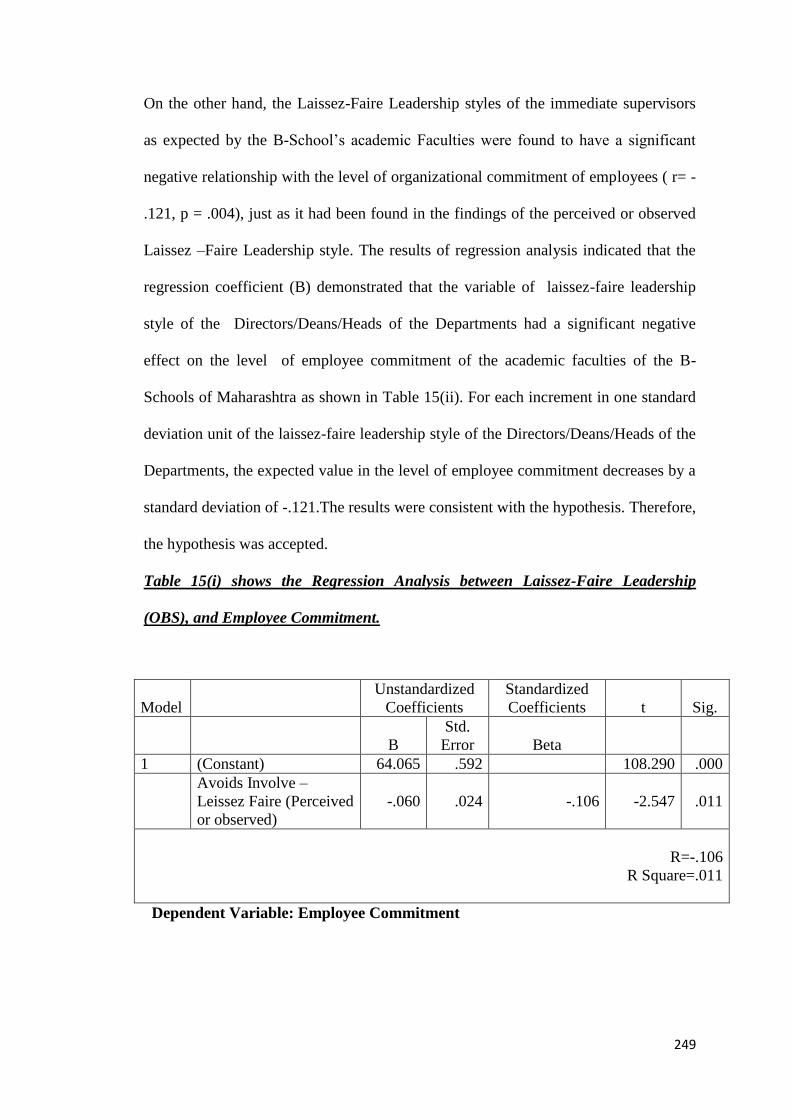
249
On the other hand, the Laissez-Faire Leadership styles of the immediate supervisors
as expected by the B-School‘s academic Faculties were found to have a significant
negative relationship with the level of organizational commitment of employees ( r= -
.121, p = .004), just as it had been found in the findings of the perceived or observed
Laissez –Faire Leadership style. The results of regression analysis indicated that the
regression coefficient (B) demonstrated that the variable of laissez-faire leadership
style of the Directors/Deans/Heads of the Departments had a significant negative
effect on the level of employee commitment of the academic faculties of the B-
Schools of Maharashtra as shown in Table 15(ii). For each increment in one standard
deviation unit of the laissez-faire leadership style of the Directors/Deans/Heads of the
Departments, the expected value in the level of employee commitment decreases by a
standard deviation of -.121.The results were consistent with the hypothesis. Therefore,
the hypothesis was accepted.
Table 15(i) shows the Regression Analysis between Laissez-Faire Leadership
(OBS), and Employee Commitment.
Model
Unstandardized
Coefficients
Standardized
Coefficients t Sig.
B
Std.
Error Beta
1 (Constant) 64.065 .592 108.290 .000
Avoids Involve –
Leissez Faire (Perceived
or observed)
-.060 .024 -.106 -2.547 .011
R=-.106
R Square=.011
Dependent Variable: Employee Commitment
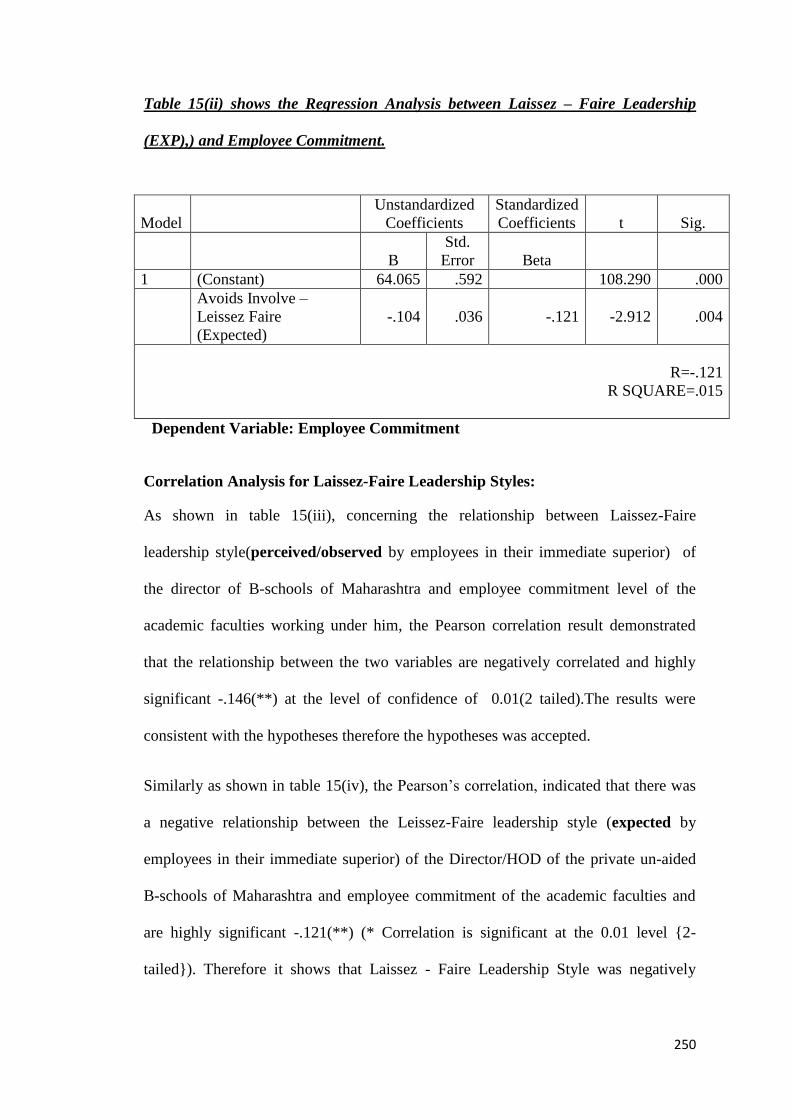
250
Table 15(ii) shows the Regression Analysis between Laissez – Faire Leadership
(EXP),) and Employee Commitment.
Model
Unstandardized
Coefficients
Standardized
Coefficients t Sig.
B
Std.
Error Beta
1 (Constant) 64.065 .592 108.290 .000
Avoids Involve –
Leissez Faire
(Expected)
-.104 .036 -.121 -2.912 .004
R=-.121
R SQUARE=.015
Dependent Variable: Employee Commitment
Correlation Analysis for Laissez-Faire Leadership Styles:
As shown in table 15(iii), concerning the relationship between Laissez-Faire
leadership style(perceived/observed by employees in their immediate superior) of
the director of B-schools of Maharashtra and employee commitment level of the
academic faculties working under him, the Pearson correlation result demonstrated
that the relationship between the two variables are negatively correlated and highly
significant -.146(**) at the level of confidence of 0.01(2 tailed).The results were
consistent with the hypotheses therefore the hypotheses was accepted.
Similarly as shown in table 15(iv), the Pearson‘s correlation, indicated that there was
a negative relationship between the Leissez-Faire leadership style (expected by
employees in their immediate superior) of the Director/HOD of the private un-aided
B-schools of Maharashtra and employee commitment of the academic faculties and
are highly significant -.121(**) (* Correlation is significant at the 0.01 level {2-
tailed}). Therefore it shows that Laissez - Faire Leadership Style was negatively
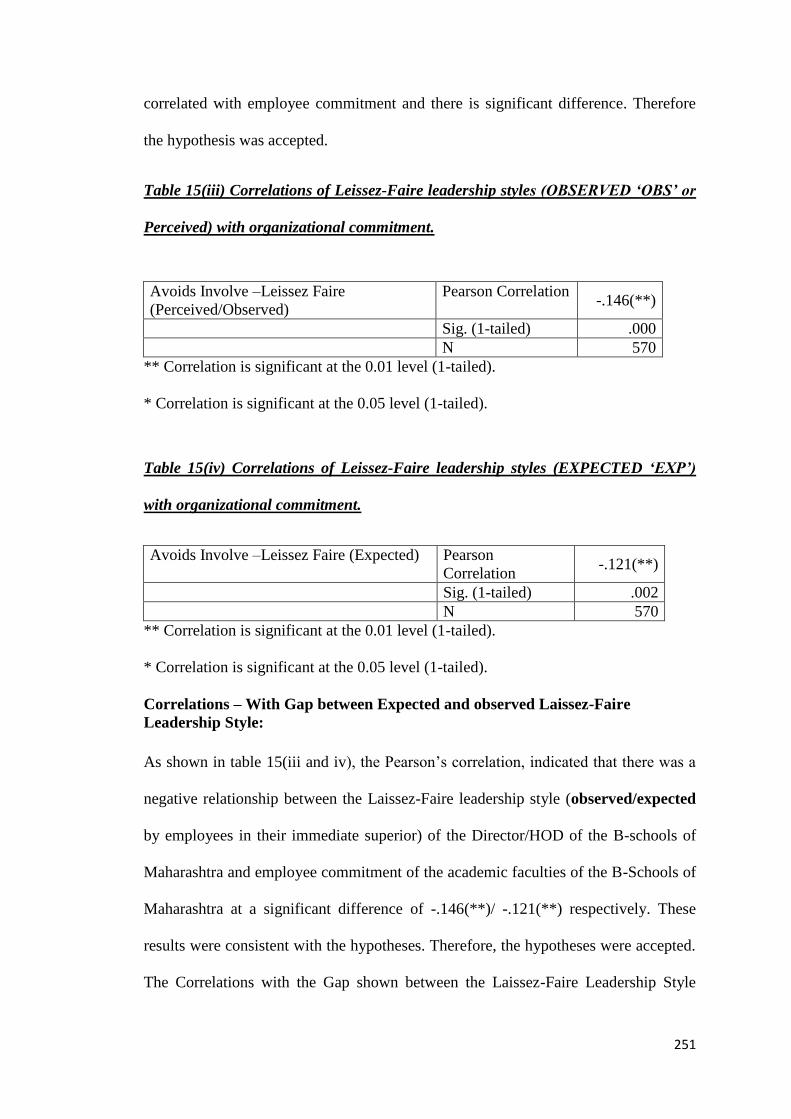
251
correlated with employee commitment and there is significant difference. Therefore
the hypothesis was accepted.
Table 15(iii) Correlations of Leissez-Faire leadership styles (OBSERVED „OBS‟ or
Perceived) with organizational commitment.
Avoids Involve –Leissez Faire
(Perceived/Observed)
Pearson Correlation -.146(**)
Sig. (1-tailed) .000
N 570
** Correlation is significant at the 0.01 level (1-tailed).
* Correlation is significant at the 0.05 level (1-tailed).
Table 15(iv) Correlations of Leissez-Faire leadership styles (EXPECTED „EXP‟)
with organizational commitment.
Avoids Involve –Leissez Faire (Expected) Pearson
Correlation -.121(**)
Sig. (1-tailed) .002
N 570
** Correlation is significant at the 0.01 level (1-tailed).
* Correlation is significant at the 0.05 level (1-tailed).
Correlations – With Gap between Expected and observed Laissez-Faire
Leadership Style:
As shown in table 15(iii and iv), the Pearson‘s correlation, indicated that there was a
negative relationship between the Laissez-Faire leadership style (observed/expected
by employees in their immediate superior) of the Director/HOD of the B-schools of
Maharashtra and employee commitment of the academic faculties of the B-Schools of
Maharashtra at a significant difference of -.146(**)/ -.121(**) respectively. These
results were consistent with the hypotheses. Therefore, the hypotheses were accepted.
The Correlations with the Gap shown between the Laissez-Faire Leadership Style
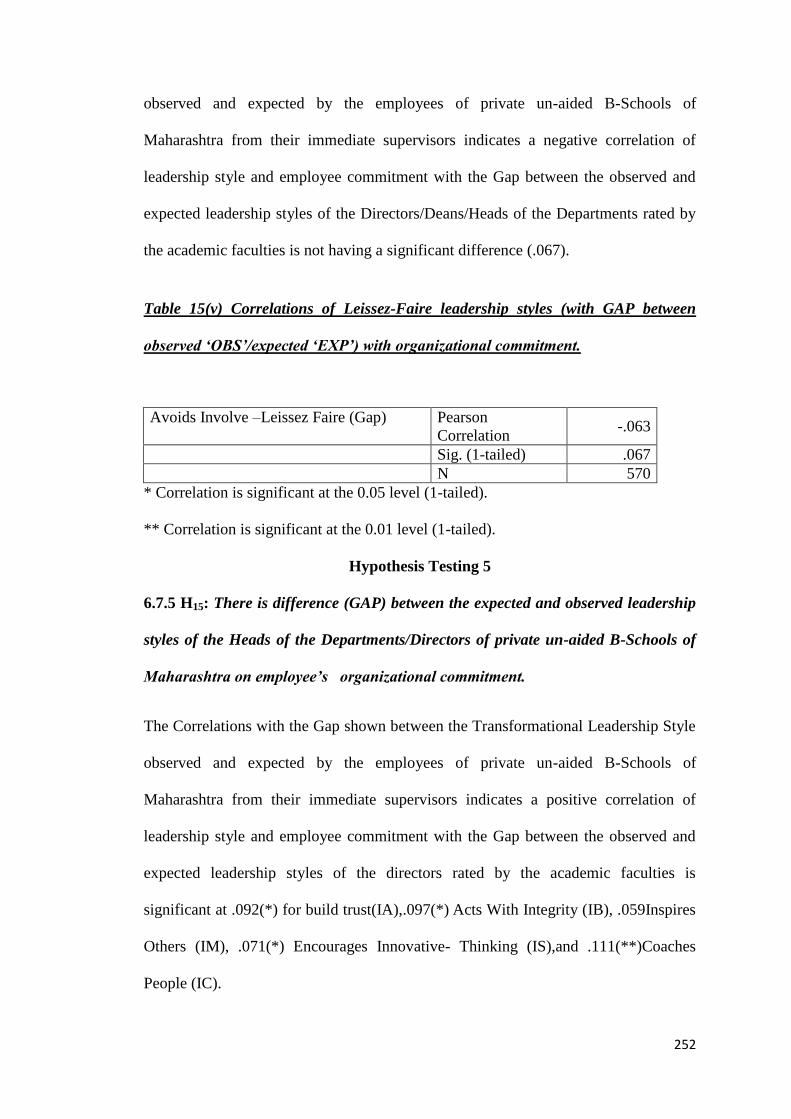
252
observed and expected by the employees of private un-aided B-Schools of
Maharashtra from their immediate supervisors indicates a negative correlation of
leadership style and employee commitment with the Gap between the observed and
expected leadership styles of the Directors/Deans/Heads of the Departments rated by
the academic faculties is not having a significant difference (.067).
Table 15(v) Correlations of Leissez-Faire leadership styles (with GAP between
observed „OBS‟/expected „EXP‟) with organizational commitment.
Avoids Involve –Leissez Faire (Gap) Pearson
Correlation -.063
Sig. (1-tailed) .067
N 570
* Correlation is significant at the 0.05 level (1-tailed).
** Correlation is significant at the 0.01 level (1-tailed).
Hypothesis Testing 5
6.7.5 H15: There is difference (GAP) between the expected and observed leadership
styles of the Heads of the Departments/Directors of private un-aided B-Schools of
Maharashtra on employee‟s organizational commitment.
The Correlations with the Gap shown between the Transformational Leadership Style
observed and expected by the employees of private un-aided B-Schools of
Maharashtra from their immediate supervisors indicates a positive correlation of
leadership style and employee commitment with the Gap between the observed and
expected leadership styles of the directors rated by the academic faculties is
significant at .092(*) for build trust(IA),.097(*) Acts With Integrity (IB), .059Inspires
Others (IM), .071(*) Encourages Innovative- Thinking (IS),and .111(**)Coaches
People (IC).
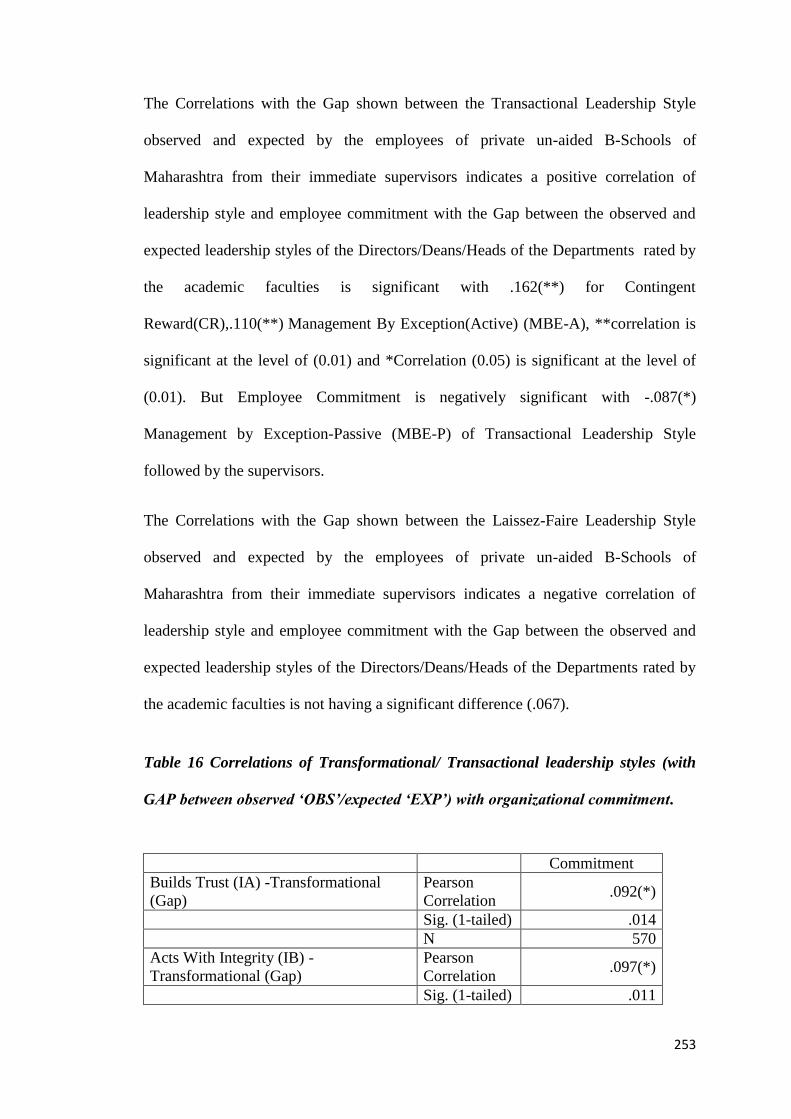
253
The Correlations with the Gap shown between the Transactional Leadership Style
observed and expected by the employees of private un-aided B-Schools of
Maharashtra from their immediate supervisors indicates a positive correlation of
leadership style and employee commitment with the Gap between the observed and
expected leadership styles of the Directors/Deans/Heads of the Departments rated by
the academic faculties is significant with .162(**) for Contingent
Reward(CR),.110(**) Management By Exception(Active) (MBE-A), **correlation is
significant at the level of (0.01) and *Correlation (0.05) is significant at the level of
(0.01). But Employee Commitment is negatively significant with -.087(*)
Management by Exception-Passive (MBE-P) of Transactional Leadership Style
followed by the supervisors.
The Correlations with the Gap shown between the Laissez-Faire Leadership Style
observed and expected by the employees of private un-aided B-Schools of
Maharashtra from their immediate supervisors indicates a negative correlation of
leadership style and employee commitment with the Gap between the observed and
expected leadership styles of the Directors/Deans/Heads of the Departments rated by
the academic faculties is not having a significant difference (.067).
Table 16 Correlations of Transformational/ Transactional leadership styles (with
GAP between observed „OBS‟/expected „EXP‟) with organizational commitment.
Commitment
Builds Trust (IA) -Transformational
(Gap)
Pearson
Correlation .092(*)
Sig. (1-tailed) .014
N 570
Acts With Integrity (IB) -
Transformational (Gap)
Pearson
Correlation .097(*)
Sig. (1-tailed) .011
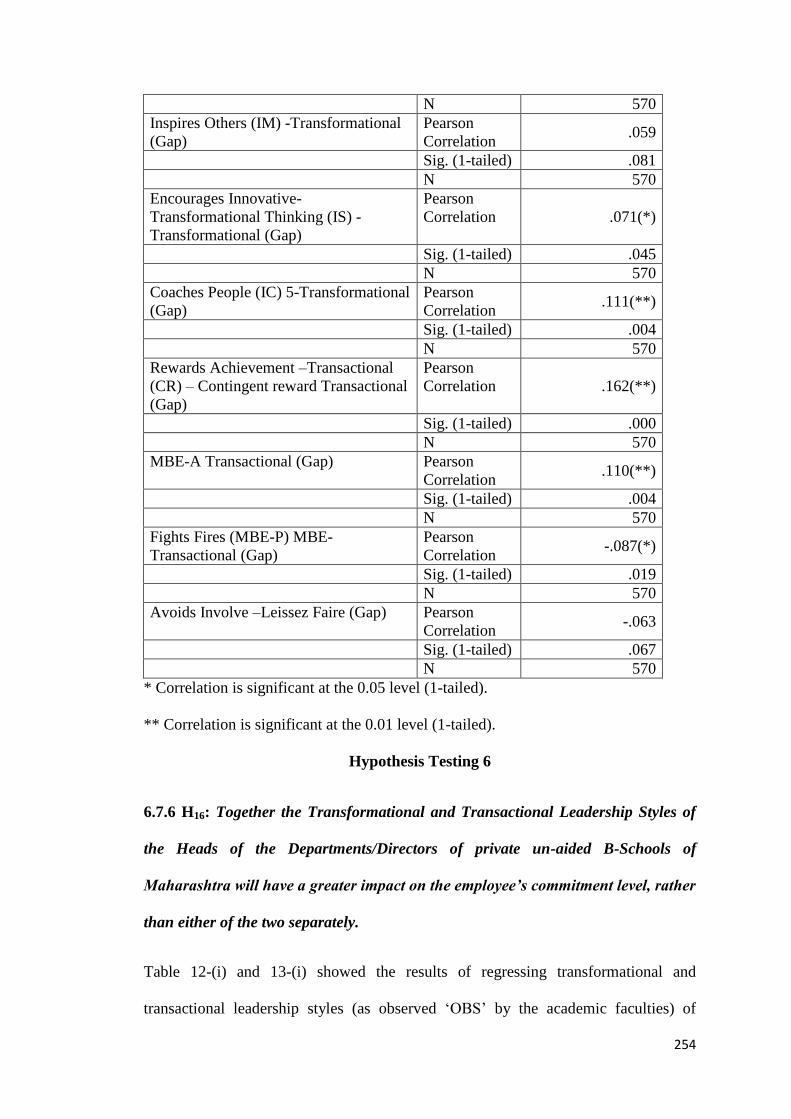
254
N 570
Inspires Others (IM) -Transformational
(Gap)
Pearson
Correlation .059
Sig. (1-tailed) .081
N 570
Encourages Innovative-
Transformational Thinking (IS) -
Transformational (Gap)
Pearson
Correlation .071(*)
Sig. (1-tailed) .045
N 570
Coaches People (IC) 5-Transformational
(Gap)
Pearson
Correlation .111(**)
Sig. (1-tailed) .004
N 570
Rewards Achievement –Transactional
(CR) – Contingent reward Transactional
(Gap)
Pearson
Correlation .162(**)
Sig. (1-tailed) .000
N 570
MBE-A Transactional (Gap) Pearson
Correlation .110(**)
Sig. (1-tailed) .004
N 570
Fights Fires (MBE-P) MBE-
Transactional (Gap)
Pearson
Correlation -.087(*)
Sig. (1-tailed) .019
N 570
Avoids Involve –Leissez Faire (Gap) Pearson
Correlation -.063
Sig. (1-tailed) .067
N 570
* Correlation is significant at the 0.05 level (1-tailed).
** Correlation is significant at the 0.01 level (1-tailed).
Hypothesis Testing 6
6.7.6 H16: Together the Transformational and Transactional Leadership Styles of
the Heads of the Departments/Directors of private un-aided B-Schools of
Maharashtra will have a greater impact on the employee‟s commitment level, rather
than either of the two separately.
Table 12-(i) and 13-(i) showed the results of regressing transformational and
transactional leadership styles (as observed ‗OBS‘ by the academic faculties) of
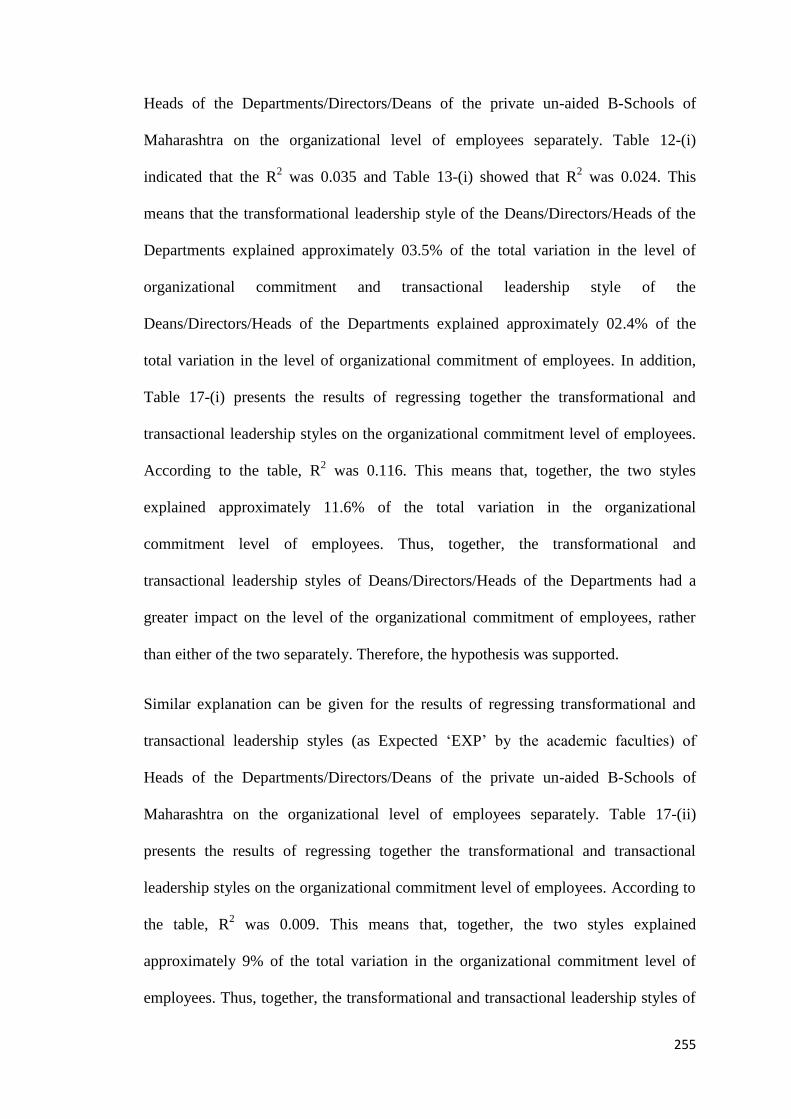
255
Heads of the Departments/Directors/Deans of the private un-aided B-Schools of
Maharashtra on the organizational level of employees separately. Table 12-(i)
indicated that the R2 was 0.035 and Table 13-(i) showed that R
2 was 0.024. This
means that the transformational leadership style of the Deans/Directors/Heads of the
Departments explained approximately 03.5% of the total variation in the level of
organizational commitment and transactional leadership style of the
Deans/Directors/Heads of the Departments explained approximately 02.4% of the
total variation in the level of organizational commitment of employees. In addition,
Table 17-(i) presents the results of regressing together the transformational and
transactional leadership styles on the organizational commitment level of employees.
According to the table, R2 was 0.116. This means that, together, the two styles
explained approximately 11.6% of the total variation in the organizational
commitment level of employees. Thus, together, the transformational and
transactional leadership styles of Deans/Directors/Heads of the Departments had a
greater impact on the level of the organizational commitment of employees, rather
than either of the two separately. Therefore, the hypothesis was supported.
Similar explanation can be given for the results of regressing transformational and
transactional leadership styles (as Expected ‗EXP‘ by the academic faculties) of
Heads of the Departments/Directors/Deans of the private un-aided B-Schools of
Maharashtra on the organizational level of employees separately. Table 17-(ii)
presents the results of regressing together the transformational and transactional
leadership styles on the organizational commitment level of employees. According to
the table, R2 was 0.009. This means that, together, the two styles explained
approximately 9% of the total variation in the organizational commitment level of
employees. Thus, together, the transformational and transactional leadership styles of
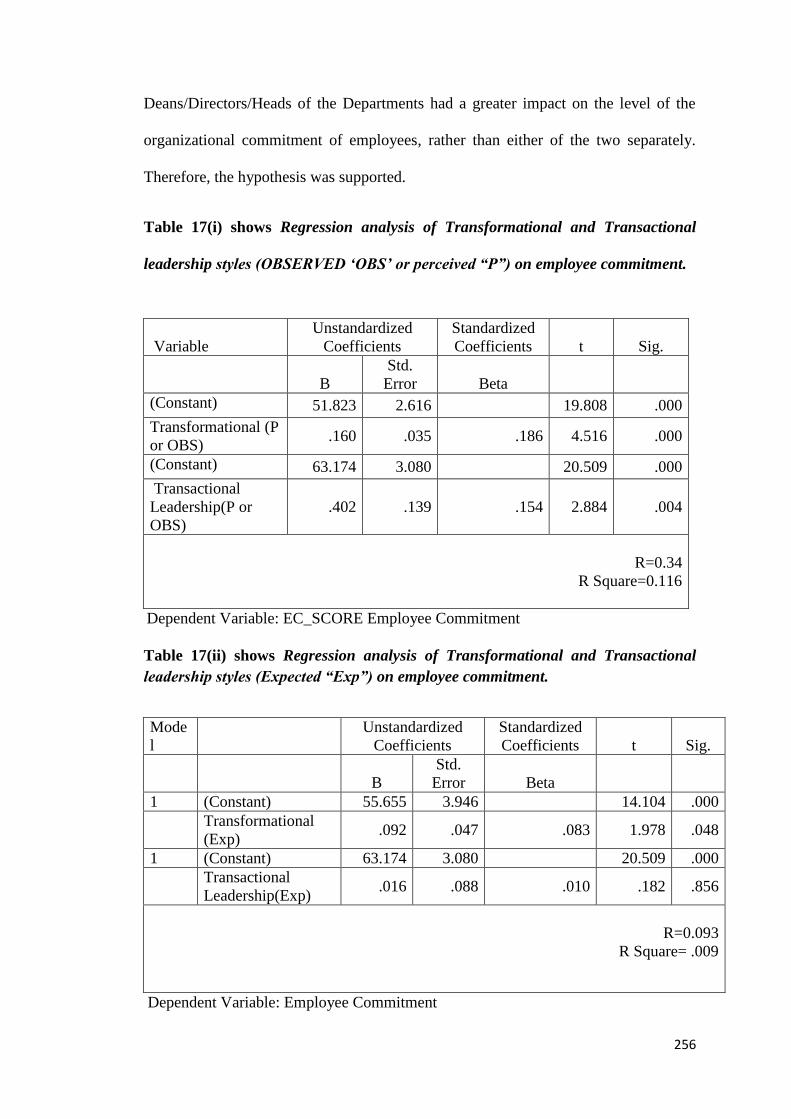
256
Deans/Directors/Heads of the Departments had a greater impact on the level of the
organizational commitment of employees, rather than either of the two separately.
Therefore, the hypothesis was supported.
Table 17(i) shows Regression analysis of Transformational and Transactional
leadership styles (OBSERVED „OBS‟ or perceived “P”) on employee commitment.
Variable
Unstandardized
Coefficients
Standardized
Coefficients t Sig.
B
Std.
Error Beta
(Constant) 51.823 2.616 19.808 .000
Transformational (P
or OBS) .160 .035 .186 4.516 .000
(Constant) 63.174 3.080 20.509 .000
Transactional
Leadership(P or
OBS)
.402 .139 .154 2.884 .004
R=0.34
R Square=0.116
Dependent Variable: EC_SCORE Employee Commitment
Table 17(ii) shows Regression analysis of Transformational and Transactional
leadership styles (Expected “Exp”) on employee commitment.
Mode
l
Unstandardized
Coefficients
Standardized
Coefficients t Sig.
B
Std.
Error Beta
1 (Constant) 55.655 3.946 14.104 .000
Transformational
(Exp) .092 .047 .083 1.978 .048
1 (Constant) 63.174 3.080 20.509 .000
Transactional
Leadership(Exp) .016 .088 .010 .182 .856
R=0.093
R Square= .009
Dependent Variable: Employee Commitment
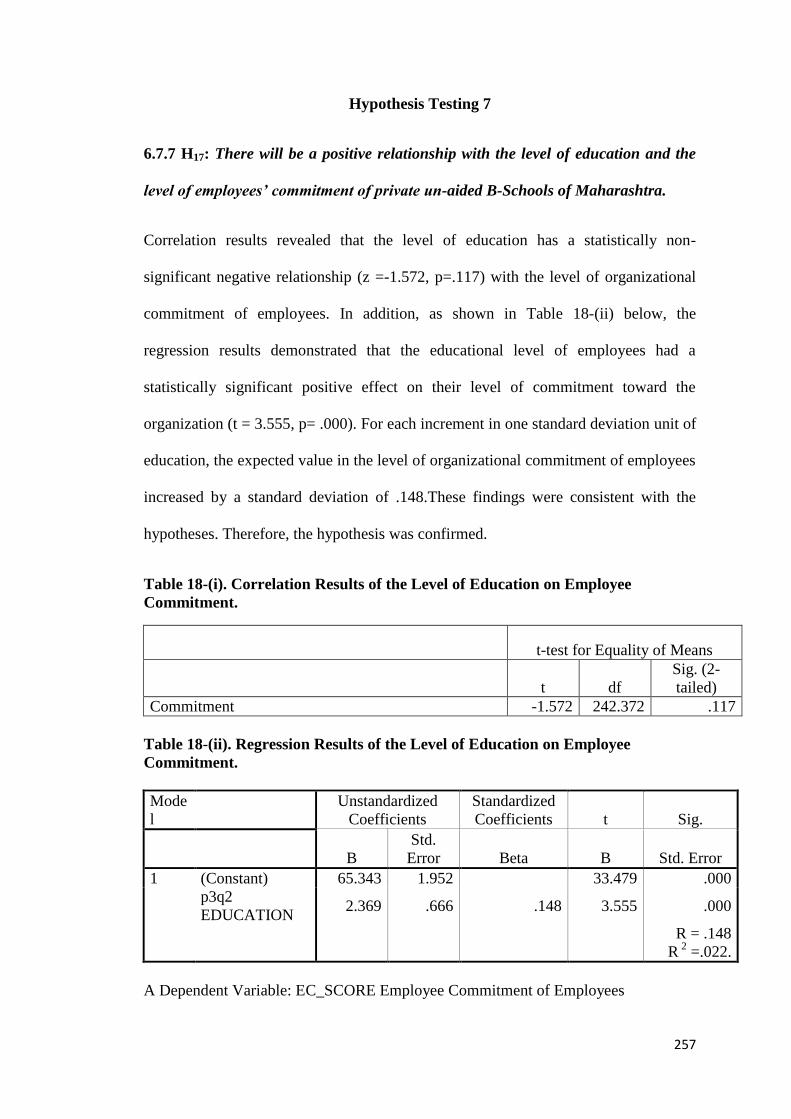
257
Hypothesis Testing 7
6.7.7 H17: There will be a positive relationship with the level of education and the
level of employees‟ commitment of private un-aided B-Schools of Maharashtra.
Correlation results revealed that the level of education has a statistically non-
significant negative relationship (z =-1.572, p=.117) with the level of organizational
commitment of employees. In addition, as shown in Table 18-(ii) below, the
regression results demonstrated that the educational level of employees had a
statistically significant positive effect on their level of commitment toward the
organization (t = 3.555, p= .000). For each increment in one standard deviation unit of
education, the expected value in the level of organizational commitment of employees
increased by a standard deviation of .148.These findings were consistent with the
hypotheses. Therefore, the hypothesis was confirmed.
Table 18-(i). Correlation Results of the Level of Education on Employee
Commitment.
t-test for Equality of Means
t df
Sig. (2-
tailed)
Commitment -1.572 242.372 .117
Table 18-(ii). Regression Results of the Level of Education on Employee
Commitment.
Mode
l
Unstandardized
Coefficients
Standardized
Coefficients t Sig.
B
Std.
Error Beta B Std. Error
1 (Constant) 65.343 1.952 33.479 .000
p3q2
EDUCATION 2.369 .666 .148 3.555 .000
R = .148
R 2
=.022.
A Dependent Variable: EC_SCORE Employee Commitment of Employees
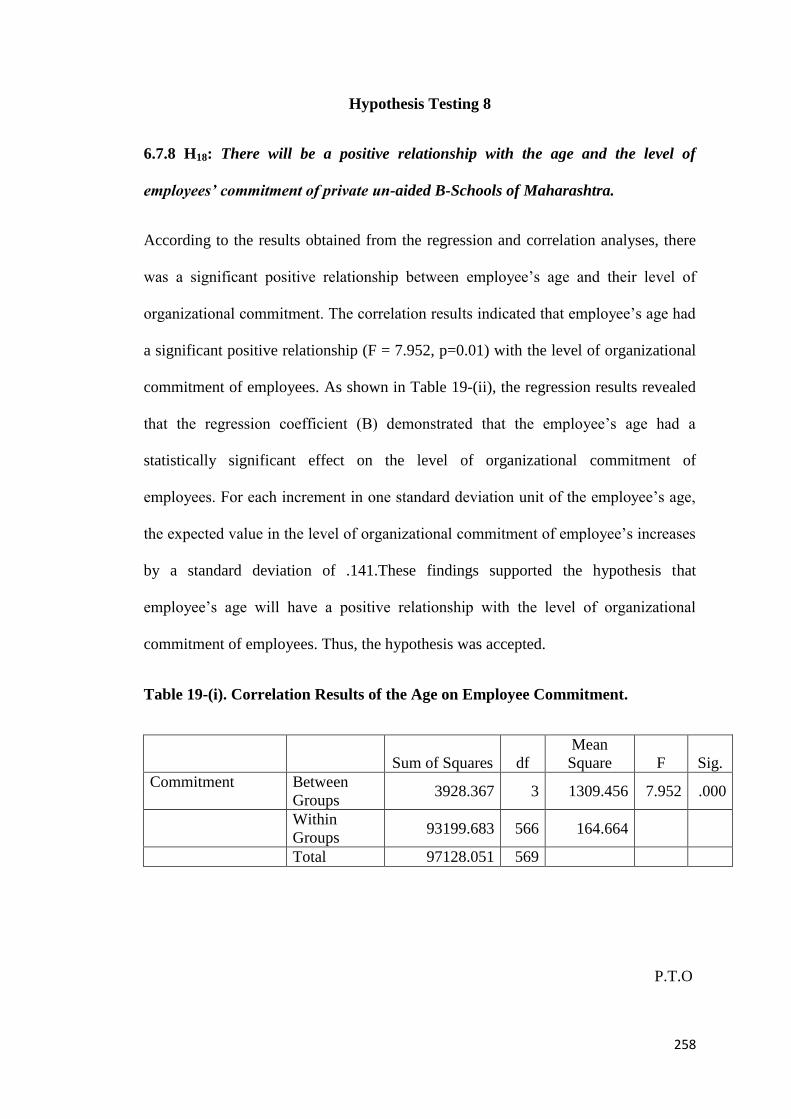
258
Hypothesis Testing 8
6.7.8 H18: There will be a positive relationship with the age and the level of
employees‟ commitment of private un-aided B-Schools of Maharashtra.
According to the results obtained from the regression and correlation analyses, there
was a significant positive relationship between employee‘s age and their level of
organizational commitment. The correlation results indicated that employee‘s age had
a significant positive relationship (F = 7.952, p=0.01) with the level of organizational
commitment of employees. As shown in Table 19-(ii), the regression results revealed
that the regression coefficient (B) demonstrated that the employee‘s age had a
statistically significant effect on the level of organizational commitment of
employees. For each increment in one standard deviation unit of the employee‘s age,
the expected value in the level of organizational commitment of employee‘s increases
by a standard deviation of .141.These findings supported the hypothesis that
employee‘s age will have a positive relationship with the level of organizational
commitment of employees. Thus, the hypothesis was accepted.
Table 19-(i). Correlation Results of the Age on Employee Commitment.
Sum of Squares df
Mean
Square F Sig.
Commitment Between
Groups 3928.367 3 1309.456 7.952 .000
Within
Groups 93199.683 566 164.664
Total 97128.051 569
P.T.O

259
Table 19-(ii). Regression Results of the Age on Employee Commitment.
Model
Unstandardized
Coefficients
Standardized
Coefficients t Sig.
B
Std.
Error Beta B Std. Error
1 (Constan
t) 68.084 1.272 53.535 .000
p3q1
AGE
1.740 .513 .141 3.389
.001
R = .141
R2 = .02/.019
Dependent Variable: EC_SCORE Employee Commitment.
Hypothesis Testing 9
6.7.9 H19: There will be a positive relationship between occupational status and the
level of employees‟ commitment of private un-aided B-Schools of Maharashtra.
According to the results of correlation analysis, the variable of occupational status
found to be positively correlated with the level of employee commitment (r= .071),
but this correlation was not statistically significant (p >0.05, i.e., p=.007). Also the
regression analysis, as shown in Table 20-(ii) below, confirmed that the occupational
status of employees had a positive effect on their level of organizational commitment
of employees. But this effect was not statistically significant ( t = .414, p = .679). For
each increment in one standard deviation unit of the occupational status, the expected
value in the level of organizational commitment of employees increases by a standard
deviation of .017. These findings were inconsistent with the hypothesis. Thus, the
hypothesis was rejected.
P.T.O
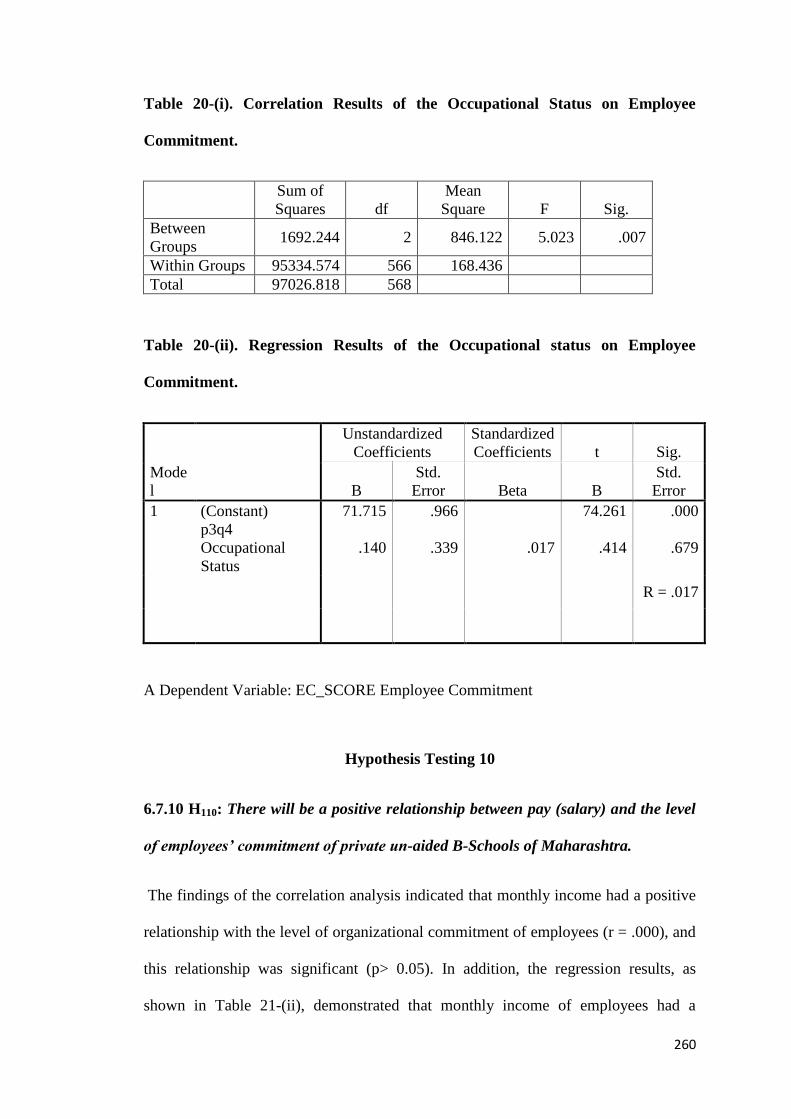
260
Table 20-(i). Correlation Results of the Occupational Status on Employee
Commitment.
Sum of
Squares df
Mean
Square F Sig.
Between
Groups 1692.244 2 846.122 5.023 .007
Within Groups 95334.574 566 168.436
Total 97026.818 568
Table 20-(ii). Regression Results of the Occupational status on Employee
Commitment.
Mode
l
Unstandardized
Coefficients
Standardized
Coefficients t Sig.
B
Std.
Error Beta B
Std.
Error
1 (Constant) 71.715 .966 74.261 .000
p3q4
Occupational
Status
.140 .339 .017 .414 .679
R = .017
A Dependent Variable: EC_SCORE Employee Commitment
Hypothesis Testing 10
6.7.10 H110: There will be a positive relationship between pay (salary) and the level
of employees‟ commitment of private un-aided B-Schools of Maharashtra.
The findings of the correlation analysis indicated that monthly income had a positive
relationship with the level of organizational commitment of employees (r = .000), and
this relationship was significant (p> 0.05). In addition, the regression results, as
shown in Table 21-(ii), demonstrated that monthly income of employees had a
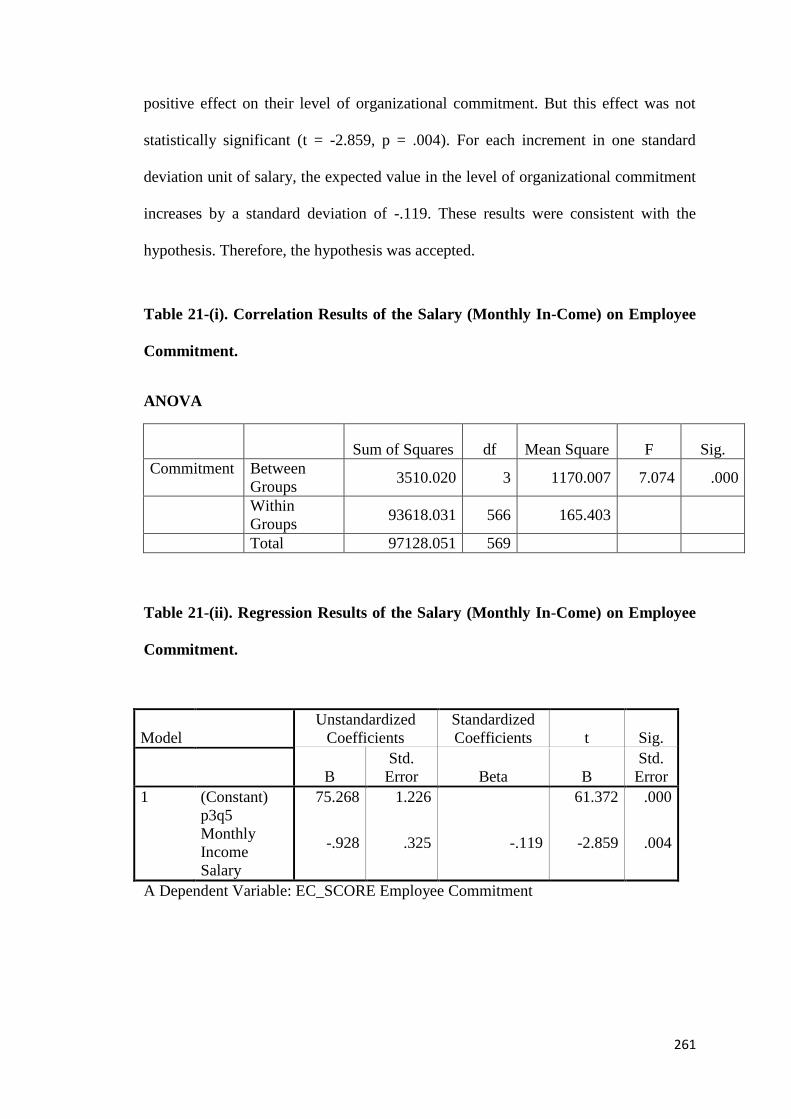
261
positive effect on their level of organizational commitment. But this effect was not
statistically significant (t = -2.859, p = .004). For each increment in one standard
deviation unit of salary, the expected value in the level of organizational commitment
increases by a standard deviation of -.119. These results were consistent with the
hypothesis. Therefore, the hypothesis was accepted.
Table 21-(i). Correlation Results of the Salary (Monthly In-Come) on Employee
Commitment.
ANOVA
Sum of Squares df Mean Square F Sig.
Commitment Between
Groups 3510.020 3 1170.007 7.074 .000
Within
Groups 93618.031 566 165.403
Total 97128.051 569
Table 21-(ii). Regression Results of the Salary (Monthly In-Come) on Employee
Commitment.
Model
Unstandardized
Coefficients
Standardized
Coefficients t Sig.
B
Std.
Error Beta B
Std.
Error
1 (Constant) 75.268 1.226 61.372 .000
p3q5
Monthly
Income
Salary
-.928 .325 -.119 -2.859 .004
A Dependent Variable: EC_SCORE Employee Commitment
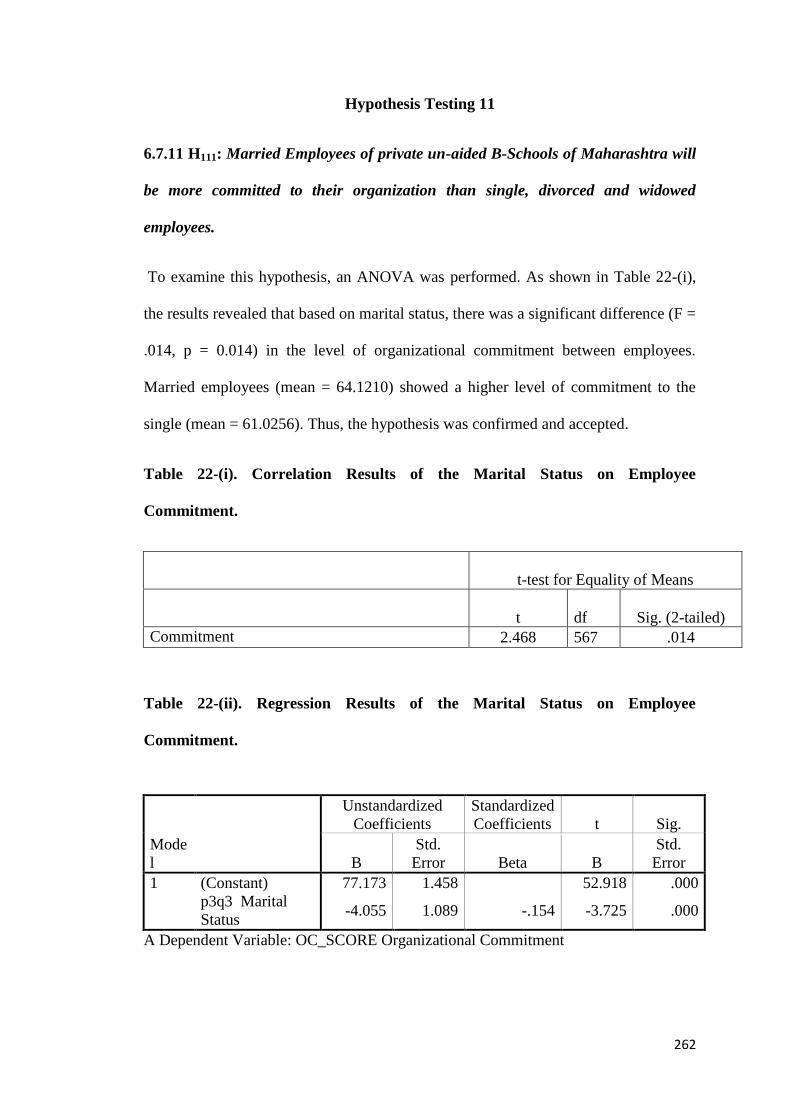
262
Hypothesis Testing 11
6.7.11 H111: Married Employees of private un-aided B-Schools of Maharashtra will
be more committed to their organization than single, divorced and widowed
employees.
To examine this hypothesis, an ANOVA was performed. As shown in Table 22-(i),
the results revealed that based on marital status, there was a significant difference (F =
.014, p = 0.014) in the level of organizational commitment between employees.
Married employees (mean = 64.1210) showed a higher level of commitment to the
single (mean = 61.0256). Thus, the hypothesis was confirmed and accepted.
Table 22-(i). Correlation Results of the Marital Status on Employee
Commitment.
t-test for Equality of Means
t df Sig. (2-tailed)
Commitment 2.468 567 .014
Table 22-(ii). Regression Results of the Marital Status on Employee
Commitment.
Mode
l
Unstandardized
Coefficients
Standardized
Coefficients t Sig.
B
Std.
Error Beta B
Std.
Error
1 (Constant) 77.173 1.458 52.918 .000
p3q3 Marital
Status -4.055 1.089 -.154 -3.725 .000
A Dependent Variable: OC_SCORE Organizational Commitment
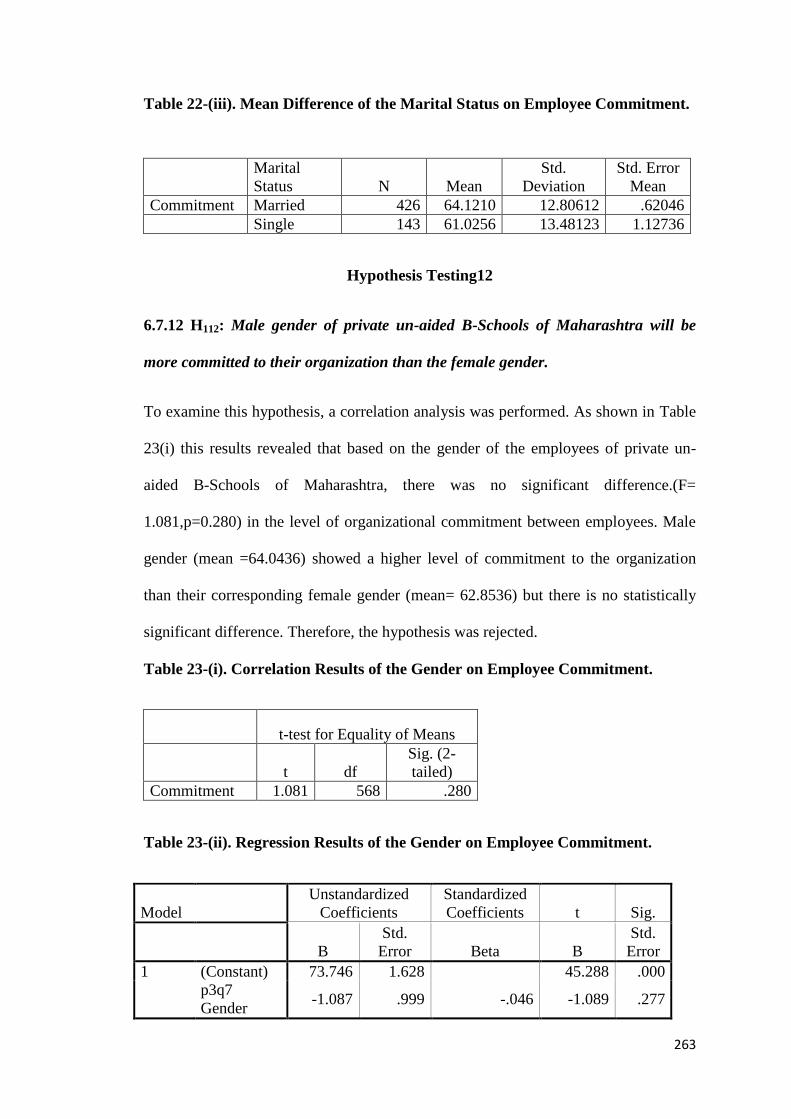
263
Table 22-(iii). Mean Difference of the Marital Status on Employee Commitment.
Marital
Status N Mean
Std.
Deviation
Std. Error
Mean
Commitment Married 426 64.1210 12.80612 .62046
Single 143 61.0256 13.48123 1.12736
Hypothesis Testing12
6.7.12 H112: Male gender of private un-aided B-Schools of Maharashtra will be
more committed to their organization than the female gender.
To examine this hypothesis, a correlation analysis was performed. As shown in Table
23(i) this results revealed that based on the gender of the employees of private un-
aided B-Schools of Maharashtra, there was no significant difference.(F=
1.081,p=0.280) in the level of organizational commitment between employees. Male
gender (mean =64.0436) showed a higher level of commitment to the organization
than their corresponding female gender (mean= 62.8536) but there is no statistically
significant difference. Therefore, the hypothesis was rejected.
Table 23-(i). Correlation Results of the Gender on Employee Commitment.
t-test for Equality of Means
t df
Sig. (2-
tailed)
Commitment 1.081 568 .280
Table 23-(ii). Regression Results of the Gender on Employee Commitment.
Model
Unstandardized
Coefficients
Standardized
Coefficients t Sig.
B
Std.
Error Beta B
Std.
Error
1 (Constant) 73.746 1.628 45.288 .000
p3q7
Gender -1.087 .999 -.046 -1.089 .277
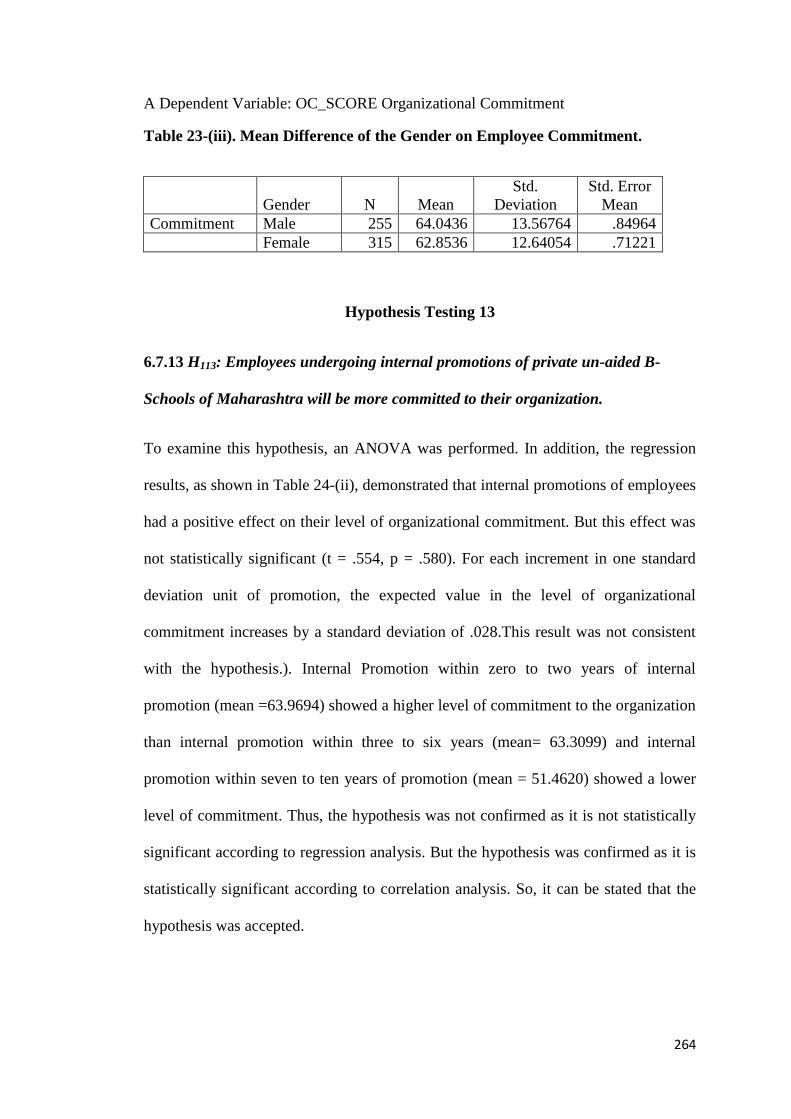
264
A Dependent Variable: OC_SCORE Organizational Commitment
Table 23-(iii). Mean Difference of the Gender on Employee Commitment.
Gender N Mean
Std.
Deviation
Std. Error
Mean
Commitment Male 255 64.0436 13.56764 .84964
Female 315 62.8536 12.64054 .71221
Hypothesis Testing 13
6.7.13 H113: Employees undergoing internal promotions of private un-aided B-
Schools of Maharashtra will be more committed to their organization.
To examine this hypothesis, an ANOVA was performed. In addition, the regression
results, as shown in Table 24-(ii), demonstrated that internal promotions of employees
had a positive effect on their level of organizational commitment. But this effect was
not statistically significant (t = .554, p = .580). For each increment in one standard
deviation unit of promotion, the expected value in the level of organizational
commitment increases by a standard deviation of .028.This result was not consistent
with the hypothesis.). Internal Promotion within zero to two years of internal
promotion (mean =63.9694) showed a higher level of commitment to the organization
than internal promotion within three to six years (mean= 63.3099) and internal
promotion within seven to ten years of promotion (mean = 51.4620) showed a lower
level of commitment. Thus, the hypothesis was not confirmed as it is not statistically
significant according to regression analysis. But the hypothesis was confirmed as it is
statistically significant according to correlation analysis. So, it can be stated that the
hypothesis was accepted.
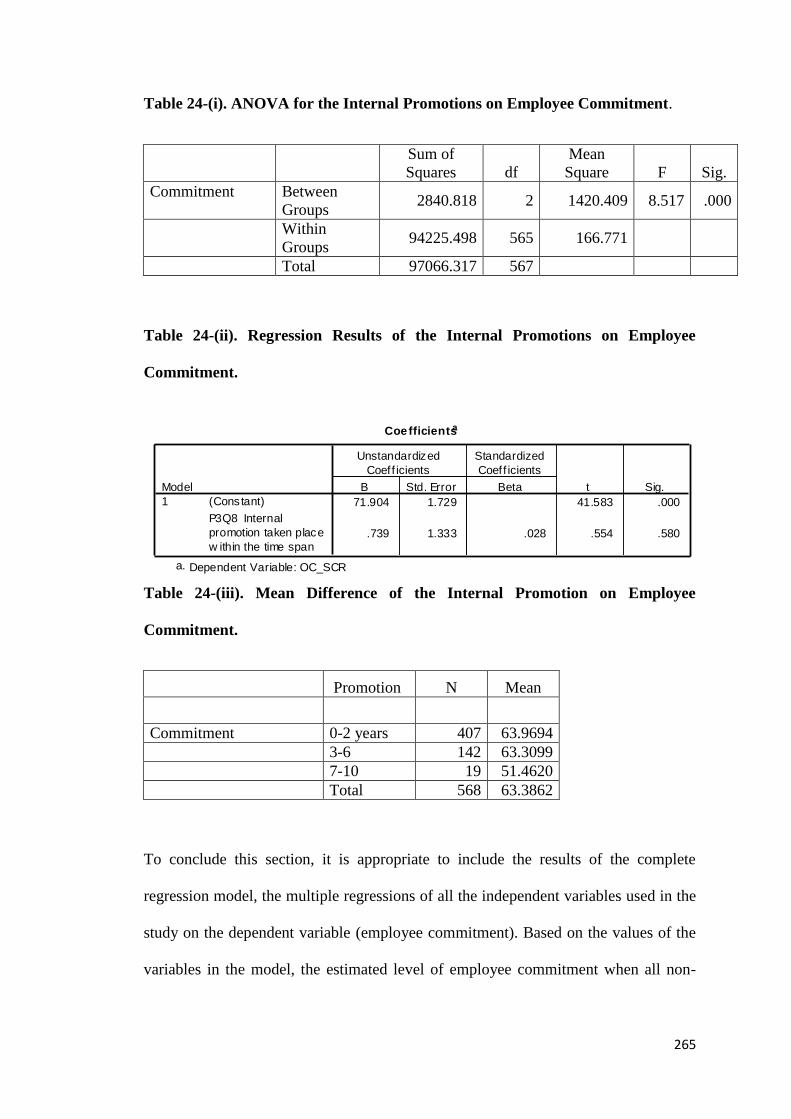
265
Table 24-(i). ANOVA for the Internal Promotions on Employee Commitment.
Sum of
Squares df
Mean
Square F Sig.
Commitment Between
Groups 2840.818 2 1420.409 8.517 .000
Within
Groups 94225.498 565 166.771
Total 97066.317 567
Table 24-(ii). Regression Results of the Internal Promotions on Employee
Commitment.
Table 24-(iii). Mean Difference of the Internal Promotion on Employee
Commitment.
Promotion N Mean
Commitment 0-2 years 407 63.9694
3-6 142 63.3099
7-10 19 51.4620
Total 568 63.3862
To conclude this section, it is appropriate to include the results of the complete
regression model, the multiple regressions of all the independent variables used in the
study on the dependent variable (employee commitment). Based on the values of the
variables in the model, the estimated level of employee commitment when all non-
Coefficientsa
71.904 1.729 41.583 .000
.739 1.333 .028 .554 .580
(Constant)
P3Q8 Internal
promotion taken place
w ithin the time span
Model
1
B Std. Error
Unstandardized
Coeff icients
Beta
Standardized
Coeff icients
t Sig.
Dependent Variable: OC_SCRa.

266
dummy variables are at their mean values is 77.469.Coefficient values for each
dummy show the change in the level of commitment for those categories.
Table 25.Regression Results of all the Independent Variables on Employee
Commitment
Model Unstandardized
Coefficients
Standardized
Coefficients
t Sig.
B Std.
Error
Beta
1
(Constant) 40.522 7.270 5.574 .000
AGE 1.490 1.872 .077 .796 .427
EDUCATION -1.608 1.114 -.109 -1.444 .151
Marital Status .584 1.825 .023 .320 .749
Occupational
Status 1.949 1.112 .160 1.754 .081
Monthly
Income Salary 6.955 3.025 .176 2.299 .023
Length of
service 5.375 1.798 .288 2.989 .003
Gender .980 1.302 .049 .753 .453
Internal
promotion
taken place
within the time
span
-.868 1.658 -.035 -.524 .601
Transactional
Leadership .369 .214 .137 1.719 .087
Transformation
al Leadership .124 .079 .136 1.568 .119
NLF1 -.338 .186 -.131 -1.813
.071
R2=.
24
8
F=5.52
6
SIG=.
000
Dependent Variable: EC_SCR
267
CHAPTER-7
DISCUSSIONS AND CONCLUSIONS
268
CHAPTER-7
DISCUSSIONS AND CONCLUSIONS
This chapter is divided into two sections. Discussions, conclusions, and limitations.
The discussion section provides an explanation of the results and clarifies how they
are related to the literature. The second section is concerned with providing
meaningful conclusions derived from the study findings.
7.1 Discussion
The research questions for this study include the following:
7.1.1 Research Questions:
1) To what extent are faculties of private unaided B-Schools of Maharashtra
committed to their organizations?
2) What Leadership characteristics do Deans/Directors of private un-aided B-
Schools of Maharashtra possess as interpreted by the faculties under them?
3) What are the effects of the Dean‘s and Director‘s perceived leadership
characteristics on the level of employee‘s organizational commitment?
4) Is there a difference in the level of commitment among academic faculties on
the basis of demographic and job related variables?
5) Is there a difference of Leadership styles perceived and expected by the
academic faculties from their respective Deans and Directors?
To answer these questions, a thorough and detailed review of the literature on
leadership and employee commitment was conducted. Based on the review of the
literature, 4 expectations and 12 hypotheses were derived and tested by the researcher.
269
Before discussing the results of testing the expectations and hypotheses, some
comments should be made regarding the characteristics of the respondents. The
findings of this study indicated that a plurality of respondents were between the ages
of 20 and 29 (58.6%), held Masters Degree MMS and MBA (85.2%), among it 5.6%
with graduation in BA/B.COM/BSc/B.E. and 20.0% with masters degree MMS/MBA
with another masters degree M.A/M.E./MSc, were married (74.4%), were employed
as Assistant Professors (51.6%), were in the middle and higher income category
(76.3%), and had worked between 1 and 5 years of service in private un-aided B-
Schools of Maharashtra ( 56.8%)., were of the gender female(55.3%), and have
experienced internal promotions in their present organization within 1 and 2 years
(52.8%).The relationships between the answers of the majority on the eight
demographic items are logically accepted.
With regard to testing the research expectations and hypotheses, the results indicated
that only one expectation was supported, while three were rejected. The results also
indicated that eleven while two were rejected.
The findings of this study revealed that the majority of private un-aided B-School‘s
employees (70.2%) of Maharashtra were found to be committed to the organization,
while the remaining percentage were found either neutral or uncommitted. The
highest score for the category of employee commitment was 105 and the lowest score
was 68.These results were consistent with the hypothesis that the majority of the
employees of the private un- aided B-Schools of Maharashtra were found to be highly
committed to their organization. One explanation of this result could be that the
majority of the B-School employees are well paid and have family responsibility and
are belonging to the female gender category, that positively affect their level of
commitment to the organization. Another explanation of this could be that less
270
number of doctoral degrees was found among the B-Schools academic facilitates were
relatively low in number. Very high levels of education negatively affect the level of
commitment of employees. Steers (1977) argued that employees with higher levels of
education may have higher expectations which make it difficult for an organization to
meet such expectations and results in less committed employees. Another explanation
of this could be that private sector employees are more committed to their
organization than their counterparts in the private sector. Buchanan (1974a) also
observed that public managers are ―less involved, less loyal, and display weaker
identification with the aims of their agencies than business executives‖ (p.345).
The results of the study showed that the majority of the private un-aided B-School‘s
academic faculties observed their Heads of the Departments as transformational and
transactional. This result was also consistent with what the study hypothesized.
However, the findings indicated that the score for Head of the Departments
categorized as transactional was 45.2% and the score for Head of the Departments
categorized as transformational was about 63.1%. This implied the prevalence of
transactional and transformational leadership characteristics among the majority of
Heads of the Departments in private un-aided B-Schools of Maharashtra. (The highest
score for the category transactional leadership style was 40 and the lowest score was
20, the highest score for the category transformational leadership style was 90 and the
lowest score was 54). But the expectation of the academic faculties of B-Schools
slightly varies in transformational leadership (The highest score for the category
transformational leadership style was 90 and the lowest score was 61). The literature
revealed that transactional leadership is a type of leadership that is based on an
exchange relationship between leader and follower. The transactional leaders focus on
the clarification of task requirements and the specification of contingent rewards

271
(Bass, 1990).Whereas the Transformational leaders transform the needs, aspirations,
and values of followers from a focus on self-interest to a focus on collective interest.
They practice trust building to create strong commitment to a common mission. They
generate emotion, energy, and excitement that cause followers to make significant
personal sacrifices in the interest of the mission, and to perform above and beyond the
call of duty. (Lussier /Achua, 2008).One reason behind this could be that academic
faculties of private un-aided B-Schools in Maharashtra number more in Female
gender (55.3%) than their male counterparts (44.7%).In female gender emotive
factors and emotional attachment are more sensitive than male gender.
Transformational leadership has been found to be positively related to organizational
commitment and job-satisfaction. And as found from the result of the study the
commitment level (70.2%) is quite high among the academic faculties of the B-
Schools of Maharashtra. Therefore the result confirms the earlier studies and
definitions of transformational leadership style too and also indicated that the majority
of the respondents viewed their Head of the departments as transformational. This
finding support the hypothesis that the majority of the academic faculties of the B-
Schools of Maharashtra perceive their managers to be significantly transformational
as well as transactional in their leadership style and keeps an expectation from their
Head of the departments to be more transformational than transactional. The result
also shows that the Head of the departments are not following Laissez –Faire
Leadership style. Both the expected and observed leadership style findings of the
respondents show that Laissez-faire leadership style has. Thereby we find that the
findings support Hypothesis 1, 3, 4, 5&6. The findings confirms the earlier literature
too that it describes a process of positive influence that changes and transforms
individuals, organizations, and communities. Transformational leaders influence their

272
constituencies to make the shift from focus on self-interests to a focus on collective
interests. They understand the importance of trust building as a means to creating a
high commitment to mission-driven outcomes. Effective transformational leaders use
their charisma and power to inspire and motivate followers to trust and follow their
example. They generate excitement and energy by focusing on the future
(Lussier/Achua, 2008). The present research study have revealed that transformational
leadership has been found to be positively related to organizational commitment and
in turn work outcomes. The research data showed that the respondents i.e., the
academic faculties of private un-aided B-Schools of Maharashtra observed/perceived
their immediate Heads of the Departments/Directors to whom they report, with the
following findings of transformational leadership style:
a) Build Trust(IA) [.000(**)]
b) Acts with Integrity(IB)[.000(**)]
c) Inspires other (IM) [.000(**)]
d) Encourages Innovative thinking(IS)[.012(*)]
e) Couches people(IC)[.000(**)]
For the above data: ** Correlation is significant at the 0.01 level (1-tailed).
* Correlation is significant at the 0.05 level (1-tailed).
The research data showed that the respondents i.e., the academic faculties of private
un-aided B-Schools of Maharashtra expected from their immediate Heads of the
Departments/Directors to whom they report, with the following findings of
transformational leadership style:
a) Build Trust(IA) [.010(*)]
b) Acts with Integrity(IB)[.047(*)]
273
c) Inspires other (IM) [.004(**)]
d) Encourages Innovative thinking(IS)[.362]
e) Couches people/Individual consideration(IC)[.122]
Transactional Leadership seeks to maintain stability within an organization through
regular economic and social exchanges that achieve specific goals for both the leaders
and their followers. Burns indicated that the transactional leaders influence followers
by transactions of exchange in which rewards such as pay, promotions, or status are
exchanged for work. Bass maintains that transactional leadership revolves around the
leader-follower exchange, in which the leader rewards the follower for specific
behaviours and performance that meets with the leader‘s expectations, and punishes
or criticizes behaviour or performance that does not meet expectation. The research
data showed that the respondents i.e., the academic faculties of private un-aided B-
Schools of Maharashtra observed/perceived their immediate Heads of the
Departments/Directors to whom they report, with the following findings of
transactional leadership style:
a) Contingent Reward (CR) [.000(**)]
b) Management By Exception-Active(MBE-A) [.000(**)]
c) Fights Fire-Management By Exception-Passive (MBE-P) [.001(**)]
For the above data: ** Correlation is significant at the 0.01 level (1-tailed).
* Correlation is significant at the 0.05 level (1-tailed).
The research data showed that the respondents i.e., the academic faculties of private
un-aided B-Schools of Maharashtra expected their immediate Heads of the
Departments/Directors to whom they report, with the following findings of
transactional leadership style:
274
a) Contingent Reward (CR) [.249]
b) Management By Exception-Active(MBE-A) [.077]
c) Fights Fire-Management By Exception-Passive (MBE-P) [.103]
For the above data: ** Correlation is significant at the 0.01 level (1-tailed).
* Correlation is significant at the 0.05 level (1-tailed).
From the above data it is understood that the academic faculties of the B-Schools of
Maharashtra do not want their Heads of the Departments and the Directors to whom
they report to follow transactional leadership style.
The research data also showed that the respondents i.e., the academic faculties of
private un-aided B-Schools of Maharashtra GAP between the perceived and
observed leadership styles of their immediate Heads of the Departments/Directors
to whom they report, with the following findings of transformational as well as
transactional leadership style:
a) Build Trust(IA) [.014(*)]
b) Acts with Integrity(IB)[.011(*)]
c) Inspires other (IM) [.081]
d) Encourages Innovative thinking(IS)[.045(*)]
e) Couches people(IC)[.004(**)]
f) Contingent Reward (CR) [.000(**)]
g) Management By Exception-Active(MBE-A) [.004(**)]
h) Fights Fire-Management By Exception-Passive (MBE-P) [.019(*)]
For the above data: ** Correlation is significant at the 0.01 level (1-tailed).
* Correlation is significant at the 0.05 level (1-tailed).
So, it‘s understood from the above given data that the academic faculties observe their
275
Heads/Directors to be both transactional and transformational. But their expectation is
more towards transformational leaders than transactional. Despite these differences, it
is worth mentioning that effective leaders exhibit both transactional and
transformational leadership skills in appropriate situations. Along these lines, one
study proposed that a manager‘s perceptions of organizational context and personality
variables would influence or constrain his or her utilization of transformational and
transactional leadership behaviours (S.L.Shivers-Blackwell, 2004 /J.E.Bono and
T.A.Judge, 2004). A meta-analytic test of the relative validity of transformational and
transactional leadership styles revealed that both are valid approaches for achieving
organizational objectives,(B.M. Bass ,B.J.Avolio,D.I.Jung,and Y.Berson,2003) with
transformational leadership showing the highest overall relations and transactional or
contingent reward leadership a close second.(T.Judge and R.Piccolo,2004)
In other research study comparing transformational, transactional, and laissez-faire
leadership styles between women and men, it was found that female leaders were
more transformational than male leaders, and also engaged in more of the contingent
reward behaviours that are a component of transactional leadership. Male leaders
were generally more likely to manifest the other aspects of transactional leadership
(active and passive management by exception) and laissez-faire leadership (A.H.
Eagly, M.C. Johannesen Schmidt, and M.L.V.Engen, 2003).
Consistent with what this study hypothesized, the results revealed that both
Transformational and Transactional Leadership Styles had a positive impact on the
level of organizational commitment of employees. An explanation for this result could
be that B-School Faculties value the transformational and Transactional leadership
styles because they are consistent with the academic values and cultures. These
findings support the other scholarly studies. Bass and Avolio (1994) stated that both
276
transformational and transactional leadership styles enhance the level of commitment
to the organization among employees. Further, it has been found that the level of
organizational commitment of employees was positively related to the initiating and
consideration structure behaviours(which are similar to transactional and
transformational leadership styles, respectively)of their immediate managers(Brief et
al.,1976;Morris & Sherman,1981).In other research, the positive relationship between
transformational leadership style and the level of organizational commitment was
emphasized(Bateman & Strasser,1984;Bycio et al.,1995;Carlson &
Perrewe,1995;Michael & Sector,1982;Morris Sherman,1981). The effects of both
styles on organizational commitment were consistent with Bass‘s augmentation
theory of leadership. Bass‘s augmentation theory of leadership postulates that
successful leaders are both transformational and transactional. Based on this theory,
transformational and transactional leadership styles should have positive effects on
the level of organizational commitment of employees and this is what this study
demonstrated. The findings showed that transformational and transactional leadership
styles positively affected organizational commitment. The results also indicated that
transformational leadership had a greater impact on the level of organizational
commitment of employees compared to transactional leadership. This could be
attributed to two factors; first, the transformational leadership focuses more on the
human side of individuals. In relation to this, Carlson and Perrewe (1995) stated that,
―When transformational leadership is enacted, members of organizations no longer
seek merely self-interest, but that which is beneficial to the organization as a whole‖
(p.832)
The findings of this study revealed that there was a significant positive relationship
between the age of employees and their organizational commitment level. An
277
explanation of this finding could be that when employees get older, their alternative
employment opportunities become limited. As a result, they are likely to develop
more positive attitudes toward their organization including organizational
commitment. This finding was consistent with the literature (Angle & Perry, 1981;
Hrebiniak, 1974; Lee, 1971; Mathieu & Zajac, 1990).Mowday et al. (1982) and
Meyer and Allen (1984) indicated that when the individual gets older and remains
with an organization longer, the individual‘s opportunities for alternative employment
tend to decrease, thereby enhancing the employee‘s commitment to the organization.
With respect to the relationship between education and the level of organizational
commitment of employees, the results demonstrated that there was a positive
relationship between the two variables but is not statistically significant. To explain
this relationship, we can say that more educated employees often have higher
expectations which may be met with in academic institution, since the promotion is
based on academic developments and not only performance based. Though previous
literature and research study conducted in public organization in Saudi Arabia
confirms that highly qualified employees adversely affects employee‘s level of
commitment toward their organization(Faisal Homoud A-Ammaj,2000). In relation to
this, Mowday et al.(1982),Steers (1977),Mathieu and Zajac (1990), and AL-Kahtany
(1998) found education to be inversely related to commitment. But with respect to B-
School‘s academic faculties of Maharashtra it is not inversely related but positively
related but not statistically significant.
As predicted, the results of this study showed that there was a significant and positive
relationship between the length of service of employees and employee commitment.
This finding was consistent with previous studies (AL-Kahtany, 1998; Angle & Perry,
1981; Hrebiniak, 1974; Lee, 1971; Mathieu and Zajac, 1990). One explanation for this
278
finding can be that when employees stay longer with an employer; their alternative
employment opportunities become limited. This positively affects the employee‘s
attitudes toward the employer and consequently enhances their organizational
commitment. It may also be that the longer one is in an organization, the more
acclimated they become to the norms and values that constitute part of the
organizational culture.
With regard to occupational status, the results indicated that occupational status was
positively related with employee commitment but is not statistically significant. In
other research, it has been found that a positive relationship between occupational
status and employee commitment exists (AL-Kahtany, 1998; Wiener & Vardi, 1980).
This positive relationship is due to the fact that employees who occupy top-level or
heading the department have more pay and prestige. As a result, employees tend to be
more committed.
Additionally, the results indicated that there was a positive relationship between
monthly income (salary) and employee commitment. And this effect was statistically
significant at .05 levels; it was significant at .10 levels. A logical explanation for such
a relationship is that pay or monthly income is one of the most important factors that
assess employee‘s attitudes toward their organization. This finding supports previous
research studies (AL-Kahtany, 198; Angle & Perry, 1983; Becker, 1960).
In testing the hypothesis based on marital status, the findings clearly showed that
married employees were found to be more committed than single, divorced, or
widowed employees. This result of this finding was statistically significant and was
positively related to employee commitment. This result is consistent with the
literature (Kawakubo, 1987; Lincoln & Kalleberg, 1990). To explain this, one may
279
say that married employees often have big responsibilities for their families which
force them to be more committed than others. For instance, it is more cost incurring
and risk taking for a married employee who has family responsibility upon him to
leave his employer without alternative employment or income than a single employee.
These responsibilities force married employees to be more committed to their
employing organizations.
In testing the hypothesis based on gender classification, the findings clearly showed
that there is a positive relation of both the gender with employee commitment, but the
result of the findings was not statistically significant. The hypothesis demands that
male gender will be more committed to their organizations than their female
counterparts‘. Since the frequency and the strength of the female employees are more
in the academic faculties of the B-Schools of Maharashtra, It could be said that the
number of female employees along with their male counterparts are committed to
their organizations. Gender, as a topic in organizational commitment literature, has
been approached from both the gender-model and the job model (Aven, Parker, &
McEvoy, 1993). The gender approach to the study of women and organizational
commitment was described as one where the basic belief was that, "women accept
family roles as a chief source of their identity and fulfilment, leading to a different
orientation to work for men, for whom work is paramount" (Loscocco, 1990, p. 155).
In contrast, proponents of the job-model view concerning the study of organizational
commitment and women indicated that there were no differences in the work attitudes
of women and men, and that work attitudes of both sexes developed in similar ways
(Loscocco).
In testing the final hypothesis, the findings clearly showed that employees who had
undergone internal promotion within 0-6 years are more committed to their
280
organization than the rest. The explanation of this could be the simple psychology of
employees‘ ambition to be promoted keeps their commitment to their employer. The
descriptive statistics showed that employee(63.9694) undergo internal promotion
within a span of 0-2years and employee(63.3099) undergo internal promotion within
a span of 3-6years,and (51.4620)employees undergo internal promotion within a span
of 7-10years. The correlation result shows that internal promotion is statistically
significant with employee commitment. It should be noted here that the findings of
the overall regression results indicated that the result was not statistically significant.
To explain this, it could be that the existence of multicollinearity between some
variables led to incorrect results.
To summarize the result it could be suggested that the most committed employee is
the one who is older, educated, has a high monthly income, has served the
organization for a considerable period of time, is married, male, and undergoes early
promotions, and works under a leader who is more of transformational, transactional
too but less laissez-faire in following the leadership styles with an expectation of their
Leaders to be more and more Transformational in nature.
7.2 CONCLUSION
As organizations strive to improve, there is a pressing need to understand the factors
that may directly or indirectly impact individual‘s behaviours in organizations. This
study was concerned with two important issues in the field of organizational
behaviour, organizational commitment and leadership. The literature revealed that
both subjects were considered as major contributors to the success of any
organization, public or private. Based on the findings of the present study, the
researcher developed the following conclusions:

281
1. The findings of this study indicated that transactional and transformational
leadership styles positively impacted the level of employee commitment of the
academic faculties of the B-Schools of Maharashtra. Additionally, the findings
showed that the organizational commitment of individuals was negatively
affected by the laissez-faire leadership style. Thus, in terms of organizational
commitment, these results provide support for the cross-cultural applicability
of Bass‘s augmentation theory of leadership, which postulates that successful
leaders are both transformational and transactional. Bass (1996) stated that ‗
although the model of transformational or transactional leadership may have
needs for adjustments and fine-tuning as we move across cultures, particularly
into non-Western, overall, it holds up as having a lot of universal
potential‖(p.754). Furthermore, consistent with Bass‘s theory that stressed that
successful leaders are more transformational, the findings of this study
demonstrated that the academic faculties of the B-Schools of Maharashtra
keeps an expectation from their Heads of the Departments and Directors to be
more transactional in nature while dealing their sub-ordinates and confirmed
that sub-ordinates of transformational leaders were more committed to the
organization than those who were under transactional leaders.
2. The results revealed that the majority of the academic faculties of the B-
Schools of Maharashtra were found to be committed to the organization.
3. The majority of the academic faculties of the B-Schools of Maharashtra
perceived/observed their leaders or Heads of the Departments/Directors to
exhibit transformational and transactional characteristics, but keeps an
expectation from their Heads to whom they report to be more transformational
in nature and follow contingent reward as well as management by exception-
282
active when concerning transactional leadership. Management by exception –
passive was not accepted by the B-School academic employees.
4. Consistent with early research studies, the demographic variables of age,
education, monthly income, marital status i.e., married employees had
significant positive impacts on employee commitment. The result also shows
that length of service, internal promotion, occupational status are positively
related to employee commitment but the statistical results are not significant.
The result also shows that both male and female employees are positively
related to employee commitment but their statistical findings showed no
significant difference.
283
CHAPTER 8
RECOMMENDATIONS AND SUGGESTIONS
284
CHAPTER 8
RECOMMENDATIONS AND SUGGESTIONS
8.1 Recommendations:
Based on the results of the research findings, it could be said that, to enhance
employee‘s organizational commitment, leaders or Heads of the Departments have to
utilize both Transformational and Transactional Leadership Styles.
If employees are highly committed, they are expected to be highly productive and
loyal to their employing organization. However, the results of the study show that the
academic faculties of the private un-aided B-Schools are moderately committed to
their organisation. This result carries with it an important implication that the
organization may achieve its goals with the committed employees. Buchanan (1974a)
argued that employee commitment is no less than a precondition for successful
organizations. In addition, the literature demonstrated that organizational commitment
of employees is positively related to job performance and tenure with the
organization, and negatively with turnover, absenteeism, and tardiness. Therefore, the
Heads of the Departments or the Directors of the B-Schools of Maharashtra, leaders
and managers and those who are responsible for the developments of the employees
working under their leadership must pay close attention to their styles of dealing
people and enhance their skills for better job-performance and productivity and their
quality of teaching or working.
Heads and Directors of the institutes who hold the leadership position should follow
both transformational and transactional leadership styles as the findings demonstrated
that the employee‘s level of organisational commitment was having positive impact

285
by transformational and transactional leadership style.
Leaders who avoid responsibilities and making decisions are not appreciated by their
employees as the result of the research shows that the Laissez-Faire style had a
negative impact on the employee commitment. Therefore, it is recommended that
Heads should be more active in taking responsibilities and actively taking part in
decision–making process.
The findings also indicated that the maximum positive contribution to employee
commitment came from the behaviours associated with transformational leadership. It
implies that a high level of organisational commitment of employees would be a
result of having Deans and Directors of the B-Schools who are both transformational
and transactional, but who display more transformational characteristics.
Orientation programs should be applied. Such programs will provide new employees
with a general background about the organisation, its mission, its values, and its
policies.
Communications between management and highly educated employees should take
place.
Regular increments and special increments for the deserving candidates should be
implemented. Rewards and award giving ceremony should be held on annual
occasions to motivate and inspire aspiring employees too.
Experienced employees and employees who are in service to the organisation for a
considerable period of time should be given importance and not taken for granted.
Their advice and contributions can be pertinent to the achievement of the
organisational goals.
286
Internal promotional system should be there in terms of the employee‘s performance
and interpersonal communication skills. Institutions should provide a supportive work
environment, which creates a mutually beneficial environment.
Institutions should demonstrate their commitment to the employees by providing
comprehensive training, sharing information, provide for the development and growth
of employees within the organisation.
8.2 Suggestions:
It is suggestive that the Heads of the departments or the Directors under whose
leadership the academic faculties of the private un-aided B-schools of Maharashtra
are working should be more transformational and transactional in nature while dealing
with the academic faculties.
It is even more suggestive that the Heads or the directors should be more
transformational in their leadership styles. They should be more co-operative and
participative in nature. Though they are expected to be transactional in their
leadership styles but they should not devote much time over finding mistakes in their
sub-ordinate faculties.
The Heads and the Directors should not avoid or delay in taking decisions. They
should be more punctual by nature and should not delay in responding to urgent
questions. They should not be absent when needed and should not wait for things to
go wrong before taking actions. Their steady involvement in all the important issues
and problems should be there.
For newly joined faculties orientation programs should be conducted.
Regular communications should be there between the management and highly
287
educated faculties.
Regular increments as per the HR of the institutions should be there. Whenever new
openings are there, internal candidates should be considered first for the promotions.
Inspirational and motivational training programmes should be there for the faculties.
For good academic achievements or feedback from the students or conducting
National and International seminars or for resource generation for the institute, the
faculties should be rewarded and awarded.
Employees who are working for a considerable period of time and the senior
employees should be given more importance and should be involved in the decision–
making process. Their wisdom and experience can be beneficial to the organisation.
288
BIBLIOGRAPHY
Allen, N.J., & Meyer, J.P. (1990). The Measurement and Antecedents of Affective,
Continuance and Normative Commitment to the Organization. Journal of
Occupational Psychology, pg.1-18.
Allen, N. J., & Meyer, J. P. (1993). Organizational commitment: Evidence of career
stage effect? Journal of Business Research, Vol-26, Pg. 49-61.
Alpander, G.G. (1990). Relationship between commitment to hospital goals and job
satisfaction: A case study of a nursing department. Journal of Health Care
Management Review, Vol-15, Pg 51-62.
Alluto, J. A., Hrebiniak, L. G., & Alonso, R. C. (1973). On operationalizing the
concept of commitment. Journal of Social Forces, Vol-51, Pg. 448-454.
Angel, H.L., & Perry, J.L. (1981). An Empirical Assessment of Organizational
Commitment and Organizational Effectiveness. Journal of Administrative Science
Quarterly, Vol. 26, pg. 1-14.
Angle, H.L., & Perry, J.L. (1983).Organizational Commitment: Individual and
Organizational Influences. Journal of Work and Occupations.Vol-10, Pg 123-146.
Ansari, M.A. (1990). Managing People at Work: Leadership Styles and Influence
Strategy. Publisher: Sage Publication, New Delhi/London.
Aranya, N., Kushnir, T., & Valency, A. (1986). Organizational commitment in a
male-dominated profession. Journal of Human Relations, Vol-39, Pg.433-448.
Austin, A.E., & Gammon, Z.F. (1983) Academic Workplace: New Demands,
Heightened Tensions. Journal of Higher Education Research Report
No.10.Wasington, DC: Association for the Study of Higher Education.
289
Avolio, B.J. & Bass, B.M. (1991). The Full Range of Leadership Development: Basic
and advanced Manuals. Publisher: Bass, Avolio, & Associates.
Aven, F. F., Parker, B., & McEvoy, G. M. (1993). Gender and attitudinal
commitment to organizations: A meta-analysis. Journal of Business Research, Vol-
26, Pg.63-73.
A.H. Eagly, M.C. Johannesen Schmidt, and M.L.V. Engen. ―Transformational,
Transactional, and Laissez-Faire Leadership Styles: A Meta-Analysis Comparing
Women and Men,” Journal of Psychological Bulletin, Vol 129(4), July-2003, Pg.569-
582.
Agarwal, P. (2006), “Higher education policy: many contradictions”, Economic and
Political Weekly, 11 November, pp. 4645-8.
Asubonteng, P., McCleary, K.J. and Swan, J.E. (1996), “SERVQUAL revisited: a
critical review of service quality”, Journal of Services Marketing, Vol. 10 No. 6, pp.
62-81.
Asha Gupta, 2008. International trends and private higher education in India.
Publisher: Emerald Group Publishing Limited International Journal of Educational
Management, Vol. 22 No. 6, 2008, pp. 565-594,
AICTE (1994), Report of the High Power Committee for Mobilization of Additional
Resources for Technical Education, All India Council for Technical Education, New
Delhi.
Baruch, Y. (1998). The Rise and fall of Organizational Commitment and Human
System Management, Vol-17, Pg 135-144.
Bass, B.M. (1981) Stogdill‘s Handbook of leadership: Revised and expanded edition.
New York: The Free Press.

290
Bass, B.M. (1985). Leadership and Performance beyond Expectations. Publisher: Free
Press, New York.
Brown, R. B. (1996). Organizational commitment: Clarifying the concept and
simplifying the existing construct typology. Journal of Vocational Behaviour, Vol-49,
Pg.230-251.
Babakus, E. and Boller, G.W. (1992), ―An empirical assessment of the SERVQUAL
scale”, Journal of Business Research, Vol. 24 No. 3, pp. 253-68.
Boyatzis, R.E. and Renio, A. (1989), “Research article; the impact of an MBA on
managerial abilities”, Journal of Management Development, Vol. 8 No. 5, pp. 66-77.
Banker, R.D., Charnes, A.W. and Cooper, W.W. (1984), “Some models for estimating
technical and scale inefficiencies in data envelopment analysis”, Management
Science, Vol. 30 No. 9, pp. 1078-92.
Barnhart, B.T., & Bechhofer, S. (1995). New Faculty Departure at Five Institutions.
Presented at the Annual Meeting of the American Educational Research Association.
San Francisco, CA. April 18-22, 1995.
Dayal, I (1998), Reappraising Management Education, A Perspective for the Future,
Mittal Publications, New Delhi.
Dhopte, S.J. (2011). Impact of Globalization on Indian Higher Education Sector with
Respect to Selected Parameters. PhD thesis in Business Management from
Padmashree Dr.D.Y.Patil University, Pg.258.
Romzek, B.S. (1990) .Employee Investment and Commitment: The ties that bind.
Public Administration Review.Vol-50, Pg.374-382.
Bass, B.M. (1990). Bass & Stogdill‘s handbook of leadership (3rd
Ed.). New York:
Free Press.

291
Bass, B.M. (1996). Anew paradigm of leadership: An inquiry into transformational
leadership. Alexandria, VA: U.S.Army Research Institute for Behavioural and Social
Sciences.
Bass, B.M. (1996). Is there universality in the full range model of leadership?
International Journal of Public Administration, Vol-19, Pg.731-761.
Bass, B.M., & Avolio, B.J. (1990a).The implications of transactional and
transformational leadership for individual, team, and organizational development. In
W.A. Pasmore & W.Woodman (Eds.), Research in Organizational Change and
Development, Greenwich, CT: Jai Press, Inc.Pg 231-272.
Bass, B.M. & Riggio, R.E. (2006).Transformational Leadership. Publisher: Lawrence
Erlbaum Associates, New York.
Bass, B.M. (1998). Transactional Leadership: Industry, Military, and Educational
impact. Publisher: Lawrence Erlbaum Associates, New York.
Bass, B.M. & Avolio, B.J. (2004). Multifactor Leadership Questionnaire. Publisher:
University of Nebraska, Binghamton.
Bass, B.M. & Avolio, B.J. (1995). MLQ Multi-factor Leadership Questionnaire
Manual. Publisher: Mind Garden, Palo Alto.
B.M. Bass, B.J. Avolio, D.I. Jung, and Y. Berson (2003), ―Predicting Unit
Performance by Assessing Transformational and Transactional Leadership,‖ Journal
of Applied Psychology, Vol-88, Pg. 207-219.
Bateman, T.S. & Strasser, S. (1984). A Longitudinal Analysis of the Antecedents of
Organizational Commitment. Academy of Management Journal, vol.27, pg. 95-112.
Baruch, Y. (1998). The Rise and fall of Organizational Commitment. Journal of
Human Systems Management, 17(2), pg.135-144.

292
Barling, J., Weber, T and Kelloway, E. K. 1996. ―Effects of Transformational
Leadership Training on Attitudinal and Fiscal Outcomes: A Field Experiment‖,
Journal of Applied Psychology, vol. 81, pp. 827-832.
Batten, J.D. (1989).Tough-Minded Leadership. New York: American Management
Association (AMACOM).
Becker, H.S. (1960) .Notes on the Concept of Commitment. American Journal of
Sociology, vol.66, pg. 32-40.
Behling, O. & Schriesheim, C. (1976).Organizational Behaviour: Theory, research,
and application. Boston: Allen and Bacon, Inc.
Benkhoff, B. (1997) Disentangling organizational Commitment. Personnel Review,
Vol-26, Pg.114-131.
Becker, T.E., Randall, D.M., & Reigel, C.D. (1995). The Multidimensional view of
Commitment and the Theory of Reasoned Action: A Comparative Evaluation.
Journal of Management, Vol21 (4), Pg.616-639.
Blake, R.R. & Mouton, J.S. (1975).An overview of the grid. Training and
Development Journal, Vol-29(5), Pg 29-37.
Bowditch, J. L. and Buono, A. F. (1990). A Primer on Organizational Behaviour.
John Wiley & Sons, New York.
Bryman, A. (1996). Leadership in Organization. In S.R.Clegg, C.Hardy, & W.Nord,
Handbook of Organizational Studies. London: Sage Publications. Thousand Oaks.
Bryman, A. (1986).Leadership and Organizations. London: Routledge & Kegan Paul.
Buchanan, B. (1974a).Government Managers, Business Executives, and
Organizational Commitment. Public Administration Review.Vol-34.Pg 339-347.
293
Bowditch, J. L. and Buono, A. F. (1990). A Primer on Organizational Behaviour.
John Wiley & Sons, New York.
Brum, S. (2007).What Impact Does Training takes over Employee Commitment and
Employee Turnover? Publisher: University of Rhode Island, Kingston.
Buchanan, B. (1974b). Building Organizational Commitment: The Socialization of
Managers in Work Organizations. Journal of Administrative Science Quarterly,
vol.14, pg.346-355.
Burn, J.M. (1978). Leadership. Publisher: Harper & Row, New York.
Bycio, P., Hackett, R.D., & Allen, J. (1995).Further assessments of Bass‘s (1985)
conceptualization of transactional and transformational leadership. Journal of Applied
Psychology, Vol-80, Pg 468-478.
Cannella, Jr., A.A., & Monroe, M.J. (1997).Contrasting perspectives on strategic
leaders: Toward a more realistic view of top managers. Journal of Management, Vol-
23, Pg 213-237.
Carlson, D.S., & Perrewe, P.L. (1995).Institutionalization of Organizational Ethics
through Transformational Leadership. Journal of Business Ethics. Vol 14, Pg 829-
838.
Chemers, M.M. (1997). An Integrative Theory of Leadership. Publisher: Lawrence
Erlbaum Associates, New York.
Coetzee. (2005). Employee Commitment. Publisher: University of Pretoria (Pty) Ltd.,
Hatfield.
Conger, J. A. 1999, ―Charismatic and Transformational Leadership in Organizations:
An Insider's Perspective on these Developing Streams of Research‖. The Leadership
Quarterly, vol.10, no.2, pp. 145-179.
294
Chitnis, S. and Altbach, P.G. (Eds) (1993), Higher Education Reforms in India:
Experiences and Perspectives, Sage Publications, New Delhi.
Charnes, A., Cooper, W.W. and Rhodes, E. (1978), “Measuring the efficiency of
decision making units”, European Journal of Operational Research, Vol. 2 No. 2, pp.
429-44.
Caplow, T., & McGee, R.J. (1958).The Academic Marketplace. New Brunswick, NJ:
Transaction Publishers.
Cronin, J.J. and Taylor, S.A. (1992), ―Measuring service quality: a re-examination
and extension”, Journal of Marketing, Vol. 56 No. 7, pp. 55-68.
Cronin, J.J. and Taylor, S.A. (1994), “SERVPERF versus SERVQUAL: reconciling
performance-based and perceptions-minus-expectations measurement of service
quality”, Journal of Marketing, Vol. 58, January, pp. 125-31.
Davis, & Newstorm, J.W. (1985).Human Behaviour at work: Organizational
Behaviour (7th
Ed.).New York: McGraw-Hill Book Company.
Davenport, T.H., Prusak, L., 1998‖, “Working Knowledge: How Organizations
Manage What They Know”, Harvard Business School Press
Deluga, R. J. (1990). The effects of Transformational, Transactional and Laissez Faire
Leadership characteristic on Subordinate Influencing Behaviour. Journal of Basic and
Applied Social Psychology, Vol- 11(2), Pg. 191-203
Dykes, A.R. (1968). Faculty participation in academic decision making, Washington:
American council on Education.
Dayal, I (1998), Reappraising Management Education, A Perspective for the Future,
Mittal Publications, New Delhi.
Dayal, I (1991), Organising Innovation: A Management Study, Concept Publishing
Company, New Delhi.

295
Dogra, S. and Gulati, Anjli (2006), “Learning traditions and teachers role: the Indian
perspective”, Educational Research and Reviews, Vol. 1 No. 6, pp. 165-9.
Davenport, T.H., Prusak, L., 1998‖, “Working Knowledge: How Organizations
Manage What They Know”, Harvard Business School Press
Espey, J. and Batchelor, P. (1987), “Management by degrees: a case study in
management development”, Journal of Management Development, Vol. 6 No. 5, pp.
61-8.
Eztioni, A. (1961). A Comparative Analysis of Complex Organizations. New York.
Free Press.
Field, R. H. G. (1979). A critique of the Vroom-Yetton Contingency Model of
Leadership Behaviour. Academy of Management Review, Vol-4, Pg.249-257.
Fein, E., Tziner, A. and Vasiliu, C. 2010. ―Age Cohort Effects, Gender, and
Romanian Leadership Preferences‖, Journal of Management Development, vol. 29,
no. 4, pp. 364-376.
Fiedler, F.E. (1976). A Theory of Leadership Effectiveness. Publisher: McGraw-Hill,
New York.
Fiedler, F. E., & House, R.J. (1988).Leadership theory and research: A report of
progress. In C.L Cooper & I.T. Robertson (Eds.). International Review of Industrial
and Organizational Psychology. Chichester, New York: John Wiley & Sons.
Fleishman, E. A. (1957). The Leadership Opinion Questionnaire. In R.M. Stogdill &
A.E. Coons (Eds.), Leader Behaviour and its description and measurement
(Columbus: Bureau of Business Research, Ohio State University, 1957).
Fiekers, T., Dale, B.G., Littler, D.A. and Vob, W. (2000), “Benchmarking the
postgraduate admission process”, Quality Management Journal, Vol. 7 No. 4, pp. 45-
57.
296
Garcia-Moroles, V. J, Matias-Reche, F. and Hurtado-Torres, N. 2008. ―Influence of
Transformational Leadership Innovation and Performance Depending on the Level of
Organizational Learning in the Pharmaceutical Sector‖, Journal of Organizational
Change Management, vol.21, no.3, pp. 188-212.
Gregersen, H. B. (1993). Multiple commitments at work and extra role behaviour
during three stages of organizational tenure. Journal of Business Research, Vol-26,
Pg.31-47.
Griffin, R.W. (1990).Management. Boston: Houghton Mifflin Company.
Glakas, N.J. (2003), Trends Policies and Issues, National Council of Higher
Education Loan Programmes, Sarasota. Florida, 9 January.
Gupta, A. (2007), ―Introduction‖, in Gupta, A., Levy, D.C. and Powar, K.B. (Eds),
Private Higher Education: Emerging Global Trends, Shipra Publications, New Delhi.
Government of India, Planning Commission (2006), Towards Faster and More
Inclusive Growth: An Approach to 11th Five Year Plan (2007-2012).
Government of India Planning Commission, New Delhi, available at:
http://planningcommission.nic.in/plans/planrel/ app11_16jan.pdf (accessed June 26,
2008).
Gill, J.I. et al. (1992). Bringing Into Focus the Factors Affecting Faculty Supply and
Demand.
Government of India (2001), Approach Paper to the Tenth Five-year Plan: 2002-
2007, Planning Commission, New Delhi.
Government of India (2002-2007), Tenth Five-year Plan: 2002-2007, Planning
Commission, New Delhi.
Hartog, Dd. N., Muijen, J. J., & Koopman, P.L. (1997).Journal of Occupational &
Organizational Psychology, Vol – 70, Pg.19-35.

297
Hill, W. (1973). Leadership Style: Rigid or Flexible. Journal of Organizational
Behaviour and Human Performance, Pg.35-47.
House, R. J. (1971). A Path-Goal Theory of Leader-Effectiveness. Journal of
Administrative Science Quarterly, Vol-16, Pg.321-338.
Hunt, J.G. (1991).Leadership: A new synthesis. Newbury Park, CA: Sage
Publications, Inc.
Hollander, E.B., & Julian, J.W. (1969).Contemporary trends in the analysis of
leadership processes. Psychological Bulletin, Pg.387-397.
Harris, R.W. (1994), “Alien or ally? TQM, academic quality and the new public
management”, Quality Assurance in Education, Vol. 2 No. 3, pp. 33-9.
Harrigan, M.N. (1999). An Analysis of Faculty Turnover at the University of
Wisconsin-Madison. Presented at the 39th Annual AIR Forum. Seattle, WA. May 30-
June 2, 1999. June 2-5, 20024.
Ivancevich, J.M., Szilagyi, Jr., A.D., & Wallace, Jr., M.J. (1977).Organizational
Behaviour and Performance. Goodyear Publishing Company, Inc.
Iverson, R.D. & Buttigieg, D.M. (1999). Affective, Normative and Continuance
Commitment: can the ―right kind‖ of commitment be managed? Journal of
Management Studies, Vol 36(3), Pg.307-350.
J.E.Bbono ad T.A.Judge (2004),‘ Personality and Transformational and Transactional
Leadership: A Meta-Analysis,‖ Journal of Applied Psychology, Vol89, Pg 901-911.
Jandaghi, Gh, Matin, H.Z., and Farjame, A. 2009. ―Comparing Transformational
Leadership in Successful and Unsuccessful Companies‖, International Journal of
Social Sciences, vol. 4, no. 3, pp. 211-216.
298
Jaros, S.J., Jermier, J.M., Koehler, J.W. & Sincich, T. (1993). Effects of Continuance,
Affective, and Moral Commitment on the withdraw process: An Evaluation. Academy
of Management Journal, Vol 36(5), 951-995.
Johnston, M.W., Parasuraman, A., Futrell, C.M.,& Black,W.C.(1990).A longitudinal
assessment of the impact of selected organizational influences on salespeople‘s
organizational commitment during early employment. Journal of Marketing
Research.Vol-27, Pg.333-344.
Judge and R. Piccolo (2004),‖Transformational and Transactional Leadership: A
Meta-Analytic Test of Their Relative Validity,‖ Journal of Applied Psychology, Vol
89, Pg.755.
Jasimuddin, S.M., 2005, ―An Integration of Knowledge Transfer and Knowledge
Storage: A Holistic approach”, GESTS International Transactions of Computer
Science and Engineering, Vol. 18, No.1 pp.37-48.
Johnsrud, L.K., & Heck, R.H. (1998).Faculty Worklife: Establishing Benchmarks
across Groups. Research in Higher Education, 39.5, 539-555.
Joshi, M.M. (1998), “Higher education in India: vision and action”, paper presented
at the UNESCO World Conference on Higher Education in the 21st Century, Paris, 5-
9 October.
Kanter, R.M. (1968). Commitment and Social Organization: A study of Commitment
Mechanisms in Utopian Communities. Journal of American Sociological View, Vol-
33, Pg.449-517.
Kelman, H.C. (1958). Compliance, Identification, and Internalization: Three Process
of Attitude Change. Journal of Conflict Resolution.Vol-2, Pg.51-60.

299
Kidwell, J., J., Vander Linde, K.M., Johnson, S.L., 2000, “Applying Corporate
Knowledge Management Practices in Higher Education”, Educause Quarterly, pp.
28-33.
Koh, W. L., Steers, R. M. and Terborg, J. R. 1995. ―The Effects of Transformational
Leadership on Teacher Attitudes and Student Performance in Singapore‖, Journal of
Organizational Behaviour, no. 16, pp. 319-333.
Kolb, D.A., Rubin, I. M., & Mclntyre, J. M. (1971).Organizational Psychology: An
Experiential Approach. Englewood Cliffs, NJ: Prentice-Hall, Inc.
Kushman, J. W. (1992). The organizational dynamics of teacher workplace
commitment: A study of urban elementary and middle schools. Educational
Administration Quarterly, Vol-28, Pg.5-42.
Kulandai Swamy, V.C. (2003). Higher Education’s Management. New Delhi: Viva
Books.
Kanji, G.K., Tambi, A.M.A. and Wallace, W. (1999), “A comparative study of quality
practice in higher education institutions in the US and Malaysia”, Total Quality
Management, Vol. 10, No. 3, pp. 357-71.
Kidwell, J., J., Vander Linde, K.M., Johnson, S.L., 2000, “Applying Corporate
Knowledge Management Practices in Higher Education”, Educause Quarterly, pp.
28-33.
Korhonen, P. and Syrjanen, M. (2004), ―Resource allocation based on efficiency
analysis”, Management Science, Vol. 50 No. 8, pp. 1134-44.
Landy, F.J. (1985).Psychology of Work Behaviour. Homewood, IL: The Dorsey
Press.
Loscocco, K. A. (1990). Reactions to blue-collar work: A comparison of women and
men. Journal of Work and Occupations, Vol-17, Pg.152-177.
300
Liou, K. T. (1995, Apr.) Professional Orientation and Organizational Commitment
among Public Employees: An Empirical Study of Detention Workers. Journal of
Public Administration Research and Theory, Vol-5(2), Pg.231-247.
Laugharne, M. (2002), “Benchmarking academic standards”, Quality Assurance in
Education, Vol. 10 No. 3, pp. 134-8.
Lynn, S. (2002). The winding pathy: understanding the career cycle of teachers. The
clearing house, 75, 179-182.
Mathi, Ravi J. (1977). “Problems of Academic Administration Institution- building: A
Layman’s experience” New Delhi: All India Management Association, PP. 89-104.
McGregor, D (1960), Human Side of Enterprise, McGraw Hill, New York.
Mamta Bhusry1
, Jayanti Ranjan2
.
Knowledge Collaboration in Higher Educational
Institutions in India: Charting a Knowledge Management Solution -
IJCSI 2011
International Journal of Computer Science Issues, Vol. 8, Issue 5, No 3, September
ISSN (Online): 1694-0814.
Mowday, R., Porter, L., & Steers, R. (1982).Employee-Organization Linkages: The
Psychology of Commitment, Absenteeism, and Turnover. New York, NY: Academic
Press.
Boulder, CO: Western Interstate Commission for Higher Education.
Nagad, W., Amin, G., 2006, ―Higher Education in Sudan and Knowledge
Management Applications”, IEEE 0-7803-9521-2/06, pp. 60-65.
Owlia, M.S. and Aspinwall, E.M. (1996a), ―Quality in higher education: a survey”,
Total Quality Management, Vol. 7 No. 2, April, pp. 161-72.
Robbins, S.P. (1994).Essentials of Organizational Behaviour (4th
Ed.).Englewood
Cliffs, NJ: Prentice Hall.
301
Reitz, H.J. (1981).Behaviour in Organizations (Rev.ed). Homewood, IL: Richard
D.Irwin, Inc.
Trice, H.M., & Beyer, J.M. (1993).The Cultures of Work Organizations. Englewood
Cliffs: Prentice Hall.
Meyer, J. & Allen. N.J, (1991). A Three Component Conceptualization of
Organizational Commitment. Journal of Human Resource Management Review, Vol.
I, Pg.61-89.
Meyer, J.P. & Herscovitch, L. (2001). Commitment in the Workplace: Toward a
general model. Human Resource Management Review, Vol-11, Pg.299-326.
Meyer, R.C. & Schoorman, F.D. (1992).Predicting Participation and Production
Outcomes through a Two-Dimensional Model of Organizational Commitment.
Academy of Management Journal. Vol-35(3), Pg.671-684.
Mowday, R., Porter, L.W., & Steers, R.M. (1982). Employee-Organization Linkages:
The Psychology of Commitment, Absenteeism, and Turnover. Publisher: Academic
Press, New York.
Moorman, C., Zaltman, G., Deshpade, R., (1993). Relationship between Providers and
Users of Market Research: The Dynamics of Trust within and between Organizations.
Journal of Marketing Research, Vol29 (3), Pg.314-328.
Morrow, P. (1983). Concept Redundancy in Organizational Research: The Case of
Work Commitment. Academy of Management Review, Vol-8, Pg.486-500.
Nagad, W., Amin, G., 2006, ―Higher Education in Sudan and Knowledge
Management Applications”, IEEE 0-7803-9521-2/06, pp. 60-65.
302
Nijhof, W. J., De Jong, M.J., & Beukhof, G (1998).Employee Commitment in
Changing Organizations: an Exploration. Journal of European Industrial Training.
Vol-22 (6), Pg.243-248.
O‘Reilly, C., & Chatman, J. (1986). Organizational Commitment and Psychological
Attachment: The effects of Compliance, Identification, and Internalization on Pro-
social Behaviour. Journal of Applied Psychology, Vol-71, Pg.492-499.
Ozaralli, N. 2003. ―Effects of Transformational Leadership on Empowerment and
Team Effectiveness‖, Leadership & Organization Development Journal, vol. 24, no.
6, pp. 335-344.
Porter, L. W., Steers, R. M., Mowday, R. T., & Boulain, P. V. (1974). Organizational
commitment, job satisfaction, and turnover among psychiatric technicians. Journal of
Applied Psychology, Vol-59, Pg.603-609.
Patrinos, H.A. (2002), “The role of the private sector in the global market for
education”, paper presented at a conference on “Shifting roles, changing rules: the
global higher education market”, The Hague, 19 March.
Panda, S. (2003). Planning & Management in distance educations, London: Kogan
Page.
Pareek, Udai (1981). Beyond Management: Essays on the process of institution
building. New Delhi: Oxford & IDH.
Powar, K. B. (2001), Management Universitues, AIV Decasional Paper. 2002/1 New
Delhi, AIV. Planning and Management in Higher Education. Study material for the
course of PGDHE. IGNOU, New Delhi.
Parasuraman, A., Zeithaml, V.A. and Berry, L.L. (1985), ―A conceptual model of
service quality and its implications for future research”, Journal of Marketing, Vol.
49 No. 4, pp. 41.
303
Prem Chand and Jagdish Arora, Access to scholarly communication in higher
education in India, Trends in usage statistics via INFLIBNET, Information and
Library Network (INFLIBNET) Consortium, Ahmedabad, India, Program: electronic
library and information systems Vol. 42 No. 4, 2008 pp. 382-390.
Rai, S. & Sinha, A.K. (2000). Transformational Leadership, Organizational
Commitment, and Facilitating Climate. Journal of Psychological Studies, vol. 45, pg.
33-42.
Ranjan, J., Khalil, S., 2007, “Application of Knowledge Management in Management
Education: A Conceptual Framework”, Journal of Theoretical and Applied
Information Technology, pp. 15-25.
Robbins, S.P. (1994). Essentials of Organizational Behaviour (4th
.Ed). Publisher:
Prentice Hall, Englewood Cliffs.
Roma Mitra Debnath ,Assessing performance of management institutions An
application of data envelopment analysis IGSM, Greater Noida, Uttar Pradesh, India,
Ravi Shankar School of Management,( Asian Institute of Technology, Pathumthani,
Thailand) Publisher: Emerald Group Publishing Limited. The TQM Journal, Vol. 21
No. 1, 2009, pp. 20-33.
Rachit Gupta*; Hemant Chauhan**; Palki Setia***. Faculty Retention: A Challenge
for Business Schools. International Journal of Multidisciplinary Research Vol.1 Issue
8, December 2011, ISSN: 2231 5780.
Suliman, A.M.Isles, P.A. (2000a).Is Continuance Commitment Beneficial to
Organizations? Commitment-Performance Relationship: A New Look. Journal of
Managerial Psychology, Vol-15(5), 407-426.

304
Suliman, A.M.Isles, P.A. (2000b). The Multi-Dimensional Nature of Organizational
Commitment in a non-western-context. Journal of Management Development. Vol-
19(1), Pg.71-82.
Schermerhorn, Jr., J.R., Hunt, J.G., Osborn, R.N. (1982).Managing Organizational
Behaviour. New York: John Wiley & Sons.
Schermerhorn, J.R., Jr. 2008, Management, Danvers, John Wiley & Sons, Inc., MA.
Scholl, R.W. (1981). Differentiating Commitment from Expectancy as a Motivational
Force. Academy of Management Review.Vol-6, Pg.589-599.
Shin, H., & Reyes, P. (1991a). Assessing personal and organizational predictors of
managerial commitment in schools (Report No. EA 023 517) Chicago, IL:
Midwestern Educational Research89 Association (ERIC Document Reproduction
Service No. 339 128).
Shoemaker, D. J., Snizek, W. E., & Bryant, C. D. (1977). Toward a further
clarification of Becker’s side-bet hypothesis as applied to organizational and
occupational commitment. Journal of Social Forces, Vol- 56, Pg.598-603.
Smith, H.C. (1964).Psychology of Industrial Behaviour (2nd
Ed.).New York:
McGraw-Hill Book Company.
Steers, R.M. (1975). Antecedents and Outcome of Organizational Commitment.
Journal of Administrative Science Quarterly, Vol. 22, pg .46-56.
Steers, R. M. (1981). Introduction to Organizational Behaviour. Santa Monica:
Goodyear Publishing Company, Inc.
S.L., Shivers-Blackwell, ―Using Role Theory to Examine Determinants of
Transformational and Transactional Leader Behaviour,‖ Journal of Leadership &
Organizational Studies, 2004, Vol 10, Pg 41-51.

305
Stogdill, R.M. (1948).Personal factors associated with leadership: A survey of the
literature. The Journal of Psychology, Vol-25, Pg.35-71.
Schon, D.A. (1986).Leadership as refection-in-action in leadership and organizational
culture: New perspectives on administrative theory and practice.T.J.Sergiovanni &
J.E.Corbally (Eds). Urbana: University of Illinois Press.
Spotts, J.V. (1964).The problem of leadership: A look at some recent findings of
behavioural science research. In W.B.Eddy, W.W.Bruke, Drupe, V.A., & O.P.South
(Eds), Behavioural Science and the manager‘s role (1969).NTL Institute for Applied
Behavioural Science.
Siegel, L., & Lane, I.M. (1982).Personal and Organizational Psychology Homewood,
IL: Richard D.Irwin, Inc.
Sutermeister, R.A. (1969). People and Productivity. New York: McGraw-Hill Book
Company.
Singh, Amrik & G. D. Sharma (eds.) (1981), Higher Education in India: The
institutional context, New Delhi: Konark Publishers Pvt. Ltd.
Sahney, S. (2002), “Total quality management in higher education in India – a
diagnostic study of select engineering and management institutions”, unpublished
paper, Department of Management Studies, IIT.
Sahney, S., Banwet, D.K. and Karunes, S. (2003), ―Enhancing quality in education:
application of quality function deployment – an industry perspective”, Work Study,
Vol. 52 No. 6, pp. 197-209.
Sallis, E. (1993), TQM in Education, Kogan Page, London.
Sedziuviene, N., Vveinhardt, J., 2009. “The Paradigm of Knowledge Management in
Higher Educational Institutions”, Inzinerine Ekonomika-Engineering Economics (5),
pp. 79-90.
306
Shammari, M.A. and Salimi, A. (1998), “Modeling the operating efficiency of banks:
a nonparametric methodology”, Logistic Information Management, Vol. 11 No. 1,
pp. 5-17.
Seiford, L.H. (1996), “Data envelopment analysis: the evolution of the state-of-the-
art (1978-1995)”, Journal of Productivity Annals, Vol. 7, pp. 99-137.
Stockard, J., & Lehman, M. B. (2004). Influences on the satisfaction and retention of
1st-year teachers: The importance of effective school management. Education
Administration Quarterly, 40, 742-771.
Stewart, F. (1996), “Globalisation and Education”, International Journal of
Educational Development, Vol.16, No.2, pp. 327-33.
Lassey, W.R. (1976).Dimensions of leadership. In W.R.Lassey & R.R.La Jolla (Eds.),
Leadership and social change. Fernandez, CA: University Associates, Inc.
Taylor, R.L., & Rosenbach, W.E. (1989).Leadership: Challenges for today‘s manager.
New York: Nichols Publishing. Orange, NJ: Leadership Library of America.
T.Judge and R.Piccolo (2004), ―Transformational and Transactional Leadership: A
Meta-Analytic Test of Their Relative Validity,‖ Journal of Applied Psychology, Vol
89, Pg.755.
Tiwana, A., 2000, The Knowledge Management Toolkit: Practical Techniques for
Building a Knowledge Management System, Prentice Hall, New Jersey.
Tilak, J.B.G. (1997), "Lessons from Cost Recovery in Education," in: Marketising
Education and Health in Developing Countries: Miracle or Mirage? (ed.: C.
Colclough). Oxford: Clarendon Press, pp. 63-89.
UGC (1993), UGC Funding of Institutions of Higher Education, Report of Justice
Dr.K.Punnayya Committee, 1992-92, University Grants Commission, New Delhi.
307
UGC (1997), Report of the Pylee Committee on the Recommendations of the
Punnayya Committee Relating to Unit Cost of Higher Education and Other Issues,
University Grants Commission, New Delhi.
UNESCO: India, updated August 2003 and Annual Report 2004/5, Ministry of
Human Resource Development, India (overview). - Newsletter, October-December
2005, International Institute for Educational Planning.
UNESCO. Learning without Burden, NCERT, 1993, reprinted 2004. - Annual report
2004/5, Ministry of Human Resource Development, India (annexes).
Vroom, V. H., & Yetton, P. (1973). Leadership and Decision Making. Pittsburgh:
University of Pittsburgh Press.
Voke, H. (2002). Understanding the teacher shortage. ASCD Info Brief, 29, 1-17.
West-Burnham, J. (1992), Managing Quality in Schools – A TQM Approach,
Longman Group, London.
Wan Endut, W., Abdullah, M. and Husain, N. (2000), “Benchmarking institutions of
higher education”, Total Quality Management, Vol. 11 Nos 4-6, pp. 796-9.
Ward, E.A., & Davis, E. (1995, summer).The Effect of Benefit Satisfaction on
Organizational Commitment. Journal of Compensation and Benefits Management,
Pg.35-40.
Walton, R.E. (1985). From Control to Commitment in the Workplace. Publisher:
Harvard Business Review, Vol.63, pg.77-84.
Wang, and Huang, T. 2009. ―The Relationship of transformational Leadership with
Group Cohesiveness and Emotional Intelligence‖. Journal of Social Behaviour and
Personality, vol.37, no.3, pp. 379-392.
308
Weber, M. (1947). The Theory of Social Economic Organization. Talcott Parsons
(Ed.). New York: The Free Press.
Williams, J. C. (1978).Human Behaviour in Organizations. Cincinnati, OH: South-
Western Publishing Co.
Weiner, Y. (1982). Commitment in Organizations: A Normative View. Academy of
Management Review.Vol-7, Pg. 418-428.
Yammarino, F.J., & Bass, B.M. (1990).Long-term forecasting of transformational
leadership and its effects among naval officers: Some preliminary findings. In
K.E.Clark & M.B. Clark (Eds.), Measure of Leadership.
Yeh, C.M.Y., 2005, “The Implementation of Knowledge Management System, vol.9,
pp. 35-41.
Zangaro, G.A. (2001).Organizational Commitment: A Concept Analysis, Nursing
Forum, Vol- 36(2), Pg.14-23.

309
ANNEXURE-I
QUESTIONNAIRES
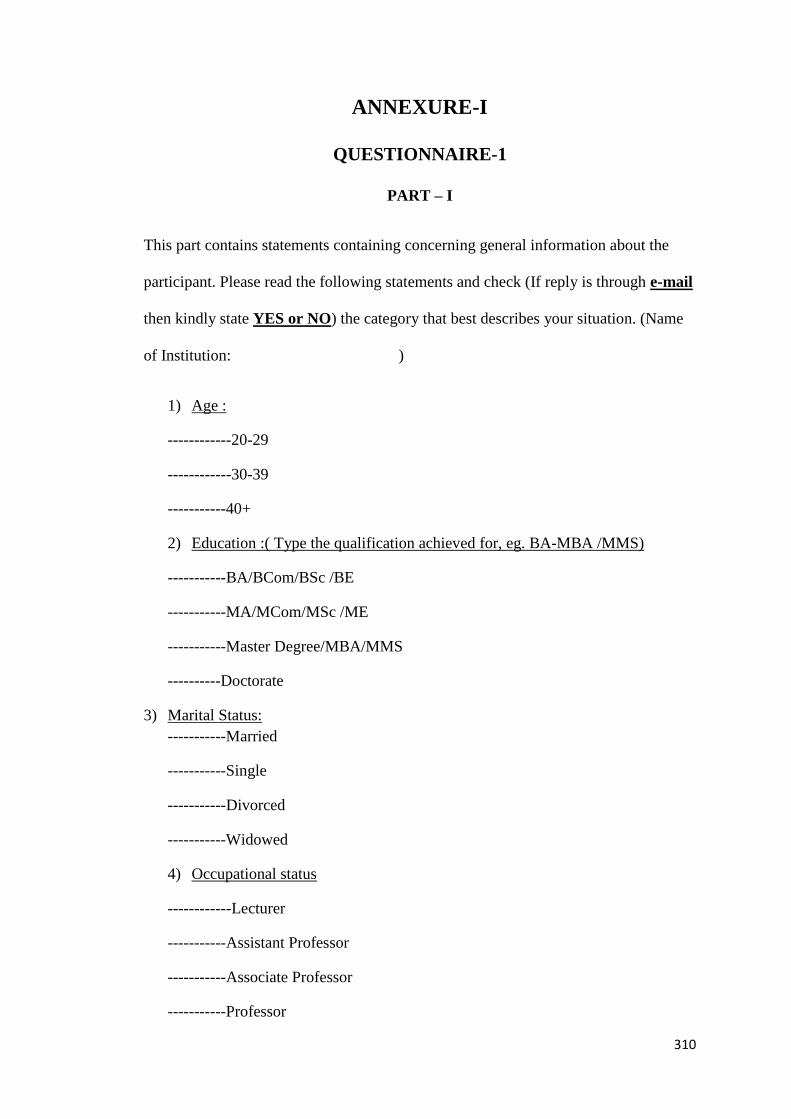
310
ANNEXURE-I
QUESTIONNAIRE-1
PART – I
This part contains statements containing concerning general information about the
participant. Please read the following statements and check (If reply is through e-mail
then kindly state YES or NO) the category that best describes your situation. (Name
of Institution: )
1) Age :
------------20-29
------------30-39
-----------40+
2) Education :( Type the qualification achieved for, eg. BA-MBA /MMS)
-----------BA/BCom/BSc /BE
-----------MA/MCom/MSc /ME
-----------Master Degree/MBA/MMS
----------Doctorate
3) Marital Status:
-----------Married
-----------Single
-----------Divorced
-----------Widowed
4) Occupational status
------------Lecturer
-----------Assistant Professor
-----------Associate Professor
-----------Professor
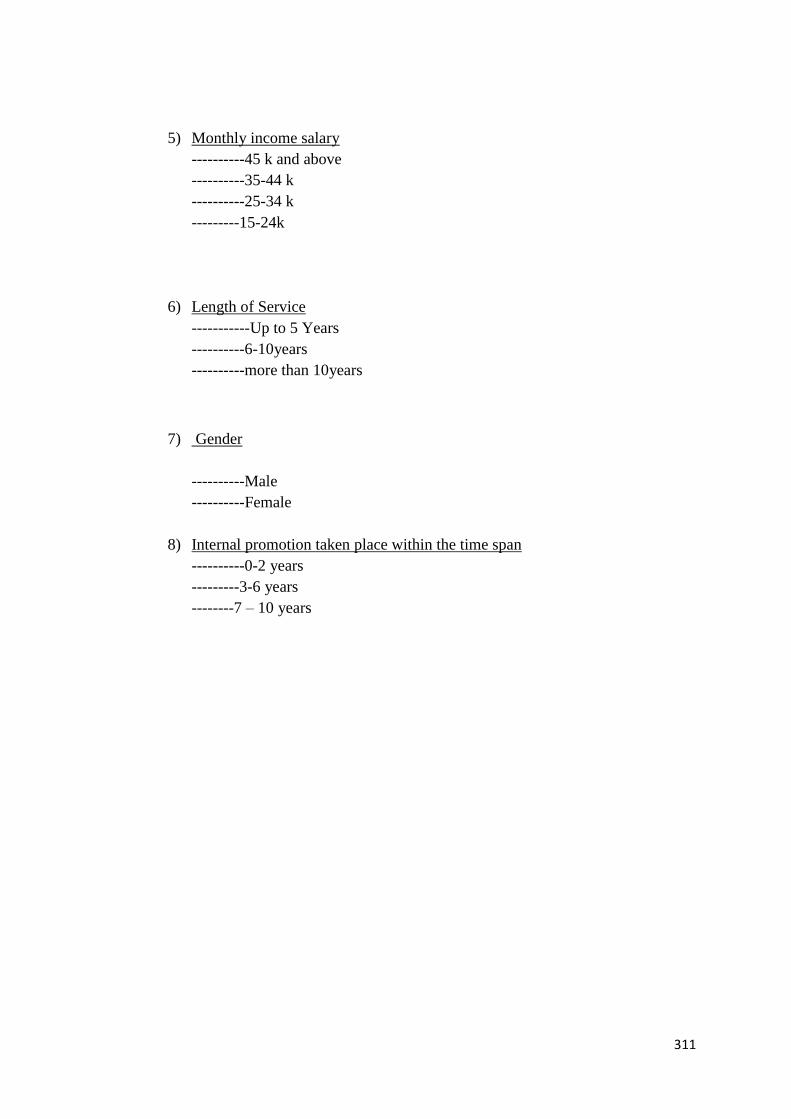
311
5) Monthly income salary
----------45 k and above
----------35-44 k
----------25-34 k
---------15-24k
6) Length of Service
-----------Up to 5 Years
----------6-10years
----------more than 10years
7) Gender
----------Male
----------Female
8) Internal promotion taken place within the time span
----------0-2 years
---------3-6 years
--------7 – 10 years

312
QUESTIONNAIRE-2
PART – II
Employee Commitment Questionnaire
Employee Commitment Survey-OCQ
You are being asked to participate in a survey to provide the state of Maharashtra with
information that will help to improve the working environment for employees.
Participation in this survey is voluntary and confidentially is assured. No individual
data will be reported.
The following statements concern how you feel about the department where you
work. Please indicate the extent of your agreement or disagreement with each
statement by circling a number from 1 to 7.If answering by way of e-mail then
kindly RATE your answer by choosing from 1-7 ,any number as per your rating,
for e.g., „3‟ under the column Rate. Please do not put your name on this
questionnaire.
1 2 3 4 5 6 7
strongly
disagree
Disagree somewhat
disagree
Neutral Somewhat
agree
Agree Strongly
agree
Employee Commitment Questionnaire 1 2 3 4 5 6 7
RATE
1 I am willing to put a great deal of effort beyond
that normally expected in order to help this
organization be successful
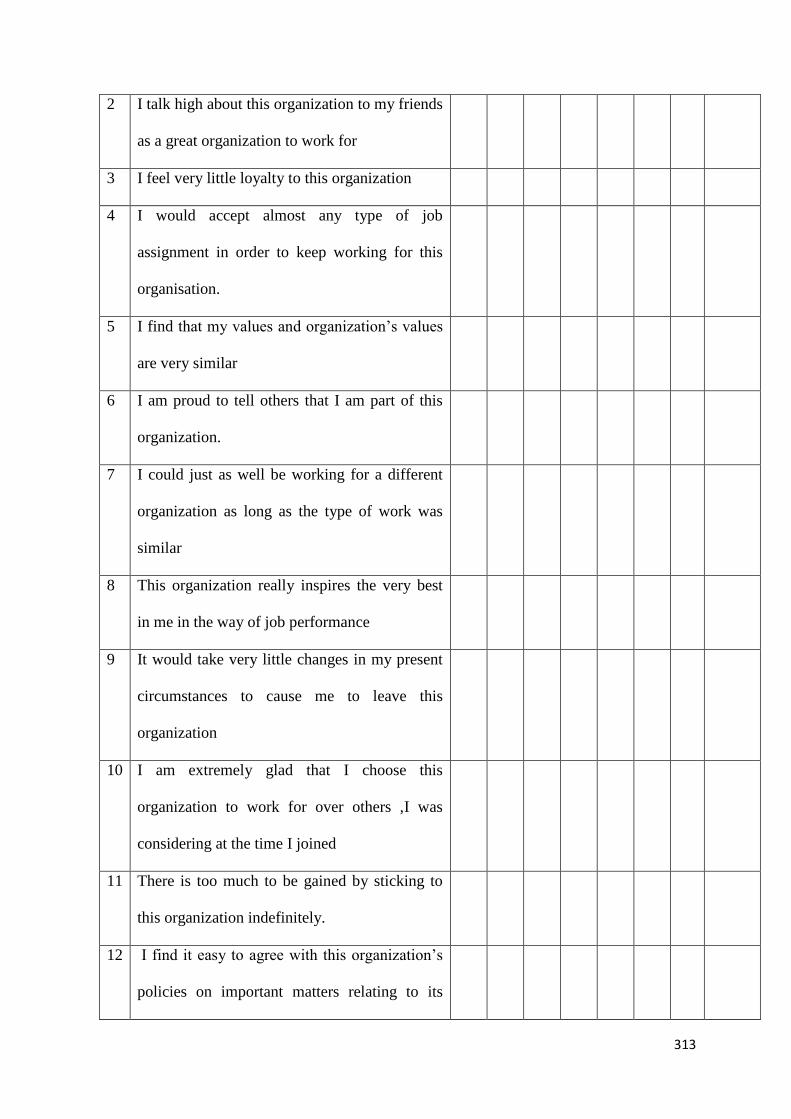
313
2 I talk high about this organization to my friends
as a great organization to work for
3 I feel very little loyalty to this organization
4 I would accept almost any type of job
assignment in order to keep working for this
organisation.
5 I find that my values and organization‘s values
are very similar
6 I am proud to tell others that I am part of this
organization.
7 I could just as well be working for a different
organization as long as the type of work was
similar
8 This organization really inspires the very best
in me in the way of job performance
9 It would take very little changes in my present
circumstances to cause me to leave this
organization
10 I am extremely glad that I choose this
organization to work for over others ,I was
considering at the time I joined
11 There is too much to be gained by sticking to
this organization indefinitely.
12 I find it easy to agree with this organization‘s
policies on important matters relating to its
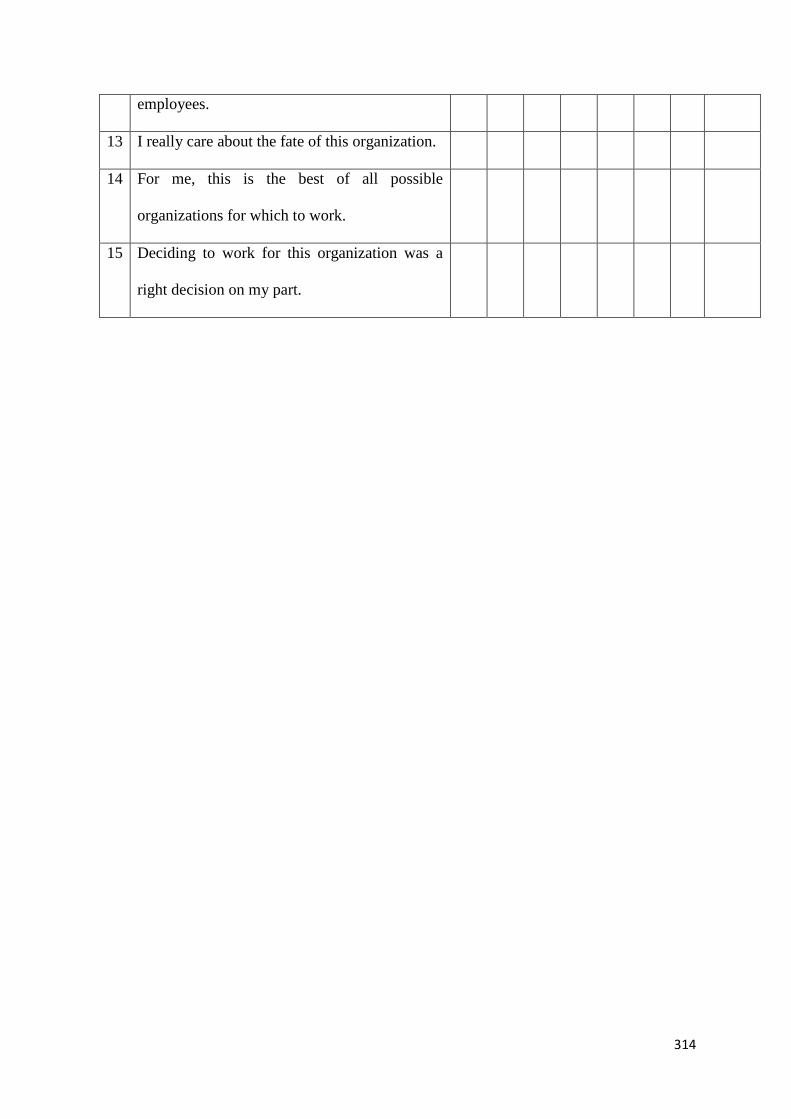
314
employees.
13 I really care about the fate of this organization.
14 For me, this is the best of all possible
organizations for which to work.
15 Deciding to work for this organization was a
right decision on my part.

315
QUESTIONNAIRE-3
PART – III
Head of the Department/Director: M / F - ------------- (Please circle the
appropriate response, if by way of e-mail then kindly state M/F in the blank
space provided)
This questionnaire is to describe the leadership style of your Head of the Department
(or the person you report to), as you perceive/observe it. Please answer all items on
this sheet. If an item is irrelevant, or if you are unsure or do not know the answer,
leave the answer blank. Please answer this question anonymously.
Thirty descriptive statements are listed on the following pages. Judge how frequently
each statement fits the person you are describing. Use the following rating scale by
circling your desired option for rating. If answering by way of e-mail, then kindly
rate your answer by stating the number you prefer to rate your immediate
leader to whom you report, for e.g., „4‟ under your rating column and state
his/her designation in the blank space provided in the table given below.
Not at all Once in a
while
Sometimes Fairly often Frequently,
if not always
0 1 2 3 4
Leadership style preferred by you:
Your designation : YOUR
RATING
1 Instil pride in me for being associated with 0 1 2 3 4
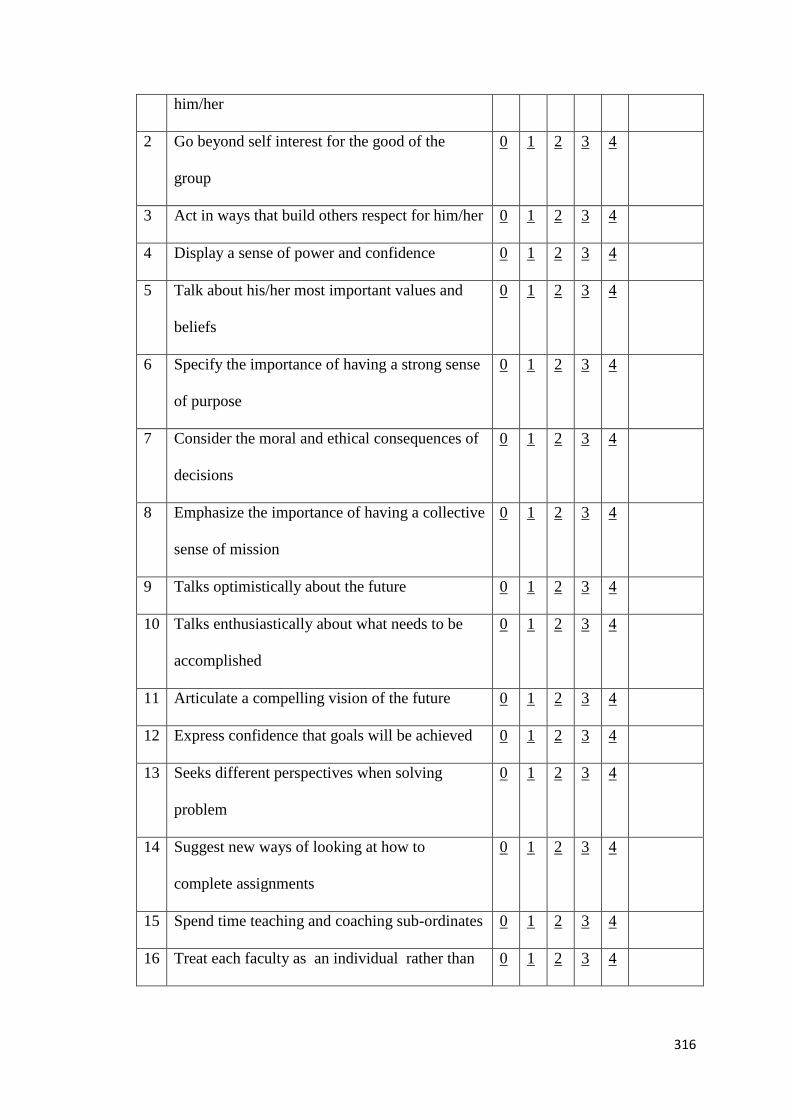
316
him/her
2 Go beyond self interest for the good of the
group
0 1 2 3 4
3 Act in ways that build others respect for him/her 0 1 2 3 4
4 Display a sense of power and confidence 0 1 2 3 4
5 Talk about his/her most important values and
beliefs
0 1 2 3 4
6 Specify the importance of having a strong sense
of purpose
0 1 2 3 4
7 Consider the moral and ethical consequences of
decisions
0 1 2 3 4
8 Emphasize the importance of having a collective
sense of mission
0 1 2 3 4
9 Talks optimistically about the future 0 1 2 3 4
10 Talks enthusiastically about what needs to be
accomplished
0 1 2 3 4
11 Articulate a compelling vision of the future 0 1 2 3 4
12 Express confidence that goals will be achieved 0 1 2 3 4
13 Seeks different perspectives when solving
problem
0 1 2 3 4
14 Suggest new ways of looking at how to
complete assignments
0 1 2 3 4
15 Spend time teaching and coaching sub-ordinates 0 1 2 3 4
16 Treat each faculty as an individual rather than 0 1 2 3 4
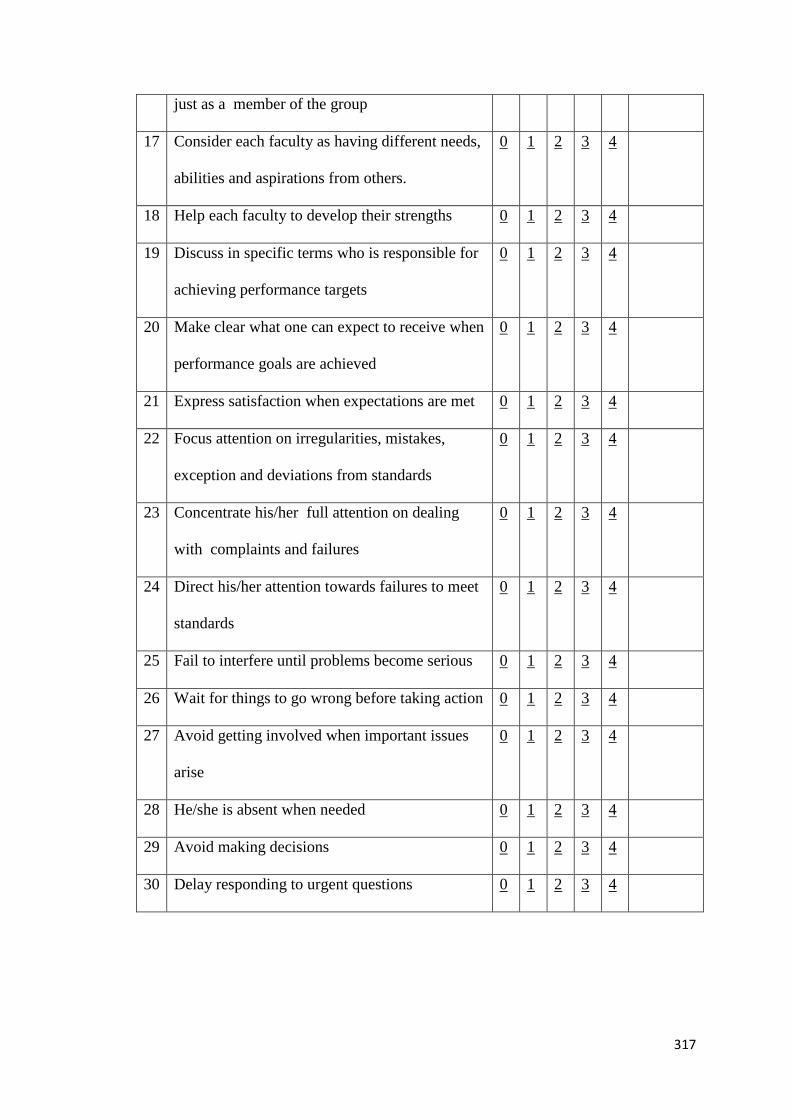
317
just as a member of the group
17 Consider each faculty as having different needs,
abilities and aspirations from others.
0 1 2 3 4
18 Help each faculty to develop their strengths 0 1 2 3 4
19 Discuss in specific terms who is responsible for
achieving performance targets
0 1 2 3 4
20 Make clear what one can expect to receive when
performance goals are achieved
0 1 2 3 4
21 Express satisfaction when expectations are met 0 1 2 3 4
22 Focus attention on irregularities, mistakes,
exception and deviations from standards
0 1 2 3 4
23 Concentrate his/her full attention on dealing
with complaints and failures
0 1 2 3 4
24 Direct his/her attention towards failures to meet
standards
0 1 2 3 4
25 Fail to interfere until problems become serious 0 1 2 3 4
26 Wait for things to go wrong before taking action 0 1 2 3 4
27 Avoid getting involved when important issues
arise
0 1 2 3 4
28 He/she is absent when needed 0 1 2 3 4
29 Avoid making decisions 0 1 2 3 4
30 Delay responding to urgent questions 0 1 2 3 4
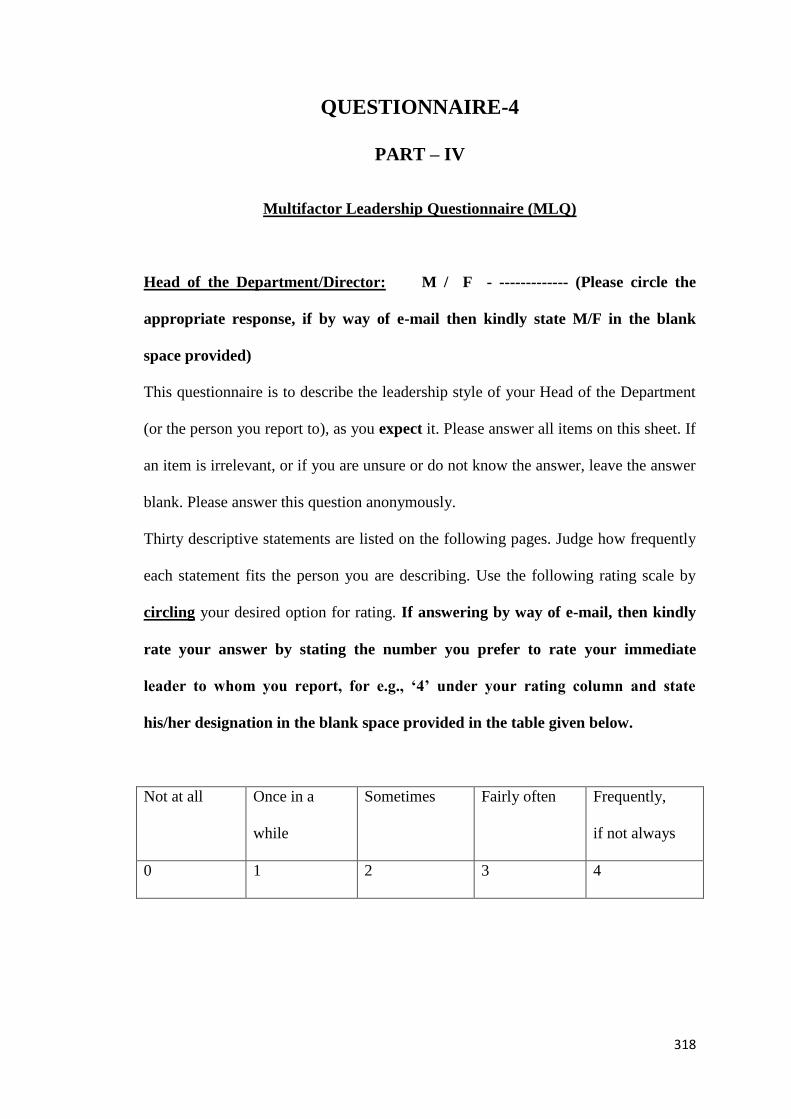
318
QUESTIONNAIRE-4
PART – IV
Multifactor Leadership Questionnaire (MLQ)
Head of the Department/Director: M / F - ------------- (Please circle the
appropriate response, if by way of e-mail then kindly state M/F in the blank
space provided)
This questionnaire is to describe the leadership style of your Head of the Department
(or the person you report to), as you expect it. Please answer all items on this sheet. If
an item is irrelevant, or if you are unsure or do not know the answer, leave the answer
blank. Please answer this question anonymously.
Thirty descriptive statements are listed on the following pages. Judge how frequently
each statement fits the person you are describing. Use the following rating scale by
circling your desired option for rating. If answering by way of e-mail, then kindly
rate your answer by stating the number you prefer to rate your immediate
leader to whom you report, for e.g., „4‟ under your rating column and state
his/her designation in the blank space provided in the table given below.
Not at all Once in a
while
Sometimes Fairly often Frequently,
if not always
0 1 2 3 4

319
Leadership style followed by my immediate supervisor
Designation of the person you report to --- YOUR
RATING
1 Instil pride in me for being associated with
him/her
0 1 2 3 4
2 Go beyond self interest for the good of the
group
0 1 2 3 4
3 Act in ways that build others respect for him/her 0 1 2 3 4
4 Display a sense of power and confidence 0 1 2 3 4
5 Talk about his/her most important values and
beliefs
0 1 2 3 4
6 Specify the importance of having a strong sense
of purpose
0 1 2 3 4
7 Consider the moral and ethical consequences of
decisions
0 1 2 3 4
8 Emphasize the importance of having a collective
sense of mission
0 1 2 3 4
9 Talks optimistically about the future 0 1 2 3 4
10 Talks enthusiastically about what needs to be
accomplished
0 1 2 3 4
11 Articulate a compelling vision of the future 0 1 2 3 4
12 Express confidence that goals will be achieved 0 1 2 3 4
13 Seeks different perspectives when solving
problem
0 1 2 3 4
14 Suggest new ways of looking at how to
complete assignments
0 1 2 3 4
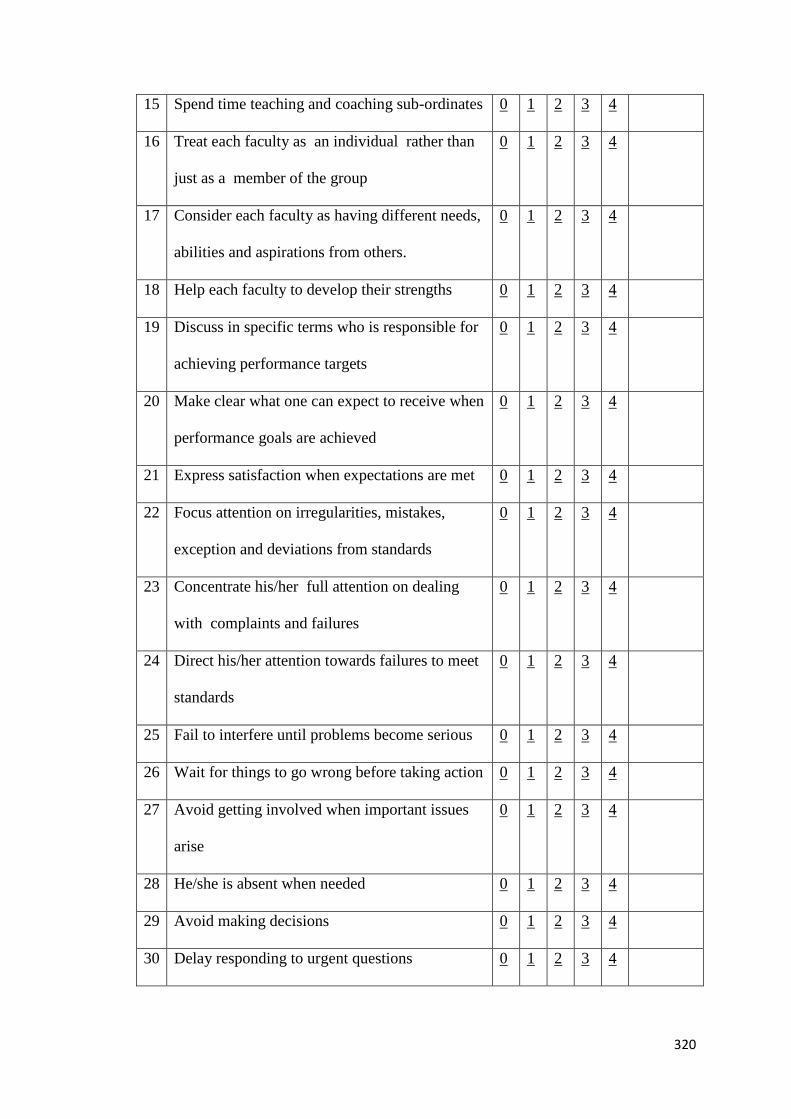
320
15 Spend time teaching and coaching sub-ordinates 0 1 2 3 4
16 Treat each faculty as an individual rather than
just as a member of the group
0 1 2 3 4
17 Consider each faculty as having different needs,
abilities and aspirations from others.
0 1 2 3 4
18 Help each faculty to develop their strengths 0 1 2 3 4
19 Discuss in specific terms who is responsible for
achieving performance targets
0 1 2 3 4
20 Make clear what one can expect to receive when
performance goals are achieved
0 1 2 3 4
21 Express satisfaction when expectations are met 0 1 2 3 4
22 Focus attention on irregularities, mistakes,
exception and deviations from standards
0 1 2 3 4
23 Concentrate his/her full attention on dealing
with complaints and failures
0 1 2 3 4
24 Direct his/her attention towards failures to meet
standards
0 1 2 3 4
25 Fail to interfere until problems become serious 0 1 2 3 4
26 Wait for things to go wrong before taking action 0 1 2 3 4
27 Avoid getting involved when important issues
arise
0 1 2 3 4
28 He/she is absent when needed 0 1 2 3 4
29 Avoid making decisions 0 1 2 3 4
30 Delay responding to urgent questions 0 1 2 3 4
321
ANNEXURE-II
Tables and Graphs
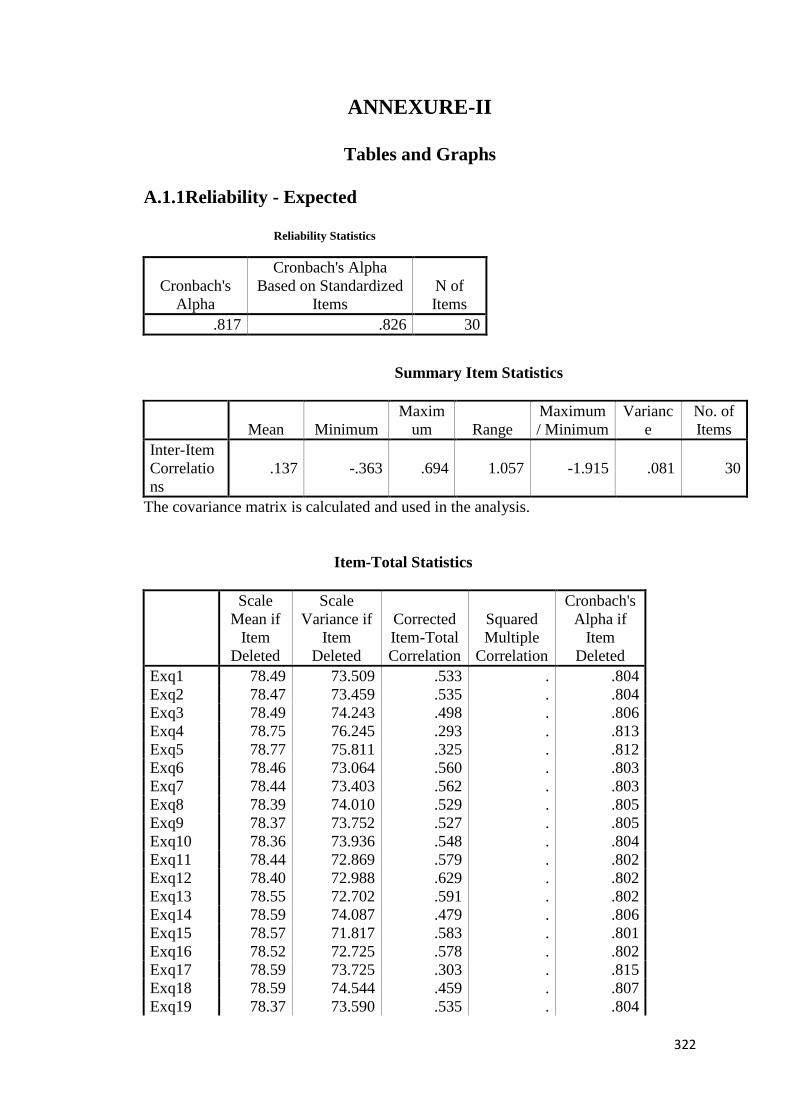
322
ANNEXURE-II
Tables and Graphs
A.1.1Reliability - Expected
Reliability Statistics
Cronbach's
Alpha
Cronbach's Alpha
Based on Standardized
Items
N of
Items
.817 .826 30
Summary Item Statistics
Mean Minimum
Maxim
um Range
Maximum
/ Minimum
Varianc
e
No. of
Items
Inter-Item
Correlatio
ns
.137 -.363 .694 1.057 -1.915 .081 30
The covariance matrix is calculated and used in the analysis.
Item-Total Statistics
Scale
Mean if
Item
Deleted
Scale
Variance if
Item
Deleted
Corrected
Item-Total
Correlation
Squared
Multiple
Correlation
Cronbach's
Alpha if
Item
Deleted
Exq1 78.49 73.509 .533 . .804
Exq2 78.47 73.459 .535 . .804
Exq3 78.49 74.243 .498 . .806
Exq4 78.75 76.245 .293 . .813
Exq5 78.77 75.811 .325 . .812
Exq6 78.46 73.064 .560 . .803
Exq7 78.44 73.403 .562 . .803
Exq8 78.39 74.010 .529 . .805
Exq9 78.37 73.752 .527 . .805
Exq10 78.36 73.936 .548 . .804
Exq11 78.44 72.869 .579 . .802
Exq12 78.40 72.988 .629 . .802
Exq13 78.55 72.702 .591 . .802
Exq14 78.59 74.087 .479 . .806
Exq15 78.57 71.817 .583 . .801
Exq16 78.52 72.725 .578 . .802
Exq17 78.59 73.725 .303 . .815
Exq18 78.59 74.544 .459 . .807
Exq19 78.37 73.590 .535 . .804
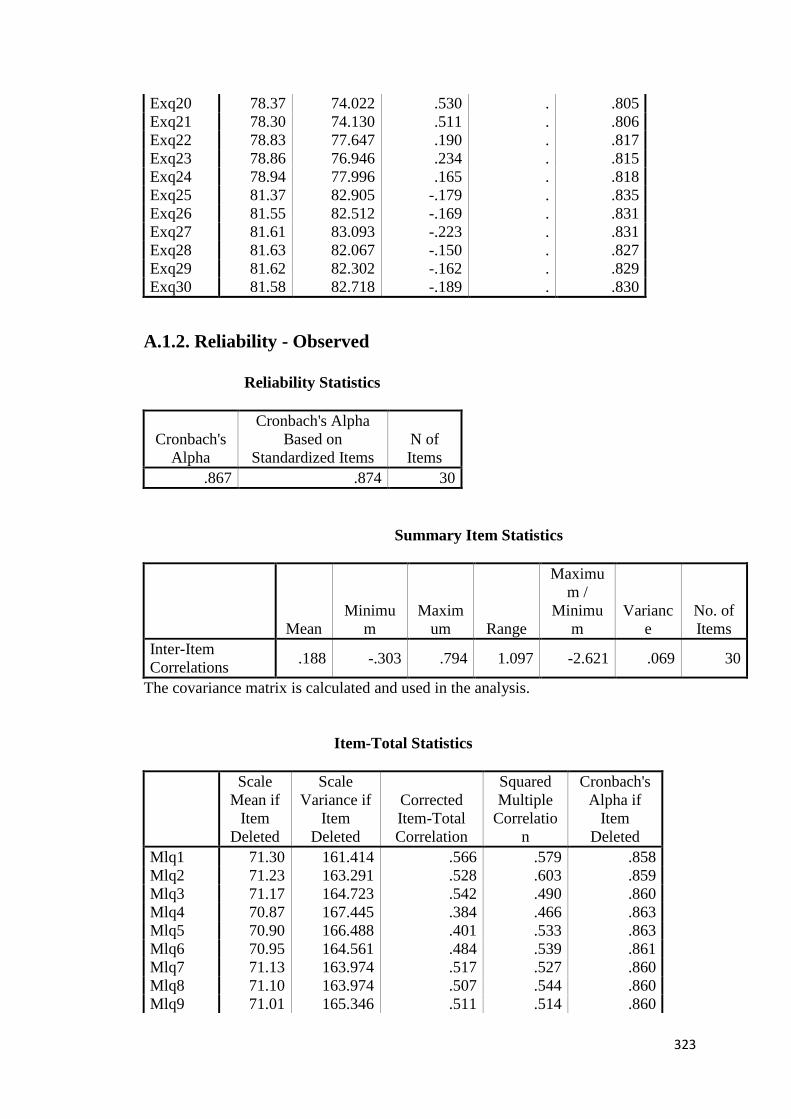
323
Exq20 78.37 74.022 .530 . .805
Exq21 78.30 74.130 .511 . .806
Exq22 78.83 77.647 .190 . .817
Exq23 78.86 76.946 .234 . .815
Exq24 78.94 77.996 .165 . .818
Exq25 81.37 82.905 -.179 . .835
Exq26 81.55 82.512 -.169 . .831
Exq27 81.61 83.093 -.223 . .831
Exq28 81.63 82.067 -.150 . .827
Exq29 81.62 82.302 -.162 . .829
Exq30 81.58 82.718 -.189 . .830
A.1.2. Reliability - Observed
Reliability Statistics
Cronbach's
Alpha
Cronbach's Alpha
Based on
Standardized Items
N of
Items
.867 .874 30
Summary Item Statistics
Mean
Minimu
m
Maxim
um Range
Maximu
m /
Minimu
m
Varianc
e
No. of
Items
Inter-Item
Correlations .188 -.303 .794 1.097 -2.621 .069 30
The covariance matrix is calculated and used in the analysis.
Item-Total Statistics
Scale
Mean if
Item
Deleted
Scale
Variance if
Item
Deleted
Corrected
Item-Total
Correlation
Squared
Multiple
Correlatio
n
Cronbach's
Alpha if
Item
Deleted
Mlq1 71.30 161.414 .566 .579 .858
Mlq2 71.23 163.291 .528 .603 .859
Mlq3 71.17 164.723 .542 .490 .860
Mlq4 70.87 167.445 .384 .466 .863
Mlq5 70.90 166.488 .401 .533 .863
Mlq6 70.95 164.561 .484 .539 .861
Mlq7 71.13 163.974 .517 .527 .860
Mlq8 71.10 163.974 .507 .544 .860
Mlq9 71.01 165.346 .511 .514 .860
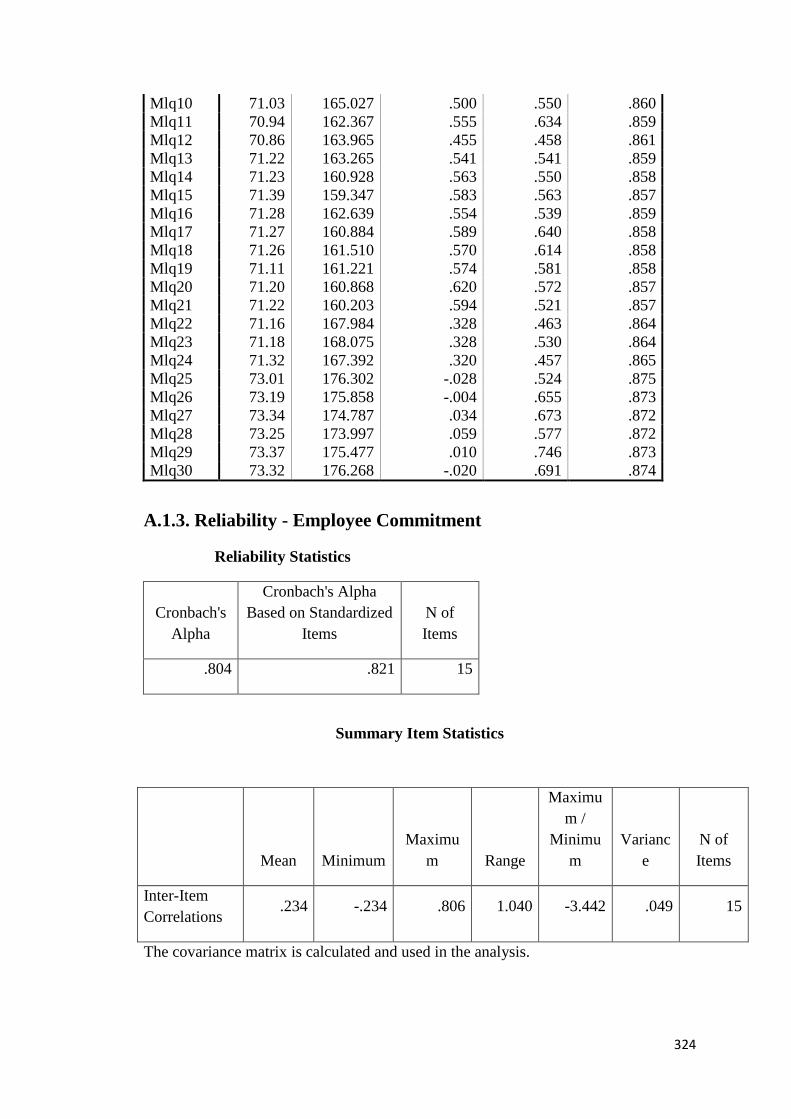
324
Mlq10 71.03 165.027 .500 .550 .860
Mlq11 70.94 162.367 .555 .634 .859
Mlq12 70.86 163.965 .455 .458 .861
Mlq13 71.22 163.265 .541 .541 .859
Mlq14 71.23 160.928 .563 .550 .858
Mlq15 71.39 159.347 .583 .563 .857
Mlq16 71.28 162.639 .554 .539 .859
Mlq17 71.27 160.884 .589 .640 .858
Mlq18 71.26 161.510 .570 .614 .858
Mlq19 71.11 161.221 .574 .581 .858
Mlq20 71.20 160.868 .620 .572 .857
Mlq21 71.22 160.203 .594 .521 .857
Mlq22 71.16 167.984 .328 .463 .864
Mlq23 71.18 168.075 .328 .530 .864
Mlq24 71.32 167.392 .320 .457 .865
Mlq25 73.01 176.302 -.028 .524 .875
Mlq26 73.19 175.858 -.004 .655 .873
Mlq27 73.34 174.787 .034 .673 .872
Mlq28 73.25 173.997 .059 .577 .872
Mlq29 73.37 175.477 .010 .746 .873
Mlq30 73.32 176.268 -.020 .691 .874
A.1.3. Reliability - Employee Commitment
Reliability Statistics
Cronbach's
Alpha
Cronbach's Alpha
Based on Standardized
Items
N of
Items
.804 .821 15
Summary Item Statistics
Mean Minimum
Maximu
m Range
Maximu
m /
Minimu
m
Varianc
e
N of
Items
Inter-Item
Correlations .234 -.234 .806 1.040 -3.442 .049 15
The covariance matrix is calculated and used in the analysis.
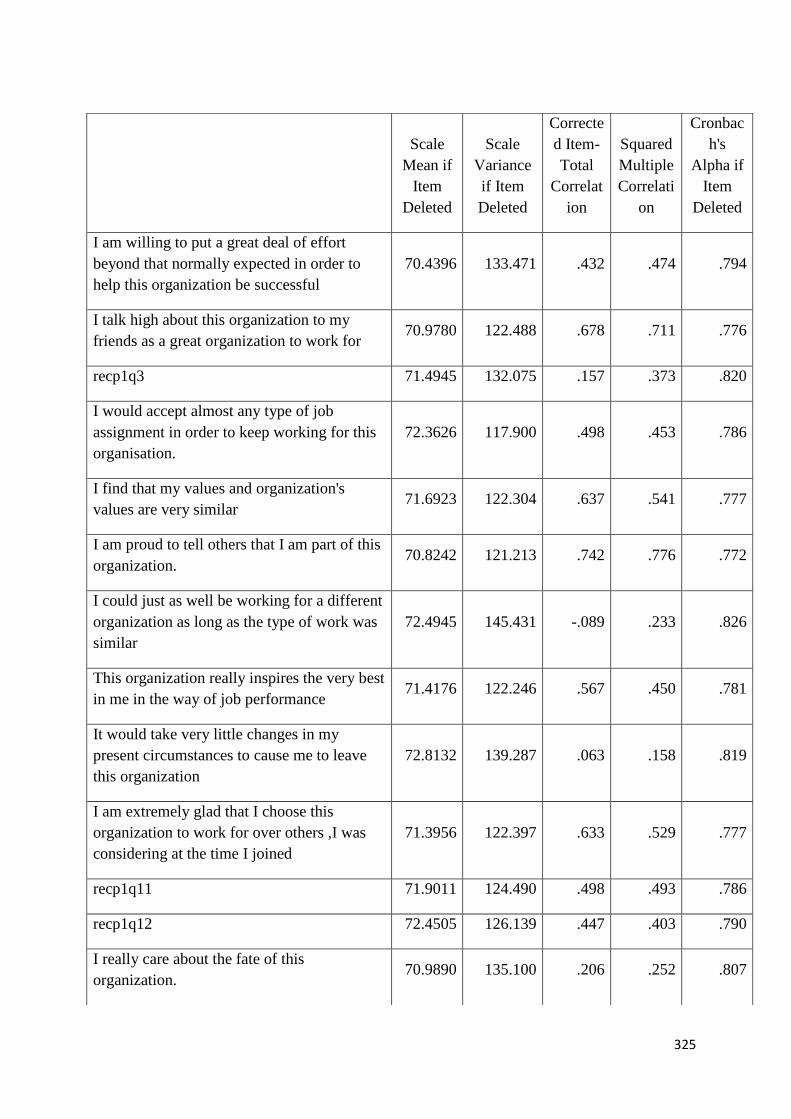
325
Scale
Mean if
Item
Deleted
Scale
Variance
if Item
Deleted
Correcte
d Item-
Total
Correlat
ion
Squared
Multiple
Correlati
on
Cronbac
h's
Alpha if
Item
Deleted
I am willing to put a great deal of effort
beyond that normally expected in order to
help this organization be successful
70.4396 133.471 .432 .474 .794
I talk high about this organization to my
friends as a great organization to work for 70.9780 122.488 .678 .711 .776
recp1q3 71.4945 132.075 .157 .373 .820
I would accept almost any type of job
assignment in order to keep working for this
organisation.
72.3626 117.900 .498 .453 .786
I find that my values and organization's
values are very similar 71.6923 122.304 .637 .541 .777
I am proud to tell others that I am part of this
organization. 70.8242 121.213 .742 .776 .772
I could just as well be working for a different
organization as long as the type of work was
similar
72.4945 145.431 -.089 .233 .826
This organization really inspires the very best
in me in the way of job performance 71.4176 122.246 .567 .450 .781
It would take very little changes in my
present circumstances to cause me to leave
this organization
72.8132 139.287 .063 .158 .819
I am extremely glad that I choose this
organization to work for over others ,I was
considering at the time I joined
71.3956 122.397 .633 .529 .777
recp1q11 71.9011 124.490 .498 .493 .786
recp1q12 72.4505 126.139 .447 .403 .790
I really care about the fate of this
organization. 70.9890 135.100 .206 .252 .807
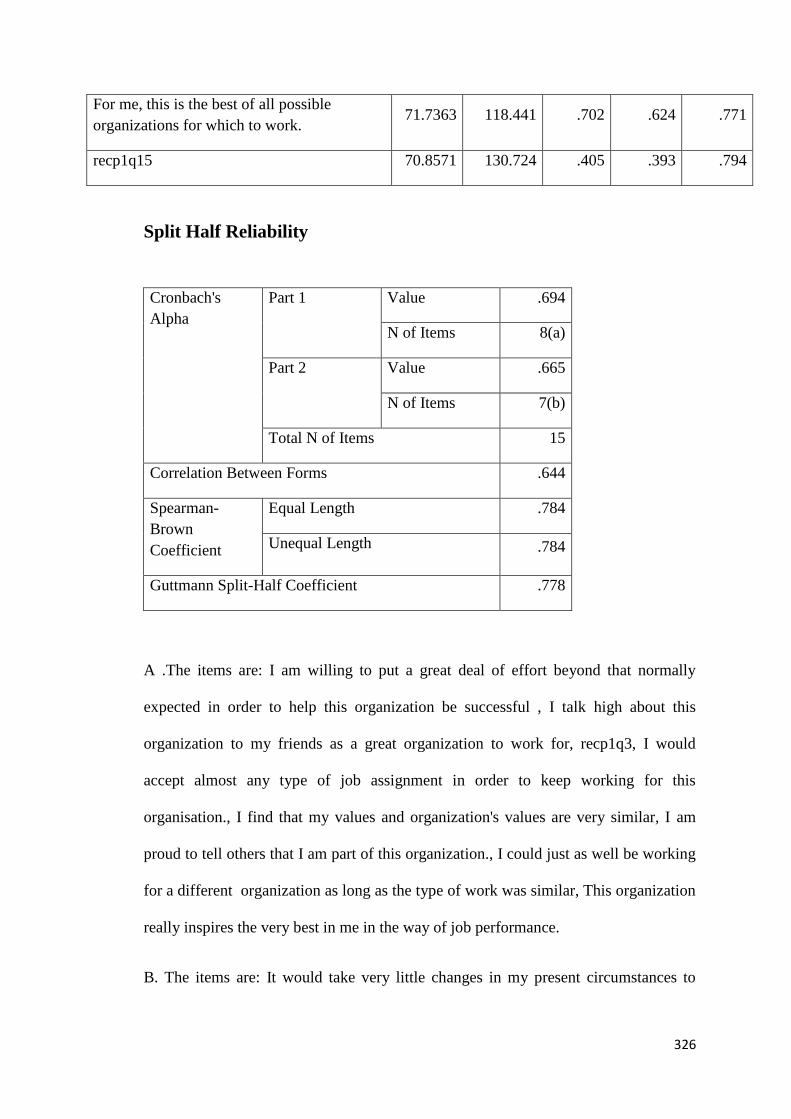
326
Split Half Reliability
Cronbach's
Alpha
Part 1 Value .694
N of Items 8(a)
Part 2 Value .665
N of Items 7(b)
Total N of Items 15
Correlation Between Forms .644
Spearman-
Brown
Coefficient
Equal Length .784
Unequal Length .784
Guttmann Split-Half Coefficient .778
A .The items are: I am willing to put a great deal of effort beyond that normally
expected in order to help this organization be successful , I talk high about this
organization to my friends as a great organization to work for, recp1q3, I would
accept almost any type of job assignment in order to keep working for this
organisation., I find that my values and organization's values are very similar, I am
proud to tell others that I am part of this organization., I could just as well be working
for a different organization as long as the type of work was similar, This organization
really inspires the very best in me in the way of job performance.
B. The items are: It would take very little changes in my present circumstances to
For me, this is the best of all possible
organizations for which to work. 71.7363 118.441 .702 .624 .771
recp1q15 70.8571 130.724 .405 .393 .794
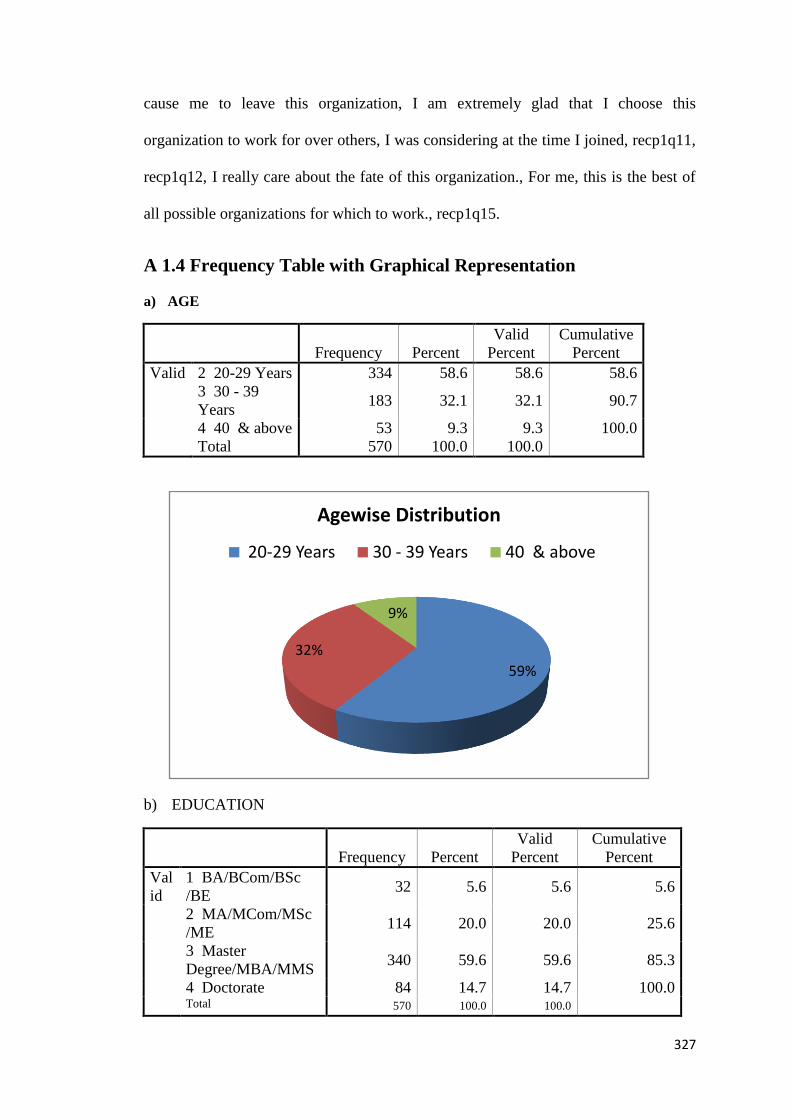
327
cause me to leave this organization, I am extremely glad that I choose this
organization to work for over others, I was considering at the time I joined, recp1q11,
recp1q12, I really care about the fate of this organization., For me, this is the best of
all possible organizations for which to work., recp1q15.
A 1.4 Frequency Table with Graphical Representation
a) AGE
Frequency Percent
Valid
Percent
Cumulative
Percent
Valid 2 20-29 Years 334 58.6 58.6 58.6
3 30 - 39
Years 183 32.1 32.1 90.7
4 40 & above 53 9.3 9.3 100.0
Total 570 100.0 100.0
b) EDUCATION
Frequency Percent
Valid
Percent
Cumulative
Percent
Val
id
1 BA/BCom/BSc
/BE 32 5.6 5.6 5.6
2 MA/MCom/MSc
/ME 114 20.0 20.0 25.6
3 Master
Degree/MBA/MMS 340 59.6 59.6 85.3
4 Doctorate 84 14.7 14.7 100.0 Total 570 100.0 100.0
59%
32%
9%
Agewise Distribution
20-29 Years 30 - 39 Years 40 & above
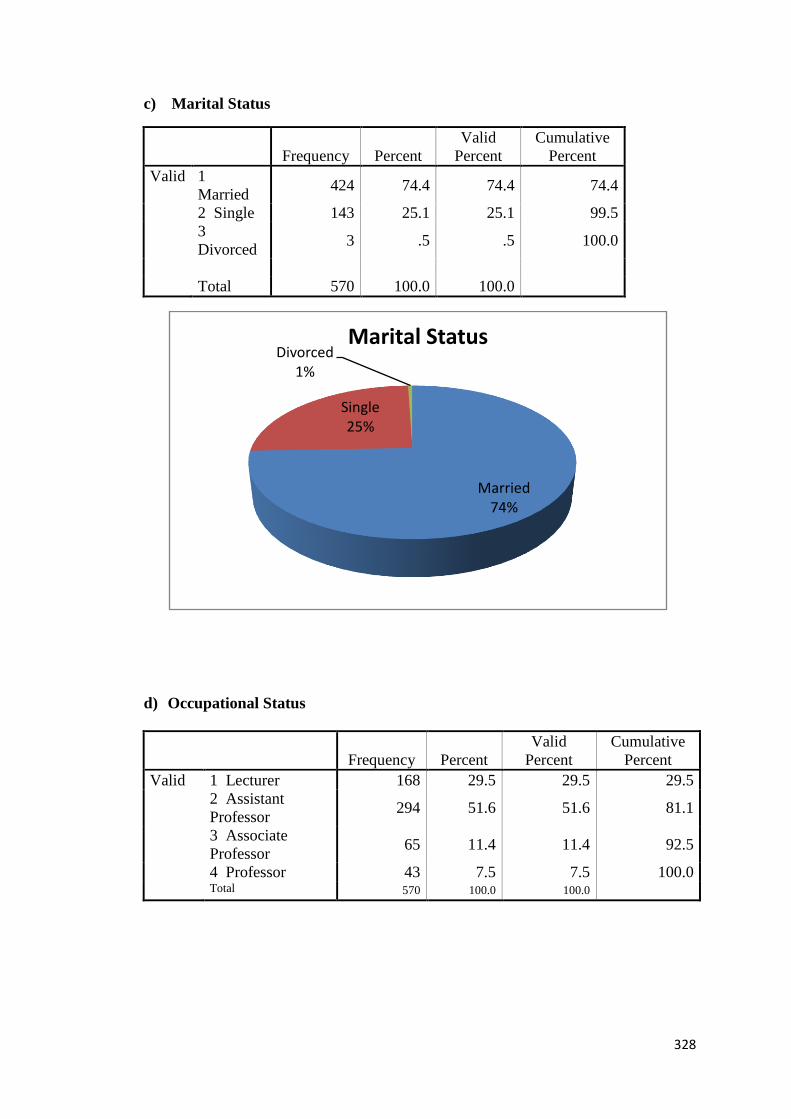
328
c) Marital Status
Frequency Percent
Valid
Percent
Cumulative
Percent
Valid 1
Married 424 74.4 74.4 74.4
2 Single 143 25.1 25.1 99.5
3
Divorced 3 .5 .5 100.0
Total 570 100.0 100.0
d) Occupational Status
Frequency Percent
Valid
Percent
Cumulative
Percent
Valid 1 Lecturer 168 29.5 29.5 29.5
2 Assistant
Professor 294 51.6 51.6 81.1
3 Associate
Professor 65 11.4 11.4 92.5
4 Professor 43 7.5 7.5 100.0 Total 570 100.0 100.0
Married74%
Single25%
Divorced1%
Marital Status
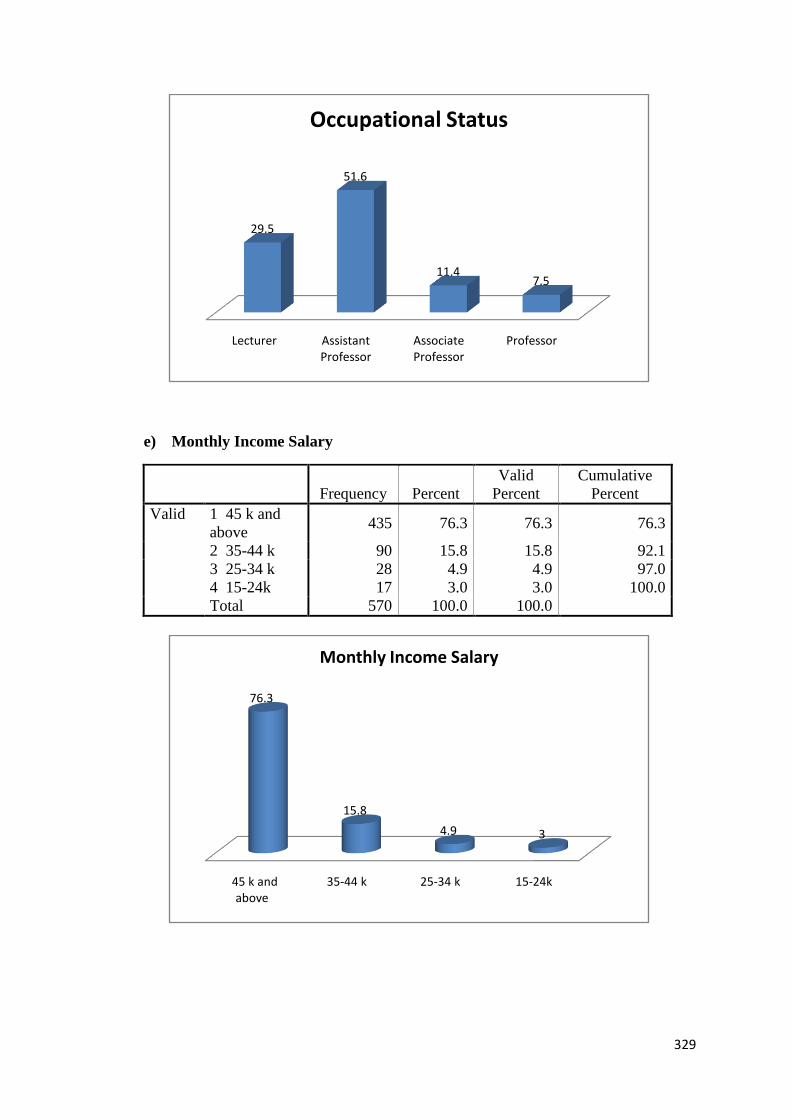
329
e) Monthly Income Salary
Frequency Percent
Valid
Percent
Cumulative
Percent
Valid 1 45 k and
above 435 76.3 76.3 76.3
2 35-44 k 90 15.8 15.8 92.1
3 25-34 k 28 4.9 4.9 97.0
4 15-24k 17 3.0 3.0 100.0
Total 570 100.0 100.0
Lecturer Assistant Professor
Associate Professor
Professor
29.5
51.6
11.47.5
Occupational Status
45 k and above
35-44 k 25-34 k 15-24k
76.3
15.8
4.9 3
Monthly Income Salary
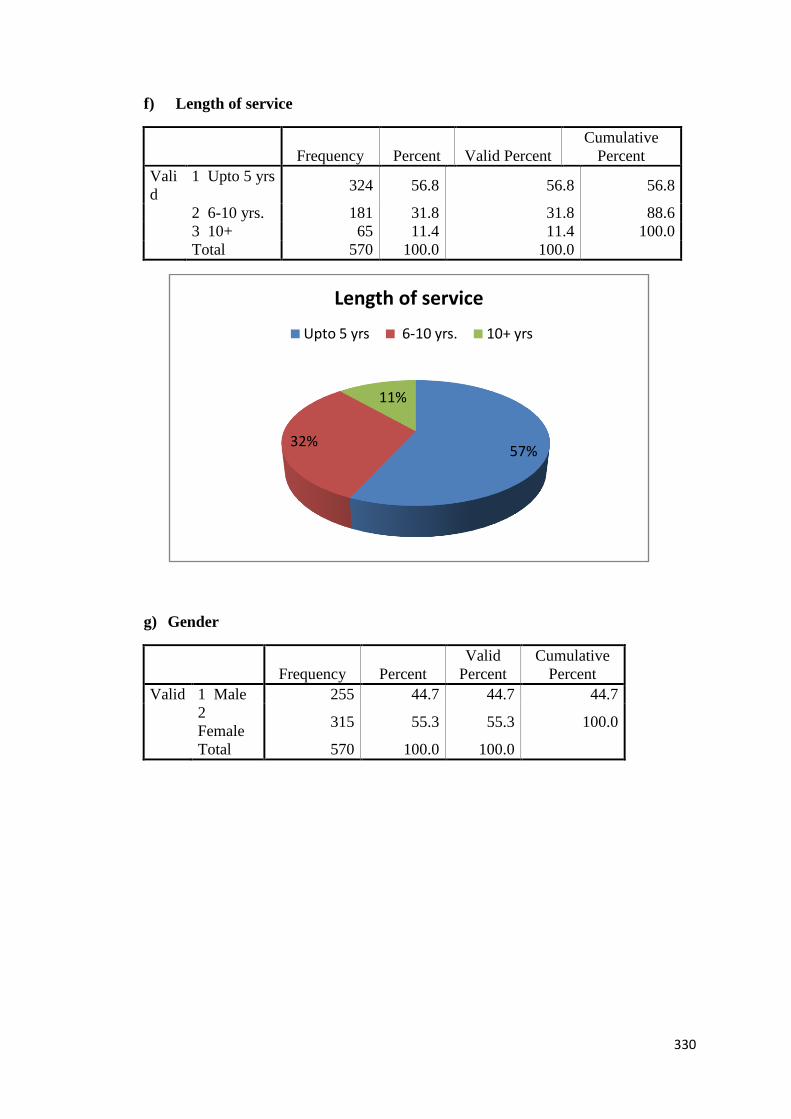
330
f) Length of service
Frequency Percent Valid Percent
Cumulative
Percent
Vali
d
1 Upto 5 yrs 324 56.8 56.8 56.8
2 6-10 yrs. 181 31.8 31.8 88.6
3 10+ 65 11.4 11.4 100.0
Total 570 100.0 100.0
g) Gender
Frequency Percent
Valid
Percent
Cumulative
Percent
Valid 1 Male 255 44.7 44.7 44.7
2
Female 315 55.3 55.3 100.0
Total 570 100.0 100.0
57%32%
11%
Length of service
Upto 5 yrs 6-10 yrs. 10+ yrs
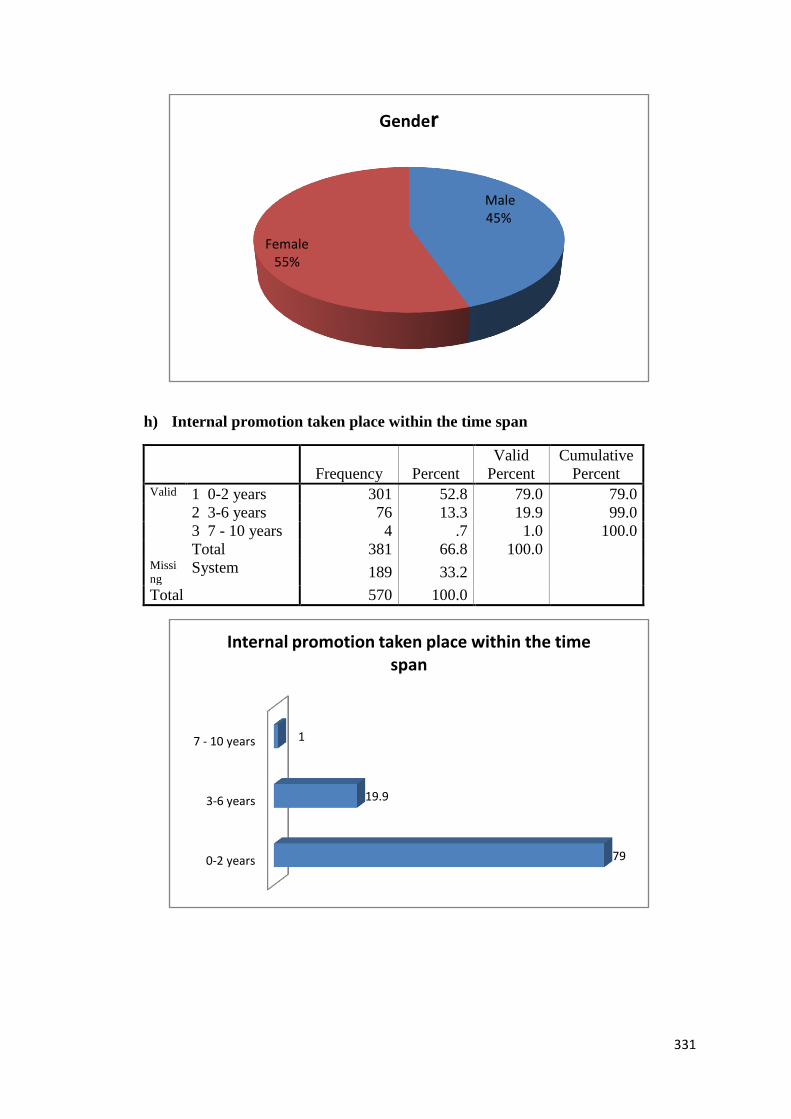
331
h) Internal promotion taken place within the time span
Frequency Percent
Valid
Percent
Cumulative
Percent Valid 1 0-2 years 301 52.8 79.0 79.0 2 3-6 years 76 13.3 19.9 99.0 3 7 - 10 years 4 .7 1.0 100.0 Total 381 66.8 100.0 Missi
ng System 189 33.2
Total 570 100.0
Male45%
Female55%
Gender
0-2 years
3-6 years
7 - 10 years
79
19.9
1
Internal promotion taken place within the time span
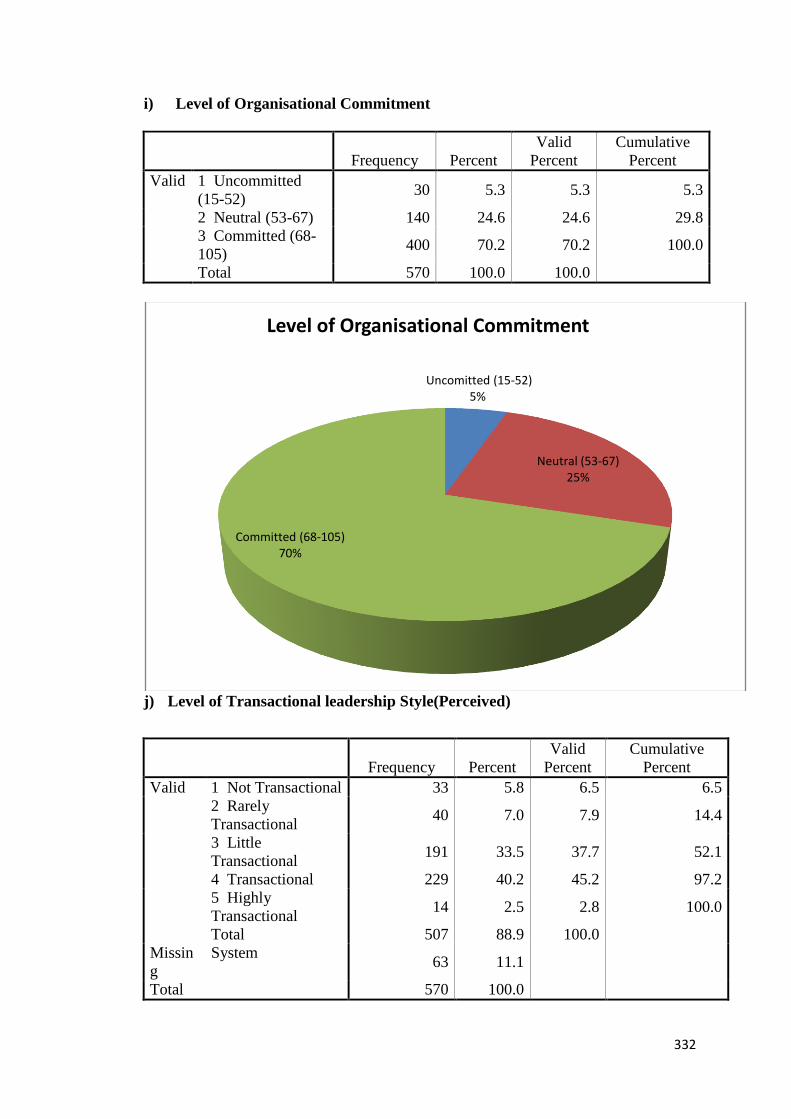
332
i) Level of Organisational Commitment
Frequency Percent
Valid
Percent
Cumulative
Percent
Valid 1 Uncommitted
(15-52) 30 5.3 5.3 5.3
2 Neutral (53-67) 140 24.6 24.6 29.8
3 Committed (68-
105) 400 70.2 70.2 100.0
Total 570 100.0 100.0
j) Level of Transactional leadership Style(Perceived)
Frequency Percent
Valid
Percent
Cumulative
Percent
Valid 1 Not Transactional 33 5.8 6.5 6.5
2 Rarely
Transactional 40 7.0 7.9 14.4
3 Little
Transactional 191 33.5 37.7 52.1
4 Transactional 229 40.2 45.2 97.2
5 Highly
Transactional 14 2.5 2.8 100.0
Total 507 88.9 100.0
Missin
g
System 63 11.1
Total 570 100.0
Uncomitted (15-52)5%
Neutral (53-67)25%
Committed (68-105)70%
Level of Organisational Commitment

333
k) Level of Transactional leadership Style(Expected)
Frequency Percent
Not Transactional 1 .2
Rarely 12 2.1
Little 365 64.0
Transactional 186 32.6
Highly Transactional 6 1.1
Total 570 100.0
1%
8%
61%
27%
3%
Transactional (Perceived)
Not Transactional Rarely Little Transactional Highly Transactional
0% 2%
64%
33%
1%
Transactional (Expected)
Not Transactional Rarely Little Transactional Highly Transactional

334
l) Level of Transformation leadership Style(Perceived)
Frequency Percent
Not Transformational 2 .4
Rarely 17 3.0
Little 103 18.1
Transformational 269 47.2
Highly
Transformational 179 31.4
Total 570 100.0
1% 3%
18%
47%
31%
Transformational (Perceived)
Not Transformational Rarely Little Transformational Highly Transformational
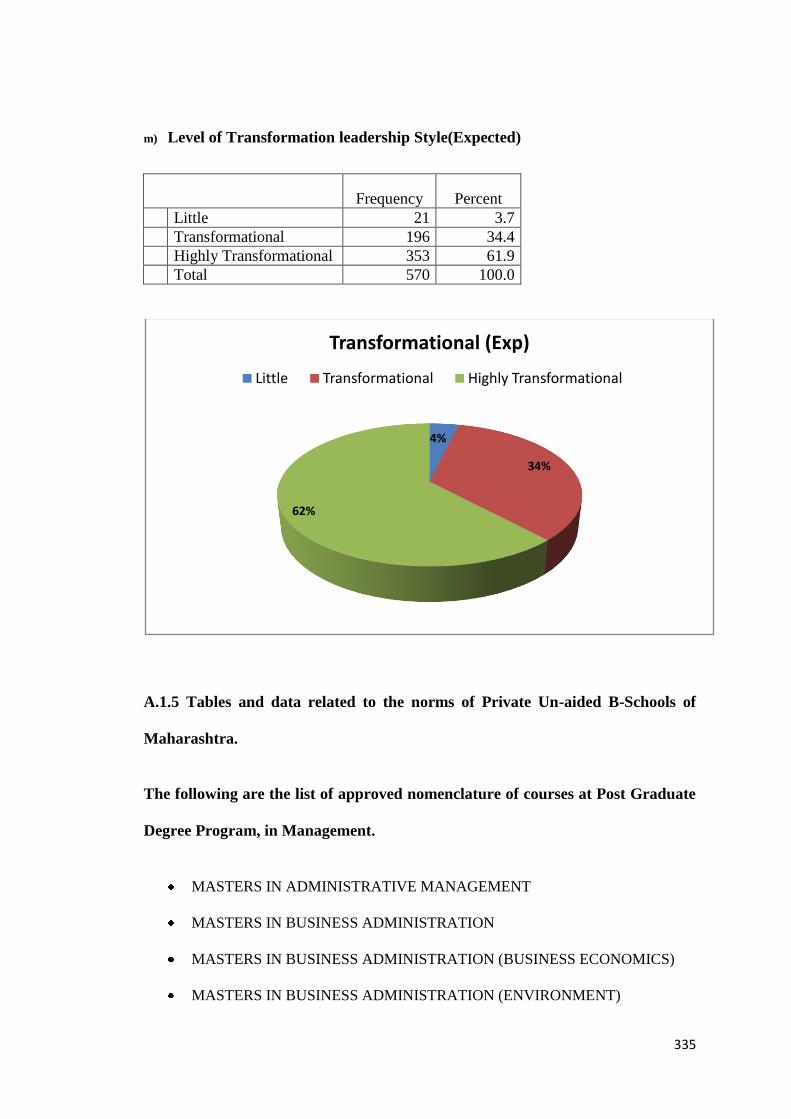
335
m) Level of Transformation leadership Style(Expected)
Frequency Percent
Little 21 3.7
Transformational 196 34.4
Highly Transformational 353 61.9
Total 570 100.0
A.1.5 Tables and data related to the norms of Private Un-aided B-Schools of
Maharashtra.
The following are the list of approved nomenclature of courses at Post Graduate
Degree Program, in Management.
MASTERS IN ADMINISTRATIVE MANAGEMENT
MASTERS IN BUSINESS ADMINISTRATION
MASTERS IN BUSINESS ADMINISTRATION (BUSINESS ECONOMICS)
MASTERS IN BUSINESS ADMINISTRATION (ENVIRONMENT)
4%
34%
62%
Transformational (Exp)
Little Transformational Highly Transformational
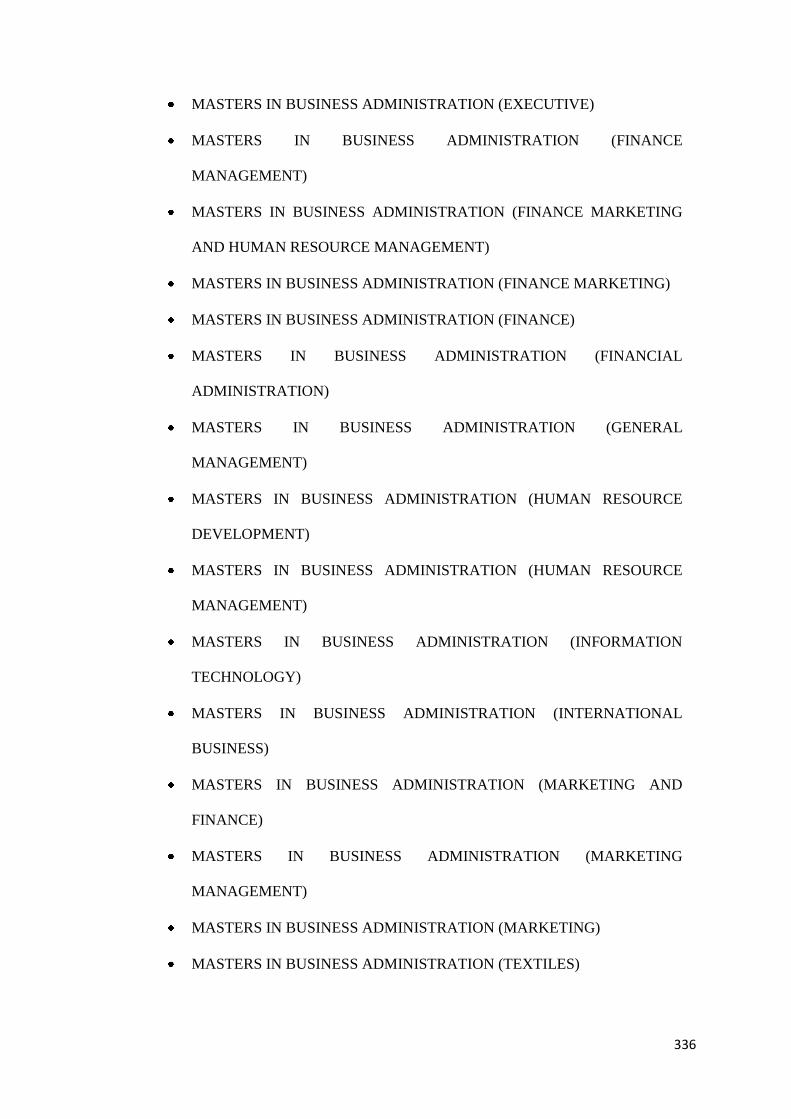
336
MASTERS IN BUSINESS ADMINISTRATION (EXECUTIVE)
MASTERS IN BUSINESS ADMINISTRATION (FINANCE
MANAGEMENT)
MASTERS IN BUSINESS ADMINISTRATION (FINANCE MARKETING
AND HUMAN RESOURCE MANAGEMENT)
MASTERS IN BUSINESS ADMINISTRATION (FINANCE MARKETING)
MASTERS IN BUSINESS ADMINISTRATION (FINANCE)
MASTERS IN BUSINESS ADMINISTRATION (FINANCIAL
ADMINISTRATION)
MASTERS IN BUSINESS ADMINISTRATION (GENERAL
MANAGEMENT)
MASTERS IN BUSINESS ADMINISTRATION (HUMAN RESOURCE
DEVELOPMENT)
MASTERS IN BUSINESS ADMINISTRATION (HUMAN RESOURCE
MANAGEMENT)
MASTERS IN BUSINESS ADMINISTRATION (INFORMATION
TECHNOLOGY)
MASTERS IN BUSINESS ADMINISTRATION (INTERNATIONAL
BUSINESS)
MASTERS IN BUSINESS ADMINISTRATION (MARKETING AND
FINANCE)
MASTERS IN BUSINESS ADMINISTRATION (MARKETING
MANAGEMENT)
MASTERS IN BUSINESS ADMINISTRATION (MARKETING)
MASTERS IN BUSINESS ADMINISTRATION (TEXTILES)
337
MASTERS IN BUSINESS ADMINISTRATION (TOURISM
MANAGEMENT)
MASTERS IN BUSINESS MANAGEMENT
MASTERS IN BUSINESS SYSTEMS
MASTERS IN CORPORATE MANAGEMENT
MASTERS IN ENGINEERING AND MANAGEMENT
MASTERS IN FINANCIAL AND PERSONNEL MANAGEMENT
MASTERS IN FINANCIAL MANAGEMENT
MASTERS IN HUMAN RESOURCE DEVELOPMENT AND
MANAGEMENT
MASTERS IN HUMAN RESOURCE MANAGEMENT
MASTERS IN INDUSTRIAL MANAGEMENT
MASTERS IN INDUSTRIAL RELATIONS AND PERSONNEL
MANAGEMENT
MASTERS IN MANAGEMENT STUDIES
MASTERS IN MATERIALS MANAGEMENT
MASTERS IN PERSONNEL MANAGEMENT
MASTERS IN PUBLIC SERVICE MANAGEMENT
MHMCT (FOOD AND BEVERAGE MANAGEMENT)
MHMCT (HOSPITALITY AND TOURISM ADMINISTRATION)

338
Norms for Land requirement and Building Space for B-Schools of Maharashtra
Table below shows the Land Requirements for Management Institutions
Land Area requirement in Acres
Other than Rural places
(Competent Authority to certify that
the place is not located in a rural area)
Rural Places as defined by
Competent Authority
Stand alone Post Graduate Programs
Stand alone Post Graduate
Programs
Management
0.50 1.00
Table below states the strength of students against per acre of land available for
private un-aided B-Schools of Maharashtra.
Program
Number of students generally allowed
per acre land available when FSI = 1
Management
300
Land area shall cover hostel facilities, if any
Land shall be in one continuous piece.
Considering hilly nature of land in North Eastern States, land may be made
available in 3 pieces which are not away from each other by more than 1 Km
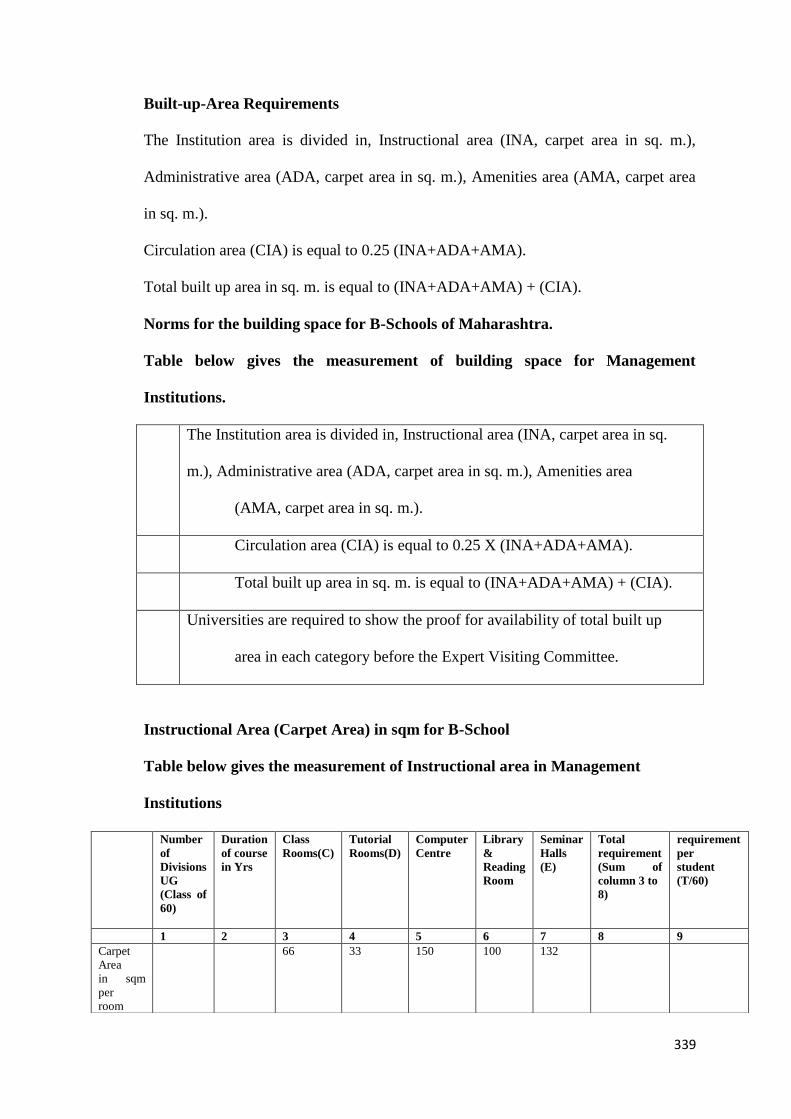
339
Built-up-Area Requirements
The Institution area is divided in, Instructional area (INA, carpet area in sq. m.),
Administrative area (ADA, carpet area in sq. m.), Amenities area (AMA, carpet area
in sq. m.).
Circulation area (CIA) is equal to 0.25 (INA+ADA+AMA).
Total built up area in sq. m. is equal to (INA+ADA+AMA) + (CIA).
Norms for the building space for B-Schools of Maharashtra.
Table below gives the measurement of building space for Management
Institutions.
a The Institution area is divided in, Instructional area (INA, carpet area in sq.
m.), Administrative area (ADA, carpet area in sq. m.), Amenities area
(AMA, carpet area in sq. m.).
b Circulation area (CIA) is equal to 0.25 X (INA+ADA+AMA).
c Total built up area in sq. m. is equal to (INA+ADA+AMA) + (CIA).
d Universities are required to show the proof for availability of total built up
area in each category before the Expert Visiting Committee.
Instructional Area (Carpet Area) in sqm for B-School
Table below gives the measurement of Instructional area in Management
Institutions
Number
of
Divisions
UG
(Class of
60)
Duration
of course
in Yrs
Class
Rooms(C)
Tutorial
Rooms(D)
Computer
Centre
Library
&
Reading
Room
Seminar
Halls
(E)
Total
requirement
(Sum of
column 3 to
8)
requirement
per
student
(T/60)
1 2 3 4 5 6 7 8 9
Carpet
Area
in sqm
per
room
66 33 150 100 132
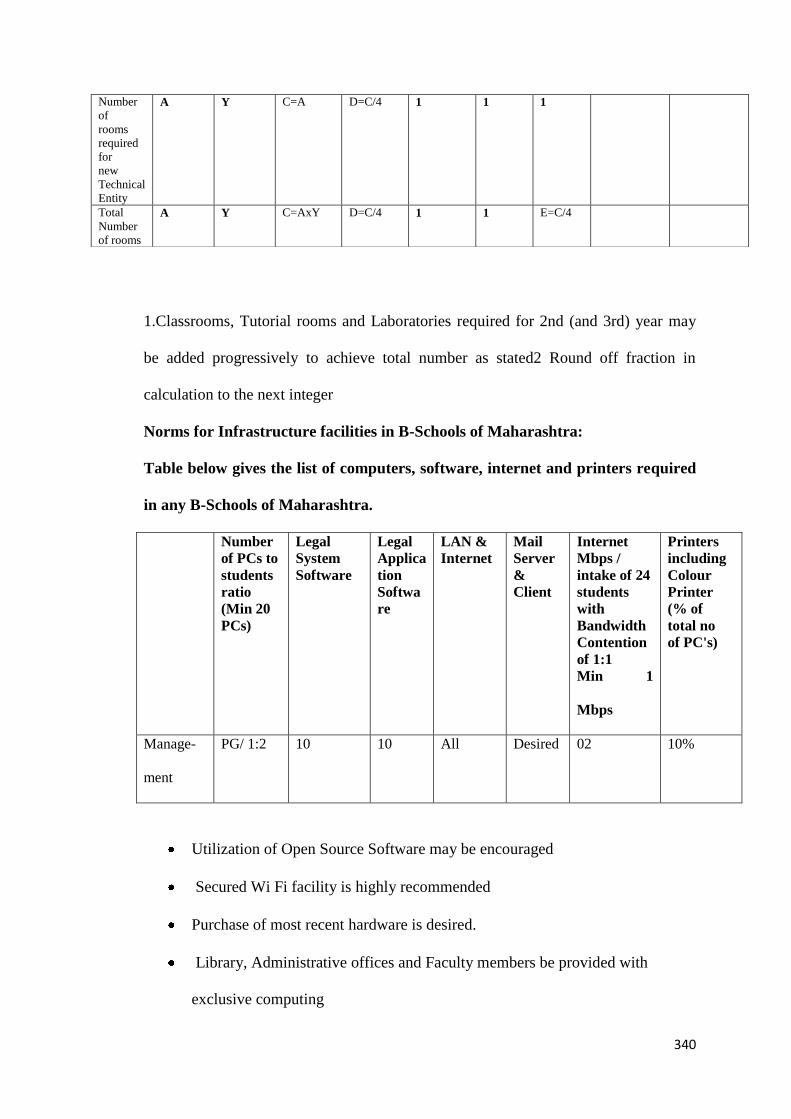
340
1.Classrooms, Tutorial rooms and Laboratories required for 2nd (and 3rd) year may
be added progressively to achieve total number as stated2 Round off fraction in
calculation to the next integer
Norms for Infrastructure facilities in B-Schools of Maharashtra:
Table below gives the list of computers, software, internet and printers required
in any B-Schools of Maharashtra.
Number
of PCs to
students
ratio
(Min 20
PCs)
Legal
System
Software
Legal
Applica
tion
Softwa
re
LAN &
Internet
Server
&
Client
Internet
Mbps /
intake of 24
students
with
Bandwidth
Contention
of 1:1
Min 1
Mbps
Printers
including
Colour
Printer
(% of
total no
of PC's)
Manage-
ment
PG/ 1:2 10 10 All Desired 02 10%
Utilization of Open Source Software may be encouraged
Secured Wi Fi facility is highly recommended
Purchase of most recent hardware is desired.
Library, Administrative offices and Faculty members be provided with
exclusive computing
Number
of
rooms
required
for
new
Technical
Entity
A Y C=A D=C/4 1 1 1
Total
Number
of rooms
A Y C=AxY D=C/4 1 1 E=C/4
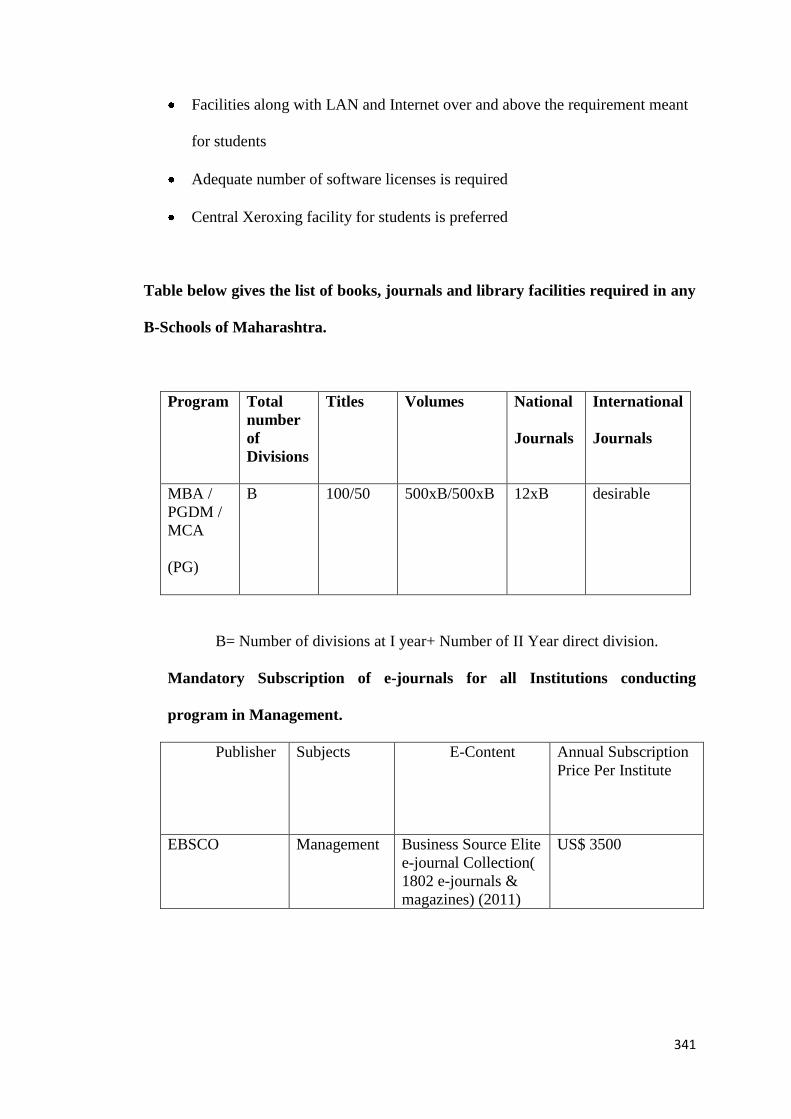
341
Facilities along with LAN and Internet over and above the requirement meant
for students
Adequate number of software licenses is required
Central Xeroxing facility for students is preferred
Table below gives the list of books, journals and library facilities required in any
B-Schools of Maharashtra.
Program Total
number
of
Divisions
Titles Volumes National
Journals
International
Journals
MBA /
PGDM /
MCA
(PG)
B 100/50 500xB/500xB 12xB desirable
B= Number of divisions at I year+ Number of II Year direct division.
Mandatory Subscription of e-journals for all Institutions conducting
program in Management.
Publisher Subjects E-Content Annual Subscription
Price Per Institute
EBSCO Management Business Source Elite
e-journal Collection(
1802 e-journals &
magazines) (2011)
US$ 3500
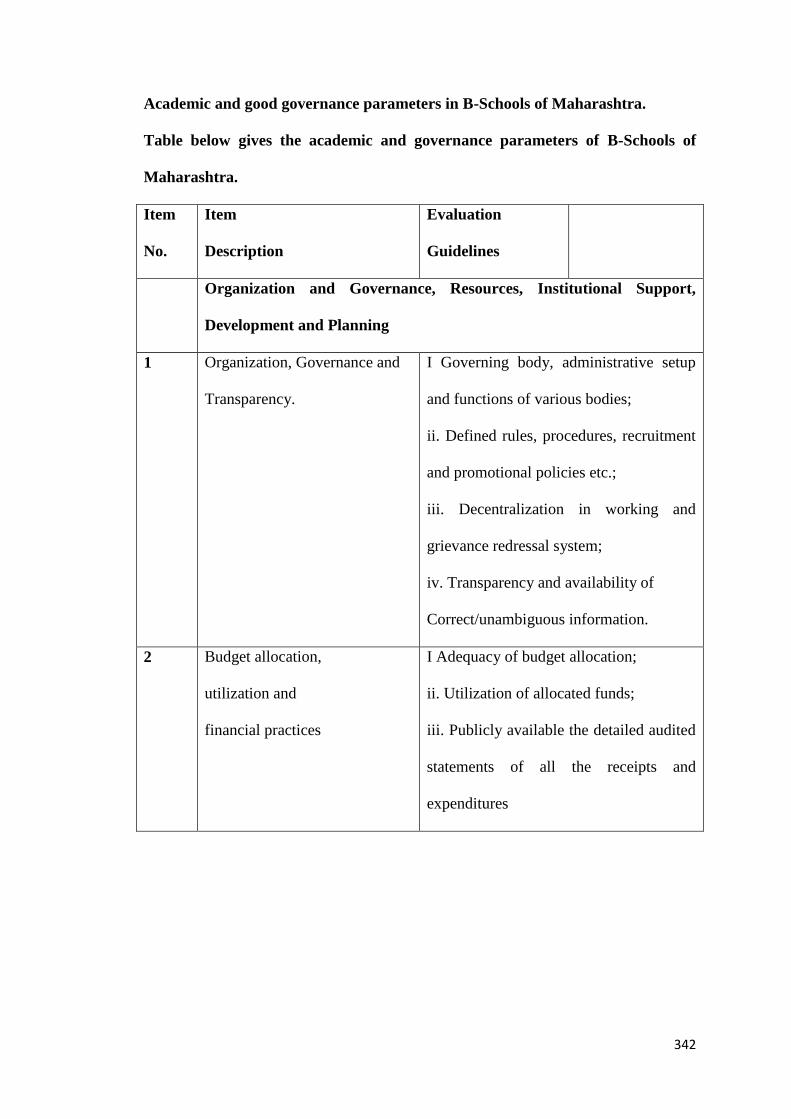
342
Academic and good governance parameters in B-Schools of Maharashtra.
Table below gives the academic and governance parameters of B-Schools of
Maharashtra.
Item
No.
Item
Description
Evaluation
Guidelines
Organization and Governance, Resources, Institutional Support,
Development and Planning
1 Organization, Governance and
Transparency.
I Governing body, administrative setup
and functions of various bodies;
ii. Defined rules, procedures, recruitment
and promotional policies etc.;
iii. Decentralization in working and
grievance redressal system;
iv. Transparency and availability of
Correct/unambiguous information.
2 Budget allocation,
utilization and
financial practices
I Adequacy of budget allocation;
ii. Utilization of allocated funds;
iii. Publicly available the detailed audited
statements of all the receipts and
expenditures