Embed Size (px)
Citation preview

A STUDY OF TRAVELERS’ FOODIE ACTIVITY DIMENSIONS, D EMOGRAPHIC CHARACTERISTICS, AND TRIP BEHAVIORS
By
Erin Green
April, 2013
Director of Thesis: Dr. Carol Kline
Major Department: Sustainable Tourism
People who identify themselves as foodies may do so for vastly different reasons. From
interests in sustainable agriculture to gardening, they differ in their lifestyles and behaviors.
These interests can be grouped into foodie activity dimensions. Through a tourism lens,
someone with a strong interest in one of these dimensions may travel longer or spend more
money during their travels.
This study looks at potential tourists to Minneapolis, Minnesota. Using the theory of
involvement, travelers’ travel habits and demographics will be studied based on their interest in
foodie activity dimensions. These dimensions are segmented based on factor analysis of their
enjoyment of food-related activities. The travel habits dimensions are investigated to learn more
about their effect on the destination. This information is valuable for destination marketing
organizations in order to know which foodie activity dimensions should be targeted through
destination marketing efforts or which food-related activities they may want to advertise to
potential tourists based on their food-related interests.


A STUDY OF TRAVELERS’ FOODIE ACTIVITY DIMENSIONS, D EMOGRAPHIC
CHARACTERISTICS, AND TRIP BEHAVIORS
A Thesis
Presented To the Faculty of Sustainable Tourism
East Carolina University
In Partial Fulfillment of the Requirements for the Degree
M.S. Sustainable Tourism
by
Erin Green
April, 2013

© Copyright by Erin Green 2013 All rights reserved

A STUDY OF TRAVELERS’ FOODIE ACTIVITY DIMENSIONS, D EMOGRAPHIC
CHARACTERISTICS, AND TRIP BEHAVIORS
by
Erin Green
APPROVED BY:
DIRECTOR OF THESIS_______________________________________________________
(Carol Kline, PhD, Assistant Professor, Sustainable Tourism)
COMMITTEE MEMBER________________________________________________________
(Huili Hao, PhD, Research Director, Center for Sustainable Tourism)
COMMITTEE MEMBER________________________________________________________
(Alleah Crawford, PhD, Assistant Professor, Hospitality Management)
COMMITTEE MEMBER________________________________________________________
(Kevin Hanstad, MBA, Director of Market Research, Meet Minneapolis)
DIRECTOR M.S. SUSTAINABLE TOURISM ______________________________________
(Patrick Long, PhD, Center for Sustainable Tourism)
DEAN OF THE GRADUATE SCHOOL ___________________________________________
(Paul J. Gemperline, PhD)

ACKNOWLEDGEMENTS
I would first like to thank my committee for all of their support throughout this project.
Kevin, when I first called you to approach the idea of partnering on this research, I only could
have dreamed that I would receive the enthusiastic and welcoming response that I did. I have
been so lucky to have been able to work with you and the resources you and Meet Minneapolis
have been able to provide me. Dr. Crawford, you are always such a pleasure to talk with and
I’ve appreciated your ideas and feedback throughout this process. Dr. Hao, you are a stats
goddess. Thank you for multiple office sessions of working through research challenges.
Finally, Dr. Kline, I am so grateful for the attention you have given me and this project. You are
the queen of multi-tasking, and knowing how much you have on your plate (foodie pun intended)
affirms the commitment you have to assisting your students to do the best work they can do.
From Cuba to butter carving conversations, I have truly appreciated your mentoring throughout
my time at ECU.
Dr. Fridgen, you proved the fact I can always find some Minnesota nice wherever I may
end up. Thank you for making my years at the Center a knee-slapping good time. Dr. Long,
from the first phone call I received from my “NC Visit Planning Team” to our ice skating
afternoons, you have been such a joy to get to work for and get to know. The opportunities I
have been provided through you and this program have been invaluable and I can’t thank you
enough for your guidance and friendship. My fellow SUTO students, you are the ones that have
made grad school an incredibly fun time. Finally, a giant life-long thank you to my family. In
the parent message section of my high school yearbook, you wrote “you’ve got roots, you’ve got
wings, enjoy the flight.” I have the deepest roots I could hope for and have had the best flight I
could ever want with your support. Thank you now and forever.

TABLE OF CONTENTS
LIST OF TABLES ....................................................................................................................................... vi
CHAPTER 1: INTRODUCTION ................................................................................................................. 1
Purpose of Study .............................................................................................................................. 1
Objectives/Research Questions ........................................................................................................ 2
Linkages between Food-related Activities and Sustainable Tourism .............................................. 2
CHAPTER 2: REVIEW OF THE LITERATURE ....................................................................................... 5
What is a Foodie?............................................................................................................................. 5
Foodie Typologies ........................................................................................................................... 8
Food in Tourism ............................................................................................................................. 10
Profiles of Culinary Tourists .......................................................................................................... 12
Food-Activity Involvement ............................................................................................................ 15
Foodie Travel Behavior ................................................................................................................. 16
Summary of Literature Review ...................................................................................................... 18
CHAPTER 3: METHODS .......................................................................................................................... 19
Description of Sample.................................................................................................................... 19
Survey Development and Distribution ........................................................................................... 19
CHAPTER 4: RESULTS ............................................................................................................................ 22
Descriptive Results ........................................................................................................................ 22
Foodie Activity Dimensions .......................................................................................................... 34
Socio-demographic Test Results .................................................................................................... 38
Gender ............................................................................................................................... 39
Age .................................................................................................................................... 40
Income .............................................................................................................................. 44
Travel Behavior Test Results ......................................................................................................... 46

Length of Last Vacation ................................................................................................... 46
Size of Travel Party .......................................................................................................... 50
Food Expenditures ............................................................................................................ 53
Total Expenditures ......................................................................................................................... 54
Foodie Rating ................................................................................................................................. 55
Summary of Results ....................................................................................................................... 56
CHAPTER 5: DISCUSSION ...................................................................................................................... 58
Introduction .................................................................................................................................... 58
Foodie Activity Dimensions .......................................................................................................... 58
Sustainable Agriculture Dimension .................................................................................. 58
Adventure Dimension ....................................................................................................... 59
Home Cooking Dimension ............................................................................................... 60
Political Activist Dimension ............................................................................................. 60
Earthy Dimension ............................................................................................................. 60
Trendy Dimension ............................................................................................................ 61
Drinking Dimension ......................................................................................................... 61
Farmer Friendly Dimension .............................................................................................. 62
Engaged Dimension .......................................................................................................... 62
Upscale Cooking Dimension ............................................................................................ 63
Socio-demographics Across Foodie Activity Dimensions ............................................................ 62
Travel Behavior Across Foodie Activity Dimensions ................................................................... 64
Foodie Ratings Across Foodie Activity Dimensions ..................................................................... 67
Implications for Sustainable Tourism ............................................................................................ 68
Limitations ..................................................................................................................................... 69
Future Research Directions ............................................................................................................ 70
Conclusion ..................................................................................................................................... 70

REFERENCES ........................................................................................................................................... 72
APPENDIX A: ECU UMC IRB APPROVAL LETTER ........................................................................... 76
APPENDIX B: SURVEY ........................................................................................................................... 77
APPENDIX C: INITIAL CONTACT EMAIL ........................................................................................... 85
APPENDIX D: SECONDARY EMAIL REQUEST .................................................................................. 86
APPENDIX E: FINAL EMAIL REQUEST ............................................................................................... 87

LIST OF TABLES
Table 1: Barr and Levy’s Foodie Types ........................................................................................................ 9
Table 2: Examples of Bourdain’s Foodie Types ......................................................................................... 10
Table 3: Culinary Tourist Segmentation Based on Participation in Food Experiences and Food-related
Activities as Trip Motivation ...................................................................................................................... 13
Table 4: Bell and Marshall’s Food Involvement Scale ............................................................................... 16
Table 5: Robinson and Getz’s Highest Ranking Food Involvement Scale Items ....................................... 17
Table 6: Items Added to or Changed from Previous Instrument ................................................................ 20
Table 7: Expert Panel .................................................................................................................................. 21
Table 8: Socio-demographic Profile of Participants ................................................................................... 22
Table 9: Occupation of Respondents .......................................................................................................... 23
Table 10: Food Consumption Habits .......................................................................................................... 24
Table 11: Self-reported Foodie Rating ........................................................................................................ 24
Table 12: Food-related Activities ............................................................................................................... 26
Table 13: Food-related Travel Behavior ..................................................................................................... 31
Table 14: Profile of Last Vacation .............................................................................................................. 33
Table 15: Average Expenditures on Last Vacation..................................................................................... 34
Table 16: Descriptions, Factor Loadings, Reliability Coefficients, and Variance Explained for Foodie
Activity Dimensions ................................................................................................................................... 35
Table 17: Items Excluded from Scale ......................................................................................................... 37
Table 18: Factor Means and Standard Deviations ...................................................................................... 37
Table 19: Means and Standard Deviations of Gender ................................................................................ 39
Table 20: T-test Statistics for Gender ......................................................................................................... 40
Table 21: Means and Standard Deviations of Age Ranges ......................................................................... 41
Table 22: Welch and Brown-Forsythe’s Test of Equality of Means for Age Ranges ................................ 42

Table 23: ANOVA Results for Age ............................................................................................................ 42
Table 24: Means and Standard Deviations of Household Income .............................................................. 44
Table 25: Welch and Brown-Forsythe’s Test of Equality of Means for Income ........................................ 45
Table 26: ANOVA Results for Household Income .................................................................................... 46
Table 27: Means and Standard Deviations of Length of Stay .................................................................... 47
Table 28: Welch and Brown-Forsythe’s Test of Equality of Means for Length of Stay ............................ 48
Table 29: ANOVA Results for Length of Stay ........................................................................................... 48
Table 30: Means and Standard Deviations of Party Size ............................................................................ 51
Table 31: Welch and Brown-Forsythe’s Test of Equality of Means for Party Size .................................... 52
Table 32: ANOVA Results for Party Size .................................................................................................. 52
Table 33: Pearson Product-Movement Correlations for Food Expenditures .............................................. 53
Table 34: Pearson Product-Movement Correlations for Expenditures ....................................................... 54
Table 35: Pearson Product-Movement Correlations for Foodie Ratings .................................................... 55
Table 36: Summary of Significant Differences within Dimensions for Socio-demographics .................... 64
Table 37: Summary of Significant Differences within Dimensions for Travel Behavior........................... 67

A Study of Travelers' Foodie Activity Dimensions, Demographic Characteristics, and Trip
Behaviors
1. INTRODUCTION
1.1 Purpose of Study
The purpose of this study is to examine potential visitors to Minneapolis, Minnesota
based on their enjoyment of food-related activities to produce a scale of foodie activity
dimensions and compare visitor characteristics and travel behavior according to their level of
enjoyment on the various dimensions. For the purpose of this study, a foodie is defined as
someone that has a very strong interest in food (Barr and Levy, 1985). This definition is broad,
and the term encompasses a population of people with varying interests and participation in
activities related to food, which is why investigating how the population’s enjoyment of various
food-related activities fall into different foodie activity dimensions is important. Once the
dimensions are identified, it will be possible to take a closer look at the kind of characteristics
and visitor behavior associated with each dimension. This information is valuable for marketing
the destination as it will provide insight into the activities and habits of foodies that they would
like to attract to their destination. Destination marketing organizations and businesses that offer
food experiences can decide how to best market the destination to the most desirable groups.
Attracting visitors is important for the sustainability of a destination. Learning more
about the interests of potential tourists will help a destination to ensure the viability of continuing
to profit from the economic impact of visitors. Many visitors desire authentic experiences while
traveling, and local foods and beverages are one important way to offer those experiences. Local
foods are also a way for visitors to connect with the community, spend money in ways that
support local businesses and farmers, and discourage emissions associated with transporting food

2
(Sims, 2009). This study will provide insights into the food-related activities tourists are
interested in so that a destination can consider how to best feature its food and beverage
experiences in order to attract tourists and support local businesses.
1.2 Objectives/Research Questions
The first objective of this study is to investigate whether a survey instrument can be
reliable and valid in producing foodie activity dimensions. In the case that it is, the second
objective is to describe the different foodie activity dimensions based on the respondents’
enjoyment of the food-related activities listed on the survey. The final objective is to compare
the characteristics and travel behaviors of the participants according to their foodie dimension
scores. The following research questions will be investigated:
1. Can foodie activities be factored into activity dimensions?
2. Are there differences in foodie activity dimension scores among respondents with
varying socio-demographic characteristics?
3. Are there differences in foodie activity dimension scores among respondents with
varying travel behaviors?
4. How do the respondents with varying foodie activity dimension scores rate
themselves when asked to what degree they identify as a foodie?
1.3 Linkages between Food-related Activities and Sustainable Tourism
The World Tourism Organization defines sustainable tourism as “tourism, which meets
the needs of present tourists and host regions while protecting and enhancing opportunity for the
future,” (World Tourism Organization, 1993, p. 7). The concept is oriented around three pillars:
social, economic, and environmental and aims to foster sustainable growth in all three of these
dimensions (Sims, 2009).
3
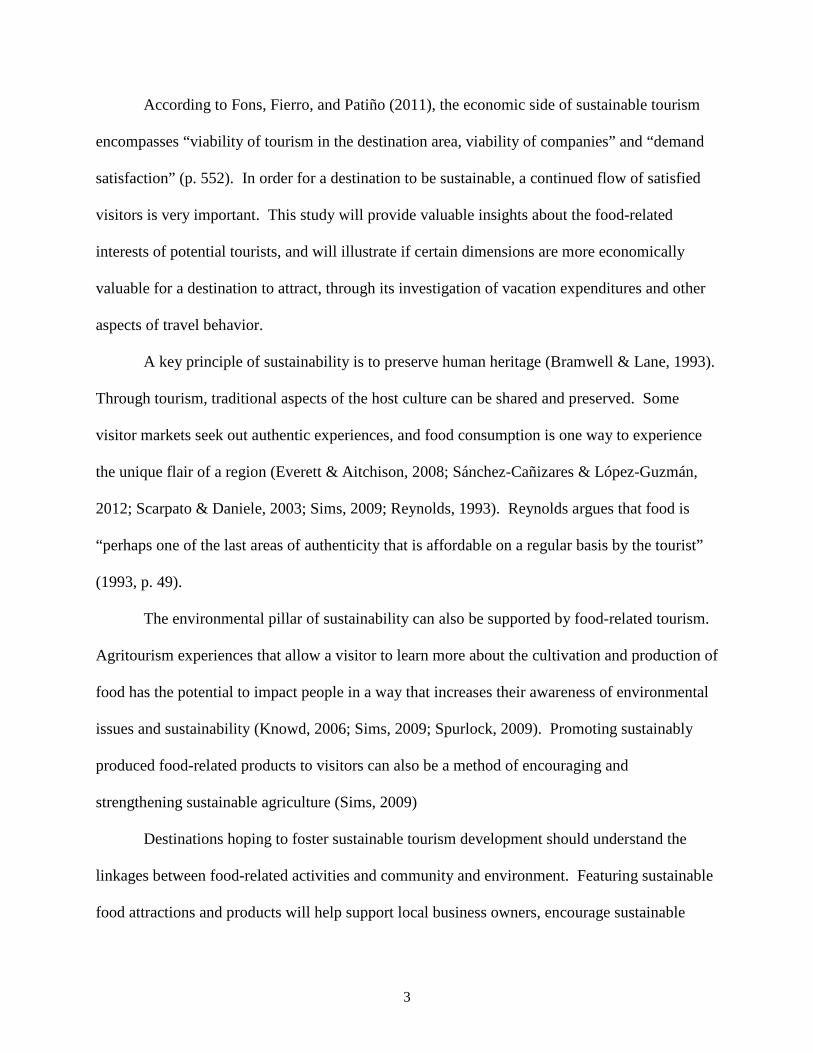
According to Fons, Fierro, and Patiño (2011), the economic side of sustainable tourism
encompasses “viability of tourism in the destination area, viability of companies” and “demand
satisfaction” (p. 552). In order for a destination to be sustainable, a continued flow of satisfied
visitors is very important. This study will provide valuable insights about the food-related
interests of potential tourists, and will illustrate if certain dimensions are more economically
valuable for a destination to attract, through its investigation of vacation expenditures and other
aspects of travel behavior.
A key principle of sustainability is to preserve human heritage (Bramwell & Lane, 1993).
Through tourism, traditional aspects of the host culture can be shared and preserved. Some
visitor markets seek out authentic experiences, and food consumption is one way to experience
the unique flair of a region (Everett & Aitchison, 2008; Sánchez-Cañizares & López-Guzmán,
2012; Scarpato & Daniele, 2003; Sims, 2009; Reynolds, 1993). Reynolds argues that food is
“perhaps one of the last areas of authenticity that is affordable on a regular basis by the tourist”
(1993, p. 49).
The environmental pillar of sustainability can also be supported by food-related tourism.
Agritourism experiences that allow a visitor to learn more about the cultivation and production of
food has the potential to impact people in a way that increases their awareness of environmental
issues and sustainability (Knowd, 2006; Sims, 2009; Spurlock, 2009). Promoting sustainably
produced food-related products to visitors can also be a method of encouraging and
strengthening sustainable agriculture (Sims, 2009)
Destinations hoping to foster sustainable tourism development should understand the
linkages between food-related activities and community and environment. Featuring sustainable
food attractions and products will help support local business owners, encourage sustainable

4
agriculture, preserve cultural heritage, and bring a sense of authenticity that so many visitors are
seeking.

2. REVIEW OF THE LITERATURE
2.1 What is a Foodie?
One of the first formal uses of the term “foodie” was in 1982 in an essay called ‘Cuisine
Poseur’ published in Harpers and Queen magazine (Barr & Levy, 1985). The “foodie”
movement rose to a new level when a book devoted to this ‘class’ of people was published in
1985 by Ann Barr and Paul Levy: The Official Foodie Handbook. The tagline of the book reads
“Be Modern – Worship Food.” Barr and Levy define a foodie simply as “a person who is very,
very, very interested in food” (1985, p. 6). Their book contains a timeline of historical events
that relate to the foodie world, discusses the relationship between health and food, famous
recipes, restaurants, and chefs, global food, foodie society, and many other topics, written in a
light-hearted and entertaining fashion.
A more recent contribution to the world of foodie literature comes from Johnston and
Baumann (2010) through their book Foodies: Democracy and Distinction in the Gourmet
Foodscape. The authors interviewed 30 participants on a range of topics including their personal
definition of a foodie, food media, shopping habits, cooking habits, eating out, authenticity, and
exoticism, as well as demographic information including age, ethnicity, highest educational
degree achieved occupation, and income. The authors offer a detailed history of “foodie-ism”
beginning with the 1940’s when French haute cuisine was fashionable to the present day
popularity of organic and local foods and the impact on technology on foodie culture.
Additionally, they delineated four ways that foodies can be defined: education, identity,
exploration, and evaluation. While one assumption might be that a foodie is someone who is
well educated about food or cooking, Johnston and Baumann (2010) make a distinction that
foodies usually have an interest and enthusiasm for learning about food, regardless of their

6
knowledge level. In terms of identity, a foodie incorporates food as a part of their inner-self,
whether that is through family traditions that shaped their upbringing or a lens through which
they view the world. The “exploration” characteristic often means a foodie is always trying new
foods or types of cuisines, or perhaps always trying new recipes. Finally, enjoyment is
“synonymous with evaluation of food” (Johnston and Bauman, 2010, p. 65) for foodies. They
enjoy trying new foods and the process of discussing and evaluating the food. They may have
high standards for their food, but this doesn’t necessarily mean their food needs to be expensive
or gourmet, which is also a common perception of foodies (Johnston & Baumann, 2010). The
popularity of food trucks and unique fair foods are examples of up and coming foodie culture
that shirks the idea of being expensive or gourmet (Hermosillo, 2012; Mayerowitz, 2009).
Additionally, they note that foodies are often represented as elitist, snobby, or patronizing. This
idea is supported in other literature as well (Ambrozas, 2003; Cairns, Johnston, & Baumann,
2010).
Beyond Johnston and Baumann’s book, scholarly research on foodies is somewhat
sparse. Cairns, Johnston, and Baumann (2010) investigated the role of gender in foodie culture.
Their definition of foodies is “people with a long-standing passion for eating and learning about
food but who are not food professionals” (Cairns, Johnston, and Baumann, 2010, p. 592).
Ambrozas (2003) defined a foodie as someone “whose identity is formed in some way by eating
‘good food’ and by regularly consuming a range of food related products from food magazines
and cooking television shows to highly specialized kitchen tools” (p. 13). Robinson and Getz
(2012, p.3) define a foodie as someone that has an “underlying passion, or involvement, with
food” in their study of foodies and their travel experiences (their results are discussed later in the
literature review). Ruth Bourdain (2012) notes that ‘foodies’ is “…an umbrella term for people

7
with an interest in food, cooking, and restaurants. It has come to acquire an unsavory association
with snobbishness or faddishness” (p. 25). The Merriam-Webster Online Dictionary also
includes the concept of fads in its definition of a foodie: “a person having an avid interest in the
latest food fads” (2012).
Additionally, the tourism industry itself is embracing the term, and is beginning to cater
marketing messages to self-proclaimed foodies. The Calaveras County Convention and Visitors
Bureau in California operates a website titled GoCalaverasFoodie.com. The site lists local
restaurants, food-related events, features recipes and chefs, and explains their Calaveras Grown
program for labeling local produce. The site has a page called “What is a Foodie?” which
explains the difference between a foodie and a gourmet. They define foodies as “amateurs who
simply love food for consumption, study, preparation, and news” (para. 1). They further note,
“gourmets simply want to eat the best food, whereas foodies want to learn everything about food,
both the best and the ordinary, and about the science, industry, and personalities surrounding
food” (para. 1). In short, foodies have various hobbies within the food realm
(GoCalaverasFoodie, 2012).
The convention and visitors bureau of Asheville, North Carolina has a section of their
website dedicated to what they refer to as their “foodtopian society.” This unique food
movement intertwines local and sustainable food into daily life and is strongly propelled at the
grassroots level. Whether it is farmers markets, microbreweries, or farm-to-table restaurants,
Asheville realizes its food assets and markets them to potential visitors. Their website features
“forest to table” experiences that involve gathering edibles from the woods and learning to cook
them, the “Taste of Asheville” culinary event, culinary travel packages, and vegan and
vegetarian cooking classes. Food is an extremely important part of the Asheville community and

8
the convention and visitors bureau realizes the potential it has to attract visitors (Explore
Asheville, 2013).
While there have been attempts to define a foodie, these definitions are broad and
encompass a range of people who may be very different in their food interests and food-related
activities. A foodie might cook exclusively with produce from his or her own garden, frequent
upscale restaurants, be politically active in changing government regulations on food production,
or blog about their cooking and eating adventures. This study examines the food-related
activities and habits of the traveling public, and potential foodies, in order to identify different
dimensions of foodie activities.
2.2 Foodie Typologies
Barr and Levy (1985) developed a foodie typology that designates seven different foodies
(See Table 1). These seven types were a first attempt at classifying foodies and depict many
different food-related interests.

9
Table 1. Barr and Levy’s Foodie Types
A more recent foodie typology was published by a food writer on the Huffington Post
internet newspaper in 2011 and included ten types of foodies: Made it Myself, Organivore,
Europhile, One Upper, Snob, Anti-Snob, Avoider, Blogging Food Pornographer, Bacon Lover,
and DIYer (Do-It-Yourself-er) (Brones, 2011). The Made It Myself and the DIYer differ in the
type of product they are making. Where the Made It Myself foodie aims to impress with the
fancy dishes they can create, the DIYer makes their own granola or grows their own herbs. The
Organivore is often shopping at farmers markets and want to know exactly where their food is
coming from. The Europhile has a strong interest in European food trends. The One-Upper likes
to share the unique food experiences that they have had at any chance they get. The Snob is
extremely picky with upscale tastes, while the Anti-Snob scoffs at upscale tastes and yet still has
a specific taste in restaurants, often small diners or food trucks. The Avoider is one that latches
onto a trendy health-focused diet that avoids gluten, dairy, meat, or another specific ingredient.
Foodie Type Description
Whole-foodier Than Thou Uses only organic methods growing their own produce and flowers, slaughters their own meat, uses simple ingredients in their cooking
Squalor Scholar Cook Does their research and knows the history of their favorite foods and recipes, sticks to traditional recipes, has the academic and historical knowledge of food to set them apart from others
Made in Paris Starts off learning basic cooking techniques in small restaurants and manages to move themselves up the ranks through their connections to make a living cooking in Paris, a foodie mecca
Paris C’est un Dump Ultimate upscale foodie that spends much of their time in expensive restaurants, subscribes to important food magazines, and is extremely picky
Gorgeous East in Me Drawn to ethnic and foreign foods, constantly wants to try new things and experience new cultures through food
Foodies on Ice Regards food as artistic material, aims to impress by creating ice sculptures, elaborately decorated cakes, or butter statues
All-American Small-town foodie that searches out local food and ingredients that deserve attention, constantly attempts to improve their crops and create new dishes

10
The Blogging Food Pornographer is constantly taking pictures of something they cooked or their
meal at a restaurant and uploading them to social media. As expected, the Bacon Lover has an
obsession for anything involving the popular fried meat. The presence of this article on the
Huffington Post, a popular source of news on the Internet, demonstrates that the trend of foodie
culture has continued to grow and develop since The Official Foodie Handbook was released two
decades ago.
Taking an even lighter approach, Ruth Bourdain’s book Comfort Me with Offal (2012)
contains an extensive guide to modern foodies with 85 types. Table 2 features a few examples.
Table 2. Examples of Bourdain’s Foodie Types
While Bourdain’s categories of foodies is devoid of empirical support and was developed
for entertainment purposes only, it is offered here as a testament to the increased presence of
popular literature about foodies, and to emphasize the uniqueness of a research-based description
of dimensions of foodie activities.
2.3 Food in Tourism
Food is an important part of the tourist experience. However, a growing number of
visitors are traveling with the principal motivation of food or food-related activities and upwards
Foodie Type Description
Chefestants Culinary contestants vying for fame and cash prizes on television reality cooking shows
Coffeegeeks A species of highly caffeinated humans with an unhealthy addiction to coffee, brewing techniques, and coffee-making equipment and gear
Dining Digerati Recently evolved species of gastronomes who communicate in the form of blog posts, tweets, and message-board posting
Locapours Individuals who seek to drink only wine, beer, and spirits produced locally
Pizzaratti These pizza snobs are on the eternal quest for pizza perfection and endlessly debate the merits of various types of pizza crust, cheese, sauce, and toppings

11
of 25% of all tourist spending is on food (Green & Dougherty, 2009; Quan & Wang, 2004;
Sánchez-Cañizares & López-Guzmán, 2012). In 2004, Long defined culinary tourism as “the
intentional, exploratory participation in the foodways of an other – participation including the
consumption, preparation, and presentation of a food item, cuisine, meal system, or eating style
considered to belong to a culinary system not one’s own” (Long, 2004, p. 21). This phenomenon
has other names, including food tourism, gastronomic tourism, and gourmet tourism (Okumus,
Okumus, & McKercher, 2007; Sánchez-Cañizares & López-Guzmán, 2012).
Quan and Wang (2004) attempted to build a model of the tourist experience using food as
an example. They discuss the difference between the peak experience and the supporting
experiences that make up tourism. The peak experience is the primary reason one is traveling,
and is most often studied in social science literature. The supporting experience is usually
studied in marketing and management literature and involves such experiences as lodging, food,
and transportation. While these are complementary to the peak experience, they are extremely
important to ensuring that the visitor is satisfied with their visit. If the visitor has a poor
experience with hotel and meals, they may not be satisfied with their visit, even if the peak
attraction was rewarding (Quan & Wang, 2004). Food is a valuable aspect of the tourism
experience to study, as it is a part of every tourist’s supporting experience, and is the peak
experience for a growing number of culinary tourists. Even those that may travel for sightseeing
or other more mainstream tourism attractions often discover that the local food may be worth
more of their time or discover food-related attractions that capture their attention. Food
consumption habits are an extremely important part of destination marketing as it is a unique
aspect of culture (Quan & Wang, 2004).

12
Sims (2009) investigated the role of local foods in the tourism industry. Interviews with
tourists to two United Kingdom regions found that sixty percent of tourists said that they had
chosen to experience local food and beverage products. Sánchez-Cañizares and López-Guzmán
(2012) interviewed 206 visitors to ten restaurants in Córdoba, Spain about travel motivations as
related to food, and found that 68% of tourists take local cuisine in account when deciding where
to visit. There is a quest among visitors to seek out authentic experiences that provide a unique
experience to the destination, and food consumption is one way to do this (Sims, 2009). As
foodies already hold a vested interest in food, seeking out unique food products while traveling is
most likely a common trait of their travel behavior.
2.4 Profiles of Culinary Tourists
As mentioned previously, most every tourist participates in culinary experiences simply
by making the choice to consume food or beverage at the destination. However, culinary tourists
represent a niche of the tourist market that is motivated to travel for culinary purposes, and
numerous studies have been done to describe them (Ignatov & Smith, 2006; MacLaurin, Blose,
& Mack, 2007; Sánchez-Cañizares & López-Guzmán, 2012; Seery, 2010; Shenoy, 2005; Smith
& Costello, 2009; Yun, Hennessey, & Mac Donald, 2011).
Sánchez-Cañizares and López-Guzmán (2012) profiled culinary tourists based on
interviews with visitors to ten restaurants in Córdoba. They segmented the participants into three
groups: those that stated local cuisine was the principal reason for traveling; those that said local
food was important to take into account when planning a trip, but isn’t the primary reason for
traveling; and those whose food is a secondary reason to travel. The study then compared socio-
demographics and details of travel such as country of origin, reason for visit, and length of stay,
but found little difference between the segments according to education, gender, length of stay,
13
or nationality. One interesting conclusion of the study is that the culinary tourists that traveled
primarily for local cuisine were the most satisfied of all three groups with the visit and the local
food experience during the visit (Sánchez-Cañizares & López-Guzmán, 2012).
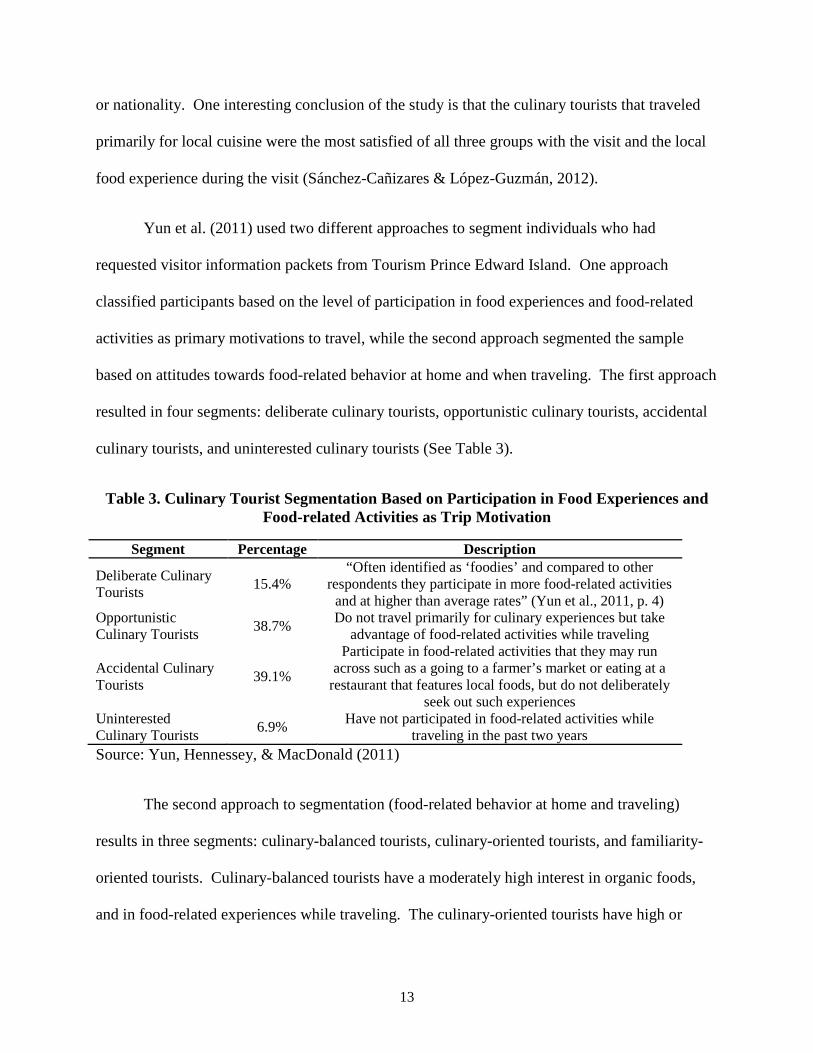
Yun et al. (2011) used two different approaches to segment individuals who had
requested visitor information packets from Tourism Prince Edward Island. One approach
classified participants based on the level of participation in food experiences and food-related
activities as primary motivations to travel, while the second approach segmented the sample
based on attitudes towards food-related behavior at home and when traveling. The first approach
resulted in four segments: deliberate culinary tourists, opportunistic culinary tourists, accidental
culinary tourists, and uninterested culinary tourists (See Table 3).
Table 3. Culinary Tourist Segmentation Based on Participation in Food Experiences and Food-related Activities as Trip Motivation
Segment Percentage Description
Deliberate Culinary Tourists
15.4% “Often identified as ‘foodies’ and compared to other
respondents they participate in more food-related activities and at higher than average rates” (Yun et al., 2011, p. 4)
Opportunistic Culinary Tourists
38.7% Do not travel primarily for culinary experiences but take
advantage of food-related activities while traveling
Accidental Culinary Tourists
39.1%
Participate in food-related activities that they may run across such as a going to a farmer’s market or eating at a
restaurant that features local foods, but do not deliberately seek out such experiences
Uninterested Culinary Tourists
6.9% Have not participated in food-related activities while
traveling in the past two years Source: Yun, Hennessey, & MacDonald (2011)
The second approach to segmentation (food-related behavior at home and traveling)
results in three segments: culinary-balanced tourists, culinary-oriented tourists, and familiarity-
oriented tourists. Culinary-balanced tourists have a moderately high interest in organic foods,
and in food-related experiences while traveling. The culinary-oriented tourists have high or

14
moderately high interest in the previously mentioned categories, as well as cooking and
wine/beer related experiences. The familiarity-oriented tourists are more likely than the other
segments to participate in food experiences that are familiar to them. This study also investigates
the relationship between the two approaches of segmentation. They found that culinary-balanced
tourists were more likely to be opportunistic and accidental culinary tourists, which means they
tend to take advantage of culinary experiences while traveling, but balance them with other
activities. Culinary-oriented tourists were most likely to be deliberate and opportunistic culinary
tourists who often build culinary experiences into their trip, as well as participate in experiences
they encounter during the trip. Finally, familiarity-oriented tourists were found to be mostly
accidental and uninterested culinary tourists, whom despite a lack of interest, may participate in
culinary experiences if they happen upon them (Yun et al., 2011).
The current study aims to move away from studying the culinary tourist and focus on the
general traveling publics with specific attention being paid to their interest in food-related
activities, at home and while traveling. Market segmentation is used in many fields but within
the realm of tourism, it has been used to segment a wide range of tourism activities, from
Wyoming snowmobilers to potential ecotourists in Scotland (May, Bastian, Taylor, & Whipple,
2001; Zografos & Allcroft, 2007). While segmentation studies often include demographic
questions, it is commonly accepted that it is better to segment based on psychographic factors or
involvement in order to investigate tourist behavior (Johns & Gyimóthy, 2002). González and
Bello (2002) characterize two principal methodologies used in market segmentation of tourists.
The first classifies visitors based on general lifestyle choices and the second focuses on lifestyle
choices pertaining only to the product being investigated. They argue that “market segmentation

15
by general lifestyle would allow more in-depth awareness of variables influencing consumers’
behavior” (González & Bello, 2002, p. 57).
While many of the segmentation studies in the literature related to food and tourists are
based on food-related travel motivations, this study aims for a more general approach, based on
lifestyles related to food at home, as well as while traveling. However, these may or may not be
similar, as many tourists bring their habits from home with them when they travel (Quan &
Wang, 2004). The literature on culinary tourists is growing, but there is no analysis of the
traveling public based on their involvement with food while at home.
2.5 Food-Activity Involvement
There are a plethora of studies within the tourism literature that focus on involvement as
it relates to consumers’ search for products as well as their purchasing decisions. Kyle and
Chick (2002) describe involvement as “the degree to which a person devotes him or herself to an
activity or associated product.” Previous research has found that producing involvement profiles
is a valid method of finding distinct target markets (Kyle, Kerstetter, & Guadagnolo, 2002). For
destination marketing organizations that focus their marketing based on customer needs and
desires, involvement is an important issue to consider. Food and food-related activities are key
products marketed to tourists and therefore, food involvement should be considered in marketing
destinations.
This study uses involvement with food-related activities as a way to investigate how
demographics and travel behaviors vary among foodie activity dimensions. Bell and Marshall
(2003) constructed a food involvement scale (Table 4) to investigate whether participants highly
involved with food could discriminate between food samples better than those less involved.

16
Bell and Marshall (2003) used Goody’s five stages of the life cycle of food to create their scale.
The five stages are acquisition, preparation, cooking, eating, and disposal (Goody, 1982). They
asked 30 participants to come up with statements that reflected each stage in terms of food
involvement, and created their scale based on those responses. The participants were lab
employees, public health graduate students, and military academy undergraduate students.
Table 4. Bell and Marshall’s Food Involvement Scale
Food involvement scale item 1. I don’t think much about food each day. 2. Cooking or barbequing is not much fun. 3. Talking about what I ate or am going to eat is something I like to do. 4. Compared with other daily decisions, my food choices are not very important. 5. When I travel, one of the things I anticipate most is eating the food there. 6. I do most or all of the clean up after eating. 7. I enjoy cooking for others and myself. 8. When I eat out, I don’t think or talk much about how the food tastes. 9. I do not like to mix or chop food. 10. I do most or all of my own food shopping. 11. I do not wash dishes or clean the table. 12. I care whether or not a table is nicely set.
Bell and Marshall (2003) concluded that the scale has reliability through a test and retest
method with two samples of respondents. Items with low item-total correlations or low face
validity were removed, leaving the final scale with 20 items. They emphasized that food
involvement is important in many food choice behaviors, beyond taste discrimination, and
declared that further research in food choice behavior should consider food involvement. Yun et
al. (2011) also note that food-related behavior of tourists helps marketing agencies target specific
groups of consumers, e.g. culinary tourists.
2.6 Foodie Travel Behavior
Robinson and Getz (2012) performed a study about foodies and their travel experiences.
They based their study on the assumption that foodies are travelers who look for and participate

17
in food tourism experiences. The survey instrument itself was developed from a food
involvement scale Robinson and Getz developed based on a leisure involvement scale by Kyle,
Absher, Norman, Hammitt, and Jodice (2007) and Goody’s life cycle of food (1982). The online
survey, targeting Australians who consider themselves foodies, asked about involvement in food
related activities, food related events, travel activities, and demographics; over 700 responses
were received (Robinson and Getz, 2012). The majority of the sample was females, under the
age of 40, well educated, and affluent. The results indicated that there were high levels of food
involvement among the respondents. Just over one third (34%) of participants subscribed to or
regularly purchased food magazines. About one-fifth (19%) participated in online food blogs or
communities, while 6% of participants belonged to a food club and 11% belonged to a wine club.
As far as travel behavior is concerned, one third of respondents (33%) were planning a domestic
food travel experience within the next year (Robinson & Getz, 2012). Table 5 shows the highest
food involvement items from the survey.
Table 5: Robinson and Getz Highest Ranking Food Involvement Scale Items (n=541)
Note: 1 = strongly disagree and 7 = strongly agree
Item Mean* Standard Deviation
I really hate having a bad meal experience 6.26 1.209 I like to experiment with food from different cultures 5.87 1.227 Being careful not to waste food is important to me 5.83 1.118 My special family occasions are often marked with a truly great meal
5.76 1.212
A well equipped kitchen is important to me 5.73 1.145 Table etiquette says a lot about a person 5.63 1.271 Nothing satisfies me more than eating a splendid meal 5.60 1.378 Dining out is one of the most enjoyable things I do 5.60 1.287 My kitchen and equipment are always clean 5.59 1.370 Sharing memorable dining experiences bonds me with my friends
5.58 1.199

18
The most popular food-related events respondents participated in were farmers markets,
ethnic or cultural festivals, wine or food tasting events, food-themed festivals, and visiting very
expensive restaurants. These results suggest that foodies enjoy activities in which they are
actively participating (Robinson and Getz, 2012). When asked about their preferred Australian
destination food-related experiences, the most preferred experience is “enjoying authentic
regional cuisine in local restaurants.” The following results support the idea that the respondents
like to participate in active experiences, and show a preference for cultural attractions (Robinson
and Getz, 2012). Robinson and Getz’s (2012) study is unique as it investigates self-designated
foodies and their interests in food tourism whereas most research studies designated food
tourists.
2.7 Summary of Literature Review
In today’s world of technology, one can “travel” around the world from the comfort of
their living room via television and the Internet. However, the tastes and smells of local foods
are something that must be experienced firsthand. The Official Foodie Handbook proclaims that
“this is why Foodies, above all people, love travel” (Barr & Levy, 1985, p. 80). There remains a
significant gap in the academic literature regarding foodies. A research-supported framework of
foodie activity dimensions has yet to be developed. The varying travel behavior of people with
different levels of interest in dimensions of food activities also has yet to be investigated.
According to Quan and Wang, “…it is necessary to segment markets of tourists in terms of their
different food habits and preferences” (2004, p. 302). This study aims to fill those gaps.

3. METHODS
3.1 Description of Sample
The population for this study is individuals that have demonstrated an interest in visiting
Minneapolis. The sampling frame is made up of people who have made an inquiry for travel
information to the Meet Minneapolis Convention and Visitors Bureau. This study’s intent is to
investigate the general traveling public, therefore participants were included in the results even if
they did not end up visiting Minneapolis.
3.2 Survey Development and Distribution
The instrument used (Appendix A) was based on a previously validated survey developed
and tested on four smaller populations (Green & Kline, 2012; Green & Kline, 2013). While this
instrument was used as a foundation for the current study, the items on the scale were refined
based on the above literature, and questions about last vacation or getaway were added.
The first section of the survey instrument asks the participant to rate themselves on a
foodie scale from ten to zero, ten being a ‘total foodie’ and zero meaning ‘not a foodie at all’.
For this question the following definition of the term ‘foodie’ was developed and offered:
‘A “foodie” is someone who has strong interest in food. A foodie might be interested in
eating high quality food, cooking with local foods or trying new recipes, following trends in
nutrition, restaurants, chefs, or food, or traveling to try new foods or drinks.’
Following that, 58 food-related activities were listed using the phrase ‘I enjoy
participating in…’; respondents were asked to rate their level of agreement with each. The
response choices (strongly agree, agree, somewhat agree, somewhat disagree, disagree, strongly
disagree) were based on a 6-point Likert scale, with an additional “No opinion” option. Studies
have found that a 6-point scale has high reliability and is suitable for research with many

20
variables such as this one as six is not enough to overwhelm the participant with too many
response options (Chomeya, 2010; Green & Rao, 1970). An even number of points forces
respondents to have an opinion, which encourages deeper processing of the item and minimizes
social desirability bias (Smyth et al., 2006; Garland, 1991). The items on the questionnaire that
were not included on the original instrument are listed in Table 6.
Table 6. Items Added to or Changed from Previous Instrument
The second section of the survey instrument investigated seven aspects of the participants
food-related travel behavior using the same question format as described above. The third
section asked questions about their last leisure vacation and included questions about their length
of stay, primary purpose of travel, number in the travel party, type of lodging utilized, method of
travel to destination, tools used to plan the trip, and an approximation of expenditures on
lodging, food, activities, and transportation (Stynes & White, 2006; Etzel & Woodside, 1982;
Leeworthy, English, & Kriesel, 2001; Long & Perdue, 1990). Finally, the last part of the survey
included questions about socio-demographics including age, gender, household income, and zip
code or country of origin (Sánchez-Cañizares & López-Guzmán, 2012; Robinson & Getz, 2012).
The instrument was piloted with 12 students in a graduate-level sustainable tourism
course at East Carolina University and reviewed by an expert panel including faculty at East
Item Reference I regularly visit farms/orchards Yun, Hennessey, & MacDonald, 2011 I regularly shop at specialty cookware/food stores MacLaurin, Blose, & Mack, 2007 I regularly purchase locally grown and/or organic food MacLaurin, Blose, & Mack, 2007 I think about food a lot during the day Bell & Marshall, 2003 I enjoy discussing activities related to food Shenoy, 2005 Participating in activities related to food is one of the most enjoyable things I do
Shenoy, 2005
When I eat out, I think or talk a lot about how the food tastes
Bell & Marshall, 2003

21
Carolina University, staff at the Meet Minneapolis Convention and Visitors Bureau, and
members of the food service industry (see Table 7).
Table 7. Expert Panel
The survey was created on a web-based platform and a link to the survey was distributed
to 4,725 email addresses; respondents were incentivized to complete the survey through a
drawing for a two-night hotel stay at the Normandy Inn in downtown Minneapolis. A reminder
email was sent one week later, and a final email was sent one week after the first reminder (see
Appendices B-D). The survey was available from November 12, 2012 to December 5, 2012.
Name Title
Dr. Stephanie Jilcott-Pitts Assistant Professor, Department of Public Health, East Carolina University
Dr. Patrick Long Director, East Carolina University Center for Sustainable Tourism
Dr. Jason Oliver Assistant Professor, Department of Marketing and Supply Chain Management, East Carolina University
Dr. Jon Kirchoff Assistant Professor, Department of Marketing and Supply Chain Management, East Carolina University
Kevin Hanstad Director of Market Research, Meet Minneapolis Convention and Visitors Bureau
Matthew Teichert Market Research Associate, Meet Minneapolis Convention and Visitors Bureau
Jacqueline Venner Senske Operations Director, 7th Street Public Market, Charlotte, NC
Neha Shah Director of Travel and Tourism, Pittsboro-Siler City Convention and Visitors Bureau
Delia Liuzza Owner, The Tipsy Teapot, Greenville, NC

4. RESULTS
4.1 Descriptive Results
In just over three weeks of data collection, 690 usable responses were amassed, resulting
in a 14.6% response rate. Most of the respondents were women (69.5%) and between the ages of
30-39 (26.7%) and 50-59 (26.2%). The largest portion of the sample had a total household
income of $50,000-$99,999 (42.6%). The results can be seen in Table 8.
Table 8. Socio-demographic Profile of Participants
Variable Percentage of Respondents
(n=690) Gender Male 30.5% Female 69.5% Missing responses 31 Age Range 18-29 10.9% 30-39 26.7% 40-49 23.1% 50-59 26.2% 60+ 13.0% Missing responses 50 Household Income Under $25,000 7.4% $20,000-$49,999 18.6% $50,000-$99,999 42.6% $100,000-$149,999 21.5% Over $150,000 9.9% Missing responses 94
The most cited occupational category was the health care industry (11%), followed by
general business (10%) and retirees (9.3%). Table 9 displays the occupations of respondents.

23
Table 9. Occupation of Respondents
Occupational Category Percentage of Respondents Occupational Category Percentage of
Respondents Healthcare - Medical Services and Products
11% Services (retail sales, clerk, etc.)
3.8%
General Business (middle management, analyst, programmer, etc.)
10% Student 3.8%
Retired 9.3% Artistic/Crafts 2.8% Teacher/Educator 8.7% Hospitality and Recreation 2.2%
Financial Services 7.5% Skilled Trade (electrician, plumber, construction, etc.)
2.2%
Upper Management/Administrator
7.3% Manufacturing - Consumer/Industrial Goods
0.8%
Office Worker (clerical, secretary, word processor, data entry, etc.)
6.8% Real Estate Services/Property Management
0.8%
Government/Public Services 5.8% Transportation Services 0.8% Homemaker 5.2% Agricultural/Farmer 0.5% Professional/Technical 4.7% Other 1.7% Sales (salesperson, broker, etc.)
4.2%
There were 627 respondents that reported their zip code. Of those, most live in the
United States (90.0%), with the majority (63.2%) from Midwestern states and 14.8% from
Minnesota. Nearly one-eighth of respondents (12.4%) are from the Minneapolis /St. Paul metro
area.
Respondents were asked about their food consumption habits. Most respondents eat all
types of meat regularly (59.4%) or eat meat in limited portions (34.8%). A total of 7.0% of
respondents have a food intolerance or allergy. More detailed results can be seen in Table 10.

24
Table 10. Food Consumption Habits
Food Consumption Habit Percentage of Responses
I eat all types of meat regularly 59.4% I eat meat, but in limited portions 34.8% I have a food intolerance or allergy (e.g. peanut allergy, gluten intolerant)
7.0%
I am a lacto-ovo or ovo vegetarian (I eat dairy and/or eggs)
4.2%
I eat fish only 2.5% I am vegan 1.2% I eat according to a religious doctrine 0.7% Other 2.8%
Note: As respondents could select more than one answer, percentages may not add to100%.
Participants were to rank themselves on a foodie scale from 10 to 0 with 10 being a “total
foodie,” 7 being “mostly a foodie,” 4 being “somewhat a foodie,” and 0 being “not a foodie at
all.” The majority of the respondents (19.3%) rated themselves as a 3 on the foodie scale, which
is relatively low. However, other large percentages were spread along the scale: 7 (14.6%),
followed by 10 (12.3%) and 5 (11.2%) (Table 11).
Table 11. Self-reported Foodie Rating (n=690)
10 9 8 7 6 5 4 3 2 1 0 12.3% 7.5% 9.0% 14.6% 7.5% 11.2% 5.2% 19.3% 5.7% 4.5% 3.2%
Through grouping these self-reported scores, the results denote 43.4% as strong foodies (7-10),
23.9% as moderate foodies (4-6), and 32.7% as marginal foodies (0-3).
The most popular food-related activities were trying new restaurants (86.9% of
respondents agreed or strongly agreed), trying new recipes (80.1%), cooking (74.4%), attending
food and beverage festivals (71.1%), baking (68.4%), trying food from other cultures (68.0%),
grilling (66.1%), trying heritage/traditional foods (64.0%), watching the Food Network or

25
cooking shows (62.2%%), shopping at specialty cookware stores (60.8%), and visiting
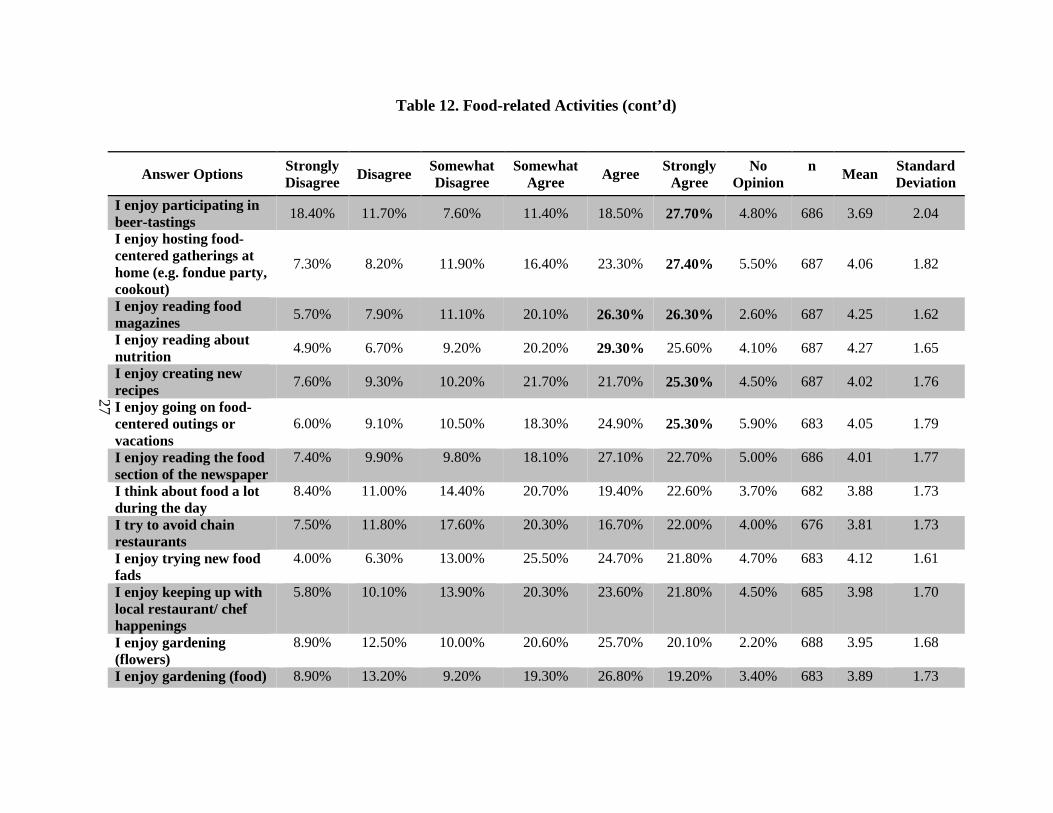
farms/orchards (60.7%) (Table 12). Respondents were also given the opportunity to list other
activities they enjoy. Several respondents reported activities related to nutrition such as avoiding
fat and sugar in their diet, or nutrition related events such as gluten-free food expos. Drink-
focused activities such as happy hours, drink fads, and bar crawls were also commonly
mentioned. Events mentioned were chocolate shows, progressive dinners, and volunteering at
food banks. Cooking-related activities listed were getting recipes from Pinterest, teaching food
classes, reading cookbooks, and participating in baked good exchanges during the holidays.

26
Table 12. Food-related Activities
Answer Options Strongly Disagree Disagree Somewhat
Disagree Somewhat
Agree Agree
Strongly Agree
No Opinion
n Mean Standard
Deviation
I enjoy trying new restaurants
0% 0.30% 1.00% 5.80% 24.90% 62.00% 6.00% 687 5.23 1.49
I enjoy trying new recipes
1.20% 1.60% 2.50% 10.10% 29.20% 50.90% 4.50% 682 5.04 1.48
I enjoy cooking 2.20% 3.10% 4.70% 13.40% 29.90% 44.50% 2.30% 688 4.92 1.40 I enjoy trying food from other cultures
1.90% 4.50% 5.60% 15.10% 27.40% 40.60% 4.80% 682 4.69 1.62
I enjoy baking 2.20% 4.90% 5.40% 16.00% 29.90% 38.50% 3.20% 689 4.72 1.51 I enjoy trying heritage/traditional foods (i.e. soul food, shrimp and grits)
4.50% 4.80% 7.00% 16.00% 26.50% 37.50% 3.60% 686 4.57 1.64
I enjoy attending food and beverage festivals
2.30% 3.30% 4.80% 16.60% 34.10% 37.00% 1.90% 687 4.82 1.36
I enjoy grilling 3.30% 3.60% 7.30% 16.60% 29.40% 36.70% 3.10% 687 4.66 1.53 I enjoy watching the Food Network or cooking shows
6.00% 6.30% 6.00% 14.60% 26.50% 35.70% 5.10% 687 4.41 1.79
I enjoy participating in wine-tastings
11.70% 9.00% 5.70% 14.00% 19.20% 35.40% 5.10% 687 4.11 1.97
I enjoy shopping at specialty cookware stores
4.80% 4.50% 6.40% 18.80% 29.20% 31.60% 4.70% 686 4.44 1.67
I enjoy attending county/state fairs to eat “fair food”
8.70% 6.80% 9.70% 18.00% 23.40% 29.30% 4.10% 689 4.16 1.79
I enjoy visiting farms/orchards
3.20% 3.50% 6.70% 22.50% 31.50% 29.20% 3.50% 689 4.53 1.50
27
Table 12. Food-related Activities (cont’d)
Answer Options Strongly Disagree Disagree Somewhat
Disagree Somewhat
Agree Agree
Strongly Agree
No Opinion
n Mean Standard
Deviation
I enjoy participating in beer-tastings
18.40% 11.70% 7.60% 11.40% 18.50% 27.70% 4.80% 686 3.69 2.04
I enjoy hosting food-centered gatherings at home (e.g. fondue party, cookout)
7.30% 8.20% 11.90% 16.40% 23.30% 27.40% 5.50% 687 4.06 1.82
I enjoy reading food magazines
5.70% 7.90% 11.10% 20.10% 26.30% 26.30% 2.60% 687 4.25 1.62
I enjoy reading about nutrition
4.90% 6.70% 9.20% 20.20% 29.30% 25.60% 4.10% 687 4.27 1.65
I enjoy creating new recipes
7.60% 9.30% 10.20% 21.70% 21.70% 25.30% 4.50% 687 4.02 1.76
I enjoy going on food-centered outings or vacations
6.00% 9.10% 10.50% 18.30% 24.90% 25.30% 5.90% 683 4.05 1.79
I enjoy reading the food section of the newspaper
7.40% 9.90% 9.80% 18.10% 27.10% 22.70% 5.00% 686 4.01 1.77
I think about food a lot during the day
8.40% 11.00% 14.40% 20.70% 19.40% 22.60% 3.70% 682 3.88 1.73
I try to avoid chain restaurants
7.50% 11.80% 17.60% 20.30% 16.70% 22.00% 4.00% 676 3.81 1.73
I enjoy trying new food fads
4.00% 6.30% 13.00% 25.50% 24.70% 21.80% 4.70% 683 4.12 1.61
I enjoy keeping up with local restaurant/ chef happenings
5.80% 10.10% 13.90% 20.30% 23.60% 21.80% 4.50% 685 3.98 1.70
I enjoy gardening (flowers)
8.90% 12.50% 10.00% 20.60% 25.70% 20.10% 2.20% 688 3.95 1.68
I enjoy gardening (food) 8.90% 13.20% 9.20% 19.30% 26.80% 19.20% 3.40% 683 3.89 1.73

28
Table 12. Food-related Activities (cont’d)
Answer Options Strongly Disagree Disagree Somewhat
Disagree Somewhat
Agree Agree
Strongly Agree
No Opinion
n Mean Standard
Deviation I enjoy participating in community/church potlucks
9.60% 9.50% 12.40% 17.20% 23.90% 18.30% 9.20% 687 3.64 1.92
I enjoy eating at food trucks
10.70% 8.60% 10.90% 22.20% 20.60% 18.10% 8.90% 689 3.61 1.90
I enjoy attending cooking classes
7.60% 12.20% 13.70% 19.20% 21.00% 17.30% 8.90% 686 3.59 1.86
I enjoy keeping up with sustainable agriculture happenings
9.60% 11.50% 16.70% 24.70% 15.70% 13.50% 8.40% 689 3.41 1.78
I enjoy reading food blogs
11.40% 15.60% 16.40% 21.60% 17.50% 12.70% 4.70% 684 3.42 1.71
I enjoy following state or national food issues
9.20% 12.20% 13.00% 24.60% 18.30% 12.40% 10.20% 683 3.37 1.84
I enjoy taking photos of food 19.00% 19.00% 14.10% 12.70% 10.80% 12.30% 12% 683 2.78 1.91
I enjoy participating in wine or beer clubs 18.90% 16.70% 13.40% 13.50% 12.90% 11.90% 12.60% 688 2.83 1.94
I enjoy organic gardening
13.30% 15.80% 11.40% 19.80% 19.20% 11.30% 9.20% 683 3.22 1.86
I enjoy participating in Community Supported Agriculture
13.40% 14.50% 13.60% 14.30% 14.60% 11.10% 18.50% 685 2.80 2.01
I enjoy posting on social media about food 23.20% 19.10% 10.70% 12.50% 12.50% 10.10% 11.90% 681 2.67 1.90
I enjoy seeing movies about sustainable food (Food Inc., Fresh, Fast Food Nation, King Korn, etc.)
13.10% 15.90% 15.10% 19.20% 14.30% 9.90% 12.50% 687 2.98 1.86

29
Table 12. Food-related Activities (cont’d)
Answer Options Strongly Disagree Disagree Somewhat
Disagree Somewhat
Agree Agree Strongly Agree
No Opinion
n Mean Standard
Deviation I enjoy participating in dinner clubs
13.20% 16.90% 15.10% 16.70% 12.20% 9.60% 16.30% 688 2.78 1.91
I enjoy canning fruits or vegetables
19.80% 18.20% 14.00% 14.10% 12.50% 8.70% 12.80% 688 2.69 1.86
I enjoy reading books about sustainable food (Omnivore's Dilemma, Animal Vegetable Miracle, Slow Food)
15.70% 19.00% 16.30% 16.40% 8.90% 7.40% 16.30% 688 2.57 1.81
I enjoy attending food competitions
14.90% 18.70% 17.10% 16.00% 11.40% 7.30% 14.70% 686 2.68 1.81
I enjoy being politically active on food issues
14.40% 19.80% 16.90% 18.30% 10.60% 6.60% 13.40% 687 2.70 1.76
I enjoy participating in Community Supported Fisheries
17.10% 17.70% 14.20% 11.00% 8.60% 5.80% 25.50% 689 2.17 1.86
I enjoy volunteering at farm/orchard tours
16.10% 18.60% 20.40% 10.40% 5.90% 5.70% 23.00% 683 2.19 1.76
I enjoy seed-saving of heirloom varieties
17.40% 23.90% 13.50% 13.60% 11.60% 5.60% 14.50% 683 2.51 1.76
I enjoy participating in food or recipe competitions/ contests
18.90% 22.90% 19.90% 12.20% 6.10% 4.70% 15.30% 687 2.32 1.64
I enjoy attending food industry meetings
13.40% 20.30% 19.40% 13.40% 9.50% 4.50% 19.50% 686 2.40 1.75
I enjoy attending sustainable agriculture events/meetings
13.60% 18.40% 18.20% 16.40% 9.80% 4.10% 19.50% 683 2.44 1.76
I enjoy contributing to food blogs
25.70% 26.20% 17.60% 9.90% 6.00% 3.80% 10.70% 680 2.24 1.54

30
Table 12. Food-related Activities (cont’d)
Participants were also asked about their food-related travel behavior (Table 13). The most popular activities were seeking
out locally-owned restaurants while on a vacation or getaway (70.6% of respondents agreed or strongly agreed), seeking out special
types of food products while on a vacation or getaway (58.7%), seeing out local drink products while on a vacation or getaway
(57.1%), traveling more than 50 miles to attend a food/beverage festival (45.0%), and seeking out special types of food experiences
while on a vacation or getaway (44.9%).
Answer Options Strongly Disagree Disagree Somewhat
Disagree Somewhat
Agree Agree Strongly Agree
No Opinion
n Mean Standard
Deviation I enjoy participating in slow food groups
16.80% 17.90% 14.90% 10.30% 5.80% 3.60% 30.60% 686 1.90 1.75
I enjoy raising livestock for my own consumption
40.30% 20.90% 10.20% 4.50% 3.90% 3.30% 16.80% 689 1.70 1.47
I enjoy learning specialty butchering techniques
40.10% 21.80% 9.40% 7.00% 5.10% 2.20% 14.40% 688 1.78 1.45

31
Table 13. Food-related Travel Behavior
Answer Options Strongly Disagree Disagree Somewhat
Disagree Somewhat
Agree Agree Strongly Agree
No Opinion
n
Mean Standard Deviation
I seek out locally-owned restaurants while on a vacation or getaway
2.8% 3.6% 3.6% 16.7% 28.8% 41.8% 2.6% 687 4.83 1.46
I seek out local drink products (wine, beer, mead, moonshine, cider, colas, ades) while on a vacation or getaway
9.6% 10.6% 5.7% 14.8% 25.7% 31.4% 2.2% 688
4.24 1.78
I seek out special types of food products (local, artisanal, heritage) while on a vacation or getaway
5.2% 9.0% 6.8% 18.0% 28.3% 30.4% 2.3% 690
4.39 1.62
I seek out special types of food experiences (cooking class, farm tour, wine tasting) while on a vacation or getaway
7.7% 11.9% 12.6% 19.8% 22.2% 22.7% 3.1% 688
3.96 1.71
I would travel more than 50 miles to attend a food/beverage festival
9.1% 13.9% 11.5% 19.3% 24.5% 20.5% 1.2% 689 3.94 1.66
I consider food when deciding where to vacation
7.5% 15.7% 13.4% 22.1% 23.9% 15.7% 1.7% 689 3.81 1.60
I look for restaurants that serve organic food while on a vacation or getaway
11.3% 17.4% 16.3% 22.5% 11.8% 13.2% 7.4% 688
3.23 1.77

32
The final section of descriptive results reflected information about the respondent’s last
vacation or getaway. The first question asked the respondent to report the destination of their
last vacation. The results of this question are divided into three categories: states and Canadian
provinces, Minnesota destinations, and international. Minneapolis had the overall highest
number of response (n=157). California (n=34), Florida (n=33), Wisconsin (n=33), and Illinois
(n=28) had the highest responses among states and provinces. The Caribbean (n=4), France
(n=4), and Ireland (n=3) were the most popular international destinations.
Half of the trips lasted 2-4 days (50.1%), and just under one-third lasted 5-7 days
(29.3%). The majority of respondents had 2 people in their travel party (48.1%). Most
respondents stayed in a hotel (74.5%), while 15.4% stayed with friends and relatives. The
majority of respondents used a personal vehicle to travel to their destination (52.8%), and 39.7%
used an airplane. Participants were able to choose more than one response for lodging and
method of travel used, so percentages may not add to 100%. More detailed results about
respondents’ vacations can be found in Table 14.

33
Table 14. Profile of Last Vacation
Variable Percentage of Responses
Length of Trip One day (no overnight) 2.9% 2-4 days 50.1% 5-7 days 29.3% 7-14 days 14.6% 14+ days 4.7% Number of People in Party One 9.8% Two 48.1% Three 12.9% Four 14.7% 5 or more 14.5% Number of Adults in Party One 12.8% Two 61.4% Three 9.4% Four 9.2% 5 or more 7.2% Type of Lodging Utilized* Hotel 74.5% Stayed with friends or relatives 15.4% Rental property (i.e. cabin, condo) 8.6% Bed and Breakfast 5.2% Camping 2.3% RV 0.7% Other 4.9% Method of Travel* Personal Vehicle 52.8% Airplane 39.7% Rental Car 12.8% Train 4.3% Bus 4.2% Other 3.0%
Note: Percentages do not add up to 100%.
Respondents were also asked to estimate their expenditures during their last vacation
within the categories of transportation, lodging, food and beverages, shopping, activities and
entertainment, and other. The total expenditures were dived by the number of people in the
travel party to calculate the expenditures per person. The average total expenditures per party

34
and per person can be seen in Table 15. Transportation was the category with the highest
average expenditure ($693.71), closely followed by lodging ($668.56).
Table 15. Average Expenditures on Last Vacation
Category Average Amount per Party Average Amount per Person Transportation $693.71 $285.42 Lodging $668.56 $259.95 Food/Beverages $430.12 $175.30 Shopping $317.07 $86.84 Activities/Entertainment $227.15 $120.38 Other $155.00 $29.42 Total Trip $2355.68 $995.64
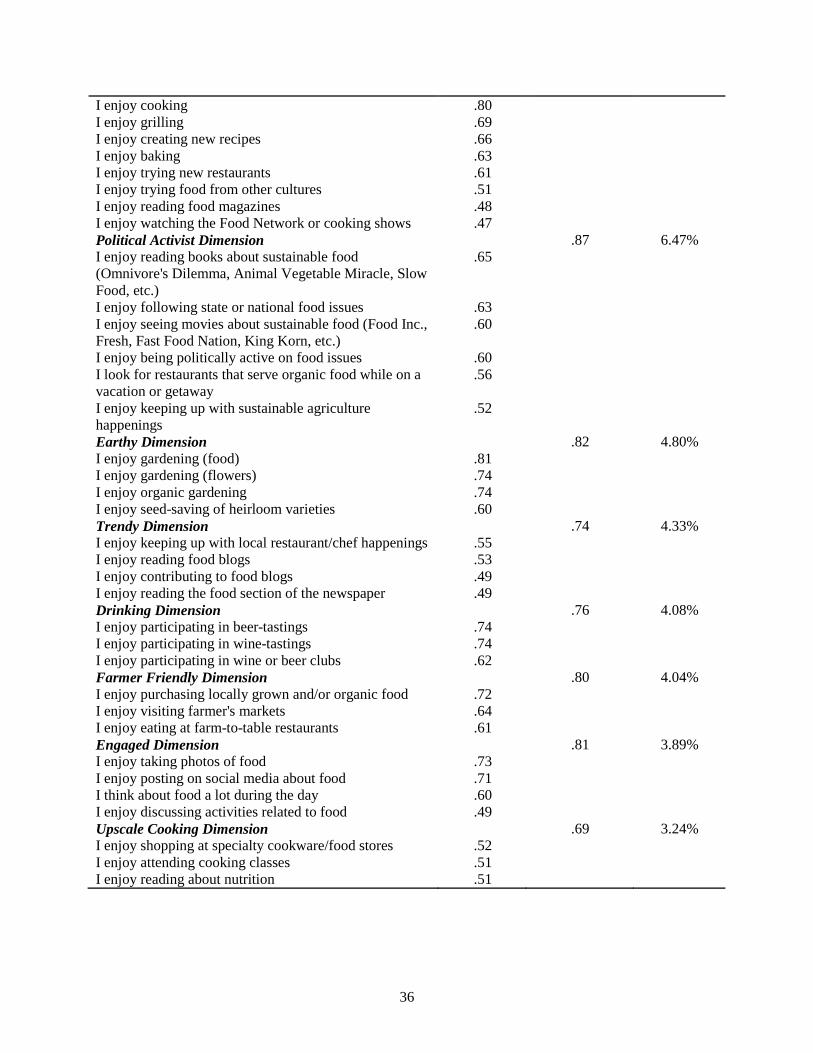
4.2 Foodie Activity Dimensions
Data were analyzed in SPSS version 20. To address the first research question, ‘Can
foodie activities be factored into activity dimensions?’, exploratory factor analysis was
performed using pairwise exclusion for missing data. The KMO value was checked to ensure it
was at a level of .6 or above; the initial factor solution had a KMO value of .933. Additionally,
the Bartlett’s Test of Sphericity value was checked to be sure it was significant (.05 or less). The
strengths of the inter-item correlations were investigated to ensure factor analysis was
appropriate. The majority of the correlations fell between .2 and .7 indicating an appropriate
level of correlation for factor analysis (Pallant, 2006). After examining the scree plot, the
eigenvalues of the initial solution, and face value of the factors, Varimax rotation was used to
preform further exploratory analysis and the ten-factor solution was chosen as the best result.
Reliability was calculated for each factor by finding the Cronbach’s Alpha based on standardized
items (Table 16). The ten factors explain 58.72% of the variance.

35
Table 16. Descriptions, Factor Loadings, Reliability Coefficients, and Variance Explained for Foodie Activity Dimensions
Foodie Activity Dimension
Factor Loading
Score
Cronbach’s Alpha based
on standardized
items
Variance Explained
Sustainable Agriculture Dimension I enjoy raising livestock for my own consumption I enjoy learning specialty butchering techniques I enjoy participating in Community Supported Fisheries I enjoy volunteering at farm/orchard tours I enjoy participating in food or recipe competitions/contests I enjoy attending food industry meetings I enjoy attending sustainable agriculture events/meetings I enjoy participating in slow food groups I enjoy attending food competitions I enjoy participating in Community Supported Agriculture I enjoy canning fruits or vegetables I enjoy home-brewing I enjoy participating in dinner clubs
.70 .69 .67 .67 .67
.63 .63 .61 .59 .54
.53 .49 .46
.90 10.29%
Adventure Dimension I seek out special types of food products (local, artisanal, heritage) while on a vacation or getaway I would travel more than 50 miles to attend a food/beverage festival I enjoy trying heritage/traditional foods (i.e. soul food, shrimp and grits) I seek out special types of food experiences (cooking class, farm tour, wine tasting) while on a vacation or getaway I seek out locally-owned restaurants while on a vacation or getaway I consider food when deciding where to vacation I enjoy attending food and beverage festivals I seek out local drink products (wine, beer, mead, moonshine, cider, colas, ades) while on a vacation or getaway I enjoy attending county/state fairs to eat “fair food” I enjoy eating at food trucks I enjoy going on food-centered outings or vacations
.72
.69
.69
.67
.65
.65
.62
.60
.51 .480 .47
.89 9.60%
Home Cooking Dimension I enjoy trying new recipes
.81
.87 7.98%
36
I enjoy cooking I enjoy grilling I enjoy creating new recipes I enjoy baking I enjoy trying new restaurants I enjoy trying food from other cultures I enjoy reading food magazines I enjoy watching the Food Network or cooking shows
.80
.69
.66
.63
.61
.51
.48
.47 Political Activist Dimension I enjoy reading books about sustainable food (Omnivore's Dilemma, Animal Vegetable Miracle, Slow Food, etc.) I enjoy following state or national food issues I enjoy seeing movies about sustainable food (Food Inc., Fresh, Fast Food Nation, King Korn, etc.) I enjoy being politically active on food issues I look for restaurants that serve organic food while on a vacation or getaway I enjoy keeping up with sustainable agriculture happenings
.65
.63
.60
.60
.56
.52
.87 6.47%
Earthy Dimension I enjoy gardening (food) I enjoy gardening (flowers) I enjoy organic gardening I enjoy seed-saving of heirloom varieties
.81 .74 .74 .60
.82 4.80%
Trendy Dimension I enjoy keeping up with local restaurant/chef happenings I enjoy reading food blogs I enjoy contributing to food blogs I enjoy reading the food section of the newspaper
.55 .53 .49 .49
.74 4.33%
Drinking Dimension I enjoy participating in beer-tastings I enjoy participating in wine-tastings I enjoy participating in wine or beer clubs
.74 .74 .62
.76 4.08%
Farmer Friendly Dimension I enjoy purchasing locally grown and/or organic food I enjoy visiting farmer's markets I enjoy eating at farm-to-table restaurants
.72 .64 .61
.80 4.04%
Engaged Dimension I enjoy taking photos of food I enjoy posting on social media about food I think about food a lot during the day I enjoy discussing activities related to food
.73 .71 .60 .49
.81 3.89%
Upscale Cooking Dimension I enjoy shopping at specialty cookware/food stores I enjoy attending cooking classes I enjoy reading about nutrition
.52 .51 .51
.69 3.24%

37
There were 5 items removed from the scale due to low factor loading scores and/or cross
loading (Garson, 2012). These items can be seen in Table 17.
Table 17. Items Excluded from Scale
Item Reason for Exclusion I enjoy participating in community/church potlucks Low loading score I enjoy trying new food fads Low loading score/cross loading I enjoy hosting food-centered gatherings at home (e.g. fondue party, cookout)
Low loading score
I try to avoid chain restaurants Low loading score I enjoy visiting farms/orchards Low loading score/cross loading
The Sustainable Agriculture dimension consists of 13 items, which is the largest of the
factors, and explains 10.29% of the variance of the model. This dimension includes educational
activities focused on sustainable food, buying from local farms, and being involved with food
production, such as butchering or canning. The Adventure factor includes eleven items and
explains 9.60% of the variance of the model. This dimension involves seeking unique food
experiences and spending money on local food or beverage products and locally owned
restaurants while traveling. The Home Cooking dimension consists of nine items and explains
7.98% of the variance of the model. This dimension includes making food in various methods
such as grilling and baking, as well as trying/creating new recipes. There are six items making
up the Political Activist dimension, which explains 6.47% of the variance of the model,
involving activities focused on learning about, following, and/or being politically involved in
current food issues. The Earthy dimension consists of four items and explains just under 5% of
the variance. This dimension consists of gardening-related activities. The Trendy dimension
consists of four items, explains 4.33% of the variance of the model, and focuses on being
informed and up to date on restaurant and chef happenings and food blogs. The Drinking

38
dimension consists of three items that focus on wine and beer experiences and explains just over
4% of the variance of the model. The Farmer Friendly dimension contains three items and
explains just over 4% of the variance of the model. The dimension centers on activities
involving consuming food from local producers. The Engaged dimension, explaining 3.89% of
the model variance, includes four activities that relate to sharing food experiences with others,
whether through photos, social media, or talking. Finally, the Upscale Cooking dimension
contains three items, explains 3.24% of the model variance, and consists of activities that involve
investing in cooking-related things such as specialty cookware or cooking classes. Factor means
were calculated for each dimension and can be seen in Table 18.
Table 18. Factor Means and Standard Deviations
4.3 Socio-demographic Test Results
The second research question addressed the socio-demographic differences of the
respondents with varying foodie activity dimension scores. The socio-demographic
characteristics investigated were gender, age, and household income. Skewness and kurtosis
were investigated to ensure normality of data. Skew and kurtosis values should normally fall
between -2 and 2, however -3 to 3 is also acceptable (Garson, 2012). The skewness and kurtosis
Foodie Activity Dimension Mean Standard Deviation
Sustainable Agriculture Dimension 2.29 1.17 Adventure Dimension 4.20 1.14 Home Cooking Dimension 4.63 1.10 Political Activist Dimension 3.03 1.40 Earthy Dimension 3.37 1.43 Trendy Dimension 3.38 1.25 Drinking Dimension 3.53 1.64 Farmer Friendly Dimension 4.44 1.37 Engaged Dimension 3.26 1.46 Upscale Cooking Dimension 4.08 1.36

39
values of the dimensions and variables all fell between -3 and 3.. Therefore, the assumption of
normality was met and parametric tests were used.
4.3.1 Gender
An independent samples t-test was used to compare gender in each foodie activity
dimension. The means and standard deviations for gender for each dimension can be seen in
Table 19.
Table 19. Means and Standard Deviations of Genders
Gender
Female (n=458)
Male (n=201)
Foodie Activity Dimension M SD M SD Sustainable Agriculture Dimension 2.29 1.18 2.24 1.14 Adventure Dimension 4.10 1.13 4.37 1.15 Home Cooking Dimension 4.58 1.05 4.76 1.16 Political Activist Dimension 2.93 1.39 3.21 1.40 Earthy Dimension 3.36 1.45 3.37 1.38 Trendy Dimension 3.33 1.22 3.46 1.30 Drinking Dimension 3.49 1.63 3.57 1.67 Farmer Friendly Dimension 4.35 1.37 4.58 1.32 Engaged Dimension 3.24 1.43 3.24 1.51 Upscale Cooking Dimension 4.01 1.38 4.21 1.32
The assumptions of independence and normality were met. The assumption of equal
variance was investigated through a Levene’s Test for Equality of Variances. None of the F
values were significant at the p<.05 level; therefore, equal variances were assumed. The
Adventure, Political Activist, and Farmer Friendly dimensions were significant at the p<.05 level
(Table 20).

40
Table 20. T-test Statistics for Gender
Within the Adventure dimension, the mean score for males (M=4.37, SD=1.15) was
significantly higher than the mean score for females (M=4.10, SD=1.13). Within the Political
Activist dimension, the mean score for males (M=3.21, SD=1.40) was significantly higher than
the mean score for females (M=2.93, SD=1.39). Within the Farmer Friendly dimension, the
mean score for males (M=4.58, SD=1.32) was significantly higher than the mean score for
females (M=4.35, SD=1.37).
4.3.2 Age
One-way Analysis of Variance (ANOVA) was used to investigate differences among age
groups within the foodie activity dimensions. The means and standard deviations are reported
in Table 21.
Foodie Activity Dimension
t Statistic
Degrees of Freedom Significance
Sustainable Agriculture .43 657 .664 Adventure -2.84 657 .005 Home Cooking -1.89 657 .059 Political Activist -2.38 657 .017 Earthy -.07 657 .944 Trendy -1.25 657 .211 Drinking -.56 657 .576 Farmer Friendly -2.03 657 .043 Engaged .05 657 .961 Upscale Cooking -1.71 657 .088

41
Table 21. Means and Standard Deviations of Age Ranges
Age Range
18-29 (n=70)
30-39 (n=171)
40-49 (n=148)
50-59 (n=168)
60+ (n=83)
Foodie Activity Dimension M SD M SD M SD M SD M SD Sustainable Agriculture 2.42 1.27 2.23 1.30 2.36 1.12 2.26 1.08 2.17 1.04
Adventure 4.50 1.14 4.49 1.10 4.24 1.07 3.98 1.14 3.97 1.11
Home Cooking 4.86 0.97 4.61 1.21 4.60 1.17 4.54 1.05 4.60 1.04
Political Activist 2.93 1.49 2.94 1.39 3.12 1.46 3.05 1.36 2.99 1.29
Earthy 2.98 1.48 3.06 1.49 3.43 1.39 3.53 1.31 3.56 1.40
Trendy 3.24 1.41 3.41 1.31 3.38 1.26 3.32 1.24 3.48 1.07
Drinking 4.25 1.70 3.80 1.58 3.38 1.56 3.29 1.64 3.29 1.56
Farmer Friendly 4.45 1.31 4.41 1.46 4.34 1.52 4.37 1.33 4.63 1.06
Engaged 4.14 1.53 3.61 1.50 3.21 1.37 2.92 1.28 2.78 1.23
Upscale Cooking 4.19 1.36 4.09 1.38 4.23 1.34 3.88 1.42 4.01 1.17
The assumptions of independence and normality were both met. The Levene’s Test for
Equality of Variances indicated that the Farmer Friendly and Engaged dimensions did not meet
the assumption of homogeneity as the F statistic was significant at the p<.05 level. The other
eight dimensions did meet the assumption of homogeneity.
Welch and Brown-Forsythe’s tests were performed to find the adjusted F statistic for the
two dimensions that did not meet the assumption of homogeneity (Table 22). The test
demonstrated that the adjusted F statistic for the Engaged dimension was significant at the
p<.001 level.

42
Table 22. Welch and Brown-Forsythe’s Test of Equality of Means for Age Ranges
ANOVA was used to investigate the dimensions that met the assumption of homogeneity.
The results revealed significant mean differences on Adventure [F(4,635)=6.80, p<.001], Earthy
[F(4,635)=4.34, p<.005], and Drinking [F(4,635)=6.45, p<.001] dimensions (Table 23).
Table 23. ANOVA Results for Age
Foodie Activity Dimension Sum of
Squares df F Sig.
Sustainable Agriculture Between Groups 3.88 4 .71 .586 Within Groups 868.34 635 Total 872.21 639 Adventure Between Groups 33.39 4 6.80 .000 Within Groups 779.43 635 Total 812.82 639 Home Cooking Between Groups 5.28 4 1.07 .371 Within Groups 785.05 635 Total 790.33 639 Political Activist Between Groups 3.51 4 .45 .771 Within Groups 1235.33 635 Total 1238.84 639 Earthy Between Groups 34.42 4 4.34 .002 Within Groups 1259.15 635 Total 1293.57 639 Trendy Between Groups 3.06 4 .48 .751 Within Groups 1014.43 635 Total 1017.49 639 Drinking Between Groups 66.16 4 6.45 .000 Within Groups 1628.53 635 Total 1694.69 639
Foodie Activity Dimension Test Adjusted F Statistic
df1 df2 Significance
Farmer Friendly Welch .97 4 264.32 .427 Brown-Forsythe .72 4 558.20 .578 Engaged Welch 14.03 4 256.50 .000 Brown-Forsythe 14.70 4 482.85 .000

43
Upscale Cooking Between Groups 11.16 4 1.52 .195 Within Groups 1166.90 635 Total 1178.06 639 Post-hoc comparisons used the Tukey HSD test to investigate the Adventure, Earthy, and
Drinking dimensions, and the Games-Howell test to investigate the Engaged dimension. The
Tukey HSD test indicated for the Adventure dimension, the mean scores for 18-29 year olds
(M=4.50, SD=1.14) and the 30-39 year olds (M=4.49, SD=1.10) were significantly different
from the 50-59 year olds (M=3.98, SD=1.14) and the 60 years and older group (M=3.97,
SD=1.11) at the p<.05 level. This analysis shows that the youngest groups more often sought out
the activities in the Adventure dimension than the two oldest groups.
Within the Earthy dimension, the mean score for the 50-59 year olds (M=3.53, SD=1.31)
was significantly different from the 18-29 year olds (M=2.98, SD=1.48) and the 30-39 year olds
(M=3.06, SD=1.49). This shows that the 50-59 year olds showed greater enjoyment of Earthy
activities than the two youngest groups.
Within the Drinking dimension, the mean score for 18-29 year olds (M=4.25, SD=1.70)
was significantly different from 40-49 year olds (M=3.38, SD=1.56), 50-59 year olds (M=3.29,
SD=1.64), and the 60 years and older group (M=3.29, SD=1.56) at the p<.005 level. The mean
score for the 30-39 year olds (M=3.80, SD=1.58) was significantly different than the 50-59 year
olds (M=3.29, SD=1.64) at the p<.05 level. This analysis shows that the youngest group
reported greater enjoyment of activities in the Drinking Dimension that the participants above
the age of 40 years, and the 30-39 year olds showed greater enjoyment than the 50-59 year olds.
For the Engaged dimension, the Games-Howell test indicated the mean score for 18-29
year olds (M=4.14, SD=1.53) was significantly different from 40-49 year olds (M=3.21,
SD=1.37), 50-59 year olds (M=2.92, SD=1.28), and the 60 years and older group (M=2.78,

44
SD=1.23) at the p<.001 level. The mean score for 30-39 year olds (M=3.61, SD=1.50) was
significantly different from 50-59 year olds (M=2.92, SD=1.28) and the 60 years and older group
(M=2.78, SD=1.23) at the p<.001 level. This analysis shows that the younger groups indicated
greater enjoyment of the activities in the Engaged dimension.
4.3.3 Income
ANOVA was used to investigate differences between household incomes. The means
and standard deviations are reported in Table 24.
Table 24. Means and Standard Deviations of Household Income
Household Income
Under $25,000
(n=44)
$20,000-$49,999 (n=111)
$50,000-$99,999 (n=254)
$100,000-$149,999 (n=128)
Over $150,000 (n=59)
Foodie Activity Dimension M SD M SD M SD M SD M SD Sustainable Agriculture 2.45 1.31 2.19 1.27 2.37 1.15 2.28 1.07 2.30 1.26 Adventure 4.03 1.32 4.22 1.23 4.29 1.05 4.33 0.98 4.32 1.16 Home Cooking 4.63 1.03 4.63 1.10 4.66 1.05 4.58 1.15 4.49 1.35 Political Activist 3.06 1.62 2.97 1.43 3.06 1.35 3.01 1.30 3.30 1.50 Earthy 3.06 1.68 3.23 1.45 3.49 1.34 3.22 1.47 3.46 1.32 Trendy 3.27 1.48 3.22 1.32 3.41 1.22 3.38 1.23 3.61 1.29 Drinking 3.77 1.65 3.59 1.72 3.51 1.59 3.68 1.56 3.68 1.66 Farmer Friendly 4.11 1.55 4.39 1.45 4.46 1.37 4.41 1.38 4.71 1.28 Engaged 3.59 1.69 3.39 1.46 3.25 1.44 3.28 1.36 3.35 1.48 Upscale Cooking 3.98 1.41 3.84 1.55 4.11 1.29 4.15 1.27 4.29 1.41
The assumptions of independence and normality were both met. The Levene’s Test for
Equality of Variances indicated that the Adventure and Upscale Cooking dimensions did not
meet the assumption of homogeneity as the F statistic was significant at the p<.05 level. The
other eight dimensions did meet the assumption of homogeneity.

45
Welch and Brown-Forsythe’s tests were performed to find the adjusted F statistic for the
two dimensions that did not meet the assumption of homogeneity (Table 25). The test
demonstrated that the adjusted F statistic was not significant at the p<.05 level for both
dimensions.
Table 25. Welch and Brown-Forsythe’s Test of Equality of Means for Income
ANOVA was used to investigate the eight dimensions that did meet the assumption of
homogeneity. The results revealed that there were no significant mean differences between the
income levels at the p<.05 level (Table 26).
Foodie Activity Dimension
Test Adjusted F Statistic
df1 df2 Significance
Adventure Welch .54 4 168.65 .708 Brown-Forsythe .62 4 281.82 .646 Upscale Cooking Welch 1.14 4 170.46 .341 Brown-Forsythe 1.29 4 329.32 .272

46
Table 26. ANOVA Results for Household Income
Foodie Activity Dimension Sum of
Squares df F Sig.
Sustainable Agriculture Between Groups 3.66 4 .66 .622 Within Groups 823.11 591 Total 826.77 595 Home Cooking Between Groups 1.72 4 .35 .847 Within Groups 733.36 591 Total 735.08 595 Political Activist Between Groups 4.40 4 .57 .685 Within Groups 1144.06 591 Total 1148.46 595 Earthy Between Groups 13.05 4 1.63 .166 Within Groups 1184.54 591 Total 1197.59 595 Trendy Between Groups 6.71 4 1.04 .387 Within Groups 955.35 591 Total 962.06 595 Drinking Between Groups 4.71 4 .45 .774 Within Groups 1555.16 591 Total 1559.86 595 Farmer Friendly Between Groups 9.74 4 1.26 .286 Within Groups 1146.00 591 Total 1155.74 595 Engaged Between Groups 5.37 4 .64 .635 Within Groups 1240.14 591 Total 1245.51 595
4.4 Travel Behavior Test Results
The third research question addressed the travel behavior differences of the respondents
with varying foodie activity dimension scores. The travel behavior characteristics investigated
were length of last vacation, size of travel party, and food and beverage and total expenditures on
last vacation. The assumption of normality was met, therefore parametric tests were used.
4.4.1 Length of Last Vacation
ANOVA was used to investigate differences between the lengths of the participants’ last
vacation. While the survey offered 5 response options for this question, due to unequal group
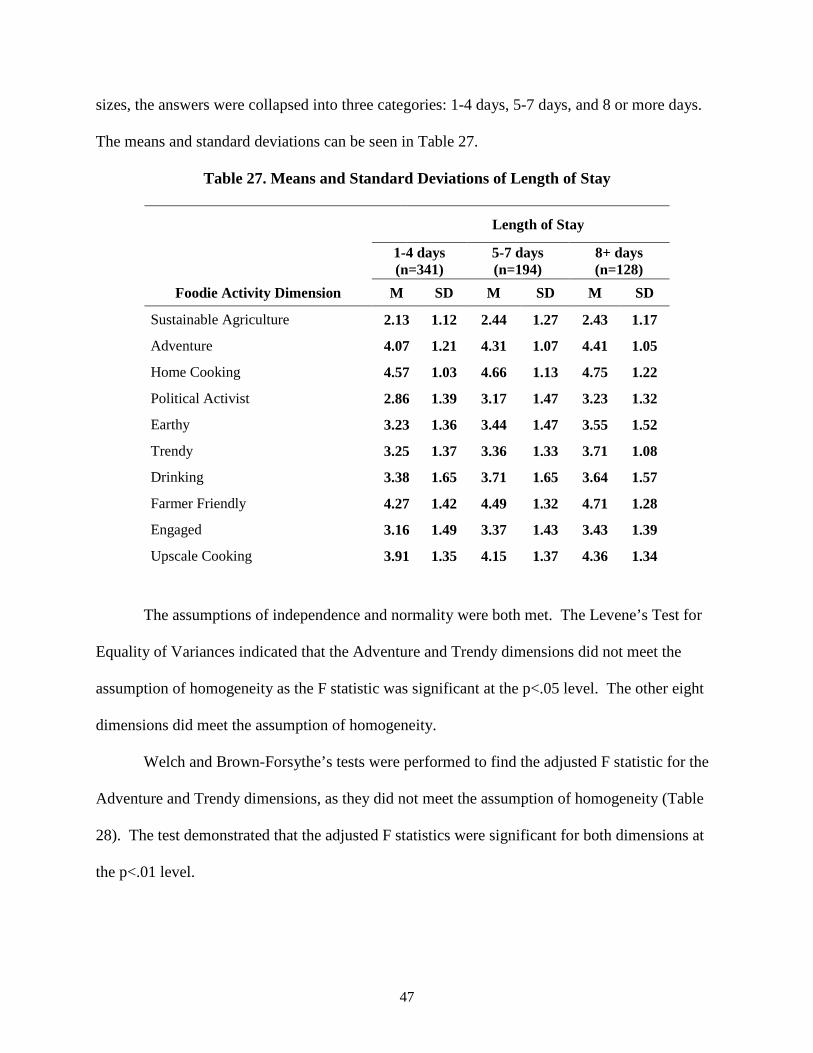
47
sizes, the answers were collapsed into three categories: 1-4 days, 5-7 days, and 8 or more days.
The means and standard deviations can be seen in Table 27.
Table 27. Means and Standard Deviations of Length of Stay
Length of Stay
1-4 days (n=341)
5-7 days (n=194)
8+ days (n=128)
Foodie Activity Dimension M SD M SD M SD
Sustainable Agriculture 2.13 1.12 2.44 1.27 2.43 1.17
Adventure 4.07 1.21 4.31 1.07 4.41 1.05
Home Cooking 4.57 1.03 4.66 1.13 4.75 1.22
Political Activist 2.86 1.39 3.17 1.47 3.23 1.32
Earthy 3.23 1.36 3.44 1.47 3.55 1.52
Trendy 3.25 1.37 3.36 1.33 3.71 1.08
Drinking 3.38 1.65 3.71 1.65 3.64 1.57
Farmer Friendly 4.27 1.42 4.49 1.32 4.71 1.28
Engaged 3.16 1.49 3.37 1.43 3.43 1.39
Upscale Cooking 3.91 1.35 4.15 1.37 4.36 1.34
The assumptions of independence and normality were both met. The Levene’s Test for
Equality of Variances indicated that the Adventure and Trendy dimensions did not meet the
assumption of homogeneity as the F statistic was significant at the p<.05 level. The other eight
dimensions did meet the assumption of homogeneity.
Welch and Brown-Forsythe’s tests were performed to find the adjusted F statistic for the
Adventure and Trendy dimensions, as they did not meet the assumption of homogeneity (Table
28). The test demonstrated that the adjusted F statistics were significant for both dimensions at
the p<.01 level.

48
Table 28. Welch and Brown-Forsythe’s Test of Equality of Means for Length of Stay
ANOVA was used to investigate the rest of the dimensions; the results revealed
significant mean differences between lengths of stay within the Sustainable Agriculture
[F(2,660)=5.81, p<.005], Political Activist [F(2,660)=4.78, p<.01], Farmer Friendly
[F(2,660)=5.37, p<.01], and Upscale Cooking [F(2,660)=5.74, p<.005] dimensions (Table 29).
Table 29. ANOVA Results for Length of Stay
Foodie Activity Dimension Sum of Squares df F Sig.
Sustainable Agriculture Between Groups 16.10 2 5.81 .003 Within Groups 914.54 660 Total 930.64 662 Home Cooking Between Groups 3.38 2 1.40 .247 Within Groups 796.99 660 Total 800.37 662 Political Activist Between Groups 18.69 2 4.78 .009 Within Groups 1291.59 660 Total 1310.28 662 Earthy Between Groups 11.37 2 2.80 .061 Within Groups 1339.38 660 Total 1350.75 662 Drinking Between Groups 14.88 2 2.78 .063 Within Groups 1768.42 660 Total 1783.31 662 Farmer Friendly Between Groups 20.02 2 5.37 .005 Within Groups 1229.86 660 Total 1249.88 662 Engaged Between Groups 9.52 2 2.25 .106 Within Groups 1395.22 660 Total 1404.74 662 Upscale Cooking Between Groups 21.07 2 5.74 .003 Within Groups 1212.43 660 Total 1233.50 662
Foodie Activity Dimension Test Adjusted F Statistic df1 df2 Significance
Adventure Welch 5.21 2 334.38 .006 Brown-Forsythe 5.53 2 523.01 .004 Trendy Welch 7.80 2 333.44 .000 Brown-Forsythe 6.70 2 525.96 .001

49
Post-hoc comparisons used the Tukey test to investigate the differences for the
dimensions that met the assumption of homogeneity as equal variances were assumed, and the
Games-Howell test to investigate the Adventure and Trendy dimensions, as equal variances were
not assumed.
The Tukey test indicated for the Sustainable Agriculture dimension, the mean score for
respondents that stayed 1-4 days (M=2.13, SD=1.12) was significantly different than those that
stayed 5-7 days (M=2.44, SD=1.27) and those that stayed over a week (M=2.43, SD=1.17) at the
p<.05 level. This analysis shows that those that traveled for longer amounts of time reported
higher enjoyment of Sustainable Agriculture activities than those that only traveled for 1-4 days.
The Tukey test indicated that for the Political Activist dimension, the mean score for
those that traveled for 1-4 days (M=2.86, SD=1.39) was significantly different than those that
stayed 5-7 days (M=3.17, SD=1.47) and those that stayed over a week (M=3.23, SD=1.32) at the
p<.05 level. This analysis shows that those who traveled longer reported greater enjoyment of
activities in the Political Activist dimension.
For the Farmer Friendly dimension, the Tukey test indicated the mean score for those that
traveled for 1-4 days (M=4.27, SD=1.42) was significantly different than those that traveled over
a week (M=4.71, SD=1.28) at the p<.01 level. This analysis shows that those that traveled
longest indicated greater enjoyment of the activities in the Farmer Friendly dimension than those
that only traveled a few days.
The Tukey test indicated that for the Upscale Cooking dimension, the mean score for
those that traveled 1-4 days (M=3.91, SD=1.35) was significantly different than those that stayed
over a week (M=4.36, SD=1.34) at the p<.005 level. This shows that those that traveled longest

50
indicated greater enjoyment of the activities in the Upscale Cooking dimension than those that
only traveled a few days.
The Games-Howell test indicated that for the Adventure dimension, the mean score for
respondents that stayed 1-4 days (M=4.07, SD=1.21) was significantly different than those that
stayed 5-7 days (M=4.31, SD=1.07) and those that stayed over a week (M=4.41, SD=1.05) at the
p<.05 level. This analysis demonstrates that those that traveled for longer periods of time more
often sought out the activities in the Adventure dimension than those that only traveled a few
days.
For the Trendy dimension, the Games-Howell test indicated that the mean score for
respondents that stayed over a week (M=3.71, SD=1.08) was significantly different than those
that traveled for 1-4 days (M=3.25, SD=1.37) and those that traveled 5-7 days (M=3.36, SD=
1.33) at the p<.05 level. This analysis demonstrates that those that traveled over a week showed
greater levels of enjoyment of the Trendy dimension than those that traveled for shorter periods
of time.
4.4.2 Size of Travel Party
ANOVA was used to investigate differences among respondents that traveled with
different party sizes during their last vacation. The means and standard deviations are reported
in Table 30.
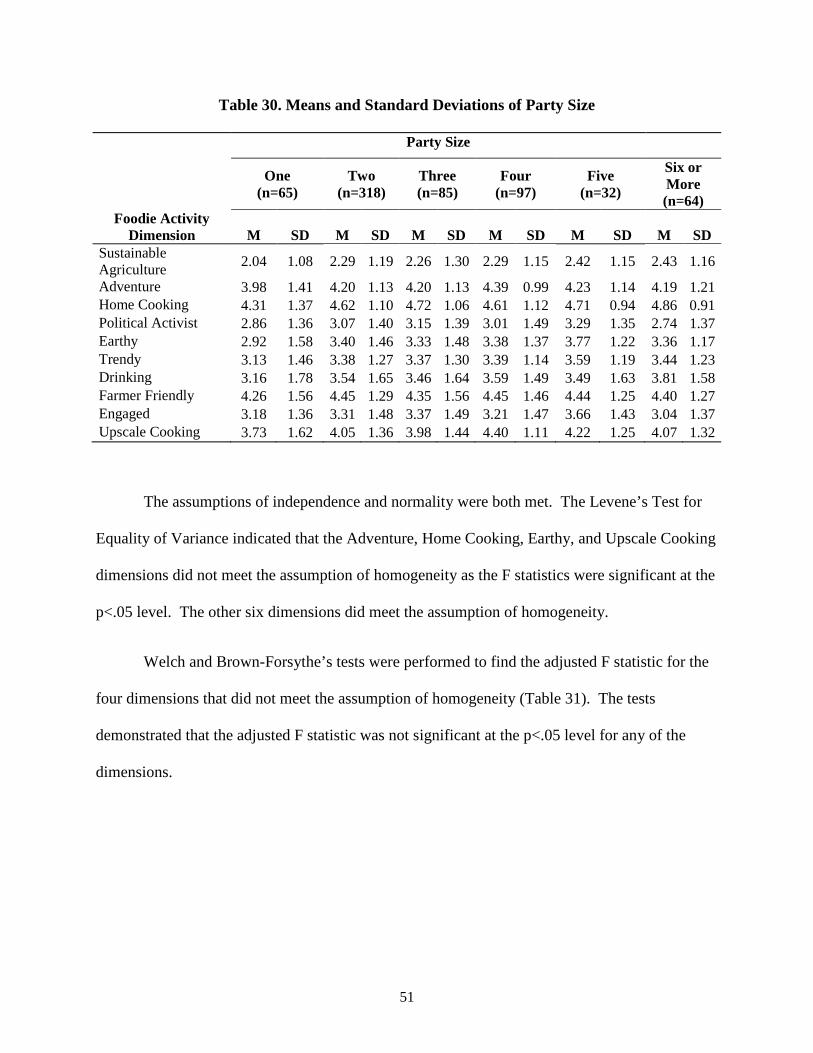
51
Table 30. Means and Standard Deviations of Party Size
Party Size
One (n=65)
Two (n=318)
Three (n=85)
Four (n=97)
Five (n=32)
Six or More (n=64)
Foodie Activity Dimension M SD M SD M SD M SD M SD M SD
Sustainable Agriculture
2.04 1.08 2.29 1.19 2.26 1.30 2.29 1.15 2.42 1.15 2.43 1.16
Adventure 3.98 1.41 4.20 1.13 4.20 1.13 4.39 0.99 4.23 1.14 4.19 1.21 Home Cooking 4.31 1.37 4.62 1.10 4.72 1.06 4.61 1.12 4.71 0.94 4.86 0.91 Political Activist 2.86 1.36 3.07 1.40 3.15 1.39 3.01 1.49 3.29 1.35 2.74 1.37 Earthy 2.92 1.58 3.40 1.46 3.33 1.48 3.38 1.37 3.77 1.22 3.36 1.17 Trendy 3.13 1.46 3.38 1.27 3.37 1.30 3.39 1.14 3.59 1.19 3.44 1.23 Drinking 3.16 1.78 3.54 1.65 3.46 1.64 3.59 1.49 3.49 1.63 3.81 1.58 Farmer Friendly 4.26 1.56 4.45 1.29 4.35 1.56 4.45 1.46 4.44 1.25 4.40 1.27 Engaged 3.18 1.36 3.31 1.48 3.37 1.49 3.21 1.47 3.66 1.43 3.04 1.37 Upscale Cooking 3.73 1.62 4.05 1.36 3.98 1.44 4.40 1.11 4.22 1.25 4.07 1.32
The assumptions of independence and normality were both met. The Levene’s Test for
Equality of Variance indicated that the Adventure, Home Cooking, Earthy, and Upscale Cooking
dimensions did not meet the assumption of homogeneity as the F statistics were significant at the
p<.05 level. The other six dimensions did meet the assumption of homogeneity.
Welch and Brown-Forsythe’s tests were performed to find the adjusted F statistic for the
four dimensions that did not meet the assumption of homogeneity (Table 31). The tests
demonstrated that the adjusted F statistic was not significant at the p<.05 level for any of the
dimensions.

52
Table 31. Welch and Brown-Forsythe’s Test of Equality of Means for Party Size
ANOVA was used to investigate the six dimensions that did meet the assumption of
homogeneity (Table 32). The results revealed that there were no significant mean differences
between party size within any of the dimensions at the p<.05 level.
Table 32. ANOVA Results for Party Size
Foodie Activity Dimension Sum of
Squares df F Sig.
Sustainable Agriculture Between Groups 5.94 5 .85 .518 Within Groups 921.12 655 Total 927.06 660 Political Activist Between Groups 11.05 5 1.12 .346 Within Groups 1287.29 655 Total 1298.34 660 Trendy Between Groups 5.76 5 .71 .613 Within Groups 1056.82 655 Total 1062.58 660 Drinking Between Groups 14.52 5 1.09 .364 Within Groups 1742.13 655 Total 1756.65 660 Farmer Friendly Between Groups 2.40 5 .25 .938 Within Groups 1243.40 655 Total 1245.80 660 Engaged Between Groups 10.18 5 .96 .441 Within Groups 1387.09 655 Total 1397.27 660
Foodie Activity Dimension
Test Adjusted F Statistic
df1 df2 Significance
Adventure Welch .99 5 160.02 .427 Brown-Forsythe .97 5 322.34 .437 Home Cooking Welch 1.67 5 163.28 .144 Brown-Forsythe 1.88 5 351.78 .097 Earthy Welch 1.78 5 164.42 .119 Brown-Forsythe 1.97 5 375.25 .082 Upscale Cooking Welch 2.29 5 161.60 .049 Brown-Forsythe 2.10 5 339.59 .066

53
4.4.3 Food Expenditures
Participants were asked to report an estimate of how much money they spent on food and
beverages on their last vacation. This amount was divided by the number in their travel party in
order to find the amount spent per person on food and beverages. For the purpose of this
analysis, respondents that did not fill out the expenditures section of the survey, or who chose the
‘six or more’ response to the party size question were not included as the precise party size was
unknown. An association between food expenditures and the different foodie activity
dimensions was investigated using the Pearson product-moment correlation (Table 33).
Table 33. Pearson Product-Moment Correlations for Food Expenditures (n=537)
Foodie Activity Dimension Pearson Correlation df Significance Percentage
of Variance Sustainable Agriculture .03 535 .543 .09%
Adventure .12 535 .007 1.44%
Home Cooking .01 535 .872 .01%
Political Activist .05 535 .305 .25%
Earthy .04 535 .376 .16%
Trendy .11 535 .02 1.21%
Drinking .06 535 .208 .36%
Farmer Friendly .07 535 .128 .49%
Engaged .11 535 .013 1.21%
Upscale Cooking .07 535 .095 .49%
There were weak positive correlations between food and beverage expenditures and
enjoyment of the Adventure [r(535)=.12, p<.01], Trendy [r(535)=.11, p<.05], and Engaged
[r(535)=.11, p<.05] dimensions, indicating that higher food spending was correlated with
increased enjoyment levels of the Adventure, Trendy, and Engaged dimensions.

54
4.4.4 Total Expenditures
A total expenditure variable was created from summing all spending categories reported.
Once again, this amount was divided by the number in their travel party to find the amount spent
per person on the respondent’s last vacation and respondents that did not fill out the expenditures
section or that chose the ‘six or more’ response to the party size question were not included. The
relationship between expenditures and the different foodie activity dimensions was investigated
using the Pearson product-moment correlation (Table 34).
Table 34. Pearson Product-Moment Correlations for Expenditures (n=537)
Foodie Activity Dimension Pearson Correlation df Significance Percentage
of Variance Sustainable Agriculture .08 535 .076 .64%
Adventure .13 535 .004 1.69%
Home Cooking .06 535 .194 .36%
Political Activist .10 535 .026 1.0%
Earthy .05 535 .297 .25%
Trendy .16 535 .000 2.56%
Drinking .10 535 .027 1.0%
Farmer Friendly .13 535 .003 1.69%
Engaged .13 535 .004 1.69%
Upscale Cooking .13 535 .004 1.69%
There were weak positive correlations between total expenditures and enjoyment of the
Trendy [r(535)=.16, p<.001], Adventure [r(535)=.13, p<.005], Farmer Friendly [r(535)=.13,
p<.005], Engaged [r(535)=.13, p<.005], Upscale Cooking [r(535)=.13, p<.005], Political Activist
[r(535)=.10, p<.05], and Drinking [r(535)=.10, p<.05] dimensions, indicating that higher
vacation spending was correlated with increased levels of enjoyment of activities associated with
all dimensions except for Sustainable Agriculture, Home Cooking, and Earthy.

55
4.5 Foodie Rating
Participants were asked to rate themselves on a scale of 0 to 10 with 0 being ‘not a foodie
at all’ and 10 being ‘a total foodie.’ The relationship between the foodie rating and the different
foodie activity dimensions was investigated using the Pearson product-moment correlation
(Table 35).
Table 35. Pearson Product-Moment Correlations for Foodie Rating (n=690)
Foodie Activity Dimension Pearson Correlation df Significance
Percentage of Variance
Sustainable Agriculture .24 688 .000 5.76%
Adventure .53 688 .000 28.09%
Home Cooking .33 688 .000 10.89%
Political Activist .28 688 .000 7.84%
Earthy .19 688 .000 3.61%
Trendy .45 688 .000 20.25%
Drinking .32 688 .000 10.24%
Farmer Friendly .28 688 .000 7.84%
Engaged .42 688 .000 17.64%
Upscale Cooking .42 688 .000 17.64%
There was a strong positive correlation between the foodie rating and the Adventure
dimension [r(688)=.53, p<.001], indicating that a higher foodie rating was correlated with
increased seeking out of Adventure activities. There were moderate positive correlations
between the foodie rating and enjoyment of the Trendy [r(688)=.45, p<.001], Engaged
[r(688)=.42, p<.001], Upscale Cooking [r(688)=.42, p<.001], Home Cooking [r(688)=.33,
p<.001], and Drinking [r(688)=.32, p<.001] dimensions, indicating that a higher foodie rating
was correlated with increased levels of enjoyment of activities within those dimensions. There
were low positive correlations between the foodie rating and enjoyment of the Political Activist
[r(688)=.28, p<.001], Farmer Friendly [r(688)=.28, p<.001], Sustainable Agriculture [r(688)=.24,

56
p<.001], Earthy [r(688)=.19, p<.001] dimensions, indicating that higher foodie ratings were
correlated with increased levels of enjoyment of activities associated with those dimensions.
4.6 Summary of Results
The purpose of this study was to investigate food-related activities of potential tourists to
Minneapolis to produce foodie activity dimensions and investigate the demographics and travel
habits of the respondents, differentiated by their enjoyment levels of various foodie activity
dimensions: Sustainable Agriculture, Adventure, Home Cooking, Political Activist, Earthy,
Trendy, Drinking, Farmer Friendly, Engaged, and Upscale Cooking.. Together, these factors
explained 58.72% of the variance of the model, and satisfied the first research question: ‘Can
foodie activities be factored into activity dimensions?’.
The second research question investigated socio-demographic differences of the
respondents as related to the various foodie activity dimensions. Results revealed that men had a
significantly higher enjoyment of the Adventure, Political Activist, and Farmer Friendly
dimensions than women. Regarding differences between age groups within dimensions, the 50-
59 year olds had a significantly higher level of enjoyment of the Earthy dimension than the
younger groups. The younger groups reported higher enjoyment of the Adventure, Drinking, and
Engaged dimensions than the oldest groups. There were no statistically significant differences
between income levels for any of the dimensions.
The third research question investigated differences in travel behavior by asking
respondents details about their last vacation, including length of stay, size of travel party, food
and beverage expenditures, and total trip expenditures. Respondents that traveled for longer
amounts of time reported significantly higher enjoyment of Sustainable Agriculture, Adventure,

57
Politically Active, Trendy, Farmer Friendly, and Upscale Cooking activities than those that only
traveled for 1-4 days. Size of party revealed no statistically significant differences. There were
weak positive correlations between the Adventure, Trendy, and Engaged dimensions and both
food expenditures and total vacation expenditures. There were weak positive correlations
between the Farmer Friendly, Engaged, Upscale Cooking, Political Activist, and Drinking
dimensions and total vacation expenditures.
The final research question investigated how respondents with varying foodie activity
dimension scores rate themselves when asked to what degree they self-identify as a foodie. The
foodie scale ranged from 0 to 10 with 0 being ‘not a foodie at all’ and 10 being ‘a total foodie’.
All of the dimensions had positive correlations with the foodie rating, with the Adventure
dimension have the strongest correlation. In the final chapter, these results will be discussed and
future research topics will be suggested.

5. DISCUSSION
5.1 Introduction
This study examined potential visitors to Minneapolis based on their enjoyment of food-
related activities to produce foodie activity dimensions and to compare visitor behavior and
demographics among dimensions. This chapter is organized by research question:
1. Can foodie activities be factored into activity dimensions?
2. Are there differences in foodie activity dimension scores among respondents with
varying socio-demographic characteristics?
3. Are there differences in foodie activity dimension scores among respondents with
varying travel behaviors?
4. How do the respondents with varying foodie activity dimension scores rate
themselves when asked to what degree they identify as a foodie?
5.2 Foodie Activity Dimensions
The first question explored the possibility of creating foodie activity dimensions based on
people’s enjoyment of various food related activities. The factor analysis identified ten
dimensions, which are discussed below.
5.2.1 Sustainable Agriculture Dimension
The activities that loaded onto this factor were mostly focused on being informed about
events and activities related to sustainable food. There were a few items in this factor that seem
slightly unrelated based on face value, such as attending food competitions, participating in food
or recipe competitions/contests, and attending food industry meetings. Because these items are

59
not very specific, they could have been interpreted differently by each respondent. For example,
the items related to participating in or attending food competitions may have loaded onto the
Sustainable Agriculture factor because sustainable-minded respondents could have interpreted
this item as small-scale events designed to promote the use of local foods (for example, a salsa-
making contest at a local food cooperative). Respondents may have associated the food industry
meeting item with the item asking about sustainable agriculture events/meetings even though
food industry meetings do not necessarily have an association with sustainability, which could
explain why it loaded onto the Sustainable Agriculture factor with a .63 loading score. The
factor mean for the Sustainable Agriculture dimension was the lowest of all the factors (M=2.29,
SD=1.17). Most of the items in this factor are activities that require a strong interest in
sustainable food systems. This dimension shares some characteristics with the “Whole-foodier
than thou” foodie type in Barr and Levy’s The Official Foodie Handbook (1985), such as raising
their own livestock.
5.2.2 Adventure Dimension
Many of the items in this dimension asked about various food-related activities
respondents may seek out while traveling, such as special food and drink products and
experiences and considering food when deciding where to vacation. These activities are closely
related to authentic food and travel experiences, which encourages sharing and preserving human
heritage, which is an important aspect of sustainable tourism (Bramwell & Lane, 1993; Sims,
2009; Sánchez-Cañizares & López-Guzmán, 2012; Reynolds, 1993). This dimension is similar
to results found in Robinson and Getz’s study (2012), which states that foodies seek “authentic,
traditional, and regional food experiences when traveling” (p. 19). The food and beverage
festival aspect of this dimension is one that is supported by other research that has also found

60
festivals to be an important travel motivator (Robinson and Getz, 2012). This dimension is also
similar to Barr and Levy’s “Gorgeous East in Me” foodie, who is drawn to new foods and likes
to experience other cultures through their food choices (1985).
5.2.3 Home Cooking Dimension
The activities within the Home Cooking dimension are centered on making food in
various ways and trying/creating recipes. This dimension had the highest mean (M=4.63,
SD=1.10). Many people cook on a daily basis in order to feed themselves, but also enjoy it as a
hobby. The activities constituting the dimension are accessible to almost anyone, e.g. trying new
recipes, grilling, baking. Yun et al. (2011) found a cluster in their food-related behavior study
they designated as “Interests in Cooking” that shares similar interests with the Home Cooking
dimension (p. 7).
5.2.4 Political Activist Dimension
Most of the activity items in the Political Activist Dimension are related to being an
active participant in activities related to food issues, such as seeing films and reading books
about food issues and following and being active in state and national food issues. Some of the
items are similar to the items in the Sustainable Agriculture dimension but the Political Activist
activities are more involved and require direct action.
5.2.5 Earthy Dimension
The Earthy dimension activities include gardening flowers and food, practicing organic
gardening methods, and seed-saving. Organic gardening and seed-saving are both activities that
could be linked to sustainable agriculture, yet they became their own factor with the gardening

61
items. It is possible that someone participating in organic gardening is practicing that method
due to simplicity. A gardener that uses fertilizer or pesticides needs to be somewhat educated on
how to use those products, where as anyone can attempt to grow flowers or vegetables by simply
watering their seeds, which could be considered organic gardening. They may not be doing it for
the sake of being sustainable. It also could have factored separately as gardening activities are
hands on physical activities whereas the sustainable agriculture activities are more about being
interested and informed on the big picture of sustainable agriculture issues.
5.2.6 Trendy Dimension
These activities center on using media to stay informed of food, restaurant, and chef
happenings through blogs and the newspaper. Ambrozas (2003) also found that that some
foodies were especially interested in trying new restaurants and in reading food blogs, going so
far as to have computers installed in their kitchens for the purpose of looking up recipes on blogs
(p. 159).
5.2.7 Drinking Dimension
All of the items in this dimension are related to consuming alcoholic beverages. The
survey instrument did not include non-alcoholic beverage items such as coffee or tea, which
should be included in future revisions of the instrument for those respondents that enjoy
beverage-related activities, such as coffee cuppings or tea tastings. A “Wine and Beer related
Experiences” cluster was also a result in the study by Yun et al. (2011, p. 7).

62
5.2.8 Farmer Friendly Dimension
The activities in this dimension include purchasing local or organic food, eating at farm-
to-table restaurants, and visiting farmers markets. It is interesting to note that these items loaded
onto a separate factor, as they are very similar to the items within the Sustainable Agriculture
dimension. While farmers markets are closely linked to sustainable agriculture, visitors often
frequent them to have fun and relax, escape daily life, and spend time with family (Silkes, 2012).
Those motivations are not necessarily linked to an interest in Sustainable Agriculture, which
could be an explanation for why the item factored separately. Robinson and Getz (2012) found
farmers markets to be the most frequently attended food-related event in their study. The
“Organivore” foodie in Brones’ article (2011) is similar to the Farmer Friendly dimension in that
they like to visit farmers markets and know where their food originates.
5.2.9 Engaged Dimension
The activities making up this dimension primarily involve social interactions that relate to
food, including discussing food-related activities or posting on social media about food as well
as activities that indicate a strong general interest in food such as thinking about food a lot or
taking pictures of food. Brones’ “One-upper” and “Blogging Food Pornographer” foodies share
characteristics with this dimension as the former enjoys boasting to others about unique or new
food experiences they have, and the latter enjoys taking and sharing pictures of their meals
(2011).

63
5.2.10 Upscale Cooking
Two of the items are shopping at specialty cookware/food stores and attending cooking
classes. These differ from the Home Cooking dimension, as they are activities that require some
investment of time and money.
5.3 Socio-demographics Across Foodie Activity Dimensions
The second research question looks at how the various demographic variables differ in
their enjoyment of the foodie activity dimensions. Gender was the first characteristic
investigated. The three dimensions with significant differences were Adventure, Political
Activist, and Farmer Friendly. In all cases, men reported higher enjoyment of the dimensions
than their female counterparts. However, only 201 men took the survey in comparison with 458
females. According to a study by Zalatan (1998), wives are more likely to gather vacation
planning materials than husbands are, so it could be inferred that the men in the sample are
particularly engaged and interested in food-related activities, and were thus drawn to completing
the survey about food activities and travel.
Regarding age, the younger groups also showed significantly higher enjoyment of the
Engaged dimension activities than the older groups. The “I enjoy posting about food on social
media” item within this dimension may have especially contributed to these results, as young
adults are more likely to use social media than older adults (Lenhart, 2009). Social media is a
valuable advertising and marketing tool for destinations, therefore the younger generations that
are using social media more and are posting more about food are a good target market for social
media food-related advertising, especially as advertising efforts spread quickly through social
media users themselves. The two youngest groups also sought out activities in the Adventure

64
dimension significantly more than the oldest groups which may imply that this age group is more
likely than their older counter parts to seek out unique food and beverage experiences while they
are traveling. The youngest group also showed significantly higher enjoyment of the Drinking
dimension activities than the oldest groups (40 years and older) which corresponds with research
demonstrating that alcohol is often used more by younger people, than by those who are older
(Carey et al., 2009; Hilton, 1988). These results imply that destinations should consider
including attractions such as authentic food or beverage experiences their location has to offer,
including breweries or unique bars when advertising their destination to younger generations and
utilize social media in doing so. Finally, the 50-59 year old age group demonstrated significantly
higher enjoyment of the Earthy dimension than the two youngest groups.
Finally, the last demographic investigated was total household income. There were no
significant differences between different income levels. This could be due to the fact that almost
half the sample was made up of people making $50,000 -$99,999 so differences may have not
appeared due restriction of range. Another possible explanation for the lack of differences is that
it is possible to find ways to participate in most of the dimensions for people of all levels of
income. For example, a wealthy person who enjoys food gardening may have a large piece of
property to base a garden and can invest a lot of time and resources into fencing, fertilizers,
decorations, high quality seeds or seedling, and tools. However, a person of a lower income may
have access to a community garden. While these two gardening experiences are vastly different
and require different resources in able to be able to participate, they both are manners in which
people of different economic backgrounds can enjoy gardening.
Table 36 summarizes the dimensions that had statistically significant differences for each
demographic variable.
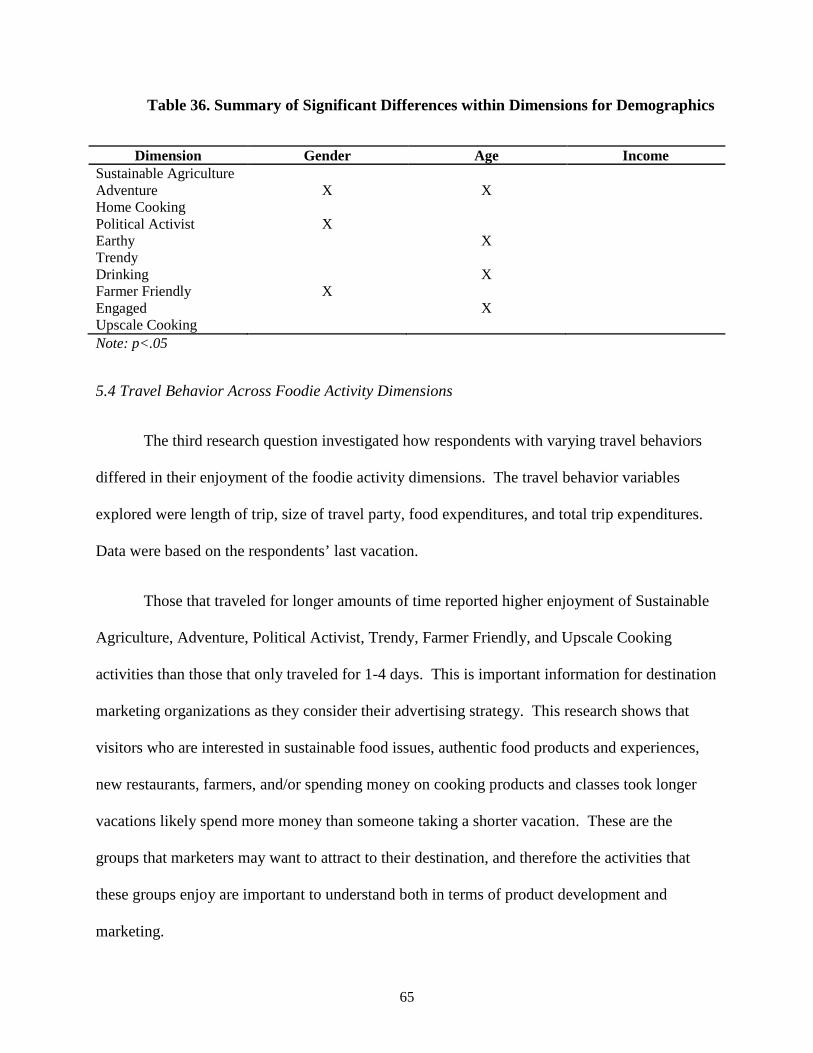
65
Table 36. Summary of Significant Differences within Dimensions for Demographics
Dimension Gender Age Income Sustainable Agriculture Adventure X X Home Cooking Political Activist X Earthy X Trendy Drinking X Farmer Friendly X Engaged X Upscale Cooking Note: p<.05
5.4 Travel Behavior Across Foodie Activity Dimensions
The third research question investigated how respondents with varying travel behaviors
differed in their enjoyment of the foodie activity dimensions. The travel behavior variables
explored were length of trip, size of travel party, food expenditures, and total trip expenditures.
Data were based on the respondents’ last vacation.
Those that traveled for longer amounts of time reported higher enjoyment of Sustainable
Agriculture, Adventure, Political Activist, Trendy, Farmer Friendly, and Upscale Cooking
activities than those that only traveled for 1-4 days. This is important information for destination
marketing organizations as they consider their advertising strategy. This research shows that
visitors who are interested in sustainable food issues, authentic food products and experiences,
new restaurants, farmers, and/or spending money on cooking products and classes took longer
vacations likely spend more money than someone taking a shorter vacation. These are the
groups that marketers may want to attract to their destination, and therefore the activities that
these groups enjoy are important to understand both in terms of product development and
marketing.

66
Another aspect of travel behavior that was investigated was the size of the travel party
during the respondent’s last vacation. There were no significant differences between the various
travel party sizes in terms of their enjoyment of the dimensions. This information may lead to
the conclusion that marketing based on food-related interests is not useful for attracting certain
sized travel parties. If a destination wants to attract specific group sizes, for example large
groups or couples, other visitor behavior or interests should be investigated in order to target
those markets.
This study also looked at the relationship between food and beverage expenditures and
total expenditures during the respondents’ last vacations and their enjoyment scores in the ten
foodie activity dimensions. As up to 25% of visitor spending is on food, food and beverage
expenditures are important to consider (Quan & Wang, 2004). While the correlations were
weak, the respondents who spent more on food during their last vacation had higher interest in
the Adventure, Trendy, and Engaged, dimensions than those who spent less. Travelers with
higher scores in the Adventure dimension are interested in seeking unique food or beverage
related products or experiences during vacation so it is logical that they would spend more on
food and beverages than those with lesser interest in those activities. Respondents with higher
enjoyment of the Trendy dimension may spend more as they have a higher interest in restaurant
and chef happenings and keep themselves up to date on food-related information, which are
activities they can also participate in while traveling. Additionally, because they are interested in
food trends, they may spend more on food to participate in food-related activities that they
researched ahead of time and that reflect the destination. Those with higher interest in the
Engaged dimension may spend more on food as they think and talk about food often, which may
inspire them to focus on and try more food-related activities while traveling.

67
Those that spent more on their total vacation had higher interests in the Adventure,
Political Activist, Trendy, Drinking, Farmer Friendly, Engaged, and Upscale Cooking
dimensions. As the Political Activist, Drinking, Farmer Friendly, and Upscale Cooking
dimensions did not have higher correlations with food and beverage spending, they may be
spending more in areas such as shopping for souvenirs. For example, the Upscale Cooking
dimension includes shopping for specialty cookware, which is something respondents could do
while on vacation, increasing their shopping expenditures. There are many other reasons
vacation expenditures could be high for these groups, including spending more on attractions,
flying to their destination, or staying in luxury hotels, all of which would raise the cost of their
vacation. Table 37 summarizes the statistically significant differences for each travel behavior
variable.
Table 37. Summary of Significant Differences within Dimensions for Travel Behavior
Dimension Length of Stay
Party Size Food Expenditures
Total Expenditures
Sustainable Agriculture X Adventure X X X Home Cooking Political Activist X X Earthy Trendy X X X Drinking X Farmer Friendly X X Engaged X X Upscale Cooking X X Note: p<.05
5.5 Foodie Ratings Across Foodie Activity Dimensions
Respondents were asked to rate themselves on an 11-point foodie scale with 0 meaning
‘not a foodie at all’ and 10 meaning ‘a total foodie’. A correlation between this rating and each
of the foodie activity dimensions was investigated to determine if respondents with varying

68
levels of interest in the dimensions rated themselves differently on the foodie scale. There were
positive correlations between respondents’ foodie rating and interest in all of the dimensions, the
strongest correlation being with the Adventure dimension. This demonstrates that despite the
fact that some literature finds the word “foodie” is often associated with someone that is snobby
or elitist (Johnston & Baumann, 2010; Ambrozas, 2003; Cairns, Johnston, & Baumann, 2010),
people with higher enjoyment of food-related activities designate themselves at a higher ‘level’
of foodie-ism.
5.6 Implications for Sustainable Tourism
As this and other research has shown, there are foodies that are highly interested in
having authentic food experiences (Robinson & Getz, 2012; Sims, 2009). Attracting these kinds
of tourists will help preserve cultural aspects of destinations as demand is raised for authentic
experiences and local business owners see the economic benefits of being able to provide a
unique and authentic experience. Additionally, it is important for destinations to advertise local
specialty products and experiences, and assist businesses in being able to provide those authentic
travel experiences.
Economic sustainability is a pillar of sustainable tourism. Without a continued flow of
visitor spending, a destination will cease to become a destination. This research has provided
valuable information about potential visitors’ interests and hobbies, which destinations can
incorporate into their long term planning for sustainable tourism growth. They can focus on
groups that they think will help their destination flourish. For example, the respondents who
tended to stay longer on vacation and spend more overall indicated higher interest in the Farmer
Friendly dimension. A destination may want to target potential Farmer Friendly tourists by

69
promoting farm-to-table restaurants and farmers markets at their destination in order to attract
people that will stay longer and spend more money. The interests of Farmer Friendly visitors
also help support local farmers and businesses, which is good for economic, cultural, and
environmental sustainability. People with higher interest in the Earthy, Sustainable Agriculture,
and Political Activist dimensions also have interests related to environmentally friendly activities
such as organic gardening, being aware of sustainable food issues, and being involved in slow
food movements. If these foodies bring their interests with them on vacation, it could be
beneficial to environmentally sustainable development of a destination.
5.7 Limitations
The data for this study was collected through an internet survey, which restricted data
collection to individuals that have access to the Internet. The results are also limited as they are
single sourced from one survey. There are also several limitations of the questionnaire design to
consider. The survey asked participants to report their enjoyment of various activities. This may
not mean that they actively participate in the items, but may like the idea of it or think that they
may enjoy it if they did participate. The respondents were also self-reporting which may limit
the validity of the data. The survey instrument contained a disproportionate number of items
related to sustainable agriculture, which is one possible explanation for why the Sustainable
Agriculture food activity dimension contained more items than the other dimensions. The expert
panel that reviewed the questionnaire consisted of several people that work in the food industry
or faculty, however they were all people with a vested interest in sustainability issues, which
could have caused some bias. There are also some items that seem not to fit into their respective
factors based on face value, for example, “I enjoy attending food competitions” loaded onto the
Sustainable Agriculture dimension. One explanation for this is that the item was not specific

70
enough. In this case, it’s possible that the item was interpreted as a small food competition
between amateurs using their own local ingredients, although it could have also been interpreted
as a large-budget competition between famous chefs, which seems less likely to have loaded
onto Sustainable Agriculture. The participants in this study were primarily American and
Canadian residents, so the results are limited in their application globally. More specifically, the
majority of the respondents were from the Midwestern part of the United States, which means
the results could differ than if the sample was primarily residing in a different region.
5.8 Future Research Directions
This was an exploratory study in a relatively new field of research, as literature about
foodies is scarce. There are many opportunities for future research based on the results and
conclusions of this study. A few of these are:
• Perform a similar study with a sample that has a more balanced gender ratio
• Perform similar studies in different countries to research food-related travel
behavior in other cultures
• Further investigate travel expenditures to determine on which activities, events, or
items tourists with higher interest in certain dimensions specifically spend money
• Include a more diverse range of activities to avoid disproportionate loadings on
factors
• Include more demographic variables such as level of education, religious
affiliation, or race/ethnicity.
• Investigate differences in foodie activity dimensions in varying regions
• Study differences among respondents based on family stage

71
• Perform cluster analysis to investigate how respondents fall in to specific types of
foodies
• A qualitative study concerning the definition of the term ‘foodie’ and perceptions
of foodies.
• While this study investigated a few aspects of travel behavior, there are many
possibilities of other variables that could be investigated using the foodie activity
dimensions such as visitor satisfaction, travel motivations, distance traveled, and
risk perception or avoidance.
5.9 Conclusion
This exploratory study was intended to produce foodie activity dimensions based on
participants’ food related interests. Ten dimensions were produced: Sustainable Agriculture,
Adventure, Home Cooking, Political Activist, Earthy, Trendy, Drinking, Farmer Friendly,
Engaged, and Upscale Cooking. Further investigation of each of these dimensions revealed
differences in demographics, travel behavior and foodie self-ratings - differences that can be
used by DMOs to target advertising and marketing campaigns for foodies. The results can be
used by destinations to find ways to attract tourists that will help maintain cultural authenticity
and economic stability of the host community.
This study is also an important first step for future academic research. There is very little
scholarly literature written about foodies as it is a relatively new field of study, especially when
related to travel behavior. Culinary tourism is attracting much more research attention, however
much more needs to be done regarding food-interests and tourism of the general market, not
tourists already traveling with culinary motivations. This study, therefore, stands as one of the

72
first research-based descriptions of varying foodie activities based on lifestyles at home and
while traveling. There is much more work to be done to define and segment foodies and foodie
activity dimensions, as well as study various aspect of their interests or behavior, and hopefully
this study will encourage others to continue studying this subject.

73
REFERENCES
Ambrozas, D. (2003). Serious feast: Vancouver foodies in globalized consumer society. (Unpublished Doctor of Philosophy). Simon Fraser University.
Barr, A., & Levy, P. (1985). The official foodie handbook. Arbor House Publishing Company.
Bell, R., & Marshall, D. (2003). The construct of food involvement in behavioral research: Scale development and validation. Appetite, 40, 235-244.
Bourdain, R. (2012). Comfort me with offal. Kansas City: Andrews McMeel Publishing.
Bramwell, B. & Lane, B. (1993). Sustainable tourism: An evolving global approach. Journal of Sustainable Tourism, 1(1), 1-5.
Brones, A. (2011). The 10 types of foodies. Retrieved September 8, 2012, from http://www.huffingtonpost.com/anna-brones/the-10-types-of-foodies_b_1170430.html.
Cairns, K., Johnston, J., & Baumann, S. (2010). Caring about food: Doing gender in the foodie kitchen. Gender & Society, 24, 519.
Carey, K., McClurg, A., Bolles, J., Hubbell, S., Will, H., & Carey, M.. (2009). College student drinking and ambulance utilization. Journal of Public Health Management & Practice, 15(6), 524-528.
Chomeya, R. (2010). Quality of psychology test between Likert scale 5 and 6 points. Journal of Social Sciences, 6(3), 399-403.
Etzel, M. J. & Woodside, A. G. (1982). Segmenting vacation markets: The case of the distant and near-home travelers. Journal of Travel Research, 20(4), 10-14.
Everett, S. & Aitchison, C. (2008). The role of food tourism in sustaining regional identity: A case study of Cornwall, South West England. Journal of Sustainable Tourism, 16(2), 150-167.
Fons, M., Fierro, J., & Patiño, M. (2011). Rural tourism: A sustainable alternative. Applied Energy, 88, 551-557.
Foodie. (2012). Retrieved September 23, 2012, from http://www.merriam-webster.com/dictionary/foodie.
Foodtopian Society. (2013). Explore Asheville: Foodtopia. Retrieved March 18, 2013, from http://www.exploreasheville.com/foodtopia/.
Garland, R. (1991). The mid-point on a rating scale: Is it desirable? Marketing Bulletin, 2, 66-70.

74
Garson, D. G. (2012). PA 765 Stat notes: An online textbook. Retrieved January 10, 2012 from www2.chass.ncsu.edu/garson/PA765/statnote.htm.
González, A. M., & Bello, L. (2002). The construct "lifestyle" in market segmentation: The behaviour of tourist consumers. European Journal of Marketing, 36(1/2), 51-85.
Goody, J. (1982). Cooking, cuisine and class: A study in comparative sociology. Cambridge: Cambridge University Press.
Green, E. & Kline, C. (2013). Are you a foodie? Food related travel study. Technical report prepared for: 7th Street Public Market, Charlotte, NC.
Green, E. & Kline, C. (2012). Are you a foodie? Technical report prepared for: Festival of Legends, Pittsboro, NC.
Green, E. & Rao V. (1970). Rating scales and information recovery – how many scales and response categories to use? Journal of Marketing, 34(3), 33-39.
Green, G. P., & Dougherty, M. L. (2009). Localizing linkages for food and tourism: Culinary tourism as a community development strategy. Community Development, 39(3), 148-158.
Hermosillo, J. (2012). Loncheras: A look at the stationary food trucks of Los Angeles. (Unpublished Master of Arts). University of California Los Angeles.
Hilton, M. (1988). The demographic distribution of drinking patterns in 1984. Drug and Alcohol Dependence, 22(1-2), 37-47.
Ignatov, E., & Smith, S. (2006). Segmenting Canadian culinary tourists. Current Issues in Tourism, 9(3), 235-255.
Johns, N., & Gyimóthy, S. (2002). Market segmentation and the prediction of tourist behavior: The case of Bornholm, Denmark. Journal of Travel Research, 40(3), 316-327.
Johnston, J., & Baumann, S. (2009). Foodies: Democracy and distinction in the gourmet foodscape. New York: Routledge.
Knowd, I. (2006). Tourism as a mechanism for farm survival. Journal of Sustainable Tourism, 14(1), 24-42.
Kyle, G., Absher, J., Norman, W., Hammitt, W., & Jodice, L. (2007). A modified involvement scale. Leisure Studies, 26(4), 399-427.
Kyle, G., & Chick, G. (2002). The social nature of leisure involvement. Journal of Leisure Research, 34(4), 426-448.

75
Kyle, G. T., Kerstetter, D. L., & Guadagnolo, F. B. (2002). Market segmentation using participant involvement profiles. Journal of Park & Recreation Administration, 20(1), 1-21.
Leeworthy, V. R., Wiley, P. C., English, D. B. K., & Kriesel, W. (2001). Correcting response bias in tourist spending surveys. Annals of Tourism Research, 28(1), 83-97.
Lenhart, A. (2009). Adults and social network Web sites. Retrieved March 11, 2013 from http://www.pewinternet.org/Reports/2009/Adults-and-Social-Network-Websites.aspx.
Long, L. M. (2004). Culinary tourism: A folkloristic perspective on eating and otherness. In L. M. Long (Ed.), Culinary tourism (1st ed., pp. 20-50). Lexington, Kentucky: The University Press of Kentucky.
Long, P. T., & Perdue, R. R. (1990). The economic impact of rural festivals and special events: Assessing the spatial distribution of expenditures. Journal of Travel Research, 28(4), 10-14.
MacLaurin, T., Blose, J., & Mack, R. (2007). Marketing segmentation of culinary tourists. 7th Annual Conference on Business & Economics, Rome, Italy.
Mayerowitz, S. (2009, August 10). Top 10 state fair food favorites. Retrieved March 11, 2013 from: http://abcnews.go.com/Travel/top-10-state-fair-food-favorites/story?id=8279841.
Okumus, B., Okumus, F., & McKercher, B. (2007). Incorporating local and international cuisines in the marketing of tourism destinations: The cases of Hong Kong and Turkey. Tourism Management, 28(1), 253-261.
Pallant, J. (2006). SPSS Survival Manual. New York: Open University Press.
Quan, S., & Wang, N. (2004). Towards a structural model of the tourist experience: An illustration from food experiences in tourism. Tourism Management, 25(3), 297-305.
Reynolds, P. (1993). Food and tourism: Towards an understanding of sustainable culture. Journal of Sustainable Tourism, 1(1), 48-54.
Robinson, R. N. S., & Getz, D. (2012). Getting involved: ‘Foodies’ and food tourism. CAUTHE Conference, Melbourne, Australia.
Sánchez-Cañizares, S. M., & López-Guzmán, T. (2012). Gastronomy as a tourism resource: Profile of the culinary tourist. Current Issues in Tourism, 15(3), 229-245.
Scarpato, R., & Daniele, R. (2003). New global cuisine: Tourism, authenticity and sense of place in postmodern gastronomy. In C. Hall, L. Sharples, R. Mitchell, N. Macionis & B. Cambourne (Eds.), Food tourism around the world (1st ed., pp. 296-313). Burlington, MA: Butterworth-Heinemann.

76
Seery, P. S. (2010). Metropolitan cuisine tourism: Exploring food tourists to the creole cuisine in New Orleans, LA USA. (Unpublished Master of Arts). Arizona State University.
Shenoy, S. S. (2005). Food tourism and the culinary tourist. (Unpublished Doctor of Philosophy). Clemson University.
Silkes, C. (2012). Farmers’ markets: A case for culinary tourism. Journal of Culinary Science & Technology, 10(4), 326-336.
Sims, R. (2009). Food, place and authenticity: Local food and the sustainable tourism experience. Journal of Sustainable Tourism, 17(3), 321-336.
Smith, S., & Costello, C. (2009). Segmenting visitors to a culinary event: Motivations, travel behavior, and expenditures. Journal of Hospitality Marketing & Management, 18(1), 44-67.
Smyth, J., Dillman, D., Christian, L., & Stern, M. (2006). Comparing check-all and forced-choice question formats in web surveys. Public Opinion Quarterly, 70(1), 66-77.
Spurlock, C. (2009). Performing and sustaining (agri)culture and place: The cultivation of environmental subjectivity on the Piedmont Farm Tour. Text and Performance Quarterly, 29(1), 5-21.
Stynes, D. J., & White, E. M. (2006). Reflections on measuring recreation and travel spending. Journal of Travel Research, 45, 8-16.
What is a foodie? (2012). Retrieved September 23, 2012, from http://www.gocalaverasfoodie.com/what-is-a-foodie.
World Tourism Organization. (1993). Sustainable Tourism Development: Guide for Local Planners. Madrid: World Tourism Organization.
Yun, D., Hennessey, S., & MacDonald, R. (2011). Understanding culinary tourists: Segmentations based on past culinary experiences and attitudes toward food-related behaviour. 2011 Annual ICHRIE Summer Conference, Denver, Colorado.
Zalatan, A. (1998). Wives involvement in tourism decision processes. Annals of Tourism Research, 25(4), 890-903.
Zografos, C., & Allcroft, D. (2007). The environmental values of potential ecotourists: A segmentation study. Journal of Sustainable Tourism, 15(1), 44-66.

APPENDIX A: SURVEY

78
APPENDIX B: SURVEY

79

80

81

82

83

84
85

86
APPENDIX C: INITIAL CONTACT EMAIL
Hello,
You are receiving this email because you asked for travel information from Meet Minneapolis and we
value your opinion! We are currently working with the East Carolina University Center for Sustainable
Tourism to conduct a study about travelers and their enjoyment of food-related activities. The following
survey asks you about these activities, as well as details about your travel behavior. We would greatly
appreciate your participation. Upon completion of the survey, you will be entered into a drawing for a
TW0-NIGHT HOTEL STAY at the Normandy Inn and Suites in downtown Minneapolis. The survey should
only take approximately 10-15 minutes of your time. To take the survey, simply click the link below or
copy and paste the text into your browser:
http://www.surveymonkey.com/s/minneapolisfoodtravel
Thank you for your time and participation.
Best regards,
Erin Green
Graduate Student
ECU Center for Sustainable Tourism

87
APPENDIX D: SECONDARY EMAIL REQUEST
This is a reminder to participate in our survey in order to be entered into a drawing for a two
night hotel stay. If you have already completed the survey, thank you for your participation!
Unfortunately, we are unable to remove your email from our distribution list due to the
anonymity of the survey. If you haven't filled out the survey, please review the message below.
Thank you for your time.
Hello,
You are receiving this email because you asked for travel information from Meet Minneapolis
and we value your opinion! We are currently working with the East Carolina University Center
for Sustainable Tourism to conduct a study about travelers and their enjoyment of food-related
activities. The following survey asks you about these activities, as well as details about your
travel behavior. We would greatly appreciate your participation. Upon completion of the
survey, you will be entered into a drawing for a TW0-NIGHT HOTEL STAY at the Normandy Inn
and Suites in downtown Minneapolis. The survey should only take approximately 10-15
minutes of your time. To take the survey, simply click the link below or copy and paste the text
into your browser:
http://www.surveymonkey.com/s/minneapolisfoodtravel
Thank you for your time and participation.
Best regards,
Erin Green
Graduate Assistant
ECU Center for Sustainable Tourism
88
APPENDIX E: FINAL EMAIL REQUEST
This is the FINAL reminder to participate in our survey. If you have already
completed the survey, thank you for your participation! Unfortunately, we are
unable to remove your email from our distribution list due to the anonymity of the
survey. The survey will close on December 1st and the winner of the hotel stay will
be notified through email. If you haven't filled out the survey, please review the
message below. Thank you for your time. THIS IS THE LAST EMAIL YOU WILL
RECEIVE.
Hello,
You are receiving this email because you asked for travel information from Meet Minneapolis
and we value your opinion! We are currently working with the East Carolina University Center
for Sustainable Tourism to conduct a study about travelers and their enjoyment of food-related
activities. The following survey asks you about these activities, as well as details about your
travel behavior. We would greatly appreciate your participation. Upon completion of the
survey, you will be entered into a drawing for a TW0-NIGHT HOTEL STAY at the Normandy Inn
and Suites in downtown Minneapolis. The survey should only take approximately 10-15
minutes of your time. To take the survey, simply click the link below or copy and paste the text
into your browser:
http://www.surveymonkey.com/s/minneapolisfoodtravel
Thank you for your time and participation.
Best regards,
Erin Green
Graduate Assistant
ECU Center for Sustainable Tourism