Embed Size (px)
Citation preview
Academy of Strategic Management Journal Volume 20, Special Issue 6, 2021
1 1544-1458-20-S6-192
A STUDY ON CONSUMERS SATISFACTION AND
ATTITUDE TOWARDS ONLINE SHOPPING IN
CHENNAI CITY
Venkatesh, M., Bharathidasan University
Thiruchelvam, C., H.H Rajahs College (Autonomous) Pudukkottai
ABSTRACT
In this modern era has millions of customers are influenced over online shopping. Online
searching may be a kind of electronic commerce that permits the consumers and consumers to
directly purchase product or services from a merchant over the web employing a web browser.
There are totally different names given to the current akin to e-web-store, e-shop, e-store, web
shop, web-shop, web-store, on-line store, online front and virtual store. Online shopping is the
growth and progression whereby consumers directly buy goods, services etc. since a seller
interactively in real-time without an intermediary service over the internet. Online shopping is
the process of buying goods products from merchants who sell on the Internet. Since the
surfacing of the World Wide Web, merchants have sought to sell their products to people who
surf the Internet. Shoppers can visit web stores from the comfort of their homes and shop as they
sit in front of the computer. Consumers buy a variety of items from online stores. Modern trend
of internet is not just another medium to get in touch with customers, but it is an important
channel to find potential customers as well as channel to continue relationship with existing
customers. Particularly and essentially, the idea of online shopping is to lead customers to a
convenient way of shopping. Users and customers will be able to save their time and money,
plus retrieve all the product information with just few clicks in few minutes. Moreover,
purchasing can be done anywhere, anytime according to their preferences.
Keywords: Electronic Commerce, Modern trend, Potential Customers and Preferences
INTRODUCTION
The modern age has hundreds of shopping patterns and the most famous of all time is
online shopping. Online shopping is a form of electronic commerce that enables buyers and
consumers to purchase goods or services directly from a seller over the Internet using a web
browser. There are different names for this, such as e-webstore, e-shop, e-store, Internet shop,
web shop, web shop, online shop, online storefront and virtual shop or application. There is
variety of advantages and easiness in online shopping. An online shop evokes the physical
analogy of buying products or services at a bricks-and-mortar retailer or shopping centre the
process is called business-to-consumer (B to C) online shopping. In the case where a business
buys from another business, the process is called business-to-business (B to B) online shopping.
The largest of these online retailing corporations are Alibaba, Amazon.com and eBay.
Online shopping is the growth and progression whereby consumers directly buy goods,
services etc. since a seller interactively in real-time without an intermediary service over the
internet. Online shopping is the process of buying goods products from merchants who sell on
the Internet. Since the surfacing of the World Wide Web, merchants have sought to sell their
products to people who surf the Internet. Shoppers can visit web stores from the comfort of their
homes and shop as they sit in front of the computer. Consumers buy a variety of items from
online stores. Nowadays, online shopping is a fast growing phenomenon. Growing numbers of
consumers shop online to purchase good product and services, gather product information or
even browse for enjoyment. Online shopping environment are therefore playing an increasing
role in the overall relationship between markets and their consumers (look et al., 2008). It is
Academy of Strategic Management Journal Volume 20, Special Issue 6, 2021
2 1544-1458-20-S6-192
clear that consumer-purchases are mainly based on the cyberspace appearance such as pictures,
image, quality information, and video clips of the product, not on the actual experience. Since
the internet has now become a truly global phenomenon, the number of internet users worldwide
is expected to reach 1.8 billion by 2010 according to the survey of clicks stats, this growing and
diverse internet population means the people having diverse taste and purposes are now going to
web for information and to buy products and services. The by and large use of internet and the
rapid growth of technology have created a new market for both the customers and business.
Modern trend of internet is not just another medium to get in touch with customers, but it is an
important channel to find potential customers as well as channel to continue relationship with
existing customers. Particularly and essentially, the idea of online shopping is to lead customers
to a convenient way of shopping. Users and customers will be able to save their time and money,
plus retrieve all the product information with just few clicks in few minutes. Moreover,
purchasing can be done anywhere, anytime according to their preferences.
HISTORICAL BACKGROUND OF THIS STUDY
Historical profile of online shopping reveals many things to learn. British entrepreneur
Michael Aldrich invented online shopping in 1979. The computer system he had, got connected
a modified domestic TV to a real-time transaction processing computer via a domestic telephone
line. He immensely trusted and believed that video text, the modified domestic TV technology
with a simple menu-driven human-computer interface, was a ‘new, universally applicable,
participative communication medium - the first since the invention of the telephone’. This
experience ‘closed’ corporate information systems to be opened to ‘outside’ correspondents not
used for transaction processing but also for e-messaging and information retrieval and
dissemination, later known as e-business. There was different learning about mass
communications. However, his definition of the new mass communications medium as
participative was fundamentally different from the traditional definitions of mass
communication and mass media and a precursor to the social net working on the Internet 25
years later.
General Background to the Study
There are different dynamisms working in buying and selling. There are so many
categories of buyers too. Online consumer to buying pattern is used as the main tool to activate
funds for the economic growth of the country. In order to have continuous and constant growth
of economy in any country, well-functioning of security market is needed; the security market
provides a bridge between critical savers and ultimate consumer, the chance to position the
buying product of the careful at the disposal of the original, thus hopeful to raise the total level
of sales and growth. The development and growth of securities market changes the quantum and
composition of buying by the households. The presence and availability of yield-bearing
securities induces people to consume less and more in high elastic, divisible, liquid securities. It
is always interesting to know that strong domestic online shopping market show forms the basis
for the well relating to consumer group to raise buying promotion in the online shopping
markets.
AIM OF THE STUDY
The aim of the study to identify consumers’ satisfaction and attitude towards online
shopping, When marketers get to know the factors affecting online consumers and buyer’s
behavior, then it create huge opportunity for the marketers to develop the marketing strategies.
Accordingly and turn the potential customers into actual one and retain the exiting buyers. All
the needs are strongly affected, by different situational factors i.e., can be cognitive involvement
(indicates one’s personal relevance with the Internet 4 as a medium of shopping. It is observed

Academy of Strategic Management Journal Volume 20, Special Issue 6, 2021
3 1544-1458-20-S6-192
that more cognitively involved persons usually believe that the Internet can also raise their
shopping efficiency) and affective involvement (affective involvement include affective factors,
such as hedonic and symbolic expectations, can also influence the personal relevance of a
shopping medium.
Importance of the Study
It turns out that there are many attitudes changes in our interpersonal relationships, and it
is much more than a fundamental shift in online shopping in consumer buying behavior from
traditional to modern avenues as observed in the late decade, ideal differences and changes that
we find and this change has paved the way for a new range of post-consumer behaviors to meet
the needs and attitudes of the individual consumer. In addition, we learn that various online
shopping and consumer purchases also contribute to some regular changes to make the
individual consumer save various risks that are perfectly normal. Online vs. Offline Shopping In
traditional shopping, features of the atmosphere are a key factor influencing the consumer’s
perception. We here by learn that these features also affect whether the consumer is finding the
shopping experience pleasurable or not, as stated by Sherman, et al., (1997). It is on the other
hand, the environment in online shopping includes a much narrower range of experiences and
certain technological abilities are needed to function in such a setting. All the senses cannot be
used to perceive online shopping experiences. It is learnt that the buying pattern of consumer
among the online shopping, and its impacts on satisfaction of consumer behavior and consumer
perception an exception to this for the balanced development of the nation; it is highly essential
to analyze the online shopping of the consumer. Several factors play a role in this and this is the
main reason the researcher chooses the research topic as an economic analysis in buying pattern
of consumer in online shopping: An assessment and in depth study of consumer in Chennai.
History of Online Shopping
We know that online shopping is a form of electronic commerce in which consumers
directly buy goods or services from a seller over the Internet without an intermediary service. It
is a fact that an online shop, e-shop, e-store, Internet shop, web-shop, web-store, online store, or
virtual store evokes the physical analogy of buying products or services at a bricks-and-mortar
retailer or shopping centre. Thus, it is known that the process is called Business-to-Consumer
(B2C) online shopping. There is a tragic event taking place when a business buys from another
business it is called Business-to-Business (B2B) online shopping.
Context and the Requirement of the Study
It feel it is very clear from the review of literature made in the succeeding paragraphs
that not many studies have been undertaken exclusively to study the perceptions, preferences,
and the behavior of online shopping consumer, a very crucial area in the formulation of policies
and procedures which are very important for the orderly growth and development of online
shopping and the same has to be disseminated positively in the minds of consumer important in
any nation. By and large the studies reviewed have mainly covered the aspects at macro level,
occupation wise break-up of paid-up value of consumer of individuals, buying patterns of
consumer, geographical distribution of product in Chennai city. There are studies covering the
issue of online shopping consumer buying pattern at micro level. When referred to the context of
decline in the participation in particular, online consumer in the primary online market
operations, withdrawal of consumer from the online shopping market into safer consumer
avenues like cash on delivery bank withdrawal, online payment, debit cards and credit card
payment, they becomes all the more important to study an economic analysis in buying pattern
of consumer with special reference to Chennai city. It is understood to know that this may help
Academy of Strategic Management Journal Volume 20, Special Issue 6, 2021
4 1544-1458-20-S6-192
the policy makers in evolving the suitable strategies to get online consumer in large numbers so
that the mobilization and effective operation of the online shopping markets may improve.
Rajesh (2018) According to Rajesh online shopping in e-business concerns are vital role
moving from transactional marketing, to one-to-one affiliation marketing, for users or the
customer fulfilment. It is given special focus on key factor of online shopping like suitable and
time saving, Clear Return policy, Variety of product and brands available on online sites,
Trusted shopping, Product reviews, 24*7 Shopping, Cash on delivery and Credit card services
availability of favourite brands, clarity about terms and conditions, risk at credit card
transactions, past purchase experience etc., as well as customer satisfaction factors like return
policy, product quality, experience, touch and feel factor etc. These results will enable, e-
marketers to designs better suitable strategies, aiming to shopping practice and fulfillment.
Priyanka Sharma (2017) Appraised that online shopping was speed mounting changes
in the way people doing business all over the world. In the business-to-consumer segment, sales
through the web had been increasing eye opening moment over the last few years. Customers to
perform not only those from well developed countries but also those from developing countries
are getting used to the new shopping channel. The internet had given rise to great potential for
businesses through connecting globally in online shopping. Cash on delivery was found most
popular payment method for online shopping among consumers.
Gunjita Kumar (2017) it was reported that before demonetization goods were bought
online shopping to consumer preference and risk bearing capacity, but after demonetization it
became almost mandatory to look for maximum payments through e-wallet for all kinds of
goods and services bought. Prior to demonetization people consume to buy online either rare
goods or goods which are not easily available in the nearby market, but after demonetization
they were purchasing goods of their daily needs. Formerly people also liked to buy items online
for which satisfaction gained was assured, but currently they can use to different sites providing
the facilities like try and buy they were ready to take up the risk also.
OBJECTIVES OF THE STUDY
1. To identify the factors that influence of Pre and Post consumer behaviour
2. To evaluate the online shopping’ perception and awareness level of online consumer’ characteristics
3. To identify the factors that influence choice of buying product and expected return.
Hypothesis of the Study
1. H0=There is no association between investment perception and investor characteristics.
2. H1= There is a association between consumer perception and the consumer characteristics.
3. H0=There is no relationship between factors that influence choice of online consumer and consumer
avenues.
4. H1=There is a relationship between factors that influence choice of online consumer and consumer
avenues.
Sources of Data
Several systems are being followed to achieve the objectives, the researcher has used
both primary and secondary sources to achieve the objectives sources, and other secondary data
has also been collected from government organizations such as: B. the Statistical Supervisor
Report in the State. There is a range of data collected through the study and secondary data
provided by these organizations from their annual reports and newsletters.
Sampling Plan
The selected group or population of the locations selected for the study is very large and,
due to practical difficulties, not all respondents could be interviewed. Only samples selected for

Academy of Strategic Management Journal Volume 20, Special Issue 6, 2021
5 1544-1458-20-S6-192
research were produced in the study. Disclose your financial details, particularly the amount of
money you have spent on various online purchases on the product. Therefore, data was collected
from respondents who were willing to disclose the information. Simple random sampling is used
for the study. A cluster sampling of different socio-economic groups is carried out to select the
respondents. The study was conducted using the simple random sampling method most
appropriate for this research.
Location of the Study
Each study has a location that should be understood in terms of the factors involved in
the study. The study used a simple random sampling method as students, businesspeople,
retirees and grocers. 720 investor questionnaires will be distributed in the city of Chennai
selected for the study. Of these, 615 questionnaires were collected. Of these questionnaires of
the respondents, 15 questionnaires were found to be incomplete and unusable, from which
incorrect conclusions can be derived, so that the exact and exact sample of the study is 600.
Statistical Tools for Analysis
There has to be a reference to something to reference the research being done. This study
is based on primary data collected from investors through questionnaires. There is also a good
source of secondary data, which is also used, obtained from sources such as publications such as
books, magazines, websites, journals, and annual reports. The information collected from both
sources is analyzed, processed, tabulated and recorded in the simplest possible way for
reference. The information collected was analyzed using a social science statistics package
(IBMSPSS22). As a result, the study uses the following statistical tools to make it more
professional and technical: there is a reference data set to know the measures of central tendency
and the measures of dispersion, one-sided analysis of variance, analysis of K-medias
conglomerates, the methods and techniques used are multiple discrimination analysis, multiple
regression analysis, chi-square analysis and percent analysis. h It was also used to get the best
and correct results necessary for this research.
Limitations of the Study
The boundaries of a research are always a limitation and no study can have a limited geographical
representation. Therefore, this research is limited to the city of Chennai, and hence the conclusion cannot
cover the entire universe.
By consolidating the results and conclusions of the study, we concluded that the results, suggestions and
conclusion are only applicable to an economic analysis of consumer buying behavior when shopping
online, with particular reference to the city of Chennai.
Percentage Analysis
The following section, the percentage analysis is submitted for all the demographic
factors involved in the study (Table 1).
Table 1
GENDER DISTRIBUTION OF THE RESPONDENT
Gender Frequency Percent Cumulative Percent
Male 396 66 66
Female 204 34 100
Total 600 100
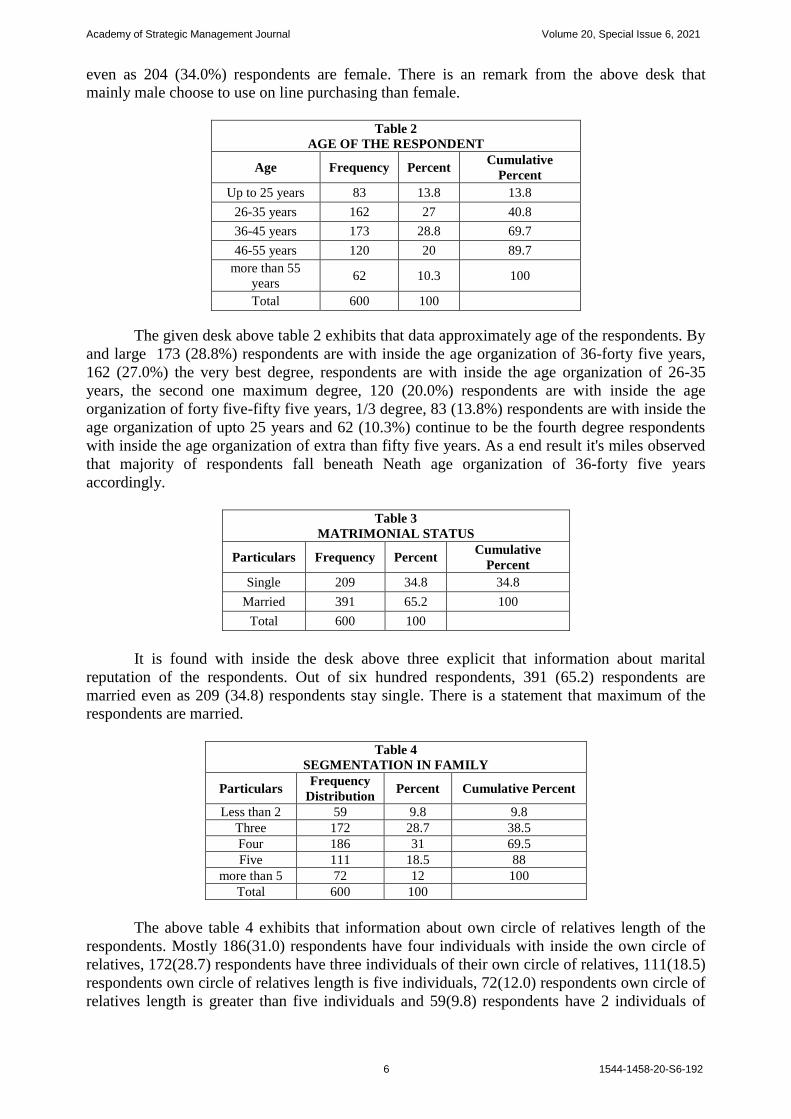
The given desk above 1 famous that information about gender sensible distribution of the
respondents of those, six hundred respondents, a majority of 396 (66%) respondents are male
Academy of Strategic Management Journal Volume 20, Special Issue 6, 2021
6 1544-1458-20-S6-192
even as 204 (34.0%) respondents are female. There is an remark from the above desk that
mainly male choose to use on line purchasing than female.
Table 2
AGE OF THE RESPONDENT
Age Frequency Percent Cumulative
Percent
Up to 25 years 83 13.8 13.8
26-35 years 162 27 40.8
36-45 years 173 28.8 69.7
46-55 years 120 20 89.7
more than 55
years 62 10.3 100
Total 600 100
The given desk above table 2 exhibits that data approximately age of the respondents. By
and large 173 (28.8%) respondents are with inside the age organization of 36-forty five years,
162 (27.0%) the very best degree, respondents are with inside the age organization of 26-35
years, the second one maximum degree, 120 (20.0%) respondents are with inside the age
organization of forty five-fifty five years, 1/3 degree, 83 (13.8%) respondents are with inside the
age organization of upto 25 years and 62 (10.3%) continue to be the fourth degree respondents
with inside the age organization of extra than fifty five years. As a end result it's miles observed
that majority of respondents fall beneath Neath age organization of 36-forty five years
accordingly.
Table 3
MATRIMONIAL STATUS
Particulars Frequency Percent Cumulative
Percent
Single 209 34.8 34.8
Married 391 65.2 100
Total 600 100
It is found with inside the desk above three explicit that information about marital
reputation of the respondents. Out of six hundred respondents, 391 (65.2) respondents are
married even as 209 (34.8) respondents stay single. There is a statement that maximum of the
respondents are married.
Table 4
SEGMENTATION IN FAMILY
Particulars Frequency
Distribution Percent Cumulative Percent
Less than 2 59 9.8 9.8
Three 172 28.7 38.5
Four 186 31 69.5
Five 111 18.5 88
more than 5 72 12 100
Total 600 100
The above table 4 exhibits that information about own circle of relatives length of the
respondents. Mostly 186(31.0) respondents have four individuals with inside the own circle of
relatives, 172(28.7) respondents have three individuals of their own circle of relatives, 111(18.5)
respondents own circle of relatives length is five individuals, 72(12.0) respondents own circle of
relatives length is greater than five individuals and 59(9.8) respondents have 2 individuals of
Academy of Strategic Management Journal Volume 20, Special Issue 6, 2021
7 1544-1458-20-S6-192
their own circle of relatives accordingly. Therefore majority of respondents have four
individuals of their own circle of relatives accordingly (Table 5).
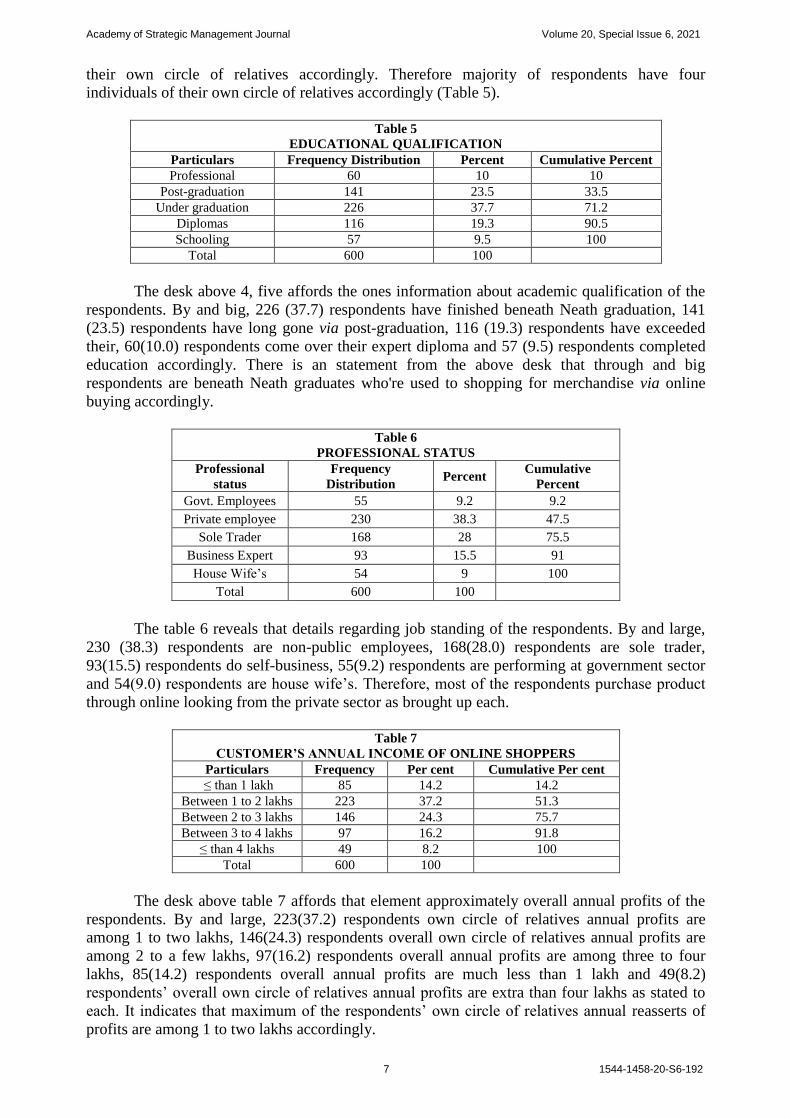
Table 5
EDUCATIONAL QUALIFICATION
Particulars Frequency Distribution Percent Cumulative Percent
Professional 60 10 10
Post-graduation 141 23.5 33.5
Under graduation 226 37.7 71.2
Diplomas 116 19.3 90.5
Schooling 57 9.5 100
Total 600 100
The desk above 4, five affords the ones information about academic qualification of the
respondents. By and big, 226 (37.7) respondents have finished beneath Neath graduation, 141
(23.5) respondents have long gone via post-graduation, 116 (19.3) respondents have exceeded
their, 60(10.0) respondents come over their expert diploma and 57 (9.5) respondents completed
education accordingly. There is an statement from the above desk that through and big
respondents are beneath Neath graduates who're used to shopping for merchandise via online
buying accordingly.
Table 6
PROFESSIONAL STATUS
Professional
status
Frequency
Distribution Percent
Cumulative
Percent
Govt. Employees 55 9.2 9.2
Private employee 230 38.3 47.5
Sole Trader 168 28 75.5
Business Expert 93 15.5 91
House Wife’s 54 9 100
Total 600 100
The table 6 reveals that details regarding job standing of the respondents. By and large,
230 (38.3) respondents are non-public employees, 168(28.0) respondents are sole trader,
93(15.5) respondents do self-business, 55(9.2) respondents are performing at government sector
and 54(9.0) respondents are house wife’s. Therefore, most of the respondents purchase product
through online looking from the private sector as brought up each.
Table 7
CUSTOMER’S ANNUAL INCOME OF ONLINE SHOPPERS
Particulars Frequency Per cent Cumulative Per cent
≤ than 1 lakh 85 14.2 14.2
Between 1 to 2 lakhs 223 37.2 51.3
Between 2 to 3 lakhs 146 24.3 75.7
Between 3 to 4 lakhs 97 16.2 91.8
≤ than 4 lakhs 49 8.2 100
Total 600 100
The desk above table 7 affords that element approximately overall annual profits of the
respondents. By and large, 223(37.2) respondents own circle of relatives annual profits are
among 1 to two lakhs, 146(24.3) respondents overall own circle of relatives annual profits are
among 2 to a few lakhs, 97(16.2) respondents overall annual profits are among three to four
lakhs, 85(14.2) respondents overall annual profits are much less than 1 lakh and 49(8.2)
respondents’ overall own circle of relatives annual profits are extra than four lakhs as stated to
each. It indicates that maximum of the respondents’ own circle of relatives annual reasserts of
profits are among 1 to two lakhs accordingly.
Academy of Strategic Management Journal Volume 20, Special Issue 6, 2021
8 1544-1458-20-S6-192
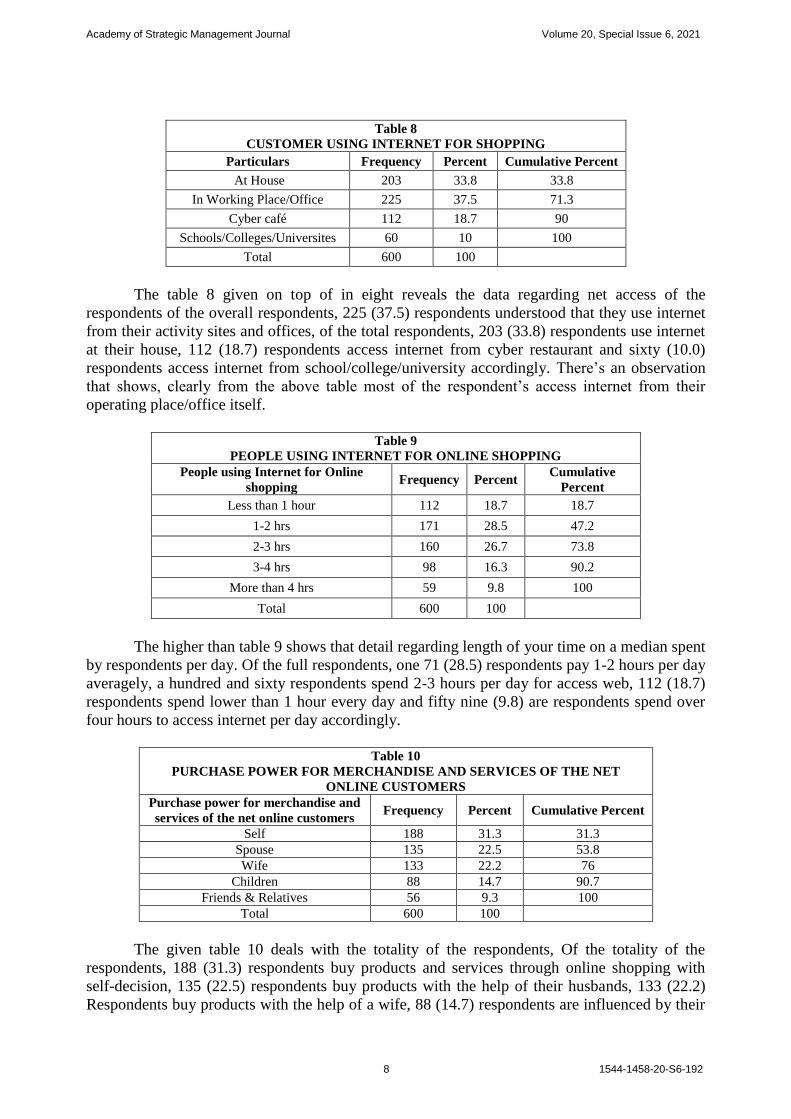
Table 8
CUSTOMER USING INTERNET FOR SHOPPING
Particulars Frequency Percent Cumulative Percent
At House 203 33.8 33.8
In Working Place/Office 225 37.5 71.3
Cyber café 112 18.7 90
Schools/Colleges/Universites 60 10 100
Total 600 100
The table 8 given on top of in eight reveals the data regarding net access of the
respondents of the overall respondents, 225 (37.5) respondents understood that they use internet
from their activity sites and offices, of the total respondents, 203 (33.8) respondents use internet
at their house, 112 (18.7) respondents access internet from cyber restaurant and sixty (10.0)
respondents access internet from school/college/university accordingly. There’s an observation
that shows, clearly from the above table most of the respondent’s access internet from their
operating place/office itself.
Table 9
PEOPLE USING INTERNET FOR ONLINE SHOPPING
People using Internet for Online
shopping Frequency Percent
Cumulative
Percent
Less than 1 hour 112 18.7 18.7
1-2 hrs 171 28.5 47.2
2-3 hrs 160 26.7 73.8
3-4 hrs 98 16.3 90.2
More than 4 hrs 59 9.8 100
Total 600 100
The higher than table 9 shows that detail regarding length of your time on a median spent
by respondents per day. Of the full respondents, one 71 (28.5) respondents pay 1-2 hours per day
averagely, a hundred and sixty respondents spend 2-3 hours per day for access web, 112 (18.7)
respondents spend lower than 1 hour every day and fifty nine (9.8) are respondents spend over
four hours to access internet per day accordingly.
Table 10
PURCHASE POWER FOR MERCHANDISE AND SERVICES OF THE NET
ONLINE CUSTOMERS
Purchase power for merchandise and
services of the net online customers Frequency Percent Cumulative Percent
Self 188 31.3 31.3
Spouse 135 22.5 53.8
Wife 133 22.2 76
Children 88 14.7 90.7
Friends & Relatives 56 9.3 100
Total 600 100
The given table 10 deals with the totality of the respondents, Of the totality of the
respondents, 188 (31.3) respondents buy products and services through online shopping with
self-decision, 135 (22.5) respondents buy products with the help of their husbands, 133 (22.2)
Respondents buy products with the help of a wife, 88 (14.7) respondents are influenced by their
Academy of Strategic Management Journal Volume 20, Special Issue 6, 2021
9 1544-1458-20-S6-192
children and 56 (9.3) respondents are influenced accordingly by their friends and family.
Therefore, most of the respondents buy their products based on their own decision.
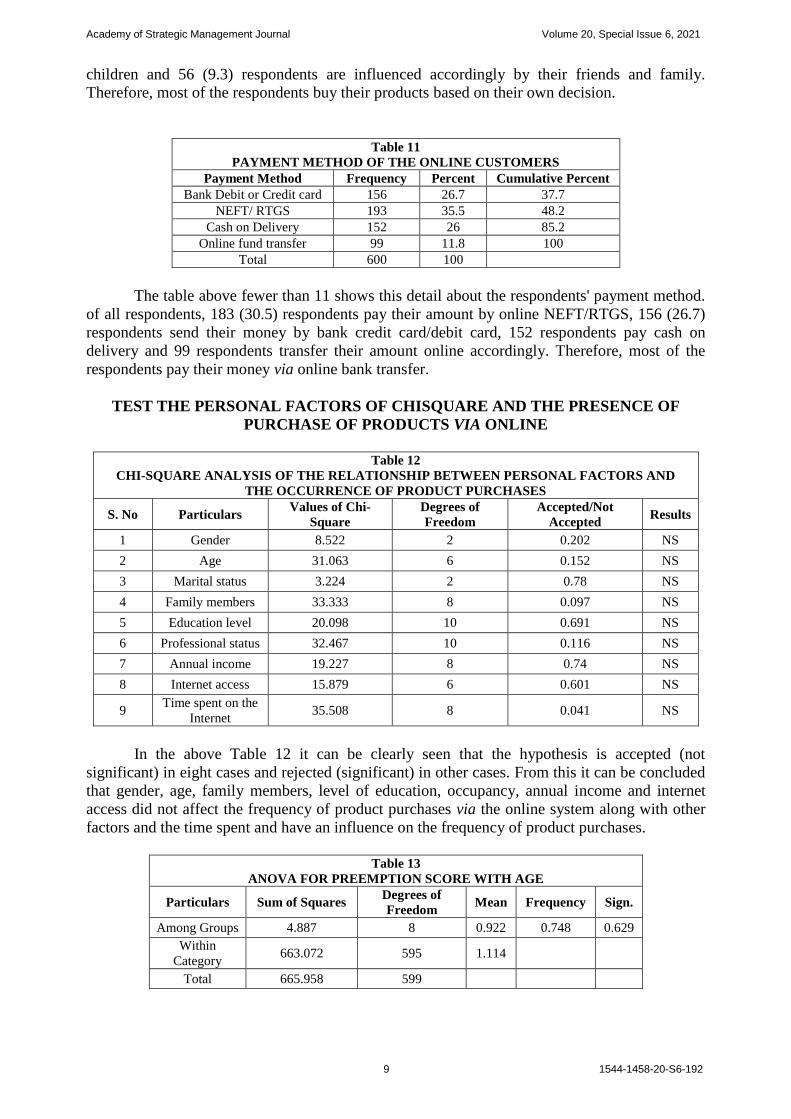
Table 11
PAYMENT METHOD OF THE ONLINE CUSTOMERS
Payment Method Frequency Percent Cumulative Percent
Bank Debit or Credit card 156 26.7 37.7
NEFT/ RTGS 193 35.5 48.2
Cash on Delivery 152 26 85.2
Online fund transfer 99 11.8 100
Total 600 100
The table above fewer than 11 shows this detail about the respondents' payment method.
of all respondents, 183 (30.5) respondents pay their amount by online NEFT/RTGS, 156 (26.7)
respondents send their money by bank credit card/debit card, 152 respondents pay cash on
delivery and 99 respondents transfer their amount online accordingly. Therefore, most of the
respondents pay their money via online bank transfer.
TEST THE PERSONAL FACTORS OF CHISQUARE AND THE PRESENCE OF
PURCHASE OF PRODUCTS VIA ONLINE
Table 12
CHI-SQUARE ANALYSIS OF THE RELATIONSHIP BETWEEN PERSONAL FACTORS AND
THE OCCURRENCE OF PRODUCT PURCHASES
S. No Particulars Values of Chi-
Square
Degrees of
Freedom
Accepted/Not
Accepted Results
1 Gender 8.522 2 0.202 NS
2 Age 31.063 6 0.152 NS
3 Marital status 3.224 2 0.78 NS
4 Family members 33.333 8 0.097 NS
5 Education level 20.098 10 0.691 NS
6 Professional status 32.467 10 0.116 NS
7 Annual income 19.227 8 0.74 NS
8 Internet access 15.879 6 0.601 NS
9 Time spent on the
Internet 35.508 8 0.041 NS
In the above Table 12 it can be clearly seen that the hypothesis is accepted (not
significant) in eight cases and rejected (significant) in other cases. From this it can be concluded
that gender, age, family members, level of education, occupancy, annual income and internet
access did not affect the frequency of product purchases via the online system along with other
factors and the time spent and have an influence on the frequency of product purchases.
Table 13
ANOVA FOR PREEMPTION SCORE WITH AGE
Particulars Sum of Squares Degrees of
Freedom Mean Frequency Sign.
Among Groups 4.887 8 0.922 0.748 0.629
Within
Category 663.072 595 1.114
Total 665.958 599
Academy of Strategic Management Journal Volume 20, Special Issue 6, 2021
10 1544-1458-20-S6-192
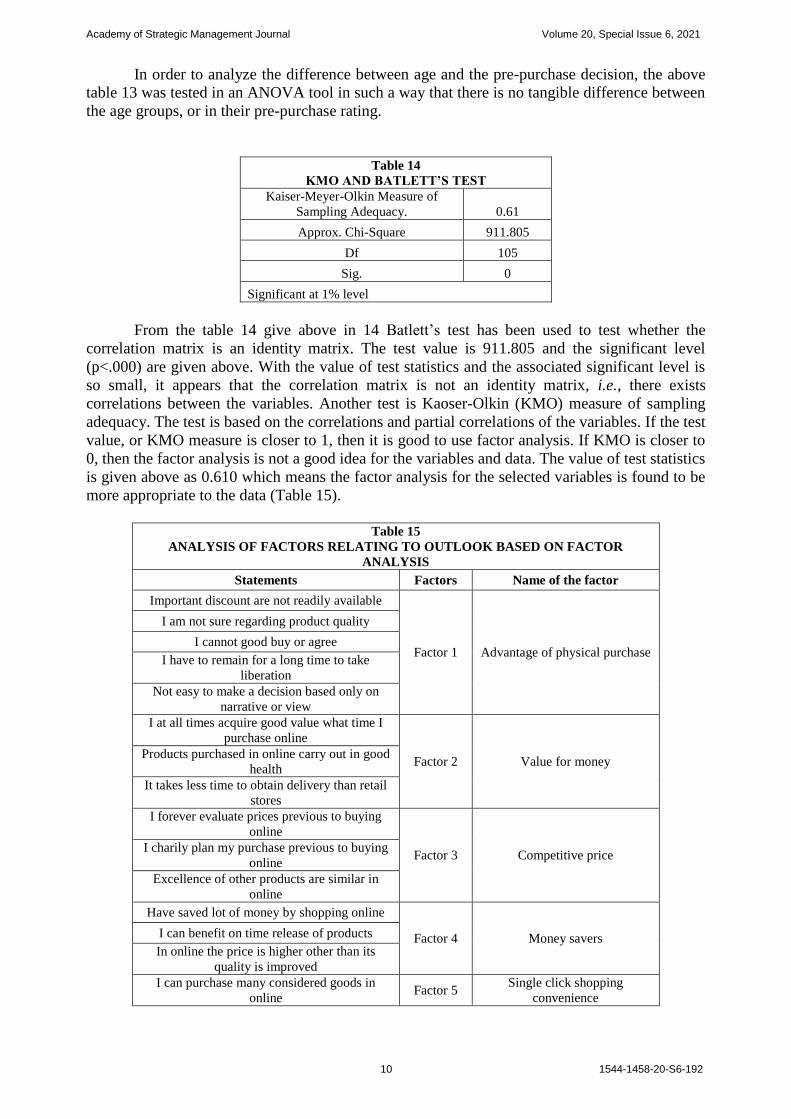
In order to analyze the difference between age and the pre-purchase decision, the above
table 13 was tested in an ANOVA tool in such a way that there is no tangible difference between
the age groups, or in their pre-purchase rating.
Table 14
KMO AND BATLETT’S TEST
Kaiser-Meyer-Olkin Measure of
Sampling Adequacy. 0.61
Approx. Chi-Square 911.805
Df 105
Sig. 0
Significant at 1% level
From the table 14 give above in 14 Batlett’s test has been used to test whether the
correlation matrix is an identity matrix. The test value is 911.805 and the significant level
(p<.000) are given above. With the value of test statistics and the associated significant level is
so small, it appears that the correlation matrix is not an identity matrix, i.e., there exists
correlations between the variables. Another test is Kaoser-Olkin (KMO) measure of sampling
adequacy. The test is based on the correlations and partial correlations of the variables. If the test
value, or KMO measure is closer to 1, then it is good to use factor analysis. If KMO is closer to
0, then the factor analysis is not a good idea for the variables and data. The value of test statistics
is given above as 0.610 which means the factor analysis for the selected variables is found to be
more appropriate to the data (Table 15).
Table 15
ANALYSIS OF FACTORS RELATING TO OUTLOOK BASED ON FACTOR
ANALYSIS
Statements Factors Name of the factor
Important discount are not readily available
Factor 1 Advantage of physical purchase
I am not sure regarding product quality
I cannot good buy or agree
I have to remain for a long time to take
liberation
Not easy to make a decision based only on
narrative or view
I at all times acquire good value what time I
purchase online
Factor 2 Value for money Products purchased in online carry out in good
health
It takes less time to obtain delivery than retail
stores
I forever evaluate prices previous to buying
online
Factor 3 Competitive price I charily plan my purchase previous to buying
online
Excellence of other products are similar in
online
Have saved lot of money by shopping online
Factor 4 Money savers I can benefit on time release of products
In online the price is higher other than its
quality is improved
I can purchase many considered goods in
online Factor 5
Single click shopping
convenience
Academy of Strategic Management Journal Volume 20, Special Issue 6, 2021
11 1544-1458-20-S6-192
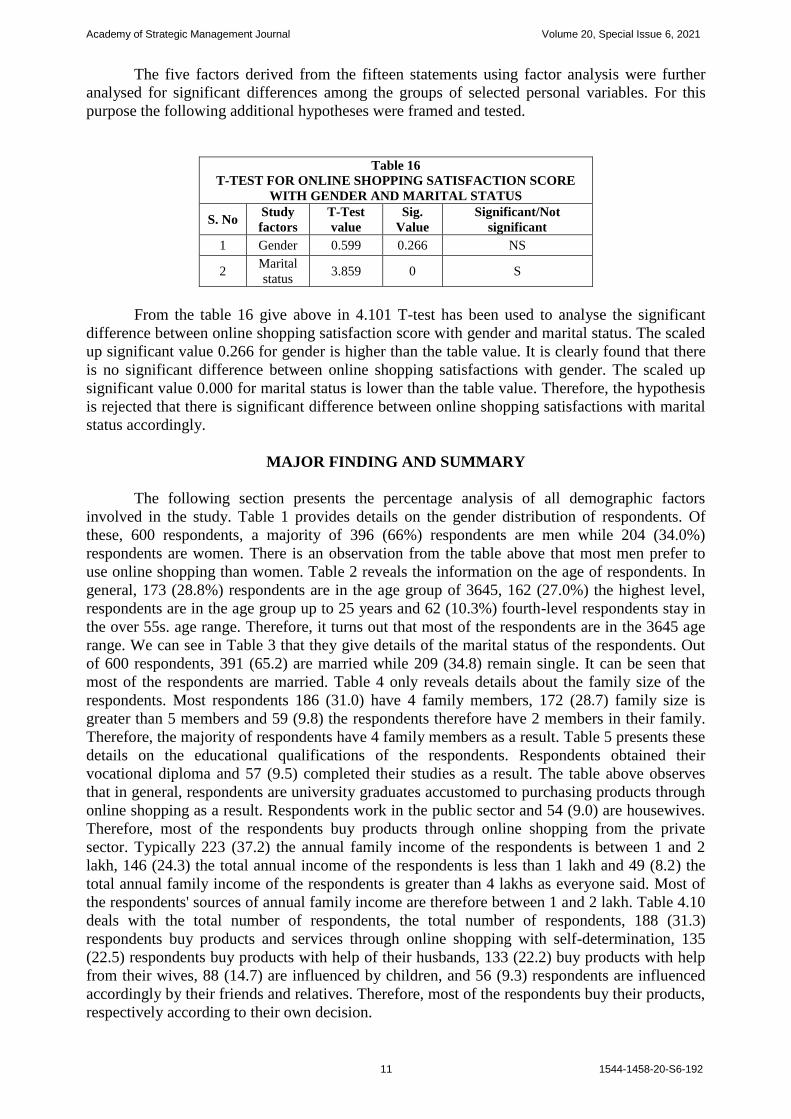
The five factors derived from the fifteen statements using factor analysis were further
analysed for significant differences among the groups of selected personal variables. For this
purpose the following additional hypotheses were framed and tested.
Table 16
T-TEST FOR ONLINE SHOPPING SATISFACTION SCORE
WITH GENDER AND MARITAL STATUS
S. No Study
factors
T-Test
value
Sig.
Value
Significant/Not
significant
1 Gender 0.599 0.266 NS
2 Marital
status 3.859 0 S
From the table 16 give above in 4.101 T-test has been used to analyse the significant
difference between online shopping satisfaction score with gender and marital status. The scaled
up significant value 0.266 for gender is higher than the table value. It is clearly found that there
is no significant difference between online shopping satisfactions with gender. The scaled up
significant value 0.000 for marital status is lower than the table value. Therefore, the hypothesis
is rejected that there is significant difference between online shopping satisfactions with marital
status accordingly.
MAJOR FINDING AND SUMMARY
The following section presents the percentage analysis of all demographic factors
involved in the study. Table 1 provides details on the gender distribution of respondents. Of
these, 600 respondents, a majority of 396 (66%) respondents are men while 204 (34.0%)
respondents are women. There is an observation from the table above that most men prefer to
use online shopping than women. Table 2 reveals the information on the age of respondents. In
general, 173 (28.8%) respondents are in the age group of 3645, 162 (27.0%) the highest level,
respondents are in the age group up to 25 years and 62 (10.3%) fourth-level respondents stay in
the over 55s. age range. Therefore, it turns out that most of the respondents are in the 3645 age
range. We can see in Table 3 that they give details of the marital status of the respondents. Out
of 600 respondents, 391 (65.2) are married while 209 (34.8) remain single. It can be seen that
most of the respondents are married. Table 4 only reveals details about the family size of the
respondents. Most respondents 186 (31.0) have 4 family members, 172 (28.7) family size is
greater than 5 members and 59 (9.8) the respondents therefore have 2 members in their family.
Therefore, the majority of respondents have 4 family members as a result. Table 5 presents these
details on the educational qualifications of the respondents. Respondents obtained their
vocational diploma and 57 (9.5) completed their studies as a result. The table above observes
that in general, respondents are university graduates accustomed to purchasing products through
online shopping as a result. Respondents work in the public sector and 54 (9.0) are housewives.
Therefore, most of the respondents buy products through online shopping from the private
sector. Typically 223 (37.2) the annual family income of the respondents is between 1 and 2
lakh, 146 (24.3) the total annual income of the respondents is less than 1 lakh and 49 (8.2) the
total annual family income of the respondents is greater than 4 lakhs as everyone said. Most of
the respondents' sources of annual family income are therefore between 1 and 2 lakh. Table 4.10
deals with the total number of respondents, the total number of respondents, 188 (31.3)
respondents buy products and services through online shopping with self-determination, 135
(22.5) respondents buy products with help of their husbands, 133 (22.2) buy products with help
from their wives, 88 (14.7) are influenced by children, and 56 (9.3) respondents are influenced
accordingly by their friends and relatives. Therefore, most of the respondents buy their products,
respectively according to their own decision.
Academy of Strategic Management Journal Volume 20, Special Issue 6, 2021
12 1544-1458-20-S6-192
Chi-Square Test
The method of analysis used is Chi square test which is used to test the significance of
influence of personal factors of the respondents, over the study factors at 1% and 5% level of
significance. While applying the chi-square test, the factors in the study are classified into two
groups. The earlier group consists of personal factors namely, Gender, Age, Marital Status,
Family Members, Educational Qualification, Occupation, Annual Income, Internet Access, Time
spent on internet. The second groups consists of study factors namely Frequency of purchase of
products through online, Daily basis, Weekly basis, Fortnightly, Monthly, Quarterly, Bi-
Annually, Yearly basis, The results are presented in the following tables, with suitable
hypothesis and relevant interpretations.
Pre - Purchased Decision Making Factors
The analysis of the difference between age and pre-purchase decision was tested. It has
obviously been found that the hypothesis is accepted. Therefore, it is understood in conclusion
that there is no tangible difference between age groups, respectively, in their pre-purchase
decision score difference between family members. Therefore, it is clear that from the above
table the hypothesis is rejected and shows that there is a tangible difference between family
members in their pre-purchase decisions as a result. It is therefore understood and clears from
the table mentioned above, that there is no tangible difference between the diploma, in the pre-
purchase decision score and the hypothesis is accepted. The tangible difference between
different professional levels in their pre-purchase decision score. Significant value. 648 is
greater than the value in the array tangible difference between different professional levels in
their pre-purchase decision score. The hypothesis is therefore accepted. The significant value is
0.107 is greater than the table value at a significant level of 0.05. Therefore, the assumption is
accepted that there is no tangible difference between their annual income and their pre-purchase
decision score as a result. Therefore, the hypothesis is rejected that there is a tangible difference
between Internet accesses in their pre-purchase decision score as a result. The table analyzes the
tangible difference between the times spent in their pre-purchase decision score. Therefore, the
hypothesis is accepted, it shows that there is no tangible difference between the time spent in
their pre-purchase decision score.
On-Purchase Decision Making Factors
The analysis analyzes the tangible difference between age groups in their purchasing
decision score. The significant value 0.062 is greater than the table value at significant levels of
0.05. Therefore, it is accepted that there is no tangible difference between age groups in their
purchasing decision score. The significant value 0.040 is less than the table value at significant
levels 0.05. Therefore, the hypothesis that there is a tangible difference between family members
in the score relating to the purchase decision as a result is rejected. Significant value.591 is
greater than the table value at 0.05 significant levels. Therefore, it is accepted that there is no
tangible difference between the educational qualification and the purchasing decision score as a
result. He accepts the hypothesis that there is no tangible difference between the employment
levels in their purchasing decision score as a result. The significant value 0.000 is less than the
table value at 0.05 significant levels. Therefore, the hypothesis that there is a tangible difference
between the annual incomes in the purchasing decision score is rejected. The significant value
0.351 is greater than the array value of 0.05 significant levels. Therefore, it is accepted that there
is no tangible difference between Internet accesses in their purchasing decision score as a result.
The average score is 3.144 and the F value is 2.662 for the Time Elapsed Purchase Decision
Score. The significant value is 0.032 less than the table value at significant levels of 0.05. So
there is a tangible difference between the times taken in their purchasing decision score.
Certainly the hypothesis is rejected, according to the table above.
Academy of Strategic Management Journal Volume 20, Special Issue 6, 2021
13 1544-1458-20-S6-192
Post Purchase Decision Making Factors
The mean score is 1334 and the F value is 1357 for the post-purchase decision score with
age. Significant 0.247 is greater than table value at 0.05 significant levels. It is therefore
accepted that there is no tangible difference between age groups in the score of post-purchase
decisions as a result. The average score is 1.526 and the F value is 1.554 for the post-purchase
decision score with family members. The significant value 0.185 is greater than the table value
at 0.05 significant levels. Therefore, it is accepted that there is no tangible difference between
family members in their post-purchase decision score. The average score is 1.453 and the F-
value is 1.480 for the score for post-purchase decisions with a diploma. The significant value
0.207 is greater than the table value at significant levels of 0.05. We therefore accept the
hypothesis that there is no tangible difference between the qualifications in the score of the
decisions following the purchase. The highest mean score is 5,631 and the F value is 5,902 for
the post-purchase decision score with employment. The significant value 0.000 is less than the
table value at 0.05 significant levels. Therefore, the hypothesis of a tangible difference between
the occupancy level in the post-purchase decision score is rejected accordingly. The calculated
value 0.340 is greater than the table value at 0.05 significant level. Therefore, it is accepted that
there is no tangible difference between the annual income in their post-purchase decision score.
The calculated value 0.123 is greater than the table value at the 0.05 significant levels.
Therefore, it is accepted the assumption that there is therefore no tangible difference between
Internet access in their post-purchase decision score. It is therefore accepted that there is no
tangible difference between the time spent in their post-purchase decision score.
Other Decision Making Factors
The analysis analyzes the tangible difference between age groups in their decision score
on other factors. The mean value is 0.743 and the F value is 0.715 for other factors with age. The
significant value has increased. 582 is greater than the table value at 0.05 significant values.
Therefore, it is accepted that there is no tangible difference between age groups in the decision
score of other factors as a result. The average score is 3.382 and the F value is 3.308 for other
factors with family members. The significant value increased by 0.011 is less than the table
value at significant levels of 0.05. Therefore, the hypothesis that there is a tangible difference
between family members in their decision score on other factors is rejected. The average score is
0.552 and the F value is 0.530 for the other factors with annual income. The calculated value
0.714 is greater than the table value at 0.05 significant levels. Therefore, it is accepted that there
is no tangible difference between the annual incomes in their decision score for other factors as a
result. The significant value increased by 0.989 is greater than the table value at 0.05 significant
levels. Therefore, the assumption is accepted that there is no tangible difference between
Internet access and their decision score of other factors.
ANALYSIS OF CONSUMER ATTITUDE FACTORS TOWARDS ONLINE
PURCHASES
Correlation matrix for the variables, item 1 to item 15, included in Question 15;
Consumer Attitude towards online shopping was analyzed initially for possible inclusion in
Factor Analysis. Usually a correlation value of 0.3 (absolute value) is taken as sufficient to
explain the relation between variables. All the variables from 1 to 15 have been retained for
further analysis. Further, two tests are applied to the resultant correlation matrix to test whether
the relationship among the variables is significant or not. The variances extracted by the factors
are called the Eigen values. Now that we have measure of how much variance each successive
factor extracts and we can decide about the number of factor storetain. We can retain only
factors with Eigen values greater than 1. In essence, this is like saying that, unless a factor

Academy of Strategic Management Journal Volume 20, Special Issue 6, 2021
14 1544-1458-20-S6-192
extracts at least as much as the equivalent of one original variable, we drop it. This criterion is
probably the one most widely used and is followed in this study also. In our example above,
using this criterion, we would retain 5 factors (principal components). The five factors derived
from the fifteen statements using factor analysis were further analysed for significant differences
among the groups of selected personal variables. For this purpose the following additional
hypotheses were framed and tested.
Regression Analysis for Consumer Satisfaction towards Online Shopping
It is observed from the above table that the multiple correlations between the selected
independent variables and dependent variables (Online shopping Satisfaction Score) was 0.312,
which indicated that there was a high level of correlations between the independent variables
and dependent variables. The F-test value was significant showing 4.494. The R2 value (0.097)
indicated that 9.7% of variation in attitude was influenced by the related independent variables.
Individually, from the regression co-efficient it was found that gender, number of family
members, annual income, length of income and pre-purchase
decisionshadpositiveeffectontheconsumersatisfactionwhereastheotherfactorsarenegativeaspectso
nthesatisfactionlevel. Howeverindependentvariableslike marital status, number of family
members, educational qualification, occupation, annual income and length of time score had
significantly affected the consumer satisfaction level.
Suggestions
The examiner has finished delicate write to respondents who have purchased products
and services through online. It is accomplished that the majority of the respondents have a good
outlook regarding online shopping, although in crowd are so many evils to be enhanced by the
vendors and examine providers.
1. As present are no appropriate laws on behalf of online purchases, they have to be implemented to avoid the
unspecified intruders. This will lend a hand to keep up safety measures and private information
appropriately relating to the respondents. So the website developers and service providers should take
compulsory steps to overcome this problem
2. To provide website design and quality of services impact on online shopping satisfaction. So the vendor
companies should focus more on the design part of the websites. Web based technology upgrades original
conceptualization with the purpose of would get better the answer from knowledge know-how consumers.
So the firms encompass to devote in such new technologies.
3. Internet backgrounds have to be enhanced in the areas of art, dynamic and interactive techniques. These
development determinations provide supplementary illustration application.
4. The major drawbacks of respondents include felt are no proper recurring strategy to the product. After
getting opinion from the respondent condition the on top of said problem occurs, and then they are
hypothetical to be present guided in a appropriate way to go back the product. These resolves generate a
good website standing and re-purchasing power of the respondents.
5. Due to the scientific growth the check providers must execute new original ideas to exhibit information
about the product. Now-a-day’s 360 degree method is mostly helpful to be acquainted with about all the
location of the product. This process will help to create self-confidence about the product. So all the
service provider’s should realize these kinds of ground-breaking methods.
6. The dependability and accessibility of the release structure is the explanation accomplishment issue for a
few online businesses and this determination create a center of attention the consumers repurchase
objective.
7. Even although the customers have a basic knowledge about online shopping, they are ineffective to put
into operation it since the language becomes a difficulty. Upward regional language oriented websites
would help new comers to improve their knowledge and also to augment the online purchasers.
CONCLUSION
It is here that before consumers had enough time to visit shopping malls, looking for
various products, many consumers choose to bargain and decide their purchases after physical
Academy of Strategic Management Journal Volume 20, Special Issue 6, 2021
15 1544-1458-20-S6-192
evaluation of raw materials. The whole process can vary from a few hours to a few weeks
depending on the product, quantity, quality, brands, brands, companies and source of purchase.
Nowadays and today there is a drastic change in the whole storyline. There is a broad feeling
that everything in the world today is internet oriented, such as electronic data interchange,
electronic location, e-commerce, and e-commerce. Electronic commerce is the exchange of
information using network-based technologies. In today's high cost situation, e-commerce may
exist used as a competitive strategy, so it increasingly includes the whole online process of
development, marketing, sales, delivery, support and payment products and services. The
problem of online shopping is an immeasurable assembly technology. Correct Used with
guaranteed security and protection for transactions, it will thrive in a highly competitive and
motivated environment. The population of Chennai city is very tech savvy and the city is dotted
with businesses of many successful entrepreneurs. Chennai has many industries, properties,
corporate hospitals and a number of engineering colleges. In the future, online shopping is
expected to increase significantly given the growing youth population.
REFERENCES
Acquisti & Varian (2005). Conditioning prices on purchase history. Journal of Marketing Science, 24(3), 367-381.
Ahmed, A. (2016). Correlates of consumer online buying behavior. International journal of management and
Applied Science, 2(1), 12-18.
Ahmad, S. (2002). Service failures and customer selection: A Closer look at online shopping experiences. Journal
of Managing Service Quality, 12(1), 19-29.
Alan, D.S., & Dean, R.M. (2004). Exploring the trust factor in medicine. Online Information Review, 28(5), 346-
355.
Aleja, I.S., & Joan, F. (2005). Ethical aspects at e-commerce: Data subjects and context. New York Times.
Dhanalakshmi, M. (2018). A study on customer perception towards online shopping. International Journal of
Engineering Research & Technology, 5(11).
Mayakkannan, R. (2018). Impact of buying behaviour of consumers towards instant food products in Chennai
district. International Journal of Pure and Applied Mathematics,119(12), 16279-16286.
Gunjita, K. (2017). Influence of demonetization on consumer’s buying behavior towards online shopping. Journal
of interdisciplinary research.
Gopal, R., & Deepika, J. (2016). Consumer buying behavior towards online shopping. International Journal of
information research and review.
Hua, Z., & Ping, Q. (2016). Rural consumers’ online shopping. International journal of retails & distribution
management.
Murali, K., & Chalam, G.V. (2015). Attitude of consumers towards online- marketing. International Journal of
emerging research in management and technology.
Mohammed, J.U. (2015). ACMA and Tunazzina Sultana, consumer preference on online purchasing. Journal of
direct marketing.
Priyanka, S. (2017). A study on Consumer behavior towards online shopping an empirical study with reference.
International journal of advanced research in management.
Rajesh, R. (2018). Evaluating the factors influencing online shopping and its consumer satisfaction in Pune area.
International Journal of Social Sciences, 4(1), 54-76.
Sanjay, K. (2015). Online shopping - A literature review. Proceedings of National Conference on Innovative Trends
in Computer Science Engineering.
Sarita, D., & Parul, S. (2018). Online shopping: Interplay of influencing factors, risks and benefits. South Asian
Journal of Marketing and Management Research, 5(2), 30-42.
Senthilkumar, C.B., Rajesh, G., Rohini, B., Mayakkannan, R., & Kandeepan, E. (2020). Customer satisfaction
towards Honda activa: A study in Chennai City. The Mattingley Publishing Co., Inc.
Shalini, G.R., & Hemamalini, K.S. (2015). A study of online shopping website characteristics and its impact on
consumer intention to purchase online. International journal of service industry management.
Silpa, K.S., & Rajasree, P.U. (2016). A study on people’s perceptions towards online shopping. International
Journal of Industrial and management, 6(3), 93-95.