Embed Size (px)
Citation preview
www.pbr.co.in
A Study on Corporate Leverage and Profitability of Pharmaceutical Industry
in India: An Empirical Analysis
Pacific Business Review InternationalVolume 10 Issue 6, December 2017
111
Abstract
The present study seeks to examine the impact of corporate leverage on profitability of pharmaceutical industry in India. The period of study is considered for 10 years i.e. from 2004-05 to 2013-14. The study is based on Secondary Data. 37 pharmaceutical firms listed in National Stock Exchange (NSE)are considered for analysis during the study period. Three independent variables Financial Leverage (FL) , Operating Leverage (OL), and Combined Leverage (CL) and three dependent variables Return on Assets (ROA), Return on Equity (ROE) and Earning Per Share( EPS) have been used and tested by using regression and correlation analysis as statistical tools. The findings of the study indicate that there is a significant impact of CL and OL on Profitability (ROA, ROE and EPS) have significant impact on the CL on Profitability is chosen by pharmaceutical Industry in India for the study period.
Keywords: Capital structure, operating leverage, financial leverage, combined leverage.
JEL Classification Code: G34, G30, G31, G32.
Introduction
Jensen (1986) argues that firms having more internally generated funds than positive net present value investment opportunities, the presence of debt in the firm’s Capital Structure may force managers to utilize the funds in servicing the debt which could have been utilized in investing in negative net present value projects at the detriment of shareholder’s interest..
Matt (2000) stated “Financial Leverage (FL) is the final component of return on equity. FL is a measure of how much firm uses equity and debt to finance its assets. As debt increases, FL increases. Management tends to prefer equity financing over debt since it carries less risk.” Pandey (2006) described the use of the fixed-charges sources of funds, such as debts and preference capital along with the owner’s equity in the capital structure, is described as financial leverage or gearing or trading on equity.
Significance of The Study
This study is very useful for the financial manager to know the variables, which affect the debt equity mix of the Pharmaceutical industry in India.
Dr. N. S. PandeyAssistant Professor
P.G & Research Department Of Commerce
Kanchi Mamunivar Centre for
Post Graduate Studies
Puducherry
Ponni. RResearch Scholar
P.G & Research Department Of Commerce
Kanchi Mamunivar Centre for
Post Graduate Studies
Puducherry
www.pbr.co.inwww.pbr.co.in
Pacific Business Review International
112
The result of this study is significant to the lending institutions to prevent and to decrease non-performing assets, while granting loans and advances to companies belonging to Pharmaceutical industry in India.
Shareholders too stand to gain out of the results of the study .They can understand the magnitude of leverage engaged by the Pharmaceutical Industry and accordingly reorganize their portfolio.
Scope of The Study
The study is limited to analyze for a period of ten years i.e., from 2004-05 to 2013-14 and the study is limited to the Pharmaceutical Industry with the firms which have listing flag with national stock exchange and Bombay stock exchange.
Objectives of The Study
The following objectives of the present study with reference to the impact of leverage on profitability of selected Indian Pharmaceutical industry have been listed out.
• To evaluate the relationship between leverage and profitability of a pharmaceutical industry in India.
• To examine the impact of leverage on profitability.
• To examine the Growth and trend of various measures CL and Profitability of Pharmaceutical industries in India over the period under study.
Hypotheses Developed for The Study
• H01: Operating leverage does not have an impact on ROA.
• H02: Operating leverage does not have an impact on on ROE.
• H03: Operating leverage does not have an impact on on EPS.
• H04: Financial leverage does not have an impact on ROA.
• H05: Financial leverage does not have an impact on ROE.
• H06: Financial leverage does not have an impact on EPS.
• H07: Financial leverage does not have an impact on ROA.
• H08: Financial leverage does not have an impact on ROE.
• H09: Financial leverage does not have an impact on EPS.
• H010: Corporate leverage and Profitability (ROA, ROE, and EPS) do not have significant relationship.
Research Methodology For The Study
The study is based on the secondary source of data. The relevant data for the measurement of variables was taken from the national stock exchange (NSE) (www.nseindia. com), and money control (www.money control.com).
Population
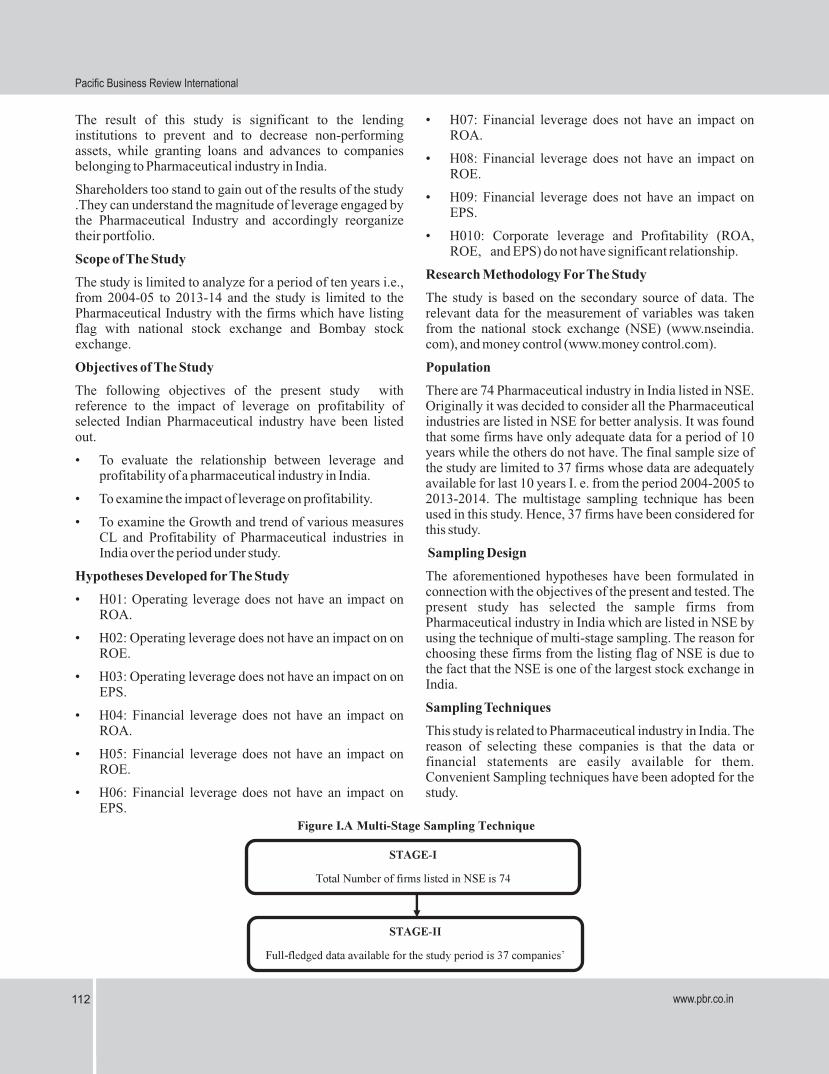
There are 74 Pharmaceutical industry in India listed in NSE. Originally it was decided to consider all the Pharmaceutical industries are listed in NSE for better analysis. It was found that some firms have only adequate data for a period of 10 years while the others do not have. The final sample size of the study are limited to 37 firms whose data are adequately available for last 10 years I. e. from the period 2004-2005 to 2013-2014. The multistage sampling technique has been used in this study. Hence, 37 firms have been considered for this study.
Sampling Design
The aforementioned hypotheses have been formulated in connection with the objectives of the present and tested. The present study has selected the sample firms from Pharmaceutical industry in India which are listed in NSE by using the technique of multi-stage sampling. The reason for choosing these firms from the listing flag of NSE is due to the fact that the NSE is one of the largest stock exchange in India.
Sampling Techniques
This study is related to Pharmaceutical industry in India. The reason of selecting these companies is that the data or financial statements are easily available for them. Convenient Sampling techniques have been adopted for the study.
03www.pbr.co.in
Volume 10 Issue 6, December 2017
113
Volume 10 Issue 6, December 2017
www.pbr.co.in
Review of Literature
Veni and Narayanan (2002) has Studied "Leverage, Capital Structure, Dividend Policy and Practices — the management Accountant" the Leverage, Capital Structure dividend Policy and practices on Coromandel Fertilizers ltd. This study reveals the effect of debt-equity mix and its impact and the dividend policy and also the leverage impact. Mohanty (2003) found in the study entitled, “Are view of research on the practices of corporate finance”, that value of the firm both within industry as well as within the Indian economy and leverage is negatively related with profitability. It also found that companies spend a large sum of money on advertisement and research and development expenditure are least levered. Aivazian (2005) analysed the “The impact of leverage on firm’s investment Canadian evidence”, impact of leverage on investment on Canadian industrial companies cover the period from 1982 to 1999. They found a negative relationship between investment and leverage and that the relationship is higher for low growth firms rather than high growth firms.
Narender and Sharma (2006), concluded in the study entitled “Determinants of Capital Structure in Public Enterprises” and the study found that the tangibility of asset influenced the leverage in the price earnings ratios.. Singh and Chitto (2008) analyzed in the study “Does financial leverage influence Investment Decision. The case of Mauritian Firms?” the study inferred that leverage has a significant negative effect on investments and suggested it is not the case for high growth firm.
Kumamangalam and Govindasami (2010) have examined the impact of leverage on the profitability of selected cement companies in India. It explains the relationship between debt equity ratio & earnings per share and how effectively the firm uses debt financing. Its result of the study suggested that leverage, profitability and growth are positively related and leverage had impact on profitability of firm. Virani (2010) in the study “impact of leverage on profitability of pantaloon retail India Ltd” had stated that finance decision was concerned with selection of correct mix of debt and equity in its capital structure. The study inferred that company should reframe its capital structure and capacity utilization for further capability in future. Peswani (2011) found that a Marico industries Ltd is high leveraged firms than Britannia industries Ltd. A high leveraged firm had
given high return on equity to its shareholders but the profitability of both the companies was similar.
Khalid (2012) examined in the study titled “the determinants of leverage of listed companies”. It was found that both industrial and services had no significant relationship. The findings of the study revealed that the growth rate, liquidity, and tangibility have significant relationship with leverage. Olayinka and Taiwo (2012) examined “Profitability and leverage: Evidence from Nigerian firms” the study analyzed the profit profile of firms in Nigeria and found leverage has an impact on profitability.
Khushbakht (2013) observed in the study and concluded that there is a positive correlation between ROA and DFL, while there is negative correlation between ROA and DOL. DFL and ROI have inverse relationship and similarly DOL and ROI also have negative relationship. The correlation result found that there is a significant relationship between DFL and EPS while there is negative correlation between DOL and EPS. The overall finding shows that there is no significant effect of DFL and DOL on ROA, ROE, ROI and EPS. Khaled et al. (2013) examined in the study entitled “Impact of Leverage and Managerial Skills on Shareholders’ Return” A sample of research paper entitled “Leverage, governance and wealth effects of asset purchasers” The study examined a sample of 670 firms and inferred that announcement-period returns decrease with the seller's Z-score, suggesting that buyers benefit from the lower liquidity of assets sold by sellers with lower debt capacity and higher financial distress.
Patel (2014) delineated in the study entitled “Impact of leverage on profitability: A study of sabar dairy”. The findings of the study showed that sabar dairy has use the operating leverage, financial leverage and total leverage satisfactorily. Edwin et al. (2014) inferred in the study titled “financial leverage and performance variance among banks. Evidence of tier commercial banks listed on Nairobi security exchange Kenya” that the analysis showed negative correlation between debt asset ratio and ROAC, and ROCE though not found significant. Yadav (2014) examined in the study entitled “Determinants of the capital structure and financial leverage: Evidence of selected Indian companies”. The study found that there is a relationship between financial leverage and determinants of capital structure.
www.pbr.co.in04
Pacific Business Review International
www.pbr.co.in114
Pacific Business Review International
Pandey and Prabhavathi (2016) found in the study and the result of the simple and multiple regression inferred return on capital employed, return on equity, return on debt, net worth, reserve fund, borrowings, investment as well as gross fixed assets have significant impact of financial leverage which means that the debt cost is strongly associated with the returns of the firms.. Pandey et al. (2016) investigated in the study that there is a significant and negative relationship between leverage and firms’ profitability.
Analysis and Interpretation
Regression Model used for Analysis
In statistics, regression analysis is a statistical process for estimating the relationships among variables. It includes many techniques for modeling and analyzing several variables, when the focus is on the relationship between a dependent variable and one or more independent variables (or 'predictors').
Regression is a statistical tool for the potentiality of the relationship between one response variable (normally expressed by Y) and a series of other changing variables (assumed as predictor variables). It is used to measure impact of independent and dependent variable.
Correlations Analysis
Correlation and regression analysis are related in the sense that both deal with relationships among variables. The correlation coefficient is a measure of linear association between two variables. Values of the correlation coefficient are always between -1 and +1.
Correlations are useful because they can indicate a predictive relationship that can be exploited in practice.
The following table shows mean, standard deviation and CAGR (Compound Annual Growth Rate) of ROA, ROE, EPS of sample units presented in the Table. Standard deviation as a statistical to assess the variability or diversity used in statistics and probability theory it indicates how much variation or dispersion is there from the average (mean, or expected value). A low standard deviation give results that the data points tend to be very close to the mean, whether high standard deviation result shows that the data are spread out over a large range of values.
Compound annual growth rate (CARG) is an average. Growth rate over a period of several years it is a geometric average of annual growth rates
(1/Number of years)-1) CAGR = ((Ending value/Starting value)
The investor can compare the CAGR in order to evaluate how will one stock has performed against the other stock in a pear group or against a market index. The CAGR can also be used to compare the historical returns of stocks to bond or a savings account. When using the CAGR, it is important to
remember two thinks: The CAGR does not reflect investment risk, and one must use the same time periods. When CAGR is negative, it means that it can vary significantly from one year to another, and CAGR does not reflect volatility. CAGR is a pro forma number that provides a “smoothed” annual yield, so it can give the illustration that here is a steady growth rate even when the value of the underlying investment can vary significantly this volatility, or investment risk, is important to consider while making investment decisions.
Operating leverage
It is a measure of how revenue growth transforms into growth in operating income. It is a measure of leverage, and of how risky, or volatile, a company's operating income is.
Financial leverage:
It is the degree to which a company uses fixed-income securities such as debt and preferred equity. The more debt financing a company uses, the higher its financial leverage.
Combined leverage:
It is the leverage ratio summarizes the combined effect of the operating leverage (OL), and the financial leverage (FL) has an earnings per share (EPS), given a particular change in sales.
Return on Asset:
It is an indicator of how profitable a company is relative to its total assets. ROA gives an idea as to how efficient management is at using its assets to generate earnings. Calculated by dividing a company's annual earnings by its total assets, ROA is displayed as a percentage. Sometimes this is referred to as "return on investment".
Return on Equity:
The amount of net income returned as a percentage of shareholders equity. Return on equity measures a corporation's profitability by revealing how much profit a company generates with the money shareholders have invested.
Earnings per share:
The portion of a company's profit allocated to each outstanding share of common stock. Earnings per share serve as an indicator of a company's profitability. It is directly taken from profit and loss account.
03www.pbr.co.in
Volume 10 Issue 6, December 2017
115
Volume 10 Issue 6, December 2017
www.pbr.co.in
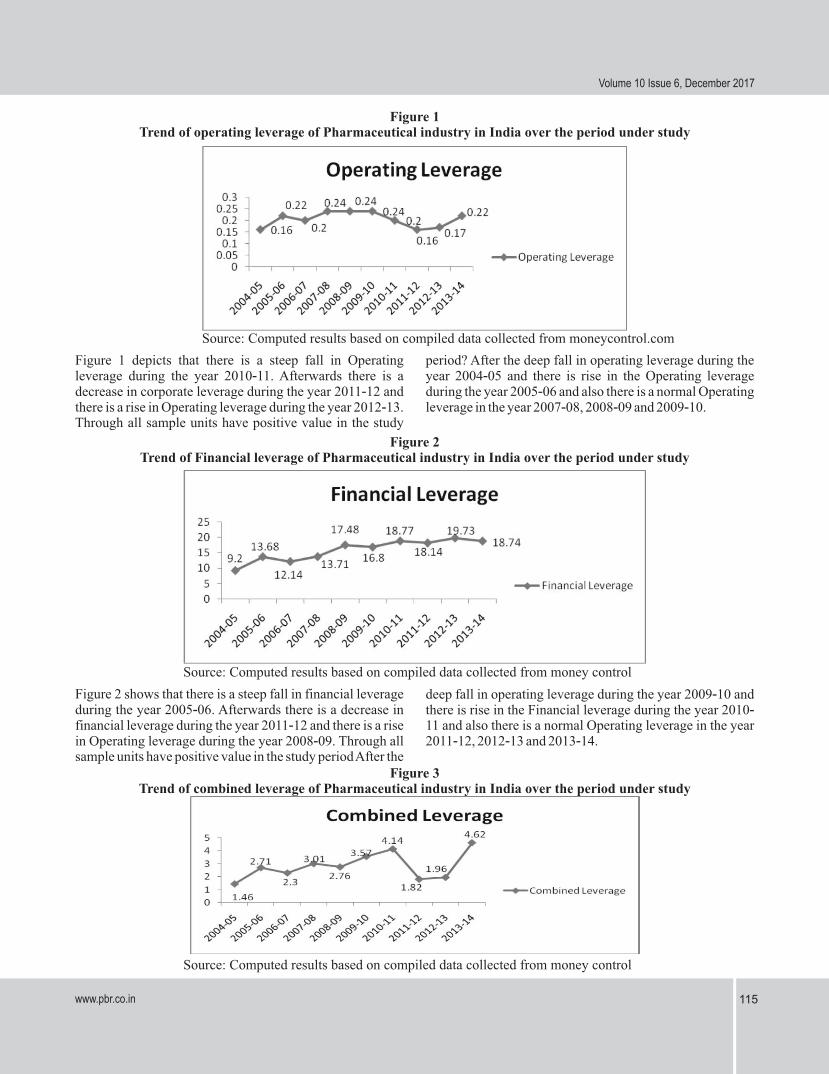
Figure 1 Trend of operating leverage of Pharmaceutical industry in India over the period under study
Source: Computed results based on compiled data collected from moneycontrol.com
Figure 1 depicts that there is a steep fall in Operating leverage during the year 2010-11. Afterwards there is a decrease in corporate leverage during the year 2011-12 and there is a rise in Operating leverage during the year 2012-13. Through all sample units have positive value in the study
period? After the deep fall in operating leverage during the year 2004-05 and there is rise in the Operating leverage during the year 2005-06 and also there is a normal Operating leverage in the year 2007-08, 2008-09 and 2009-10.
Figure 2Trend of Financial leverage of Pharmaceutical industry in India over the period under study
Source: Computed results based on compiled data collected from money control
Figure 2 shows that there is a steep fall in financial leverage during the year 2005-06. Afterwards there is a decrease in financial leverage during the year 2011-12 and there is a rise in Operating leverage during the year 2008-09. Through all sample units have positive value in the study period After the
deep fall in operating leverage during the year 2009-10 and there is rise in the Financial leverage during the year 2010-11 and also there is a normal Operating leverage in the year 2011-12, 2012-13 and 2013-14.
Figure 3Trend of combined leverage of Pharmaceutical industry in India over the period under study
Source: Computed results based on compiled data collected from money control
www.pbr.co.in04
Pacific Business Review International
www.pbr.co.in116
Pacific Business Review International
Figure 3 shows that there is a steep fall in combined leverage during the year 2011-12. Afterwards there is a decrease in combined leverage during the year 2012-13 and there is a rise in combined leverage during the year 2013-14. Through all sample units have positive value in the study period After
the deep fall in operating leverage during the year 2006-07 and there is rise in the Financial leverage during the year 2007-08 and also there is continues increase in Combined leverage in the year 2009-10 and 2010-11.
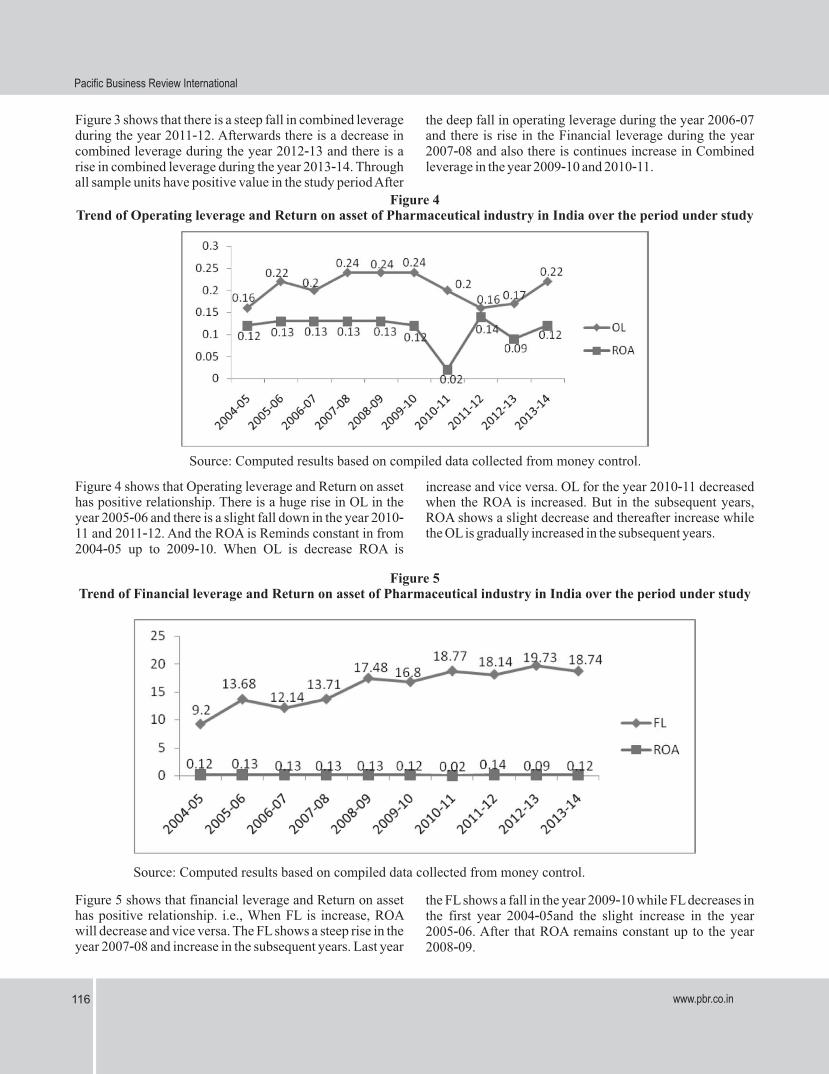
Figure 4Trend of Operating leverage and Return on asset of Pharmaceutical industry in India over the period under study
Source: Computed results based on compiled data collected from money control.
Figure 4 shows that Operating leverage and Return on asset has positive relationship. There is a huge rise in OL in the year 2005-06 and there is a slight fall down in the year 2010-11 and 2011-12. And the ROA is Reminds constant in from 2004-05 up to 2009-10. When OL is decrease ROA is
increase and vice versa. OL for the year 2010-11 decreased when the ROA is increased. But in the subsequent years, ROA shows a slight decrease and thereafter increase while the OL is gradually increased in the subsequent years.
Figure 5Trend of Financial leverage and Return on asset of Pharmaceutical industry in India over the period under study
Source: Computed results based on compiled data collected from money control.
Figure 5 shows that financial leverage and Return on asset has positive relationship. i.e., When FL is increase, ROA will decrease and vice versa. The FL shows a steep rise in the year 2007-08 and increase in the subsequent years. Last year
the FL shows a fall in the year 2009-10 while FL decreases in the first year 2004-05and the slight increase in the year 2005-06. After that ROA remains constant up to the year 2008-09.
03www.pbr.co.in
Volume 10 Issue 6, December 2017
117
Volume 10 Issue 6, December 2017
www.pbr.co.in
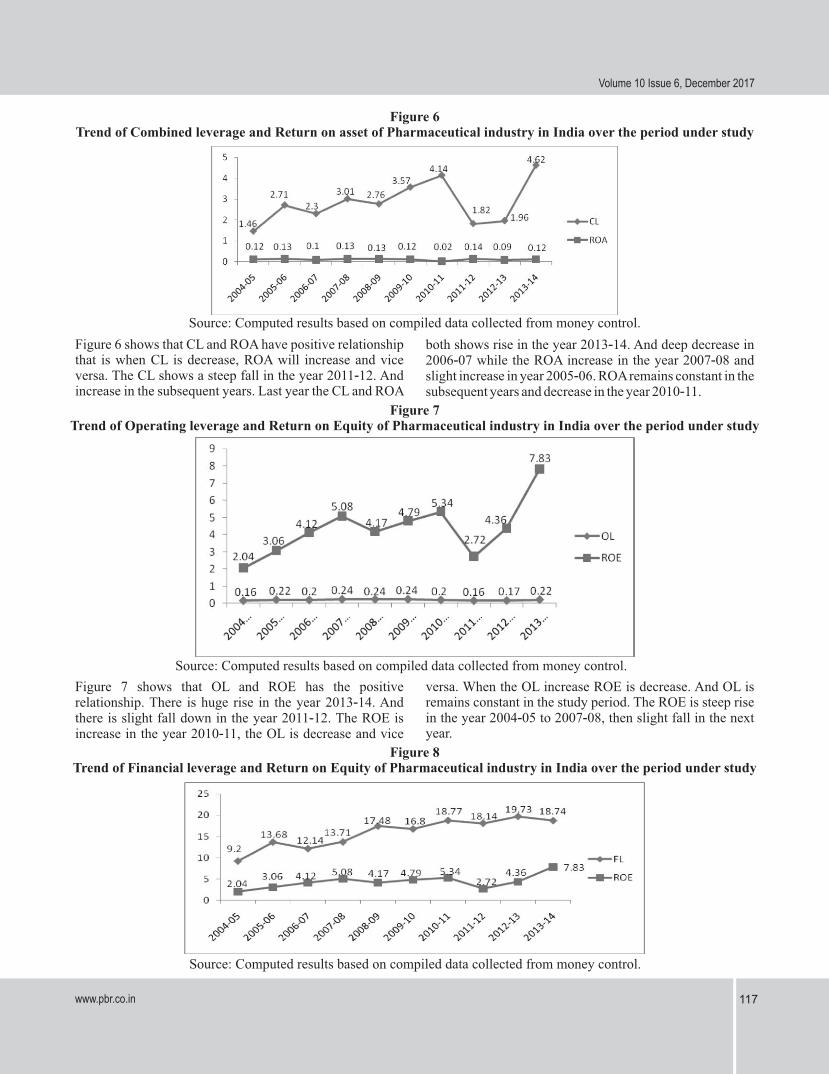
Figure 6Trend of Combined leverage and Return on asset of Pharmaceutical industry in India over the period under study
Source: Computed results based on compiled data collected from money control.
Figure 6 shows that CL and ROA have positive relationship that is when CL is decrease, ROA will increase and vice versa. The CL shows a steep fall in the year 2011-12. And increase in the subsequent years. Last year the CL and ROA
both shows rise in the year 2013-14. And deep decrease in 2006-07 while the ROA increase in the year 2007-08 and slight increase in year 2005-06. ROA remains constant in the subsequent years and decrease in the year 2010-11.
Figure 7Trend of Operating leverage and Return on Equity of Pharmaceutical industry in India over the period under study
Source: Computed results based on compiled data collected from money control.
Figure 7 shows that OL and ROE has the positive relationship. There is huge rise in the year 2013-14. And there is slight fall down in the year 2011-12. The ROE is increase in the year 2010-11, the OL is decrease and vice
versa. When the OL increase ROE is decrease. And OL is remains constant in the study period. The ROE is steep rise in the year 2004-05 to 2007-08, then slight fall in the next year.
Figure 8Trend of Financial leverage and Return on Equity of Pharmaceutical industry in India over the period under study
Source: Computed results based on compiled data collected from money control.
www.pbr.co.in04
Pacific Business Review International
www.pbr.co.in118
Pacific Business Review International
Figure 8 shows that FL and ROE have positive relationship. The FL shows the steep rice in the year 2010-11 and decrease in the next year last year the FL is decrease in the year 2013-
14 while increase in ROE in the year 2013-14 and vice versa. Both FL and ROE has more ups and downs in the subsequent years.
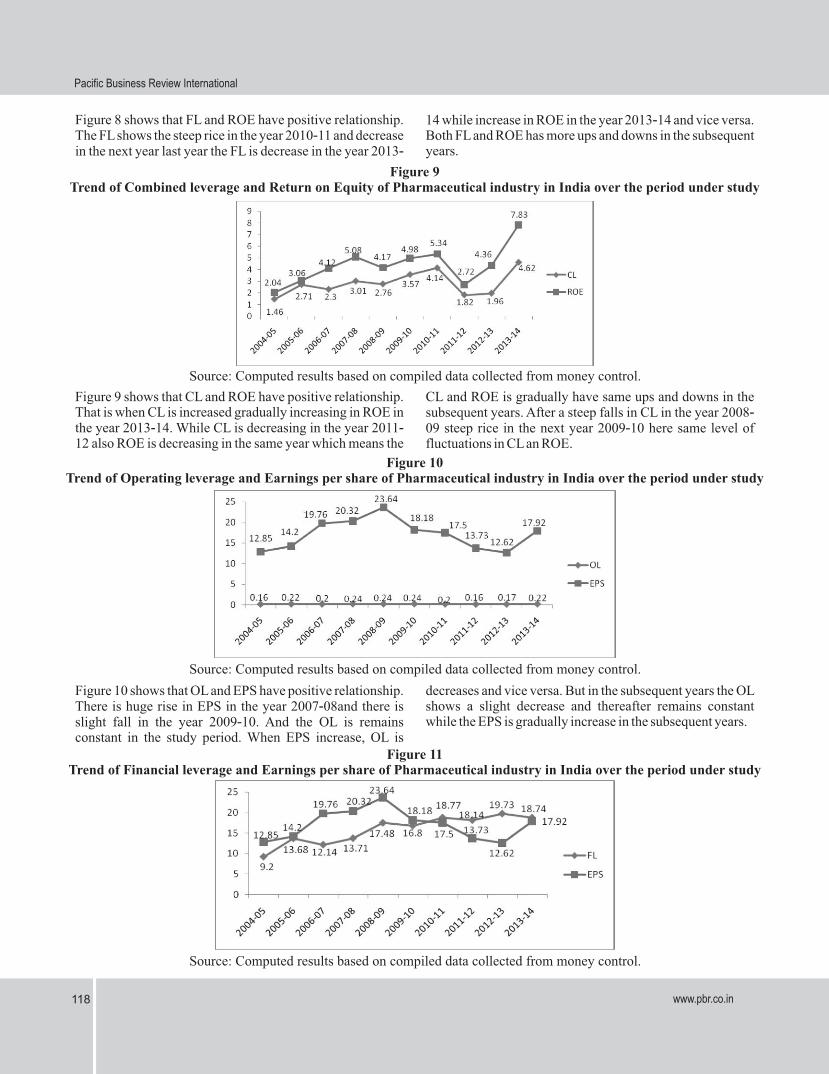
Figure 9Trend of Combined leverage and Return on Equity of Pharmaceutical industry in India over the period under study
Source: Computed results based on compiled data collected from money control.
Figure 9 shows that CL and ROE have positive relationship. That is when CL is increased gradually increasing in ROE in the year 2013-14. While CL is decreasing in the year 2011-12 also ROE is decreasing in the same year which means the
CL and ROE is gradually have same ups and downs in the subsequent years. After a steep falls in CL in the year 2008-09 steep rice in the next year 2009-10 here same level of fluctuations in CL an ROE.
Figure 10Trend of Operating leverage and Earnings per share of Pharmaceutical industry in India over the period under study
Source: Computed results based on compiled data collected from money control.
Figure 10 shows that OL and EPS have positive relationship. There is huge rise in EPS in the year 2007-08and there is slight fall in the year 2009-10. And the OL is remains constant in the study period. When EPS increase, OL is
decreases and vice versa. But in the subsequent years the OL shows a slight decrease and thereafter remains constant while the EPS is gradually increase in the subsequent years.
Figure 11Trend of Financial leverage and Earnings per share of Pharmaceutical industry in India over the period under study
Source: Computed results based on compiled data collected from money control.
119
Volume 10 Issue 6, December 2017
www.pbr.co.in
Figure 11 shows the EPS, which reveals that in the first year is increase when an equal increase in the FL in the year. But in the subsequent years there is more fluctuation in the EPS
when compared to FL. In the year 2012-13, there is steep fall in the EPS while FL is increased, vice versa. And slight fluctuation in the subsequent years.
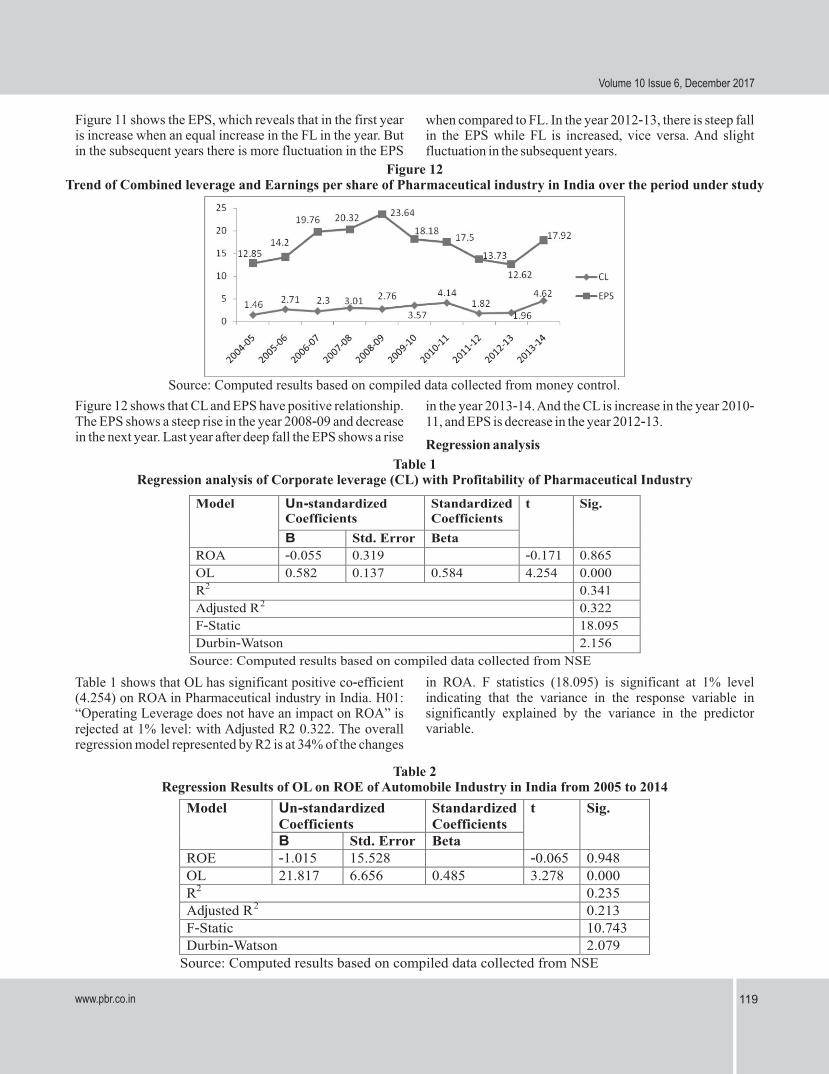
Figure 12Trend of Combined leverage and Earnings per share of Pharmaceutical industry in India over the period under study
Source: Computed results based on compiled data collected from money control.
Figure 12 shows that CL and EPS have positive relationship. The EPS shows a steep rise in the year 2008-09 and decrease in the next year. Last year after deep fall the EPS shows a rise
in the year 2013-14. And the CL is increase in the year 2010-11, and EPS is decrease in the year 2012-13.
Regression analysis
Table 1Regression analysis of Corporate leverage (CL) with Profitability of Pharmaceutical Industry
Model Un-standardized Coefficients
Standardized Coefficients
t Sig.
Β
Std. Error Beta
ROA
-0.055
0.319 -0.171 0.865
OL 0.582 0.137 0.584 4.254 0.000
R2 0.341
Adjusted R2 0.322
F-Static 18.095
Durbin-Watson 2.156
Source: Computed results based on compiled data collected from NSE
Table 1 shows that OL has significant positive co-efficient (4.254) on ROA in Pharmaceutical industry in India. H01: “Operating Leverage does not have an impact on ROA” is rejected at 1% level: with Adjusted R2 0.322. The overall regression model represented by R2 is at 34% of the changes
in ROA. F statistics (18.095) is significant at 1% level indicating that the variance in the response variable in significantly explained by the variance in the predictor variable.
Table 2Regression Results of OL on ROE of Automobile Industry in India from 2005 to 2014
Model
Un-standardized Coefficients
Standardized Coefficients
t Sig.
Β
Std. Error Beta
ROE -1.015 15.528 -0.065 0.948
OL 21.817 6.656 0.485 3.278 0.000R2 0.235Adjusted R2 0.213F-Static 10.743Durbin-Watson 2.079
Source: Computed results based on compiled data collected from NSE
www.pbr.co.in120
Pacific Business Review International
Table 2 shows that OL has significant positive co-efficient (3.278) on ROA in Pharmaceutical industry in India. H02: “Operating Leverage does not have an impact on ROE” is rejected at 1% level: with Adjusted R2 0.213. The overall regression model represented by R2 is at 23% of the changes
in ROA. F statistics (10.743) is significant at 1% level indicating that the variance in the response variable is significantly explained by the variance in the predictor variable.
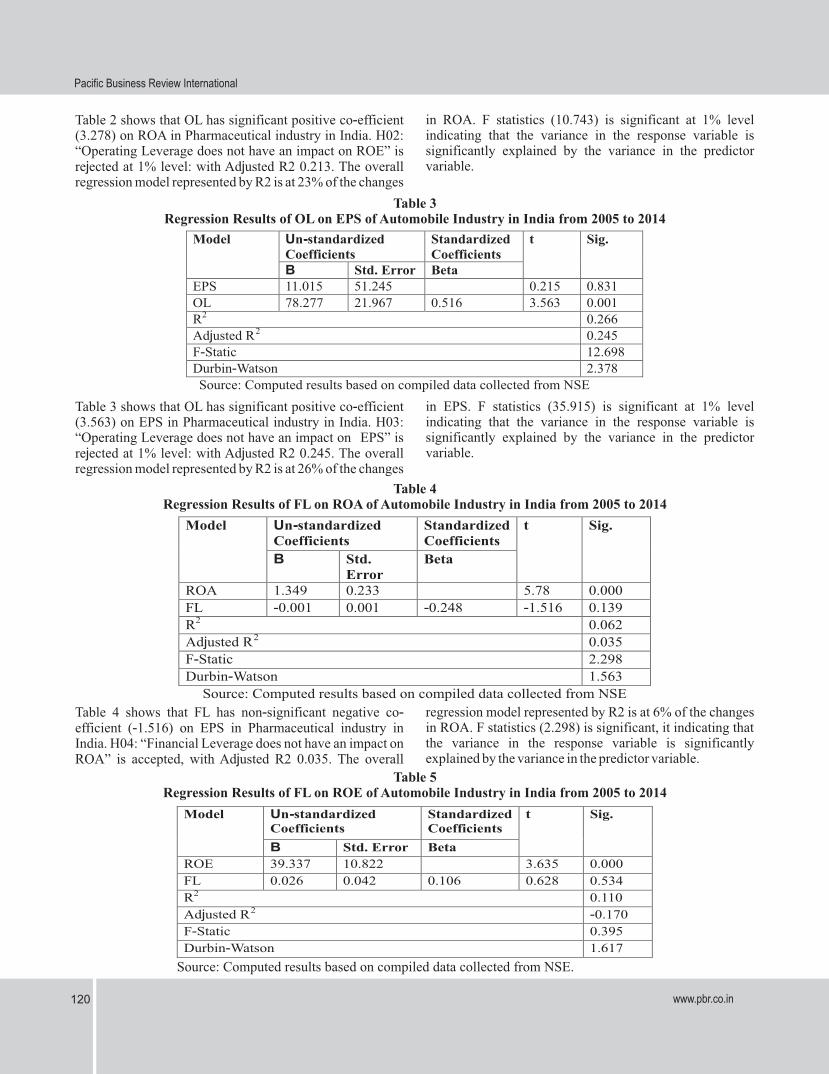
Table 3Regression Results of OL on EPS of Automobile Industry in India from 2005 to 2014
Model Un-standardized Coefficients
Standardized Coefficients
t Sig.
Β
Std. Error
BetaEPS
11.015
51.245
0.215 0.831
OL
78.277
21.967
0.516 3.563 0.001R2 0.266Adjusted R2 0.245F-Static 12.698Durbin-Watson 2.378
Source: Computed results based on compiled data collected from NSE
Table 3 shows that OL has significant positive co-efficient (3.563) on EPS in Pharmaceutical industry in India. H03: “Operating Leverage does not have an impact on EPS” is rejected at 1% level: with Adjusted R2 0.245. The overall regression model represented by R2 is at 26% of the changes
in EPS. F statistics (35.915) is significant at 1% level indicating that the variance in the response variable is significantly explained by the variance in the predictor variable.
Table 4Regression Results of FL on ROA of Automobile Industry in India from 2005 to 2014
Model Un-standardized Coefficients
Standardized Coefficients
t Sig.
Β
Std. Error
Beta
ROA 1.349 0.233 5.78 0.000
FL -0.001 0.001 -0.248 -1.516 0.139
R2 0.062
Adjusted R2 0.035
F-Static 2.298
Durbin-Watson 1.563
Source: Computed results based on compiled data collected from NSE
Table 4 shows that FL has non-significant negative co-efficient (-1.516) on EPS in Pharmaceutical industry in India. H04: “Financial Leverage does not have an impact on ROA” is accepted, with Adjusted R2 0.035. The overall
regression model represented by R2 is at 6% of the changes in ROA. F statistics (2.298) is significant, it indicating that the variance in the response variable is significantly explained by the variance in the predictor variable.
Table 5Regression Results of FL on ROE of Automobile Industry in India from 2005 to 2014
Model Un-standardized Coefficients
Standardized Coefficients
t Sig.
Β Std. Error Beta
ROE 39.337 10.822 3.635 0.000
FL 0.026 0.042 0.106 0.628 0.534
R2 0.110
Adjusted R2 -0.170
F-Static 0.395
Durbin-Watson 1.617
Source: Computed results based on compiled data collected from NSE.
03www.pbr.co.in
Volume 10 Issue 6, December 2017
121
Volume 10 Issue 6, December 2017
www.pbr.co.in
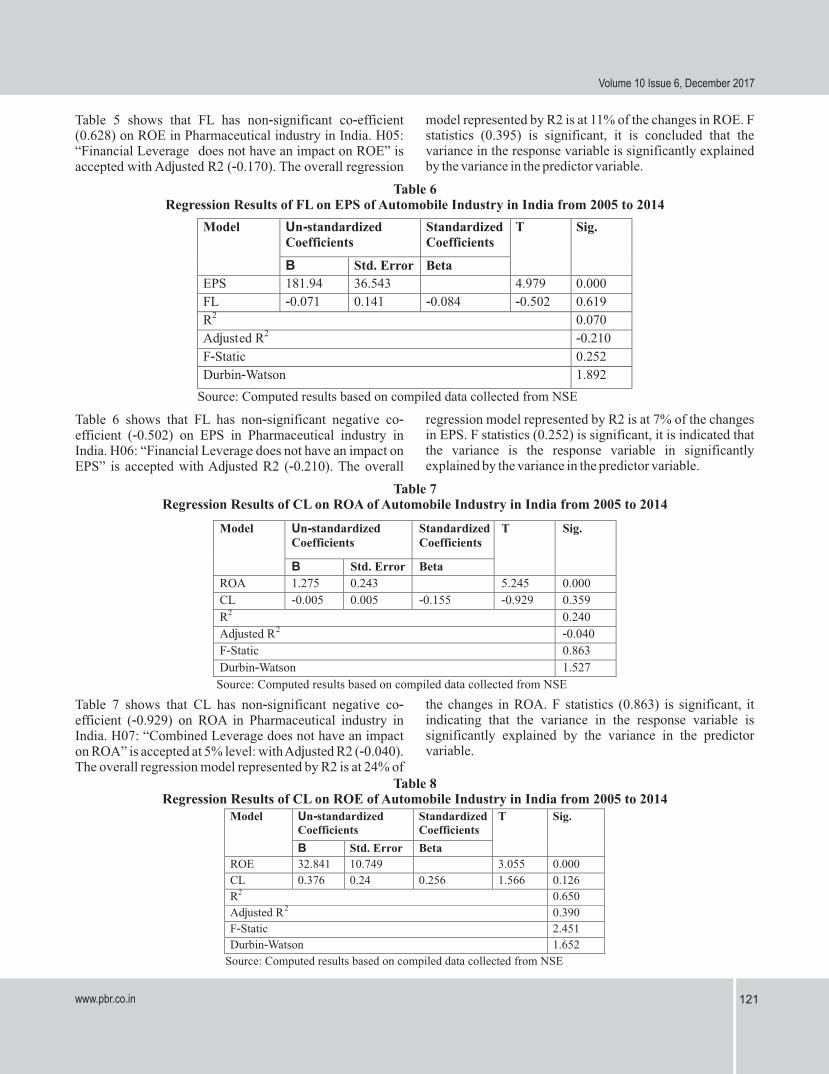
Table 5 shows that FL has non-significant co-efficient (0.628) on ROE in Pharmaceutical industry in India. H05: “Financial Leverage does not have an impact on ROE” is accepted with Adjusted R2 (-0.170). The overall regression
model represented by R2 is at 11% of the changes in ROE. F statistics (0.395) is significant, it is concluded that the variance in the response variable is significantly explained by the variance in the predictor variable.
Table 6Regression Results of FL on EPS of Automobile Industry in India from 2005 to 2014
Model Un-standardized Coefficients
Standardized Coefficients
T Sig.
Β Std. Error Beta
EPS
181.94
36.543 4.979 0.000
FL -0.071 0.141 -0.084 -0.502 0.619
R2 0.070
Adjusted R2 -0.210
F-Static 0.252
Durbin-Watson 1.892
Source: Computed results based on compiled data collected from NSE
Table 6 shows that FL has non-significant negative co-efficient (-0.502) on EPS in Pharmaceutical industry in India. H06: “Financial Leverage does not have an impact on EPS” is accepted with Adjusted R2 (-0.210). The overall
regression model represented by R2 is at 7% of the changes in EPS. F statistics (0.252) is significant, it is indicated that the variance is the response variable in significantly explained by the variance in the predictor variable.
Table 7Regression Results of CL on ROA of Automobile Industry in India from 2005 to 2014
Model Un-standardized Coefficients
Standardized Coefficients
T Sig.
Β Std. Error Beta
ROA 1.275 0.243 5.245 0.000
CL -0.005 0.005 -0.155 -0.929 0.359
R2 0.240
Adjusted R2 -0.040
F-Static 0.863
Durbin-Watson 1.527
Source: Computed results based on compiled data collected from NSE
Table 7 shows that CL has non-significant negative co-efficient (-0.929) on ROA in Pharmaceutical industry in India. H07: “Combined Leverage does not have an impact on ROA” is accepted at 5% level: with Adjusted R2 (-0.040). The overall regression model represented by R2 is at 24% of
the changes in ROA. F statistics (0.863) is significant, it indicating that the variance in the response variable is significantly explained by the variance in the predictor variable.
Table 8Regression Results of CL on ROE of Automobile Industry in India from 2005 to 2014
Model Un-standardized Coefficients
Standardized Coefficients
T Sig.
Β Std. Error Beta
ROE 32.841 10.749 3.055 0.000
CL 0.376 0.24 0.256 1.566 0.126
R2 0.650
Adjusted R2 0.390
F-Static 2.451
Durbin-Watson 1.652
Source: Computed results based on compiled data collected from NSE
www.pbr.co.in04
Pacific Business Review International
www.pbr.co.in122
Pacific Business Review International
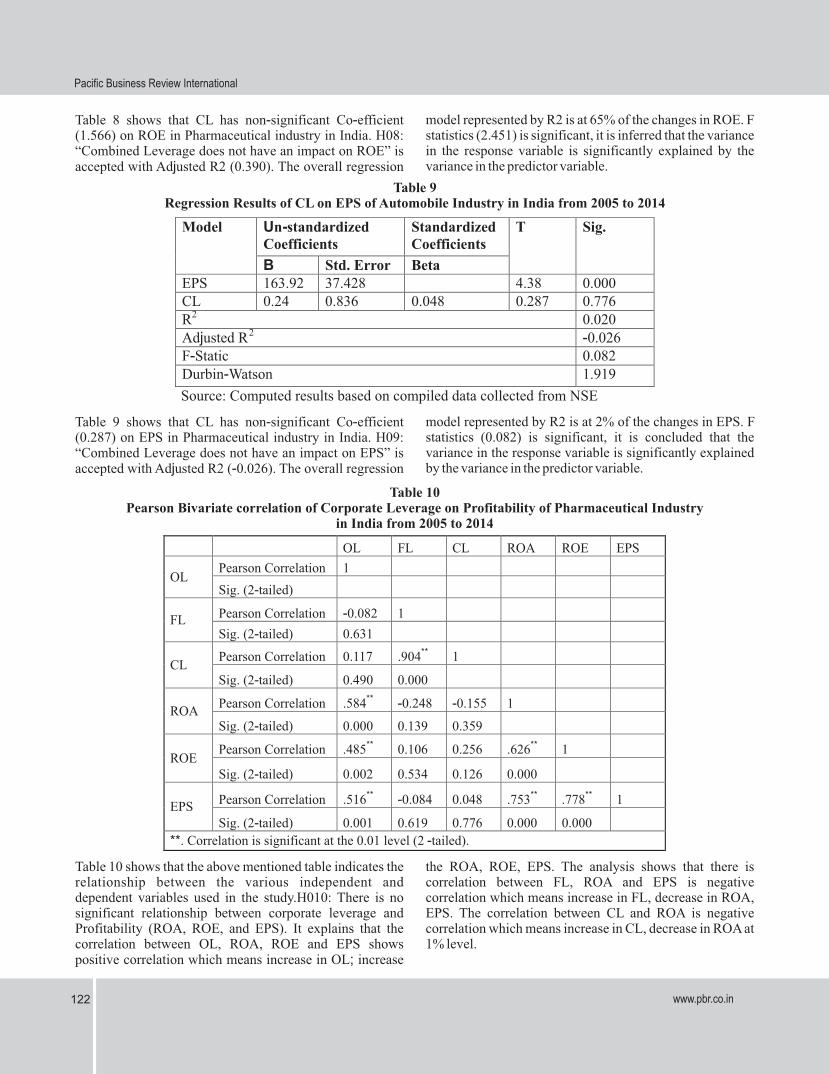
Table 8 shows that CL has non-significant Co-efficient (1.566) on ROE in Pharmaceutical industry in India. H08: “Combined Leverage does not have an impact on ROE” is accepted with Adjusted R2 (0.390). The overall regression
model represented by R2 is at 65% of the changes in ROE. F statistics (2.451) is significant, it is inferred that the variance in the response variable is significantly explained by the variance in the predictor variable.
Table 9Regression Results of CL on EPS of Automobile Industry in India from 2005 to 2014
Model Un-standardized Coefficients
Standardized Coefficients
T Sig.
Β Std. Error BetaEPS 163.92 37.428 4.38 0.000CL 0.24 0.836 0.048 0.287 0.776R2 0.020Adjusted R2 -0.026F-Static 0.082Durbin-Watson 1.919
Source: Computed results based on compiled data collected from NSE
Table 9 shows that CL has non-significant Co-efficient (0.287) on EPS in Pharmaceutical industry in India. H09: “Combined Leverage does not have an impact on EPS” is accepted with Adjusted R2 (-0.026). The overall regression
model represented by R2 is at 2% of the changes in EPS. F statistics (0.082) is significant, it is concluded that the variance in the response variable is significantly explained by the variance in the predictor variable.
Table 10Pearson Bivariate correlation of Corporate Leverage on Profitability of Pharmaceutical Industry
in India from 2005 to 2014
OL FL CL ROA ROE EPS
OL
Pearson Correlation
1
Sig. (2-tailed)
FL
Pearson Correlation
-0.082 1
Sig. (2-tailed)
0.631
CLPearson Correlation
0.117 .904** 1
Sig. (2-tailed) 0.490 0.000
ROAPearson Correlation .584** -0.248 -0.155 1
Sig. (2-tailed) 0.000 0.139 0.359
ROEPearson Correlation .485** 0.106 0.256 .626** 1
Sig. (2-tailed) 0.002 0.534 0.126 0.000
EPSPearson Correlation .516** -0.084 0.048 .753** .778** 1
Sig. (2-tailed) 0.001 0.619 0.776 0.000 0.000
**. Correlation is significant at the 0.01 level (2 -tailed).
Table 10 shows that the above mentioned table indicates the relationship between the various independent and dependent variables used in the study.H010: There is no significant relationship between corporate leverage and Profitability (ROA, ROE, and EPS). It explains that the correlation between OL, ROA, ROE and EPS shows positive correlation which means increase in OL; increase
the ROA, ROE, EPS. The analysis shows that there is correlation between FL, ROA and EPS is negative correlation which means increase in FL, decrease in ROA, EPS. The correlation between CL and ROA is negative correlation which means increase in CL, decrease in ROA at 1% level.
03www.pbr.co.in
Volume 10 Issue 6, December 2017
123
Volume 10 Issue 6, December 2017
www.pbr.co.in
Results of Descriptive Statistics
• The highest Operating Leverage of 5.61 among the selected 37 Pharmaceutical companies in India which means that the sale unit of Exide industries gives more marginal profit.
• The highest Financial Leverage of 984.09 among the selected 37 Pharmaceutical companies in India which means that the Industry uses high fixed income securities.
• The highest combined Leverage of 141.46 among the selected 37 Pharmaceutical companies in India which means that the company earns high profit due to fixed costs.
• The highest Return on asset of 5.02 among the 37 Pharmaceutical companies in India.
• The highest Return on equity of 225.97 among the 37 automobile companies in India.
• The highest Earnings per share of 598.65 among the selected 37 Pharmaceutical companies in India which means the Pharmaceutical industry to increase price that the individual asset.
The hypotheses developed to study the impact of selected financial variables on corporate Leverages were tested using regression model and correlation model. The results of regression model and correlation model show that:
Findings of Regression Model:
• The Operating leverage (OL) is a significant determinant of Return on asset (ROA), thus rejecting the H01: Operating Leverage does not have an impact on Return on asset at 1% level. Therefore, it is concluded that OL has a significant “impact” on ROA.
• The Operating leverage (OL) is a significant determinant of Return on Equity, thus rejecting the H02: Operating Leverage does not have an impact on Return on Equity significant at 1% level. Therefore, it is inferred that OL has a significant “impact” on ROE.
• The Operating leverage (OL) is a significant determinant of Earnings per share (EPS), thus rejecting the H03: Operating Leverage does not have an impact on Earnings per share significant at 1% level. Therefore, it is found that OL has a significant “impact” on EPS.
• The Financial leverage (FL) is not a significant determinant of Return on asset (ROA), thus accepting the H04: Financial Leverage does not have an impact on Return on asset. Therefore, it is concluded that FL does not have impact on ROA.
• The Financial leverage (FL) is not a significant
determinant of Return on Equity (ROE), thus accepting the H05: Financial Leverage does not have an impact on Return on equity. Therefore, it is inferred that FL does not have impact on ROE.
• The Financial leverage (FL) is not a significant determinant of Earnings per share (EPS), thus accepting the H06: Financial leverage does not have an impact on Earnings per share. Therefore, it is found that FL does not have impact on EPS.
• The Combined leverage (CL) is not a significant determinant of Return on asset (ROA), thus accepting the H07: Combined Leverage does not have an impact on Return on asset. Therefore, it is concluded that CL does not have impact on ROA.
• The Combined leverage (CL) is not a significant determinant of Return on Equity (ROE), thus accepting the H08: Combined Leverage does not have an impact on Return on Equity. Therefore, it is inferred that CL does not have impact on ROE.
• The Combined leverage (CL) is not a significant determinant of Earnings per share (EPS), thus accepting the H09: Combined Leverage does not have an impact on Earnings per share. Therefore, it is found that CL does not have impact on EPS.
Findings of Correlation Model:
• The corporate leverage of OL with ROA, ROE, and EPS is positive correlations and the FL with ROA, EPS is negative correlations and the CL with ROA is also negative correlations H010: there is no significant relationship between corporate leverage and profitability (ROA, ROE, and EPS). therefore it is concluded that OL with ROA,ROE and EPS have positive correlation were as FL with ROA, EPS have negative correlation and CL with ROA also has negative correlation.
Conclusion
• On the basis of above findings, it is concluded that simple regression inferred that the OL has significant impact on ROA, ROE and EPS, of the Pharmaceutical industry in India whereas FL and CL do not have significant impact on profitability measures.
References
Aivazian V. A. (2005). “The Impact of Leverage on Firm’s Investment Canadian Evidence”. Journal of Corporate Finance: 277-291.
Edwin, Sawa Wabwile, Mwalati Solomon Chitiavi, Ondiek B. Alala and Musiega Douglas (2014). “Financial Leverage and Performance Variance among Banks. Evidence of Tier Commercial Banks Listed on
www.pbr.co.in04
Pacific Business Review International
www.pbr.co.in124
Pacific Business Review International
Nairobi Security Exchange Kenya”. International Journal of Business and Management Invention. 3(4): 1-13.
Jensen, Michael, C. (1986). “Agency Cost of Free Cash Flow, Corporate Finance and Takeovers”. American Economic Review. 76(2): 323-329.
Khaled, Amira, John Kose, Alexandrosprezas, and Gopala, K. Vasudevan (2013). “Leverage, Governance and Wealth Effects of Asset Purchaser”. Journal of Corporate Finance. 22: 209–220.
Khalid, Alkhatib (2012). “The Determinants of Leverage of Listed Companies” International Journal of Business and Social Science. 3(24): 78-83.
Khushbakht, Tayyba (2013). “Leverage- An Analysis and Its Impact on Profitability With Reference To Selected Oil and Gas Companies”. International Journal of Business and Management Invention. 2(7): 50-59.
Kumaramangalam Chandra, S. and Govindasami, P. (2010). “Leverage – An Analysis and Its Impact on Profitability With Reference To Selected Cement Companies in India”. Erouropean Journal of Economics, Finance Administrative Science. 27: 53-65.
Matt, H. Evans (2000). “Excellence in Financial Management”. Course 1: Evaluating Financial Performance. Cited on: (www.exinfm.com/ training).mbaii_fm.pdf. Cited on :( http:/www. zshared.com/document/mbaii_fm.html).
Mohanty, Pitabos (2003). “A Review of Research on the Practices of Corporate Finance” South Asian Journal of Management. 4(9): 29.
Olayinka Akinlo and Asaolu Taiwo (2012).” Profitability and Leverage: Evidence from Nigerian Firms”. Global Journal of Business Research. 6(1): 17-25.
Pandey, I. M. (2006). “Financial Management”. 9th Ed; (New Delhi: Vikas Publishing House PVT Ltd): 290
Pandey, N. S., Prabhavathi, M. and Pandey, Meenu (2016). “The Impact of Leverage on Profitability on Steel Industry in India: An Empirical Analysis” Invertis Journal of Management, 8(2): 40-50.
Pandy, N. S. and Prabhavathi, M. (2016). “The Impact of Leverage on Shareholders’ Wealth of Automobile Industry in India: An Empirical Analysis” Pacific Business Review International.8(8):1-14.
Patel, J. B. (2014). “Impact of Leverage on Profitability: A Study of Sabar Dairy”. International Multidiscip-linary Research Journal. 1(3): 1-6.
Peswani, Shilpa (2011). “Does A Highly Leveraged Capital Structure of A Firm Influence Its Performance? A Comparative Study of High and Low Leveraged FMCG Companies In India”. Indian Journal of Finance. (5): 31-35.
Singh, Mohun Prasad Odit and Hemant, B. Chittoo (2008). “Does Financial Leverage Influence Investment Decision. The Case of Mauritian Firms?” Journal of Business Case Studies: 49-60.
Vanyale Narender and Sharma Abhinar (2006). “Determinants of Capital Structure in Public Enterprises”. Journal of Applied Finance. 12(7): 60-80.
Veni, P. and Narayanan, V. S. (2002). "Leverage, Capital Structure, Dividend Policy and Practices — The Management Accountant" — December. 2002: 256-264
Virani, Varsha (2010). “Impact of Leverage on Profitability of Pantaloon Retail India Ltd.”. Advances in Management, 3(8): 52-59.