Embed Size (px)
Citation preview
The Use of Leverage & Financial structure
The Use of Leverage & Financial structure
Financial Management-IIDepartment of CommerceUniversity of North Bengal
Topics in the Syllabus
Operating and Financial Leverage:
1. Effects of operating and financial leverage on profit
2. Measurement of leverages
3. Analyzing alternate financial plans
4. Combined financial and operating leverage.
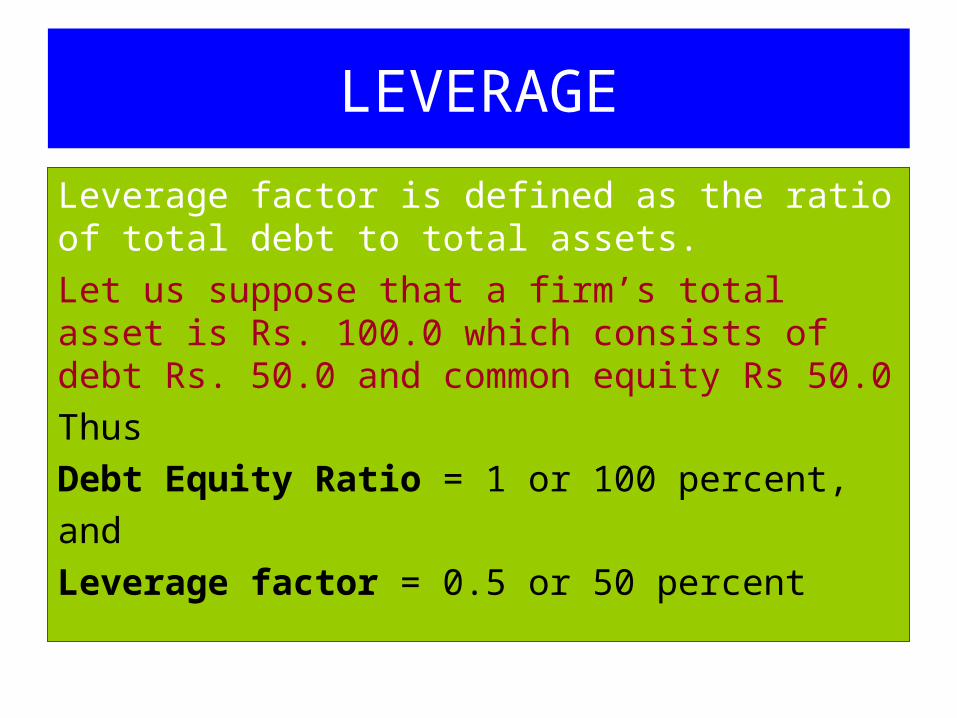
LEVERAGE
Leverage factor is defined as the ratio of total debt to total assets.
Let us suppose that a firm’s total asset is Rs. 100.0 which consists of debt Rs. 50.0 and common equity Rs 50.0
Thus
Debt Equity Ratio = 1 or 100 percent,
and
Leverage factor = 0.5 or 50 percent
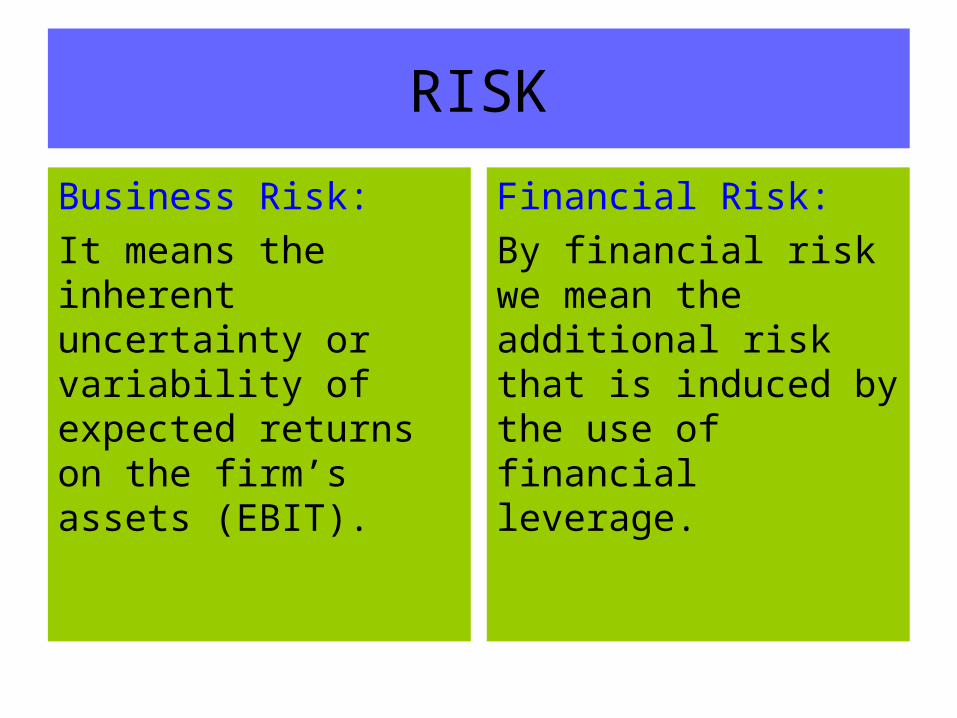
RISK
Business Risk:
It means the inherent uncertainty or variability of expected returns on the firm’s assets (EBIT).
Financial Risk:
By financial risk we mean the additional risk that is induced by the use of financial leverage.
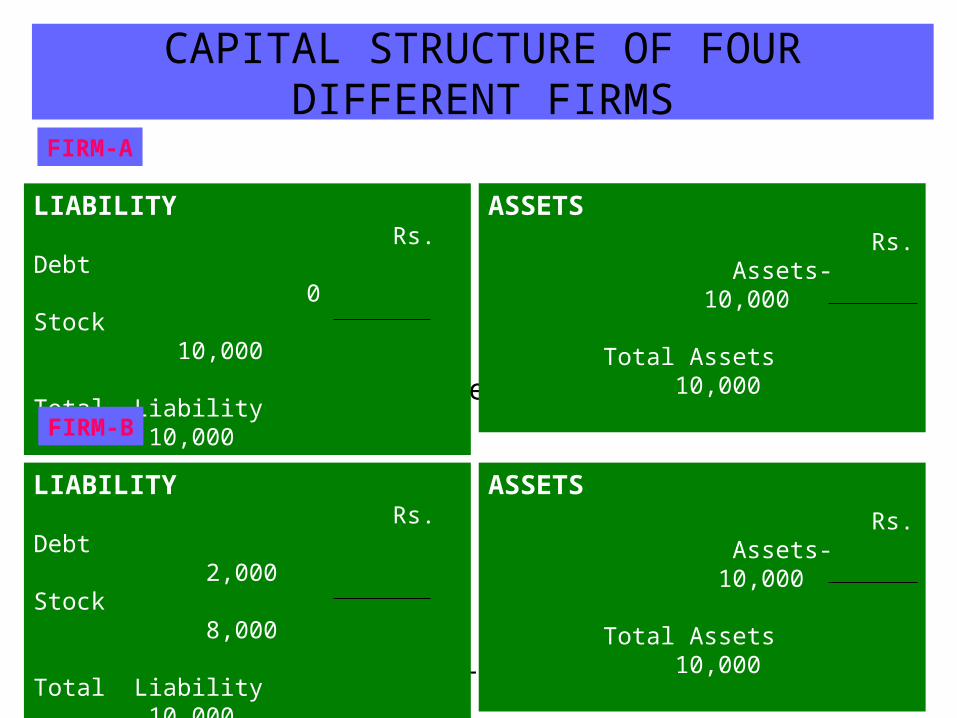
CAPITAL STRUCTURE OF FOUR DIFFERENT FIRMS
DebtEquity 25% Leverage factor=20%
DebtEquity 0 Leverage factor=0
FIRM-A
LIABILITY Rs.
Debt 0 Stock 10,000
Total Liability 10,000
ASSETSRs.
Assets- 10,000
Total Assets 10,000
FIRM-B
LIABILITY Rs.
Debt 2,000 Stock 8,000
Total Liability 10,000
ASSETSRs.
Assets- 10,000
Total Assets 10,000
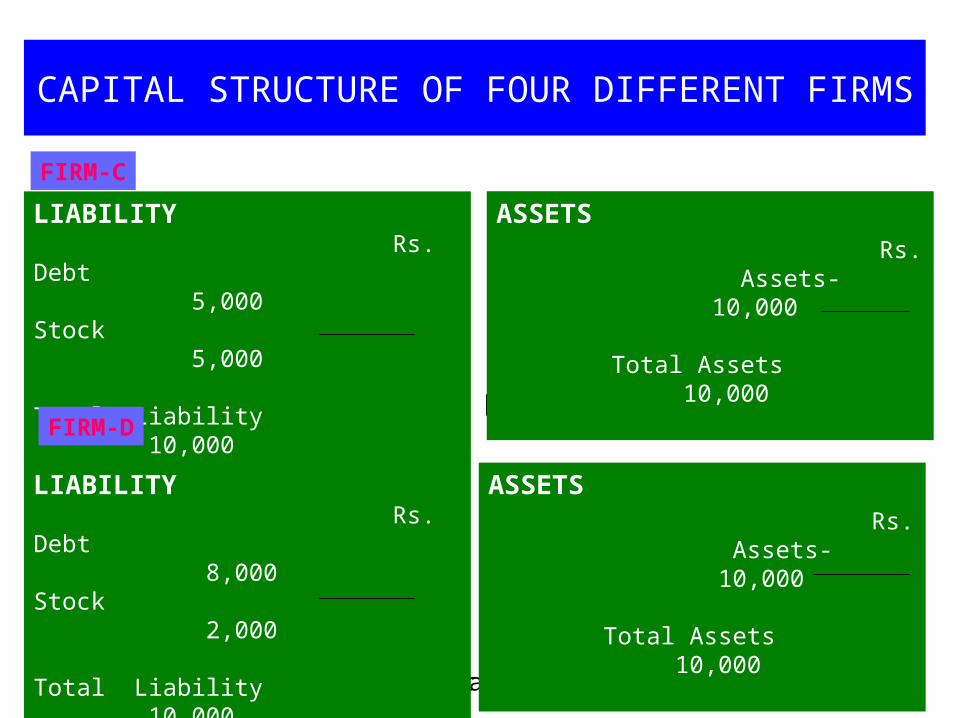
CAPITAL STRUCTURE OF FOUR DIFFERENT FIRMS
DebtEquity
44 or 400% Leverage factor= or 80%
5
Debt 1Equity 21 or 100% Leverage factor= or 50%
FIRM-C
LIABILITY Rs.
Debt 5,000 Stock 5,000
Total Liability 10,000
ASSETSRs.
Assets- 10,000
Total Assets 10,000
FIRM-D
LIABILITY Rs.
Debt 8,000 Stock 2,000
Total Liability 10,000
ASSETSRs.
Assets- 10,000
Total Assets 10,000
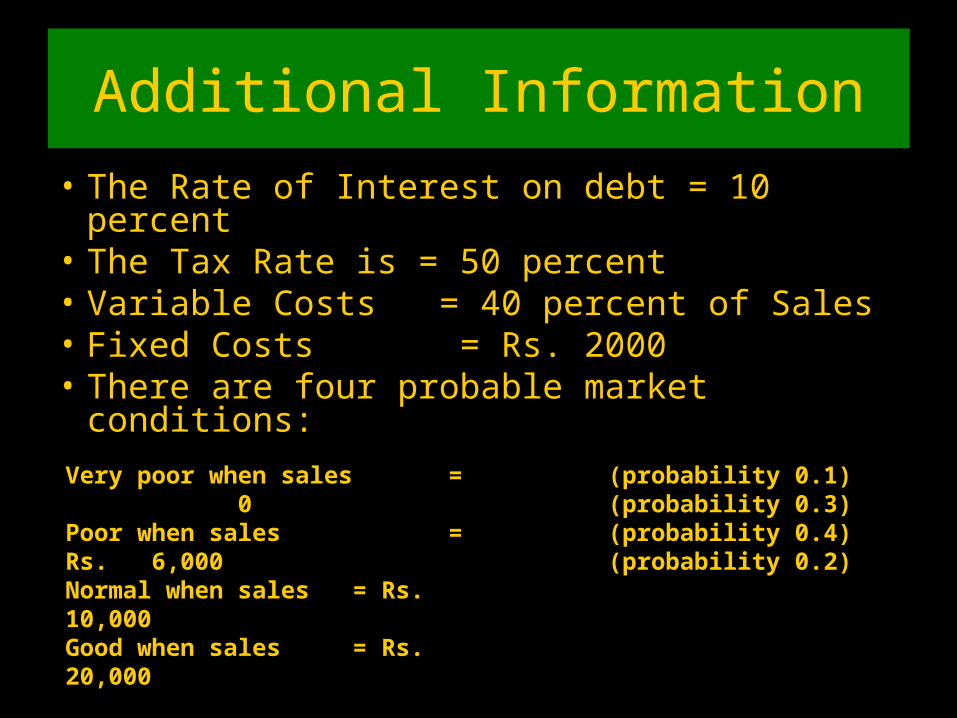
Additional Information
• The Rate of Interest on debt = 10 percent• The Tax Rate is = 50 percent• Variable Costs = 40 percent of Sales• Fixed Costs = Rs. 2000• There are four probable market conditions:
Very poor when sales = 0Poor when sales = Rs. 6,000Normal when sales = Rs. 10,000Good when sales = Rs. 20,000
(probability 0.1)(probability 0.3)(probability 0.4)(probability 0.2)
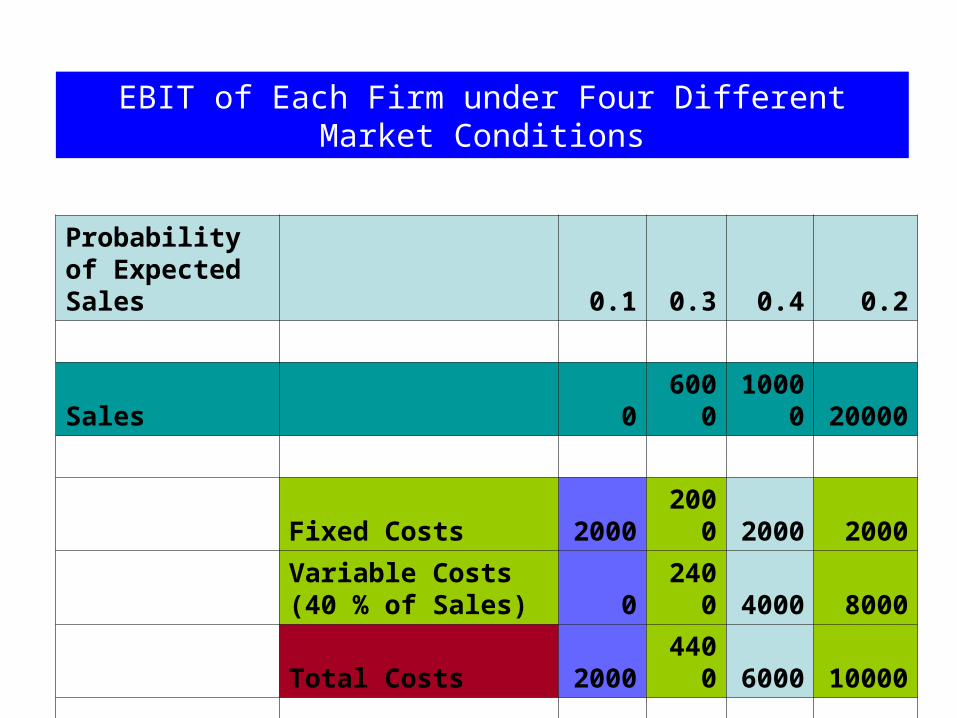
Probability of Expected Sales 0.1 0.3 0.4 0.2
Sales 0 6000 10000 20000
Fixed Costs 2000 2000 2000 2000
Variable Costs (40 % of Sales) 0 2400 4000 8000
Total Costs 2000 4400 6000 10000
EBIT -2000 1600 4000 10000
EBIT of Each Firm under Four Different Market Conditions
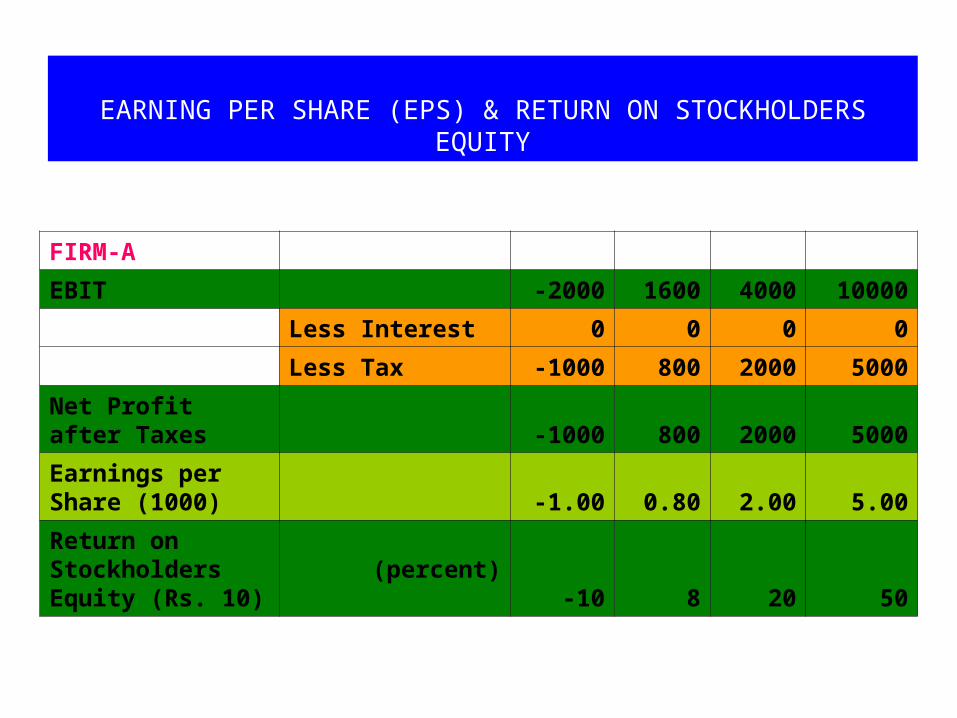
FIRM-A
EBIT -2000 1600 4000 10000
Less Interest 0 0 0 0
Less Tax -1000 800 2000 5000
Net Profit after Taxes -1000 800 2000 5000
Earnings per Share (1000) -1.00 0.80 2.00 5.00
Return on Stockholders Equity (Rs. 10)
(percent)-10 8 20 50
EARNING PER SHARE (EPS) & RETURN ON STOCKHOLDERS EQUITY
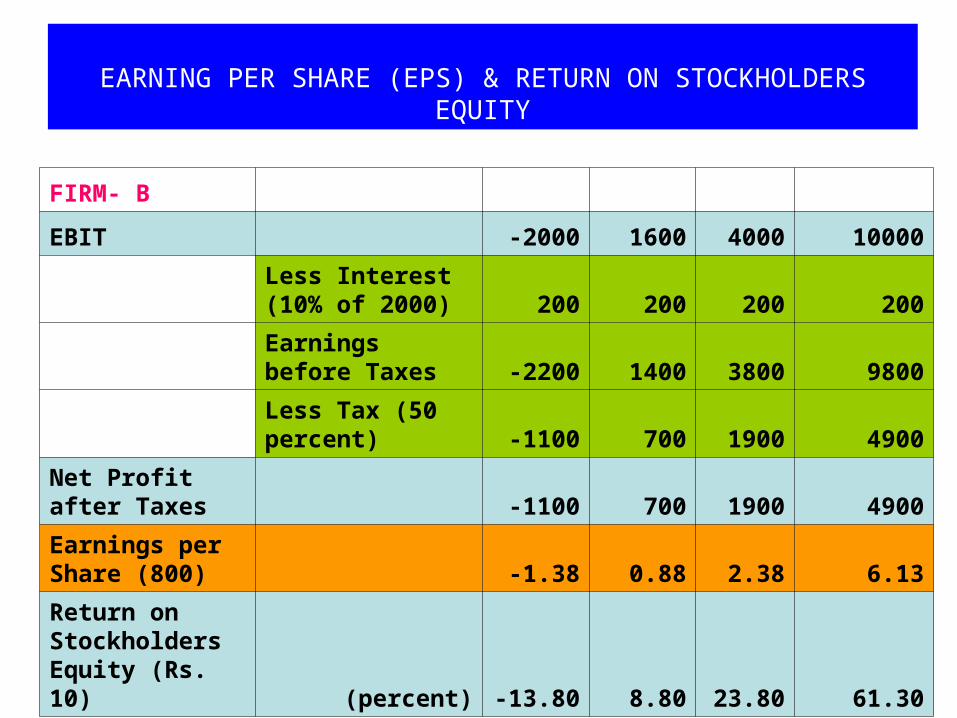
FIRM- B
EBIT -2000 1600 4000 10000
Less Interest (10% of 2000) 200 200 200 200
Earnings before Taxes -2200 1400 3800 9800
Less Tax (50 percent) -1100 700 1900 4900
Net Profit after Taxes -1100 700 1900 4900
Earnings per Share (800) -1.38 0.88 2.38 6.13
Return on Stockholders Equity (Rs. 10) (percent) -13.80 8.80 23.80 61.30
EARNING PER SHARE (EPS) & RETURN ON STOCKHOLDERS EQUITY
FIRM-C
EBIT -2000 1600 4000 10000
Less Interest (10% of 5000) 500 500 500 500
Earnings before Taxes -2500 1100 3500 9500
Less Tax (50 percent) -1250 550 1750 4750
Net Profit after Taxes -1250 550 1750 4750
Earnings per Share (500) -2.50 1.10 3.50 9.50
Return on Stockholders Equity (Rs. 10) (percent) -25.00 11.00 35.00 95.00
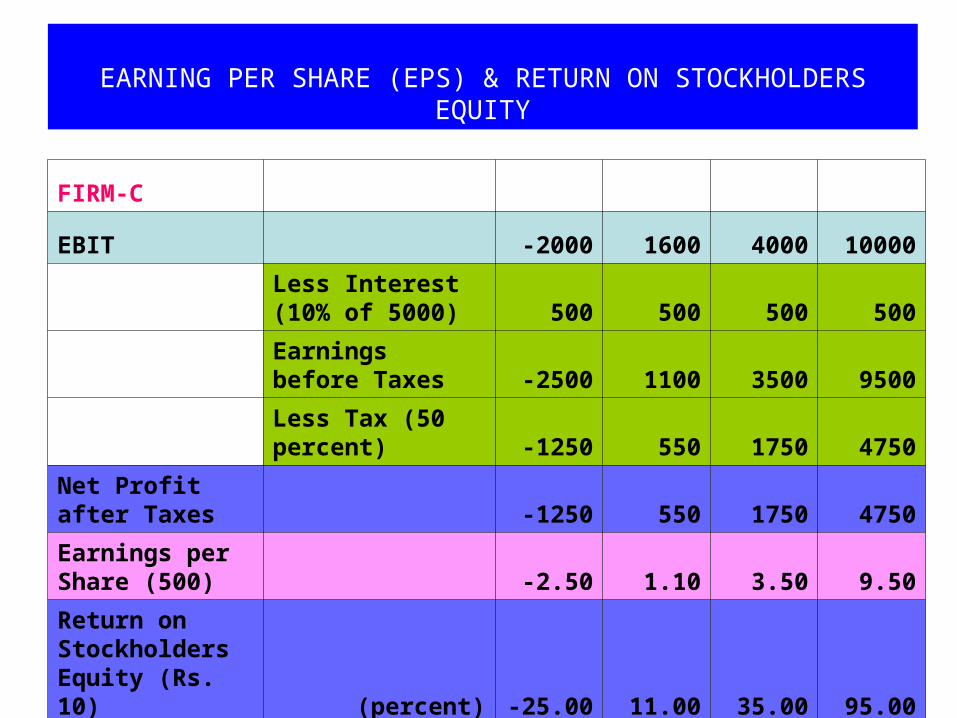
EARNING PER SHARE (EPS) & RETURN ON STOCKHOLDERS EQUITY
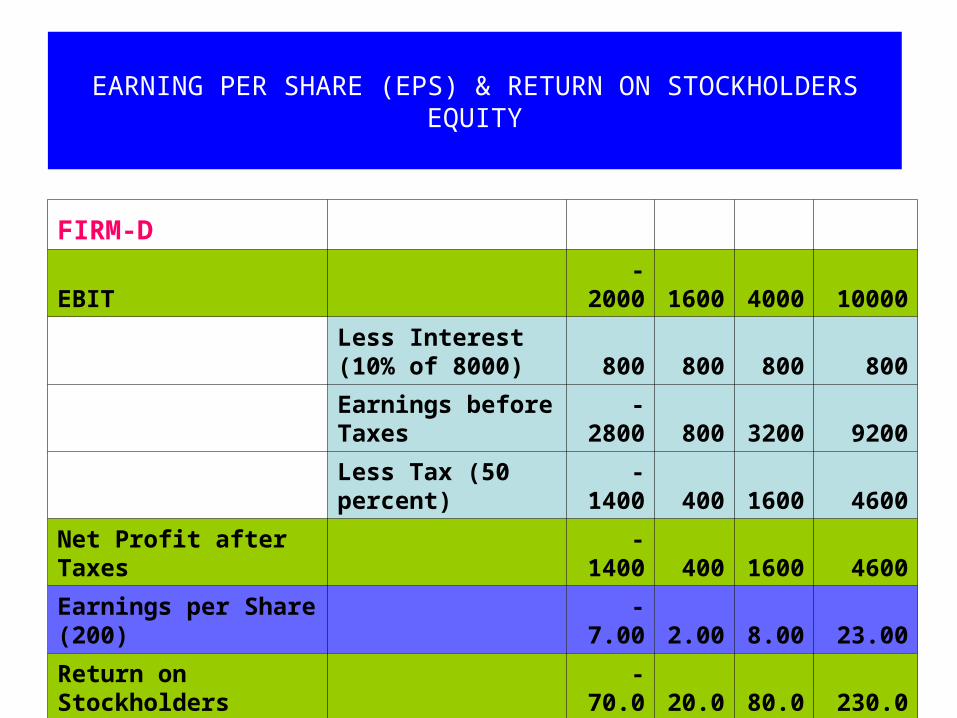
FIRM-D
EBIT -2000 1600 4000 10000
Less Interest (10% of 8000) 800 800 800 800
Earnings before Taxes -2800 800 3200 9200
Less Tax (50 percent) -1400 400 1600 4600
Net Profit after Taxes -1400 400 1600 4600
Earnings per Share (200) -7.00 2.00 8.00 23.00
Return on Stockholders Equity (percent) -70.00 20.00 80.00 230.00
EARNING PER SHARE (EPS) & RETURN ON STOCKHOLDERS EQUITY
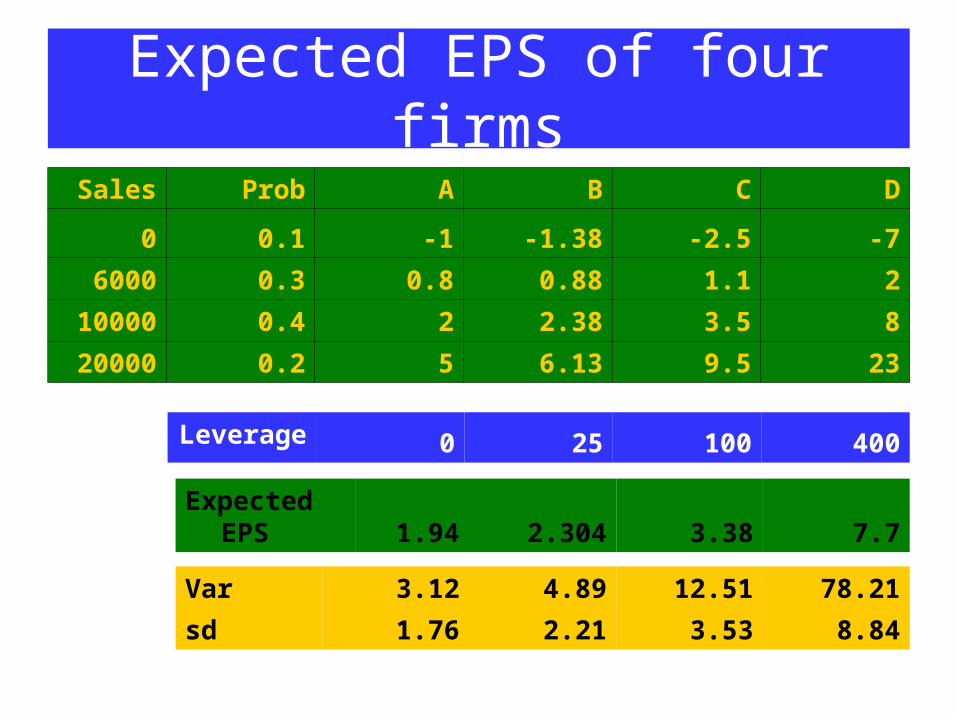
Expected EPS of four firms
Sales Prob A B C D
0 0.1 -1 -1.38 -2.5 -7
6000 0.3 0.8 0.88 1.1 2
10000 0.4 2 2.38 3.5 8
20000 0.2 5 6.13 9.5 23
Expected EPS 1.94 2.304 3.38 7.7
Leverage 0 25 100 400
Var 3.12 4.89 12.51 78.21
sd 1.76 2.21 3.53 8.84
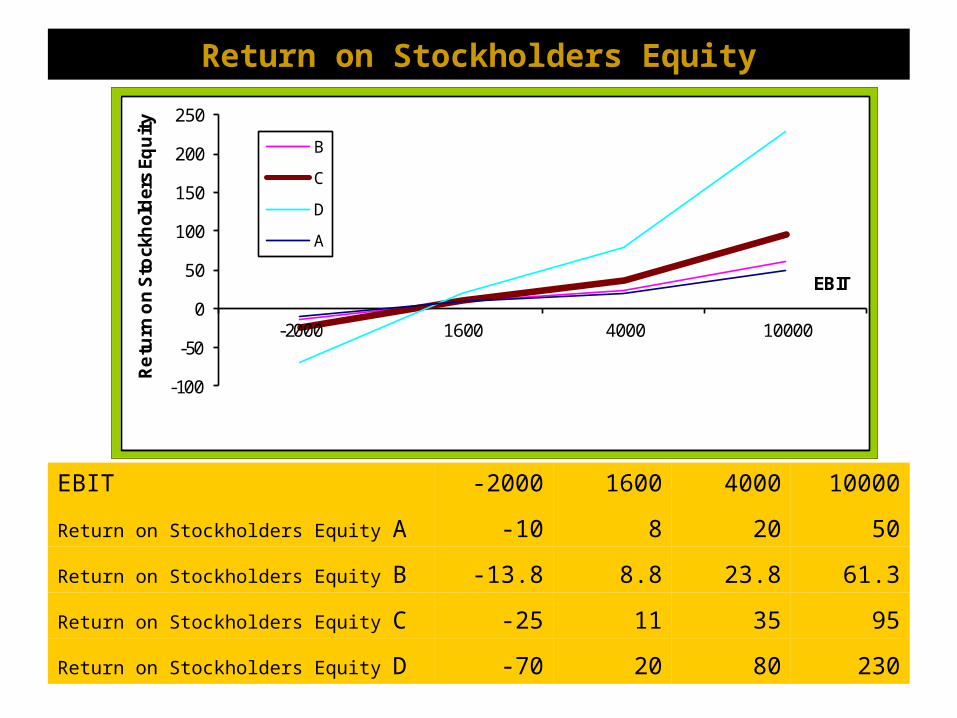
Return on Stockholders Equity
EBIT -2000 1600 4000 10000
Return on Stockholders Equity A -10 8 20 50
Return on Stockholders Equity B -13.8 8.8 23.8 61.3
Return on Stockholders Equity C -25 11 35 95
Return on Stockholders Equity D -70 20 80 230
-100
-50
0
50
100
150
200
250
-2000 1600 4000 10000
Re
turn
on
Sto
ckh
old
ers
Equ
ity
EBIT
B
C
D
A

END