Embed Size (px)
Citation preview

HAL Id: hal-01987255https://hal.inria.fr/hal-01987255
Submitted on 21 Jan 2019
HAL is a multi-disciplinary open accessarchive for the deposit and dissemination of sci-entific research documents, whether they are pub-lished or not. The documents may come fromteaching and research institutions in France orabroad, or from public or private research centers.
L’archive ouverte pluridisciplinaire HAL, estdestinée au dépôt et à la diffusion de documentsscientifiques de niveau recherche, publiés ou non,émanant des établissements d’enseignement et derecherche français ou étrangers, des laboratoirespublics ou privés.
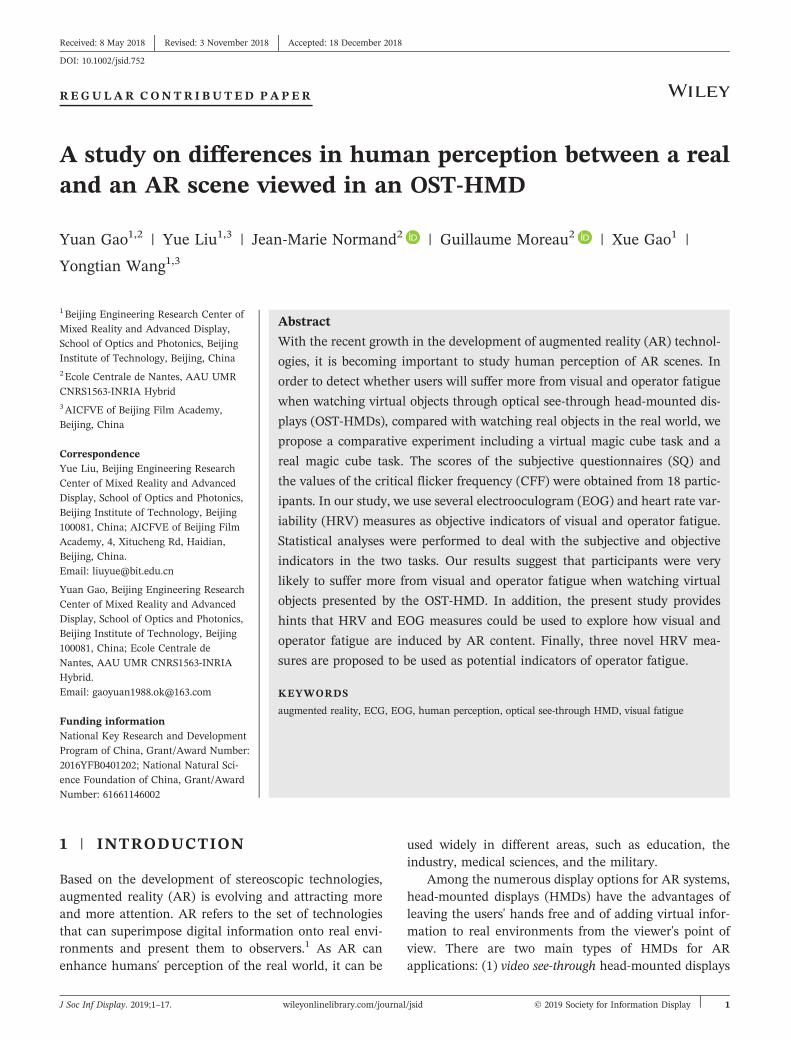
A study on differences in human perception between areal and an AR scene viewed in an OST-HMD
Yuan Gao, Yue Liu, Jean-Marie Normand, Guillaume Moreau, Xue Gao,Yongtian Wang
To cite this version:Yuan Gao, Yue Liu, Jean-Marie Normand, Guillaume Moreau, Xue Gao, et al.. A study on differencesin human perception between a real and an AR scene viewed in an OST-HMD. Journal of the Societyfor Information Display, Society for Information Display(AIP), 2019, pp.1-17. �10.1002/jsid.752�. �hal-01987255�
Received: 8 May 2018 Revised: 3 November 2018 Accepted: 18 December 2018
REGULAR CONTR I BU TED PAPER
DOI: 10.1002/jsid.752
A study on differences in human perception between a realand an AR scene viewed in an OST‐HMD
Yuan Gao1,2 | Yue Liu1,3 | Jean‐Marie Normand2 | Guillaume Moreau2 | Xue Gao1 |
Yongtian Wang1,3
1Beijing Engineering Research Center ofMixed Reality and Advanced Display,School of Optics and Photonics, BeijingInstitute of Technology, Beijing, China2Ecole Centrale de Nantes, AAU UMRCNRS1563‐INRIA Hybrid3AICFVE of Beijing Film Academy,Beijing, China
CorrespondenceYue Liu, Beijing Engineering ResearchCenter of Mixed Reality and AdvancedDisplay, School of Optics and Photonics,Beijing Institute of Technology, Beijing100081, China; AICFVE of Beijing FilmAcademy, 4, Xitucheng Rd, Haidian,Beijing, China.Email: [email protected]
Yuan Gao, Beijing Engineering ResearchCenter of Mixed Reality and AdvancedDisplay, School of Optics and Photonics,Beijing Institute of Technology, Beijing100081, China; Ecole Centrale deNantes, AAU UMR CNRS1563‐INRIAHybrid.Email: [email protected]
Funding informationNational Key Research and DevelopmentProgram of China, Grant/Award Number:2016YFB0401202; National Natural Sci-ence Foundation of China, Grant/AwardNumber: 61661146002
J Soc Inf Display. 2019;1–17.
Abstract
With the recent growth in the development of augmented reality (AR) technol-
ogies, it is becoming important to study human perception of AR scenes. In
order to detect whether users will suffer more from visual and operator fatigue
when watching virtual objects through optical see‐through head‐mounted dis-
plays (OST‐HMDs), compared with watching real objects in the real world, we
propose a comparative experiment including a virtual magic cube task and a
real magic cube task. The scores of the subjective questionnaires (SQ) and
the values of the critical flicker frequency (CFF) were obtained from 18 partic-
ipants. In our study, we use several electrooculogram (EOG) and heart rate var-
iability (HRV) measures as objective indicators of visual and operator fatigue.
Statistical analyses were performed to deal with the subjective and objective
indicators in the two tasks. Our results suggest that participants were very
likely to suffer more from visual and operator fatigue when watching virtual
objects presented by the OST‐HMD. In addition, the present study provides
hints that HRV and EOG measures could be used to explore how visual and
operator fatigue are induced by AR content. Finally, three novel HRV mea-
sures are proposed to be used as potential indicators of operator fatigue.
KEYWORDS
augmented reality, ECG, EOG, human perception, optical see‐through HMD, visual fatigue
1 | INTRODUCTION
Based on the development of stereoscopic technologies,augmented reality (AR) is evolving and attracting moreand more attention. AR refers to the set of technologiesthat can superimpose digital information onto real envi-ronments and present them to observers.1 As AR canenhance humans' perception of the real world, it can be
wileyonlinelibrary.com/journa
used widely in different areas, such as education, theindustry, medical sciences, and the military.
Among the numerous display options for AR systems,head‐mounted displays (HMDs) have the advantages ofleaving the users' hands free and of adding virtual infor-mation to real environments from the viewer's point ofview. There are two main types of HMDs for ARapplications: (1) video see‐through head‐mounted displays
© 2019 Society for Information Displayl/jsid 1

2 GAO ET AL.
(VST‐HMDs) and (2) optical see‐through head‐mounteddisplays (OST‐HMDs).2 VST‐HMDs compose the virtualobjects into a video stream that is captured by camerasattached to the HMD. In contrast, OST‐HMDs receivethe information from an optical element, which can com-bine the virtual objects with an optical view of the realworld. However, there are also many limitations regard-ing the AR‐HMD technology. Since most of the HMDshave a fixed focal length, a focal rivalry will arise whenthe depth of the virtual objects is different from the focallength, which will influence users' perception in AR.Indeed, some researchers have come up with ideas to dealwith the problem, such as using free‐form design.3 How-ever, there is still a need for measuring methods for per-ception issues in AR. In this work, we focus onperception judgment in OST‐HMDs.
In the present study, a comparative experiment withtwo tasks was designed to investigate differences inhuman perception when watching virtual objects pre-sented in an OST‐HMD, compared with watching realobjects through the OST‐HMD. In order to measurevisual or operator fatigue, we used the scores of subjectivequestionnaires before and after the tasks, as well as otherobjective measures. Our results show that some subjectssuffered more from visual and operator fatigue afterwatching virtual objects presented by the OST‐HMD thanwatching the real objects. Moreover, we found that somephysiological measures could serve as effective indicatorsof operator fatigue.
2 | RELATED WORK
Over the past decade, many researchers focused on per-ception issues in AR systems, most of them being dedi-cated to depth perception. Some researchers conductedvarious experiments to detect human accuracy of depthperception under different conditions in AR.4–6 Studiesalso focused on finding proper methods to conduct depthassessments.7–9 There are also quantitative depth percep-tion studies for stereoscopic disparity.10,11 However, inthose studies, the detected human perception dependedon the results of task performances. In contrast, the pres-ent research studies human operator fatigue by analyzingusers' physiological signals and subjective scores. Itshould be noted that visual fatigue is a feeling of weari-ness resulting from a visual task. It can be of ocular, mus-cular, or psychic causes.12 Moreover, there is no uniformdefinition for the operator fatigue. In the presentresearch, operator fatigue can be explained as a complexstate that affects a person's ability to be attentive and toremain alert.13
Traditionally, visual fatigue caused by stereoscopiccontents presented by visual display terminals can bemeasured using (1) subjective questionnaires,14 (2) criti-cal flicker frequency (CFF), which is defined as thethreshold at which light from an intermittent source isseen half the time as flickering and half the time as fusedor continuous,15,16 or (3) accommodative response orvisual function index of human eyes.17
In addition, some physiological signals have beenshown to be good indicators of fatigue. Heart rate variabil-ity (HRV) is one of these typical indicators. HRV is definedas the physiological phenomenon of variation in the timeinterval between heartbeats18 and is usually recorded byelectrocardiography (ECG). ECG records the electricalactivity of a participant's heart using electrodes placed onthe skin over a period of time.19 McCraty et al20 proposedthat humans' neurological and cognitive functions caninfluence their heart rate and rhythm. Conversely, theheart's sensory input can also influence cognitive func-tions, performance, and working memory.21 Park et al22
conducted a 2D‐3D comparative experiment to investigatewhether the visual fatigue from 3D contents can affecthumans' autonomic regulations and heart rhythms. Theresults show that subjects of the 3D group have a signifi-cant increase of heart rate compared with those from the2D group. Heinze et al23 studied the relationship betweenHRV and numerous operator fatigue measures and foundthat several measures can be strong indicators of operatorfatigue.Electrooculography (EOG) can also serve as indi-cators of visual fatigue and operator fatigue. EOG mea-sures the corneo‐retinal standing potential that existsbetween the front and the back of the human eye.24 Sternet al25 proposed that a higher blink rate was related tohigher eyestrain. Yu et al26 investigated the visual fatiguecaused by 2D and 3D displays through measuring the eyemovement based on EOG. Inoue et al27 conducted anexperiment to confirm that the video‐oculography (VOG)and EOG can be used as indicators of visual fatigue whenthe users are watching 3D contents. Kaneko et al28 usedthe EOG waveform as an objective indicator of the visualfatigue assessment of a visual display terminal.
Interestingly, few researchers have studied users'fatigue in AR systems. Tümler et al29 designed an experi-ment to compare users' strain between an AR‐supportedand a non–AR‐supported work task. They analyzed HRVmeasures and found that there is no difference betweenthe two tasks. Later, Grubert et al30 designed a new exper-iment based on Tümler's one. They extended the durationof the tasks, but, once again, there was no significant dif-ference between the two tasks. However, these studiesused a few HRV measures, and no powerful evidencewas mentioned in their paper to prove that these measuresare strong enough to indicate human strain.

GAO ET AL. 3
3 | MATERIALS AND METHODS
Before the formal experiment, all the participants have per-formed visual function tests, including the visual acuity test,the stereo acuity test, and the Ishihara31 test to ensure thatthey have normal or correcting normal vision functions. Asa result, 18 participants (nine males and nine females)have passed the tests and could participate in the experi-ment. The average age of the participants is 25.11 years, theirages ranging from 23 to 29, with an SD = 1.45.
Since our comparative experiment consisted of twotasks, all the participants needed to perform both of them.The subjects were randomly divided into two groups: Onegroup performed the virtual magic cube task (viewing ARcontent) first, and the other group performed the realmagic cube task (viewing real objects) first. In order toeliminate learning effects, the users had to wait at least1 week before performing the second task. Moreover, toguarantee that the participants have similar physiologicalstates in the two tasks, they were asked to perform thetwo tasks at the same time of two different days.
3.1 | Experiment environment andstimuli
Figure 1 gives an overview of the experimental environ-ment, as well as of the equipment used for the research.The experiment consists of two tasks, which are thevirtual magic cube task (Figure 1A) and the real magiccube task (Figure 1B). A stereo OST‐HMD with the reso-lution of 800 × 600 pixels per eye, designed by the BeijingInstitute of Technology, was used to present the virtual3D images in the experiment.32 The OST‐HMD has a bin-ocular visual system with free‐form surface optics. Theeffective focal length of the optics is 15 mm. The field ofview is 45H32V. The size of the LCD screens is 0.61 in.The device named BIOPAC MP150 and the software
FIGURE 1 The experimental environment: A, the virtual magic cub
OST‐HMD, see‐through head‐mounted display
AcqKnowledge 4.01 were used to record the ECG andEOG signals of the subjects during the experiment. ACFF measurement device was used to gain the subjects'CFF values.
Before the formal experiment, the subjects sat in frontof the desk and held the wooden support of the OST‐HMD. In the virtual magic cube task, the subjectswatched virtual magic cubes that were presented on theplatform in the real world through the OST‐HMD (cfFigure 1A). The AR scene was produced by the softwareUnity 3D. The depth and size of the virtual magic cubewere set in Unity directly. The virtual cameras' distancewas set as an adjustable variable in the program to matchdifferent people's interpupillary distance (IPD). An inter-pupillary ruler was used to measure the participants'IPD before the experiment. Correspondingly, the OST‐HMD was turned off in the real magic cube task, and apair of real magic cubes was located at the same placeas the virtual magic cubes. In both tasks, the magic cubeswere located at a distance of 0.9 m from the viewer and ofthe same size. We selected 0.9 m as the watching distancedue to that it exceeds the smallest distance of distinctvision of 25 cm, and considering the angular resolution,the viewing distance, and the field of view, 0.9 m wasselected to guarantee that the virtual magic cubes lookthe same size with the real magic cubes. Moreover, theHMD's brightness at the exit pupil position was 150 nits,and the transmittance of the HMD is 60%. In addition,the ambient brightness was kept at 300 lx. The subjectscould watch the real magic cubes through the optical lensof the OST‐HMD (cf Figure 1B).
In both tasks, seven pairs of magic cubes with fixedpatterns served as stimuli. Each pair of magic cubes waspresented for 3 minutes. The presentation order of theseven pairs of magic cubes was identical in the two tasksand was the same for all subjects. The OST‐HMD wasfixed on the holder in order to make the experimental
e task; B, the real magic cube task. CFF, critical flicker frequency;

FIGURE 2 The experimental procedure
FIGURE 3 Example of one pair of real magic cubes
4 GAO ET AL.
settings more consistent between trials, as well as to elim-inate the influence of the fatigue caused by the weight ofthe HMD.
*https://en.wikipedia.org/wiki/Error_bar.
3.2 | Experiment procedure
The two tasks of the experiment have the same proce-dure, which is depicted in Figure 2. Before the formalexperiment, written informed consent was obtained andthe experiment procedure was explained to each partici-pant. Then the electrodes for ECG and EOG were con-nected to the subjects. The software began to record thebiological data after the connection, and the recordingwas performed for all the experiment. In addition, anextra experiment was designed for the subjects to practicethe tasks before the formal ones.
Then, the subjects began the formal experiment. Theywere asked to relax for 3 minutes and to answer the sub-jective questionnaires on visual fatigue. Next, the CFFvalues of the subjects were tested and recorded by theexperimenter. Subsequently, the subjects began to per-form the task.
In the real magic cube task, the subjects could see apair of real magic cubes presented on the platform. Infact, subjects could see six faces of these two magic cubes,as depicted in Figure 3. We have prepared seven pairs ofmagic cubes with random patterns. Therefore, the pat-terns on the seven pairs of magic cubes are different fromeach other and have not been changed during the
experiment. The faces of the cubes were of six differentcolors: red, orange, yellow, green, blue, and white. Thesubjects' task was to count the number of each color thatappeared on the six faces of the pair of magic cubes. Thetime allocated for this was 3 minutes. The counting taskwas in fact irrelevant but served as a guarantee that thesubjects always kept their eyes on the magic cubes duringthe experiment. The subjects were then asked to writedown their answers after each session. After that, theirCFF values were tested. The experimenter replaced themagic cubes manually. After all these seven sessions,the subjects were asked to answer the subjective ques-tionnaire once again. Moreover, the experimentermarked the time of the beginning and ending of each ses-sion in the software.
The procedure of the virtual magic cube task is thesame as the real one. The patterns of the virtual magiccubes are the same with the real ones. The only differenceis that the virtual magic cubes were presented by theOST‐HMD.
4 | RESULTS OF THE EXPERIMENT
4.1 | CFF value
Many previous studies used CFF as an indicator of visualfatigue caused by visual display terminals. The decreaseof CFF values is characteristic of a diminution of partici-pants' sensory perception functions.33
The present research measured participants' CFFvalues before and after every session for each task; thereis thus a total of eight CFF measurements for each sub-ject. Figure 4 represents the mean values of CFF for allthe subjects after every session of the tasks. The blue con-tinuous line represents the mean CFF value in the realmagic cube task, while the red dotted line is used forthe virtual magic cube task. Error bars are graphical rep-resentations of the variability of data; it is used on graphsto indicate the error or uncertainty in a reported mea-surement.* In the present study, the error bars were

FIGURE 4 Mean value of critical flicker frequency (CFF) during
the experimental process
GAO ET AL. 5
represented by ±2SE (SE: standard error). This methodshows a 95% confidence interval. In general, the blue linedecreases with the task process, whereas the red linereaches its apex in session 2, before showing a downtrendfrom sessions 2 to 6. Finally, a slight increase can be seenin session 7.
A paired sample t test was used to compare the CFFvalues between the two tasks. The results show that thereis no significant difference between the two tasks. In addi-tion, a paired sample t test was used to compare differentsessions within the real magic cube task. The result showsthat the participants' CFF values of previewing, sessions 1and 2 were significantly higher than those of sessions 4 to7. The CFF values of session 3 are significantly higher thanthose of sessions 5 to 7. Table 1 gives the significant resultsof paired sample t test for the real magic cube task.
In summary, we can see that CFF values decreased sig-nificantly after the experiment in the real magic cube task.The decreasing trend is not as noticeable in the virtualmagic cube task as in the real one. However, we found aphenomenon in Figure 3, where the mean CFF valuebegan to decrease after session 2 in the virtual magic cubetask; a paired sample t test was thus applied to comparesession 2 with all the other sessions. The results show thatthe significant differences arise between session 2 and allthe following sessions (session 2 vs session 3: t17 = 3.619,P= 0.002; session 2 vs session 4: t17 = 2.462, P= 0.025; ses-sion 2 vs session 5: t17 = 3.179, P = 0.005; session 2 vs
TABLE 1 The paired sample t test results for the real magic cube tas
Results of Paired Sample t Test Session 4 Sessio
Previewing t17 = 3.510, P = 0.003 t17 = 4
Session 1 t17 = 2.112, P = 0.050 t17 = 3
Session 2 t17 = 2.108, P = 0.050 t17 = 3
Session 3 No significant result t17 = 3
session 6: t17 = 3.654, P = 0.002; session 2 vs session 7:t17 = 3.042, P= 0.007). Although the mean value increasedduring the first two sessions in the virtual magic cube task,the increase is not statistically significant. In other words,the participants' sensory perception functions declinedover time in both tasks.
4.2 | Subjective questionnaire
The subjective questionnaire in the present researchselected nine symptoms that have a relationship with visualfatigue, including the symptoms of burning, ache, strain,irritation, tearing, blur, double vision, dryness, and head-ache. The selection of these nine symptoms is based onSheedy's theory, in which Sheedy et al34 divided visualfatigue into two constellations, labeled as external andinternal symptom factors (ESF and ISF). ESF can inducedry eye symptoms, such as burning, irritation, tearing,and dryness, while ISF are related to accommodative andvergence stress, such as ache, strain, and headache. In addi-tion, we added another two symptoms blur and doublevision in the present subjective questionnaire. Subjectsneed to give score for each symptom on a 0 to 100 scale,where the higher the score, the more serious the symptomis. Scoring was achieved by making a cross on a 10‐cm‐longline on a piece of paper. The experimenters calculated thescores based on the cross's location on the line.
The mean scores of the subjective questionnaires havebeen calculated by averaging all the subjects' subjectivescores before and after the tasks, and are shown inFigure 5, where each bar represents a condition, namely,real‐pre, real‐post, virtual‐pre, and virtual‐post. The meansubjective scores before and after the same task werecompared. Results show that the mean subjective scoreshave increased after both tasks.
The paired sample t test was used to compare the sub-jects' previewing and postviewing scores of each subjec-tive symptom. Results show that significant increaseswere found on all the symptoms' subjective scores, exceptfor tearing in the real magic cube task, and headache inboth of the tasks. Table 2 gives the results of the pairedsample t test. In other words, participants suffered frommore serious visual fatigue in ESF and ISF after both
k between different sessions
n 5 Session 6 Session 7
.374, P = 0.001 t17 = 3.316, P = 0.004 t17 = 4.223, P = 0.001
.646, P = 0.002 t17 = 3.071, P = 0.007 t17 = 3.783, P = 0.001
.753, P = 0.002 t17 = 2.716, P = 0.015 t17 = 2.774, P = 0.013
.2, P = 0.005 t17 = 2.322, P = 0.033 t17 = 2.498, P = 0.023

FIGURE 5 Mean scores of the
subjective questionnaires
TABLE 2 The paired sample t test results for all the symptoms between previewing and postviewing
Symptoms
Burning Ache Strain Irritation Tearing Blur Double Vision Dryness Headache
R‐t17 −2.870 −3.463 −3.964 −2.748 −1.390 −2.420 −2.783 −3.645 −1.957
R‐P 0.011 0.003 0.001 0.014 0.182 0.027 0.013 0.002 0.067
V‐t17 −2.808 −3.903 −3.304 −2.978 −2.134 −2.450 −2.477 −3.662 −1.116
V‐P 0.012 0.001 0.004 0.008 0.048 0.025 0.024 0.002 0.280
6 GAO ET AL.
tasks. After that, a paired sample t test was used to com-pare the mean values of all the symptoms between thetwo tasks. The results show that the mean subjectivescore after the virtual magic cube task (mean = 17.14,SD = 7.24) is significantly higher (t8 = 5.69, P = 0.000)than that after the real magic cube task (mean = 13.22,SD = 6.35). Finally, there is no significant differencebetween the two tasks before the experiment (t8 = 1.37,P = 0.208).
TABLE 3 Description of the heart rate variability (HRV)
measures35
Measure Units Description
Time domain STD‐RR ms Standard deviationof RR intervals
Mean‐RR ms The mean of RR intervalsSTD‐HR 1/min Standard deviation of
instantaneous heart ratevalues
NN50 Interval pairs that differmore than 50 ms
pNN50 % NN50 divided by the totalnumber of RR intervals
4.3 | ECG data
As mentioned above, the subjects' ECG signals wererecorded, and we removed artifacts in those signals byapplying a correction threshold in AcqKnowledge 4.0.However, we had to discard ECG signals from three ofthe subjects due to significant noise. This was probablycaused by a poor connection between the electrodes'and the subjects' skin (the ECG electrodes were stuckon the legs and arms of participants). As a conclusion,15 ECG signals were used in the analysis.
Nonlinear SD1,SD2 ms The standard deviation ofthe Poincaré plotperpendicular to (SD1)and along (SD2) the lineof identity
DET % DeterminismShanEn Shannon entropy
4.3.1 | HRV measures used in the study
In order to analyze the participants' time‐domain HRVmeasures, we used the Kubios HRV 2.22 software, which
is also able to compute several nonlinear interesting HRVmeasures.
Table 3 lists the HRV measures used in ourresearch.35 The abbreviation RR intervals in Table 3 rep-resents the time intervals (in milliseconds) between twosuccessive heart beats. Therefore, STD‐RR is the standarddeviation of RR intervals, and Mean‐RR is the mean of

GAO ET AL. 7
RR intervals. In addition, STD‐HR is the standard devia-tion of instantaneous heart rate values. NN50 representsthe number of the successive RR intervals that differmore than 50 milliseconds, and pNN50 is the correspond-ing relative amount:
pNN50 ¼ NN50N − 1
× 100%:
N is the number of the successive RR intervals.As for the nonlinear HRV measures SD1 and SD2 in
Table 2, a diagram as shown in Figure 5 helps explainingthe meanings. The Poincaré plot is a commonly nonlinearmethod that is a graphical representation of the correla-tion between successive RR intervals, as shown inFigure 6. An ellipse was used to parameterize the shapeof the plot, and it is oriented according to the line of iden-tity (RRj = RRj + 1). The standard deviation of the pointsperpendicular to the line of identity denoted by SD1
FIGURE 6 Poincaré plot analysis with the ellipse fitting
procedure. SD1 and SD2 are the standard deviations in the
directions x1 and x2, where x2 is the line of identity for which
RRj = RRj + 135
FIGURE 7 A, The mean values of Mean‐RR. B, The mean values of
describes short‐term variability, whereas the standarddeviation of the points along the line of identity denotedby SD2 describes long‐term variability.
As for DET% and ShanEn, they are both measuresusing another nonlinear method, named recurrence plotanalysis: DET% is the measure of the determinism ofRR intervals time series; ShanEn represents Shannoninformation entropy of the diagonal line lengthdistribution.
Heinze et al23 calculated the correlations betweenHRV measures and multiple fatigue measures underthree different conditions. Their results show that HRVmeasures are, in general, good indicators of operatorfatigue. SD2 and STD‐RR can be considered as strongindicators of operator fatigue, as they have positive corre-lations with almost all the fatigue measures. They alsofound that Mean‐RR, pNN50, and SD1 have nonsignifi-cant correlations with all fatigue measures in all threeconditions of their experiments. Comparatively, someprevious studies found that a decreasing Mean‐RR has asignificant correlation with chronic fatigue syndrome36
and that a decreasing pNN50 value represents physicalfatigue.37
As a consequence, we chose to use the reliable fatigueindicators SD2 and STD‐RR to detect the operator fatigueinduced by the two tasks. Nevertheless, we also analyzedthe Mean‐RR, pNN50, and SD1 HRV measures to con-firm results obtained by Heinze et al.23 In addition, someprevious studies proposed that the subjects' heart ratesincrease after watching 3D contents.20,32 Therefore, heartrate–related measure STD‐HR was selected to be ana-lyzed. Furthermore, some nonlinear HRV measures(DET% and ShanEn) have also been selected to detectwhether they could be used as potential reliable indica-tors of operator fatigue.
4.3.2 | Statistical analysis and results
Figure 7 gives the trends of the above three measures. Themean values and standard deviation of Mean‐RR, pNN50,and SD1 are presented in Table 4. In order to analyze the
pNN50. C, The mean values of SD1

TABLE 4 The mean values and standard deviation of Mean‐RR, PNN50, and SD1
Sessions
1 2 3 4 5 6 7
Mean‐RR (mean) R 792.52 792.50 789.99 788.72 802.83 793.81 795.52V 806.71 789.63 778.19 790.30 784.49 792.53 780.94
Mean‐RR (SD) R 116.76 117.51 114.86 111.82 117.64 109.18 111.66V 125.25 121.86 116.61 118.84 112.47 114.90 111.43
pNN50 (mean) R 15.31 13.89 11.223 12.91 13.87 12.52 13.07V 14.36 12.31 11.224 10.57 11.05 12.45 10.95
pNN50 (SD) R 16.79 14.06 13.11 15.02 12.38 12.24 11.29V 14.99 17.25 14.31 14.64 13.69 14.63 14.63
SD1 (mean) R 22.51 22.77 21.12 21.62 22.53 21.97 20.73V 23.18 22.03 21.04 20.49 20.75 22.03 20.85
SD1 (SD) R 10.78 9.65 8.52 9.52 8.72 7.94 8.83V 9.61 10.58 9.02 8.57 8.26 9.09 9.02
8 GAO ET AL.
time effect, a paired sample t test was conducted on differ-ent sessions within the same task. Results show that com-pared with session 1, all the following sessions (exceptsession 6) show a significant decrease in Mean‐RR in thevirtual magic cube task (session 1 vs session 2: t14 = 2.497,P = 0.026; session 1 vs session 3: t14 = 4.043, P = 0.001;session 1 vs session 4: t14 = 2.304, P = 0.037; session 1 vssession 5: t14 = 2.684, P = 0.018; session 1 vs session 7:t14 = 2.473, P = 0.027). No significant difference was foundduring the real magic cube task.
Furthermore, significant decreases in pNN50 valueswere found in sessions 3 and 4 compared with session 1in the virtual magic cube task (session 1 vs session 3:t14 = 2.266, P = 0.04; session 1 vs session 4: t14 = 2.906,P = 0.011). As for pNN50 in the real magic cube task,although the mean value decreased in the first three ses-sions, no significant difference was found.
The results of the paired sample t test also show thatcompared with session 1, all the following sessions(except sessions 2 and 6) show a significant decrease inSD1 in the virtual magic cube task (session 1 vs session3: t14 = 2.815, P = 0.014; session 1 vs session 4:t14 = 3.449, P = 0.004; session 1 vs session 5:
FIGURE 8 A, The mean values of STD‐RR. B, The mean values of S
t14 = 2.419, P = 0.03; session 1 vs session 7: t14 = 2.464,P = 0.027). No significant difference was found duringthe real magic cube task.
The paired sample t test also showed no significantdifference between the same sessions of the two tasksfor these three HRV measures (pNN50, Mean‐RR, andSD1).
Moreover, a paired sample t test analysis was per-formed to compare all the HRV measures of correspond-ing sessions in the two tasks. As previously, a 95%confidence interval was used during statistical analysis.Results show that the reliable fatigue indicators STD‐RRand SD2 both have significant differences between thetwo tasks in session 3 (STD‐RR: t14 = −2.306, P = 0.037;SD2: t14 = −2.387, P = 0.032), but no significant differ-ence was noticed in the other sessions.
The trends of the STD‐RR and SD2 indicators duringthe two tasks are depicted in Figure 8. It is interestingto note that they exhibit similar trends and that theirmean values are both higher in the virtual magic cubetask than in the real magic cube tasks in session 3. Noabnormal data were found in session 3. After they fluctu-ate during the first three sessions, the mean values of
D2

GAO ET AL. 9
STD‐RR and SD2 increased stably in the following ses-sions. The mean values and standard deviation of thesetwo measures are given in Table 5. In order to detectchanges as the time goes by, a paired sample t test wasapplied on the sessions within each task. Results founda significant increase in session 7 compared with session4 in the virtual magic cube task for the STD‐RR indicator(t14 = −2.351, P = 0.034). Similarly, a significant increasealso appeared in session 7 compared with session 4 in thereal magic cube task for SD2 (t14 = 3.436, P = 0.004).
It is worth noting that the following three HRV mea-sures also have a significant difference between the twotasks in session 3: STD‐HR (t14 = −2.417, P = 0.030),DET% (t14 = −2.273, P = 0.039), and ShanEn(t14 = −2.213, P = 0.044). They also have similar trendswith STD‐RR and SD2 (see Figure 9) that were provedto be reliable fatigue indicators in the literature.23 Elevenout of 15 subjects were found to have a higher STD‐HRvalue in the virtual magic cube task than in the real onein session 3. Regarding DET% and ShanEn, 10 out of 15subjects have a higher value in session 3 of the virtualmagic cube task than in the same session of the realmagic cube task. Once again, no abnormal data werefound in these subjects. The mean values and standarddeviation of STD‐HR, DET%, and ShanEn are given inTable 6.
TABLE 5 The mean values and standard deviation of STD‐RR and S
Sessions
1 2 3
STD‐RR (Mean) R 38.44 40.34 3V 38.28 38.49 4
STD‐RR (SD) R 11.35 10.14V 8.15 8.77 1
SD2 (Mean) R 48.30 50.39 4V 46.71 47.46 5
SD2 (SD) R 13.64 13.53 1V 12.00 12.32 1
FIGURE 9 A, The mean values of STD‐HR (1/min). B, The mean va
4.4 | EOG data
EOG data were obtained through electrodes placedaround the subjects' eyes. A software named Eogui338
was used to record and extract the EOG data. Eogui3 isa MATLAB software that has a graphical user interface(GUI) to analyze EOG data. It can detect saccades andblinks in the EOG. A correction threshold in the softwarewas used to remove artifacts in the EOG signals. How-ever, for some of our subjects, the extraction of EOG mea-sures remained impossible after the artifacts' removal. Inorder to guarantee the accuracy of results, EOG signalsthat have too much noise were removed from the finaldata. Considering the need to compare results obtainedfrom both tasks, we only kept data from subjects whoseEOG signals were good enough in both tasks. As a conse-quence, six subjects out of 18 were used in the statisticalanalysis.
Three measures (“Blink duration,” “Blink delay,” and“Blink rate”) were selected as visual fatigue indicators inthe present research. Several previous studies investigatedthe relationship between blink duration and humanfatigue. Caffier et al39 found that the blink duration wassignificantly longer in a drowsy condition than in an alertcondition (50 ms longer). This difference is noticeablesince it is about one‐quarter of the original blink duration
D2
4 5 6 7
6.33 39.24 39.46 40.68 41.461.74 37.89 39.99 40.40 42.19
8.25 11.96 10.19 10.05 12.232.29 8.18 9.48 7.25 9.88
5.23 49.05 49.39 50.19 52.742.99 48.26 50.76 51.77 52.14
0.84 16.23 13.47 16.03 13.487.23 9.93 13.02 14.55 8.69
lues of DET%. C, The mean values of ShanEn

TABLE 6 The mean values and standard deviation of STD‐HR, DET%, and ShanEn
Sessions
1 2 3 4 5 6 7
STD‐HR (mean) R 3.65 3.97 3.55 3.81 3.69 3.91 3.97V 3.68 3.76 4.24 3.73 4.00 4.02 4.24
STD‐HR (SD) R 0.96 1.12 0.70 0.76 0.75 0.77 0.82V 1.08 0.68 1.22 0.80 1.15 1.18 1.09
DET% (mean) R 97.48 97.51 96.98 97.54 97.20 97.34 97.64V 96.77 97.62 97.81 97.46 97.38 97.11 97.98
DET% (SD) R 1.32 1.34 1.26 1.34 1.13 1.76 1.19V 1.49 1.27 1.48 1.53 1.49 1.86 0.86
ShanEn (mean) R 3.07 3.04 2.95 3.06 3.05 3.05 3.04V 2.93 3.06 3.16 3.05 3.09 2.99 3.14
ShanEn (SD) R 0.34 0.28 0.25 0.26 0.27 0.29 0.26V 0.27 0.29 0.37 0.29 0.38 0.31 0.30
10 GAO ET AL.
(200 ms). Hsieh et al40 proposed a system that utilizes eyeblink durations as one of the main schemes to warndrivers about fatigue. Schleicher et al41 stated that blinkduration is by far the most important variable to indicatesubjective, as well as video‐rated fatigue, and the secondmost important is the delay of reopening the eye. Otherresearchers pointed out that the delay of reopening is anindicator of sleepiness, and the longer the delay ofreopening, the sleepier the subjects.39,42 In addition,many previous studies investigated the influence of visualfatigue on blink rate. Kim et al43 analyzed the individualblink rate and found that eye blinks increased with mod-erate visual fatigue compared with low visual fatigue forfive out of seven subjects. Li et al44 focused on the rela-tionship between visual fatigue, blink rate, and 3Dmotion characteristics. They found that blink ratesincreased along with subjective scores of visual fatiguewhen the subjects watched static 3D contents.
FIGURE 10 From left to right. A, The mean values of blink duration
blink rate (times/s)
Figure 10 shows blink duration, blink delay, andblink rate as measured in our experiment. Figure 10Ashows that the mean blink duration increases with theprogress of the virtual magic cube task, whereas it gener-ally remains stable during the real magic cube task.Although the mean blink duration in the real magic cubetask is higher than that in the virtual magic cube task,they reach almost the same level in session 7 given theincrease of blink duration in the virtual magic cube task.Figure 10B shows that mean blink delay fluctuates whileremaining at similar values during the experiment in thetwo tasks. Moreover, the mean blink delay value in thereal magic cube task has an increasing trend with theprogress of the task. Figure 10C gives the trends of blinkrate during the two tasks. At the beginning, the meanblink rates have similar values in the two tasks. After ses-sion 3, the mean blink rate in the virtual magic cube taskwas always higher than that in the real one.
(ms). B, The mean values of blink delay (ms). C, The mean values of

GAO ET AL. 11
A paired sample t test was used to compare blinkduration, blink delay, and blink rate of all sessionsbetween the two tasks. Results show that no significantdifference was found in “Blink duration” and “Blinkdelay” between the two tasks for all the sessions.
As for the parameter “Blink rate,” a significant differ-ence was found between the two tasks in session 2(t5 = −3.683, P = 0.014) and session 7 (t5 = −4.167,P = 0.009). Through observing each subject's blink ratedata, it can be found that all the subjects have a higherblink rate in sessions 2 and 7 of the virtual magic cubetask than the corresponding sessions in the real magiccube task. It is not very clear to us why these significantresults only appear in sessions 2 and 7. Results reveal thatparticipants may be more affected by visual fatigue dur-ing the virtual magic cube task than during the real
TABLE 7 Blink duration: mean values, standard deviation, and t val
Blink Duration
1 2 3
Mean R 299.54 303.35 307.56V 258.96 269.31 270.68
SD R 32.06 49.44 50.11V 38.13 31.49 21.43
t5 2.381 1.470 1.624
P 0.063 0.201 0.165
TABLE 9 Blink rate: mean values, standard deviation, and t values a
Blink Rate
1 2 3
Mean R 0.49 0.48 0.54V 0.45 0.56 0.42
SD R 0.18 0.25 0.3V 0.19 0.24 0.27
t5 1.013 −3.68 0.987
P 0.358 0.014 0.369
TABLE 8 Blink delay: mean values, standard deviation, and t values
Blink Delay
1 2 3
Mean R 6.69 9.66 9.88V 10.61 8.20 9.86
SD R 4.14 5.87 6.60V 6.22 5.54 6.60
t5 −2.019 0.554 0.008
P 0.099 0.603 0.994
magic cube task. Nevertheless, additional experimentsneed to be conducted to confirm this tendency.
Detailed data of mean values and standard deviationfor the EOG measures, as well as their t and P values ofthe paired sample t test, are shown in Tables 7, 8, and 9.
With Table 6, it can be found that the mean value ofthe subjects' blink duration increased of 35.6 millisecondsafter the virtual magic cube task, which is about 13.7% ofthe original blink duration (258.96 ms). On the contrary,the mean value of the blink duration did not change asmuch during the real magic cube task. In order to detectthe time effect on the EOG measures, a paired sample ttest was also used in the comparison between the first ses-sion with each other session of the two tasks. Resultsshow a significant difference for blink duration betweenthe first and the last sessions in the virtual magic cube
ues and P values of the paired sample t test between two tasks
4 5 6 7
291.45 296.43 289.28 292.96283.25 287.98 283.64 294.56
35.70 48.18 44.45 41.6138.90 53.04 36.09 36.25
0.578 0.307 0.512 −0.076
0.588 0.771 0.63 0.943
nd P values of the paired sample t test between two tasks
4 5 6 7
0.48 0.44 0.52 0.420.72 0.55 0.60 0.56
0.27 0.19 0.24 0.170.44 0.26 0.23 0.20
−2.022 −1.917 −2.061 −4.167
0.099 0.113 0.094 0.009
and P values of the paired sample t test between two tasks
4 5 6 7
10.33 10.41 10.05 10.4511.49 10.45 11.54 9.58
4.88 5.57 4.71 5.066.36 5.52 6.69 7.67
−0.593 −0.04 −0.582 0.263
0.579 0.97 0.586 0.803

12 GAO ET AL.
task (t5 = −4.978, P = 0.04). As for blink delay, a signifi-cant difference arises between the first and the fourth ses-sions (t5 = −2.99, P = 0.03) and between the first and thelast sessions (t5 = −2.876, P = 0.035) in the real magiccube task. The blink rates' results show that significantdifferences emerge in the virtual magic cube task: session1 vs session 2 (t5 = −2.603, P = 0.048), session 1 vs session6 (t5 = −3.241, P = 0.023), and session 1 vs session 7(t5 = −3.421, P = 0.019).
Considering that physiological signals of individualsmay greatly differ, all the subjects' blink data wereobserved. Results show that there is no outlier in the data.
As for blink duration, the increasing magnitude wascomputed after the two tasks individually. Results showthat while all subjects exhibit a longer blink durationafter the virtual magic cube task, only half of themincreased their blink duration after the real magic cubetask. The increasing magnitudes are listed in Table 10.Note that the average increase in blink duration magni-tude is 35.6 milliseconds with a base average value of258.96 milliseconds.
From the blink delay's raw data, we can see that fourout of six subjects have a longer blink delay in the virtualmagic cube task than in the real magic cube task duringthe first two sessions. In the following sessions, this is stilltrue for three out of six subjects. All the subjects had alonger blink delay in the last session of the real magiccube task, whereas only two out of six subjects had a lon-ger blink delay in the last session of the virtual magiccube task.
Table 11 presents the number of subjects having ahigher blink rate in the virtual magic cube task than thereal magic cube task for each session. Note that in ses-sions 2 and 7, all the subjects have a higher blink ratein the virtual magic cube task. We also found that the dif-ference between the two tasks is bigger in session 7 thanin session 2.
TABLE 10 Subjects' increasing magnitude after the two tasks
Subject
1 2 3 4 5 6
R −1.83 −10.07 11.79 −81.78 2.42 40.02
V 39.89 46.01 39.55 52.85 2.65 32.66
TABLE 11 The number of the subjects who have higher blink
rate in the virtual magic cube task compared with the real cube task
Session
1 2 3 4 5 6 7
Number 2 6 3 4 5 5 6
5 | ANALYSIS AND DISCUSSION
5.1 | CFF and subjective scores
Results of CFF show that (1) the participants' sensory per-ception functions declined over time in both tasks andthat (2) no significant difference was found between thetasks. Moreover, results of the subjective scores show thatparticipants suffered from visual fatigue after the twotasks in both ESF and ISF and that visual fatigue wasmore important after the virtual magic cube task thanafter the real magic cube task.
5.2 | ECG data
5.2.1 | Mean‐RR, pNN50, and SD1
We know that a decrease of Mean‐RR and pNN50 is sig-nificantly correlated with human fatigue (see, eg,Tarvainen et al35 and Yoshiharu et al36). Previousresearch also shows that Mean‐RR has a consistentdecrease under mental workload,45 whereas pNN50increased under heavier mental workload condition.46,47
Some previous studies also show that there is a decreaseof SD1 when human do physical exercise.48,49 In ourexperiment, it can be seen that subjects suffer from oper-ator fatigue and mental workload during the virtualmagic cube task given the significant decrease of theMean‐RR indicator in nearly all the sessions followingsession 1 (with the exception of session 6). As for resultsof the pNN50 indicator, they highlight that subjects gotoperator fatigue in sessions 3 and 4 of the virtual magiccube task. This phenomenon may be an accumulationof mental workload strong enough to make the pNN50indicator increase sufficiently to counterbalance theeffects of operator fatigue after session 4. The result alsoshows the significant decrease of the SD1 indicator innearly all the sessions following session 1 (with the excep-tion of sessions 2 and 6) in the virtual magic cube task.However, no significant result was found in the realmagic cube task. Moreover, no significant difference wasfound between the two tasks.
It should be noted that previous research found differ-ent relationships between Mean‐RR, pNN50, operatorfatigue, and mental workload. Heinze et al23 found thatMean‐RR, pNN50, and SD1 have no significant relation-ship with operator fatigue, while Cinaz et al found thatpNN50 decreases significantly under mental workload.50
In our study, we found results that are consistent withexperiments that link a decrease in Mean‐RR with bothoperator fatigue and mental workload35,45 and a decreasein SD1 with operator fatigue48,49 and that correlate a

GAO ET AL. 13
pNN50 decrease with operator fatigue and a pNN50increase with mental workload.36,46,47
5.2.2 | STD‐RR and SD2
Based on results of a previous study,23 these two indica-tors show positive correlations with fatigue. As a conse-quence, it can be inferred that most of the subjectssuffered from more operator fatigue in session 3 of thevirtual magic cube task than in the same session of thereal magic cube task. No significant differences werenoted for the other sessions.
Some questions naturally arise: Why did significant dif-ferences only appear in session 3? Based on previous stud-ies,23 HRV measures can only reliably indicate operatorfatigue under strict experimental conditions in order toeliminate the influence ofmental workload. They alsomen-tioned that some HRV measures such as HR and HRVshowed contradicting sensitivities to workload comparedwith operator fatigue. In addition, we also found thatSTD‐RR and SD2 have similar contradicting sensitivitiesto workload and fatigue: STD‐RR and SD2 increased withthe increasing of operator fatigue,23 whereas STD‐RRdecreased with the increasing of mental workload50,51 andSD2was significant lower in the highmental workload con-dition than in the low mental workload condition.52
It is quite obvious that the tasks used in our study(counting the number of cubes with different colors)can induce a mental workload after a number of repeti-tions. From our results, it can be shown that operatorfatigue mainly influences HRV measures in session 3. Infact, both operator fatigue and mental workload onlyappear after a certain amount of time. Therefore, wecan hypothesize that the subjects did not experience nei-ther operator fatigue nor mental workload during the firsttwo sessions.
However, operator fatigue had been accumulated toan extent level in session 3 in the virtual magic cube task;the subjects' operator fatigue mainly influenced values ofSTD‐RR and SD2 and makes the mean value of STD‐RRand SD2 increase after session 2. However, we noticedan increase of the mean values of STD‐RR and SD2 indi-cators starting in session 3 of the virtual magic cube task.This could mean that subjects suffered from operatorfatigue in session 3 of the virtual magic cube task.
In order to explain why we did not notice such anincrease in the subsequent sessions, we provide the follow-ing explanation. We know that STD‐RR and SD2 showedcontradicting sensitivities to workload compared with oper-ator fatigue: They increased with operator fatigue anddecreased with mental workload.22,47,51,52 However, mentalworkload only appears after a certain amount of time. As a
consequence, it is possible that STD‐RR and SD2 started tobe impacted by the mental workload after session 3 (whichrepresents roughly 10 min).
Since operator fatigue and mental workload have con-tradicting effects on STD‐RR and SD2 (operator fatiguecorresponds to an increase, while mental workload ischaracterized by a decrease of the same indicators), it ishighly possible that the mental workload counterbalanceseffects of operator fatigue in sessions 4 to 7 of the virtualmagic cube task. It is possible that for the real magic cubetask, operator fatigue only showed up in session 4 andwas therefore directly counterbalanced by mental work-load. This hypothesis needs however to be confirmed byfurther experiments.
5.2.3 | STD‐HR, DET%, and ShanEn
These three measures show similar trends with STD‐RRand SD2. It can be thus concluded that they may havethe potential to be used as reliable indicators of operatorfatigue. However, further experiments need to be carriedout to confirm these results.
5.3 | EOG data
5.3.1 | Blink duration
From the results of the paired sample t test, blink dura-tion shows a significant increase after the virtual magiccube task with an average increase in magnitude of35.6 milliseconds with a base average value of 258.96 mil-liseconds. As mentioned above (see Wei et al51), anincrease in blink duration of 50 milliseconds (given a basevalue of 200 ms) arises when subjects experience drowsi-ness. Even if our results have not reached the extent of adrowsy condition, we still believe that the significantincrease of blink duration reflects that subjects sufferedfrom visual fatigue, to a certain extent, after the virtualmagic cube task. Some previous studies have proved thattime influences human's visual fatigue significantly.53
Besides, many studies on the difference of the visualfatigue caused by the 2D and 3D display terminals showthat the significant difference was found after a long con-tinuous watching time of about 15 minutes.54 However,the task time for each session in the present experimentwas only 3 minutes. Although blink duration meanvalues in the real magic cube task are higher than thosein the virtual cube task, the trends of those mean valueslead us to believe that they may have become higher inthe virtual magic cube task than in the real magic cubetask, if the experiment was longer. However, a furtherstudy is needed to verify the idea.

14 GAO ET AL.
5.3.2 | Blink delay
According to our statistical analysis, there is no signifi-cant difference between the two tasks. Nevertheless, wenoticed a significant increase of blink delay in session 7compared with the blink delay in session 1 in the realmagic cube task (individual observations show that allsubjects had an increased blink delay after this task).
It is interesting to notice that blink duration and blinkdelay only proved that subjects suffered from visualfatigue in one of the two tasks (the virtual magic cubetask and the real magic cube one). However, the resultsof these two EOG measures did not show any significantdifference between the two tasks.
5.3.3 | Blink rate
A question arises as to why significant differences regard-ing blink rate between the two tasks appeared onlybetween session 2 and session 7. In order to answer thisquestion, individual blink rates were observed. Table 10shows that all subjects have a higher blink rate in the vir-tual magic cube task in sessions 2 and 7. Moreover, thedifference in session 7 is larger than that in session 2. Inother words, the difference between the two tasksincreased as the experiment progressed. Combining thesetrends with the results of the statistical analysis, it can benoted that (1) the virtual magic cube task increased thesubjects blink rate significantly and (2) the subjects suf-fered more from visual fatigue after the virtual magiccube task than the real magic cube task.
6 | CONCLUSION
This study proposes a comparative experiment to investi-gate differences in human perception when eitherwatching virtual objects displayed in an OST‐HMD orwatching real objects while wearing an OST‐HMD. Thisstudy also provides hints that HRV and EOG measurescould be used to explore visual and operator fatigueinduced by AR content. In addition, CFF measures andsubjective questionnaires were used to evaluate subjects'visual fatigue in the experiment.
Among all the measures, two of them show a signifi-cant difference between the two tasks: the subjectivescores and blink rate. Those indicators reveal that (1) par-ticipants got operator and visual fatigue after both tasksand (2) visual and operator fatigue were significantlymore important in the virtual magic cube task.
The present research also gives some limited findingsthat can serve as reference data for future research. First,among the HRV measures, STD‐RR and SD2 show that
participants suffered more from operator fatigue in thevirtual magic cube task than in the real magic cube taskonly in session 3. This might be explained by mentalworkload accumulation. Indeed, mental workload caninfluence operator fatigue after session 3 (about10 min). Mental workload accumulation can also partlyexplain results of the Mean‐RR and pNN50 indicators:
• Mean‐RR shows significant decrease in the virtualmagic cube task due to the combined action of opera-tor fatigue and mental workload.
• pNN50 decreased significantly during sessions 3 and 4of the virtual magic cube task due to operator fatigue.After session 4, we believe that mental workloadcounterbalances effects of operator fatigue.
As for the real magic cube task, we hypothesize that itmay not induce significant operator fatigue before theend of session 4 and that after this session, it is likely thatthe limited operator fatigue is also counterbalanced bythe effects of mental workload. In addition, the SD1 indi-cator shows significant decrease due to operator fatigue inthe virtual magic cube task. However, it is unclear as towhy there is no difference in the real magic cube taskor between the two tasks for the Mean‐RR, pNN50, andSD1 indicators.
Secondly, some of the measures reveal a time effectduring the task: The CFF values indicate that partici-pants' sensory perception functions declined with thetasks progress. Moreover, the significant increase of blinkduration after the virtual magic cube task indicates thatparticipants got visual fatigue after this task. Blink delayresults show that participants got visual fatigue after thereal magic cube task. Thirdly, we also found out that sev-eral other HRV measures have the potential to be used asindicators of operator fatigue, namely, STD‐HR, DET%,and ShanEn. However, further experiments need to beconducted to confirm these findings.
Although not all measures show significant differ-ences between the two tasks, the present study still foundsome evidences showing that the virtual magic cube taskinduces more visual and operator fatigue than the realmagic cube task. This difference can be explained by thefollowing factors: (1) The virtual magic cubes presentedin the OST‐HMD are self‐luminous, but the real magiccubes are diffuse objects, and (2) the contradictionbetween accommodation and convergence when usingOST‐HMDs could also induce more virtual fatigue.
Nevertheless, our current research also has some lim-itations: Simpler and more boring tasks should be used infuture studies to eliminate the mental workload effect.Indeed, as mentioned above, mental workload may influ-ence the detection of operator fatigue. Regarding the

GAO ET AL. 15
experiment, it should probably be made longer in order toinduce larger differences between the two tasks. Finally,the brightness of virtual objects should also be taken intoconsideration in future research.
ACKNOWLEDGMENTS
This work is supported by the National Key Research andDevelopment Program of China (No.2016YFB0401202)and the National Natural Science Foundation of China(Grant No.61661146002).
ORCID
Jean‐Marie Normand https://orcid.org/0000-0003-0557-4356Guillaume Moreau https://orcid.org/0000-0003-2215-1865
REFERENCES
1. Gabbard JL, Swan JE, Hix D, Schulman RS, Lucas J, Gupta D.An empirical user‐based study of text drawing styles and out-door background textures for augmented reality, in VirtualReality, 2005. Proceedings. VR 2005. IEEE. IEEE. 2005: 11–18.https://doi.org/10.1109/VR.2005.1492748
2. Gao Y, Liu Y, Cheng D, Wang Y. A review on development ofhead mounted display. J Comput Aided Des Comput Graph.2016;6(1):896–904. https://doi.org/10.3969/j.issn.1003‐9775.2016.06.004
3. Hu X, Hua H. High‐resolution optical see‐through multi‐focal‐plane head‐mounted display using freeform optics. Opt Express.2014;22(11):13 896–13 903. https://doi.org/10.1364/OE.22.013896
4. Livingston MA, Ai Z, Swan JE, Smallman HS. Indoor vs. out-door depth perception for mobile augmented reality, in 2009IEEE Virtual Reality Conference. 2009: 55–62. https://doi.org/10.1109/VR.2009.4810999
5. Swan JEI, Livingston MA, Smallman HS, et al. A perceptualmatching technique for depth judgments in optical, see‐through augmented reality, in IEEE Virtual Reality Conference(VR 2006). 2006:19–26. https://doi.org/10.1109/VR.2006.13,ISSN=1087–8270.
6. Swan JE, Jones A, Kolstad E, Livingston MA, Smallman HS.Egocentric depth judgments in optical, see‐through augmentedreality. IEEE Trans Vis Comput Graph. May 2007;13(3):429–442. https://doi.org/10.1109/TVCG.2007.1035
7. Singh G, Ii JES, Jones JA. Depth judgments by reaching andmatching in near‐field augmented reality, in 2012 IEEE VirtualReality Workshops (VRW). 2012:165–166. https://doi.org/10.1109/VR.2012.6180933
8. Swan JE, Singh G, Ellis S. Matching and reaching depth judg-ments with real and augmented reality targets. IEEE Trans VisComput Graph. November 2015;21(11):1289–1298. https://doi.org/10.1109/TVCG.2015.2459895
9. Koheiushima, Moser KR, Rompapas DC, et al. SharpView:improved clarity of defocused content on optical see‐through
head‐mounted displays, in 2016 IEEE Symposium on 3D UserInterfaces (3DUI). 2016:173–181. https://doi.org/10.1109/3DUI.2016.7460049
10. Eisemann E. A perceptual model for disparity. ACM Transac-tions on Graphics (Proceedings SIGGRAPH 2011, Vancouver).2011;30(4). https://doi.org/10.1145/1964921.1964991
11. Du SP, Masia B, Hu SM, Gutierrez D. A metric of visual comfortfor stereoscopic motion. ACM Trans Graph. 2013;32(6):222:1–222:9. https://doi.org/10.1145/2508363.2508387
12. Millodot M. Dictionary of optometry and visual science. 7th ed.UK: Butterworth Heinemann—Elsevier; 2009:465. https://doi.org/10.1111/j.1444‐0938.2009.00388.x
13. Scott R. Calhoun LT, USCG. Human factors in ship design:preventing and reducing shipboard operator fatigue. Universityof Michigan. 2006.
14. Lambooji M, Ijsselsteijn W, Fortuin M, Heynderickx I. Visualdiscomfort and visual fatigue of stereoscopic displays: a review.J Imaging Sci Technol. 2009;53(3):30 201–1–30 201–14. https://doi.org/10.2352/J.ImagingSci.Technol.2009.53.3.030201
15. Flicker fusion threshold. https://en.wikipedia.org/wiki/Flicker\fusion\threshold, retrieved: 2018–01–30.
16. Murata K, Araki S, Yokoyama K, Yamashita K, Okumatsu T,Sakou S. Accumulation of VDT work‐related visual fatigueassessed by visual evoked potential, near point distance and crit-ical flicker fusion. Ind Health. 1996;34(2):61–69. https://doi.org/10.2486/indhealth.34.61
17. Emoto M, Niida T, Okano F. Repeated vergence adaptationcauses the decline of visual functions in watching stereoscopictelevision. J Disp Technol. December 2005;1(2):328–340.https://doi.org/10.1109/JDT.2005.858938
18. Heart rate variability. https://en.wikipedia.org/wiki/Heart\ rate\variability, retrieved: 2018‐01‐30.
19. Electrocardiography. https://en.wikipedia.org/wiki/Electrocar-diography, retrieved: 2018‐01‐30.
20. McCraty R, Atkinson M, Tomasino D, Bradley RT. The coherentheart: heart‐brain interactions, psychophysiological coherence,and the emergence of system‐wise order. Int For Rev.2009;5(2):10–115.
21. Hansen AL, Johnsen BH, Thayer JF. Vagal influence on workingmemory and attention. Int J Psychophysiol. 2003;48(3):263–274.https://doi.org/10.1016/S0167‐8760(03)00073‐4
22. Park S, Won MJ, Mun S, Lee EC, Whang M. Does visual fatiguefrom 3D displays affect autonomic regulation and heart rhythm?Int J Psychophysiol. 2014;92(1):42–48. https://doi.org/10.1016/j.ijpsycho.2014.02.003
23. Heinze C, Trutschel U, Schnupp T, et al. Operator fatigue esti-mation using heart rate measures. In: Dössel O, Schlegel WC,editorsWorld Congress on Medical Physics and BiomedicalEngineeringWC: Springer; 2009. pp. 930–933 https://doi.org/10.1007/978‐3‐642‐03882‐2_248.
24. Electrooculography. https://en.wikipedia.org/wiki/Electroocu-lography, retrieved: 2018–01–30.
25. Stern JA, Boyer D, Schroeder D. Blink rate: a possible measureof fatigue. Hum Factors. 1994;36(2):285–297. https://doi.org/10.1177/001872089403600209
16 GAO ET AL.
26. Yu JH, Lee BH, Kim DH. EOG based eye movement measure ofvisual fatigue caused by 2D and 3D displays, in Proceedings of2012 IEEE‐EMBS International Conference on Biomedical andHealth Informatics. 2012:305–308. https://doi.org/10.1109/BHI.2012.6211573
27. Inoue T, Kato YO, Ozawa J. Evaluating visual fatigue by sensingeye movement during viewing of 3D images, in The 1st IEEEGlobal Conference on Consumer Electronics 2012. 2012:486–490.https://doi.org/10.1109/GCCE.2012.6379666
28. Kaneko K, Sakamoto K. Spontaneous blinks as a criterion ofvisual fatigue during prolonged work on visual display termi-nals. Percept Mot Skills. 2001;92(1):234–250. https://doi.org/10.2466/pms.2001.92.1.234
29. Tümler J, Mecke R, Schenk M, et al. Mobile augmented realityin industrial applications: approaches for solution of user‐related issues, in 2008 7th IEEE/ACM International Symposiumon Mixed and Augmented Reality. 2008:87–90. https://doi.org/10.1109/ISMAR.2008.4637330
30. Grubert J, Hamacher D, Mecke R, et al. Extended investigationsof user‐related issues in mobile industrial AR. IEEE Interna-tional Symposium on Mixed and Augmented Reality IEEE,2010:229–230. https://doi.org/10.1109/ismar.2010.5643581
31. Birch J, Mckeever LM. Survey of the accuracy of newpseudoisochromatic plates. Ophthalmic Physiol Opt. 1993;13(1):35–40. https://doi.org/10.1111/j.1475‐1313.1993.tb00423.x
32. Cheng D, Hua H, Wang Y. Optical see‐through free‐form head‐mounted display. 2016: US Patent 9,239,453.
33. M. Kumashiro, “Practical measurement of psychophysiologicalfunctions for determining workloads,” in Evaluation of humanwork, 3rd ed., J. R. Wilson, N. Corlett, Ed. Taylor & Francis:Boca Raton, 2005, pp. 605–627.
34. Sheedy JE, Hayes JN, Jon E. Is all asthenopia the same? OptomVis Sci. November 2003;80(11):732–739. https://doi.org/10.1097/00006324‐200311000‐00008
35. TarvainenMP. KubiosHRVusers guide. http://www.kubios.com/downloads/Kubios HRV Users Guide.pdf, retrieved: 2018‐01‐30.
36. Yoshiharu Y, Lamanca JJ, Natelson BH. A measure of heart ratevariability is sensitive to orthostatic challenge in women withchronic fatigue syndrome. Exp Biol Med. 2003;228(2):167–174.https://doi.org/10.1177/153537020322800206
37. Pichot V, Bourin E, Roche F, et al. Quantification of cumulatedphysical fatigue at the workplace. Pflugers Arch. 2002;445(2).https://doi.org/10.1007/s00424‐002‐0917‐7
38. Schleicher R. Eogui—a software to analyze electro‐oculogram(EOG) recordings. https://www.mathworks.com/matlabcentral/fileexchange/32493, retrieved: 2018‐01‐30.
39. Caffier PP, Erdmann U, Ullsperger P. Experimental evaluation ofeye‐blink parameters as a drowsiness measure. Eur J Appl Physiol.May 2003;89(3):319–325. https://doi.org/10.1007/s00421‐003‐0807‐5
40. Hsieh CS, Tai CC. An improved and portable eye‐blink durationdetection system to warn of driver fatigue. Instrum SciTechnol. 2013;41(5):429–444. https://doi.org/10.1080/10739149.2013.796560
41. Schleicher R, Galley N, Briest S, Galley L. Blinks and saccadesas indicators of fatigue in sleepiness warnings: looking tired?
Ergonomics. 2008;51(7):982–1010. https://doi.org/10.1080/00140130701817062
42. Tucker AJ, Johns MW. The duration of eyelid movements dur-ing blinks: changes with drowsiness. Sleep. 2005;28:A122.
43. Kim D, Choi S, Park S, Sohn K. Stereoscopic visual fatigue mea-surement based on fusional response curve and eye‐blinks, in2011 17th International Conference on Digital Signal Processing(DSP). 2011:1–6. https://doi.org/10.1109/ICDSP.2011.6004999
44. Li J, Barkowsky M, Callet PL. Visual discomfort of stereoscopic3D videos: influence of 3D motion. Displays. 2014;35(1):49–57.https://doi.org/10.1016/j.displa.2014.01.002
45. Lo JC, Prorail ES, Meijer SA. Measuring mental workload withlow‐cost and wearable sensors: insights into the accuracy, obtru-siveness, and research usability of three instruments. J CognEng Decision Mak. 2017;11(4):323–336. https://doi.org/10.1177/1555343417716040
46. Guo W, Tian X, Tan J, Wang L. Change in heart rate variabilityindexes due to high driving workload in turning left at the inter-section in real road environment, in Proceedings of the 2016 3rdInternational Conference on Materials Engineering, Manufactur-ing Technology and Control (2016). 2016:804–807. https://doi.org/10.2991/icmemtc‐16.2016.158
47. Guo W, Tian X, Tan J, Li Z, Li L. Driver's mental workload esti-mation based on empirical physiological indicators, in ChineseAssociation of Automation (YAC), Youth Academic Annual Con-ference of. IEEE, 2016, no. 61503007. 2016. https://doi.org/10.1109/YAC.2016.7804916
48. Machado HG, Simões RP, Mendes RG, et al. Cardiac autonomicmodulation during progressive upper limb exercise by patients withcoronary artery disease. Braz JMed Biol Res. 2011;44(12):1276–1284.https://doi.org/10.1590/S0100‐879X2011007500134
49. Schaal K, Le Meur Y, Bieuzen F, et al. Effect of recovery modeon postexercise vagal reactivation in elite synchronized swim-mers. Appl Physiol Nutr Metab. 2013;38(2):126–133. https://doi.org/10.1139/apnm‐2012‐0155
50. Cinaz B, Marca RL, Tröster G. Monitoring of mental workloadlevels during an everyday life office‐work scenario. Pers UbiquitComput. 2011;17(2):229–239. https://doi.org/10.1007/s00779‐011‐0466‐1
51. Wei Z, Zhuang D, Wanyan X, Zhang H, Chen L. A theoreticalmodel of mental workload in pilots based on multiple experimen-tal measurements, in International Conference on EngineeringPsychology and Cognitive Ergonomics, Springer, Cham.2008:104–113. https://doi.org/10.1007/978‐3‐319‐07515‐011
52. Krüger A, Cilliers PJ. A systems approach to the assessment ofmental workload in a safety‐critical environment. Doctoral Dis-sertation, University of Pretoria. 2008. https://ieeexplore.ieee.org/abstract/document/7804916/metrics.
53. Lin YH, Chen CY, Lu SY, Lin YC. Visual fatigue during VDTwork: effects of time‐based and environment‐based conditions.Displays. 2008;29(5):487–492. https://doi.org/10.1016/j.displa.2008.04.003
54. Kim YJ, Lee EC. EEG based comparative measurement of visualfatigue caused by 2D and 3D displays. Commun Comput InformSci. 2011;174:289–292. https://doi.org/10.1007/978‐3‐642‐22095‐1_59

GAO ET AL. 17
AUTHOR BIOGRAPHIES
Yuan Gao is a PhD student ofOptical Engineering at theSchool of Optoelectronics, Bei-jing Institute of Technologyfrom the year of 2014. FromNovember 2016 to May 2018,she studied as a joint doctoralstudent in the Computer Sci-ence and Mathematics Depart-
ment, École Centrale de Nantes, France. Hercurrent research interests include the humanvisual fatigue in virtual reality and augmentedreality, human's depth perception in head‐mounteddisplays, and the plausibility of virtual reality andaugmented reality.
Yue Liu received his PhDdegree in Telecommunicationand Information System fromJilin University, Jilin Province,China, in 2000. He is currentlya Professor of optical engineer-ing at the School of Optoelec-tronics, Beijing Institute ofTechnology, Beijing. His
research interests include human computer inter-action, virtual and augmented reality, accuratetracking of the pose of camera, 3D display system,and camera calibration. He has published morethan 100 technical papers. Dr Liu is a memberof council of China Society of Image andGraphics, a member of China Society of Optics,and he also serves on the editorial board of theOptical Technique.
Jean‐Marie Normand receivedhis PhD degree in Computer Sci-ence, University of Nantes,France, in 2008. He is currentlyassociate professor in the Com-puter Science and MathematicsDepartment, Ècole Centrale deNantes, France. His researchinterests include embodiment and
interaction in immersive Virtual Reality as well asplausibility of virtual, augmented, and realenvironments.
Guillaume Moreau received hisPhD degree in Computer Science,University of Rennes I, France, in1998. He is currently a Professorin the Computer Science andMathematics, Ecole Centrale deNantes, France, where he alsoserves as the Dean of Studies. Hisresearch interests deal with per-
ception in virtual and augmented worlds. He has beenstudying visual fatigue in AR/VR as well as plausibil-ity and fidelity of virtual and real environments.
Xue Gao received her bachelor'sdegree in Optical Information Sci-ence and Technology from BeijingJiaotong University, Beijing, China,in 2015. She is currently a studentof Optical Engineering for her mas-ter's degree at the School of Opto-electronics, Beijing Institute ofTechnology, Beijing. Her research
interests in projection based augmented reality andmuseum exhibition design based on virtual reality.
Yongtian Wang received the BScdegree in Precision Instrumenta-tion from Tianjin University,China, in 1982, and the PhDdegree in Optics from the Univer-sity of Reading, UK, in 1986. Heis currently a Yangtze RiverScholar of the Chinese Ministryof Education and a Professor and
the Director of the Center for Research on Optoelec-tronics and Information Technology in Beijing Insti-tute of Technology. Dr Wang is a Fellow of theOptical Society of America and the International Soci-ety for Optical Engineers. His research interestsinclude optical design and CAD, optical instrumenta-tion, image processing, and virtual reality (VR) andaugmented reality (AR) technologies and applications.
How to cite this article: Gao Y, Liu Y, NormandJ‐M, Moreau G, Gao X, Wang Y. A study ondifferences in human perception between a realand an AR scene viewed in an OST‐HMD. J Soc InfDisplay. 2019;1–17. https://doi.org/10.1002/jsid.752