Embed Size (px)
Citation preview

www.pbr.co.in
A Study on the Factors Influencing the Rate of Attrition in IT Sector:
Based on Indian Scenario
Pacific Business Review InternationalVolume 9 Issue 7, Jan. 2017
01
Abstract
As per Darwin's Law of Survival in this highly cutthroat service industry, most organizations realize that a 'highly contented' employee does not inevitably mean a dedicated employee and a high performer.The study mainly revolves around the present cases of IT industry which face the maximum employee churn-out every year. Though IT industry is a key player in generating employment, offering lucrative salary package thereby strengthening the national economy as a whole, yet it fails to retain employees for longer service period. The study tries to explore and establish a relation between various factors which might be responsible for retention risks.Also the study tries to bring under notice the change in strategies adopted and evolving with the concept of employee engagement to lower the risk of retention.
Keywords: - Employee, Attrition, Retention, IT Industry
Introduction
BVR Mohan Reddy, vice-chairman of NAASCOM explained thatIT companies seem to be dropping bench strengths, which might go losing around 1-2 per cent of last fiscal year. Employees with high experience could be hired on requirement and positioned to projects with least training. The only way of hiring would be from each other and consequently it will increase in attrition.
The latest reports of NAASCOM on Attrition rates exhibited that IT majors like TCS, Infosys and Cognizant were 12.8 per cent, 20.1 per cent and 15.6 per cent respectively for the quarter ended September 30, 2014. The companies had a total workforce of 3.13 lakh, 1.65 lakh and nearly 2 lakh respectively, at the end of the quarter (Shyamala,2015).
Continuous increase in attrition rates yields the idea of lower chances in revenue generation. But NASSCOM ChairmanCP Gumani rubs off the idea by saying fall in recruitment would not blow off the revenue growth which is hooked at 10-11 per cent in this fiscal year. IT industry would witness 20 per cent less recruitments in 2016, as key players like TCS and Infosys arefocused more on automation, leading to hiring less number of people (The Economic Times, 2016).
Considering the economic track record for the past 10 years, the industry has grown over 30 percent (Wadhwa and Koul, 2012) providing an employment of 2.5 million people directly or indirectly (Confederation of Indian Industry, 2011).
Archita BanerjeeAssistant Professor
Institute of Management Study
Rahul Kumar GhoshResearchScholar
Seacom Skills University
Meghdoot GhoshAssistant Professor
Institute of Management Study

www.pbr.co.inwww.pbr.co.in
Pacific Business Review International
02
According to Table – 1 it can be stated that out of 6 above compensation schemes(CXOtoday,2014).mentioned companies 5 companies had an increased in the
Ajoy Mukherjee, Head of Global Human Resources, TCS attrition rate. The problem of attrition has been constantly
said, “The kind of initiatives that we have taken and the increasing in the leading IT companies of India (Simhan,
overall business environment are definitely helping us in 2014)
keeping retention levels at this stage”.Scenario in IBM
SD Shibulal, CEO of Infosys said that “Attrition meant more Lee Conrad in 2015 of Alliance updated in IBM Talking Opportunities”.cloud that 250 employees in Boulder Colorado had lost their
ManojBhat,deputy Chief Financial Officer of Tech jobs, 150 employees received pink slips and 202 employees
Mahindra agreed that due to attrition wages keep increasing in Dubuque, IOWA were asked to leave their jobs (Arlotta,
but their business model and recruiting model is proficient 2015).
enough to manage the attrition problems(Simhan,2014).Infosys Suffering but Recuperated
BackgroundThe second largest software company in India,Infosys, had
The information technology industry faced the problem of been striving hard with attrition problem, for the past 2-3
employee shortage since the employees could have years. It was recorded in quarter 4 attrition rates as 18.7%
extensive employment opportunities not only at the local which was a cause for concern.Lately it was observed
level but more importantly at the global level. The attrition rates falling by 15% during quarter March which
expanding employment opportunities with better and better was a result of several employee morale boosting measures
terms of employment made the employees to seek taken by its Top Management (Alawadhi, 2015).
employment with another employer who was willing to hire TCS putting up a better picture them with better terms and conditions.
Compared to Infosys, Wipro and other IT houses, TCS Concept of Attrition – Definition:reports a low attrition rate and has shown a growth in
Attrition concept for any organization is a natural workforce by two and half times from 3.2 lacs since
phenomenon of leaving the organization, detaching him December 2008. A US based research firm, named
with current roles and responsibilities. An employee who Technology Business Research (TBR) states, barring
has completed his entire service tenure departs from the TCS,other leading software companies clouted 14% rise in
organization with a satisfaction. But there could be the attrition rates, in December 2013which is the end of
employees who moved away because their job instinct was fourth quarter. Companies like Tech Mahindra and HCL also
left dissatisfied. For such employees the companies rely on witnessed a distinctive rise in attrition in Q4 2013; it was
exit interviews. But as per the studies it would be more only TCS whose rate dipped from 11.2 to 10.9% in the same
relevant to interview the employees during their stay, so as to year (CXOtoday, 2014).
reduce attrition (Manjunatha V,Nanjegowda H,2016).An Opportunity Increase
Some define attrition as the shrinkage of number. In simple Though attrition seem to be a major problem hovering in IT words it could be defined as numbers reducing due to companies on a continuous basis, but some companies see a resignations, retirement or death (Ranjitham,2013).The silver lining.It indicates market is growing and offering a method used by Ranjithamto calculate attrition is:-greater job opportunity with better profiles and
Attrition Rate Table – 1
Vendor
4Q12 (in %) 4Q13 (in %)
Cognizant
10.7 14.5
HCL Technologies
13.1* 15.3*
Infosys
15.1 18.1
TCS 11.2 10.9
Tech Mahindra 16.0 17.0
Wipro ITS 12.9 16.3
*Estimated to include both IT services
Table Source: Attrition on the rise in IT firms (Simhan, 2014)

03www.pbr.co.in
Volume 9 Issue 7, Jan. 2017
Real Causes of Attrition strategies on how to increase employee commitment. Firms must focus on employee with a mission to give importance
1. Employees with low morale and absenteeism put in on theircriticalskills, and providing high competencies
high risk of Attrition. Mainly, if the employees start mostly to employees holding crucial positionsHay
losing interest in their jobs, they will leave. Group,(2013).Osteraker (1999) says the success story of
2. Employees also leave their companies when their skills any organization is because of employee satisfaction and are in high demand, and other companies entice them their aim of retention. He divided the factors of retention into for higher pay and better benefits. Hence, being three broad dimensions, i.e., social, mental and physical. unhappy at work cannot be the sole reason. The mental dimension comprises work characteristics,
employees always prefer flexible work tasks where they can 3. Other common reasons could be due to lack of
use their knowledge and see the results of their efforts progression in career, inadequacy of training and lack of
which, in turn, helps in retaining the valuable resources. The employee's engagement (MalathiG, Mathi Malar K)
social dimension consists of the contacts that the employees Literature Review have with other people, both internal and external. The
physical dimension consists of working conditions and pay. Employee attrition in India is predicted to rise from 26% in
To reduce the level of attrition, companies have changed 2010 to 26.9% in 2013.This shows employee turnover or
their approach. It has brought some strategically changes in attrition rate in India the world's highest. Indian
its concept:organizations give serious thought and try to find out
According to a latest study, since 1990s employees working that the fundamental ground why people leave their jobs with an employer might shift to another employer the next because they are discontented with their jobs. In the course day and again might move to a third employer the day after of research it is discovered that the decision to refrain from tomorrow. Employers were competing against each other to jobs can be made in different ways and in response to find employees. Consequently, the attrition took a rocketing different stimulus.speed.Angelo S.Denisi and Ricky W.Griffin (2009) said
www.pbr.co.in04
Pacific Business Review International
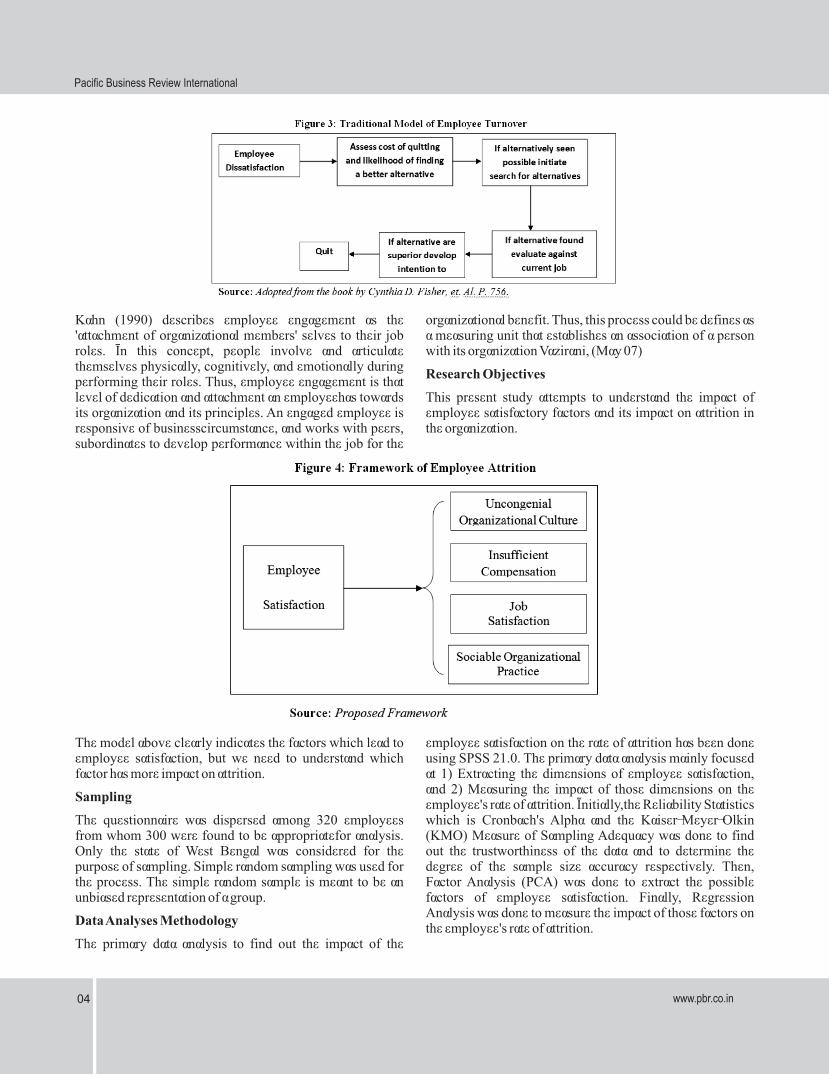
Kahn (1990) describes employee engagement as the organizational benefit. Thus, this process could be defines as 'attachment of organizational members' selves to their job a measuring unit that establishes an association of a person roles. In this concept, people involve and articulate with its organization Vazirani, (May 07)themselves physically, cognitively, and emotionally during
Research Objectivesperforming their roles. Thus, employee engagement is that
This present study attempts to understand the impact of level of dedication and attachment an employeehas towards employee satisfactory factors and its impact on attrition in its organization and its principles. An engaged employee is the organization. responsive of businesscircumstance, and works with peers,
subordinates to develop performance within the job for the
The model above clearly indicates the factors which lead to employee satisfaction on the rate of attrition has been done employee satisfaction, but we need to understand which using SPSS 21.0. The primary data analysis mainly focused factor has more impact on attrition. at 1) Extracting the dimensions of employee satisfaction,
and 2) Measuring the impact of those dimensions on the Sampling
employee's rate of attrition. Initially,the Reliability Statistics The questionnaire was dispersed among 320 employees which is Cronbach's Alpha and the Kaiser-Meyer-Olkin from whom 300 were found to be appropriatefor analysis. (KMO) Measure of Sampling Adequacy was done to find Only the state of West Bengal was considered for the out the trustworthiness of the data and to determine the purpose of sampling. Simple random sampling was used for degree of the sample size accuracy respectively. Then, the process. The simple random sample is meant to be an Factor Analysis (PCA) was done to extract the possible unbiased representation of a group. factors of employee satisfaction. Finally, Regression
Analysis was done to measure the impact of those factors on Data Analyses Methodology
the employee's rate of attrition.The primary data analysis to find out the impact of the
05www.pbr.co.in
Volume 9 Issue 7, Jan. 2017
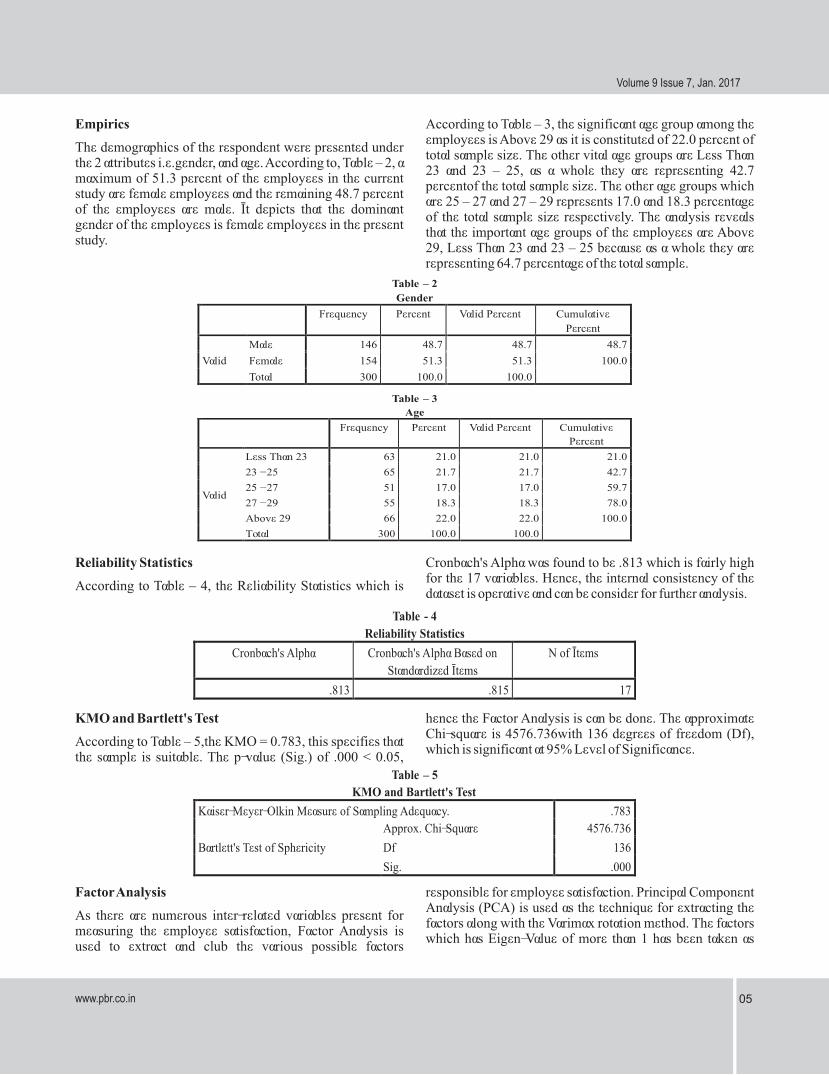
Empirics According to Table – 3, the significant age group among the employees is Above 29 as it is constituted of 22.0 percent of
The demographics of the respondent were presented under total sample size. The other vital age groups are Less Than
the 2 attributes i.e.gender, and age. According to, Table – 2, a 23 and 23 – 25, as a whole they are representing 42.7
maximum of 51.3 percent of the employees in the current percentof the total sample size. The other age groups which
study are female employees and the remaining 48.7 percent are 25 – 27 and 27 – 29 represents 17.0 and 18.3 percentage
of the employees are male. It depicts that the dominant of the total sample size respectively. The analysis reveals
gender of the employees is female employees in the present that the important age groups of the employees are Above
study.29, Less Than 23 and 23 – 25 because as a whole they are representing 64.7 percentage of the total sample.
Table – 2
Gender
Frequency
Percent Valid Percent Cumulative
Percent
Valid
Male 146 48.7 48.7 48.7
Female 154 51.3 51.3 100.0
Total 300 100.0 100.0
Table – 3
Age
Frequency Percent Valid Percent Cumulative
Percent
Valid
Less Than 23 63 21.0 21.0 21.0
23 - 25 65 21.7 21.7 42.7
25 - 27 51 17.0 17.0 59.7
27 - 29 55 18.3 18.3 78.0
Above 29 66 22.0 22.0 100.0
Total 300 100.0 100.0
Reliability Statistics Cronbach's Alpha was found to be .813 which is fairly high for the 17 variables. Hence, the internal consistency of the
According to Table – 4, the Reliability Statistics which is dataset is operative and can be consider for further analysis.
Table - 4 Reliability Statistics
Cronbach's Alpha
Cronbach's Alpha Based on
Standardized Items
N of Items
.813 .815 17
KMO and Bartlett's Test hence the Factor Analysis is can be done. The approximate Chi-square is 4576.736with 136 degrees of freedom (Df),
According to Table – 5,the KMO = 0.783, this specifies that which is significant at 95% Level of Significance.
the sample is suitable. The p-value (Sig.) of .000 < 0.05,
Table – 5 KMO and Bartlett's Test
Kaiser-Meyer-Olkin Measure of Sampling Adequacy.
.783
Bartlett's Test of Sphericity
Approx. Chi-Square
4576.736
Df 136
Sig. .000
Factor Analysis responsible for employee satisfaction. Principal Component Analysis (PCA) is used as the technique for extracting the
As there are numerous inter-related variables present for factors along with the Varimax rotation method. The factors
measuring the employee satisfaction, Factor Analysis is which has Eigen-Value of more than 1 has been taken as
used to extract and club the various possible factors

www.pbr.co.in06
Pacific Business Review International
significant, because Eigen-Value greater than 1 indicates Communalitiesthat principal components account for more variance than
According to Table – 6, the communalities of all the accounted by one of the original variables in standardized
variables was higher than 0.64 which depicts that more than data. This is commonly used cutoff point for which principal
64% of the variations in all the variables were explained by components are to be retained (G. F. (n.d.). Principal
the factors.Component Analysis).
Table – 6Communalities
Initial Extraction
Dissatisfied salary
1.000 .864
Dissatisfied perquisites / allowance
1.000 .854
Low incentives
1.000 .769
Lack of medical benefits
1.000 .789
Uniformity in rules
1.000 .884
Relationship with superior
1.000 .702
Relationship with subordinates
1.000 .638
Job knowledge 1.000 .762
Skills utilization 1.000 .789
Skills recognition 1.000 .778
Unbiased superiors 1.000 .643
Acknowledgement of work by superior 1.000 .776
Dearth of rewards 1.000 .947
Lack of appreciation 1.000 .893
Unsatisfied work culture 1.000 .828
Unsatisfactory HR policy 1.000 .814
Biased evaluation 1.000 .704
Extraction Method: Principal Component Analysis.
Total Variance Explained Factor which was consider to summarize 4 variables was able to explain 17.56% of variance and the remaining 4
From Table – 7, it can be described that the 1st Factor which variables was able to explain 17.51% of variance forming
was consider to summarize 5 variables was able to explain the 4th Factor. All together these4 Factors were able to
24.55% of variance, the 2nd Factor which was consider to explain 79.03% of the variance in total.
summarize 4 variables was able to explain 19.42%, the3rd

07www.pbr.co.in
Volume 9 Issue 7, Jan. 2017
Table – 7Total Variance Explained
Component
Initial Eigenvalues Extraction Sums of Squared Loadings
Rotation Sums of Squared Loadings
Total
% of Varian
ce
Cumulative %
Tota
l
% of Varian
ce
Cumulative %
Total
% of Varian
ce
Cumulative %
1 4.59
3 27.017
27.017
4.59
3 27.017 27.017 4.17
324.548 24.548
2
3.355
19.733
46.750
3.355
19.733 46.750 3.301
19.418 43.966
3
2.78
9
16.406
63.156
2.789
16.406 63.156 2.985
17.556 61.522
4
2.69
8
15.873
79.029
2.698
15.873 79.029 2.97
617.507 79.029
5 .810 4.765 83.7946 .516 3.034 86.8287 .416 2.450 89.2788 .332 1.951 91.2289 .288 1.697 92.92510 .279 1.641 94.56611 .233 1.371 95.93712 .180 1.058 96.99513 .157 .921 97.91514 .124 .728 98.64315 .117 .691 99.33416 .066 .386 99.72017 .048 .280 100.000
Extraction Method: Principal Component Analysis.
Rotated Component Matrix The 3rd Factor was formed with 4 variables namely Skills utilization (.886), Skills recognition (.879), Unbiased
According to Table – 8, the 1st Factor was formed with the 5 superiors (.793), and Acknowledgement of work by superior
variables namely Dearth of rewards (.970), Lack of (.873) all together it accounted for17.56% of variance.
appreciation (.943), Unsatisfied work culture (.907), Unsatisfactory HR policy (.889) and Biased evaluation The 4th Factor was formed with 4 variables namely (.830) all together it accounted for24.55% of variance. Uniformity in rules (.936), Relationship with superior
(.827), Relationship with subordinates (.795), and Job The 2nd Factor was formed with 4 variables namely
knowledge (.871) all together it accounted for 17.51%. Dissatisfied salary (.925), Dissatisfied perquisites /
Altogether the 4 Factors collectively were able to explain allowance (.924), Low incentives (.876) and Lack of
79.03% of the variance.medical benefits (.884) all together it accounted for19.42% of variance.

www.pbr.co.in08
Pacific Business Review International
Table – 8 Rotated Component Matrixa
Component
1
2
3 4
Dissatisfied salary
.027
.925
.084 .017Dissatisfied perquisites / allowance
.017
.924
.024 .017Low incentives
.006
.876
.035 -.007Lack of medical benefits
.063
.884
.060 .006Uniformity in rules
.065
.041
.048 .936Relationship with superior
.125
-.024
.047 .827Relationship with subordinates
.066
-.038
-.021 .795Job knowledge
.019
.059
.022 .871Skills utilization
.034
-.024
.886 .043Skills recognition
.061
.011
.879 .033Unbiased superiors
.079
.089
.793 .003Acknowledgement of work by superior
.026
.119
.873 .013Dearth of rewards
.970
.034
.031 .059Lack of appreciation .943 .009 .027 .062Unsatisfied work culture .907 .044 .022 .054Unsatisfactory HR policy .889 .090 .118 .040Biased evaluation .830 -.041 .045 .109
Extraction Method: Principal Component Analysis. Rotation Method: Varimax with Kaiser Normalization. a
a. Rotation converged in 5 iterations.
Nomenclature of the Factors referred as the dimensions of employee job satisfaction. The following Table – 9,shows the factors nomenclature as well
These 4 factors which were finally extracted have factor as the variables loading point for each factors.
loading of more than 0.793 and these factors have been Table – 9
Factors of employee job satisfaction extracted from factor analysis
Factors
Variables
Factor LoadingName of the
Factors (Latent Variable)
1
Dearth of rewards
.970
UncongenialOrganizational
Culture
Lack of appreciation
.943
Unsatisfied work culture
.907
Unsatisfactory HR policy
.889
Biased evaluation
.830
2
Dissatisfied salary
.925
Insufficient Compensation
Dissatisfied perquisites / allowance
.924
Low incentives
.876
Lack of medical benefits
.884
3
Skills utilization
.886
Job SatisfactionSkills recognition
.879
Unbiased superiors .793Acknowledgement of work by
superior.873
4
Uniformity in rules .936
Sociable Organizational
Practice
Relationship with superior .827
Relationship with
subordinates .795
Job knowledge .871
09www.pbr.co.in
Volume 9 Issue 7, Jan. 2017
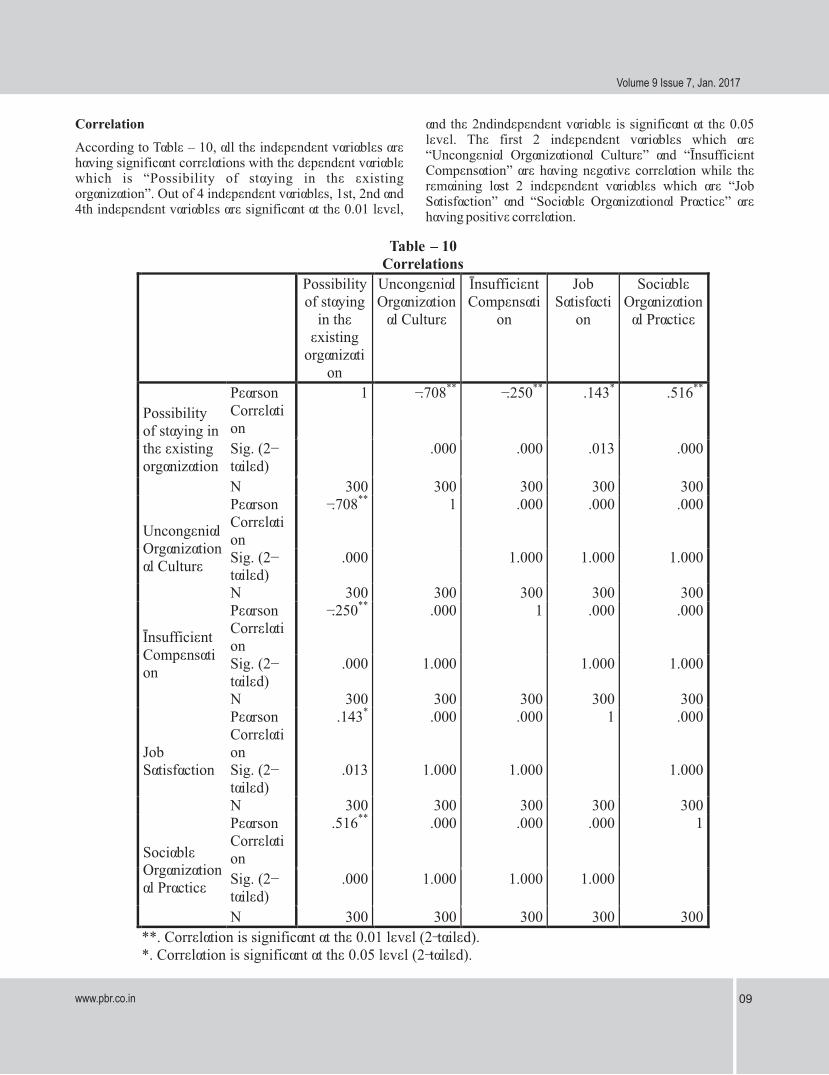
Correlation and the 2ndindependent variable is significant at the 0.05 level. The first 2 independent variables which are
According to Table – 10, all the independent variables are “Uncongenial Organizational Culture” and “Insufficient
having significant correlations with the dependent variable Compensation” are having negative correlation while the
which is “Possibility of staying in the existing remaining last 2 independent variables which are “Job
organization”. Out of 4 independent variables, 1st, 2nd and Satisfaction” and “Sociable Organizational Practice” are
4th independent variables are significant at the 0.01 level, having positive correlation.
Table – 10Correlations
Possibility of staying
in the existing
organization
Uncongenial Organization
al Culture
Insufficient Compensati
on
Job Satisfacti
on
Sociable Organization
al Practice
Possibility of staying in the existing organization
Pearson Correlation
1
-.708** -.250** .143* .516**
Sig. (2-tailed)
.000 .000 .013 .000
N
300
300 300 300 300
Uncongenial Organizational Culture
Pearson Correlation
-.708**
1 .000 .000 .000
Sig. (2-tailed)
.000 1.000 1.000 1.000
N 300 300 300 300 300
Insufficient Compensation
Pearson Correlation
-.250** .000 1 .000 .000
Sig. (2-tailed)
.000 1.000 1.000 1.000
N 300 300 300 300 300
Job Satisfaction
Pearson Correlation
.143* .000 .000 1 .000
Sig. (2-tailed)
.013 1.000 1.000 1.000
N 300 300 300 300 300
Sociable Organizational Practice
Pearson Correlation
.516** .000 .000 .000 1
Sig. (2-tailed)
.000 1.000 1.000 1.000
N 300 300 300 300 300
**. Correlation is significant at the 0.01 level (2-tailed).*. Correlation is significant at the 0.05 level (2-tailed).

www.pbr.co.in10
Pacific Business Review International
The 2 dimensions of employee satisfaction are variable as possibility of staying in the existing organization “Uncongenial Organizational Culture” and “Insufficient and the independent variables as the dimensions which got Compensation” is having negative correlation of -0.708 and extracted from the factor analysis i.e. Uncongenial -0.250 respectively with the employees' “Possibility of Organizational Culture, Insufficient Compensation, Job staying in the existing organization”. The more the Satisfaction, and Sociable Organizational Practice. employees identify the incompatible nature of
According to Table – 11, it shows the regression model fit organizational culture and inadequate disbursement of
summary, the R value which is .922, signifies that 92.2% of compensation, the more is the chance of quitting the
correlation is present between the dependent and organization.
independent variables. Next, the R2 value which is .849, it On the other hand, remaining 2 dimensions of employee depicts that the linear regression explains 84.9% of the satisfaction are “Job Satisfaction” and “Sociable variance in the dataset when all the independent variables in Organizational Practice” is having positive correlation of the model affects the dependent variable, and the Adjusted 0.143 and 0.516with the employees' “Possibility of staying R2 value which is .847 shows that 84.7% of variation is in the existing organization”. The higher the employee explained by only those independent variables that in notices job gratification level and friendly organizational actuality affect the dependent variable. Then, the Durbin-practices, the more is the chance of retaining in the Watson d = 2.103, which is between the critical value of 1.5 organization. < d < 2.5 and hence we can assume that there is no first order
linear auto-correlation in the dataset.Regression Model
The regression analysis was directed with the dependent
Table – 11
Model Summaryb
Model
R
R Square
Adjusted R
Square
Std. Error of the
Estimate
Durbin-Watson
1 .922a .849 .847 .477 2.103
a. Predictors: (Constant), Sociable Organizational Practice , Job Satisfaction, Insufficient
Compensation , Uncongenial Organizational Culture
b. Dependent Variable: Possibility of staying in the existing organization
According to Table – 12, the F-test with a high value of which is less than 0.05, indicates that, in general the 415.883 and degree of freedom (df) with value of 299, states regression model is statistically significant and predicts the that there is no linear relationship between the any two outcome variable.variables in the model. The p-value (Sig.) of .000 < 0.05,
Table – 12
ANOVA a
Model
Sum of Squares
df Mean Square F Sig.
1
Regression
378.649
4 94.662 415.883 .000b
Residual 67.147 295 .228
Total 445.797 299
a. Dependent Variable: Possibility of staying in the existing organization
b. Predictors: (Constant), Sociable Organizational Practice , Job Satisfaction, Insufficient
Compensation , Uncongenial Organizational Culture
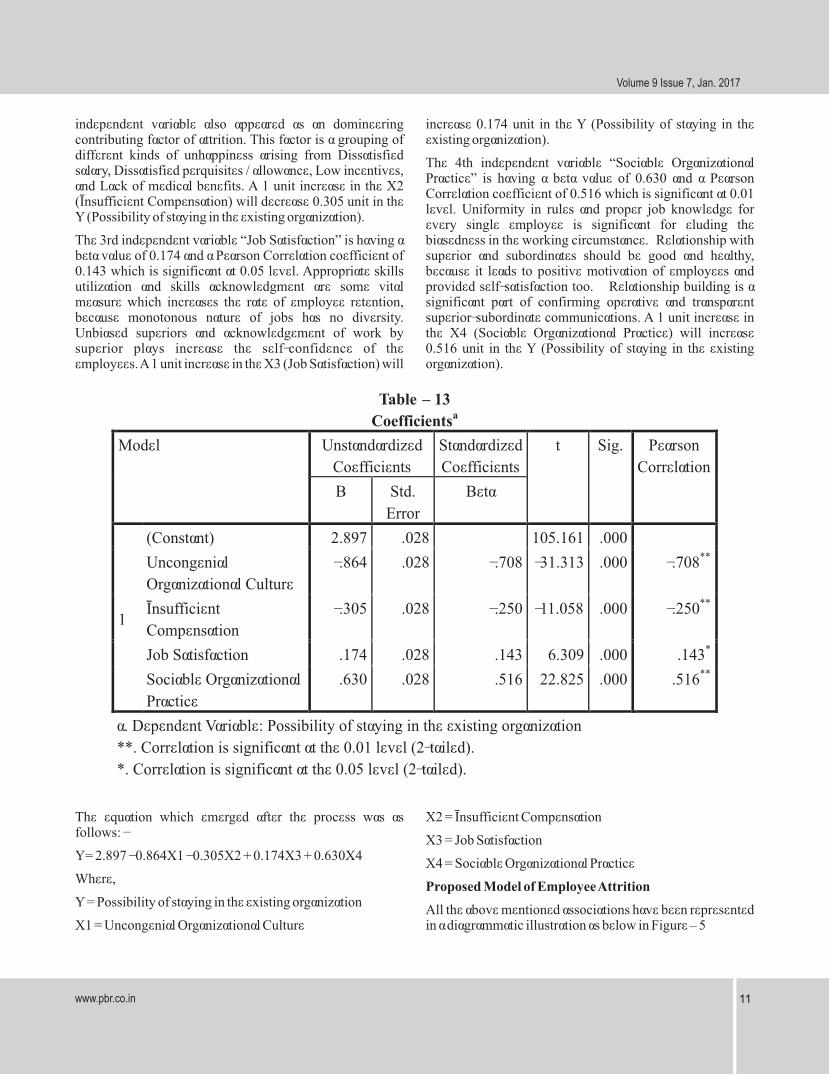
According to Table – 13, the 1st independent variable in the existing organization, as because the incompatible “Uncongenial Organizational Culture” is having a beta organizational principles demotivates the employees. A 1 value of -0.864 and a Pearson Correlation coefficient of - unit increase in the X1 (Uncongenial Organizational 0.708 which is significant at 0.01 level, this particular factor Culture) will decrease 0.864 unit in the Y (Possibility of contributes significantly and quite largely to the employee staying in the existing organization).rate of attrition. It can be stated that Dearth of rewards, Lack
The 2nd independent variable “Insufficient Compensation” of appreciation, Unsatisfied work culture, Unsatisfactory
is having a beta value of -0.305 and a Pearson Correlation HR policy, and Biased evaluation are the variables which are
coefficient of -0.250 which is significant at 0.01 level, this putting negative impact on the rate of Possibility of staying
11www.pbr.co.in
Volume 9 Issue 7, Jan. 2017
independent variable also appeared as an domineering increase 0.174 unit in the Y (Possibility of staying in the contributing factor of attrition. This factor is a grouping of existing organization).different kinds of unhappiness arising from Dissatisfied
The 4th independent variable “Sociable Organizational salary, Dissatisfied perquisites / allowance, Low incentives,
Practice” is having a beta value of 0.630 and a Pearson and Lack of medical benefits. A 1 unit increase in the X2
Correlation coefficient of 0.516 which is significant at 0.01 (Insufficient Compensation) will decrease 0.305 unit in the
level. Uniformity in rules and proper job knowledge for Y (Possibility of staying in the existing organization).
every single employee is significant for eluding the The 3rd independent variable “Job Satisfaction” is having a biasedness in the working circumstance. Relationship with beta value of 0.174 and a Pearson Correlation coefficient of superior and subordinates should be good and healthy, 0.143 which is significant at 0.05 level. Appropriate skills because it leads to positive motivation of employees and utilization and skills acknowledgment are some vital provided self-satisfaction too. Relationship building is a measure which increases the rate of employee retention, significant part of confirming operative and transparent because monotonous nature of jobs has no diversity. superior-subordinate communications. A 1 unit increase in Unbiased superiors and acknowledgement of work by the X4 (Sociable Organizational Practice) will increase superior plays increase the self-confidence of the 0.516 unit in the Y (Possibility of staying in the existing employees. A 1 unit increase in the X3 (Job Satisfaction) will organization).
The equation which emerged after the process was as X2 = Insufficient Compensationfollows: -
X3 = Job SatisfactionY= 2.897 - 0.864X1 - 0.305X2 + 0.174X3 + 0.630X4
X4 = Sociable Organizational PracticeWhere,
Proposed Model of Employee AttritionY = Possibility of staying in the existing organization
All the above mentioned associations have been represented X1 = Uncongenial Organizational Culture in a diagrammatic illustration as below in Figure – 5
Table – 13
Coefficientsa
Model
Unstandardized
Coefficients
Standardized
Coefficients
t Sig. Pearson
Correlation
B
Std.
Error
Beta
1
(Constant)
2.897
.028 105.161 .000
Uncongenial
Organizational Culture
-.864 .028 -.708 -31.313 .000 -.708**
Insufficient
Compensation
-.305 .028 -.250 -11.058 .000 -.250**
Job Satisfaction .174 .028 .143 6.309 .000 .143*
Sociable Organizational
Practice
.630 .028 .516 22.825 .000 .516**
a. Dependent Variable: Possibility of staying in the existing organization
**. Correlation is significant at the 0.01 level (2-tailed).
*. Correlation is significant at the 0.05 level (2-tailed).

www.pbr.co.in12
Pacific Business Review International
Conclusion correlate with the dependent variable, which means as there will be increase in these two factors, the possibility of stay in
Most important contributing factors for high attrition rate of the current organization will also increase, which will lead to
employees in IT sector in West Bengal are identified in this a decreased attrition rate.
particular objective through primary data and the factors were defined after using factor analysis. The factors defined Referencewere “Uncongenial Organizational Culture”, “Insufficient
Alawadhi, N. (2015, April 24). Infosys arrests attrition at Compensation”, “Job Satisfaction” and “Sociable
13.4%; continues to promote design thinking. Organizational Practice” All the factors were found
Retrieved July 09, 2016, from http://articles. significant at 0.05 level. Taking all these factors as
economict imes. india t imes.com/2015-04-independent variable and the “Possibility of staying in the
24/news/61493903_1_attrition-rate-design-existing organization” as dependent variable, the
thinking-vishal-sikka Regression analysis was done in order to find out the
Arlotta, C. J. (Ed.). (2015). CJ Arlotta. Retrieved July 09, contribution of these factors to the dependent variable 2016, from http://talkincloud.com/author/cj-arlotta (Possibility of staying in the existing organization).
Denisi, A. S., & Griffin, R. W. (2000, April). Human The factors “Uncongenial Organizational Culture” and resource Management. Hay Group. (n.d.). “Insufficient Compensation” were found to negatively Retrieved July 14, 2016, from http://www. correlate with the dependent variable, which means as there haygroup.com/en/ will be increase in these two factors, the possibility of stay in
the current organization will decrease, that will lead to an Indian IT Sees High Attrition As Market Rebounds. (2014,
increased attrition rate. February 27). Retrieved July 09, 2016, from http://www.cxotoday.com/story/indian-it-sees-While on other hand the factors “Job Satisfaction” and high-attrition-as-market-rebounds/ “Sociable Organizational Practice” were found to positively
13www.pbr.co.in
Volume 9 Issue 7, Jan. 2017
IT hiring may drop by 20% this year: Nasscom - The Ranjitham, D. (2013). Attrition and retention at BPO Economic Times. (2016, April 21). Retrieved July companies in Chennai: An analytical study. Journal 14, 2016, from http://economictimes.indiatimes. of Exclusive Management Science,2(7).ISSN 2277 com/jobs/it-hiring-may-drop-by-20-this-year- – 5684 Shyamala, S. (2015, January 5). Attrition nasscom/articleshow/51930291.cms picks up with growth in IT | mydigitalfc.com.
Retrieved July 14, 2016, from http://www. Kahn, W. A. (1990). Psychological conditions of personal
mydigitalfc.com/it/attrition-picks-growth-it-611 engagement and disengagement at work. Academy of Management Journal,33, 692-724. SIMHAN, T. R. (2014, February 26). Attrition on the rise in
IT firms. Retrieved July 09, 2016, from Manjunatha, V., &Nanjegowda, H. (2016, January).
http://www.thehindubusinessline.com/info-EMPLOYEE ATTRITION Management in
tech/attrition-on-the-rise-in-it-firms/article software companies-a conceptual study. Journal of
5730053.ece Applied Research,6(1). ISSN-249-555X
Vazirani, N. (May 07). Employee Engagement. SIES Mathi, K. M., &Malathi, G. (n.d.). Analyzing the causes of
College of Management Studies Working Paper attrition in it industries - opinion of employee and
Series, wps05. employer. Asia Pacific Journal of Research, 1(4). ISSN 2320-5504 Mobley, W. H. (1982). Employee Wadhwa, P., &Koul, S. (2012). Critical factors affecting turnover: causes, consequences, and control. retention. Ninth AIMS International Conference on Reading, MA: Addison-Wesley. Management.
Osteraker, M. C. (1999). Measuring motivation in a learning organization. Journal of Work Place Learning.