Embed Size (px)
Citation preview

PREPARED BY
HNTB Corporation3715 Northside Parkway
400 Northcreek, Suite 600Atlanta, GA 30327
Phone: (404) 946-5708Fax: (404) 841-2820
Contact: Andrew C. Smith, AICP
PREPARED FOR
Georgia Department of TransportationOffice of Planning600 West Peachtree Street NWAtlanta, GA 30308Phone: (404) 631-1796Fax: (404) 631-1804Contact: Michelle Caldwell
January 2010c
Georgia Department of Transportation
A SUMMARY REVIEW OF LOCAL STUDIES

FINAL A Summary Review of Local Studies
January 2010
Atlanta Regional Managed Lane System Plan Georgia Department of Transportation, Office of Planning
Atlanta Regional Managed Lane System Plan Technical Memorandum 2: A Summary Review of Local Studies
Prepared for:
Georgia Department of Transportation
One Georgia Center, Suite 2700
600 West Peachtree Street NW
Atlanta, Georgia 30308
Prepared by:
HNTB Corporation

FINAL A Summary Review of Local Studies
January 2010
-1- Atlanta Regional Managed Lane System Plan Georgia Department of Transportation, Office of Planning
A SUMMARY REVIEW OF LOCAL
STUDIES
Purpose
There have been several studies in the Atlanta area evaluating managed lanes including High Occupancy Vehicle (HOV) lanes, High Occupancy Toll (HOT) lanes, Truck Only Lanes (TOL) and Truck Only Toll lanes (TOT) at a system-wide level or a corridor level. As part of the Atlanta Region Managed Lane System Plan these studies were reviewed in order to understand their assumptions and recommendations with respect to evaluation of managed lanes feasibility, pricing and implementation.
This document summarizes the level of detail and major policy and technical considerations addressed by these studies. The following are addressed in the subsequent sections:
Analysis focus;
Summary of major findings;
Overview of analysis methodology; and
Critical assumptions.
This is not intended to be a technical document. Rather it is a roadmap for policy and decision makers to compare and contrast the robustness of analysis and recommendations of different studies. A more detailed review of each study is contained in an associated Appendix.
Description of Studies
A number of studies were reviewed as part of this analysis and five studies were considered appropriate for more detailed analysis:
Reducing Congestion in Atlanta: A Bold New Approach to Increasing Mobility, Robert W. Poole, Jr., Reason Foundation, The Galvin Mobility Project, November 2006;
High Occupancy Toll Lanes and Truck Only Toll Facilities: Potential for Implementation in the Atlanta Region, State Road and Tollway Authority, 2005;
Value Pricing on the I-75 HOV/ BRT (Bus Rapid Transit) Project, GDOT, October 2006;
SR 400 Value Pricing Study, GDOT (ongoing); and,
I-285 Strategic Implementation Plan, GDOT (ongoing).

FINAL A Summary Review of Local Studies
January 2010
-2- Atlanta Regional Managed Lane System Plan Georgia Department of Transportation, Office of Planning
The following studies were reviewed but not considered as part of this analysis due to limited applicability for evaluating managed lanes, particularly with respect to pricing options:
Statewide Truck Lanes Needs Identification Study, Georgia Department of Transportation (ongoing);
2005-2035 Georgia Statewide Transportation Plan, Georgia Department of Transportation, January 2006; and,
HOV Strategic Implementation Plan for the Atlanta Region, Georgia Department of Transportation, August 2003.
Policy, analysis and technical consideration presented in each study have been assigned to one of the following three classes based on the level of detail:
Sketch Level – This analysis considered few pricing alternatives and offered broad details about the projects. The pricing strategy considered is fairly simple and the analysis was conducted using basic tools.
Preliminary Level - This analysis considered a number of pricing alternatives and offered more details about the projects. The pricing strategy considered is more detailed than the sketch level analysis and considers some general factors such as eligibility. The analysis was conducted using some unrefined modeling tools.
Detailed Level - This analysis considered several pricing alternatives, including various combinations of these, and offered specific details about the project such as entrance and exit locations. The pricing strategy was complex and varied factors such as vehicle eligibility and willingness to pay. The analysis was conducted using sophisticated methodologies and travel demand modeling tools.

FINAL A Summary Review of Local Studies
January 2010
-3- Atlanta Regional Managed Lane System Plan Georgia Department of Transportation, Office of Planning
STUDY 1
Study 1: Reducing Congestion in Atlanta: A Bold New Approach to Increasing Mobility, Robert W. Poole, Jr., Reason Foundation, The Galvin Mobility Project, November 2006
A. Introduction
This study is a system-wide exploratory study of Express Toll Lanes (ETL)1 and Truck Only Toll
(TOT)2 Lanes in metro Atlanta. The study has a 25 year time-frame and cites congestion-relief
and revenue generation as two main reasons for promoting ETLs and TOTs in the region. The results from this project are under discussion but have not been embraced by any agency or discussed through public involvement exercises. Public Private Partnership (PPP) is assumed for implementation and operation under a long term concession agreement.
The goal of the analysis in the study is to eliminate LOS F conditions by 2030.
B. Data Inputs
The Galvin Mobility Project study is based on the following data inputs:
The 20 County Regional ARC Travel Demand Model which is used to generate operational and volume data;
Data from two California managed lanes projects – 91 Express and I-15 Express, obtained from the 2005 Urban Mobility Report from the Texas Transportation Institute is used to generate ETL toll rate per mile;
Value of time for trucks from the SRTA HOT-TOT Study; and,
Per mile cost of construction based on GDOT and ARC estimates.
C. Main Conclusions
Primary study concepts/recommendations related to managed lanes and truck only toll lanes are:
Introduction of a network of Express Toll Lanes on all major freeways in metro Atlanta;
A separate toll truckway system consisting of elevated/ at grade lanes and underground lanes;
1 ETL means that all vehicles in the managed lanes pay a toll. Trucks are not permitted in the managed lanes.
2 TOT means the managed lanes are reserved for trucks willing to pay a toll.

FINAL A Summary Review of Local Studies
January 2010
-4- Atlanta Regional Managed Lane System Plan Georgia Department of Transportation, Office of Planning
Significant congestion-relief benefits from these projects; and,
The projects considered are largely self-financing.
D. Main Features of the Study
This Galvin Mobility Project Study takes a system-wide view of the impact of tolling on metro-Atlanta’s transportation system. It concludes that additional system capacity is a must in order to reduce Atlanta’s congestion problems. It explores where this capacity can be added and in which form. This study calls for a change in transportation policy direction in metro Atlanta, recommending construction of ETLs instead of HOV lanes. From a methodological perspective, this study relies on secondary data sources to calculate Value of Time (VOT). These methodological assumptions can be used to classify the Galvin Mobility Report as a sketch level traffic and revenue study. The main results and assumptions of the study are summarized in Table 1.
Table 1: Main Characteristics of the Study
Major Points Sketch Level
Analysis
Preliminary Level Analysis
Detailed Level
Analysis Critical Assumptions
Priced Lanes √
ETL system on all major Metro Atlanta freeways
Truck tollway system consisting of surface/ elevated lanes and tunnels
Toll Modeling Methodology √
Derived passenger car toll rate from CA Express Lanes data (did not undertake a Stated Preference Survey)
Derived truck toll rate from HOT-TOT study
Toll revenue calculations done off-model
Pricing Strategy
√
ETL pricing varies by peak/ off-peak directions and time of day
All personal vehicles and light trucks in the ETL will be charged. Free access will be provided only for buses and vanpools (up to 100 vehicles/hr) and emergency vehicles.
Voluntary use of toll-truck-way system by trucks
Cost Estimation Technique √
Per lane mile ROW and construction costs used for specific ETL projects and aggregated to provide system-wide costs
System to system interchange costs considered
Average of construction and ROW costs for surface truck lanes and tunnels used
Toll technology equipment costs not considered

FINAL A Summary Review of Local Studies
January 2010
-5- Atlanta Regional Managed Lane System Plan Georgia Department of Transportation, Office of Planning
Major Points Sketch Level
Analysis
Preliminary Level Analysis
Detailed Level
Analysis Critical Assumptions
Construction costs generally regarded as low
Revenue Generation
Methodology √
Annual and Cumulative gross revenue and net revenue estimated for ETL network
Per mile toll rate and volume used for ETL revenue generation
Travel time savings from HOT/TOT Study and growth rate assumptions used for TOT revenue generation
Construction √
Phasing plan Limited consideration of constructability/
public acceptance
Operational Benefits √
Eliminate LOS F system-wide by 2030

FINAL A Summary Review of Local Studies
January 2010
-6- Atlanta Regional Managed Lane System Plan Georgia Department of Transportation, Office of Planning
STUDY 2
Study 2: High Occupancy Toll Lanes and Truck Only Toll Facilities: Potential for Implementation in the Atlanta Region, State Road and Tollway Authority, 2005
A. Introduction
This study, also known as the HOT-TOT Study, evaluated the potential of accommodating High-Occupancy Toll (HOT) Lanes within metro Atlanta’s existing and planned HOV system, as well as the feasibility of Truck Only Toll (TOT) Lanes on the interstates in Atlanta. It was conducted in response to Georgia Senate Resolution (SR) 575 that requested a comprehensive look at HOT lanes in Atlanta. This study took a system-wide approach and included all limited access facilities in the 13-County Atlanta metro area. The study examined 24 corridors which are the same corridors studied by GDOT’s HOV Strategic Implementation Plan for the Atlanta Region.
B. Data Inputs
The HOT-TOT Study used the following data inputs:
The 13-County ARC Regional Travel Demand Model was used for toll modeling;
Market research was used to gauge public acceptance for potential benefits of a regional HOT lane system; and,
Results from other national studies to develop Value of Time for light and heavy trucks.
C. Main Conclusions
The primary recommendations of the study related to managed lanes and truck lanes are:
The study recommended that the implementation of HOV, HOT, or TOT strategies should be examined from both a network perspective and at the individual corridor level;
HOT and TOT strategies provide greater network efficiency than just the HOV strategy alone;
HOT and TOT lanes offer more reliability and travel time savings for vehicles in the managed lanes as well as GP lanes, as compared to HOV lanes in congested corridors; and,
Both HOT and TOT lanes can generate a “respectable” amount of revenue.
FINAL A Summary Review of Local Studies
January 2010
-7- Atlanta Regional Managed Lane System Plan Georgia Department of Transportation, Office of Planning
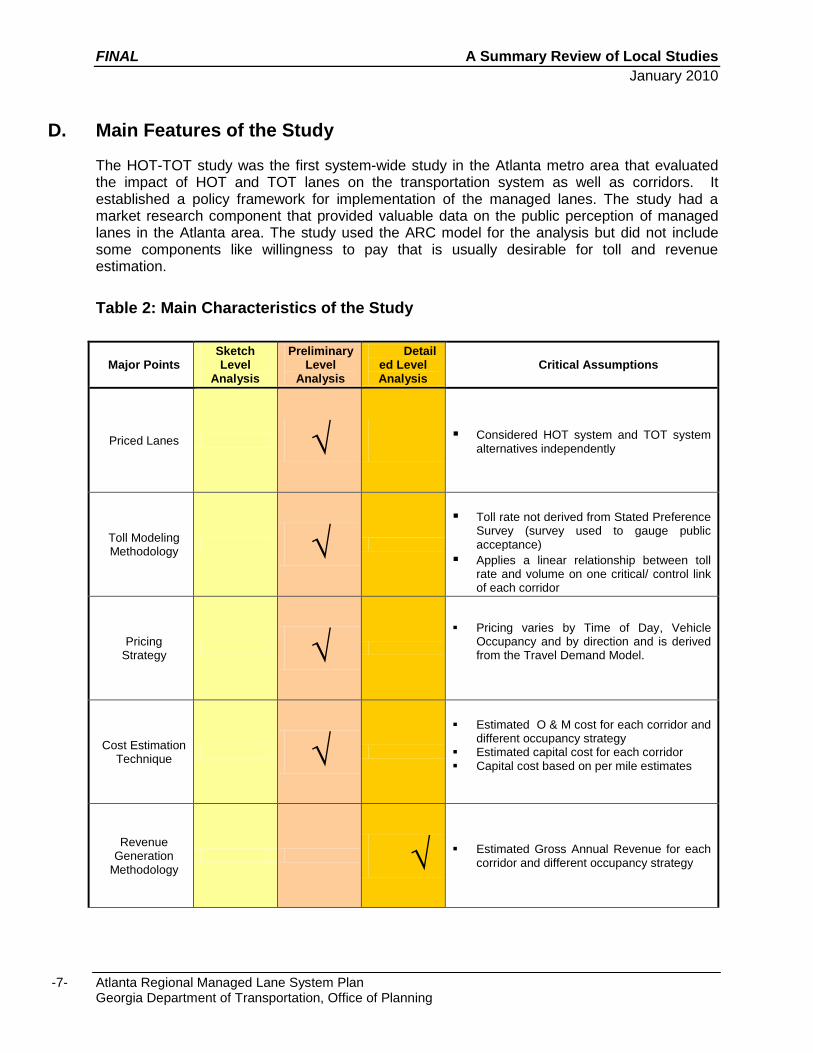
D. Main Features of the Study
The HOT-TOT study was the first system-wide study in the Atlanta metro area that evaluated the impact of HOT and TOT lanes on the transportation system as well as corridors. It established a policy framework for implementation of the managed lanes. The study had a market research component that provided valuable data on the public perception of managed lanes in the Atlanta area. The study used the ARC model for the analysis but did not include some components like willingness to pay that is usually desirable for toll and revenue estimation.
Table 2: Main Characteristics of the Study
Major Points Sketch Level
Analysis
Preliminary Level
Analysis
Detailed Level Analysis
Critical Assumptions
Priced Lanes √ Considered HOT system and TOT system alternatives independently
Toll Modeling Methodology
√
Toll rate not derived from Stated Preference Survey (survey used to gauge public acceptance)
Applies a linear relationship between toll rate and volume on one critical/ control link of each corridor
Pricing Strategy
√
Pricing varies by Time of Day, Vehicle Occupancy and by direction and is derived from the Travel Demand Model.
Cost Estimation Technique
√
Estimated O & M cost for each corridor and different occupancy strategy
Estimated capital cost for each corridor Capital cost based on per mile estimates
Revenue Generation
Methodology √
Estimated Gross Annual Revenue for each corridor and different occupancy strategy

FINAL A Summary Review of Local Studies
January 2010
-8- Atlanta Regional Managed Lane System Plan Georgia Department of Transportation, Office of Planning
Major Points Sketch Level
Analysis
Preliminary Level
Analysis
Detailed Level Analysis
Critical Assumptions
Construction √ Limited phasing and feasibility analysis
Operational Benefits √
Evaluated system-level operational benefits Travel time saving numbers provided for
critical corridors only

FINAL A Summary Review of Local Studies
January 2010
-9- Atlanta Regional Managed Lane System Plan Georgia Department of Transportation, Office of Planning
STUDY 3
Study 3: Value Pricing on the I-75 HOV/ BRT Project, GDOT, October 2006
A. Introduction
This study was a corridor specific study evaluating the feasibility of HOT lanes, TOT lanes and BRT alternatives on the I-75 Northwest Corridor. It was a preliminary traffic and toll revenue feasibility study, primarily targeted at identifying the potential range of revenue streams associated with various policy assumptions beginning in the projected opening year, 2014, and the financial capacity to fund project costs through the sale of bonds.
B. Data Inputs
The main data inputs used for this study were:
A refined version of the 13-County ARC Travel Demand model (generated as part of the EIS process for this corridor) used to evaluate the traffic and revenue forecast;
Detailed Passenger Car Stated Preference Survey undertaken with a sample set of corridor commuters; and,
Detailed Trucker and Shipper Survey coupled with an extensive educational component about TOT lanes.
C. Main Conclusions
The primary recommendations of the study related to managed lanes and truck lanes are:
HOT lanes can provide reliability in travel time along the corridor for managed lane users;
The study did not observe a significant operational benefit associated with managed lane implementation in the GP lanes due to latent demand;
The revenue generated by providing voluntary use of truck only lanes was found to be much lower than the capital and operating costs associated with such a facility; and,
Depending on policy decisions about pricing strategies and lane management strategies, different project goals can be achieved whether it is maximum revenue generation or optimum traffic management.
D. Main Features of the Study
The I-75 study was a corridor-based analysis that evaluated several HOT/ TOT alternatives and aggregated performance measures for each. This study adopted a true dynamic pricing

FINAL A Summary Review of Local Studies
January 2010
-10- Atlanta Regional Managed Lane System Plan Georgia Department of Transportation, Office of Planning
methodology by incorporating the information from the willingness to pay curve (developed from the stated preference survey efforts) directly into the model stream. The study performed a variety of sensitivity tests by varying growth rate assumptions and willingness to pay levels. These tests provided a comprehensive picture of the impact of a change in these variables on the revenue estimates.
Table 3: Main Characteristics of the Study
Major Points Sketch Level
Analysis
Preliminary Level
Analysis
Detailed Level
Analysis Critical Assumptions
Priced Lanes √ Considered several HOT/ TOT
alternatives by themselves and in combination
Toll Modeling Methodology
√
Dynamic toll diversion estimated using the Travel Demand Model
Willingness to pay curve developed using Stated Preference Surveys
This was to the travel demand modeling efforts
Pricing Strategy √
Complex Pricing Strategy Pricing varies by Time Of Day, by
Direction, by Vehicle Occupancy and Vehicle Type
Cost Estimation Technique
√
Toll technology unit costs Applied ARC ROW and construction
costs for HOVs included in the RTP O & M costs
Revenue Generation
Methodology √
Calculated annual and cumulative gross as well as net revenue
Revenue generation calculations done based on toll modeling results
Construction √
Preferred alternative being investigated for environmental and constructability impacts through a draft EIS that is under review

FINAL A Summary Review of Local Studies
January 2010
-11- Atlanta Regional Managed Lane System Plan Georgia Department of Transportation, Office of Planning
Major Points Sketch Level
Analysis
Preliminary Level
Analysis
Detailed Level
Analysis Critical Assumptions
Operational Benefits
√
Considered detailed operational measures, such as travel time and delay, at corridor level
Considered system-wide measures

FINAL A Summary Review of Local Studies
January 2010
-12- Atlanta Regional Managed Lane System Plan Georgia Department of Transportation, Office of Planning
STUDY 4
Study 4: SR 400 Value Pricing Study, GDOT (ongoing)
A. Introduction
This study is a corridor specific study that is currently underway. The study evaluates the feasibility of HOT lanes on the SR 400 corridor. It is a preliminary traffic and toll revenue feasibility study, primarily targeted at identifying the potential range of revenue streams.
B. Data Inputs
The main data inputs used for this study were:
A refined version of the 13 County ARC Travel Demand model used to evaluate the traffic and revenue forecast;
Detailed Passenger Car Stated Preference Survey undertaken with a sample set of corridor commuters;
Occupancy field data collected on SR 400 corridor and used to modify the travel demand model trip table; and
License plate O & D data collection used to calibrate Model.
C. Main Conclusions
The primary recommendations of the study related to managed lanes are:
HOT lanes can provide reliable travel times along the corridor for managed lane users;
The study did not observe a significant operational benefit in the GP lanes associated with managed lane implementation due to latent demand; and,
Study still in progress – additional conclusions still being developed.
D. Main Features of the Study
The SR 400 study is a corridor based analysis that evaluates several HOT alternatives and aggregated performance measures for each. This study adopted a true dynamic pricing methodology (similar to the I-75 Corridor study) by linking the information from the willingness to pay curve (developed through the stated preference survey efforts) to the regional travel demand model. The study will perform a variety of sensitivity tests by varying the growth rate assumptions and the willingness to pay levels. This study undertook a significant data collection effort to verify and calibrate the SR 400 corridor within the ARC model.

FINAL A Summary Review of Local Studies
January 2010
-13- Atlanta Regional Managed Lane System Plan Georgia Department of Transportation, Office of Planning
Table 4: Main Characteristics of the Study
Major Points Sketch Level
Analysis
Preliminary Level
Analysis
Detailed Level
Analysis Critical Assumptions
Priced Lanes √ Considered a range of HOT alternatives
Toll Modeling Methodology
√
Dynamic toll diversion estimated using the Travel Demand Model
Willingness to pay curve developed using a Stated Preference Survey
This was linked to travel demand modeling efforts
Pricing Strategy
√
Complex Pricing Strategy Pricing varies by Time Of Day, by
Direction, by Vehicle Occupancy
Cost Estimation Technique
√
Toll technology unit costs Applied ARC ROW and construction
costs for HOVs included in the RTP O & M costs
Revenue Generation
Methodology √
Calculated annual and cumulative gross as well as net revenue
Revenue generation calculations done based on toll modeling results
Construction √
Will consider phasing after final alternative is identified
Operational Benefits
√
Considering detailed operational measures, such as travel time and delay, at corridor level

FINAL A Summary Review of Local Studies
January 2010
-14- Atlanta Regional Managed Lane System Plan Georgia Department of Transportation, Office of Planning
STUDY 5
Study 5: I-285 Strategic Implementation Plan, GDOT (ongoing)
A. Introduction
This study is a multi-corridor study that is currently underway. The main goal of the study is to develop a comprehensive, feasible improvement program for the I-285 corridor to improve safety and efficiency. HOT lanes were considered in some alternatives evaluated in the study.
B. Data Inputs
The main data inputs used for this study were:
A refined version of the 13 County ARC Travel Demand model used to evaluate the traffic and revenue forecast;
ARC travel time data (2001);
GDOT TMC traffic counts data.
C. Main Conclusions
Since the study is still underway, no conclusions have currently been released.
D. Main Features of the Study
The I-285 study is unique since it uses a system-wide micro-simulation model for project and alternative evaluation. The study simulated various detailed system improvement projects like barrier-separated HOV lanes, BRT, barrier-separated truck only lanes, barrier-separated managed lanes, combination of HOV/BRT and managed lanes, HOV system-to-system interchanges and truck only system-to-system interchanges. The study considered several detailed performance measures like travel speeds, delay, delay costs, percentage of lane miles greater than capacity and increase in percentage of trips with trip time equal to free flow travel time.

FINAL A Summary Review of Local Studies
January 2010
-15- Atlanta Regional Managed Lane System Plan Georgia Department of Transportation, Office of Planning
SUMMARY
Table 5 summarizes the utility of the five studies discussed above to various regional planning goals. These goals were established based on the range of dialogue currently taking place in the region – both among planning partners and political decision makers. The studies are ranked as providing average, good or significant information for making informed decisions – those supported with appropriate and sound technical analysis.

FINAL DRAFT A Summary Review of Local Studies
January 2010
-16- Atlanta Regional Managed Lane System Plan Georgia Department of Transportation, Office of Planning
Table 5: Utility of Study
LEGEND
Studies
HO
T L
anes
Develo
pm
ent
TO
T L
anes
Develo
pm
ent
Pricin
g S
trate
gy
Revenu
e
Estim
ation
Corr
idor
Safe
ty
Cong
estio
n-
Relie
f
Altern
ative
Modes
Constr
ucta
bili
ty
Pub
lic
Involv
em
ent
Reducing Congestion in Atlanta: A Bold New
Approach to Increasing Mobility
High Occupancy Toll
Lanes and Truck Only Toll Facilities: Potential for Implementation in the
Atlanta Region
I-285 Strategic Implementation Plan
Value Pricing on the I-75 HOV/ BRT Project
SR 400 Managed Lanes
Study
Average Good Significant

FINAL A Summary Review of Local Studies
January 2010
Atlanta Regional Managed Lane System Plan Georgia Department of Transportation, Office of Planning
TECHNICAL APPENDIX

FINAL A Summary Review of Local Studies
January 2010
Atlanta Regional Managed Lane System Plan Georgia Department of Transportation, Office of Planning
A-1
The appendix summarizes a detailed comparison of the Atlanta area studies evaluating managed lanes
including High Occupancy Vehicle (HOV) lanes, High Occupancy Toll (HOT) lanes, Truck Only Lanes
(TOL), and Truck Only Toll lanes (TOT) at a system-wide level or a corridor level. The goal of this
comparison was to understand the technical and policy assumptions behind these studies, and thus, allow
for meaningful comparisons between their results.
The comparison framework analyses the different studies at two levels:
o Overall Assessment - The first level of analysis in the framework provides background information
on each study and identifies its major assumptions. This framework is illustrated in Figure 1.1.
There are three key subsets to this framework:
Project Background;
Project Description and;
Toll and Revenue analysis.
Project background (Table 1.1.) provides a baseline information-set related to the study. This
section identifies if the study is a preliminary traffic and revenue study or a detailed one. It also
outlines the geographic extent of the study i.e. if it was corridor-specific, analyzed multiple corridors
or looked at a system of corridors. Project description (Table 1.2.) outlines the study’s goals and
objectives, its policy framework and assumptions about the proposed project configuration. Toll and
revenue analysis (Table 1.3.) touches upon the growth assumptions considered by the study, the
use of survey or focus groups, a description of the model used for the analysis and an overview of
the toll modeling methodology. Altogether, this section provides a robust set of information to
understand the similarities and differences between results of one study to another.
o The second level of analysis in the framework provides more detailed information at a corridor level.
The framework is illustrated in Figure 1.2. There are two key subsets in this framework:
Alternatives Considered and;
Study Results.
One corridor may be addressed by more than one study. This framework consolidates and
compares study assumptions and results at a corridor level. The study alternatives section (Table
1.4.) describes the various scenarios that the study analyzed, the pricing strategy adopted and the
design of access points for the managed lanes. The results of study (Table 1.4.) are summarized in
terms of the toll rate selected for the managed lane configurations, the revenue projected and the
operational benefits envisioned to follow from the implementation of proposed management
strategies.

FINAL A Summary Review of Local Studies
January 2010
Atlanta Regional Managed Lane System Plan Georgia Department of Transportation, Office of Planning
A-2
Figure 1.1: Overall Assessment
Overall Assessment This section provides an overview of the project, the project
sponsor, the geographic extent of the study (system plan, corridor specific), study grade (exploratory, investment grade, etc) and
some baseline assumptions.
Project
Background
Project
Description
Study Name
Study Sponsor
Study Grade (exploratory, investment
grade, etc) Geographic
Extent
Corridor Specific
Multiple Corridors
System Plan
Toll and Revenue
Analysis
Goals and Objectives
Policy Framework
Institutional
Operational
Public/Private Partnership
Project Configuration
Traffic Management
Strategy
Lane
Configuration Technology
Options
Survey/ Focus Groups
Willingness to Pay
Public Acceptance
Value of Time
Model Description
Toll Modeling Methodology
Growth Assumptions
Transit
Phasing
Corridor Profile

FINAL A Summary Review of Local Studies
January 2010
Atlanta Regional Managed Lane System Plan Georgia Department of Transportation, Office of Planning
A-3
Table 1.1: Overall Assessment - Project Background
Study Name Sponsor Study Grade
Geographic Extent
Corridor Profile
Corridor Multiple System
HOT & TOT Feasibility Study For the Atlanta
Region
State Road & Tollway Authority (Georgia)
System-wide feasibility study of implementing HOT lanes and/or TOT facilities.
The project study area includes all limited access facilities in the 13-county Atlanta Metropolitan Area.
Value Pricing on the I-75 HOV/ BRT Project
Georgia Department of Transportation
Preliminary Traffic and Revenue Study
I-75 N from Akers Mill Road to Hickory Grove Road
I-575 from I-75 to Sixes Road
NA NA Congestion is a significant problem on the I-75 and I-575 corridor. Under existing forecasts, population is expected to increase by approximately 60% along
the study area as compared to a 12% increase in lane miles. Northbound PM peak period travel time from Akers Mill Road northbound to the I-575
split is estimated to take 25 minutes (2005 travel demand model results).
SR 400 Value Pricing Study
Georgia Department of Transportation
Preliminary Traffic and Revenue
SR 400 corridor from I-85 to SR 20 in the north
SR 400 is a multi-lane facility with an AADT of approximately 220,000 just north of the I-285 interchange. The study area is approximately 30 miles. Inside I-285, SR 400 is operated as a toll facility with the toll booth located mid-point
between I-85 and I-285. SR 400 experiences heavy congestion during the peak periods, particularly in the PM. Key bottlenecks are the interchanges at I-85 (southbound only) and I-285, and the
northbound lane drop location at Haynes Bridge Road. There is no direct access from SR 400 southbound to I-85 northbound (or from I-85
southbound to SR 400 northbound).
I-285 Strategic Implementation Plan
GDOT Strategic Implementation Study (Preliminary level / Fiscally Constrained Level)
I-285 Corridor (63-mile total)
Reducing Congestion in Atlanta: A Bold New
Approach to Increasing Mobility
The Galvin Project and the Reason Foundation
Atlanta Regional Commission's 20-County Planning Boundaries

FINAL A Summary Review of Local Studies
January 2010
Atlanta Regional Managed Lane System Plan Georgia Department of Transportation, Office of Planning
A-4
Table 1.2: Overall Assessment - Project Description
Study Name Goals and Objectives
Policy Framework Project Configuration
Institutional Public Private Operational Transit Traffic Management
Strategy Lane Configuration Technology Options Phasing
HOT & TOT Feasibility Study For the Atlanta
Region
HOT Lane Study Goals: Assess the necessary
legislative actions and business model options required for the development of a HOT system in the Atlanta region. Assess the potential impacts of
the installation of HOT lanes on: o The operations and
safety of the general purpose lanes.
o The operations and safety of the HOV system.
Identify improvements that may be required to mitigate impacts. Identify enforcement
requirements. Assess the impact on
transportation policies such as: o Congestion relief. o Reduction in vehicle
miles traveled. o Air quality/emissions
reduction. TOT Facility Study Goals: Assess the necessary
legislative actions and business model options required for the development of a TOT system in the Atlanta region. Assess the potential impacts of
the installation of TOT facilities on the operation and safety of the general purpose lanes. Identify improvements that may
be required to mitigate impacts. Identify enforcement
requirements. Assess the impact on
transportation policies.
A capacity of 2,400 vehicles per lane per hour and a V/C ratio of 0.64 was used for HOT/TOT initial analysis. The goal was to
maintain a LOS C in the designated lanes. If any managed
lane link with more than 1,320 HOV’s per hour per lane is “filled”, then the toll paying SOV’s can not be allowed. The analysis
introduced a “control” link concept for each corridor. All the calculations mentioned above were performed on the control links for each corridor.
Qualified transit vehicles to travel for free on all managed lanes in the region.
The HOV scenario assumes the current HOV policy, denoted HOV-2+, on the analysis network. The HOT (HOT3+)
scenario allows three or more occupant vehicles to use the HOT lanes for free, while vehicles with less than three occupants pay a fee. The TOT scenario
converts all existing and planned HOV lanes in the region (except those inside of I-285) to TOT lanes.
The analysis assumes two barrier-separated managed lanes in each direction (where applicable) outside of I-285 and on I-285. Assume the existing
HOV segments and one additional managed lane in each direction inside of I-285.
Electronic Tolling. The expansion of the
Cruise Card program managed by SRTA for the payment of tolls in HOT lanes was proposed to be the most sensible near term solution.
Horizon year of 2030

FINAL A Summary Review of Local Studies
January 2010
Atlanta Regional Managed Lane System Plan Georgia Department of Transportation, Office of Planning
A-5
Study Name Goals and Objectives
Policy Framework Project Configuration
Institutional Public Private Operational Transit Traffic Management
Strategy Lane Configuration Technology Options Phasing
Value Pricing on the I-75 HOV/ BRT Project
The main goal of this study is to address congestion on the corridor through traffic management techniques. To address existing and future
congestion on the I-75 corridor, HOV lanes, TOLs and transit options are under study through an EIS for this corridor. This value pricing study investigates pricing opportunities for the build alternatives being considered as part of the corridor EIS. The primary objective of the
study is to determine if converting the planned HOV lanes on the corridor to a managed lanes facility, including pricing, could be an effective mechanism to provide a non-congested alternative for HOVs, transit, and SOVs willing to pay a toll. The main purpose of the pricing
alternatives investigated by this report was effective congestion management, not revenue generation. Tolling the truck only lanes is
not specifically designed to maximize person throughput but rather as a mechanism to defray the cost of construction, and to foster congestion related demand management strategies that can improve our region’s air quality.
A public private proposal – I-75/ I-575 (Northwest Corridor) proposal, for pricing on the corridor has been submitted by the Georgia Transportation Partners.
The toll analysis methodology required that an average travel speed of 45 mph or over be maintained in the HOT/ TOT lanes.
Two of the three alternatives analyzed for I-75 include transit along with the truck/ managed lanes: TSM alternative
considers transit facility improvements (like surface park-and-ride lots and bus transfer facilities) along with bus service in HOV lanes. BRT alternative
considers transit stations and park-and-ride lots at HOV-only interchanges along with BRT in HOV lanes. No transit options are proposed along I-575.
The alternatives analyzed considered the following strategies: HOT/ TOL lanes. HOT/ TOL lanes with
Bus Service in HOV lanes. HOT/TOL lanes with
BRT in HOV lanes.
I-75 Corridor: GP lanes remain the
same. 2 HOV lanes in each
direction between I-285 and I-575, 1 HOV lane north of I-575. 2 TOLs in each
direction along I-75 study extent (I-285 to Hickory Grove Road). HOV and TOL lanes
are assumed to be barrier separated.
I-575 Corridor: GP lanes remain the
same: 1 HOV lane in either direction.
Electronic toll collection (ETC). The tolled lanes
would be dynamically priced to ensure that they operate at 45 mph or more. The preferred ETC
design included entry/ exit system tolling and three mainline tolling zones – one at either end of the projects extents. Estimated capital
costs of implementing the ETC system was about $24 million.
The toll lanes are estimated to be operational by year 2014.
SR 400 Value Pricing Study
Offer additional choices to motorists on the SR 400 corridor. Investigate feasibility of
implementing managed lanes in the SR 400 corridor from I-285 N to SR 20. Investigate the feasibility of
adding concurrent HOV lanes to
This study builds upon the state and regional planning efforts along with the department's Public Private Initiative (PPI) program.
The original PPI proposal for GA 400 from the Crossroads Group included upgrades to GA 400 between I-85 and SR 20.
The toll analysis methodology required that an average travel speed of 45 mph or over be maintained in the HOT/ TOT lanes.
While it is assumed that buses will be eligible to travel in the HOT lanes, transit has not been specifically modeled as a part of this project.
The alternatives analyzed consider pricing for SOV, HOV- 2, HOV-3 and for all traffic. Various
combinations of pricing based on occupancy are under
The following lane configurations are under consideration: Two managed lanes
in each direction on SR 400 from I-285 to SR 20. In addition to the
managed lanes
Electronic Toll Collection
Project is estimated to open in 2015.

FINAL A Summary Review of Local Studies
January 2010
Atlanta Regional Managed Lane System Plan Georgia Department of Transportation, Office of Planning
A-6
Study Name Goals and Objectives
Policy Framework Project Configuration
Institutional Public Private Operational Transit Traffic Management
Strategy Lane Configuration Technology Options Phasing
the currently tolled section of SR 400 inside of I-285.
evaluation. mentioned above, a single concurrent HOV lane on SR 400 south of I-285 to I-85.
I-285 Strategic Implementation
Plan
Objective, detailed evaluation of planned projects and programs in the I-285 corridor. Development and evaluation of
alternate improvement projects, programs and/or strategies. Development of a
comprehensive, implementable improvement program for the entire I-285 corridor through the horizon year 2030. Development of implementation
program for 2010, 2020, 2030, and beyond 2030. Provide planning input to
subsequent projects such as Revive 285 Top End and the update of the Regional Transportation Plan (RTP).
N/A N/A The study considered several operational performance measures like travel speeds, delay, delay costs, etc.
Qualified transit vehicles to travel for free on all managed lanes in the region.
Developed various system improvement scenarios including: Barrier separated
high occupancy. vehicle (HOV) lanes Bus Rapid Transit
(BRT). Barrier separated
truck only lanes. Barrier separated
managed lanes. Combination of
HOV/BRT and managed lanes. HOV system-to-
system interchanges. Truck only system-to-
system interchanges.
Not Considered Development of implementation program is underway: 2010; 2020; 2030; and Beyond 2030.
Reducing Congestion in Atlanta: A Bold New Approach to Increasing
Mobility
Project construction would be accelerated through toll revenue bonds, private equity, and traditional sources. The report
noted that the current escalations in construction materials is not included and may shift the policy direction away from "mainly user fee financed".
PPP assumed for implementation and operations under a long term concession agreement.
SRTA or PPP Transit and vanpools are assumed to be free up to 100 vehicles per hours.
LOS C Two ETL lanes in each direction on all major freeways in metro Atlanta. The exceptions to this
are I-575, SR 154, I-85S. These facilities have one ETL lane per direction due to low congestion levels.
All electronic tolling. Four phases each taking four years to construct.

FINAL A Summary Review of Local Studies
January 2010
Atlanta Regional Managed Lane System Plan Georgia Department of Transportation, Office of Planning
A-7
Table 1.3: Overall Assessment - Toll and Revenue Analysis
Study Name Growth
Assumptions
Survey/ Focus Group Model Description Toll Modeling Methodology
Willingness to Pay Value of Time Public Acceptance
HOT & TOT Feasibility Study For the Atlanta Region
ARC Travel Demand Model
The average price that commuters are willing to pay for HOT-TOT service is 10¢ per minute. o Commuters of I-75 North, I-
85 North and I-75 South are willing to pay the most, 11¢ per minute;
o Commuters on I-20 East and I-20 West are willing to pay the least, 9¢ and 8¢ per minute respectively; and,
o Commuters of GA 400 are willing to pay 10 ¢ per minute.
The average elasticity of willingness to pay with respect to time saved is 1.079 or 1.1. Specifically, for every 10% increase in time saved, commuters are willing to pay an additional 11% in tolls. Elasticity of willingness to pay
varies significantly by the average commute. Individuals who commute on average 40 minutes or less have a much lower elasticity of response to time saved (.954). By contrast, individuals who commute on average 60 minutes and greater have a very high elasticity (1.58). Middle-income commuters
($35,000 - $75,000) have a much higher elasticity than lower income commuters (incomes less than $35,000), i.e., 1.49 as compared to 0.86 respectively.
A value of time of $35 per hour for heavy duty commercial vehicles. A value of time of $18 per hour
for light duty commercial vehicles.
People are skeptical regarding the travel-time guarantee, but most would use the lane in a time of need. There is a perception that
transit would be a better investment to solve the current traffic problems. Conversion of existing HOV
lanes to HOT lanes is adverse to the purpose of HOV lanes. People like the idea of HOT as
its own lane rather than as an expanded use of the HOV lane. Conversion to HOV-3 is not
supported. There is a correlation between
frequency of use of the lane and preferred toll collection method. People agree that HOT lanes
should be self-funded and that revenue should be used to construct and operate the HOT lanes. There is a mix of opinion
regarding the use of toll revenues for the operation of transit. Enforcement methods should
be harsh enough to deter violators. Current express bus users will
continue to ride the express bus even if HOT lanes are an option.
ARC Travel Demand Model - 2030 Mobility
The procedure for estimating tolls for managed lanes is summarized as follows. (i) Apply the ARC travel demand model specifying the HOT lanes as simply HOV lanes; (ii) Apply the dynamic toll procedure. The dynamic toll procedure consists of four major steps: o Identify the HOT links for each corridor. The
critical links were selected based on the most vehicles assigned for each corridor and used for toll estimation for that certain corridor.
o Perform a “normal” ARC assignment, specifying the HOT lanes as simply HOV lanes. The assigned HOV volume will be preloaded in the following assignment steps. The desired maximum number of SOV vehicles is calculated based on assigned HOV and acceptable capacity. (An ideal capacity of 2,400 vehicles per lane per hour and an acceptable V/C ratio of 0.64 were assumed for this study.) Calculations are then performed for the critical link of each corridor.
o Perform two assignments allowing SOV vehicles in the managed lanes with the required payment of a toll of five cents a mile and seven cents a mile. A linear relationship of (SOV toll in cents per
mile is Volume) = A + B is assumed. With the SOV volume generated from the two assignments from different toll rate, A and B coefficients in the equation can be derived, and furthermore, the optimal toll can be obtained given the desired maximum SOV volume. Still, the calculation is only being performed for the critical link of each corridor.
o Examine SOV volumes on the highway assignment using the toll estimated by the linear equation. The calculation of tolls and volumes (step c and step d) is repeated until the SOV volumes are within five percent to the desired maximum SOV volumes.
(iii) Apply the ARC travel demand model using the tolls derived from the dynamic toll procedure with the preloaded HOV volume from step (i). The dynamic toll procedure is applied for each individual time period used in the assignment process, which at the present

FINAL A Summary Review of Local Studies
January 2010
Atlanta Regional Managed Lane System Plan Georgia Department of Transportation, Office of Planning
A-8
Study Name Growth
Assumptions
Survey/ Focus Group Model Description Toll Modeling Methodology
Willingness to Pay Value of Time Public Acceptance
time is the morning peak period, mid-day, afternoon peak period and the evening / early morning period. The application of the procedure for the evening / early morning period is probably not warranted since this period does not have much congestion.
Value Pricing on the I-75 HOV/ BRT Project
Overall growth in traffic on the I-75 corridor is estimated to be 20-30%. Overall growth in
traffic on the I-575 corridor is estimated to be 80%. Traffic volumes
are projected to exceed 370,000 vehicles per day on I-75 just north of I-285. In 2030, even
with addition of HOV lanes on I-75, travel time is expected be 33 minutes in the GP lanes (up from 25 minutes in 2005) and 16 minutes in the HOV lanes (based on ARC’s TDM results). Overall trip times
in the general purpose lanes are expected to increase by 32%.
The willingness to pay curve for candidate HOT lane users was developed by occupancy type (SOV, HOV-2 and HOV-3+). The willingness to pay curve
for candidate TOT lane users was developed based on truck shipper and truck driver stated preference survey. The stated preference survey
shows that truck shippers are less willing to pay the toll than truck drivers, particularly at the lower levels of travel time savings.
The mean VOT for passenger cars ranged from $0.48 to $24.35. Truck drivers were found to
have an average VOT of $38/hour if the driver’s company would always pay the toll for the SP reference trip. But if the driver would always pay the toll him/herself, the average VOT was about $22/hour.
About 49% of survey respondents thought that the HOT concept was a good idea while an equal number thought it was a bad idea. The primary reason
respondents thought it was a good idea was that it would help with the flow of traffic and the primary reason respondents thought it was a bad idea was because they did not think it was fair. Of all respondents who were
willing to pay a toll, about 49% said they would do it to reduce overall travel time on their trip.
This study used the modified ARC Travel Demand Model being used by consultant Parsons Brinckerhoff for the I-75 HOV/BRT Environmental Impact Statement (EIS). ARC’s highway network was
modified to include additional detail in the study corridor. Trip tables used for this analysis
reflect the latest socio-economic forecasts available for the region, developed in the Mobility 2030 plan. The input data for ARC’s TDM
was refined for this analysis: o The four analysis period trip
tables from the ARC TDM were segregated into eight vehicle categories for the traffic and revenue analysis.
o The disaggregation of HOV trips was based on the information from ARC’s mode choice model.
o The disaggregation of commercial registered vehicles/Trucks into commercial vehicles (autos, pick-up trucks, vans, etc), Medium-Duty Trucks (FHWA classes 4-7) and Heavy-Duty Trucks (FHWA 8-13) was based on ARC’s 20-county model and the counts performed in the corridor.
PCE factors were introduced in the model – a PCE of 1.5 for Medium-Duty trucks and 3.0 for Heavy-Duty Trucks. No PCEs were applied to other commercial vehicles. To balance the introduction of
ARC’s toll methodology relies on a simple toll diversion curve – the shortest cost path that assigns either 100% or 0% to tolled and toll-free routes. The methodology for this value pricing study added more detail to the curve between these extremes. The willingness to pay curve for candidate HOT lane
users was developed by occupancy type (SOV, HOV-2, and HOV-3+) and by travel period. The various vehicle categories (e.g., SOV, HOV-2,
HOV-3, HOV-4+, CV, Medium-Duty Trucks and Heavy-Duty Trucks) were handled separately in the TP+ assignment process to recognize differing restrictions on specific lane uses (HOV Lane, HOT lane, TOT lane, etc.) and toll charges. For each of the different alternatives, traffic
assignments were completed at each of the four time periods independently (a.m. peak period, p.m. peak period, midday period, and night-time period). Various toll rates ranging from 2 cents/mile to 80 cents/mile were tested for each pricing strategy and each period of day. A series of toll sensitivity curves were created to illustrate the relationships between the toll rates and revenue collected over the entire facility.

FINAL A Summary Review of Local Studies
January 2010
Atlanta Regional Managed Lane System Plan Georgia Department of Transportation, Office of Planning
A-9
Study Name Growth
Assumptions
Survey/ Focus Group Model Description Toll Modeling Methodology
Willingness to Pay Value of Time Public Acceptance
PCE factors and not compromise the model’s validation, road capacities were increased based on the proposed PCE factors in concert with the percentage of passenger cars, MDT and HDT for each of the facility types system-wide.
o Interstate/HOV/TOL:15%; o Parkway/Expressway: 10%; o Principal Arterial I/II: 9%; o Minor Arterial I: 8%; o Minor Arterial II: 5%
SR 400 Value Pricing Study
The ARC travel demand model is used to quantify future demand on the corridor. The study also
considers alternate growth scenarios describing aggressive and conservative economic growth trends in terms of allocation of population and employment and household income distributions.
The range of VOT range identified by the Stated Preference Survey varies from $108/hr ($9 for 5 minutes saved) to $0.50/hr (25 cents for 30 minutes saved). The Stated Preference Survey
also found that those who use only the outer segment of SR 400 tend to have a lower VOT.
63% of respondents to the Stated Preference Survey said that congestion on GA 400 is a "major problem" while 22% classified it s as a "moderate problem". An almost equal number of
respondents thought that the HOT concept was a "good idea" as those who thought it was a "bad idea".
The 20 County ARC regional Travel Demand Model is being used to develop the traffic and revenue forecasts. Based on the data collected for
this study, the occupancy distribution represented in the model was modified. HOV 3 and HOV 4 trips were found to be over represented in the model as compared to the field data collection results. Thus, some of these trips were converted to HOV 2 trips.
ARC’s toll methodology relies on a simple toll diversion curve – the shortest cost path that assigned either 100% or 0% to tolled and toll-free routes. The methodology for this value pricing study expanded the detail of the curve between these extremes. The willingness to pay curve for candidate HOT lane
users was developed by occupancy type (SOV, HOV-2, and HOV-3+) and by travel period. The various vehicle categories (e.g., SOV, HOV-2, HOV-3, HOV-4+) were handled separately in the TP+ assignment process to recognize differing toll charges. For each of the different alternatives, traffic
assignments are being investigated for each of the four time periods independently (a.m. peak period, p.m. perk period, midday period, and night-time period). Various toll rates ranging from 2 cents/mile to 15
cents/mile are being tested for each pricing strategy and each period of day.
I-285 Strategic Implementation
Plan
ARC 13-County Travel Demand Model
N/A Value of Time identified in ARC travel demand model
N/A VISSIM micro-simulation model was developed and utilized to interface the urban transportation model with detailed characteristics of the operation of I-285 and its connecting freeways and arterial roadways. The detailed modeling process and methodology can be summarized as follows: Prepare/set up I-285 sub area
corridor model and use the input highway and transit network in ARC 13-County travel demand
Dynamic traffic assignment in the VISSIM

FINAL A Summary Review of Local Studies
January 2010
Atlanta Regional Managed Lane System Plan Georgia Department of Transportation, Office of Planning
A-10
Study Name Growth
Assumptions
Survey/ Focus Group Model Description Toll Modeling Methodology
Willingness to Pay Value of Time Public Acceptance
model as the basis. Separate truck trip tables to
heavy/medium-duty trucks and light-duty trucks. Move light-duty trucks to SOV passenger car trip tables. Introduce peak spreading into the
travel demand trip table so that assigned volumes on each link generally do not exceed the available capacity. Refine trip table so that the
resulting assigned volumes more accurately reflect traffic counts collected along I-285 corridor. Assign hourly trip table in 15-
minute increments. Extract four sets of trip tables for
the analysis sections (north, south, east and west). Convert trip tables to VISSIM
format. Develop and calibrate micro-
simulation model. The process involves traffic signal timing coding, VISSIM dynamic assignment and static traffic simulation.
Reducing Congestion in Atlanta: A Bold New Approach to Increasing
Mobility
Used the ARC Model.
$12 per hour and $0.60 per mile for autos. $18/hour for light duty trucks
and $35/hour for heavy duty trucks.
Same as willingness to pay. N/A Used the ARC model off the shelf - no tolling assumption or latent demand considerations.
Total value of time savings from the system would be: The time saved by users of the general-purpose
lanes who would no longer experience LOS congestion, plus The time saved by users of the new priced lanes, as
measured by what they voluntarily pay to use those lanes.
ETL toll revenue methodology: Use SR 91 and I-15 in California as indicators.
Summarize the average peak-period, peak-direction toll levels. Compare the peak toll levels with the intensity of
congestion in those two metro areas using data from the 2005 Urban Mobility Report. Graphing the congestion levels and toll rates
experience on these facilities. A toll rate for Atlanta was calculated to be 35 cents per mile. Non-peak direction rates were assumed to be one
third the peak direction toll rates which would in turn attract half the users as the peak direction.

FINAL A Summary Review of Local Studies
January 2010
Atlanta Regional Managed Lane System Plan Georgia Department of Transportation, Office of Planning
A-11
Study Name Growth
Assumptions
Survey/ Focus Group Model Description Toll Modeling Methodology
Willingness to Pay Value of Time Public Acceptance
Reducing Congestion in Atlanta: A Bold New Approach to Increasing
Mobility
The weighted average peak period toll rate is $0.27.2 per lane-mile in 2005 dollars. Toll rate is inflated at 3.5 percent per year (CPI
index). Ramp is assumed for three years, 250 weekdays
per year, 10 percent reduction to go from gross to net revenue.
North South Tunnel Methodology: The same starting point costs as the ETL
methodology however, it is assumed that there is no peak direction and the core tunnel would have equally heavy demand in both directions. The demand for the system was assumed to be
1700 paying vehicles per lane/hour for each of the six lanes during the eight-hour peak period. Thereby, not requiring averaging or discounting for the off-peak direction and maintain the $0.35 per lane-mile toll rate. Ramp is extended to five years. Gross to net is assumed to be 15% due to the
increased cost of maintaining a tunnel. Lakewood Freeway Methodology: Same as above at 60 percent of the level of the N-S
tunnel. Truck Lanes Network Methodology: Tolls would be charged based on one third of the
time saved by trucker using the TOT lanes based on $18/hour for light duty trucks and $35/hour for heavy duty trucks. The study estimated that the annual value of time
saved was $721 million. One third of that is $240 million, which was assumed to be the year 2005 revenue. The 2005 revenue was adjusted using the 3.5
percent rates to 2018 levels to establish an opening year revenue estimate of $423M gross revenue. A 15% reduction was estimated for O&M.

FINAL A Summary Review of Local Studies
January 2010
Atlanta Regional Managed Lane System Plan Georgia Department of Transportation, Office of Planning
A-12
Figure 1.2: Corridor Specific Assessment
Corridor Specific Assessment One corridor can be addressed in more than one study. The purpose of the corridor-specific assessment is to consolidate and compare all
study assumptions and results related to a specific corridor.
Alternatives Results
Description of Alternatives
Revenue Projection
Selected Per Mile Toll Rate
Pricing Strategy
Access Design Operational Benefits

FINAL A Summary Review of Local Studies
January 2010
Atlanta Regional Managed Lane System Plan Georgia Department of Transportation, Office of Planning
A-13
Table 1.4: Corridor Assessment
Study Name Description of Alternatives Pricing Strategy Access Design
Toll Rate Revenue Projection Operational Benefits
HOT & TOT Feasibility Study For the Atlanta
Region
• The HOV scenario • The HOT (HOT3+) scenario • The TOT scenario
The pricing for HOT lane (Toll Rate) was adjusted through an iterative process with the objective of maximizing the flow at the "control" link and at the same time maintaining LOS C or better on each corridor.
Access to managed lane facilities occurs at exclusive interchanges only. No intermediate access (e.g. through slip ramps) is provided except at system-to-system interchanges.
N/A for specific corridor
Value Pricing on the I-75 HOV/ BRT Project
Alternatives 1-4 Build 2 HOT Lanes in
Each Direction. HOT 2+, HOT 3+, HOT
4+, ETL Alternatives 5-8
Build 2 HOT Lanes in Each Direction.
Build 2 voluntary TOT lanes in Each Direction.
Alternatives 9-12
Build 2 HOT Lanes in Each Direction.
Dynamic pricing that varies by congestion levels.
Access points same as those identified in the I-75 EIS.
Optimum toll rates on the I-75 corridor (NB direction) managed lanes in the PM Peak Period ranged from $0.10 to $0.20 per mile in the 2015 horizon year and from no pricing (since no excess capacity for SOVs was available) to $0.60 per mile in the 2030 horizon year. Optimum toll rates on the I-575
corridor (NB direction) managed lanes in the PM Peak Period ranged from $0.10 to $0.15 per mile for horizon year 2015 and from no pricing to $0.60 per
Cumulative gross annual revenue ranged from approximately $5 million to $27 million in 2015 and from $149 million to $870 million in 2030.
Gross Annual
Revenue
Operations
and
Maintenance
Costs
Gross Annual
Revenue
Operations
and
Maintenance
Costs
Gross
Annual
Revenue
Operations
and
Maintenance
Costs
HOT
Incremental
Capital Costs
HOV Capital
Costs
I-285 (4 lanes)
7 I-285 N 35.2 - $352,000 $5,815,000 $5,585,000 $22,086,000 $9,644,000 $1,190,000 $147,030,000
9 I-285 S 26.8 $3,795,000 $4,779,000 $1,993,000 $3,660,000 $4,150,000 $4,346,000 $906,000 $60,190,000
Corridors Inside I-285
1 I-75 N 8.3 $1,420,000 $1,206,000 $1,420,000 $1,129,000 $2,430,000 $1,511,000 $286,000 -
2 SR 400 6.3 - $63,000 - $63,000 $3,440,000 $2,084,000 $217,000 $16,315,000
3 I-85 N 10.5 - $105,000 - $105,000 $2,785,000 $2,418,000 $362,000 -
4 I-20 E 9.8 - $98,000 $410,000 $1,058,000 $1,092,000 $1,356,000 $338,000 -
5 I-20 W 6.3 - $63,000 $437,000 $984,000 $1,201,000 $1,408,000 $217,000 $27,573,000
6 I-75 S 4.2 $218,000 $812,000 $218,000 $626,000 $437,000 $879,000 $145,000 -
8 I-75/I-85 7.8 $5,870,000 $5,297,000 $5,706,000 $4,960,000 $3,549,000 $3,052,000 $269,000 -
10 I-85 S 7.9 $410,000 $856,000 $109,000 $554,000 $300,000 $566,000 $272,000 $11,639,000
15 SR 166 5.6 $164,000 $1,067,000 $164,000 $943,000 $546,000 $1,063,000 $193,000 $15,465,000
Corridors Outside I-285 (4 lanes)
11 US 78 8.7 $437,000 $1,153,000 $246,000 $875,000 $410,000 $868,000 $294,000 $6,620,000
12 I-575 30.5 $3,194,000 $3,256,000 $3,549,000 $2,995,000 $4,996,000 $3,012,000 $1,031,000 $44,510,000
13 SR 316 18.8 $1,310,000 $2,181,000 $819,000 $2,075,000 $1,229,000 $2,210,000 $635,000 $10,717,000
14 SR 141 3.3 $928,000 $1,646,000 $874,000 $1,027,000 $1,775,000 $1,596,000 $112,000 $3,660,000
16 I-75 N 18.4 $3,986,000 $3,263,000 $5,296,000 $3,193,000 $9,828,000 $4,133,000 $622,000 $65,390,000
17 SR 400 29.6 - $296,000 $5,788,000 $3,680,000 $10,702,000 $4,648,000 $1,000,000 $27,940,000
18 I-85 N 29.8 - $298,000 $5,433,000 $4,688,000 $11,657,000 $5,724,000 $1,006,000 $29,016,000
19 I-20 E 18.8 $2,785,000 $2,894,000 $1,147,000 $2,054,000 $1,611,000 $2,022,000 $635,000 $19,565,000
20 I-20 W 25.1 $2,757,000 $3,324,000 $3,221,000 $3,043,000 $4,505,000 $3,164,000 $848,000 $19,784,000
21 I-75 S 30 $6,989,000 $4,272,000 $6,525,000 $3,778,000 $8,490,000 $3,948,000 $1,014,000 $30,184,000
22 I-85 S 34.3 $1,911,000 $3,912,000 $2,348,000 $3,696,000 $3,522,000 $3,837,000 $1,159,000 $29,118,000
23 I-985 7.3 $983,000 $2,009,000 $1,229,000 $1,938,000 $1,447,000 $2,059,000 $245,000 $5,744,000
24 I-675 10.1 $956,000 $1,358,000 $655,000 $1,032,000 $1,010,000 $1,032,000 $341,000 $7,586,000
HOT 3+ Limited Network HOT 4+HOV 2+ Limited Network
Potential Revenue
and Costs by Corridor Cente
rlin
e M
iles

FINAL A Summary Review of Local Studies
January 2010
Atlanta Regional Managed Lane System Plan Georgia Department of Transportation, Office of Planning
A-14
Study Name Description of Alternatives Pricing Strategy Access Design
Toll Rate Revenue Projection Operational Benefits
Build 2 mandatory TOT lanes in Each Direction.
mile for horizon year 2030. Optimum toll rates on the I-575
corridor (NB direction) managed lanes in the PM Peak Period ranged from $0.25 to $0.44 in the 2015 horizon year and $0.35 to $0.44 in the 2030 horizon year.
SR 400 Value Pricing Study
Three scenarios generating 12 alternatives are being examined.
The pricing strategy varies by Time of Day. The value of time and willingness to pay also varies by the time period under consideration.
The different scenarios under consideration are evaluating the following access configurations: Four HOT entry/ exit ramp. HOT to HOV Interchange with I-
85. Five transition areas between
GP and HOT lanes along the corridor. The HOT access points and
interchanges are same as recommended in the GA 400 PPI proposal.
Under investigation Under investigation Under investigation
I-285 Strategic Implementation Plan
Nine initial scenarios have been evaluated using the new transportation model. The initial scenarios are
focused on operational improvements on I-285 including the addition of ATMS, collector and distributor roads along with interchange modifications, the construction of new interchanges, and provision of extra capacity along the study corridor such as: additional General Purpose lanes, High Occupancy Vehicle (HOV), Truck Only Lanes (TOL) and Bus Rapid Transit (BRT).
N/A Access to HOV/HOT lane facilities occurs at exclusive interchanges only. The access points were identified based on GDOT's HOV system plan. No intermediate access (e.g. through slip ramps) is provided. Access to truck only lane
facilities occurs only at system to system interchanges.
N/A for specific corridor. N/A System improvement scenarios will: o Improve travel speeds; o Reduce delay and delay
costs; o Reduce percentage of lane
miles greater than capacity; and,
o Increase percentage of trips with trip time equal to free flow travel time.
The evaluated scenarios were
ranked according to the above performance measures.
Reducing Congestion in Atlanta: A Bold New
Approach to Increasing Mobility
Under all conditions it was assumed that the priced lanes would be at ideal operational levels at the prescribed toll rates.
Taken from California experience for peak-period operations.
Per GDOT's HOV Lanes system Plan and ARC’s Mobility 2030 Plan.
$0.272 per lane-mile weighted average during the peak period (8 hours). Non peak period revenue was
assumed to be a fraction of the peak period revenue calculation form the California experience. For the N-S tunnel = $0.35 per lane-mile.
ETL Revenue: 2010=$89m; 2015=394m; 2020=$1,272m; 2030=$2,660m; 2040=$2,660. Net Present Value of 2008-2047
revenue stream = $17.016B. NPV of the cost of construction is $9.43B.
Eliminate LOS F conditions in 2030.