Embed Size (px)
Citation preview

OVERVIEW
Document of the World Bank
A SUSTAINABLE AND INCLUSIVE TRANSITION TO HIGH-INCOME STATUS
INTRODUCTION
Lessons from Poland, Insights for Poland:A SUSTAINABLE AND INCLUSIVE TRANSITION TO HIGH INCOME STATUS
INTRODUCTION
Poland’s economic ascent is remarkable. After transitioning from communism, Poland’s per capita GDP growth was fast and stable averaging about 4 percent per year. The country moved from middle to high-income status in less than 15 years.The economy expanded rapidly: two-parts perspiration (investment) and one-part inspiration (innovation). And prosperity was shared. Jobs and income growth were broad-based, and lagging regions have been catching up. Throughout these changes, the income inequality coefficient—the Gini—did not increase. Poland has one of the lowest Gini coefficients among countries that have become high-income since 2000—the “new high-income countries” (HICs). It also has one of the lowest internal regional variations in GDP per capita.
How did Poland do this? After the “big bang” reforms of the transition from communism, Poland got the institutions right, namely the rule of law, property rights, democratic accountability, and basic market institutions1. It then used EU accession and membership to reinforce them. A widely-shared vision of a socially responsible market economy provided policy consistency and continuity. Sound macroeconomic policies provided stability and resilience. Poland was the only European country to record positive growth in 2008—the year of the global crisis—and completely avoid a banking sector crisis. Concurrently, the country successfully connected to global and regional markets, while ensuring competition at home—in this way, it got the prices right. Because of market competition, resources were reallocated more efficiently across sectors, between firms, and within firms, leading to efficiency gains. Labor productivity rose fast, as Poland reformed its education system, raising quality at one of the fastest rates in the OECD in the last decade and providing access across income groups and regions. Equally impressive, infrastructure improvements, supported by generous EU structural funds, were seen all across the country; the length of motorways has almost quadrupled since the transition.
This report discusses Poland’s experience along five dimensions. These five dimensions—a pentagon of policies and institutions—are governing, sustaining, connecting, growing, and including (Figure 1). The main lessons from Poland and the key insights for its future, based on this pentagon, are summarized in Box 1 and detailed in the remainder of this overview.
1 Institutions are defined as the organizations and rules that enforce and implement policies. Basic market institutions include rules with respect to price and product liberalization, entry and exit of firms, regulation, corporate governance, and international trade and foreign direct investment.
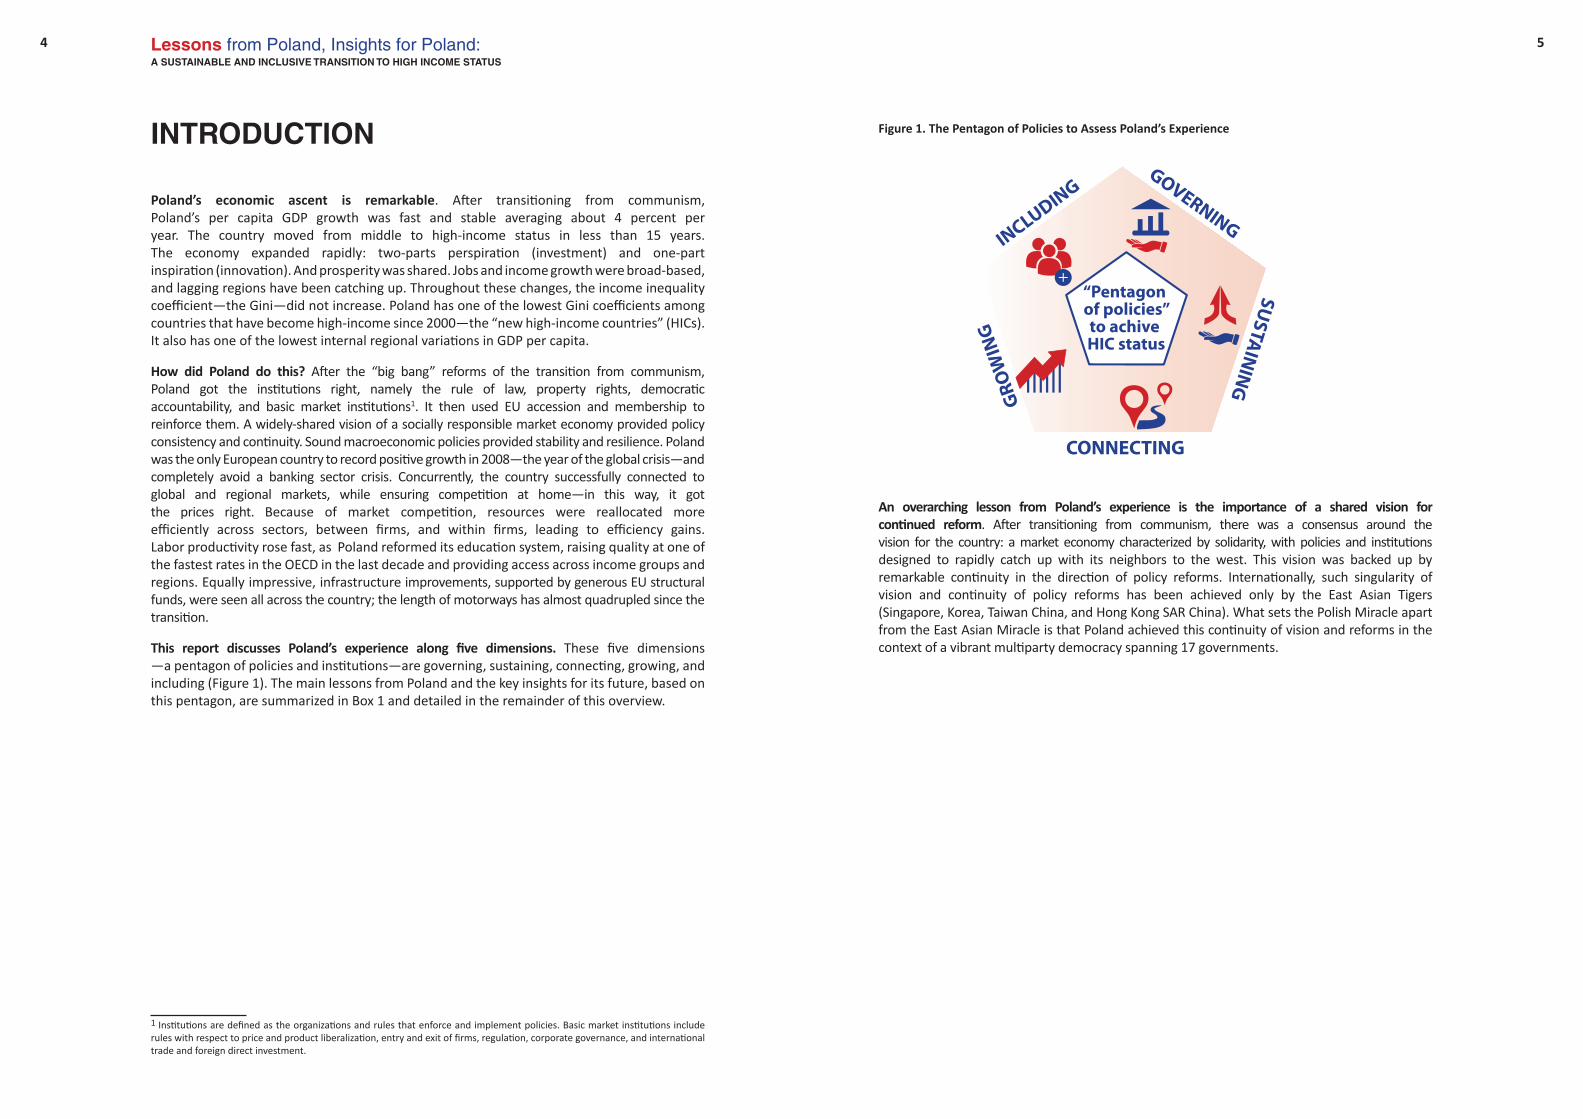
Figure 1. The Pentagon of Policies to Assess Poland’s Experience
An overarching lesson from Poland’s experience is the importance of a shared vision for continued reform. After transitioning from communism, there was a consensus around the vision for the country: a market economy characterized by solidarity, with policies and institutions designed to rapidly catch up with its neighbors to the west. This vision was backed up by remarkable continuity in the direction of policy reforms. Internationally, such singularity of vision and continuity of policy reforms has been achieved only by the East Asian Tigers (Singapore, Korea, Taiwan China, and Hong Kong SAR China). What sets the Polish Miracle apart from the East Asian Miracle is that Poland achieved this continuity of vision and reforms in the context of a vibrant multiparty democracy spanning 17 governments.
4 5

Lessons from Poland, Insights for Poland:A SUSTAINABLE AND INCLUSIVE TRANSITION TO HIGH INCOME STATUS
6 7
Box 1 Main lessons from Poland and key insights for Poland
LESSONS:Governing:
1. Get the institutions right—economic, but also political and guide reform with a shared vision. In Poland’s case, a shared policy vision of a market economy characterized by solidarity was accompanied by remarkable policy continuity, spanning 17 democratically elected governments since the transition.
2. Sequence reforms properly. For Poland, rapid liberalization was quickly followed by the creation of a support structure of basic democratic institutions at local and national level – so as to create political consensus for deeper economic institutional change, while using EU accession as an anchor.
Sustaining:
3. Ensure macroeconomic stability. Poland did this through a rules-based but flexible fiscal framework that limited deficit and debt, and a flexible exchange rate that was backed up by a credible inflation-targeting monetary policy.
4. Mind the financial sector. Poland’s effective restructuring, regulating and supervising of the financial sector ensured that banking crises were avoided.
Connecting:
5. Increase firm productivity and competitiveness. Poland did this through rapid, but sequenced, integration: cutting tariffs first to help markets “get the prices right”, then tackling the more complex soft infrastructure in advance of EU accession, and finally making the most of EU hard infrastructure funds to connect domestic and external markets.
6. Connect to markets. Poland did this through participating in global value chains (GVCs), linking it to global markets.
Growing:
7. Use markets well to reallocate resources as the country grows. Poland balanced factor accumulation – “perspiration” – and technological improvement – “inspiration” – by allowing market forces to continuously reallocate resources between sectors (structural transformation), within sectors (rewarding efficient and punishing inefficient firms) and within firms (adopting better management and new technology).
8. Invest in human capital. Poland did this with focused reforms and investments, resulting in large gains in educational performance.
Including:
9. Provide opportunity. Poland ensured broad-based access to quality education across income groups and regions.
10. Increase business opportunities, but also earnings. Poland’s competitive and open markets provided business opportunities for firms and jobs for workers, but this was also complemented with regular raises in the minimum wage.
INSIGHTS:Governing:
1. Invest in transparent and accountable governance. Sustaining prosperity requires making the public service more client oriented, less corrupt, more transparent and more efficient, including by involving citizens more directly in the policy making and public service delivery process.
2. Improve institutional resilience. Boosting the economy’s ability to innovate and sustain high growth needs strengthening the rule of law; regulatory quality; voice and accountability; and the capacity to design, implement and evaluate policies.
Sustaining:
3. Create fiscal space as a buffer to support counter-cyclical policies, to deal with aging and to sustain investment when EC structural funds decline.
4. Ramp up national savings by strengthening individual incentives to save, increasing the availability of saving instruments and developing local capital markets.
Connecting:
5. Move up the global value chain by improving the business environment for more sophisticated tasks and closing the hard infrastructure gap so as to base competitiveness on quality rather than cost.
6. Maximize the contribution of immigrants to the economy, offsetting the negative impact of aging by implementing programs such as formalizing immigration, reducing discrimination in the workplace, and improving the process for recognizing foreign credentials.
Growing:
7. Boost innovation through greater investment in research and development (R&D), cooperation between academia and the private sector, technological parks and clusters, new financial instruments, high-speed broadband, and a conducive environment for business online.
8. Support growth in services by removing barriers to competition and promoting technological diffusion through enhanced use of ICT.
Including:
9. Improve labor incomes by reducing segmentation of the labor market, better balancing job security and labor market flexibility, and supporting workers in their job transitions.
10. Strengthen the social compact by implementing a more progressive tax system, improved social assistance programs and providing quality education and health care to low-income groups.

Lessons from Poland, Insights for Poland:A SUSTAINABLE AND INCLUSIVE TRANSITION TO HIGH INCOME STATUS
Poland’s rapid economic ascent created new challenges: the creative destruction on which the growth process was based, successfully, caused massive social change. For instance, workers moved from farms to factories and then to offices, with a significant increase in temporary or “junk” contracts and relatively limited social assistance. Together with the automation trend and its adverse impact on low-skilled jobs, a significant segment of working-class families now faces heightened anxiety and uncertainty about their future.
In addition, there is frustration even among those favored by the economic trends. People’s aspirations and perceptions grow as welfare improves: catching up with established HICs, and in particular its western neighbors, is perceived to be frustratingly slow by many. This includes catching up on governance—the government needs to move faster on effectiveness and improve accountability to stakeholders and citizens1. And it does not help that, as in the rest of Europe, there has been a loss in confidence in the EU, a key support of the Polish social compact for reforms in the past.
Looking ahead, the Report provides several insights for Poland. First, better governing is needed to build more trust in government by making public services more client- oriented, less corrupt, more transparent, and more efficient, and involving citizens more directly in governing and public service delivery. Second, sustaining sound macroeconomic policies will now need to include creation of fiscal space to deal with the increasing pressures coming from population aging and the inevitable decline of EC structural funds for investment, as well as from a more uncertain global context in future. Third, connecting the country to allow citizens to continue reaping the benefits of trade and integration implies ramping up investments in the appropriate hard and soft infrastructure. At the same time, the stance on migration can be more inclusive. Fourth, continuing to grow robustly will mean moving Poland up the global value chain by focusing on the quality of products and services and supporting innovation in a more concerted way. Finally, better including all citizens means continuing to expand investment in quality education and health care for all; striking a better balance between job security and labor market flexibility; supporting workers between jobs, targeting social spending to aging and vulnerable parts of population; and increasing the progressivity of the tax system. Overall, Poland’s vibrant political institutions need to work on (re-)building a broad consensus on the vision and economic strategy for the country. The challenges just outlined need to be met, while ensuring the long-term policy continuity that has served it so well in the past.
The Report addresses two sets of questions. First, what are the lessons from Poland’s remarkable transition to high-income? What policies were behind Poland’s economic achievements? Why was Poland able to achieve high-income per capita so fast, while many other coun-tries remained in the upper-middle-income range for decades—“trapped middle-income countries (MICs)?” What policies were similar to those pursued by other new HICs and what were specific to Poland? And second, what are the insights for Poland going forward? Given international experience and Poland’s characteristics, what policies could it adopt to continue its ascent and reach the much higher income levels of countries that have been high income for a considerable period—“established HICs.”
The pages that follow try to answer these questions. They first discuss the methodology used to define benchmark country groups. They then discuss the reasons for Poland’s economic success and suggest policies for Poland to sustain rapid income growth in the coming years. A final section concludes.
1 Governance is the process through which state and non-state actors interact to design and implement policies, within a given set of formal and informal rules that shape, and are shaped by, power.
What Are Trapped MICs, New HICs, and Established HICs?
Three groups of countries constitute the universe considered here: Trapped MICs, new HICs,and established HICs. Trapped MICs are countries that have spent more than the average amount of time in the upper-middle-income range (Box 2). Identified here as trapped MICs are Algeria, Argentina, Brazil, Iran, Mexico, Romania, and Turkey. By contrast, the new HICs took less than 20 years in the upper-middle-income range. These are: Chile, Croatia, the Czech Republic, Hungary, Korea, Malaysia, Poland, the Slovak Republic, and Uruguay. Established HICs are countries that have maintained a growth rate above 2 percent since entering HIC status: Australia, Austria, Belgium, Germany, Finland, Hong Kong SAR China, Ireland, Israel, and Singapore. The idea of countries being stuck in a “middle-income trap” is derived from the observation that challenges change as a country develops and unless policies and institutions also change profoundly to adapt to the new challenges, economies grow below potential and incomes per capita stagnate.
Box 2. The Middle-Income Trap
The World Development Report 2012 showed that only 13 of 101 middle-income economies in 1960 had graduated to high income by 2008, leading to the use of the term “middle income trap” and to an extensive literature on the topic. But some authors like Bulman, Eden and Nguyen (2014) question the existence of such a trap, arguing that countries experience slowdown in growth at different per capita income levels. However in a recent review of the literature, Gill and Kharas (2015:10–11) concluded that:
“a “trap” is characterized by a context where growth is below potential. Such traps can exist at all income levels, from low to upper income, but may well be different in nature at different income levels. If the purpose of defining a middle-income trap is to help policy makers in middle-income countries frame policy choices in the right way, then it is useful to describe those choices that are particularly pertinent to middle-income countries.”
In such a spirit, this report attempts to learn more about the policies that helped new HICs gradu-ate from upper MIC to HIC. It does so by benchmarking Poland’s experience with that of other countries that made a smooth transition to the HIC group (the “new” HICs) and comparing it with that of those countries that remained upper MIC for more than two decades (“trapped” MICs).
Several methodologies are employed to determine if a country crosses the trap threshold over time. The World Bank’s Atlas methodology ranks countries according to their GNI per capita in current dollars and based on thresholds set in 1987 that are adjusted for inflation. Its shortcom-ing is the brevity of the time series and its sensitivity to exchange rate volatility. Felipe (2012) therefore uses GDP per capita at purchasing power parity (PPP) exchange rates (from Maddison 2010) to rank countries, and recalculates the income thresholds that best match those of the World Bank Atlas with a longer data series. This report employs both methodologies (although it uses the Maddison tables of the Conference Board updated to 2014 using 2011 PPP, rather than 1990 PPP, which provides results similar to using Felipe 2012 but not identical). It considers as high income any country that has reached that status according to the Atlas or the Felipe meth-odology. Trapped MICs are those that spent more than 20 years in the upper-middle-income range without reaching HIC status.
A few adjustments are made to these calculations. To limit the incidence of countries shifting back and forth between MIC and HIC status, a country is considered HIC only after it has remained at that level for three consecutive years. To limit the impact of idiosyncratic factors that may dispro-portionally affect outcomes in very small countries, only countries with populations exceeding 3 million in 2014 are considered. Finally, countries exceptionally well-endowed in natural resources (those with natural wealth in excess of $20,000 per capita in 2005 per World Bank 2011) are also excluded. These countries face special circumstances, and were extensively reviewed in the report “Diversified Development” by Van Eeghen et al. (2014).
8 9

Lessons from Poland, Insights for Poland:A SUSTAINABLE AND INCLUSIVE TRANSITION TO HIGH INCOME STATUS
Figure 2. GDP per capita in 2014 US$. New HICs and trapped MICs
Source: WDI, Groningen Growth and Development Centre.Note: T= period when the country crossed Upper MIC threshold for good.
0
5 000
10 000
15 000
20 000
25 000
30 000
35 000
40 000
T
T+5
T+10
T+15
T+20
T+25
T+30
T+35
T+40
T+45
T+50
T+55
Czech Republic
Hungary
Korea, Rep.
Poland
MexicoHI threshold
UMI threshold
Romania
10
Poland escaped the middle-income trap and entered the HIC group in the mid-2000s, after spending less than 15 years in the upper middle-income group. In the 1990s, GDP per capita levels in Poland were similar to those in the trapped MICs (Argentina, Mexico, Romania and Turkey), but they have since diverged sharply (Figure 2). By the 2000s, Poland had achieved per capita levels comparable to those of Hungary and just below those of the Czech Republic —both countries had been significantly richer than Poland in 1990.
LESSONS FROM POLAND’S PAST

Lessons from Poland, Insights for Poland:A SUSTAINABLE AND INCLUSIVE TRANSITION TO HIGH INCOME STATUS
LESSONS FROM POLAND’S PASTThis section outlines lessons from Poland’s rapid transition to high-income status. What can other countries learn from this experience? These policies are benchmarked against other new HICs to discern those unique to Poland. During the process of rapid economic change, challenges emerged that will be discussed in the section on insights for Poland’s future.
Governing
In pursuit of its vision of a socially responsible market economy, Poland quickly got its political and economic institutions right, through successful sequencing and external anchoring of its reform agenda. Poland first liberalized the economy with a ‘big bang’ economic reform. It then performed the political reform required to create consensus for the much deeper second phase of economic reforms. It did so by creating more inclusive political institutions through the democratization of national and local governments and creating the basic political institutions of good governance while using EU accession as an anchor. By many measures, Poland is now close to achieving levels of governance of the established HICs, and well above levels in trapped MICs (Figure 3).
Figure 3. Robust Political and Improving Economic Institutions
Poland’s economic ascent was driven by remarkable policy continuity inspired by a widely-shared vision. After the initial big bang reforms following transition, the creation of more inclusive political institutions and the EU accession made it possible to form a broad-based consensus among political leaders on a vision of a market economy with solidarity. This vision helped sustain the reforms through 17 governments. The continuity of Poland’s policy through the structural reform process (e.g., trade openness, competition) contrasts strongly with the policy reversals found in many trapped MICs (e.g., Argentina).
Poland successfully sequenced the transformation of its political and economic institu-tions, which now largely resemble those of other new HICs. After the initial big bang approach to starting up a market economy, Poland created a broad-based political consensus around the strategic vision for the country—a socially-responsible market economy based on solidarity between socioeconomic groups. This was achieved domestically by creating more inclusive political institutions through the democratization of both national and local governments. Poland put in place strong mechanisms for ensuring that different groups could effectively participate in the political process and stricter accountability of government operations. The economic institu-tional transformation included establishing market-based competition for goods and services, free movement of labor and capital, protection of property rights, sound economic regulation to foster market-based competition, prudent banking and financial sector regulation, constitution-ally binding fiscal rules, and adequate bureaucratic capacity and accountability at national and local levels to implement these policies and deliver basic public services.
Anchoring the reforms mattered. Poland was able to galvanize political support for the reform of institutions around a common goal: accession to the EU. Poland adopted the EU’s acquis communautaire—the EU’s policy package—wholesale, and it quickly became the largest recipient of EU structural funds. Poland and the other new HICs in the EU (Czech Republic, Hungary, and Slovakia) were all successful at using EU accession as an external anchor for institutional reforms. This was perhaps because of their shared history with European neighbors to the west, which facilitated relatively rapid and fundamental reform: there was a relatively recent institutional memory of the political and economic institutions common to the earlier EU members.
This “pincer” movement of sequencing and anchoring proved highly effective. It started with rapid liberalization, followed by creation of the basic political institutions of good governance to create political consensus for deeper economic institutional change, while externally anchoring the reform agenda to EU accession. Together the democratization of local institutions, which avoided elite capture, and the commitment to EU institutions, which helped push reforms through, exerted complementary pressure on institutional reform and acted as a perfect pincer movement. It was this pincer movement between the sequencing of domestic reforms and the external anchoring that provided the basis for the sustained commitment, coordination, and cooperation necessary to implement a wide-ranging policy reform agenda and create a successful market economy (see also Campos et al. 2014). This sequencing and anchoring sets Poland apart from several other economic success stories, which opened up their economies before creating more open and inclusive political institutions.
Poland inherited a relatively well-functioning bureaucracy, which it did not dismantle but gradually transformed. Once its political independence was established, the national bureaucracy proved to be more capable than originally anticipated. It was gradually reformed to increase transparency and accountability. Poland’s national bureaucracy developed into an effective public management system, absorbing large EU funds efficiently. It implemented a huge privatization program and created an investor-friendly regulatory environment, exemplified by Poland’s quick ascent into the category of globally recognized good business environments. The government taxed public enterprises heavily if they exceeded spending targets, created several institutions to oversee administration and provide essential checks and balances, and nurtured a stable and qualified human resource base, while offering generous pension benefits to older civil servants. The stellar performance of the public management system
12 13
Source: World Government Indicators, World Justice Project, EIU Democracy Index.
Source: World Government Indicators, WorldJustice Project, Doing Business 2016.

Lessons from Poland, Insights for Poland:A SUSTAINABLE AND INCLUSIVE TRANSITION TO HIGH INCOME STATUS
14 15
ensured sound fiscal management (revenue collection and spending controls) and effective development planning, with well-developed capacities for both strategic planning and compliance.
Increased bureaucratic accountability enabled successful tax reform. Poland undertook fundamental tax reforms, shifting tax collection away from production and large public enterprises toward consumption, workers, and small businesses. This created substantial and sustainable fiscal space. That the government was able to do so is testimony to the legitimacy citizens accorded it. Without reforms to political institutions, this would have been difficult to achieve. The fiscal space created made it possible for Poland to successfully weather major global crises in 1998 and 2008.
Local governments were subject to increased political accountability. Together with steady resource flows, combined with additional local revenues, they became effective in service delivery. The restoration of democratic, autonomous local and regional authorities played a prominent role in Poland’s improved governance. Decentralization in Poland was implemented in two stages, in 1990 and 1999. The early reforms transferred decision-making authority to elected municipal governments and passed down central government tasks and some revenue-raising authority. The second round of administrative reform reduced the number of provinces, restored counties, and decentralized public programs and services to these two levels aimed to increase citizen involvement and improve public service delivery.
Strong and accountable local governments improved service delivery. Local governments were strong in promoting education, health, and public investment. Most local governments perform equally well, unlike their counterparts in some other EU countries. Local governments successfully implemented centrally-designed policies in education, health and public investment. And they absorbed large amounts of EU funds for investment, further supporting regional growth. In addition, subnational governments were able to increase local revenues, legitimized by greater local political accountability. This also helped to smooth the impact of the economic downturn, unlike in some other EU countries that responded to the economic crisis by making ad hoc cuts in intergovernmental transfers. In Poland, the government continued to fully fund local government mandates and made no drastic ad hoc changes to the system of local financing, thus helping local governments to sustain vital services.
Sustaining
A sustained, stable growth pattern drove Poland’s effective macroeconomic policies. Poland and the other new HICs had more stable macroeconomic environments than the trapped MICs. During their upper-middle-income period, the annual average rate of GDP growth of the new HICs exceeded that of the trapped MICs by just above 1 percentage point, and for the new HICs growth volatility, measured by the average standard deviation of GDP growth, was more than 1 percentage point lower than for the trapped MICs (Figure 5).
Three main macroeconomic policies stand out: first, Poland had a rules-based, but flexible, fiscal framework that sustainably managed the public sector deficits and debts of central and local governments. With this framework, like other new HICs, it had substantial success in implementing countercyclical fiscal policies during crises. Both discretionary actions and automatic stabilizers played a role. The process was assisted by measures authorized before – but taking effect during – the economic downturn in the form of discretionary tax reductions and increases in public investment. Countercyclical policies at the central level were further assisted by a significant shift in the overall fiscal balance of local governments, which swung from a balanced budget in 2007 to a deficit of 1.2 percent of GDP in 2010, the largest shift in local government balances of all EU countries.
Second, sound monetary and exchange rate policies were implemented by a strong, independent, but accountable Central Bank that successfully resisted attempts to encroach on its autonomy. The Central Bank’s credible, transparent, and flexible inflation targeting system reduced inflation during the early 2000s and has maintained price stability since then. Inflation was on average slightly above 2 percent, significantly below the 4 percent average for the new HICs and substantially below the almost 10 percent average among trapped MICs (Figure 5). The inflation targeting regime was not excessively narrow or focused solely on short-term inflation; it provided for flexibility to consider the broader impact of monetary policy on the real economy and the financial system (the latter was particularly important after the crisis). Monetary policy worked in tandem with, rather than against, fiscal policy, using expansionary measures when needed, without damaging long-term credibility. Backed by this effective monetary policy, Poland allowed real exchange rate changes to help buffer the impact of external shocks and avoid the overvaluation that affected some other EU member states.
Figure 4. High GDP Growth and Low Volatility Support Graduation to High-Income Status
Source: World Bank.Note: The time period used for each country refers to the specific time during which the country was an upper-MIC.

Lessons from Poland, Insights for Poland:A SUSTAINABLE AND INCLUSIVE TRANSITION TO HIGH INCOME STATUS
Figure 5. Inflation, New HICs and Trapped MICs, 2000–14, Percent
Third, effective restructuring, regulation, and supervision ensured the stability of Poland’s financial system, which compares well with the other new HICs and established HICs. Poland’s sound banking sector was grounded in a privatization policy of “no bailouts” that made banks accountable for their bad debts and on opening the sector to foreign banks, which built capacity and diversified the investor base. Competent and strict supervision was applied to ensure bank solvency and contain excessive credit expansion. As a result, the banking sector has been sound, competitive, well-capitalized, liquid, and properly managed and supervised. Consequently, unlike many HICs new and established, Poland did not experience a surge in credit in the run-up to the global financial crisis. Its approach to bank restructuring during the transition, which involved forcing banks to manage their own bad debts and inviting in foreign partners with capital and banking expertise, created a competitive banking system with low concentration and a geographically diversified investor base, while the foreign banks ensured informed decision-making by employing local managers. The presence of strategic investors, rather than ownership by numerous shareholders, facilitated negotiations with owners about corrective actions, while the dominant role of foreign investors reduced the risks of regulatory capture and pressures for supervisory forbearance.
Connecting
Like other new HICs, and unlike the trapped MICs, Poland’s greater openness to trade enabled it to reap larger productivity gains and deliver higher economic growth. Poland experienced remarkable trade integration: the share in its GDP of trade went from 61 percent in 2000 (far below the trapped MIC average), to 94 percent in 2014, the average for the new HICs. Poland also scores high in the Open Markets Index, which captures market access and barriers to entry. Greater openness promoted competition and improved technological awareness, leading to increased firm productivity.
More openness enhanced the performance of Poland’s exports along three main dimensions—export growth, market and product diversification, and product quality. More trade opportunities, stronger import competition, and declining regulatory barriers to firm entry and exit enabled more productive firms to grow while hastening the exit
from the market of less productive firms—a pattern common when trade is liberalized (Aghion and Bircan 2017). Export growth was impressive, peaking at 40 percent in 2004 and remaining well above global and EU averages for the decade to 2015. Exports also achieved substantial market and product diversification, on a par with high-income peers. During this period, Polish exporters gained market shares in all top 10 destinations, and in relatively sophisticated products. As in many other countries, Polish exports were highly concentrated in a hand-ful of “superstars” that accounted for about 70 percent of exports in 2013. However, the contribution of big firms to export growth has fallen from about 80 percent in 2006 to 52 percent in 2013, indicating that gains from openness to trade accrued not only to the large and powerful but also to smaller firms. Exported products also achieved higher quality, converging with that of more mature EU members, like Spain.
Sequencing also helped reforms to have some immediate impacts as integration gathered momentum. Integration of Poland’s trade with the rest of the world started with an impressive reduction of tariffs in the early 1990s. This brought most-favored-nation tariff rates down to the EU average even before accession in 2004, helping markets get the prices right and opening up access to the large Western European market and its advanced technology. From then on, the focus was on the more difficult reforms of soft infrastructure (behind-the-border reforms) and then hard infrastructure to heighten the competitiveness of Polish exports not only in the EU but also in the rest of the world. This effort was remarkably successful.
Trade openness facilitated greater participation of Poland and other new HICs than trapped MICs in global value chains (GVCs), which in turn enhanced integration and brought the new HICs significant economic benefits. GVC participation helped improve the performance of Polish firms through three channels: First, it provided access to quality inputs, capital goods, and technological transfers. Second, it increased competition, strengthening the incentives for firms to improve. Lastly, it provided new opportunities for innovation in processes and products through exchange of information and knowledge, which allowed firms to learn what others were doing, how they were doing it, and the advantages and disadvantages of particular activities. With such information, firms leveraged comparative advantages to meet the competition by adapting current or adopting new processes, functions, and products. GVC participation also made it easier for firms to increase the sophistication of their production because they no longer needed to master all the stages in production of given goods, focusing instead on tasks in which they had comparative advantage.
The “neighborhood effect” of bordering Germany—an economic powerhouse and one of the world’s three GVC nodes—helped Poland firmly integrate into the internationally competitive German production networks. As in other Central and Eastern European countries (Georgiev et al. 2017), GVCs boosted total factor productivity and economic growth in Poland. Deeper economic integration with Germany was an important driver of the recent firm dynamics observed in Poland. In fact, following EU accession, total factor productivity and employment grew relatively faster among firms operating in sectors where Germany had greater industrial capacity and outsourcing potential.
Connecting to global and regional markets was also made easier through the substantial improvements in infrastructure, both soft and hard. First, Poland recorded major gains in soft infrastructure—border and transport efficiency—before EU accession. It then made steady gains in hard infrastructure—transport and information and communications technology (ICT)—largely funded by the EU. These improvements helped Poland to surpass the hard infrastructure levels of trapped MICs and narrow the gap with new HICs. The significant infrastructure improvements also helped link Poland’s peripheral areas to domestic as well as external markets.
16 17
Source: World Bank.

Lessons from Poland, Insights for Poland:A SUSTAINABLE AND INCLUSIVE TRANSITION TO HIGH INCOME STATUS
Poland also connected to global markets through migration. The magnitude of labor migration has been substantial: Poland experienced much higher emigration of workers than other new HICs and EU accession countries, with the exception of Romania. The emigration of workers increased following EU accession, and by 2014, the number of Poles residing abroad exceeded 6 percent of the population.
Until now, migration has not led to labor market shortages. In the early phases after the transition, migration helped to reduce what was then a labor surplus. The migration avoided the hysteresis that persistent high levels of unemployment could have brought about. This is similar to the role migration played in Southern European countries after World War II. The migrants were mainly young and educated workers, particularly post-accession. The downside was a brain drain, largely concentrated in certain regions, with a consequent negative impact on local economies.
More recently, the emergence of labor shortages was curtailed by the global financial crisis. The direct brain gain, if any, has been small because few migrants have returned. However, the prospective benefit of emigration has given families strong incentives to invest in education and skills improvement, which in turn has made the Polish economy more attractive for foreign and domestic investment in modernizing sectors. The development of these sectors is key, given that migrants working abroad often find themselves often in jobs for which they are overeducated.
Growing
Poland, like other new HICs, grew thanks not only to perspiration, but also inspiration. This sets them apart from the trapped MICs. Poland’s process of capital accumulation and technological and institutional growth also differs from that of the Asian Tigers. Their rapid growth and structural transformation was built on several decades of perspiration in the form of factor accumulation: massive investments in human and physical capital at rates rarely seen in history and improvements in infrastructure. For Poland, perspiration (factor accumulation) accounted for two-thirds of GDP growth in 2000–14. Inspiration, as measured by improvements in total factor productivity, accounted for the other one-third (Figure 6). The policies implemented since the transition created solid incentives for firms to invest and innovate. Many firms rapidly adopted new technology as foreign direct investment expanded.
Figure 6. Total Factor Productivity and Growth in the New HICs, 2000–14
Poland’s productivity growth was driven by market forces through three channels: productivity-enhancing reallocation of resources between sectors (structural transformation), within sectors (between firms), and within firms. These gains resulted from both increasingly better allocation of resources from the less to most productive sectors, as well as reallocation of resources from low to high-productivity firms as the former left the market. And as manufacturing pulled labor from agriculture, the latter responded by increasing its labor productivity.
One-fourth of Poland’s growth in manufacturing productivity during 2000–14 is explained by structural transformation. This process led to more efficient reallocation of resources between sectors. Labor moved from low productivity agriculture to higher productivity services, such as retail and wholesale trade, transport, and professional services. Manufacturing slightly contracted in Poland and other new HICs (except for Slovakia) but remains a larger sector than in trapped MICs. These trends are the hallmark of a successful transformation from agriculture to manufacturing.
The remaining three-fourths of Poland’s growth in manufacturing productivity is explained by efficient reallocation of resources within sectors. This refers to reallocation of resources between firms within the same sector as inefficient firms shrink and efficient firms expand (“creative destruction”; see Figure 7).
18 19
Source: World Bank.

Lessons from Poland, Insights for Poland:A SUSTAINABLE AND INCLUSIVE TRANSITION TO HIGH INCOME STATUS
Figure 7. Growth in Manufacturing TFP in Poland, Within and Between Firms, 1997–2013, Percent
Finally, productivity also improved within Polish firms as they reorganized, expanded, and upgraded management. These gains were reaped not only by foreign firms but also by domestic firms independent of their size. In contrast to trapped MICs, the productivity gains were supported by expansion of efficient small firms into larger firms, not just expansion of large firms.
Economic growth was also spurred by an impressive accumulation of physical and human capital responding to market needs. While the emphasis on physical capital accumulation as the main driver of growth is similar for both the new and trapped MICs, its composition is different. Poland and the new HICs give more weight to ICT capital investment to facilitate technological upgrading. Capital accumulation took place as a result of the integration of capital markets and EU structural funds, and education reforms supplied the higher skills needed as production processes grew more complex. Test scores for the Program for International Student Assessment (PISA) show that Poland’s increase in the quality of its education was one of the fastest among Organization for Economic Co-operation and Development (OECD) countries in the last decade. This provided workers with an improved set of skills to move from farms to factories. The rise in the supply of graduates and skilled labor was in line with the demands of the market as it grew in size and complexity: returns to education at secondary and tertiary levels were stable over time. As in other new HICs, in Poland the growing market economy saw a steady increase of employment in higher-skilled, nonroutine cognitive activities, matching the increasingly sophisticated market structure of the economy (Figure 8). The decline in middle-skilled occupations reflects the growing use of ICT to substitute for workers in these categories (e.g., automation of back office functions).
Figure 8. Share of High-Skilled Employment, New and Trapped HICs, 1995-2012
Including
Poland’s pattern of economic growth was inclusive: Prosperity was shared. This helped ease the social strains associated with the dramatic restructuring of the economy over the past two decades. The particular pattern of growth achieved increased jobs and wages across the board, reduced poverty, and kept inequality minimal. Between 2005 and 2014, Poland’s Gini coefficient fell from 0.351 to 0.343 and other indicators of poverty also declined significantly (Figure 9). An increase in the minimum wage relative to the median wage also contributed to reducing poverty.
20 21
Source: Polish CSO (Central Statistical Office) data.
Source: World Development Report 2016. Notes: Annual average change in employment between circa 1995 and circa 2012.

Lessons from Poland, Insights for Poland:A SUSTAINABLE AND INCLUSIVE TRANSITION TO HIGH INCOME STATUS
Inequality in incomes and wealth was kept in check. Poland follows a pattern common to the other new HICs: they typically have less income inequality than the trapped MICs (Figure 10). Poland has significantly smaller wealth inequalities than many European established and new HICs, as evidenced by a lower Gini coefficient for net wealth (0.58 vs. 0.76 in Germany and 0.73 in Hungary). Although wealth inequality is more pronounced than income inequality (the Gini coefficient for net income is 0.38), the difference is no higher than in other HICs (NBP 2014).
Figure 10. Income Inequality, New and Trapped MICs (Gini coefficient in 2000 and 2014)
Competitive markets, equality of opportunity, and effective public service delivery were the main factors that supported the sharing of prosperity to all citizens. Competitive and well-regulated markets for labor, capital, products, and services provided business opportunities for firms and jobs for workers. Increases in access to education (especially the proportion of workers with tertiary education) and education quality led to across-the-board gains in educational outcomes, raising labor productivity. In both education and health care, access to improved services was provided to all, without significant regional differences.
The markets rewarded increased labor productivity with higher salaries across the distribution. This, together with increased labor force participation (including by older workers due to retirement reforms) and increases in the minimum wage, raised labor incomes, which helped reduce poverty and keep inequality at bay. At the lower end of the market, a national minimum wage policy regularly and significantly has pushed up the minimum wage in the last decade to enable low wage earners to share in the productivity gains. Between 2005 and 2014, labor incomes went up in real terms for all groups, but the real minimum wage grew nearly twice as fast as the average wage.
The key factor that helped avoid increases in inequality was improved access to education across income groups and regions. Education policies created broad-based equality of opportunity. This is a pattern common to the new HICs. It can be seen, for instance, in the smaller differences in educational attainment between regions within countries, as for Poland (Figure 11). Effective policies included extending the length of general education, implementing a national system of examinations and tests, substantial increases in teacher salaries, and relatively high levels of overall public spending on education. As a result, among all OECD countries Poland has one of the largest shares of attainment of at least upper secondary education by 25–34-year-olds. The proportion of Polish 25–34-year-olds who have acquired tertiary education also increased sharply between 2000 and 2014, from 14 to 43 percent, compared to the OECD average of 41 percent in 2014. Performance in reading, mathematics, and science, as measured by the PISA, is above the OECD average (OECD 2016). Importantly, the PISA scores on, for instance, mathematics show improvements across all income groups. Improved access to education accounted for 84 percent of the reduction in poverty over 2005–14.
Figure 11. Equality of Access to Education by Region, New HICs and Trapped MICs: Share of Workers with at Least Secondary Education, 2014, Percent
Source: OECD Regions at a Glance 2016.
22 23
Source: World Bank.
Figure 9. Poverty in Poland, 2005–14
Source: World Bank estimates using PHBS (population weights recalibrated using Myck and Najsztub 2015).

Lessons from Poland, Insights for Poland:A SUSTAINABLE AND INCLUSIVE TRANSITION TO HIGH INCOME STATUS
Economic growth also reached all Polish regions, supported by redistributive external (EU) transfers. During the past decade, some of Poland’s lagging regions grew above the country average (5 percent in nominal terms) and some of the richer regions grew below the country average (Figure 12). As a result, Polish regional income disparities are actually smaller than in most other new HICs, and on par with Germany or Finland (Figure 13). Regional inclusion was supported by providing lagging regions with larger capital transfers (mainly EU structural funds and agriculture direct payments). For instance, for 2004– 13, the lagging regions of East-ern Poland received on average annual EU-related payments exceeding 2.5 percent of GDP, significantly higher than the 1.7 percent average for Poland as a whole. Nevertheless, significant regional differences remain; on average GDP per capita is about 30 percent higher in regions bordering Germany in the west than in regions bordering Belarus and Ukraine in the east.
Figure 12. Regional GDP: Average Annual Nominal GDP Growth, 2005–14
Figure 13. Regional Income Disparities: GDP per Capita as a Percent of the National Average, 2013
Regional equalization mechanisms introduced in the 2000s, contributed to the inclusive educational and health outcomes. Poorer regions have the highest enrollment rates in both urban and rural areas. Competence test results in primary and secondary schools are also not related to a region’s development, and regions with low GDP per capita have lower ratios of primary and secondary students per teacher. And while the density of the number of physicians1 was below other HICs, these resources were much more equally distributed. This pattern changes only for the availability of hospital beds.
1 The number of physicians includes general practitioners and specialists actively practicing medicine during the year in both public and private institutions. Density of physicians is defined as the number of active physicians per every 1,000 people
24 25
Source: GUS.
Source: OECD Regions at a Glance, 2016.

INSIGHTS FOR POLAND

Lessons from Poland, Insights for Poland:A SUSTAINABLE AND INCLUSIVE TRANSITION TO HIGH INCOME STATUS
INSIGHTS FOR POLAND
Like the rest of the world, Poland now faces a different global context. It is one of lower growth and greater uncertainty. Manufacturing is less labor intensive than before. The fourth industrial revolution, characterized by the automation of production processes, is causing the loss of significant numbers of medium-skilled workers in the developed world.
Poland’s growth challenge is not unique. Sources of growth that delivered major increases in prosperity in Poland now have less scope to bring about further large improvements in incomes. Many countries that reached high-income status have experienced relatively slow growth since. From the 1960s to the 1990s, only 10 countries entered the HIC club and had average annual GDP per capita growth close to or above 2 percent (Figure 14).
Figure 14. Achievement of High-Income Status and Average GDP Growth, 1965–95
The key external anchor of Poland’s reforms—the EU—has weakened. Accession and commitment to the EU’s acquis communautaire was a key factor driving the vision and consistency of the reforms which propelled Poland into high income status. However, this anchor now faces challenges of its own:
Despite this [progress], many Europeans consider the Union as either too distant or too interfering in their day-to-day lives. Others question its added-value and ask how Europe improves their standard of living. And for too many, the EU fell short of their expectations as it struggled with its worst financial, economic and social crisis in post-war history (European Commission 2017:6).
Against this backdrop, Poland is facing substantial challenges of its own. As incomes rise, so do people’s aspirations, with economic convergence with advanced neighbors not tak-ing place as fast as desired. Demands for better governance are growing sharply due to perceptions of widespread corruption in government and poor functioning of the judicial system. Poland’s workforce is aging. Wages have been growing relatively slowly despite
persistent economic growth. Job insecurity has increased since the global crisis, with Poland having the highest share in Europe of temporary jobs, so-called “junk” contracts. And throughout a period of profound economic change, overall social assistance has been low and mostly limited to poverty-targeted programs.
Governing
To make growth more inclusive and meet the new aspirations, a new political consensus around vision and institutions needs to be forged. Poland needs to continue working on fostering more inclusive political and economic institutions to maintain the political consensus that has served it so well in the past. Central to that vision is better governance towards inclusive, transparent and client-oriented institutions. Citizens’ trust in government needs to improve by making public service more client-oriented, less corrupt, more transparent, and more efficient, and by involving citizens more directly in governing and the delivery of public services.
Strengthening governance also boosts the economy’s ability to innovate and continue the rapid growth in incomes. As economies enter the high-income group, weakness in economic institutions such as the rule of law, property rights, and the quality of governance become increasingly important to sustain convergence (Plekanov 2017). Poland’s ratings on governance are approximately equal to the average of the new HICs, but well below that of established HICs (Figure 3). Addressing gaps in governance matters, because the incentives of firms to innovate are positively correlated with institutional variables such as the rule of law and democracy (Nguyen and Jaramillo 2016). Cross-country evidence shows that the correlation between democracy and innovation and growth becomes more positive and significant as economies reach the technological frontier (Aghion et al. 2014).
Priority governance reforms include enhancing the rule of law, with a focus on the judiciary; strengthening regulatory quality by increasing competitiveness and innovation; enhancing voice and accountability; and improved government capacity to design, implement, and evaluate policies. Poland also trails more developed countries in the utilization of new public management processes and in the use of ICT to promote accountability and responsiveness. Further modernization of the administration will be needed to sustain growth as the economy becomes increasingly complex and knowledge-driven.
Poland’s political and economic institutions need to be rooted in a homegrown social and political consensus, if the policy consistency that has helped Poland so much in the past is to continue. Poland adopted the acquis communautaire speedily and wholesale based on its shared European institutional history. However, for some of these institutions, there may not have been sufficient time to allow changes in them to put down roots. Strengthening governance supports both the needed consensus building and growth—innovation thrives in a good governance environment.
AUSAUT
BELDEUFIN
HKG IRL
ISR
SGP TWN
NLD CAN
NZL ITAFRA GBR
JPN
GRC
ESP
PRT
0.0
0.5
1.0
1.5
2.0
2.5
3.0
3.5
4.0
4.5
1960 1965 1970 1975 1980 1985 1990 1995
Aver
age
GDP
betw
een
ente
ring
HICs
and
now
Year entering HIC group
28 29
Source: TED database.Note: Countries in orange experienced GDP growth of about 2 percent or higher.

Lessons from Poland, Insights for Poland:A SUSTAINABLE AND INCLUSIVE TRANSITION TO HIGH INCOME STATUS
Sustaining
Sustaining Poland’s record of high, stable growth will require adjustments to fiscal policy. Fiscal rules have contributed to fiscal stability but need strengthening. Increased flexibility in budgetary processes (for example, by reducing the number of expenditure items that are subject to automatic indexation), more rigorous review of spending proposals, and adoption of a medium-term expenditure framework could not only make fiscal policy more flexible but also strengthen control over public finances.
For their part, local governments need to mature into responsible partners of the central government in fiscal management, supported by local capacity-building not only in management but also in economic analysis. Central government should encourage greater local autonomy, for example by ensuring that local governments have greater control over their own revenues and allowing them to take a more flexible approach to the economic cycle. At the same time, local governments must face hard budget constraints to ensure discipline.
Government will need to create the fiscal space to deal with the increasing pressures coming from aging, the inevitable decline of EC structural funds for investment, and a more uncertain global context. Population aging presents a considerable challenge to productivity and fiscal sustainability in Poland. Its age-dependency ratio is projected to exceed almost all HICs, new and established, by 2050. Aging could reduce the average productivity of the workforce and place significant demands on social security transfers, potentially threatening the sustainability of the pension system and the provision of health care to the growing older generation. Lowering the retirement age when life expectancy is improving puts significant pressure on public finances and could exacerbate the threat of poverty for future pensioners, in particular women, whose retirement age was lower than men’s under the old system. It will thus be important for the government to manage the projected growth in publicly financed age-related spending. Creating fiscal space will also be important to continue financing investment as EU structural funds gradually fall, as well as to support countercyclical policies to address external shocks.
Ramping up domestic savings is particularly important to finance the large investment needs, sustain dynamic productivity growth, maintain income in an aging society and reduce vulnerability to external conditions. Consumption-led economic growth over the last two decades has increased convergence, but it is also a source of risk. From 2004 until the crisis hit in 2008, private consumption increased to more than 80 percent of GDP, significantly above the levels in other HICs, new and established (Figure 15). Private consumption growth was fuelled in part by rising incomes but also by strong and mostly foreign-financed credit growth. The contribution of investment to GDP growth was significantly lower than the contribution of consumption, although EU funds increased investment after Poland’s accession in 2004. The high level of domestic consumption, fuelled by borrowing and a high reliance on EU15 countries for exports and capital inflows, has created macroeconomic vulnerabilities that were exposed in the wake of the global financial crisis and the resulting economic slowdown.
Figure 15. Gross Saving Rates in Poland, Percent of GDP, 2000 and 2014.
Higher savings would enable Poland to reduce its vulnerability to interruptions in foreign financing, increase growth through more investment, improve the resilience of the financial system, and raise pension benefits. In addition to higher overall income levels, savings can be supported by raising household propensities to save and limiting government dis-saving. There is scope for the government to strengthen individual incentives to save (such as through private retirement savings) and increase the availability of saving instruments. Further development of a local currency capital market can also create a more stable domestic financial system that is less reliant on bank funding and supplies the instruments that savers need, directly or indirectly (World Bank 2014).
Connecting
Poland must now move up within the GVC by improving the business environment for more sophisticated tasks so as to base competitiveness on quality rather than cost. This challenge arises from increasing wages and an aging population, which together will undermine Poland’s comparative advantage based on low-cost labor, as is the case also for other new HICs. Focusing on other sources of comparative advantage, such as product quality and quality processing, will enable Poland to maintain competitiveness. However, when compared to other new HICs, Poland is a latecomer in implementing policies which would support such a move up the value chain. Such policies would focus on technology adoption, product standards, the business environment, and trade in services. These would help Poland to
0
5
10
15
20
25
30
35
40
45
50
ARG
BRA
MEX
ROU
TUR
CHL
CZE
HUN
KOR
MYS
POL
SVK
URY
AUS
AUT
BEL
DEU
FIN
HKG IRL
ISR
SGP
2000 2014
30 31
Source: WB, WDI.

Lessons from Poland, Insights for Poland:A SUSTAINABLE AND INCLUSIVE TRANSITION TO HIGH INCOME STATUS
heighten the sophistication of its products and be integrated more deeply into GVCs, especially upstream. Poland’s performance in these areas is currently closer to that of trapped MICs than to its peer group. Firm and worker preparedness to adopt new ICT technologies (e.g., cloud computing, 3D printing, and online buyer-seller platforms) would enable Polish firms to keep up with the latest developments in German parent firms. Facilitating the development of ICT services and ICT-enabled logistics and business services would support the entry of domestic firms into GVCs as indirect contributors to exports.
Closing the hard infrastructure gap is a critical element for sustaining Poland’s competitiveness. The quality of Poland’s transport and ICT infrastructure, as measured by the global competitiveness index, is far below the level of established HICs. The gap can be addressed by increasing the effectiveness of spending by rebalancing infrastructure spending toward construction of high-speed roads—the density of high-speed roads in Poland is lower than in other high-income EU countries—and greater investment in maintenance of rail infrastructure (Poland’s rail investment as a share of GDP is far below other HICs, new or established) and local roads (since 2012 the percentage of national roads in acceptable condition has plateaued at 60–65 percent). It will also be important to rebalance demand between different types of transport while continuing to improve services and investing in intelligent transport systems solutions and ICT infrastructure generally. The resources for a ramped-up infrastructure program could come in part from higher revenues from road (e-tolling) and rail transport infrastructure and by creating conditions to crowd-in private finance, for both maintaining and building infrastructure. Transport services could also be better organized and integrated, particularly in urban and surrounding metropolitan areas, with better links between transport modes and cooperation between different governments in organizing transport. More generally, a long-term approach to managing and financing transport and ICT infrastructure will help to improve spending efficiency, prepare for the likely phasing-out of EU financing, and reduce the general infrastructure gap.
Figure 16. Hard Infrastructure Indicator Averages, Poland and Established HICs
Transport Infrastructure ICTGlobal Competitiveness Index, Quality of Overall Infrastructure, 1-7 (best).
Global Competitiveness Index, 9th pillar: Technological Readiness, 1-7 (best).
Forward-looking migration policies could improve the contribution of immigrants to the economy, by bringing needed skills and innovative ideas, while compensating for Poland’s aging workforce. Poland will need both highly-skilled immigrants to meet the rapid demand for skills in the context of the emigration and aging of skilled workers, and low-skilled workers to fulfill basic jobs that may become unattractive as incomes and skill levels rise at the bottom of the income distribution. While the share of foreign-born workers in total employment is lower in Poland than in most HICs, new and established (Figure 17), temporary immigration is increasing. Policies that make the most of temporary migrants and encourage greater permanent immigration include implementing programs that would improve the productivity of immigrant workers, expanding opportunities for formal immigration, providing language training, incorporating immigrants into mainstream active labor management programs, removing barriers to their employment in the public sector, improving the process for recog-nizing foreign credentials, reducing discrimination in the workplace, and supporting immigrant start-ups. Problems unique to immigrants could be addressed by programs such as tailored approaches for disadvantaged youth with an immigrant background, linking child care with training of immigrant mothers, efforts to curtail illegal and unfair employment practices, improving workers’ rights, and opening selective channels into permanent employment and settlement.
Figure 17. Poland as a Migration Destination: Foreign-born in Total Employment, 2007, 2011, and 2014, Percent
Growing
Poland is close to exhausting its engine of growth and will need to move on to a new model of growth driven by innovation. While imitation of existing technologies has driven technology diffusion and productivity on the way to high income, sustaining Poland’s convergence requires cutting-edge technologies and frontier innovation. While Poland can still benefit from absorbing advanced technology to increase TFP, the scope for this will narrow as Poland moves closer to the technologically sophisticated countries. Further increases in TFP will need to be driven by investment in human capital, research and development (R&D), and innovation. But Poland is far below established HICs in international rankings of the
0
1
2
3
4
5
6
7
ARG
BRA
MEX
ROU
TUR
CHL
CZE
HUN
KOR
MYS
POL
SVK
URY
AUS
AUT
BEL
DEU
FIN
HKG IRL
ISR
SGP
2009-2010 2015-2016
32 33
2007 2011 2014
AUS
IRL
AUT
DEU
BEL
FIN
TUR
CZE
CHL
KOR
HUN
SVK
MEXPOL
05 10 15 20 25 30 05 05
Source: World Economic Forum and World Bank Doing business.
Source: OECD 2015.

Lessons from Poland, Insights for Poland:A SUSTAINABLE AND INCLUSIVE TRANSITION TO HIGH INCOME STATUS
policy framework to support innovation (Figure 18). The level of R&D public research and industries is low. And Poland, like Malaysia and Chile, still has a long way to go in terms of both protecting intellectual property rights (Figure 19) and ensuring the rule of law, both of which support engagement in innovation and the growth of innovative companies.
Figure 18. Ranking of Poland on International Innovation
Global Competitiveness Index, Innovation Pillar
Figure 19. Protection of Intellectual Property Rights in Poland
Intellectual Property Rights Index
Source: World Development Indicators, INSEAD, and the Global Competitiveness Report.
Source: International Property Rights index (IPRI).
As Poland reaches the technological frontier, international evidence suggests that ensuring ever more intense competition, openness to trade, emphasis on research education, and equity financing become ever more important. More intensive investment by the private and public sectors in enterprise R&D will be critical to further technology adoption and to frontier innovation, as will be modernization of the public innovation system to support cooperation between scientific institutions and the private sector. Another important step to encouraging innovation is to lower barriers to competition, trade, and investment. Here Poland made considerable progress between 1998 and 2013. Nevertheless, performance remains uneven. Poland is ranked by the World Bank’s Ease of Doing Business surveys below the EU average on half of the 10 areas surveyed, particularly in ease of starting a business. And with a financial sector still dominated by traditional banks, Poland will also need new financial instruments that are better-suited to the degree of risk inherent in innovation.
Trading services can further support growth, jobs and integration. This requires movement of people across borders, ease in establishing a local presence, and harmonious home–host regu-lations. Progress in Poland is mixed: travel and financial services have done well but other busi-ness services—especially those involving new technologies and the Internet—have not done so well. With better regulations, Poland’s trade in services could also increase significantly in size over the next decade and productivity in the general services sector would increase.
Supporting the development of the capital market would help open up access to equity financing for innovation. While bank finance is well adapted to the needs of imitative firms, equity financing (such as venture capital) is better suited to the needs of an innovative firm at the frontier (Aghion 2012). Poland’s financial system is heavily reliant on banking (Figure 20) and access to equity financing is more limited in Poland than in many HICs. Thus, there is a role for the Polish government to support the development of capital markets (bonds, equity, and insurance) by improving the regulatory framework, encouraging the growth of institutions such as rating agencies that are necessary for the market to function efficiently, providing services where private institutions are unwilling to participate (e.g., market-making) and taking steps to spur venture finance.
Figure 20. Structure of Poland’s Financial Sector, 2014 (bonds 2011)
It would be in Poland’s interest to narrow the gap in the use of ICT and ICT-enabled services, especially those based on the most innovative technologies. Important measures would be to strengthen the rules governing e-commerce and the use of data for consumer protection, privacy, competition, and copyright protection; invest in infrastructure to speed delivery and promote high-speed broadband; reduce the administrative burden of doing business online; and support new approaches for content distribution and cross-sectoral online platforms designed to heighten the transparency and availability of information.
Including
As Poland’s recent experience shows, there is still a challenging agenda with respect to inclusion, even in the context of general, broad-based improvements in welfare. Any increase in vertical or horizontal inequalities (in incomes and wealth, but also with respect to ownership, employment, or access to health and education) can foment dissatisfaction and make the social compact unstable. And while perceptions of the fairness of the economic system are rather high in Poland compared to the new HICs, continued improvements in the economic situation are likely to increase citizens’ attention to their relative position in the income and wealth distribution.
Poland’s rapid economic transformation has created a number of serious challenges. As noted, the absolute improvements in GDP per capita, incomes, and human capital were impressive. However, poor households and workers need to feel that they are sharing fairly in the rising prosperity and enhanced opportunities. In this regard, surveys that attempt to measure happiness show that the happiness of Poles has indeed been improving—but not commensurate with economic growth. In particular, in these surveys, people felt their lives improved rapidly in the early 2000s, but this was followed by a much slower rate of improvement from 2003 to 2015. And the poorest regions expressed the least happiness. Again, this did not change much between 2003 and 2013 (Figure 21).
0
1
2
3
4
5
6
7
ARG BR
AD
ZA IRN
MEX
RO
UTU
RC
HL
CZE
HU
NK
OR
MYS
POL
SVK
UR
YA
US
AU
TB
ELD
EU FIN
HK
GIR
LIS
RSG
PTW
N
34 35
Banks
0 30 60 90 120 150 0 30 60 90 120 150
ARGMEXTURBRACZEHUNPOLMYSFINDEUAUTISRBELIRLAUS
Source: Bank for International Settlements.
Lessons from Poland, Insights for Poland:A SUSTAINABLE AND INCLUSIVE TRANSITION TO HIGH INCOME STATUS
Figure 21. Happiness of People in Poland by Region, 2003 and 2013
Source: Social Diagnosis 2000, 2003, 2005, 2009, 2011, 2013, 2015.
Note: Poorer regions are in purple.
DSL (Dolnośląskie), KPM (Kujawsko-Pomorskie), LBL (Lubelskie), LBU (Lubuskie), LDZ (Łódzkie), MLP (Małopolskie), MAZ (Mazowieckie), OPO (Opolskie), PKR (podkarpackie), PDL (Podlaskie), POM (Pomorskie), OPO (Opolskie), PKR (Podkarpackie), PDL (Podlaskie), POM (Pomorskie), SLA (Śląskie), SWK (Świętokrzyskie), WMZ (Warmińsko-Mazurskie), WKP (Wielkopolskie), ZPM (Zachodniopomorskie)
Challenges in three areas deserve attention. Trends in these areas may have produced a sense of horizontal inequity and relative unhappiness. It may be that these relative, rather than absolute, deprivations are at the heart of the current political dynamics.
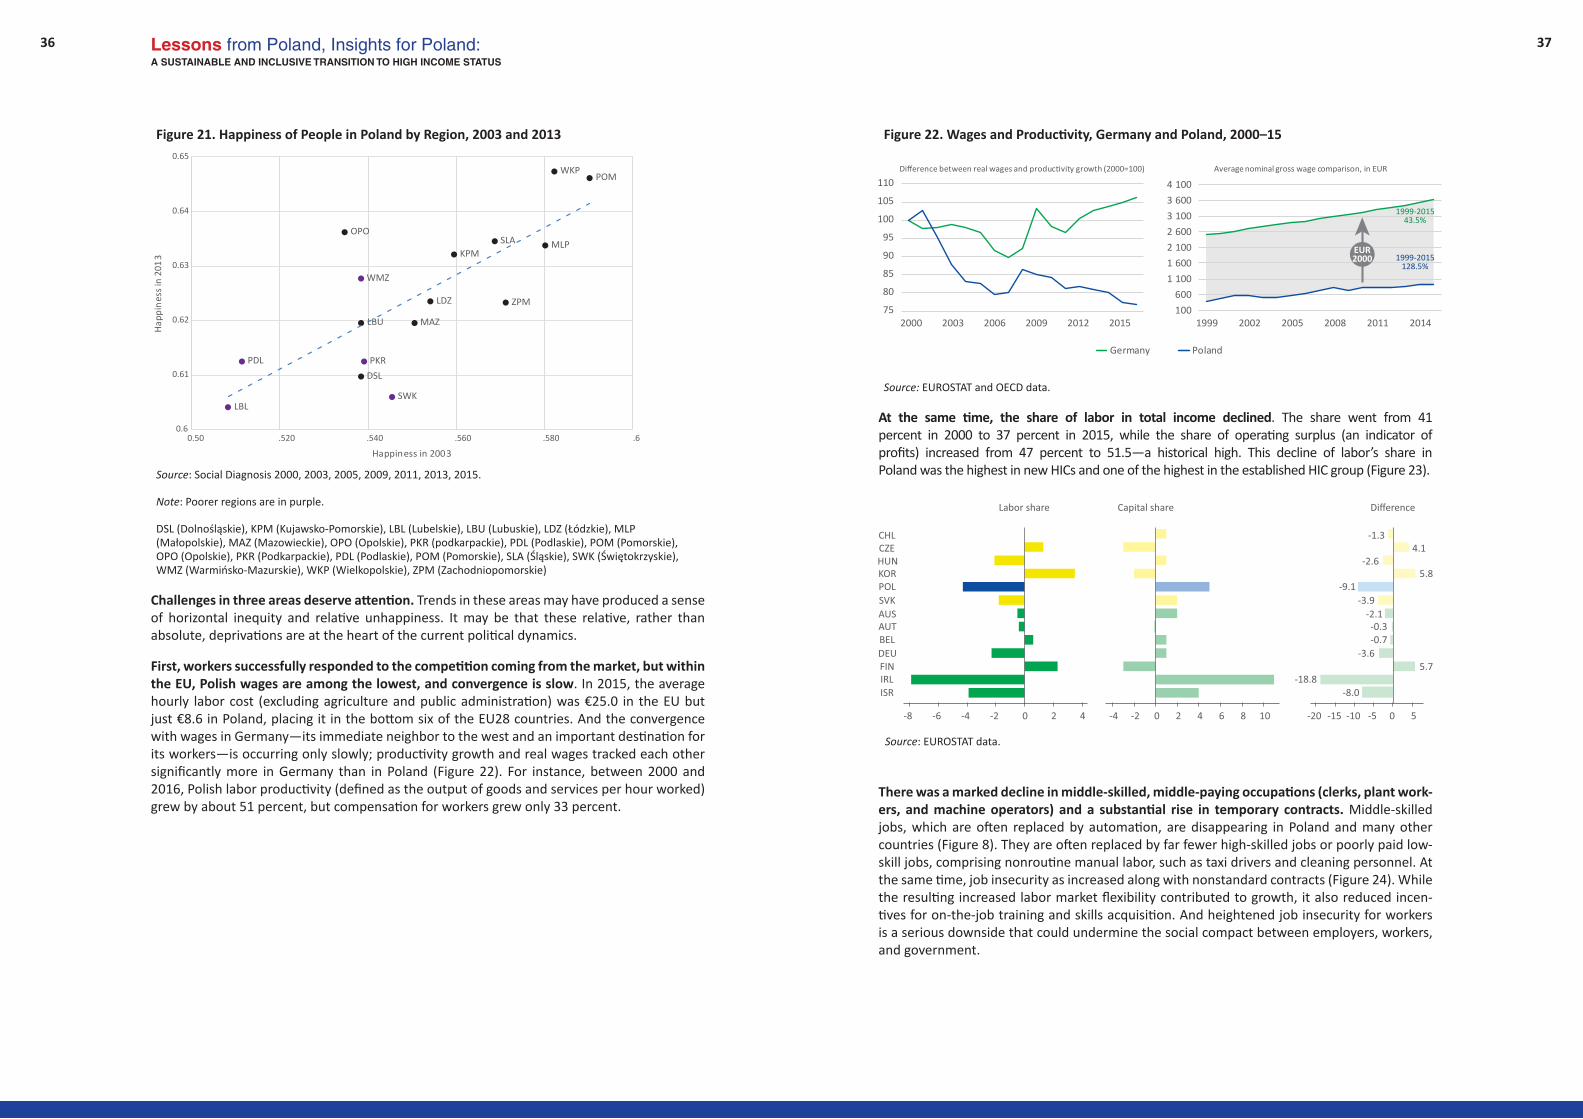
First, workers successfully responded to the competition coming from the market, but within the EU, Polish wages are among the lowest, and convergence is slow. In 2015, the average hourly labor cost (excluding agriculture and public administration) was €25.0 in the EU but just €8.6 in Poland, placing it in the bottom six of the EU28 countries. And the convergence with wages in Germany—its immediate neighbor to the west and an important destination for its workers—is occurring only slowly; productivity growth and real wages tracked each other significantly more in Germany than in Poland (Figure 22). For instance, between 2000 and 2016, Polish labor productivity (defined as the output of goods and services per hour worked) grew by about 51 percent, but compensation for workers grew only 33 percent.
Figure 22. Wages and Productivity, Germany and Poland, 2000–15
Source: EUROSTAT and OECD data.
At the same time, the share of labor in total income declined. The share went from 41 percent in 2000 to 37 percent in 2015, while the share of operating surplus (an indicator of profits) increased from 47 percent to 51.5—a historical high. This decline of labor’s share in Poland was the highest in new HICs and one of the highest in the established HIC group (Figure 23).
There was a marked decline in middle-skilled, middle-paying occupations (clerks, plant work-ers, and machine operators) and a substantial rise in temporary contracts. Middle-skilled jobs, which are often replaced by automation, are disappearing in Poland and many other countries (Figure 8). They are often replaced by far fewer high-skilled jobs or poorly paid low-skill jobs, comprising nonroutine manual labor, such as taxi drivers and cleaning personnel. At the same time, job insecurity as increased along with nonstandard contracts (Figure 24). While the resulting increased labor market flexibility contributed to growth, it also reduced incen-tives for on-the-job training and skills acquisition. And heightened job insecurity for workers is a serious downside that could undermine the social compact between employers, workers, and government.
DSL
KPM
LBL
LBU
LDZ
MLP
MAZ
OPO
PKRPDL
POM
SLA
SWK
WMZ
WKP
ZPM
0.6
0.61
0.62
0.63
0.64
0.65
0.50 .520 .540 .560 .580 .6
Happ
ines
s in
2013
Happiness in 2003
36 37
Germany Poland
75
80
85
90
95
100
105
110
2000 2003 2006 2009 2012 2015 100 600
1 100 1 600 2 100 2 600 3 100 3 600 4 100
1999 2002 2005 2008 2011 2014
Average nominal gross wage comparison, in EUR
1999-201543.5%
1999-2015128.5%
EUR2000
Source: EUROSTAT data.

Lessons from Poland, Insights for Poland:A SUSTAINABLE AND INCLUSIVE TRANSITION TO HIGH INCOME STATUS
Figure 24. Nonstandard Employment Contracts, 2002–14, Millions
Source: Lewandowski and Baran 2016, based on Eurostat and Ministry of Finance data.
First segmentation of the labor market can be reduced. This could be achieved by changes to tax and social contribution regimes, streamlining legal dismissal procedures, and limiting the cumulative duration of temporary contracts. Increasing and improving enforcement of labor standards can also reduce job segmentation. Changes to labor standards that assist workers and their families to achieve a better balance between work and family can also help. Togeth-er, these measures could contribute to creating a better link between wage and productivity growth.
Second, improving social assistance programs and ensuring access to quality health and edu-cation for low-income groups would also strengthen the social compact while increasing the productivity of the future workforce. Social assistance spending in Poland is much lower than in established HICs. For instance, putting in place a better-targeted social safety net would sup-port vulnerable groups such as the growing group of low-income pensioners.
In general, ensuring equal access to better health and preschool education services would consolidate and further expand the important gains Poland has made. Boosting the efficiency of spending on health constitutes part of the solution, since Poland spends considerably less on health services as a share of GDP than the established HICs. Another priority would be to channel more resources to preschool education (particularly for children under 2 years), where Poland has lower enrolment rates than the average for both new and established HICs. In ad-dition, many people report having an unmet need for a medical examination, with twice as many low-income earners reporting unmet needs than high-income earners. Moreover, the situation of low-income groups has been improving more slowly than that of high-income groups (Figure 25).
Figure 25. Unmet Needs for Medical Examinations, Selected HICs
Source: OECD.
Third, increasing the progressivity of the tax system would support shared prosperity. The redistributive effect of taxes and transfers in Poland is low compared to all other HICs (Figure 26).2
Figure 26. The Redistributive Impact of Direct Taxes and Transfers
2 This is true whether pensions are treated as deferred income (with corresponding contributions as savings) or whether they are treated as transfers (with the corresponding contributions as taxes).
38 39

Lessons from Poland, Insights for Poland:A SUSTAINABLE AND INCLUSIVE TRANSITION TO HIGH INCOME STATUS
ConclusionPoland has come a long way since the early 1990s. Governing its remarkable ascent were inclusive political and economic institutions built on consensus around the vision of a socially responsible market economy. Favorable conditions compared to many other socialist countries at the start of the transition, the quick dismantling of price controls and trade barriers, and a comprehensive privatization program created a rapid transition to a mar-ket economy. Subsequently, the creation of more inclusive political institutions enabled the emergence of a strong and broad-based consensus to build a market economy based on soli-darity and provided the consistency needed to pursue economic reforms in a focused and sus-tained fashion.
The result was an open economy, with trade oriented to the West, and improvements in the regulatory regime governing firm entry and exit, encouraging productivity improvements and facilitating the absorption of technology. Prudent fiscal policies, credible monetary policies geared to reducing inflation, and a sound and well-supervised banking system helped to maintain stability, assisted by countercyclical policies (rising fiscal deficits, reductions in interest rates and exchange rate depreciation) to sustain growth during the global financial crisis. This policy framework, which was strongly supported by the policy reforms surrounding EU accession and Poland’s access to GVCs through its ties to Germany, resulted in Poland’s rapid entry into the high-income country group after spending only a relatively short time as an upper-middle-income country.
Poland’s pattern of growth was inclusive—prosperity was shared. Growth increased jobs and wages across the board, reduced poverty, and kept inequality at low levels. Poland’s Gini coefficient actually fell slightly, and indicators of poverty declined significantly. Inclusive institutions, including the devotion of considerable resources to education and absolute in-creases in the minimum wage, were instrumental in creating this pattern.
However, Poland’s transformation is bringing new economic and demographic challenges. The creative destruction on which the growth process was based caused massive social change and, together with the automation trend, has caused a significant segment of working-class families to face heightened anxiety and uncertainty about their future. There is frustration even among those favored by the growth process as their aspirations of faster convergence with the advanced economies, in terms of governance and incomes, are not being met. Added to these pressures, Poland also faces a rapidly aging population that will require more targeted social spending to ensure fiscal sustainability. These increased demands are coming at a time when productivity gains from traditional sources of growth are declining and the economy faces greater global uncertainty.
Achieving the income levels of established HICs and accelerating convergence with Europe’s high-income member states will require new policies. While there is still some scope for catching up by absorbing advanced technology, increases in productivity will increasingly need to be driven by innovation. A range of policy reforms would contribute to more rapid innovation, for example, by making it easier to start a business, boosting investment in R&D, devoting more resources to education from pre-primary school to university, encouraging more permanent employment contracts to enhance incentives to train workers, improving connectivity through greater investment in hard and soft infrastructure, and supporting the growth of capital markets to increase the availability of finance, particularly for risky ventures.
It will also require redoubling efforts to reduce poverty and income inequality. Efforts to improve governance, where Poland ranks far below established HICs, are essential to establish the broad framework conducive to growth and social stability. High-quality institutions prevent
elite capture, foster competition, and create trust in government. Improving the progressivity of the tax system, increasing public spending on health services and supporting targeted safety nets for disadvantaged groups would continue Poland’s achievements in ensuring equality of opportunity and rapid, sustainable growth in the coming years. Increases in the retirement age and measures to encourage both permanent and temporary migration could address the potential aging crisis.
A renewal of the broad consensus around the vision for the country will be needed for Poland to continue its ascent towards established HIC status and meet citizens’ expectations. A revitalization of the democratic consensus around a socially responsible market economy will help ensure the reform commitment and policy consistency that has served Poland so well so far.
40 41

Lessons from Poland, Insights for Poland:A SUSTAINABLE AND INCLUSIVE TRANSITION TO HIGH INCOME STATUS
ReferencesAghion, P., and S.N. Durlauf (eds.). 2014. Handbook of Economic Growth.
Atoyan R., et al. 2016. “Emigration and its economic impact on Eastern Europe”. IMF Discussion Note. Washington, D. C.: International Monetary Fund.
Baran, J., and P. Lewandowski. 2016. “Labour market in Poland”. IBS Background Paper. Warsaw: Institute for Structural Research.
Bulman D., M. Eden, and H. Nguyen. 2017. “Transitioning from low-income growth to high-income growth: is there a middle-income trap?,” Journal of the Asia Pacific Economy, Vol. 22, pp. 5-28.
Campos, N. F., F. Coricelli, and L. Moretti. 2014. “Economic Growth and Political Integration: Estimating the Benefits from Membership in the European Union Using the Synthetic Coun-terfactuals Method.” Discussion Paper Series, IZA DP No. 8162. Bonn: Institute for the Study of Labor (IZA).
Czapiński J., and T. Panek (eds.). 2000, 2003, 2005, 2009, 2001, 2013, 2015. Diagnoza społeczna. http://www.diagnoza.com/.
Eichengreen, B., D. Park, and K. Shin. 2012. “When Fast Growing Economies Slow Down: International Evidence and Implications for China,” Asian Economic Papers, 11, pp 42– 87.
Felipe, J. 2012. “Tracking the Middle-Income Trap: What is It, Who is in It, and Why? Part 1,” ADB Economics Working Paper Series No. 307, Asian Development Bank.
Georgiev, Y., P. Nagy-Mohacsi and A. Plekhanov. 2017. “Structural reform and productivity growth in Emerging Europe and Central Asia”, Research Paper Series 02/2017, LSE Institute of Global Affairs.
Gill, I. S. and M. Raiser. 2012. Golden Growth: Restoring the Lustre of the European Economic Model. Washington, DC: World Bank.
Howard, P., and S. Kamal. 2006. “Is there a case for industrial policy? A critical survey”. The World Bank Research Observer, Vol. 21 (2), pp. 267-297.
Maddison A. 2010. Historical Statistics of the World Economy: 1-2008 AD. http://www.ggdc.net/maddison/
Myck, M., and M. Najsztub. 2015. “Data and Model Cross-validation to Improve Accuracy of Microsimulation Results: Estimates for the Polish Household Budget Survey,” International Journal of Microsimulation, International Microsimulation Association, Vol. 8(1), pages 33-66.
National Bank of Poland. 2015. Household Wealth and Debt in Poland. Pilot survey report 2014. Warsaw: National Bank of Poland.
Nguyen, H., and P. A. Jaramillo. 2016. “Institutions and Returns to Firm Innovation: Focus on Latin America“. In: Thompson A., J., E. Vostroknutova, K. M. Wacker, and M. Clavijo. Under-standing the Income and Efficiency Gap in Latin America and the Caribbean, Directions in De-velopment – Countries and Regions. Washington, DC: World Bank, pp. 187-208. http://dx.doi.org/10.1596/978-1-4648-0450-2
Noland, M. and P. Howard. 2003. Industrial Policy in an Era of Globalization: Lessons from Asia. Peterson Institute for International Economics.
OECD. 2016. OECD Regions at a Glance 2016. Paris: OECD Publishing.
OECD. 2016. PISA 2015 Results (Volume I): Excellence and Equity in Education. Paris: OECD Publishing. DOI: http://dx.doi.org/10.1787/9789264266490-en
Rodrik, D., A. Subramanian, and F. Trebbi. 2004. “Institutions Rule: The Primacy Of Institutions Over Geography And Integration In Economic Development,” Journal of Economic Growth, Vol. 9, pp. 131-165.
Spence, M. 2011. The Next Convergence. The Future of Economic Growth in a Multispeed World. Farrar, Straus and Giroux: New York.
Van Eeghen, M. W., I. S. Gill, I. Izvorski, and D. De Rosa. 2014. Diversified development : mak-ing the most of natural resources in Eurasia. Europe and Central Asia Studies. Washington, DC: World Bank. http://documents.worldbank.org/curated/en/124481468251373591/Diversified-development-making-the-most-of-natural-resources-in-Eurasia
World Bank Group. 2016. World Development Report 2016: Digital Dividends. Washington, DC: World Bank. https://openknowledge.worldbank.org/handle/10986/23347
World Bank Group. Doing Business. Washington, DC: World Bank. http://www.doingbusiness.org
World Bank. 2012. World Development Report 2013: Jobs. Washington, DC: World Bank. https://openknowledge.worldbank.org/handle/10986/11843
World Economic Forum. 2016. The Global Competitiveness Report 2016-17. Geneva: World Economic Forum. https://www.weforum.org/reports/the-global-competitiveness-report-2016-2017-1
42 43