Embed Size (px)
Citation preview

University of Central Florida University of Central Florida
STARS STARS
Electronic Theses and Dissertations, 2004-2019
2013
A Systems Approach To Sustainable Energy Portfolio A Systems Approach To Sustainable Energy Portfolio
Development Development
Saeed Hadian University of Central Florida
Part of the Civil Engineering Commons
Find similar works at: https://stars.library.ucf.edu/etd
University of Central Florida Libraries http://library.ucf.edu
This Doctoral Dissertation (Open Access) is brought to you for free and open access by STARS. It has been accepted
for inclusion in Electronic Theses and Dissertations, 2004-2019 by an authorized administrator of STARS. For more
information, please contact [email protected].
STARS Citation STARS Citation Hadian, Saeed, "A Systems Approach To Sustainable Energy Portfolio Development" (2013). Electronic Theses and Dissertations, 2004-2019. 2938. https://stars.library.ucf.edu/etd/2938

A SYSTEMS APPROACH TO SUSTAINABLE ENERGY PORTFOLIO
DEVELOPMENT
By
SAEED HADIAN B.S. Amirkabir University of Technology, 2007
M.S. Amirkabir University of Technology, 2010
A dissertation submitted in partial fulfillment of the requirements
for the degree of Doctor of Philosophy
in the Department of Civil, Environmental and Construction Engineering
in the College of Engineering and Computer Science
at the University of Central Florida
Orlando, Florida
Fall Term
2013
Major Professor: Kaveh Madani

ii
© 2013 Saeed Hadian

iii
ABSTRACT
Adequate energy supply has become one of the vital components of human development and
economic growth of nations. In fact, major components of the global economy such as
transportation services, communications, industrial processes, and construction activities are
dependent on adequate energy resources. Even mining and extraction of energy resources,
including harnessing the forces of nature to produce energy, are dependent on accessibility of
sufficient energy in the appropriate form at the desired location. Therefore, energy resource
planning and management to provide appropriate energy in terms of both quantity and quality
has become a priority at the global level. The increasing demand for energy due to growing
population, higher living standards, and economic development magnifies the importance of
reliable energy plans. In addition, the uneven distribution of traditional fossil fuel energy sources
on the Earth and the resulting political and economic interactions are other sources of complexity
within energy planning. The competition over fossil fuels that exists due to gradual depletion of
such sources and the tremendous thirst of current global economic operations for these sources,
as well as the sensitivity of fossil fuel supplies and prices to global conditions, all add to the
complexity of effective energy planning.
In addition to diversification of fossil fuel supply sources as a means of increasing national
energy security, many governments are investing in non-fossil fuels, especially renewable energy
sources, to combat the risks associated with adequate energy supply. Moreover, increasing the
number of energy sources also adds further complication to energy planning. Global warming,
resulting from concentration of greenhouse gas emissions in the atmosphere, influences energy
infrastructure investments and operations management as a result of international treaty

iv
obligations and other regulations requiring that emissions be cut to sustainable levels. Burning
fossil fuel, as one of the substantial driving factors of global warming and energy insecurity, is
mostly impacted by such policies, pushing forward the implementation of renewable energy
polices. Thus, modern energy portfolios comprise a mix of renewable energy sources and fossil
fuels, with an increasing share of renewables over time. Many governments have been setting
renewable energy targets that mandate increasing energy production from such sources over
time. Reliance on renewable energy sources certainly helps with reduction of greenhouse gas
emissions while improving national energy security. However, the growing implementation of
renewable energy has some limitations. Such energy technologies are not always as cheap as
fossil fuel sources, mostly due to immaturity of these energy sources in most locations as well as
high prices of the materials and equipment to harness the forces of nature and transform them to
usable energy. In addition, despite the fact that renewable energy sources are traditionally
considered to be environmentally friendly, compared to fossil fuels, they sometimes require more
natural resources such as water and land to operate and produce energy. Hence, the massive
production of energy from these sources may lead to water shortage, land use change, increasing
food prices, and insecurity of water supplies. In other words, the energy production from
renewables might be a solution to reduce greenhouse gas emissions, but it might become a
source of other problems such as scarcity of natural resources.
The fact that future energy mix will rely more on renewable sources is undeniable, mostly due
to depletion of fossil fuel sources over time. However, the aforementioned limitations pose a
challenge to general policies that encourage immediate substitution of fossil fuels with
renewables to battle climate change. In fact, such limitations should be taken into account in

v
developing reliable energy policies that seek adequate energy supply with minimal secondary
effects.
Traditional energy policies have been suggesting the expansion of least cost energy options,
which were mostly fossil fuels. Such sources used to be considered riskless energy options with
low volatility in the absence of competitive energy markets in which various energy technologies
are competing over larger market shares. Evolution of renewable energy technologies, however,
complicated energy planning due to emerging risks that emanated mostly from high price
volatility. Hence, energy planning began to be seen as investment problems in which the costs of
energy portfolio were minimized while attempting to manage associated price risks. So, energy
policies continued to rely on risky fossil fuel options and small shares of renewables with the
primary goal to reduce generation costs. With emerging symptoms of climate change and the
resulting consequences, the new policies accounted for the costs of carbon emissions control in
addition to other costs. Such policies also encouraged the increased use of renewable energy
sources. Emissions control cost is not an appropriate measure of damages because these costs are
substantially less than the economic damages resulting from emissions. In addition, the effects of
such policies on natural resources such as water and land is not directly taken into account.
However, sustainable energy policies should be able to capture such complexities, risks, and
tradeoffs within energy planning. Therefore, there is a need for adequate supply of energy while
addressing issues such as global warming, energy security, economy, and environmental impacts
of energy production processes. The effort in this study is to develop an energy portfolio
assessment model to address the aforementioned concerns.

vi
This research utilized energy performance data, gathered from extensive review of articles
and governmental institution reports. The energy performance values, namely carbon footprint,
water footprint, land footprint, and cost of energy production were carefully selected in order to
have the same basis for comparison purposes. If needed, adjustment factors were applied. In
addition, the Energy Information Administration (EIA) energy projection scenarios were selected
as the basis for estimating the share of the energy sources over the years until 2035. Furthermore,
the resource availability in different states within the U.S. was obtained from publicly available
governmental institutions that provide such statistics. Specifically, the carbon emissions
magnitudes (metric tons per capita) for different states were extracted from EIA databases,
states’ freshwater withdrawals (cubic meters per capita) were found from USGS databases,
states’ land availability values (square kilometers) were obtained from the U.S. Census Bureau,
and economic resource availability (GDP per capita) for different states were acquired from the
Bureau of Economic Analysis.
In this study, first, the impacts of energy production processes on global freshwater resources
are investigated based on different energy projection scenarios. Considering the need for
investing on energy sources with minimum environmental impacts while securing maximum
efficiency, a systems approach is adopted to quantify the resource use efficiency of energy
sources under sustainability indicators. The sensitivity and robustness of the resource use
efficiency scores are then investigated versus existing energy performance uncertainties and
varying resource availability conditions. The resource use efficiency of the energy sources is
then regionalized for different resource limitation conditions in states within the U.S. Finally, a
sustainable energy planning framework is developed based on Modern Portfolio Theory (MPT)

vii
and Post-Modern Portfolio Theory (PMPT) with consideration of the resource use efficiency
measures and associated efficiency risks.
In the energy-water nexus investigation, the energy sources are categorized into 10 major
groups with distinct water footprint magnitudes and associated uncertainties. The global water
footprint of energy production processes are then estimated for different EIA energy mix
scenarios over the 2012-2035 period. The outcomes indicate that the water footprint of energy
production increases by almost 50% depending on the scenario. In fact, growing energy
production is not the only reason for increasing the energy related water footprint. Increasing the
share of water intensive energy sources in the future energy mix is another driver of increasing
global water footprint of energy in the future. The results of the energies’ water footprint analysis
demonstrate the need for a policy to reduce the water use of energy generation. Furthermore, the
outcomes highlight the importance of considering the secondary impacts of energy production
processes besides their carbon footprint and costs. The results also have policy implications for
future energy investments in order to increase the water use efficiency of energy sources per unit
of energy production, especially those with significant water footprint such as hydropower and
biofuels.
In the next step, substantial efforts have been dedicated to evaluating the efficiency of
different energy sources from resource use perspective. For this purpose, a system of systems
approach is adopted to measure the resource use efficiency of energy sources in the presence of
trade-offs between independent yet interacting systems (climate, water, land, economy). Hence, a
stochastic multi-criteria decision making (MCDM) framework is developed to compute the
resource use efficiency scores for four sustainability assessment criteria, namely carbon

viii
footprint, water footprint, land footprint, and cost of energy production considering existing
performance uncertainties. The energy sources’ performances under aforementioned
sustainability criteria are represented in ranges due to uncertainties that exist because of
technological and regional variations. Such uncertainties are captured by the model based on
Monte-Carlo selection of random values and are translated into stochastic resource use efficiency
scores. As the notion of optimality is not unique, five MCDM methods are exploited in the
model to counterbalance the bias toward definition of optimality. This analysis is performed
under “no resource limitation” conditions to highlight the quality of different energy sources
from a resource use perspective. The resource use efficiency is defined as a dimensionless
number in scale of 0-100, with greater numbers representing a higher efficiency. The outcomes
of this analysis indicate that despite increasing popularity, not all renewable energy sources are
more resource use efficient than non-renewable sources. This is especially true for biofuels and
different types of ethanol that demonstrate lower resource use efficiency scores compared to
natural gas and nuclear energy. It is found that geothermal energy and biomass energy from
miscanthus are the most and least resource use efficient energy alternatives based on the
performance data available in the literature. The analysis also shows that none of the energy
sources are strictly dominant or strictly dominated by other energy sources.
Following the resource use efficiency analysis, sensitivity and robustness analyses are
performed to determine the impacts of resource limitations and existing performance
uncertainties on resource use efficiency, respectively. Sensitivity analysis indicates that
geothermal energy and ethanol from sugarcane have the lowest and highest resource use
efficiency sensitivity, respectively. Also, it is found that from a resource use perspective,

ix
concentrated solar power (CSP) and hydropower are respectively the most and least robust
energy options with respect to the existing performance uncertainties in the literature.
In addition to resource use efficiency analysis, sensitivity analysis and robustness analysis, of
energy sources, this study also investigates the scheme of the energy production mix within a
specific region with certain characteristics, resource limitations, and availabilities. In fact,
different energy sources, especially renewables, vary in demand for natural resources (such as
water and land), environmental impacts, geographic requirements, and type of infrastructure
required for energy production. In fact, the efficiency of energy sources from a resource use
perspective is dependent upon regional specifications, so the energy portfolio varies for different
regions due to varying resource availability conditions. Hence, the resource use efficiency scores
of different energy technologies are calculated based on the aforementioned sustainability
criteria and regional resource availability and limitation conditions (emissions, water resources,
land, and GDP) within different U.S. states, regardless of the feasibility of energy alternatives in
each state. Sustainability measures are given varying weights based on the emissions cap,
available economic resources, land, and water resources in each state, upon which the resource
use efficiency of energy sources is calculated by utilizing the system of systems framework
developed in the previous step. Efficiency scores are graphically illustrated on GIS-based maps
for different states and different energy sources. The results indicate that for some states, fossil
fuels such as coal and natural gas are as efficient as renewables like wind and solar energy
technologies from resource use perspective. In other words, energy sources’ resource use
efficiency is significantly sensitive to available resources and limitations in a certain location.

x
Moreover, energy portfolio development models have been created in order to determine the
share of different energy sources of total energy production, in order to meet energy demand,
maintain energy security, and address climate change with the least possible adverse impacts on
the environment. In fact, the traditional “least cost” energy portfolios are outdated and should be
replaced with “most efficient” ones that are not only cost-effective, but also environmentally
friendly. Hence, the calculated resource use efficiency scores and associated statistical analysis
outcomes for a range of renewable and nonrenewable energy sources are fed into a portfolio
selection framework to choose the appropriate energy mixes associated with the risk attitudes of
decision makers. For this purpose, Modern Portfolio Theory (MPT) and Post-Modern Portfolio
Theory (PMPT) are both employed to illustrate how different interpretations of “risk of return”
yield different energy portfolios. The results indicate that 2012 energy mix and projected world’s
2035 energy portfolio are not sustainable in terms of resource use efficiency and could be
substituted with more reliable, more effective portfolios that address energy security and global
warming with minimal environmental and economic impacts.

xi
To my family. Without their support this work was not possible

xii
ACKNOWLEDGMENT
I would never have been able to finish my dissertation without the guidance of my advisor
and support from my family.
I would like to express my deepest gratitude to my advisor, Dr. Kaveh Madani, for his
excellent guidance, caring, and patience. He provided me with an excellent atmosphere for doing
research all these years. I have been amazingly fortunate to have an advisor who gave me the
freedom to explore on my own, and at the same time the guidance to recover when my steps
faltered. Kaveh taught me how to question thoughts and express ideas. His patience and support
helped me overcome many crisis situations and finish this dissertation. I hope that one day I
would become as good an advisor to my students as Kaveh has been to me.
For this dissertation, I would like to thank my defense committee members: Debra Reinhart,
Dingbao Wang, Jennifer Pazour, Dima Nazzal, and Woo Lee for their time, interest, helpful
comments, and insightful questions.
I’m also grateful to the HEESA members who helped me in different stages of my research.
Special thanks to Juan Gonzalez, Chris Rowney, Soroush Mokhtari, Kaitlyn Jeanis, Angela
Rodriguez, Tanya Kay, and rest of the team. I would also like to thank Dr. Ali Mirchi who
patiently corrected my writings and provided me with valuable comments in my research.
Most importantly, I would like to thank my parents and two sisters, Maryam and Mina. They
have been a constant source of love, concern, support and strength all these years.

xiii
TABLE OF CONTENTS
CHAPTER 1: INTRODUCTION ................................................................................................... 1
1.1 Overview ............................................................................................................... 1
1.2 Research Objectives .............................................................................................. 5
1.3 Dissertation Organization ...................................................................................... 6
1.4 References ............................................................................................................. 7
CHAPTER 2: THE WATER DEMAND OF ENERGY ................................................................ 8
2.1 Introduction ........................................................................................................... 8
2.2 Methods and Data................................................................................................ 14
2.3 Results and Discussion ........................................................................................ 18
2.4 Conclusion ........................................................................................................... 24
2.5 References ........................................................................................................... 27
CHAPTER 3: A SYSTEM OF SYSTEMS APPROACH TO ENERGY SUSTAINABILITY
ASSESSMENT ............................................................................................................................. 31
3.1 Introduction ......................................................................................................... 31
3.2 Energy Production Impacts: Selecting Lower Level Indicators.......................... 35
3.3 Energy Resource Use Efficiency......................................................................... 42
3.4 Results ................................................................................................................. 47
3.5 Robustness And Sensitivity ................................................................................. 53
3.6 Conclusions ......................................................................................................... 58
3.7 References ........................................................................................................... 60

xiv
CHAPTER 4: ENERGIES’ RESOURCE USE EFFICIENCY ANALYSIS UNDER REGIONAL
RESOURCE AVAILABILITY AND LIMITATIONS: IMPLICATIONS FOR THE UNITED
STATES OF AMERICA .............................................................................................................. 71
4.1 Introduction ......................................................................................................... 71
4.2 Method and Data ................................................................................................. 74
4.2.1 Sustainability criteria ............................................................................... 74
4.2.2 Stochastic Multi criteria Resource Use Efficiency Evaluaion ................. 77
4.3 Regional Resource Availability and Limitations ................................................ 78
4.4 Results And Discussion ....................................................................................... 82
4.4.1 Resource Use Efficiency Evaluation of the U.S. Energy Sources ............ 82
4.4.2 State-Level Energy Production Planning ................................................. 95
4.4.3 Implications for the U.S. Energy Production Outlook ............................. 98
4.5 Conclusions ....................................................................................................... 100
4.6 References ......................................................................................................... 102
CHAPTER 5: ENERGY PORTFOLIO ANALYSIS AND DEVELOPMENT BASED ON
SUSTAINABILITY CONSIDERATIONS ................................................................................ 106
5.1 Introduction ....................................................................................................... 106
5.2 Sustainable Energy Planning Based On MPT ................................................... 111
5.3 Sustainable Energy Planning Based On PMPT ................................................ 114
5.4 Results ............................................................................................................... 118
5.5 Discussion ......................................................................................................... 122

xv
5.6 Conclusion ......................................................................................................... 128
5.7 References ......................................................................................................... 130
CHAPTER 6: CONCLUSIONS AND RECOMMENDATION ................................................ 132
6.1 Energy Production Secondary Impacts Analysis .............................................. 132
6.2 Multi-Criteria Assessment Of Energy Efficiency ............................................. 134
6.3 Energy Planning Based On Resource Use Sustainability Considerations ........ 136

xvi
LIST OF FIGURES
Figure 1.1: Energy generation capacity, 2005-2035 ....................................................................... 3
Figure 2.1: Shares of energy sources in world's total energy supply based on EIA reference
scenario (a) 2012; (b) 2035. .......................................................................................................... 20
Figure 2.2: World’s water footprint of energy consumption in billion cubic meters (BCM) (a)
2012 low estimation; (b) 2012 high estimation ............................................................................ 21
Figure 2.3: Percent increase in the World’s water footprint of energy consumption compared to
2012: (a) 2020 low estimation; (b) 2020 high estimation; (c) 2035 low estimation; (d) 2035 high
estimation ...................................................................................................................................... 23
Figure 2.4: Percent increase in per capita water footprint of global energy production compared
to 2012 based on different EIA scenarios. .................................................................................... 24
Figure 3.1: Energy sustainability assessment as a system of systems (SOS) framework ............. 35
Figure 3.2: Resource use efficiency scores of different energy sources (0-100) .......................... 49
Figure 3.3: Sensitivity of energy sources’ resource use efficiency to uncertainties in resource
availabilities and limitations ......................................................................................................... 56
Figure 4.1: Resource use efficiency scores of different energy sources (0-100) .......................... 83
Figure 4.2: Statewide resource use efficiency maps for energy sources with high resource use
efficiency: (a) Geothermal, (b) Onshore wind, (c) Solar thermal, (d) Offshore wind, (e) Wave
and tidal, (f) Nuclear. .................................................................................................................... 87
Figure 4.3: Statewide resource use efficiency maps for energy sources with medium resource use
efficiency: (a) Hydropower, (b) Solar photovoltaic, (c) Natural gas. ........................................... 90
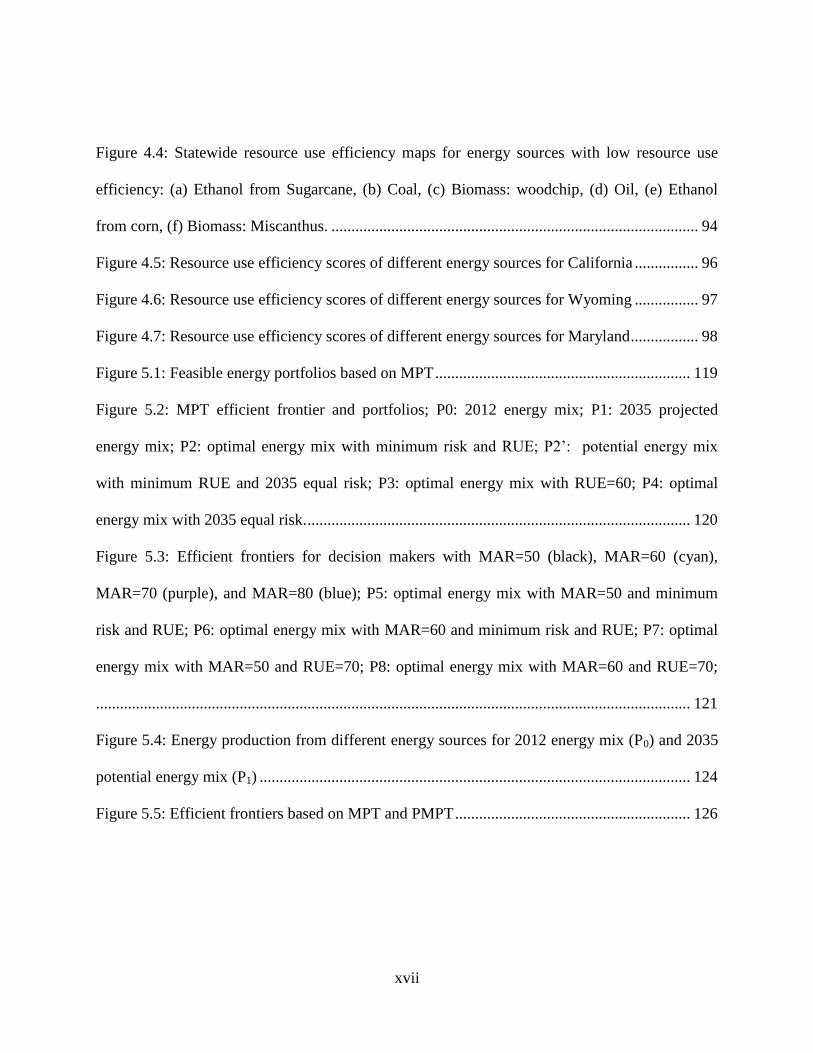
xvii
Figure 4.4: Statewide resource use efficiency maps for energy sources with low resource use
efficiency: (a) Ethanol from Sugarcane, (b) Coal, (c) Biomass: woodchip, (d) Oil, (e) Ethanol
from corn, (f) Biomass: Miscanthus. ............................................................................................ 94
Figure 4.5: Resource use efficiency scores of different energy sources for California ................ 96
Figure 4.6: Resource use efficiency scores of different energy sources for Wyoming ................ 97
Figure 4.7: Resource use efficiency scores of different energy sources for Maryland ................. 98
Figure 5.1: Feasible energy portfolios based on MPT ................................................................ 119
Figure 5.2: MPT efficient frontier and portfolios; P0: 2012 energy mix; P1: 2035 projected
energy mix; P2: optimal energy mix with minimum risk and RUE; P2’: potential energy mix
with minimum RUE and 2035 equal risk; P3: optimal energy mix with RUE=60; P4: optimal
energy mix with 2035 equal risk. ................................................................................................ 120
Figure 5.3: Efficient frontiers for decision makers with MAR=50 (black), MAR=60 (cyan),
MAR=70 (purple), and MAR=80 (blue); P5: optimal energy mix with MAR=50 and minimum
risk and RUE; P6: optimal energy mix with MAR=60 and minimum risk and RUE; P7: optimal
energy mix with MAR=50 and RUE=70; P8: optimal energy mix with MAR=60 and RUE=70;
..................................................................................................................................................... 121
Figure 5.4: Energy production from different energy sources for 2012 energy mix (P0) and 2035
potential energy mix (P1) ............................................................................................................ 124
Figure 5.5: Efficient frontiers based on MPT and PMPT ........................................................... 126

xviii
LIST OF TABLES
Table 2.1: Summary of EIA energy scenarios .............................................................................. 15
Table 2.2: Water footprint of different energy sources................................................................. 16
Table 2.3: Percent increase in energy production for different energy sources from 2012 to 2035
....................................................................................................................................................... 19
Table 2.4: Shares of energy sources in world’s total energy supply based on EIA scenarios ...... 20
Table 3.1: Carbon footprint, water footprint, land footprint, and cost of energy sources ............ 41
Table 3.2: MCDM methods .......................................................................................................... 47
Table 3.3: Ranking of the energy sources based on different MCDM methods ........................... 49
Table 3.4: Energy sources’ standard deviation of resource use efficiency scores ........................ 54
Table 4.1: Performance of energy alternatives under different sustainability criteria .................. 76
Table 4.2: Multi criteria decision making methods ...................................................................... 77
Table 4.3: States available resources ............................................................................................ 78
Table 4.4: States weights of resource use efficiency assessment criteria ..................................... 81
Table 5.1: Energy sources performance measures under four sustainability criteria ................. 111
Table 5.2: Resource use efficiency, standard deviation, extreme value and skewness .............. 116
Table 5.3: Energy mix components for different scenarios based on MPT and PMPT ............. 122

1
CHAPTER 1: INTRODUCTION
1.1 Overview
With the world population increasing by more than 1.2 percent per year and the failure of the
traditional economic systems to respond to growing global demands, the increasing scarcity of
natural resources, global climate change, hunger, and other social and environmental issues,
many governments are striving to substitute the inefficient conventional and long-established
development and production policies with more effective ones to address the aforementioned
concerns in a sustainable manner. The existing situation has emerged as the consequence of
economic activities designed to maximize economic prosperity based on the fast paced
consumption of natural resources, regardless of the secondary effects imposed by such practices
on the environment. Continuance of this trend is found to be unsustainable as the associated
natural resources consumption rate is much faster than the regeneration rate, which will
ultimately result in an economic downturn. As a result, moving toward sustainability to address
the needs of the current generation while minimizing effects on the environment to preserve it
for future generations has become a global concern in recent years.
To have sustainable development, energy is of a particular importance as all the mechanisms
and infrastructures within a society need some sort of energy to operate. In fact, energy as the
essential part of the whole system provides the basis for other system components to supply
goods and services to society. As a result, moving toward sustainability requires sustainable
energy development plans as well, in order to produce and supply the demanded energy levels
with acceptable environmental, economic, and social effects.

2
Traditionally, conventional fossil fuels including oil, coal, and natural gas, have been the
major source of energy production for industrial, residential, commercial, transportation, and
electric power sectors worldwide. Oil has been mostly used in the transportation and industrial
sectors; coal has been the primary fuel option to produce electricity; and natural gas has been
providing energy to the industrial, residential, commercial, and electric power sectors. These
fossil fuels, however, are becoming less accessible for extraction and new reserves are becoming
harder to find. As a result, the dependency of the current energy systems on limited fossil fuel
resources endangers the national energy security of many countries (UNEP, 2011). In addition,
fossil fuel resources are not diverse enough. There are many areas around the globe with no
access to adequate fossil fuel reserves, where demands are fulfilled with imports. This makes
national energy supply plans highly uncertain and insecure as fossil fuel supply quantities are a
function of many variables including but not limited to the political relations, economic
situations, laws and regulations, and the national development plans of the involved countries.
Moreover, climate change resulting from the concentration of greenhouse gas emissions from
burning of fossil fuels has been recognized as one of the obstacles to sustainable development
and planning (USAID, 2011; McDonald, 2006), resulting in different health and environmental
problems.
Because of the aforementioned reasons, various countries all around the world have been
developing policies in an attempt to control climate change and preserve the national energy
security. As a result, national energy policy plans are promoting the more easily accessible
renewable energy sources, among which the most popular technologies are hydropower plants,
onshore and offshore wind power plants, solar thermal and photovoltaic energy, ocean energy,

3
biomass and biofuels, and geothermal power plants. Figure 1.1 shows the past and projected
generation capacities for different renewable and nonrenewable energy sources under different
EIA scenarios (EIA, 2011): reference (R); high oil prices (HOP); traditional high oil prices
(THOP); low oil prices (LOP); traditional low oil prices (TLOP).
Figure 1.1: Energy generation capacity, 2005-2035 (adapted from Mirchi et al., 2012)
As illustrated in Figure 1.1, the renewables’ share of total energy production is increasing
rapidly on a global scale. In comparison with fossil energy sources, such renewables are known
to be environmental- friendly because of lower emissions. Hence, the immediate substitution of
renewables for fossil fuels is encouraged by most of the recent energy polices. Emerging policies
are more inclined toward renewables in the future, so the energy mix resulting from those
policies includes a combination of both fossil fuels and renewables, with the share of the
renewables increasing gradually over time. Nevertheless, such policies largely ignore unintended

4
consequences, especially with respect to their effects on other valuable natural resources (e.g.,
water and land) in the long run.
Moving toward a sustainable future requires the actions taken to solve environmental
problems be rich enough to address the problem, taking into account these actions’ shortcomings
and possible undesirable feedbacks. In the case of renewable sources of energy, how could it be
justified to invest on a technology that produces close to zero carbon dioxide yet demands
considerable amounts of natural resources and huge financial backup over a long time? Although
such policies might be effective to reduce greenhouse gas emissions and the resulting global
warming in the long run, they might have secondary impacts on other components of the
ecosystem, namely water and land. Some renewables such as hydropower and biomass consume
more water than others and some of them such as the ethanol and biomass require large land
areas to produce energy. These secondary impacts are barriers to sustainable development as the
pressure on a component of the ecosystem yields to the failure of that component and eventually,
the collapse of the whole system. This is especially true for those ecosystem components that
have already been under pressure because of other human activities. The secondary impacts on
other ecosystem components might be so severe to nullify the advantages of the aforementioned
policies. As a result, the general policy of substituting renewables for fossil fuels might not be
effective unless the other impacts are also taken into consideration. In fact, we need to replace
conventional energy sources with renewables ultimately, as the current world’s energy profile is
unsustainable in terms of energy security and environmental impacts. However, developing an
efficient future energy mix that addresses energy security, climate change, environmental
impacts, and energy diversity all together is an objective that best supports the needs of society.

5
The main question to be answered in this research becomes “how to develop a sustainable
energy portfolio with respect to the economic and environmental criteria, data and
performance uncertainties, and risk attitudes and expected utilities?”
1.2 Research Objectives
This research focuses on measuring the resource use efficiency of different energy sources
with respect to sustainability indicators in the presence of uncertainty, evaluating the variability
of energy sources efficiency based on resource limitations, measuring the variability of resource
use efficiency scores due to existing uncertainties, evaluating the regionalized resource use
efficiency of energy alternatives, and developing a sustainable energy portfolio development
framework. The detailed objectives were achieved by the following main procedures:
1. Collecting the energy sources performance values under sustainability criteria; carbon
footprint, water footprint, land footprint, and costs of energy production. Data are represented
in ranges to reflect the technological and regional variations of energy sources performance
values.
2. Measuring the impacts of current energy policies and future projections on global water
resources.
3. Developing a system of systems framework for multi-criteria evaluation of energy sources
efficiency:
a. Developing a stochastic multi-criteria assessment framework for measuring the
resource use efficiency scores of the energy sources;

6
b. Evaluating the sensitivity of energy source resource use efficiency scores for varying
resource limitation conditions.
c. Evaluating the robustness of resource use efficiency scores for performance
uncertainties of existing energy sources’.
4. Evaluating the resource use efficiency of the energy sources under different regional resource
limitation patterns:
a. Collecting the states’ carbon emissions, freshwater withdrawals, available land, and
GDP values;
b. Weighting the resource use efficiency analysis criteria based on the availability of
resources in each state;
c. Calculating the resource use efficiency of energy sources within the U.S.
5. Developing Energy portfolios with consideration of sustainability;
a. Developing sustainable energy portfolios based on Modern Portfolio Theory (MPT);
b. Developing sustainable energy portfolios based on Post-Modern Portfolio Theory
(PMPT).
1.3 Dissertation Organization
The dissertation is organized as follows: following this overview chapter, chapter 2
investigates the impacts of the current energy policies and future energy projections on global
water resources. Chapter 3 presents the fundamentals of resource use efficiency analysis based
on sustainability measures in uncertain conditions. This chapter provides details of the efficiency
assessment method as well as the sensitivity and robustness analyses of resource use efficiency

7
of energy sources’. Chapter 4 discusses the impacts of regional resource availability and
limitation conditions on the preference toward different energy sources from a resource use
perspective. In this chapter, the resource use efficiency scores are calculated for the states within
United States of America based on the resource limitations in each state. Chapter 5 presents the
proposed solutions to sustainable energy portfolio development based on the resource use
efficiency scores and associated risks. This chapter discusses different portfolio theories (Modern
Portfolio Theory and Post-Modern Portfolio Theory) to develop energy portfolios. Finally,
chapter 6 concludes the research efforts, findings, and future recommendations of this work.
1.4 References
McDonald, C. T. (2006). The Impact of Global Warming on Sustainable Developments-
Mitigating the Impact: Natural Hazard Mitigation. 2nd
International Solar Cities Congress
2006 at the Oxford University, Oxford, England.
Mirchi, A., Hadian, S., Madani, K., Rouhani, O. M., Rouhani, A. M. (2012). World Energy
Balance Outlook and OPEC Production Capacity: Implications for Global Oil
Security. Energies, 5(8), 2626-2651.
U.S. Agency For International Development (USAID). Global Climate Change. Available
online: http://www.usaid.gov/our_work/environment/climate/ (Accessed on December 25,
2011).
U.S. Energy Information Administration (EIA). (2011) International Energy Outlook 2011.

8
CHAPTER 2: THE WATER DEMAND OF ENERGY
2.1 Introduction
Population growth is one of the main (if not the main) drivers of energy demand in the future.
In the last century, water use rate almost doubled the population growth rate (World Bank,
2010). Under business-as-usual scenarios, the global energy consumption is estimated to rise
from 77 million BTU per capita in 2012 to 91 million BTU per capita in 2035. So, the energy
required for food production, water extraction, treatment, and transfer, education, industrial,
residential, and commercial purposes, etc. is estimated to increase by more than 40% over the
next 23 years (EIA, 2011). In addition to the potential technological, socioeconomic, political,
and geographic challenges for generation, transmission, and supply of energy, substantial
quantities of environmental resources required for producing energy are becoming a major
concern for policy makers. Currently, human activities demand for natural resources such as
freshwater, forests, fisheries and other ecosystems more than any other time in history (UNEP,
2007). As a result of such activities, ecological footprint exceeded biocapacity by 44% in 2006
and is estimated to exceed the biocapacity by 100% in 2030 (Global Footprint Network, 2010),
meaning that the available environmental resources are approaching the breaking point (Wolf,
2010), leading to scarcity of such resources with reasonable quality.
With the experience of global warming as an unintended consequence of poorly developed
energy production policies, reducing greenhouse gas (GHG) emissions has become an important
priority in energy policy development, shifting the focus towards low-carbon energy production
through alternative sources. The political and economic importance of energy security and

9
independence has been another incentive for investment in alternative sources of energy
worldwide. While most renewable energy sources can help reducing GHGs, they also have some
disadvantages (Brower, 1992; Abbasi and Abbasi, 2000; Madani et al., 2011, Hadian et al., 2012;
Clarke, 2012). For example, some renewable energy sources require a considerable amount of
valuable natural resources such as water and land. Hence, the potential impacts of energy
generation on the environment and natural resources should be taken into account in developing
global, national, and sub-country level energy policies and regulations to protect the already
stressed ecosystem components more wisely while producing sufficient energy.
Water is an essential element in many human-driven processes, including energy generation.
The agricultural water sector currently has the highest water demand at the global scale, followed
by the energy and industrial sector that is responsible for 20% of the total water withdrawals
(U.N. Water, 2012a). In the U.S., the energy sector is expected to be the fastest growing water
consuming sector, being responsible for 85% of the increase in domestic water consumption in
the 2005-2030 period (Carter, 2010). U.S. Governmental ethanol subsidies and mandates in the
U.S. lead to considerable use of biofuels that have 70-400 times higher water footprint compared
to traditional energy sources (Gerbens-Leenes et al., 2009). In some regions such as California,
expanding the energy production from bioenergy requires 1,000 times more water than gasoline
production (Fingerman et al., 2010). Hydrofracking, as another popular energy supply
alternative, has been recognized as a high water-intensive series of actions that impact the
surface water and ground water in both site creation and drilling processes (EPA, 2012). Regular
oil and gas production processes also require water for drilling and extraction of resources (DOE,
2006). Large-scale hydroelectric power as one of the oldest renewable energy sources has a

10
relatively high water footprint (Gerbens-Leenes et al., 2009), mostly pertaining to the
evaporation from large reservoir areas (Mekonnen and Hoekstra, 2012). The amount of water
that is evaporated on a daily basis from hydroelectric reservoirs across the U.S. is enough to meet
demands of 50 million people (Wilson and Leipzig, 2012). In coal and nuclear power plants, a
large amount of water is circulated for cooling purposes, part of which goes back to the energy
production system for reuse (World Nuclear Association, 2013) and the rest is evaporated or
discharged into the original source, causing a range of environmental issues such as fish
mortality and algae growth. Nuclear, coal, and natural gas power plants are the fastest growing
freshwater users in the U.S., being responsible for more than half of the total freshwater
withdrawals from different sources (Wilson, 2012). Concentrating Solar Power (CSP) also
requires a considerable amount of water to spin steam turbines (Carter and Campbell, 2009).
Other energy sources or energy production processes also require different levels of water
supply. For instance, wind power and solar photovoltaic are generally known to be very
environmentally friendly with no water footprint. However, the amount of water required in the
manufacturing process may become considerable with large-scale implementation of these
energy technologies, especially in places where technology is still immature or inefficient. In
addition, these technologies require coal, nuclear, or natural gas backup to guarantee the
sufficient supply of energy when wind or sun is not available (Schlesinger and Hirsch, 2009;
Vartabedian, 2012) leading to more water use for cooling purposes.
Water is a global resource, distributed unevenly throughout the planet. This makes effective
management of this valuable resource very complex at the national scale, especially with
consideration of the virtually imported and exported water through global economic trades

11
(Hoekstra and Hung, 2012). International trade of energy in different forms such as oil, natural
gas, coal, and biofuels, as well as the exchange of energy production technologies such as wind
turbines and solar panels place pressure on global water resources. Quantifying the amount of
water that goes into the energy sector at a global scale can help us better understand the risks
associated with developing myopic energy management plans that ignore the effects of energy
production on valuable natural resources. Water footprint is a reliable measure for this purpose
and represents the amount of freshwater used to produce one unit of energy from a given energy
source (Hoekstra and Hung, 2012). The components of water footprint are: blue water footprint,
which is the volume of surface and ground water consumed in the energy production process;
green water footprint, which represents the volume of rainwater consumed during the production
process (related to evapotranspiration and the rainwater incorporated in crop or wood); and grey
water footprint, which represents the amount of freshwater required to dilute the pollutants such
that the quality of water remains above water quality standards. In fact, the water footprint index
can take into account the direct and indirect water consumption in the energy production
lifecycle. Past studies have acknowledged the necessity for calculating the water impact of
different energy technologies. Gleick calculated the water consumption of different forms of
energy, and his findings were the basis for many recent studies on the water footprint of energy
(Gleick, 1994). Jacobson estimated the impacts of different renewable and nonrenewable energy
technologies including their water footprint, based on which a multi-criteria decision making
model was created to evaluate the efficiency of different energy sources (Jacobson, 2009).
Gerbens-Leenes et al. calculated the water footprint of different types of biomass and concluded
that large-scale production of biomass requires extensive amounts of water, leading to

12
unintended competition between “water for energy” and “water for food” (Gerbens-Leenes,
2009).
Considering the water footprint of various energy sources, Cooper and Sehlke suggested that
developing a sustainable energy policy is not feasible unless the water footprint and cost of
energy production are considered in addition to carbon footprint (Cooper and Sehlke, 2012).
Some studies have been focusing on the water use of the energy sector in different regions across
the globe. For instance, Wilson et al. estimated the water footprint of electricity sector in the U.S.
and concluded that an average kWh of electricity from different sources in the U.S. in 2009
required almost 42 gallons of water, more than 95 percent of which was gray water footprint,
associated with water quality effects of electricity production (Wilson and Leipzig, 2012).
Macknick et al. reviewed the existing literature on water consumption and withdrawal for the
U.S. electricity generating technologies and concluded that solar thermal and coal have the
highest water consumption while non-thermal renewables such as wind and solar photovoltaic
have the lowest water consumption (Macknick et al., 2012). Meldrum et al. reviewed and
classified the existing literature of electricity’s water withdrawal and water consumption for
different energy technologies and concluded that the water used for cooling purposes dominated
the life cycle water use of electricity generation. They also reported solar photovoltaic and wind
as the lowest water consuming energy technologies, and thermoelectricity as the highest water
consuming energy (Meldrum et al., 2013). Averyt et al. evaluated the water withdrawal and
consumptive use of power plants in the U.S. (including ocean and fresh water) and observed
substantial difference between the obtained results and EIA estimations, mostly due to imperfect
assumptions and misreported information regarding power plants (Averyt, 2013).
13
In fact, estimation of future water demands of the global energy sector comes with numerous
uncertainties and limitations and is contingent upon many parameters, including but not limited
to future international and national regulations, global warming, energy security issues, and
technological and economic development of nations. In fact, even energy scenarios from
different sources yield different energy mix projections due to different assumptions, projection
scope, and purposes. Hence, calculation of the water that goes to the energy sector depends on
what energy supply scenario and calculation assumptions are considered. For instance, according
to the World Energy Council (WEC), the water consumption of energy sector rises from 1775
BCM in 2005 to 2012 BCM in 2035 (less than 15% increase) (WEC, 2010). However, according
to the International Energy Agency (IEA), 66 BCM of water was consumed by energy sector in
2012, whereas this number changes to 135 BCM in 2035 (more than 100% increase) (IEA,
2012). The main reason for such a gap between these estimations is the different definitions of
water consumption as well as different water impact measurement methods used by these
sources. Hence, water consumption of the energy sector, is not a reliable measure for estimation
of the total water impacted by the energy sector, leading to inconsistent misinforming
estimations. Water footprint (Hoekstra and Hung, 2012), on the other hand, represents the total
direct and indirect water use of the energy sector and yields more robust understanding of the
water-energy nexus and associated policy insights.
In this chapter, five energy scenarios developed by the International Energy Outlook of the
U.S. Energy Information Administration (EIA) and water footprint of different energy
technologies are set as bases for estimating the total global water footprint of energy production
processes over the 2012-2035 period.

14
2.2 Methods and Data
The water footprint of global energy is estimated for 10 categories of energy sources
including conventional and unconventional liquids, biofuels, natural gas, coal, nuclear,
hydroelectric power, solar, wind, geothermal, and other renewable energy sources under five
EIA energy mix scenarios for the 2005-2035 period. These scenarios generally project energy
consumption based on the conditions of current laws and regulations as well as the effects of oil
prices on the global energy market (EIA, 2011).
The reference scenario (REF) represents a “business-as-usual” assumption for oil prices,
demographic trends, and technology. It assumes a baseline world economic growth of 3.5% per
year from 2008 to 2015 and 3.3% from 2015 to 2035. This scenario assumes that a barrel of light
sweet crude oil will cost $125 in 2035 (EIA, 2012). The high oil price (HOP) and low oil price
(LOP) scenarios consider the impacts of high and low non-OECD demand conditions. The high
oil price scenario assumes a higher demand for liquid fuels with a lower global supply when
compared to the reference scenario. This scenario assumes that a barrel of light sweet crude oil
will rise to $200 (in 2009 U.S.D.) in 2035, making it 60% more expensive than the reference
scenario. The low oil price scenario assumes a lower demand for liquid fuels and a higher global
supply when compared to the reference scenario. This scenario assumes that a barrel of light
sweet crude oil will decrease to $50 (in 2009 U.S.D.) in 2035, making it 60% less expensive than
the reference scenario. The traditional high oil price (THOP) and low oil price (TLOP) scenarios
assume the same economic growth as the reference scenario but account for the impact of
alternative supply conditions (EIA, 2011). The key assumptions for these scenarios are
summarized in Table 2.1.

15
Table 2.1: Summary of EIA energy scenarios
Scenario Oil price per barrel in
2035 (2009 dollars) Assumptions
REF $125 OPEC’s oil production remains about 42% of world’s
total liquid fuel production.
HOP $200
Higher oil prices result from high demand for liquid
fuels in non-OECD countries due to high economic
growth.
LOP $50
Lower oil prices result from low demand for liquid
fuels in non-OECD countries due to low economic
growth.
THOP $200 OPEC countries reduce their production from the
current rate, resulting in higher oil prices.
TLOP $50 OPEC countries increase their production from the
current rate, resulting in lower oil prices.
The water footprints of different energy sources are presented in Table 2.1. Some of the
values in Table 2.1 are given as intervals due to the technological and other regional conditions,
resulting in different estimations of water footprints. For instance, the solar energy might be
produced using different technologies (solar thermal and solar photovoltaic) with different water
footprint. Moreover, the efficiency of different production can be affected by local conditions
(e.g. solar radiation), resulting in some estimation uncertainties.

16
Table 2.2: Water footprint of different energy sources
Energy Source Water Footprint (m3/GJ)
Conventional/ Unconventional Liquids 4.29-8.6 (Hill and Younos, 2007)
Biofuels 37-42 (Gerbens-Leenes et al., 2009)
Natural Gas 0.1 (Gleick, 1994)
Coal 0.15-0.58 (Hill and Younos, 2007)
Nuclear 0.42-0.76 (Jacobson, 2009)
Hydroelectric 22a (Gerbens-Leenes et al., 2009)
Solar 0.037-0.78 (Jacobson, 2009)
Wind 0.001 (Jacobson, 2009)
Geothermal 0.005 (Jacobson, 2009)
Other Renewables 78 (Gerbens-Leenes et al., 2009) a Some studies estimate the water footprint of hydropower plants to be three times higher than this amount
(Mekonnen and Hoekstra, 2002).
The EIA scenarios do not provide a detailed estimation of the shares of different energy
sources from total energy production. Hence, a set of assumptions is required to calculate the
shares of the energy alternatives from total energy production, as follows:
“Conventional liquids” include crude oil and lease condensate, natural gas plant liquids,
and refinery gain; “Unconventional liquids” include oil sands, extra-heavy oil, coal-to-
liquids, gas-to-liquids, and shale oil (not including biofuels);
“Solar energy” includes solar thermal and solar photovoltaic technologies;
“Wind energy” includes wind onshore and offshore technologies;
“Hydroelectric” energy is produced by large hydropower systems associated with large
reservoirs only. While small and run-of-the-river run-of-the river hydropower systems
have smaller water footprint, they have been excluded from the study due to lack of
reliable information on their water footprint

17
“Other renewables” include wave and tidal, municipal waste, and ethanol. The water
footprint of “other renewables” is assumed to be equal to that of ethanol as it is more
prevalent than others;
The energy production values are assumed to be equal to the energy consumption values;
and
If neither production, nor consumption of energy is provided for a given renewable
energy, the generating capacity share for that type of energy is considered to be equal to
energy production/consumption share of that energy.
To determine the water footprint of conventional liquids, unconventional liquids, and
biofuels, the world’s total liquids production values given by EIA are used as a basis to calculate
the shares of these energy sources from the future energy supply portfolios (EIA, 2011). In 2005,
the world’s total liquid production was 84.6 million barrels per day (mbpd), while the world’s
conventional liquids production in that year was 82.1 mbpd (97 % of conventional liquids
production). To find the amount of conventional liquids consumed (165.75 quadrillion BTU), the
percentage of conventional liquids production was multiplied by the total liquids energy
consumption (170.8 quadrillion BTU). The values for unconventional liquids (including
biofuels) and biofuels were also found to be 2.6 and 0.7 mbpd, respectively.
The energy production from hydroelectric power, solar energy, wind energy, geothermal, and
other renewable energy sources are not explicitly listed in EIA tables and were calculated similar
to the liquid energy sources. Due to absence of the production or consumption values of
renewable energies, generation capacities were assumed to represent the shares of these
resources. Hydropower, solar energy, wind energy, geothermal, and other renewables have 773,

18
4, 60, 8, and 145 GW of generation capacities, respectively. The percent installed generation
capacity for each renewable source was found by dividing the installed generation capacity of
that renewable by the total installed generation capacity of all renewables. The total renewable
energy consumption value (45.4 quadrillion BTU) was multiplied by the percent installed
generation capacity of the aforementioned energy sources to calculate the energy production
from each source. The values of energy consumption from natural gas, coal, and nuclear energy
were explicitly listed in the EIA tables, so no additional calculation was needed. Once the shares
of different energy sources from the world’s total energy production were calculated for different
scenarios, the water footprint of energy mixes for EIA scenarios were estimated based on the
water footprint of different energy technologies to examine how energy policies are evolving
over time in terms of water consumption.
2.3 Results and Discussion
The main oil supply forecast classes, i.e., peak forecasts and quasi-linear forecasts identified
by (Bentley et al., 2009) have been the basis for development of low and high oil production
forecasts (Sorrell et al., 2010). Both forecast types indicate an increasing share for renewable
energy sources in the future, but comparing to high oil production forecasts, low oil production
scenarios assume a larger share of energy coming from renewables. According to Sorrell et al.,
EIA forecasts fall into the high oil production category in which the global oil production will
continue to rise or will plateau around year 2030 (Sorrell et al., 2010). Table 2.3 shows the
percent increase in total energy production from 2012 to 2035 based on EIA estimates (EIA,
2011).

19
Table 2.3: Percent increase in energy production for different energy sources from 2012
to 2035
Energy Source % Increase from 2012 to 2035
REF HOP LOP THOP TLOP
Conventional Liquids 17 23 21 5 42
Biofuels 114 210 75 209 75
Unconventional Liquids 180 217 128 216 129
Natural Gas 45 57 31 46 42
Coal 38 68 15 38 33
Nuclear 71 72 70 72 70
Hydroelectric 64 77 51 67 64
Solar 212 231 198 220 212
Wind 154 167 142 157 154
Geothermal 124 143 109 127 115
Other Renewables 44 55 38 50 44
According to Table 2.3, energy production from all energy sources experiences a significant
increase, implying the considerable energy demand increase in period of 2012-2035. Energy
production from all sources except oil has the highest and lowest increase rates under high and
low oil price scenarios, respectively. Although the energy production from most of the energy
sources increases dramatically, the shares of different energy sources from the world’s total
energy production do not change exceedingly in the 2012-2035 period due to increase in total
energy production. Figure 2.1 illustrates the estimated shares of energy sources from total energy
production in 2012 and 2035 based on the reference scenario.

20
(a) (b)
Figure 2.1: Shares of energy sources in world's total energy supply based on EIA
reference scenario (a) 2012; (b) 2035.
In addition, Table 2.4 shows the estimated shares of different energy sources from the world’s
total energy production in 2012 and 2035 based on other energy scenarios (HOP, LOP, THOP,
TLOP). Although the shares of energy sources under different scenarios do not vary
significantly, as illustrated in Table 2.3, they have considerably different production magnitudes.
Table 2.4: Shares of energy sources in world’s total energy supply based on EIA
scenarios
Energy Source HOP (%) LOP (%) THOP (%) TLOP (%)
2012 2035 2012 2035 2012 2035 2012 2035
Conventional 31.0 24.2 31.3 28.8 31.1 23.3 31.3 30.4
Biofuels 0.7 1.5 0.7 1.0 0.7 1.6 0.7 0.9
Unconventional 1.5 3.1 1.2 2.1 1.5 3.4 1.2 1.8
Natural Gas 22.1 21.9 22.2 22.2 22.1 22.9 22.2 21.4
Coal 27.9 29.6 28.0 24.5 27.9 27.4 27.9 25.4
Nuclear 5.5 6.0 5.5 7.2 5.5 6.7 5.5 6.4
Hydroelectric 7.6 8.5 7.6 8.7 7.6 9.0 7.6 8.5
Solar 0.3 0.7 0.3 0.7 0.3 0.7 0.3 0.7
Wind 1.8 3.0 1.8 3.3 1.8 3.3 1.8 3.1
Geothermal 0.1 0.1 0.1 0.2 0.1 0.2 0.1 0.1
Other Renewables 1.4 1.3 1.4 1.4 1.4 1.5 1.4 1.3
conventional 31.3%
biofuel 0.8%
nonconvetional 1.1%
natural gas 22.2%
coal 27.9%
nuclear 5.5%
hydro 7.6%
solar 0.3%
wind 1.8%
geothermal 0.1%
other 1.4%
(a)
conventional 25.8%
biofuel 1.2%
nonconvetional 2.2%
natural gas
22.7%
coal 27.2%
nuclear 6.7%
hydro 8.8%
solar 0.7%
wind 3.2%
geothermal 0.1% other
1.4%
(b)

21
Figure 2.2 illustrates the global energy sector’s water footprint in 2012. Figure 2.3 illustrates
the percent increase in the world’s total water footprint of energy consumption in 2020 and 2035
with respect to base values in 2012. The importance of year 2020 is that the energy targets and
mandates for some regions such as member countries of the European Union are set for this year.
Figure 2.3 indicates the future water use impacts of implemented energy policies in the future. In
2012, almost all scenarios have the same water footprint. In 2035, however, varying water use
impact of different scenarios is noticeable, among which the HOP scenario has the highest
impact in the future with 59%-66% higher water footprint than 2012. This is because under this
scenario, the share of water-intensive energy sources such as hydropower, biofuels, and
unconventional energy sources in the overall energy supply portfolio due to higher oil prices.
Figure 2.2: World’s water footprint of energy consumption in billion cubic meters
(BCM) (a) 2012 low estimation; (b) 2012 high estimation
According to Figure 2.3, the water footprint of the world’s energy sector is projected to
increase by at least 37% (LOP) and at most 66% (HOP) over the next two years, while the
0 1000 2000 3000 4000
Traditional Low Oil Prices
Traditional High Oil Prices
Low Oil Prices
High Oil Prices
Reference
(a)
0 1000 2000 3000 4000
Traditional Low Oil Prices
Traditional High Oil Prices
Low Oil Prices
High Oil Prices
Reference
(b)

22
available water resource for energy is shrinking due to increasing population and climatic
changes.
Currently, the agricultural and domestic water sectors are responsible for 70% and 10% of the
world’s freshwater consumption, respectively, leaving 20% of the total available freshwater for
the industry-energy sector (U.N. Water, 2012b). The increasing world population of 80 million
people per year together with economic development implies increased freshwater demand in the
future, putting more pressure on water resources worldwide. Based on this analysis, the amount
of world’s renewable water resources required by the energy sector increases from 4-7% in 2012
to 8-11% in 2035. This is of particular importance, if the world’s renewable water resources
remain unchanged and almost equal to the current 50,000 km3 (Gleick, 1998; CIA, 2013) and the
world needs more water and food for its increasing population. The estimated quantities,
however, depend extensively on the shares of different energy sources, especially renewables,
from the total energy production, which are not clear due to the uncertainties that exist with
regard to the long-term evolution of different energy technologies.

23
Figure 2.3: Percent increase in the World’s water footprint of energy consumption
compared to 2012: (a) 2020 low estimation; (b) 2020 high estimation; (c) 2035 low
estimation; (d) 2035 high estimation
Figure 2.4 illustrates growth of per capita water footprint of the global energy consumption
over the 2012-2035 period. For most scenarios, per capita energy’s water footprint growth rate
(13%-38%) surpasses the population growth rate (20%) and per capita energy consumption
19%
18%
17%
21%
18%
0% 10% 20% 30% 40% 50% 60% 70%
Traditional Low Oil Prices
Traditional High Oil Prices
Low Oil Prices
High Oil Prices
Reference
(a)
18% 15% 16%
18% 16%
0% 10% 20% 30% 40% 50% 60% 70%
Traditional Low Oil Prices
Traditional High Oil Prices
Low Oil Prices
High Oil Prices
Reference
(b)
54% 55%
41% 66%
50%
0% 10% 20% 30% 40% 50% 60% 70%
Traditional Low Oil Prices
Traditional High Oil Prices
Low Oil Prices
High Oil Prices
Reference
(c)
51% 47%
37% 59%
44%
0% 10% 20% 30% 40% 50% 60% 70%
Traditional Low Oil Prices
Traditional High Oil Prices
Low Oil Prices
High Oil Prices
Reference
(d)

24
growth rate (18%), implying a steeper trend in per capita water footprint of global energy
production.
Figure 2.4: Percent increase in per capita water footprint of global energy production
compared to 2012 based on different EIA scenarios.
2.4 Conclusion
The results indicate that if the 2012 energy sources proportionally keep the same shares of
energy production in the future, the global water footprint of energy production will be lower by
1-10% from the water footprint of other future energy portfolio projections. This is mainly due to
the fact that the 2012 energy portfolio excludes high shares of the water-intensive renewable
energy sources that are expected to replace today’s fossil fuels in the future. Hence, the
undeniable fact that global energy portfolios are experiencing a gradual shift toward higher
shares of renewables to reduce emissions and combat global warming is not sufficient to secure a
sustainable future (Mirchi et al., 2012). In other words, the general policy of “energy production
from renewables” is not sustainable unless accompanied by detailed analysis of the energy
0%
5%
10%
15%
20%
25%
30%
35%
40%
2013 2016 2019 2022 2025 2028 2031 2034
Pe
rce
nt
incr
eas
e in
pe
r ca
pit
a w
ate
r fo
otp
rin
t
Year
REF low
HOP low
THOP low
TLOP low
REF high
HOP high
LOP high
THOP high
TLOP high
LOP low

25
policies’ water use impacts. If the policies shift the future energy production scenarios toward
investment in more renewable energy sources with relatively high water consumption such as
biofuels and hydropower, energy-related water footprint might surpass the aforementioned
levels, leading to severe water shortage that eventually has negative feedback to energy
production. It is important to note that reduction in share of water-intensive energy resources
from the total energy production does not necessarily lead to reduction in water footprint of the
energy policies as the energy production from such resources is increasing over time.
Although the water footprint of different energy technologies varies for each power plant and
depends on the geographic variations and climate (Mekonnen and Hoekstra, 2012), the fact that
more water is needed to feed future thirsty energy sector is undeniable. The analysis shows that
projected energy policies’ water-energy ratio rises by 5%-10% in the 2012-2035 period,
implying that more water is required for generating one unit of energy. This means an increase of
37-66% during the next two decades in the amount of water required for total energy production
in the world. The amount of water that goes to the energy sector will be much higher if low oil
production scenarios are realized in the future due to higher shares of water-intensive energy
sources such as hydropower and biofuels. Hence, optimizing the energy policies with regard to
the water usage besides reducing emissions should be an important concern for policy makers
and necessary actions should be taken before water shortage becomes another global barrier to
sustainable development, if it has not become already. The energy produced from water-
intensive energy sources such as hydropower is not as ‘green’ as the energy produced from low
water consumption energy sources such as wind energy although they both have emissions far
less than fossil fuels. Therefore, future energy mix should rely more on the energy resources that

26
not only have controllable emissions, but also consume less water. In addition, future research
should focus on improving the water use of different energy technologies, especially the ones
with higher negative impacts on water resources.
The energy sector’s water footprint calculations in this chapter had some major limitations
that can be addressed in future studies. Despite its limitations, however, this study can provide
some valuable insights, if its simplifying assumptions are not overlooked, especially when
advising policy (Madani, 2013). The energy related water footprint calculations in this study
were conducted based on the limited data from EIA and did not consider technological
evolutions that result in reduction of water consumption in energy production processes over the
next decades. Therefore, it is likely that the total water footprint of global energy production falls
below or over the values suggested in this study, mostly due to variations in technology and
energy efficiency and water use policies and regulations. Furthermore, technology advancements
can contribute to improved water recycling and reuse in the energy sector, reducing the lifecycle
water footprint of energy production processes. In addition, the shares of different forms of
energy in a category was not clear from EIA databases, leading to some precision loss in
calculations of this study. For instance, the likely shares of solar thermal, solar photovoltaic,
wind onshore, and wind offshore were not specified by EIA. To overcome this ambiguity, the
water footprint of such categories were defined as ranges to address the water requirements of
different technologies within one category such as solar energy or wind energy. Here,
hydroelectricity was assumed to be produced by large hydropower systems only, ignoring the
portion of hydroelectricity supplied by small and run-of-the-river hydropower systems. This
might result in overestimation of the water footprint of hydropower as large hydropower

27
reservoirs have significant water footprints due to evaporative losses. A more detailed
composition of the world’s future energy mix provides a more reliable basis for study of the
water-energy nexus, policy analysis and management. In this study, the analysis is based on the
scenarios developed by EIA in order to cover a broad range of possible futures. Future studies
might focus on measuring the energy production’s water footprint based on the portfolios
developed by other sources such as IEA, WEC, OPEC, etc.
2.5 References
Abbasi, S. A., Abbasi, N. (2000). The likely adverse environmental impacts of renewable energy
sources. Applied Energy, 65, 121-144.
Averyt, K., Macknick, J., Rogers, J., Madden, N., Fisher, J., Meldrum, J., Newmark, R. (2013).
Water use for electricity in the United States: an analysis of reported and calculated water
use information for 2008. Environmental Research Letters, 8, 015001.
Bentley, R. W., Miller, R. G., Wheeler, S., Boyle, G. (2009). Comparison of global oil supply
forecasts Review of Evidence on Global Oil Depletion. Technical Report 7, UK Energy
Research Centre. London UK.
Brower, M. (1992). Cool Energy: Renewable Solutions to Environmental Problems. MIT press.
Carter, N. T. (2010). Energy’s Water Demand: Trends, Vulnerabilities, and Management.
DIANE Publishing.
Carter, N. T., Campbell, R. J. (2009). Water Issues of Concentrating Solar Power (CSP)
Electricity in the U.S. Southwest. CRS Report for Congress. Available online:
http://www.circleofblue.org/waternews/wp-content/uploads/2010/08/Solar-Water-Use-
Issues-in-Southwest.pdf (accessed on 20 February 2013).
CIA. Total Renewable Water Resources. Available online:
https://www.cia.gov/library/publications/the-world-factbook/fields/2201.html (accessed on
15 April 2013).
Clarke, A. D. (2012). Environmental Impacts of Renewable Energy. Doctoral dissertation. Open
University.

28
Cooper, D. C., Sehlke, G. (2012). Sustainability and energy development: influences of
greenhouse gas emission reduction options on water use in energy production.
Environmental science & technology, 46, 3509-3518.
Department of Energy (DOE). (2006). Energy Demands On Water Resources. Report to
congress on the interdependency of energy and water 2006.
Environmental Protection Agency (EPA). (2012). Study of the Potential Impacts of Hydraulic
Fracturing on Drinking Water Resources. Office of Research and Development Washington
D.C.
Fingerman, K. R., Torn, M. S., O’Hare, M. H., Kammen, D. M. (2010). Accounting for the water
impacts of ethanol production. Environmental Research Letters, 5, 014020.
Gerbens-Leenes, P. W., Hoekstra, A. Y., Van der Meer, T. (2009). The water footprint of energy
from biomass: A quantitative assessment and consequences of an increasing share of bio-
energy in energy supply. Ecological economics, 68, 1052-1060.
Gleick, P. H. (1994). Water and energy. Annual Review of Energy and the Environment. 19, 267-
299.
Gleick, P. H. (1998). The World’s Water: The Biennial Report on Freshwater Resources, 1998–
1999. Pacific Institute for Studies in Development, Environment, and Security, Oakland
California, Island Press, Washington DC, Covelo, California.
Global Footprint Network (GFN). Ecological Wealth of Nation. Available online:
http://www.footprintnetwork.org/images/uploads/Ecological_Wealth_of_Nations.pdf
(accessed on 15 May 2013)
Hadian, S., Madani, K., Rowney, C., Mokhtari, S. (2012). Toward More Efficient Global
Warming Policy Solutions: The Necessity for Multi-Criteria Selection of Energy Sources In
Proc. of the 2012 World Environmental and Water Resources Congress ASCE Albuquerque
NM USA 22–26 May 2011 2884–2892.
Hill, R., Younos, T. (2007). The Intertwined Tale of Energy and Water. Virginia Water
Resources Research Center.
Hoekstra, A. Y., Hung, P. Q. (2012). Virtual water trade A quantification of virtual water flows
between nations in relation to international crop trade. Value of water research report
series, 11 166.
International Energy Agency (IEA). (2012). World Energy Outlook 2012.
Jacobson, M. Z. (2009). Review of Solutions To Global Warming, Air Pollution, And Energy
Security. Energy & Environmental Science. 2, 148-173.

29
Macknick, J., Newmark, R., Heath, G., Hallett, K. C. (2012). Operational Water Consumption
And Withdrawal Factors For Electricity Generating Technologies: A Review Of Existing
Literature. Environmental Research Letters. 7.
Madani, K. (2013). Modeling international climate change negotiations more responsibly: Can
highly simplified game theory models provide reliable policy insights?. Ecological
Economics, 90, 68-76.
Madani, K., Rouhani, O. M., Pournazeri, S., Moradi, M., Sheikhmohammady, M. (2011). Can
We Rely on Renewable Energy Sources to Overcome Global Warming? In Proceeding of
the 2011 World Environmental and Water Resources Congress 3319-3326.
Mekonnen, M. M., Hoekstra, A. Y. (2012). The blue water footprint of electricity from
hydropower. Hydrology and Earth System Sciences, 16, 179-187.
Meldrum, J., Nettles-Anderson, S., Heath, G., Macknick, J. (2013). Life cycle water use for
electricity generation: a review and harmonization of literature estimates. Environmental
Research Letters, 8, 015031.
Mirchi, A., Hadian, S., Madani, K., Rouhani, O. M., Rouhani, A. M. (2012). World Energy
Balance Outlook and OPEC Production Capacity: Implications for Global Oil
Security. Energies, 5(8), 2626-2651.
Schlesinger, J., Hirsch, R. L. (2009). Getting Real on Wind and Solar. Washington Post
Available online: http://articles.washingtonpost.com/2009-04-
24/opinions/36790561_1_wind-power-wind-energy-electric-power (accessed on 20
February 2013).
Sorrell, S., Miller, R., Bentley, R., Speirs, J. (2010). Oil futures: A comparison of global supply
forecasts Energy Policy, 38, 4990-5003.
U.N. Water. (2012a). Coping with Water Scarcity: An Action Framework for Agriculture and
Food Security Rome.
U.N. Water. (2012b) Managing Water Report under Uncertainty and Risk The United Nations
world water development report 4, 1.
United Nations Environmental Program (UNEP). (2007). Determining the Impact of Human
Activity. Available online:
http://www.unep.org/training/programmes/Instructor%20Version/Part_2/Activities/Human_
Societies/Population/Core/Determining_the_Impact_of_Human_Activity.pdf
U.S. Energy Information Administration (EIA). (2011) International Energy Outlook 2011.

30
http://www.unep.org/training/programmes/Instructor%20Version/Part_2/Activities/Human_
Societies/Population/Core/Determining_the_Impact_of_Human_Activity.pdf (accessed on
20 February 2013)
Vartabedian, R. (2012). Rise in renewable energy will require more use of fossil fuels. Los
Angeles Times. Available online: http://articles.latimes.com/2012/dec/09/local/la-me-
unreliable-power-20121210 (accessed on 20 February 2013).
Wilson, W., Leipzig, T., Griffiths-Sattenspiel, B. (2012). Burning our rivers: the water footprint
of electricity A River Network Report. Rivers Energy & Climate Program, Oregon USA.
Wolf, C. (2012). Sustainable Development of Environmental Resources? Available online:
http://www.biotech.iastate.edu/publications/bioethics_outreach/Bioethics_in_Brief/webfiles/
1205.html (accessed on 15 May 2013)
World Bank. (2010). IDA at Work: Water Resources - Managing a Scarce, Shared Resource.
Available online: http://water.worldbank.org/publications/ida-work-water-resources-
managing-scarce-shared-resource-2010 (accessed on 01 December 2012).
World Energy Council (WEC). (2010). Water for Energy. Regency House, 1-4 Warwick Street
London W1B 5LT United Kingdom ISBN: [978-0-946121-10-6].
World Nuclear Association. Cooling power plants. Available online: http://www.world-
nuclear.org/info/cooling_power_plants_inf121.html (accessed on 15 May 2013)

31
CHAPTER 3: A SYSTEM OF SYSTEMS APPROACH TO ENERGY
SUSTAINABILITY ASSESSMENT
3.1 Introduction
Conventional fossil fuels, including oil, coal, and natural gas, have been the major sources of
energy production worldwide. These fossil fuels, however, are becoming increasingly
inaccessible in terms of extraction and reserves are gradually becoming harder to find. Many
areas around the world do not have access to sufficient fossil energy reserves and, thus, must
meet their demands through imports. This makes national energy supply plans uncertain and
insecure, due to unreliability of fossil energy availability, which can be affected by different
factors, including political stability, economic conditions, laws and legislations, and national
development plans of fossil fuel suppliers. Also, the powerful energy suppliers such as OPEC
members could affect the global energy security through their future energy production policies
(Mirchi et al., 2012). As a result, the dependency of current energy systems on the limited fossil
fuel resources endangers national energy security in many countries (UNEP, 2011).
Global warming, resulting from the concentration of the greenhouse gas (GHG) emitted from
burning fossil fuels, has been recognized as one of the obstacles to sustainable development and
planning (McDonald, 2006; USAID, 2011). Climate warming is expected to create a range of
issues, including but not limited to health and environmental problems (EPA, 2011; NRDC,
2011), rising sea levels (NCDC, 2011), changing rainfall and temperature patterns (Dore, 2005;
Mirchi et al., 2013), manipulated ecosystem productivity (Doll and Zhang, 2010), agricultural
productivity deterioration (Gohari et al., 2013), increased energy demand and prices (Guégan et
al., 2012), and limited availability of water-dependent energy sources such as hydropower

32
(Madani and Lund, 2010; Jamali et al., 2013). Many countries around the world have been
developing policies in an attempt to preserve the national energy security and to adapt to climate
change. The emerging policies are more inclined to use renewables in the future, so the ideal
future energy supply portfolios include a combination of both fossil fuels and renewables, with
the share of the renewables increasing gradually over time. For example, in the U.S., many states
have renewable portfolio standards or goals (Zonis, 2011) that require the timely increasing
production of energy from renewable sources to certain levels; in their 20/20/20 energy strategy,
European countries have set an overall mandatory target of 20% for the portion of renewable
energy in gross domestic consumption by 2020 (European Union, 2011); Denmark aims to cover
50% and 100% of the electricity demand through renewables by 2020 and 2050, respectively
(The Danish Government, 2012); and Scotland plans to fully satisfy electricity demand via
renewables by 2020 (The Scottish Government, 2012).
Sustainable development mandates establishing equilibrium between biocapacity, i.e. the area
of productive land and water available to produce resources and absorb carbon dioxide wastes,
and ecological footprint, i.e. the area of productive land and water required to produce resources
and absorb carbon dioxide wastes (GFN, 2010). According to GFN (2010), the ecological
footprint exceeded biocapacity by 44% in 2006 and is expected to surpass the biocapacity by
100% by the late 2030s, as a result of population growth and economic development, associated
with increased consumption of goods and services and natural resource exhaustion. Continuation
of this trend leads to natural resources unsustainability and eventually to ecosystem collapse
(Holmberg et al., 1999; Wackernagel et al., 2002; Foley et al., 2005; UN, 2005). In comparison
with fossil energy sources, the renewables are known to be more environmental-friendly and
33
‘green’, as they produce less carbon dioxide and other greenhouse gases. This has been the
significant motivation for proposing the immediate substitution of fossil fuels with renewables to
combat global warming. Nevertheless, what is largely ignored by such policies is the unintended
consequences emerging from the increased use of renewables, especially with respect to their
effects on other valuable natural resources (e.g., water and land) in the long run. Some renewable
energy sources, such as hydropower and biomass, consume more water than others. Additionally,
production of some of them like ethanol and biomass requires large land areas. These secondary
impacts on water and land can establish barriers to sustainable development as the pressure on a
major component of the ecosystem (e.g., land, water) can eventually yield to the failure of that
the collapse of the whole system due to interrelations of ecosystem components.
Moving toward a sustainable future requires policy actions that solve existing problems
without creating new ones (Gohari et al., 2013; Hjorth and Madani, accepted). Thus, it is
essential to consider the byproducts of our climate change solutions, affecting other valuable
natural resources. In the case of renewable energies, it is unjustifiable to invest in an energy
production method that produces minimal GHGs, yet demands considerable amounts of natural
resources (e.g. water and/or land) as well as significant financial backup in the long run.
Although active use of renewable energies might be effective in reducing greenhouse gas
emissions and the resulting climate change effects, secondary impacts on the other components
of the ecosystem, namely water and land, are inevitable if carbon footprint is the only decision
driver. As a result, the general policy of substituting fossil fuels with renewables might not be
effective unless the other aspects of the policy are also taken into consideration. Ultimately, there
is no alternative other than replacing the conventional energy sources with renewables, as the

34
current world’s energy supply profile is unsustainable in terms of energy security and
environmental impacts. However, tradeoffs should be seriously considered and the secondary
impacts on other natural resources should be minimized.
Assessment of the sustainability of energy sources must be done through a hierarchical
systems procedure that minimizes the impacts of energy production on each complex resource
system (lower level consideration) with respect to the trade-offs involved and the aggregate
impacts (higher level consideration). Because we are dealing with a larger system which itself is
composed of independent but interacting systems (water, land, climate, economy, etc.), the
hierarchical sustainability assessment procedure can be best developed within a system of
systems framework (Hipel et al., 2008; Phillis et al., 2010; Hjorth and Madani, accepted). The
schematic of this framework is shown in Figure 3.1. The objective of this chapter is to develop a
quantitative procedure within the system of systems framework (Ackoff, 1971) to estimate the
resource use efficiency of energy sources. A new resource use efficiency index is proposed
which can be used to evaluate the aggregate impact of energy sources on different resources
systems considering the existing uncertainties in estimated impacts of energy sources on each
system. The resource use efficiency scores of different energy sources are calculated to indicate
how a holistic view of energy production impacts can change the desirability of some of the
‘green’ energy sources.

35
Figure 3.1: Energy sustainability assessment as a system of systems (SOS) framework
3.2 Energy Production Impacts: Selecting Lower Level Indicators
One of the most notable secondary effects of the energy production processes is water
resources depletion. Energy is required for extraction, treatment, and distribution of water and
water is needed to produce energy (Dennen et al., 2007). While the water becomes less available,
the global water demand of the energy sector is expected to grow by 60-70% in the 2005-2035
period. Introduction of renewable energy to substitute conventional fossil energies can create
competition over water (Gerbens-Leenes and Hoekstra, 2007), especially between the food and
energy sectors with the potential to increase food prices and decrease food security (Gerbens-
Leenes and Hoekstra, 2011a). For some renewable energy sources, the amount of freshwater
used to produce a unit of energy is so high that makes them inefficient and unreliable sources of
energy in comparison to traditional sources, when water consumption is considered as a
sustainability criterion. For example, the amount of water needed to produce one unit of some
bioenergies is between 70 to 400 times larger than the water needed to produce energy from the

36
conventional primary energy sources (Gerbens-Leenes et al., 2009a). A significant amount of
freshwater (estimated to be 68 m3/GJ by Mekonnen and Hoekstra (2012)) is lost through
evaporation for hydropower, the most prevalent renewable energy source. Other renewable
energy technologies also show a large variability in direct and indirect water consumption
(Spang, 2012).
Decarbonizing the current energy systems may be the most important step in battling climate
change, but excluding water-energy nexus in energy policy evaluations results in unsustainable
solutions to climate change that create other issues such as water shortage. Given the important
role of water resources in sustainable development and considering the fact that nearly half of the
world’s population will be living in conditions of severe water stress by 2030 (OECD, 2008), the
water use efficiency of energy sources must be taken into account in energy efficiency analyses
and sustainable energy planning. This is of particular importance for countries with high water
usage such as the U.S. with an average per capita water footprint of 2,842 cubic meters per
year—105% more than world’s average water footprint (Mekonnen and Hoekstra, 2011a).
Water footprint, defined as the total amount of freshwater used to produce products (Hoekstra
and Hung, 2002; Hoekstra and Chapagain, 2007, 2008), is a reliable metric for water use
efficiency. Water footprint for products and services including energy sources, energy
applications, and energy utilization modes have been explored in a number of studies. Gleick
(1994) calculated the consumptive water use of energy production for different energy sources
and concluded that energy planning is highly dependent on the available regional water
resources. Gerbens-Leenes and Hoekstra (2011a) studied water footprints of different modes of
transport based on first generation biodiesel, bio-ethanol and bio-electricity and concluded that

37
electricity is much more efficient than biofuels in terms of water footprint. Gerbens-Leenes et al.
(2009a) calculated the water footprint of energy from biomass for fifteen crops, emphasizing that
the large difference between the average water footprint of biomass and the average water
footprint of primary energy carriers makes bioenergies inefficient in terms of water use.
Mekonnen and Hoekstra (2012) estimated the blue water footprint (the volume of surface and
ground water consumed in the energy production process) of electricity from hydropower for a
number of hydropower plants to be equivalent to 10% of global blue water footprint of crop
production, concluding that hydropower is a significant water consumer. Other studies of water
use of energy sources include Gerbens-Leenes et al. (2008 and 2009b), Fader et al. (2011),
Gerbens-Leenes and Hoekstra (2011b), and Mekonnen and Hoekstra (2010, 2011b and 2011c).
Table 3.1 indicates the water footprint of different energy sources.
Similar to water, as one of the principal ecosystem components, land also plays a significant
role in maintaining a balanced ecosystem state and if deteriorated, can endanger the ecological
cycles. Examples of negative land use impacts on the ecosystem include ecosystem productivity
degradation (Vitousek, 1997), biodiversity loss (Pimm and Raven, 2000), soil erosion (Tidman et
al., 2001), carbon cycle disruption and climate change (Houghton et al., 2002; Pielke et al.,
2002), and water quality deterioration (Matson et al., 1997; Bennet et al., 2001). Similar to the
water-energy nexus, the land-energy nexus must be considered in developing sustainable energy
plans as they affect land use and the global ecological footprint. Some energy sources such as
nuclear have comparatively small land footprints, while others, such as biomass and ethanol,
have large land footprints when compared to others. Indeed, improving energy efficiency and

38
energy conservation can both decrease the land footprint of energy by reducing the need for
further energy production infrastructure (Outka, 2011).
Land use practices are highly affected by the energy lifecycle including the location of
extraction and travel distances between different energy production and transportation steps.
Similarly, energy production can be influenced by land use patterns. For example, energy
production from energy crops requires suitable land, resulting in competition with food crops
with implications for food prices (Dale et al., 2011). Satisfying the U.S. 2005 electricity demand
via wind power, for example, would need an area equal to the combined area of Texas and
Louisiana. Using biofuels to generate the same amount of energy that can be produced by a
1,000 MW nuclear powerplant would require 2,500 square kilometers of land (Ausubel, 2007).
Recognizing land use as another energy sustainability criterion might make some energy
production options inefficient and unsustainable. In its 20/20/20 energy policy, for instance, the
European Union (EU) determined a minimum target of 10% for biofuels in 2020 (EU, 2011). In
the U.S., according to Energy Independence and Security Act of 2007, 136 billion liters (36
billion gallons) of biofuel from corn and cellulosic crops should be produced in 2022 (Pimentel,
2009). According to a study by Shell (2008), a 200% increase in the usage of biomass as an
energy source is expected by 2050, accounting for 15% of the total energy use. Given the
significant land use impacts of biofuels, their sustainability as a solution to global warming is
questionable. A number of studies have been focusing on the land use intensity of energy
sources, including McDonalds et al. (2009), Fthenakis and Kim (2009), and Lovins (2011). Table
3.1 shows the values for the land footprint of different energy sources, defined as direct and
indirect amount of land used for energy production purposes (Lugschitz et al., 2011).

39
While environmental impacts of energy production has received attention in the recent
decades, economics of energy remains to be a determinant parameter in developing sustainable
energy plans. This is especially true in the face of growing energy prices at the global scale with
energy producers trying to maximize their profit by maximizing the least-cost energy production.
Several studies have investigated the cost of various energy sources. Energy costs are usually
expressed as levelized costs, reflecting the capital costs, fuel costs, fixed and variable operation
and maintenance costs, financing costs, and utilization rate for each energy option (ICCEPT,
2002; Cosijns and D’haeseleer, 2007; Lazard, 2009; EPRI, 2011; EIA, 2011a). Table 3.1 shows
the levelized cost of different energy sources.
Life cycle-based energy production impact indicators such as levelized cost, carbon footprint,
water footprint, and land footprint provide invaluable information about the effects of energy
production on different interacting systems (economy, climate, water, and land) within a coupled
human-natural system of systems. Nevertheless, individually, they fail to provide sufficient
information for evaluating the overall resource use efficiency of energy sources and their
sustainability. Thus, a system of systems perspective is required to develop a holistic
understanding of the aggregate effects of energy sources on the larger human-natural system.
The lack of such perspective has been the major cause of our rushed movements to replace fossil
energy sources with the renewable and green energy sources. This research intends to bridge the
gap in our understanding of the overall impacts of energy sources on human-natural systems to
re-evaluate the sustainability of our energy production policies. As a proof-of-concept study, this
work considers levelized cost, carbon footprint, water footprint, and land footprint as lower level
system indicators and proposes a method for aggregating them at the system of systems level.

40
Table 3.1 indicates the average global-scale performances of different energy sources under
the four lower level criteria considered in this study. The provided information is based on an
extensive review of the information in the literature. Some of the table values are given in
intervals, reflecting the uncertainties involved in the energy performances resulting from
technological, geographic, geologic, and other variations at the global scale. The carbon footprint
values are based on Life Cycle Assessment (LCA) studies, which take into account emissions
during life cycle of the energy production. The values for water footprint reflect the water used
during different production phases to produce one unit of energy. Where data were taken from
different sources, the values were checked for consistency with respect to different assumptions
behind estimations in each study. The levelized cost values for different energy sources in this
study are primarily chosen from ICCEPT (2002) and Cosijns and D’haeseleer (2007). Given the
assumptions used in these studies, their numbers are more applicable globally than at a regional
basis. In order to account for the uncertainties involved in the long term cost estimations, the
ranges used in this study are based on the interest rate used in the original studies (10%). It is
also assumed that all technologies become mature after 2020, so the levelized cost of one unit of
energy from different sources becomes almost constant over a long period. When required, the
euro to dollar conversion rate was assumed to be 1.30. When cost data were extracted from
different studies, they were adjusted for the differences between measures, such as currency and
the year of calculation. The levelized cost of electricity from various biomass and ethanol
sources were not clear in the reference studies.

41
Table 3.1: Carbon footprint, water footprint, land footprint, and cost of energy sources
Energy Type Carbon Footprint (g CO2/kWh) Water Footprint (m3/GJ) Land footprint (m
2/GWh) Cost (cent/kWh)
Ethanol from corn 81-85 (Hill, 2006) 78 (Gerbens-Leenes et al.,
2009)
10667-12500 (McDonald et
al., 2009) 2-4 (ICCEPT, 2002)
Ethanol from sugar
cane 19 (Oliveira, 2008)
99 (Gerbens-Leenes et al.,
2009)
9520 (McDonald et al.,
2009) 2-4 (ICCEPT, 2002)
Biomass: wood-chip 25 (Parliamentary Office of
Science and Technology, 2006)
42 (Gerbens-Leenes et al.,
2009)
14433-21800 (McDonald et
al., 2009) 4-10 (ICCEPT, 2002)
Biomass: miscanthus 93 (Parliamentary Office of
Science and Technology, 2006)
37 (Gerbens-Leenes et al.,
2009)
14433-21800 (McDonald et
al., 2009)*
4-10 (ICCEPT, 2002)
Solar thermal 8.5-11.3 (Jacobson, 2009) 0.037-0.780 (Jacobson,
2009)
340-680 (McDonald et al.,
2009) 4-10 (ICCEPT, 2002)
Solar photovoltaic 12.5-104 (World Energy Council,
2004) 0.042 (Jacobson, 2009)
704-1760 (McDonald et al.,
2009)
10.9-23.4 (Cosijns and
D’haeseleer, 2007)
Wind: onshore 6.9-14.5 (World Energy Council,
2004) 0.001 (Jacobson, 2009)
2168-2640 (McDonald et
al., 2009)
4.16-5.72 (Cosijns and
D’haeseleer, 2007)
Wind: offshore 9.1-22 (World Energy Council,
2004) 0.001 (Jacobson, 2009) 2168-2640
** 3.64-8.71 cent/kWh (Cosijns and
D’haeseleer, 2007)
Wave and tidal 14-119 (Jacobson, 2009) 0.001 (Jacobson, 2009) 33-463**
5-15 (ICCEPT, 2002)
Hydropower 2-48 (NEI, 2012) 22 (Gerbens-Leenes et al.,
2009)
538-3068 (McDonald et al.,
2009)
3.25-12.35 (Commission of
European Communities, 2007)
Coal 834-1026 (World Energy
Council, 2004)
0.15-0.58 (Hill and Younos,
2007)
83-567 (McDonald et al.,
2009)
3.77-5.85 (Cosijns and
D’haeseleer, 2007)
Oil 657-866 (World Energy Council,
2004)
4.29-8.6 (Hill and Younos,
2007)
1490 (McDonald et al.,
2009) 8-10 (ICCEPT, 2002)
Natural gas 398-499 (World Energy Council,
2004) 0.1 (Gleick, 1994)
623 (McDonald et al.,
2009)
5.46-11.96 (Cosijns and
D’haeseleer, 2007)
Nuclear 9-70 (Jacobson, 2009) 0.42-0.76 (Jacobson, 2009) 63-93 (McDonald et al.,
2009)
4.55-5.46 (Cosijns and
D’haeseleer, 2007)
Geothermal 15.1-55 (Jacobson, 2009) 0.005 (Jacobson, 2009) 33-463 (McDonald et al.,
2009) 1-8 (ICCEPT, 2002)
*Assumed to be the same as biomass woodchip.
**Assumed to be the same as geothermal (Jacobson, 2009)

42
3.3 Energy Resource Use Efficiency
In essence, the complexity of energy planning resulting from social, political, technological,
economic, and ecosystem interactions requires a system of multiple criteria that should be
evaluated and included in energy policy making. Thus, a systems approach to energy planning
has been encouraged in several studies. Sims et al. (2003) analyzed the efficiency of different
energy sources for their economic and carbon mitigation potential and concluded that nuclear,
wind, hydropower and bioenergy technologies are efficient, while solar and carbon sequestration
technologies are not. The World Energy Council (2004) compared energy systems using the
LCA method, emphasizing the importance of considering different criteria in energy systems
analysis, such as energy accessibility (representing costs of energy), energy availability
(representing reliability of energy), and energy acceptability (representing environmental
impacts). This study concluded that emissions from renewables and nuclear energy are
comparable, while environmental impacts of fossil fuels could be decreased significantly if
advanced technologies are applied. Abulfotuh (2007) emphasized the importance of considering
the links between energy use, economic growth, and the environmental impacts of excessive use
of energy in energy and environmental problems. Wang et al. (2009) reviewed published
literature on Multi-Criteria Decision-Making (MCDM) applications in sustainable energy
planning and concluded that efficiency, investment cost, CO2 emissions and job creation criteria,
associated with technical, economic, environmental and social attributes, have been the main
focus of previous research. Zhao et al. (2009) evaluated various power supply technologies based
on the Analytic Hierarchy Process (AHP) and concluded that from a sustainability perspective,

43
hydropower and solar power are the best and the worst alternatives, respectively. Jacobson
(2009) reviewed the possible solutions to climate change, air pollution, and energy security,
taking into account the unintended effects on water supply, land use, wildlife, resource
availability, thermal pollution, water chemical pollution, nuclear proliferation, and under-
nutrition. He ranked a range of nonrenewable and renewable energy sources based on the
aforementioned criteria without considering cost as a determining factor and concluded that
wind, concentrated solar power (CSP), geothermal, tidal, solar, wave, and hydropower are the
best options for electricity generation, while biofuels are the worst. Roth et al. (2009) studied
sustainability of current and future electricity supply technologies from the environmental, social
and economic points of view and reported hydropower, geothermal, and biogas technologies as
the best energy alternatives. Chatzimouratidis et al. (2009a) evaluated powerplants based on
technological, sustainability, and economic criteria using AHP and suggested renewable energy
and fossil fuel powerplants as the best and the worst options among ten different alternatives.
Oberschmidt et al. (2010) evaluated energy alternatives for electricity and heat supply using a
Modified PROMETHEE method and concluded that renewable sources are more promising.
Kahraman et al. (2009), Kahraman and Kaya (2010), and Kaya and Kahraman (2010) ranked
different renewable energies that are best suited for future investment in Turkey, taking into
account their technical, economic, environmental, political, and social aspects and suggested
wind power as the best alternative. San Cristobal (2011) investigated various renewable energy
sources in Spain based on different criteria, such as power, investment ratio, implementation
period, operating hours, useful life, operation and maintenance costs, and tons of CO2 avoided.
He found biomass, wind, and solar energies to be the best alternatives.

44
The relatively high number of systems methods applications in energy planning reflects the
fact that the field has correctly realized the complexity of the problem and identified the proper
framework for problem analysis. However, significant differences between the study results
indicate the inconsistency in the assumptions and methods applied in previous studies due to
three major limitations:
a) Notion of optimality: Given the difference in the notion of optimality, various multi-
criteria assessment methods produce different ‘optimal’ outcomes and rankings of
different energy alternatives. This makes the study results highly sensitive to the choice
of multi-criteria assessment method. Therefore, there is a need to develop a more robust
assessment method, which minimizes the sensitivity of results to the analyst choice of
multi-criteria assessment method.
b) Performance variability and uncertainty: Performance of energy production options under
different assessment criteria (carbon footprint, water footprint, cost, etc.) depends on a
variety of factors, including regional conditions and technology maturity. Therefore,
estimation of the performance values at a large scale (e.g. global) becomes challenging
and controversial. While some studies have suggested different methods to consider
uncertainty in energy planning (Rylatt et al., 2001; Gamou et al., 2002; Borges and
Antunes, 2003; Mavrotas et al., 2008; Chen et al., 2007; Cai et al., 2011b; Li et al.,
2011b; Wang et al., 2010; Zang et al., 2012; Zhou et al., 2012) most of the literature
overlooks the high level of uncertainty in performance values at different geographical
scales. Conventionally, energy planning studies use deterministic performance values
and/or use different methods which provide deterministic outputs despite the stochastic

45
input information, hiding the risks associated with the study results. Therefore, there is a
need to develop a method, which considers the uncertainties involved and informs the
decision makers about the uncertainties impacts on assessment results and their
robustness.
c) Lack of a reliable aggregating index: As discussed, different system level life-cycle
indicators (water footprint, carbon footprint, etc.) provide valuable information, but the
literature lacks a reliable aggregating indicator, which can provide useful quantitative
information to the decision maker. Normally, performance aggregation is done using one
of the multi-criteria decision making methods, which makes the aggregation process
highly sensitive to the choice of method, while the final output provides meaningless
quantitative information to the decision maker. Therefore, there is a need to develop a
robust aggregating indicator at the appropriate level (system of systems level) which
conveys useful quantitative information to decision makers with respect to performance
uncertainness and the lower level indicators.
In this dissertation, a quantitative method is developed which addresses these limitations. To
counterbalance the bias toward definition of optimality by a single analysis method and increase
the robustness of results, this study employs multiple MCDM methods. Among the many
methods available for multi-criteria analysis, five MCDM methods (Table 3.2) are applied here
to investigate the resource use efficiency of different energy sources. The selected methods are
mostly suitable for social planner problems (Linkov et al., 2004, 2005; Madani et al., 2013), in
which a central decision maker is interested in identifying the system-wide optimal solution. To
account for performance uncertainties (Table 3.1), multi-criteria assessment is combined with a

46
Monte-Carlo selection. This type of problem analysis, common in multi-criteria assessment
under uncertainty (Madani and Lund, 2011; Madani et al., 2011; Shalikarian et al., 2011;
Rastgoftar et al., 2012; Read et al., 2013) maps the stochastic decision making problem into
numerous (100,000 in this case) deterministic problems by generating random numbers from the
uncertainty intervals for all the energy sources. Each deterministic decision making problem is
then solved and the energy sources are ranked using each MCDM method with respect to the
four lower level criteria (carbon footprint, water footprint, land footprint, and cost). The winning
probability of each alternative at each rank under each MCDM method is then calculated based
on the results of 100,000 deterministic MCDM analyses. The winner alternative at each rank is
selected to establish the final ranking under each MCDM method. Further details about this
procedure can be found in Mokhtari et al. (2012) and Mokhtari (2013). For detailed
mathematical descriptions of the five MCDM methods used in this study (Table 3.2), readers are
referred to Madani et al. (2013).
Given that the overall rankings of the alternatives under each MCDM method are not
necessarily identical (due to their different notions of optimality) there is a need for an
aggregation method for establishing the overall ranking method, which is more robust.
“Resource use efficiency” is proposed as a system of system index to evaluate the overall
resource use efficiency of energy alternatives with respect to the four evaluation criteria and the
performance uncertainties. The value of this index can be identified for each alternative using the
following equation:
(1)
where:

47
; : number of MCDM methods; : Borda score of alternative i
(Borda score is the sum of the scores (ranks) given to each energy alternative by each MCDM
methods (Sheikhmohammadi and Madani, 2008)); and : resource use efficiency of
alternative i. varies from 0 to 100, where 0 is given to the absolute worst and 100 is given
to the absolute best alternative.
Table 3.2: MCDM methods
Method Notion of Optimality
Dominance Selects the non-dominated option based on Pair-wise comparisons of the
alternatives
Maximin Selects the alternative with the maximum lowest performance under all criteria
Lexicographic Selects the most desirable alternative for the most important criterion
TOPSIS Selects the alternative with the minimum distance from the ideal performance
SAW Selects the alternative with the highest weighted performance
3.4 Results
Table 3.3 shows the overall ranking of energy alternatives based on different MCDM
methods. These rankings are based on the winning probabilities calculated using the Monte-
Carlo MCDM method (Mokhtari et a., 2012; Mokhtari, 2013) with 100,000 rounds of selection.
In this chapter, the four lower level resource use efficiency criteria are assumed to be equally
important to the central energy planner. This assumption is not true in case of regional restriction
in availability of one or more of the main resources (e.g. water and land). So, the weights can be
adjusted accordingly considering the decision maker(s)’ preferences at the local level. The
results reported here are based on a global scale analysis with equally weighted criteria.
As expected, the rankings under different MCDM methods are not identical. A more robust
ranking can be established based on the resource use efficiency scores of the energy alternatives,

48
which can be calculated based on the ranking results (Table 3.3) using Equation 1. Figure 3.2
shows the value of resource use efficiency for each energy alternative. In this figure, energy
sources have been categorized into three groups (highly efficient, efficient, inefficient) based on
their resource use efficiency scores. While the first group does not include any fossil energy
sources, reflecting the desirability of most renewable energy sources, biofuels belong to the
inefficient energy group with low efficiency scores together with coal and oil. This finding
proves that renewable energies are not necessarily ‘green’ when a system of systems perspective
is adopted. On the other hand, some energy sources such as nuclear and natural gas can be
competitive with most renewable energies based on their overall resource use efficiency. The
fact that no energy resource has received an efficiency score of 100 or 0 shows that there is no
strictly dominant (best) and strictly dominated (worst) energy supply option, due to the
performance value uncertainties.

49
Table 3.3: Ranking of the energy sources based on different MCDM methods
Energy Type Dominance Maximin SAW Lexicographic TOPSIS
Ethanol from corn 12 9 15 13 15
Ethanol from sugar cane 10 12 12 7 13
Biomass: wood-chip 15 13 10 10 10
Biomass: miscanthus 14 11 13 15 11
Solar thermal 3 5 2 5 2
Solar photovoltaic 9 14 7 6 7
Wind: onshore 1 2 4 1 5
Wind: offshore 4 4 6 2 6
Wave and tidal 6 8 5 3 4
Hydropower 8 6 8 12 8
Coal 7 15 11 9 14
Oil 13 10 14 14 12
Natural gas 11 7 9 11 9
Nuclear 5 3 3 8 3
Geothermal 2 1 1 4 1
Figure 3.2: Resource use efficiency scores of different energy sources (0-100)
EIA (2011b) only foresees a 0.06% increase in share of geothermal in the global energy
supply portfolio in the period of 2011-2035. However, while geothermal is not the best energy
option in terms of energy production costs or emissions, it has the highest resource use efficiency
0
10
20
30
40
50
60
70
80
90
100
RU
E

50
score (94) based on the four efficiency criteria considered in this analysis. This clearly shows
how a holistic view of energy production effects on different resources using a system of systems
approach can change desirability of an energy source, which is not highly desirable based on one
or two specific criteria. While expansion of geothermal energy is encouraged based on the results
here, different conditions and limitations exist in increasing the geothermal energy supply such
as the availability and deepness of geothermal vents as well as the required technologies.
Similar to geothermal energy, wind (onshore and offshore) is one of the most efficient energy
sources (resource use efficiency score=88) based on a system of systems perspective. However,
the share of wind energy is supposed to increase by only 1.5% in the next two decades (EIA,
2011b). The small increase in the share of wind from the world’s total energy production could
be related to the geographic limitations as well as the cost of energy production from wind in
countries in which this energy source is still immature. In many advanced economies, however,
the energy production from wind is increasing rapidly. For instance, wind energy has had a
growth of more than 2,000% in the U.S. during the 1995-2009 period (EIA, 2012b).
Solar thermal is the next most resource use efficient energy source (resource use efficiency
score=83). Compared to solar photovoltaic (resource use efficiency score=46), solar thermal is
more efficient due to lower carbon, land, and economic footprints, whereas solar photovoltaic is
gaining more popularity due to accessibility of this technology and its ease of use without serious
concerns about its overall resource use efficiency. From a resource use perspective, the
efficiency of solar photovoltaic could be increased by improving the production technology and
recycling PV materials after their useful life (Fthenakis, 2000). This yields a lower emission,

51
cost, and land use per unit of energy production and makes this energy alternative more resource
use efficient.
According to Figure 3.2, nuclear energy with the resource use efficiency score of 76 is the
most attractive nonrenewable energy source. Although safety issues, international laws and
regulations, nuclear waste, and the lack of required technologies and materials could be the main
barriers to further development of this energy, when looked at from a resource use perspective,
nuclear energy is more efficient compared to some renewables such as hydropower, solar
photovoltaic, ethanol, and biofuels.
Wave and tidal energies are renewable energy sources with a relatively high resource use
efficiency score (70). Despite their power generation inefficiency, that yields fairly high carbon
footprint and cost, their low water use and land use make them more efficient compared to more
popular renewable power sources such as hydropower, solar photovoltaic and biofuels. However,
technological barriers, production costs, and limitations in large-scale implementation of these
technologies, are the main reasons for small share of such wave and tidal technologies from the
world’s total energy supply.
Hydropower has been the most commonly used renewable energy source for a long time.
However, it has a resource use efficiency score of 47 because of its considerable water footprint
(due to evaporative losses from hydropower reservoirs) and land footprints (due to the area of
land required for the reservoir and other hydropower facilities). While this study uses the average
performance values for evaluating the overall resource efficiencies, it must be noted that high
water and land footprints are not concerning issues in case of small and run-of-river hydropower.

52
Therefore, these energy sources are expected to have higher resource use efficiencies under
considered sustainability indicators in this study.
Natural gas (resource use efficiency score=40) is the most resource use efficient fossil fuel.
Compared to coal (resource use efficiency score=27) and oil (resource use efficiency score=17),
natural gas has lower carbon and water footprints. Resource use efficiency of natural gas is very
close to some renewable energy sources such as hydropower and solar photovoltaic. Also, it is
more efficient than biofuels, whereas it is not a competitive energy option if climate change or
low-cost energy production are the only concerns. Among all types of fossil fuels, natural gas is
capable of becoming more competitive to other renewables if its cost and carbon emissions are
lowered.
Despite their relatively low costs, biofuels (resource use efficiency scores of 24 and 16) and
different types of ethanol (resource use efficiency scores of 30 and 16) are among the least
efficient alternatives from resource use perspective. This is mainly because of the considerable
land and water footprints of these energy sources. While the current energy policies in different
parts of the world promote biofuel and ethanol as reliable energy alternatives to fossil fuels
(European Union, 2011; Pimentel et al., 2009), the results suggest that a system of systems
perspective that considers their secondary impacts on land and water resources, makes these
energies very inefficient overall.
Overall, the obtained results suggest that not all renewable energy sources are necessarily
‘green’ as they are generally perceived when the evaluation is based on system of systems
perspective. However, this does not mean that our current reliance upon fossil fuels should be
continued to avoid ecosystem damages by excluding renewables in the energy supply mix.

53
Instead, we need to invest in technological improvements that make renewable energy sources
more efficient, mostly in terms of land and water use efficiency. Some renewables such as solar
photovoltaic, hydropower, biofuels, and ethanol need more attention if we do not like to mitigate
climate change by exhausting other valuable natural resources. A system of systems approach
helps us understand the trade-offs involved between the effects of energy production on different
components of the complex human-natural system that we are part of.
3.5 Robustness And Sensitivity
The method used here orders energy alternatives under each MCDM method based on their
winning probabilities at each rank. Once the option with the highest winning probability is
determined as the best alternative (rank 1) based on a given MCDM method, this option is
removed from the alternatives set and the winning probabilities are calculated for the remaining
options by repeating the same process. While the input performance values are certain, the
overall resource use efficiency scores are deterministic. This might hide the uncertainty
associated with the calculations from the decision makers. To inform the decision makers about
the risks associated with selection of different alternatives, the standard deviation of the
efficiency score of each energy alternative can be reported. Standard deviation of efficiency
score of each alternative is calculated based on the ranking distribution (probability distribution
of getting selected at different ranks) and reflects the degree of robustness of calculated
efficiency scores (Madani et al., in review).
Table 3.4 presents the standard deviation of the resource use efficiencies of different energy
alternatives calculated based on the proposed Monte-Carlo MCDM method with 100,000 rounds

54
of sampling. Relatively low standard deviation values imply a high degree of robustness in the
calculated resource use efficiency scores. Among all sources, hydropower, nuclear, as well as
wave and tidal energies have the least robust resource use efficiency sources under the existing
performance values, while solar thermal, onshore wind, and ethanol have the most robust
efficiency scores.
Table 3.4: Energy sources’ standard deviation of resource use efficiency scores
Energy Type Standard deviation (%)
Ethanol from corn 2.84
Ethanol from sugar cane 2.70
Biomass: wood-chip 3.96
Biomass: miscanthus 4.13
Solar Thermal 1.63
Solar Photovoltaic 3.82
Wind: Onshore 2.25
Wind: Offshore 3.32
Wave and Tidal 4.03
Hydropower 4.87
Coal 3.29
Oil 3.00
Natural Gas 3.06
Nuclear 4.16
Geothermal 3.70
In addition to information on degree of robustness, decision makers can benefit from learning
about the sensitivity of efficiency scores to exclusion/inclusion of different criteria from the
analysis. Sensitivity analysis helps with understanding the drawbacks of different energy sources
that make them inefficient overall and the need to address them in order to improve the
efficiency score significantly. For example, learning the fact that the high water footprint of
biofuels is one of the main reasons for their inefficiency would encourage decision makers to
invest in technological improvements that can help to minimize the biofuels water footprint.

55
Moreover, given that the importance of different resource use efficiency criteria (carbon
footprint, water footprint, etc.) varies among regions depending on the availability of local
resources, sensitivity analysis information can help selecting the best local energy supply
sources. For example, hydropower could be a desirable renewable resource where water and land
availability is not a limitation (e.g., Canada).
To examine the sensitivity of resource use efficiency scores of different energy sources to the
four criteria in this study (carbon footprint (C), water footprint (W), land footprint (L), and cost
($)) the analysis was repeated using all subsets of these equally weighted criteria. Figure 3.3
shows how the energy alternatives’ resource use efficiency scores vary depending on the criteria
considered. Generally, efficiency scores are highly sensitive to the set of evaluation criteria.
However, the degree of sensitivity varies among different energy options. For example, while oil
shows a lower degree of sensitivity (difference between the maximum and minimum efficiency
scores obtained), ethanol has a high degree of sensitivity. This means that desirability of
geothermal is less dependent than the desirability of ethanol on local resource availability
conditions.

56
Figure 3.3: Sensitivity of energy sources’ resource use efficiency to uncertainties in
resource availabilities and limitations
Generally, the resource use efficiency sensitivity scores (Figure 3.3) are independent of the
resource use efficiency values (Figure 3.2). Desirability of energy sources might be or not be
highly sensitive to local resource availability conditions irrespective of their overall efficiency
scores. Geothermal energy shows the lowest sensitivity (minimum difference between the
maximum and minimum efficiency scores obtained) to resource availability conditions (the
considered criteria).. High resource use efficiency score coupled with low sensitivity makes
geothermal energy both efficient and reliable, if the required geographic and geological
conditions for implementing this energy option are available. Although onshore and offshore
wind energy sources have high efficiency scores, their scores are fairly sensitive to resource
availability conditions, making these options undesirable where land availability is an important
concern for the decision makers. Contrary to solar photovoltaic, solar thermal shows low
resource use efficiency sensitivity to different resource availability constraints. The resource use
0
10
20
30
40
50
60
70
80
90
100 C
W
L
$
CW
CL
C$
WL
W$
L$
CWL
CW$
CL$
WL$
CWL$ (RUE)

57
efficiency of solar thermal, however, is highly sensitive to the cost criterion, meaning that solar
thermal is not a competitive energy option in poor economies. Nuclear energy shows a lower
sensitivity to different resource availability conditions when compared to some renewable
sources like wind, solar photovoltaic, and wave and tidal. With the lowest land use among all
energy sources as well as low costs, the nuclear energy could become more resource use efficient
if its water footprint is improved significantly. Nevertheless, with the Fukushima experience,
future studies need to carefully reconsider the land footprint estimations for nuclear energy, as a
significantly larger land use might be required (e.g. required expansion of protected/undeveloped
zone around nuclear plants) to increase the safety of nuclear facilities. Similar to wind energy,
wave and tidal energies show high resource use efficiency sensitivity and lose as energy
production cost becomes more important to the decision maker. Hydropower has one of the
lowest sensitivity values among all energy sources, meaning that the resource use efficiency of
this energy source is not considerably dependent on resource limitation conditions. Natural gas
shows a relatively low sensitivity. Although natural gas is not an appropriate energy option when
GHG emissions are the main concern, its overall resource use efficiency score coupled with its
fairly low sensitivity, could make natural gas an appropriate energy resource in some parts of the
world depending on the local resource availability conditions. Oil has a low efficiency score
sensitivity to resource availability, as the major source of energy in industrial and transportation
sectors in many countries despite its significant environmental impacts. Desirability of biofuels
is highly dependent on resource availability conditions, except for biomass from miscanthus,
which has a fairly low sensitivity range. The resource use efficiency score of biofuels can
improve significantly by improving their water use efficiency (lowering their water footprint).

58
3.6 Conclusions
Current energy production systems are extensively dependent on continued supply of natural
resources such as water and land, as well as economic resources, while producing considerable
amount of greenhouse gas emissions that result in climate warming. To achieve a sustainable
energy mix that addresses the increasing energy demand and energy security with minimal
impacts on our scarce resources, we need to consider the interactions of energy production with
such independent systems (water, land, climate, economy) under existing uncertainties. Hence, a
higher level system (system of systems) that accounts for the trade-offs between lower level
components. In this chapter, a system of systems framework was proposed to measure the
resource use efficiency of energy sources with respect to such trade-offs. For this purpose, a
stochastic multi-criteria analysis framework is created to calculate the resource use efficiency
scores under different sustainability criteria, e.g. carbon footprint, water footprint, land footprint,
and costs of energy production under performance uncertainties. Such assessment framework is
based on utilization of different MCDM methods to eliminate the bias toward specific energy
sources, resulting from optimality definitions by different MCDM methods. Based on the
proposed method, geothermal and biomass from miscanthus are the best and worst energy
options, respectively. This, however, does not guarantee that high resource use efficient energy
sources (geothermal, wind, solar thermal, nuclear, and wave and tidal energies) are attractive
under all resource limitation conditions as these sources might be dominated by other energy
sources in presence of certain conditions. Hence, a sensitivity analysis is performed to measure
the variability of resource use efficiency scores of energy sources under different resource
limitation scenarios. The sensitivity analysis results indicate that geothermal and ethanol from

59
sugarcane show the lowest and highest sensitivity to availability and limitation of resources. The
impacts of existing performance uncertainties on the energies resource use efficiency scores are
also measured to determine the robustness of the resource use efficiency scores. The results of
the robustness analysis indicates that hydropower and solar thermal are the most and least robust
energy sources under existing performance uncertainties.
The results clearly indicate that from a resource use perspective, some of the renewable
energy sources such as hydropower and solar photovoltaic are not green in the current form and
biofuel and ethanol have lower resource use efficiency comparing to natural gas, mainly due to
high water and land footprints. Such sources should be improved in terms of emissions, water
consumption, land use, and production costs to make them more resource use efficient and avoid
more environmental losses in large scale energy production. In fact, use efficiency sensitivity
analysis outcomes also provide decision makers with valuable insights into potential
improvements in the efficiency of the energy technologies. This gives direction to future
investment for bettering the resource use efficiency of a certain technology by improving its
performance under one or more criteria.
This study had some limitations that could be addressed in future studies. First, the
sustainability criteria in this study were weighted equally and did not clearly reflect the
efficiency of energy sources for different regions. Although sensitivity analysis determined the
variability of the resource use efficiency scores under different resource limitation conditions,
there is still a need to consider the regional resource availability and limitations to develop a
more reliable energy plan for different regions. In addition, the feasibility of energy alternatives
in different regions should be taken into account, as not all energy sources are appropriate for all

60
regions. Furthermore, other sustainability criteria should be added to the analysis to achieve a
more reliable understanding of energy sources efficiency. Such criteria could be the energy
return on investment (EROI), safety, and other indices that reflect the social and political impacts
of energy production processes. Also, the analysis in this study was based on the assumption that
the energy sources performance under different sustainability indicators does not change over
time, while technology improvements could potentially lead to improving the performance
values used in this study. Such performance improvements could be addressed in future studies.
3.7 References
Abulfotuh, F. (2007). Energy Efficiency and Renewable Technologies: The Way To Sustainable
Energy Future. Desalination, 209, 275–282.
Ackoff, R. L. (1971). Towards a system of systems concepts. Management science, 17(11), 661-
671.
Awerbuch, S. (1993). The surprising role of risk in utility integrated resource planning. The
Electricity Journal, 6(3), 20-33.
Awerbuch, S. (1995). Market-based IRP: It's easy!!!. The Electricity Journal,8(3), 50-67.
Awerbuch, S. (2006). Portfolio-Based Electricity Generation Planning: Policy Implications for
Renewables and Energy Security, Springer, 11, 693-710.
Beltran, H. (2009). Modern Portfolio Theory Applied To Electricity Generation Planning.
University of Illinois at Urbana-Champaign, Master’s Thesis.
Bennett, E. M., Carpenter, S. R., Caraco, N. F. (2001). Human impact on erodable phosphorus
and eutrophication: a global perspective. BioScience, 51, 227–234.
Borges, A.R., Antunes, C.H. (2003). A fuzzy multiple objective decision support model for
energy-economy planning. European Journal of Operational Research 145, 304–316.
Cai, Y.P., Huang, G.H., Lin, Q.G., Nie, X.H., Tan, Q. (2009a). An optimization-model-based
interactive decision support system for regional energy management systems planning under
uncertainty. Expert Systems with Applications 36, 3470–3482.

61
Cai, Y.P., Huang, G.H., Yang, Z.F., Lin, Q.G., Tan, Q. (2009b). Community-scale renewable
energy systems planning under uncertainty—An interval chance-constrained programming
approach. Renewable and Sustainable Energy Reviews 13, 721–735.
Cai, Y.P., Huang, G.H., Tan, Q., Liu, L. (2011a). An integrated approach for climate-change
impact analysis and adaptation planning under multi-level uncertainties. Part II. Case study.
Renewable and Sustainable Energy Reviews 15, 3051–3073.
Cai, Y.P., Huang, G.H., Tan, Q., Yang, Z.F. (2011b). An integrated approach for climate-change
impact analysis and adaptation planning under multi-level uncertainties. Part I:
Methodology. Renewable and Sustainable Energy Reviews 15, 2779–2790.
Chatzimouratidis, A. I., Pilavachi, P. A. (2009a). Technological, Economic and Sustainability
Evaluation of Power Plants Using the Analytic Hierarchy Process. Energy Policy, 37, 778-
787.
Chatzimouratidis, A. I., Pilavachi, P. A. (2009b). Sensitivity Analysis of Technological,
Economic and Sustainability Evaluation of Power Plants Using the Analytic Hierarchy
Process, Energy Policy, 37, 788-798.
Chen, B., Chen, G.Q., Yang, Z.F., Jiang, M.M. (2007). Ecological footprint accounting for
energy and resource in China. Energy Policy 35, 1599–1609.
Commission of European Communities. (2007). EU Energy Policy Data.
Cosijns, L., D’haeseleer, W. (2007). Eusustel: European Sustainable Electricity; Comprehensive
Analysis of Future European Demand and Generation of European Electricity and Its
Security of Supply. Final Technical Report.
Dale, V. H., Efroymson, R., Kline, K. (2011). The land use–climate change–energy nexus.
Landscape Ecology, 26(6), pp. 755-773.
Dennen, B., Larson, D., Lee, C., Lee, J., Tellinghuisen, S. (2007). California’s Energy-Water
Nexus: Water Use in Electricity Generation. Bren School of Environmental Management
And Science, University Of California, Santa Barbara.
Doll, P., Zhang, J. (2010). Impact of Climate Change on Freshwater Ecosystems: A Global-Scale
Analysis of Ecologically Relevant River Flow Alterations. Hydrology and Earth System
Sciences Discussions.
Domingues, E. G., Arungo, H., Policurpo, J., Campinho, C. B., Paulillo, G. (2001). Applying
Modern Portfolio Theory to Investment Projects in Electric Energy Markets. IEEE Power
Tech, Porto.

62
Dooley, A. E., Sheath, G. W., & Smeaton, D. (2005). Multiple Criteria Decision Making:
Method Selection And Application To Three Contrasting Agricultural Case Studies. In 2005
Conference, August 26-27, 2005, Nelson, New Zealand (No. 98510). New Zealand
Agricultural and Resource Economics Society.
Dore, M. H. I. (2005). Climate Change and Changes in Global Precipitation Patterns: What Do
We Know? Environment International, 31(8), 1167-1181.
Electric Power Research Institute (EPRI). (2011). Program on Technology Innovation: Integrated
Generation Technology Options. Available online:
http://rfflibrary.wordpress.com/2011/07/30/program-on-technology-innovation-integrated-
generation-technology-options/
Environmental Protection Agency (EPA). (2011). Climate Change: Health and Environmental
Effects. Available online: http://epa.gov/climatechange/effects/health.html/ (Accessed on
December 28, 2011)
European Union (EU). (2007) Renewable Energy Road Map Available online:
http://europa.eu/legislation_summaries/energy/renewable_energy/l27065_en.htm/
(Accessed on December 28, 2012).
Europedia. (2012). The Importance of Energy for Europe. Available online:
http://europedia.moussis.eu/books/book_2/6/19/01/index.tkl?all=1&pos=266, (accessed on
April 1, 2012).
Fader, M., Gerten, D., Thammer, M., Heinke, J., Lotze-Campen, H., Lucht, W., Cramer, W.,
(2011). Internal and External Green-Blue Agricultural Water Footprints of Nations, and
Related Water and Land Savings through Trade. Hydrology and Earth System Sciences,
15(5), 1641-1660.
Foley, J. A., DeFries, R., Asner, G. P., Barford, C., Bonan, G., Carpenter, S. R., Chapin, F. S.,
Coe, M. T., Daily, G. C., Gibbs, H. K., Helkowski, J. H., Holloway, T., Howard, E. A.,
Kucharik, C. J., Monfreda, C., Patz, J. A., Prentice, I. C., Ramankutty, N., Snyder, P.
K. (2005). Global Consequences of Land Use. Science, 309, 570–574.
Fthenakis, V. M. (2000). End-of-life management and recycling of PV modules.Energy
Policy, 28(14), 1051-1058.
Fthenakis, V., Kim, H. C. (2009). Land Use and Electricity Generation: A Life-Cycle Analysis,
Renewable Sustainable Energy, 13, 1465–1474. International Atomic Energy Agency
(IAEA) (2001), Chernobyl FAQ.
Gamou, S., Yokoyama, R., Ito, K. (2002). Optimal unit sizing of cogeneration systems in
consideration of uncertain energy demands as continuous random variables. Energy
Conversion and Management 43, 1349–1361.

63
Gerbens-Leenes, P. W., Hoekstra, A. Y., Meer, T. (2007). The Water Footprint of Energy
Consumption: An Assessment of Water Requirements of Primary Energy Carriers. ISESCO
Science and Technology Vision, 4 (5), 38-42.
Gerbens-Leenes, P. W., Hoekstra, A. Y., Meer, T. (2008). Water Footprint of Bio-Energy and
Other Primary Energy Carriers. Value of Water Research Report Series No.29, UNESCO-
IHE.
Gerbens-Leenes, P. W., Hoekstra, A. Y., Meer, T. (2009a). The Water Footprint of Energy from
Biomass: A Quantitative Assessment and Consequences of an Increasing Share of Bio-
Energy in Energy Supply.
Gerbens-Leenes, P. W., Hoekstra, A.Y., Meer, T. (2009b). The Water Footprint of Bioenergy.
Proceedings of the National Academy Of Sciences, 106 (25), 10219-10223.
Gerbens-Leenes, P. W., Hoekstra, A. Y. (2011a). The Water Footprint of Biofuel-Based
Transport. Energy and Environmental Science, 4, 2658-2668.
Gerbens-Leenes, P. W., Hoekstra, A.Y. (2011b). The Water Footprint of Sweeteners And Bio-
Ethanol. Environment International, 40, 202-211.
Gleick. (1994). Water and Energy. Annual Review of Energy and The Environment, 19, 267–
299.
Global Footprint Network (GFN). (2010). Ecological Wealth of Nations Global Footprint
Network, San Francisco, California, USA.
http://www.footprintnetwork.org/images/uploads/Ecological_Wealth_of_Nations.pdf
Gohari, A., Eslamian, S., Mirchi, A., Abedi-Koupaei, J., Bavani, A. M., Madani, K. (2013).
Water transfer as a solution to water shortage: A fix that can Backfire. Journal of
Hydrology.
Guégan M., Uvo C. B., Madani K. (2012), Developing a Module for Estimating Climate
Warming Effects on Hydropower Pricing in California. Energy Policy, Vol. 42: 261–271,
doi: 10.1016/j.enpol.2011.11.083.
Hill, J., Nelson, E., Tilman, D., Polasky, S., Tiffany, D. (2006). Environmental, Economic, and
Energetic Costs And Benefits of Biodiesel and Ethanol Biofuels. Proceedings of the
National Academy of Sciences of the United States of America, 103(30), 11206-11210.
Hill, R., Younos, T. (2007). The Intertwined Tale of Energy and Water. Virginia Water
Resources Research Center.
Hipel, K. W., Obeidi, A., Fang, L. and Kilgour, D. M. (2008). Sustainable Environmental
Management from a System of Systems Engineering Perspective, in System of Systems
64
Engineering (ed M. Jamshidi), John Wiley & Sons, Inc., Hoboken, NJ, USA.
doi: 10.1002/9780470403501.ch18
Mekonnen, M., Hoekstra, A. Y. (2012). The blue water footprint of electricity from
hydropower. Hydrology and earth system sciences, 16, 179-187.
Hoekstra, A. Y., Hung, P. Q. (2002). Virtual Water Trade: A Quantification of Virtual Water
Flows between Nations In Relation To International Crop Trade. Value of Water Research
Report Series, No. 11, UNESCO-IHE, Delft, The Netherlands.
Hoekstra, A. Y., Chapagain, A. K. (2007). Water Footprints of Nations: Water Use By People as
a Function of Their Consumption Pattern. Water Resources Management, 21, 35–48.
Hoekstra, A. Y., Chapagain, A. K. (2008). Globalization of Water: Sharing the Planet's
Freshwater Resources. Blackwell Publishing, Oxford, UK.
Holmberg, J., Lundqvist, U., Robèrt, K-H. and Wackernagel, M. (1999). The Ecological
Footprint from a Systems Perspective of Sustainability. International Journal of Sustainable
Development and World Ecology 6:17-33.
Houghton, R. A., Hackler, J. L. (2002). Carbon flux to the atmosphere from land-use changes.
In: Trends: A Compendium of Data on Global Change. Oak Ridge National Laboratory,
U.S. Department of Energy, Carbon Dioxide Information Center, Oak Ridge, TN, USA.
Jacobson, M. Z. (2009). Review of Solutions To Global Warming, Air Pollution, And Energy
Security. Energy & Environmental Science, 2, 148-173.
Jamali S, Abrishamchi A., Madani K. (2013). Climate Change and Hydropower Planning in the
Middle East: Implications for Iran’s Karkheh Hydropower Systems. ASCE Journal of
Energy Engineering, doi: 10.1061/(ASCE)EY.1943-7897.0000115.
Kahraman, C., Kaya, I., Cebi, S. (2009). A Comparative Analysis for Multi-Attribute Selection
Among Renewable Energy Alternatives Using Fuzzy Axiomatic Design and Fuzzy Analytic
Hierarchy Process. Energy, 34, 1603-1616.
Kahraman, C., Kaya, I. (2010). A Fuzzy Multicriteria Methodology for Selection Among Energy
Alternatives. Expert Systems with Applications, 37, 6270-6281.
Kaya, T., Kahraman, C. (2010). Multicriteria Renewable Energy Planning Using an Integrated
Fuzzy Vikor & Ahp Methodology: The Case of Istanbul. Energy, 35, 2517-2527.
Lazard. (2009). Levelized Cost of Energy Analysis-Version 3.0. Available online:
http://blog.cleanenergy.org/files/2009/04/lazard2009_levelizedcostofenergy.pdf, (Accessed
On May 15, 2012).

65
Li, Y. F., Huang, G. H., Li, Y.P., Xu, Y., Chen, W. T. (2010a). Regional-scale electric power
system planning under uncertainty—A multistage interval-stochastic integer linear
programming approach. Energy Policy 38, 475–490.
Li, Y. F., Li, Y. P., Huang, G. H., Chen, X. (2010b). Energy and environmental systems planning
under uncertainty—An inexact fuzzy-stochastic programming approach. Applied Energy
87, 3189–3211.
Li, Y. P., Huang, G. H., Chen, X. (2011a). Planning regional energy system in association with
greenhouse gas mitigation under uncertainty. Applied Energy 88, 599–611.
Li, G. C., Huang, G. H., Lin, Q. G., Zhang, X. D., Tan, Q., Chen, Y. M. (2011b). Development
of a GHG-mitigation oriented inexact dynamic model for regional energy system
management. Energy 36, 3388–3398.
Linkov, I., Varghese, A., Jamil, S., Seager, T. P., Kiker, G., Bridges, T. (2004). Multi-criteria
Decision Analysis: A Framework for Structuring Remedial Decisions at the Contaminated
Sites. Comparative Risk Assessment and Environmental Decision Making, Springer, New
York, pp. 15-54.
Linkov, I., Sahay, S., Seager, T. P., Kiker, G., Bridges, T. (2005). Multi-Criteria Decision
Analysis: A Framework for Managing Contaminated Sediments. Strategic Management of
Marine Ecosystems. Berlin (De): Springer.
Lovins, A. B. (2011). Renewable Energy’s ‘Footprint’ Myth, The Electricity Journal, 24(6).
Lugschitz, B., Bruckner, M., Giljum, S. (2011). Europe’s Global Land Demand. A study on the
actual land embodied in European imports and exports of agricultural and forestry products,
Sustainable Europe Research Institute (SERI).
Madani, K., Lund, J. R. (2010). Estimated Impacts of Climate Warming on California's High-
Elevation Hydropower. Climatic Change, Vol. 102 (3-4): 521-538, doi: 10.1007/s10584-
009-9750-8.
Madani, K., Lund, J. R. (2011). A Monte-Carlo game theoretic approach for multi-criteria
decision making under uncertainty. Advances in water resources,34(5), 607-616.
Madani, K., Shalikarian, L., Naeeni, S. T. O. (2011). Resolving hydro-environmental conflicts
under uncertainty using fallback bargaining procedures. In Proceeding of the 2011
International Conference on Environment Science and Engineering (ICESE 2011) (pp. 192-
196).
Madani, K., Sheikhmohammady, M., Mokhtari, S., Moradi, M., Xanthopoulos, P. (in press)
“Multi-Criteria Decision Analysis of the Caspian Sea conflict”, Group Decision and
Negotiation, doi: 10.1007/s10726-013-9345-7.

66
Matson, P. A., Parton, W. J., Power, A. G., Swift, M. J. (1997). Agricultural intensification and
ecosystem properties. Science, 277, pp. 504–509.
Mavrotas, G., Demertzis, H., Meintani, a., Diakoulaki, D. (2003). Energy planning in buildings
under uncertainty in fuel costs: The case of a hotel unit in Greece. Energy Conversion and
Management 44, 1303–1321.
Mavrotas, G., Diakoulaki, D., Florios, K., Georgiou, P. (2008). A mathematical programming
framework for energy planning in services’ sector buildings under uncertainty in load
demand: The case of a hospital in Athens. Energy Policy 36, 2415–2429.
Mcdonald, C. T. (2006). The Impact of Global Warming on Sustainable Developments-
Mitigating The Impact: Natural Hazard Mitigation. 2nd International Solar Cities Congress
2006 at The Oxford University, Oxford, England.
Mcdonald, R. I., Fargione, J., Kiesecker, J., Miller, W. M., Powell, J. (2009). Energy Sprawl or
Energy Efficiency: Climate Policy Impacts on Natural Habitat for the United States of
America, Plos One, 4 (8) At 1–11.
Mekonnen, M. M., Hoekstra, A. Y. (2010). A Global and High-Resolution Assessment of the
Green, Blue And Grey Water Footprint of Wheat. Hydrology and Earth System Sciences,
14(7), 1259–1276.
Mekonnen, M. M., Hoekstra, A. Y. (2011a). National Water Footprint Accounts: The Green,
Blue and Grey Water Footprint of Production and Consumption. Value of Water Research
Report Series No.50, UNESCO-IHE.
Mekonnen, M. M., Hoekstra, A. Y. (2011b). The Water Footprint of Electricity from
Hydropower. Value of Water Research Report Series No.51, UNESCO-IHE.
Mekonnen, M. M., Hoekstra, A. Y. (2011c). The Green, Blue and Grey Water Footprint of Crops
and Derived Crop Products. Hydrology and Earth System Sciences, 15(5), 1577-1600.
Mekonnen, M., Hoekstra, A. Y. (2012). The blue water footprint of electricity from
hydropower. Hydrology and earth system sciences, 16, 179-187.
Mirchi, A., Hadian, S., Madani, K., Rouhani, O. M., Rouhani, A. M. (2012). World Energy
Balance Outlook and OPEC Production Capacity: Implications for Global Oil
Security. Energies 2012, 5, 2626-2651.
Mirchi, A., Madani, K., Roos, M., & Watkins, D. W. (2013). Climate Change Impacts on
California’s Water Resources. In Drought in Arid and Semi-Arid Regions (pp. 301-319).
Springer Netherlands.

67
Mokhtari, S. (2013). Developing a Group Decision Support System (GDSS) For Decision
Making Under Uncertainty. Master's Thesis. University of Central Florida, Orlando, USA.
Mokhtari S., Madani K., Chang N. B. (2012). Multi-Criteria Decision Making under
Uncertainty: Application to the California’s Sacramento-San Joaquin Delta Problem, 2012
World Environmental and Water Resources Congress, pp. 2339-2348, ASCE, Albuquerque,
New Mexico, Edited by: Loucks E. D.
National Climate Data Center (NCDC). (2011). Global Climate Change Indicators. Available
online: http://www.ncdc.noaa.gov/indicators/ (Accessed on December 28, 2011)
Natural Resources Defense Council (NRDC). (2011). Climate Change Threatens Health.
Available online: http://www.nrdc.org/health/climate/, (Accessed On December 28, 2011)
Nuclear Energy Institute (NEI). (2012). Nuclear Energy: Part of A Clean Energy Portfolio. South
Dakota Public Utilities Commission.
Oberschmidt, J., Geldermann, J., Ludwig, J., Schmehl, M. (2010). Modified Promethee
Approach for Assessing Energy Technologies. International Journal of Energy Sector
Management, 4, 183-212.
Oliveira, M. D. (2008). Sugarcane and Ethanol Production And Carbon Dioxide Balances.
Biofuels, Solar and Wind as Renewable Energy Systems, 215-230.
Organization for Economic Co-Operation And Development (OECD). (2008). OECD
Environmental Outlook To 2030: Key Results. (Accessed on December 28, 2011).
Outka, U. (2011). The Renewable Energy Footprint. Stanford Environmental Law Journal, 30,
241-309.
Parliamentary Office of Science and Technology. (2006). Carbon Footprint of Electricity
Generation. Postnote, No. 268.
Phillis, Y. A., Kouikoglou, V. S., & Manousiouthakis, V. (2010). A review of sustainability
assessment models as system of systems. Systems Journal, IEEE, 4(1), 15-25.
Pielke, R. A., Marland, G., Betts, R. A., Chase, T. N., Eastman, J. L., Niles, J. O., Niyogi, D. D.
S., Running, S. W. (2002). The influence of land-use change and landscape dynamics on the
climate system: Relevance to climate-change policy beyond the radiative effect of
greenhouse gases, Philos. Trans. R. Soc. London, Ser. A, 360(1797), 1705 – 1719.
Pimm, S. L., Raven, P. (2000). Extinction by numbers. Nature, 403, 843 – 845.
Rastgoftar, H., Imen, S., Madani, K. (2012). Stochastic Fuzzy Assessment for Managing Hydro-
Environmental Systems under Uncertainty and Ambiguity. In World Environmental and
Water Resources Congress 2012@ sCrossing Boundaries (pp. 2413-2421). ASCE.
68
Read, L., Mokhtari, S., Madani, K., Maimoun, M., Hanks, C. (2013). A Multi-Participant, Multi-
Criteria Analysis of Energy Supply Sources for Fairbanks, Alaska. In World Environmental
and Water Resources Congress 2013@ sShowcasing the Future (pp. 1247-1257). ASCE.
Rylatt, M., Gadsden, S., Lomas, K. (2001). GIS-based decision support for solar energy planning
in urban environments. Computers, Environment and Urban Systems 25, 579–603.
San Cristóbal, J. R. (2011). Multi-Criteria Decision-Making In The Selection of a Renewable
Energy Project in Spain: The Vikor Method. Renewable Energy, 36, 498-502.
Shalikarian L., Madani K., Naeeni S. T. O. (2011). Finding the Socially Optimal Solution for
California’s Sacramento-San Joaquin Delta Problem. Proceeding of the 2011 World
Environmental and Water Resources Congress, pp. 3190-3197, ASCE, Palm Springs,
California, Edited by: Beighley II R. E. and Kilgore M. W.
Sheikhmohammady, M., Madani, K. (2008). Bargaining over the Caspian Sea–the largest Lake
on the earth. In Proceeding of the 2008 World Environmental and Water Resources
Congress, Honolulu, Hawaii, doi (Vol. 10, No. 40976, p. 316).
Sheikhmohammady, M., Madani, K., Moradi, M., Behmanesh, I. (2011). Finding the Best Legal
Governance Regime for The Caspian Sea Through Multi-Criteria Decision-Making
Methods. Systems, Man, and Cybernetics (SMC). (2011). IEEE International Conference,
Pp. 3029-3034.
Sims, R. E. H., Rogner, H-H., Gregory, K.. (2003). Carbon Emission and Mitigation Cost
Comparisons between Fossil Fuel, Nuclear and Renewable Energy Resources For
Electricity Generation. Energy Policy, 31, 1315-1326.
Spang, E. (2012). A thirst for power: A global analysis of water consumption for energy
production. Global Water Footprint Discussion Paper 1246, Global Water Forum,
Canberra, Australia. Available online: http://www.globalwaterforum.org/2012/10/23/a-
thirst-forpower-a-global-analysis-of-water-consumption-for-energy-production/
The Center for International Environmental Law (CIEL). (2002). Global Warming and
Sustainable Development. Available online: http://www.ciel.org/publications/climate.pdf/
(accessed on February 15, 2012)
The Danish Government. Energy Agreement. Available online: http://www.kemin.dk/da-
dk/klimaogenergipolitik/danmark/energiaftaler/sider/forside.aspx (Accessed on June, 30,
2012)
The Scottish Givernment. Renewable Energy. Available online:
http://www.scotland.gov.uk/topics/business-industry/energy/energy-sources/19185
(Accessed on June, 30, 2012)

69
United Nations (UN). (2005). Millenium Ecosystem Assessment. Available online:
http://www.maweb.org/en/index.aspx
United Nations Conference on Sustainable Development. (2012). The Future We Want.
Available online: http://www.uncsd2012.org/thefuturewewant.html (Accessed on July 10,
2012)
United Nations Environment Programme (UNEP). (2011). Towards A Green Economy:
Pathways to Sustainable Development and Poverty Eradication. Available online:
http://www.unep.org/greeneconomy/greeneconomyreport/tabid/29846/default.aspx,
(Accessed On February 15, 2011)
U.S. Agency For International Development (USAID). Global Climate Change. Available
online: http://www.usaid.gov/our_work/environment/climate/ (Accessed on December 25,
2011).
U.S. Energy Information Administration (EIA). (2012a). EIA projects U.S. non-hydro renewable
power generation increases, led by wind and biomass. Washington D.C., U.S. Available
online: http://www.eia.gov/todayinenergy/detail.cfm?id=5170/ (Accessed on March 15,
2012)
U.S. Energy Information Administration (EIA). (2012b). International Energy Outlook 2011.
Washington D.C., U.S., 2011. Available Online:
Http://Www.Eia.Gov/Oiaf/Aeo/Tablebrowser/ (Accessed On 26 May 2012).
U.S. Energy Information Administration (EIA). (2011a). Levelized Cost of New Generation
Resources in the Annual Energy Outlook 2011. Washington D.C. Available online:
http://www.eia.gov/oiaf/aeo/pdf/2016levelized_costs_aeo2011.pdf/ (Accessed on February
15, 2012)
U.S. Energy Information Administration (EIA). (2011b). International Energy Outlook 2011.
Washington D.C., U.S. Available online: http://www.eia.gov/oiaf/aeo/tablebrowser/
(accessed on May 26, 2012)
Vitousek, P. M., Mooney, H. A., Lubchenco, J., Melillo, J. M. (1997). Human Domination of
Earth's Ecosystems. Science , 277, 494±499.
Wackernagel, M., Schulz, N. B, Deumling, D., Linares, A. C., Jenkins, M., Kapos, V., Monfreda,
C., Loh, J., Myers, N. (2002). Tracking The Ecological Overshoot Of The Human
Economy. Proceedings of the National Academy of Sciences of the United States of
America, 99, 9266–9271.
Wang, J. J., Jing, Y. Y., Zhang, C. F., Zhao, J. H. (2009). Review on Multi-Criteria Decision
Analysis Aid In Sustainable Energy Decision Making. Renewable and Sustainable Energy
Reviews, 13, 2263-2278.

70
Wang, S., Huang, G.H., Lu, H.W., Li, Y.P. (2010). An interval-valued fuzzy linear programming
with infinite α-cuts method for environmental management under uncertainty. Stochastic
Environmental Research and Risk Assessment 25, 211–222.
World Energy Council (2004). Comparison of Energy Systems Using Life Cycle Assessment.
Available online: http://www.worldenergy.org/documents/lca2.pdf (Accessed on February
15, 2012).
World Energy Council (WEC) (2009). Promoting Energy Security Through Energy Efficiency.
Wec Ethiopia-Workshop On Energy Efficiency, Addis Ababa, Ethiopia, June 29-30, 2009.
http://www.worldenergy.org/documents/ethiopia_june_30_v_gbeddy_security.pdf
Zang, H., Xu, Y., Li, W., Huang, G., Liu, D. (2012). An uncertain energy planning model under
carbon taxes. Frontiers of Environmental Science & Engineering 6, 549–558.
Zhao, J., Yang, Z., Chen, S. (2009). Multi-Criteria Evaluation of Alternative Power Supply
Using Analytic Hierarchy Process. International Conference on Sustainable Power
Generation and Supply (Supergen '09), pp. 1-7.
Zonis, M. (2011). Interactive Map Compares States’ Renewable Energy Goals.
http://www.climatecentral.org/blogs/interactive-map-to-compare-states-renewable-energy-
goals%23http://www.climatecentral.org/blogs/interactive-map-to-compare-states-
renewable-energy-goals
Zhou, Y., Li, Y., Huang, G., Zhang, W., Zhou, Y. (2012). Planning Energy and Environmental
Systems Associated with Air Pollutants Mitigation under Uncertainty. 2012 International
Conference on Biomedical Engineering and Biotechnology 1594–1597.

71
CHAPTER 4: ENERGIES’ RESOURCE USE EFFICIENCY ANALYSIS
UNDER REGIONAL RESOURCE AVAILABILITY AND LIMITATIONS:
IMPLICATIONS FOR THE UNITED STATES OF AMERICA
4.1 Introduction
Increasing the share of renewable energy sources in the global energy mix is a key component
of energy policies worldwide for alleviating global warming (Hvelplund and Lund, 1998; Lund
et al., 2000, 2003; Perdan and Clift, 2004; Duic and da Graça Carvalho, 2004; Hennicke, 2004;
Lund et al., 2005) and energy insecurity (Awerbuch, 2006; Yergin, 2006; Flavin et al., 2006).
For instance, Denmark’s energy policy calls for sourcing 100% of the energy from renewables
by 2050 (Lund and Matheisen, 2009). The Scottish government will strive to produce 40% of its
electricity from renewable energies by 2020 (Scottish Executive, 2003). Similarly, European
Union Energy Council (2008) aims to provide 20% of its energy from renewables by 2020, while
in China the share of renewables will increase to 16% of total primary energy (Martinot et al.,
2007). To date, the U.S. has no federally defined renewable energy target (Delmas and Montes-
Sancho, 2011). However, mandates such as Renewable Portfolio Standard (RPS) and the
Mandatory Green Power Option (MGPO) have been implemented in some states, enforcing the
use of renewable energy sources to specified levels. Furthermore, the US Energy Security and
Independence Act of 2007 mandates production of 36 billion gallons of biofuel per year by 2022
(US Congress, 2007).
Comprehensive assessment of diverse energy technologies with different characteristics,
limitations, and requirements is a critical challenge for effective energy policy. It is difficult, if
not impossible, to determine the optimal share of different energy sources in the energy portfolio,
in order to meet disparate sectorial energy demands (e.g., society, economic sector,

72
environmental agencies, and political parties) with maximum stakeholder satisfaction. As an
important step in this process, effective energy policy should recognize the requirements,
limitations, and efficiency of different energy technologies. Despite potentially significant
impacts on energy production scheme, regional limitations such as economic and natural
resource availability and potential environmental impacts of energy production are not explicitly
incorporated in integrated regional energy planning frameworks. Jacobson (2009) investigated
the energy solutions to global warming and energy security by simultaneously considering
different criteria such as water use, land use, thermal pollution, concluding that wind, solar
thermal and geothermal are the most efficient energy sources while biofuels are relatively
inferior. As discussed in Chapter 3, the resource use efficiency of different energy alternatives
were evaluated with respect to the energy sources’ carbon, water, and land footprints, as well as
cost of energy production and it was concluded that geothermal, wind, and solar thermal
technologies are among the superior options, outperforming biofuels and oil. Accounting for
regional limitations is especially critical for renewable energy sources causing energy sprawl
(McDonald et al., 2009) because of appreciable natural resource footprint (Bryce, 2011), coupled
with the need for fallback energy sources due to intermittency of renewables.
Regional energy production capacity and limitations affect the efficiency of energy sources of
different types. For instance, onshore wind is an efficient energy source with close to zero
emissions, fairly low prices, and availability in many areas, gaining increasing popularity in
many countries (Herbert et al., 2007). However, wind turbines require considerable land, which
may not be accessible in many areas (Mayerhoff et al, 2010). Alternatively, a low-efficiency less
land intensive energy source may be preferred. Similarly, a large amount of water is required in

73
the lifecycle of energy production from biomass (Gerbens-Leenes et al., 2009) and hydropower
(Mekonnen, M., Hoekstra, 2012). Hence, the energy mix of a water-scarce region with vast open
lands is different from that of a water-abundant region with limited accessible land.
Understanding these important environmental tradeoffs can illuminate energy planning.
A number of studies in the literature investigate the solutions to energy planning at regional
scale. Examples include Beccali et al. (2003), Cormio et al. (2003), Terrados et al. (2007),
Hiremath et al. (2007), Dicorato et al. (2007, 2008), Cai et al. (2009a, 2009b), Arnette and Zobel
(2011), Derakhshan and Fogelholm (2011), Dzene et al. (2012), and Jebaraj et al. (2012). Most
of these studies focus on developing analytical frameworks to deal with the complexity of energy
planning and management problems with an emphasis on economic factors and greenhouse gas
reduction. The literature is unclear as to how the preference toward different energy options is
affected in the face of variable economic, environmental, and natural resource availability and/or
constraints. The links between geographically variable resource availability and limitations and
favorability of a specific energy source need to be better understood. This is especially important
because expansion of some energy sources, mostly renewables (e.g., biofuel and ethanol), is
widely advocated as a pathway to sustainability in energy production despite their high water and
land footprint.
It is critical to determine the suitability of different renewable and nonrenewable energy
sources from a regional-scale resource use perspective. Following Chapter 3, a statewide analysis
is performed in this chapter to determine the resource use efficiency of energy alternatives across
the U.S. under resource availability and limitations such as regional freshwater resources,
available land, emissions cap, and GDP (as a measure of states’ economic power). This chapter
74
is structured as follows. First, the performance ranges of different renewable and nonrenewable
energy sources under a set of sustainability criteria are presented, followed by description of the
stochastic multi-criteria analysis framework to evaluate the resource use efficiency scores of the
energy sources. Then, the states’ resource limitations are discussed along with the outcomes of
the analysis. Finally, the counterintuitive results are discussed.
4.2 Method and Data
A stochastic multi-criteria decision making framework is developed in this chapter to evaluate
the resource use efficiency scores of energy alternatives, considering a suite of sustainability
criteria. The framework facilitates energy planning using a set of multi-criteria analysis methods
(MCDM) that evaluate energy sources’ efficiency with reference to specific optimization
objective functions. Input data, MCDM methods, and the resource use efficiency evaluation
framework are discussed in this section.
4.2.1 Sustainability criteria
The sustainability criteria considered in the analysis include carbon footprint, water footprint,
land footprint, and cost of energy production. The criteria are selected to create a holistic image
of environmental impact, regional resource use efficiency, and capital requirement of energy
production from different energy sources. Carbon, water, and land footprints, respectively,
represent the amount of CO2 equivalent (Wiedmann and Minx, 2007; Baldwin, 2006), life-cycle
fresh water use (Hoekstra and Hung, 2002; Hoekstra and Chapagain, 2007 and 2008), and land
requirement (Lugschitz et al., 2011) associated with production of one unit of energy (KWh)
from a given energy source. Similarly, cost of energy production is considered in terms of the

75
budget required to produce one unit of energy. These sustainability criteria are given varying
weights based on the greenhouse gas emissions, available budget, available land, and water
resources in each state.
Many studies have attempted to quantify the carbon and resource use footprint, as well as cost
implication of energy production, providing footprint and cost values that vary depending on the
case-specific assumptions and methodologies employed (see for example World Energy Council,
2004; Gerbens-Leenes et al., 2009, McDonald et al., 2009). For instance, the land footprint of
onshore wind technology is estimated to be trivial by some studies, mainly due to excluding the
inter-turbine space from land footprint calculation, assuming that the land could be used for
cultivation and grazing purposes (Lovins, 2011). By contrast, other studies consider inter-turbine
space as part of the wind technologies’ land footprint, arguing that wind farms cannot be used
effectively for other human uses (Brand, 2010). The ranges of footprint values under the
aforementioned sustainability criteria for renewable and nonrenewable energy sources are
summarized in Table 4.1. The values reported in Table 4.1 have been compiled through a
synthetic review of the existing literature on lifecycle analysis of energy production, which is
discussed in the previous chapter. In case of significant discrepancy between literature values,
the more common values are selected for this analysis. Furthermore, necessary adjustments are
applied to the cost values to account for varying value of dollar over different periods of time
and different monetary units (e.g., Euro) used to represent energy production cost.

76
Table 4.1: Performance of energy alternatives under different sustainability criteria
Energy Source Type Carbon Footprint
(g CO2/kWh)
Water Footprint
(m3/GJ)
Land footprint
(m2/GWh)
Cost
(cent/kWh)
Ethanol from corn 81-85 78 10667-12500 2-4
Ethanol from sugar cane 19 99 9520 2-4
Biomass: wood-chip 25 42 14433-21800 4-10
Biomass: miscanthus 93 37 14433-21800 4-10
Solar Thermal 8.5-11.3 0.037-0.780 340-680 4-10
Solar Photovoltaic 12.5-104.0 0.042 704-1760 10.9-23.4
Wind: Onshore 6.9-14.5 0.001 2168-2640 4.16-5.72
Wind: Offshore 9.1-22.0 0.001 2168-2640
3.64-8.71
Wave and Tidal 14-119 0.001 33-463 5-15
Hydropower 2-48 22 538-3068 3.25-12.35
Coal 834-1026 0.15-0.58 83-567 3.77-5.85
Oil 657-866 4.29-8.60 1490 8-10
Natural Gas 398-499 0.1 623 5.46-11.96
Nuclear 9-70 0.42-0.76 63-93 4.55-5.46
Geothermal 15.1-55.0 0.005 33-463 1-8
As can be seen in Table 4.1, performance values come with uncertainties that originate from
regional and technological variations of energy production processes from different energy
technologies. For instance, the carbon footprint of solar photovoltaic ranges from 12.5 to 104
gCO2/KWh, mainly due to the efficiency of the materials, maturity of the energy technology, and
sunlight availability in different locations that result in different energy production rates for a
given level of emissions. Furthermore, Table 4.1 shows that there are tradeoffs between
performance values of energy sources under different criteria. For instance, ethanol from corn is
a more favorable energy source than natural gas in terms of carbon emissions and production
costs. However, this energy source is extremely more water-intensive and has larger land
footprint. Due to such tradeoffs, no energy source is strictly dominating others under all
sustainability criteria.

77
4.2.2 Stochastic Multi criteria Resource Use Efficiency Evaluaion
To evaluate the resource use efficiency of the energy sources under such uncertainties, the
stochastic MCDM framework, introduced in Chapter 3, is applied here. As discussed earlier, the
framework consists of a set of MCDM methods, namely Lexicographic, Technique for Order
Preference by Similarity to Ideal Solution (TOPSIS), and Simple Additive Weighting (SAW).
These methods, which are discussed in length in Madani et al. (2013), are briefly described in
Table 4.2). As the notion of optimality is not the same in different MCDM methods, this
approach uses multiple MCDM methods to offset the bias toward optimality.
Table 4.2: Multi criteria decision making methods
Method Description
Lexicographic Identifies the most desirable alternative for the most important criterion
TOPSIS Identifies the alternative with minimum distance from the ideal performance
SAW Identifies the alternative with highest weighted performance
Due to existing uncertainties in the performance of energy sources under different
sustainability criteria, random numbers are generated using a Monte-Carlo selection technique by
sampling the footprint ranges of the sustainability criteria, which are weighted based on the
availability of resources. A multi-criteria assessment is performed based on the generated
random numbers to obtain the most efficient option after 100,000 runs of the model. The most
efficient option is then removed from the energy list, followed by re-running the model to
identify the next best energy source in an iterative ranking process with 100,000 generations.
This process is repeated until the ranking of energy sources under each MCDM method is
obtained. Finally, the resource use efficiency scores of alternative energy sources are calculated

78
by aggregating the outcomes of MCDM methods (equation 1). Scores range from 0 to 100 with
larger scores representing higher resource use efficiency.
(1)
where:
The resource use efficiency score of alternative p; : The overall Borda score of
alternative p.
4.3 Regional Resource Availability and Limitations
Criteria weights are determined based on the resource availability and limitations in the states.
Table 4.3 provides the states’ per capita values of carbon emissions, freshwater withdrawal,
available land, and GDP for example US states. Per capita values are measures of the resource
availability (freshwater, land, and budget) and emissions within states. According to this table,
the availability of resources varies significantly for different locations. For instance, compared to
Texas, Colorado has 185% and 100% more water and land availability, respectively. Such
variations in resource availability in different locations affect the preference toward energy
alternatives with different resource demands.
Table 4.3: States available resources
State
Carbon emissions
(metric tons per
capita) (EIA,
2013)
Freshwater
withdrawal (1000
cubic meters per
capita)(USGS,
2005)
Available land (square
kilometers per capita)
(U.S. Census Bureau,
2013)
Available funds (GDP
in 1000 dollars per
capita) (Bureau of
Economic Analysis,
2012)
Alabama 28.05 2.93 0.03 32
Alaska 55.05 1.73 2.12 62
Arizona 14.50 1.31 0.04 34
Arkansas 22.91 5.46 0.05 32
California 10.03 1.23 0.01 46
Colorado 19.01 3.75 0.05 46

79
Connecticut 10.52 0.34 0.00 56
Delaware 13.74 0.99 0.01 64
Florida 13.19 0.51 0.01 35
Georgia 17.60 0.76 0.02 37
Hawaii 14.37 0.48 0.01 45
Idaho 10.56 17.47 0.14 33
Illinois 17.87 1.62 0.01 44
Indiana 33.60 2.02 0.01 37
Iowa 30.00 1.55 0.05 42
Kansas 25.97 1.85 0.08 40
Kentucky 34.82 1.39 0.02 33
Louisiana 46.97 3.51 0.02 46
Maine 14.05 0.49 0.06 34
Maryland 12.39 0.33 0.00 46
Massachusetts 11.10 0.26 0.00 52
Michigan 16.62 1.62 0.01 33
Minnesota 17.70 1.06 0.04 46
Mississippi 22.25 1.33 0.04 29
Missouri 22.63 2.03 0.03 36
Montana 35.69 14.29 0.39 33
Nebraska 26.63 9.68 0.11 44
Nevada 14.40 1.25 0.11 42
New
Hampshire 12.78 0.46 0.02 42
New Jersey 13.58 0.31 0.00 49
New Mexico 27.06 2.29 0.16 35
New York 8.90 0.73 0.01 51
North Carolina 15.15 1.67 0.01 40
North Dakota 75.36 2.86 0.28 49
Ohio 21.48 1.38 0.01 36
Oklahoma 27.96 0.58 0.05 36
Oregon 10.54 2.61 0.06 46
Pennsylvania 20.13 1.04 0.01 39
Rhode Island 10.59 0.18 0.00 41
South Carolina 18.68 2.38 0.00 31
South Dakota 18.64 0.85 0.24 42
Tennessee 17.19 2.37 0.02 36
Texas 26.36 1.32 0.03 45
Utah 22.79 2.40 0.08 38
Vermont 9.70 1.16 0.04 37
Virginia 13.92 1.24 0.01 48
Washington 11.50 1.16 0.03 46
West Virginia 54.21 3.65 0.03 29
Wisconsin 17.53 2.10 0.02 39
Wyoming 119.08 11.21 0.46 59
80
The U.S. average regional freshwater resources and available land, emissions and GDP are
assumed to be the benchmark for calculating weights using the method developed by Journel and
Rao (1996). The Kriging weighting method, through the following equations, calculates the
weights of decision criteria based on the numerical distance of the states’ values from the
benchmark.
{
(2)
{
| | (3)
∑ (4)
where:
Standard value for criterion ; Existing value for criterion in state ; Relative
weight for criterion in state ; Correction factor for state ; Weight of criterion in state
For states’ available resources, namely per capita of freshwater, land, and GDP, the values
that are greater than benchmark are desirable, representing excess of such resources in the state,
while lower than benchmark values imply resource shortage. As for carbon emissions, lower
than benchmark values are favorable. Desirable condition for a given resource in a state is
represented as negative relative weight ( ) for corresponding criterion, reflecting the non-
criticality of such resource in that state, which results in a zero weight upon applying the
correction factor ( ) to the relative weights. In the State of Colorado, for example, the land
availability is the most critical limitation (higher weight) for energy production purposes,

81
followed by available budget and emissions cap. The water availability is not a limiting
parameter for energy production in Colorado, as the amount of available water resources (3760
m3 per capita) in this state exceeds the benchmark (2504 m
3 per capita). Hence, the energy
sources with large land footprints are expected to have lower resource use efficiency scores when
compared to the case with no resource limitations. Table 4.4 shows the calculated criteria
weights for selected states.
Table 4.4: States weights of resource use efficiency assessment criteria
State Carbon emissions Freshwater
withdrawal Available land Available funds
Alabama 0.19 0.00 0.49 0.32
Alaska 0.34 0.33 0.00 0.33
Arizona 0.00 0.37 0.41 0.22
Arkansas 0.24 0.00 0.37 0.39
California 0.29 0.35 0.37 0.00
Colorado 0.16 0.00 0.52 0.32
Connecticut 0.00 0.38 0.41 0.21
Delaware 0.00 0.29 0.38 0.33
Florida 0.19 0.40 0.42 0.00
Georgia 0.06 0.44 0.50 0.00
Hawaii 0.00 0.33 0.35 0.32
Idaho 0.30 0.00 0.31 0.38
Illinois 0.21 0.34 0.45 0.00
Indiana 0.27 0.13 0.56 0.05
Iowa 0.16 0.23 0.31 0.30
Kansas 0.08 0.22 0.22 0.48
Kentucky 0.22 0.21 0.36 0.21
Louisiana 0.44 0.00 0.37 0.19
Maine 0.00 0.37 0.25 0.38
Maryland 0.00 0.42 0.44 0.14
Massachusetts 0.00 0.46 0.48 0.06
Michigan 0.00 0.36 0.63 0.01
Minnesota 0.00 0.41 0.43 0.15
Mississippi 0.00 0.28 0.34 0.38
Missouri 0.00 0.20 0.63 0.17
Montana 0.41 0.00 0.15 0.44
Nebraska 0.32 0.00 0.30 0.38
Nevada 0.00 0.41 0.15 0.44
New Hampshire 0.00 0.34 0.34 0.33
New Jersey 0.07 0.45 0.48 0.00
New Mexico 0.27 0.24 0.00 0.49

82
New York 0.23 0.37 0.39 0.00
North Carolina 0.05 0.36 0.59 0.00
North Dakota 0.48 0.20 0.00 0.32
Ohio 0.17 0.34 0.49 0.00
Oklahoma 0.09 0.39 0.27 0.25
Oregon 0.00 0.22 0.40 0.38
Pennsylvania 0.19 0.37 0.45 0.00
Rhode Island 0.00 0.34 0.35 0.32
South Carolina 0.00 0.12 0.56 0.31
South Dakota 0.21 0.37 0.00 0.41
Tennessee 0.00 0.18 0.61 0.21
Texas 0.30 0.34 0.36 0.00
Utah 0.00 0.08 0.28 0.63
Vermont 0.00 0.29 0.32 0.39
Virginia 0.02 0.41 0.57 0.00
Washington 0.00 0.40 0.48 0.12
West Virginia 0.42 0.00 0.27 0.30
Wisconsin 0.00 0.23 0.55 0.22
Wyoming 0.63 0.01 0.00 0.37
Georgia 0.06 0.44 0.50 0
Texas 0.30 0.34 0.36 0
Utah 0 0.08 0.28 0.64
4.4 Results And Discussion
4.4.1 Resource Use Efficiency Evaluation of the U.S. Energy Sources
In Chapter 3, the resource use efficiency scores of different energy alternatives in the U.S.
were reported assuming unlimited resources for energy production. In this hypothetical case, the
four sustainability criteria were considered to be equally important, each having a criterion
weight of 25%. The results are shown in Figure 4.1 where energy sources are classified into three
major categories; energy sources with high (green), medium (yellow), and low (red) resource use
efficiency scores. The figure illustrates that when the regional resource availability and
limitations are left out from the analysis, geothermal, wind, solar thermal energies top the list of
the most resource use efficient energy sources, whereas coal, biomass, ethanol, and oil lie at the
bottom.

83
Figure 4.1: Resource use efficiency scores of different energy sources (0-100)
Figure 4.2 illustrates the statewide resource use efficiency maps for the energy sources with
high resource use efficiency scores in the absence of resource limitations. According to this
figure, geothermal is the most efficient energy source for most states. This energy source has
fairly small water and land footprints and cost, but considerable carbon emission compared to
other green energy sources. From a resource use perspective, geothermal energy efficiency
ranges from 77 to 96, depending mainly on the state’s emission caps. Also, wind onshore is one
of the cheapest renewable energy sources, mostly due to relatively low capital investments as
well as transportation and maintenance costs. Taking into account the available resources in
different states, as shown in figure 4.2, onshore wind is one of the most attractive energy sources
across the U.S., with higher resource use efficiency scores in the northeastern states. Onshore
wind has minimal water and carbon footprints. However, the occupied land by wind farms is
significant if the spaces between turbines are also taken into account. The resource use efficiency
of onshore wind ranges from 60 to 95, depending on the land use limitations within each state.
0
10
20
30
40
50
60
70
80
90
100R
eso
urc
e U
se E
ffic
ien
cy S
core

84
Compared to onshore wind technology, offshore wind has higher carbon footprint and cost
values, mainly due to transportation. Although offshore wind is not feasible for most states,
according to Figure 4.2, it is still potentially one of the most resource use efficient energy
sources. The resource use efficiency of offshore wind ranges from 56 to 86 over the U.S. and
largely depends on the budget availability and emissions cap in a given state.
Disregarding effects of temperature, solar thermal has a high resource use efficiency value
across the U.S., with mid-eastern states such as Louisiana, Arkansas, and Missouri having higher
values compared to other states (Figure 4.2). The resource use efficiency of solar thermal ranges
from 69 to 90, mostly due to variations in the availability of water resources in different states.
Emissions cap is not a limiting factor in the resource use efficiency of this technology due to low
carbon footprints. However, relatively high operating cost of the system surpasses the
benchmark, lowering the resource use efficiency of solar thermal technology for states with tight
budgets. Nuclear energy is the most resource use efficient nonrenewable energy source for most
states, having the smallest land footprint among all energy sources, as well as relatively low cost.
The carbon and water footprints of this technology, however, surpass those of renewables such
as wind and solar technologies. Hence, nuclear energy has a large resource use efficiency score
for the states with significant land inaccessibility or budget constraint, whereas it has a lower
score for states with emission caps or water shortage. The resource use efficiency score of
nuclear ranges from 74 to 90. Similar to offshore wind energy, wave and tidal energies require
the availability of a body of water to operate. The low electricity output of these technologies
yield large carbon footprint and cost values, leading to low resource use efficiency scores for
locations with emissions cap or budget constraints. Assuming all required conditions exist for all

85
states, from a resource use perspective, the efficiency of wave and tidal energy sources range
from 49 to 82.
(a)
(b)

86
(c)
(d)

87
(e)
(f)
Figure 4.2: Statewide resource use efficiency maps for energy sources with high
resource use efficiency: (a) Geothermal, (b) Onshore wind, (c) Solar thermal, (d)
Offshore wind, (e) Wave and tidal, (f) Nuclear.

88
The resource use efficiency maps for energy technologies with medium resource use
efficiency scores are shown in Figure 4.3. These include hydropower, solar photovoltaic, and
natural gas. Hydropower is the most prevalent renewable energy source in the U.S., being
responsible for almost 6% of electricity generation in the nation (NRDC, 2013). From a resource
use perspective, hydropower has considerable water and land footprints as well as cost. It also
has higher carbon footprints compared to wind and solar energy technologies. Assuming the
presence of required conditions in any given state, the resource use efficiency of hydropower
ranges from 45 to 66. The sensitivity of hydropower’s resource use efficiency score comes
mostly from water resources and land availability limitations coupled with budget constraints in
most states. Compared to solar thermal (CSP), photovoltaic (PV) technology has lower water
footprint but relatively higher than benchmark cost value followed by relatively large land
footprint and carbon emissions, leading to lower resource use efficiency for most states. The
resource use efficiency score of solar photovoltaic ranges from 26 to 60. This variation is mainly
due to different budget limitations in states as well as various emission caps and land
accessibility. Despite coal and oil, natural gas is seen as a green energy source due to lower
carbon emissions. In fact, natural gas is a more appropriate energy source in most states
compared to other forms of fossil fuels. The resource use efficiency of natural gas ranges from
29 to 54, with lower scores for eastern states, mostly due to the existing emissions limitations for
those states.
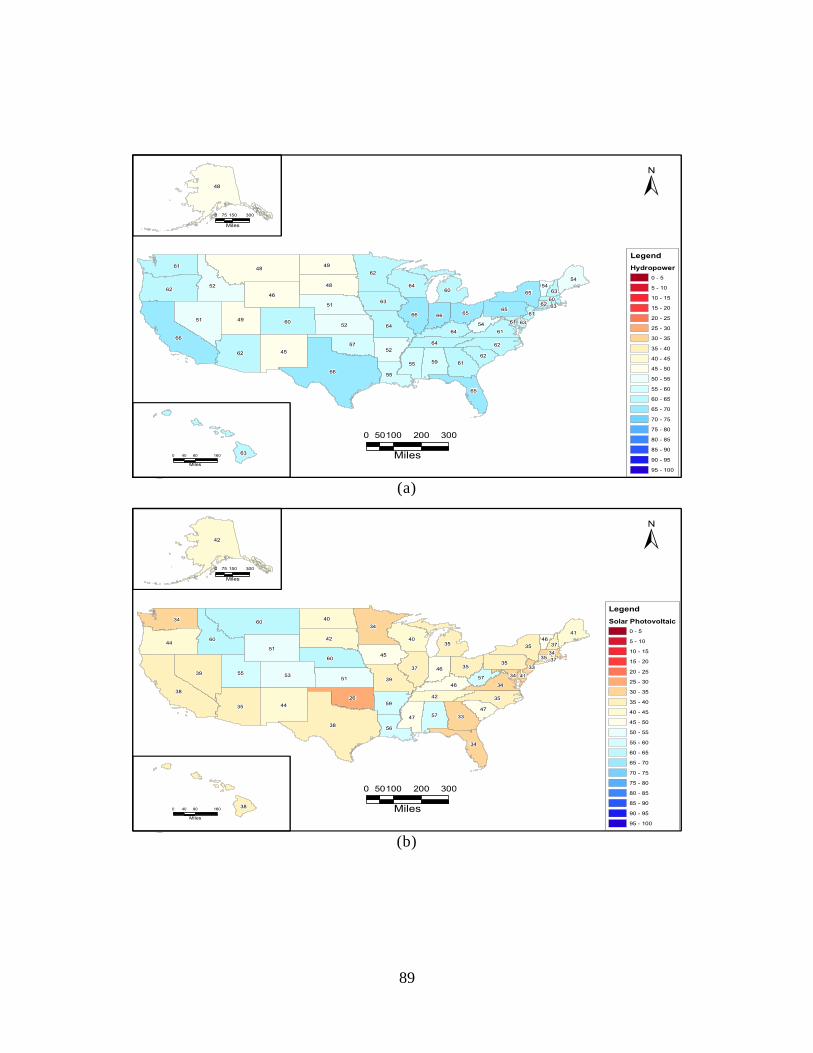
89
(a)
(b)
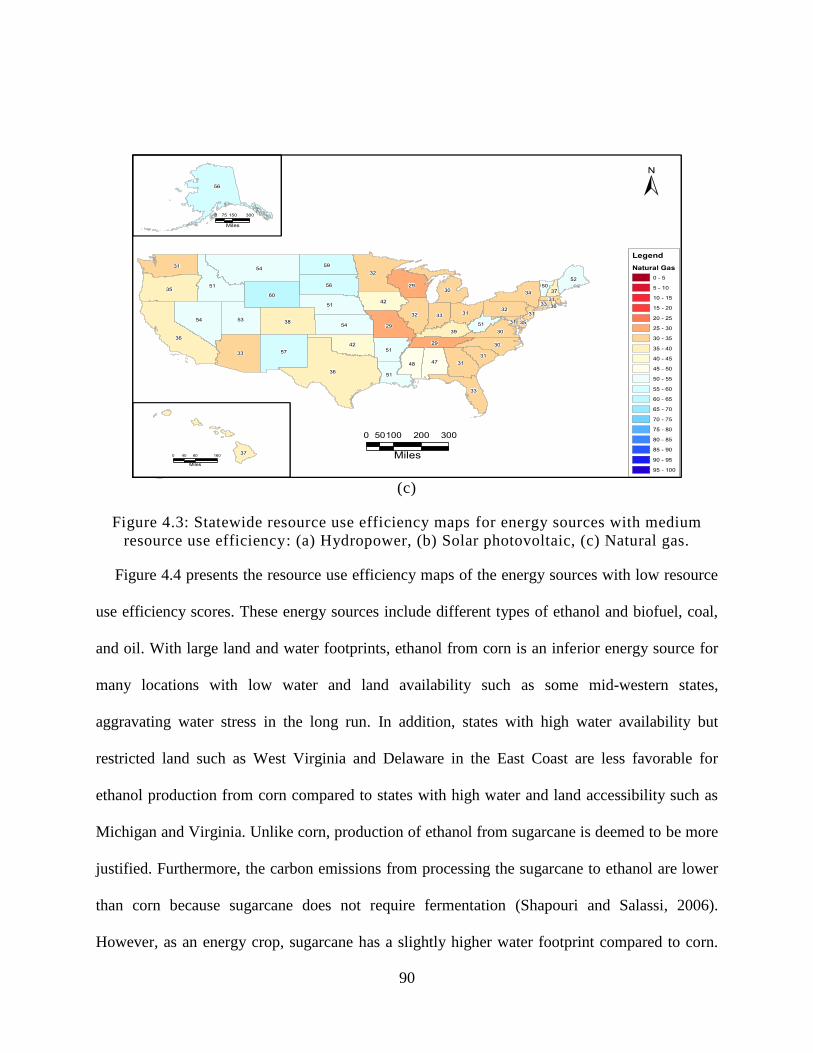
90
(c)
Figure 4.3: Statewide resource use efficiency maps for energy sources with medium
resource use efficiency: (a) Hydropower, (b) Solar photovoltaic, (c) Natural gas.
Figure 4.4 presents the resource use efficiency maps of the energy sources with low resource
use efficiency scores. These energy sources include different types of ethanol and biofuel, coal,
and oil. With large land and water footprints, ethanol from corn is an inferior energy source for
many locations with low water and land availability such as some mid-western states,
aggravating water stress in the long run. In addition, states with high water availability but
restricted land such as West Virginia and Delaware in the East Coast are less favorable for
ethanol production from corn compared to states with high water and land accessibility such as
Michigan and Virginia. Unlike corn, production of ethanol from sugarcane is deemed to be more
justified. Furthermore, the carbon emissions from processing the sugarcane to ethanol are lower
than corn because sugarcane does not require fermentation (Shapouri and Salassi, 2006).
However, as an energy crop, sugarcane has a slightly higher water footprint compared to corn.

91
As demonstrated in the maps, sugarcane has a higher resource use efficiency score than corn in
most states, while the lower score in other states such as Alabama is mostly because of the water
scarcity and low emission caps.
Similar to ethanol, the amount of water required for cooling purposes in coal power plants is a
significant issue. However, high carbon emissions are the most important limitation of power
generation from coal in most states. In fact, out of all the energy sources, coal has the highest
carbon footprint, leading to very low resource use efficiency score in most states, especially
eastern states with low emission caps. According to Figure 4.4, North Dakota, South Dakota,
New Mexico, Wyoming, and Alaska are the states where coal has the highest efficiency score
due to relatively low emissions. Like coal, availability of oil reserves in a given region does not
necessarily guarantee high resource use efficiency for oil in that region. The resource use
efficiency score of oil ranges from 19 to 58, depending on the availability of resources in a given
state. Compared to coal, oil has higher water footprint values, land footprint, and cost. However,
in most states oil is a more attractive energy source than coal, mainly due to lower carbon
emissions that is the most important limitation in majority of the states.
Energy production from both miscanthus and wood-chips have large land footprints and low
costs, whereas miscanthus has a much larger carbon footprint as it requires harvest by
machinery, but a lower water footprint due to its low moisture requirements for growth. As
shown in Figure 4.4, miscanthus has a lower resource use efficiency score than wood-chips in
most states, primarily because of the carbon emission constraints in different U.S. regions.
Unless fund availability is a major concern in energy production, these energy sources are not
competitive with other energy sources with regards to carbon and land footprints. The resource

92
use efficiency score ranges from 18 to 38 for biomass from miscanthus, while it ranges from 19
to 47 for wood-chips, implying wood-chip’s higher sensitivity to resource availability variations.
(a)
(b)

93
(c)
(d)

94
(e)
(f)
Figure 4.4: Statewide resource use efficiency maps for energy sources with low
resource use efficiency: (a) Ethanol from Sugarcane, (b) Coal, (c) Biomass: woodchip,
(d) Oil, (e) Ethanol from corn, (f) Biomass: Miscanthus.

95
4.4.2 State-Level Energy Production Planning
The heterogeneity of the ranking of different energy sources arising from regional resource
availability and limitations bears important implications for state-level energy production
planning as well as the U.S. energy production outlook. This point is discussed by taking a closer
look at the resource use efficiency ranking of energy sources for the states of California,
Wyoming, and Maryland.
Figure 4.5 illustrates the resource use efficiency scores of the energy technologies for
California. According to Figure 4.5, the most resource use efficient energy technology is onshore
wind, followed by nuclear energy. Indeed, the preference toward energy alternatives considering
sustainability criteria does not follow the same order as in the analysis under no resource
limitation conditions for the state. For instance, ethanol from corn and sugarcane are more
attractive than solar photovoltaic energy technology, mainly due to budget limitations in the
State of California. In addition, hydropower is 40% more attractive in this state compared to no
resource limitation conditions. Despite its growing popularity in the State of California, solar
photovoltaic is 16% less efficient from a resource use perspective. Furthermore, wave and tidal
energies are 18% less efficient in this state and are not found to be among energy sources with
high resource use efficiency. Also, biomass from miscanthus is 67% more resource use efficient
and is more attractive than coal and oil.

96
Figure 4.5: Resource use efficiency scores of different energy sources for California
The resource use efficiency scores of energy alternatives for the State of Wyoming are shown
in Figure 4.6. In this state, wind energy technologies are not considered options with high
resource use efficiency scores. In fact, traditional fossil fuels such as coal and natural gas are
more efficient than wind energy in this state. Compared to the analysis with no resource
limitations, coal is 130% more efficient in Wyoming from a resource use perspective. Also,
natural gas is 50% more resource use efficient in this state. This is mostly due to the high
emissions cap that allows for production of energy from fossil fuels with high carbon emissions.
On the other hand, the resource use efficiency score of onshore wind energy technology is 32%
lower compared to no resource limitation conditions. The reason for low resource use efficiency
of wind energy is the low land availability that limits the implementation of wind energy with
relatively large land footprint. Unlike the State of California, hydropower does not have a
significant resource use efficiency score in Wyoming. Similarly, solar photovoltaic has a lower
resource use efficiency score than coal and natural gas. In addition, different ethanol and biomass
0
10
20
30
40
50
60
70
80
90
100
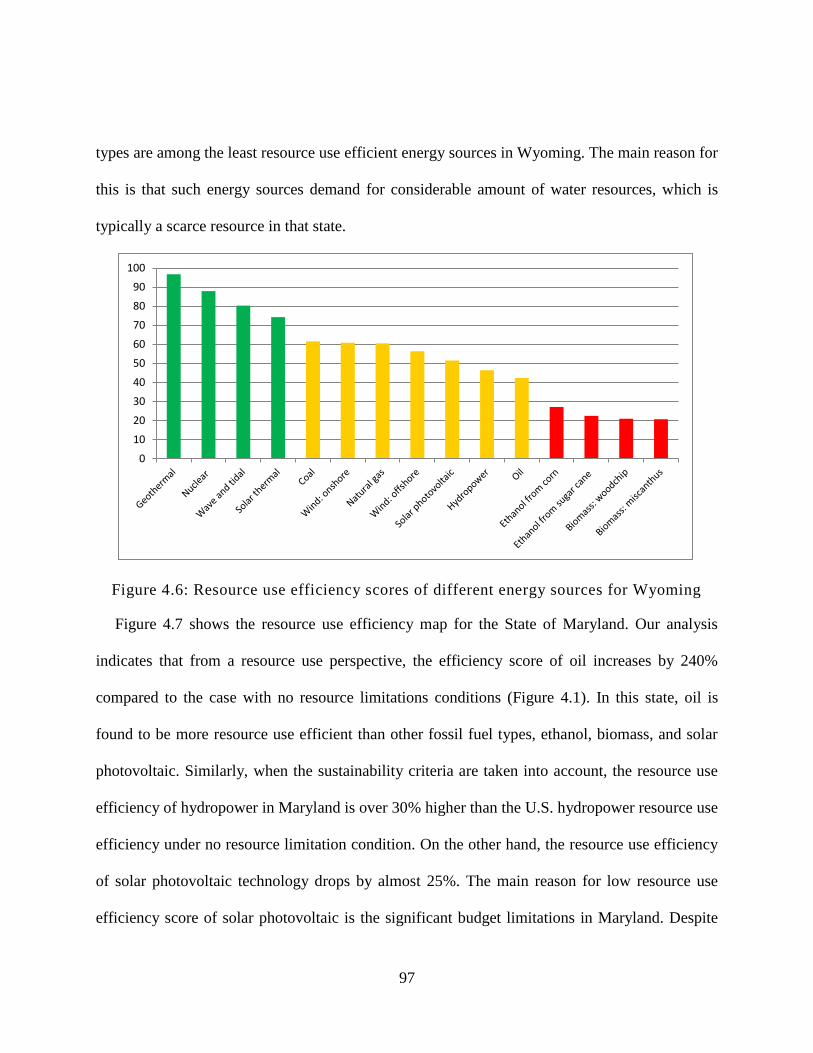
97
types are among the least resource use efficient energy sources in Wyoming. The main reason for
this is that such energy sources demand for considerable amount of water resources, which is
typically a scarce resource in that state.
Figure 4.6: Resource use efficiency scores of different energy sources for Wyoming
Figure 4.7 shows the resource use efficiency map for the State of Maryland. Our analysis
indicates that from a resource use perspective, the efficiency score of oil increases by 240%
compared to the case with no resource limitations conditions (Figure 4.1). In this state, oil is
found to be more resource use efficient than other fossil fuel types, ethanol, biomass, and solar
photovoltaic. Similarly, when the sustainability criteria are taken into account, the resource use
efficiency of hydropower in Maryland is over 30% higher than the U.S. hydropower resource use
efficiency under no resource limitation condition. On the other hand, the resource use efficiency
of solar photovoltaic technology drops by almost 25%. The main reason for low resource use
efficiency score of solar photovoltaic is the significant budget limitations in Maryland. Despite
0
10
20
30
40
50
60
70
80
90
100

98
the relatively high resource use efficiency score of coal in Wyoming, this energy source is the
least resource use efficient energy option among all in Maryland.
Figure 4.7: Resource use efficiency scores of different energy sources for Maryland
4.4.3 Implications for the U.S. Energy Production Outlook
Our results clearly indicate that the resource use efficiency of the energy sources is extremely
sensitive to availability of resources and existing limitations within a specific location. In fact,
various resource availabilities and limitations affect the preference toward different energy
options. The above examples indicate that not only the energy planning for cost or carbon
emissions reduction alone cannot be sustainable, but it also clarifies that not all renewable energy
sources with high resource use efficiency scores in the absence of resource constraints are
appropriate for all locations. In fact, high-level energy enterprise resource planning provides
valuable insights for decision makers to establish the appropriate goals and milestones to meet
future energy demand and secure a continuous energy supply, but it is unable to prescribe
0
10
20
30
40
50
60
70
80
90
100

99
appropriate localized energy mix. For this purpose, the large scale energy resource planning
should be downscaled to account for the local environmental and economic resource
availabilities and limitations.
In the U.S., for instance, the production of 36 billion gallons of biofuel by 2022 requires
extensive amounts of water and land. This policy could be questioned based on the water
resources and land limitations in different states, especially those with limited water and land
resources. 95% of ethanol is produced in 3 farm-production regions; region 5 (Iowa, Indiana,
Illinois, Ohio, and Missouri), Region 6 (Minnesota, Wisconsin, and Michigan), and Region 7
(North Dakota, South Dakota, Nebraska, and Kansas) (RFA, 2007). Ethanol production in these
regions demand for 10, 17, and 324 gallons of water per one gallon of ethanol, respectively (Wu,
2008). Our analysis indicates that corn-based ethanol production in the States of Iowa, North
Dakota, South Dakota, and Nebraska is not efficient from resource use perspective. This is
especially true for the last three states in region 7 with significant corn production water demand.
Such policies will eventually leave significant negative impacts on the environment. Indeed, the
effects of ethanol production from corn on the water resources have already been seen in
particular states, leading to severe drought conditions in production zones.
California, Arizona, Nevada, and New Mexico are the top producers of energy from solar
photovoltaic technology as a part of their renewable portfolio standards, although this energy
source is one of the low efficiency energy sources for these states from a resource use
perspective. As another example, disregarding the safety issues as a major constraint in further
development of nuclear energy in the U.S., based on our analysis, it is one the most resource use
efficient energy sources for most states. In fact, nuclear energy is preferable over some

100
renewable energy sources for most locations. Nevertheless, the investment on this energy source
is trivial when compared to some renewables such as biofuels.
4.5 Conclusions
The efficiency of energy technologies is tied to the amount of resources they use to produce
energy. The availability of such resources might vary for different locations, constraining the
production of energy from specific energy sources that demand for extensive use of limited local
resources. The results of our analysis indicate clearly that the localized energy efficiency
assessment affects the preference toward energy alternatives. This means that some green energy
sources might not be attractive for specific locations where implementation of such energy
technologies may pose environmental, social, or economic risks in the long run. A good example
is the onshore wind energy, which turned out to be one of the most attractive energy sources
among all options in the absence of local resource constraints. However, considering the regional
resource availabilities and limitations, onshore wind was not the best energy source for some of
the states. On the other hand, fossil fuels were not efficient options from a resource use
perspective in resource abundant conditions, whereas some of them such as coal and natural gas
are as resource use efficient as renewables such as onshore wind and solar thermal in presence of
specific resource limitations in some states. Solar photovoltaic technology, as another renewable
energy with ever-increasing popularity in energy policies, is dominated by fossil fuels for some
states.

101
Analysis of resource use efficiency of energy alternatives for a specific location with certain
resource availability and limitation conditions should be a significant part of feasibility study of
energy investments that seek sustainability. For this purpose, multi-criteria evaluation of energy
sources with respect to long-term natural and economic resource limitations could provide
invaluable insights to decision makers. Simultaneous consideration of environmental and
economic parameters under existing local limitations as well as involved uncertainties reveals the
efficiency, sensitivity, robustness, and reliability of different energy sources’ performance in
different conditions.
Despite its valuable insights for the resource use efficiency of different energy options under
regional resource limitations, this study has some limitations that may be addressed in future
studies. First, it is assumed in this study that all energy sources are technologically feasible in all
locations. This limitation could be addressed through elimination of infeasible energy
alternatives for a specific location besides implementing appropriate proxies to restrict the option
for a certain region with particular geographic and geologic conditions that is suitable for only
some of the available energy technologies. In addition, it is assumed that all the energy sources
for a given state are produced within borders of that state and no transfer of energy or materials
take place. In other words, it is assumed that energy technologies utilize the available resources
in the region where they are implemented. In reality, however, there are resource trades for the
purpose of energy production. To address this limitation, a comprehensive resource allocation
map is required to demonstrate the amount of required internal and external resources for
different sources of energy. Also, an analysis based on more accurate magnitudes for availability

102
and limitation of water, land, budget, and emissions could provide more reliable insights for
energy production investment or expansion projects.
4.6 References
Arnette, A., Zobel, C. W. (2012). An optimization model for regional renewable energy
development. Renewable and Sustainable Energy Reviews,16(7), 4606-4615.
Australian Government. About the Renewable Energy Target. Accessed online on August 2013:
http://ret.cleanenergyregulator.gov.au/about-the-schemes
Awerbuch, S. (2006). Portfolio-based electricity generation planning: policy implications for
renewables and energy security. Mitigation and adaptation strategies for Global
Change, 11(3), 693-710.
Baldwin, S. (2006). Carbon footprint of electricity generation. London: Parliamentary Office of
Science and Technology, (268).
Beccali, M., Cellura, M., Mistretta, M. (2003). Decision-making in energy planning. Application
of the Electre method at regional level for the diffusion of renewable energy
technology. Renewable Energy, 28(13), 2063-2087.
Brand, S. (2010). Whole earth discipline. Atlantic Books.
Bryce, R. (2011). Power Hungry: The Myths of “Green” Energy and the Real Fuels of the
Future. Public Affairs.
Cai, Y. P., Huang, G. H., Lin, Q. G., Nie, X. H., Tan, Q. (2009a). An optimization-model-based
interactive decision support system for regional energy management systems planning under
uncertainty. Expert Systems with Applications, 36(2), 3470-3482.
Cai, Y. P., Huang, G. H., Yang, Z. F., Tan, Q. (2009b). Identification of optimal strategies for
energy management systems planning under multiple uncertainties. Applied Energy, 86(4),
480-495.
Congress, U. S. (2007). Energy independence and security act of 2007. Public Law, (110-140), 2.
Cormio, C., Dicorato, M., Minoia, A., Trovato, M. (2003). A regional energy planning
methodology including renewable energy sources and environmental
constraints. Renewable and Sustainable Energy Reviews, 7(2), 99-130.

103
Delmas, M. A., Montes-Sancho, M. J. (2011). US state policies for renewable energy: Context
and effectiveness. Energy Policy, 39(5), 2273-2288.
Derakhshan, F., Fogelholm, C. (2011). On Sustainability in Local Energy Planning.
Dicorato, M., Forte, G., Trovato, M. (2008). Environmental-constrained energy planning using
energy-efficiency and distributed-generation facilities.Renewable Energy, 33(6), 1297-
1313.
Dicorato, M., Forte, G., Trovato, M. (2007). Assessing distributed generation in an
environmental-constrained energy planning. In Power Engineering Society General
Meeting, 2007. IEEE (pp. 1-8). IEEE.
Duić, N., da Graça Carvalho, M. (2004). Increasing renewable energy sources in island energy
supply: case study Porto Santo. Renewable and Sustainable Energy Reviews, 8(4), 383-399.
Dzene, I., Rošā, M., Blumberga, D. (2011). How to select appropriate measures for reductions in
negative environmental impact? Testing a screening method on a regional energy
system. Energy, 36(4), 1878-1883.
European Union (EU). Renewable Energy. Accessed online on August 2013:
http://ec.europa.eu/energy/renewables/index_en.htm
Flavin, C., Sawin, J. L., Mastny, L., Aeck, M. H., Hunt, S., MacEvitt, A., Mohin, T. (2006).
American energy: the renewable path to energy security.American energy: the renewable
path to energy security.
Gerbens-Leens, P. W., Hoekstra, A. Y., Meer, T., (2009). The Water Footprint of Energy from
Biomass: A Quantitative Assessment and Consequences of an Increasing Share of Bio-
Energy in Energy Supply.
Hennicke, P. (2004). Scenarios for a robust policy mix: the final report of the German study
commission on sustainable energy supply. Energy policy,32(15), 1673-1678.
Herbert, G. M., Iniyan, S., Sreevalsan, E., Rajapandian, S. (2007). A review of wind energy
technologies. Renewable and Sustainable Energy Reviews, 11(6), 1117-1145.
Hiremath, R. B., Shikha, S., Ravindranath, N. H. (2007). Decentralized energy planning;
modeling and application—a review. Renewable and Sustainable Energy Reviews, 11(5),
729-752.
Hoekstra, A. Y., Hung, P. Q., (2002). Virtual Water Trade: A Quantification of Virtual Water
Flows between Nations In Relation To International Crop Trade. Value of Water Research
Report Series, No. 11, UNESCO-IHE, Delft, The Netherlands.
104
Hoekstra, A. Y., Chapagain, A. K., (2007). Water Footprints of Nations: Water Use By People as
a Function of Their Consumption Pattern. Water Resources Management, 21, 35–48.
Hoekstra, A. Y., Chapagain, A. K., (2008). Globalization of Water: Sharing the Planet's
Freshwater Resources. Blackwell Publishing, Oxford, UK.
Hvelplund, F., Lund, H. (1998). Rebuilding without restructuring the energy system in east
Germany. Energy policy, 26(7), 535-546.
Jacobson, M. Z. (2009). Review of Solutions To Global Warming, Air Pollution, And Energy
Security. Energy & Environmental Science, 2, 148-173.
Jebaraj, S., Iniyan, S., Goic, R. (2012). An optimal electricity allocation model for sustainable
resource use in India. International Journal of Energy Research.
Journel, A. G., Rao, S. E. (1996). Deriving conditional distributions from ordinary
kriging. Stanford Center for Reservoir Forcasting, Stanford University Report, (29), 25.
Lovins, A. B. (2011). Renewable Energy's ‘Footprint’Myth. The Electricity Journal, 24(6), 40-
47.
Lugschitz, B., Bruckner, M., Giljum, S. (2011). “Europe’s Global Land Demand”. A study on
the actual land embodied in European imports and exports of agricultural and forestry
products, Sustainable Europe Research Institute (SERI).
Madani K., Lund J. R. (2010). "Estimated Impacts Lund, H., Hvelplund, F., Ingermann, K., &
Kask, Ü. (2000). Estonian energy system Proposals for the implementation of a
cogeneration strategy. Energy Policy, 28(10), 729-736.
Lund, H., Hvelplund, F., Nunthavorakarn, S. (2003). Feasibility of a 1400 MW coal-fired power-
plant in Thailand. Applied Energy, 76(1), 55-64.
Lund, H., Mathiesen, B. V. (2009). Energy system analysis of 100% renewable energy
systems—The case of Denmark in years 2030 and 2050.Energy, 34(5), 524-531.
Lund, H., Šiupšinskas, G., Martinaitis, V. (2005). Implementation strategy for small CHP-plants
in a competitive market: the case of Lithuania. Applied Energy, 82(3), 214-227.
Martinot, E., Dienst, C., Weiliang, L., Qimin, C. (2007). Renewable energy futures: Targets,
scenarios, and pathways. Annu. Rev. Environ. Resour., 32, 205-239.
McDonald, R. I., Fargione, J., Kiesecker, J., Miller, W. M., & Powell, J. (2009). Energy sprawl
or energy efficiency: climate policy impacts on natural habitat for the United States of
America. PLoS One, 4(8), e6802.

105
Mekonnen, M., Hoekstra, A. Y. (2012). The blue water footprint of electricity from
hydropower. Hydrology and earth system sciences, 16, 179-187.
Meyerhoff, J., Ohl, C., & Hartje, V. (2010). Landscape externalities from onshore wind
power. Energy Policy, 38(1), 82-92.
Natural Resources Defense Council (NRDC), 2013. Hydropower. Available online at:
http://www.nrdc.org/energy/renewables/hydropower.asp
Perdan, S., Clift, R. (2004). Sustainable development in practice. A. Azapagic (Ed.). England:
Wiley
RFA (Renewable Fuels Association) (2007). Industrial Statistics, Available online at:
http://www.ethanolrfa.org/.
Scottish Executive (2003), Scottish Executive, 2003. Securing a Renewable Future: Scotland's
Renewable Energy.
Shapouri, H., Salassi, M. E. (2006). Economic feasibility of ethanol production from sugar in the
United States.
Terrados, J., Almonacid, G., Hontoria, L. (2007). Regional energy planning through SWOT
analysis and strategic planning tools.: Impact on renewables development. Renewable and
Sustainable Energy Reviews, 11(6), 1275-1287.
Wiedmann, T., Minx, J. (2007). A definition of 'carbon footprint'. Ecological economics research
trends, 1, 1-11
World Energy Council (2004). Comparison of Energy Systems Using Life Cycle Assessment.
Available online: http://www.worldenergy.org/documents/lca2.pdf (Accessed on February
15, 2012).
Wu, M., Mintz, M., Wang, M., & Arora, S. (2008). Consumptive water use in the production of
bioethanol and petroleum gasoline. Center for Transportation Research. Energy Systems
Division, Argonne National Laboratory.
Yergin, D. (2006). Ensuring energy security. Foreign Affairs, 69-82.

106
CHAPTER 5: ENERGY PORTFOLIO ANALYSIS AND DEVELOPMENT
BASED ON SUSTAINABILITY CONSIDERATIONS
5.1 Introduction
Energy planning is one of the challenges facing governments at all times. Adequate energy
resources should be available to support economic development, to maintain high living
standards, and to provide national security. In the meantime, global warming resulting from
human activities is tied to energy production and consumption processes, enforcing more
restrictive laws and regulations at the energy planning level. Also, energy security considerations
push the energy policies toward reliance upon inland energy sources and diversification of
energy choices, which adds to the complexity of energy planning. Scarcity of natural resources is
another challenge, as considerable environmental resources such as water and land are required
to produce enough energy to meet demand. Needless to say, the resulting energy mix should be
economically feasible, as energy production processes require significant financial support.
Traditionally, energy planning was simply adoption of the least-cost energy technologies.
Such policies could address the energy demand effectively in an era with constant energy prices
in the absence of competitive energy markets, advanced technologies, and cost uncertainty
(Awerbuch, 1993, 1995a). However, with the evolution of diverse energy technologies and more
competitive energy markets, the cost of energy production has been experiencing a rise in
volatility, leading to revocation of past policies that failed to capture the uncertainty and
dynamicity within evolving energy markets. Hence, energy planning began to be seen as an
investment decision problem, evaluated from a portfolio perspective to manage risks and
maximize returns of the portfolio instead of the energy options individually (Awerbuch, 2006).

107
For this purpose, the mean-variance portfolio theory, also called Modern Portfolio Theory
(MPT), is applied to energy planning problems to create efficient portfolios. Previous research
indicates that MPT can be applied to a range of energy planning problems in order to maximize
return for a given risk level or minimize the risk for any expected return. For instance, Awerbuch
and Yang (2007) applied the MPT to the European Union (EU) energy market and concluded
that greater shares of nuclear and wind added to the EU energy portfolio lowered the risk and
cost of the portfolio and carbon emissions while maximizing the energy security. Roques et al.
(2008) studied the liberalized electricity markets to identify efficient electricity portfolios and
concluded that incentives such as long-term power purchase contracts and low capital costs lead
to more diversified electricity portfolios with greater shares of coal and nuclear energies.
Madlener et al. (2009) applied the MPT for energy planning in Germany, Sweden, and United
Kingdom and concluded that more efficient portfolios could be generated if shares of renewables
went up. Other studies include Domingues et al. (2001), Lesbirel (2004), Beltran (2009),
Rodoulis (2010), Delarue et al. (2011), Allan et al. (2011), Bhattacharya and Kojima (2012), and
Arnesano et al. (2012).
Energy planning based on the risk-return relationship outputs diversified energy portfolios
with a lower risk of return for any expected return. Compared to traditional energy mixes, such
portfolios included larger shares of non-fossil fuel sources in terms of both the number of
sources and energy production from each source, resulting in reduction of GHG emissions.
Besides capital costs, operation and maintenance costs, and fuel costs, some studies have also
considered carbon emissions costs for each asset in the portfolio as an indication of
environmental effects pertaining to each energy source, and eventually, the portfolio. Examples
108
include Awerbuch and Yang (2007), Roques et al. (2008), Bhattacharya and Kojima (2012), and
Arnesano et al. (2012).
The past research acknowledges the necessity and advantage of energy portfolio analysis and
development with focus on energy planning within specific locations. Although this is
promising, there is still a lack of global energy analysis with sustainability considerations. Based
on the previous chapter, despite the fact that energy policies are developed based on regional
specifications, they should be consistent with global objectives, specifically when sustainability
is desired on the global scale. Also, whether CO2 costs in the literature represent either CO2
trading costs or social cost of carbon (SCC), they underestimate the true resulting damages
(Bernstein et al., 2008; Ackerman and Stanton, 2011) as not all negative effects could be
explicitly and thoroughly represented by monetary units, especially when sustainability is a
concern in energy portfolio development. In addition, previous studies fail to address other
adverse effects resulting from energy production processes. Such impacts include but are not
limited to water resources drainage and pollution, land use change, agricultural production loss,
and biodiversity deterioration. Diversification of the energy portfolio might yield more secure
energy supplies and lower emissions both due to increase in shares of renewable energy sources,
but it does not necessarily guarantee minimal negative impacts on other components of the
ecosystem. In other words, the notion of sustainability would not be acknowledged based solely
on a diversified, decarbonized energy portfolio, unless the aforementioned secondary impacts are
also taken into account in energy planning. Such sustainability concerns are neglected in the
literature mainly because they are incomputable based on the common price measures. For
instance, the dollar value of the water amount allocated to produce one unit of energy from a

109
particular energy source, although measurable, does not reveal its true value when it is looked at
as a scarce natural resource. Even if the monetary value of water is to be used as a reliable
measure for quantification of its true value, it cannot be added to costs corresponding to other
energy production processes due to inconsistency within the nature of such costs. In addition,
assuming that natural resources dollar values are a reasonable representation of secondary
impacts of energy production, a traditional definition of investment risk as a measure of price
fluctuations is not applicable to measure a portion of risk associated with such resources’ prices.
The reason is that natural resources prices do not respond as quickly to market demands and
associated changes as fuel prices do. As a result, if moving toward sustainability is a concern in
energy policy development, monetary units are not reliable and cannot reflect the actual costs
and benefits. Hence, a new scale is required based on which the efficiency of energy production
of natural resources are measured along with corresponding costs.
In this dissertation, the efficiency of energy production processes in terms of environmental
impacts as well as associated costs are integrated into a resource use efficiency index, which is
measure of sustainability. In summary, the resource use efficiency of an energy source is
calculated based on a systems approach that takes into account the performance of the energy
sources under multiple sustainability criteria, which are carbon emissions, water footprint, land
footprint, and cost of energy production shown in this study. The resource use efficiency score is
represented by a dimensionless number scale of 0 to 100 with larger numbers being more
favorable. In the lack of a reliable sustainability measure, the resource use efficiency index
accounts for the tradeoffs existing among different sustainability criteria when they are
considered simultaneously for performance evaluation of an energy source. In other words, the
110
resource use efficiency score for an energy alternative could be interpreted as the investment
returns estimated by a consistent measure that not only encompasses the costs of energy
production and CO2 emissions, but also other environmental impacts. Furthermore, it is worth
mentioning that the performance of the energy sources considered in this study are measured
mostly in ranges, due to the uncertainties that exist as a result of technological and regional
variations. As discussed in Chapter 3, such performance uncertainties result in uncertain
outcomes, leading to a distribution of resource use efficiency scores for a given energy source.
As discussed later, a statistical analysis of the resulting distribution yields measures such as risk.
The main objective in this chapter is to construct global energy portfolios based on resource
use efficiency (as a measure of sustainability) and related fluctuations (as a measure of risk). The
energy sources considered in this study along with their performance under four sustainability
criteria are shown in Table 5.1. Among the pool of data available in the literature, the values in
Table 5.1 are selected in attempt to capture the current performance values for different
technologies on the global scale. This chapter considers two methods of portfolio analysis and
development: Modern Portfolio Theory (MPT) and Post-Modern Portfolio Theory (PMPT).
These theories differ in their definition of risk. The former considers the standard deviation from
the expected return as a measure of risk, while the latter employs the concept of downside risk as
a measure of investment risk.
This chapter is structured as follows. The next two sections explain the fundamentals of
sustainable energy planning based on MPT and PMPT, respectively. Then, the results from the
two analyses are presented and a discussion of how the analysis based on the resource use

111
efficiency scores and associated risks clarifies sustainability of energy portfolios. Also, a
discussion of how a more realistic measure of risk yields more efficient portfolios.
Table 5.1: Energy sources performance measures under four sustainability criteria
Energy Source Type Carbon Footprint
(g CO2/kWh)
Water Footprint
(m3/GJ)
Land footprint
(m2/GWh)
Cost
(cent/kWh)
Ethanol from corn 81-85 78 10667-12500 2-4
Ethanol from sugar cane 19 99 9520 2-4
Biomass: wood-chip 25 42 14433-21800 4-10
Biomass: miscanthus 93 37 14433-21800 4-10
Solar Thermal 8.5-11.3 0.037-0.780 340-680 4-10
Solar Photovoltaic 12.5-104.0 0.042 704-1760 10.9-23.4
Wind: Onshore 6.9-14.5 0.001 2168-2640 4.16-5.72
Wind: Offshore 9.1-22.0 0.001 2168-2640
3.64-8.71
Wave and Tidal 14-119 0.001 33-463 5-15
Hydropower 2-48 22 538-3068 3.25-12.35
Coal 834-1026 0.15-0.58 83-567 3.77-5.85
Oil 657-866 4.29-8.60 1490 8-10
Natural Gas 398-499 0.1 623 5.46-11.96
Nuclear 9-70 0.42-0.76 63-93 4.55-5.46
Geothermal 15.1-55.0 0.005 33-463 1-8
5.2 Sustainable Energy Planning Based On MPT
Developed by Markowitz (1952), the Modern Portfolio Theory (MPT) is considered the basis
for modern economics (Rubinstein, 2002), helping investors and decision makers manage the
risks associated with investments and make better decisions. According to MPT, a portfolio
compounded by diverse, less than perfectly correlated securities may reduce the risk compared to
individual securities, known as the portfolio effect. In MPT, an efficient portfolio takes no
unnecessary risk with respect to its expected return, meaning that the risk is minimized for any
expected return or the expected return is maximized for any risk level (Beltran, 2009). In fact,
portfolio selection in MPT is implemented based on tradeoffs between expected returns and risk
attitudes of decision makers, as higher returns are generally associated with higher risks and vice

112
versa. In MPT, the expected return and risk of the portfolio are quantified based on the expected
return and risk of the securities, given that the securities past returns follow normal distribution.
As discussed earlier, most of the energy portfolio studies have been dealing with the
electricity sector investment risks in terms of monetary values. However, a systems approach is
required in the energy policy analysis and development, in order to account for the
environmental effects of the energy production besides the production costs. Hence, the expected
return in this research is not defined as the expected return of assets based on dollars. Rather, it is
defined as a function of the performances of the alternatives under environmental and economic
criteria. The multi-criteria assessment of energy alternatives input data with associated
uncertainties (Table 5.1) yields stochastic outputs. Goodness-of-fit normality tests show that the
outcomes fit a normal distribution for all energy sources. As a result, the resource use efficiency
and corresponding standard deviation for the energy sources are calculated in Chapter 3 based on
the statistical analysis of distributions and are shown in Table 5.2.
The portfolio’s resource use efficiency and risk are calculated based on the following
equations:
∑ (1)
√ ∑ √∑
∑ ∑
(2)
where:
(RUE)p: Expected resource use efficiency of the portfolio; Wi: Proportion of energy source i
in the portfolio; (RUE)i: Expected resource use efficiency of energy source i; (SD)p: Standard

113
deviation of the portfolio; : Standard deviation of energy sources i and j; : The correlation
between energy sources i and j.
Although generation costs of energy sources such as fossil fuels are correlated and usually
move together in the market (Beltran, 2009; Awerbuch and Yang, 2007), emissions and other
environmental impacts of a given energy source are almost independent of other energy sources.
Hence, it is safe to assume that correlations between energy sources environmental impacts are
zero, which results in close to zero correlation factors between resource use efficiency of the
energy sources. In other words, the effect of cost correlations is trivial in the total correlation
factor and assumed to be zero. Numerous portfolios are generated based on different asset
allocation patterns. Not all of the generated portfolios are optimal however. In other words, there
are a large number of portfolios with equal risk magnitudes but varying resource use efficiency
scores. Similarly, there are numerous portfolios with equal resource use efficiency scores but
varying risk magnitudes. Generated portfolios are illustrated in Figure 5.1. In fact, rational
decision makers choose the least risky portfolio among those with equal resource use efficiency
scores, or they choose the one with the largest resource use efficiency score between those with
the same risk magnitude. Hence, the optimal portfolios for different risk and resource use
efficiency values occur at the boundary of the feasible solutions (efficient frontier). Efficient
frontier, shown on Figure 5.2, represents the optimal feasible portfolios, each of which is
appropriate for an investor with a specific risk aversion degree. In MPT, selection between
different efficient portfolios is made based on the highest modified Sharpe ratio (Rom and
Ferguson, 1994), which signifies the risk-adjusted performance of the portfolio. The modified
Sharpe ratio is calculated based on equation 3:

114
(3)
5.3 Sustainable Energy Planning Based On PMPT
In MPT, the variance of returns for each asset in the portfolio is considered as a symmetric
measure of risk associated with that asset, contributing to the portfolio variance (portfolio risk).
However, the variance is not a perfect metric for measuring risk, because it captures positive
volatility in addition to negative volatility. In fact, investors care more about avoiding loss than
gaining profit, meaning that risk is not symmetrical and is severely skewed (Rom and Ferguson,
1994). Hence, the normal distribution is not necessarily a perfect simulation of a real world
investor behavior. In addition, MPT fails to address the investor’s goals by assuming the “mean”
to be the expected return of assets and the portfolio. However, high efficiency portfolios should
reflect investor objectives and expectations as the risk averseness of different investors affects
their bias toward a given feasible alternative. To overcome these limitations, Post Modern
Portfolio Theory (PMPT) was developed by Rom and Ferguson (1994) and yields a more
realistic view of investment risk and return by proposing “downside risk” (Bawa, 1982;
Fishburn, 1977; Sortino and Van Der Meer, 1991; Clarkson, 1989) and “minimum acceptable
return”. Downside risk (DR) represents the volatility below a target return, whereas any outcome
greater than target return is favorable and should not be considered as the risk of investor but
investment return uncertainty. Downside risk is the standard deviation of lower than expected
returns, or the probability weighted below target returns with consideration of investor’s risk
attitude. In other words, downside risk addresses the probability of below target returns as well
as the distance from the target return (Sortino, 2001). Minimum acceptable return (MAR)

115
captures the investor’s expectations and is defined as the minimum return to be earned to avoid
failing to meet investor’s objectives (Rom and Ferguson, 1994). Table 5.2 illustrates the
skewness of resource use efficiency scores for the considered energy sources in this study.
Positive skewness values represent right-skewed distributions, indicating more returns occurring
above the median, which means that gains are larger and losses are smaller when they occur.
Negative skewness values represent left-skewed distributions, indicating more returns occurring
below the median, which means that gains are smaller and losses are larger when they occur
(Nawrocki, 1997). In fact, positive skewness is a result of controlled risks and avoided losses that
limit unfavorable outcomes, but allows for extended upside returns. As a result, normal
distribution is not a perfect fit for resource use efficiency of the energy sources. A log-normal
distribution, on the other hand, allows for both positive and negative skewness (Rom and
Ferguson, 1994). Hence, a three-parameter log-normal distribution formulation, suggested by
Forsey (2001), is used in this study to represent the resource use efficiency score of portfolios
compounded by different energy options. Mean, standard deviation, and extreme value, used in
Forsey-Sortino model (Sortino and Satchell, 2001), are used as a basis to create three-parameter
log-normal distributions for the considered energy alternatives. These values are represented in
Table 5.2.

116
Table 5.2: Resource use efficiency, standard deviation, extreme value and skewness
Energy Source Type Resource use
efficiency
Standard
deviation
Extreme
value
Statistical
skewness
Ethanol from corn 15.7 2.8 7.2 0.2
Ethanol from sugar cane 30.0 2.7 10.6 0.4
Biomass: wood-chip 24.3 4.0 2.7 0.1
Biomass: miscanthus 15.7 4.1 17.8 0.0
Solar Thermal 82.9 1.6 54.1 0.1
Solar Photovoltaic 45.7 3.8 19.0 0.1
Wind: Onshore 88.6 2.2 68.1 0.3
Wind: Offshore 75.7 3.3 53.9 0.1
Wave and Tidal 70.0 4.0 38.2 0.2
Hydropower 47.1 4.9 20.5 0.3
Coal 27.1 3.3 2.6 0.1
Oil 17.1 3.0 0.9 0.0
Natural Gas 40.0 3.1 24.9 0.2
Nuclear 75.7 4.2 47.6 0.1
Geothermal 94.3 3.7 56.6 0.4
In this research, the method suggested by Forsey (2001) is adapted to fit a log-normal
distribution to portfolios. Similar to MPT, the mean and standard deviation of the portfolio is
calculated based on the means and standard deviations of the assets in the portfolio. The
portfolio’s extreme value ( ) is estimated based on the weighted average of the assets’ extreme
values that are calculated from equation (4) and shown in Table 5.2. Based on the following
equations, some auxiliary parameters are required to calculate the lognormal distribution for the
portfolio:
(4)
∑ (5)
(6)

117
(
)
(7)
(8)
√ (9)
(10)
(11)
√∫
(12)
where:
, : Extreme values of energy source i and portfolio p, respectively; Dif, , , , and :
Auxiliary parameters for calculating portfolio’s lognormal distribution; : Lognormal
distribution of portfolio’s resource use efficiency scores; (DR)p: Downside risk of the portfolio
(Fishburn, 1977; Sortino and Van der Meer, 1991); n: Degree of investor’s risk averseness.
In the downside risk equation, parameter “n” is the adjustment proxy for penalizing below
target returns. Following Sortino and Van der Meer (1991), this research adopts a magnitude of 2
for n. The advantage of n=2 is that it makes DR comparable to standard deviation as the risk
measure in MPT. Similar to MPT, the correlations between the resource use efficiency scores of
the assets in a portfolio are assumed to be zero. Unlike MPT that yields one efficient frontier for
all investors with diverse risk attitudes, PMPT gives a unique efficient frontier for any given
MAR value, representing the efficient portfolios with respect to the investor’s specific risk
attitude. Hence, a portfolio might have different risk magnitudes depending on investors’
expectations and project goals. Efficient frontiers for four investors with MAR of 50, 60, 70, and

118
80 are shown in Figure 5.3. In PMPT, the comparison between efficient portfolios from a
particular investor’s perspective is calculated by the returns adjusted for downside risk and
MAR, referred to as Sortino ratio (Sortino and Price, 1994). The Sortino ratio is calculated based
on the following equation:
(15)
5.4 Results
Figure 5.1 shows the feasible portfolios generated based on MPT. As mentioned earlier, the
optimal portfolios are located on the upper edge of the feasible region, contributing to a unique
efficient frontier that is shown in Figure 5.2 (show in green). However, the lower edge (shown in
blue) is also illustrated to compare the status of current energy portfolios with more efficient
ones. The model is stopped running when a reasonable quantity of portfolios is generated, mainly
due to a huge number of feasible and efficient portfolios that need considerable computational
capacity to be found. The overlapped circles in the efficient frontier indicate diverse portfolios
for a given set of resource use efficiencies and risk magnitudes. In other words, there might be
more than one portfolio with equal or very close resource use efficiency and risk values.

119
Figure 5.1: Feasible energy portfolios based on MPT
Illustrated in Figure 5.2 is the 2012 energy mix and the 2035 business as usual energy mix
projection, shown as P0 and P1, respectively. The least risk-least RUE is shown as P2. Also, P2’
represents the least RUE non-optimal portfolio with the same risk level as the 2035 projected
energy mix. P3 indicates the optimal portfolio for RUE of 60. In addition, P4 represents the most
efficient portfolio with the same risk level as 2035 projected energy mix.
X P
4

120
Figure 5.2: MPT efficient frontier and portfolios; P0: 2012 energy mix; P1: 2035
projected energy mix; P2: optimal energy mix with minimum risk and RUE; P2’:
potential energy mix with minimum RUE and 2035 equal risk; P3: optimal energy mix
with RUE=60; P4: optimal energy mix with 2035 equal risk.
Figure 5.3 depicts the efficient frontiers for the analysis based on PMPT for four decision
makers with MARs 50 (black), 60 (cyan), 70 (purple), and 80 (blue). As shown in this figure,
optimal portfolios have different risk magnitudes for investors with diverse risk attitudes. In
other words, a portfolio becomes riskier for a risk taker investor than a risk averse investor.
Despite P2’ which has a quantifiable downside risk and is shown on the graph, the 2012 energy
mix (P0) and the projected 2035 energy mix (P1) have lower than expected returns and are not
situated on the efficient frontiers for decision makers with MAR 50, 60, 70, and 80. In this
figure, P5 and P6 represent the minimum risk efficient portfolios for MARs 50 and 60,

121
respectively. Also, P7 and P8 represent the efficient portfolios corresponding to RUE of 70 for
MARs 50 and 60.
Figure 5.3: Efficient frontiers for decision makers with MAR=50 (black), MAR=60
(cyan), MAR=70 (purple), and MAR=80 (blue); P5: optimal energy mix with MAR=50
and minimum risk and RUE; P6: optimal energy mix with MAR=60 and minimum risk
and RUE; P7: optimal energy mix with MAR=50 and RUE=70; P8: optimal energy mix
with MAR=60 and RUE=70;
In addition to shares of different energy sources for selected portfolios, the resource use
efficiency (RUE), downside risk (DR), and standard deviation (SD) of the portfolios are also
calculated and shown in Table 5.3. The Sharpe and Sortino ratios are calculated for the chosen
portfolios where applicable, in order to compare the efficiency and desirability of the portfolios
from investment perspective.

122
Table 5.3: Energy mix components for different scenarios based on MPT and PMPT
Energy portfolio
0 1 2 2’ 3 4 5 6 7 8
%
En
erg
y s
ou
rces
Ethanol from corn 1.68 1.20 9.94 1.14 1.26 0.29 3.66 1.26 3.17 3.17
Ethanol from sugar cane 0.49 1.00 8.29 0.80 0.68 0.64 3.25 1.68 2.38 2.38
Biomass: wood-chip 0.20 0.60 0.55 0.67 0.42 0.21 0.41 0.42 0.24 0.24
Biomass: miscanthus 0.60 0.63 2.76 2.01 1.68 0.57 6.10 1.68 1.58 1.58
Solar Thermal 0.12 0.20 8.29 1.34 10.50 5.00 4.88 10.50 5.54 5.54
Solar Photovoltaic 0.20 0.51 3.87 3.35 4.20 3.57 8.13 4.20 3.96 3.96
Wind: Onshore 1.48 2.50 11.05 9.37 18.49 42.89 8.94 18.49 38.00 38.00
Wind: Offshore 0.30 0.70 2.76 1.34 4.20 5.72 2.03 4.20 7.92 7.92
Wave and Tidal 1.35 1.39 1.10 0.67 0.84 2.14 0.81 0.84 2.38 2.38
Hydropower 7.51 8.77 5.52 23.09 7.56 21.09 12.20 7.56 13.46 13.46
Coal 27.68 27.17 12.15 14.73 12.61 2.86 16.26 12.61 3.17 3.17
Oil 30.92 25.84 11.05 13.39 8.40 1.43 10.16 8.40 2.38 2.38
Natural Gas 21.90 22.70 13.26 16.73 14.71 4.29 16.26 14.71 5.54 5.54
Nuclear 5.47 6.65 6.08 10.04 9.24 6.43 4.47 9.24 7.13 7.13
Geothermal 0.09 0.15 3.31 1.34 4.20 2.86 2.44 4.20 3.17 3.17
(RUE)p 37.11 39.47 51.1 51.1 60.00 72.38 50.00 60.00 70.00 70.00
(SD)p 1.53 1.47 0.92 1.47 1.03 1.47 1.12 1.00 1.20 1.20
(DR)p -- -- 0.31 0.49 0.34 0.49 0.37 0.45 0.40 0.53
Sharpe ratio 24.25 26.85 55.54 34.76 58.25 49.24 44.65 60 58.33 58.33
Sortino ratio -- -- -- -- -- -- 0 0 50.10 19.01
5.5 Discussion
According to Table 5.3, the 2012 energy mix (P0) and the 2035 business as usual energy mix
(P1) get low RUE scores versus the risk taken. In fact, the resource use efficiency scores and risk
magnitudes of these portfolios are close, meaning that compared to the 2012 energy mix, the
2035 projected energy mix does not experience a significant improvement from a resource use
perspective. As shown in Figure 5.2, P0 and P1 are close to the curve representing the least
efficient portfolios (the lower curve). This implies that these portfolios are not optimal when
sustainability measures such as water use and land use are considered in addition to carbon
emissions and cost of energy production, mainly due to the considerable shares of fossil fuels in
the mix with their adverse environmental impacts. In Figure 5.2, P4 represents an efficient

123
portfolio with the same risk level as P1 but with 85% more efficiency. P4 compounds large
shares of renewable energy sources, particularly wind and hydropower, while leaving less than
10% for fossil fuels. Regardless of unavailability of infrastructures required to meet targets in P4
as well as the current reliance upon fossil fuels, P4 implies that a portfolio with sustainable
resource use efficiency carries considerable shares of specific renewable energy sources among
available alternatives.
Based on the outcomes of MPT analysis, P2 represents an efficient portfolio with minimum
risk and RUE. Compared to P0 and P1, P2 is less dependent on a specific energy source, yielding
a more diversified portfolio with fossil fuels being responsible for only 36% of the energy
production. P2 has 30% more RUE while 37% less risk than P1. P1 might be cheaper and more
feasible given existing infrastructures, but it lacks considerable potential to address sustainability
due to resource use inefficiency. In addition, compared to P1, P3 has 52% higher efficiency in
terms of the resource use, while the risk is 30% lower. P3 has even lower shares of renewable
and fossil fuels comparing to P2, but relies more upon specific energy sources such as wind and
nuclear while holding substantially lower shares of biofuels.
P2’ has the same resource use efficiency score as P2 but it has slightly higher risk value.
However, as shown in Table 5.3, these portfolios hold notably different shares of available
energy options. This shows that the shares of the energy sources in a portfolio are highly
sensitive to the risk magnitude of the portfolio and change significantly in response to a small
change in the risk. P2’ has the same risk level as the 2035 projected energy mix (P1), but it has
30% more resource use efficiency. Figure 5.4 shows the energy production from different energy
sources in the 2012 energy mix (P0) and the 2035 potential energy mix (P1). According to

124
Figure 5.4, the energy production from fossil fuels such as oil, coal, wave and tidal energy, and
ethanol from corn decrease, whereas the energy production from most renewables experience
significant rise, especially in the case of solar photovoltaic, geothermal, solar thermal, and
onshore and offshore wind energies. This means that the projected 2035 energy mix might
address the increasing energy needs, but it is not resource use efficient due to large shares of
fossil fuels and fairly small shares of renewables.
Figure 5.4: Energy production from different energy sources for 2012 energy mix (P 0)
and 2035 potential energy mix (P1)
Efficiency analysis based on PMPT yields different outcomes depending on decision maker’s
risk attitudes and MAR. However, as illustrated in Figure 5.5, efficient portfolios developed
from PMPT analysis are less risky compared to those constructed based on mean-variance
theory. P5, for instance, represents a portfolio with the least RUE score and risk magnitude for a
decision maker with MAR of 50. P5 is comparable to P2 in terms of RUE, whereas it has 60%
-29% 104% 200% 5% 67% 155% 69%
133% 3%
17%
-2%
-16%
4%
22%
67% 0
2000
4000
6000
8000
10000
12000
14000
16000
18000
Qu
adri
llio
n B
TU
2012 energyproduction mix
2013 energyproduction mix(projection)

125
less risk. Similarly, the least risky efficient portfolio for MAR of 60, P6, has the same RUE as
P3, but 56% less risk. This indicates that a certain portfolio is more attractive from the more
realistic downside risk perspective. P7 and P8, respectively developed for MARs 50 and 60, are
comparable to P4 as they have close RUEs. It is obvious from Table 5.3 and Figure 5.5 that P7
and P8 have significantly lower risks, making them more attractive for decision makers adopting
PMPT for portfolio analysis and development. Both portfolios have the same energy mix.
However, P8 has a higher magnitude of downside risk when compared to P7, implying the fact
that decision makers with higher MARs are adopting higher risk magnitudes for the same
portfolio versus higher gained RUE.
According to Figure 5.3, P5 and P7 are both developed based on MAR of 50. As mentioned
earlier, selection between diverse efficient portfolios developed for a particular decision maker is
a tradeoff between adopting higher magnitudes of risk and gaining more RUE. Sortino ratio is
developed to help with more robust decisions. In this case, P7 has a higher Sortino ratio,
meaning that it is worth taking more risk for higher RUE. Similarly, P8 is more desirable
compared to P6 developed for MAR of 60. Similar to Sortino ratio, Sharpe ratio helps decision
makers select more desirable portfolios in presence of tradeoffs between higher efficiency and
higher risk magnitudes. For instance, P4 has greater RUE and risk values compared to P3, but its
Sharpe ratio is lower, meaning that the excess RUE is not worth the additional risk of P4. In
other words, P3 is more desirable based on Sharpe ratio. However, P4 is more attractive if
portfolios are compared based on Sortino ratio, implying that selection based on the more
realistic downside risk yields different results.
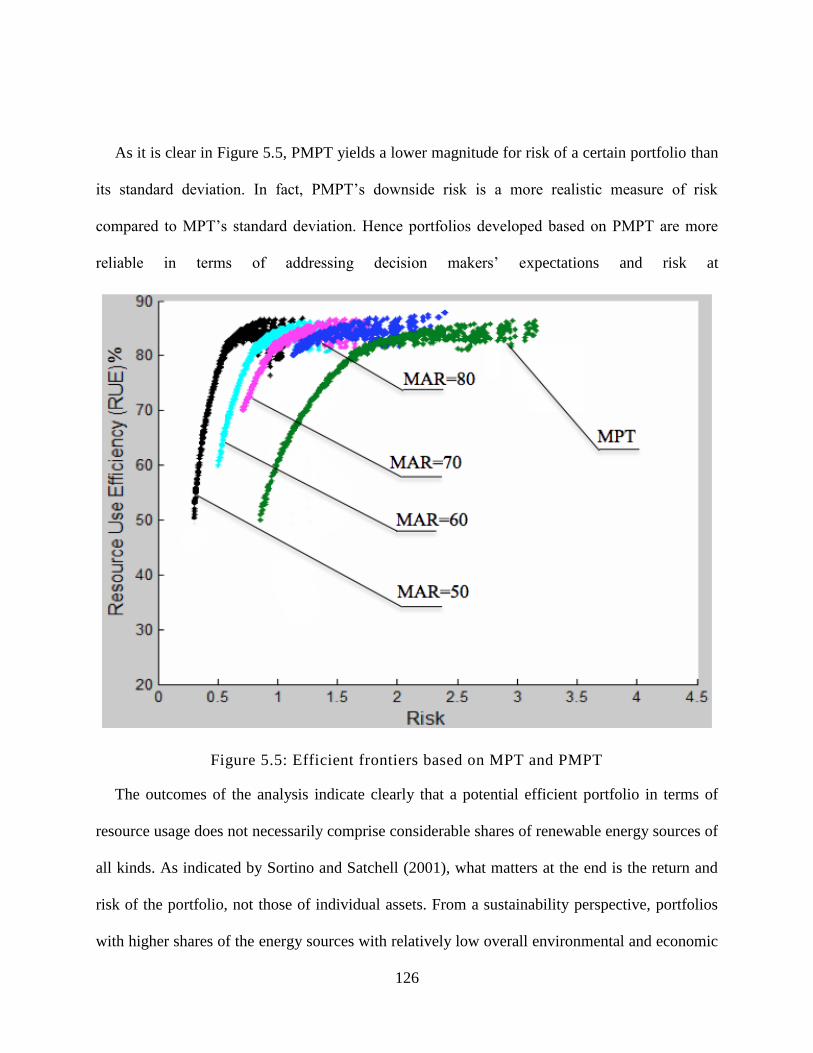
126
As it is clear in Figure 5.5, PMPT yields a lower magnitude for risk of a certain portfolio than
its standard deviation. In fact, PMPT’s downside risk is a more realistic measure of risk
compared to MPT’s standard deviation. Hence portfolios developed based on PMPT are more
reliable in terms of addressing decision makers’ expectations and risk at
Figure 5.5: Efficient frontiers based on MPT and PMPT
The outcomes of the analysis indicate clearly that a potential efficient portfolio in terms of
resource usage does not necessarily comprise considerable shares of renewable energy sources of
all kinds. As indicated by Sortino and Satchell (2001), what matters at the end is the return and
risk of the portfolio, not those of individual assets. From a sustainability perspective, portfolios
with higher shares of the energy sources with relatively low overall environmental and economic

127
impacts and risks have the most contribution in the portfolio. In addition, an efficient portfolio
with large RUE or low risk is not necessarily attractive. In fact, the risk-RUE tradeoff of a
portfolio for a specific decision maker determines the desirability of the portfolio.
The main message of this study is that energy planning based solely on cost simply ignores
the adverse effects of energy production processes on the environment. Global warming is a
clear example of such practices. Even taking into account the cost of emissions control and
reduction does not save the environment. Increasing demand for energy along with secondary
impacts of energy production processes on environmental resources such as water and land leave
no space for single criterion energy planning. The results indicate clearly that the expected future
energy status is highly unsustainable in terms of resource use efficiency, leading to severe
consequences such as natural resource depletion and pollution. This analysis demonstrates how
the concepts of resource use efficiency (RUE), developed based on a systems approach,
addresses different environmental and economic concerns and could replace the traditional cost
based energy planning in attempt to develop portfolios that are not only cost effective, but also
environmentally friendly. It is worth mentioning that an efficient portfolio for a decision maker
with specific goals and risk attitude is not necessarily unique. In other words, there might be
numerous portfolios with varying shares of different energy sources that yield the same RUE and
risk magnitude. In reality, technological, political, and economic considerations play a major role
in development and implementation of energy portfolios. In this study, feasibility of constructed
portfolios is not considered. In fact, more robust energy solutions could be developed if different
aspects of feasibility are also considered. The developed model in this study is capable of
addressing such concerns by adding more decision-making criteria that represent available

128
infrastructures as well as regional capacities and limitations. In addition, embodied energy for
sources could also be considered as another important index in developing more reliable energy
portfolios. For this purpose, energy return on investment (EROI) could also be taken into account
as another sustainability criterion in evaluating the overall efficiency of individual energy
sources that contribute to the portfolio. A systems approach toward energy planning is capable of
considering multiple conflicting criteria in evaluating the overall efficiency of the energy
sources, yielding a single and easy to understand measure to be fed into energy portfolio analyses
and development frameworks.
5.6 Conclusion
Ecosystem failures usually emerge because of a human’s willingness to succeed immediately,
regardless of long-term impacts of his actions. A look into the past reveals many situations in
which a particular action had been considered a reasonable solution to address a concern
effectively, but it was regarded as a threat once its drawbacks and downsides were disclosed.
One example of this could be the utilization of fossil fuels as primary energy sources to provide
goods and services at the beginning of the industrial revolution. Despite the fact that our life in
the current form would not have been possible without relying on fossil fuels over the past
decades, the consequences of such reliance are so severe that immediate actions are required to
regulate them. These actions should be designed and implemented in such a way that they have
minimal effects on the already stressed ecosystem as we do not want our policies, especially
environmental policies, to be a “today’s solution and tomorrow’s disaster” anymore. Energy
sources typically require tremendous amounts of various natural resources. So, their effects on

129
such resources should be investigated. Recognizing the nexus between energy, economy, and
natural resources subsystems provides the opportunity to move toward a more sustainable future.
The point is, with a policy developed without a systems view to the energy planning problem,
threats to our scarce natural resources are likely to emerge in the long run.
Least-cost energy planning neglects all negative impacts of energy production processes on
the environment by encouraging unsustainable methods of energy production that either produce
considerable amount of greenhouse gasses, consume a lot of water, or demand for significant
amounts of land. The model illustrates how sustainability could be addressed in energy planning
by applying the Modern Portfolio Theory (MPT) and Post Modern Portfolio Theory (PMPT) to
resource use efficiency (RUE) of the energy sources with associated fluctuations (risk).
Regardless of technological and regional limitations in energy planning, as indicated in the
results, there is a significant gap between EIA’s projected 2035 energy mix and a sustainable
energy portfolio. Such energy production policies will eventually leave considerable negative
impacts on our scarce natural resources and should be improved in terms of addressing
sustainability concerns by reducing shares of fossil fuels to lower levels. However, an
appropriate portfolio for a particular decision maker does not necessarily comprise considerable
shares of renewable energy sources of all kinds. In other words, the risk-RUE of a portfolio is
tied to a decision maker’s expectations and risk attitudes, leading to various shares of the energy
sources in the portfolio. A Systems approach toward evaluating energy sources overall efficiency
in extremely helpful in this regard.

130
5.7 References
Allan, G., Eromenko, I., McGregor, P., Swales, K. (2011). The regional electricity generation
mix in Scotland: A portfolio selection approach incorporating marine technologies. Energy
Policy, 39(1), 6-22.
Arnesano, M., Carlucci, A. P., Laforgia, D. (2012). Extension of portfolio theory application to
energy planning problem–The Italian case. Energy, 39(1), 112-124.
Awerbuch, S. (1993). The surprising role of risk in utility integrated resource planning. The
Electricity Journal, 6(3), 20-33.
Awerbuch, S. (1995). Market-based IRP: It's easy!!!. The Electricity Journal,8(3), 50-67.
Awerbuch, S. (2006). Portfolio-based electricity generation planning: policy implications for
renewables and energy security. Mitigation and adaptation strategies for Global
Change, 11(3), 693-710.
Awerbuch, S., Yang, S. (2007). Efficient electricity generating portfolios for Europe:
maximising energy security and climate change mitigation. EIB papers, 12(2), 8-37.
Ackerman, F., Stanton, E. (2011). Climate risks and carbon prices: Revising the social cost of
carbon. Economics Discussion Paper, (2011-40).
Bawa, V. S. (1982). Research Bibliography—Stochastic Dominance: A Research
Bibliography. Management Science, 28(6), 698-712.
Beltran, H. (2009). Modern Portfolio Theory Applied to Electricity Generation
Planning (Doctoral dissertation, University of Illinois).
Bernstein, L., Bosch, P., Canziani, O., Chen, Z., Christ, R., Davidson, O., Yohe, G. (2008).
Climate Change 2007: Synthesis Report: An Assessment of the Intergovernmental Panel on
Climate Change.
Bhattacharya, A., Kojima, S. (2012). Power sector investment risk and renewable energy: A
Japanese case study using portfolio risk optimization method. Energy Policy, 40, 69-80.
Clarkson, R. S. (1989). The measurement of investment risk. Journal of the Institute of
Actuaries, 116(1), 127-178.
Delarue, E., De Jonghe, C., Belmans, R., D'haeseleer, W. (2011). Applying portfolio theory to
the electricity sector: Energy versus power. Energy Economics, 33(1), 12-23.

131
Domingues, E. G., Arango, H., Abreu, P. G., Campinho, C. B., Paulillo, G. (2001). Applying
modern portfolio theory to investment projects in electric energy markets. In Power Tech
Proceedings, 2001 IEEE Porto (Vol. 1, pp. 5-pp). IEEE.
Fishburn, P. C. (1977). Mean-risk analysis with risk associated with below-target returns. The
American Economic Review, 67(2), 116-126.
Forsey, H. (2001). The Mathematician's View: Modelling Uncertainty with Three Parameter
Lognormal. Sortino/Satchell (Hrsg., 2001), 51-58.
Lesbirel, S. H. (2004). Diversification and energy security risks: the Japanese case. Japanese
Journal of Political Science, 5(1), 1-22.
Madlener, R., Glensk, B., Raymond, P. (2009). Applying Mean-Variance Portfolio Analysis to
E. ON’s Power Generation Portfolio in the UK and Sweden. Institute for Future Energy
Consumer Needs and Behavior.
Markowitz, H. (1952). Portfolio selection*. The journal of finance, 7(1), 77-91.
Nawrocki, D. N. (1999). A brief history of downside risk measures. The Journal of
Investing, 8(3), 9-25.
Rodoulis, N. (2010). Evaluation of Cyprus’ Electricity Generation Planning Using Mean-
Variance Portfolio Theory. Cyprus Economic Policy Review, 4(2), 25-42.
Rom, B. M., Ferguson, K. W. (1994). Post-modern portfolio theory comes of age. The Journal
of Investing, 3(3), 11-17.
Roques, F. A., Newbery, D. M., Nuttall, W. J. (2008). Fuel mix diversification incentives in
liberalized electricity markets: a mean–variance portfolio theory approach. Energy
Economics, 30(4), 1831-1849.
Rubinstein, M. (2002). Markowitz’s “Portfolio Selection”: A Fifty‐ Year Retrospective. The
journal of finance, 57(3), 1041-1045.
Sortino, F. A. (2001). From alpha to omega. Managing Downside Risk in Financial Markets, 51-
58.
Sortino, F. A., Price, L. N. (1994). Performance measurement in a downside risk framework. the
Journal of Investing, 3(3), 59-64.
Sortino, F. A., Satchell, S. (Eds.). (2001). Managing downside risk in financial markets.
Butterworth-Heinemann.
Sortino, F. A., Van Der Meer, R. (1991). Downside risk. The Journal of Portfolio Management,
17(4),27-31.

132
CHAPTER 6: CONCLUSIONS AND RECOMMENDATION
This dissertation incorporated the analysis of sustainable energy portfolios based on a
resource use efficiency perspective. Different portfolio theories, namely Modern Portfolio
Theory (MPT) and Post-Modern Portfolio Theory (PMPT) were implemented to create
sustainable portfolios and illustrate the more reliable energy solutions. Different resource use
sustainability indicators such as carbon footprint, water footprint, land footprint, and costs of
energy production were taken into account, based on which resource use efficiencies of energy
sources were measured. Various data (performance measures of renewable and nonrenewable
energy sources under sustainability criteria and resource limitations across the U.S.) have been
obtained, processed and utilized in this study. For the methodology part, this dissertation
employed a system of systems approach that incorporated a set of stochastic multi-criteria
assessment models to address different notions of optimality. This chapter discusses the critical
findings, conclusions, and recommendations of the three major research aspects: (1) energy
production secondary impacts analysis, (2) multi-criteria assessment of energy production
efficiency, (3) energy planning based on resource use sustainability considerations.
6.1 Energy Production Secondary Impacts Analysis
Energy production processes demand considerable resources of different types, including,
water, land, and money. To illustrate the impacts of global energy production on such resources,
the impacts on water resources are calculated for different Energy Information Administration
(EIA) energy scenarios for different oil price projections. The water footprint is selected as a

133
reliable measure for this purpose as it accounts for all direct and indirect water use in the energy
production lifecycle.
The water footprint values of different energy technologies are represented in ranges to
represent the existing technological and regional uncertainties. In addition to water footprint
values, the shares of different energy sources are extracted from EIA databases for five energy
mix scenarios: Reference, High Oil Prices, Low Oil Prices, Traditional High Oil Prices, and
Traditional Low Oil Prices. Based on these data, the amount of water that goes to the global
energy sector is calculated under each scenario.
The results of this analysis indicates that the water footprint of future energy production
grows faster than the amount of energy production itself, meaning that the global energy sector is
becoming thirstier. This is found to be especially true for energy scenarios that predict high oil
prices in the future, mostly due to larger shares of renewable energy sources in the future. In fact,
the amount of water that goes to the energy sector is found to increase by 37-66% over the 2012-
2035 period, while energy production and population are projected to grow by 40% and 20%
over the same period, respectively. In fact, if the 2012 energy source shares continue into the
future, the water footprint of the energy sector will be 1-10% less than the future energy
projections developed by EIA. It is also found that the water to energy ratio increases by 5-10%
over the 2012-2035 period, meaning that more water is required to produce one unit of energy.
This implies that increasing the share of renewable energy sources in the energy mix might
alleviate the climate change and improve the energy security, but it might have secondary
impacts on our scarce natural resources such as water and land.

134
6.2 Multi-Criteria Assessment Of Energy Efficiency
To identify the resource use impacts of different renewable and nonrenewable energy sources,
a new measure of efficiency is defined as resource use efficiency, representing the efficiency of
different energy sources in terms of their demand for water, land, economic resources, as well as
their carbon emissions in production of one unit of energy over their lifecycle. To calculate the
resource use efficiency, the interactions of independent yet interacting climate systems, water
systems, land systems, and economy systems are captured by a system of systems framework
that consists of multiple multi-criteria assessment methods. The resource use sustainability
analysis criteria are defined as carbon footprint, water footprint, land footprint, and costs of
energy production. The performance values of energy sources under sustainability indicators are
collected from a thorough literature review and adjusted (where needed) in accordance with the
purpose of this study. One of the major contributions of this study is to consider the existing
uncertainties of different energy technologies, which are reflected in the performance ranges of
the energy sources under resource use efficiency criteria. To account for such uncertainties, a
stochastic multi-criteria assessment framework is developed that consists of five MCDM
methods, each of which has a unique definition of optimality. Criteria weights are also
considered to be the same and equal to 25%, addressing the equivalent significance of all
secondary impacts in a sustainable manner.
The results of this analysis indicate that not all renewable energy sources are resource use
efficient based on simultaneous consideration of water impact, land impact, climate impact, and
costs. Geothermal is recognized as the most resource use efficient energy source, followed by
onshore wind, solar thermal, offshore wind, nuclear, and wave and tidal energies. These energy

135
sources are classified as sources with high resource use efficiency. Energy sources with medium
resource use efficiency are hydropower, solar photovoltaic, and natural gas. Finally, low resource
use efficient energy sources are different types of ethanol and biomass, coal, and oil. The results
shows that some renewable energy sources such as ethanol and biofuels are less resource use
efficient than some nonrenewable energy sources such as natural gas when a holistic view of the
unintended consequences of energy production is employed.
To clarify the sensitivity of the obtained resource use efficiency scores under varying resource
limitation conditions, sensitivity analysis is performed based on which extreme resource
availability patterns are implemented in the model. Hence, the weight of different sustainability
criteria varies from 0 to 100 to reflect resource limitation scenarios. Based on sensitivity analysis
outcomes, geothermal and ethanol from sugarcane energy sources are the most and least
sensitive energy sources under varying resource availability conditions.
In addition to the sensitivity analysis, robustness analysis is performed to investigate the
effects of performance uncertainties on the resource use efficiency of the energy sources. In fact,
the uncertainty intervals yield uncertain outcomes. In this analysis, all energy source resource
use efficiency scores follow normal distribution. The standard deviation of such distributions is
treated as an indication of resource use efficiency robustness in the face of performance
uncertainties. The results of this analysis show that solar thermal and hydropower energy
technologies are the most and least robust energy sources, respectively, meaning that the existing
performance uncertainties have the smallest and largest impacts on the resource use efficiency of
these energy sources, respectively.

136
Furthermore, the impacts of regional resource limitations on the preference toward different
energy sources are investigated. For this purpose, appropriate data are gathered from federal
agencies for the availability of water, land, economic resources, and emissions in each state
within the United States of America. Per capita emissions, freshwater withdrawals, land area,
and GDP are chosen to represent such resource limitations across the United States. The resource
use sustainability measures are weighted for each state based on the resource limitations in that
state. The results of regionalized stochastic multi-criteria assessment illustrate that energy
sources resource use efficiency scores are extremely sensitive to resource availability conditions.
In fact, for some states, fossil fuels such as coal and oil are more resource use efficient than
renewables such as solar and wind energy technologies. In other words, the high resource use
efficient energy sources under “no resource limitation” conditions are not necessarily appropriate
for all locations with different resource limitation patterns. Hence, although renewable energies
have lower emissions and provide more diversity in the energy portfolio, they are not all
appropriate for all locations with different characteristics.
6.3 Energy Planning Based On Resource Use Sustainability Considerations
Portfolio theories are utilized to develop energy portfolios that address global warming,
energy security, and sustainability considerations discussed in this study. Based on portfolio
theories, efficient portfolios have the largest possible return versus the lowest possible risk. In
this study, portfolio returns are not defined as the expected return of assets based on monetary
values that only reflect the economic aspect of sustainability. However, it is defined as the
weighted average of energy sources resource use efficiency scores that consider both economic

137
and environmental sustainability aspects. In the Modern Portfolio Theory (MPT), portfolio risks
are obtained based on energy alternatives standard deviation of resource use efficiency scores,
meaning that any deviation (positive or negative) from expected resource use efficiency should
be regarded as portfolio risk. In Post-Modern Portfolio Theory (PMPT), portfolio downside risk
should be implemented, considering only the below target resource use efficiency scores as the
risk of the portfolio. The results from both portfolio theories indicate that 2012 energy portfolio
and 2035 energy projection based on the EIA reference scenario are not sustainable from a
resource use perspective, as more efficiency could be obtained with the same risk level. In fact,
these portfolios are similar in their risk and resource use efficiency scores. Another
counterintuitive outcome of this analysis is that increasing the share of all renewables in the
portfolio would not necessarily lead to more resource use efficient portfolios. In fact, only a few
renewable energy sources contribute to portfolio high resource use efficiency and low risk levels.
Although the results of this study demonstrate the significance of simultaneous consideration
of energy production impacts in energy planning and policy analysis, limitations do exist in the
analysis. First, the outcomes of this research are obtained based on data from EIA scenarios,
which are considered to be high oil production scenarios with lower shares for renewable energy
sources in the future. To obtain more reliable solutions to the energy planning problem, future
studies may focus on scenarios developed by other sources such as International Energy Agency
(IEA), World Energy Council (WEC), Organization of the Petroleum Exporting Countries
(OPEC), etc.
In addition, the performance measures of the energy sources in this study are based on the
assumption that performance values of energy sources under different sustainability criteria do

138
not experience substantial alteration over time. However, future technology improvements could
significantly affect the performance of energy sources, ultimately leading to different energy
solutions. Also, the regional energy efficiency analysis in this study is performed based on the
states total available water, land, GDP, and emissions. A more precise analysis could incorporate
the limitations of such resources within each state (on smaller scale). Furthermore, more reliable
energy efficiency outcomes could be reached based on the availability and limitation of such
resources for the energy sector in each region.