Embed Size (px)
Citation preview

1
SUSTAINABILITY LEARNING GUIDE
The world’s habitats are in danger and you can help save them.
A Teaching Resource for students 7 to 12 years.

2
About Habitat the Game
In the vein of the Tamagotchi persistence play craze of the 90s, users will undertake actions to keep an endangered animal alive. In Habitat game players will adopt a polar bear. To keep the bear alive and healthy, players need to successfully complete events in the game and undertake real world actions. By completing these TASKS players will progress through levels, increasing the health of their bear. Ultimately the goal is to save the world by improving the bear’s health.
Habitat the Game is designed to teach seven to 12 year-olds ecologically sustainable habits, the game encourages players to adopt an endangered animal, a virtual polar bear, and keep it happy and healthy. Players earn points through games in the app and by completing real-life “missions,” like recycling or checking in at more than 30 parks around the world, including national parks, Zoos and other iconic sites. The virtual pins collected at these sites can also be traded with players around the world.
The Habitat team worked with the Integrated Sustainability Analysis team at Sydney University to develop algorithms that measure players’ ecological footprint based on indicators like water consumption and greenhouse gas emissions. In addition to promoting outdoor activities, the point system in the game incentivizes players towards a 25% reduction in their carbon, water and land use and shows their impact through an ecological footprint calculator.
3
Curriculum Overview
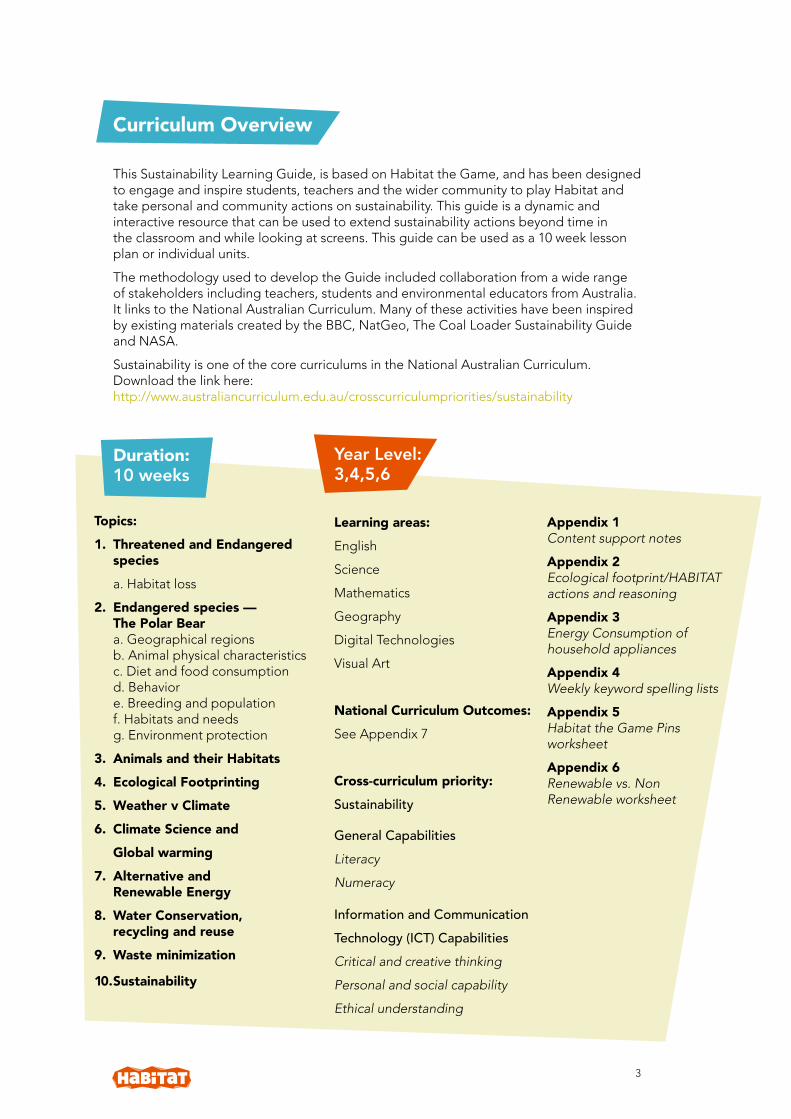
This Sustainability Learning Guide, is based on Habitat the Game, and has been designed to engage and inspire students, teachers and the wider community to play Habitat and take personal and community actions on sustainability. This guide is a dynamic and interactive resource that can be used to extend sustainability actions beyond time in the classroom and while looking at screens. This guide can be used as a 10 week lesson plan or individual units.
The methodology used to develop the Guide included collaboration from a wide range of stakeholders including teachers, students and environmental educators from Australia. It links to the National Australian Curriculum. Many of these activities have been inspired by existing materials created by the BBC, NatGeo, The Coal Loader Sustainability Guide and NASA.
Sustainability is one of the core curriculums in the National Australian Curriculum. Download the link here: http://www.australiancurriculum.edu.au/crosscurriculumpriorities/sustainability
Topics:1. Threatened and Endangered species a. Habitat loss
2. Endangered species — The Polar Bear a. Geographical regions b. Animal physical characteristics c. Diet and food consumption d. Behavior e. Breeding and population f. Habitats and needs g. Environment protection
3. Animals and their Habitats4. Ecological Footprinting5. Weather v Climate6. Climate Science and Global warming7. Alternative and Renewable Energy8. Water Conservation, recycling and reuse9. Waste minimization
10. Sustainability
Year Level: 3,4,5,6
Learning areas:English
Science
Mathematics
Geography
Digital Technologies
Visual Art
National Curriculum Outcomes:See Appendix 7
Cross-curriculum priority:Sustainability
General CapabilitiesLiteracy
Numeracy
Information and CommunicationTechnology (ICT) CapabilitiesCritical and creative thinking
Personal and social capability
Ethical understanding
Duration: 10 weeks
Appendix 1Content support notes
Appendix 2Ecological footprint/HABITAT actions and reasoning
Appendix 3Energy Consumption of household appliances
Appendix 4Weekly keyword spelling lists
Appendix 5Habitat the Game Pins worksheet
Appendix 6Renewable vs. Non Renewable worksheet

4
Playing Habitat the game
FREE for SmartphonesYou can download the game Habitat the Game for free on all iOS, Android and tablet devices.
Find the app on iTunes and Google Play.
Children who do not have a smartphone can play online at www.Habitat the Game.com
There is an educational blog at: http://Habitat the Game.wordpress.com/
And a walk through on the game at: http://Habitat the Game.wordpress.com/2014/07/15/Habitat the Game-walkthrough/
Watch the Habitat the Game videos
The videos are less than 3 minutes each and explain different aspects of the game.
https://www.youtube.com/channel/UCE0fysLAWh7r26KiPmYL_OQ
At the end of the unit– Inspire students who wish to pursue further actions:
– Spread the message at school during assembly.
– Write a key message from the game into your newsletter, perhaps include a regular eco-tip.
– Create signs/posters/recycling boxes for classrooms encouraging sustainable actions.
– Start a kitchen garden and cook a meal once a term.
– Build animal habitat boxes and place in the school playground.
Stay connected with Habitat the Game
https://www.facebook.com/Habitat the Game
5
Climate Change and Threatened Species
Learning outcomes Year 3 English ACELY1675, ACELA1479, ACELY1792, ACELY1682, ACELY1683, ACELY1684, ACELY1685
Geography ACHGK017
Science ACSHE051
Digital Technologies ACTDIK007, ACTDIK008, ACTDIP010
Year 4 English ACELA1498, ACELY1695, ACELY1696, ACELY1697
Geography ACHGK022, ACHGK024, ACHGS031
Digital Technologies ACTDIK007, ACTDIK008, ACTDIP010
Year 5 English ACELA1504, ACELA1512, ACELY1699, ACELY1706, ACELY1707
Geography ACHGK029, ACHGS039
Science ACSSU043, ACSHE217, ACSIS093
Year 6 English ACELA1522, ACELA1523, ACELY1716, ACELY1717
Geography ACHGS046
Science ACSSU094, ACSHE220, ACSIS110
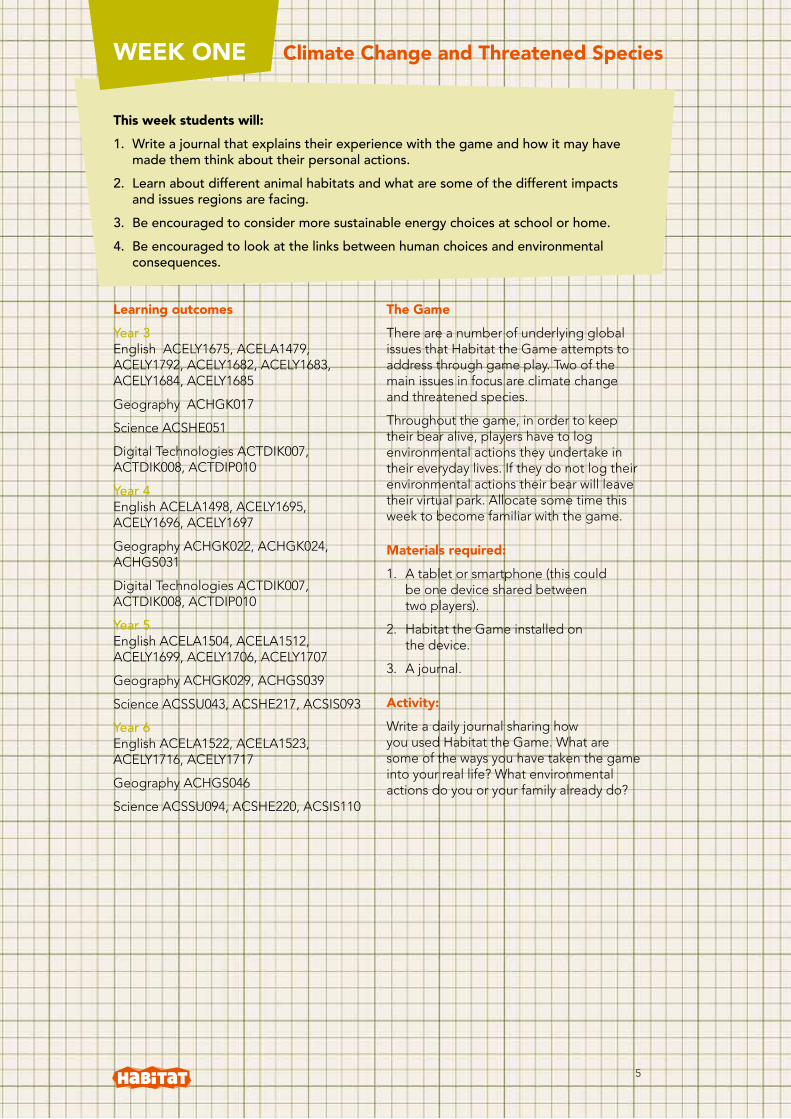
The GameThere are a number of underlying global issues that Habitat the Game attempts to address through game play. Two of the main issues in focus are climate change and threatened species.
Throughout the game, in order to keep their bear alive, players have to log environmental actions they undertake in their everyday lives. If they do not log their environmental actions their bear will leave their virtual park. Allocate some time this week to become familiar with the game.
Materials required:1. A tablet or smartphone (this could
be one device shared between two players).
2. Habitat the Game installed on the device.
3. A journal.
Activity:Write a daily journal sharing how you used Habitat the Game. What are some of the ways you have taken the game into your real life? What environmental actions do you or your family already do?
This week students will:1. Write a journal that explains their experience with the game and how it may have
made them think about their personal actions.2. Learn about different animal habitats and what are some of the different impacts
and issues regions are facing.3. Be encouraged to consider more sustainable energy choices at school or home.4. Be encouraged to look at the links between human choices and environmental
consequences.
WEEK ONE

6
Learning outcomes Year 3 English ACELY1675, ACELA1479, ACELY 1676, ACELY1682, ACELY1683, ACELY1684, ACELY1685
Geography ACHGS020, ACHGS021, ACHGS022, ACHGS024
Mathematics ACMSP068, ACMSP069
Digital Technologies ACTDIK007, ACTDIK008
Year 4 English ACELY1688, ACELY1695, ACELA1793, ACELY1698, ACELY1692, ACELY1694, ACELY1695, ACELY1696, ACELY1697
Geography ACHGK022, ACHGS027, ACHGS029, ACHGS031, ACHGS032
Science ACSIS068
Mathematics ACMSP095, ACMSP096
Digital Technologies ACTDIK007, ACTDIK008
Year 5 English ACELY1709, ACELA1522, ACELA1523, ACELY1712, ACELY1714, ACELY1716, ACELY1717
Geography ACHGK034, ACHGS035
Science ACSIS093
Year 6 English ACELA1522, ACELA1523, ACELY1716, ACELY1717
Geography ACHGS042, ACHGS044, ACHGS045
Science ACSSU094, ACSIS107, ACSIS110
Mathematics ACMSP147
The GameStudents ideally would login daily to take consistent care of their adopted polar bear and their environment with the length determined by the teacher.
Activities:1. Research polar bears and their
environment.
2. Write a short story about your bear using your research. What are some of the environmental issues your polar bear faces? What is the bear’s most unique characteristics? Does your bear get into mischief?
3. Conduct your own survey: The polar bear was the most popular animal surveyed by kids. This is why the Habitat the Game team created the bear. Conduct your own survey. What other endangered animals do other students like? Where do these animals live? What are some of the challenges they face? Create a classroom display of the results using a picture or column graph.
5. Map the areas where polar bears live today. Study the United States Geological Survey and redraw the map to show where their habitat is predicted to be by 2050. https://www.youtube.com/watch?v=1xJ8wSBTU_4
6. What are some of the ways we can help protect the polar bear from facing extinction?
This week students will learn:1. To increase knowledge and awareness the impact of species due to loss of habitat. 2. To learn about different polar bear habitats and what are some of the different
impacts facing these animals.3. To encourage students to look at the links between human choices and
environmental consequences.4. Look at animal behaviors and characteristics.5. Look at ways to mitigate species extinction.
WEEK TWO Endangered species — The Polar Beara. Geographical regions b. Animal physical characteristicsc. Diet and food consumption d. Behavior
e. Breeding and population f. Habitats and needs g. Environment protection

7
Animals and their Habitats
Learning outcomes Year 3 Science ACSSU044
Digital Technologies ACTDIK007
Year 4 Geography ACHGK022, ACHGK024
Digital Technologies ACTDIK007
Year 5 Geography ACHGK026
Science ACSSU043
Year 6 Geography ACHGS031
Science ACSSU094
The GamePlayers in Habitat the Game are rewarded ‘in game’ for their real world behavior and for visiting nature locations. Players earn points through games in the app and by completing real-life “missions,” like recycling or checking in at natural locations such as national parks and other iconic sites around the world.
Players collect unique virtual pins of the animals at each of the sites. These pins can be traded with other players around the world. There are also multiple choice questions about each of the pins.
There are now 150 virtual pins for players to collect in the game in 13 different countries. The players determine the “value” of the pins through anonymous online trades.
Materials required:1. A tablet or smartphone.
2. Habitat the Game installed on the device.
3. Print Appendix 5 Habitat the Game pins worksheet.
4. If you would like the Habitat the Game team to put a local pin in your area that the kids can collect email us on info@Habitat the Game.com
Activities:1. Look through the Habitat the Game
pins (see worksheet) – ask students to pick three animals, with at least one from Australia, Asia and either Africa, South America, Europe or North America. Research the animal and create three multiple-choice questions for the pin they have chosen. Compare these questions to the ones that are used in the game. Discuss both sets of questions.
2. Collect a pin in your area (teacher needs to contact Habitat the Game team to place pin.) Visit the area. Identify the flora and fauna in the area. Look at the animal that is in your area. Identify what is unique about the area and makes it a good spot for that animal to live.
This week students will:1. Learn about designing questions for audiences. What is the most engaging way to
present information about a species?2. Learn about different animals and their habitats. 3. Learn about their local area.4. Look at what is required for an animal to live in a certain area.
WEEK THREE

8
Learning outcomes Year 3 Mathematics ACMSP068, ACMSP069
Digital Technologies ACTDIK007, ACTDIK008
Year 4 Geography ACHGK025, ACHGS032, ACHGK029
Science ACSHE061, ACSHE062
Digital Technologies ACTDIK007, ACTDIK008
Year 5 Science ACSSU043, ACSHE217, ACSIS218
Year 6 Science ACSSU094, ACSHE220, ACSIS221
Mathematics ACMSP147, ACMSP148
The GameThe Habitat the Game Team partnered with Sydney University to develop algorithms that measure players’ ecological footprint based on indicators like water consumption and greenhouse gas emissions. In addition to promoting outdoor activities, the point system in the game incentivizes players towards a 25% reduction in their carbon, water and land use and shows their impact through an ecological footprint calculator.
Players will be able to see how much carbon, water and land they have saved. These measurements are represented as:
1. Buckets
2. Footprints
3. Balloons
The players will be learning:
“The number of buckets represents the litres of water you have saved. The measurements are based on an averaged sized 10 litre bucket (2.64 gallons). 70% of the world’s surface is water and only 2.5% is freshwater with less than 1% of the freshwater accessible to humans.”
“The number of footprints represents the area of land that you have NOT disturbed by your actions. The measurement is based on a typical human footprint area of 300 cm2 (47 square-inches). By reducing your resource use, by consuming different sorts of products or by reducing waste, you are treading more lightly on the planet.”
“The number of balloons represents the volume of greenhouse gas emissions that you have saved. Measured in terms of volume of C02 gas, 1 kg (2.2 pounds) of CO2 is equivalent to 140 typical party balloons. CO2 is the most important greenhouse gas contributing to global warming.”
We have based the point system in the game around incentivising the players towards a 25% reduction in their carbon, water and land use – compared with the national average.
This week students will:1. Increase knowledge and awareness of the impact of human decisions on the
environment.2. Learn about environmental impacts in terms of carbon, water and land used/saved.3. Learn about ecological foot-printing and how to create their own.4. Learn about footprints in different areas of the world.5. Encourage students to look at their individual behaviors.
WEEK FOUR Ecological Footprinting

9
Materials required:1. A tablet or smartphone.
2. Habitat the Game installed on the device.
3. Have a computer so students can do their own footprint.
Activities1. Open the app and go to your real world
action page. Undertake some real world actions that you have done today. Look at your profile and see how much land, water and carbon you have saved. Work out how much water, land or carbon these simple actions have saved you. Work out how much your class would save if you collectively undertook these actions.
a. Discuss why carbon, land and water are measured.
b. What is the difference between a carbon footprint and an eco footprint?
2. Write down all the environmental actions you undertake in your every day life. Appendix 2 shows a list of 38 environmental actions that are included in Habitat the Game and explains why they are important actions. Beside each of your actions identify why you think they may be important.
Below is our most current calculations showing the player reductions and the links to the point (reward) system:
3. Calculating your footprint:
Open one of the footprint calculators and have students enter their data.
http://calc.zerofootprint.net/
http://www.wwf.org.au/our_work/people_and_the_environment/human_footprint/footprint_calculator/
a) Get students to tell you how many worlds they would need to support their lifestyles.
b) Do they think people in other countries would need the same amount of resources?
c) Discuss what are some of the activities that consumed the most resources?
d) Discuss the different make up of your individual ecological footprint.
e) What are three actions the students can undertake that will reduce their ecological footprint?
Indicator Value Units Value Units Reduction Total Reduction Factor
Total emissions 17,119 kg C02-e
2,445,618 balloons 25% 611,405 1
Total water consumption 693,943 L 69,394 buckets 25% 17,349 20
Total land disturbance 30,227 m2 1,007,579 footprints 25% 251,895 1.5
The correlation between points and player reductions

10
Learning outcomes Year 3 Geography ACHGK017
Digital Technologies ACTDIK007, ACTDIK008
Year 4 Science ACSSU073, ACSHE061, ACSHE062
Digital Technologies ACTDIK007, ACTDIK008
Year 5 Geography ACHGK029
Science ACSSU043, ACSHE217
Mathematics ACMNA098, ACMNA100, ACMNA291
Year 6 Science ACSSU094, ACSSU096, ACSHE098, ACSHE220
Mathematics ACMNA123, ACMSP147, ACMSP148
Materials required: Computer for activity one and access to the Internet to play NASA’s climate kids.
Activities:1. Complete the list of Trivia questions
below about weather and Climate at NASA’ Climate kids http://climatekids.nasa.gov/trivia/
2. Measure how much methane is in your lunch. Methane produces 20x more emissions than C02. Cow burps or agriculture contributes to about 14% of global emissions. Look at what you have in your lunch ie meat or vegetarian and see the difference different food choices have on greenhouse gases.
3. Work out how much Co2 is released by an average car a year. What environmental behavior can you undertake to save the most carbon? How many cars could you “take off the road” each year?
This week students will:1. Learn about the difference between Climate and Weather.2. Explain why people study climate.3. Understand what is global climate change.
WEEK FIVE Weather vs Climate

11
Learning outcomes Year 3 Geography ACHGK017
Digital Technologies ACTDIK007, ACTDIK008
Year 4 Science ACSSU073, ACSHE061, ACSHE062
Digital Technologies ACTDIK007, ACTDIK008
Year 5 Geography ACHGK029
Science ACSSU043, ACSHE217
Year 6 Science ACSSU094, ACSSU096, ACSHE098, ACSHE220
Mathematics ACMSP148
Materials required:1. A tablet or smartphone.
2. Habitat the Game installed on the device.
3. Watch an animation on the greenhouse effect http://www.epa.gov/climatechange/kids/basics/index.html
4. Look through the learning resources at http://www.epa.gov/climatechange/kids/impacts/signs/index.html
Activities:1. Open the app look go to your real
world action page. Undertake some real world actions that you have done today. Look at your profile and see how much carbon you have saved. Work out how much carbon these simple actions have saved you. Which actions are saving the most carbon? Work out how much carbon your class would save if you collectively undertook these actions.
2. Climate Science a) Draw a diagram that shows the
make up of greenhouse gases in the world. Draw some of the things that contribute to these gases in your diagram.
b) Draw some of the signs of climate change eg Wild Weather
3. Climate Science and Geography a) Pick a location in the world talk
about how what are some of the changes due to climate change this area may see.
This week students will:1. Increase knowledge and awareness the impact of human decisions on the
environment.2. Learn about environmental impacts in terms of Carbon. 3. Learn the concepts of climate change and global warming. 4. Be encouraged to look at their individual behaviors.
WEEK SIX Climate Science and Global Warming

12
Learning outcomes Year 3 Geography ACHGS025
Digital Technologies ACTDIK007, ACTDIK008
Year 4 Geography ACHGS027, ACHGS03Z
Science ACSHE062
Digital Technologies ACTDIK007, ACTDIK008
Year 5 Geography ACHGS034, ACHGS035
Science ACSHE081, ACSHE217
Mathematics ACMNA107, ACMSP120
Year 6 Science ACSHE098, ACSHE220
Mathematics ACMNA123, ACMNA124
Materials required:1. Paper and pens.
2. Print Appendix 3 – Energy Consumption of Household Appliances.
Activities:1. Design your house: Draw the layout
of your house, including mark the direction of the sun. Work out the approximate size of your roof and how many solar panels you may put on the roof. You can have them for all your energy needs or just your solar hot water. Work out how much energy your family uses, minus the power you are now creating with your solar panels and see if you will be putting electricity back into the grid.
2. Appliances: a. Set up a fake energy company –
pick and name and design a logo.
b. Pretend that you have gone into your home to do an energy audit.
c. List all of the appliances you have in your house. Arrange the list to show which appliances consume the most energy. See table below.
d. Write an energy saving plan for your home to save money and power. Prepare the energy saving plan for your parents.
e. Class Activity: Do a group activity that audits the energy in your school. Draw up a list of recommendations for your Principal.
This week students will:1. Increase knowledge and awareness of the different types of energies, and to
illustrate the positives and negatives of each. 2. Be encouraged to consider more sustainable energy choices at school or home.3. Learn about civic leadership and what decision-making processes are used at a local government level to make decisions on sustainability and other issues.4. Learn to calculate energy consumption. 5. Learn how to interpret energy consumption data in order to make conclusions
about what factors influence consumption patterns.6. Be able to identify the most energy intensive appliances/equipment.7. Identify strategies to reduce energy at school and home.
WEEK SEVEN Alternative and Renewable Energy

13
Water Conservation
Learning outcomes Year 3 Mathematics ACMNA057
Digital Technologies ACTDIK007, ACTDIK008
Year 4 Geography ACHGS024, ACHGS027, ACHGS032
Science ACSHE061, ACSHE062
Mathematics ACMSP095, ACMNA081
Digital Technologies ACTDIK007, ACTDIK008
Year 5 Geography ACHGK029, ACHGS034, ACHGSS039
Science ACSHE081, ACSHE217, ACSIS218
Mathematics ACMNA098, ACMNA100, ACMSP118, ACMNA291
Year 6 Science ACSHE098, ACSHE220, ACSIS221
Mathematics ACMNA123, ACMSP144, ACMNA148
The GameHabitat the Game rewards players who decrease their use of water. There are many ways to save water including cutting use, recycling and reuse. Water is an extremely precious resource. Of all the water in the world, 97% is salt water and only 3% is fresh water. Of this 3%, a tiny amount (less 0.01%) is available for human use. The rest is frozen in glaciers or polar ice caps, or is deep within the earth, beyond our reach. To put it another way, if 100 litres represents the world’s water, about half a tablespoon of it is fresh water available for our use.
When thinking about water conservation, recycling and reuse there are a number of things you can do to save water:
1. Get a water tank for your home or school: The water is used for toilet flushing, garden and nursery irrigation and general washing-down.
2. Use water saving devices: Such as tap aerators, dual flush toilets
and water saving appliances eg dishwasher. The bathrooms with a 4 star WELS rated toilets use only 3.5L water per flush compared with 12L for a traditional toilet, and 6 star WELS rated taps, using only 4.5L water per minute compared to a normal tap using up to 18L per minute.
This week students will:1. Calculate the amount of water consumed at home and identify the different water
saving devices and technologies used to conserve water.2. Understand the importance of water saving and what systems, devices and behavior
can be used to reduce water consumption.3. Use real time water data to calculate consumption.4. Write a diary to monitor their own and their family’s water use and come up with
suggestions about how they may make savings.
WEEK EIGHT
14
Activities:1. Household water:
a. This activity requires students to list all of the water outlets in their house. What are the ways in which your household consumes water? How many are already water saving devices? Does the house have a rain tank? Do you wait until the dishwasher is full before you turn it on?
b. Students are encouraged to think not only about systems and devices but also consider water use behaviors and their impact on water consumption. For example, waiting until the dishwasher is full before use or hand washing if there are only a couple of items.
c. Estimate how much water you currently use around the house.
d. Then identify the ways in which you could save water. Now recalculate the water use imagining all your water saving suggestions were put to use.
2. Measuring your water consumption/footprint. Open the Habitat the Game. Go to the real world actions section. Chose some of the water saving actions you have completed today. Measure via your profile page how much water you save completing these actions. How much would you save if your whole class completed the action? What is this the equivalent of? A bucket? A swimming pool?

15
Waste Minimisation
Year 3 Digital Technologies ACTDIK007, ACTDIK008
Year 4 Geography ACHGK024, ACHGK025, ACHGS026
Digital Technologies ACTDIK007, ACTDIK008
Year 5 Geography ACHGK033, ACHGS039
Science ACSHE081, ACSHE217, ACSIS218
Year 6 Science ACSHE098, ACSHE220
Materials required:1. A tablet or smartphone.
2. Habitat the Game installed on the device.
3. Print Renewable v Non Renewable worksheet in Appendix 6.
Activities:1. Have students identify the different
ways they can avoid, reduce, reuse and recycle waste. a. Look at the list of Habitat the Game
behaviors (Appendix 2) that are in the game and decide how you would class each action i.e. avoiding, reducing, reusing or recycling waste.
2. Perils of Plastic a. Students learn about the world’s
largest “landfill”, a collection of trash covering an estimated five million square miles of the Pacific Ocean. To connect this crisis to their own world students estimate what their recyclable trash is for the week. They extrapolate this number to make additional calculations.
3. Renewable versus non-renewable resources a. A renewable resource is one that can
be replaced by nature eg sun, wind, water (and oranges!)
b. Non renewable resources cannot be replaced by nature once they have been used. eg: oil, coal, petroleum
c. In this activity you will be asked to consider the life cycle of two different products, an orange juice popper and an orange.
d. Complete the table Renewable vs non-Renewable worksheet, which looks at the life cycle of the popper and the orange.
Class Discussion:1. Which product do you think has the
lower environmental impact? Discuss your reasons why.
2. Could you answer all the questions about each product? What information is missing and where could we go to find this out?
Using all the information you have gathered as a class help piece together a product life cycle for both the popper and the orange. You could either draw pictures to represent the different stages in the products life or you might like to use the following headings.
1. Raw materials
2. Transport
3. Manufacturing and packaging
4. Distribution
5. Use by consumer
6. Disposal or recycling
This week students will:1. Understand the waste management hierarchy.2. Be able to identify different strategies to avoid, reduce, reuse, and recycle waste.3. Be able to research and assess the life cycle of a product.4. Compare and contrast the ecological impact of different products.
Learning outcomes
WEEK NINE

16
At every stage be sure you consider both the inputs eg soil, air, water, fertilisers etc, and the outputs eg waste, emissions to air and water etc.
Discuss the differences between the two product life cycles. Which would you choose to buy? What could be done to reduce the environmental impact of the orange juice popper?
This activity will demonstrate that all products have life cycles that can be studied to estimate the ecological impact of the product. Students are challenged to research and analyse the life cycle of one product, the orange juice popper, compared to another that could meet the same need with a lower ecological impact, the orange.
Aim:To be able use the waste hierarchy to categorise the various waste management strategies that can be implemented in their homes.
To conduct a life cycle analysis on two items that both produce the same product, but which have different life cycles. Students will compare the life cycle of an orange juice popper and an orange, and examine the ecological impact of each.

17
Learning outcomes Year 3 & 4 Visual Arts ACAVAM111, ACAVAM112
Digital Technologies ACTDIK007, ACTDIK008
Year 5 & 6 Visual Arts ACAVAM115, ACAVAM116
The GameHabitat the Game aims to give players a holistic view of sustainability by measuring their eco footprint including the measurement of carbon, land and water.
Sustainability is based on a simple principle: Everything that we need for our survival and wellbeing depends, either directly or indirectly, on our natural environment. Sustainability creates and maintains the conditions under which humans and nature can exist in productive harmony, that permit fulfilling the social, economic and other requirements of present and future generations.
Sustainability is important to making sure that we have and will continue to have, the water, materials, and resources to protect human health and our environment.
Materials required:Various art supplies.
Activities: Create an artwork reflecting your ideas of a sustainable world.
This week students will:1. Demonstrate their understanding of the concepts of sustainability.2. Identify some features of a sustainable world and represent them visually.
WEEK TEN Sustainability

18
APPENDIX 1 — Content support notes
Week 1 — Threatened and Endangered Species Habitat LossThe impact of climate change is placing enormous pressure on the earth’s fragile ecosystems pushing many of the earth’s animals and plants close to extinction.
This century global warming is expected to be one of the greatest drivers of species extinction, particularly those species that have already declined due to other human causes.
Few species will be immune to the effects of global warming, but some are particularly at risk such as those in areas of higher than average warming (polar regions), those that cannot adapt and those whose populations are already too small to cope with rapid changes. A recent report by the International Union for Conservation of Nature (IUCN) suggests that up to 35% of birds, 52% of amphibians and 71% of reef-building corals have traits that are likely to make them particularly susceptible to climate change.
For species like orang-utans, tigers and whales, which have been at risk of extinction for decades, due to over-exploitation by humans and habitat loss, climate change threatens to put the final nail in the coffin. Threats like the widespread loss and fragmentation of habitat, illegal hunting and trade, and uncontrolled, unsustainable human development have already drastically depleted many species’ populations worldwide. Six of the seven species of marine turtles are threatened or endangered, and one-third of
Australia and New Guinea’s kangaroo and wallaby species are at risk of extinction. In combination with the existing threats, global warming will push some species over the edge unless drastic measures are taken now.
Predicting the effects of global warming is not an exact science. It relies on a combination of bioclimatic modelling and ecological knowledge. Bioclimatic modelling allows scientists to predict the potential impacts of climate change on the natural distribution of species. For many species it is unknown how – or if – they will adapt to climate change. Some adapt easily to their environment, while others are have very specific needs.
For species like orang-utans in Indonesia or Malaysia and African elephants, food shortages as a result of changed rainfall patterns may be one of the first signs of climate change. In the dwindling Indonesian forests where orang-utans live, the frequency and intensity of flooding and wild fi res are predicted to increase in wet and dry seasons respectively, changing the life cycles of their food plants and nesting trees and reducing food supply. Coupled with widespread logging of their habitat and illegal hunting and capture of orang-utans, the combination could be the final blow. In sub-Saharan Africa, extreme weather events such as droughts are predicted to become more frequent and intense.
Some climate projections suggest that 20% of the protected areas in which African elephants live may no longer be suitable for them by 2080, including possibly national parks like Kruger.
For other species the effects of climate change are already being felt as their environments respond to global warming. Populations of polar bears and Emperor penguins at the north and south poles respectively are beginning to decline due to the loss of vital sea ice, which is essential for their survival. The loss of sea ice edges, which provide important foraging grounds for many whale species, is reducing the krill populations on which many species rely for food. Other important food sources for whales such as squid may be affected by rising levels of ocean acidity as a result of global warming. Some coral reefs have almost been destroyed by the bleaching events caused by global warming in the latter part of last century, and such events are predicted to grow more severe and frequent in the future.
In Australia, warmer temperatures on Macquarie Island have fostered
favourable conditions for non-native feral rabbits and rats, which are destroying the nesting sites of rare Albatross. On some beaches in northern Australia and in Latin

19
America, marine turtles are producing more female hatchlings than male. It suggests global warming is already affecting this species as sex determination for marine turtles is based on nest temperature. In the Sunderbans of India and Bangladesh, which contain the only population of tigers living in mangrove swamps, the sea level is rising rapidly, threatening to engulf the limited amount of tiger habitat that is left on land.
A changing climate will change the geography and in some cases, biology of certain species, so existing measures put in place to conserve them may no longer be enough. For example, higher temperatures may force some species to move outside of protected areas established specifically for them. Climate change will also change human behaviors. Sea level rises and the need for alternative fuel sources will increase competition for land, placing greater pressures on the habitat of some species.
It is not too late to turn the tide of extinction around, but there is no time to waste. If we want to share our future with tigers, turtles and polar bears, urgent action is needed to reduce greenhouse gas emissions globally. Simultaneously, steps must be taken to increase the resilience of ecosystems to climate change by reducing all other threats to species, allowing them to adapt to the changes in their habitat. (WWF Climate Change and species, author Dr Tammy Matson)
Week 2 — Endangered species — The Polar Bearh. Geographical regions i. Animal physical characteristicsj. Diet and food consumption k. Behavior l. Breeding and population m. Habitats and needs n. Environment protection
Polar BearsThe polar bear is an icon of the Arctic wilderness and a symbol of the catastrophic impact that global warming is having on the world. The long term survival of polar bears in the wild is now literally ‘on thin ice’.
There are approximately 20,000-25,000 polar bears in the wild today, with the majority in Canada (13 out of 19 subpopulations). Six of these subpopulations are declining or showing critical signs of decline.
Both male and female polar bears can live for 25-30 years, primarily preying on ringed and bearded seals. The seasonal movements of polar bears depends on the availability of sea ice. Sea ice is essential for polar bear survival because it acts as a platform for hunting, mating and resting, and reproduction. During spring and early summer, polar bears feed intensively on seals to build up their energy for the long, dark Arctic winter.
Polar bears often travel huge distances throughout the year and the greatest threat to their survival is the loss of their sea ice habitat due to climate change. With increases in air temperatures over the Arctic of up to 5oC in the last 100 years, the fundamental habitat of this top predator is rapidly disappearing. Between 1979 and 2006, Arctic sea ice decreased by 21%, an area roughly the size of Alaska. In May 2008, the United States Fish & Wildlife Service recognised the future threat from predicted habitat loss, and listed the polar bear as a threatened species on the US Endangered Species Act, due to the probability that “all or a significant proportion of the global population will become endangered in the foreseeable future”.

20
Polar bears are also threatened by the offshore expansion of industrial activities like oil and gas development and commercial shipping, unsustainable harvest, and the loss of their prey base, seals, as a result of sea ice loss.
The Impact of Climate ChangeA recent study by the United States Geological Survey projected that at current levels of sea ice reduction, 42% of summer polar bear habitat will be lost by the middle of the 21st century. The most severe impacts will be in spring and summer, which are the most crucial times for polar bears to secure food and mate in advance of the long winter. Approximately two-thirds of the world’s remaining polar bears could be lost based on these projections of changes in sea ice. Unless drastic steps are taken now to reduce greenhouse gas emissions and ease the impact of warming worldwide, the polar bear could be gone in 75 years.
One of the major impacts of global warming in the Arctic is the thinning and early break up of sea ice. In the Hudson and Baffin Bay areas of
Canada, sea ice is breaking up three weeks earlier than in 1979. This gives both male and female polar bears less time in spring to build up their body weight by hunting and feeding. The average body weight of lone adult females fell from 290kg in 1980 to 230kg in 2004. The critical weight at which females appear to no longer be able to reproduce is 189kg. If the reduction in body weight continues at the same rate, females will be unable to reproduce by 2012.
Polar bear cub survival is also negatively affected by the earlier break up of sea ice. With changes in sea ice, important denning areas for pregnant females may no longer be available. Changes in rainfall patterns may cause the roofs of dens to fall in before females and cubs have departed, exposing them to the elements and predators. Denning and feeding areas for females may be separated, with vulnerable cubs unable to survive in the freezing water that divides them.
Like polar bears, the life cycle of their main prey species, seals, is heavily dependent on sea ice. As sea ice levels fall, ringed seals will find it harder to reproduce and their populations will almost certainly diminish. Fewer seals means less food for polar bears, and in the Arctic, there are no similarly abundant sources of high calorie prey.
Polar bears are highly specialised and have adapted to their polar environment, making them extremely vulnerable to changes in climate and habitat loss. With dramatic loss of habitat and the effect this has on their physical condition and ability to reproduce, some populations are already declining and more are predicted to follow over time.
What can be done?Governments, corporations, communities, and individuals have a huge role to play in saving the polar bear from extinction by reducing greenhouse gas emissions while working to reduce all the other threats to polar bears and their Arctic habitat. Polar bears are not simply an Arctic icon, but they truly integrate and represent the health of this critical ecosystem. As a key regulator of the global climate, a living Arctic is important not only to polar bears, but to people worldwide. The plight of this majestic creature is an early warning and call to action for the changes that await us all if we fail to act now in reducing greenhouse gases and creating sustainable communities. (WWF Climate Change and species, author Dr Tammy Matson)

21
Week 3 — Animals and their Habitats Every organism has a unique ecosystem within which it lives. This ecosystem is its natural habitat. This is where the basic needs of the organism to survive are met: food, water, shelter from the weather and place to breed its young. All organisms need to adapt to their habitat to be able to survive.
This means adapting to be able to survive the climatic conditions of the ecosystem, predators, and other species that compete for the same food and space. An adaptation is a modification or change in the organism’s body or behavior that helps it to survive.
An animal may adapt to its habitat in different ways. It may be a physical or structural adaptation, just as the limbs of birds have modified into wings or the way the cheetah is shaped for running at a fast speed.
It may be in the way the body works in circulating and respiration, for instance the gills that fish have enable them to breathe in water. Or it may be the way the animal behaves whether it is hunting for food, or running fast to avoid predators or migrating to other places for food or survival. To know more about different types of adaptations visit the link.
An animal’s environment consists of many different things. The climate, the kinds of food plants that grow in it, other animals that may be predators or competitors- the animal must learn to adapt to each of these factors in order to survive. With increasing population growth and human activity that disturbs the natural habitat, animals must learn to adapt to these kind of threats as well.
Animals in the wild can only live in places they are adapted to. They must have the right kind of habitat where they can find the food and space they need. Visit the link for a brief overview of how animals adapt to their habitat.
Did you know that animals camouflage themselves so they can adapt to their environment? Adaptation can protect animals from predators or from harsh weather. Many birds can hide in the tall grass and weeds and insects can change their colour to blend into the surroundings. This makes it difficult for predators to seek them out for food.
Some animals, like the apple snail, can survive in different ecosystems- from swamps, ditches and ponds to lakes and rivers. It has a lung/gills combination that reflects its adaptation to habitats with oxygen poor water. This is often the case in swamps and shallow waters. To know more about how the apple snail can survive in different habitats visit the link.
In the harsh cold climate of Alaska, the animals have learnt to adapt to the weather by storing food in their body and protecting themselves from the cold with thick furs. Human inhabitants in Alaska have also learnt to cope with the environment by building shelters that insulate and hold the heat, and yet do not allow the structure to melt. To know more about this go to this website.
Reference: http://wwf.panda.org/about_our_earth/teacher_resources/webfieldtrips/hab_adaptation/

22
Week 4 — Ecological Footprinting
An Ecological FootprintHuman activities consume resources and produce waste, and as our populations grow and global consumption increases, it is essential that we measure nature’s capacity to meet these demands. The Ecological Footprint has emerged as one of the world’s leading measures of human demand on nature. Simply put, Ecological Footprint Accounting addresses whether the planet is large enough to keep up the demands of humanity.
The Footprint represents two sides of a balance sheet. On the asset side, biocapacity represents the planet’s biologically productive land areas including our forests, pastures, cropland and fisheries. These areas, especially if left unharvested, can also absorb much of the waste we generate, especially our carbon emissions.
Biocapacity can then be compared with humanity’s demand on nature: our Ecological Footprint. The Ecological Footprint represents the productive area required to provide the renewable resources humanity is using and to absorb its waste. The productive area currently occupied by human infrastructure is also included in this calculation, since built-up land is not available for resource regeneration.
It now takes the Earth one year and six months to regenerate what we use in a year.
We maintain this overshoot by liquidating the Earth’s resources. Overshoot is a vastly underestimated threat to human well-being and the health of the planet, and one that is not adequately addressed.
By measuring the Footprint of a population—an individual, city, business, nation, or all of humanity—we can assess our pressure on the planet, which helps us manage our ecological assets more wisely and take personal and collective action in support of a world where humanity lives within the Earth’s bounds.
Conceived in 1990 by Mathis Wackernagel and William Rees at the University of British Columbia, the Ecological Footprint is now in wide use by scientists, businesses, governments, agencies, individuals, and institutions working to monitor ecological resource use and advance sustainable development.
http://www.footprintnetwork.org/en/index.php/GFN/page/footprint_basics_overview/
Week 5 — Weather v Climate
The difference between weather and climate is a measure of time. Weather is what conditions of the atmosphere are over a short period of time, and climate is how the atmosphere “behaves” over relatively long periods of time.
When we talk about climate change, we talk about changes in long-term averages of daily weather. Today, children always hear stories from their parents and grandparents about how snow was always piled up to their waists as they trudged off to school. Children today in most areas of the country haven’t experienced those kinds of dreadful snow-packed winters, except for the Northeastern U.S. in January 2005. The change in recent winter snows indicate that the climate has changed since their parents were young.
If summers seem hotter lately, then the recent climate may have changed. In various parts of the world, some people have even noticed that springtime comes earlier now than it did 30 years ago. An earlier springtime is indicative of a possible change in the climate.
23
Things That Make Up Our WeatherThere are really a lot of components to weather. Weather includes sunshine, rain, cloud cover, winds, hail, snow, sleet, freezing rain, flooding, blizzards, ice storms, thunderstorms, steady rains from a cold front or warm front, excessive heat, heat waves and more.
What Climate MeansIn short, climate is the description of the long-term pattern of weather in a particular area.
Some scientists define climate as the average weather for a particular region and time period, usually taken over 30-years. It’s really an average pattern of weather for a particular region.
When scientists talk about climate, they’re looking at averages of precipitation, temperature, humidity, sunshine, wind velocity, phenomena such as fog, frost, and hail storms, and other measures of the weather that occur over a long period in a particular place.
For example, after looking at rain gauge data, lake and reservoir levels, and satellite data, scientists can tell if during a summer, an area was drier than average. If it continues to be drier than normal over the course of many summers, than it would likely indicate a change in the climate.
Why Study Climate?The reason studying climate and a changing climate is important, is that will affect people around the world. Rising global temperatures are expected to raise sea levels, and change precipitation and other local climate conditions. Changing regional climate could alter forests, crop yields, and water supplies. It could also affect human health, animals, and many types of ecosystems. Deserts may expand into existing rangelands, and features of some of our National Parks and National Forests may be permanently altered.
References: http://www.nasa.gov/mission_pages/noaa-n/climate/climate_weather.html
http://climatekids.nasa.gov/climate-change-meaning/
Week 6 — Climate Science and Global warming
Increases in carbon dioxide into the atmosphere can cause the temperature to rise. Humans create carbon dioxide in their everyday lives. In Habitat the Game we measure player’s reduction in carbon dioxide every time they undertake an environmental action.
A recent study published in the journal Nature (2004) projected that at least a quarter of land animals and plants will be driven to extinction by 2050 if greenhouse gas emissions are not drastically reduced. The Intergovernmental Panel on Climate Change’s (IPCC’s) fourth assessment
report Climate Change 2007 predicts an even worse outcome; it states that 20-30% of species are likely to be at high risk of extinction with global warming of 1.5-2.5oC.
The IPCC report predicts global rises in temperature of 1.1-6.4oC by the end of the century based on current rates of greenhouse gas emissions.
Even if global emissions were to suddenly drop to zero, the earth will be 0.4oC hotter by 2050 regardless. (WWF Climate Change and species, author Dr Tammy Matson).
24
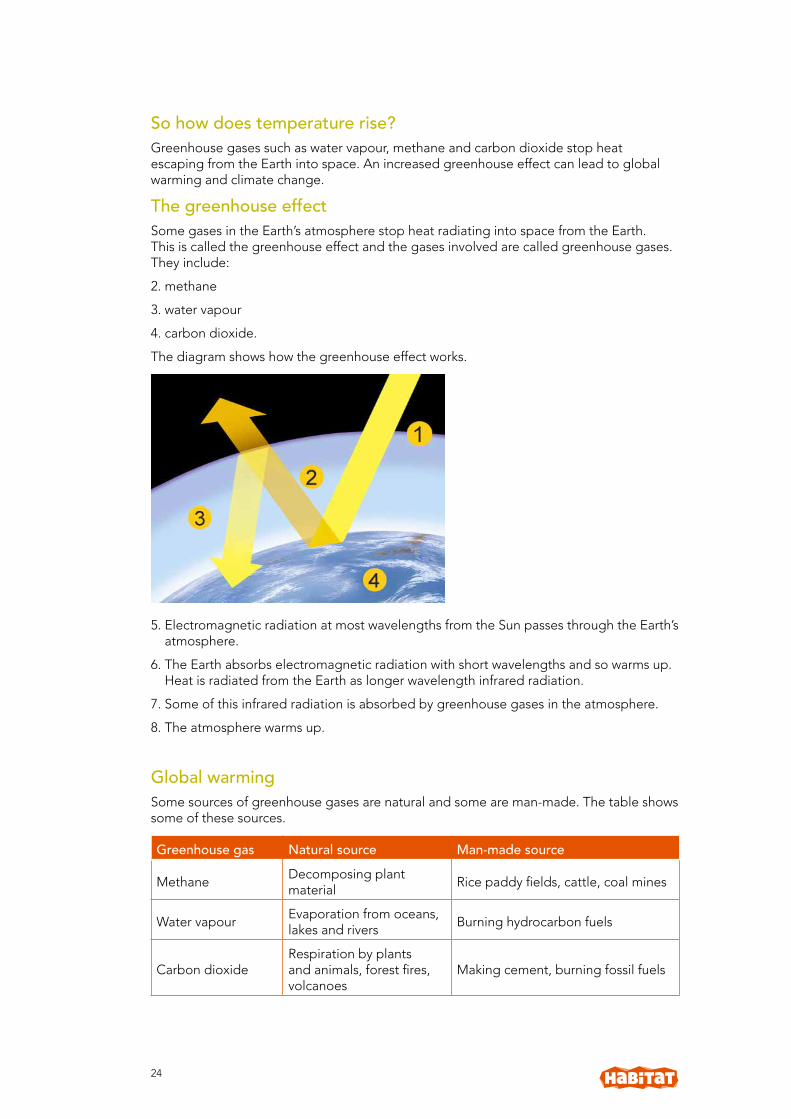
So how does temperature rise?Greenhouse gases such as water vapour, methane and carbon dioxide stop heat escaping from the Earth into space. An increased greenhouse effect can lead to global warming and climate change.
The greenhouse effectSome gases in the Earth’s atmosphere stop heat radiating into space from the Earth. This is called the greenhouse effect and the gases involved are called greenhouse gases. They include:
2. methane
3. water vapour
4. carbon dioxide.
The diagram shows how the greenhouse effect works.
Greenhouse effect
5. Electromagnetic radiation at most wavelengths from the Sun passes through the Earth’s atmosphere.
6. The Earth absorbs electromagnetic radiation with short wavelengths and so warms up. Heat is radiated from the Earth as longer wavelength infrared radiation.
7. Some of this infrared radiation is absorbed by greenhouse gases in the atmosphere.
8. The atmosphere warms up.
Global warmingSome sources of greenhouse gases are natural and some are man-made. The table shows some of these sources.
Greenhouse gas Natural source Man-made source
MethaneDecomposing plant material
Rice paddy fields, cattle, coal mines
Water vapourEvaporation from oceans, lakes and rivers
Burning hydrocarbon fuels
Carbon dioxideRespiration by plants and animals, forest fires, volcanoes
Making cement, burning fossil fuels

25
The amount of man-made water vapour is insignificant compared to the amount of water vapour from natural sources. However, emissions of methane and carbon dioxide are contributing to increased global warming.
Global warmingHuman activities are causing the release of large amounts of carbon dioxide. These activities include:
deforestation — cutting down trees for fuel, farms, buildings and roads
increased use of energy (and so an increased use of fossil fuels).
As the percentage of carbon dioxide in the atmosphere has increased, so in general has the Earth’s mean temperature.

26
Climate changeIncreased global warming will lead to climate change — changes in the average weather experienced over 30 years or more. Climate change may make it impossible to grow certain food crops in some regions. Melting polar ice, and the thermal expansion of sea water, could cause rising sea levels and the flooding of low-lying land.
DifficultiesThere is a good agreement between scientists about how the greenhouse effect works. However, there is less agreement about the extent to which human activities are causing an increased greenhouse effect, and so global warming with its associated climate change. The balance of scientific opinion is that human activities are to blame.
It is not just the release of carbon dioxide and methane that can contribute to global warming. Dust produced from factories goes into the atmosphere that reflects radiation back to the Earth and causing warming too.
However, it is not just human activities that can affect weather patterns and climate. Ash and gases released by volcanic eruptions also go into the atmosphere. They reflect radiation from the Sun back into space, causing cooling. This, and other effects, can make it difficult for scientists who study the atmosphere and global warming.
Reference: http://www.bbc.co.uk/schools/gcsebitesize/science/ocr_gateway/energy_resources/global_warmingrev1.shtml)
Week 7 — Alternative and Renewable Energy Habitat the Game rewards players who decrease their energy consumption.
Alternative energy is defined as energy from sources that do not use up natural resources or harm the environment. One of the biggest sources of alternative energy is the sun.
In the game this is measured as carbon saved. Players can see this represented as balloons. The number of balloons represents the volume of greenhouse gas emissions that you have saved. Measured in terms of volume of Carbon Dioxide (C02) gas as 1 kilogram of C02is equivalent to 140 typical party balloons. C02 is the most important greenhouse gas contributing to global warming.
Players are also rewarded for using alternative or renewable energies. The game also asks quiz questions about alternative energy.
Households vary in the ways they gain their power from and how much is from alternative energy sources. Some people’s houses are completely powered by coal. It has only been recently that the old infrastructure of coal that powers our economy for 150 yeas has been overlaid with new ‘clean’ technologies that reduce pollution and energy use.
Some of the innovative ways that people power their houses includes solar power, wind power and biomass. Let’s look at solar power.
The Sun provides a stable source of heat and light energy. Photocells transfer light into electricity, and glass can provide passive heating for buildings. Wind turbines transfer kinetic energy in the wind into electricity.

27
Photocells
Solar-powered ticket machine
The Sun is a stable source of energy that is transferred to the Earth as light and heat energy. We can use this energy.
Photocells are devices that transfer light energy directly into electrical energy. They produce DC — direct current — electricity. This is electricity in which the current moves in the same direction all the time.
Photocells have no moving parts. They do not need to be connected to the National Grid, so no cables are needed and they can work in remote locations. For example, they are used to power the lights for some road signs.
The output of photocells depends on the surface area that is exposed to light. For a given light intensity, the larger the area, the greater the power output.
The Hubble Space Telescope uses photocells to generate the electricity it needs — image courtesy of NASA.
You may have seen photocells in pocket calculators. Very large panels of photocells are used to power satellites in orbit around Earth.
28
Advantages and disadvantagesPhotocells produce no power in bad weather or at night. But sunlight is a renewable energy resource and photocells do not produce polluting waste while they are in use. Here are some other advantages to photocells:
– no fuel is needed
– no power cables are needed
– they have a long life and are rugged - little maintenance is needed.
Reference: (http://www.bbc.co.uk/schools/gcsebitesize/science/ocr_gateway/energy_resources/energy_from_the_sunrev1.shtml)
Energy Consumption of household appliancesTypical wattages of various appliancesHere are some examples of the range of nameplate wattages for various household appliances:
Aquarium = 50 – 1210 Watts
Clock radio = 10
Coffee maker = 900 – 1200
Clothes washer = 350 – 500
Clothes dryer = 1800 – 5000
Dishwasher = 1200 – 2400 (using the drying feature greatly increases energy consumption)
Dehumidifier = 785
Electric blanket (Single/Double) = 60 / 100
Fans
Ceiling = 65 – 175
Window = 55 – 250
Furnace = 750
Whole house = 240 – 750
Hair dryer = 1200 – 1875
Heater (portable) = 750 – 1500
Clothes iron = 1000 – 1800
Microwave oven = 750 – 1100
Personal computer
CPU – awake / asleep = 120 / 30 or less
Monitor – awake / asleep = 150 / 30 or less
Laptop = 50
Radio (stereo) = 70 – 400
Refrigerator (frost-free, 16 cubic feet) = 725
Televisions (color)
19” = 65–110
27” = 113
36” = 133

29
53” - 61” Projection = 170
Flat screen = 120
Toaster = 800–1400
Toaster oven = 1225
VCR/DVD = 17–21 / 20–25
Vacuum cleaner = 1000–1440
Water heater (40 gallon) = 4500–5500
Water pump (deep well) = 250–1100
Water bed (with heater, no cover) = 120–380
Reference: http://energy.gov/energysaver/articles/estimating-appliance-and-home-electronic-energy-use
Week 8 - Water Conservation, recycling and reuse
Only about three percent of the world’s water is available for drinking. As the world’s population increases, more and more people need this natural resource. However, like all natural resources, there is not an infinite supply of water.
Most people drink at least one glass of water every day. On a daily basis, millions of people turn on faucets at work and at home filling their glasses or bottles with water. People also take showers or baths, wash their clothes, turn on their garden sprinklers, and use water in dozens of other ways. Not surprisingly, most people don’t think about where their water comes from or how it arrived there.
In order to convey to students the importance of water, it helps if they have some background on where water comes from and how it becomes the drinking water that pours out of a faucet.
Water pollution is another critical topic to include in an instruction unit on water.
Reference : http://www.seametrics.com/water-lesson-plans
Week 9 - Waste minimization
WasteAvoid, Reduce, Reuse and Recycle (ARRR) is often referred to as the waste management hierarchy. It says that the best way to manage your waste is to avoid it, reduce it, reuse it and then recycle it. By following this process the Coal Loader has dramatically reduced the amount of waste it sends to landfill.
The Waste Management Hierarchy is a nationally and internationally accepted guide for prioritizing waste management practices. It sets out the preferred order of waste management practices, from most to least preferred. The further the activity moves up the waste management hierarchy, the more greenhouse gases are avoided and the less water and energy consumed.

30
Looking at some examples of waste management in the hierarchy:
AVOID — the least energy intensive strategy:
1. growing your own herbs instead of purchasing from shops
2. making a conscious decision not to buy things you don’t really need
3. disposable items
4. using home-made green cleaning products instead of buying commercial, packaged products
5. using a bicycle instead of a car whenever possible
REDUCE — requiring less energy than reusing or recycling:
1. Diverting organic material from landfill and reducing greenhouse gases through composting, worm farming for eg
2. A kitchen bench composting bin to recycle food waste. This reduces the amount of waste put out for garbage collection.
3. Buying goods in bulk
4. Using a calico bag rather than a plastic bag
REUSE — requiring more energy than reducing, however less energy than recycling.
1. Purchasing second hand items whenever possible such as computers, office chairs and photocopiers
2. Scrap paper for notes/phone messages
RECYCLE — when materials from waste streams are broken down into raw materials and reprocessed either into the same product (closed loop) or a new product (open loop).
1. Recycling all paper waste
2. Collecting plastic bottles and containers for reprocessing into outdoor furniture

31
Background Information:What is a product life cycle?Just as living things are born, get older, and die, products also complete a life cycle. Each stage of a product’s life cycle can affect the environment in different ways.
Some products, such as an orange juice popper, have many different components for example the tetra box carton, the straw, the plastic wrap to encase the straw, the ink on the label, the lining, as well as the juice itself, each of which has its own life cycle. The stages of a product’s life cycle usually include:
Design — A product’s design can influence each stage of its life cycle and in turn the environment. Design affects which materials will be used to manufacture a product. For example, cheaper materials are often less durable, which means the product will have a short useful life. Product design can also prevent waste in many ways. Products can be designed with modular components that can be easily replaced so that the entire product does not have to be thrown away if only one piece breaks.
Materials Extraction — All products are made from materials found in or on the earth. “Virgin” or “raw” materials, such as trees or ore, are directly mined or harvested from the earth, a process that can create pollution, use large amounts of energy, and deplete limited natural resources. Making new products from materials that have already been used (recycled materials) can reduce the amount of raw materials we need to take from the earth.
Materials Processing — Once materials are extracted, they must be converted into a form that can be used to make products. For example, paper is made from trees, but the wood has to undergo several different processes before we can use it.
Manufacturing — Products that are made in factories require a great deal of energy and water to create. The manufacturing process can also produce pollution. Many products require the use of packaging as well, to prevent spoilage, damage, contamination, and tampering.
Packaging & Transportation — The use of packaging can protect products from damage and provide product information. However, packaging consumes valuable natural resources and when used excessively can be wasteful. Some packaging can be made from recycled materials. Finished products are transported in trucks, ships, planes, and trains to different locations where they are sold. All of these forms of transportation burn fossil fuels, which can contribute to global climate change.
Use — The way products are used can impact the environment. For example, products that are only used once create more waste than products that are used again.
Reuse/Recycling/Disposal — Using a product over and over again prevents the need to create the product from scratch, which saves resources and energy while also preventing pollution. Recycling or re-manufacturing products also reduces the amount of new materials that have to be extracted from the earth. Throwing a product away means that it will end up in a land-fill and will not be useful again.
Recycle plasticBackgroundThe world’s largest trash “landfill” isn’t on land — it’s in the Pacific Ocean. The so-called “Great Pacific Garbage Patch” covers an estimated five million square miles of ocean waters. That’s the size of the United States, Mexico, and Central America combined!
The trash is carried — and trapped — by a system of surface currents called the North Pacific Subtropical Gyre. A whopping 80% of the trash is plastic, carried from the shores of Asia and the Americas.
32
Week 10 — Sustainability
Sustainability and Sustainable Development are often used interchangeable.
The Brundtland ReportThe term ‘sustainable development’ was popularised by the World Commission on Environment and Development (WCED) in its 1987 report entitled Our Common Future. This book is also known as the Brundtland Report, after the Chair of the Commission and former Prime Minister of Norway, Gro Harlem Brundtland.
The aim of the World Commission was to find practical ways of addressing the environmental and developmental problems of the world. In particular, it had three general objectives:
— To re-examine the critical environmental and development issues and to formulate realistic proposals for dealing with them;
— To propose new forms of international co-operation on these issues that will influence policies and events in the direction of needed changes; and
— To raise the levels of understanding and commitment to action of individuals, voluntary organisations, businesses, institutes, and governments.
Our Common Future was written after three years of public hearings and over five hundred written submissions. Commissioners from twenty one countries analysed this material, with the final report being submitted to the United Nations General Assembly in 1987.
Key IssuesOur Common Future reported on many of the global realities explored in Module 1, and recommended urgent action on eight key issues to ensure that development was sustainable, i.e. that it would satisfy ‘the needs of the present without compromising the ability of future generations to meet their own needs’. These eight issues were:
— Population and Human Resources
— Industry
— Food Security
— Species and Ecosystems
— The Urban Challenge
— Managing the Commons
— Energy
— Conflict and Environmental Degradation
References: http://www.australiancurriculum.edu.au/crosscurriculumpriorities/sustainability
http://www.un-documents.net/ocf-02.htm
http://www.unesco.org/education/tlsf/mods/theme_a/mod02.html?panel=1#top
http://www.un-documents.net/ocf-02.htm

33
1. Dark NightsTurning off the lights you don’t need at night means less electricity wasted, less green house gas emissions, and lower electricity bills!
2. Superscrub weeklyYour average shower uses about 20L of water per minute. That means that every minute you cut from your shower saves the equivalent of 10 milk bottles full of water, every minute!
3. Superscrub one offLimiting your shower to 4 minutes means that you only use about 80L of water for your shower, and that means we don’t have to put as much stress on our water ways and environment to meet our water needs!
4. Compost your foodComposting your fruit and veg scraps can make food for trees and flowers in your garden. It makes the soil super happy, as well as stops all that rubbish getting thrown into landfill!
5. Tormenting the tapTurning off the tap when you brush stops wasted water running down the drain, and saves money on water bills! You can save around 15 litres per minute!
6. Finding FishySustainable fishing means that the fishermen catch enough fish to sell, but not so much that means there’s no more left for anyone else, in a way that doesn’t hurt the environment. Eating their fish means your support their hard eco work!
7. Change modes Using public transport saves petrol, reduces pollution and traffic, and reduces stress levels. Plus, you might make new friends!
8. Share the loveMaking a magazine creates about 1kg of green house gasses, that’s about how much a car makes over a 3km trip. Sharing with a friend means all that pollution stays out of the air!
9. Avoid packagingAll that packaging on the stuff you buy just ends up going into the bin and going to landfill. Try buying things with less, or with biodegradable or recyclable packages.
APPENDIX 1 — Ecological footprint actions and reasoning

34
10. Recycle paperRecycling a pound of paper, less than the weight of your average newspaper, saves about 3.5 gallons of water. Buying recycled paper products saves water too, as it takes about six gallons of water to produce a dollar worth of paper.
11. NaturaleChemical products can be nasty man made products that pollute the air and can get into your local rivers and streams and hurt the animals and plants that live there. Using natural products made from renewable products helps reduce the overall pollution.
12. Recycle plasticPlastic is a man made product that uses oil, gas and coal to make. These fuels cause pollution to the air and water, and have to be dug out of the ground, destroying large areas of bushland and forest. Recycling it means we don’t need to make as much new stuff!
13. Recycle GlassGlass can continually be recycled by being crushed, melted, and reformed into new glass containers over and over and over!
14. Reduce water heatReducing the water heat from piping hot, to just warm enough means that there is less energy needed to make it hot. For electric and gas hot water systems, this means less carbon dioxide emissions!
15. Hit the source weeklyElectrical devices like computers, TV’s and game consoles can still use electricity when you turn them off into standby mode. Turning them off at the power point makes sure this electricity isn’t wasted.
16. Tap KingBottled water production makes 600 times more green house gasses than tap water, and tap water has 1% of the environmental impact of bottled water.
17. Avoid personal heater/coolerOpening a window on a hot day, or using a blanket or a jumper on a cold one can help you cut out the electricity used by an air conditioner.
18. No baggagePlastic bags use fossil fuels in their production, and in most cases are used once and then end up in landfill or as pollution. It’s estimated that around 1 trillion bags are thrown out every year! Using a reusable bag instead can help cut this number down.

35
19. Turn off the boxWatching TV can be fun, but the TV can use a whole lot of electricity. Turning it off and playing or doing something else can help save energy, and is good for your health!
20. Log offYour computer is part of your life, but it needs a lot of electricity to run. Turning it off when you don’t need to use it, and playing outside rather than playing games on it can help reduce energy usage!
21. Just enough55% of household waste is food scraps. Try cooking just enough food for everyone, this way, you’ll reduce landfill and save money on food bills!
22. Locally grown
Buying food that was grown and produced locally means that there is less energy used in transporting it to your plate, compared to something made on the other side of the country. Plus, you get to support your local home town farmers and usually save money!
23. Dish TetrisYour average dishwasher uses electricity and about 17L of water per wash, regardless of how full it is. Only using it when it’s full means that all that energy and water goes to its maximum use, and reduces the amount of times you use it!
24. Dining InEveryone loves takeaway food, but the containers are such a waste of materials! If you dine-in at your favourite restaurant, or try cooking at home, you can help save all those containers ending up in landfill.
25. Decrease Room Temp (Winter)Air conditioners take a lot of energy to run. Setting it 20° in winter means its running at its most efficient. Every degree above this increases the energy use by 10%!
26. Power of the sunHanging you laundry out on a clothes line on a clear day can help save electricity by not using a clothes dryer. You can get all the drying you want done for free by the sun!
27. Riding with friendsCar-pooling means you travel in 1 car with a bunch of friends, rather than each person taking their own. This makes for less traffic on our roads, less pollution, and a whole lot of road trippin’ fun!

36
28. Tormenting the tap (weekly)Turning off the tap when you brush stops wasted water running down the drain, and saves money on water bills! You can save around 15 litres per minute! That could mean if you spend 3 minutes brushing your teeth a day, you’d save over 300L of water in a week!
29. Vege mealsMeat generally uses around 10 times more energy, land and water than vegetarian equivalents. Swapping a few meals a week can help you reduce your overall eco footprint, plus, you might find your new favourite dish!
30. Heat SpaceIf you have to use heating in your home, close all the doors and windows around the area you want warm. This reduces overall energy use by stopping heat escaping outside, and by not wasting heating on an empty room.
31. Increase room temp (Summer)Air conditioners take a lot of energy to run. Setting it 25° in summer means its running at its most efficient. Every degree below this increases the energy use by 10%!
32. Black BoxCutting your PC, computer games, or TV usage by just 1 hour a day can cut your overall electricity usage. It also lets you go outside and play, and is great for your health!
33. Cold WashWashing your clothes in cold water means that no energy is needed to heat warm water, which means less energy demands! Most detergents work just as well in cold water too!
34. Recycled PaperUsing recycled paper is a great way to help the planet. It means less trees cut down, less energy, and less water! You can even try make your own at home!
35. Hit the source one offElectrical devices like computers, TV’s and game consoles can still use electricity when you turn them off into standby mode. Turning them off at the power point makes sure this electricity isn’t wasted.
36. Packed LunchBringing a packed lunch means you don’t use wasteful packaging of take-out food and drinks. This will reduce the waste going to landfill, and saves you money!

37
37. Put on a jumperWearing a jumper or coat when it’s cold inside means you won’t have to have your heater working as hard. Every degree closer to the temperature outside saves 10% in energy.
38. Op Shop.Buying pre loved clothes from goodwill or thrift shops means that all the energy used in making, transporting, and selling new clothes doesn’t have to be used. Plus, you might find your new favourite outfit for dirt cheap!

38
APPENDIX 2 — Energy Consumption of household appliances
Energy Consumption of household appliancesTypical wattages of various appliancesHere are some examples of the range of nameplate wattages for various household appliances:
Aquarium = 50 – 1210 Watts
Clock radio = 10
Coffee maker = 900 – 1200
Clothes washer = 350 – 500
Clothes dryer = 1800 – 5000
Dishwasher = 1200 – 2400 (using the drying feature greatly increases energy consumption)
Dehumidifier = 785
Electric blanket (Single/Double) = 60 / 100
Fans
Ceiling = 65 – 175
Window = 55 – 250
Furnace = 750
Whole house = 240 – 750
Hair dryer = 1200 – 1875
Heater (portable) = 750 – 1500
Clothes iron = 1000 – 1800
Microwave oven = 750 – 1100
Personal computer
CPU – awake / asleep = 120 / 30 or less
Monitor – awake / asleep = 150 / 30 or less
Laptop = 50
Radio (stereo) = 70 – 400
Refrigerator (frost-free, 16 cubic feet) = 725
Televisions (color)
19” = 65–110
27” = 113
36” = 133
53” - 61” Projection = 170
Flat screen = 120
Toaster = 800–1400
Toaster oven = 1225
VCR/DVD = 17–21 / 20–25
Vacuum cleaner = 1000–1440
Water heater (40 gallon) = 4500–5500
Water pump (deep well) = 250–1100
Water bed (with heater, no cover) = 120–380
Reference: http://energy.gov/energysaver/articles/estimating-appliance-and-home-electronic-energy-use
39
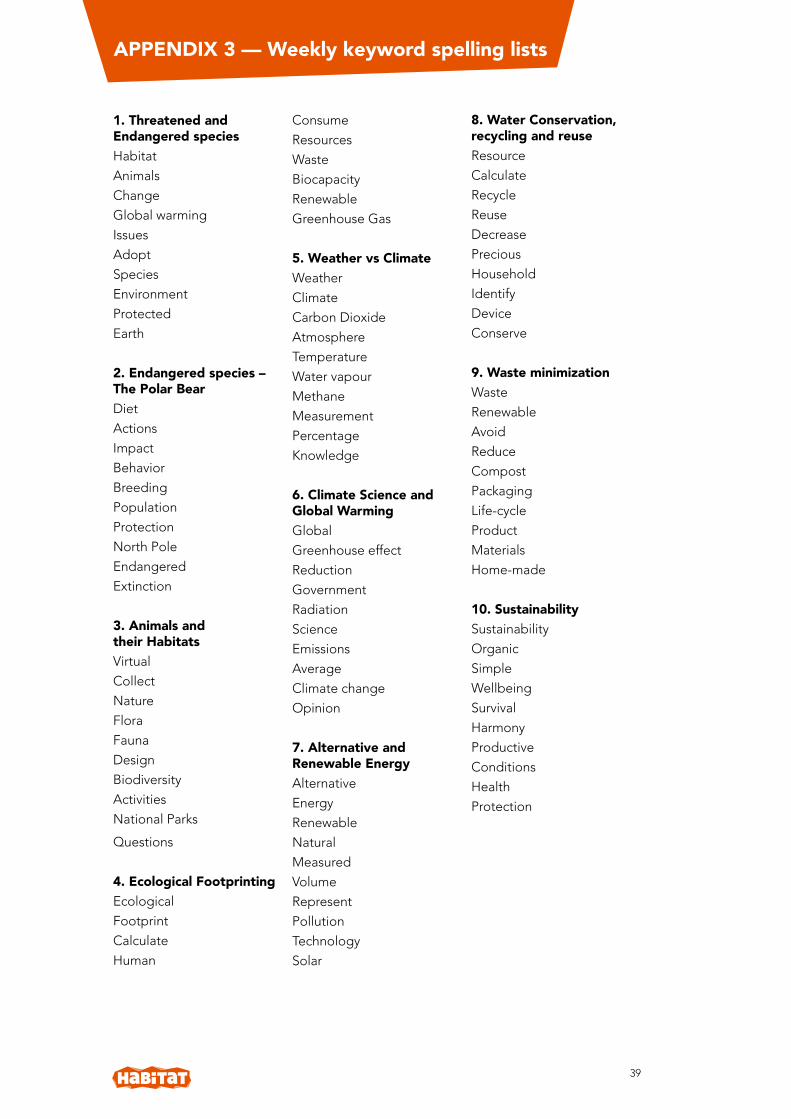
APPENDIX 3 — Weekly keyword spelling lists
1. Threatened and Endangered speciesHabitat
Animals
Change
Global warming
Issues
Adopt
Species
Environment
Protected
Earth
2. Endangered species – The Polar BearDiet
Actions
Impact
Behavior
Breeding
Population
Protection
North Pole
Endangered
Extinction
3. Animals and their HabitatsVirtual
Collect
Nature
Flora
Fauna
Design
Biodiversity
Activities
National Parks
Questions
4. Ecological FootprintingEcological
Footprint
Calculate
Human
Consume
Resources
Waste
Biocapacity
Renewable
Greenhouse Gas
5. Weather vs ClimateWeather
Climate
Carbon Dioxide
Atmosphere
Temperature
Water vapour
Methane
Measurement
Percentage
Knowledge
6. Climate Science and Global WarmingGlobal
Greenhouse effect
Reduction
Government
Radiation
Science
Emissions
Average
Climate change
Opinion
7. Alternative and Renewable EnergyAlternative
Energy
Renewable
Natural
Measured
Volume
Represent
Pollution
Technology
Solar
8. Water Conservation, recycling and reuseResource
Calculate
Recycle
Reuse
Decrease
Precious
Household
Identify
Device
Conserve
9. Waste minimizationWaste
Renewable
Avoid
Reduce
Compost
Packaging
Life-cycle
Product
Materials
Home-made
10. SustainabilitySustainability
Organic
Simple
Wellbeing
Survival
Harmony
Productive
Conditions
Health
Protection
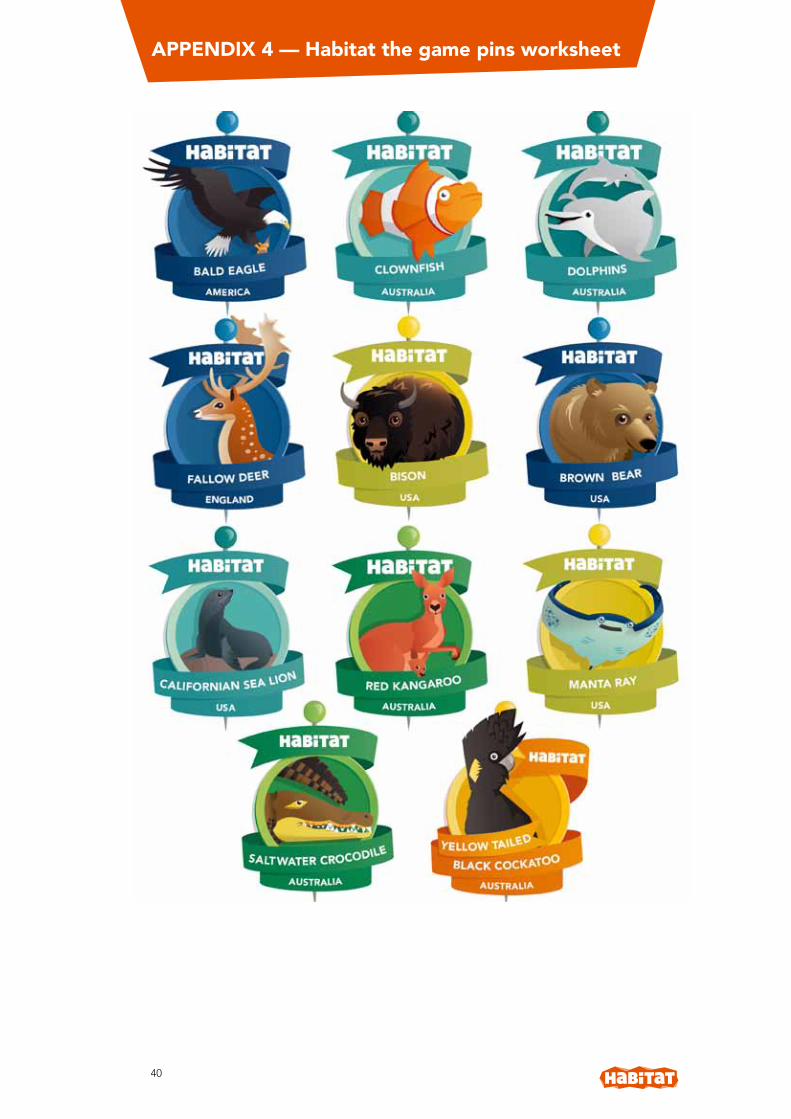
40
APPENDIX 4 — Habitat the game pins worksheet

41
APPENDIX 5 — Renewable v Non Renewable worksheet
Orange juice popper Orange
What is this product made from?
What materials are used to make it?
Are they renewable or non renewable resources?
Where did the components come from?
Who made them?
Where was it made?
How is it packaged?
How is it transported to market?
What are the inputs and outputs of each? eg. soil, air, water, fertilisers
What will happen to the item at the end of it’s life?

42
Year 3EnglishUnderstand that paragraphs are a key organisational feature of written texts (ACELA1479)
Identify the point of view in a text and suggest alternative points of view (ACELY1675)
Listen to and contribute to conversations and discussions to share information and ideas and negotiate in collaborative situations (ACELY1676)
Use interaction skills, including active listening behaviors and communicate in a clear, coherent manner using a variety of everyday and learned vocabulary and appropriate tone, pace, pitch and volume (ACELY1792)
Identify the audience and purpose of imaginative, informative and persuasive texts (ACELY1678)
Use comprehension strategies to build literal and inferred meaning and begin to evaluate texts by drawing on a growing knowledge of context, text structures and language features (ACELY1680)
Plan, draft and publish imaginative, informative and persuasive texts demonstrating increasing control over text structures and language features and selecting print,and multimodal elements appropriate to the audience and purpose (ACELY1682)
Reread and edit texts for meaning, appropriate structure, grammatical choices and punctuation (ACELY1683)
Write using joined letters that are clearly formed and consistent in size (ACELY1684)
Use software including word processing programs with growing speed and efficiency to construct and edit texts featuring visual, print and audio elements (ACELY1685)
GeographyThe main climate types of the world and the similarities and differences between the climates of different places (ACHGK017)
APPENDIX 6 — Australian curriculum links
Collect and record relevant geographical data and information, for example, by observing by interviewing, conducting surveys, measuring, or from sources such as maps, photographs, satellite images, the media and the internet (ACHGS020)
Represent data by constructing tables and graphs (ACHGS021)
Represent the location of places and their features by constructing large-scale maps that conform to cartographic conventions including scale, legend, title and north point, and describe their location using simple grid references, compass direction and distance (ACHGS022)
Present findings in a range of communication forms, for example, written, oral, digital, graphic, tabular, and visual, and use geographical terminology (ACHGS024)
Reflect on their learning to propose individual action in response to a contemporary geographical challenge and identify the expected effects of the proposal (ACHGS025)
ScienceScience involves making predictions and describing patterns and relationships (ACSHE050)
Science knowledge helps people to understand the effect of their actions (ACSHE051)
Use a range of methods including tables and simple column graphs to represent data and to identify patterns and trends (ACSIS057)
Represent and communicate ideas and findings in a variety of ways such as diagrams, physical representations and simple reports (ACSIS060)
MathematicsRepresent and solve problems involving multiplication using efficient mental and written strategies and appropriate digital technologies (ACMNA057)
Identify questions or issues for categorical variables. Identify data sources and plan methods of data collection and recording (ACMSP068)

43
Collect data, organise into categories and create displays using lists, tables, picture graphs and simple column graphs, with and without the use of digital technologies (ACMSP069)
Interpret and compare data displays (ACMSP070)
Year 3 and 4Digital TechnologiesExplore and use a range of digital systems with peripheral devices for different purposes, and transmit different types of data (ACTDIK007)
Recognise different types of data and explore how the same data can be represented in different ways (ACTDIK008)
Collect, access and present different types of data using simple software to create information and solve problems (ACTDIP009)
Define simple problems, and describe and follow a sequence of steps and decisions (algorithms) needed to solve them (ACTDIP010)
Visual ArtsUse materials, techniques and processes to explore visual conventions when making artworks (ACAVAM111)
Present artworks and describe how they have used visual conventions to represent their ideas (ACAVAM112)
Year 4EnglishUnderstand differences between the language of opinion and feeling and the language of factual reporting or recording (ACELA1489)
Use interaction skills such as acknowledging another’s point of view and linking students’ response to the topic, using familiar and new vocabulary and a range of vocal effects such as tone, pace, pitch and volume to speak clearly and coherently (ACELY1688)
Identify characteristic features used in imaginative, informative and persuasive texts to meet the purpose of the text (ACELY1690)
Use comprehension strategies to build literal and inferred meaning to expand content knowledge, integrating and linking ideas and analysing and evaluating texts (ACELY1692)
Incorporate new vocabulary from a range of sources into students’ own texts including vocabulary encountered in research (ACELA1498)
Use comprehension strategies to build literal and inferred meaning to expand content knowledge, integrating and linking ideas and analysing and evaluating texts (ACELY1692)
Plan, draft and publish imaginative, informative and persuasive texts containing key information and supporting details for a widening range of audiences, demonstrating increasing control over text structures and language features (ACELY1694)
Reread and edit for meaning by adding, deleting or moving words or word groups to improve content and structure (ACELY1695)
Write using clearly-formed joined letters, and develop increased fluency and automaticity (ACELY1696)
Use a range of software including word processing programs to construct, edit and publish written text, and select, edit and place visual, print and audio elements (ACELY1697)
GeographyThe importance of environments to animals and people, and different views on how they can be protected (ACHGK022)
The natural resources provided by the environment, and different views on how they could be used sustainably (ACHGK024)
The sustainable management of waste from production and consumption (ACHGK025)

44
Collect and record relevant geographical data and information, for example, by observing, by interviewing, conducting surveys and measuring, or from sources such as maps, photographs, satellite images, the media and the internet (ACHGS027)
Represent the location of places and their features by constructing large-scale maps that conform to cartographic conventions including scale, legend, title and north point, and describe their location using simple grid references, compass direction and distance (ACHGS029)
Interpret geographical data to identify distributions and patterns and draw conclusions (ACHGS030)
Present findings in a range of communication forms, for example, written, oral, digital, graphic, tabular and visual, and use geographical terminology (ACHGS031)
Reflect on their learning to propose individual action in response to a contemporary geographical challenge and identify the expected effects of the proposal (ACHGS032)
ScienceEarth’s surface changes over time as a result of natural processes and human activity (ACSSU075)
Science knowledge helps people to understand the effect of their actions (ACSHE062)
Use a range of methods including tables and simple column graphs to represent data and to identify patterns and trends (ACSIS068)
Represent and communicate ideas and findings in a variety of ways such as diagrams, physical representations and simple reports (ACSIS071)
MathematicsSelect and trial methods for data collection, including survey questions and recording sheets (ACMSP095)
Construct suitable data displays, with and without the use of digital technologies, from given or collected data. Include
tables, column graphs and picture graphs where one picture can represent many data values (ACMSP096)
Year 3 and 4Digital TechnologiesExplore and use a range of digital systems with peripheral devices for different purposes, and transmit different types of data (ACTDIK007)
Recognise different types of data and explore how the same data can be represented in different ways (ACTDIK008)
Collect, access and present different types of data using simple software to create information and solve problems (ACTDIP009)
Define simple problems, and describe and follow a sequence of steps and decisions (algorithms) needed to solve them (ACTDIP010)
Visual ArtsUse materials, techniques and processes to explore visual conventions when making artworks (ACAVAM111)
Present artworks and describe how they have used visual conventions to represent their ideas (ACAVAM112)
Year 5EnglishUnderstand how to move beyond making bare assertions and take account of differing perspectives and points of view (ACELA1502)
Understand how texts vary in purpose, structure and topic as well as the degree of formality (ACELA1504)
Clarify understanding of content as it unfolds in formal and informal situations, connecting ideas to students’ own experiences and present and justify a point of view (ACELY1699)
Understand the use of vocabulary to express greater precision of meaning, and know that words can have different meanings in different contexts (ACELA1512)

45
Navigate and read texts for specific purposes applying appropriate text processing strategies, for example predicting and confirming, monitoring meaning, skimming and scanning (ACELY1702)
Use comprehension strategies to analyse information, integrating and linking ideas from a variety of print and digital sources (ACELY1703)
Plan, draft and publish imaginative, informative and persuasive print and multimodal texts, choosing text structures, language features, images and sound appropriate to purpose and audience (ACELY1704)
Develop a handwriting style that is becoming legible, fluent and automatic (ACELY1706)
Use a range of software including word processing programs with fluency to construct, edit and publish written text, and select, edit and place visual, print and audio elements (ACELY1707)
GeographyThe influence people have on the human characteristics of places and the management of spaces within them (ACHGK029)
Collect and record relevant geographical data and information, using ethical protocols, from primary and secondary sources, for example, people, maps, plans, photographs, satellite images, statistical sources and reports (ACHGS034)
Evaluate sources for their usefulness and represent data in different forms, for example, maps, plans, graphs, tables, sketches and diagrams (ACHGS035)
Interpret geographical data and other information, using digital and spatial technologies as appropriate, and identify spatial distributions, patterns and trends, and infer relationships to draw conclusions (ACHGS037)
Present findings and ideas in a range of communication forms, for example, written, oral, graphic, tabular, visual and maps; using geographical terminology and digital technologies as appropriate (ACHGS038)
Reflect on their learning to propose individual and collective action in response to a contemporary geographical challenge and describe the expected effects of their proposal on different groups of people (ACHGS039)
ScienceLiving things have structural features and adaptations that help them to survive in their environment (ACSSU043)
Scientific knowledge is used to inform personal and community decisions (ACSHE217)
Construct and use a range of representations, including tables and graphs, to represent and describe observations, patterns or relationships in data using digital technologies as appropriate (ACSIS090)
Compare data with predictions and use as evidence in developing explanations (ACSIS218)
Communicate ideas, explanations and processes in a variety of ways, including multi-modal texts (ACSIS093)
MathematicsSolve problems involving multiplication of large numbers by one- or two-digit numbers using efficient mental, written strategies and appropriate digital technologies (ACMNA100)
Pose questions and collect categorical or numerical data by observation or survey (ACMSP118)
Use efficient mental and written strategies and apply appropriate digital technologies to solve problems (ACMNA291)
Describe, continue and create patterns with fractions, decimals and whole numbers resulting from addition and subtraction (ACMNA107)
Describe and interpret different data sets in context (ACMSP120)

46
Year 5 and 6 Digital TechnologiesInvestigate how digital systems use whole numbers as a basis for representing all types of data (ACTDIK015)
Define problems in terms of data and functional requirements, and identify features similar to previously solved problems (ACTDIP017)
Visual ArtsDevelop and apply techniques and processes when making their artworks (ACAVAM115)
Plan the display of artworks to enhance their meaning for an audience (ACAVAM116)
Year 6EnglishUnderstand the uses of objective and subjective language and bias (ACELA1517)
Understand that cohesive links can be made in texts by omitting or replacing words (ACELA1520)
Participate in and contribute to discussions, clarifying and interrogating ideas, developing and supporting arguments, sharing and evaluating information, experiences and opinions (ACELY1709)
Investigate how complex sentences can be used in a variety of ways to elaborate, extend and explain ideas (ACELA1522)
Understand how ideas can be expanded and sharpened through careful choice of verbs, elaborated tenses and a range of adverb groups/phrases (ACELA1523)
Identify and explain how analytical images like figures, tables, diagrams, maps and graphs contribute to our understanding of verbal information in factual and persuasive texts (ACELA1524)
Select, navigate and read texts for a range of purposes, applying appropriate text processing strategies and interpreting structural features, for example table of contents, glossary, chapters, headings and subheadings (ACELY1712)
Use comprehension strategies to interpret and analyse information and ideas, comparing content from a variety of textual sources including media and digital texts (ACELY1713)
Plan, draft and publish imaginative, informative and persuasive texts, choosing and experimenting with text structures, language features, images and digital resources appropriate to purpose and audience (ACELY1714)
Reread and edit students’ own and others’ work using agreed criteria and explaining editing choices (ACELY1715)
Develop a handwriting style that is legible, fluent and automatic and varies according to audience and purpose (ACELY1716)
Use a range of software, including word processing programs, learning new functions as required to create texts (ACELY1717)
GeographyCollect and record relevant geographical data and information, using ethical protocols, from primary and secondary sources, for example, people, maps, plans, photographs, satellite images, statistical sources and reports
Evaluate sources for their usefulness and represent data in different forms, for example, maps, plans, graphs, tables, sketches and diagrams (ACHGS042)
Geographical information by constructing large-scale and small-scale maps that conform to cartographic conventions including border, source, scale, legend, title and north point, using spatial technologies as appropriate (ACHGS043)
Interpret geographical data and other information using digital and spatial technologies as appropriate, and identify spatial distributions, patterns and trends, and infer relationships to draw conclusions (ACHGS044)
Present findings and ideas in a range of communication forms, for example, written, oral, graphic, tabular, visual and maps, using geographical terminology and digital technologies as appropriate (ACHGS045)

47
Reflect on their learning to propose individual and collective action in response to a contemporary geographical challenge and describe the expected effects of their proposal on different groups of people (ACHGS046)
ScienceThe growth and survival of living things are affected by the physical conditions of their environment (ACSSU094)
Sudden geological changes or extreme weather conditions can affect Earth’s surface (ACSSU096)
Scientific knowledge is used to inform personal and community decisions (ACSHE220)
Construct and use a range of representations, including tables and graphs, to represent and describe observations, patterns or relationships in data using digital technologies as appropriate (ACSIS107)
Compare data with predictions and use as evidence in developing explanations (ACSIS221)
Communicate ideas, explanations and processes in a variety of ways, including multi-modal texts (ACSIS110)
MathematicsSelect and apply efficient mental and written strategies and appropriate digital technologies to solve problems involving all four operations with whole numbers (ACMNA123)
Interpret and compare a range of data displays, including side-by-side column graphs for two categorical variables (ACMSP147)
Interpret secondary data presented in digital media and elsewhere (ACMSP148)
Year 5 and 6Digital TechnologiesInvestigate how digital systems use whole numbers as a basis for representing all types of data (ACTDIK015)
Define problems in terms of data and functional requirements, and identify features similar to previously solved problems (ACTDIP017)
Visual ArtsDevelop and apply techniques and processes when making their artworks (ACAVAM115)
Plan the display of artworks to enhance their meaning for an audience (ACAVAM116)

48