Embed Size (px)
Citation preview
A Thin Slice 1
Running head: FIRST IMPRESSIONS
A Thin Slice Perspective on the Accuracy of First Impressions
Dana R. Carney, C. Randall Colvin, and Judith A. Hall
Northeastern University
A Thin Slice 2
Abstract
The accuracy of first impressions was examined by investigating judged variable (negative
affect, positive affect, the Big 5 personality variables, intelligence), exposure time (5, 20, 45, 60,
300 s), and slice location (beginning, middle, end). 334 judges rated 30 targets. Accuracy was
defined as the correlation between a judge’s ratings and the target’s criterion scores on the same
construct. Negative affect, extraversion, conscientiousness, and intelligence were judged
moderately well after 5-s exposures; however, positive affect, neuroticism, openness, and
agreeableness required more exposure time to achieve similar levels of accuracy. Overall,
accuracy increased with exposure time, judgments based on later segments of the 5-min
interactions were more accurate, and 60-s yielded the optimal ratio between accuracy and slice
length. Results suggest that first impressions are not uniformly right or wrong but depend on the
type of judgment made and the amount of exposure judges have to targets’ social behavior.
Keywords: FIRST IMPRESSIONS, ACCURACY, PERSON PERCEPTION, THIN SLICES
A Thin Slice 3
A Thin Slice Perspective on the Accuracy of First Impressions
A person’s first impression of a stranger’s characteristics is, by definition, based on
impoverished information and until recently, of uncertain utility. Allport (1937) noted long ago
that people make broad generalizations about personality based on limited exposure to others.
The ubiquity of personality judgments derived from limited information and the social
consequences of these judgments make this an important topic of inquiry. The term “thin slices”
has been used to describe the approach of using short excerpts of social behavior that perceivers
use to draw inferences about states, traits, and other personally-relevant characteristics (Ambady
& Rosenthal, 1992; Ambady, Bernieri, & Richeson, 2000) and is an approach that is well suited
for studying the accuracy of first impressions. In the current study, we will use the thin slice
approach to study when first impressions are right and wrong, and examine the amount of
exposure that judges need to increase the likelihood of producing an accurate judgment.
Considerable research has addressed the degree to which inferences based on thin slices
are accurate, or can predict other meaningful attributes of the stimulus person. Nevertheless,
significant gaps in knowledge remain in the thin slices literature. In this study, we address four
issues that have yet to be fully studied: (a) Previous empirical studies have not fully investigated
the impact of slice “thickness” (i.e., length) on accuracy across a range of constructs. (b) Little is
known about how the location of a slice within a behavioral stream might influence judges’
accuracy about target individuals. It may be the case, for example, that slices of social behavior
derived from the start of a social interaction may be less informative about a target’s personality
than slices taken later in an interaction when individuals feel comfortable disclosing their real
selves. (c) It is not known to what extent accuracy may differ according to the type of construct
being judged. Thus far, no single research study has investigated differences in accuracy for
A Thin Slice 4
emotions, personality, and cognitive ability. Furthermore, research has not yet investigated
whether the effects of slice length and location generalize across different types of judged
constructs. (d) Finally, the stimuli presented to judges for evaluation have been highly variable
from study to study (e.g., naturalistic interactions vs. posed expressions, college students vs.
community members, get-acquainted conversations vs. people reading a prepared script, etc.)
introducing possible confounds if a researcher attempts to address the foregoing questions by
comparing results between studies. The present study addresses these gaps by systematically
varying slice length, slice location within the behavioral stream, and the constructs judged, all
within the situational context of two college students participating in a getting acquainted
interaction.
We will examine how the thickness of a behavioral slice affects accuracy and/or
prediction. The Realistic Accuracy Model (RAM; Funder, 2001) and the Weighted Average
Model (WAM; Kenny, 1994) both describe when and how accuracy is achieved in person
perception. These models agree that judgmental accuracy should increase as the amount of
available information increases, suggesting that accuracy should be greater for “thicker” slices.
However, research does not always support this hypothesis, which we discuss in more detail
below. In the discussion that follows, we describe the different methods researchers have used
that may account for inconsistent findings, and then we will introduce the methodological
approach to be used in the current study.
Agreement and Prediction as Indicators of Accuracy
It is relevant to distinguish between two operational indicators of accuracy: agreement
and prediction. To illustrate the differences, assume that you are trying to determine the level of
extraversion of your new acquaintance. After some period of observation and interaction, you
A Thin Slice 5
decide that she is highly extraverted. During a subsequent conversation, she tells you that she
views herself to be a raging extravert. The two of you agree she is highly extraverted and, despite
the possibility that both of you are wrong, chances are good that she really is an extravert. This
scenario is about agreement, which we define as the match between a thin-slice judgment and a
criterion where both are measured on a similar scale on the same content (e.g., judge and new
acquaintance rating of extraversion). For example, researchers have found that judgments of
sexual orientation based on 1-s and 10-s slices agreed with targets’ actual sexual orientation
(Ambady, Hallahan, & Conner, 1999); judgments of intelligence based on thin slices agreed with
targets’ actual IQ scores (Murphy, Hall, & Colvin, 2003; Reynolds & Gifford,2001); and
judgments of personality traits based on thin slices agreed with targets’ self-rated personality
traits (Borkenau & Liebler, 1995; Lippa & Dietz, 2000). Moreover, several studies have found
that judges’ evaluations of emotion from thin slices of behavior exhibit agreement with criteria
for those states (Nowicki & Duke, 1994; Rosenthal, Hall, DiMatteo, Rogers, & Archer, 1979).
Returning to our example above, now assume that you decide your new acquaintance is
highly extraverted and you use this evaluation to predict that she will be outgoing at the party
you invited her to next week. In this example, a personality judgment is used to predict a future
behavior. This is predictive validity, and in this context it refers to the relation between ratings of
thin slices and characteristics or outcomes of the target persons that are different in content from
the rating. For example, Ambady and Rosenthal (1993) showed that thin-slice judgments of
enthusiasm, attentiveness, and warmth (among others) predicted semester-end teacher
evaluations. Many of the studies in Ambady and Rosenthal’s (1992) meta-analysis similarly
demonstrate thin-slice predictive validity. There is no theoretical requirement that the impact of
A Thin Slice 6
slice length or location should be the same for studies that utilize agreement and predictive
validity.
Definition of Accuracy
A second source of possible discrepancy in results stems from differences, and possibly
lack of clarity, in how the term “accuracy” is defined and discussed. To make a claim for
accuracy, a researcher performs a statistical test against a null or chance value (what that value is
depends on methodological factors; Hall, Bernieri, & Carney, 2005). If the test is significant, one
might conclude that the thin-slice judgment exhibits accuracy. But what does this mean? To find
that a coefficient reflecting average agreement or predictive validity exceeds chance may not be
saying very much. Such a coefficient can be significantly better than chance even if it is actually
small in an absolute sense. For example, Zebrowitz, Hall, Murphy, and Rhodes (2002) found in a
meta-analysis of published research that intelligence was inferred with significant accuracy from
facial expressions, but the average of the individual perceivers’ correlations between inference
and criterion was a modest r = .19. Similarly, other research has shown that accuracy of
individual perceivers’ judgments of rapport between two people having a conversation
(calculated as in the preceding study) was significant but also only r = .19 (Bernieri, Gillis,
Davis, & Grahe, 1996). Although the magnitudes of these correlations are considered to be
modest to moderate on the accuracy continuum, the sweeping conclusion that there is “accuracy”
may create a misleading impression if the distinction between significance test and magnitude is
not made clear.1 Furthermore, broad statements about accuracy that do not distinguish larger
from smaller effects are also problematic.
A Thin Slice 7
Moreover, there is no inherent incompatibility between finding that there is accuracy at
very brief exposures and finding that accuracy increases with exposure length. These are
separable questions that can be obscured if one refers in a loose sense to thin-slice accuracy.
Judged Construct
Thin-slice research has addressed a wide range of constructs, including personality traits,
affective states or emotions, status or dominance, relationships, attitudes, deception, and
intelligence (Hall & Bernieri, 2001). Unfortunately, it is rare for more than one construct to be
included and compared within the same study. One exception is the study by Borkenau and
Liebler (1993), who measured judgmental accuracy for several personality traits. In studies of
emotion judgment, it is common to include and compare accuracy for a range of different
emotions, but studies that include and compare both states and traits, or qualitatively different
kinds of states, are extremely rare and perhaps non-existent.2 Comparisons between different
constructs are therefore typically done on a between-studies basis, but such comparisons are
confounded by all the other methodological differences between the studies (e.g., slice length).
In the present study we included eight judged constructs: the states of positive affect and
negative affect, the Big Five traits of neuroticism, extraversion, openness, agreeableness, and
conscientiousness, and cognitive ability (overall intelligence).
Context
Different studies have used thin-slice samples from a wide range of settings, tasks, and
populations such as standardized interviews about a movie (Carney, 2005); office spaces and
bedrooms (Gosling, Ko, Mannarelli, & Morris, 2002); university employees (Schmid Mast &
Hall, 2004); college students having a competitive discussion (Bernieri et al., 1996); community-
dwelling adults reading a weather report (Borkenau & Liebler, 1993); college men role-playing
A Thin Slice 8
being a television announcer (Lippa & Dietz, 2000); or college students getting acquainted or
talking with a close friend (Vogt & Colvin, 2003). Such variation contributes to the ability to
generalize if the results converge across studies. However, comparisons between studies can be
confounded by these contextual differences. In the present study we held context constant by
basing all analyses on one set of expressors in one context (college students in an opposite-
gender get-acquainted situation).
Slice Length
Research is mixed on whether slice length is related to accuracy. It was found that
observers’ accuracy in judging targets’ personality increased with the number and variety of
targets’ videotaped behavioral contexts, such as introducing oneself versus telling a joke versus
solving a logical problem versus telling a dramatic story (Borkenau, Mauer, Riemann, Spinath,
& Angleitner, 2004). Other research has shown that across 100 personality items, there was a
statistically significant linear increase in agreement between observers’ and targets’ ratings as a
function of exposure time. In this latter study, accuracy increased from r = .22 when judgments
were based on 5-10 minutes to r = .26 when judgments were based on 25-30 minutes (Blackman
& Funder, 1998). Ambady et al. (1999) found that judgments of sexual orientation increased
from r = .35 at 1-s exposures to r = .52 at 10-s exposures. Rosenthal et al. (1979) reported on a
version of the Profile of Nonverbal Sensitivity (PONS test) in which the exposures to videotaped
face and body cues were 1/24 s, 3/24 s, 9/24 s, and 27/24 s. Accuracy was significantly greater
than chance even at 1/24 s, but increased dramatically after that (with not much change across
the longer exposure lengths). Some researchers have found a linear trend in accuracy for judging
basic facial emotions across exposure lengths of 1/15 s, 2/15 s, and 3/15 s (Matsumoto, LeRoux,
A Thin Slice 9
Wilson-Cohn, Raroque, Kooken, Ekman, Yrizarry, Loewinger, Uchida, Yee, Amo, & Goh,
2000).
On the other hand, the meta-analysis of Ambady and Rosenthal (1992) found that across
38 studies of thin-slice accuracy, there was no linear increase in correlations from slices of under
30 s to slices of 300 s in length. Moreover, Ambady and Rosenthal (1993) showed that prediction
of end-of-semester teaching evaluations did not vary when slices of 2 s and 5 s were compared
(prediction based on 10 s was stronger but not statistically significantly so). Bernieri and Gillis
(2001) compared accuracy of judging rapport for slices varying from 5 s to 60 min and found
only minimal increases as more information was made available to perceivers.
It appears that there is little consensus on whether exposure length makes a difference.
Again, due to methodological differences, comparisons between studies that examine different
slice lengths are problematic. For example, it would be inadvisable to compare accuracy for 2-s
slices of affect conveyed in the voice (Rosenthal et al., 1979) to accuracy for 5-min slices of
personality conveyed in full video (Vogt & Colvin, 2003). In reality, slice length may matter
only under some circumstances, for some constructs, or within a specific range of slice lengths. It
is also important to reiterate that finding accuracy at very short exposures is not inherently
incompatible with finding an effect of slice length. Furthermore, there may be a linear effect up
to a point and no evident gains beyond that, or there may be threshold effects. Clearly, much
more research is needed on the question of slice length. In the present study we examined five
slice lengths: 5 s, 20 s, 45 s, 60 s, and 300 s (i.e., the full 5-min interaction).
Slice Location
Very little is known about where in the behavioral stream thin slices are most diagnostic
and whether slice location may be related to accuracy. It has been argued that accuracy is
A Thin Slice 10
enhanced when judges are exposed to “good” information (i.e., information derived from
contexts in which individuals freely express their underlying personality characteristics) as
opposed to less valid information (Funder, 2001). In addition, Funder noted that “the quality
dimension is just beginning to receive its due attention, but already it seems clear that some
kinds of acquaintanceship and contexts of observation are more informative than others” (p.
133).
We will examine whether the location of the behavioral stream from which a slice is
excerpted (first min, third or middle min, and fifth or last min) is related to accuracy. We
reasoned that when strangers “get to know each other” during a 5 min interaction, as in the
current study, information contained in the beginning of the behavioral stream may be wrought
with awkwardness as the two strangers settle in. Then, as the strangers begin to feel more
comfortable with their environment and with each other, the information may be optimal for
making accurate assessments because, presumably, they are acting more “like themselves” as
they feel more comfortable. We predicted that judges’ accuracy would be highest in the third and
fifth mins and lowest in the first.
The Present Research
A better understanding of the scope and boundaries of thin-slice accuracy requires
research that systematically varies the various parameters of interest. Without such research, few
definitive conclusions can be reached about the influences of slice length and location within the
behavioral stream, making it extremely difficult to develop an understanding of the generality of
such effects across a range of different judged constructs.
The present study is concerned with accuracy defined as the correlation between a
perceiver’s thin-slice ratings of a construct (e.g., extraversion) and a criterion measure of the
A Thin Slice 11
same construct, calculated across a set of stimulus individuals (targets). Based on 5-min
videotapes of college students having a get-acquainted conversation, perceivers made ratings in
different conditions created by crossing slice length, slice location, and judged construct. Aside
from the overall goal of describing accuracy as a function of these factors, we made predictions
about constructs, exposure length, slice location, and gender differences.
What Will Judges be Accurate About at the Briefest Exposures?
Judgments of affect. Previous research has found accuracy for judging affective variables
at very short exposure lengths (e.g., Matsumoto et al., 2000; Nowicki & Duke, 1994; Rosenthal
et al., 1979). This finding is consistent with an evolutionary or functional approach to emotion
(e.g., Darwin, 1872/1965; Izard, 1991) that emphasizes the adaptive value of recognizing others’
emotional states. In addition, research has demonstrated that skin conductance responses can be
elicited in response to subliminally presented faces expressing negative affect, but not positive
affect (Esteves, Dimberg, & Ohman, 1994). Thus, we expected that judges would be more
accurate at detecting negative than positive affect after extremely brief exposure.
Judgments of personality. Funder’s (2001) RAM suggests that the achievement of
accuracy requires, in part, valid and available cues. Research on the relevant and available
behavioral correlates of each of the Big 5 personality factors was extensively cataloged and
revealed that extraversion had the greatest number of valid and available behavioral cues (Funder
& Sneed, 1993). Other research has demonstrated that with only minimal behavioral
observation, judges can accurately assess the extraversion of strangers (Albright, Kenny, &
Malloy, 1988; Borkenau & Liebler, 1993; Funder & Colvin, 1988; Funder & Dobroth, 1987;
Gifford, 1991; Lippa & Dietz, 2000; Norman & Goldberg, 1966; Watson, 1989).
A Thin Slice 12
Although they possess fewer observable cues than extraversion, conscientiousness and
agreeableness were also found to have valid and available behavioral cues (Funder & Sneed,
1993). These factors also can be relatively accurately judged by strangers Borkenau & Liebler,
1993, and Lippa & Dietz, 2000, for conscientiousness and Borkenau & Liebler, 1993, and
Gifford, 1991 for agreeableness). The most difficult personality factors to judge are neuroticism
and openness to experience (Borkenau & Liebler, 1993; Funder & Dobroth, 1987), presumably
because there are few or conflicting behavioral cues (Funder & Sneed, 1993). We predicted that
judges would be most accurate when judging extraversion and conscientiousness, with some
accuracy for agreeableness, and relatively less accuracy for neuroticism and openness.
Specifically, it was predicted that the personality constructs deemed most easily judged in
previous research (extraversion and conscientiousness) would be most easily judged at the
shortest time lengths (e.g., 5 s) and would be the least likely to benefit dramatically from
increases in exposure time. In contrast, neuroticism and openness were not expected to be
accurately judged at the shortest time lengths and but should benefit the most from an increase in
exposure length.
Judgments of intelligence. Research on the accuracy of intelligence judgments has not
used slices any shorter than 1 min in duration. Reynolds and Gifford (2001) and Murphy et al.
(2003) found significant accuracy with slices of this length, as did Borkenau and Liebler (1993)
with 90-s exposures. Zebrowitz et al. (2002), in a meta-analysis as well as in a new study of
judgments of facial photographs, found significant accuracy. We thought it possible, therefore,
that even our shortest exposures would contain enough information for intelligence to be judged
better than chance.
A Thin Slice 13
Gender Differences
Accuracy research often demonstrates that female judges are more accurate than male
judges, particularly when judging emotions (see meta-analyses by Hall, 1978, 1984; and
McClure, 2000). Women’s greater accuracy has also been observed for judgments of personality
traits and intelligence (Ambady, Hallahan, & Rosenthal, 1995; Lippa & Dietz, 2000; Murphy et
al., 2003; Vogt & Colvin, 2003). Overall, past research suggests that women may be more
accurate than men on all the constructs we assessed in the current study.
Method
Phase 1: Collecting and Assembling the Stimulus Material
Targets and materials. Across two waves of data collection which spanned
approximately six months each, 55 female and 47 male college students completed the project.
Participants came to the laboratory on five separate occasions for a two hour research session.
Participants were paid for their time and could earn up to one hundred dollars for completing all
five research sessions. All participants were videotaped while engaging in a 5-min dyadic
interaction with an opposite sex partner. They were instructed to “talk about whatever you like”
in an attempt to create a relatively unstructured situation, and as a result, permit the expression of
individual differences in behavior.3 From this body of videotaped social interactions, 30 (15
female and 15 male) individuals (only one individual from a given dyad) were chosen to be
targets on the basis that the videotaped segment was in good condition (i.e., contained clear
audio and video). Targets were measured on eight criterion variables (constructs): positive affect,
negative affect, neuroticism, extraversion, openness, agreeableness, conscientiousness, and
intelligence. Each of the eight constructs was measured with multiple different measures and/or
A Thin Slice 14
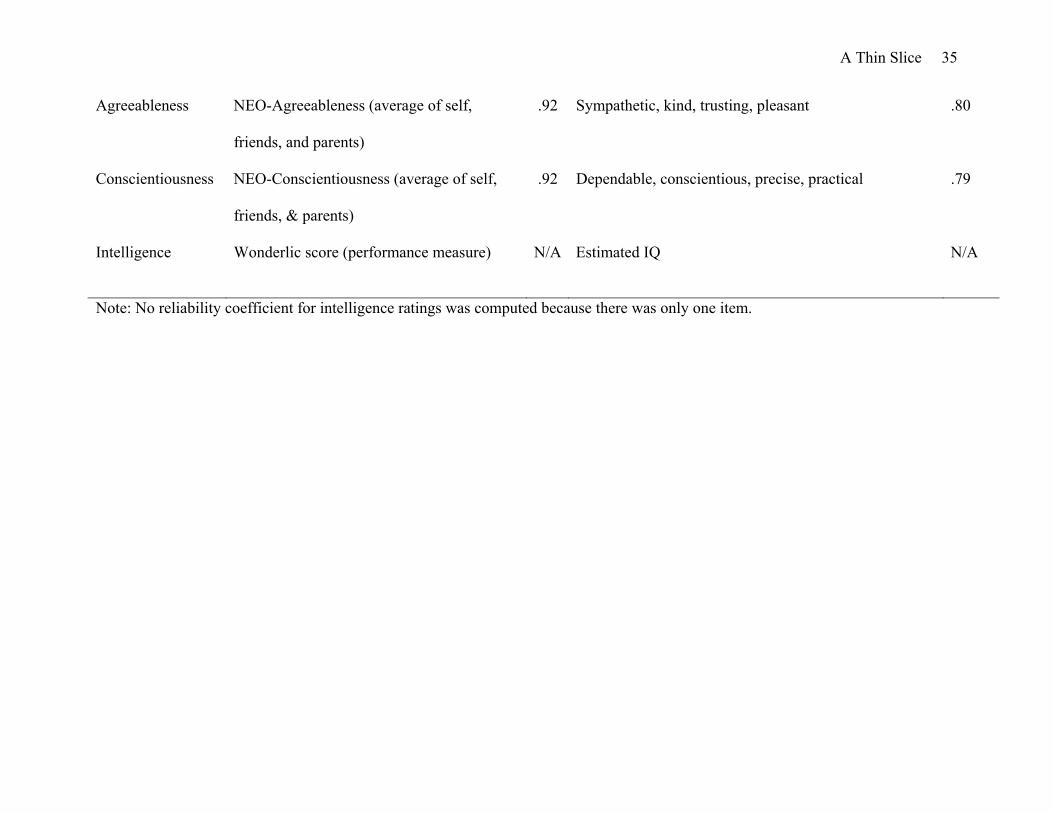
measurement methods, or a performance measure (IQ test). Table 1 lists the criteria with
associated internal consistency coefficients. Below, each is discussed in detail.
Affective variables. Trained coders evaluated the videotaped social behavior of each
target using the Riverside Behavioral Q-set (RBQ; Funder, Furr, & Colvin, 2000). The RBQ
consists of 64 items pertaining to directly observable behavior in a dyadic or group setting, each
printed on a separate card, that coders sort into nine piles ranging from 1 (extremely
uncharacteristic of the participant) to 9 (extremely characteristic of the participant). Of the 64
RBQ items, nine behaviors describe positive affect (appears to be relaxed and comfortable,
laughs frequently, smiles frequently, shows high enthusiasm, expresses sympathy, expresses
warmth, seems to enjoy interaction, behaves in a cheerful manner, and acts playful) and 10
behaviors describe negative affect (is reserved and unexpressive, shows physical signs of
tension, acts irritated, expresses hostility, behaves in a timid or fearful manner, expresses guilt,
says negative things about self, blames others, expresses self-pity, and seems detached from the
interaction).
Personality. The Big Five factors of neuroticism, extraversion, openness, agreeableness,
and conscientiousness were calculated for each target by using an average of self report, peer
report, and parent reports on the NEO-PI-R (Costa & McCrae, 1992; peer and parent reports are
further described in Vogt & Colvin, 2003).
Intelligence. Intelligence was measured with the Wonderlic Personnel Test (Wonderlic,
1984), a 12-min 50-item measure that is highly correlated with established IQ tests (Dodrill,
1983).
Stimulus tapes. The 5-min interactions for each of the 30 target individuals were
assembled onto three stimulus video tapes containing 10 targets each. Three separate minutes
A Thin Slice 15
from the behavioral stream were chosen to represent the beginning (first min), middle (third
min), and end (fifth min) of the interaction. From each point in time, different slice lengths were
chosen, 5 s, 20 s, 45 s, 60 s, and the full 5 min; each slice length beyond 5 s included the same
information contained in the shorter slice lengths along with the additional information provided
by the lengthened clip.
Phase 2: Collecting Judgments of the Stimulus Material
Design and participants. The stimulus tapes configured into a 4 (slice length; 5 s, 20 s, 45
s, 60 s) x 3 (slice location; first, third, fifth min) + 1 (5 min) between-participants design. Three
hundred thirty-four participants (199 female and 132 male; 80% Caucasian) were recruited to
view and judge one of the three stimulus tapes containing 10 targets (the full video, including
both audio and video, was shown). Judges ranging in age from 18 to 43 (M = 19) were recruited
from the Northeastern University Participant Pool for partial course credit. Judges were
randomly assigned to experimental conditions.
Materials and procedure. Judges made 39 ratings in 3 min after viewing each of the 10
targets on the videotape. Ratings corresponded to the eight criterion constructs (see Table 1). All
but IQ were rated on a 1 (not at all like the target person) to 5 (exactly like the target person)
scale. Judges rated targets’ positive and negative affect using 10 items from the Positive and
Negative Affect Schedule (PANAS; Watson, Clark, & Tellegen, 1988). For the Big Five
personality traits, judges rated 20 items, four each, for neuroticism, extraversion, openness,
agreeableness, and conscientiousness. For intelligence, judges were told that the average IQ
score in the U.S. population was 100, and were then asked to rate the IQ of each target on a 1 to
5 scale using the following anchors: (1) IQ of 93 and below, (2) 94 – 104, (3) 105 – 115, (4) 116
– 126, and (5) 127 and above.
A Thin Slice 16
Scoring of Accuracy
Accuracy was calculated for each judge, for each judged construct, across targets using
profile correlations (Carney, 2005; Hall et al., 2005; Hall & Carter, 1999; Lippa & Dietz, 2000;
Tickle-Degnen & Lyons, 2004; Vogt & Colvin, 2003).4 After each judge’s accuracy score for
each construct was calculated, the profile correlations (accuracy scores) were transformed into
Fisher’s z coefficients before any descriptive or inferential statistics were conducted. All
analyses were based on the Fisher’s z transformed accuracy scores and results were converted
back into r for presentation.5
Results
Overall Effects for Constructs, Slice Length, and Slice Location
A repeated-measures ANOVA on the 8 judged variables revealed a main effect of judged
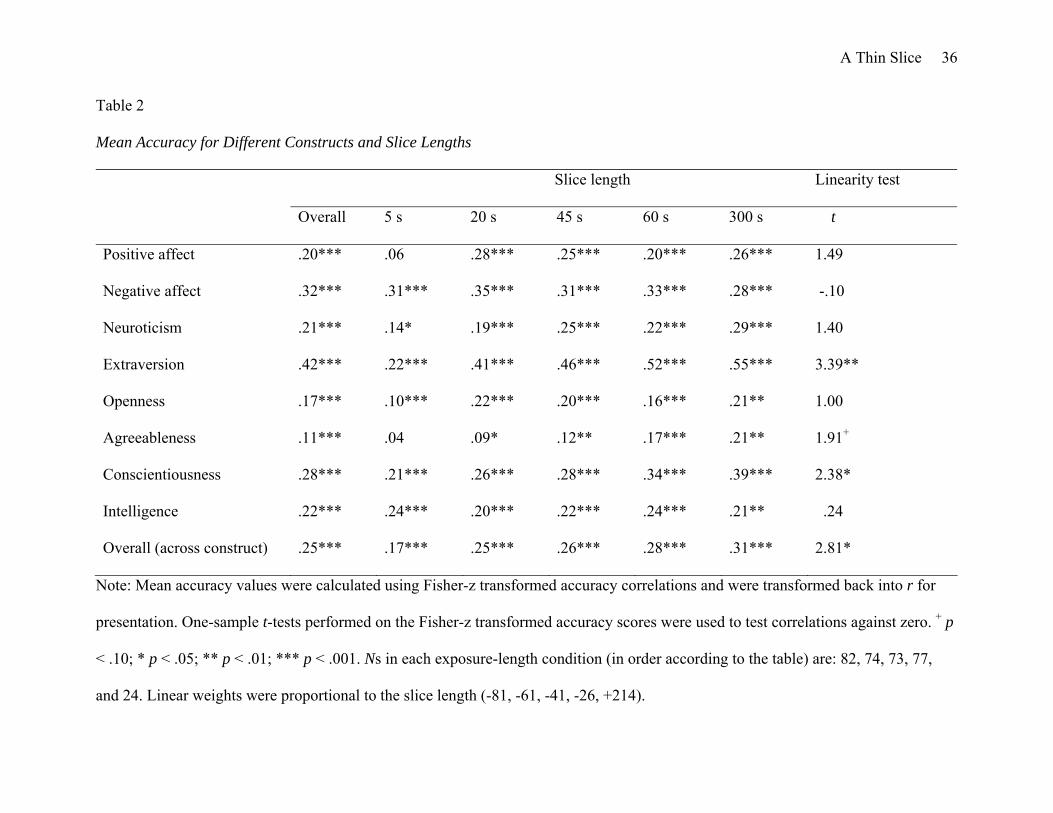
construct, F(7, 304) = 34.09, p < .001. The left column in Table 2 shows the overall accuracy for
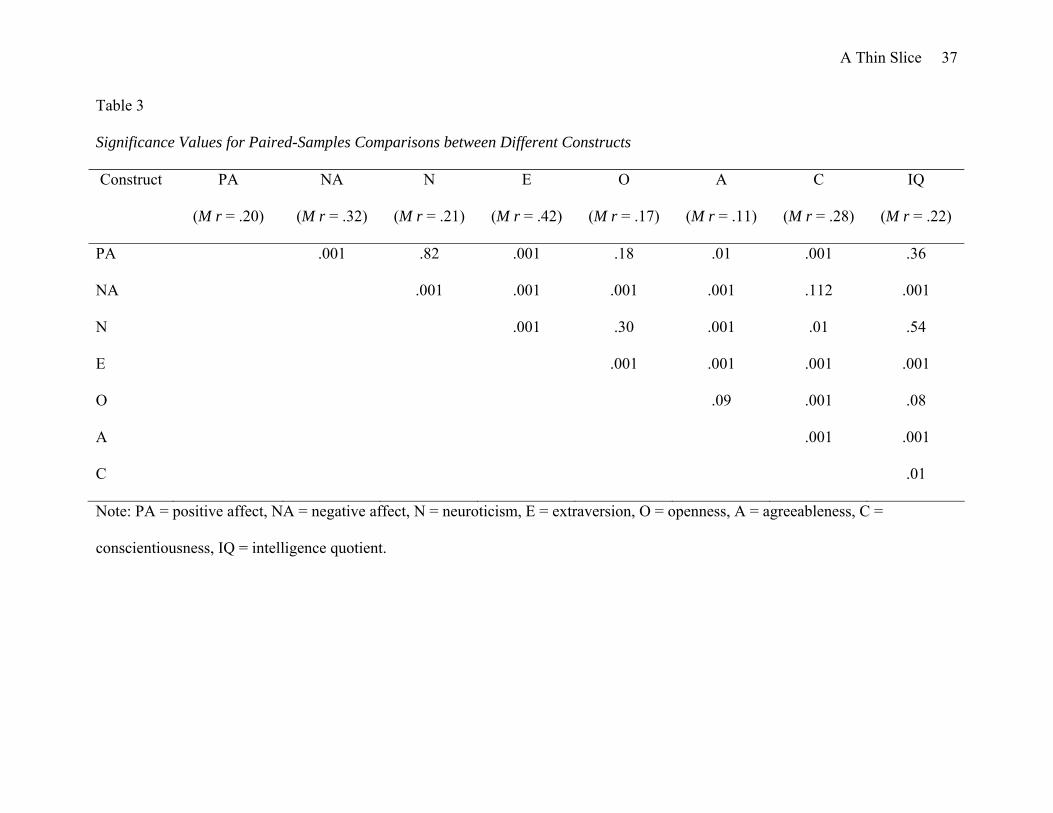
each judged construct. Pair-wise paired-sample t-tests revealed many differences in average
accuracy. Table 3 shows that accuracy for judging extraversion was greater than accuracy for
judging all other constructs; accuracy for agreeableness was lower than all others; and accuracy
for negative affect was greater than all others except positive affect and conscientiousness.
To examine the overall effect of slice length on accuracy, accuracy across the eight
judged constructs was averaged and subjected to a linear contrast with appropriate contrast
weights (see note at bottom of Table 2). Across all judged constructs, there was a statistically
significant linear effect of slice length (bottom of Table 2). These results suggest that overall,
accuracy increases with exposure length.

A Thin Slice 17
It is important, of course, to understand the effects of slice length and location for
individual constructs. In the sections that follow, the eight judged constructs are grouped into
affect, personality, and cognitive ability.
Accuracy in the Affective Domain
Positive affect. The first column in Table 2 shows that judges were significantly better
than chance at detecting positive affect, averaging across all slice lengths. In addition, Table 2
shows that accuracy for positive affect was not achieved at 5 s; however, it was at 20-s and
longer exposures. Because the following comparisons were exploratory, Tukey’s post hoc tests
revealed that accuracy at 5 s was lower than accuracy at all other slice lengths (p < .001 - .09),
and the other slice lengths were not different from each other (p > .57). There was no linear
effect of slice length on accuracy (see last column in Table 2).
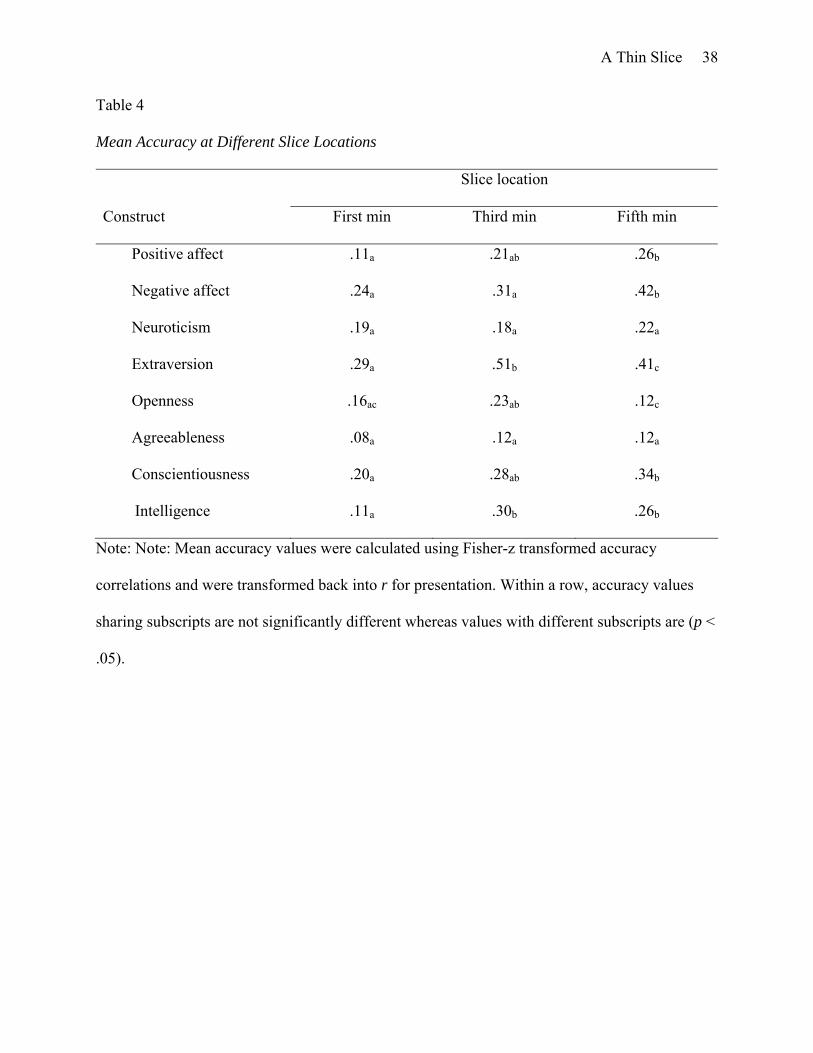
To examine the effects of slice location on positive affect, a 4 (slice length) x 3 (slice
location) between-participants ANOVA was used. There was a main effect of slice location, F(2,
326) = 3.75, p < .02 (Table 4). Accuracy was greatest when judgments were based on the third or
fifth min (the comparison of first with third min was not significant). To determine whether slice
location mattered for each of the slice-lengths, a series of one-way ANOVAs was conducted on
the slice locations for each slice length. A statistically significant one-way ANOVA would
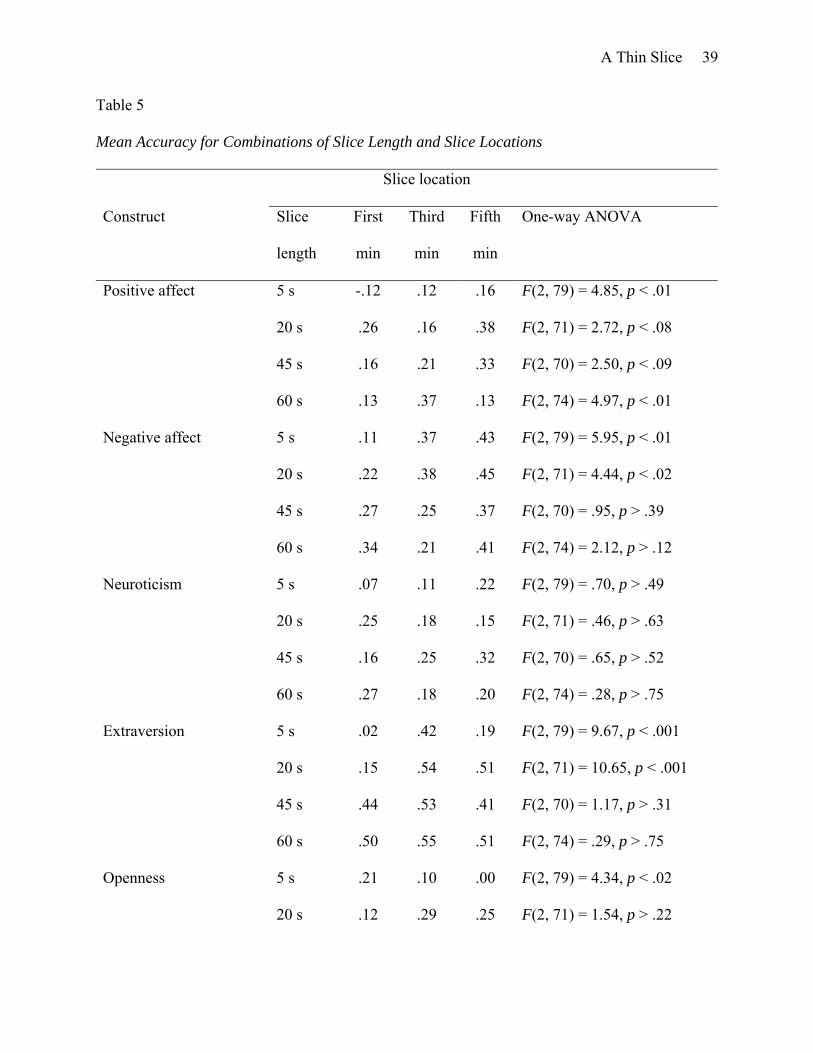
indicate that slice location moderated accuracy for a particular slice length. Table 5 displays the
mean accuracy achieved at each slice location separately for each slice length. In the column
farthest to the right is the one-way ANOVA indicating whether slice location mattered for each
particular slice-length. Rows 1 through 4 of Table 5 suggest that slice location appears to matter
for all slice lengths and matters the most for 5- and 60-s exposures (Table 5).
A Thin Slice 18
Negative affect. Table 2, first column, shows that overall accuracy was significantly
greater than chance for negative affect. In addition, Table 2 shows that accuracy for negative
affect was achieved at all slice lengths. Planned contrasts revealed no differences in accuracy as
a function of slice length (p > .86), and there was no linear effect of slice length on accuracy.
To examine the effects of slice location a 4 (slice length) x 3 (slice location) between-
participants ANOVA was used. There was a main effect of slice location, F(2, 294) = 8.24, p <
.001. Accuracy was greatest when judgments were based on the third or fifth min (the
comparison of first with third was not significant) (Table 4). In Table 5, the 4 rows associated
with negative affect suggest that slice location affected accuracy at the shorter exposure lengths
but mattered much less at the longer exposure lengths.
Accuracy in the Big Five Personality Domain
Neuroticism. The first column in Table 2 shows that judges were significantly greater
than chance at detecting neuroticism. Table 2 also shows that accuracy for neuroticism was
achieved at 5 s (although statistically significant, the magnitude of the mean accuracy correlation
was very small) and longer exposures. Planned contrasts revealed no differences between the
different slice lengths on accuracy (all p > .52) and no significant linear trend.
To examine the effects of slice location on neuroticism, a 4 (slice length) x 3 (slice
location) between-participants ANOVA was used. There was no main effect of slice location,
F(2, 303) = .29, p > .74 (Table 4). Table 5 (the 4 rows associated with neuroticism) suggests that
slice location did not affect accuracy at any slice lengths.
Extraversion. The first column in Table 2 shows that judges were significantly better than
chance at detecting extraversion. In addition, Table 2 shows that statistically significant accuracy
for extraversion was achieved at all slice lengths. Planned contrasts revealed that 5 s was less
A Thin Slice 19
accurate than all other slice lengths (all p < .001), and there were no other differences (all p >
.21). There was a linear effect of slice length on accuracy for extraversion (Table 2).
To examine the effects of slice location on extraversion, a 4 (slice length) x 3 (slice
location) between-participants ANOVA was used. There was a main effect of slice location on
accuracy, F(2, 294) = 12.64, p < .001. Accuracy was lower when it was based on the first or third
min (Table 4). Table 5 (the 4 rows associated with extraversion) suggests that slice location
affected accuracy at 5 s and 20 s but not at 45 and 60 s exposures.
Openness. Table 2, column 1, shows that judges were significantly greater than chance at
detecting openness. Table 2 also shows that accuracy for openness was achieved at all slice
lengths. Planned contrasts revealed no differences in accuracy as a function of slice length (all ps
> .22). There was no linear effect of slice length on accuracy for openness (Table 2).
To examine the effects of slice location on openness, a 4 (slice length) x 3 (slice location)
between-participants ANOVA was used, revealing a main effect of slice location, F(2, 294) =
3.03, p < .05. Accuracy was lower in the first as compared to the third and fifth min (the latter
two were not different; Table 4). Table 5 (the 4 rows associated with openness) suggests that
slice location affected accuracy the most at 5 and 45 s but not at 20 and 45 s.
Agreeableness. Column 1 in Table 2 shows that judges were significantly better than
chance at detecting agreeableness. Table 2 shows that significant accuracy was not achieved until
20-s exposures, and did not reach a magnitude above .15 until 60-s exposures. Planned contrasts
revealed that 5 s was less accurate than 60 s (p < .08). No other differences were statistically
significant (all p > .18). The linear effect of slice length on accuracy for agreeableness was
marginally significant (Table 2).
A Thin Slice 20
To examine the effects of slice location on agreeableness, a 4 (slice length) x 3 (slice
location) between-participants ANOVA was used. There was no main effect of slice location,
F(2, 294) = .74, p > .47 (Table 4). Table 5 (the 4 rows associated with agreeableness) suggests
that slice location did not affect accuracy except for slightly at 20-s exposures.
Conscientiousness. Column 1 in Table 2 reveals that judges were significantly better than
chance at detecting conscientiousness. In addition, Table 2 shows that accuracy for
conscientiousness was better than chance at all slice lengths. Planned contrasts revealed that 5 s
was not different from any other lengths (all ps > .11). The linear effect of slice length on
accuracy was statistically significant (Table 2).
To examine the effects of slice location on agreeableness, a 4 (slice length) x 3 (slice
location) between-participants ANOVA was used. There was no main effect of slice location,
F(2, 317) = 5.27, p < .01 (Table 4). Table 5 (the 4 rows associated with conscientiousness)
suggests that slice location affected accuracy the most at 45-s and 60-s exposures.
Accuracy in the Cognitive Domain
Accuracy for judging intelligence was significantly greater than zero overall (Column 1
of Table 2). Table 2 also shows that accuracy for intelligence was achieved at all slice lengths
from 5 s to 5 min. Post hoc tests revealed that none of the slice lengths was different from any
other (p > .97), and there was no linear effect of slice length (Table 2).
To examine effects of slice location on intelligence a 4 (slice length) x 3 (slice location)
between-participants ANOVA was used. There was a main effect of slice location, F(2, 281) =
8.79, p < .001, such that accuracy based on the first min was lower than accuracy based on the
third or fifth min (third and fifth were not different; Table 4). Table 5 (the 4 rows associated with
intelligence) suggests that slice location did not affect accuracy except for at 60 s exposures.
A Thin Slice 21
Gender Effects
Over all constructs, females’ mean accuracy across all judged variables was higher (M r
= .26) than males’ (M r = .22), F(1, 325) = 7.11, p < .01; effect size r = .15. At the individual
construct level, one-way ANOVAs revealed that females achieved significantly or marginally
significantly higher accuracy (M rs = .35, .20, and .25) than males (M rs = .28, .12, and .18) on
negative affect, F(1, 325) = 3.26, p < .08, openness F(1, 325) = 4.24, p < .04, and intelligence,
F(1, 312) = 3.33, p < .07 (respectively). Gender did not interact with slice length (all p > .32) or
location (all p > .40).
Discussion
Our empirical results demonstrate that the achievement of accurate first impressions
depends upon the judgment being made, and the quantity and quality of information on which
the judgment is based. Under varying judgment circumstances, first impressions either can be
remarkably right or dead wrong.
Sometimes “Slice Thickness” Matters
We predicted that exposure time and accuracy would be positively related, which is
consistent with two models of trait accuracy (Funder, 2001; Kenny, 1994) and previous research
on judgments of personality based on excerpts longer than 5 min (Blackman & Funder, 1998).
Consistent with these predictions, there was a positive relationship between exposure time and
accuracy for the aggregated set of variables. However, slice length (i.e., exposure time) mattered
most for three variables: positive affect, extraversion, and agreeableness. For each of these three
variables, accuracy at 5s was significantly lower than accuracy at longer exposures. There was a
significant linear effect of slice length on accuracy for extraversion and agreeableness. These
A Thin Slice 22
results seem to suggest that more information yields more accuracy particularly for constructs
related to positive affect and social approach.
In contrast, increased exposure time was unrelated to accuracy when judging negative
affect, neuroticism, openness, and intelligence—accuracy was no different at 5 s than at 300 s.
Judgments of conscientiousness exhibited a linear increase in accuracy with greater slice length,
but the difference between 5 and 300s was not statistically significant. Overall, it might be
argued that these 5 variables fall into the two categories of negative affect or threat, and
intelligence or competence. Quick and accurate judgments of these behavioral categories may be
both life-saving and life-promoting.
Sometimes “Slice Location” Matters
The current study, as far as we know, is the first to empirically examine the influence of
slice location on accuracy. Judges observed targets in an unstructured “get acquainted”
interaction and it was found, consistent with our predictions, that slices from the middle and end
of the behavioral stream produced the greatest accuracy for 6 of 8 variables (the exceptions were
neuroticism and agreeableness). Overall, accuracy was highest for slices extracted from the third
minute of the 5 min interaction. Considerable accuracy was also observed for slices extracted
from the fifth min, whereas accuracy for the first min was much lower. The middle min may be
the most informative as participants pass through the nervous phase of initial introductions, begin
to learn something about each other’s characteristics, but have not yet entered the awkward
period of having nothing left to discuss. These results support Funder’s (2001) claim that
qualitative differences in information can influence the accuracy of judges’ ratings. This finding
is more prescriptive than theoretical; however, it suggests that slice location ought to be
A Thin Slice 23
considered in future research on first impressions. It remains an open question whether slices
positioned later in the behavioral stream will consistently produce greater accuracy.
Accuracy Differs According to Judged Construct
Because the thin slice literature is marked by studies that are not always directly
comparable, we thought it was important to investigate in one study first impression accuracy for
emotions, personality traits, and intelligence. Furthermore, the stimuli presented to judges for
evaluation were all derived from the same set of dyadic get acquainted interactions so that
accuracy estimates could be compared across constructs. As it turned out, there was
considerable variability in the judgment accuracy of our set of constructs (e.g., Funder & Colvin,
1988). Thin-slice judgments for extraversion exhibited the greatest accuracy, followed by
negative affect, conscientiousness, IQ, neuroticism, positive affect, openness, and agreeableness
(for which accuracy was significantly lower than all other variables).
We expected, and found, greater accuracy for negative than positive affect, which may
reflect the survival value of accurately judging negative affect. We expected accuracy to be
higher for extraversion, conscientiousness, and agreeableness than for neuroticism and openness.
Our results were consistent with this pattern except that, on average, neuroticism was judged
relatively accuracy whereas agreeableness was not. The results replicate those reported by
Kenny, Albright, Malloy, and Kashy on accuracy at zero-acquaintance (1994) in which
consensus on the Big 5 factors was found to be highest for extraversion and lowest for
agreeableness.
Gender Differences
Women’s judgments of targets, across all 8 constructs, were significantly more accurate
than men’s judgments of targets (for related personality results, see Vogt & Colvin, 2003).

A Thin Slice 24
Women were significantly or marginally more accurate on openness, intelligence (e.g., Murphy
et al., 2003), and negative affect (as frequently found in affect judgment studies). Women and
men did not differ in accuracy on neuroticism, extraversion, or positive affect (c.f., Lippa &
Dietz, 2000; Ambady et al., 1995).
Caveats When Interpreting the Current Research
It should be noted that our accuracy criteria, although based on multiple methods,
multiple raters, or objective tests, varied across constructs. The constructs explored spanned
affective, personality, and intelligence domains, and thus required different types of accuracy
criteria in which to compare judges’ ratings. For example, intelligence is typically measured
with an objective IQ measure, and not by self, friend, or parent ratings of intelligence. Thus, the
validity of the intelligence criteria may be questioned. Nevertheless, at least one study has
demonstrated that observers can evaluate the intelligence of others with considerable validity
(Block & Kremen, 1996). Still, it is difficult to know whether the various criteria used in this
study were equally valid. Therefore, differences in average levels of accuracy from construct to
construct may be due to in part to the differences in criterion measurement.
A strength of the study is that we evaluated accuracy in the emotion, personality, and
intelligence domains. However, our sampling of constructs is a relatively small one and the
results we reported are likely to reflect this fact. Future research will benefit from studies that
evaluate a wide range of constructs in order to develop parameter estimates for the independent
variables we and others have begun to study. We considered only a restricted range of exposure
lengths (only up to 5 min). It may now be the right time to integrate thin slices and trait accuracy
research in which the former tends to make judgments based on 5s to 5 min observations
whereas the latter tends to make judgments based on 5 min and longer observations.

A Thin Slice 25
Conclusion and Prescription For Future Research on First Impressions
Sixty-s slices provided sufficient behavioral fodder to yield the optimal accuracy-to-slice-
length ratio for all judged variables. Increasing exposures to 300 s (the full 5 min) did not
significantly increase accuracy from that obtained at one min. However, 60-s slices generally
yielded significantly more accuracy than shorter slices. This result is at odds with previous
findings in which thicker slices were not related to accuracy (Ambady & Rosenthal, 1992, 1993).
In addition, 60-s slices were the most impervious to slice location. That is, slice location did not
generally influence accuracy if the excerpts were 60 s long. Thus, if a researcher’s goal is to
determine an excerpt length to optimize accuracy, 60 s is the answer. However, if a researcher
needs to know which variable to study because his or her question can only be met by
investigating a variable under conditions of extremely brief exposure, the answers, in the order of
magnitude of accuracy at 5-s exposure, are negative affect, extraversion, conscientiousness, and
intelligence.
A Thin Slice 26
References
Albright, L., Kenny, D. A., & Malloy, T. E. (1988). Consensus in personality judgments at zero
acquaintance. Journal of Personality and Social Psychology, 55, 387-395.
Allport, G. W. (1937). Personality: A psychological interpretation. New York: Holt.
Ambady, N., & Rosenthal, R. (1992). Thin slices of expressive behavior as predictors of
interpersonal consequences: A meta-analysis. Psychological Bulletin, 111, 256-274.
Ambady, N., & Rosenthal, R. (1993). Half a minute: Predicting teacher evaluations from thin
slices of nonverbal behavior and physical attractiveness. Journal of Personality and
Social Psychology, 64, 431-441.
Ambady, N., Bernieri, F. J., & Richeson, J. A. (2000). Toward a histology of social behavior:
Judgmental accuracy from thin slices of the behavioral stream. In M. P. Zanna (Ed.),
Advances in experimental social psychology, Vol. 32. (pp. 201-271). San Diego, CA:
Academic Press.
Ambady, N., Hallahan, M., & Conner, B. (1999). Accuracy of judgments of sexual orientation
from thin slices of behavior. Journal of Personality and Social Psychology, 77, 538-547.
Bernieri, F. J., & Gillis, J. S. (2001). Judging rapport: Employing Brunswik’s lens model to
study interpersonal sensitivity. In J. A. Hall & F. J. Bernieri (Eds.), Interpersonal
sensitivity: Theory and measurement (pp. 67-86). Mahwah, NJ: Erlbaum.
Bernieri, F., Gillis, J. S., Davis, J. M., & Grahe, J. E. (1996). Dyad rapport and the accuracy of
its judgment across situations: A lens model analysis. Journal of Personality and Social
Psychology, 71, 110-129.
Blackman, M. C., & Funder, D. C. (1998). The effect of information on consensus and accuracy
in personality judgment. Journal of Experimental Social Psychology, 34, 164-181.
A Thin Slice 27
Block, J., & Kremen, A. (1998). IQ and ego-resiliency: Conceptual and empirical connections
and separateness. Journal of Personality and Social Psychology, 70, 349-361.
Borkenau, P., & Liebler, A. (1993). Convergence of stranger ratings of personality and
intelligence with self-ratings, partner ratings, and measured intelligence. Journal of
Personality and Social Psychology, 65, 546-553.
Borkenau, P., & Liebler, A. (1995). Observable attributes as manifestations and cues of
personality and intelligence. Journal of Personality, 63, 1-25.
Borkenau, P., Mauer, N., Riemann, R., Spinath, F. M., & Angleitner, A. Thin slices of behavior
as cues of personality and intelligence. Journal of Personality and Social Psychology, 86,
599-614.
Carney, D. R. (2005). Perceptions of prejudice: When expression reveals and overcorrection
conceals. Manuscript under review.
Costa, P., & McCrae, R. (1992). NEO PI-R Professional Manual. Odessa, FL: Psychological
Assessment Resources.
Darwin, C. (1965). The expression of the emotions in man and animals. Chicago: University of
Chicago Press. (Original work published 1872).
Dodrill, C. B. (1983). Long-term reliability of the Wonderlic Personnel Test. Journal of
Consulting and Clinical Psychology, 51, 316-317.
Esteves, F., Dimberg, U., & Oehman, A. (1994). Automatically elicited fear: Conditioned skin
conductance responses to masked facial expressions. Cognition and Emotion, 8, 393-413.
experiments. Berkeley, CA: University of California Press.
Funder, D. C. (2001). Accuracy in personality judgment: Research and theory concerning an
obvious question. In B. W. Roberts, & R. Hogan (Eds.) Personality Psychology in the
A Thin Slice 28
Workplace. Decade of Behavior. (pp. 121-140). Washington: American Psychological
Association.
Funder, D. C., & Colvin, C. R. (1988). Friends and strangers: Acquaintanceship, agreement, and
the accuracy of personality judgment. Journal of Personality and Social Psychology, 55,
149-158.
Funder, D. C., & Dobroth, K. M. (1987). Differences between traits: Properties associated with
interjudge agreement. Journal of Personality and Social Psychology, 52, 409-418.
Funder, D. C., & Sneed, C. D. (1993). Behavioral manifestations of personality: An ecological
approach to judgmental accuracy. Journal of Personality and Social Psychology, 64, 479-
490.
Funder, D. C., Furr, R. M., & Colvin, C. R. (2000). The Riverside behavioral Q-sort: A tool for
the description of social behavior. Journal of Personality, 68, 451-489.
Gifford, R. (1991). Mapping nonverbal behavior on the interpersonal circle. Journal of
Personality and Social Psychology, 61, 279-288.
Gosling, S. D., Ko, S. J., Mannarelli, T., & Morris, M. E. (2002). A room with a cue: Personality
judgments based on offices and bedrooms. Journal of Personality and Social Psychology,
82, 379-398.
Hall, J. A. (1978). Gender effects in decoding nonverbal cues. Psychological Bulletin, 85, 845-
857.
Hall, J. A. (1984). Nonverbal sex differences: Communication accuracy and expressive style.
Baltimore, MD: Johns Hopkins University Press.
Hall, J. A., & Bernieri, F. J. (2001). Interpersonal sensitivity: Theory and measurement. NJ:
Erlbaum.
A Thin Slice 29
Hall, J. A., & Carter, J. D. (1999). Gender-stereotype accuracy as an individual difference.
Journal of Personality and Social Psychology, 77, 350-359.
Hall, J. A., Bernieri, F. J., & Carney, D. R. (2005). Nonverbal behavior and interpersonal
sensitivity. In J. A. Harrigan, R. Rosenthal, & K. R. Scherer (Eds.), Handbook of
nonverbal behavior research methods in the affective sciences. New York: Oxford
Izard, C. E. (1991). The psychology of emotions. New York: Plenum Press.
Kenny, D. A. (1994). Interpersonal perception: A social relations analysis. New York: Guilford.
Kenny, D. A., Albright, L., Malloy, T. E., & Kashy, D. A. (1994). Consensus in interpersonal
perception: Acquaintance and the big five. Psychological Bulletin, 116, 245-258.
Lippa, R., & Dietz, J. K. (2000). The relation of gender, personality, and intelligence to judges'
accuracy in judging strangers' personality from brief video segments. Journal of
Nonverbal Behavior, 24, 25-43.
Matsumoto, D., LeRoux, J., Wilson-Cohn, C., Raroque, J., Kooken, K., Ekman, P., Yrizarry, N.,
Loewinger, S., Uchida, H., Yee, A., Amo, L., & Goh, A. (2000). A new test to measure
emotion recognition ability: Matsumoto and Ekman's Japanese and Caucasian Brief
Affect Recognition Test (JACBERT). Journal of Nonverbal Behavior, 24, 179-209.
McClure, E. B. (2000). A meta-analytic review of sex differences in facial expression processing
and their development in infants, children, and adolescents. Psychological Bulletin, 126,
424-453.
Murphy, N. A., Hall, J. A., & Colvin, R. C. (2003). Accurate intelligence assessments in social
interactions: Mediators and gender effects. Journal of Personality, 71, 465-493.
Norman, W. T., & Goldberg, L. R. (1966). Raters, ratees, and randomness in personality
structure. Journal of Personality and Social Psychology, 4, 681-691.
A Thin Slice 30
Nowicki, S., & Duke, M. P. (1994). Individual differences in the nonverbal communication of
affect: The Diagnostic Analysis of Nonverbal Accuracy Scale. Journal of Nonverbal
Behavior, 18, 9-35.
Realo, A., Allik, J., Nõlvak, A., Valk, R., Ruus, T., Schmidt, M., & Eilola, T. (2003). Mind-
reading ability: Beliefs and performance. Journal of Research in Personality, 37, 420-
445.
Reynolds, D. J., Jr., & Gifford, R. (2001). The sounds and sights of intelligence: A lens model
channel analysis. Personality and Social Psychology Bulletin, 27, 187-200.
Rosenthal, R., Hall, J. A., Di Matteo, M. R., Rogers, P. L. & Archer, D. (1979). Sensitivity to
nonverbal communication: The PONS test. Baltimore, MD: The Johns Hopkins
University Press.Schmid Mast, M., & Hall, J. A. (2004). Who is the boss and who is not?
Accuracy of judging status. Journal of Nonverbal Behavior, 28, 145-165.
Tickle-Degnen, L., & Lyons, K.D. (2004). Practitioners’ impressions of patients with
Parkinson’s disease: The social ecology of the expressive mask. Social Science &
Medicine, 58, 603-614.
Vogt, D. S., & Colvin, C. R. (2003). Interpersonal orientation and the accuracy of personality
judgments. Journal of Personality, 71, 267-295.
Watson, D. (1989). Strangers' ratings of the five robust personality factors: Evidence of a
surprising convergence with self-report. Journal of Personality and Social Psychology,
57, 120-128.
Watson, D., Clark, L. A., & Tellegen, A. (1988). Development and validation of brief measures
of positive and negative affect: The PANAS scales. Journal of Personality and Social
Psychology, 54, 1063-1070.
A Thin Slice 31
Wonderlic, E. F. (1984). Wonderlic personnel test manual. Northfield, IL: Wonderlic &
Associates.
Zebrowitz, L. A., Hall, J. A., Murphy, N. A., & Rhodes, G. (2002). Looking smart and looking
good: Facial cues to intelligence and their origins. Personality and Social Psychology
Bulletin, 28, 238-249.
A Thin Slice 32
Author Note
Please address correspondence to Dana R. Carney ([email protected]) at the Department
of Psychology, Harvard University, 33 Kirkland Street, Cambridge, MA 02138, C. Randall
Colvin ([email protected]), or Judith A. Hall ([email protected]), both at the Department of
Psychology, Northeastern University, Boston, MA 02115. We would like to thank David Leng,
Jessica Federici, Lindsay Romo, Mahima Subramanian, Marybeth Philp, Alexia Mantzaris, Kari
Lyon, Taylor Anderson, Sarah Clarkson, Elizabeth Salib, Dannielle Keefe, and Kate Zayko for
help with data collection and processing. We would like to extend special thanks to Dawne Vogt
and Dan Warren for especially large contributions to various aspects of this project.
A Thin Slice 33
Footnotes
1 Such comparison is made doubly difficult by the fact that different studies report results
in incommensurable metrics, for example in terms of mean percentage accuracy versus the
correlation between ratings and a criterion. Within studies that use the correlation between
ratings and a criterion as the operational definition of accuracy, the magnitude of results can
further depend on whether accuracy was calculated per individual perceiver and then averaged
across perceivers, or the ratings were averaged across perceivers and then correlated with the
criterion (see Hall et al., 2005, for a discussion).
2 Because accuracy of judging affect and accuracy of judging personality traits are
typically scored using different metrics (percent accuracy vs. profile correlation, respectively),
even studies that include both may not be able to compare the two (e.g., Realo, Allik, Nõlvak,
Valk, Ruus, Schmidt, & Eilola, 2003).
3 The subset of individuals used in this study are a part of a larger data set that has been
used to answer questions unrelated to those asked in the current research (Vogt & Colvin, 2003).
4 For example, judge 1 rated targets 1-10 on four extraversion items. Judge 1’s four
ratings were then averaged for each target. Then, judge 1’s averaged ratings of extraversion for
targets 1-10 were correlated with target 1-10’s criterion extraversion scores (derived from an
average of self, friend, and parent’s NEO on the target). This correlation is a profile, or accuracy,
correlation indicating how accurate judge 1 is at making assessments of the rated targets’
extraversion.
5 Correlation coefficients are not normally distributed; thus, transforming them into
Fisher-z coefficients, which are normally distributed, circumvents a non-normality violation
which is an assumption in ANOVA and other statistical tests based on the general linear model.
A Thin Slice 34
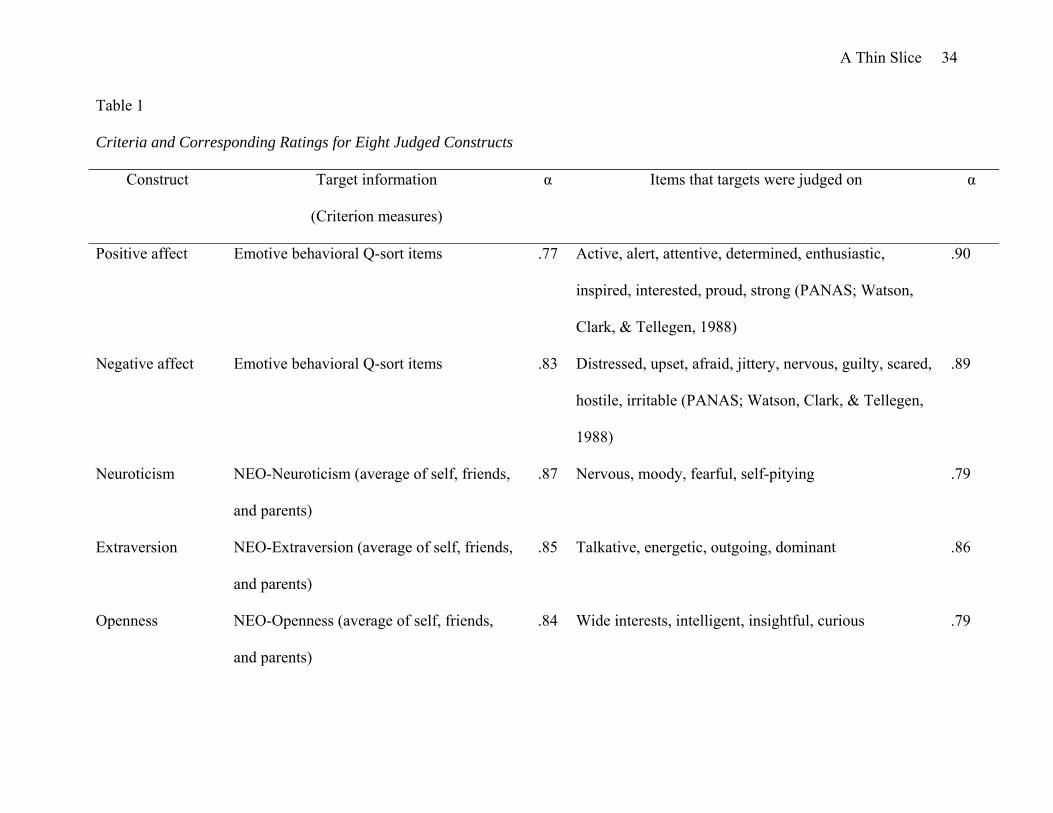
Table 1
Criteria and Corresponding Ratings for Eight Judged Constructs
Construct Target information
(Criterion measures)
α Items that targets were judged on α
Positive affect Emotive behavioral Q-sort items .77 Active, alert, attentive, determined, enthusiastic,
inspired, interested, proud, strong (PANAS; Watson,
Clark, & Tellegen, 1988)
.90
Negative affect Emotive behavioral Q-sort items .83 Distressed, upset, afraid, jittery, nervous, guilty, scared,
hostile, irritable (PANAS; Watson, Clark, & Tellegen,
1988)
.89
Neuroticism NEO-Neuroticism (average of self, friends,
and parents)
.87 Nervous, moody, fearful, self-pitying .79
Extraversion NEO-Extraversion (average of self, friends,
and parents)
.85 Talkative, energetic, outgoing, dominant .86
Openness NEO-Openness (average of self, friends,
and parents)
.84 Wide interests, intelligent, insightful, curious .79
A Thin Slice 35
Agreeableness NEO-Agreeableness (average of self,
friends, and parents)
.92 Sympathetic, kind, trusting, pleasant .80
Conscientiousness NEO-Conscientiousness (average of self,
friends, & parents)
.92 Dependable, conscientious, precise, practical .79
Intelligence Wonderlic score (performance measure) N/A Estimated IQ N/A
Note: No reliability coefficient for intelligence ratings was computed because there was only one item.
A Thin Slice 36
Table 2
Mean Accuracy for Different Constructs and Slice Lengths
Slice length Linearity test
Overall 5 s 20 s 45 s 60 s 300 s t
Positive affect .20*** .06 .28*** .25*** .20*** .26*** 1.49
Negative affect .32*** .31*** .35*** .31*** .33*** .28*** -.10
Neuroticism .21*** .14* .19*** .25*** .22*** .29*** 1.40
Extraversion .42*** .22*** .41*** .46*** .52*** .55*** 3.39**
Openness .17*** .10*** .22*** .20*** .16*** .21** 1.00
Agreeableness .11*** .04 .09* .12** .17*** .21** 1.91+
Conscientiousness .28*** .21*** .26*** .28*** .34*** .39*** 2.38*
Intelligence .22*** .24*** .20*** .22*** .24*** .21** .24
Overall (across construct) .25*** .17*** .25*** .26*** .28*** .31*** 2.81*
Note: Mean accuracy values were calculated using Fisher-z transformed accuracy correlations and were transformed back into r for
presentation. One-sample t-tests performed on the Fisher-z transformed accuracy scores were used to test correlations against zero. + p
< .10; * p < .05; ** p < .01; *** p < .001. Ns in each exposure-length condition (in order according to the table) are: 82, 74, 73, 77,
and 24. Linear weights were proportional to the slice length (-81, -61, -41, -26, +214).
A Thin Slice 37
Table 3
Significance Values for Paired-Samples Comparisons between Different Constructs
Construct PA
(M r = .20)
NA
(M r = .32)
N
(M r = .21)
E
(M r = .42)
O
(M r = .17)
A
(M r = .11)
C
(M r = .28)
IQ
(M r = .22)
PA .001 .82 .001 .18 .01 .001 .36
NA .001 .001 .001 .001 .112 .001
N .001 .30 .001 .01 .54
E .001 .001 .001 .001
O .09 .001 .08
A .001 .001
C .01
Note: PA = positive affect, NA = negative affect, N = neuroticism, E = extraversion, O = openness, A = agreeableness, C =
conscientiousness, IQ = intelligence quotient.
A Thin Slice 38
Table 4
Mean Accuracy at Different Slice Locations
Slice location
Construct First min Third min Fifth min
Positive affect .11a .21ab .26b
Negative affect .24a .31a .42b
Neuroticism .19a .18a .22a
Extraversion .29a .51b .41c
Openness .16ac .23ab .12c
Agreeableness .08a .12a .12a
Conscientiousness .20a .28ab .34b
Intelligence .11a .30b .26b
Note: Note: Mean accuracy values were calculated using Fisher-z transformed accuracy
correlations and were transformed back into r for presentation. Within a row, accuracy values
sharing subscripts are not significantly different whereas values with different subscripts are (p <
.05).
A Thin Slice 39
Table 5
Mean Accuracy for Combinations of Slice Length and Slice Locations
Slice location
Construct Slice
length
First
min
Third
min
Fifth
min
One-way ANOVA
Positive affect 5 s -.12 .12 .16 F(2, 79) = 4.85, p < .01
20 s .26 .16 .38 F(2, 71) = 2.72, p < .08
45 s .16 .21 .33 F(2, 70) = 2.50, p < .09
60 s .13 .37 .13 F(2, 74) = 4.97, p < .01
Negative affect 5 s .11 .37 .43 F(2, 79) = 5.95, p < .01
20 s .22 .38 .45 F(2, 71) = 4.44, p < .02
45 s .27 .25 .37 F(2, 70) = .95, p > .39
60 s .34 .21 .41 F(2, 74) = 2.12, p > .12
Neuroticism 5 s .07 .11 .22 F(2, 79) = .70, p > .49
20 s .25 .18 .15 F(2, 71) = .46, p > .63
45 s .16 .25 .32 F(2, 70) = .65, p > .52
60 s .27 .18 .20 F(2, 74) = .28, p > .75
Extraversion 5 s .02 .42 .19 F(2, 79) = 9.67, p < .001
20 s .15 .54 .51 F(2, 71) = 10.65, p < .001
45 s .44 .53 .41 F(2, 70) = 1.17, p > .31
60 s .50 .55 .51 F(2, 74) = .29, p > .75
Openness 5 s .21 .10 .00 F(2, 79) = 4.34, p < .02
20 s .12 .29 .25 F(2, 71) = 1.54, p > .22
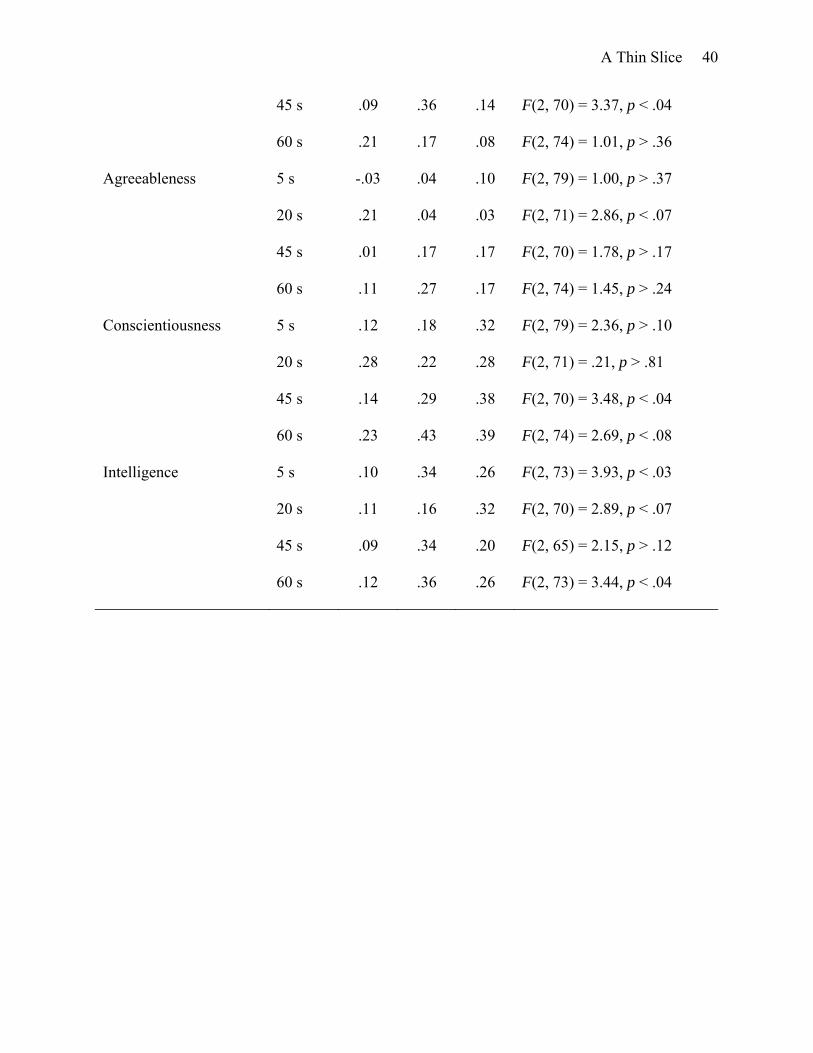
A Thin Slice 40
45 s .09 .36 .14 F(2, 70) = 3.37, p < .04
60 s .21 .17 .08 F(2, 74) = 1.01, p > .36
Agreeableness 5 s -.03 .04 .10 F(2, 79) = 1.00, p > .37
20 s .21 .04 .03 F(2, 71) = 2.86, p < .07
45 s .01 .17 .17 F(2, 70) = 1.78, p > .17
60 s .11 .27 .17 F(2, 74) = 1.45, p > .24
Conscientiousness 5 s .12 .18 .32 F(2, 79) = 2.36, p > .10
20 s .28 .22 .28 F(2, 71) = .21, p > .81
45 s .14 .29 .38 F(2, 70) = 3.48, p < .04
60 s .23 .43 .39 F(2, 74) = 2.69, p < .08
Intelligence 5 s .10 .34 .26 F(2, 73) = 3.93, p < .03
20 s .11 .16 .32 F(2, 70) = 2.89, p < .07
45 s .09 .34 .20 F(2, 65) = 2.15, p > .12
60 s .12 .36 .26 F(2, 73) = 3.44, p < .04