Embed Size (px)
Citation preview

A TRU-Zr Metal Fuel, Sodium Cooled,
Fast Subcritical Advanced Burner Reactor
W. M. Stacey, W. Van Rooijen, T. Bates, E. Colvin, J. Dion, J. Feener, E. Gayton,
D. Gibbs, C. Grennor, J. Head, F. Hope, J. Ireland, A. Johnson, B. Jones, N. Mejias, C. Myers, A. Schmitz, C. Sommer, T. Sumner, L. Tschaepe
Nuclear & Radiological Engineering Program Georgia Institute of Technology
Atlanta, GA 30332-0425 May, 2007
Keywords: advanced burner reactor, transmutation fuel cycle, sodium fast reactor
ABSTRACT
The design concept of a Subcritical Advanced Burner Reactor (SABR) is
described. SABR is fueled with transuranics (TRU) discharged from thermal reactors
cast into a TRU-Zr metal fuel pin and is cooled with sodium. The reactor operates
subcritical to achieve a deep-burn, 4-batch fuel cycle which fissions 25% of the TRU in
an 8.2 year residence time, limited by radiation damage accumulation (200 dpa) in the
ODS clad and structure. The annual TRU fission rate in SABR (3000 MWth) is
comparable to the annual TRU discharge of 3-5 1000 MWe LWRs, depending on the
plant capacity factor of SABR. A tokamak D-T fusion neutron source based on physics
and technology that will be demonstrated in ITER supports the subcritical operation.

2
I. INTRODUCTION
Closing the nuclear fuel cycle is the major technical challenge to the expansion of nuclear
energy to meet the world’s growing need for environmentally benign electrical power for the
remainder of the century. The DoE Global Nuclear Energy Partnership1 (GNEP) and Generation
IV Initiative2 (GEN-IV) are addressing this challenge by developing the nuclear technology to
minimize the long-lived transuranics (TRU) in spent nuclear fuel (SNF) that must be stored in
High Level Waste Respositories (HLWR) and to better utilize the potential energy content of the
uranium fuel resource. Specifically, the GNEP will develop a Consolidated Fuel Treatment
Center (CFTC) for separating the transuranics from the SNF discharged by Light Water Reactors
(LWR) to use as fuel in an Advanced Burner Reactor (ABR). The GEN-IV effort is focusing on
fast reactors that will be able to transmute the non-fissionable 238U (99.3% of natural uranium)
into fissionable transuranic isotopes (and on other advanced reactors for other missions).
The concept of separating the transuranics in SNF discharged from LWRs and using it as
fuel in fast (and thermal) reactors, with the primary motivation of reducing the long-lived
radioactive TRU isotopes in the waste sent to HLWRs was extensively investigated3-6 in the
1990s. The general conclusion of these investigations was that, by repeatedly reprocessing the
fuel and recycling the remaining TRU, the TRU in the waste ultimately sent to HLWRs could be
reduced by a large factor (>90%). Another conclusion was that the use of subcritical reactors that
could operate with highly burned fuel or with fuel consisting of the minor actinides (Am, Cm)
would be necessary to achieve >>90% burnup of the TRU.
Several conceptual designs and fuel cycle analyses of subcritical transmutation reactors
with an accelerator-spallation neutron source3-6 were investigated during the 1990s.
Subsequently, a series of conceptual designs and fuel cycle analyses of subcritical fast
transmutation reactors with tokamak D-T fusion neutron sources were developed at Georgia
Tech7-12. A general conclusion of these studies was that subcritical operation provides much
greater fuel cycle flexibility to achieve “deep burn” of a large quantity of TRU, hence to
significantly (i.e. by 1-2 orders of magnitude) reduce the HLWR repository requirements.
Our initial fast reactor design7 with a fusion neutron source was based on the metal fuel,
sodium cooled and lead-bismuth cooled fast reactor designs13,14 that had been developed for the
transmutation reactor design with an accelerator neutron source, but with a lead-lithium coolant in
order also to achieve tritium breeding. Then a series of helium cooled, TRU fueled fast reactor
designs8-10 were carried out to investigate the prospects for achieving deep burnup of the TRU in
TRISO fuel particles that could be then placed in the HLWR without further reprocessing.

3
Now, with the GNEP emphasis on early deployment of an ABR, the conceptual design of
a TRU metal fuel, sodium cooled fast Subcritical Advanced Burner Reactor (SABR) with a
tokamak D-T fusion neutron source is proposed, in order to take advantage of the added
flexibility for achieving deep burnup of the TRU provided by subcritical operation. Since the
fusion neutron source design15 is based on the physics and technology that has been developed for
and that will be demonstrated in the International Thermonuclear Experimental Reactor16 (ITER),
which will begin operation in 2017, the SABR is proposed as a possible second generation
Advanced Burner Reactor.
II. DESIGN OVERVIEW A. Configuration and Dimensions
The Subcritical Advanced Burner Reactor (SABR) is a subcritical, metal-fueled, sodium-
cooled, fast reactor driven by a tokamak D-T fusion neutron source. A simplified, three-
dimensional view of the design is shown in Fig. 1. The annular fission core surrounds the fusion
neutron source on the outboard side. The fission core and the plasma are surrounded first by a
combination of reflector and tritium-breeding blanket, then by a shield; the combined thickness of
these materials is 80 cm. Items not shown in the figure include the divertor below the plasma, an
emergency core cooling system above the core, coolant flow pipes, control rod drives above the
core, and other systems that were not developed in detail.
Figure 1. Configuration of the SABR

4
The primary objective of SABR is to transmute the transuranics in spent nuclear fuel in
order to reduce HLWR requirements. In the process power will be produced which will be
converted to electricity. . In order to reach this secondary objective a three loop cooling system is
employed, with sodium as the primary and intermediate coolant. The secondary loop, with water
as the working fluid in a Rankine cycle, will employ high and low pressure turbines to produce
power.
The 3.2 m core height shown in Figure 1 corresponds to the 2 m active length of the fuel,
a 1 m gas plenum, and a 20 cm reflector included within the fuel rod to reduce neutron leakage
into the plenum. The fuel pin is a 4 mm diameter, metallic TRU/Zr slug, clad in ODS steel with a
sodium bond. The outer diameter of the fuel pin is 7.26 mm. The reactor core consists of 918
hexagonal fuel assemblies, each containing 271 fuel pins. Sixteen assemblies contain enriched
boron carbide control rods.
Figure 2, which is the model used for neutronics calculations, shows the detailed
dimensions of the reactor. This model simplifies the actual geometry above and below the core
and plasma. For example, the shield configuration must allow for a divertor below the plasma
and control rod drives above the core. As seen in Fig. 2, the fission core is divided into four,
regions, each with an equal number of assemblies (for fuel shuffling). The detailed layout of the
assemblies and the batch arrangement is shown in Fig. 3. Every 750 days, the most burned batch
will be discharged, a fresh batch will be added, and the remaining assemblies will be moved.
The design for the toroidal tokamak neutron source is taken from a previous design9,10
and is a scaled down version of the ITER design16. The height of the plasma chamber is 3.76 m
and the width is 2.16 m. A divertor (not shown) is located below the plasma chamber. Sixteen
“D-shaped” superconducting toroidal field magnets surround the reactor. Each magnet is 5.4 m
in horizontal bore and 8.4 m in vertical bore, with radial thickness of 43 cm and toroidal thickness
of 36 cm. This leaves approximately one meter of free space for access between the shield and
the magnets on the top and outboard. The superconducting central solenoid magnet has an inner
radius of 94 cm and a thickness of 70 cm.

5
Figure 2. Cross section SABR calculation model
Figure 3. 4-Batch Layout of Fuel Assemblies

6
B. Major Parameters and Materials
Table 1 gives a summary of the major parameters and materials used in the SABR design.
The isotopic composition of the transuranic fuel is given in appendix A. All other materials are
commercially available items. Unless otherwise noted, all structural material is ODS (MA 957)
steel.
Table 1. Major Parameters and Materials of the SABR
Fission Core Fission Power 3000 MWth TRU Fuel Composition (wt./o) Pu-40, Am-10, Np-10, Zr-40 Fuel Density 9.595 g/cm^3 Mass of TRU/ Fuel Material 36 MT/ 60 MT Specific Power 83.3 kWth/ kg TRU Maximum keff 0.95 Major Dimensions Rin = 5 m, Rout = 5.62m, Hactive =2 m Fuel Pin #=248,778, Dfm = 4.00 mm, Do = 7.26 mm Coolant mass flow rate, Temperature •
m = 8700 kg/s, Tin/Tout = 377/650 °C Power Density, Maximum Tfuel / Tclad q'''=72.5 MW/m3, Tfm, max = 715°C, Tclad,max=
660°C Linear Fuel Pin Power 6 kW/m Clad, wire wrap, and flow tube ODS ferritic steel, t = 0.5mm, 2.2mm, 2.0mm Fuel/Clad,Gap,LiNbO3/Structure/Coolant (v/o) 15/35/14/36 Fuel Assembly #=918, Hexagonal, Dflats=15.5 cm, Dside = 8.95
cm Reflector, Blanket, and Shield
Reflector / Shield Materials ODS Steel, Boron Carbide, Tungsten, Na cooled
Tritium Breeder Li2SiO4 Combined Thickness 80 cm Tritium Breeding Ratio 1.16 Coolant mass flow rate •
m = 0.2 kg/sec Min and Max blanket temperatures Tmin= 450°C/ Tmax= 640°C Plasma1
Plasma Current 8-10.0 MA
Fusion power/ neutron source rate (50-500 MW)/(1.8e19 s-1 to 1.8e20 s-1)
Fusion gain (Qp = Pfus/Pplasma heating) 180 MWth/58 MWth = 3.2
Superconducting Magnets1
Field CS, TFC, at center of plasma 13.5 T, 11.8 T, 5.9 T TFC Magnet Dimensions w = 5.4 m , h = 8.4 m, trad = 43 cm, ttor = 36 cm Divertor
Materials Tungsten, CuCrZr, Na cooled

7
Heat Flux 1-8 MW/m2 Coolant mass flow rate
•
m = 0.09 kg/sec First Wall Materials Beryllium on ODS, Na cooled Surface Area 223 m2
Average Neutron wall load (14 MeV) 1.0 MW/m2
Average Heat flux (500 MW) 0.25 MW/m2
Coolant mass flow rate •
m = 0.057 kg/sec
C. Calculation of Fuel Loading
The SABR is designed to be operated as a sub-critical, source driven reactor, and the
maximum value of keff, which will occur for initial startup with fresh TRU fuel in all assemblies,
is specified to be no more than 0.95. To determine the amount of fuel necessary to achieve this
multiplication, the core was modeled using the 3D continuous energy Monte Carlo code MCNP17,
with temperature corrected cross sections generated with NJOY18 from ENDF/B-VI.6 and –VII
libraries19. Using the core dimensions in Table 1, it was determined that 36 MT of transuranics
(60 MT of Zr40/Pu40/Am10/Np10 fuel) was necessary to achieve keff = 0.95 for all fresh fuel.
The reactivity decrease due to fuel burnup will be compensated by increasing the neutron source.
D. Fabrication and Reprocessing
The fuel will be fabricated through arc casting and will be reprocessed using
pyrometallurigical reprocessing. A single arc casting facility can annually fabricate
approximately 60,581 fuel pins containing a total 8760 kg TRU. Pyroprocessing is based on the
use of high-temperature fused chloride salts to melt the fuel, along with electro-refining
techniques to separate the transuranics and fission products. Pyroprocessing is specifically suited
for metallic fuels. A key benefit of pyroprocessing is that the actinides are never separated, but
are instead recycled as one group, making them highly proliferation resistant.
E. Component Lifetime
The length of time that the reactor can operate continuously is determined by the
expected time-to-failure of the various components. Interactions with fast (>0.1 MeV) neutrons
cause atomic displacements, transmutation of atoms, and hydrogen and helium gas production
within the fuel pin and other components. These damaging effects determine how long essential
reactor components such as cladding, fuel, first wall, and magnets can remain in operation. Using
a damage limit of 200 displacements per atom for ODS steel, the radiation damage lifetime of the
8
clad and fuel assembly structure is found to be somewhat more than 8 years. This places an
upper limit of 3000 days on the fuel residence time. The first wall is found to have a radiation
damage lifetime of somewhat more than eight years. Therefore, it will have to be replaced
several times over the life of the reactor. The shield is designed so that the magnets will not have
to be replaced during the lifetime of the reactor.
F. Transmutation, Electrical and Safety Performance
As mentioned previously, the primary purpose of the SABR is to burn the transuranics
produced by LWRs to reduce the requirements for high level waste repositories. The SABR is
successful in this goal as it achieves a transmutation rate of 1.06 MT of TRU per full power year.
The annual production of SNF in the United States is approximately 2000 MTU/year6 for
approximately 100,000 MWe. Of this, only one percent is transuranics20. This means that on
average one 1000 MWe LWR discharges 0.2 MT of TRU per year. The support ratio for SABR
is determined by the transmutation rate and the availability of the reactor. At 100 (60)%
availability the SABR can burn the TRU discharged annually from five(three), 1000 MWe
LWRs.
The SABR fission core produces 3000 MW thermal power. The gross power produced by
the turbine in the final loop is 1049 MWe. Some of this power will be reused by the system to
power supporting systems, such as the coolant flow pumps and plasma heating source. The
power required to operate the fusion neutron source is 90 MWe10. Total power required to run all
pumps in the system is 7.65 MWe. Heaters take up an additional 30 MWe on a Rankine cycle.
Therefore the net electrical power produced is 921 MWe. This corresponds to a 30.7 % net
efficiency for the plant (conversion efficiency was not a design priority, and this value could
certainly be increased).
Dynamic simulations indicate that accidental reduction in coolant flow by up to
2 3≈ could be passively tolerated without sodium boiling or fuel melting, and that tens of
seconds would be available to prevent sodium boiling or fuel melting by control action--
neutron source termination or control rod insertion--for larger reductions in coolant flow.
III. FUELS
A. Metal TRU Fuel
Fuel candidates for transmutation design can be divided into two groups based upon the
type of reprocessing that they require. The first group consists of oxide, nitride, and carbide fuel
types that are reprocessed using aqueous methods. The second group consists solely of metal

9
fuels which are reprocessed using pyrometallurgic processes. The decision for fuel type was
therefore contingent on both fuel type and reprocessing method. Current research in the U.S. for
transmutation reactor designs with high minor actinide content indicates that the nitride and metal
based fuel elements are the frontrunners.21 Therefore only nitride and metal fuels were considered
for use in the SABR. Nitride fuels have been successfully irradiated up to 5.5% burn up in
JMTR22 while metal fuels have been successfully irradiated up to approximately 20% in EBR-II.23
Both candidates show excellent fission gas retention21,22 and both have excellent thermal
conductivities. 22,24
A major factor in the fuel choice decision was that the aqueous reprocessing associated
with nitride fuel was determined to be inferior to pyroprocessing. The two main advantages of
pyroprocessing are that the process is proliferation resistant and can be accomplished with an on-
site facility which reduces the costs and associated risks of transporting the spent fuel from the
reactor.25 The disadvantages associated with using aqueous reprocessing methods include large
amounts of high activity fission product-bearing aqueous and non aqueous wastes, the necessity
of large production sites and production scale equipment, and proliferation concerns due to the
ability of the process to generate highly purified and separate uranium and plutonium.23 Also,
there are recovery issues concerning 15N-enriched gas when using aqueous reprocessing with
nitride fuel.22
Metal TRU-Zr fuel is proposed for the liquid sodium cooled SABR. The fuel will have a
weight percent composition of 40Zr-10Am-10Np-40Pu. This fuel type is currently being
developed at Argonne National Laboratory for use in the U.S. advanced fuel cycle initiative.24 In
general, metal fuel has properties that prove favorable for applications with priority of high burn
up of TRU, including high thermal conductivity, the ability to accommodate a high actinide
density, and the ability to be directly fed into pyroprocessing and refabrication facilities.21
Zirconium is selected as the alloying element because it has been successfully fabricated
and reprocessed. In addition, metal fuel dispersed in a zirconium matrix has demonstrated
excellent radiation resistance.27 The inclusion of zirconium in the metal composition raises the
alloy solidus temperature, provides resistance between clad and fuel interactions,28 provides
dimensional stability during irradiation,29 and provides the possibility of a negative Doppler
coefficient in TRU fuel that is free of 238U.
B. ODS Steel Cladding
Both ferretic and oxygen dispersion strengthened ferretic steel were considered for the
cladding material. Oxygen dispersion strengthened (ODS) ferretic steel was favored on the basis

10
that ODS steels are mechanically superior, have much better resistance to thermal creep at higher
temperatures, and are compatible with both the fuel and liquid sodium.26,30,31 MA957, a
mechanically alloyed and commercially available ODS steel developed by INCO Metals, was
chosen for the reference cladding material. Several experimental ODS steels undergoing
development may show better mechanical properties than MA957 (Table 2), however, at the
present time, MA957 has endured a much more comprehensive battery of tests for suitability in a
fast reactor setting.32,33
Table 2: Properties of MA957
Density 7.3 g/cc (300 K) Melting Point 1800 K Recrystallization Temperature 1620 K Ductile to Brittle Transformation 220-330 K Linear Coefficient of thermal expansion 1.4x10⁻⁵/ K (650 C) Thermal Conductivity 20 W / m K (650 C) Specific Heat 600 J/ kg K (650 C) Composition by weight percent – Fe-84.55 Cr-14 Ti-.9 Mo-.3 Y2O3-.25
C. Fuel Element Design
The fuel pin design is determined by the requirement to provide enough fuel to enable
SABR to produce 3000 MWth over a 4-batch burn cycle and by the thermal and structural
limitations of the materials. To aid in the choices of pin design, similar reactors with sodium
cooled, metal fuel designs such as the HYPER34, JAERI35, and ALMR36 were reviewed. The
dimensions were chosen such that the operating temperature of the clad should not exceed 700°C
anywhere in the core. Temperatures above this point in stainless steels have been found
experimentally to have unacceptable stresses caused by fuel swelling and fission gas buildup37.
Fuel swelling and fission gas buildup must be accounted for to prevent the clad from expanding
or rupturing. Coolant flow area must be large enough to cool the core and keep velocity below 8
m/s to prevent structural vibration37.
The starting point of the design was the fuel choice of Pu-10Am-10Np-40Zr, which is
being developed at Argonne National Laboratory (ANL). The ANL reports21 used a 4 mm
diameter fuel pin and a 0.455 mm clad thickness. As a result, this was chosen to be the diameter
of the fuel material in this design. The clad thickness was increased slightly to 0.5 mm. This
value is within the range of values used for JAERI35 (0.3 mm ODS), ALMR36, (0.5mm HT9), and
HYPER34 (0.7 mm HT9). Neutronics calculations discussed in section IV were made to
determine the amount of fresh fuel needed for a keff of 0.95. These calculations combined with

11
the constraints listed above led to an active fuel length choice of 2.0 m. This gives a modest linear
power density of 6 kW/m (45 kW/m is more typical of fast reactors).
A critical issue that is linked with transmutation fuels is the high helium generation rates
due to the alpha decay of 241Am. This helium gas production substantially increases the plenum
requirements of the fuel pin and can cause substantial fuel swelling21. The fission gas plenum for
this reactor is based on the findings of the Korean HYPER design. With a similar TRU fuel and
clad thickness, it was found that the cladding strain values are 3.3, 3.1, and 3.01 % at 30 atomic
percent burnup for the 0.5, 1.0, and 1.5 plenum-to-fuel ratio, respectively38. The limiting value of
the strain is normally taken to be 3.0% for HT9 steel38. Therefore it is recommended that a 1.5
plenum to fuel ratio is used. ODS steels, however, are expected to outperform HT9 in fast
reactors at high temperatures. In view of the fact that the strain values vary only slightly between
the cases and increasing dimensions comes with such a high cost, this design will use a modest
plenum-to-fuel ratio of 1.0. This corresponds to a 1.0 m plenum on top of the core. The plenum
is initially vacant space and gradually becomes filled with gas as the fuel is irradiated.
Nuclear fuel swells as it is fissioned due to the quantum mechanical nature of atoms
occupying approximately the same volume (10-29 m2) regardless of mass37. To allow room for
fuel expansion due to solid fission products, a large fuel to clad gap size is designed for beginning
of life. A typical design is for the fuel to occupy 75% of the cross-sectional area of the interior
tube21. This allows the fuel volume to increase by approximately 30% before coming into contact
with the clad. However, for this reactor, the gap size is nearly doubled to be conservative. This
also allows the gas plenum volume to be larger with minimal length. The gap is filled with
sodium, instead of helium, to increase conductivity across the gap. This is necessary due to the
high coolant outlet temperature and the relatively low melting temperature of the fuel. If a
helium gap can be used, it would not be necessary to have the one meter long fission plenum
above the rods, as the gases would be free to fill the radial gap space. Ultimately, the design
decision is a tradeoff that must be optimized depending on the specific design objectives. The
actual amount of fuel expansion cannot be determined without experiments, but this design is
expected to be conservative. The fuel pin design parameters are given in Figs. 4 and 5 and in
Table 3.
LiNbO3 t=0.3 mm
ODS Clad t=0.5 mm
Na Gap t=0.83 mm
Fuel R=2 mm
12
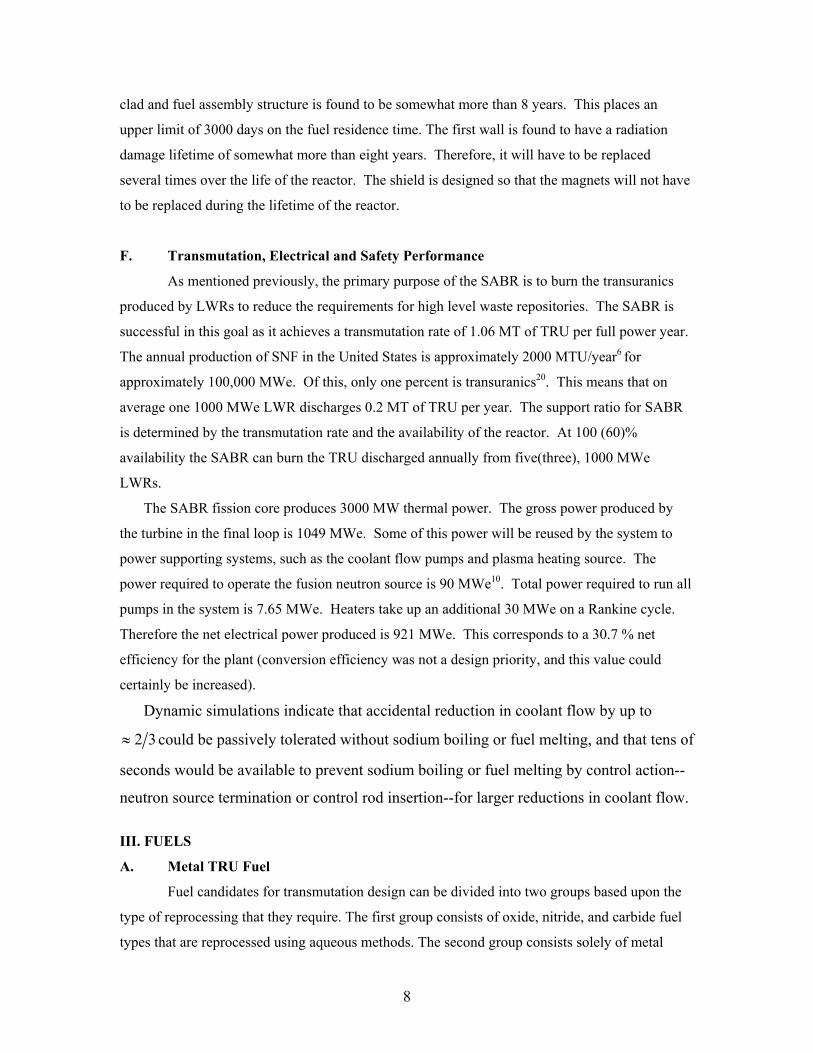
Figure 4. Cross-Sectional View of Fuel
Figure 5. Axial View of Fuel Pin
Table 3. Key Design Parameters of Fuel Pin and Assembly
Length rods (m) 3.2 Total pins in core 24877
8Length of fuel material (m) 2 Diameter_Flats (cm) 15.5Length of plenum (m) 1 Diameter_Points (cm) 17.9Length of reflector (m) 0.2 Length of Side (cm) 8.95Radius of fuel material (mm) 2 Pitch (mm) 9.41Thickness of clad (mm) 0.5 Pitch-to-Diameter ratio 1.3Thickness of Na gap (mm) 0.83 Total Assemblies 918Thickness of LiNbO3 (mm) 0.3 Pins per Assembly 271Radius Rod w/clad (mm) 3.63 Flow Tube Thickness (mm) 2Mass of fuel material per rod (g) 241 Wire Wrap Diameter (mm) 2.24
VolumePlenum / Volumefm 1Coolant Flow Area/ assy (cm2) 75
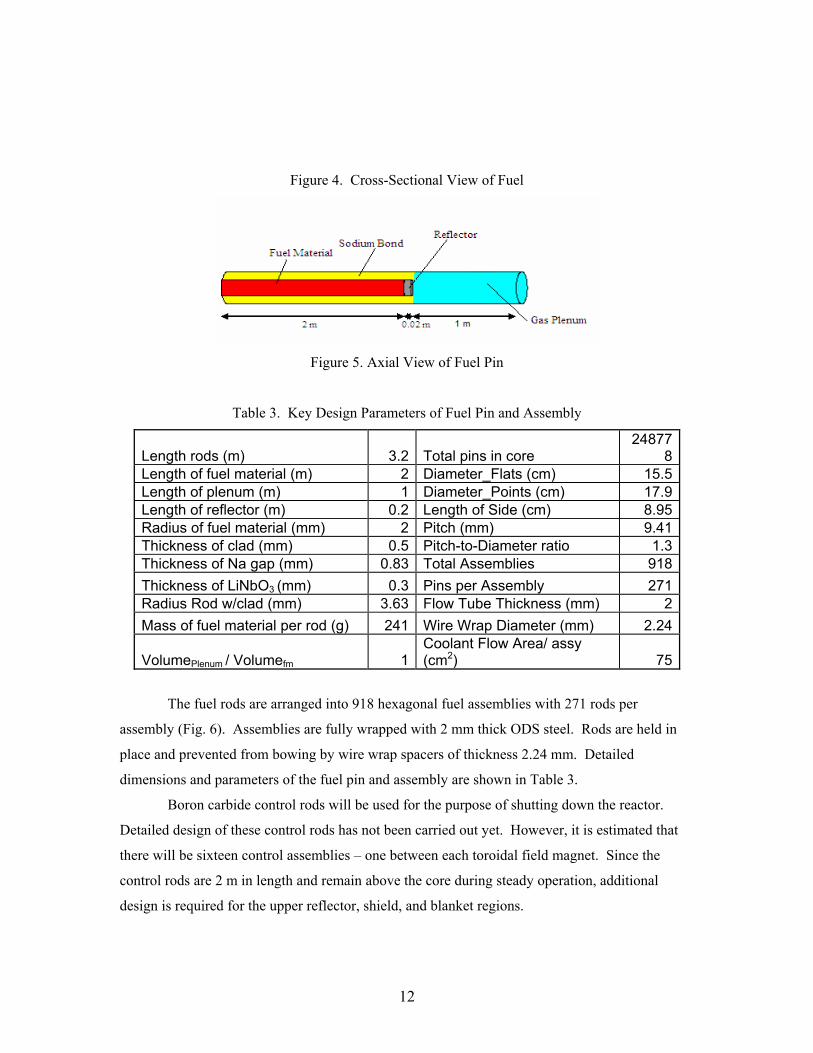
The fuel rods are arranged into 918 hexagonal fuel assemblies with 271 rods per
assembly (Fig. 6). Assemblies are fully wrapped with 2 mm thick ODS steel. Rods are held in
place and prevented from bowing by wire wrap spacers of thickness 2.24 mm. Detailed
dimensions and parameters of the fuel pin and assembly are shown in Table 3.
Boron carbide control rods will be used for the purpose of shutting down the reactor.
Detailed design of these control rods has not been carried out yet. However, it is estimated that
there will be sixteen control assemblies – one between each toroidal field magnet. Since the
control rods are 2 m in length and remain above the core during steady operation, additional
design is required for the upper reflector, shield, and blanket regions.
13
Figure 6. Cross-Sectional View of Fuel Assembly
D. Reprocessing
Pyrometallurgical reprocessing has been identified as the most appropriate means of
reprocessing for the selected metal TRU-Zr fuel. This process is based on the use of high-
temperature fused chloride salts to melt the fuel, along with electrorefining techniques to separate
the transuranics and fission products39,40 It was considered along with the aqueous PUREX
reprocessing, however pyroprocessing was deemed most appropriate. It has been shown to be
especially suited for use with advanced fuels such as the TRU-Zr fuel employed here. 21,22,24 In the
case of metallic alloy fuels, the PUREX process is more cumbersome and costly, since the
irradiated fuel is brought from the metallic state to an aqueous solution, processed and then
converted again to metal through a number of reconversion steps. The pyrochemical reprocessing
method, on the other hand, directly yields metal as the product.41 A wider temperature range is
available to amplify the differences in the thermodynamic stabilities that control the separation
factors.39,41 Ability to accommodate short cooled and high burn-up fuels due to the higher
radiation stabilities of non-aqueous reagents makes pyroprocessing especially suited for
reprocessing of fast reactor fuels.
Proliferation resistance is one of the most attractive qualities of pyroprocessing. 39,41,42
The Pu is never separated from the highly radioactive minor actinides, which is important for
proliferation resistance because the fission products are short-lived and their gamma contribution
to 1kg of TRU metal decreases to below self-protection levels two years after being discharged. 39

14
Another attractive quality of pyroprocessing in terms of non-proliferation lies in that all of the
reprocessing facilities can be located on-site, localizing problem areas, reducing diversion paths,
and simplifying accountability. 40,42
Pyroprocessing separates the spent fuel by means of high temperature molten salts and
electrolytic separation. 40 The metals in the fuel rod are dissolved in the high temperature melt,
then oxidized into chloride complexes. In the next process, the highly reactive metals are
electrochemically deposited on the electrodes as voltage is applied.43. Figure 7 shows a flow chart
of the facilities involved in pyroprocessing
.
Figure 7. Flowchart of Pyroprocessing Facilities43
Pyrochemical reprocessing has been used only on a limited basis for making metal fuel
for EBR I & II. However, significant research and development has being performed at Argonne
National Lab.21, 27 At this time there is no industrial scale experience with metal fuel,
pyroprocessing, or the reprocessing of fast reactor fuel 43
The estimated pyroprocessing actinide recovery rates are given in Table 4.
LWR Spent Fuel
Oxide Reduction
Electrorefiner
Cathode Processor
Melting Furnace
Zeolite Columns Furnace
High Level Waste
Fabrication of New
Fuel
Metal Waste
MetalOxide
MetalSalt
TRUs+
salt
Zeolite +
fission products
Ceramic Waste
Cladding + Fission Products
Salt

15
Table 4. Pyrochemical Reprocessing Recovery Rates
Element Amount Present in Fuel
(%) Estimated Amount
Recovered (%)
Pu 40 99.85
Np 10 99.85
Am 10 99.97
Zr 40 99.95
E. Fabrication
Fabrication of the TRU-Zr metal fuel will be accomplished through arc casting, which is
a modified form of melt casting designed to allow the incorporation of actinides. Melt casting is
currently used to fabricate Plutonium and Uranium metal rods and possesses numerous attractive
qualities.44 Melt casting is an already established procedure that provides consistent results as
well as being easily controllable. The process uniformly distributes the alloy so that the rods are
homogenous and have identical compositions. Melt casting is very fast, with the actual casting of
the fuel pins occurring in less than a second. Casting also allows for hundreds of fuel rods to be
cast at a time, which minimizes the time necessary to fabricate an entire batch of fuel.44
An understanding of the casting method currently employed is beneficial to the
understanding of the arc casting method. In melt casting, the alloy is melted down in a large
holding tank, called a crucible. Hollow quartz glass rods are suspended in a depressurized
chamber above the crucible, serving as the molds for the fuel pins. Quartz glass is chosen because
it is stable at casting operating temperatures and it does not interact with the fuel materials. When
the alloy reaches the desired temperature, and is sufficiently homogenized, the quartz rods are
evacuated into the molten alloy. The casting chamber is then rapidly pressurized and the pressure
gradient causes the alloy to rapidly fill the quartz molds. The filled quartz rods are then removed
and the metal is allowed to cool.45
The primary concern when fabricating fuel with high actinide content is the susceptibility
of low vapor pressure actinides to rapid vaporization during the lengthy processes of melting the
alloy and transporting the alloy throughout the furnace.46 Using the standard casting method,
Americium loss of greater than 40% has been measured.47 This loss can be minimized by
decreasing the melt and transport time of the molten metal so that the low vapor pressure
actinides don’t have sufficient time to escape, but this remains an issue for the fabrication
process.

16
Arc casting is very similar to the standard melt casting method but with two alterations
designed to minimize the loss of actinides to vaporization. First, arc casting uses a low voltage,
high current arc to rapidly melt the alloy on the order of 5-20 seconds. The significantly
decreased time to melt the metal alloy does not give the actinides enough time to escape.21 The
alloy is homogenized using a series of melts. The second major alteration is that the cast is
dropped into the quartz glass molds, which are now stored below the arc furnace. Arc casting has
been studied at Argonne National Laboratory for Pu-10Np-10Am-40Zr fuel. Laboratory scale
tests have been done to test the ratio of the Americium to Zirconium content in the melt before
casting and in the cast rods and a ratio of close to one has been achieved.48
Arc casting has been successfully completed at the laboratory level to fabricate rods for
testing purposes, but the procedure is not believed to be reasonable for large scale batches.
Therefore, the batch sizes will have to be small. In order to maximize the throughput of
transmutation fuel, the fabrication process will be automated. An automated process can be
achieved by using commercially available equipment and constructing a hot cell. The hot cell
would require robotic equipment, such as the Wälishmiller robot, the equipment necessary to
manufacture the rods, camera systems, and wireless communication systems.49 The hot cell
would be configured like an assembly line with various checkpoints to ensure the quality of the
fuel. After casting, the rods would be mechanically sheared so that they are all the desired length.
They will then be measured, weighed, and chemically analyzed. Then, enough sodium to fill the
gap between the fuel and cladding will be placed into the clad jacket and heated in a low
temperature furnace. The fuel rod will then be capped and welded shut. Each fuel element will
then be checked for leaks to ensure weld quality. Also, the elements will be x-rayed to certify that
the sodium wets all necessary surfaces and that no bubbles are present. A flow sheet of the
fabrication plant is displayed in Fig. 8.
The batch sizes may not contain more than 3 kg TRU because of criticality concerns.50
Casting and cooling the rods requires the longest time of any step in the cycle and is estimated to
take two hours while the remaining fabrication steps should take under two hours.50 Assuming a
facility down time of 1/3 with 24 hour production, one facility could process approximately 8760
kg/yr. This is approximately 45% of the 20 tons of transuranics that are produced annually by 100
GWe of LWRs in the U.S.6,51 Using the proposed fuel dimensions, density and compositions for
SABR there are 241 grams TRU per pin, which means 60,581 fuel pins could be produced
annually. The initial fuel loading in SABR, which includes four batches of fuel, requires a total of
248,778 rods. Therefore, approximately four facilities based on arc-casting technology would be
necessary to produce the fuel in a one year time frame (or one facility would require 4 years). As

17
a result, new casting methods with larger batch size capabilities should be investigated. Currently
a new method to cast the rods called induction casting is being investigated which would allow
for the larger batch sizes necessary for large scale production. Induction casting is basically an
extrapolation of the arc casting design. The method requires that the materials flow as solid
materials and powders instead of as a molten alloy until they are quickly melted and cast.52
Figure 8. Flowchart of Fabrication Facilities IV. NUCLEAR
A. Neutronics Models
The fission core is an annulus, with dimensions given in Table 1. The primary codes
used to model the neutronics characteristics of this core were the multidimensional multi-group
spherical harmonics code EVENT53 and the 3D continuous energy Monte Carlo code MCNP17.
Due to the annular symmetry of the reactor, only a two dimensional r-z model was used for
EVENT. The CSAS54 sequences were to create cross section libraries for use in EVENT, and
calculations were performed using a 5th order (P5) spherical harmonic approximation and both the
standard Scale 238-group energy structure and a reduced 27 group energy structure. This 27
group structure ranged from 0.1 meV to 20 MeV, with 20 fast groups above 10 keV. For the
MCNP model, cross sections were generated using NJOY15 to Doppler broaden the ENDF/B-VI.6
and –VII zero Kelvin libraries19. In the following sections “beginning of life” refers to fresh TRU
fuel in all locations, and “beginning of cycle” and “end of cycle” refer to the beginning and end
of the equilibrium fuel cycle in the in-to-out fuel shuffling scheme to be discussed in section VI.
Casting
Preparations
Arc Casting
Furnace
Fuel Pin
Assembly
Sodium Bonding Furnace
End Cap Welder
Inspection 2 Validates Weld and Na Bond
Integritiy
Fuel Pin Storage/ Cooling
Inspection 1 Rods are sheared,
weighed, and chemically analyzed
Reprocessed Fuel Materials
Finished Rods Sent To Reactor
18
B. Neutronics Properties
Multiplication constant
The SABR is designed to operate at a constant fission power level of 3000 MWt. To
compensate for the effects of burnup and fuel loading, the fusion power will be modulated as
necessary to modulate the neutron source to maintain this power level. The fusion power
required depends on the neutron multiplication of those source neutrons within the core. The
fusion neutron source must be able to accommodate the associated decrease in neutron
multiplication as the fuel is depleted. If M is the overall multiplication of source neutrons within
the fission core, then km=1-1/M is the multiplication constant of those neutrons. Pfus is then given
approximately by
fism
m
fis
fusfus P
k)k(
υEE
=P−
⋅1
(1)
For D-T fusion and actinide fission, Efus=17.6 MeV and Efis=197 MeV, and an effective ν was
calculated by MCNP to be 2.98. For fresh fuel with a km=0.95, Pfus = 42 MW is required.
Because the fusion neutron source can produce up to Pfus = 500 MW, the reactor can be operated
with a km as low as 0.615.
Energy spectra
The neutron energy spectra are shown in Fig. 9 for beginning of cycle with all fresh fuel
in all four core regions (see Fig. 2 for location) and in the tritium breeding blanket. The larger
low energy flux in region 1, closest to the fusion neutron source, is due to neutrons reflected from
inboard of the neutron source across the plasma into the core.

19
.
Figure 9: Energy Spectrum
Control rod worth
Shutdown control of the reactor will be accomplished using a set of boron carbide control
rods. As there are 16 gaps between the magnets of the SABR, it is logical to use 16 control
assemblies spaced evenly throughout the reactor. The removal of 16 assemblies of fuel material
from the reactor causes less than a 1% change in keff. The worth of 16 control rod assemblies,
each with a B4C mass of 10 kg, was calculated to be roughly 9 dollars (β ~ 300 pcm). Higher or
lower overall worths can be easily accommodated if needed.
C. Reactivity Coefficients
The Doppler and sodium voiding coefficients of reactivity are traditionally the most
important in sodium cooled fast reactors. The absence of 238U in pure TRU fuel will tend to make
the Doppler temperature coefficient less negative than in previous designs, or even positive, an
effect which is offset somewhat by the zirconium matrix material in the fuel. The narrow, tall
annulus design of the SABR was chosen to maximize the negative leakage component of the
sodium void worth.
Doppler temperature coefficient of reactivity
The EVENT code was used to calculate the Doppler coefficient, using data files
generated in SCALE55 . Cases were run every 100K from an average fuel temperature of 535K to

20
1135K for the Doppler coefficient. A cladding temperature of 621K and a coolant temperature of
600K were used in all calculations. Cases were run for the beginning of life, where all fuel is
fresh, and to the beginning and end of the equilibrium fuel cycle (see section VI).
The Doppler coefficient ( )( )2 1 1 2 /T k k k k Tρ ∆ = − ∆ was calculated using the keff
from EVENT for fuel temperatures differing by 100K. For example, k1 for the first point
corresponds to 535K and k2 corresponds to 635K, with ∆T = 100K, and the point is plotted at
585K. The results are shown Fig. 10. The Doppler coefficients are very small, but generally
negative, indicating the near cancellation of the positive contributions of 239Pu and 241Pu with the
negative contributions of 240Pu, the minor actinides and the zirconium. Similar calculations made
with MCNP, with cross sections Doppler-broadened using NJOY, yielded similar magnitude but
positive Doppler coefficients; however the statistical error was larger than the magnitude of the
coefficient.
-4.0E-06
-3.5E-06
-3.0E-06
-2.5E-06
-2.0E-06
-1.5E-06
-1.0E-06
-5.0E-07
0.0E+00
500 600 700 800 900 1000 1100 1200
Average Fuel Temperature (K)
Dop
pler
Coe
ffici
ent (
1/K
)
Beginning of LifeBeginning of CycleEnd of Cycle
Figure 10: Doppler Coefficient vs Average Fuel Temperature
Sodium voiding worth
The sodium density reactivity ( )2 1 1 2k k k kρ = − was determined relative to the
nominal density, where k2 corresponds to the keff from EVENT corresponding to the reduced
sodium density and k1 corresponds to the keff for the nominal sodium density. These calculations
assume a nominal average fuel temperature of 735K, a nominal average cladding temperature of

21
621K, and a nominal coolant and gap temperature of 600K. The results are shown in Fig.11. The
sodium voiding worth is positive and approximately linear with decrease in sodium density.
0.0E+00
2.0E-03
4.0E-03
6.0E-03
8.0E-03
1.0E-02
1.2E-02
1.4E-02
1.6E-02
0 20 40 60 80 100
% Nominal Na Density
rho
Beginning of LifeBeginning of CycleEnd of Cycle
Figure 11: Sodium Voiding Reacivity
An attempt to confirm these reactivity calculations using MCNP with cross sections
processed using NJOY was unsuccessful because the statistical uncertainty in keff was too
large.
D. Tritium Production
The SABR design must be tritium self-sufficient with respect to fueling the D-T fusion
neutron source. Lithium silicate was chosen for the breeding material because of its high lithium
atom density and low probability of hydroxide formation, a safety consideration. Lithium has
two naturally occurring isotopes, 93% lithium-7 and 7% lithium-6 which has a large lower-energy
(n,α) cross section. As indicated in Fig. 2, a natural lithium blanket was placed around the plasma
neutron source and a blanket enriched to 90% in lithium-6 was placed around the fission core.

22
The requirement for tritium self-sufficiency over a nominal 750 day burn cycle, with
enough excess tritium to start up the neutron source after a 60 day shutdown for fuel shuffling
and to fuel it for one week into the next burn cycle, was taken as a design objective.
Previous experience9 indicates that a tritium breeding ratio (ratio of tritium production
rate by neutron capture in lithium to fusion neutron source rate) of about 1.1 is sufficient to meet
this requirement. The 27 group EVENT calculation of TBR, using cross-sections generated with
NJOY, yielded a TBR of 1.16.
An independent time-dependent tritium inventory calculation was performed with
ORIGEN-S, using fluxes calculated by EVENT. This calculation indicated that the amount of
tritium needed at the beginning of the burn cycle is 64 kg and that 69.8 kg of tritium would be
present at this time.
E. Shield Design
The purpose of the radiation shield is to attenuate the neutron and gamma radiation in
order to limit radiation damage to the TF magnets and to limit the activation of external reactor
components to levels which permit personnel access within a reasonable period after shutdown.
The maximum allowable dose limit56,57 to the superconducting magnet insulators is estimated at 1
x 109 rads for organic insulators, and 1 x 10¹⁰ rads for ceramic insulators. The maximum
allowable fast neutron fluence to the superconductor is in the range57,58 of 5x10¹⁸ n/cm2 to 1x10¹⁹.
The shield was modeled (Fig. 12) using the Monte-Carlo code MCNP. The reactor
module consisting of the core, plasma, tritium blanket, shield, fuel and magnet was modeled as a
series of cells bounded by right circular cylindrical surfaces, with the dimensions shown in Fig. 2.
Vertical Cross-Section View
Top Down View

23
Figure 12: Model for Shielding Calculation
The fusion neutron source was modeled as a volumetric, mono-energetic 14 MeV source.
Calculation of the fluence and dose in the toroidal field magnets was based on an average volume
tally for the area at the center of the inner magnet region where the fluence was the highest.
The first layer of the shield around the fission core (the tritium breeding blanket)
contained a reflector region composed of ODS ferritic steel (Type 12YWT) and lithium silicate
which was used to reflect as many neutrons as possible back into the core region. Three layers of
tungsten heavy alloy (Grade SDD185) were used to attenuate gamma photons and fusion
neutrons, and a single layer of Boron-Carbide was used as a thermal neutron absorber at the
outside of the shield. Four sodium cooling channels were placed in between each shielding layer
to evacuate heat due to nuclear heating. The shield was designed to operate within the 500-800
degrees Celsius range. Table 5 shows the arrangement of the shield layers from the inner to the
outer region.
Table 5 Shield Layers and Compositions
Layer Material Thickness Density
Reflector ODS Steel (12YWT) 16 cm 7.8 g/cm3
Cooling CH A Sodium-22 1cm 0.927 g/cm3
1 Tungsten HA (SDD185) 12 cm 18.25 g/cm3
Cooling CH B Sodium-22 1cm 0.927 g/cm3
2 Tungsten HA (SDD185) 10 cm 18.25 g/cm3
Cooling CH C Sodium-22 1cm 0.927 g/cm3
3 Boron Carbide (B4C) 12 cm 2.52 g/cm3
Cooling CH D Sodium-22 1cm 0.927 g/cm3
4 Tungsten HA (SDD185 10 cm 18.25 g/cm3
Basing the calculation on the maximum operating power level of 500 MW for the fusion
neutron source and the 3000 MWth of fission power, it is calculated that the magnets will remain
functional for their anticipated lifetime of 40 years at 75% availability. Dose rate conversions
were performed using ICRP-21 guidelines. Table 6 shows the results of the shield analysis.

24
Table 6 Shielding Performance
Parameter Limiting Dose57 MCNP Result
40-yr Fast Neutron Fluence to Superconducting
Magnets at 75% availability 1019 n/cm2
6.87 x 10¹⁸ n/cm2
(Error 2.9%)
40-yr Radiation Dose to Magnet Insulators at 75%
availability
109 /
1010 rads
7.21 x 10⁷ rads
V. THERMAL
A. Heat Removal
The core heat removal system will be a three loop system, as shown in Fig. 13. The
primary loop with liquid sodium coolant removes heat from the core and transfers it to an
intermediate heat exchanger. An intermediate loop, with liquid sodium coolant, transfers heat
from the intermediate heat exchanger to the steam generator. The secondary loop converts the
heat removed from the core to useful electrical energy.
The primary system will consist of the reactor core, liquid sodium coolant, pump,
intermediate heat exchanger and piping. The reactor core produces heat from the fission of the
fuel. The liquid sodium coolant flows up through the core along the fuel rods, and heat is
transferred to the coolant. The coolant flows out of the top of the core and to the intermediate heat
exchanger.
The intermediate heat exchanger removes the heat from the coolant and transfers it to the
intermediate loop. The intermediate loop also has liquid sodium as its coolant. An intermediate
loop is used to isolate the activated liquid sodium coolant in the primary loop from the water in
the secondary system. If the activated sodium in the primary loop exchanged its heat directly with
the water in the secondary system the high-energy gammas from the decay of Na-24 would cause
decomposition of the water. In addition, a tube leak in the steam generator would release
radioactive sodium into the secondary loop and contaminate the components within that loop, if
there was no an intermediate loop. If a tube break occurs, the violent reaction of sodium and
water may damage or destroy the steam generator. The intermediate loop is there to prevent
radioactive sodium from being released.

25
The secondary loop is a conventional Rankine steam cycle with a steam generator,
turbine, condenser and condensate pump. The steam generator provides superheated steam to
drive the high and low pressure turbines.
The mass flow rate through the core necessary to remove the 3000 MWth fission power
with a nominal coolant Tout below the design limit of 660C was calculated to be 8700 Kg/s. The
core power density is 73 MW/m3. The area for coolant flow is 7.5 m2. The fuel pins are arranged
in hexagonal assemblies as shown in Fig. 4. The coolant flows into the bottom of the core then up
through the assemblies and out of the top of the core to the intermediate heat exchanger. The
temperature of the coolant entering the core is 377oC. The temperature at the outlet is 650oC. The
specific heat capacity (cp) of the coolant is 1.27 kJ/kg*C.
Figure 13: Heat Removal and Power Generation Cycle
B. Fuel Pin Temperature Distribution
The quantities used to determine the temperature distributions of a fuel pin are linear heat
rate, temperature of the coolant flowing into the core, and material properties of the coolant,
cladding and fuel. The thermal circuit shown below represents each section of the fuel pin. The
resistance of each material is below the resistor. The thermal resistance equations59 are used to
calculate the temperate at the lithium niobate coating outside (TLiO), Lithium niobate inside (LLiI),
cladding outside (Tco), the cladding inside (Tci), the fuel outside (Tfo), and the fuel centerline
(Tmax). The radius (R) and the conductivities59 are given in Table 7.
′+=
hRqTT
LiOLiom π2
,
′+=
)/ln(2
LiILio
LiLiOLiI RR
kqTT
π

26
′+=
LiLiIco k
qTTπ4
,
′+=
)/ln(2
cico
ccoci RR
kqTT
π (2)
−′+=
g
cifocifo k
RRqTT
)(4π,
′+=
ffo k
qTTπ4max
fkπ4
1
)(4 cifo
g
RRk
−π
c
cico
kRR
π2)/ln(
Likπ4
1
li
LiiLio
kRR
π2/ln( )
hRLioπ21
The average linear heat rate ( q′ ) was calculated using 59.
NLQq =′ (3)
where Q thermal power deposited in the fuel pins, N is the number of fuel pins, and L is the
active length of the fuel pins.
The clad-coolant heat transfer coefficient (h) was calculated from the Nusselt number
(Nu) times the conductivity (k) of liquid sodium divided by the hydraulic diameter (DH). The
Nusselt number was calculated using the Westinghouse correlation59
0.586.08.3 )/(16.0)100/()/(33.00.4 DPPeDPNu ++= (4)
The correlation is valid for Pitch to Diameter ratio of 1.1 ≤ (P/D) ≤1.4 and a Peclet number of 10
≤ Pe ≤ 5000. The Peclet number is the product of the Reynolds number and the Prandtl number.
The coolant temperature as a function of height along the fuel pin is given by59
+
′+=
ee
e
pinm L
LLzL
cmqTzT
2sinsin*)( ππ
π (5)

27
where Tm is the temperature of the coolant at height ‘z’, Le is the extrapolated length of the rod,
and L is the length of the rod. The temperature entering the core, (Tin ) was chosen to be 377 °C
to ensure that the liquid sodium does not solidify.
The core thermal properties are summarized in Table 7.
Table 7 Thermal Properties of Fuel Pin and Coolant
Conductivity of Sodium(k) 6.26E-05 MW/m*C
Specific Heat Capacity(cp) 1.27 kJ/kg*C
Heat Transfer Coefficient(h) 0.05731 MW/ m^2* °C
Nusselt Number(Nu) 5.74
Reynolds Number(Re) 28700
Prandtl Number(Pr) 4.63E-03
Ave. Linear Heat Rate (q’) .006 MW/m
Pitch to Diameter (P/D) 1.3
Conductivity of Cladding (kc) 3.0E-05 MW/ m*C
Conductivity of Fuel ( kf ) 1.0E-05 MW/ m*C
Conductivity of Gap (kg) 0.00005 MW/ m^2*C
Rco .0033 m
Rci .0028 m
Rfo .002 m
Flow Area of Core 7.5 m^2
Pump Efficiency(η ) .85
Density of Sodium ( ρ ) 829 kg/m^3
Pressure Drop( P∆ ) 36900 Pa
Electrical Conductivity of the
tube wall σs
1.10E-9 (Ωm)-1
Electrical Conductivity of the
Coolant σf
2.27E7 (Ωm)-1 Conductivity of LiNbO3 (kLi)60
.0039 Mw/ m*C
The nominal temperature distributions within a fuel pin are shown in Fig. 14. The
temperature rise through the lithium niobate coating was found to be negligible.

28
300350400450500550600650700750
0 0.0005 0.001 0.0015 0.002 0.0025 0.003 0.0035 0.004
Rod Radius (m)
Tem
pera
ture
(C)
Temperature at InletTemperature at Mid-PlaneTemperature at Outlet
Figure 14: Temperature Distribution in Fuel Pin (fuel 0.0-0.2cm, Na-gap 0.2-
0.28cm, clad 0.28-0.33cm, LiNbO3 0.33-0.36cm)
C. Coolant Pumping
The conventional pumping power was calculated using57
**pump
P mPη ρ∆
= (6)
where P∆ is the pressure drop due to friction and gravity, m is mass flow rate, η is the pump
efficiency, and ρ is the density of liquid sodium. The pumping power is 0.454 MW for the core.
A set of pumps moves the liquid sodium through the core and intermediate heat
exchanger. The factors affecting the pumping power are friction, gravity and magneto-
hydrodynamic (MHD) pressure drop. The downside of using liquid sodium as a coolant for the
reactor are the pressure losses that are experienced in moving sodium (a conductor) through the
magnetic field that is in the core. This magnetic field is a result of the magnets that are needed
for the confinement of the plasma in the fusion neutron source. When a conducting object is
moved in a perpendicular direction to a magnetic field a current is introduced in the object. This
current creates a Lorentz force that opposes the motion of the conducting material. The faster a
conducting object is moved within the magnetic field, the larger the force that will oppose the
motion of the object. This Lorentz force depends on jxB, where j represents the current flowing
in the sodium to the interfacing metal components and B is the magnetic field produced to
confine the plasma in the fusion neutron source.

29
The Lorentz force can be represented57 as an MHD (magnetohydrodynamic) pressure
drop experienced by the coolant as it moves through the magnetic field magnets.
CCVBLp fCMHD +
=∆ ⊥ 12σ (7)
Where Lc is the distance that the coolant is pumped across, V is the velocity at which the coolant
is pumped, and σf is the electrical conductivity of the coolant. The quantity ( )2 s fC t Dσ σ=
where σs is the electrical conductivity of the coolant tube wall and t is the thickness of the coolant
tube wall. With the SABR parameters given above, the MHD pressure drop would be 68 MPa;
this corresponds to a pumping power of 847 MW. This magnitude of pumping power is clearly
excessive.
The current flow from the sodium coolant to the interfacing metal can be interrupted by
coating the outside of the fuel clad and the assembly walls with a thin electrical insulator. The
coating that was chosen for this purpose was lithium niobate60.Using lithium niobate as the
insulator on all of the conducting surfaces that the sodium coolant will be flowing through allows
the MHD pressure drop to be reduced to a negligible 2.48E-6 Pa. Further research needs to be
done on the effects of using lithium niobate in high temperature sodium flows over long periods
to determine how long it takes its integrity to be compromised.
A summary of core thermal and heat removal parameters is given in Table 8.
Table 8 Core Thermal and Heat Removal Parameters
Power Density 73 MW/m3
Coolant Tin 377 °C
Coolant Tout 650 °C
Min. Centerline Temp 442 °C
Max Centerline Temp 715 °C
Mass Flow Rate( m ) 8700 Kg/s
Coolant Velocity(v) 1.4 m/s
Total Pumping Power 454 KW
D. Secondary Power Conversion Cycle
SABR is designed to produce electricity, but without compromising its primary purpose
of achieving a deep burn of transuranics. The secondary Rankine power cycle converts the steam
into electrical energy. This cycle employs the use of a high and a low-pressure turbine in order to
help maximize the efficiency of the cycle. Figure 14 gives the temperature and pressure for the
30
critical points throughout the three loop power conversion cycle. In the power generating loop,
10% of the steam exiting the steam generator is siphoned from the high pressure turbine and is
used in the moisture separator for reheat between the high and low pressure turbine stages.
The power required to operate the heaters for the plasma and to operate the magnets is
120 MW. The power to operate all of the pumps throughout the three loop system is 7.65 MW.
(All of the calculations for the pumping power neglect the pressure losses due to the piping in the
system; as a result the required pumping power to operate this system will be higher than what
was computed.) The total power produced by the turbine is 1049 MWe. This yields an overall
thermal efficiency of 34.6% for the secondary power conversion system. The overall electrical
efficiency of the system is 30.7%
E. Tritium Breeding Blanket Thermal Design
One of the design goals is tritium self-sufficiency, thus, a tritium breeding blanket (TBB)
surrounding the fusion and fission cores (see Fig. 2) is needed for tritium production. Within this
blanket, neutrons interact with the breeding material, lithium silicate, and structure, giving rise to
a corresponding nuclear heat generation.
This blanket must be cooled due to internal heat generation from the neutron flux. The
temperature within the blanket must be kept between 420ºC and 640ºC57 in order for online
tritium recovery to be possible. It must be kept above 420ºC so that the tritium produced in the
lithium silicate micro-particles will be able to diffuse to the surface of these particles. The
lithium blanket must be kept below 640ºC so that sintering and restructuring of the lithium
silicate will be minimized. As sintering and restructuring occur the porosity of the lithium
blanket would decrease, reducing the rate at which the tritium would be able to diffuse out of the
blanket57.
The coolant chosen for the breeding blanket is liquid sodium which is pumped through
the breeding blanket in pipes of ODS steel in the configuration as depicted in Fig. 15. These pipes
have a thin coating of lithium niobate, which reduces the MHD. In order to maintain the breeding
blanket material immediately adjacent to the pipe within the temperature window, a gap of
helium was placed around the main pipe structure using a double wall configuration as shown in
Fig. 15. The gap conductance was varied appropriately with respect to location within the blanket
by variance of the pressure and density of the helium within the gap for different pipe sections.
Channels of helium purge gas were also placed regularly throughout the blanket for tritium
collection purposes (see Fig. 15), but were considered to be of negligible importance for cooling
calculations due to low mass flow rates.

31
Figure 15 : Design of Coolant in Li4SiO4 Breeding Blanket
The power density used for the thermal design was estimated to be 3 MW/ m3 in the
blanket next to the plasma neutron source first wall and to decrease exponentially into the trititum
breeding region with an e-folding distance of 15 cm57. The power density at the outermost portion
of the blanket was approximately half of the maximum power density and adjacent to the first
wall. Only the cooling of that portion of the blanket surrounding the fusion core was considered
in the thermal analysis.
A total of 2172 pipes of 1cm diameter were used for cooling in the blanket, which
removed 56.3 MW of power, the total power produced in the blanket surrounding the fusion core.
The inlet coolant temperature for these pipes was 300 ºC and the outlet coolant temperature
varied with position in the blanket, the highest being 491 ºC. The temperature range in the blanket
was found to be between 445 ºC and 620 ºC with the average blanket temperature being 533ºC.
The mass flow rate of coolant in the blanket was 650 kg/s, corresponding to a coolant velocity of
4.12 m/s. The pumping power required to cool the blanket surrounding the fusion core was found
to be 35kW.
F. First-Wall and Divertor
The fusion plasma neutron source is the same as developed for the design of the GCFTR
transmutation reactor8-10. The plasma is capable of producing power up to 500 MWth, 20% of

32
which would be incident as a surface heat flux on the divertor and first wall of the plasma
chamber. The thermal analysis on the fusion neutron source will be based on this maximum
neutron source capability, even though the maximum neutron source requirement for SABR is
only about one-half this maximum capability (section VI). This surface heat flux is assumed to be
distributed with 50% on the annular plasma chamber and 50% on the divertor target plates. Some
fraction of the remaining 400 MWth of power, which is in the form of 14 MeV neutrons, is
deposited as a volumetric heat source in the first wall. The annular plasma chamber has a width
of 2.16 m, a height of 3.67 m and a centerline major radius of 3.5 m, which leads to a surface area
of about 223 m2.
First Wall
The first-wall design was adapted from the ITER design16—a beryllium-coated ODS
structure, but with sodium instead of water coolant. The average surface heat flux at maximum
fusion power (500 MWth) with 50% of the heat flux incident on the first wall is approximately
0.25 MW/m2. The first-wall has been designed to allow for peaking and for 100% of the heat
flux incident on the first-wall, which leads to a design heat flux of 0.5-1.0 MW/m2 for the first-
wall. This heat flux consists of the 20% of the fusion power plus the 98.2 MWth auxiliary power.
The assumption for this design is that 10% of the first wall surface area is unavailable since it
constitutes the entrance to the divertor.
The first wall design consists of a 3.5 cm thick first-wall between the plasma and the
sodium coolant. For the sodium coolant paths, the dimensions are approximately 4.5 m in length
up each side of the first-wall. The sodium is then removed from the system at the top of the first-
wall.
The first-wall temperatures are set for steady-state conditions at a range of 600-700ºC and
are limited to 1200°C in accident conditions, due to the melting point of the Be coating.
Beryllium has a thermal conductivity of 200 W·m−1·K−1 and the ODS61 has a thermal conductivity
range of 13-17.5 W·m−1·K−1 . Using the thermal conductivities of the first-wall materials, the
required flow rate of the sodium to cool the first-wall to the temperature range of 600-700ºC is
0.057 kg/s. This flow rate was calculated using the inlet and outlet temperatures were set to 293ºC
and 600ºC, respectively. The first-wall has a separate coolant loop and the heat is not recovered
for conversion to electricity. With this calculated flow rate, the use of an electrically insulating
coating (lithium niobate) on the structure interfacing the sodium coolant is required in order to
prevent a large MHD pressure drop.
Divertor

33
The divertor design, based on the ITER divertor16,62, is plated with cubic tungsten tiles
that measure 10 mm per side, as shown in Figs. 16.. These tiles are bonded to finned CuCrZr
layers behind which the sodium coolant flows. The coolant channels are located 4 cm from the
plasma edge reaction with the tungsten tiles allowing for the maximum cooling capacity transfer
to sodium without limiting the structural integrity of the tungsten or CuCrZr. The coolant
channels have a 10 mm diameter and are coated in lithium niobate.
Figure 16a: Divertor Cassette62 Figure 16b: Divertor Coolant Flow62
These cooling channels were designed along the width of the divertor in order to allow
for the possibility of the cassette removal system chosen by ITER. The entire divertor design was
modeled after the ITER design except sodium was used rather than water coolant.
The divertor exhausts 50% of the heat flux leaving the plasma via the toroidal “target”
strips below the plasma chamber. The heat flux impinging on the divertor is concentrated on two
target strips measuring 0.8 m each in length. For these target strips, the estimated peak heat flux
range is 1.0-8.0 MW/m2. When compared with the ITER design62, which has about the same
fusion power and a design heat flux range estimated to be less than 10 MW/m2, the calculated
values seem reasonable.
The heat flux impinging on the divertor was calculated the same way as described above
for the first-wall, with 50% of the power from the plasma assumed incident on the divertor.
Other factors affecting the heat flux include the fraction of exhaust heat flux radiated to the
divertor channel wall and the heat flux peaking factor, which have been taken into account.
The divertor heat removal system was calculated analytically and modeled (following
Ref. 10) using Fluent63, a three-dimensional fluid program that solves the energy equation
coupled with the Navier-Stokes equation. The Fluent model and mesh were created in Gambit63
for a single cooling channel. From this calculation the coolant flows at 1.22 m/s, flow rate at
0.09kg/s, to keep the temperature of the CuCrZr at a maximum of 756ºC with an inlet
temperature of 293ºC, both of which are well below the CuCrZr melting limit64 of 1500ºC.

34
VI. FUEL CYCLE
A. Objective
The goal of the SABR is to achieve a “deep-burn” transuranic (TRU) burnup. The TRU,
whose composition is given in appendix A, comes from LWR spent fuel. The primary objective
is to reduce the actinide inventory in order to decrease the requirements on high-level-waste
repositories. Previous studies7-12 of subcritical transmutation reactors show that a “deep burn” is
possible with either the use of a once through cycle or using a fuel cycle that involves repeated
reprocessing. This paper focuses on a fuel cycle that involves repeated reprocessing. The
burnup calculations in this paper are for the first cycle in a multi-cycle process. In order to
accommodate a “deep burn” of transuranics the fuel would be reprocessed and sent back through
the SABR or another burner reactor.
B. Methodology
In order to conduct the analysis, the EVENT53 and TRITON65 codes were used for the
analysis. EVENT is a deterministic neutron transport code which is used in the determination of
the multiplication factor of the system and in producing the neutron flux and power distributions.
TRITON is a code which couples a deterministic transport solver with the depletion code
ORIGEN-S66. It was used to simulate the irradiation of the actinide fuel to determine variations
in the material composition over time. The CSAS54 sequences were used to process cross section
libraries for use by EVENT. In order to use the cross sections from the SCALE package55 for the
fast spectrum in SABR, the 238 group cross section library was collapsed to 27 groups using the
238 group energy spectrum calculated for SABR, which is a fast reactor spectrum with a 14 MeV
tail.
The depletion was calculated using the power distribution calculated with EVENT. In
order to correctly deplete the TRU fuel the power distribution was calculated at many times in the
cycle to account for the change in the distribution as the actinides are depleted. Fuel batching and
fuel shuffling were employed in the depletion of the fuel. The core was broken up into 4 annular
equal volume regions so that the fuel is changed out after each burn cycle. For example in the
“in-to-out” scheme shown in Fig. 17 fresh fuel is loaded into the reactor and burned for 750 days,
then the fuel in region 4 (outboard) is removed from the core, the fuel in region 1(inboard near
plasma) is moved to region 2, the fuel in region 2 is moved to region 3, the fuel from region 3 is
moved to region 4, and fresh fuel is placed in region 1 (inboard) and another 750 day irradiation
cycle is carried out. The procedure is repeated until the equilibrium fuel cycle is reached—fresh
fuel in the innermost region 1, once burned fuel in region 2, twice burned fuel in region 3, and

35
thrice burned fuel in region 4. Once this equilibrium fuel cycle is reached each fuel batch is
irradiated for four 750 day burn cycles.
The TRU fuel was depleted via the TRITON code using simplified pin cell geometry and
recalculating the energy distribution of the flux 6 times per 750 day burn cycle as the fuel is
depleted. The 238 group spectra were collapsed to 3 groups that ORIGEN-S uses for the burnup
calculation. A fast reactor spectrum with a 14 MeV tail to account for the fusion neutron source
was used for the group collapse. From the burnup calculation new number densities were
obtained and cross sections were created for EVENT using a series of SCALE modules. These
cross sections were created in 238 groups and collapsed to the 27 groups that are used for the
power and flux distribution calculations.
Figure-17 In-to-Out Fuel Cycle Fuel Shuffling Pattern

36
C. Fuel Cycles
The fuel cycle design and analysis started by dividing up the reactor core into four equal
volume annular regions, as depicted in Fig. 3. For the purposes of this analysis, each region was
assumed to contain a uniform but time-dependent material composition throughout. Multiple
shuffling patterns have been analyzed, though this report will focus on four such patterns: the
“out-to-in” pattern, the “in-to-out” pattern, the region of high flux pattern, and the region of low
flux pattern. The first four burn cycles for a reactor starting up with “fresh” TRU fuel (see
appendix A) and utilizing the “in-to-out” concept are shown in Fig. 17. This approach to the
steady state cycle is the same for all four cycles analyzed in the paper; the only difference is in
how the fuel is shuffled.
Previous studies of subcritical transmutation reactors have shown that it is possible to
achieve a “deep burn” of the TRU in a once through fuel cycle10, provided that the reactor can be
operated a sufficiently low keff. To achieve this “deep burn” without reprocessing and recycling,
a neutron source with the ability to produce 400 MW of fusion power was necessary. However,
radiation damage accumulation to the clad and fuel assembly structure is estimated to limit the
residence time for those components to somewhat more than 8 years (section IX), indicating the
necessity to refrabricate the fuel after 8+ years of irradiation. Therefore, this analysis looks at
multiple fuel cycles of 3000 day length, with reprocessing and refabrication.
The power distribution is a function of both the fuel shuffle pattern employed and the
length of the burn cycle. There are many factors involved that limit the fuel’s residence time in
the reactor and thus the burn cycle length. 1) Negative reactivity is introduced due to the fission
product accumulation that comes along with the fuel depletion. This negative reactivity must be
compensated for by the fusion neutron source. 2) The fuel pin plenum volume must be large
enough to accommodate for the fission gases that are produced throughout the residence time
without exceeding the material’s strain limits. 3) Radiation damage to the clad must remain
below the limiting value for the fuel pin failure. 4) The power peaking must not be excessive,
where excessive was predicated here to be greater than 1.8. Taking into account these factors as
the limiting criteria, a fuel cycle with four burn cycles each of 750 days, resulting in a 3000 day
residence time for the fuel, was chosen.
The power sharing among regions at the beginning of the equilibrium fuel cycle (row 4 in
Fig. 17) is shown in Fig. 18. Region 1 is inboard next to the plasma and region 4 is outboard. No
special effort (e.g. burnable poisons, within batch fuel zoning) has been made to flatten the power
distribution.

37
Power Distribution
0
200
400
600
800
1000
1200
1 2 3 4
Region Number
MW
BOC High FluxBOC out to in BOC in to outBOC Low flux
Figure 18: Beginning of Cycle Power Sharing Among Fuel Regions
At the beginning of cycle (BOC) in the steady state fuel cycle shown in Fig. 17 (row 4)
fuel has been in the reactor for up to three residences (in region 4 for “in-to-out”), and one batch
of fuel is fresh (in region 1 for “in-to-out”). The position of each level of burned fuel is dependent
on which fuel shuffle pattern is being employed. In the “in-to-out” shuffling method the most
reactive fuel is in the innermost region of the core closest to the plasma, while the least reactive
fuel is in the outer edge of the core. As the fuel is burned there are two effects on the k-effective
of the core, both introducing negative reactivity. First, the TRU (fissile material) is changed into
fission products, and secondly neutron transmutation produces actinides with larger capture-to-
fission ratio, such as Pu-240 and Pu-242. These changes in the fuel are shown in Fig. 19 for the
“in-to-out cycle” operating with a batch burn cycle time of 600 days. These reactivity effects are
taken into consideration when determining the length of the cycle, because not only do they
influence the steady state cycle but also the approach to the steady state cycle.
The same 3000-day fuel cycle calculation described above for the “in-to-out” fuel cycle
was carried out for the other three fuel cycle options: “out-to-in”, “region of high flux”, and
“region of low flux”. Table 9 provides a comparison of the important fuel cycle parameters for
each of the 4 fuel cycles analyzed.

38
Figure 19: TRU Isotopic Composition versus time for a 2400 day “In-to-out” cycle
Table 9 SABR Fuel Cycle Parameters
Fuel Cycle
Parameter Units Out to in In to out High flux Low flux
Thermal Power MW 3000 3000 3000 3000
Cycles per Residence Time 4 4 4 4
Burn Cycle Length Time Days 750 750 750 750
4 Batch Residence Time Years 8.21 y 8.21 y 8.21 y 8.21 y
BOC keff 0.88 0.89 0.89 .87
EOC keff 0.82 0.83 0.82 .81
BOC Pfus MW 109 99 99 119
EOC Pfus MW 175 164 175 187
TRU BOC Loading MT 36 36 36 36
TRU Burned per Year MT/FPY 1.07 1.06 1.10 1.14
TRU Burned per Residence MT 8.75 8.68 9.04 9.40
TRU Burned per Residence % 24.3% 24.1% 25.1% 26.1%
SNF Disposed per Year MT/FPY 96.3 95.4 99.0 102.6
Average Core Flux Across Cycle n/cm2-s 2.80E16 2.88E16 2.69E16 2.92E16
Average Fast (>0.1 MeV) Flux n/cm2-s 1.93E16 2.00E16 1.85E16 2.03E16
Fluence per Residence Time n/cm2 7.28E24 7.48E24 6.96E24 7.56E24

39
Fast (>0.1 MeV) Fluence per Residence n/cm2 1.25E24 1.30E24 1.20E24 1.317E24
Table 9 shows that in terms of burnup there is not a reason to choose one shuffling
pattern over another. The “out-to-in” cycle shows greater burnup over the 3000 days, but this
number is not much larger than the “in-to-out” or “high flux”. However, the power sharing
among regions is more uniform for the “out-to-in” and “in-to-out” shuffling patterns, which have
peaking factors of about 1.3, while the other two shuffling patterns have higher peaking factors
up to 2.5. Primarily for this reason the “in-to-out” shuffling patterns was chosen for the SABR
reference fuel cycle.
This reference 3000-day fuel cycle, limited by radiation damage to the fuel clad and
fission gas pressure buildup, achieves 24-25% TRU burnup for the initial fuel cycle. Past
experience12 indicates that with reprocessing a > 90% burnup can be achieved by recycling the re-
fabricated fuel through the reactor about 4 times. A more detailed anaylsis of the equilibrium fuel
cycle will be the subject of a future paper.
D. Decay Heat
At the beginning of cycle, actinides within the fuel generate heat. As the fuel is burnt,
decay heat from the fission products take over as the primary source of decay heat; therefore,
decay heat generation in extensively burnt fuel is a major concern in thermal design for off-
normal conditions in which coolant flow may be reduced or lost and must be accounted for in the
primary heat removal system. If the heat removal system cannot adequately remove the decay
heat after the core has been shutdown, the entire reactor may be compromised. Ideally, a LOCA
transient simulation should be run in order to ensure adequate removal of heat during an accident;
yet, due to time constraints, the LOCA situation was interrogated analytically.
ORIGEN-S was used to calculate the thermal power from radioactive decay over time.
Four different irradiation cases were used to accurately model the fuel composition in the core:
750 days, 1500 days, 2250 days, and 3000 days. The fuel was irradiated in the core for the
previous cases and then allowed to decay for two hours. The decay heat from all four cases was
summed to give the total decay heat for a four batch load. Data points were obtained for every 10
seconds up to 2 minutes and then subsequently for every 20 minutes up to 2 hours after shutdown.
Figure 20 shows decay heat initially at around 270 megawatts, approximately 9% of the total
online power. As well it shows the decay heat leveling off at around 50 megawatts, or
approximately 2% of the online power, which is consistent with standard decay heat schemes.

40
Decay Heat
10
100
1000
0 20 40 60 80 100 120Time (minutes)
The
rmal
Pow
er (M
w)
750 Day Irradiation1500 Day Irradiation2250 Day Irradiation3000 Day IrradiationTotal Decay Heat
Figure 20: Decay Heat
VII. DYNAMICS and SAFETY
In order to design SABR to be passively safe it is necessary to simulate the dynamic
response to various off-normal conditions. This requires dynamic modeling of the three major
coupled systems-the plasma neutron source, the reactor neutron population and the heat removal
systems. This coupled dynamics system, depicted in Fig. 21, can then be analyzed to determine if
the inherent reactivity feedback mechanisms of the reactor are sufficient to shut down or limit the
fission chain reaction in the event of a failure in one or more sections of the three coupled
systems. The three major feedback mechanisms that affect the reactivity of the core are Sodium-
voiding, Doppler and Fuel Bowing. With reactivity feedbacks and the coupled dynamics model of
the reactor, simulations of Loss of Coolant, Loss of Heat Sink and Loss of Flow Accidents can be
made. The diagnostic and control systems will be looked at in detail during future research.

41
Figure 21. Integrated Reactor Dynamics Model
A. Fusion Neutron Source Model
The fusion model calculates the number of neutrons produced during the deuterium-
tritium fusion reaction. The power balance for the ions and electrons in the plasma is67
=
+ )()(
23
iiee TndtdTn
dtd
(8)
( )
+−−+⋅+++Ω i
E
iieE
eeRiefi
iaux
eaux
TnTnPUUvnPPPττ
σ αα 23
41 2
where, PΩ refers to the ohmic heating and Paux is the external auxiliary heating for the ions and
electrons in the plasma. f
συ is the fusion reaction rate and is proportional to the square of the
plasma temperature. τE is the energy confinement time, for which we use the H98(y,2)
confinement correlation67. Prad, the radiative power loss, is a combination of the bremsstrahlung
and impurity radiation and depends on the plasma temperature, electron and impurity densities
and the Z-number of the impurities. Models for these radiation power loss terms can be found in
Ref. 67. Impurities enter the plasma in one of two ways: sputtering from the walls of the
confinement chamber or injection from outside the plasma. Impurities would be injected into the
plasma to increase the radiation power loss and help control the fusion power.

42
The ion density balance67 depends on the ion source rate, the fusion reaction rate and the
particle confinement time where, ni is the ion density in particles/m3.
i
ifii
i nvnSdtdn
τσ −−= 2
21
(9)
The equations governing the alpha and impurity densities in the plasma are similar to Eq. 9,
except that the fusion term is a source for the alpha particles and does not enter the impurity
equations, and the impurity equation has a wall sputtering source. These equations are discussed
in greater detail in Ref. 67.
The fusion neutron source rate is related to the fusion power production since each D-T
fusion event produces 17.6 MeV including one 14 MeV neutron. However, not all of the plasma
neutrons reach the core. To calculate the percentage of fusion neutrons that reach the fission core,
a calculation was performed with MCNP517 . Of the neutrons created in the D-T fusion reaction,
39% are calculated to reach the fission core.
The fusion neutron source is designed to produce up to 500 MWth fusion power. To
operate at 500 MW of fusion power an external heating source of 98.6 MW is necessary10. Based
on acceptable impurity limits in a plasma67, upper limits for carbon and tungsten were set at 3 and
0.008 %, respectively, impurity atoms per ion.
B. Neutron Kinetics
The point neutron kinetics equations68 can be used to calculate the change in neutron and
neutron precursor population as a function of reactivity and source strength. Six groups of
delayed neutron precursors were used, with delayed neutron fractions and decay constants
determined for TRU fuel composition given in appendix A.
SCni
ii ++Λ−
= ∑=
6
1
0 λβρ (10)
1,6i ii i
dC β= n λC idt Λ
− = (11)
By discretizing Eqs. 10 and 11 one can model the change in neutron population at each time step.
A change in the neutron population leads to a change in the power generated per rod, which
changes the temperature in the fuel and coolant. These changes in fuel and coolant temperature
lead to changes in reactivity discussed in the following section.
The equilibrium condition is steady state neutron and precursor population at keff = 0.95
(for the initial loading of fresh fuel), with reactivity, ρ= (keff-1)/keff, which is negative for a sub-
critical reactor, and a compensating neutron source, S. The power density can be related to the

43
neutron density in the core, so that Eqs. (10) and (11) can be used to simulate the change in power
generation.
Table 10 summarizes the 6-group delayed neutron decay constants and relative yields for
fresh and equilibrium fuel compositions69 .
Table 10. Delayed Neutron Precursor Variables for Fresh TRU Fuel
Fresh TRU Fuel Equilibrium TRU Fuel lambda (1/s) Relative yield lambda (1/s) Relative yield
Group 1
1.324E-2 2.761E-2 1.324E-2 2.823E-2
Group 2
3.019E-2 2.533E-1 3.019E-2 2.550E-1
Group 3
1.166E-1 1.940E-1 1.166E-1 1.950E-1
Group 4
3.133E-1 3.519E-1 3.133E-1 3.504E-1
Group 5
1.046 1.376E-1 1.046 1.358E-1
Group 6
2.836 3.553E-2 2.836 3.549E-2
The one-group values for β and λ from the Kinetics Equations for the TRU composition
for fresh fuel are 3.009E-3 and 7.459E-2, respectively. For the equilibrium fuel composition, β
and λ become 2.953E-3 and 7.386E-2.
C. Reactivity Feedbacks
The two obvious reactivity feedbacks for SABR are sodium voiding and fuel Doppler, as
given in section IV. Aside from these, there are fuel expansion and core expansion, which tend to
be negative, and fuel bowing, which was positive and significant in EBR. The bowing reactivity
will be examined. The time dependent reactivity is then
Doppler fuel Na Na bowing subρ= α ∆T +α N + A + ρ∆ (12)
where NaN∆ is the change in sodium density either due to a change in coolant temperature or to
coolant voiding, ρsub is the subcritical reactivity (assumed constant), fuelT∆ is the change in fuel
temperature, and the Doppler and sodium density coefficients are proportional to the change in
fuel temperatures and coolant density, respectively. The Doppler and Na voiding reactivity
coefficients for SABR are given in Section IV and the fuel bowing reactivity bowingA is discussed
below.

44
When a radial thermal gradient exists over the reactor, thermal deflections cause
individual fuel rods to bow. The thermal deflection is caused because one side of the rod heats up
and expands more than the other side. Assuming that the temperature gradient follows the
neutron flux gradient, the motion of the bowed fuel is towards the higher temperature and neutron
flux. This motion results in a positive reactivity gain, Abowing, in Eq. 13 above70. Bowing
contributions are greatest when there is a substantial neutron flux and temperature gradient in the
reactor radial direction. For a typical neutron flux distribution in the SABR, the average fuel
temperature per region can be calculated. The temperature gradient is greatest in the fuel region
farthest away from the fusion source. In this region an average temperature difference is between
2 and 3 K across opposite sides of a single rod.
For an individual rod, thermal deflections can be superimposed with force deflections
imposed by the subassembly70. Figure 22 below shows the calculated net deflections for a rod
under 2, 5, and 10 K radial temperature gradients assuming that the structure is sufficiently rigid
to fully constrain both ends of the rod. The deflection is in the direction of higher temperature and
higher flux. In practice, the rods will not bow as much as shown in Fig. 23 because the wire
wraps and spacer grids will be in place to mitigate the bowing towards the center.
Net Deflections for a Slender Rod
-2.500
-2.000
-1.500
-1.000
-0.500
0.000
0.500
0 0.5 1 1.5 2 2.5 3
zaxial position [m]
y de
flect
ion
from
neu
tral
axi
s[c
m]
2K dT5K dT10K dT
Figure 22. Deflections for a fuel rod for radial temperature gradients of 2, 5, and 10 K.
To estimate the reactivity gain due to bowing, it is assumed that the bowing can be
represented as a reduction in the volume of the reactor70. The reduction in volume means that the
atom density of the fuel increases. The reactivity gain is then determined from EVENT
neutronics calculations to be
VV
kk ∆
−=∆ 006.0 (13)

45
A radius reduction of 2 cm in the fuel region farthest away from the fusion source
corresponds to a volume reduction of 3.08 E-3 m3. This volume reduction gives a reactivity gain
of k k∆ = 0.0008. A similar study for the EBR-I reactor calculated a much larger reactivity gain
of VVk ∆
−=∆ 35.0 . The EBR-I reactor is a much smaller reactor (Volume < 0.01 m3) than
SABR, therefore it is reasonable to expect that the EBR-I would be much more responsive to
changes in volume due to bowing. According to Hummel and Okrent70 in a very large reactor
whose fuel rods and subassemblies are constrained not to bow (by using spacer grids to hold the
rods in place) the reactivity due to bowing should be negligible. Without physical constraints to
prevent the bowing of the fuel rods, the reactivity gain due to bowing is expected to be positive
but small.
D. Heat Removal System
Modeling the dynamic temperature response is necessary to evaluate the safety of the
temperature dependent reactivity feedbacks. A two temperature lumped model characterizes the
entire reactor with an average fuel temperature and an average coolant temperature71.
( ))()(*
)(1)()(111
12 tTtTmcp
htPmcpt
tTtTdt
dTcf
ffff
fff −−=∆
−= (14)
( ) ( )inletccc
cfcc
ccc TtTmmtTtT
mcph
ttTtT
dtdT
,11112 )(2)()()()(
−−−=∆−
= (15)
The inlet coolant temperature, inletcT , , in Eq. 14 is dictated by how much heat is removed
through the intermediate heat exchangers (IHX). At steady state conditions, the heat removed
from the hot side of the IHX equals the heat generated in the reactor. The IHX is approximated
with an effectiveness that is a function of mass flow rate and inlet coolant temperature of the hot
side loop (from the core). The effectiveness of a heat exchanger is the ratio of actual heat
removed to the theoretical maximum heat removed71.
( )ColdHotp TTmcQQactual −== εε max (16)
whereε is the effectiveness and is calculated for a counter flow heat exchanger71, mc p is the heat
capacity rate of the hot side (primary loop), HotT is the coolant temperature entering the IHX
from the core, and ColdT is the inlet temperature on the cold side of the IHX. The average coolant
temperature in the IHX is calculated as

46
)()(2)(2 cihiphippIHXhipcp TTcmTTcmQTTcmdtdTmc −−−=−−= ε (17)
where 8696=m kg/s and cpmc is the heat capacity of all the coolant in the reactor.
E. Accident Analysis
An uncontrolled loss of flow accident (LOFA) is modeled with no active shutdown of the
plasma source or control rod insertion. To simulate a LOFA due to pump failure, the pumping
power is decreased, which reduces the velocity of the coolant through the core. When the sodium
pump malfunctions the mass flow rate is reduced and less heat is removed from the core, which
leads to an under-cooled reactor. This accident is initiated after 10 seconds of steady state
operation, when the pumping power is reduced instantaneously to a specified fraction of its
original value. While reducing the pumping power instantaneously is not an accurate
representation of a loss of flow accident, it is a worst case scenario and thus a conservative
estimate of the accident.
Figures 23 and 24 illustrate the temperature responses of the fuel and coolant during a
LOFA. The first three accidents simulated are a 50%, 75% and 85% decrease in pumping power,
hence coolant velocity, through the core without any control action. The fourth accident is again a
75% decrease in coolant velocity, but now with the plasma neutron source shut down just prior to
the time at which the sodium boils.
Fuel Temperature During Loss of Flow Accident
300450600750900
105012001350150016501800
0 20 40 60 80 100
Time (seconds)
Fuel
Tem
pera
ture
(Cel
sius
)
50% Loss of Flow
75% Loss of Flow
85% Loss of Flow
75% Loss of Flow withCorrective Measures
Figure 23. Temperature response of fuel due to LOFA

47
Coolant Temperature During Loss of Flow Accident
300450600750900
10501200135015001650
0 20 40 60 80 100
Time (seconds)
Coo
lant
Tem
pera
ture
(C
elsi
us)
50% Loss of Flow
75% Loss of Flow
85% Loss of Flow
75% Loss of Flow withCorrective Measures
Figure 24. Temperature response of coolant due to LOFA
The limiting constraint to determine whether the reactor would suffer severe damage is
the boiling point of the sodium coolant, which is 883 °C. The fuel will melt at 1200 °C but in
every LOFA case considered the sodium boiled prior to the fuel melting. It was determined that
the coolant velocity through the core can be decreased by 71% (i.e. reduced to 29% of its original
value) before sodium boiling will occur.
In the case of the 75% and 85% decrease in coolant velocity through the core, there were
34.3 and 15.6 seconds, respectively, after the accident occurred before the sodium began to boil.
This should be sufficient time to detect the loss of flow or to introduce control rods or shut down
the plasma neutron source. The plasma neutron source can be shut down by shutting off the
auxiliary heating power to the plasma, or by other means. For a LOFA, it was determined that if
the plasma auxiliary heating system is shut down within approximately one second before the
time at which sodium boiling otherwise would take place, the fission power will decrease enough
that the coolant will not reach its boiling temperature and the fission power will eventually go to
zero. This is illustrated in the fourth example in Figures 23 and 24.

48
It should be noted that the temperatures discussed above are average temperatures, and as
discussed in section V the peak fuel and coolant temperatures will be about 40% higher. This
will be examined in more detail, but probably will not change the general conclusion that about a
2/3 reduction in flow can be tolerated passively and that the time available to take control action
is ample when larger flow reductions occur.
VIII. COMPONENT LIFETIMES A. Fuel Pin
In traditional reactors that employ the use of sealed fuel pins, thermal design limits are
put in place to ensure integrity of the clad. The clad is the first absolute barrier between the
radioactive fuel and the environment. It must be designed to maintain this barrier with extreme
confidence. For maximum thermal performance of the reactor, the reactor coolant should have
the highest temperature achievable to maximize thermal efficiency. For reactors with water
coolant, high temperatures require high system pressures to maintain a minimum critical power
ratio in a BWR and a minimum departure from nucleate boiling ratio in a PWR. This requires
increased structural and component wall thicknesses, leading to increased capital costs. For
liquid metal coolants such as sodium, the saturated vapor pressure is much lower than water, and
the boiling point of sodium is not the limiting factor. The limiting factor is the creep lifetime
characteristics of the primary system material which are driven by the temperatures encountered
by this material.59 The thermal design must be balanced to avoid both the boiling of sodium, and
the failure of structural steel due to creep mechanisms. The nuclear design must also minimize
power peaking to reduce peak temperatures and cladding damage. Failure to accommodate the
creep characteristics of structural materials will constrict fuel cycle time and increase cost, length,
and frequency of outages.
Determining a strain and fatigue limit for structural components is an extremely difficult
task due to the complexity of the behavior of materials in the radiation and thermal environments
occurring in nuclear reactors.72 The design methods of evaluating structural damage have been an
evolving practice over the history of nuclear reactor design. For fast reactors, generally two
specific mechanical limits have been used for fuel design. These limits are the strain limits and
the cumulative damage fraction method limit. For radiation damage, fluence limits are imposed.
The fluence limits are produced by experimentation, through the observation of loss of
mechanical strength after an average atom in the structural material has become displaced a
certain number of times. Experiments have shown that irradiation has minimal effect on the

49
creep strength of ferretic steel33, however degradation of other mechanical properties can result
from high neutron fluences.
The strain analysis method places a limitation on the diametrical growth of the clad. For
preliminary study, a limit of 2.0% total diametrial growth, and 1.0 % maximum thermal creep
strain were imposed.73 These are typical limits for fast reactor designs in the nuclear industry.
The first cause of the diametrial growth is the thermal creep strain. Over the time period a fuel
pin is in the core, deformation of the clad will occur due to strains resulting from the pressure of
the gas plenum. For low smear density fuel pins, such as the ones proposed for the SABR, it can
be assumed that the cladding strain can be determined solely with the plenum pressure stress.
The extra room provided for the fuel slug to expand radially should prevent a significant fuel-clad
mechanical interaction (FCMI). Because the strain is a function of plenum pressure, the size of
the plenum may be extended to reduce the pressure build-up in the plenum. The plenum pressure
was calculated using the ideal gas law, where the average numbers of moles of gas in a fuel pin
was calculated using the ORIGEN code. Table 11 lists the composition of gases in the plenum
after an average pin has been in the core for the 3000 day fuel cycle residence time. Due to the
absence of data for fission gas release in the fuel slug, 100% of fission gas was assumed to
immediately enter the plenum as it is produced. Figure 25 gives the creep strain results from clad
testing for MA957 performed by the US Department of Energy at Pacific Northwest National
Lab. The pressure on the clad reaches its maximum, 11.1 MPa, at the end of cycle. Judging from
this figure, the creep strain should not exceed the limit of 1.0%.
Table 11: End-of-cycle Plenum Gas Composition in moles
Helium Bromine Hydrogen Iodine Krypton Xenon 2.03E-3 1.7E-4 9.33E-5 1.93E-3 2.66E-3 3.93E-2

50
Figure 25: Creep strain for ferretic steel claddings from PNNL-1316833
Researchers at PNNL33 also observed void swelling for the MA957 cladding at fluences
as low as 1.8*1022 n/cm2. The researchers concluded that the swelling rate was expected to
remain low at less than 0.3% per 1022 n/cm2. With this strain limit approach the SABR design
appears to be acceptable, but a testing program will be required to confirm predictions.
Unfortunately the strain limit approach to ensure fuel integrity has a deficiency in that the
rupture strain is strongly dependent on the temperature and the strain rate.72 To account for this,
another method is used, the cumulative damage fraction method. This method assumes that
damage to the clad occurs linearly and is determined through the use of a time-to-rupture
correlation as a function of temperature and stress. The CDF is given by
(18)
where tr is time to rupture and t is the time in core (3000 days for a 4-batch fuel cycle with 750
day burn cycles).74 To be consistent with the strain analysis, the stress is assumed to be only the
pressure in the plenum because of the low fuel smear density. A CDF value of 1.0 means that the
clad would most probably fail at the end of the interval. This does not mean the clad will fail at
the time that the CDF = 1, but that time is the average time to failure.74 In 2000, mechanical and
irradiation testing of the ODS steel MA957 was completed at Pacific Northwest National Lab.

51
The time-to-rupture correlation found by PNNL, provided below in Fig. 26, was produced from
bi-axial tube rupture tests.
Figure 26: Time-to-rupture Correlation from PNNL-1316833
The CDF for SABR shown in Fig. 27 is calculated with the plenum pressure as a function
of time used in the time-to-rupture correlation from PNNL. The predicted average time to rupture
(y-axis) remains well above the residence time in the core up to the design fuel cycle residence
time of 3000 days.
y = 421480e-0.0004x
050000
100000150000200000250000300000350000400000450000
0 500 1000 1500 2000 2500 3000
Time in core (days)
Tim
e to
rup
ture
(day
s)
Figure 27: Time to rupture for SABR fuel pin

52
The CDF limit is established by using statistical analysis from in-core experiments. To
avoid an extensive and expensive test program, a statistical probability distribution function of
failures from observed sample failures was used. Typically no more than 0.01% of the fuel pins
can be expected to fail, so the CDF limit is set using the probability distribution function to where
there is a 99.99% confidence that no pin will fail.72 Fuel pins using MA957 cladding have not
been tested, but another experiment is referenced for comparison. While EBR-II was in
operation, the subassembly X447 was irradiated for testing. This subassembly contained
uranium-zirconium fuel slugs with HT-9 cladding, similar to the SABR fuel pin design. To
achieve a failure rate of less than 0.01% for this type of fuel, the CDF limit was 1.0% of the mean
time to failure (CDF=.010) for the HT-9 clad without FCMI.72 For the proposed 3000 day time-
in-core for the SABR, the calculated CDF is .0136 or 1.36% of the mean time to failure.
Atomic displacements
Component damage from atomic displacements caused by interactions with fast neutrons
(>0.1 MeV) determine the expected lifetimes of various components of the SABR. The MA-957
ODS cladding for the fuel pins is the main component of interest as it is the first line of defense
against the release of the radioactive fuel and fission products. Using a damage limit of 200
displacements per atom (dpa,) and a calculated average damage rate of 23.7 dpa/year from a fast
neutron fluence of 6.23*1022 n/cm2, the clad will have an 8.44 year lifetime. This means that
from a radiation damage point of view, the fuel burnup clad radiation damage limit is consistent
with the fuel cycle residence time of 8.21 years.
The integrity of the TRU metal fuel is also a concern. Radiation damage to the fuel itself
could limit the in-core time before reprocessing is necessary. Unfortunately, because the fuel is
only recently under development, a dpa limit is unknown at this time. However, considering the
composition of the fuel, most research suggests that the fuel should outlive the cladding in terms
of radiation damage, and the cladding will serve as the limiting factor on the length of the fuel
cycle.75
B. First Wall and Divertor
The first wall surrounding the plasma will be exposed directly to the 14 MeV fusion
neutrons and hence accumulate more damage per neutron than the clad. At a fusion power of 500
MW, an effective full power year (EFPY) produces a fast (>0.1 MeV) neutron fluence of 4*1022
n/cm2/year, which would in turn produce 33 dpa/year. Assuming the same limit of 200 dpa for
the ODS in the first wall, the first wall would need to be replaced every 6 EFPY if the fusion
neutron source operated at its full design power of 500 MW. However, the fusion neutron source

53
in the SABR design needs to operate at a variable power level much less than 500 MW (section
VI), and the first wall lifetime would be correspondingly greater. It is plausible that the first wall
could be replaced every two fuel cycles, or every 16.4 years.
The divertor will require the most frequent replacement due to the damage it incurs from
plasma erosion. Routine replacement will need to occur after every 2 burn cycles, or
approximately every 4 years; thus, considering a reactor lifetime of 30 effective full-power years
(EFPY), approximately 8 replacements will need to be scheduled for the divertor.76
C. Superconducting Magnets
The Nb3Sn magnets must be lifetime components for the SABR design to be feasible.
The Tungsten and Boron-Carbide shield (see section IV.E) insures that the maximum fast neutron
fluence to the magnets never reaches the limiting value 1019 n/cm2 during the design lifetime of
30 effective full power years. The maximum calculated neutron fluence over 30 years is 6.87 x
1018 n/cm2 , and the calculated dose to the epoxy insulator is 7.21x10⁷ rads which is lower than
the limit of 109 rads.
IX. SUMMARY and CONCLUSIONS
The conceptual design of a fusion driven, sub-critical, sodium cooled transmutation
reactor for high burnup-- SABR (Sub-critical Advanced Burner Reactor)-- was described. SABR
has an annular fission core surrounding the toroidal fusion plasma neutron source on the outboard
side, with metallic fuel (Zr – Pu – Np – Am), a thermal power of 3000 MWth, and an overall
efficiency of 30.7% for electricity generation. The annular fission core contains 918 fuel
assemblies, each holding 271 fuel pins with active length 2m. Sixteen of the assemblies contain
enriched boron-carbide rods, providing about 9$ of negative reactivity. All structural materials
and cladding are ODS steel.
A four-batch fuel cycle is used, with 4 burn cycles of 750 days, to fission the TRU in
about 95 MT of spent nuclear fuel each full power year. Several fuel shuffling schemes were
examined, with the somewhat surprising result that the flux and power profiles in the fission core
are relatively insensitive to the fuel shuffling scheme. The reactor operates subcritical to
achieve a deep-burn, 4-batch fuel cycle which fissions 25% of the TRU in an 8.2 year
residence time, limited by radiation damage accumulation (200 dpa) in the ODS clad and
structure. The discharged fuel would be reprocessed to remove fission products, refabricated

54
and recycled. The metallic fuel lends itself to pyroprocessing and is fabricated using arc casting
to avoid release of volatile materials.
Reactivity coefficients were calculated and indicate that the Doppler coefficient of the
fuel is small but negative (order 10-6 / K), with increasing magnitude for higher burnup. The
sodium void coefficient is always positive, but relatively small because of the high leakage
annular core configuration (2$ for 50% coolant voiding). The positive fuel bowing coefficient
was estimated to be small both because of the size of the core and because of the spacing and
wire wrapping of fuel pins.
A coupled core neutron kinetics—plasma source dynamics—lumped parameter heat
removal system model was employed to simulate the effect of loss of flow accidents (LOCAs).
Despite the positive Na-voiding reactivity, a significant reduction in flow (71%) can be tolerated
passively, without shutting off the neutron source or inserting control rods, with no sodium
boiling or fuel melting. For larger flow reductions sodium boiling would take place after tens of
seconds, leaving ample time for corrective control actions. Simulations indicate that the plasma
neutron source can be shut down rapidly in a controlled manner by reducing the auxiliary power
to the plasma, such that initiation of source shutdown about one second before sodium boiling
would otherwise occur is sufficient to prevent it.
A tokamak D-T fusion neutron source based on physics and technology that will
be demonstrated in ITER supports the subcritical operation. The source would only need
to operate up to 200 MW fusion power, well below the 500 MW design limit based on ITER
physics and technology. The SABR design is tritium self-sufficient due to tritium production in a
lithium silicate tritium breeding blanket surrounding the plasma and fission core.
The magnetic field needed for the fusion neutron source poses an unique problem for the
liquid metal coolant due to the large pumping power that would be required to offset the Lorentz
force. However, this problem can be solved by coating all parts of the fission core and other
structural parts in direct contact with the liquid sodium with an insulating layer of LiNbO, which
virtually eliminates the current flow, hence the Lorentz force and the pumping power
requirement. The shielding design limits the neutron fluence and radiation damage to the
superconducting magnets so that these components do not need to be replaced during the reactor
lifetime of 40 yrs at 75% plant capacity factor.
The most important conclusions of this report are the following:
− SABR can achieve a high TRU burnup of about 25% FIMA in 3000 days of irradiation. The

55
limit on the residence time in the core is set by 200 dpa material damage of the ODS clad and
fuel assy structural material.
− The fusion neutron source strength required to compensate the reactivity decrement of 25%
TRU burnup is 200 MW, well below the (ITER physics based) design level of 500 MW,
which indicates that a fuel cycle with higher TRU burnup and larger reactivity decrement
would be possible if the clad and structure damage limit can be extended beyond 200 dpa..
− The annual TRU fission rate in SABR (3000 MWth) is comparable to the annual TRU
discharge of 3-5 1000 MWe LWRs, depending on the plant capacity factor of SABR.
− SABR produces 921 MWe net power with an overall efficiency for power generation of
30.7%.
− SABR is tritium self-sufficient.
− The SABR Doppler reactivity coefficient is negative, the sodium void coefficient is positive,
and both are small. Bowing of fuel rods is estimated to cause a negligibly small increase in
reactivity.
− Dynamic simulations indicate that an accidental reduction of flow up to 2 3≈ can be
tolerated (with no control action) without sodium boiling or fuel melting and that the
time available for taking control action with larger loss of flow is on the order of tens
of seconds
Follow-up studies are in progress to provide an in-depth analysis of the fuel cycle and of the
dynamic response of the coupled source-core-heat removal system to off-normal conditions.
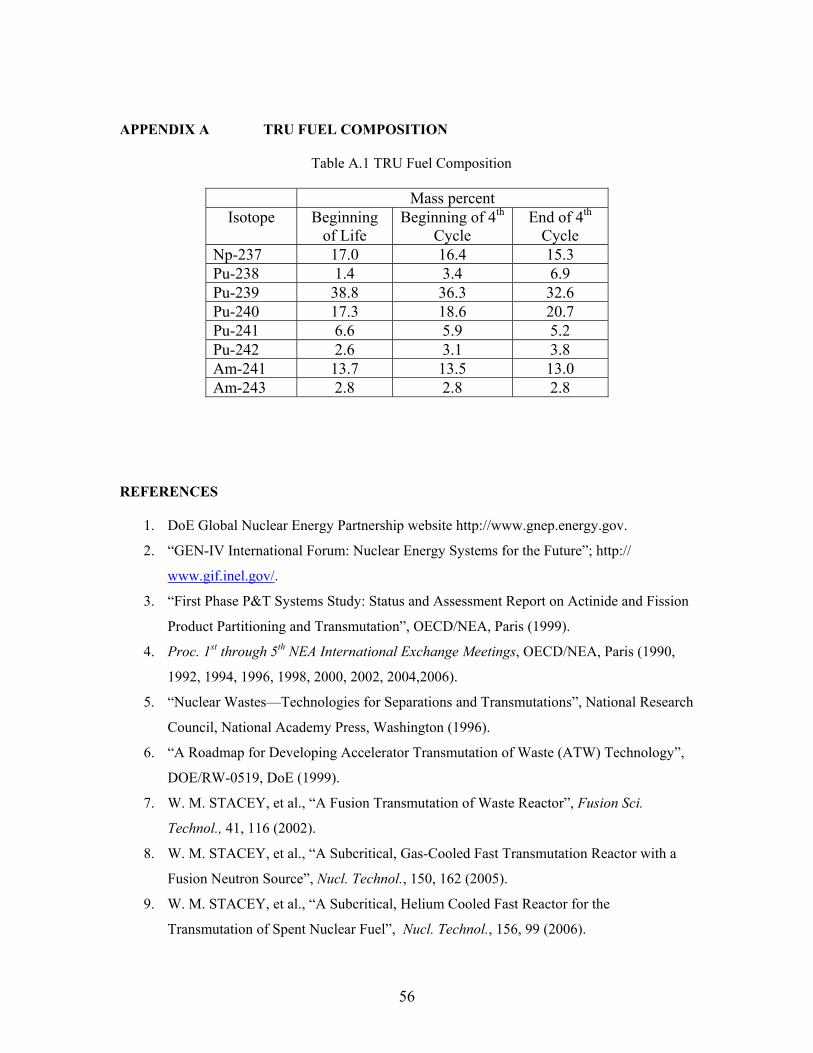
56
APPENDIX A TRU FUEL COMPOSITION Table A.1 TRU Fuel Composition
Mass percent Isotope Beginning
of Life Beginning of 4th
Cycle End of 4th
Cycle Np-237 17.0 16.4 15.3 Pu-238 1.4 3.4 6.9 Pu-239 38.8 36.3 32.6 Pu-240 17.3 18.6 20.7 Pu-241 6.6 5.9 5.2 Pu-242 2.6 3.1 3.8 Am-241 13.7 13.5 13.0 Am-243 2.8 2.8 2.8
REFERENCES
1. DoE Global Nuclear Energy Partnership website http://www.gnep.energy.gov.
2. “GEN-IV International Forum: Nuclear Energy Systems for the Future”; http://
www.gif.inel.gov/.
3. “First Phase P&T Systems Study: Status and Assessment Report on Actinide and Fission
Product Partitioning and Transmutation”, OECD/NEA, Paris (1999).
4. Proc. 1st through 5th NEA International Exchange Meetings, OECD/NEA, Paris (1990,
1992, 1994, 1996, 1998, 2000, 2002, 2004,2006).
5. “Nuclear Wastes—Technologies for Separations and Transmutations”, National Research
Council, National Academy Press, Washington (1996).
6. “A Roadmap for Developing Accelerator Transmutation of Waste (ATW) Technology”,
DOE/RW-0519, DoE (1999).
7. W. M. STACEY, et al., “A Fusion Transmutation of Waste Reactor”, Fusion Sci.
Technol., 41, 116 (2002).
8. W. M. STACEY, et al., “A Subcritical, Gas-Cooled Fast Transmutation Reactor with a
Fusion Neutron Source”, Nucl. Technol., 150, 162 (2005).
9. W. M. STACEY, et al., “A Subcritical, Helium Cooled Fast Reactor for the
Transmutation of Spent Nuclear Fuel”, Nucl. Technol., 156, 99 (2006).

57
10. W. M. STACEY, et al., “Advances in the Subcritical Gas-Cooled, Fast Transmutation
Reactor Concept”, Nucl. Technol., (July, 2007).
11. E. A. HOFFMAN and W. M. STACEY, “Comparative Fuel Cycle Analysis of Critical
and Subcritical Fast Reactor Transmutation Systems”, Nucl. Technol., 144, 83 (2003).
12. J. W. MADDOX and W. M. STACEY, “Fuel Cycle Analysis of a Subcritical, Fast, He-
Cooled Transmutation Reactor with a Fusion Neutron Source”, Nucl. Technol., (April,
2007).
13. R. N. HILL and H. KHALIL, ”ATW System Point Design Employing Sodium Cooled
Blanket Design”, ATW Report, Argonne National Laboratory (2000).
14. W. S. YANG and H. KHALIL, “ATW System Point Design Employing LBE Cooled
Blanket Design”, ATW Report, Argonne National Laboratory (2000).
15. W. M. STACEY, “Tokamak D-T fusion neutron source requirements for closing the
nuclear fuel cycle”, Nucl. Fusion, 47, 217 (2007).
16. International Thermonuclear Experimental Reactor http://www.iter.org.
17. J.F. BRIESMEISTER, Ed. “MCNP – A General Monte Carlo N-Particle Transport Code,
Version 5,” Los Alamos National Laboratory (2003).
18. R.E. MACFARLANE & D.W. MUIR. “The NJOY Nuclear Data Processing System,
Version 99,” Los Alamos National Laboratory (1999).
19. M.B. CHADWICK, P. OBLOZINSKY, M. HERMAN at al., "ENDF/B-VII.0: Next
Generation Evaluated Nuclear Data Library for Nuclear Science and Technology",
Nuclear Data Sheets, vol. 107, pp. 2931-3060 (2006).
20. DoE Global Nuclear Energy Partnership website http://www.gnep.energy.gov. “Spent
Nuclear Fuel Recycling Program - Report to Congress” (May 2005).
21. M. K. MEYER, et al. Development and Testing of Metallic Fuels With High Minor
Actinide Content, Argonne National Laboratory, Idaho Falls, Idaho. April 20, 2003.
22. Y. SUZUKI, et al. Recent Progress Of Research On Nitride Fuel Cycle In JAERI. Japan
Atomic Energy Research Institute.
23. K. E. ABNEY, et al. Advanced Nuclear Fuel Processing Options Final Report, Los
Alamos National Laboratory. (Oct. 6, 1997).
24. Personal Communication Stephen Hayes and Mitchell Meyer, Argonne National
Laboratory (2007).
25. 2002 Research Highlights: Technology Pioneered at Argonne Shows Promise For Next
Generation of Nuclear Reactors. (April 23, 2007).
<http://www.anl.gov/Media_Center/Frontiers/2002/d1ee.html>

58
26. B. WILSHIRE, and T. D. LIEU, “Deformation and damage processes during creep of
Incoloy MA957”,Materials Science and Engineering A.386: 81 (2004).
27. D. C. CRAWFORD, S.L. HAYES, M.K. MEYER, Current US Plans For Development
of Fuels for Accelerator Transmutation of Waste. Argonne National Laboratory, Idaho
Falls, Idaho (2000).
28. R. G. PAHL, E. L. Porter, C. E. Lahm,, G. L. Hofman, Experimental Studies of U-Pu-Zr
Fast Reactor Fuel Pins in the Experimental Breeder Reactor-II, Met. Trans. A, 21A.
1863-1870. (1990)
29. G. L. HOFMAN, and L. C. Walters, Metallic Fast Reactor Fuels, in Materials Science
and Technology: A Comprehensive Treatment, Vol. 10A, B.R.T. Frost (Ed.), VCH
Publishers Inc. New York (1994) 1-43.
30. E. YOSHIDA, and S. KATO, “Sodium Compatibility of ODS steel at elevated
temperature”, Journal of Nuclear Materials 329-333: 1393-1397. (2004).
31. M. K. MILLER, et al. “Stability of ferritic MA/ODS alloys at high temperatures”,
Intermetalics 13: 387-392. (2005).
32. S. UKAI, T. OKUDA,, et al. “Characterization of High Temperature Creep Properties in
Recrystalized 12Cr-ODS Ferritic Steel Claddings”, Journal of Nuclear Science and
Technology 39.8: 872-879. (2002).
33. M. L. HAMILTON, et al. Fabrication Technological Development of the Oxide
Dispersion Strengthened Alloy MA957 for Fast Reactor Applications, PNNL-13168
(2000).
34. B.O. LEE, et al.. “The Preliminary Performance Analysis of the Transmutation Fuel for
HYPER”, Korea Atomic Energy Research Institute, Taejon, Republic of Korea. year
35. T. TAZIKUA, et al.. “Conceptual Design Study of an Accelerator-based Actinide
Transmutation Plant with Sodium-cooled Solid Target/ Core”, Japan Atomic Energy
Institute. Tokai-Mura, Naka-gun, Ibaraki-ken, Japan.
36. A.L. PITNER and R.B. BAKER. “Metal Fuel Test Program in the FFTF”, Nucl. Matls.
204. 124-130, North-Holland. (1993).
37. W. MARSHALL, Nuclear Power Technology, Vol 1: Reactor Technology, Clarendon
Press, Oxford, pp. 316 (1983).
38. B.O. LEE, W.S. PARK, Y. KIM, T.Y. SONG, “The Comparison of the Performance for
the Alloy Fuel and the Inter-Metallic Dispersion Fuel by the MACSIS-H and the
DIMAC”, Korea Atomic Energy Research Institute, Taejon, Republic of Korea (2002).

59
39. K. W. BUDLONG-SILVESTER, K.W., J. F. PILAT,, Safegaurds and Advanced Nuclear
Energy Systems: Enhancing Safeguardability. Los Alamos National Laboratory. (Oct. 14,
2003)
40. Report on the Preferred Treatment Plan for EBR-II Sodium Bonded Spent Nuclear Fuel.
Office of Nuclear Energy, Science and Technology, U.S. Department of Energy.
(October, 2003)
41. D. BODANSKY, “Reprocessing spent nuclear fuel.” Physics Today. 80-81. (Dec., 2006).
42. J. KANG, F. Von HIPPEL, The limited proliferation-resistance benefits of the nuclear
fuel cycles being researched by the Department of Energy’s Advanced Fuel Cycle
Initiative. (June 8, 2005)
43. Pyrochemical Separations in Nuclear Applications: A Status Report. Nuclear Energy
Agency, Organisation for Economic Co-operation and Development. (2004)
44. X. WU, et al. An Analysis of the Melt Casting of Metallic Fuel Pins - DOE's Quarterly
Review meeting in Albuquerque, NM. University of Nevada Las Vegas. (Jan. 22, 2003).
45. X. WU, et al. Design and Analysis for Melt Casting Metallic Fuel Pins. University of
Nevada, Las Vegas. (May 15, 2005).
46. Y. CHEN, et al., Phase I: Design and Analysis for Melt Casting Metallic Fuel Pins
Incorporating Volatile Actinides, UNLV-AAA University Participation Program. (Nov.
15, 2002).
47. B.A .HILTON, J. R. KENNEDY, S. L. HAYES, D. C. CRAWFORD, Metallic Fuels for
Actinide Transmutation. Presented at 9th OECD/NEA Information Exchange Meeting on
Actinide and Fission Product Partitioning and Transmutation, September 25, 2006.
48. J. R. KENNEDY, Characterization of Actinide Alloys as Nuclear Transmutation Fuels,
EMPT-8. (Oct. 10, 2004)
49. G. F.MAUER,, Design and Evaluation of Processes for Transmuter Fuel Fabrication,
Report. University of Nevada Las Vegas. date
50. G. F. MAUER, Design and Evaluation of Processed for Fuel Fabrication: Quarterly
Progress Report #3, University of Las Vegas Nevada. (March 1, 2002).
51. F. VON HIPPELl, Managing Spent Fuel in the United States: The Illogical of
Reprocessing, <www.fissilematerials.org> (Jan. 2007).
52. Nuclear Regulatory Commission. Advisory Committee on Nuclear Waste 172nd Meeting.
Rockville, Maryland. (July 20, 2006).
53. C. de OLIVEIRA and A.GODDARD, “EVENT—A Multi-dimensional Finite Element
Spherical-Harmonics Radiation Transport Code,” Proc. Int. Seminar 3-D Deterministic

60
Radiation Transport Codes, Paris, France, December 2–3, 1996, Organization for
Economic Cooperation and Development (1996).
54. N.F. LANDERS, L.M. PETRIE, and D.F. HOLLENBACH, “CSAS: Control
Module for Enhanced Criticality Safety Analysis Sequences,” NUREG/CR-200,
Rev. 7, Vol. 1 Section C4, ORNL/NUREG/CSD-2/V1/R7 (2004).
55. “SCALE: A Modular Code System for Performing Standardized Computer
Analyses for Licensing Evaluation,” NUREG/CR-0200, Rev. 5
(ORNL/NUREG/CSD-2/R5), Vold. I, II, and III, Oak Ridge National
Laboratory/U.S. Nuclear Regulatory Commission (Mar. 1997).
56. L. A. El-GUEBALY, Shielding Design Options for the TF Magnets of ITER, Proc.
IEEE, 1989.
57. W. M. STACEY, Fusion: An Introduction to the Physics and Technology of Magnetic
Confinement Fusion. Wiley-Interscience, New York, 1984.
58. ITER General Design Requirements Document, S10 GDRD 2 95-02-10 F1.0 (1995).
59. M. S. KAZIMI and N. E. TODREAS, Nuclear Systems I: Thermal Hydraulics
Fundamentals, Hemisphere Publishing Corporation, New York pp 22-27, 295-338, 356-
360, 450-451 (1990).
60. K. K. WONG, Properties of Lithium Niobate. Institution of Engineering and Technology.
“Electrical Conductivity of LiNbO3.” pg 91-97. February 2002.
61. ODS Properties website www.unm.edu/~isnps/online/presentations/MAODS.pdf
62. ITER Technical Basics, “Divertor”, www.iter.org
63. Fluent/Gambit, Version 6.1.22/s.1.2, “Computational Fluid Dynamics”, Fluent Inc.
(2004).
64. V. KOMAROV, A. LABUSOV, and A. MALKOV., “Acceptable Mechanical Properties
of CuCrZr Cooling Tubes of ITER Divertor Plasma Facing Components”, Plasma
Devices and Operations, 2002, Vol. 10, pp. 17-26
65. “Triton: A Two-Dimensional Depletion Sequence for Characterization of Spent Nuclear
Fuel,” NUREG/CR-200, Rev. 7, Vol. I Section T1, ORNL/NUREG/CSD-2/R7 (2004).
66. “ORIGEN-S: Scale system Module to Calculate Fuel Depletion, Actinide Transmutation,
Fission Product Buildup and Decay, and Associated Radiation Source Terms,”
NUREG/CR-200, Rev. & (ORNL/NUREG/CSD-2/V2/R7) Oak Ridge National
Laboratory (2004).

61
67. W. M. STACEY, Fusion Plasma Physics, Wiley-VCH Verlag GmbH & Co. KGaA,
Weinheim (2005).
68. W. M. STACEY, Nuclear Reactor Physics, John Wiley & Sons, New York (2001).
69. J.L. KLOOSTERMAN and J.C. KUIJPER, “VAREX, a Code for Variational Analysis of
Reactivity Effects: Description and Examples”, PHYSOR 2000. Seoul, South Korea,
October 7-10 2000. ANS.
70. H. H. HUMMEL and D. OKRENT, Reactivity Coefficients in Large Fast Power
Reactors, American Nuclear Society (1970).
71. Y. S. TANG, et al., Thermal Analysis of Liquid Metal Fast Breeder Reactors, American Nuclear Society (1978).
72. C. NAM, W. HWANG, and D. SOHN. “Statistical Failure Analysis of Metallic U-10ZR/HT-9 Fast Reactor Fuel Pin by considering the Weibull distribution and Cumulative Damage Fraction.” , Annals of Nuclear Energy 25.17 (1998): 1441-1453.
73. A.E. DUBBERLEY, C.E. BOARDMAN, K. YOSHIDA, and T. WU. “Super PRISM
Oxide and Metal Fuel Core Designs.” Proceedings of 8th International Conference on
Nuclear Engineering (ICONE-8), Baltimore, MD USA (2000).
74. B. LEE and T. SONG. “The Preliminary Performance Anaylsis of the Metal Fuel for the
Lead Cooled Critical Transmutation Reactor”, Proceedings of GLOBAL 2005,
Tsukuba, Japan (2005).
75. C. B. A. FORTY, P.J. KARDITSAS. "Uses of zirconium alloys in fusion applications."
Journal of Nuclear Matrials 283.287 (2000): 607-610.
76. C. DAMIANI. “ITER divertor maintenance L7 R&D project - results and perspectives.”
Fusion Engineering and Design. 51:52 (2000) 925-940.