Embed Size (px)
Citation preview
1
A Typology of Food Security in Developing Countries
under High Food Prices
Bingxin Yu
Postdoctoral Fellow
Development Strategy and Governance Division
International Food Policy Research Institute
2033 K ST NW, Washington DC 20006 USA
Tel: 1-202-862-8114, Email: [email protected]
Liangzhi You
Senior Scientist
Environment and Production Technology Division
International Food Policy Research Institute
2033 K ST NW, Washington DC 20006 USA
Tel: 1-202-862-8121, Email: [email protected]
Shenggen Fan
Division Director
Development Strategy and Governance Division
International Food Policy Research Institute
2033 K ST NW, Washington DC 20006 USA
Tel: 1-202-862-5677, Email: [email protected]
Contributed Paper prepared for presentation at the International Association of
Agricultural Economists Conference, Beijing, China, August 16-22, 2009
Copyright 2009 by Bingxin Yu, Liangzhi You and Shenggen Fan. All rights reserved. Readers
may make verbatim copies of this document for non-commercial purposes by any means,
provided that this copyright notice appears on all such copies.
2
Abstract
The recent surge in food prices around the world may reverse the gains of reducing
hunger and poverty in the recent years. This paper employs factor and sequential typology
analysis using data for 175 countries to identify groups of countries categorized according to four
measures of food security: utilization, availability, accessibility and stability. Nine indicators are
used for this study: calories intake, protein intake, fat intake, food production, the ratio of total
exports to food imports, soil fertility, length of growing period, coefficient of variation of length
of growing period and urbanization. The analysis first identifies 5 distinct food security groups
characterized by food intake then further split these groups based on similarities and differences
across the various measures of food production, trade security and agricultural potentials. The
result suggests that the general category of “developing countries” is very heterogeneous and is
not very useful if the focus is on issues of food security. Our food security classification is
aligned with national income level and malnutrition status, but does not perfectly map to poverty
headcount. The analysis provides tailored policy recommendations focusing on agricultural
production for countries sharing the same typology.
Key Words
Food security, factor analysis, agricultural potential, typology, trade
JEL Code
C0, F0, O1
3
1. INTRODUCTION
Food security has been an ongoing concern of governments and international
organizations. In 1990, the international community set an ambitious goal to reduce hunger and
poverty in half by 2015. While a number of countries are currently on track, for many others, it
remains a challenge.
Food price increases between 2005 and 2008 have dampened global efforts fighting
poverty. High food prices pushed around 200 million more people into extreme poverty, and
about half of them will remain trapped in poverty in 2009 even as food prices recede from their
peaks. The sharp slowdown in economy growth resulting from the financial crisis can seriously
set back progress on poverty reduction and other MDGs. According to FAO (2009), estimates of
the poverty impact of the growth slowdown range from 55 million to 90 million more extreme
poor in 2009 than expected before the crisis. These numbers will rise if the crisis deepens and
growth in developing countries falters further.
Also, the food crisis and now the global financial crisis are reversing past gains in
fighting hunger and malnutrition. Before the onset of the food crisis in 2007, there were about
850 million chronically hungry people in the developing world. This number rose to 960 million
people in 2008 and is expected to climb past 1 billion in 2009, breaking the declining trend in the
proportion of hungry people in the developing world and seriously jeopardizing the goal of
halving this proportion by 2015.
In addition to increasing food insecurity, particularly among the poor, high food price is
threatening the broader development agenda as the rise in food prices has led to many riots in
countries which depend heavily upon maize, wheat and rice imports and thus are more affected
by the high commodity prices. Haiti, Burkina Faso, Guinea, Mauritania, Senegal, Egypt,
Cameroon, Cote d'Ivoire, Ethiopia, Somalia, and Madagascar have experienced food induced
social unrest and riots. The long-run consequences of the crisis for human development
outcomes may be more severe than those observed in the short run. For example, the decline in
health status among children who suffer from reduced (or inferior) food consumption can be
irreversible, retarding growth as well as cognitive and learning abilities. Estimates suggest that
the food crisis has already caused the number of people suffering permanent damage from
malnutrition to rise by 44 million. The financial crisis will exacerbate this impact as poor
households respond to decreases in income by further cutting the quantity and quality of food
consumption. These trends call for maintaining the momentum of recent efforts to boost
agricultural investment and productivity.
While food prices have receded since mid-2008, they remain high by historical standards,
and the food crisis is by no means over. At the country level. Net food exporters benefit from the
high prices with favorable terms of trade, although some countries are missing out by banning
exports to protect domestic consumers. On the other hand, net food importers are struggling to
meet domestic demand. The high food price has especially hit many African countries as most of
them are net cereal importers. But even within the net exporting countries, many poor may suffer
if they are net buyers of cereals. This is particularly detrimental to the poorest poor as they often
spend 60-80% o their income on food. For net food importing countries, not only does the
poorest will suffer even more disproportionately, increased food importing bills may also crowd
4
out other imports such as energy and technology intensive equipment. Thus, it is important to
understand the level of food security in countries and under what conditions.
The World Food Summit defined the multiple dimensions of food security as food
accessibility, availability, food use and stability. Using factor and sequential analysis, we
develop a classification of 175 countries based on their various aspects of food security. This
approach stems from Adelman & Morris (1967) who argue that development is a multifaceted
and nonlinear process and countries at different development stages require different strategies.
Using factor analysis, they classify each country’s growth according to the country’s
characteristics, focusing on social and political variables. This paper contributes to the typology
of food security by taking a more aggregate viewpoint and by classifying countries according to
the various dimensions of food security. This is an attempt by taking into account of
comprehensive driving forces behind the concept of food security over time. In the long run, the
only sustainable way to cope with food security issue is to boost food production through
increased food supply through boosting investment in agricultural sector. Hence, the analysis
considers not only the traditional perception of food production and nutritional intake, but also
the potential to augment food supply by considering constraints of natural endowment. In
addition, the role of nonagriculture in the economy and a country’s ability to afford importing
food from the international market is included in the analysis.
Previous efforts by Diaz-Bonilla et al. (2000) are a snapshot of food security situation in
the middle of the 1990s. This study further extends their work and serves three objectives: to
assess food security in a nutritional dimension (utilization), to investigate the sources of food
insecurity in a food availability dimension, to identify potentials to achieve food security or self-
sufficiency in a food stability dimension. The resulting classification allows for a broader view
of the problem: which countries face similar situations and, therefore, may learn from each
other’s successes and failures to address food security issues? Additionally, this will allow
conventional sub-national analyses to be more easily transferred across countries. Since
agricultural sector is the most common and fundamental instrument to improve food security in
the long haul, what kind of policy is most effective in attaining increased crop production? Are
similar countries clustered at regional levels or do they vary across continents? If regions are
populated by similar types of countries, then regional solutions may offer more effective
solutions than a country-by-country approach. While standard measures such as per capita
income levels and net food imports are useful, we find a more nuanced picture using a broader
array of indicators because the more conventional measures ignore the structure of the economy,
natural environment conditions, and the composition of trade. For instance, tourist destinations
like Barbados may have high levels of food imports but they are not at risk of food insecurity. In
general, we find that country specific measures (composition of trade and comparative
advantages) provide a more accurate indication of food insecurity than broader regional
characteristics.
The rest of the paper is organized as follows. The framework for food security analysis is
presented in the next section, including a rationale for the selection of food security indicators
considered for the typology analysis. The third section briefly describes the methodology used in
this study – factor analysis and presents the results of the sequential typology analysis, ending
with a classification of countries according to the food security framework defined. In the fourth
section, the suggested typology of countries is discussed in greater detail considering the variety
5
of country situations. The evolution of food security since 2000 is discussed in the fifth section.
Finally the last section concludes with some implications from the food security profiles
summarized in this study for a better systematic approach to identify representative countries.
Typology specific policy recommendations are also included in this section.
2. THE FRAMEWORK FOR FOOD SECURITY
2.1 Theoretical Framework
Food security can be analyzed at the global, national, regional, household, and individual
levels. Concepts of food security have evolved in the last thirty years to reflect changes in
official policy thinking (Clay, 2002; Heidhues et al., 2004). The history of food security
definitions shows that, the focus has moved from the global and national perspectives to the
household and individual levels, where the problem of food security emerges in a more concrete
way (Maxwell, 1990, 1996). The term first originated in the mid-1970s, when the World Food
Conference defined food security in terms of food supply to assure the availability and price
stability of basic foodstuffs at the international and national level: “food security exists when all
people, at all times, have physical and economic access to sufficient, safe, and nutritious food to
meet their dietary needs and food preferences for an active and healthy life” (FAO, 1996a). The
definition was revised by FAO to include the individual and household level, in addition to
regional and national level aggregation in food security analysis (Clay, 2002). The widely
accepted World Food Summit definition reinforces the multidimensional nature of food security
including food accessibility, availability, utilization and stability.
This paper, acknowledging that the deeper issue of food insecurity requires analyses at
the household and individual levels, takes nonetheless a national perspective and focuses mainly
on food availability and utilization issues, using consumption, production, and trade measures
suggested by Smith (1998). We do not intend to address sub-national income or food
consumption inequalities in this paper and the results are simply an examination of food security
at national level. We do recognize that there are other possible measures of the food security that
may generate different conclusions.
One contribution of this study is to include indicators of long-term solutions to steady
food insecurity -- to improve food availability by taking advantage of the country’s agricultural
potentials. Agriculture is imperative in promoting not only overall growth but also pro-poor
growth given that most of the poor depends upon agriculture for their livelihood. Agriculture
contributes to food security by increased food access and farming incomes allowing for better
nutrition and thus higher productivity (Bliss and Stern, 1978; Strauss, 1986; Strauss and Thomas,
1995; Fogel, 1991, 1997; Williamson, 1993; Nadav, 1996). It is found that agricultural outputs
per worker and per capita food production index have a large and statistically significant impact
on reducing poverty (Majid, 2004). At the national level, Irz et al. (2001) argued that increase in
agricultural output tends to drive down food prices which benefit the poor. Therefore it is not
surprising to find that agriculture has a more substantial impact on reducing poverty and
improving food security than other sectors of the economy.
6
Increased food production would help to restore the supply-demand balance at a lower
price level. High food prices and the increased incentives they provide present an opportunity for
agricultural producers to increase investment and expand production. Initial statistics indicate
that the agricultural sector has responded to these greater incentives with increased planting and
production (FAO, 2008a). The need to raise food production should not be limited to current
status. Instead, increases in food and agricultural production and productivity will be essential to
meet further increases in growing effective demand in the future. In order to meet this global
food challenge, a central question relates to who participates in the short- and long-term response
of agriculture to high food prices. Developing countries need to exploit their potential to increase
agricultural production and productivity to achieve food security and self-sufficiency if possible,
through a more conductive policy framework and increased investment in agricultural and rural
development. For instance, if soil and temperature conditions are suitable for crop production but
rainfall might be erratic and volatile in a country, investment in irrigation and water reservation
related technologies is more effective in improving crop production and productivity. Based on
climate and soil conditions, policies to exploit potentials for increasing agricultural supply can be
developed accordingly.
The framework and theoretical logic flow of this exercise on food security typology is
illustrated in Figure 1. First food utilization of the nutritional dimension is identified based on
three indicators: calorie, protein and fat intake, which is driven by food availability and
accessibility. Next food accessibility is proxied by the rate of urbanization, while domestic
production and international trade define food availability. Both food availability and
accessibility are determinants for adequate utilization of food. Agricultural potentials, including
length of growing period, variation of length of growing period, and soil quality, are important
preconditions for long term food supply or production. On the other hand, trade and trade
policies influence both national and world food availability, as well as the cost of food imports
(including food aid) at the national level. This food utilization – availability and accessibility –
stability sequential approach allows us to distinguish outcome of food security (food utilization)
from causes (food stability, accessibility and availability), providing more tailored policy
recommendations for each food security group.
2.2. Food Security Indicators at the National Level
The indicators used in this study are considered proxies for four dimensions of food
security measured at the national level: food utilization, availability, stability and accessibility.
For better cross-country comparison and classification, the four dimensions are expressed in nine
variables. Calories, protein and fat per capita intake are chosen to represent utilization of food
through adequate diet from a nutritional point of view. For availability of sufficient quantity of
food, we use food production per capita and the ratio of total exports to food imports. Food
accessibility is expressed as the share of non-agricultural population to capture the inequality
along rural/urban sub-groups. A population needs steady supply to be food secure in both short-
and long-run, which is depicted by three agricultural potential variables: length of growing
period and soil fertility for long-term stable food crop cultivation and coefficient of variation for
variability or riskiness in domestic food supply.
7
The data for constructing the seven indicators were taken from the FAO online database
(FAOSTAT, 2008b), aggregate at national level from FAO GIS database (2001), FAO (2000)
and World Development Indicators by the World Bank (2008). The latest five-year average in
the decades of 2000s, which for most countries is available for 2001-2005, was used for the
analysis. The data set shown in Appendix Table 1 covers 175 countries for which data exist,
ordered alphabetically. Those 175 countries and regions comprise 50 low, 50 lower middle, 34
upper middle, and 41 high income countries, according to the World Bank’s definition. Although
it would be desirable to assign more indicators to each of the dimensions defined above, data
availability is limited, especially for food accessibility indicators.
Food utilization
Calories, protein and fat per capita: Three separate variables are used as indicators of
average consumption levels at the national level: energy intake per capita per day measured in
calories, and nutrient intake (protein and fat) per capita per day measured in grams. While
national averages have limitations as indicators of household and individual food and nutrition
security, Smith and Haddad (2000) show that aggregate calories (which they label food
availability) is an important variable in explaining changes in malnutrition as defined by
anthropometrical measures of children1. Yet measures based only on consumption of calories
(such as the chronic malnourishment indicator used by the FAO), have been criticized, among
other things, for ignoring protein and micronutrient consumption (Smith, 1998; von Braun et al.,
1992, 2000). Consistent data on micronutrients at the national level are difficult to obtain, and
this analysis uses time series for both calories and nutrients from FAOSTAT (2008b), thus
improving upon a calories-only measure2.
Food availability
Food production per capita is an indicator of the ability of countries to feed themselves.
It tries to address both the notion of insurance and national autonomy, used mainly in some
developed countries, as well as the more pressing problems of poverty and hunger in developing
countries. This variable is calculated by the FAO as the vector of quantities of total food
production in every year multiplied by the 1999-2001 average international commodity prices in
international dollars, and then divided by total population of the corresponding year. Therefore,
all values are in constant international dollars of 1999-2001. The definition of food is the one
followed by FAOSTAT (2008b), which includes not only cereals, oils, and livestock products,
but also other products such as fruits, pulses, roots and tubers, other vegetables, cocoa, and sugar.
1 Aggregate calories is shown to be the second most important determinant to contribute to the decrease in child
malnutrition over the period 1970 to 1996, contributing to 26 percent of the decline, while women’s education, the
most important factor, explained 48 percent of that decline. The impact of the first determinant, however, decreases
at higher level of food availability. 2 Bouis (2000) presents evidence showing that the animal component of food intakes is more strongly correlated
with direct measures of nutrition such as weight-for-age, or blood hemoglobin, a marker of iron status. In that sense,
the animal portion of proteins, instead of total proteins, could have been utilized in this exercise.
8
In terms of the contribution to calories, proteins, and micronutrients, the FAO category appears
to be more adequate than narrower definitions of food, particularly those based only on cereals.3
The ratio of total exports to food imports is an indicator of the ability of different
countries to finance their food imports out of total export revenues (i.e. a measure of access to
world food supply by individual countries).4
Total exports include merchandise and services,
such as tourism. This indicator, which has been used in different early studies of food security
(see for instance, Valdes and Konandreas, 1981), is more relevant for food security analysis than
the net food trade position (i.e. food exports minus food imports). This last indicator only reflects
the fact that a country is a net food importer or exporter, but not the relative cost for access to
food in each individual country, and therefore how vulnerable it may be to changes in food
prices and international food availability. A country that is a net food exporter but for which the
total food bill takes a larger percentage of total exports (for example Bangledesh, with a food bill
of about 20 percent of total exports) is likely to be more vulnerable than a country that is a
substantial net food importer but whose food bill takes only a small percentage of its total
exports (for example Venezuela spends about 5.7 percent of total exports, which include
substantial oil sales, on imported food).
The ratio of the food import bill over total exports also presents a broader and more
adequate picture of the role of trade, and the possible impact of trade policies, on food security.
Focusing only on the value of the food import bill (gross or net) does not take into account the
broader contribution of trade to food security, which is not only the availability of food in world
markets, but also the generation of export income to finance those imports. A country whose
food import bill goes up may still be less vulnerable if at the same time its total exports have
gone up by a larger amount. Conversely, a country may be more vulnerable even with declining
food import bills, if exports receipts have dropped even more. Therefore, in the context of trade
policies the important issue is whether total exports have grew faster as a result of those policies
by more than the food import bill.
Appendix Figure 1 shows the ratio of the food bill to total exports for the low, lower
middle, upper middle, and high income countries in the sample. While the ratio remains high for
low and lower middle income countries, there is a downward trend of relative cost of food
imports. This trend is most visible among low income countries, where ratio of food bill to total
exports declines from about 20 percent in the early 1990s to 12 percent in 2005. Lower middle
income countries also see a drop in the food bill of about 6 percentage point over the same period.
Although the magnitude of decline is smaller in upper middle and high income countries, this
ratio also decreases from 9 percent in mid-1990s to 6 percent in 2005. Unlike distinctive trend
for low and lower middle income countries, upper middle income countries share almost
3 FAO data for food production does not include fish and fish products. These food items are not part of the product
coverage of the Agreement on Agriculture but their importance for food security may be high, particularly for some
developing countries and social groups. For example, Delgado et al. (1998) discuss the importance of fisheries in
developing countries. 4 This variable is usually measured as food imports over total exports, i.e. the inverse of the ratio used here. As
calculated in this paper, higher (lower) values would indicate more (less) food security and the variable could be
interpreted similarly as consumption of calories and proteins, and food production. This makes the charts used in
this analysis easier to read.
9
identical ratio and trend. However, the recent high food prices and global recession resulted in a
reversal of this downward trend.
In terms of trade and food security, a point to be noticed is that the decline in the ratio
during the last decade for low and lower middle income countries has been related to the
expansion of total trade, and not to a decrease in food imports, which have been growing (but at
a slower rate than total exports). Appendix Figures 2a-2d show the values of the food bill and
total merchandise and service exports (measured in billions of current dollars) for low, lower
middle, upper middle and high income economies, respectively. Although the cost of food
imports has increased over time in all income countries at all income levels, the volume and
value of total merchandise exports has grown even more during those years, as a result of
buoyant economic conditions at the world level. For instance, food import in low income
countries in 2005 grew to 3.3 times of its 1990 level, and at the same time total exports reached
nearly 5 times of 1990 level. The jump in food prices during 1995-1996, which generated
widespread concern at the time (Friedberg and Thomas, 1997; FAO, 1999), is barely perceived,
if at all, in the data presented. Conversely, with declining food prices after the 1997 Asian crisis
(and further reverberations in Russia during 1998 and Brazil in 1999), the ratio clearly went up,
especially in low and lower middle income economies, showing a deterioration of the ability to
finance food imports, which was basically caused by a decline in total value of exports.
Although the ratio of food imports to total exports in low and lower middle income
countries has declined in the 2000s compared to the 1990s, the burden of the food import bill is
still very high in those countries. Furthermore, the increase of total exports by these countries has
been slower than the expansion of aggregate world trade. Since data used in this study only
reflects figures up to 2005, the ratio is expected rise dramatically for some net food importing
countries during the peak of food crisis in 2007-2008. The current slowdown of world economy
will certainly exacerbate trade positions of some low and lower middle income countries whose
trade structure consists of raw material exports and cereal imports. In summary, these
observations underscore the importance of looking at food imports in the context the evolution of
trade in general. The ratio used here appears more appropriate than the net food importing
measure to identify vulnerable countries and to help evaluate the impact of trade issues in
general, and not just on food (which is only a part of agricultural exports).
Food accessibility
Non-agricultural population: An indicator of food accessibility is the share of non-
agricultural population, which gives an idea of the extent to which countries may be affected by
changes in trade and agricultural policies, and the possible distributive impact along the
rural/urban dimension. There are concerns in some developing countries that certain agricultural
and trade policies (like removal of fertilizer subsidy) may create problems for their large
agricultural populations, where poverty is still concentrated. At the same time it is also important
to notice the shift in the locus of poverty, food insecurity, and malnutrition from rural to urban
areas that different developing countries are experiencing. Some of them exists for several
decades now, some others as a more recent phenomenon (Ruel et al., 1998; Ruel et al., 1999;
Haddad et al., 1999; Garrett and Ruel, 2000). Therefore, while for the other indicators
(consumption per capita of calories, proteins and fat, food production per capita, and total
10
exports per unit of food import) a higher value would be associated with greater food security,
the ratio of urban population may be somewhat more ambiguous in its implications.
Urbanization in developing countries is posing new questions regarding economic and
social policies. The world’s urban population has grown more than the rural population. Sixty-
one percent of the world’ populace will be in urban areas in the next three decades (Cohen, 2006).
However, three quarters of the poor remain in rural areas and poverty will continue to be more
prevalent in rural areas (Ravallion, Chen and Sangraula, 2007). Ideally, ratio of agriculture
investment in agricultural GDP will capture the supply side of food security. However, since data
for the 175 countries is scarce we look at the demand side of food security equation. The share of
non agricultural population indicates impact of net food buyers, which is becoming a larger share
of people affected by rising food prices.
Food stability
Length of growing period (LGP): LGP is defined as the number of days in a year when
sufficient water is available in the soil profile to support plant growth. The concept of the
growing period provides a way of including seasonality in land resource appraisal. In many
tropical areas, conditions are too dry during part of the year for crop growth to occur without
irrigation, while in temperate climatic regimes crop production in winter is limited by cold
temperatures. The growing period defines the number of days of the year when both natural
moisture and temperature conditions are suitable for crop production (FAO, 1996b). It provides a
framework for summarizing temporally variable elements of climate, which can be compared
with the requirements and estimated responses of a plant. Such parameters as temperature regime,
total rainfall, soil properties and potential evapotranspiration are more relevant when calculated
for the growing period, when they may influence crop growth, rather than averaged over the
whole year. Length of growing period is calculated and mapped globally at a scale of 30 minutes
based on spatially interpolated 40-year average climatic data of temperature, humidity and
elevation (Fischer, et al. 2001). A map of length of growing period overlaid with country border
is presented in Figure 2, which highlights countries with favorable (long) growing period are
clustered around equator and west Europe.
Coefficient of variation of length of growing period: While length of growing period may
be acceptable for broad scale national studies, it fails to capture the temporal year-to-year
variation in length of growing period and the incidence of climatic hazards. The coefficient of
variations of length of growing period is introduced to fill the gap. It is calculated as the ratio of
standard deviation to the mean of length of growing period, allowing us to compare the scatter of
rainfall and temperature variations on a year-to-year basis. A map of length of growing period
overlaid with country border is presented in Figure 3. Countries with more erratic or irregular
rainfall patterns (a CV of LGP greater than 1) include some Middle East and North African
countries like Djibouti, Egypt, Jordan, Kuwait, Saudi Arabia, United Arab Emirates, Yemen, as
well as Namibia and Pakistan.
Soils without major constraints: This indicator reflects the percentage of soils without
major constraints in the total areas. In order to translate soil characteristics into agronomic
constraints, one of the best known methods, the fertility capability classification (FCC) is used
11
(Sanchez et al., 1982). This characterizes soils by means of a set of fertility constraints, that is,
inherent features which offer problems to soil management. The FCC criteria were linked with the
mapping units of the Soil Map of the World to derive country level soil constraints. All data reported
on inherent soil constraints apply to the total areas of regions or countries, not to their arable land, or
agricultural land. Thus, for example, the areas showed as having erosion hazard and shallowness
include mountainous regions in which little or no attempt at agricultural use is made. For the world’s
land area as a whole, there are four major constraints (erosion hazard, aluminum toxicity,
shallowness and hydromorphy), each occupying 13-16% of the global area. Four other constraints
(salinity and sodicity, low cation exchange capacity, high phosphorus fixation and vertic properties)
each cover 2-6% of the area. Soil quality analysis can be used for preliminary assessment of potential
development strategies, or potential for soil management technology transfer (Nachtergaele and Brinkman, 1996).
A range of soils exists which are not affected by any of the eight major constraints
covered above. Some are in dryland and others possess constraints within the soil fertility
capability classification, because they are either less severe or of relatively low extent5. Based on
the method by which these have been identified, they may be referred to simply as soils without
major constraints. In terms of the classes shown on the Soil Map of the World, just under a
quarter of the world’s land area has soils which lack the major constraints of the fertility
capability classification (FAO, 2000). North Asia (east of the Urals) has the largest total and
relative extent with 40 percent of total area without any major soil fertility constraints. Europe
and North America follow at 31 and 27 percent, respectively. Twenty-three percent of total area
is fertile in the Asia-Pacific region. Less than 20 percent of land area contains soil without any
major constraints in Sub-Saharan Africa and South and Central America. The figure in North
Africa and the Near East is only 9%, to which the constraint of dryness must be added due to
widespread desert and low rainfall.
A map of soil fertility by country is presented in Figure 4. A notable feature of the
country-level soil fertility results is that 22 of the 36 countries with over 40% soils without major
constraints lie in Europe. This includes the extension of the Ukraine and adjacent countries.
Among non-European countries, the greatest total extent by far is found in the Russian
Federation. Next in order of absolute area are the United States, Canada, China, Australia, India
and Argentina. There is a striking coincidence between countries with high total areas of soils
without major constraints and the world’s leading grain-producing and exporting countries. It is
worth pointing out that although some countries have vast fertile land measured in absolute area,
the share of fertile soil in total area might not follow the suit. For example, only 20 percent of
land area is fertile in China, even though it is one of the top countries when measured in the area
of high quality soil.
Table 1 summarizes definitions and sources of the 9 indicators, and descriptive statistics
are included in Table 2.
5 These additional constraints are: acidity; dominance of allophane in the clay fraction (Andosols); potassium-
deficiency; free calcium carbonate; acid sulphate soils (cat clays). Dryness (an ustic or xeric soil moisture regime) is
also recognized by the fertility capability classification as a soil limitation.
12
3. FACTOR ANALYSIS OF FOOD SECURITY
Factor analysis is a statistical method used to describe variability among observed inter-
correlated variables in terms of fewer unobservable (latent) variables called factors. The
observed variables are modeled as linear combinations of the factors, plus "error" terms. It is a
form of data dimensionality reduction, and the information gained about the interdependencies
can be used later to condense variables into fewer dimensions with a minimum loss of
information.
Factor analysis is based on the correlation matrix of the variables involved. Suppose we
have a set of p observable random variables 𝑥1, … , 𝑥𝑝 with means 𝜇1,… , 𝜇𝑝 . Assume for some
unknown constants 𝑙𝑖𝑗 and k unobserved random variables 𝐹𝑖𝑗 , where 𝑖, 𝑗 = 1, …𝑝. For k<p we
have 𝑥𝑖 − 𝜇𝑖 = 𝑙𝑖1𝐹1 + ⋯ + 𝑙𝑖𝑝𝐹𝑝 + 𝜀𝑖 .
Here 𝜀𝑖 is independently distributed error terms with zero mean and finite variance,
which may vary for different i.
Let 𝑉 𝜀𝑖 = 𝜓𝑖 , so that we have 𝐶𝑂𝑉 𝜀𝑝×1 = 𝐷𝑖𝑎𝑔 𝜓1, …𝜓𝑝 = Ψ and 𝐸 𝜀 = 0. In
matrix terms, we have 𝑥 − 𝜇 = 𝐿𝐹 + 𝜖.
Also we will impose the following assumptions on F:
1. F and 𝜖 are independent;
2. 𝐸 𝐹 = 0;
3. Cov(F)=I(k).
Any solution for the above set of equations following the constraints for F is defined as
the factors, and L as the loading matrix. Suppose 𝐶𝑂𝑉 𝑥𝑝×1 = Σ𝑝×𝑝 , then we have 𝐶𝑂𝑉 𝑥 −
𝜇=𝐶𝑂𝑉𝐿𝐹+𝜖, or Σ=𝐿𝐶𝑂𝑉𝐹𝐿′+𝐶𝑂𝑉𝜖=𝐿𝐿′+ Ψ.
Factor analysis is used to isolate the underlying “factors” that explain the variance of a
group of variables. It is an interdependence technique and the complete set of interdependent
relationships is examined. It allows us to reduce the number of variables by combining two or
more variables into a single factor. It also assists in the identification of groups of interrelated
variables and to see how they are related to each other. Factor Analysis can be used to identify
the hidden dimensions or constructs which may or may not be apparent from direct analysis.
However, the usefulness of factor analysis depends on the researchers' ability to develop a
complete and accurate set of product attributes. The selection of the variables is crucial because
the derived factors would only reflect the structure of the data set as defined by those variables.
If important attributes are missed the value of the procedure is reduced accordingly. Interpreting
factor analysis is based on using a heuristic approach, and more than one interpretation can be
made of the same data factored the same way. It is not possible to know what the “factors”
actually represent without theory or a prior knowledge. Also there is no specification of
dependent variables, independent variables, or causality.
13
There are several ways to conduct factor analysis and the choice of method depends on
many things (Hair et al., 1998). Although there have been heated debates over the merits of the
methods, a number of leading statisticians have concluded that in practice there is little
difference (Velicer and Jackson, 1990), since the computations are quite similar despite the
differing conceptual bases, especially for datasets where communalities are high and/or there are
many variables. For our purpose we will apply principal component analysis, which seeks values
of the loadings that bring the estimate of the total commonality as close as possible to the total of
the observed variance. The factors produced by principal component analysis are conceptualized
as being linear combinations of the variables, and results produced by principal component
analysis are not dependent on the method of computation.
Correlation coefficients are presented in Table 3, and high correlations are observed
among three nutritional indicators: calorie, protein and fat intake per capita per day. It is
suspected that there exist one or more common factors among the three variables and factor
analysis is applied to the three measures of nutrition intake. Generally speaking, calorie intake in
high correlated with protein and fat intake, with correlation coefficient ranging between 0.82-
0.91. To avoid giving more weight to any one variable because of its unit of measure, variables
are standardized to z-scores (subtracting the mean and dividing by the standard deviation). One
common factor is extracted from the three variables and it explains 90 percent of total variance
of the three variables. We name this factor as “food security” and it is expressed as the product
of factor loading and variables:
𝐹 = 0.961 ∗ 𝑐𝑎𝑙𝑜𝑟𝑖𝑒 + 0.959 ∗ 𝑝𝑟𝑜𝑡𝑒𝑖𝑛 + 0.929 ∗ 𝑓𝑎𝑡.
Factor scores are the scores of each country based on the caloric and nutrient intake
factors, which are widely used to portray the concept of food security. To compute the food
security factor score for a given country, one takes the country’s standardized score on each of
the three variables, multiplies by the corresponding factor loading of the variable for the given
factor, and sums these products. Computing factor scores allows us to rank countries for the
widely used nutritional or food utilization aspect of food security. In addition, factor scores can
be incorporated in subsequent analysis.
The food security score follows a standard normal distribution with mean equals to 0 and
variance equals to 1. The score ranges from -2.17 in Democratic Republic of Congo to 2.14 in
United States (Appendix Table 1). We first split the countries into 5 groups based on their food
security factor scores. Countries with food security factor scores falling below -1 are defined as
“Lowest Food Security”. The Low Food Security group has factor scores in the -1 and -0.5
ranges. Countries with factor score between -0.5 and 0 are considered to be in the “Middle Food
Security” category. Factor scores of nutrition consumption lie between 0 and 1 are labeled as
“Upper Middle Food Security”. Finally, Countries with food security factor scores above 1 are
considered “High Food Security”. The means of all nine indicators as well as GNI values, are
summarized for each food security group in Table 4. The map of the food security factor score is
included in Figure 5.
14
Since this study emphasis the food insecurity issue among countries, we will discuss the
former three groups in great detail while only briefly remark Upper Middle and High food
security countries.
4. TYPOLOGY ANALYSIS
We will employ a sequential method to generate a food security profile for the 175
countries included in this study, following the sample structure outlined in Figure 6 for each food
security group. First, countries of each food security group are separated according to the trade
security level, countries with a food imports accounts for more than 10 percent of total export
earnings on food imports are categorized as trade insecure, while countries spent less than 10
percent of total export on importing food from world market are trade secure. Second, countries
are further organized according to their food production level. If a country’s food production per
capita is below sample mean of 232 1999-2001 International dollars, it is classified as a low food
production country; otherwise, the country is a high food production country. At last, we will
arrange countries within each trade and production sub-groups into 4 sets, based on their
agronomical conditions: countries with high soil fertility and favorable climate, countries with
high soil fertility and unfavorable climate, countries with low soil fertility and favorable climate,
countries with low soil fertility and unfavorable climate. It is possible that not all sub-groups
exist within each food security group. For example, there are no trade insecure countries in the
High Food Security group, or no high food production countries in the Lowest Food Security
group.
Table 5 lists the countries based on their food security status and conditions of climate
and soil fertility. The level of food security is defined as Lowest, Low, Middle, Upper Middle
and High, and it increases as we move down the table. For example, the first panel includes
countries of lowest food security, classified in 2 sub-groups: trade secure and low production
sub-group and trade insecure and low production group. These countries are first grouped based
on their soil fertility conditions, using the sign of z-scores of percentage of soil without major
fertility constraints. “High soil fertility” refers to positive z-scores of percentage of soil fertility
and “low soil fertility” negative z-scores. Within each soil group, countries are further
disaggregated based on their climate conditions. We define “favorable climate” as positive z-
scores of temperature and rainfall conditions and “unfavorable climate” as negative z-scores.
Countries of the Low Food Security group are listed in the next panel of two rows, followed by
panels of the Middle and Upper Middle Food Security countries. The last panel of four rows
includes High Food Security countries.
Table 6 lists countries based on food security status and geographic location. The Lowest
and Low Food Security countries are overwhelmingly clustered in sub-Saharan Africa. Most
Latin American countries fall in the group of Middle and Upper Middle Food Security groups,
and the majority of West European and North American countries belong to the High Food
Security group.
15
The next section will analyze in greater detail these Food Security groups and their
composition. It provides an indicator of the degree of membership, thus allowing a deeper
understanding of the composition of groups and the differences between countries.
4.1 Lowest Food Security Group
The Lowest Food security group contains 31 countries. Countries in this group all have
food security factor scores below -1, and they suffer from the lowest levels of food intake
measured in calories (2,026), protein (50.3 grams) and fat (36.9 grams) per capita. These
countries have nutrition indicators that are all below the -0.5 threshold of their standardized z-
score values. They show the lowest levels of food production per capita ($94.4 in 1999-2001
International dollars) and have the lowest per capita income (GNI per capita only $395). The
food import bill for the group on average amounts to more than 15 percent of total exports, and
countries are predominately rural (only 31 percent of the population is urban). All but one
(Swaziland) countries are classified as low-income economies by World Bank.
The sequential typology analysis for the Lowest Food Security group is presented in
Figure 7. Of the 31 countries in this group, only 7 countries spend less than 10 percent of foreign
exchange earnings on food import: Cambodia, Laos, Tajikistan, Angola, Republic of Congo,
Swaziland and Zimbabwe.
Twenty-two countries in this group are located in sub-Saharan Africa: Burundi, Central
Africa Republic, Comoros, Democratic Republic of Congo, Eritrea, Ethiopia, Guinea, Kenya,
Liberia, Madagascar, Malawi, Mozambique, Niger, Rwanda, Sierra Leone, Tanzania, Uganda
and Zambia. Four countries located in East Asia and Pacific Rim are also classified as most food
insecure: Cambodia, Laos, Democratic Republic of Korea and Solomon Islands. In addition,
Bangladesh in South Asia, Yemen in Middle East and Haiti in Latin America and the Caribbean
are also in the Lowest Food Security group. Historically, a major source of food insecurity is
conflict, which happened in the majority of countries in this group in spite of long growing
periods.
Soil fertility is low in 19 countries but climate is favorable for crop cultivation in 11 of
them. Eight countries are endowed with low soil fertility and unfavorable climate, as indicated in
Table 5. More than half of countries in the Lowest Food Security group (17 countries) enjoy
favorable climate, and climate is favorable for agricultural production in 6 countries. However,
countries in this group do not generate enough food supply and average food production is below
$170, despite helpful weather and soil condition,.
4.2 Low Food Security Group
This group has low nutrition consumption but is better off than the Lowest Food Security
group, with consumption of 2,368 calories, 64.6 grams of protein and 55.6 grams of fat. Food
imports still account for a significant part (near 12 percent) of total export earnings, indicating
heavy reliance on international market and food aid. About one-third of the countries are trade
secure. Urbanization rate is significantly above the Lowest Food Security group, and about half
of its population lives in rural area. Countries in the Low Food Security group generally are all
16
low food producing countries, and food production per capita averages about 140 International
dollars.
This group includes 31 countries, 18 of which are low-income economies. There are 14
sub-Saharan countries in this group, of which 12 are low-income countries except for Botswana
and Namibia: Benin, Cameroon, Chad, Cote d'Ivoire, Gambia, Ghana, Guinea-Bissau, Lesotho,
Mali, Senegal, Sudan and Togo. Nine countries in Latin America and the Caribbean fall in this
group as well: Bolivia, Colombia, Dominican Republic, Guatemala, Honduras, Nicaragua,
Panama, Peru and Venezuela. Nepal, Pakistan, Sri Lanka and India are also Low Food Security
countries. This group also includes Philippine and Vietnam in East Asia, Armenia in East Europe,
Djibouti and Palestine in Middle East and North Africa.
One thing to notice is that most Latin America and the Caribbean countries in this group
are far less rural than other food vulnerable countries in this group. In fact, on average more than
68 percent of the population in Latin America and the Caribbean countries in the Low Food
Security group is classified as urban. This raises the issue of urban food insecurity, which has its
own special characteristics. While countries in the previous Lowest Food Security group, being
mostly rural, may be more concerned about food insecurity in the countryside and the impact of
agricultural imports on poor agricultural producers, in countries with larger urban populations,
where a large part of poor and food insecure groups may be urban dwellers, there is clear trade-
off for policies aimed at agricultural sector promotion: they may maintain higher incomes for
poor rural producers but they may also act as a tax on poor urban consumers (both effects
depending on other policies the interactions of market and institutions).
Similar to the Lowest Food Security group, countries in this group are presented in all
four climate and soil condition combination (Figure 8). Climate and soil fertility conditions are
detrimental for food production in 11 countries: Bolivia, Botswana, Chad, Djibouti, Guinea-
Bissau, Namibia, Pakistan, Palestine, Peru, Mali and Sudan, where deserts account for a
substantial part of land area. On the other hand, 8 countries enjoy high fertile soil and favorable
climate. They are located in tropical areas, including 5 countries in Latin America and the
Caribbean (Dominican Republic, Guatemala, Honduras, Nicaragua and Panama), 1 in sub-
Saharan Africa (Togo), 1 in East Asia and Pacific (Philippines) and 1 in South Asia (Sri Lanka).
4.3 Middle Food Security Group
The Middle Food Security group countries have their food utilization indicator z-scores
in the -0.5 to 0 range, although there are some deviations mostly towards the values above +0.5
or below -0.5. All of them show levels of food consumptions and production per capita above the
Low Food Security groups. An average person consumes 2,636 calories, 75.8 grams of protein,
and 66.9 grams of fat. Per capita food production increases by $52 to $192. Countries tend to be
more trade secure and spend less than 10 percent of total export on food import. More than 56
percent of the population is urban residents. Among the 29 members of this group, 12 members
are from Latin American and the Caribbean, 5 from sub-Saharan Africa, 6 from East Asia and
Pacific, 5 from East Europe and Central Asia, and 1 from Middle East.
Figure 9 indicates that higher than average food production is associated with benign
climate and fertile soil in this group. Favorable climate is registered in 8 out of 9 high food
17
production countries, including Paraguay, Thailand, Costa Rica and Ecuador. In addition to some
small islands, several large countries (in terms of land area) come out with low food production
under unfavorable climate: Azerbaijan, Burkina Faso, Jordan, Mongolia, Nigeria and Uzbekistan.
There are also countries under favorable climate but produce less than average food: Indonesia,
Myanmar, Bosnia and Herzegovina, El Salvador, Gabon, Georgia and Jamaica,
4.4 Upper Middle Food Security Group
The Upper Middle Food Security group countries have their food security z-score
indicators in the 0 to 1 range. The levels of nutrition consumption are higher than their
counterparts in the Middle Food Security group, with average calorie, protein and fat intake per
capita 2,977 calories, 93.1 grams and 86.5 grams. Per capita food production in the Upper
Middle Food Security group is higher than that of the Middle Food Security groups, but
countries in this group exhibit higher food production per capita at $445 despite lower soil
fertility and unfavorable growing conditions.
This group stands out for high soil quality – some of the world’s most fertile soil without
any major fertility constraints is located in countries within this group. Many countries under this
classification have great potential to significantly increase food production and provide a
resilient supply for the world market. Among the countries enjoying favorable weather and good
soil conditions, many are located in East Europe and Central Asia or are tropical islands. There is
no country falling in the combination of favorable weather and low soil fertility for trade secure
groups (Figure 10). Among 17 countries with barren soil and inclement climate, food production
is higher than average in 8 countries: Chile, China, Estonia, Iran, Kazakhstan, Kyrgyzstan,
Lebanon and Turkmenistan. Additionally, 4 more countries with low soil fertility but favorable
climate are high food production countries: Brazil, Malaysia, New Zealand and Slovakia. Of the
14 high food production countries where soil is generally rich, adverse climate exists in 9
countries: Argentina, Belarus, Bulgaria, Latvia, Macedonia, Russia, Turkey, Syria and Ukraine.
Only 5 high food production countries are blessed with both favorable climate and high soil
fertility: Albania, Croatia, Serbia and Montenegro, Slovenia and Uruguay. Many countries of
high food production in this group indicates that difficult natural endowment for crop cultivation
can not necessarily the single or predominant determinant of agricultural production or food
security status, and investment in agricultural sector could improve and overcome the
agronomical constraints in countries without beneficial natural conditions.
In the Upper Middle Food Security group, major players of food production are
concentrated in East Europe and Central Asia (16 countries) and Latin America and the
Caribbean (5 countries), in addition to China, Malaysia and New Zealand in East Asia and
Pacific Rim. South Africa is the solo significant food producer in sub-Saharan Africa in this
group.
Many small islands are classified in this group, scattering in the Caribbean and the
Pacific Ocean, which requires some further analysis because the levels of trade stress are the
highest in some individual countries. The level of trade stress is an issue for some of the
countries in this group, such as Suriname, Dominica, Antigua and Barbuda, Vanuatu, Moldova,
Jamaica, Belize, Guyana. In these island countries, food import is 20-30 percent of total exports,
as most of them have little arable land and thus have to depend heavily on imported food
18
shipment. Although these countries have a high to very high food import bill, they should not be
classified as food insecure even with such high levels of trade stress. Although in terms of trade
stress, the countries mentioned above are vulnerable or worse than some lower food security
countries, they also have far higher levels of consumption of calories and nutrition. In addition,
these countries are far less rural than most food insecure countries, and most of them are
classified as upper middle or high income countries by World Bank,. Therefore, these trade
stressed countries are classified by the factor analysis algorithm in the Upper Middle Food
Security group.
4.5 High Food Security Group
The last panel of Table 5 and 6 includes countries with food security factor scores above
the +1 value, which translates into average consumption of calories, proteins and fat in excess of
3,486, 117.4 grams and 131.8 grams. Food production per capita hovers far above any other
groups (above $445), and food import bill less than 6 percent of total exports (i.e., these
countries are mostly trade secure). Most countries are very urban (above 82 percent of total
population). There are 5 trade insecure countries but the levels of food consumption and high
domestic production, as well as a trade ratio for food imports, have provided enough buffers to
achieve food security under any likely event, domestic or international (Figure 11).
Almost all industrialized countries (considered in the category of high-income OECD
countries by the World Bank) fall into the High Food Secure group, but they also include some
developing countries and transition economies (which fall under the upper middle-income label
of the World Bank). All European Union members are in the High Food Secure group, except for
transition economies of Bulgaria, Estonia, Latvia, Slovakia and Slovenia (which are in the Upper
Middle Food Secure group with high food production). All of the 33 countries in high food
security groups are classified as high income by World Bank, with the exception of 3 upper
middle income countries (Poland, Lithuania and Romania).
5. EVOLUTION OF FOOD SECURITY
This section compares the five food security indicators: calorie intake per capita, protein
intake per capita, food production per capita, ratio of total export to food import, and share of
nonagricultural population, which are available for both Diaz-Bonilla et al.’s (2000) and this
study. Table 7 presents the growth of these variables over an 8-year period, from 1993-97 to
2001-05 (5-year average) in percentage, and a positive growth means improved food security.
On average, the five indicators all grow at various rates, with food production and protein intake
the fastest and calorie intake the slowest.
In terms of calorie intake, all groups registered a positive growth, but the High Food
Security group grew especially faster than the Lowest and Low Food Security groups. Protein
intake grows healthily across all groups, and generally growth rate of protein intake is higher
than that of energy intake. But protein intake grew the slowest in the Lowest Food Security
group at 0.6 percent per year but at a robust 1.5 percent or higher in other groups. There is a
19
trend of urbanization, which is more manifest in the Lowest and Middle Food Security countries,
witnessing share of urban population increasing by 1.1-1.2 percent annually.
Food production increases universally, especially in the Upper Middle Food Security
countries. Several countries with favorable weather or fertilizer soil register dramatic increase in
per capita food production by more than 50 percent within a decade, including Armenia,
Azerbaijan, Belarus, Laos, Malaysia, Vietnam Ghana, Rwanda, and Cuba (Appendix Table 2).
On the other hand, food production per capita dropped more than 20 percent in some countries
with unfavorable agricultural environment (Namibia, Botswana) or tropical islands (Saint Lucia,
Vanuatu, Antigua and Barbuda, Saint Vincent and Grenadines), as well as three sub-Saharan
African countries: Democratic Republic of Congo, Eritrea and Senegal. In fact, among the
countries experienced negative growth in per capita food production, 23 out of 41 are located in
sub-Saharan Africa, and 9 in Latin America and the Caribbean.
Trade variable has the biggest volatility, annual growth rate ranging from -20.6 percent in
The Bahamas to more than 31.8 percent in Uzbekistan. Average share of food import in total
export decreases in all groups except for the Lowest Food Security group, indicating a
deteriorating trade balance in the most vulnerable countries. Combined with slow growth rate of
per capita food production and high urbanization, it implies that the trade stressed Lowest Food
Security countries have observed an increased burden of imported food bill while facing a
quickly urbanizing population. Compare to Appendix Figure 2a - Figure2d, it is important to
note that aggregate by income level could mask vast difference among countries within the same
income level.
Next let’s examine the food insecure countries in the Lowest Food Security group closely
in Appendix Table 2. During the mid-1990s to early 2000s, most countries exhibited some
improvement in at least one of the five temporal indicators. Of the 30 least food secure countries,
3 countries have improved all 5 indicators: Cambodia, Malawi and Mozambique. Additionally
11 countries have gained in 4 out 5 indicators. Two countries show the complete opposite trend:
food consumption and production per capita level declined, trade position deteriorated, and
urbanization reversed, indicating the utilization, accessibility and availability of food have
plummeted. Both countries are in sub-Saharan Africa, including Democratic Republic of Congo
and Zimbabwe.
Seventeen out of 30 countries in the Lowest Food Security group observed higher per
capita food production, with more than 4 percent per annum registered in Laos, Malawi, Rwanda
and Uganda. Additionally, food production net of population growth grew at more than 2.4
percent per year took place in 7 countries: Angola, Bangladesh, Cambodia, Central African
Republic, Guinea, Kenya and Mozambique, and grew at 1-2 percent annually in Haiti, Liberia,
Niger and Tajikistan. In spite of the encouraging progress in these countries, per capita food
production decreases in a dozen of low food security countries. Annual per capita food
production falls by more than 1 percent in Burundi, Comoros, Democratic Republic of Congo,
Eritrea, Ethiopia, Madagascar, Republic of Congo, Togo, Zambia and Zimbabwe. It is alerting to
recognize that millions of people are facing dwindling domestic food supply, which could be
attributed to adverse weather, conflicts, and poor-designed agricultural policies.
20
6. CONCLUSIONS AND ISSUES FOR FURTHER RESEARCH
6.1. Discussion and Conclusions
This exercise has been an intermediate step between the analysis of aggregate categories
and the study of individual sub-national country cases. By highlighting groups of countries with
similarities in their food security profiles, as measured by the variables considered here, it allows
a more differentiated analysis of possible situations of food (in)security. This classificatory
exercise is also relevant for the grouping of countries in terms of their possible investment,
policy interventions and trade positions.
The results have implications for the two issues identified in the introduction: first, the
usefulness of the categories currently used by international development community to discuss
food security concerns, and, second, the appropriate policies tailored for each food security
group. The answer to the first issue is positive as this study shows that some of the commonly
used categories by the development economists appear inadequate to capture food security
concerns. The most obvious case is the category of “developing countries”. Concerns about the
wide variety of countries labeled as developing countries, have existed for some time in
development literature. Those concerns are highlighted by this analysis, where developing
countries appear scattered across all levels of food (in)security, except for the High Food
Security group.
The categories by income level, however, more aligned with our definition of food secure
groups: low income economies dominantly falling into the Lowest Food Security group with the
lowest food consumption indicators. Of the 50 low income countries included in this study, all
fall into the Lowest or Low Food Security groups except for Burkina Faso, Kyrgyzstan,
Mauritania, Myanmar, Nigeria, San Tome and Principe, Vietnam, and Uzbekistan. But, at the
same time, there are some countries that have a somewhat better food security profile are
included in the low food security categories, which are middle income countries, such as Angola,
Republic of Congo and Swaziland.
Figure 5 presents the regional distribution by the Lowest, Low, Middle, Upper Middle
and High Food Security groups. Sub-Saharan Africa dominates the low food security groups,
especially the Lowest group. This is consistent with the FAO (2008a) report that among 39
countries experienced serious food emergencies and required external assistance for dealing with
critical food insecurity, 25 of them are in Africa. One South Asian country is in the Lowest Food
Security group (Bangladesh) and 4 countries are in the Low Food Security group: Nepal,
Pakistan, Sri Lanka and India). Central American and the Caribbean countries are mostly
clustered in the Low and Middle Food Security groups, while several big South American
economies fall into the Upper Middle Food Security group (Argentina, Brazil, Chile and
Uruguay). Countries in Middle East and North Africa are concentrated in the Upper Middle Food
Security group, except for Yemen and Jordan in lower security groups. East Europe and Central
Asia congregates mostly in the Middle and Upper Middle Food Security groups, while all
countries in West Europe and North America are in the High Food Security group. The resulting
groups from this study allows countries within the same food security category to learn from the
successes and failures of each other for a solution to food security by further exploring the
21
synergy of cross-country study. It also encourages conventional sub-national analyses to be more
integrated into regional based on food security related issues.
The Global Hunger Index 2003 (Wiesmann, 2006) ranks 119 countries in the world,
based on three equally weighted indicators: the proportion of people who are food energy
deficient (share of the population with inadequate dietary energy intake) as estimated by the
FAO, the prevalence of underweight in children under the age of five as compiled by the World
Health Organization (the proportion of children suffering from weight loss and/or reduced
growth), and the under-five mortality rate as reported by the United Nations Children’s Fund.
The results show that most of the countries ranking low in hunger are in sub-Saharan Africa and
South Asia regions. There are a few exceptions to this regional pattern and several countries have
high hunger scores (at alarming or extremely alarming level): Haiti in the Caribbean, Yemen in
Middle East, Tajikistan in Central Asia, and Cambodia, Laos, Timor-Leste in Southeast Asia,
Nepal in South Asia. The findings based on Global Hunger Index are consistent with the Lowest
and Low Food Security groups defined in this study.
A recent IFPRI study report rate of ultra-poverty (the poorest poor) using appropriate cut-
off values applied to households’ total expenditure per capita in 20 countries, based on national
household surveys (Akhter et al., 2007). Five countries exhibit high ultra-poverty incidence
(more than 10 percent of the population is ultra poor) and high food insecurity, of which 4
countries are in sub-Saharan Africa (Burundi, Mozambique, Rwanda, and Zambia) and 1 in Latin
America (Nicaragua). The 5 countries are all classified as low food security countries in this
typology analysis.
Being a net food importer appears to be only a weak indicator of food vulnerability.
Some countries may be net food exporters but still have a larger percentage of their total exports
allocated to buy food, and vice-versa, as the contrasting examples of Mali and Venezuela have
shown. Additionally, some countries may be net food importers just because of a dominant
tourist industry (like Barbados, which also has a high income per capita at about US$7,000).
Other net food importing countries have important levels of oil exports (such as the case of
Venezuela, and Trinidad and Tobago) and therefore imports of food only reflect the comparative
advantages of their economy structure. It is important to note that some events can alter the
landscape of food security quite quickly: changes in terms of trade, occurrence of conflicts, etc.
The second issue of policy design is also very relevant. The classification presented here
of food insecure countries would help accomplish defining more precisely the group of countries
that appear vulnerable to food security problems, and thus providing more targeted policies in
representative countries. Stakeholders could design country- and region-specific policy to target
the constricting factor in promoting agriculture production. In order to achieve food security and
self-sufficiency if possible, developing countries need to exploit their potential to increase
agricultural production and productivity through a more conductive policy framework and
increased investment in agricultural and rural development. This approach allows decision
makers to mobilize and utilize resources more effectively and efficiently in order to achieve
development and food security goals. For instance, in the Lowest Food Security group, benign
weather is beneficial for crop production but soil is plagued by major constraints such as
aluminum toxicity in many sub-Saharan African countries. For most crops and cultivars, fertilizer
response will be poor so long as the soil remains strongly acid from aluminum toxicity. This could
22
be corrected by choosing the correct technology of soil management (like liming), which is
technically feasible. On the other hand, if soil and temperature conditions are suitable for crop
production but rainfall might be erratic and volatile in a country (like Kenya and Pakistan),
investment in irrigation and water reservation related technologies is shown to be more effective
in improving crop output and yield. In countries with supreme soil and moderate temperature
conditions, such as East European and Central Asian countries, policies to promoting cereal
production are one way to exploit the countries’ comparative advantages in food production in global
market. Some of the broad policy recommendations are summarized in Table 8, based on FAO’s
approaches for fighting hunger (Pingali et al., 2005).
Not only does there need to be an increase in investment in agriculture but the right focus for
this investment has to be found. A coordinated response to deliver aid in agriculture most effectively
is essential. Donors need to scale up aid to the sector and to consider investing through
comprehensive plans, formulated by the developing countries.
It is also relevant to ask about the food security situation of the developed countries. Our
typology, however, shows that developed countries are unanimously concentrated in the food
secure groups, according to the variables utilized here. There appears to be a very different
meaning of the term “food security” in developed and developing countries. In terms of policy
implications and economy development, maintaining the same label for two altogether different
situations only obscures the issues being negotiated. The discussion of food security should be
limited to the vulnerability of developing countries, using a different terminology for developed
countries.
6.2. Issues for Further Research
Our analysis raises several issues that may require additional research. First, the
calculations presented here used level variables as an average of the last five years. It may be
important to include indicators of time trends and variations over time, to have a better idea of
types of food vulnerability (Valdes and Konandreas, 1981). A related matter is the possibility
and actual occurrence of extreme events that disrupt agricultural production in a country and that
compromise its food security, such as conflicts and weather shocks such as floods and droughts.
Second, following Bouis (2000), the food security typology analysis can be recalculated
with animal proteins instead of total proteins, to try to focus more precisely on malnutrition
issues. A related aspect is that the definitions of food production and trade used here could be
expanded to include fisheries. This may be important for several developing countries, in
particular small-island economies, and countries like Peru which is a net food importer under the
definition utilized here, but is a net food exporter if fisheries are included (Quirós, 2000).
Third, after classifying countries in different types of food (in)secure groups, the relevant
issue is why they ended up where they are. Different statistical techniques can be applied to
analyze other characteristics and determinants for the grouping patterns. It seems important to
identify countries that have been changing, either moving to more secure or more insecure
groups, and then analyze the reasons for those transitions, considering both policy variables and
exogenous events. Based on this interventions can be developed for different groups of countries.
23
Lastly, this study does not take into account the distributional effects of inequality in
income or dietary energy consumption, which prevents the less privileged and hungry people
from accessing food. Countries with food inequality might grow enough food to support
themselves but divide it unequally, for instance exporting it without ensuring that benefits of
increased production to domestic consumers. Especially in remote or conflict-affected areas,
irregular or unreliable harvests have a devastating effect on family nutrition. Gender inequality
may also exacerbate food inequality among the population. Women who have never been to
school have limited information on nutrition for themselves and their children. Maternal and
child health program providing life-saving supplements and knowledge are often under-
prioritized by the government. The distribution of food is a profoundly matter, and achieving
food security means creating a food system that is sustainable, secure, safe, sufficient, nutritious,
and equitable (Tansey and Worsley, 1995). This involves issues of economic and social justice
and forging alliances between sectors such as agriculture, food policy, and health and social
welfare and between various levels of the state and civil society.
24
Reference
Adelman, I. and C. Morris. 1967. Society, Politics and Economic Development: A Quantitative
Approach. Baltimore: John Hopkins Press.
Akhter, U.A., et al. 2007. “The World’s Most Deprived: Characteristics and Causes of Extreme
Poverty and Hunger”. 2020 Discussion Paper 43. Washington, D.C.: International Food
Policy Research Institute.
Bliss, C. and N. Stern. 1978. “Productivity, Wages and Nutrition: Parts I and II”, Journal of
Development Economics 5: 331-398.
Bouis, H. 2000. “Development of Modern Varieties of Rice: Impacts on Food Security and
Poverty”. Paper prepared for presentation at the International Rice Research Conference
(IRRC) held at International Rice Research Institute, Los Baños, Laguna, Philippines.
Clay, E. 2002. “Food Security: Concepts and Measurement”, in Trade Reforms and Food
Security: Conceptualising the Linkages. Rome: Food and Agricultural Organization of
the United Nations.
Cohen, B. 2006. “Urbanization in Developing Countries: Current Trends, Future Projections, and
Key Challenges for Sustainability”. Technology and Science 28:63-80.
Delgado, C.L., J. Hopkins and V.A. Kelly. 1998. Agricultural Growth Linkages in Sub-Saharan
Africa. IFPRI Research Report 107. Washington, D.C.: International Food Policy
Research Institute.
Diaz-Bonilla, E., M. Thomas, S. Robinson and A. Cattaneo. 2000. “Food Security and Trade
Negotiations in the World Trade Organization: A Cluster Analysis of Country Groups”.
Trade and Macroeconomics Division Discussion Paper 59. Washington, D.C.:
International Food Policy Research Institute.
FAO. 1996a. “Rome Declaration on World Food Security and World Food Summit Plan of
Action”. World Food Summit. Rome: Food and Agricultural Organization of the United
Nations.
____. 1996b. Agro-ecological Zoning Guidelines. FAO Soils Bulletin 73. Rome: Food and
Agricultural Organization of the United Nations.
____. 2000. Land Resource Potential and Constraints at Regional and Country Levels. World
Soil Resources Report 90. Rome: Food and Agricultural Organization of the United
Nations.
25
____. 2008a. The State of Food Insecurity in the World 2008: High Food Prices and food
Security – Threats and Opportunities. Rome: Food and Agricultural Organization of the
United Nations.
_____. 2008b. FAOSTAT, Food and Agricultural Organization of the United Nations.
http://faostat.fao.org/, last accessed May 2008.
_____. 2009. “Assessment of the World Food Security and Nutrition Situation”, Committee on
World Food Security 34th
Session.
Fischer, G., M. Shah, H. van Velthuizen and F. O. Nachtergaele. 2001. Global Agro-ecological
Assessment for Agriculture in the 21st Century. Laxenburg, Austria: International
Institute for Applied Systems Analysis.
http://www.iiasa.ac.at/Research/LUC/Papers/gaea.pdf
Fogel, R.W. 1991. “The Conquest of High Mortality and Hunger in Europe and America: Timing
and Mechanisms”, in P. Higonnet, D. Landes and H. Rosovsky, eds. Favorites of Fortune:
Technology, Growth, and Economic Development Since the Industrial Revolution.
Cambridge: Harvard University Press.
___. 1997. “New Findings on Secular Trends in Nuitrition and Mortality: Some Implications for
Population Theory”, in M. Rosenzweig and O. Stark eds. Handbook of Population and
Family Economic Vol. 1a, Amsterdam: Elsevier Science.
Friedberg, M. and M. Thomas. 1997. “The 1990’s Global Grain Situation and Its Impact on the
Food Security of Selected Developing Countries”. Trade and Macroeconomics Division
Discussion Paper 16. Washington, D.C.: International Food Policy Research Institute.
Garrett, J.L. and M. Ruel. 2000. Achieving Urban Food and Nutrition Security in the Developing
World. IFPRI 2020 Focus Brief No. 3. Washington, D.C.: International Food Policy
Research Institute.
Haddad, L., M. Ruel and J.L. Garrett. 1999. “Are Urban Poverty and Undernutrition Growing?
Some Newly Assembled Evidence”. Food Consumption and Nutrition Division
Discussion Paper 63. Washington, D.C.: International Food Policy Research Institute.
Hair, J.F., R.E. Anderson, R.K. Tatham and W.C. Balck. 1998. Multivariate Data Analysis. 5th ed.
Upper Saddle River, NJ: Prentice Hall.
Heidhues, F. et al. 2004. “Development Strategies and Food and Nutrition Security in Africa: An
Assessment”. 2020 Discussion Paper No. 38. Washington, D.C.: International Food
Policy Research Institute.
26
Irz, X., L. Lin, C. Thirtle and S. Wiggins. 2001. “Agricultural Productivity Growth and Poverty
Alleviation”. Development Policy Review 19(4): 449-66.
Majid, N. 2004. “Reaching Millennium Goals: How Well Does agricultural Productivity Growth
Reduce Poverty?” Employment Strategy Paper 2004 No. 12. International Labor
Organization, Geneva.
Maxwell, S. 1990. “Food Security in Developing Countries: Issues and Options for the 1990s”.
Institute of Development Studies Bulletin 21 (3): 2-13.
__________. 1996. “Food Security: A Post-modern Perspective”. Food Policy 21 (6): 155-170.
Maxwell, S. and T.R. Frankenberger. 1992. Household Food Security: Concepts, Indicators,
Measurements: A Technical Overview. New York/Rome: UNICEF/FAO.
Nachtergaele, F. and R.B. Brinkman. 1996. “Identification of Analogous Land for
Agrotechnology Transfer in the Savannah Zones of the Developing world”. Integrated
Crop Management Series 1: 29-41.
Nadav, C. 1996. “Nutritional Thresholds and Growth”, Department of Economics, Ben-Gurion
University, Israel.
Pingali, P., L. Alinovi and J. Sutton. 2005. “Food Security in Complex Emergencies: Enhancing
Food System Resilience”. Disasters 29.
Ravallion M, S. Chen and P. Sangraula 2007. “New Evidence on the Urbanization of Global
Poverty”. Policy Research Working Paper Series 4199. Washington D.C.: World Bank.
Ruel, M., et al. 1998. “Urban Challenges to Food and Nutrition Security: A Review of Food
Security, Health, and Caregiving in the Cities”. Food Consumption and Nutrition
Division Discussion Paper 51. Washington, D.C.: International Food Policy Research
Institute.
Ruel, M., L. Haddad, and J. L. Garrett. 1999. “Some Urban Facts of Life”. Food Consumption
and Nutrition Division Discussion Paper 64. Washington, D.C.: International Food Policy
Research Institute.
Quirós, R. 2000. Presentation at the ALADI/IICA/IADB Workshop on Negociaciones
Internacionales Sobre Agricultura. Montevideo, July 6 and 7, 2000. Uruguay
Sanchez, P.A., W. Couto and S.W. Buol, 1982. “The Fertility Capability Soil Classification
System: Interpretation, Application and Modification”. Geoderma 27: 283-309.
Smith, L.C. 1998. “Can FAO's Measure of Chronic Undernourishment Be Strengthened?”. Food
Policy 23 (5): 425-445.
27
Smith, L.C. and L. Haddad. 2000. Explaining Child Malnutrition in Developing Countries: A
Cross-country Analysis. IFPRI Research Report 111. Washington, D.C.: International
Food Policy Research Institute.
Strauss, J. 1986. “Does Better Nutrition Raise Farm Productivity?”. Journal of Political
Economy 94(2): 297-320.
Strauss, J. and D. Thomas. 1995. "Human Resources: Empirical Modeling of Household and
Family Decisions”, in J. Behrman and T. Srinivasan eds. Handbook of Development
Economics Vol. IIA, Chap. 34. Amsterdam: North-Holland.
Tansey, G. and T. Worsley. 1995. The Food System: A Guide. Earthscan, London, UK.
Valdes, A., and P. Konandreas. 1981. “Assessing Food Insecurity Based on National Aggregates
in Developing Countries”, in A. Valdes ed. Food Security for Developing Countries.
Boulder, Colorado: Westview Press.
Velicer, W. F. and D. N. Jackson. 1990. “Component Analysis versus Common Factor Analysis:
Some Issues in Selecting an Appropriate Procedure”. Multivariate Behavioral Research
25(1): 1-28.
von Braun, J., H. Bouis, S. Kumar, and R. Pandya-Lorch. 1992. Improving Food Security of the
Poor: Concept, Policy, and Programs. Washington, D.C.: International Food Policy
Research Institute.
__________. 2000. “Trade, Trade Policy and Poverty: What are the Links?”, Background report
for World Development Report 2000/2001. Washington D.C: World Bank.
Wiesmann, D. 2006. “A Global Hunger Index: Measurement Concept, Ranking of Countries,
and Trends”, Food Consumption and Nutrition Division Discussion Paper 212.
Washington, D.C.: International Food Policy Research Institute.
Williamson, J. 1993. “Human Capital Deepening, Inequality, and Demographic Events along the
Asia-Pacific Rim”, in N. Ogawa, G.W. Jones and J.G. Wiliamson eds. Human Resources
in Development along the Asia-Pacific Rim. Singapore: Oxford University Press.
World Bank. 2008. World Development Indicator 2008. Washington, D.C.: World Bank.
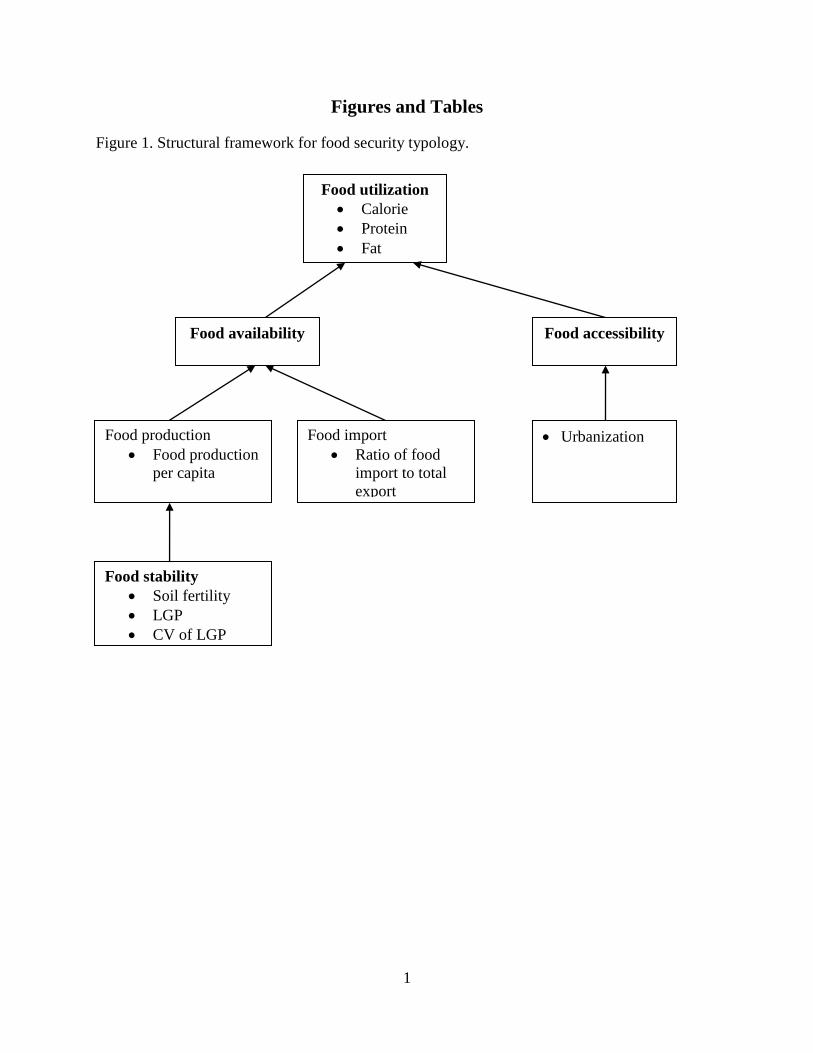
1
Figures and Tables
Figure 1. Structural framework for food security typology.
Food utilization
Calorie
Protein
Fat
Food accessibility Food availability
Food stability
Soil fertility
LGP
CV of LGP
Food production
Food production
per capita
Food import
Ratio of food
import to total
export
Urbanization
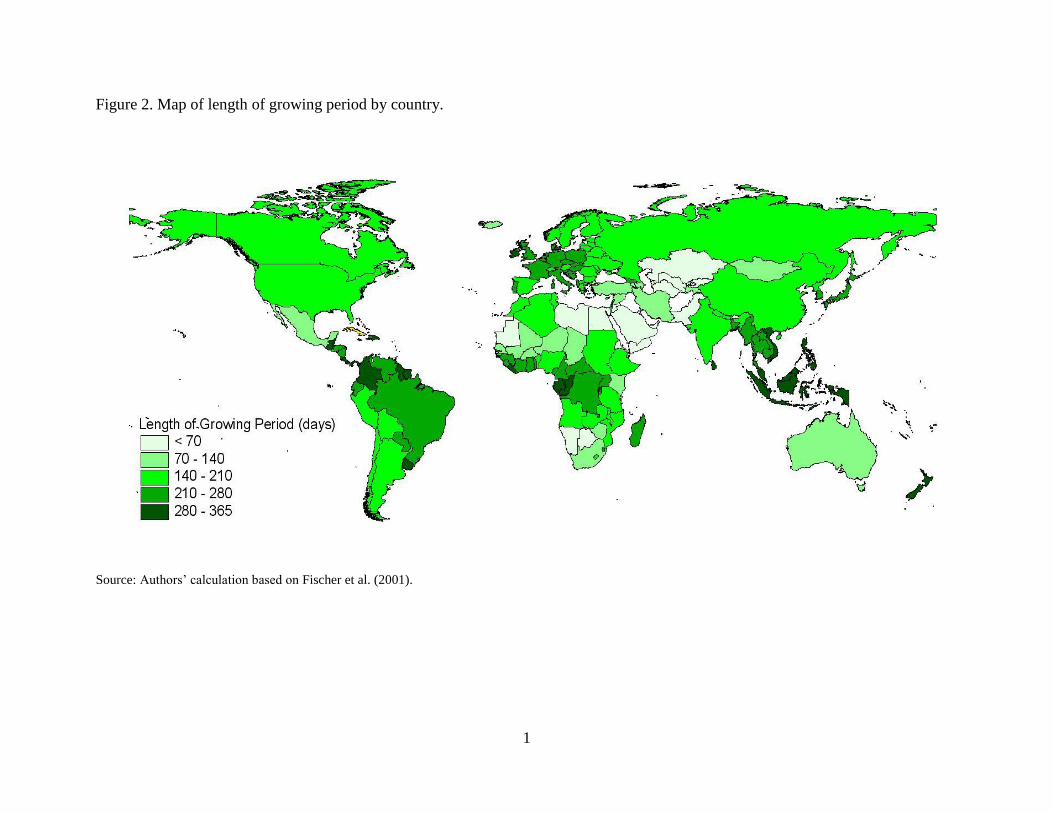
1
Figure 2. Map of length of growing period by country.
Source: Authors’ calculation based on Fischer et al. (2001).
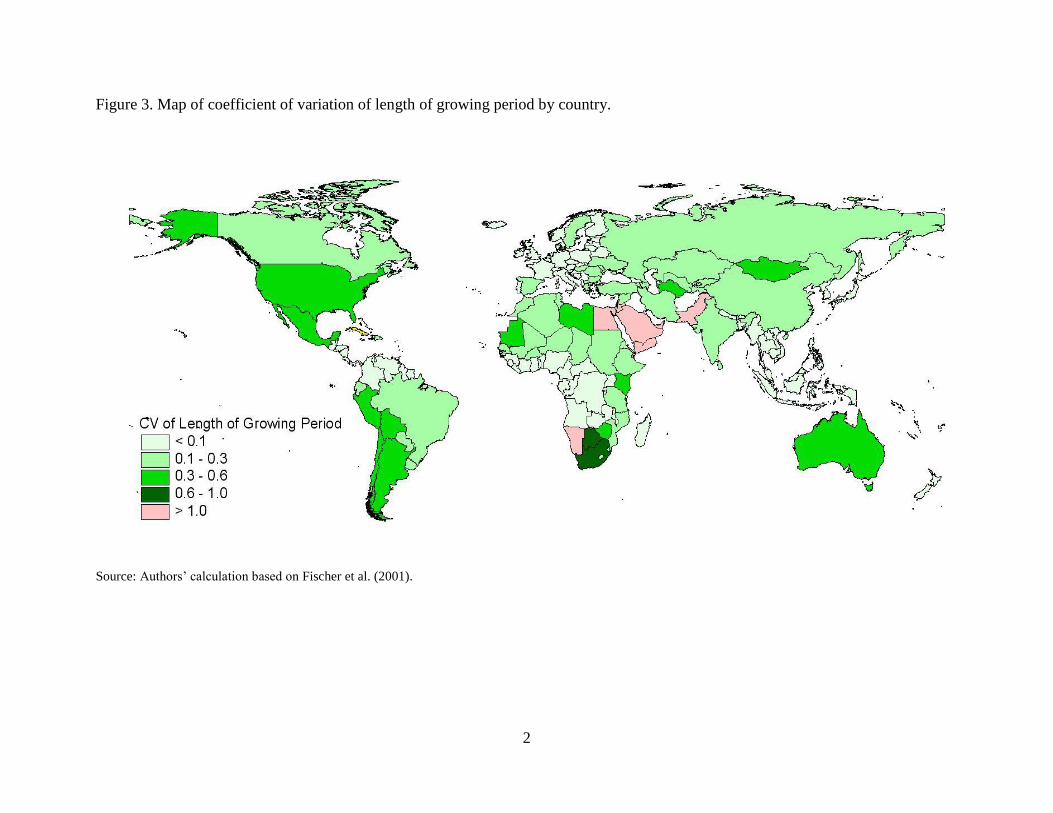
2
Figure 3. Map of coefficient of variation of length of growing period by country.
Source: Authors’ calculation based on Fischer et al. (2001).
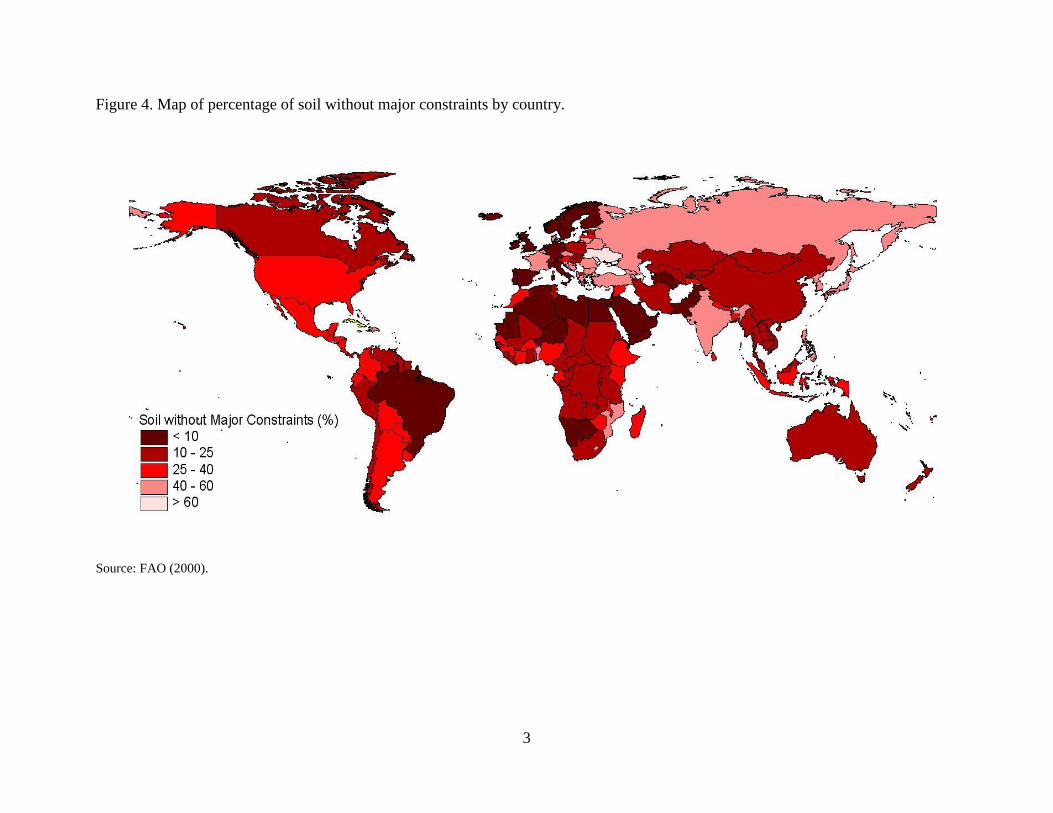
3
Figure 4. Map of percentage of soil without major constraints by country.
Source: FAO (2000).
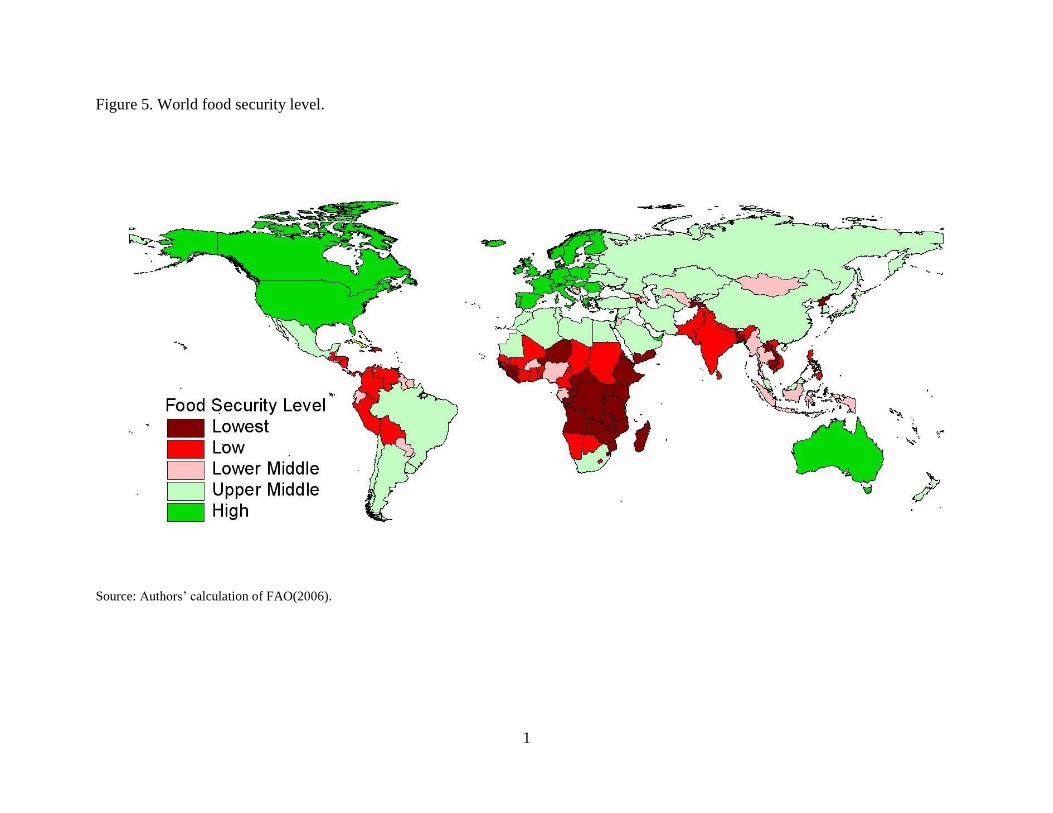
1
Figure 5. World food security level.
Source: Authors’ calculation of FAO(2006).
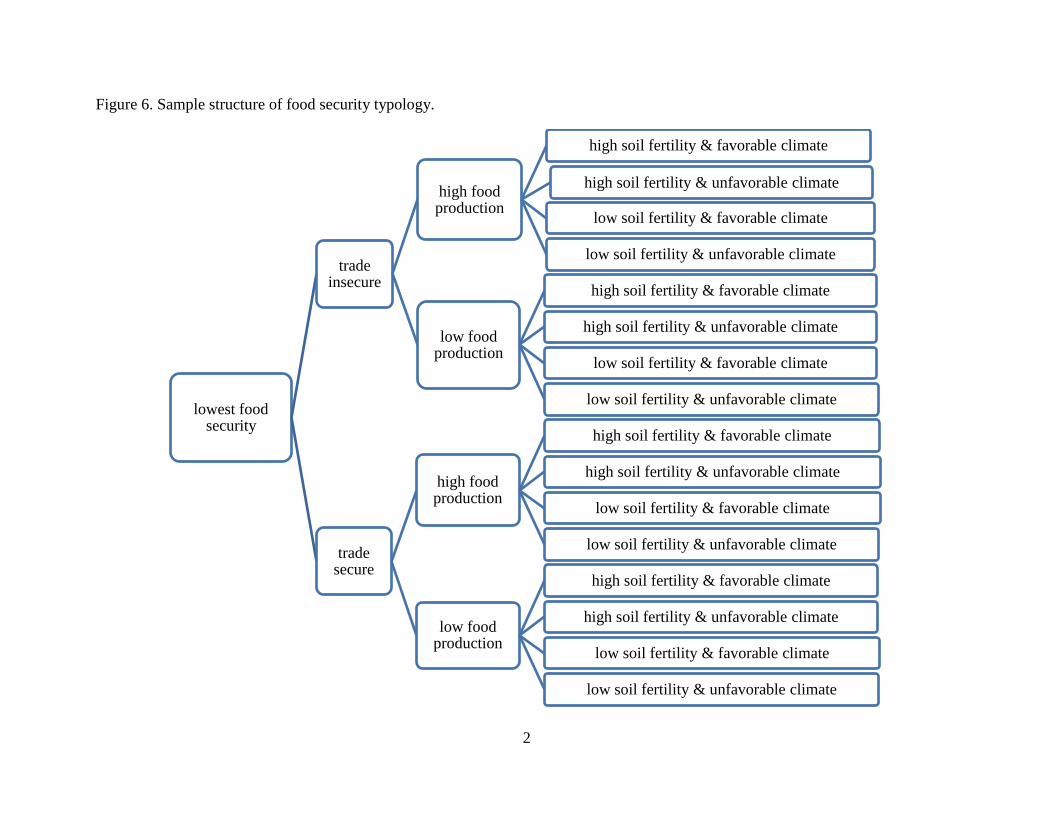
2
Figure 6. Sample structure of food security typology.
lowest food security
trade insecure
high food production
high soil fertility & favorable climate
high soil fertility & unfavorable climate
low soil fertility & favorable climate
low soil fertility & unfavorable climate
low food production
high soil fertility & favorable climate
high soil fertility & unfavorable climate
low soil fertility & favorable climate
low soil fertility & unfavorable climate
trade secure
high food production
high soil fertility & favorable climate
high soil fertility & unfavorable climate
low soil fertility & favorable climate
low soil fertility & unfavorable climate
low food production
high soil fertility & favorable climate
high soil fertility & unfavorable climate
low soil fertility & favorable climate
low soil fertility & unfavorable climate
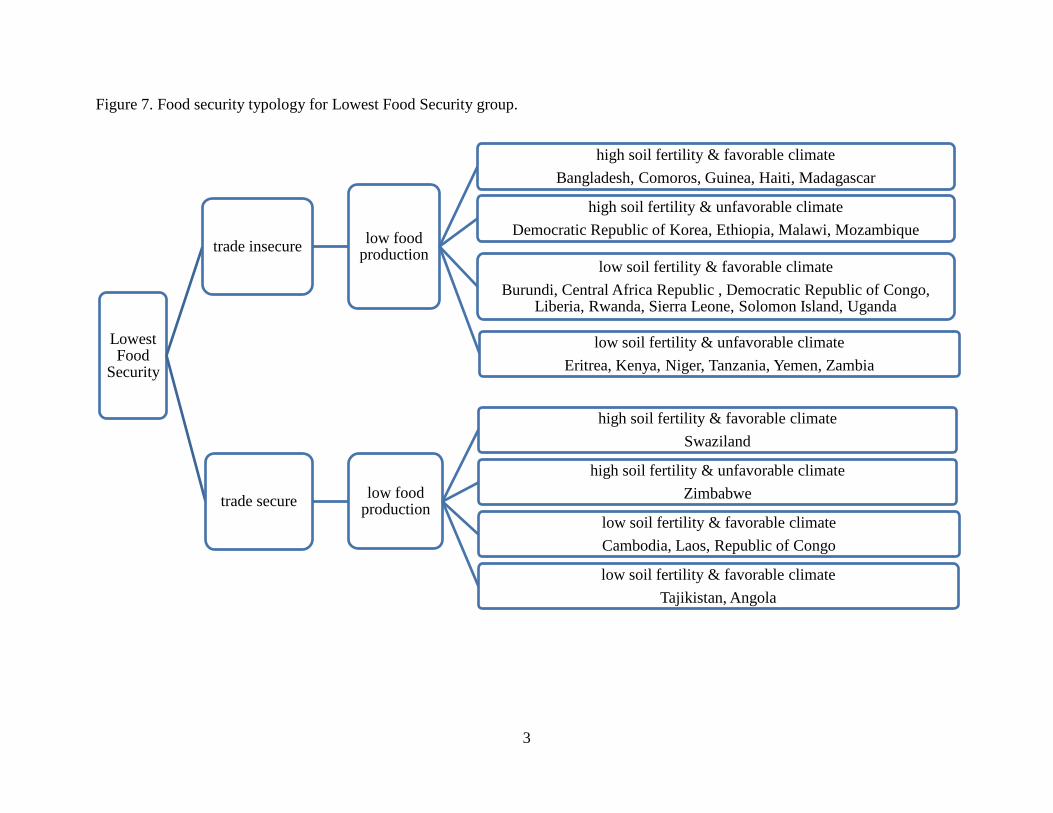
3
Figure 7. Food security typology for Lowest Food Security group.
Lowest Food
Security
trade insecurelow food
production
high soil fertility & favorable climate
Bangladesh, Comoros, Guinea, Haiti, Madagascar
high soil fertility & unfavorable climate
Democratic Republic of Korea, Ethiopia, Malawi, Mozambique
low soil fertility & favorable climate
Burundi, Central Africa Republic , Democratic Republic of Congo, Liberia, Rwanda, Sierra Leone, Solomon Island, Uganda
low soil fertility & unfavorable climate
Eritrea, Kenya, Niger, Tanzania, Yemen, Zambia
trade securelow food
production
high soil fertility & favorable climate
Swaziland
high soil fertility & unfavorable climate
Zimbabwe
low soil fertility & favorable climate
Cambodia, Laos, Republic of Congo
low soil fertility & favorable climate
Tajikistan, Angola
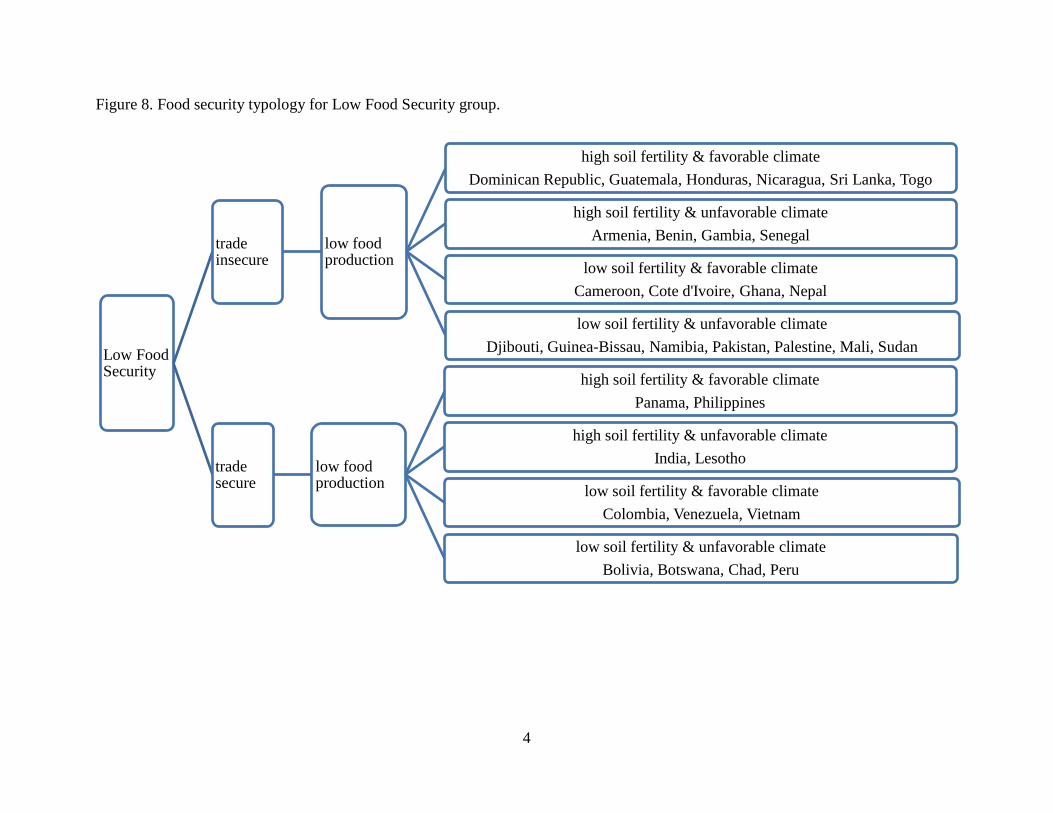
4
Figure 8. Food security typology for Low Food Security group.
Low Food Security
trade insecure
low food production
high soil fertility & favorable climate
Dominican Republic, Guatemala, Honduras, Nicaragua, Sri Lanka, Togo
high soil fertility & unfavorable climate
Armenia, Benin, Gambia, Senegal
low soil fertility & favorable climate
Cameroon, Cote d'Ivoire, Ghana, Nepal
low soil fertility & unfavorable climate
Djibouti, Guinea-Bissau, Namibia, Pakistan, Palestine, Mali, Sudan
trade secure
low food production
high soil fertility & favorable climate
Panama, Philippines
high soil fertility & unfavorable climate
India, Lesotho
low soil fertility & favorable climate
Colombia, Venezuela, Vietnam
low soil fertility & unfavorable climate
Bolivia, Botswana, Chad, Peru
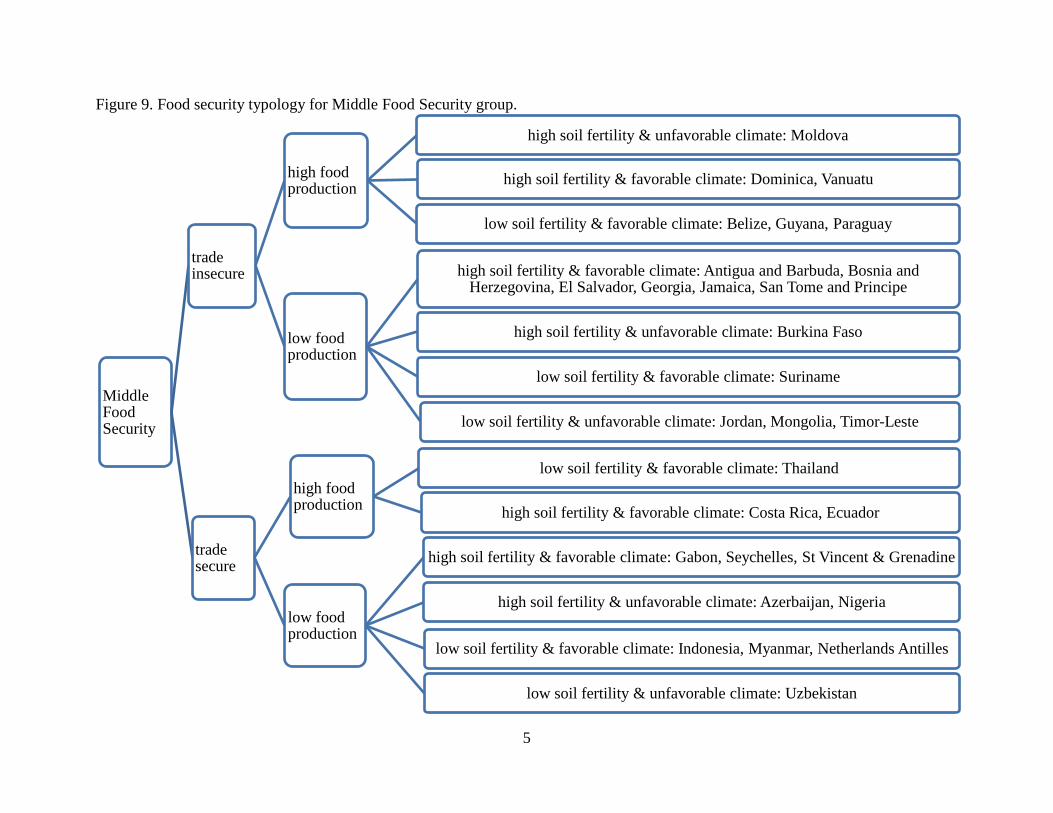
5
Figure 9. Food security typology for Middle Food Security group.
Middle Food Security
trade insecure
high food production
high soil fertility & unfavorable climate: Moldova
high soil fertility & favorable climate: Dominica, Vanuatu
low soil fertility & favorable climate: Belize, Guyana, Paraguay
low food production
high soil fertility & favorable climate: Antigua and Barbuda, Bosnia and Herzegovina, El Salvador, Georgia, Jamaica, San Tome and Principe
high soil fertility & unfavorable climate: Burkina Faso
low soil fertility & favorable climate: Suriname
low soil fertility & unfavorable climate: Jordan, Mongolia, Timor-Leste
trade secure
high food production
low soil fertility & favorable climate: Thailand
high soil fertility & favorable climate: Costa Rica, Ecuador
low food production
high soil fertility & favorable climate: Gabon, Seychelles, St Vincent & Grenadine
high soil fertility & unfavorable climate: Azerbaijan, Nigeria
low soil fertility & favorable climate: Indonesia, Myanmar, Netherlands Antilles
low soil fertility & unfavorable climate: Uzbekistan
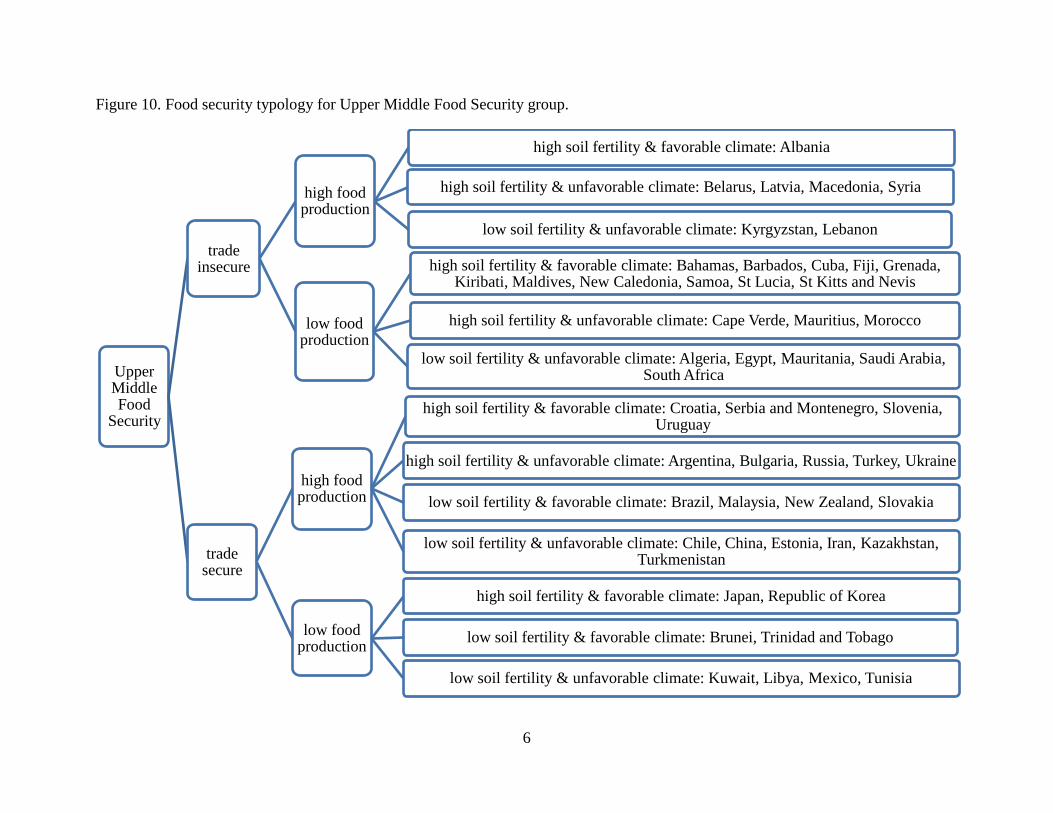
6
Figure 10. Food security typology for Upper Middle Food Security group.
Upper Middle Food
Security
trade insecure
high food production
high soil fertility & favorable climate: Albania
high soil fertility & unfavorable climate: Belarus, Latvia, Macedonia, Syria
low soil fertility & unfavorable climate: Kyrgyzstan, Lebanon
low food production
high soil fertility & favorable climate: Bahamas, Barbados, Cuba, Fiji, Grenada, Kiribati, Maldives, New Caledonia, Samoa, St Lucia, St Kitts and Nevis
high soil fertility & unfavorable climate: Cape Verde, Mauritius, Morocco
low soil fertility & unfavorable climate: Algeria, Egypt, Mauritania, Saudi Arabia, South Africa
trade secure
high food production
high soil fertility & favorable climate: Croatia, Serbia and Montenegro, Slovenia, Uruguay
high soil fertility & unfavorable climate: Argentina, Bulgaria, Russia, Turkey, Ukraine
low soil fertility & favorable climate: Brazil, Malaysia, New Zealand, Slovakia
low soil fertility & unfavorable climate: Chile, China, Estonia, Iran, Kazakhstan, Turkmenistan
low food production
high soil fertility & favorable climate: Japan, Republic of Korea
low soil fertility & favorable climate: Brunei, Trinidad and Tobago
low soil fertility & unfavorable climate: Kuwait, Libya, Mexico, Tunisia
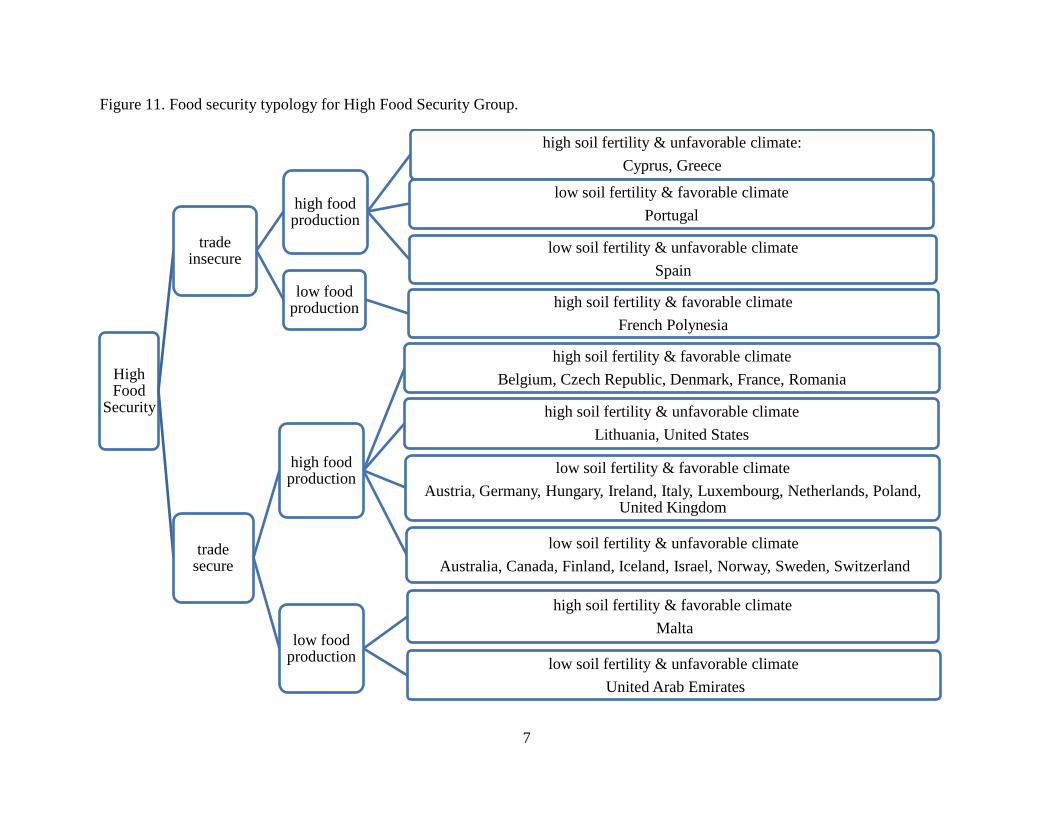
7
Figure 11. Food security typology for High Food Security Group.
High Food
Security
trade insecure
high food production
high soil fertility & unfavorable climate:
Cyprus, Greece
low soil fertility & favorable climate
Portugal
low soil fertility & unfavorable climate
Spain
low food production high soil fertility & favorable climate
French Polynesia
trade secure
high food production
high soil fertility & favorable climate
Belgium, Czech Republic, Denmark, France, Romania
high soil fertility & unfavorable climate
Lithuania, United States
low soil fertility & favorable climate
Austria, Germany, Hungary, Ireland, Italy, Luxembourg, Netherlands, Poland, United Kingdom
low soil fertility & unfavorable climate
Australia, Canada, Finland, Iceland, Israel, Norway, Sweden, Switzerland
low food production
high soil fertility & favorable climate
Malta
low soil fertility & unfavorable climate
United Arab Emirates
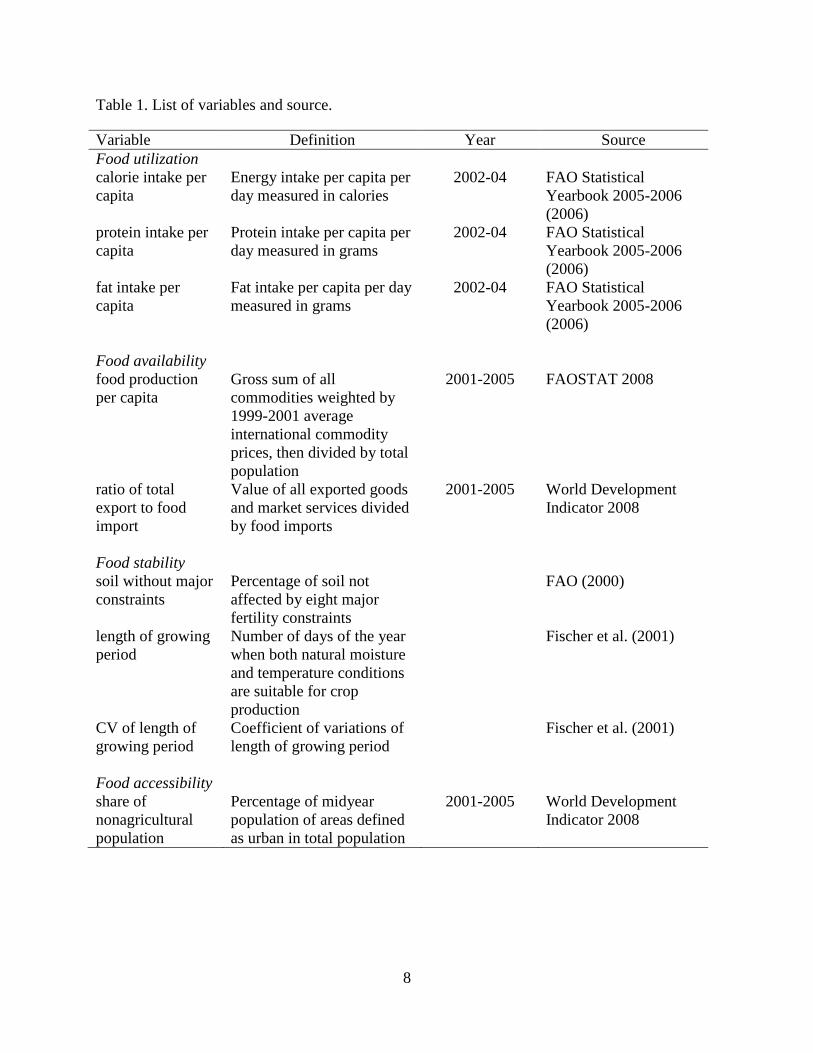
8
Table 1. List of variables and source.
Variable Definition Year Source
Food utilization
calorie intake per
capita
Energy intake per capita per
day measured in calories
2002-04 FAO Statistical
Yearbook 2005-2006
(2006)
protein intake per
capita
Protein intake per capita per
day measured in grams
2002-04 FAO Statistical
Yearbook 2005-2006
(2006)
fat intake per
capita
Fat intake per capita per day
measured in grams
2002-04 FAO Statistical
Yearbook 2005-2006
(2006)
Food availability
food production
per capita
Gross sum of all
commodities weighted by
1999-2001 average
international commodity
prices, then divided by total
population
2001-2005 FAOSTAT 2008
ratio of total
export to food
import
Value of all exported goods
and market services divided
by food imports
2001-2005 World Development
Indicator 2008
Food stability
soil without major
constraints
Percentage of soil not
affected by eight major
fertility constraints
FAO (2000)
length of growing
period
Number of days of the year
when both natural moisture
and temperature conditions
are suitable for crop
production
Fischer et al. (2001)
CV of length of
growing period
Coefficient of variations of
length of growing period
Fischer et al. (2001)
Food accessibility
share of
nonagricultural
population
Percentage of midyear
population of areas defined
as urban in total population
2001-2005 World Development
Indicator 2008
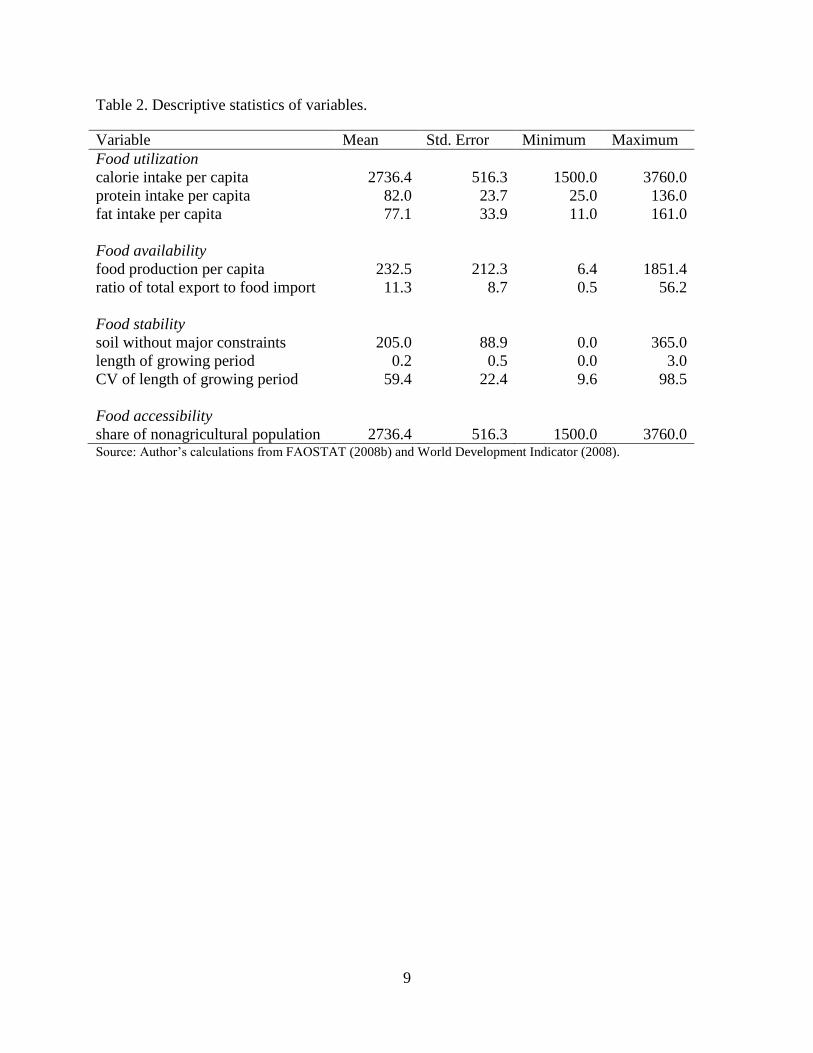
9
Table 2. Descriptive statistics of variables.
Variable Mean Std. Error Minimum Maximum
Food utilization
calorie intake per capita 2736.4 516.3 1500.0 3760.0
protein intake per capita 82.0 23.7 25.0 136.0
fat intake per capita 77.1 33.9 11.0 161.0
Food availability
food production per capita 232.5 212.3 6.4 1851.4
ratio of total export to food import 11.3 8.7 0.5 56.2
Food stability
soil without major constraints 205.0 88.9 0.0 365.0
length of growing period 0.2 0.5 0.0 3.0
CV of length of growing period 59.4 22.4 9.6 98.5
Food accessibility
share of nonagricultural population 2736.4 516.3 1500.0 3760.0 Source: Author’s calculations from FAOSTAT (2008b) and World Development Indicator (2008).
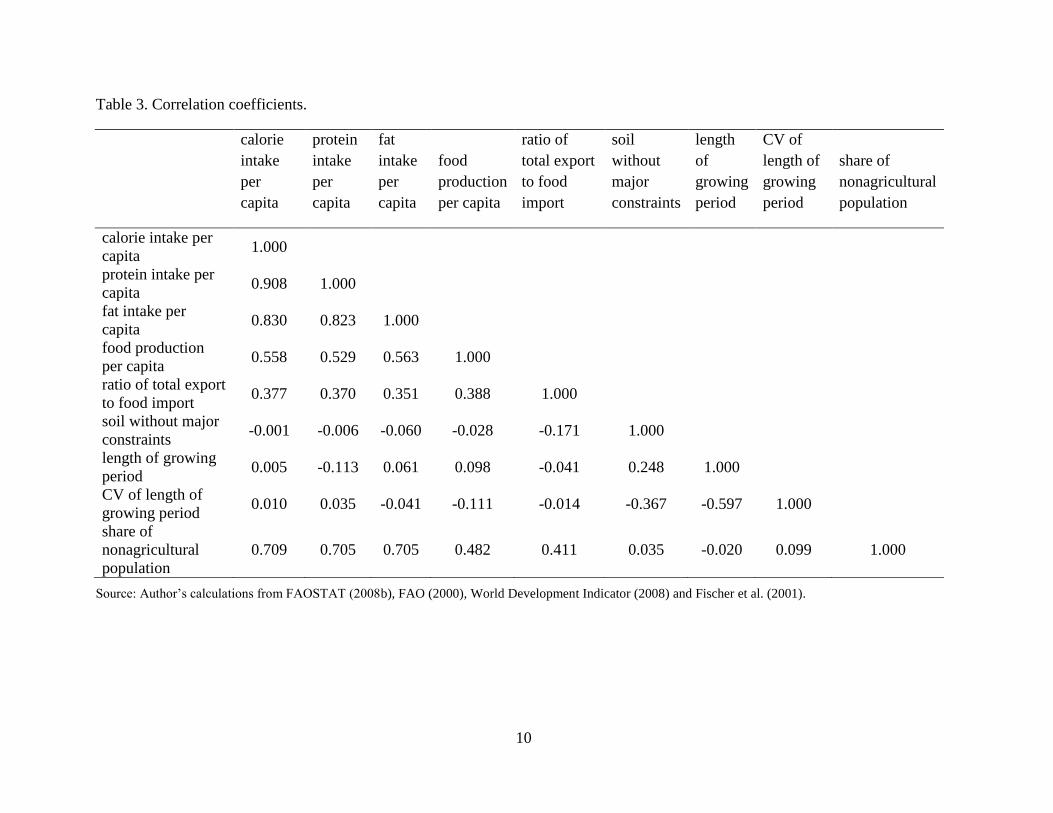
10
Table 3. Correlation coefficients.
calorie
intake
per
capita
protein
intake
per
capita
fat
intake
per
capita
food
production
per capita
ratio of
total export
to food
import
soil
without
major
constraints
length
of
growing
period
CV of
length of
growing
period
share of
nonagricultural
population
calorie intake per
capita 1.000
protein intake per
capita 0.908 1.000
fat intake per
capita 0.830 0.823 1.000
food production
per capita 0.558 0.529 0.563 1.000
ratio of total export
to food import 0.377 0.370 0.351 0.388 1.000
soil without major
constraints -0.001 -0.006 -0.060 -0.028 -0.171 1.000
length of growing
period 0.005 -0.113 0.061 0.098 -0.041 0.248 1.000
CV of length of
growing period 0.010 0.035 -0.041 -0.111 -0.014 -0.367 -0.597 1.000
share of
nonagricultural
population
0.709 0.705 0.705 0.482 0.411 0.035 -0.020 0.099 1.000
Source: Author’s calculations from FAOSTAT (2008b), FAO (2000), World Development Indicator (2008) and Fischer et al. (2001).
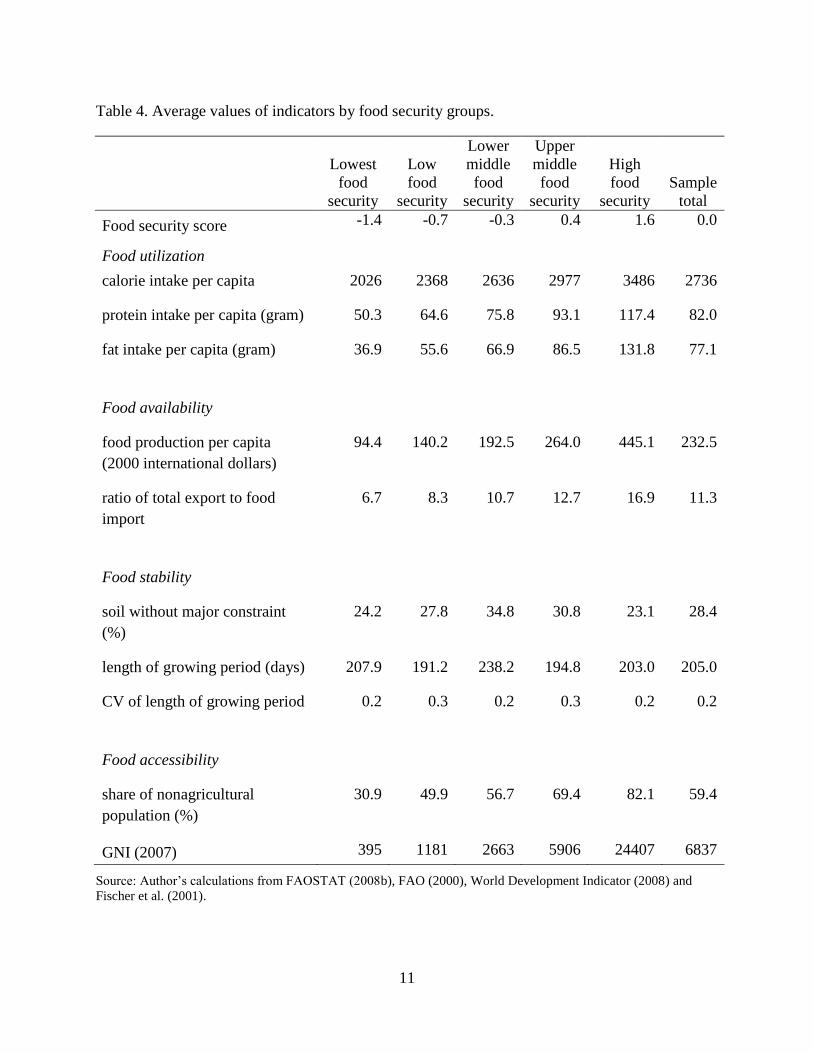
11
Table 4. Average values of indicators by food security groups.
Lowest
food
security
Low
food
security
Lower
middle
food
security
Upper
middle
food
security
High
food
security
Sample
total
Food security score -1.4 -0.7 -0.3 0.4 1.6 0.0
Food utilization
calorie intake per capita 2026 2368 2636 2977 3486 2736
protein intake per capita (gram) 50.3 64.6 75.8 93.1 117.4 82.0
fat intake per capita (gram) 36.9 55.6 66.9 86.5 131.8 77.1
Food availability
food production per capita
(2000 international dollars)
94.4 140.2 192.5 264.0 445.1 232.5
ratio of total export to food
import
6.7 8.3 10.7 12.7 16.9 11.3
Food stability
soil without major constraint
(%)
24.2 27.8 34.8 30.8 23.1 28.4
length of growing period (days) 207.9 191.2 238.2 194.8 203.0 205.0
CV of length of growing period 0.2 0.3 0.2 0.3 0.2 0.2
Food accessibility
share of nonagricultural
population (%)
30.9 49.9 56.7 69.4 82.1 59.4
GNI (2007) 395 1181 2663 5906 24407 6837
Source: Author’s calculations from FAOSTAT (2008b), FAO (2000), World Development Indicator (2008) and
Fischer et al. (2001).
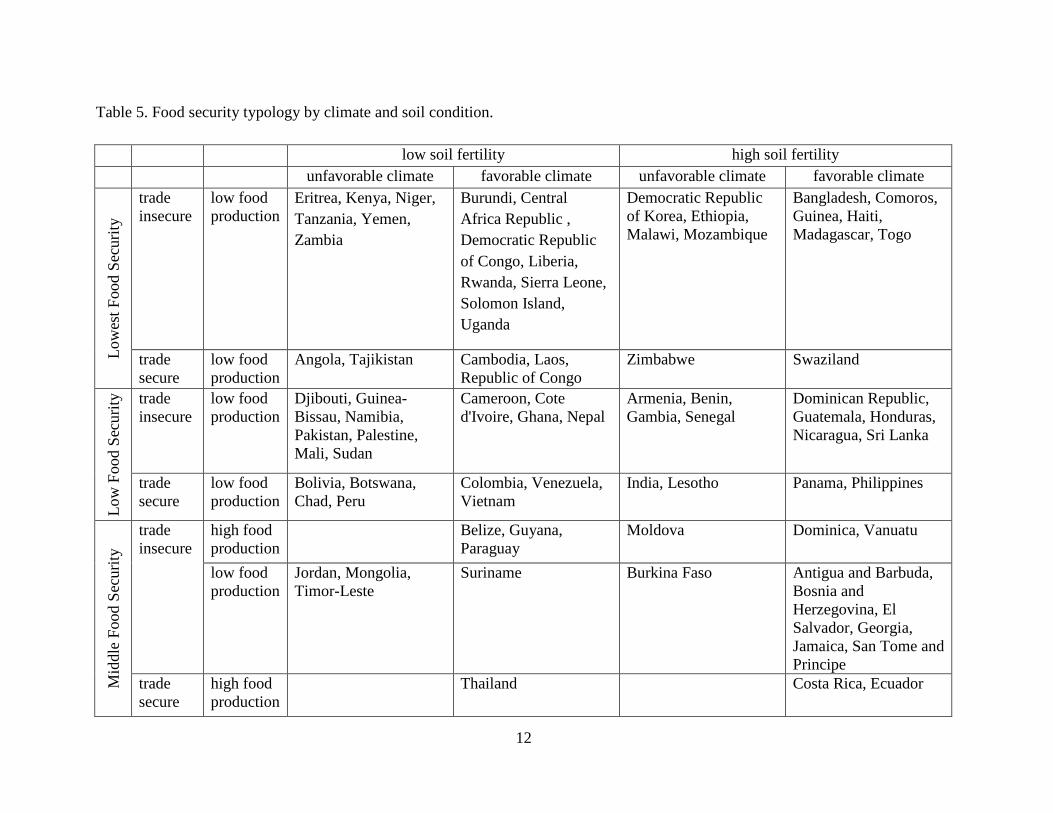
12
Table 5. Food security typology by climate and soil condition.
low soil fertility high soil fertility
unfavorable climate favorable climate unfavorable climate favorable climate
Low
est
Food S
ecuri
ty
trade
insecure
low food
production
Eritrea, Kenya, Niger,
Tanzania, Yemen,
Zambia
Burundi, Central
Africa Republic ,
Democratic Republic
of Congo, Liberia,
Rwanda, Sierra Leone,
Solomon Island,
Uganda
Democratic Republic
of Korea, Ethiopia,
Malawi, Mozambique
Bangladesh, Comoros,
Guinea, Haiti,
Madagascar, Togo
trade
secure
low food
production
Angola, Tajikistan Cambodia, Laos,
Republic of Congo
Zimbabwe Swaziland
Low
Food S
ecuri
ty
trade
insecure
low food
production
Djibouti, Guinea-
Bissau, Namibia,
Pakistan, Palestine,
Mali, Sudan
Cameroon, Cote
d'Ivoire, Ghana, Nepal
Armenia, Benin,
Gambia, Senegal
Dominican Republic,
Guatemala, Honduras,
Nicaragua, Sri Lanka
trade
secure
low food
production
Bolivia, Botswana,
Chad, Peru
Colombia, Venezuela,
Vietnam
India, Lesotho Panama, Philippines
Mid
dle
Food S
ecuri
ty
trade
insecure
high food
production
Belize, Guyana,
Paraguay
Moldova Dominica, Vanuatu
low food
production
Jordan, Mongolia,
Timor-Leste
Suriname Burkina Faso Antigua and Barbuda,
Bosnia and
Herzegovina, El
Salvador, Georgia,
Jamaica, San Tome and
Principe
trade
secure
high food
production
Thailand Costa Rica, Ecuador
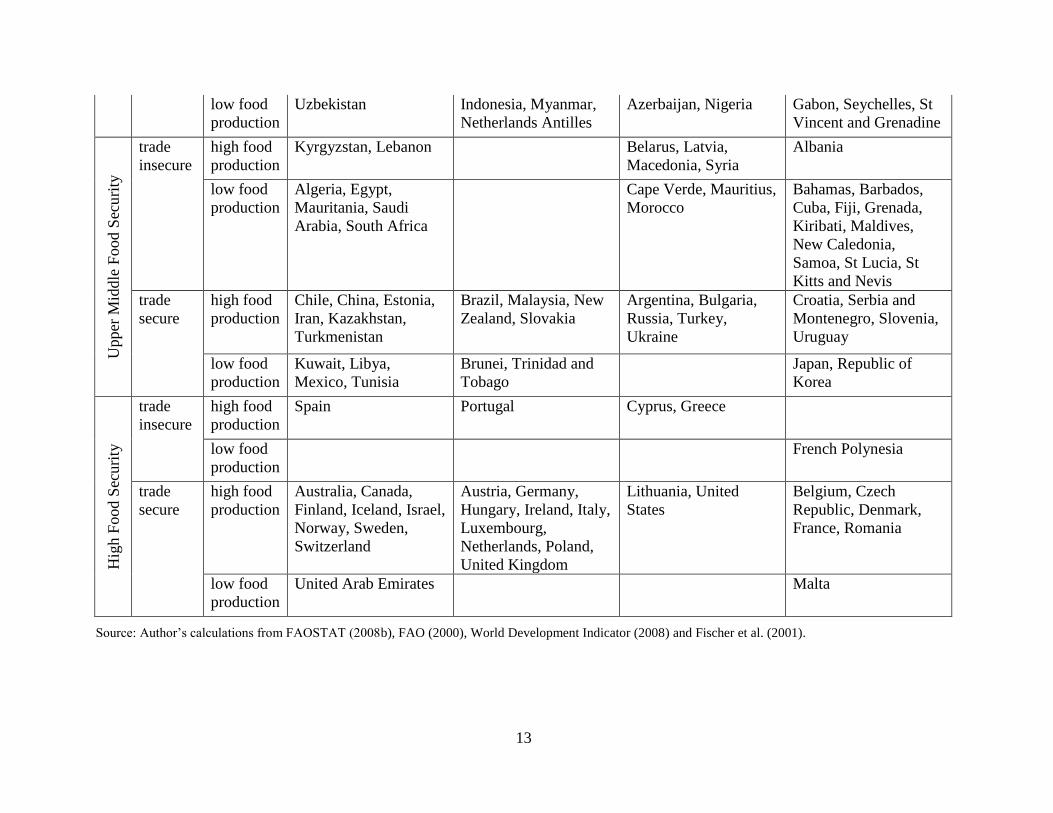
13
low food
production
Uzbekistan Indonesia, Myanmar,
Netherlands Antilles
Azerbaijan, Nigeria Gabon, Seychelles, St
Vincent and Grenadine U
pper
Mid
dle
Food S
ecu
rity
trade
insecure
high food
production
Kyrgyzstan, Lebanon Belarus, Latvia,
Macedonia, Syria
Albania
low food
production
Algeria, Egypt,
Mauritania, Saudi
Arabia, South Africa
Cape Verde, Mauritius,
Morocco
Bahamas, Barbados,
Cuba, Fiji, Grenada,
Kiribati, Maldives,
New Caledonia,
Samoa, St Lucia, St
Kitts and Nevis
trade
secure
high food
production
Chile, China, Estonia,
Iran, Kazakhstan,
Turkmenistan
Brazil, Malaysia, New
Zealand, Slovakia
Argentina, Bulgaria,
Russia, Turkey,
Ukraine
Croatia, Serbia and
Montenegro, Slovenia,
Uruguay
low food
production
Kuwait, Libya,
Mexico, Tunisia
Brunei, Trinidad and
Tobago
Japan, Republic of
Korea
Hig
h F
ood S
ecuri
ty
trade
insecure
high food
production
Spain Portugal Cyprus, Greece
low food
production
French Polynesia
trade
secure
high food
production
Australia, Canada,
Finland, Iceland, Israel,
Norway, Sweden,
Switzerland
Austria, Germany,
Hungary, Ireland, Italy,
Luxembourg,
Netherlands, Poland,
United Kingdom
Lithuania, United
States
Belgium, Czech
Republic, Denmark,
France, Romania
low food
production
United Arab Emirates Malta
Source: Author’s calculations from FAOSTAT (2008b), FAO (2000), World Development Indicator (2008) and Fischer et al. (2001).
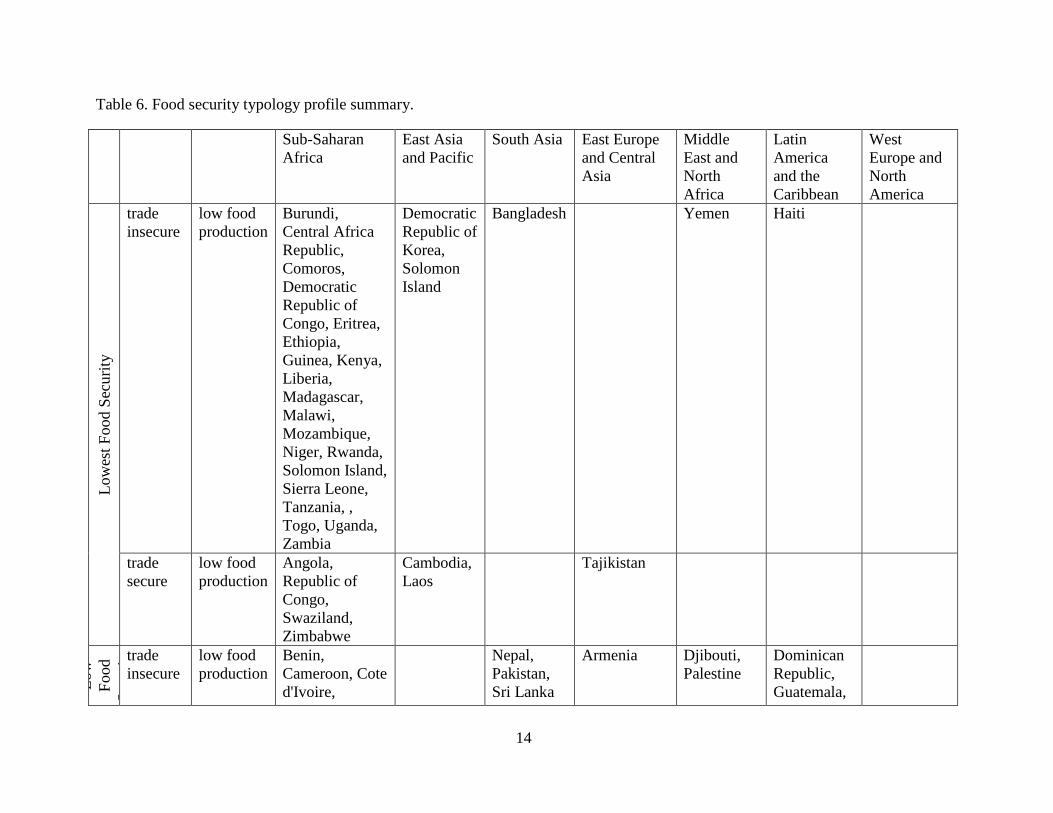
14
Table 6. Food security typology profile summary.
Sub-Saharan
Africa
East Asia
and Pacific
South Asia East Europe
and Central
Asia
Middle
East and
North
Africa
Latin
America
and the
Caribbean
West
Europe and
North
America
Low
est
Food S
ecuri
ty
trade
insecure
low food
production
Burundi,
Central Africa
Republic,
Comoros,
Democratic
Republic of
Congo, Eritrea,
Ethiopia,
Guinea, Kenya,
Liberia,
Madagascar,
Malawi,
Mozambique,
Niger, Rwanda,
Solomon Island,
Sierra Leone,
Tanzania, ,
Togo, Uganda,
Zambia
Democratic
Republic of
Korea,
Solomon
Island
Bangladesh Yemen Haiti
trade
secure
low food
production
Angola,
Republic of
Congo,
Swaziland,
Zimbabwe
Cambodia,
Laos
Tajikistan
Low
Food
Sec
uri
ty
trade
insecure
low food
production
Benin,
Cameroon, Cote
d'Ivoire,
Nepal,
Pakistan,
Sri Lanka
Armenia Djibouti,
Palestine
Dominican
Republic,
Guatemala,
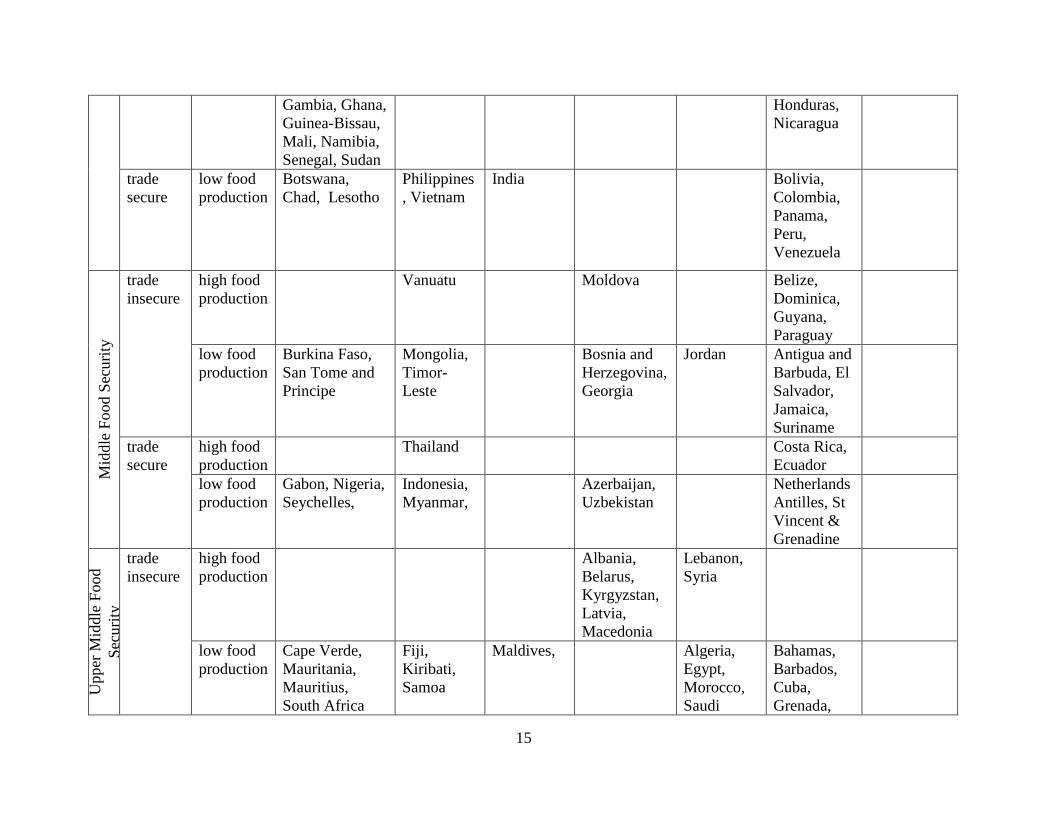
15
Gambia, Ghana,
Guinea-Bissau,
Mali, Namibia,
Senegal, Sudan
Honduras,
Nicaragua
trade
secure
low food
production
Botswana,
Chad, Lesotho
Philippines
, Vietnam
India Bolivia,
Colombia,
Panama,
Peru,
Venezuela
Mid
dle
Food S
ecuri
ty
trade
insecure
high food
production
Vanuatu Moldova Belize,
Dominica,
Guyana,
Paraguay
low food
production
Burkina Faso,
San Tome and
Principe
Mongolia,
Timor-
Leste
Bosnia and
Herzegovina,
Georgia
Jordan Antigua and
Barbuda, El
Salvador,
Jamaica,
Suriname
trade
secure
high food
production
Thailand Costa Rica,
Ecuador
low food
production
Gabon, Nigeria,
Seychelles,
Indonesia,
Myanmar,
Azerbaijan,
Uzbekistan
Netherlands
Antilles, St
Vincent &
Grenadine
Upper
Mid
dle
Food
Sec
uri
ty
trade
insecure
high food
production
Albania,
Belarus,
Kyrgyzstan,
Latvia,
Macedonia
Lebanon,
Syria
low food
production
Cape Verde,
Mauritania,
Mauritius,
South Africa
Fiji,
Kiribati,
Samoa
Maldives, Algeria,
Egypt,
Morocco,
Saudi
Bahamas,
Barbados,
Cuba,
Grenada,
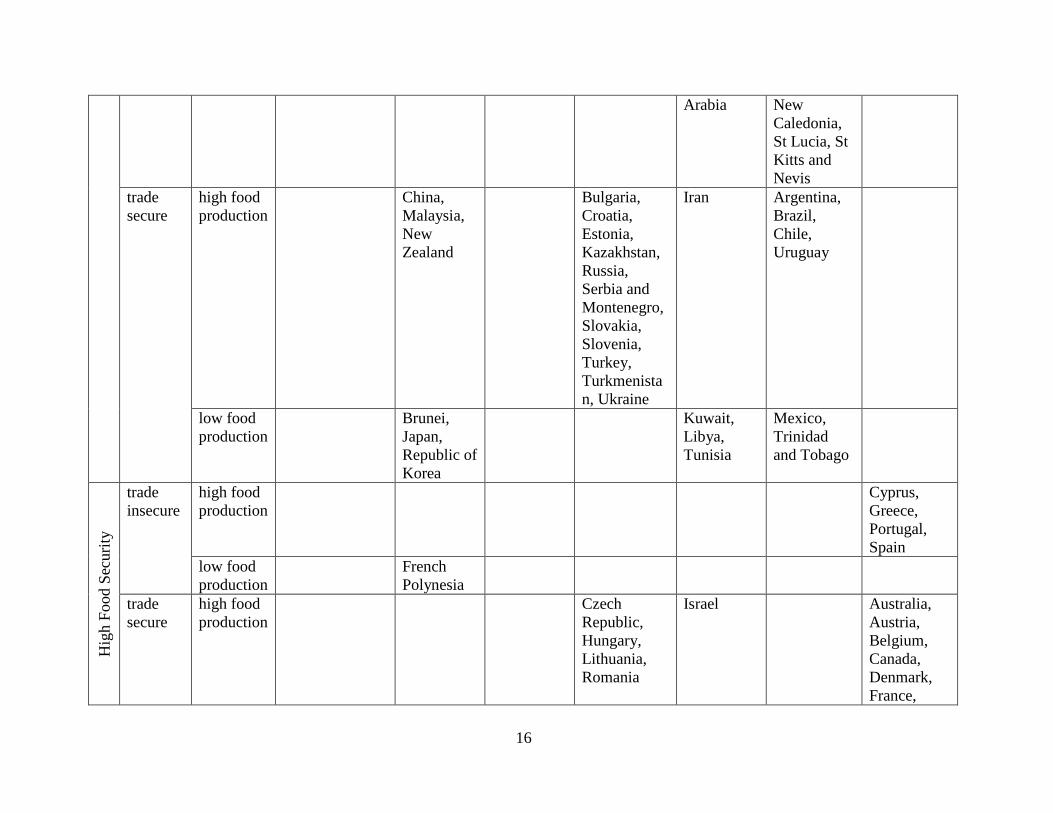
16
Arabia New
Caledonia,
St Lucia, St
Kitts and
Nevis
trade
secure
high food
production
China,
Malaysia,
New
Zealand
Bulgaria,
Croatia,
Estonia,
Kazakhstan,
Russia,
Serbia and
Montenegro,
Slovakia,
Slovenia,
Turkey,
Turkmenista
n, Ukraine
Iran Argentina,
Brazil,
Chile,
Uruguay
low food
production
Brunei,
Japan,
Republic of
Korea
Kuwait,
Libya,
Tunisia
Mexico,
Trinidad
and Tobago
Hig
h F
ood S
ecuri
ty
trade
insecure
high food
production
Cyprus,
Greece,
Portugal,
Spain
low food
production
French
Polynesia
trade
secure
high food
production
Czech
Republic,
Hungary,
Lithuania,
Romania
Israel Australia,
Austria,
Belgium,
Canada,
Denmark,
France,
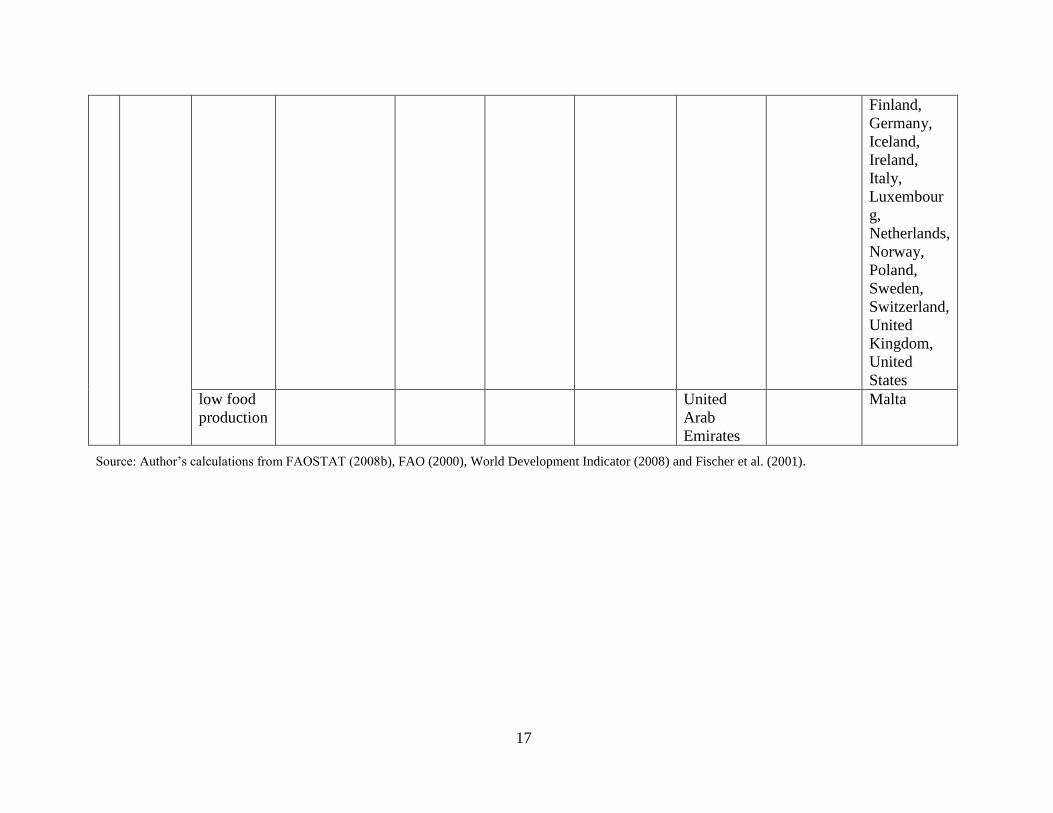
17
Finland,
Germany,
Iceland,
Ireland,
Italy,
Luxembour
g,
Netherlands,
Norway,
Poland,
Sweden,
Switzerland,
United
Kingdom,
United
States
low food
production
United
Arab
Emirates
Malta
Source: Author’s calculations from FAOSTAT (2008b), FAO (2000), World Development Indicator (2008) and Fischer et al. (2001).
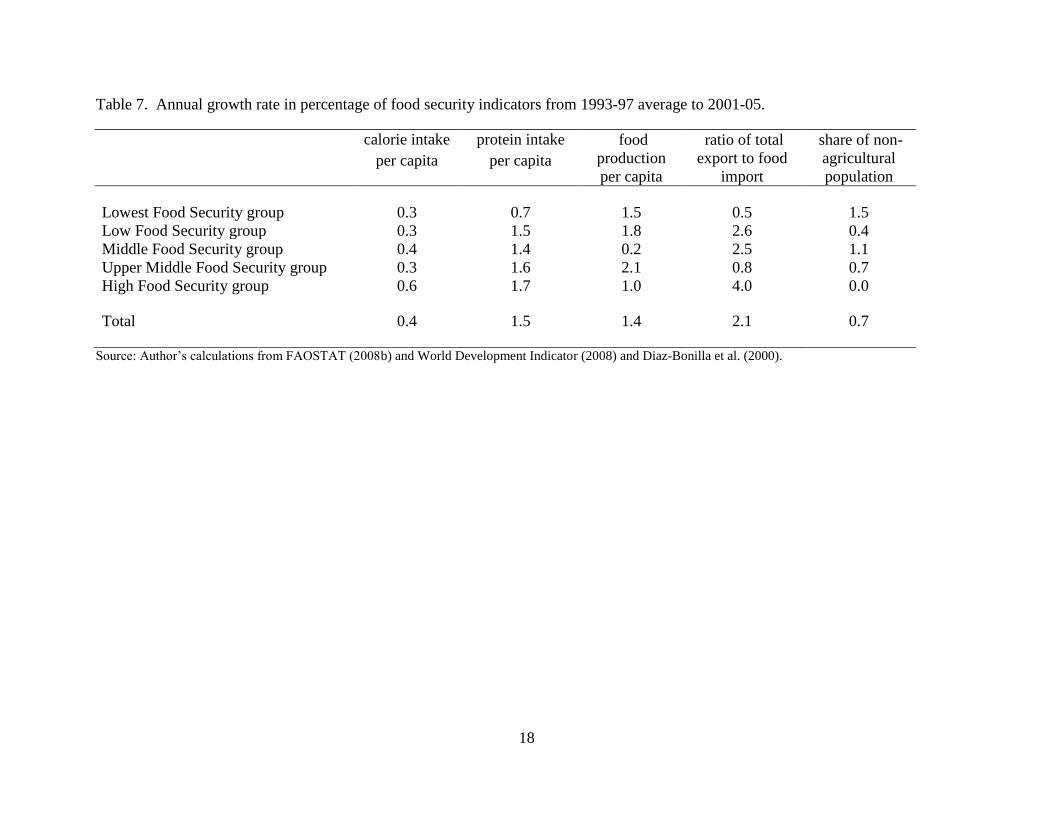
18
Table 7. Annual growth rate in percentage of food security indicators from 1993-97 average to 2001-05.
calorie intake
per capita
protein intake
per capita
food
production
per capita
ratio of total
export to food
import
share of non-
agricultural
population
Lowest Food Security group 0.3 0.7 1.5 0.5 1.5
Low Food Security group 0.3 1.5 1.8 2.6 0.4
Middle Food Security group 0.4 1.4 0.2 2.5 1.1
Upper Middle Food Security group 0.3 1.6 2.1 0.8 0.7
High Food Security group 0.6 1.7 1.0 4.0 0.0
Total 0.4 1.5 1.4 2.1 0.7
Source: Author’s calculations from FAOSTAT (2008b) and World Development Indicator (2008) and Diaz-Bonilla et al. (2000).
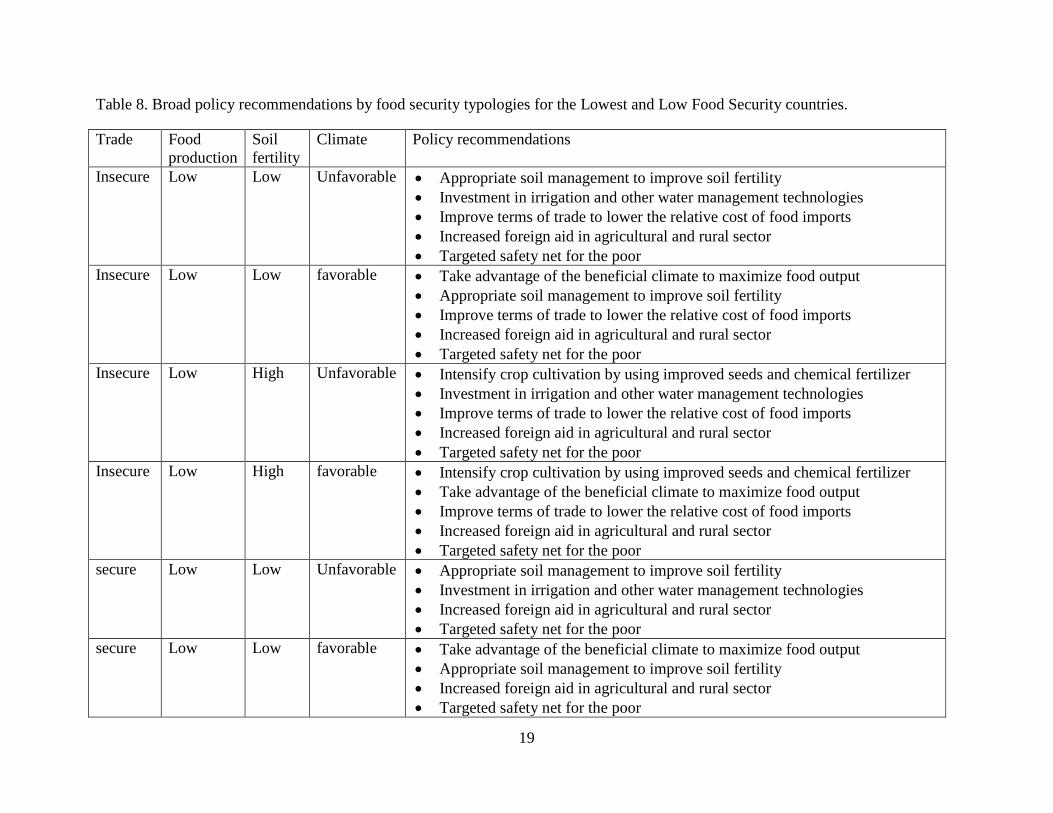
19
Table 8. Broad policy recommendations by food security typologies for the Lowest and Low Food Security countries.
Trade Food
production
Soil
fertility
Climate Policy recommendations
Insecure Low Low Unfavorable Appropriate soil management to improve soil fertility
Investment in irrigation and other water management technologies
Improve terms of trade to lower the relative cost of food imports
Increased foreign aid in agricultural and rural sector
Targeted safety net for the poor
Insecure Low Low favorable Take advantage of the beneficial climate to maximize food output
Appropriate soil management to improve soil fertility
Improve terms of trade to lower the relative cost of food imports
Increased foreign aid in agricultural and rural sector
Targeted safety net for the poor
Insecure Low High Unfavorable Intensify crop cultivation by using improved seeds and chemical fertilizer
Investment in irrigation and other water management technologies
Improve terms of trade to lower the relative cost of food imports
Increased foreign aid in agricultural and rural sector
Targeted safety net for the poor
Insecure Low High favorable Intensify crop cultivation by using improved seeds and chemical fertilizer
Take advantage of the beneficial climate to maximize food output
Improve terms of trade to lower the relative cost of food imports
Increased foreign aid in agricultural and rural sector
Targeted safety net for the poor
secure Low Low Unfavorable Appropriate soil management to improve soil fertility
Investment in irrigation and other water management technologies
Increased foreign aid in agricultural and rural sector
Targeted safety net for the poor
secure Low Low favorable Take advantage of the beneficial climate to maximize food output
Appropriate soil management to improve soil fertility
Increased foreign aid in agricultural and rural sector
Targeted safety net for the poor
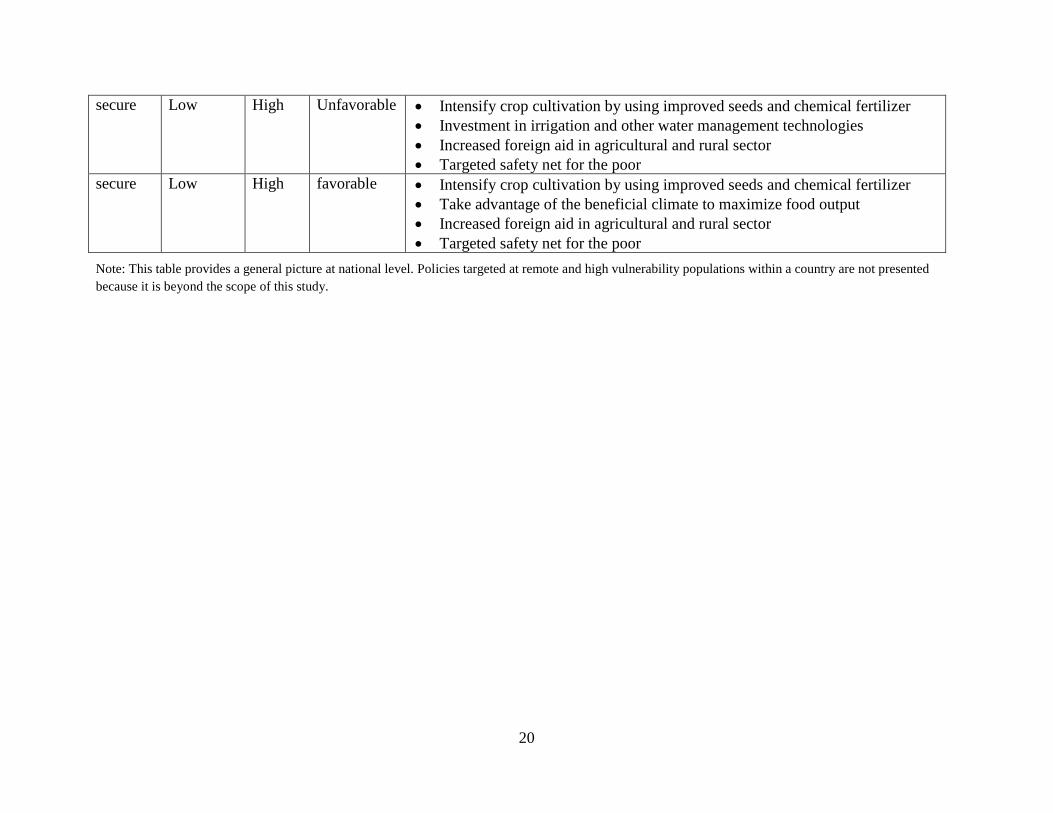
20
secure Low High Unfavorable Intensify crop cultivation by using improved seeds and chemical fertilizer
Investment in irrigation and other water management technologies
Increased foreign aid in agricultural and rural sector
Targeted safety net for the poor
secure Low High favorable Intensify crop cultivation by using improved seeds and chemical fertilizer
Take advantage of the beneficial climate to maximize food output
Increased foreign aid in agricultural and rural sector
Targeted safety net for the poor
Note: This table provides a general picture at national level. Policies targeted at remote and high vulnerability populations within a country are not presented
because it is beyond the scope of this study.
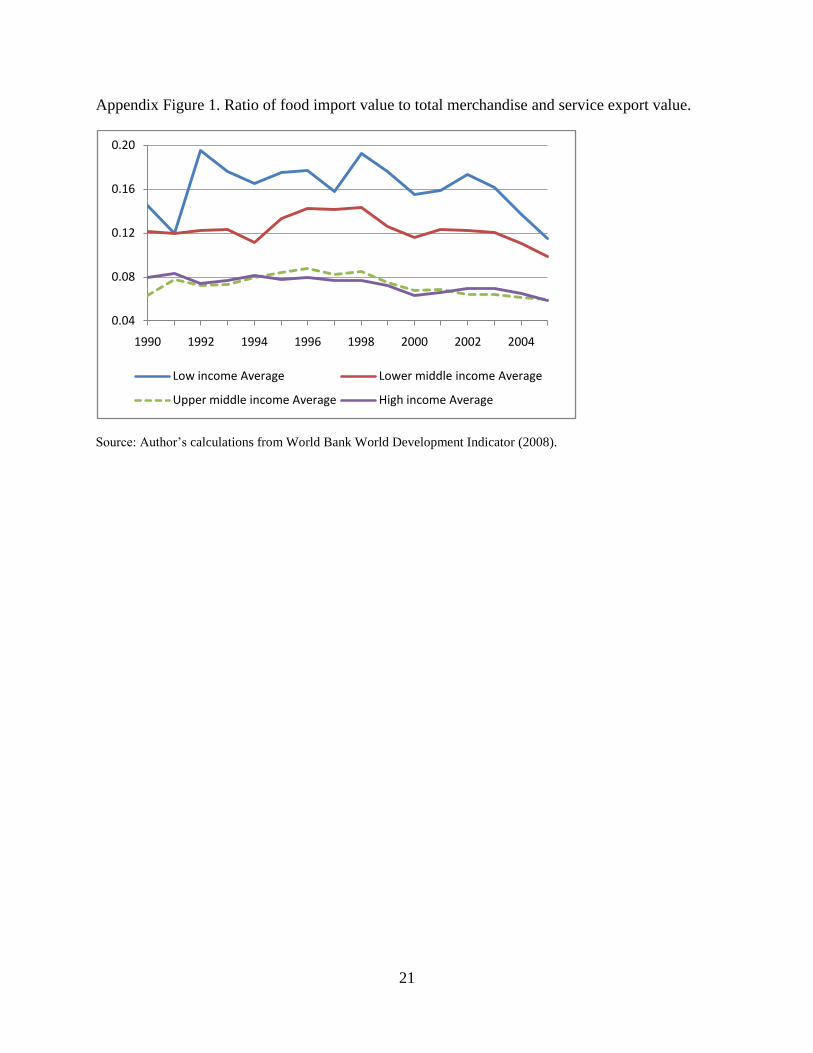
21
Appendix Figure 1. Ratio of food import value to total merchandise and service export value.
Source: Author’s calculations from World Bank World Development Indicator (2008).
0.04
0.08
0.12
0.16
0.20
1990 1992 1994 1996 1998 2000 2002 2004
Low income Average Lower middle income Average
Upper middle income Average High income Average
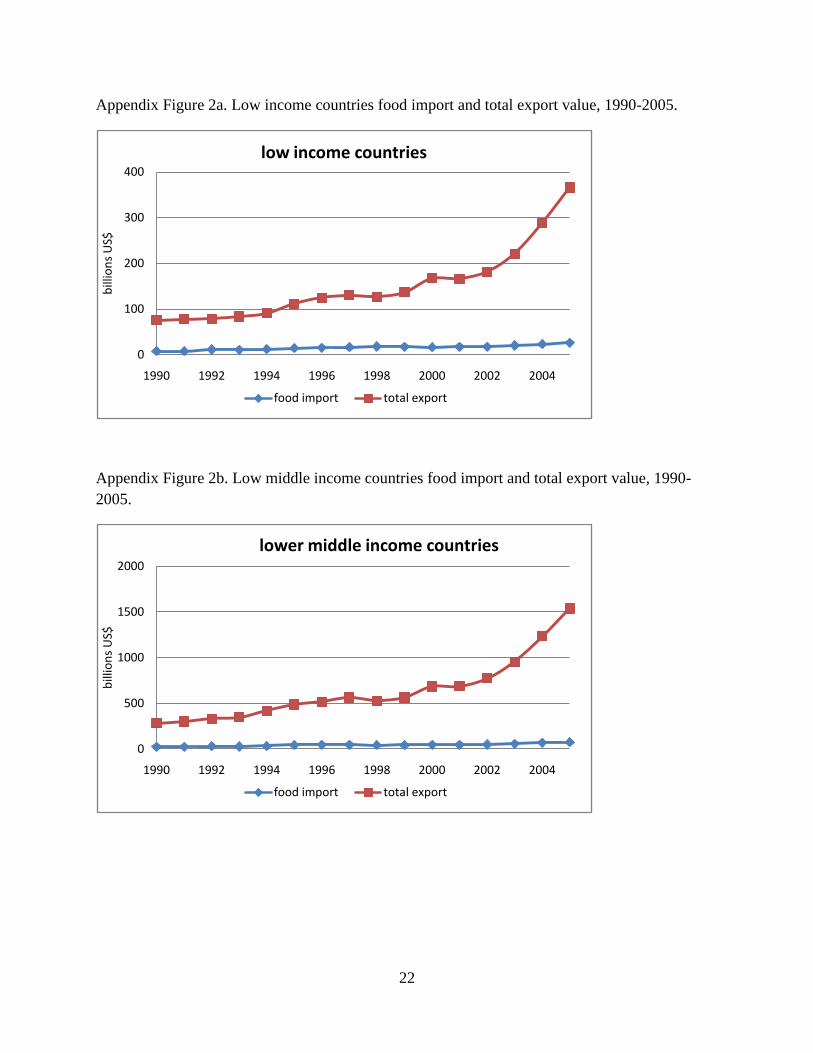
22
Appendix Figure 2a. Low income countries food import and total export value, 1990-2005.
Appendix Figure 2b. Low middle income countries food import and total export value, 1990-
2005.
0
100
200
300
400
1990 1992 1994 1996 1998 2000 2002 2004
bill
ion
s U
S$
low income countries
food import total export
0
500
1000
1500
2000
1990 1992 1994 1996 1998 2000 2002 2004
bill
ion
s U
S$
lower middle income countries
food import total export
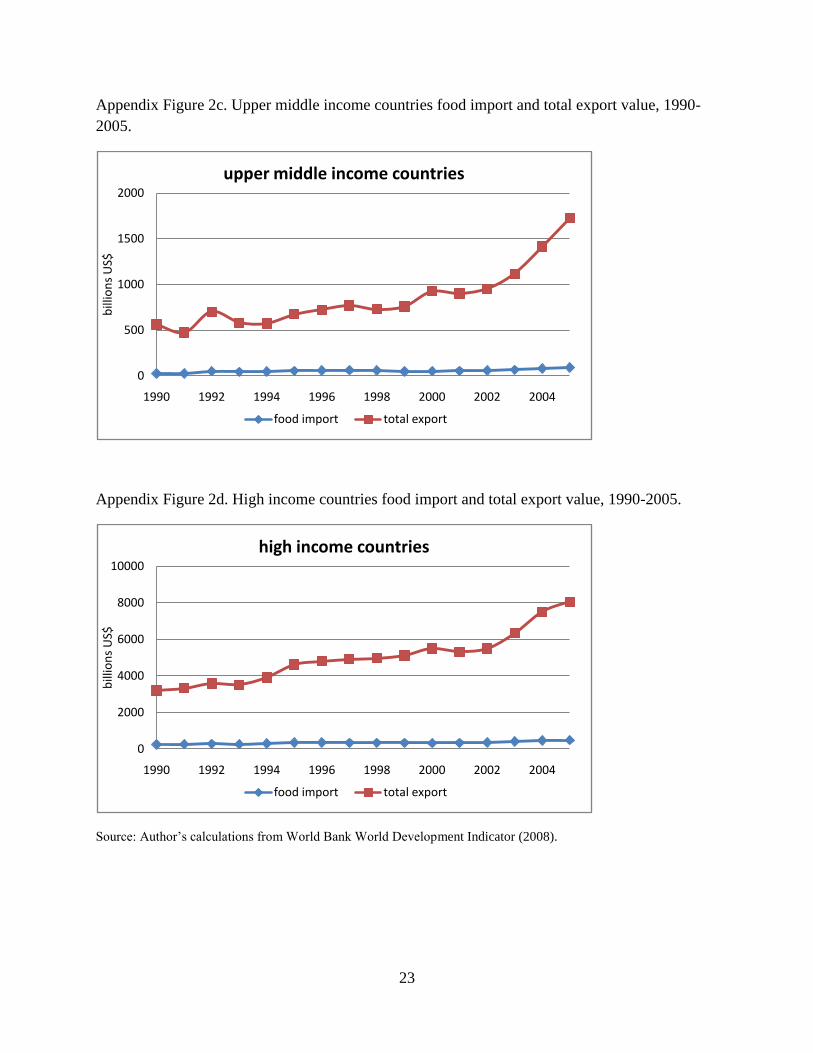
23
Appendix Figure 2c. Upper middle income countries food import and total export value, 1990-
2005.
Appendix Figure 2d. High income countries food import and total export value, 1990-2005.
Source: Author’s calculations from World Bank World Development Indicator (2008).
0
500
1000
1500
2000
1990 1992 1994 1996 1998 2000 2002 2004
bill
ion
s U
S$
upper middle income countries
food import total export
0
2000
4000
6000
8000
10000
1990 1992 1994 1996 1998 2000 2002 2004
bill
ion
s U
S$
high income countries
food import total export
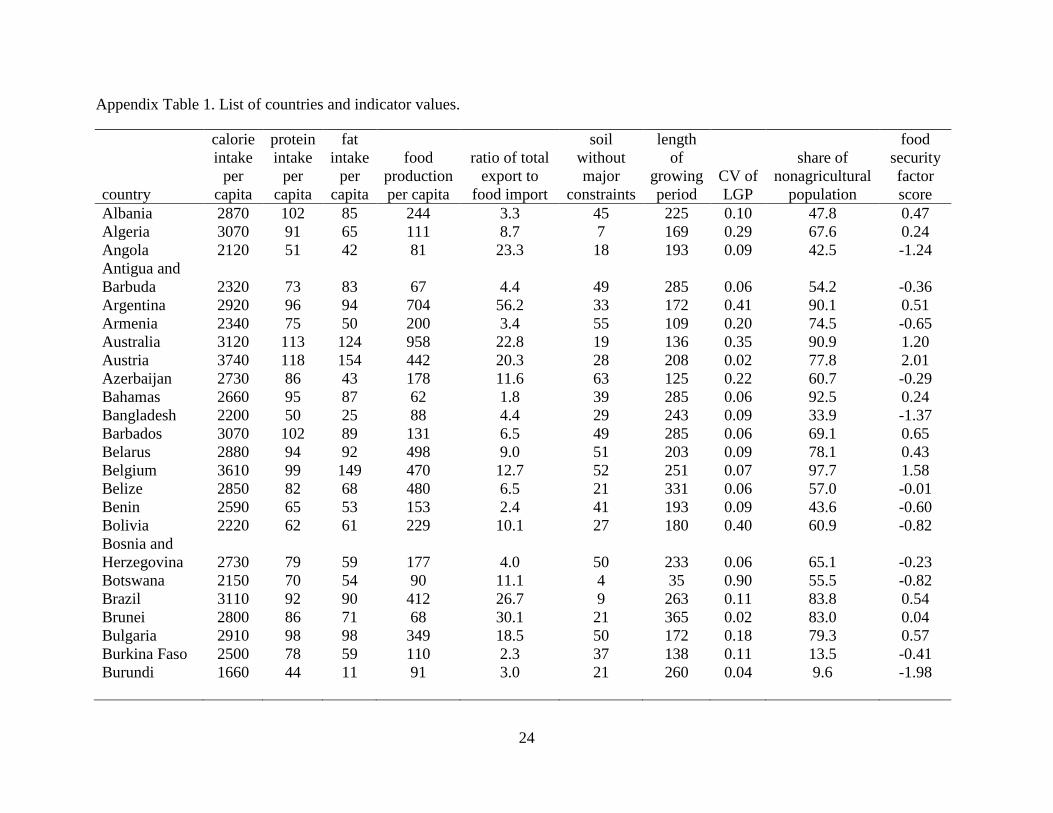
24
Appendix Table 1. List of countries and indicator values.
country
calorie
intake
per
capita
protein
intake
per
capita
fat
intake
per
capita
food
production
per capita
ratio of total
export to
food import
soil
without
major
constraints
length
of
growing
period
CV of
LGP
share of
nonagricultural
population
food
security
factor
score
Albania 2870 102 85 244 3.3 45 225 0.10 47.8 0.47
Algeria 3070 91 65 111 8.7 7 169 0.29 67.6 0.24
Angola 2120 51 42 81 23.3 18 193 0.09 42.5 -1.24
Antigua and
Barbuda 2320 73 83 67 4.4 49 285 0.06 54.2 -0.36
Argentina 2920 96 94 704 56.2 33 172 0.41 90.1 0.51
Armenia 2340 75 50 200 3.4 55 109 0.20 74.5 -0.65
Australia 3120 113 124 958 22.8 19 136 0.35 90.9 1.20
Austria 3740 118 154 442 20.3 28 208 0.02 77.8 2.01
Azerbaijan 2730 86 43 178 11.6 63 125 0.22 60.7 -0.29
Bahamas 2660 95 87 62 1.8 39 285 0.06 92.5 0.24
Bangladesh 2200 50 25 88 4.4 29 243 0.09 33.9 -1.37
Barbados 3070 102 89 131 6.5 49 285 0.06 69.1 0.65
Belarus 2880 94 92 498 9.0 51 203 0.09 78.1 0.43
Belgium 3610 99 149 470 12.7 52 251 0.07 97.7 1.58
Belize 2850 82 68 480 6.5 21 331 0.06 57.0 -0.01
Benin 2590 65 53 153 2.4 41 193 0.09 43.6 -0.60
Bolivia 2220 62 61 229 10.1 27 180 0.40 60.9 -0.82
Bosnia and
Herzegovina 2730 79 59 177 4.0 50 233 0.06 65.1 -0.23
Botswana 2150 70 54 90 11.1 4 35 0.90 55.5 -0.82
Brazil 3110 92 90 412 26.7 9 263 0.11 83.8 0.54
Brunei 2800 86 71 68 30.1 21 365 0.02 83.0 0.04
Bulgaria 2910 98 98 349 18.5 50 172 0.18 79.3 0.57
Burkina Faso 2500 78 59 110 2.3 37 138 0.11 13.5 -0.41
Burundi 1660 44 11 91 3.0 21 260 0.04 9.6 -1.98
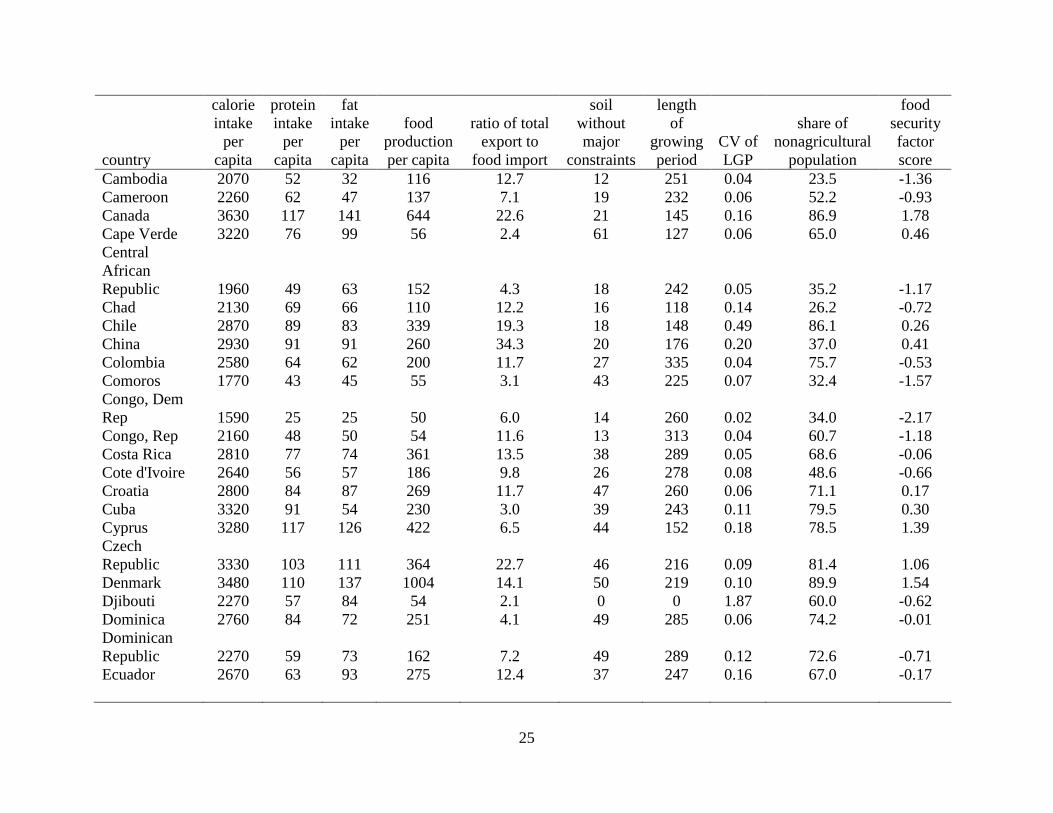
25
country
calorie
intake
per
capita
protein
intake
per
capita
fat
intake
per
capita
food
production
per capita
ratio of total
export to
food import
soil
without
major
constraints
length
of
growing
period
CV of
LGP
share of
nonagricultural
population
food
security
factor
score
Cambodia 2070 52 32 116 12.7 12 251 0.04 23.5 -1.36
Cameroon 2260 62 47 137 7.1 19 232 0.06 52.2 -0.93
Canada 3630 117 141 644 22.6 21 145 0.16 86.9 1.78
Cape Verde 3220 76 99 56 2.4 61 127 0.06 65.0 0.46
Central
African
Republic 1960 49 63 152 4.3 18 242 0.05 35.2 -1.17
Chad 2130 69 66 110 12.2 16 118 0.14 26.2 -0.72
Chile 2870 89 83 339 19.3 18 148 0.49 86.1 0.26
China 2930 91 91 260 34.3 20 176 0.20 37.0 0.41
Colombia 2580 64 62 200 11.7 27 335 0.04 75.7 -0.53
Comoros 1770 43 45 55 3.1 43 225 0.07 32.4 -1.57
Congo, Dem
Rep 1590 25 25 50 6.0 14 260 0.02 34.0 -2.17
Congo, Rep 2160 48 50 54 11.6 13 313 0.04 60.7 -1.18
Costa Rica 2810 77 74 361 13.5 38 289 0.05 68.6 -0.06
Cote d'Ivoire 2640 56 57 186 9.8 26 278 0.08 48.6 -0.66
Croatia 2800 84 87 269 11.7 47 260 0.06 71.1 0.17
Cuba 3320 91 54 230 3.0 39 243 0.11 79.5 0.30
Cyprus 3280 117 126 422 6.5 44 152 0.18 78.5 1.39
Czech
Republic 3330 103 111 364 22.7 46 216 0.09 81.4 1.06
Denmark 3480 110 137 1004 14.1 50 219 0.10 89.9 1.54
Djibouti 2270 57 84 54 2.1 0 0 1.87 60.0 -0.62
Dominica 2760 84 72 251 4.1 49 285 0.06 74.2 -0.01
Dominican
Republic 2270 59 73 162 7.2 49 289 0.12 72.6 -0.71
Ecuador 2670 63 93 275 12.4 37 247 0.16 67.0 -0.17
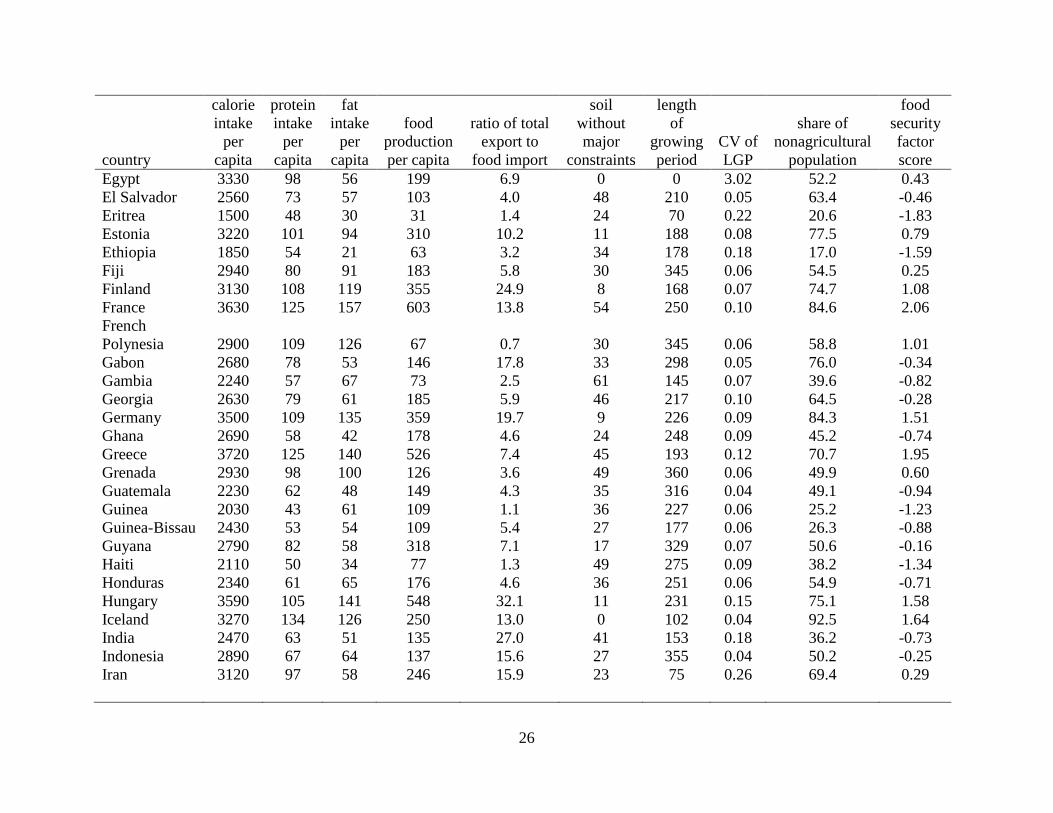
26
country
calorie
intake
per
capita
protein
intake
per
capita
fat
intake
per
capita
food
production
per capita
ratio of total
export to
food import
soil
without
major
constraints
length
of
growing
period
CV of
LGP
share of
nonagricultural
population
food
security
factor
score
Egypt 3330 98 56 199 6.9 0 0 3.02 52.2 0.43
El Salvador 2560 73 57 103 4.0 48 210 0.05 63.4 -0.46
Eritrea 1500 48 30 31 1.4 24 70 0.22 20.6 -1.83
Estonia 3220 101 94 310 10.2 11 188 0.08 77.5 0.79
Ethiopia 1850 54 21 63 3.2 34 178 0.18 17.0 -1.59
Fiji 2940 80 91 183 5.8 30 345 0.06 54.5 0.25
Finland 3130 108 119 355 24.9 8 168 0.07 74.7 1.08
France 3630 125 157 603 13.8 54 250 0.10 84.6 2.06
French
Polynesia 2900 109 126 67 0.7 30 345 0.06 58.8 1.01
Gabon 2680 78 53 146 17.8 33 298 0.05 76.0 -0.34
Gambia 2240 57 67 73 2.5 61 145 0.07 39.6 -0.82
Georgia 2630 79 61 185 5.9 46 217 0.10 64.5 -0.28
Germany 3500 109 135 359 19.7 9 226 0.09 84.3 1.51
Ghana 2690 58 42 178 4.6 24 248 0.09 45.2 -0.74
Greece 3720 125 140 526 7.4 45 193 0.12 70.7 1.95
Grenada 2930 98 100 126 3.6 49 360 0.06 49.9 0.60
Guatemala 2230 62 48 149 4.3 35 316 0.04 49.1 -0.94
Guinea 2030 43 61 109 1.1 36 227 0.06 25.2 -1.23
Guinea-Bissau 2430 53 54 109 5.4 27 177 0.06 26.3 -0.88
Guyana 2790 82 58 318 7.1 17 329 0.07 50.6 -0.16
Haiti 2110 50 34 77 1.3 49 275 0.09 38.2 -1.34
Honduras 2340 61 65 176 4.6 36 251 0.06 54.9 -0.71
Hungary 3590 105 141 548 32.1 11 231 0.15 75.1 1.58
Iceland 3270 134 126 250 13.0 0 102 0.04 92.5 1.64
India 2470 63 51 135 27.0 41 153 0.18 36.2 -0.73
Indonesia 2890 67 64 137 15.6 27 355 0.04 50.2 -0.25
Iran 3120 97 58 246 15.9 23 75 0.26 69.4 0.29
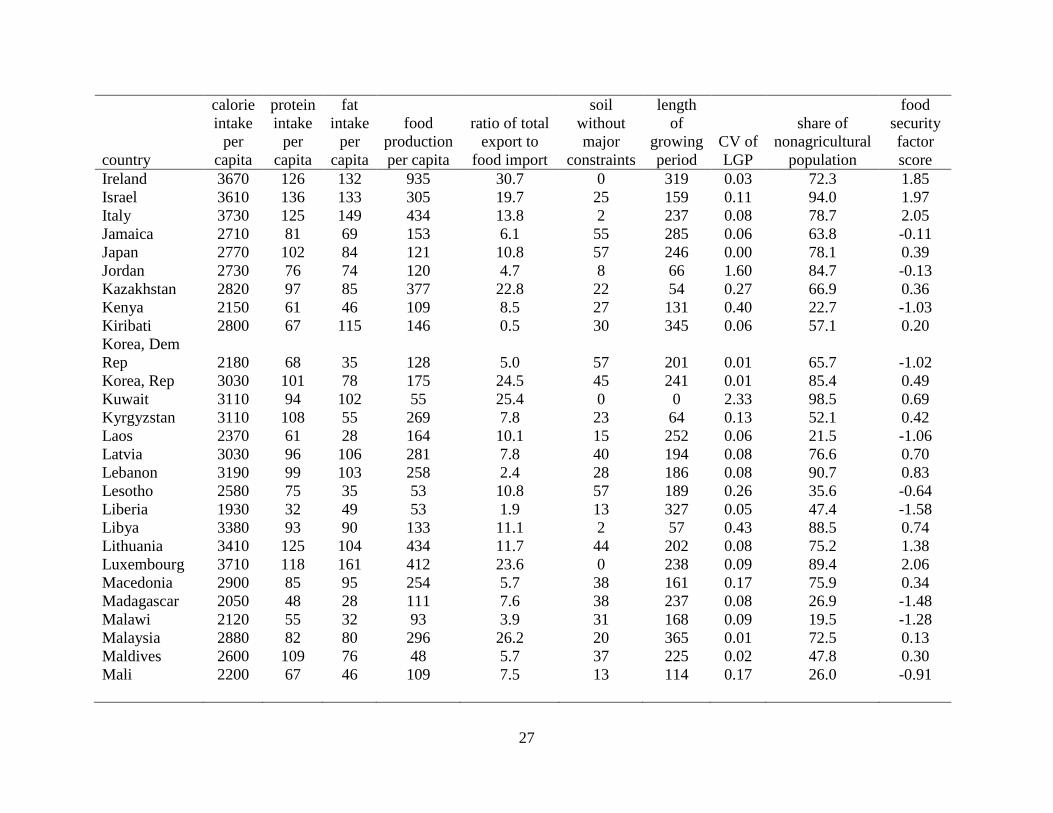
27
country
calorie
intake
per
capita
protein
intake
per
capita
fat
intake
per
capita
food
production
per capita
ratio of total
export to
food import
soil
without
major
constraints
length
of
growing
period
CV of
LGP
share of
nonagricultural
population
food
security
factor
score
Ireland 3670 126 132 935 30.7 0 319 0.03 72.3 1.85
Israel 3610 136 133 305 19.7 25 159 0.11 94.0 1.97
Italy 3730 125 149 434 13.8 2 237 0.08 78.7 2.05
Jamaica 2710 81 69 153 6.1 55 285 0.06 63.8 -0.11
Japan 2770 102 84 121 10.8 57 246 0.00 78.1 0.39
Jordan 2730 76 74 120 4.7 8 66 1.60 84.7 -0.13
Kazakhstan 2820 97 85 377 22.8 22 54 0.27 66.9 0.36
Kenya 2150 61 46 109 8.5 27 131 0.40 22.7 -1.03
Kiribati 2800 67 115 146 0.5 30 345 0.06 57.1 0.20
Korea, Dem
Rep 2180 68 35 128 5.0 57 201 0.01 65.7 -1.02
Korea, Rep 3030 101 78 175 24.5 45 241 0.01 85.4 0.49
Kuwait 3110 94 102 55 25.4 0 0 2.33 98.5 0.69
Kyrgyzstan 3110 108 55 269 7.8 23 64 0.13 52.1 0.42
Laos 2370 61 28 164 10.1 15 252 0.06 21.5 -1.06
Latvia 3030 96 106 281 7.8 40 194 0.08 76.6 0.70
Lebanon 3190 99 103 258 2.4 28 186 0.08 90.7 0.83
Lesotho 2580 75 35 53 10.8 57 189 0.26 35.6 -0.64
Liberia 1930 32 49 53 1.9 13 327 0.05 47.4 -1.58
Libya 3380 93 90 133 11.1 2 57 0.43 88.5 0.74
Lithuania 3410 125 104 434 11.7 44 202 0.08 75.2 1.38
Luxembourg 3710 118 161 412 23.6 0 238 0.09 89.4 2.06
Macedonia 2900 85 95 254 5.7 38 161 0.17 75.9 0.34
Madagascar 2050 48 28 111 7.6 38 237 0.08 26.9 -1.48
Malawi 2120 55 32 93 3.9 31 168 0.09 19.5 -1.28
Malaysia 2880 82 80 296 26.2 20 365 0.01 72.5 0.13
Maldives 2600 109 76 48 5.7 37 225 0.02 47.8 0.30
Mali 2200 67 46 109 7.5 13 114 0.17 26.0 -0.91
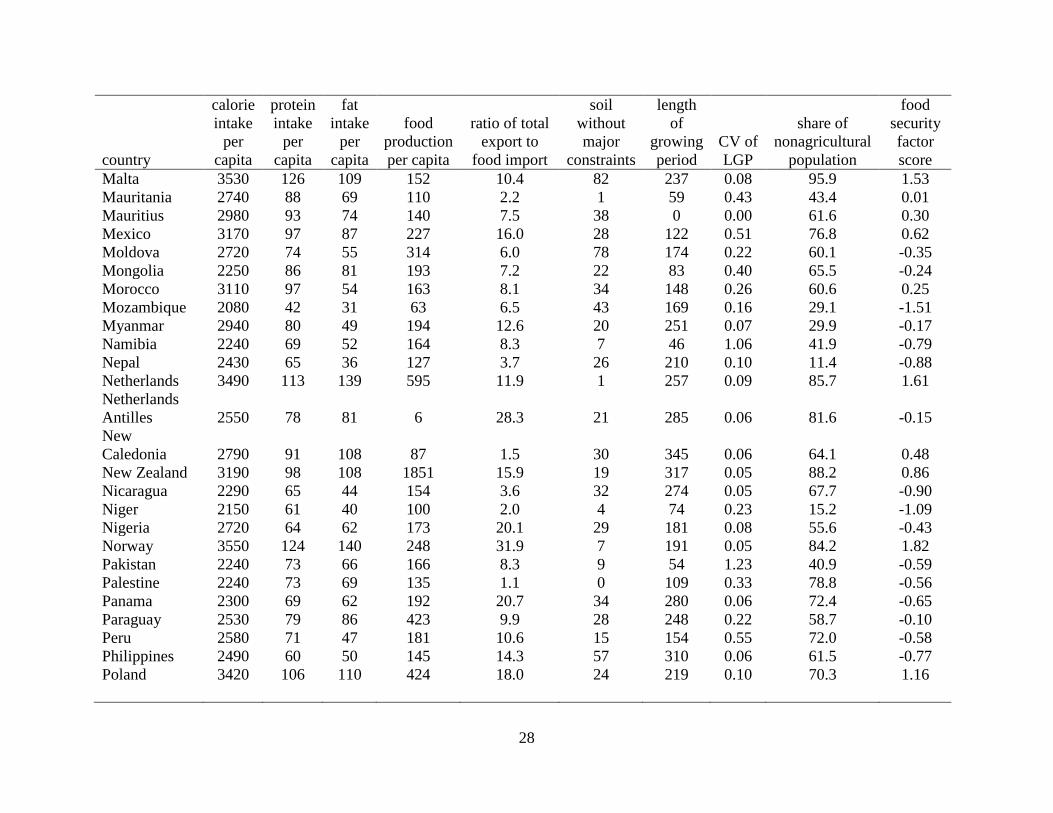
28
country
calorie
intake
per
capita
protein
intake
per
capita
fat
intake
per
capita
food
production
per capita
ratio of total
export to
food import
soil
without
major
constraints
length
of
growing
period
CV of
LGP
share of
nonagricultural
population
food
security
factor
score
Malta 3530 126 109 152 10.4 82 237 0.08 95.9 1.53
Mauritania 2740 88 69 110 2.2 1 59 0.43 43.4 0.01
Mauritius 2980 93 74 140 7.5 38 0 0.00 61.6 0.30
Mexico 3170 97 87 227 16.0 28 122 0.51 76.8 0.62
Moldova 2720 74 55 314 6.0 78 174 0.22 60.1 -0.35
Mongolia 2250 86 81 193 7.2 22 83 0.40 65.5 -0.24
Morocco 3110 97 54 163 8.1 34 148 0.26 60.6 0.25
Mozambique 2080 42 31 63 6.5 43 169 0.16 29.1 -1.51
Myanmar 2940 80 49 194 12.6 20 251 0.07 29.9 -0.17
Namibia 2240 69 52 164 8.3 7 46 1.06 41.9 -0.79
Nepal 2430 65 36 127 3.7 26 210 0.10 11.4 -0.88
Netherlands 3490 113 139 595 11.9 1 257 0.09 85.7 1.61
Netherlands
Antilles 2550 78 81 6 28.3 21 285 0.06 81.6 -0.15
New
Caledonia 2790 91 108 87 1.5 30 345 0.06 64.1 0.48
New Zealand 3190 98 108 1851 15.9 19 317 0.05 88.2 0.86
Nicaragua 2290 65 44 154 3.6 32 274 0.05 67.7 -0.90
Niger 2150 61 40 100 2.0 4 74 0.23 15.2 -1.09
Nigeria 2720 64 62 173 20.1 29 181 0.08 55.6 -0.43
Norway 3550 124 140 248 31.9 7 191 0.05 84.2 1.82
Pakistan 2240 73 66 166 8.3 9 54 1.23 40.9 -0.59
Palestine 2240 73 69 135 1.1 0 109 0.33 78.8 -0.56
Panama 2300 69 62 192 20.7 34 280 0.06 72.4 -0.65
Paraguay 2530 79 86 423 9.9 28 248 0.22 58.7 -0.10
Peru 2580 71 47 181 10.6 15 154 0.55 72.0 -0.58
Philippines 2490 60 50 145 14.3 57 310 0.06 61.5 -0.77
Poland 3420 106 110 424 18.0 24 219 0.10 70.3 1.16
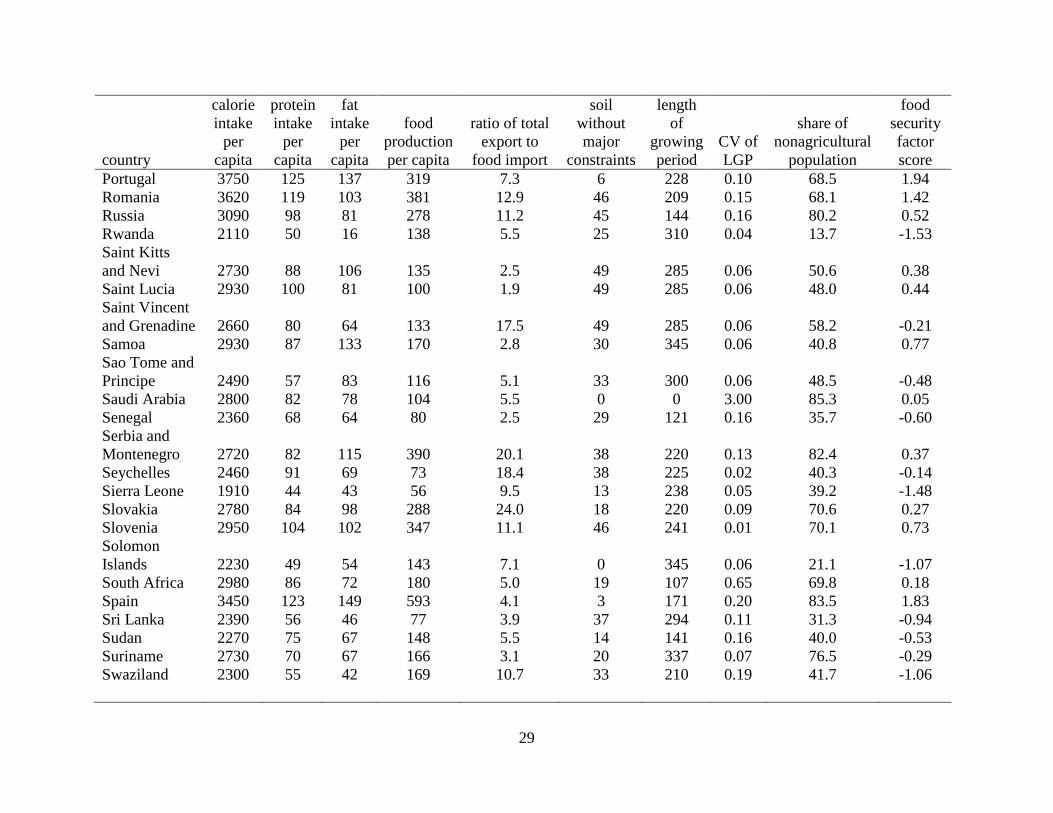
29
country
calorie
intake
per
capita
protein
intake
per
capita
fat
intake
per
capita
food
production
per capita
ratio of total
export to
food import
soil
without
major
constraints
length
of
growing
period
CV of
LGP
share of
nonagricultural
population
food
security
factor
score
Portugal 3750 125 137 319 7.3 6 228 0.10 68.5 1.94
Romania 3620 119 103 381 12.9 46 209 0.15 68.1 1.42
Russia 3090 98 81 278 11.2 45 144 0.16 80.2 0.52
Rwanda 2110 50 16 138 5.5 25 310 0.04 13.7 -1.53
Saint Kitts
and Nevi 2730 88 106 135 2.5 49 285 0.06 50.6 0.38
Saint Lucia 2930 100 81 100 1.9 49 285 0.06 48.0 0.44
Saint Vincent
and Grenadine 2660 80 64 133 17.5 49 285 0.06 58.2 -0.21
Samoa 2930 87 133 170 2.8 30 345 0.06 40.8 0.77
Sao Tome and
Principe 2490 57 83 116 5.1 33 300 0.06 48.5 -0.48
Saudi Arabia 2800 82 78 104 5.5 0 0 3.00 85.3 0.05
Senegal 2360 68 64 80 2.5 29 121 0.16 35.7 -0.60
Serbia and
Montenegro 2720 82 115 390 20.1 38 220 0.13 82.4 0.37
Seychelles 2460 91 69 73 18.4 38 225 0.02 40.3 -0.14
Sierra Leone 1910 44 43 56 9.5 13 238 0.05 39.2 -1.48
Slovakia 2780 84 98 288 24.0 18 220 0.09 70.6 0.27
Slovenia 2950 104 102 347 11.1 46 241 0.01 70.1 0.73
Solomon
Islands 2230 49 54 143 7.1 0 345 0.06 21.1 -1.07
South Africa 2980 86 72 180 5.0 19 107 0.65 69.8 0.18
Spain 3450 123 149 593 4.1 3 171 0.20 83.5 1.83
Sri Lanka 2390 56 46 77 3.9 37 294 0.11 31.3 -0.94
Sudan 2270 75 67 148 5.5 14 141 0.16 40.0 -0.53
Suriname 2730 70 67 166 3.1 20 337 0.07 76.5 -0.29
Swaziland 2300 55 42 169 10.7 33 210 0.19 41.7 -1.06
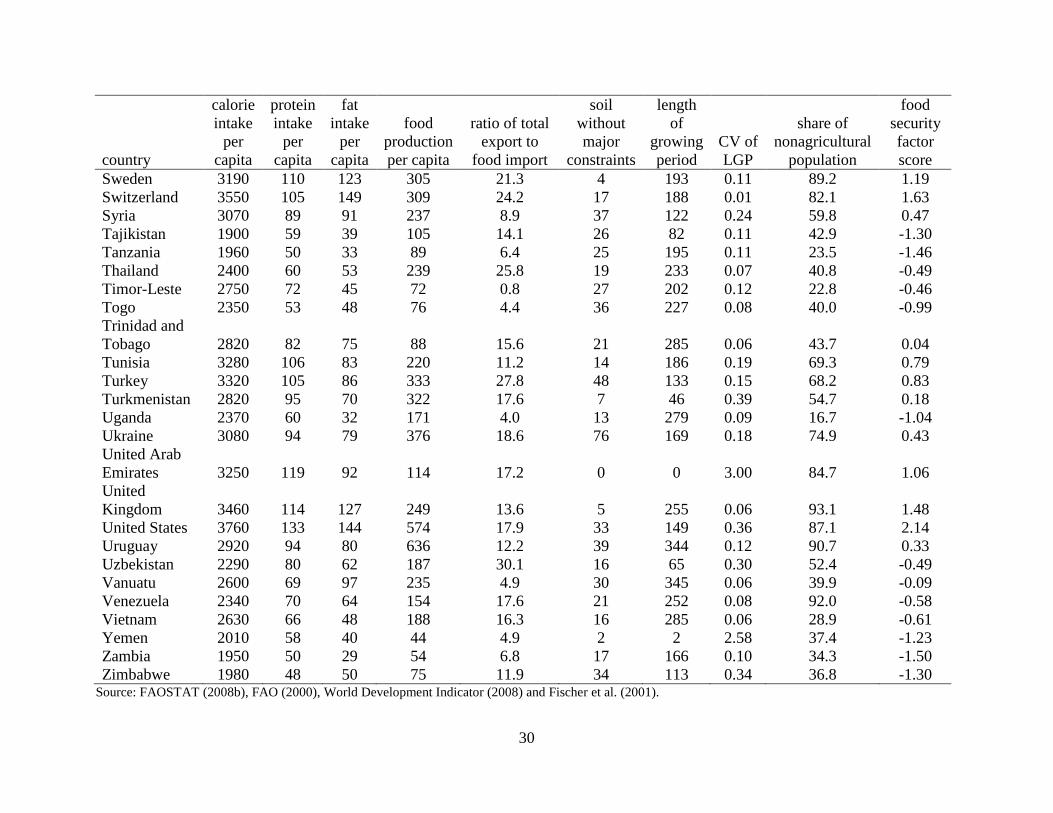
30
country
calorie
intake
per
capita
protein
intake
per
capita
fat
intake
per
capita
food
production
per capita
ratio of total
export to
food import
soil
without
major
constraints
length
of
growing
period
CV of
LGP
share of
nonagricultural
population
food
security
factor
score
Sweden 3190 110 123 305 21.3 4 193 0.11 89.2 1.19
Switzerland 3550 105 149 309 24.2 17 188 0.01 82.1 1.63
Syria 3070 89 91 237 8.9 37 122 0.24 59.8 0.47
Tajikistan 1900 59 39 105 14.1 26 82 0.11 42.9 -1.30
Tanzania 1960 50 33 89 6.4 25 195 0.11 23.5 -1.46
Thailand 2400 60 53 239 25.8 19 233 0.07 40.8 -0.49
Timor-Leste 2750 72 45 72 0.8 27 202 0.12 22.8 -0.46
Togo 2350 53 48 76 4.4 36 227 0.08 40.0 -0.99
Trinidad and
Tobago 2820 82 75 88 15.6 21 285 0.06 43.7 0.04
Tunisia 3280 106 83 220 11.2 14 186 0.19 69.3 0.79
Turkey 3320 105 86 333 27.8 48 133 0.15 68.2 0.83
Turkmenistan 2820 95 70 322 17.6 7 46 0.39 54.7 0.18
Uganda 2370 60 32 171 4.0 13 279 0.09 16.7 -1.04
Ukraine 3080 94 79 376 18.6 76 169 0.18 74.9 0.43
United Arab
Emirates 3250 119 92 114 17.2 0 0 3.00 84.7 1.06
United
Kingdom 3460 114 127 249 13.6 5 255 0.06 93.1 1.48
United States 3760 133 144 574 17.9 33 149 0.36 87.1 2.14
Uruguay 2920 94 80 636 12.2 39 344 0.12 90.7 0.33
Uzbekistan 2290 80 62 187 30.1 16 65 0.30 52.4 -0.49
Vanuatu 2600 69 97 235 4.9 30 345 0.06 39.9 -0.09
Venezuela 2340 70 64 154 17.6 21 252 0.08 92.0 -0.58
Vietnam 2630 66 48 188 16.3 16 285 0.06 28.9 -0.61
Yemen 2010 58 40 44 4.9 2 2 2.58 37.4 -1.23
Zambia 1950 50 29 54 6.8 17 166 0.10 34.3 -1.50
Zimbabwe 1980 48 50 75 11.9 34 113 0.34 36.8 -1.30 Source: FAOSTAT (2008b), FAO (2000), World Development Indicator (2008) and Fischer et al. (2001).
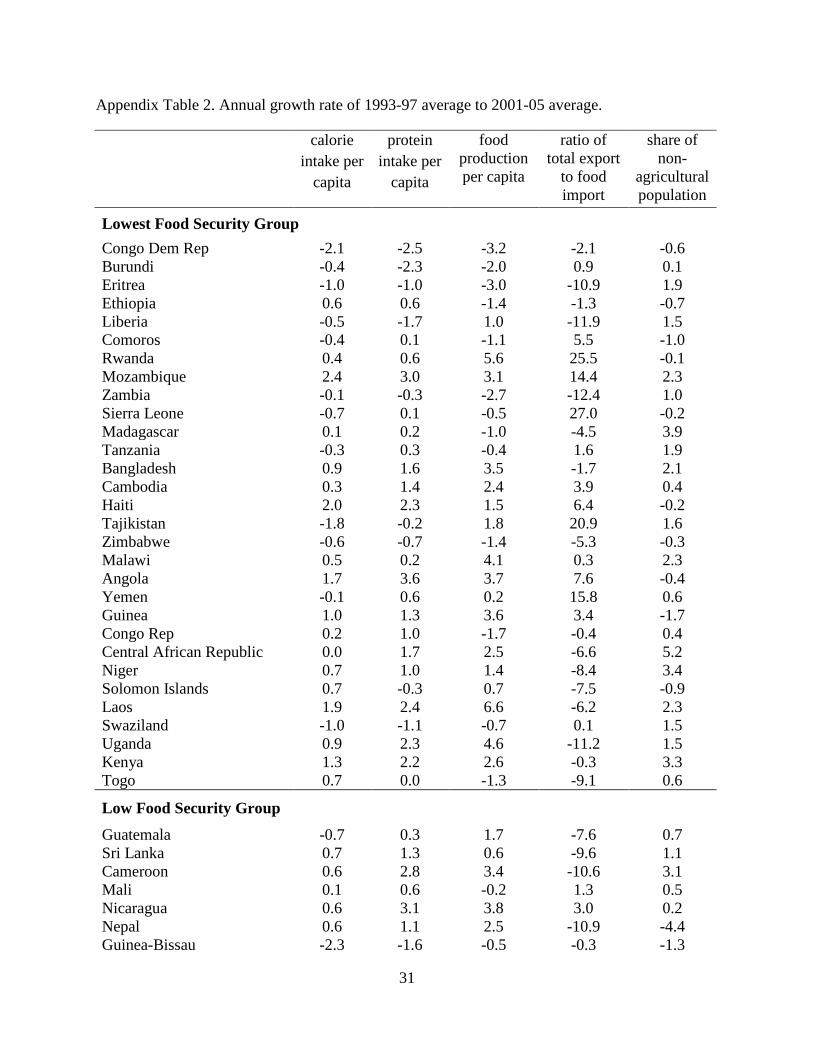
31
Appendix Table 2. Annual growth rate of 1993-97 average to 2001-05 average.
calorie
intake per
capita
protein
intake per
capita
food
production
per capita
ratio of
total export
to food
import
share of
non-
agricultural
population
Lowest Food Security Group
Congo Dem Rep -2.1 -2.5 -3.2 -2.1 -0.6
Burundi -0.4 -2.3 -2.0 0.9 0.1
Eritrea -1.0 -1.0 -3.0 -10.9 1.9
Ethiopia 0.6 0.6 -1.4 -1.3 -0.7
Liberia -0.5 -1.7 1.0 -11.9 1.5
Comoros -0.4 0.1 -1.1 5.5 -1.0
Rwanda 0.4 0.6 5.6 25.5 -0.1
Mozambique 2.4 3.0 3.1 14.4 2.3
Zambia -0.1 -0.3 -2.7 -12.4 1.0
Sierra Leone -0.7 0.1 -0.5 27.0 -0.2
Madagascar 0.1 0.2 -1.0 -4.5 3.9
Tanzania -0.3 0.3 -0.4 1.6 1.9
Bangladesh 0.9 1.6 3.5 -1.7 2.1
Cambodia 0.3 1.4 2.4 3.9 0.4
Haiti 2.0 2.3 1.5 6.4 -0.2
Tajikistan -1.8 -0.2 1.8 20.9 1.6
Zimbabwe -0.6 -0.7 -1.4 -5.3 -0.3
Malawi 0.5 0.2 4.1 0.3 2.3
Angola 1.7 3.6 3.7 7.6 -0.4
Yemen -0.1 0.6 0.2 15.8 0.6
Guinea 1.0 1.3 3.6 3.4 -1.7
Congo Rep 0.2 1.0 -1.7 -0.4 0.4
Central African Republic 0.0 1.7 2.5 -6.6 5.2
Niger 0.7 1.0 1.4 -8.4 3.4
Solomon Islands 0.7 -0.3 0.7 -7.5 -0.9
Laos 1.9 2.4 6.6 -6.2 2.3
Swaziland -1.0 -1.1 -0.7 0.1 1.5
Uganda 0.9 2.3 4.6 -11.2 1.5
Kenya 1.3 2.2 2.6 -0.3 3.3
Togo 0.7 0.0 -1.3 -9.1 0.6
Low Food Security Group
Guatemala -0.7 0.3 1.7 -7.6 0.7
Sri Lanka 0.7 1.3 0.6 -9.6 1.1
Cameroon 0.6 2.8 3.4 -10.6 3.1
Mali 0.1 0.6 -0.2 1.3 0.5
Nicaragua 0.6 3.1 3.8 3.0 0.2
Nepal 0.6 1.1 2.5 -10.9 -4.4
Guinea-Bissau -2.3 -1.6 -0.5 -0.3 -1.3
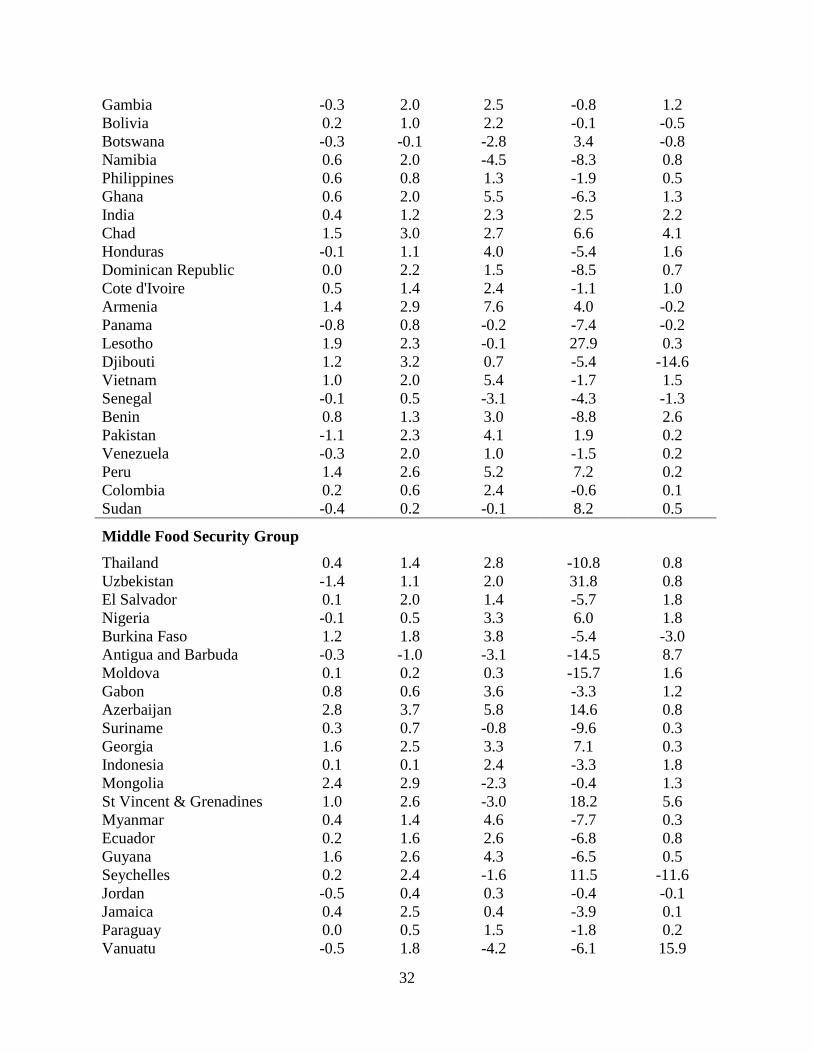
32
Gambia -0.3 2.0 2.5 -0.8 1.2
Bolivia 0.2 1.0 2.2 -0.1 -0.5
Botswana -0.3 -0.1 -2.8 3.4 -0.8
Namibia 0.6 2.0 -4.5 -8.3 0.8
Philippines 0.6 0.8 1.3 -1.9 0.5
Ghana 0.6 2.0 5.5 -6.3 1.3
India 0.4 1.2 2.3 2.5 2.2
Chad 1.5 3.0 2.7 6.6 4.1
Honduras -0.1 1.1 4.0 -5.4 1.6
Dominican Republic 0.0 2.2 1.5 -8.5 0.7
Cote d'Ivoire 0.5 1.4 2.4 -1.1 1.0
Armenia 1.4 2.9 7.6 4.0 -0.2
Panama -0.8 0.8 -0.2 -7.4 -0.2
Lesotho 1.9 2.3 -0.1 27.9 0.3
Djibouti 1.2 3.2 0.7 -5.4 -14.6
Vietnam 1.0 2.0 5.4 -1.7 1.5
Senegal -0.1 0.5 -3.1 -4.3 -1.3
Benin 0.8 1.3 3.0 -8.8 2.6
Pakistan -1.1 2.3 4.1 1.9 0.2
Venezuela -0.3 2.0 1.0 -1.5 0.2
Peru 1.4 2.6 5.2 7.2 0.2
Colombia 0.2 0.6 2.4 -0.6 0.1
Sudan -0.4 0.2 -0.1 8.2 0.5
Middle Food Security Group
Thailand 0.4 1.4 2.8 -10.8 0.8
Uzbekistan -1.4 1.1 2.0 31.8 0.8
El Salvador 0.1 2.0 1.4 -5.7 1.8
Nigeria -0.1 0.5 3.3 6.0 1.8
Burkina Faso 1.2 1.8 3.8 -5.4 -3.0
Antigua and Barbuda -0.3 -1.0 -3.1 -14.5 8.7
Moldova 0.1 0.2 0.3 -15.7 1.6
Gabon 0.8 0.6 3.6 -3.3 1.2
Azerbaijan 2.8 3.7 5.8 14.6 0.8
Suriname 0.3 0.7 -0.8 -9.6 0.3
Georgia 1.6 2.5 3.3 7.1 0.3
Indonesia 0.1 0.1 2.4 -3.3 1.8
Mongolia 2.4 2.9 -2.3 -0.4 1.3
St Vincent & Grenadines 1.0 2.6 -3.0 18.2 5.6
Myanmar 0.4 1.4 4.6 -7.7 0.3
Ecuador 0.2 1.6 2.6 -6.8 0.8
Guyana 1.6 2.6 4.3 -6.5 0.5
Seychelles 0.2 2.4 -1.6 11.5 -11.6
Jordan -0.5 0.4 0.3 -0.4 -0.1
Jamaica 0.4 2.5 0.4 -3.9 0.1
Paraguay 0.0 0.5 1.5 -1.8 0.2
Vanuatu -0.5 1.8 -4.2 -6.1 15.9
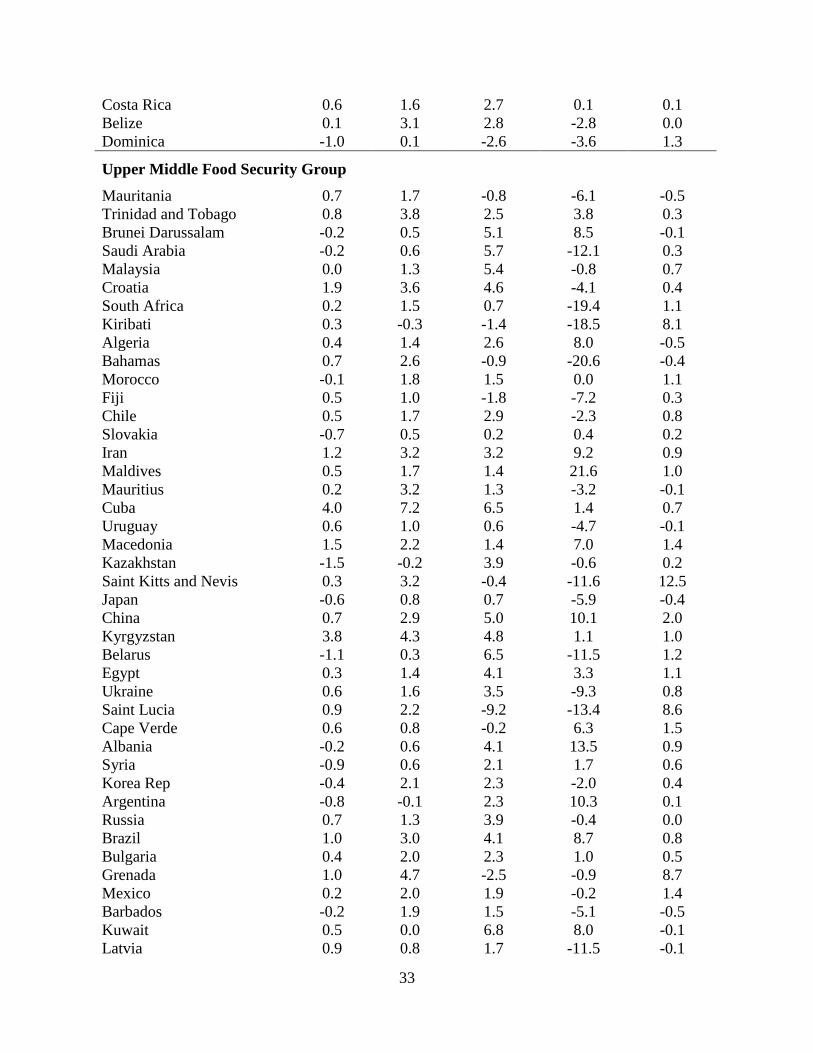
33
Costa Rica 0.6 1.6 2.7 0.1 0.1
Belize 0.1 3.1 2.8 -2.8 0.0
Dominica -1.0 0.1 -2.6 -3.6 1.3
Upper Middle Food Security Group
Mauritania 0.7 1.7 -0.8 -6.1 -0.5
Trinidad and Tobago 0.8 3.8 2.5 3.8 0.3
Brunei Darussalam -0.2 0.5 5.1 8.5 -0.1
Saudi Arabia -0.2 0.6 5.7 -12.1 0.3
Malaysia 0.0 1.3 5.4 -0.8 0.7
Croatia 1.9 3.6 4.6 -4.1 0.4
South Africa 0.2 1.5 0.7 -19.4 1.1
Kiribati 0.3 -0.3 -1.4 -18.5 8.1
Algeria 0.4 1.4 2.6 8.0 -0.5
Bahamas 0.7 2.6 -0.9 -20.6 -0.4
Morocco -0.1 1.8 1.5 0.0 1.1
Fiji 0.5 1.0 -1.8 -7.2 0.3
Chile 0.5 1.7 2.9 -2.3 0.8
Slovakia -0.7 0.5 0.2 0.4 0.2
Iran 1.2 3.2 3.2 9.2 0.9
Maldives 0.5 1.7 1.4 21.6 1.0
Mauritius 0.2 3.2 1.3 -3.2 -0.1
Cuba 4.0 7.2 6.5 1.4 0.7
Uruguay 0.6 1.0 0.6 -4.7 -0.1
Macedonia 1.5 2.2 1.4 7.0 1.4
Kazakhstan -1.5 -0.2 3.9 -0.6 0.2
Saint Kitts and Nevis 0.3 3.2 -0.4 -11.6 12.5
Japan -0.6 0.8 0.7 -5.9 -0.4
China 0.7 2.9 5.0 10.1 2.0
Kyrgyzstan 3.8 4.3 4.8 1.1 1.0
Belarus -1.1 0.3 6.5 -11.5 1.2
Egypt 0.3 1.4 4.1 3.3 1.1
Ukraine 0.6 1.6 3.5 -9.3 0.8
Saint Lucia 0.9 2.2 -9.2 -13.4 8.6
Cape Verde 0.6 0.8 -0.2 6.3 1.5
Albania -0.2 0.6 4.1 13.5 0.9
Syria -0.9 0.6 2.1 1.7 0.6
Korea Rep -0.4 2.1 2.3 -2.0 0.4
Argentina -0.8 -0.1 2.3 10.3 0.1
Russia 0.7 1.3 3.9 -0.4 0.0
Brazil 1.0 3.0 4.1 8.7 0.8
Bulgaria 0.4 2.0 2.3 1.0 0.5
Grenada 1.0 4.7 -2.5 -0.9 8.7
Mexico 0.2 2.0 1.9 -0.2 1.4
Barbados -0.2 1.9 1.5 -5.1 -0.5
Kuwait 0.5 0.0 6.8 8.0 -0.1
Latvia 0.9 0.8 1.7 -11.5 -0.1
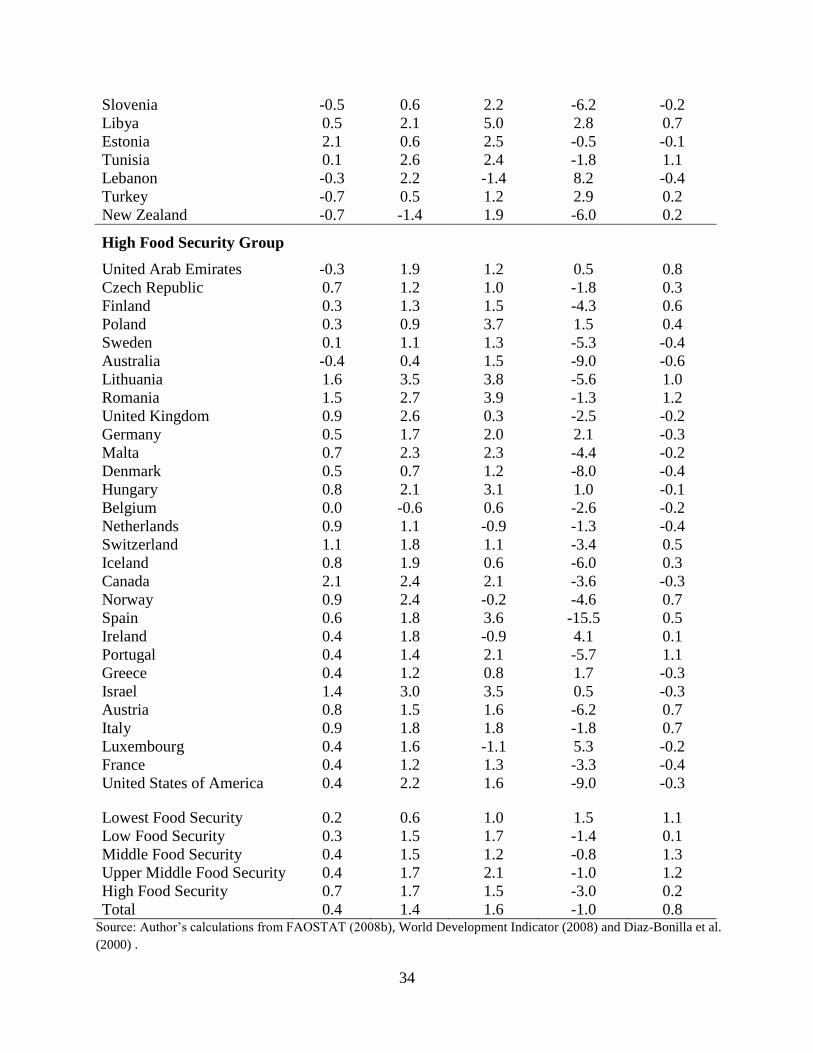
34
Slovenia -0.5 0.6 2.2 -6.2 -0.2
Libya 0.5 2.1 5.0 2.8 0.7
Estonia 2.1 0.6 2.5 -0.5 -0.1
Tunisia 0.1 2.6 2.4 -1.8 1.1
Lebanon -0.3 2.2 -1.4 8.2 -0.4
Turkey -0.7 0.5 1.2 2.9 0.2
New Zealand -0.7 -1.4 1.9 -6.0 0.2
High Food Security Group
United Arab Emirates -0.3 1.9 1.2 0.5 0.8
Czech Republic 0.7 1.2 1.0 -1.8 0.3
Finland 0.3 1.3 1.5 -4.3 0.6
Poland 0.3 0.9 3.7 1.5 0.4
Sweden 0.1 1.1 1.3 -5.3 -0.4
Australia -0.4 0.4 1.5 -9.0 -0.6
Lithuania 1.6 3.5 3.8 -5.6 1.0
Romania 1.5 2.7 3.9 -1.3 1.2
United Kingdom 0.9 2.6 0.3 -2.5 -0.2
Germany 0.5 1.7 2.0 2.1 -0.3
Malta 0.7 2.3 2.3 -4.4 -0.2
Denmark 0.5 0.7 1.2 -8.0 -0.4
Hungary 0.8 2.1 3.1 1.0 -0.1
Belgium 0.0 -0.6 0.6 -2.6 -0.2
Netherlands 0.9 1.1 -0.9 -1.3 -0.4
Switzerland 1.1 1.8 1.1 -3.4 0.5
Iceland 0.8 1.9 0.6 -6.0 0.3
Canada 2.1 2.4 2.1 -3.6 -0.3
Norway 0.9 2.4 -0.2 -4.6 0.7
Spain 0.6 1.8 3.6 -15.5 0.5
Ireland 0.4 1.8 -0.9 4.1 0.1
Portugal 0.4 1.4 2.1 -5.7 1.1
Greece 0.4 1.2 0.8 1.7 -0.3
Israel 1.4 3.0 3.5 0.5 -0.3
Austria 0.8 1.5 1.6 -6.2 0.7
Italy 0.9 1.8 1.8 -1.8 0.7
Luxembourg 0.4 1.6 -1.1 5.3 -0.2
France 0.4 1.2 1.3 -3.3 -0.4
United States of America 0.4 2.2 1.6 -9.0 -0.3
Lowest Food Security 0.2 0.6 1.0 1.5 1.1
Low Food Security 0.3 1.5 1.7 -1.4 0.1
Middle Food Security 0.4 1.5 1.2 -0.8 1.3
Upper Middle Food Security 0.4 1.7 2.1 -1.0 1.2
High Food Security 0.7 1.7 1.5 -3.0 0.2
Total 0.4 1.4 1.6 -1.0 0.8 Source: Author’s calculations from FAOSTAT (2008b), World Development Indicator (2008) and Diaz-Bonilla et al.
(2000) .


![Reader Food prices ENG[1] - Brussels Development … RISING FOOD PRICES Introduction The sharp increase in food prices over the past couple of years has raised serious concerns about](https://img.pdfslide.net/doc/110x75/5b05ff4e7f8b9ac33f8c3479/reader-food-prices-eng1-brussels-development-rising-food-prices-introduction.jpg)