Embed Size (px)
Citation preview
A very low fertility rate in Hong Kong: Challenges and Opportunities
Paul Yip Department of Statistics and Actuarial ScienceThe University of Hong Kong

Outline
An overview of the fertility pattern A critical review of dependence ratioImplication on health care deliveryOpportunities and challenges

Population size refers to the mid-point of the respective years
0
1
2
3
4
5
6
7
8
1971 1976 1981 1986 1991 1996 2001 2004
Million
0.84 2001 - 04
0.94 1996 - 01
1.80 1991 - 96
0.62 1986 - 91
1.53 1981 - 86
3.23 1976 - 81
2.34 1971 - 76
Average annual growth rate
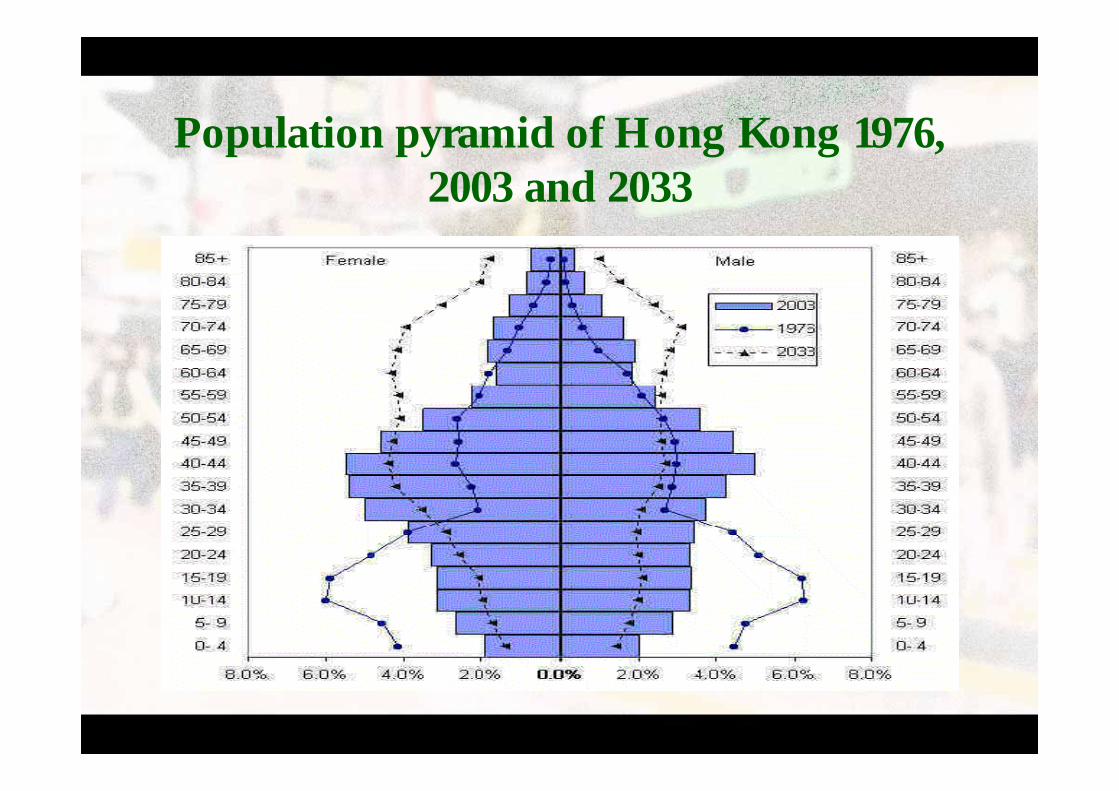
Population pyramid of Hong Kong 1976, 2003 and 2033

Replacement level (2.1)
0
0.5
1
1.5
2
2.5
3
3.5
4
1971 1976 1981 1986 1991 1996 2001Year
Live
birt
hs p
er w
oman
Total fertility rates of Hong Kong SAR, 1971 - 2005

Change in TFR, Italy, France, Japan, Singapore, Hong Kong from 1950 to 2000, prospects to 2050
0
1
2
3
4
5
6
7
1950-1955 1960-1965 1970-1975 1980-1985 1990-1995 2000-2005 2010-2015 2020-2025 2030-2035 2040-2045
ItalyFranceJapanSingaporeHong Kong

Total fert ility rate, HKSAR and other low fert ility
economies, 1971-2000
0
0.5
1
1.5
2
2.5
3
3.5
4
1971 1976 1981 1986 1991 1996Year
per w
oman
HK
Singapore
Finland

Total fertility rates of Hong Kong andselected low fertility economies, 1995 – 2002
2.011.341.641.731.751.731.751.651.321.370.962002
2.031.351.631.751.731.711.781.571.331.410.932001
2.061.381.641.771.761.721.851.551.361.61.022000
2.011.361.691.741.761.651.851.51.341.470.971999
21.361.721.721.761.631.811.51.381.470.991998
1.971.371.721.751.781.561.861.521.391.611.11997
1.981.321.731.751.81.531.891.611.431.661.171996
1.981.251.711.811.831.531.871.741.421.671.31995
USGermany UK Denmark Australia Netherlands Norway Sweden Japan Singapore Hong Kong
Non-Asian economiesAsian economiesYear

Reasons for decline of TFR
Reduction on marital fertility rate (44%)
Change in marital structure: (56%)Increasing spinsters and late marriagesIncreasing Cross-boundary marriages
(China and Hong Kong) Increasing age difference in marriage

Decomposition method for TFR
Definition
Pi : Proportion of marriage in age group i
AMFRi : Age-specific marital fertility rate in age group
i i i ii
TFR AMFR p p AMFR⎡ ⎤∆ = ×∆ + ×∆⎣ ⎦∑

Results for decomposition of the change in TFR
1004456Total
<0.5<0.5<0.545–49
33<0.540–44
84435–39
189930–34
42222025–29
2571820–24
4-1515–19
TotalAMFRAge group
Proportion (%) of decline in the TFR attributable to change in
ip

A new measure - WTMFR
A Weighted Total Marital Fertility Rate (WTMFR)
Wi : Percentage of women get married in age group i to all married women
TMFRi : Total marital fertility rate for women get married in age group i
∑=
×=7
1.
iii TMFRwWTMFR ∑
=
×=7
1.
iii TMFRwWTMFR
7
1.i i
iWTMFR w TMFR
=
= ×∑
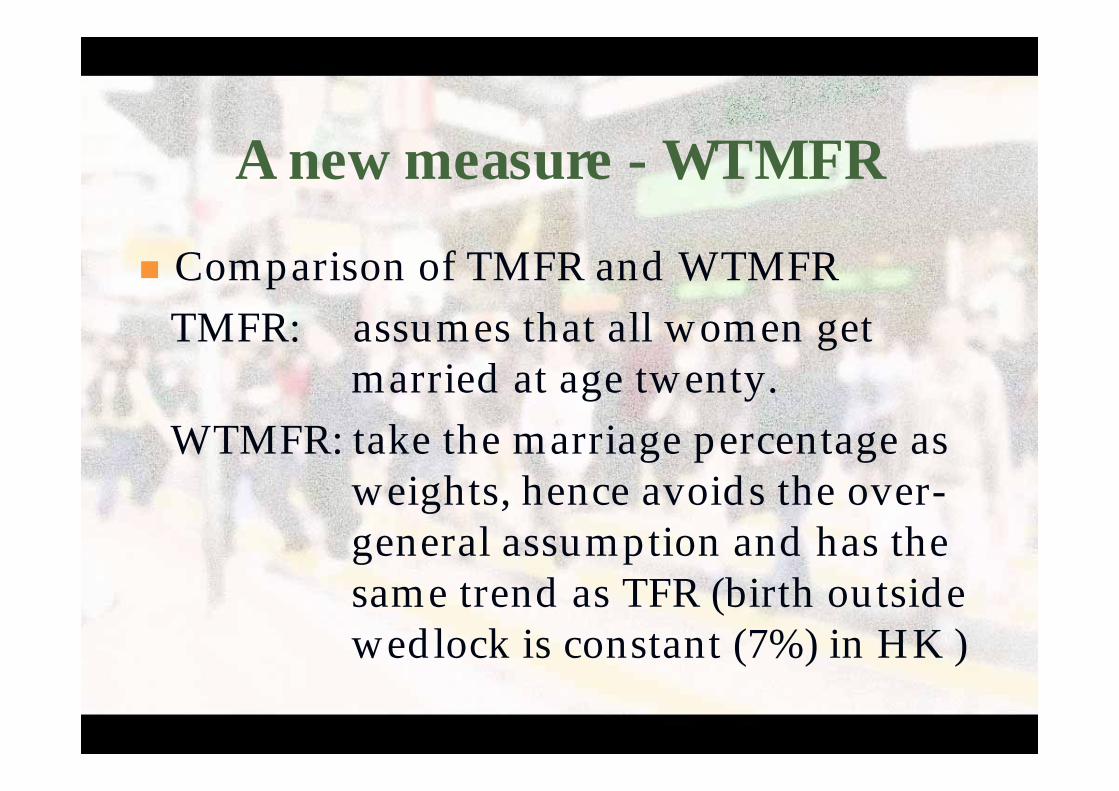
A new measure - WTMFR
Comparison of TMFR and WTMFRTMFR: assumes that all women get
married at age twenty.WTMFR: take the marriage percentage as
weights, hence avoids the over-general assumption and has the same trend as TFR (birth outside wedlock is constant (7%) in HK )

0%
1%
2%
3%
4%
5%
6%
7%
8%
1981 1986 1991 1996 2001
Prop
ortio
n of
live
birt
hs
Proportion of live births in Hong Kong by cohabitating parents, 1981-2003

Comparison of TFR, TMFR and WTMFR
Trends of WTMFR,TFR and TMFR1976-2001
0
1000
2000
3000
4000
5000
6000
7000
1976 1981 1986 1991 1996 2001Year
WTMFRTFRTMFR

Decomposition Results for WTMFR
1004852Total
<0.5<0.5<0.545–49
<0.5<0.5<0.540–44
-1<0.5-135–39
-52-730–34
216-1425–29
73274620–24
3132815–19
TotalTMFiW_iAge group
Proportion (%) of decline in the WTMFR attributable to change in

Reasons for decline of TFR
Reduction on marital fertility rate (44%)
Change in marital structure: (56%)Increasing spinsters and Late marriagesIncreasing Cross-boundary marriagesIncreasing age difference in marriage

Age-specific fertility rates of Hong Kong, 1971-2004
0
50
100
150
200
250
300
15-19 20-24 25-29 30-34 35-39 40-44 45-49
Live
birh
ts p
er 1
,000
wom
en
19711976198119861991199620012004

Mean age of mothers by live birth order, 1981-2003
24
26
28
30
32
34
36
1981 1986 1991 1996 2001
Mea
n ag
e at
bir
th
1st parity2nd parity3rd parity4th parity

For the same age group 15-49 Never married men > Never married women (76850vs892100 )
However, due to the preference of gloom age pattern we estimate there will be about 135,000 women at marriage age can’t find the partner in Hong Kong.
Increase in Spinster

A of never married Kaplan-Meier curve: Probability
Kaplan-Meier curves for females
00.10.20.30.40.50.60.70.80.9
1
15 20 25 30 35 40 45Age
Pro
babi
lity
of N
ever
mar
ried
200119961991

Median Age at First Marriage 1971-2004
20
22
24
26
28
30
32
1971 1976 1981 1986 1991 1996 2001 2004
year
age
malefemale

Increase Cross-boundary Marriage
Cross-boundary marriage in 2004, (HK Male and HK Female: 61.37%)(HK Male and Mainland Female: 33.77%)590 cases to 13126 cases in 2004(HK Female and Mainland Male: 4.8690 cases in 1991 to 1888 in 2004
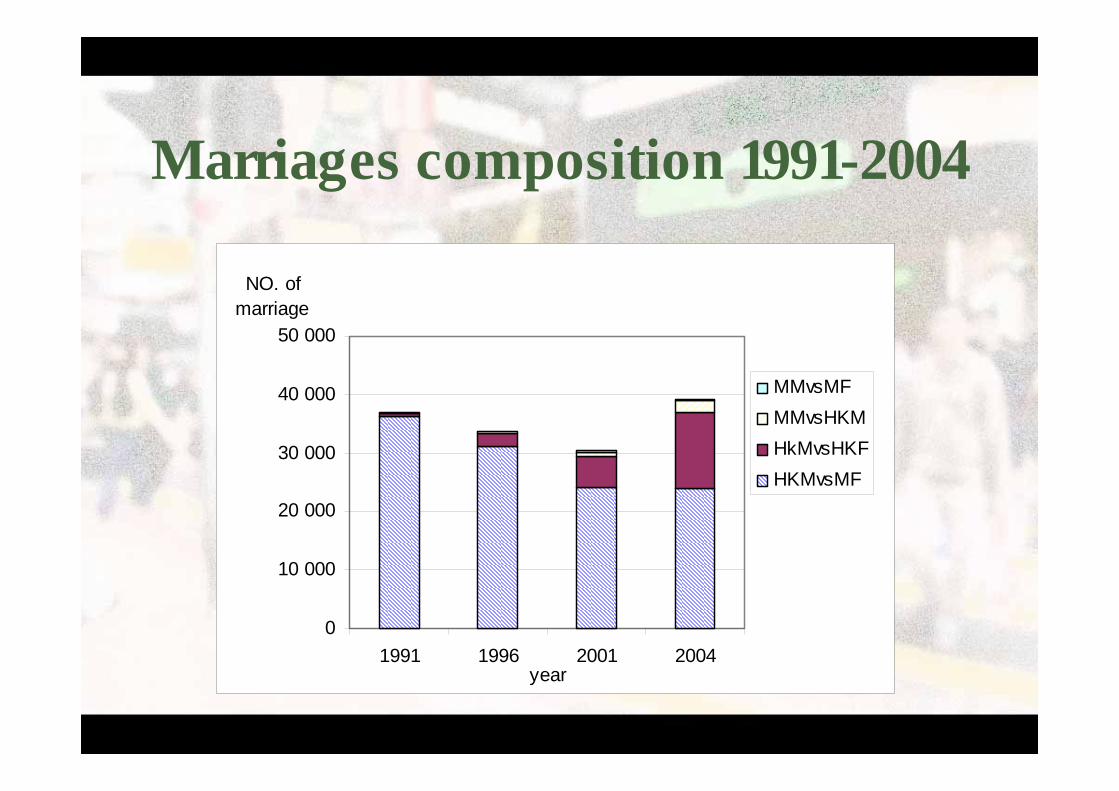
Marriages composition 1991-2004
0
10 000
20 000
30 000
40 000
50 000
1991 1996 2001 2004year
NO. of marriage
MMvsMFMMvsHKMHkMvsHKFHKMvsMF

13126200418882004
516920017232001
221519962691996
5901991901991
HK Men and Mainland
womenYear
Increased by
nearly 21 times
for1991-2004
HK Women and Mainland Men
Year

Increasing age difference in marriage
2
2.5
3
3.5
4
4.5
5
5.5
6
1991 1996 2001 2004year
age
diffe
renc
e be
twee
n m
ales
and
fe
mal
es

23853Total Number of Cases
7443281271189650187050+
54618731401401194313045-49
151475623348948720536140-44
37083321208091698894146635-39
80461747393350835635121530-34Groom
7668011779860530413575025-29Age of
1531002434286104615920-24
96000003316216-19
Number ofGroom 50+45-4940-4435-3930-3425-2920-2416-19
Age of Bride
P(Age of Groom<Age of Bride)Number of Marriages

MythsAgeing is no big deal:
Speed and magnitude and 80% growth is from migrants.A smaller population size to Hong Kong is good:
Yes it is only true if we can choose who is going to stay.Increasing fertility measures in overseas countries is useless:
The reduction of the TFR in other countries has levelled off around 1.3 but not in Hong Kong
Hong Kong can have unlimited supply of people from China, it is a city The supply is unstable and unreliable. Hong Kong has become less attractive in attracting migrants
Silver Hair MarketIt might be true twenty years later but not now
Fertility is going to rebound soon. NOT YET about 1/3 from non-Hong Kong residents in 2005

Tempo effect versus Quantum effect
Not tempo. But real Quantum effect.
In 2001, Total Marital Fertility Rate (TMFR) was still around 2.2.
It is the speed and the magnitude of the reduction of the fertility rate,

Proportion of live births born in Hong Kong, 2001-2004
0%
20%
40%
60%
80%
100%
1991 1993 1995 1997 1999 2001 2003
BHKROutside HKBnotHKRBSHKR

Demographic Ratio (DR)

Dependence Ratio
Dependency ratios for Hong Kong population, 1976 - 2031
0
100
200
300
400
500
600
1976 1986 1996 2006 2016 2026Year
Children Elderly Total

This positive “population effect” eases the pressure on countries to provide for the young and elderly and enabling more investment in economic and social development such as health, family planning, and education, in addition to providing women with more opportunities (United Nations, 2002, 2004)

Demographic window
Benchmark: 1 dependent to 2 independents
Total dependency ratio (TDR)=0.5
When the population’s TDR shifts below 0.5, it gives a golden opportunity for the community to improve the quality rather than the quantify of the population.

Window closes earlier when the age truncating for total dependency ratio changed
Source: United Nations World Population Prospects: The 2002 Revision
0.0
0.5
1.0
1.5
1950 1960 1970 1980 1990 2000 2010 2020 2030 2040 2050
YR<15TDR(0-14+60+/15-59)AR 60+

Change in young ratio <15, ageing ratio 65+ & total dependency ratio in Hong Kong, from 1950 to 2000, prospects to 2050
Source: United Nations World Population Prospects: The 2002 Revision
0.0
0.5
1.0
1.5
1950 1960 1970 1980 1990 2000 2010 2020 2030 2040 2050
YR<15AR 65+TDR

Change in labour participation rate, by age and sex, Hong Kong, from 1985 to 2001 and prospects up to 2019
Source: General Household Survey 1985-2001, Hong Kong Census and Statistics Department
0
20
40
60
80
100
15-19 20-24 25-29 30-34 35-39 40-44 45-49 50-54 55-59 60-64 65+
19852001200220102019
Males
0
20
40
60
80
100
15-19 20-24 25-29 30-34 35-39 40-44 45-49 50-54 55-59 60-64 65+
19852001200220102019
Females

Implications: Health
Figure 4: Hospital patient days needs index, HKSAR, 2000-2029
0
25
50
75
100
125
150
175
200
2000 2004 2008 2012 2016 2020 2024 2028Year
Inde
x

Health (continue)Age distribution of of patient days utilisation, HKSAR,
2000-2029 (Yip and Law, 2003)
0%
20%
40%
60%
80%
100%
2000 2004 2009 2014 2019 2024 2029Year
0-1415-6465+

Fig. 4.2: Projected patient days, population at working ages and patient days to adult ratios, HKSAR, 2001 - 2031 (Yip
and Law, 2003)
02468
101214161820
2001 2006 2011 2016 2021 2026 2031Year
Pop
ulat
ion/
Pat
ient
da
ys (m
illio
n)
012345678910
Pat
ient
day
s pe
r per
son
at w
orki
ng a
ge
Patient days per adultsPopulation (15 - 64)Patient days

Health Care implications
Sources of Support:Family members support: decreasingGovernment support: IncreasingHealth Care Protection account: The existing cohort of those aged 40 or above might not have enough.

Migration: slow down ageing

The difference between the proposed
and the official projectionComparison of official projection and new projection,
HKSAR, 2000-2029
6500
7000
7500
8000
8500
9000
2000 2005 2010 2015 2020 2025Year (mid)
(thou
sand
peo
ple)
Off icial
New
Three-fold challengesHow to revert the low fertility:
Replacement Migration:
Healthy Population:

Low fertility
About 60% reduction is due to change of marital distribution rather than the reduction of marital fertility.Promoting fertility, CS suggested to have three. However the married one on average have 2 already.Engage the newborns from Mainland born mothers in Hong Kong Family friendly work practice: including longer maternal or paternal leave for parents, child care facilities, tax reduction and shortening of working hours.

Replacement migration
About more than 80% of the population growth from migration.The new comers rejuvenate and inject new blood into the community.They are not coming and not very stable (38100 one-way permit holders in 2004; 55,000 in 2005).Impact on the labour force: postponement of the retirement age.Successful experience in Shanghai about 30% are newly migrants

Healthy Population
Life-long health promotion and practiceHealthy life style.Prevention: to prevent unnecessary health cost: for example, abortion, smoking and attempted or completed suicides

LAW, C.K. and YIP, P.S.F. (2002). Acute care service utilization and the possible impacts of a user-fee policy in Hong Kong. Hong Kong Medical Journal, 8, 348-353.LAW, C.K. and YIP, P.S.F. (2002). Healthy Adjusted Life Years of Hong Kong, SAR. International Journal of Public Health, 81, 1-7.LAW, C.K. and YIP, P.S.F. (2002). Viability of the health protection account in Hong Kong. Hong Kong Medical Journal, 8, 262-8. YIP, P.S.F. and LAW, C.K. (2002). Assessment of the future resources and needs for hospitalization in Hong Kong SAR. The International Journal of Health Planning and Management, 17, 113-122.

YIP, P.S.F. and LEE, J. (2002). The impact of the changing marital structure on the fertility rate of Hong Kong SAR. Social Science and Medicine, 55, 2159-2169.CHEUNG, Y.B. and YIP, P.S.F. (2001). Social patterns of birth weight in Hong Kong, 1984-1997. Social Science and Medicine, 52, 1135-1141.YIP, P.S.F., LEE, J, CHAN, B. and AU, J. (2001). A study of demographic changes under sustained below -replacement fertility in Hong Kong SAR. Social Science and Medicine, 53, 1003-1009.