Embed Size (px)
Citation preview

Research Journal of Information Technology 3(1): 55-67, 2011ISSN: 2041-3114© Maxwell Scientific Organization, 2011Received: December 17, 2010 Accepted: January 10, 2011 Published: March 20, 2011
Corresponding Author: G.K. Raikundalia, School of Engineering and Science, Victoria University, Melbourne, Australia55
A Web-based Visual Simulator for Hospital Management Using Discrete Event Simulation
1G.K. Raikundalia, 2M. Mastan and 3C.A. Bain1School of Engineering and Science, Victoria University, Melbourne , Australia 2Hansen Technologies, Doncaster, Victoria 3108, Australia3Performance Analysis and Data Governance, Strategy & Planning,
Ambulance Victoria, Doncaster, Victoria 3108, Australia
Abstract: Access, demand and resource management issues in hospitals continue to plague the area of hospitalmanagement. Access is the capacity to provide patients with health care in a timely fashion, demand is acommunity’s need for health care satisfied by available health services and resource management is the use ofvarious resources available to hospitals for managing them. Problems in these three areas lead to long waits inemergency, prolonged periods for patients on procedural waiting lists and cancellation of surgical operations.To support hospital managers in effective management of a hospital, managers require software that presentsthem with necessary information about resources, such as beds available for patients in emergency. This studypresents a new Web-based visual solution to the abovementioned problems using discrete event simulation.This system builds on our previous work where simulations are generated using a Web site, but the Web sitegenerates an enormous quantity of data as output. This output needs to be processed in a very short amount oftime (given managers need for quick access to information) and displayed in visual manner for easy use andinterpretation by managers. Our software solution is absolutely novel as our earlier work on which the newsolution is based was also novel as a solution for hospital managers.
Keywords: Computer simulation, discrete event simulation, hospital management, World Wide Web
INTRODUCTION
Hospitals are inarguably fundamental and essentialfor the health and wellbeing of a society. Whetherchildren are born, patients recuperate from illness orsurgeries are performed there, hospitals are the form ofcare communities can rely on to assist them with theirhealth. Therefore, it is abundantly clear that theirefficiency and effectiveness in helping people is of greatimportance. In relation to this, the management of such avital organisation as a hospital must be assisted wherepossible so that patients’ health and wellbeing ismaximized as the outcome.
Systems and technologies that can assist hospitalmanagers in their work of handling a major and complexorganisation like a hospital are of great need. Managers ofhospitals have many issues with which to contend, suchas insufficient funding of their activities, lack ofresources, efficient use of staff and so forth. In manycountries, insufficient funding and unavailability of bedsor relevant staff are highly problematic and can to leadlong waiting times for treatment or surgery. It is health ofthe community that suffers under such circumstances.
Our interest lies in the simulation of a hospital so asto assist a hospital manager in the running of a hospital.
Simulation tools for various domains have beendeveloped and made available for decades. Simulation hasthe benefit of “what-if” analysis and gaining anunderstanding of a problem before implementing asolution to the problem.
In the case of a hospital, a manager is able to executescenarios of different situations for the hospital to knowthe effects of management decisions. The manager canview the effects of an increase in the number of beds in award or the hospital or if more staff are made available toa ward or unit. The manager may determine that, forinstance, increasing the number of beds by two in aparticular ward may not have as much desired effect onreducing the waiting time for patients in the EmergencyDepartment. Therefore, the simulator can assist themanager in the prediction of effects from changingvarious aspects of a scenario, and from this, enable themto better manage the hospital.
Our previous work on hospital simulation has notinvolved a visual, graphical presentation to the manager(Bain et al., 2007; Raikundalia et al., 2009). This studyhas provide a textual (yet Web-based) output that, at thetime the work was done, provided a new capability forassisting a hospital manager in their management activity.Clearly, a more user-friendly output is one that is in a
Res. J. Inform. Technol., 3(1): 55-67, 2011
56
graphical format as described in this study. However, atthis time, there is a paucity of such visual simulators forhospital management that go beyond simulation of ahospital department or unit.
This study covers in detail the functionality of oursimulator, presenting to the reader the various userinterfaces of the system and how they work. To make theapplication of the simulator abundantly clear, twoscenarios exemplifying its use are provided.
LITERATURE REVIEW
Various systems in health informatics or e-healthhave been developed over the years that providesimulations assisting health care practitioners clinically.We present a survey here of simulation systems that usepowerful underlying technology in order to generatesimulations. Without advanced computing such as gridcomputing or parallel computing, such simulations couldnot be generated. Although in our case data in volumes ofhundreds of megabytes need to be processed to generatesimulations, these powerful forms of computing are notrequired. Many other simulation systems have beendeveloped without need for such powerful technology(indeed several systems were developed decades agobefore such technology was available); however, wehave covered such systems in our other papers(Bain et al., 2007; Raikundalia et al., 2009) and we havenot covered them again here.
Pormann et al. (2000) present a simulator generatorfor support of simulation of wavefront conductionassociated with the human heart. Simulations investigateaspects specifically involved in arrhythmias. Theresearchers use a modular approach so that the user canchoose a collection of modules that are the closest inreflecting the simulation that wish to carry out. Thesimulator is generated from this collection of modules.
The researchers run simulations on an IBM SPparallel computer and a cluster of workstations. Theyfound a relatively small problem that there were speed-ups of 12 on 16 processors and 22 on 32 processors. In thecase of a problem that was scaled, they could “simulate128 times as large a domain on 128 processors with onlya 9 processor run” (Pormann et al., 2000). Using thegreater memory available with parallel computers, veryrealistic simulations of atria were possible.
Axner (2007) covers a problem solving andsimulation environment, HemoSolve, for addressingimage-based computational hemodynamics problems. Thesystem, which is completely parallel, is used forvisualisation of biomechanical processes in vascularsystems. HemoSolve also provides tools to simulatesurgery, such as bypass replacement. The researcherdevelops an initial version and then improves that versionwith a newer, faster version using a performance
prediction model to determine who to make the systemwork faster.
Axner (2007) presents example improvements in thenew version:
C The time taken for time-harmonic blood flowsimulation in the carotid artery with bypassplacement is about one-ninth faster in new version
C Experiments that took 3 h to execute in the previousversion take about 20 min in the new version
The work of Dibble et al. (2007) involves simulationof pandemic influenza of cities in the USA. Theresearchers investigated a human transmitted H5N1 strainof influenza. They have developed an agent-basedlaboratory that implements a “light-and-fast agent-basedmodel of the spatial and temporal spread of pandemicinfluenza”. The researchers developed a parallel jobcontroller for testing different combinations of scenariosof influenza as well as a platform-independent applicationthat uses high-performance computing resourcesranging from local clusters to TeraGrid supercomputers.Dibble et al. (2007) found that this agent-based systemwas sufficiently fast to generate results via thousands ofreplications and parameter sets applied.
The coverage of a simulation of the spatial dynamicsof an influenza pandemic in an artificial society occurs inStroud et al. (2007). The simulation is created to representthe demographics of southern California using theresearchers’ EpiSimS simulator. The simulator is intendedto support pandemic planning by determining thecorrelation between characteristics of local demographicsand local pandemic severity. The simulator is founded oncluster computing, involving a high performancecomputing Linux cluster where its architecture consists of1,290 nodes and 10.2 TB of RAM is used. Theresearchers found from simulation that average householdsize in a community is a strong predictor of the localseverity of an influenza pandemic, yet population densityis a weak predictor of such severity.
Barrett et al. (2008) developed a scalable parallelalgorithm, EpiSimdemics, for addressing the spread ofinfectious disease (like pandemic influenza). Simulationis of realistic social contact networks of the magnitude of100 million people. Scalability of the algorithm isimportant because without this the simulation can only beused in the case of small populations. The researchersevaluate a multi-processor implementation of theirEpiSimdemics on tera-scale systems to find that thealgorithm scales effectively.
Although not involving any form of highperformance computing, the work of Tan et al. (2005)may be mentioned here. In Tan et al. (2005), theseresearchers address application and illustration ofcomplex adaptive system theory as a method to
Res. J. Inform. Technol., 3(1): 55-67, 2011
57
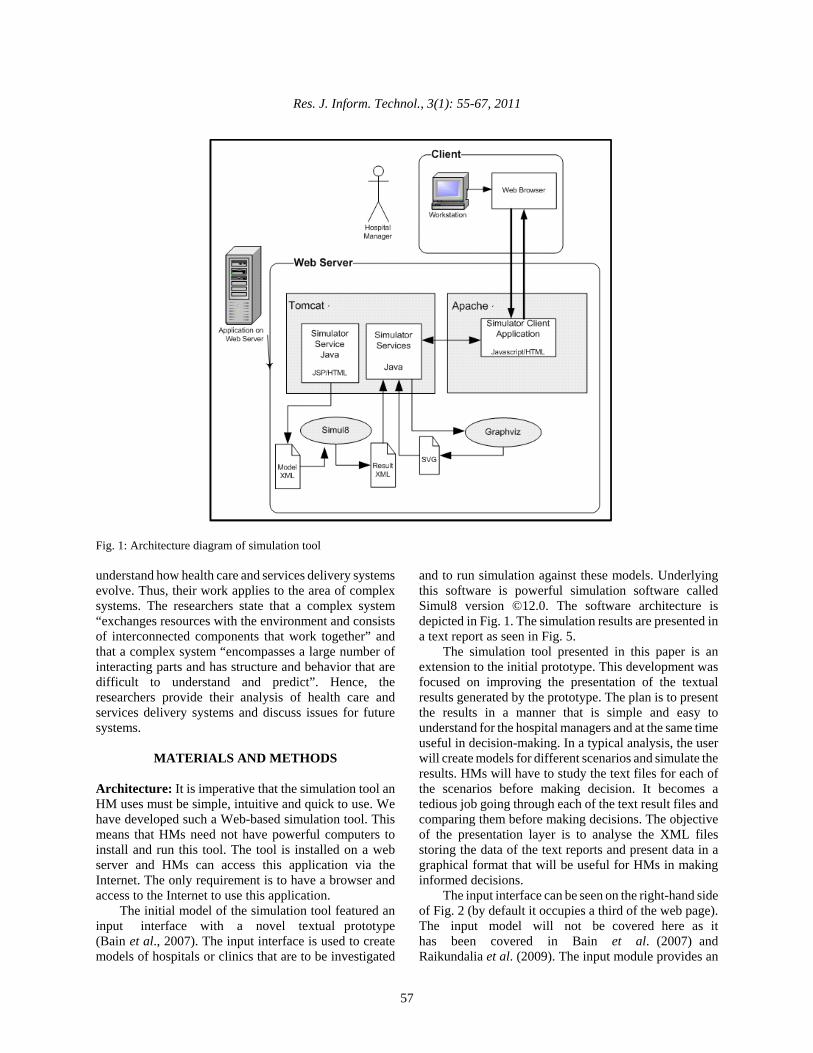
Fig. 1: Architecture diagram of simulation tool
understand how health care and services delivery systemsevolve. Thus, their work applies to the area of complexsystems. The researchers state that a complex system“exchanges resources with the environment and consistsof interconnected components that work together” andthat a complex system “encompasses a large number ofinteracting parts and has structure and behavior that aredifficult to understand and predict”. Hence, theresearchers provide their analysis of health care andservices delivery systems and discuss issues for futuresystems.
MATERIALS AND METHODS
Architecture: It is imperative that the simulation tool anHM uses must be simple, intuitive and quick to use. Wehave developed such a Web-based simulation tool. Thismeans that HMs need not have powerful computers toinstall and run this tool. The tool is installed on a webserver and HMs can access this application via theInternet. The only requirement is to have a browser andaccess to the Internet to use this application.
The initial model of the simulation tool featured aninput interface with a novel textual prototype(Bain et al., 2007). The input interface is used to createmodels of hospitals or clinics that are to be investigated
and to run simulation against these models. Underlyingthis software is powerful simulation software calledSimul8 version ©12.0. The software architecture isdepicted in Fig. 1. The simulation results are presented ina text report as seen in Fig. 5.
The simulation tool presented in this paper is anextension to the initial prototype. This development wasfocused on improving the presentation of the textualresults generated by the prototype. The plan is to presentthe results in a manner that is simple and easy tounderstand for the hospital managers and at the same timeuseful in decision-making. In a typical analysis, the userwill create models for different scenarios and simulate theresults. HMs will have to study the text files for each ofthe scenarios before making decision. It becomes atedious job going through each of the text result files andcomparing them before making decisions. The objectiveof the presentation layer is to analyse the XML filesstoring the data of the text reports and present data in agraphical format that will be useful for HMs in makinginformed decisions.
The input interface can be seen on the right-hand sideof Fig. 2 (by default it occupies a third of the web page).The input model will not be covered here as ithas been covered in Bain et al. (2007) andRaikundalia et al. (2009). The input module provides an
Res. J. Inform. Technol., 3(1): 55-67, 2011
58
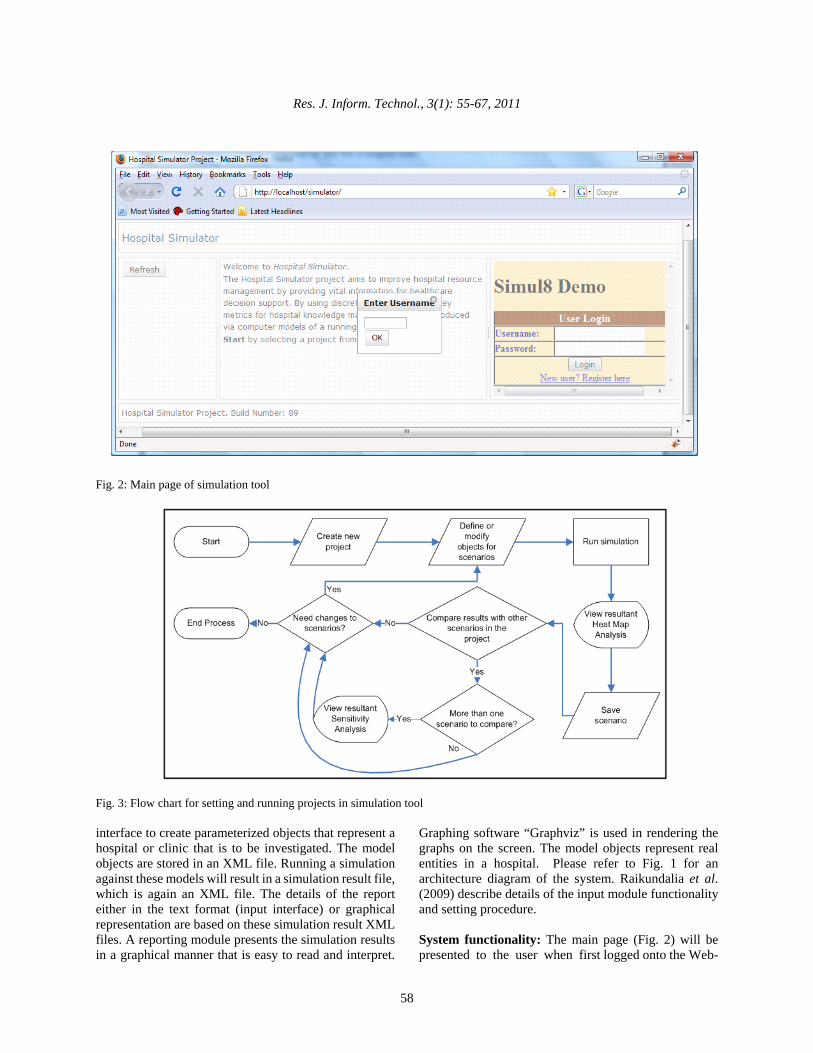
Fig. 2: Main page of simulation tool
Fig. 3: Flow chart for setting and running projects in simulation tool
interface to create parameterized objects that represent ahospital or clinic that is to be investigated. The modelobjects are stored in an XML file. Running a simulationagainst these models will result in a simulation result file,which is again an XML file. The details of the reporteither in the text format (input interface) or graphicalrepresentation are based on these simulation result XMLfiles. A reporting module presents the simulation resultsin a graphical manner that is easy to read and interpret.
Graphing software “Graphviz” is used in rendering thegraphs on the screen. The model objects represent realentities in a hospital. Please refer to Fig. 1 for anarchitecture diagram of the system. Raikundalia et al.(2009) describe details of the input module functionalityand setting procedure.
System functionality: The main page (Fig. 2) will bepresented to the user when first logged onto the Web-
Res. J. Inform. Technol., 3(1): 55-67, 2011
59
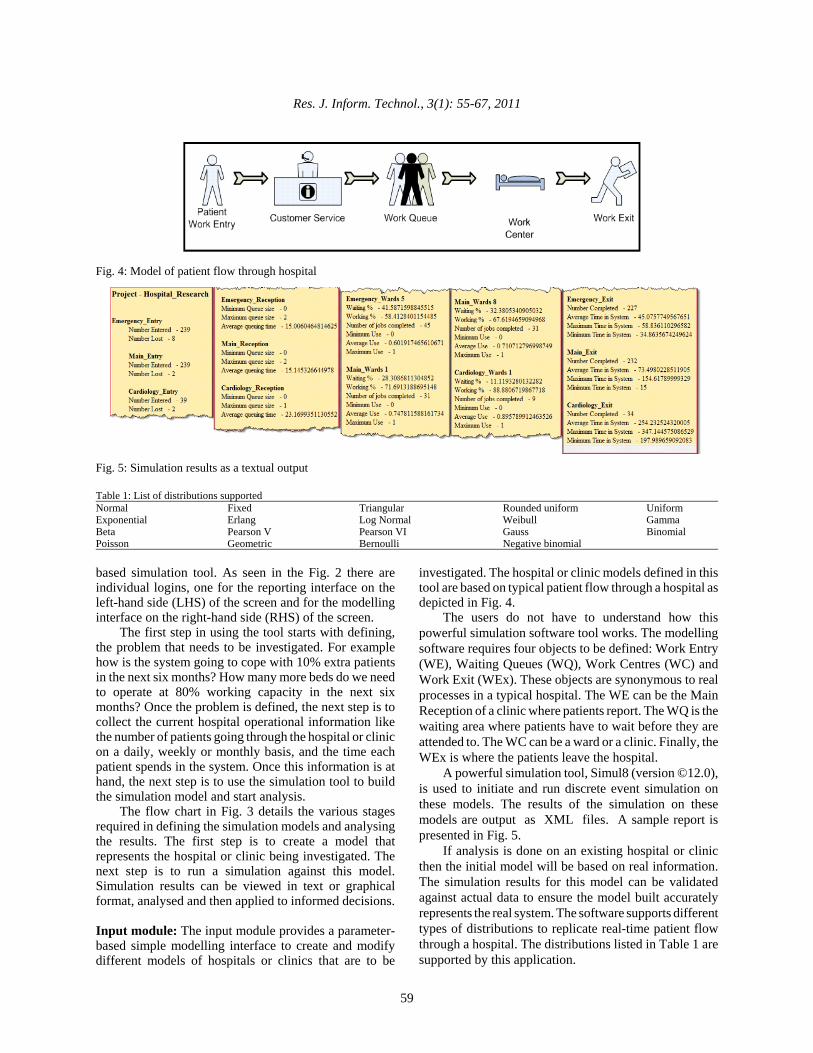
Fig. 4: Model of patient flow through hospital
Fig. 5: Simulation results as a textual output
Table 1: List of distributions supportedNormal Fixed Triangular Rounded uniform UniformExponential Erlang Log Normal Weibull GammaBeta Pearson V Pearson VI Gauss BinomialPoisson Geometric Bernoulli Negative binomial
based simulation tool. As seen in the Fig. 2 there areindividual logins, one for the reporting interface on theleft-hand side (LHS) of the screen and for the modellinginterface on the right-hand side (RHS) of the screen.
The first step in using the tool starts with defining,the problem that needs to be investigated. For examplehow is the system going to cope with 10% extra patientsin the next six months? How many more beds do we needto operate at 80% working capacity in the next sixmonths? Once the problem is defined, the next step is tocollect the current hospital operational information likethe number of patients going through the hospital or clinicon a daily, weekly or monthly basis, and the time eachpatient spends in the system. Once this information is athand, the next step is to use the simulation tool to buildthe simulation model and start analysis.
The flow chart in Fig. 3 details the various stagesrequired in defining the simulation models and analysingthe results. The first step is to create a model thatrepresents the hospital or clinic being investigated. Thenext step is to run a simulation against this model.Simulation results can be viewed in text or graphicalformat, analysed and then applied to informed decisions.
Input module: The input module provides a parameter-based simple modelling interface to create and modifydifferent models of hospitals or clinics that are to be
investigated. The hospital or clinic models defined in thistool are based on typical patient flow through a hospital asdepicted in Fig. 4.
The users do not have to understand how thispowerful simulation software tool works. The modellingsoftware requires four objects to be defined: Work Entry(WE), Waiting Queues (WQ), Work Centres (WC) andWork Exit (WEx). These objects are synonymous to realprocesses in a typical hospital. The WE can be the MainReception of a clinic where patients report. The WQ is thewaiting area where patients have to wait before they areattended to. The WC can be a ward or a clinic. Finally, theWEx is where the patients leave the hospital.
A powerful simulation tool, Simul8 (version ©12.0),is used to initiate and run discrete event simulation onthese models. The results of the simulation on thesemodels are output as XML files. A sample report ispresented in Fig. 5.
If analysis is done on an existing hospital or clinicthen the initial model will be based on real information.The simulation results for this model can be validatedagainst actual data to ensure the model built accuratelyrepresents the real system. The software supports differenttypes of distributions to replicate real-time patient flowthrough a hospital. The distributions listed in Table 1 aresupported by this application.
Res. J. Inform. Technol., 3(1): 55-67, 2011
60
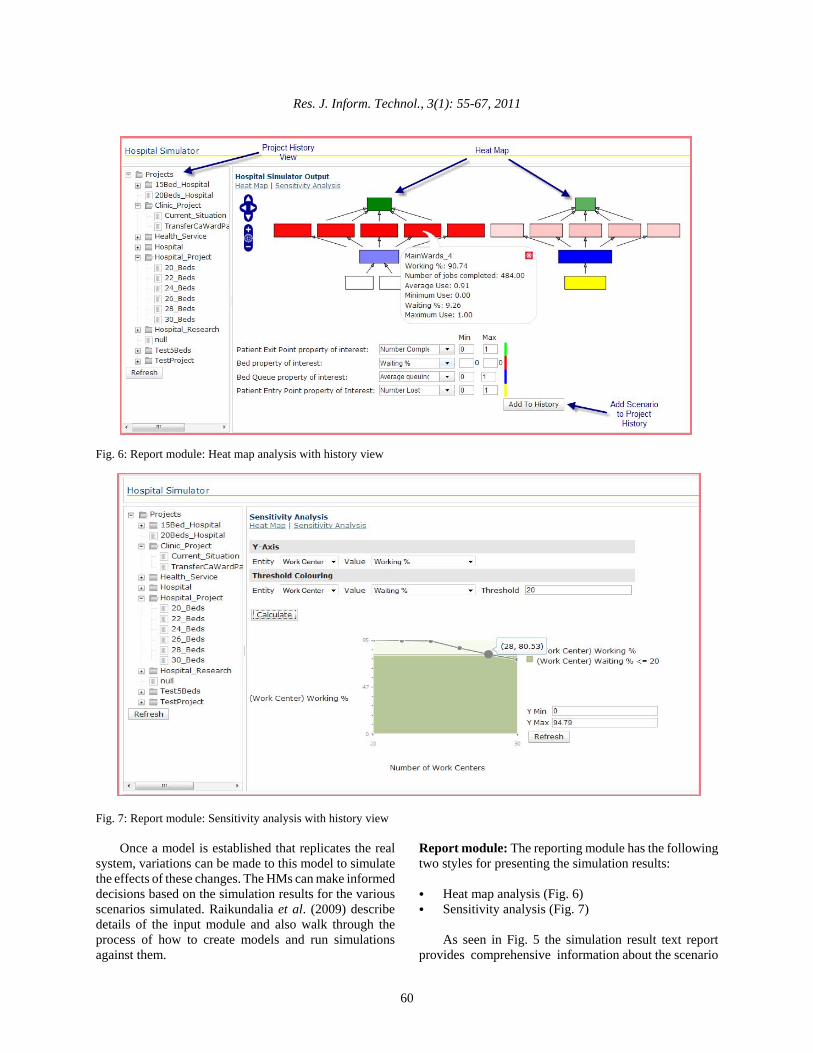
Fig. 6: Report module: Heat map analysis with history view
Fig. 7: Report module: Sensitivity analysis with history view
Once a model is established that replicates the realsystem, variations can be made to this model to simulatethe effects of these changes. The HMs can make informeddecisions based on the simulation results for the variousscenarios simulated. Raikundalia et al. (2009) describedetails of the input module and also walk through theprocess of how to create models and run simulationsagainst them.
Report module: The reporting module has the followingtwo styles for presenting the simulation results:
C Heat map analysis (Fig. 6)C Sensitivity analysis (Fig. 7)
As seen in Fig. 5 the simulation result text reportprovides comprehensive information about the scenario
Res. J. Inform. Technol., 3(1): 55-67, 2011
61
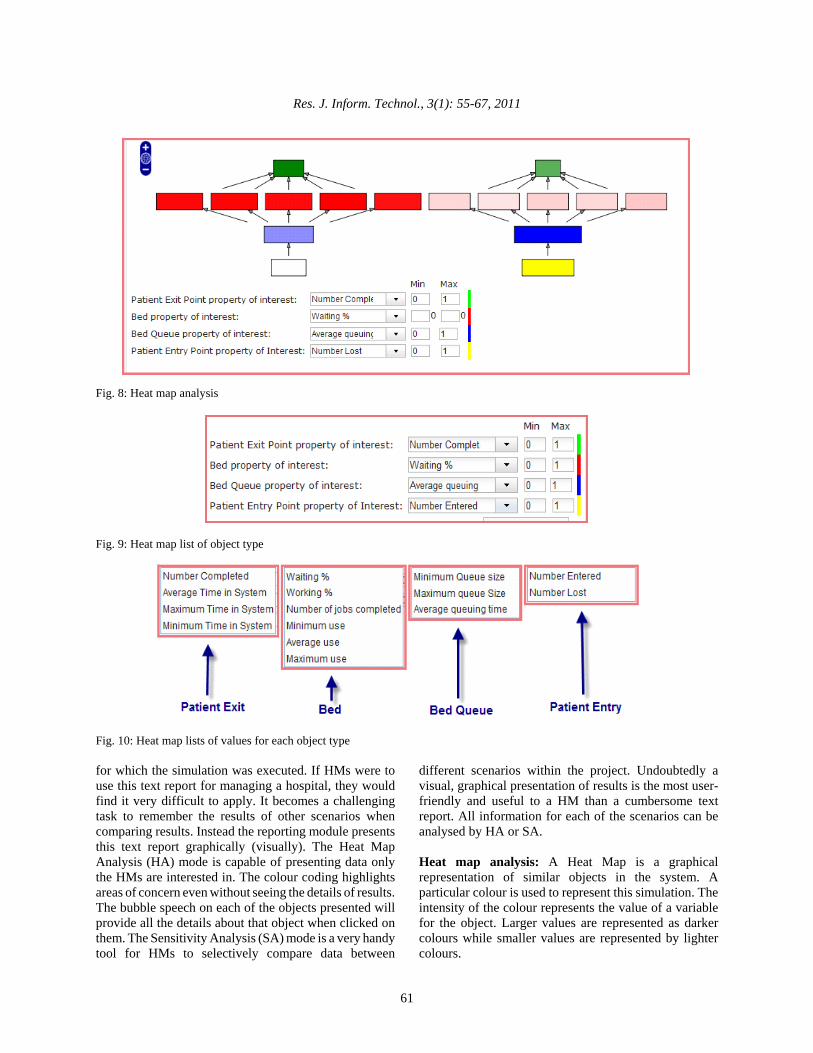
Fig. 8: Heat map analysis
Fig. 9: Heat map list of object type
Fig. 10: Heat map lists of values for each object type
for which the simulation was executed. If HMs were touse this text report for managing a hospital, they wouldfind it very difficult to apply. It becomes a challengingtask to remember the results of other scenarios whencomparing results. Instead the reporting module presentsthis text report graphically (visually). The Heat MapAnalysis (HA) mode is capable of presenting data onlythe HMs are interested in. The colour coding highlightsareas of concern even without seeing the details of results.The bubble speech on each of the objects presented willprovide all the details about that object when clicked onthem. The Sensitivity Analysis (SA) mode is a very handytool for HMs to selectively compare data between
different scenarios within the project. Undoubtedly avisual, graphical presentation of results is the most user-friendly and useful to a HM than a cumbersome textreport. All information for each of the scenarios can beanalysed by HA or SA.
Heat map analysis: A Heat Map is a graphicalrepresentation of similar objects in the system. Aparticular colour is used to represent this simulation. Theintensity of the colour represents the value of a variablefor the object. Larger values are represented as darkercolours while smaller values are represented by lightercolours.

Res. J. Inform. Technol., 3(1): 55-67, 2011
62
HA is used to analyse individual scenarios within aproject. As seen in Fig. 8 all the four object types (WE,WQ, WC and WEx) created when defining the scenarioin the input module are always represented in this graph.Each object type is represented by a single colour. Forexample, WCs (beds) is represented in red, WE (PatientEntry) in yellow, WQ (Patient waiting Queue) in blue andWEx (patient discharge) in green.
The intensity of colour depends on the values of thechosen property for each object type. Each object type inthe module has different properties. HA can be done onvarious properties for each of the model objects. HA onbeds can be done on Waiting % (beds free), Working %(beds occupied), Number of jobs completed, Minimumuse, Average use and Maximum use. The complete list ofproperties on which HA can be performed is displayed inFig. 10.
As seen in Fig. 8 the colour of bed objects variesfrom light pink to dark red. The bed objects in the graphrepresent the property Waiting% of the beds in thisscenario. The light pink in this case represents that thebeds are waiting for a very short time as compared to bedsrepresented in dark red. In other words beds in light pinkare busier than the beds represented in dark red. On thecontrary the beds represented in dark red indicate thatthey are waiting for a longer time as compared to beds inpink. The representation of the colours will be exactlyopposite if Working % is selected as the “Beds property
of interest”. The Min and Max values (Fig. 9) can beentered to display a particular range of values in renderingthis graph.
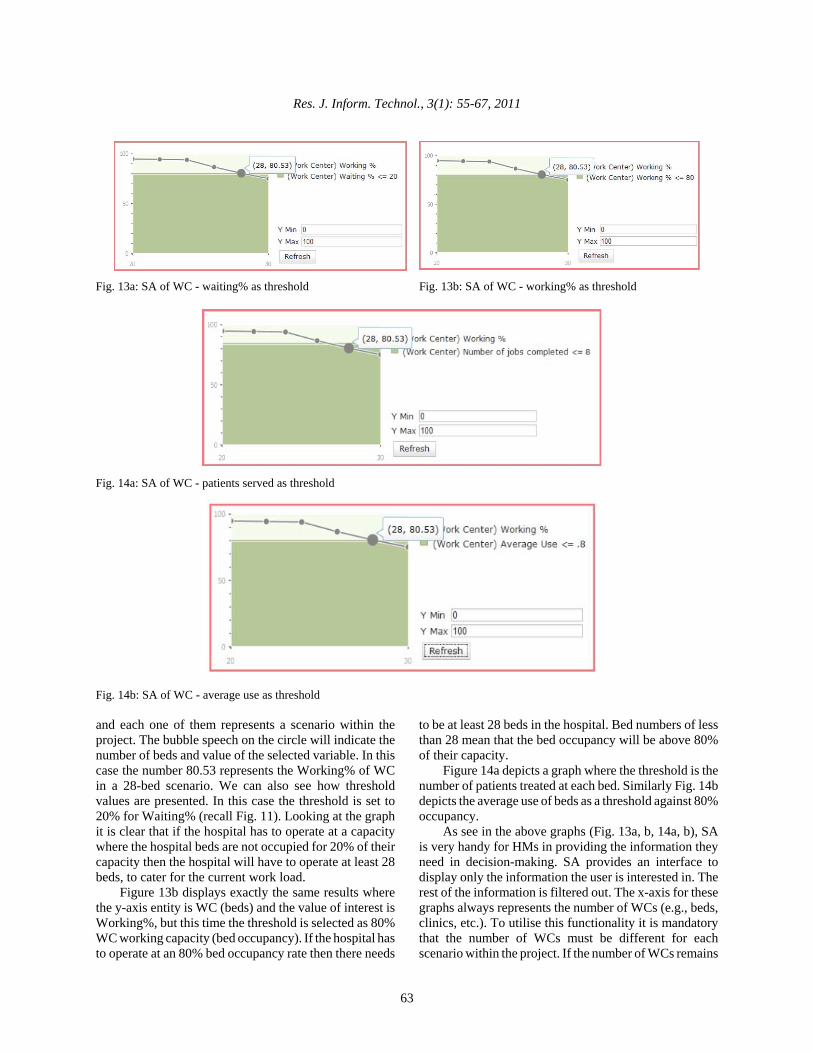
Sensitivity analysis: SA is a technique for systematicallychanging input parameters in a mathematical model anddetermining the effects of such changes. The SA graph inthis tool provides a means to compare properties of oneobject against other properties on the same or otherobject. For example in Fig. 13c the amount of time thebeds are occupied (working %) can be checked against thenumber of patients served (jobs completed) by beds.Similarly the Working % of beds (beds occupied) can bechecked against maximum allowed Waiting % (bedsunoccupied). SA is a very effective tool for comparingresults and presenting only the data HMs are interested inanalysing.
The user may choose to view any property of theobject by selecting the entity and the value of interest forthat entity as parameter for the y-axis (Fig. 11). Thecomplete list of values that can be chosen for each of thefour objects is presented in Fig. 12.
By selecting the y-axis variable and the threshold, therequested data for all scenarios under the project ispresented in the graph. For example in Fig. 13a, the y-axisentity is WC (beds) and the value of interest isWorking%. The Threshold entity is WC and the value ofinterest is Waiting%. There are six circles on the graph
Fig. 11: Sensitivity analysis property selection details
Fig. 12: Entity and value lists of properties
Res. J. Inform. Technol., 3(1): 55-67, 2011
63
Fig. 13a: SA of WC - waiting% as threshold Fig. 13b: SA of WC - working% as threshold
Fig. 14a: SA of WC - patients served as threshold
Fig. 14b: SA of WC - average use as threshold
and each one of them represents a scenario within theproject. The bubble speech on the circle will indicate thenumber of beds and value of the selected variable. In thiscase the number 80.53 represents the Working% of WCin a 28-bed scenario. We can also see how thresholdvalues are presented. In this case the threshold is set to20% for Waiting% (recall Fig. 11). Looking at the graphit is clear that if the hospital has to operate at a capacitywhere the hospital beds are not occupied for 20% of theircapacity then the hospital will have to operate at least 28beds, to cater for the current work load.
Figure 13b displays exactly the same results wherethe y-axis entity is WC (beds) and the value of interest isWorking%, but this time the threshold is selected as 80%WC working capacity (bed occupancy). If the hospital hasto operate at an 80% bed occupancy rate then there needs
to be at least 28 beds in the hospital. Bed numbers of lessthan 28 mean that the bed occupancy will be above 80%of their capacity.
Figure 14a depicts a graph where the threshold is thenumber of patients treated at each bed. Similarly Fig. 14bdepicts the average use of beds as a threshold against 80%occupancy.
As see in the above graphs (Fig. 13a, b, 14a, b), SAis very handy for HMs in providing the information theyneed in decision-making. SA provides an interface todisplay only the information the user is interested in. Therest of the information is filtered out. The x-axis for thesegraphs always represents the number of WCs (e.g., beds,clinics, etc.). To utilise this functionality it is mandatorythat the number of WCs must be different for eachscenario within the project. If the number of WCs remains
Res. J. Inform. Technol., 3(1): 55-67, 2011
64
Fig. 15: Project history
the same between different scenarios then the sensitivityanalysis will display a single circle making thispresentation model unsuitable to compare results betweendifferent scenarios.
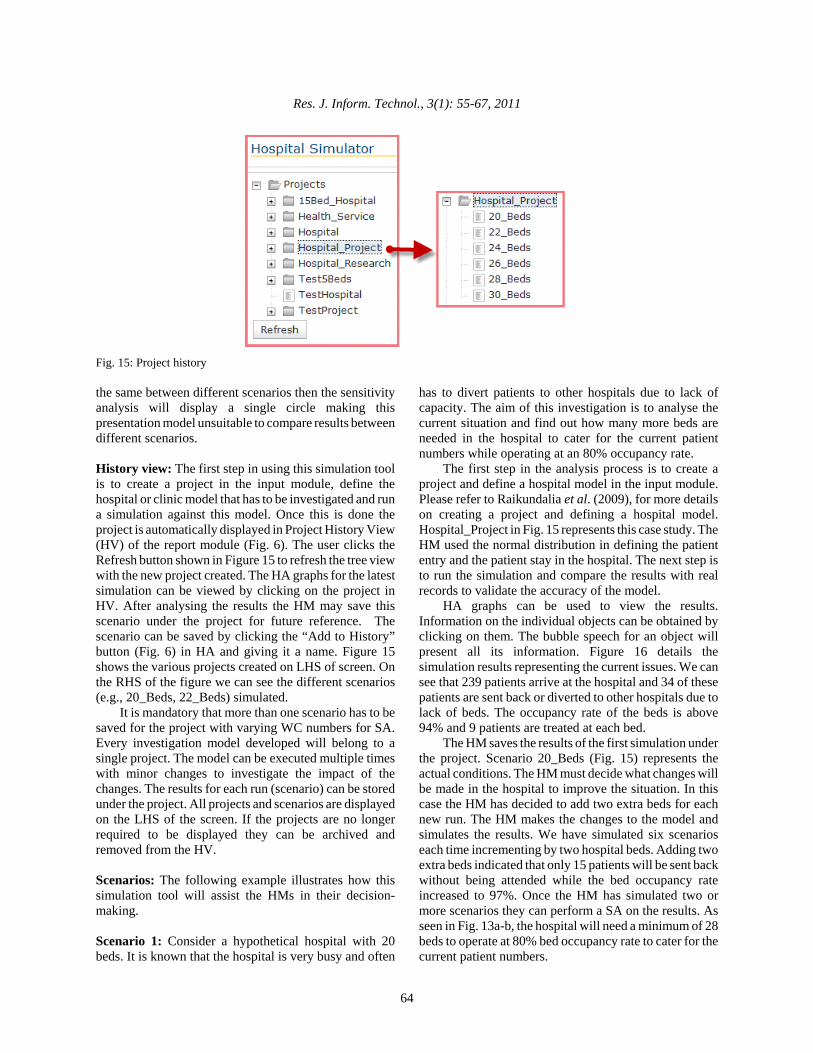
History view: The first step in using this simulation toolis to create a project in the input module, define thehospital or clinic model that has to be investigated and runa simulation against this model. Once this is done theproject is automatically displayed in Project History View(HV) of the report module (Fig. 6). The user clicks theRefresh button shown in Figure 15 to refresh the tree viewwith the new project created. The HA graphs for the latestsimulation can be viewed by clicking on the project inHV. After analysing the results the HM may save thisscenario under the project for future reference. Thescenario can be saved by clicking the “Add to History”button (Fig. 6) in HA and giving it a name. Figure 15shows the various projects created on LHS of screen. Onthe RHS of the figure we can see the different scenarios(e.g., 20_Beds, 22_Beds) simulated.
It is mandatory that more than one scenario has to besaved for the project with varying WC numbers for SA.Every investigation model developed will belong to asingle project. The model can be executed multiple timeswith minor changes to investigate the impact of thechanges. The results for each run (scenario) can be storedunder the project. All projects and scenarios are displayedon the LHS of the screen. If the projects are no longerrequired to be displayed they can be archived andremoved from the HV.
Scenarios: The following example illustrates how thissimulation tool will assist the HMs in their decision-making.
Scenario 1: Consider a hypothetical hospital with 20beds. It is known that the hospital is very busy and often
has to divert patients to other hospitals due to lack ofcapacity. The aim of this investigation is to analyse thecurrent situation and find out how many more beds areneeded in the hospital to cater for the current patientnumbers while operating at an 80% occupancy rate.
The first step in the analysis process is to create aproject and define a hospital model in the input module.Please refer to Raikundalia et al. (2009), for more detailson creating a project and defining a hospital model.Hospital_Project in Fig. 15 represents this case study. TheHM used the normal distribution in defining the patiententry and the patient stay in the hospital. The next step isto run the simulation and compare the results with realrecords to validate the accuracy of the model.
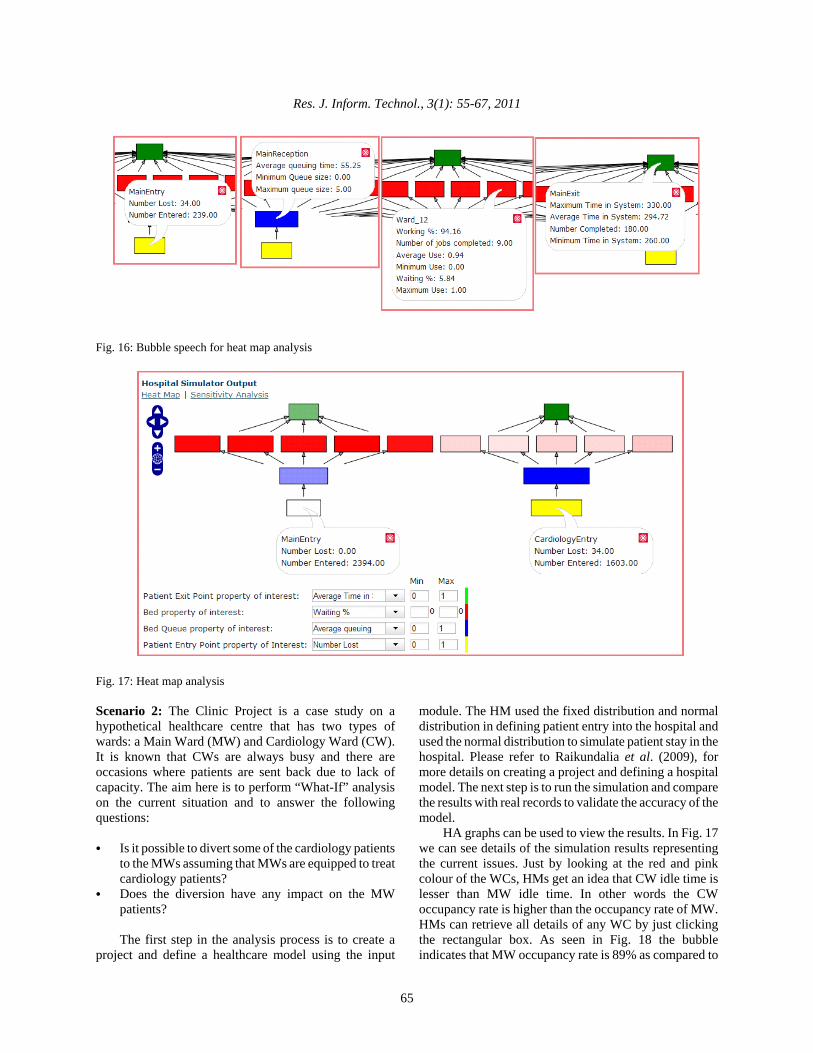
HA graphs can be used to view the results.Information on the individual objects can be obtained byclicking on them. The bubble speech for an object willpresent all its information. Figure 16 details thesimulation results representing the current issues. We cansee that 239 patients arrive at the hospital and 34 of thesepatients are sent back or diverted to other hospitals due tolack of beds. The occupancy rate of the beds is above94% and 9 patients are treated at each bed.
The HM saves the results of the first simulation underthe project. Scenario 20_Beds (Fig. 15) represents theactual conditions. The HM must decide what changes willbe made in the hospital to improve the situation. In thiscase the HM has decided to add two extra beds for eachnew run. The HM makes the changes to the model andsimulates the results. We have simulated six scenarioseach time incrementing by two hospital beds. Adding twoextra beds indicated that only 15 patients will be sent backwithout being attended while the bed occupancy rateincreased to 97%. Once the HM has simulated two ormore scenarios they can perform a SA on the results. Asseen in Fig. 13a-b, the hospital will need a minimum of 28beds to operate at 80% bed occupancy rate to cater for thecurrent patient numbers.
Res. J. Inform. Technol., 3(1): 55-67, 2011
65
Fig. 16: Bubble speech for heat map analysis
Fig. 17: Heat map analysis
Scenario 2: The Clinic Project is a case study on ahypothetical healthcare centre that has two types ofwards: a Main Ward (MW) and Cardiology Ward (CW).It is known that CWs are always busy and there areoccasions where patients are sent back due to lack ofcapacity. The aim here is to perform “What-If” analysison the current situation and to answer the followingquestions:
C Is it possible to divert some of the cardiology patientsto the MWs assuming that MWs are equipped to treatcardiology patients?
C Does the diversion have any impact on the MWpatients?
The first step in the analysis process is to create aproject and define a healthcare model using the input
module. The HM used the fixed distribution and normaldistribution in defining patient entry into the hospital andused the normal distribution to simulate patient stay in thehospital. Please refer to Raikundalia et al. (2009), formore details on creating a project and defining a hospitalmodel. The next step is to run the simulation and comparethe results with real records to validate the accuracy of themodel.
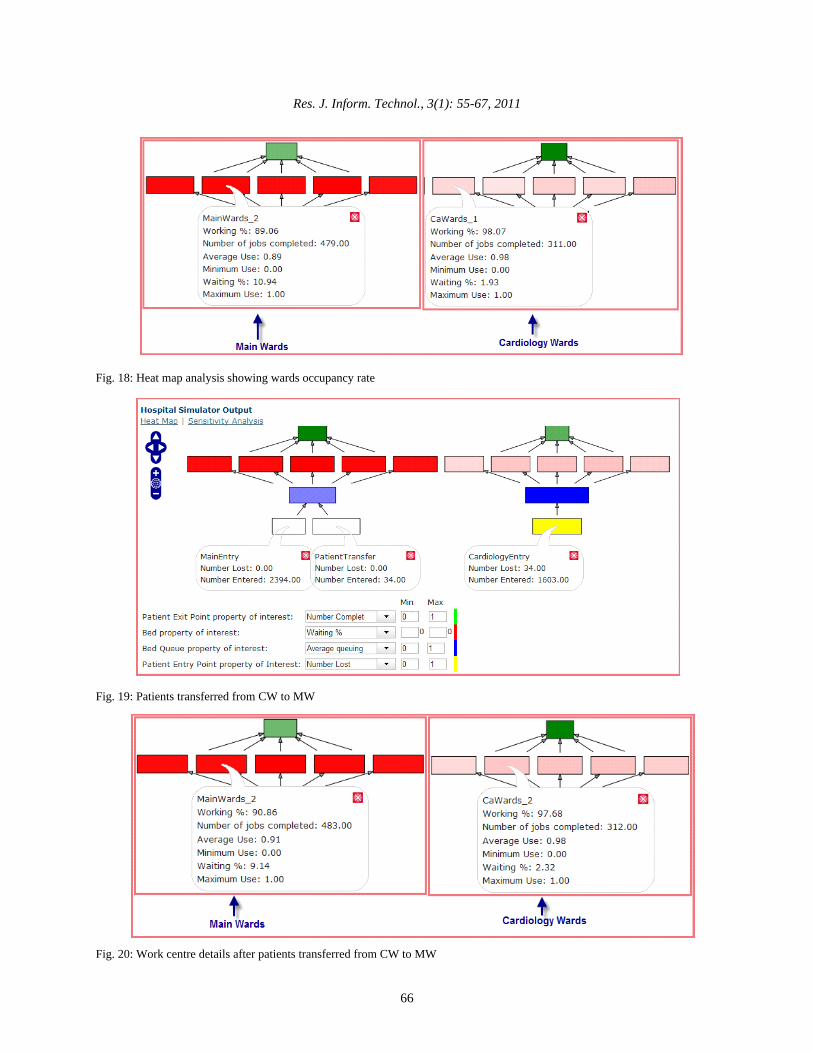
HA graphs can be used to view the results. In Fig. 17we can see details of the simulation results representingthe current issues. Just by looking at the red and pinkcolour of the WCs, HMs get an idea that CW idle time islesser than MW idle time. In other words the CWoccupancy rate is higher than the occupancy rate of MW.HMs can retrieve all details of any WC by just clickingthe rectangular box. As seen in Fig. 18 the bubbleindicates that MW occupancy rate is 89% as compared to
Res. J. Inform. Technol., 3(1): 55-67, 2011
66
Fig. 18: Heat map analysis showing wards occupancy rate
Fig. 19: Patients transferred from CW to MW
Fig. 20: Work centre details after patients transferred from CW to MW
Res. J. Inform. Technol., 3(1): 55-67, 2011
67
98% occupancy of CW. The simulation of the currentsituation indicates that 34 patients could not be treated inCWs due to lack of capacity.
The above analysis indicates that CWs are operatingto full capacity and the MWs still have capacity to treatextra patients.
In scenario 2 cardiology patients who were sent backfrom CWs are treated in MWs assuming that they havethe required expertise and spare equipment to treat them.As seen in Fig. 19 all patients have been treated and nopatients had to be sent back. Again looking at the bubble(Fig. 20) for the WC, it can be seen that the MWoccupancy rate has gone up to 91%. Based on theseresults the HM will be able to make decisions withconfidence. More scenarios can be simulated to find outwhat is the maximum number of patients that can bediverted from Cws.
RESULTS AND DISCUSSION
Certain limitations currently exist in our system andthey are as follows:
C The application provides functionality to save thehistory of a scenario, however, there are no optionsto delete the history from the application. Thepossibility of deleting the history will have to beconsidered in the next version of the system.
C The current simulation module does not support apartial day in defining working hours. A better optionis to attach a calendar where we can define workinghours as well as weekends and public holidays.
CONCLUSION
This study covered our Web-based, discrete event-based simulator for hospital managers. Hospital managersuse the functionality and user interfaces described in thispaper to execute scenarios in determining the effects tochanges in these scenarios. By being able to makechanges to a scenario, for example, number of beds,managers is generated visualizations they can apply to themanagement of the hospital. We covered two examplescenarios illustrating how the simulator is used by thehospital manager.
ACKNOWLEDGMENT
We would like to acknowledge the source of fundingfor this project: 2006 Victorian Partnership for AdvancedComputing e-Research Program Grants Scheme - VUSpecial Round 8. In addition, we would like to thank staff
of Victorian Partnership for Advanced Computing(VPAC) who were involved in the development of thesimulator: Alan Lo and Angus MacCauley. We also thankthe CEO of VPAC, Prof Bill Appelbe, for his initialadvice on the project. Finally, thanks go to ThiagarajanRamadoss and Devang Mehta for their initial work on thegrant proposal.
REFERENCES
Axner, L., 2007. High performance computationalhemodynamics with the lattice boltzmann method.Ph.D. Thesis, University of Amsterdam, TheNetherlands.
Bain, C., G.K. Raikundalia and S. Mehta, 2007. Hospitalmanagement knowledge discovery using discreteevent simulation. Proceedings of First AustralasianWorkshop on Health Knowledge Management andDiscovery, Ballarat, Australia, 30 January - 2February, pp: 209-218.
Barrett, C., K. Bisset, S. Eubank, X. Feng andM. Marathe, 2008. EpiSimdemics: an efficientalgorithm for simulating the spread of infectiousdisease over large realistic social networks.Proceedings of the 2008 ACM/IEEE Conference onHigh Performance Computing November, Austin,Texas, 15-21 November, pp: 1-12.
Dibble, C., S. Wendel and K. Carle, 2007. Simulatingpandemic influenza risks of U.S. cities. Proceedingsof 2007 Winter Simulation Conference, Washington,DC, 9-12 December, pp: 1548-1550.
Pormann, J., C. Henriquez, J. Board, D. Rose, D. Harrildand A. Henriquez, 2000. Computer simulations ofcardiac electrophysiology. Proceedings of the 2000ACM/IEEE Conference on Supercomputing, Dallas,Texas, 4-10 November.
Raikundalia, G.K., C. Bain and S. Mehta, 2009. Towardsan advanced computing solution for hospitalmanagement using discrete event simulation. Int.Rev. Comput. Software, 4:15-25.
Stroud, P., S. Del Valle, S. Sydoriak, J. Riese andS. Mniszewski, 2007. Spatial dynamics of pandemicinfluenza in a massive artificial society. JASSS-J.Artif. Soc. S., 10(2).
Tan, J., J. Wen and N. Awad, 2005. Health care andservices delivery systems as complex adaptivesystems. Commun. ACM, 48: 37-44.