Embed Size (px)
Citation preview
A World Ready To Learn
1
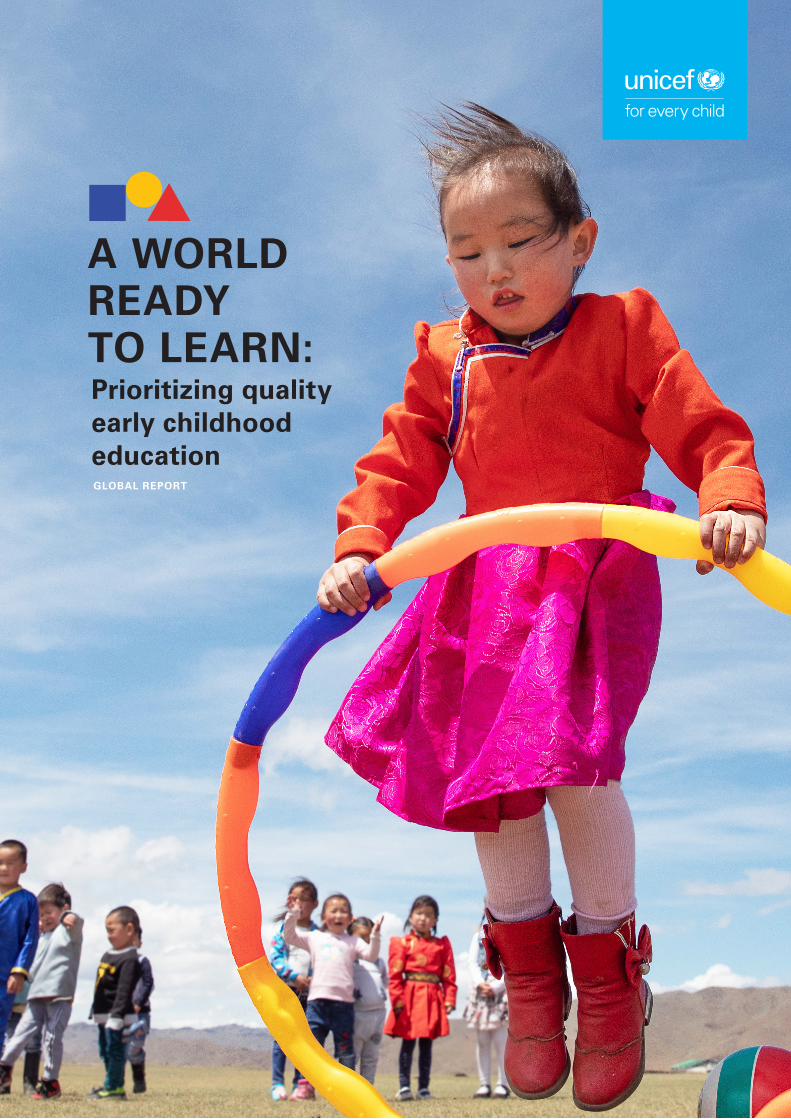
Prioritizing quality early childhood educationGLOBAL REPORT
A WORLD READY TO LEARN:
© United Nations Children’s Fund (UNICEF)
April 2019
ISBN: 978-92-806-5007-5
Permission is required to reproduce any part of this publication. Permissions will be freely granted to educational and non-profit organizations. Please contact the Division of Communication at [email protected].
Suggested citation: United Nations Children’s Fund, A World Ready to Learn: Prioritizing quality early childhood education, UNICEF, New York, April 2019.
Cover photo: © UNICEF/UN0220814/Matas
AcknowledgmentsA World Ready to Learn: Prioritizing quality early childhood education was produced by the Education Section at UNICEF headquarters and is the result of collaboration among many individuals and teams. The report team thanks everyone who gave so willingly of their time, energy, patience and expertise. Special thanks go to our colleagues in UNICEF regional and country offices, in particular:
Ana Abdelbasit, Emmanuelle Abrioux, Agnes Arthur, Daniel Baheta, Mariavittoria Ballotta, Francisco Benavides, Cecilia Baldeh, Xuefeng Chen, Bolorchimeg Dagva, Hugh Delaney, Ameena Mohamed Didi, Italo Dutra, Chinargul Dzhumagulova, Deepa Grover, Alvaro Fortin, Maekelech Gidey, Hiroyuki Hattori, Marilyn Hoar, Aleksandra Jovic, Joa Keis, Maja Kovacevic, Pawan Kucita, Elena Locatelli, Lang Ma, Mohammad Mohsin, Maniza Ntekim, Psyche Vetta Olayvar, Wycliffe Otieno, Alassane Ouedraogo, Tanaporn Perapate, Jelena Perovic, Abhiyan Jung Rana, Tanja Rankovic, Maria Paula Reinbold, Nicolas Reuge, Shantini Saberi, Margarete Sachs-Israel, Aarti Saihjee, Swadchet Sankey, Urmila Sarkar, Ulziisaikhan Sereeter, Dipu Shakya, Anna Smeby, Rasika Somaweera, Parmosivea Soobrayan, Pablo Stansbery, Erin Tanner, Haleinta Thiam, Audax Tibuhinda, Maria Elena Ubeda, Adriana Valcarce, Andries Viviers, Adriana Vogelaar and Haogen Yao, for providing critical inputs to the country case studies included in the report, as well as for reviewing and improving the scope and content of this global publication.
Special thanks also to colleagues and experts across multiple institutions who reviewed and enriched this report, including Manos Antoninis (UNESCO GEM), Magdalena Bendini (World Bank), Jean-Marc Bernard (Global Partnership for Education), Diane Coury (International Institute for Education Planning), Amanda Devercelli (World Bank), Friedrich Huebler (UNESCO Institute for Statistics), Yoshie Kaga (UNESCO), Raphaelle Martinez (Global Partnership for Education), Christin McConnell (Global Partnership for Education), Jean Claude Ndabananiye (Pôle de Dakar), Joseph O’Reilly (Save the Children), Alexandra Solano Rocha (Global Partnership for Education), Pauline Rose (REAL Center), Heather Saunders (Global Partnership for Education) and many others who shared their advice and ideas throughout the development of this publication.
We also thankfully acknowledge the input of Sherri Le Mottee in the early stages of this report, especially in developing first drafts of the case studies. We also thank Ruchita Brajabasi, Tara Dooley, Sarah French, Tanvi Shetty, Sukhmeet Singh and Jennifer Vu, who contributed to the drafting and research process at different stages of the report development. We are grateful to Chloe
O’Gara for her honest and supportive review and feedback. Our heartfelt thanks to Robert Prouty who joined the writing team at a decisive moment and helped sharpen the content and the vision presented in this report.
Overall programme and policy guidance in shaping the vision and content of this report was provided by Ted Chaiban, Jo Bourne, Pia Britto, Matthieu Brossard, Ana Nieto, Peter de Vries, Sherif Yunus Hydara, Morgan Strecker and Mark Waltham from the Programme Division and by Lawrence Chandy, David Anthony and Brina Sidel from the Division of Data, Research and Policy, as well as many other colleagues across Programme Division and the Education Section in headquarters. We are thankful for the ongoing support of so many individuals.
Report team
Overall leadership and coordination: Ivelina Borisova and Hsiao-Chen Lin.
Writing and editorial: A World Ready to Learn was developed by Ivelina Borisova (lead writer), Robert Prouty, Hsiao-Chen Lin, Daniel Kelly and Morgan Strecker.
The report was edited by Catherine Rutgers Inc. and copy-edited by Green Inc. Research and fact-checking was conducted by Xinyi Ge, Yasmine Hage and Baishalee Nayak.
Data and analysis: The data and analysis team compiled, analysed and interpreted data to glean insights and create an evidence base for the report. Data analysis was carried out by Xinxin Yu, Suguru Mizunoya, Claudia Cappa, Nicole Petrowski and Shimizu Takako in the Division of Data, Policy and Research, and Daniel Kelly, Sunmin Lee, Matthieu Brossard and Blandine Ledoux in the Education Section in Programme Division.
Publication design and production: Brigitte Stark-Merklein managed the production of this report and helped bring it to reality, and Mamura Nasirova helped us get started on this journey.
Paula Lopez designed the report with great patience and dedication, and Purva Sawat supported the report’s design concept.
Communication and dissemination: The communication team who helped shape media messaging and related products included Amy Blomme and Morgan Strecker from the Education Section in Programme Division; Paloma Escudero, Achila Imchen, Samantha Mort, Georgina Thompson and Rudina Vojvoda from the Division of Communication, and Anshana Arora and Karoline Hassfurter from the Division of Data, Policy and Research.
A World Ready To Learn
1
Global report on pre-primary education
A WORLD READY TO LEARN
2
Section
4 Foreword 6 Introduction
10 Chapter 1 Why focus on universal pre-primary
education?
13 1.1 Quality pre-primary education sets a strong foundation for learning
1.1.1 Starting school ready to learn and succeed
1.1.2 Advancing successive learning achievements
18 1.2 Universal pre-primary education helps make education systems more effective and efficient
1.2.1 Increasing primary school completion rates
1.2.2 Tackling system inefficiencies by reducing over-enrolment and repetition
1.2.3 Investing in the early years yields strong returns for all levels of education
22 1.3 Equitable pre-primary education is an effective strategy for promoting economic growth
1.3.1 Reducing achievement gaps and inequities
1.3.2 Building skills for future employment, contributing to national economies
26 1.4 Global progress in pre-primary enrolment has been slow and uneven
1.4.1 Only half of the world’s children are enrolled in pre-primary education
1.4.2 Economic status and population demographics challenge countries’ gains in expanding access
1.4.3 Millions of children in emergency settings are denied access to pre-primary learning
35 1.5 A ‘business as usual’ approach will not fulfil the promise of universal pre-primary education
38 Chapter 2 Challenges to equity, pathways
to overcome them
40 2.1 Household- and individual-level factors of exclusion
2.1.1 The impacts of household-level factors: Poverty, maternal education and residence
2.1.2 The impacts of individual-level factors: Ethnicity, language and disability
2.1.3 Simultaneous barriers and subnational differences in early education attendance
48 2.2 Some countries have made substantial gains. What strategies can help accelerate universal
progress?
2.2.1 Adopt a pro-poor policy commitment
2.2.2 Strengthen leadership to prioritize pre-primary education in education sector plans
2.2.3 Plan for universal access, while ensuring the poorest and hardest to reach are not the last to benefit
2.2.4 Coordinate government, civil society and private provision of pre-primary education
62 2.3 Unlocking the potential of progressively
universal access
Contents
A World Ready To Learn
3
66 Chapter 3 Building pre-primary systems
to deliver quality at scale
68 3.1 The meaning of ‘quality’ and its vital role in pre-primary education
70 3.2 Navigating key challenges with ensuring quality in the universal pre-primary agenda
3.2.1 Education systems are not supplying sufficient numbers of capable pre-primary teachers
3.2.2 Pre-primary teachers need stronger support
3.2.3 Governments face tough choices on qualifications, training and pupil-teacher ratios
3.2.4 An interim workforce strategy can be used to lower pupil-teacher ratios while maintaining quality
3.2.5 Quality standards and regulatory mechanisms must be established and their implementation prioritized
3.2.6 Implementing a developmentally appropriate and child-centred curriculum is vital
3.2.7 Effective pre-primary systems should engage and support families and communities
90 3.3 Pre-primary systems require significant efforts and improvements
92 3.4 Win–win scenarios to advance both access and quality
96 Chapter 4 The first step towards SDG 4:
Significantly increasing financing for pre-primary education
98 4.1 Evaluating the persistence of underfunding
104 4.2 The distribution of funds across education levels is highly inequitable in low- and lower-middle-income countries
111 4.3 Failing to treat pre-primary education as a public good leads to over-reliance on household contributions
112 4.4 Weak governance and a lack of capacities in the subsector form a barrier to better financing
113 4.5 External financing for pre-primary education is extremely limited
116 4.6 Changing course to bolster pre-primary financing
4.6.1 Place pre-primary education on a firm footing by allocating a 10 per cent share of education budgets to the subsector
4.6.2 Use available resources more equitably and efficiently
4.6.3 Coordinate national and subnational budgets, while building accountability mechanisms and capacities for implementation
4.6.4 Increase aid to pre-primary education to at least 10 per cent of international education investments, catalysing and complementing public resources
4.6.5 Leverage non-state funding sources to expand access to affordable opportunities
4.6.6 Track expenditures to pinpoint areas needing the most improvement, while monitoring efficiency and financing gaps
124 4.7 Budgeting and planning for universal pre-primary coverage will advance the possibilities
128 Call to action
140 Notes on the figures
141 Endnotes
150 Annexes
158 Abbreviations and definitions
A World Ready To Learn
3
4
Section
Foreword
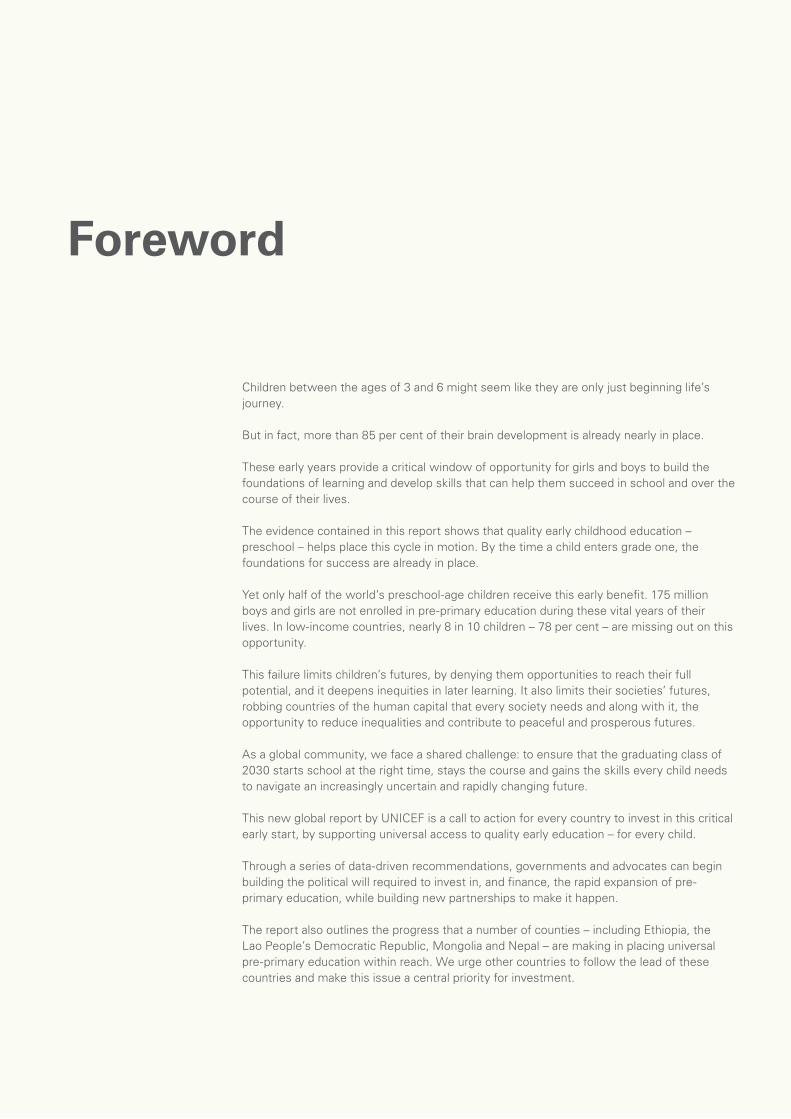
Children between the ages of 3 and 6 might seem like they are only just beginning life’s journey.
But in fact, more than 85 per cent of their brain development is already nearly in place.
These early years provide a critical window of opportunity for girls and boys to build the foundations of learning and develop skills that can help them succeed in school and over the course of their lives.
The evidence contained in this report shows that quality early childhood education – preschool – helps place this cycle in motion. By the time a child enters grade one, the foundations for success are already in place.
Yet only half of the world’s preschool-age children receive this early benefit. 175 million boys and girls are not enrolled in pre-primary education during these vital years of their lives. In low-income countries, nearly 8 in 10 children – 78 per cent – are missing out on this opportunity.
This failure limits children’s futures, by denying them opportunities to reach their full potential, and it deepens inequities in later learning. It also limits their societies’ futures, robbing countries of the human capital that every society needs and along with it, the opportunity to reduce inequalities and contribute to peaceful and prosperous futures.
As a global community, we face a shared challenge: to ensure that the graduating class of 2030 starts school at the right time, stays the course and gains the skills every child needs to navigate an increasingly uncertain and rapidly changing future.
This new global report by UNICEF is a call to action for every country to invest in this critical early start, by supporting universal access to quality early education – for every child.
Through a series of data-driven recommendations, governments and advocates can begin building the political will required to invest in, and finance, the rapid expansion of pre-primary education, while building new partnerships to make it happen.
The report also outlines the progress that a number of counties – including Ethiopia, the Lao People’s Democratic Republic, Mongolia and Nepal – are making in placing universal pre-primary education within reach. We urge other countries to follow the lead of these countries and make this issue a central priority for investment.
A World Ready To Learn
5
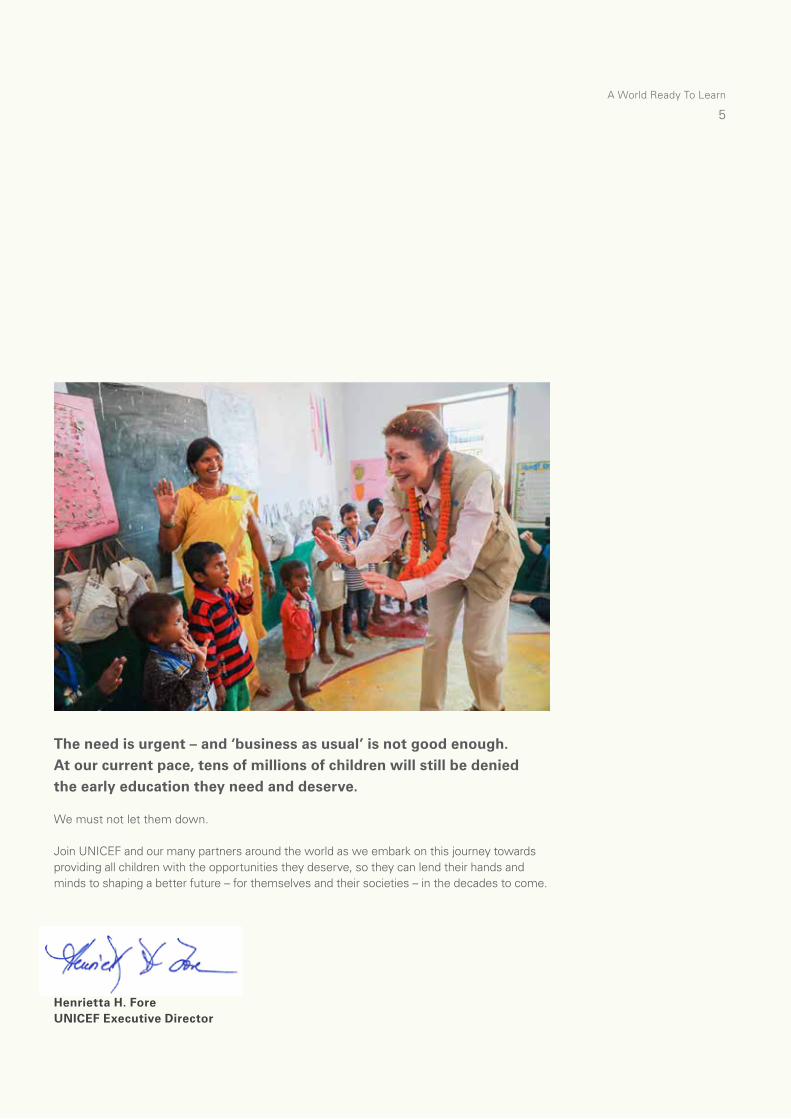
The need is urgent – and ‘business as usual’ is not good enough. At our current pace, tens of millions of children will still be denied the early education they need and deserve.
We must not let them down.
Join UNICEF and our many partners around the world as we embark on this journey towards providing all children with the opportunities they deserve, so they can lend their hands and minds to shaping a better future – for themselves and their societies – in the decades to come.
Henrietta H. Fore UNICEF Executive Director
A World Ready To Learn
5
6
Section
A young child’s brain is full of innate potential, and the early years offer an irreplaceable window of opportunity to set a path towards success in primary school and later in life. Quality early childhood education generates a positive sequence of learning – while lack of access to pre-primary education widens achievement gaps and restricts opportunities. Children who fall behind at a young age often never catch up with their peers, perpetuating cycles of underachievement and high dropout rates that continue to harm vulnerable children into their youth.1
Today, 50 per cent of pre-primary-age children around the world – at least 175 million – are not enrolled during these crucial years in pre-primary education. In low-income countries, only one in every five children has access to pre-primary education.2 Those who are the least likely to attend early childhood education programmes would benefit from them the most.
The Sustainable Development Goals (SDGs), and target 4.2 specifically, convey a clear objective that all girls and boys have access to quality early childhood development, care and pre-primary education so that they are ready for primary education. This global report confirms the importance of early childhood education in achieving SDG 4 and supports a bold challenge: Provide all children with at least one year of quality pre-primary education by 2030. The reasons for this aspiration are clear, as a solid body of evidence shows that the foundations for learning are largely built in the early years of life, before a child ever crosses the threshold of a primary school.
In recent proposals on how to achieve universal education at all levels, the International Commission on Financing Global Education Opportunity (the Education Commission), the World Development Report and the Global Education Monitoring Reports3,4,5 have all
This is a pivotal moment to spur national and global efforts to increase the investment, political will and capacity needed to expand equitable access to quality pre-primary programmes.
Introduction
emphasized that investments in early childhood education have positive returns not only for individual children but also for building more efficient and effective education systems. Yet, currently, both domestic financing and international aid invested in pre-primary education are poorly targeted and grossly inadequate. This represents one of the greatest missed opportunities to nurture the world’s human capital and help children reach their fullest potential.
Based on comprehensive, data-driven analysis, this report examines the current status of pre-primary education and offers a practical vision for expanding equitable access and improving quality. Recognizing that many countries, especially low- and lower-middle-income countries, are at the beginning of this journey, providing universal access to pre-primary education in all countries by 2030 requires a realistic yet bold approach.
A World Ready To Learn
7
Chapter 3 addresses the question: How can pre-primary education systems progressively reach all children and improve quality at the same time? It begins with a definition of ‘quality’ and underscores the importance of building pre-primary systems that can deliver quality at scale – with pre-primary teachers recognized as the driving force in achieving effective pre-primary programmes. It further explains how investing in quality as the system grows, not after, is a vital element in finding the ideal balance between expanding access and maintaining quality. A dramatic increase in the number of pre-primary educators is needed in low- and lower-middle-income countries, and interim strategies are proposed to fill this gap. This chapter also examines the inherent trade-offs facing governments in how they allocate current and new resources within the pre-primary education subsector to maximize benefits for children and their education systems as a whole.
Chapter 4 unpacks the critical issue of securing appropriate funding for pre-primary education. Governments and donors are currently failing to reflect the importance of pre-primary education in their budgetary priorities. Relative to other levels of education, this subsector is severely underfunded, particularly in low- and lower-middle-income countries. Shortfalls and stagnant financing trends in domestic and international funding are impeding progress towards universal access. This chapter shows how major increases in financing are achievable by coordinating and leveraging available financing, and strengthening the governance and accountability of the pre-primary subsector.
In the concluding section, the report presents an agenda for action by governments, donors and partners – and offers concrete recommendations for accelerating progress and making quality universal pre-primary education a reality for every child.
Chapter 1 outlines the reasons why quality pre-primary education opportunities should be universal. Investments in early childhood education bring returns that far exceed their initial costs, yielding multiple benefits for children, education systems and societies at large. Access to pre-primary education has the greatest impact in low- and lower-middle-income countries, and for the most disadvantaged children. However, given the slow and uneven progress across countries, a ‘business as usual’ approach will not fulfil the promise of universal pre-primary education. Unless progress towards achieving this goal is prioritized and accelerated, particularly among the countries farthest behind, we will fail to meet the universal SDG target and reap its benefits.
Chapter 2 presents the case for a ‘progressive universalist’ approach to the expansion of pre-primary education, as outlined by the Education Commission. It highlights a central concept followed through in this report: Disadvantaged children must gain at least as much as their better-off peers at each step of the process in order for universal pre-primary education to be achievable. Countries face many challenges as they strive to promote equity and access, but pathways to overcome them are also within reach. There are promising approaches and lessons learned to scale up access by leveraging the complex landscape of pre-primary provision. In all of these efforts, political leadership to make pre-primary education a priority within education sector policies and plans is vital.
8
SectionIntroduction
Pre-primary education: Key definitions and principal sources of data
In reference to the ‘pre-primary’ level, this report applies the International Standard Classification of Education (ISCED) definition.6 Under ISCED level 0, pre-primary education programmes are intentionally designed to include educational content for children aged 3 years up to the start of primary education, often around age 6.
Pre-primary programmes typically employ a holistic approach to introducing young children to organized instruction outside the family context, aiming to support children’s cognitive, physical, social and emotional development. They also help children develop many of the skills they need for academic readiness and entry into primary education.
Pre-primary education is an integral component of early
childhood development, which refers to all the essential policies and programmes required to support the healthy development of children from birth to 8 years of age, including health, nutrition, protection, early learning opportunities and responsive caregiving.7 This report focuses squarely on a slice of this big picture – specifically, pre-primary education.
Five sources of data underpin much of the analysis presented in the report:
· The Multiple Indicator Cluster Surveys (MICS), an international household survey programme developed by UNICEF. MICS is designed to collect statistically sound, internationally comparable estimates related to 130 different indicators to assess the situation of children, women and men. MICS includes a standard module on early childhood development.8
· Demographic and Health Surveys (DHS), which collect and disseminate accurate, nationally representative data on health and population in developing countries, through the surveys that may include the early childhood development module in data collection.
· The UNESCO Institute for Statistics (UIS) online database (http://data.uis.unesco.org), which provides internationally comparable statistics on education, among other fields, with a number of key indicators focused on pre-primary education.
· Systems Approach for Better Education Results
– Early Childhood Development (SABER-ECD) –, one of the domains within the World Bank SABER initiative, which is designed to provide comparable and comprehensive assessments of country policies in the area of ECD, including a number of key indicators on pre-primary education.
· As part of the International Development Statistics online databases, the Development Assistance Committee (DAC) databases provide comprehensive data on the volume, origin and types of aid and other resource flows. They include aggregate data by recipient and by sector, including education. The Creditor Reporting System (CRS) provides detailed information on individual aid activities, such as sectors, countries and project descriptions.
Across these data sets, two terms are used consistently: early childhood education, per MICS/DHS data sets – as in attendance in early childhood education, or the percentage of children aged 36–59 months who are currently attending any organized early learning or early childhood education programme – and pre-primary education, per UIS.stat and SABER – as in pre-primary education gross enrolment ratio (GER) or the total enrolment, regardless of age, expressed as a percentage of the population in the official age group corresponding to the pre-primary level of education.
In specific cases, these terms are used to correspond to
the source of the data they refer to; otherwise, they are
used interchangeably for readability to mean organized
learning programmes for children aged 3 years and up to
the start of primary education.
A World Ready To Learn
9
10
Why focus on universal pre-primary education?
Why focus on universal pre-primary education?
Chapter 1
A World Ready To Learn
11
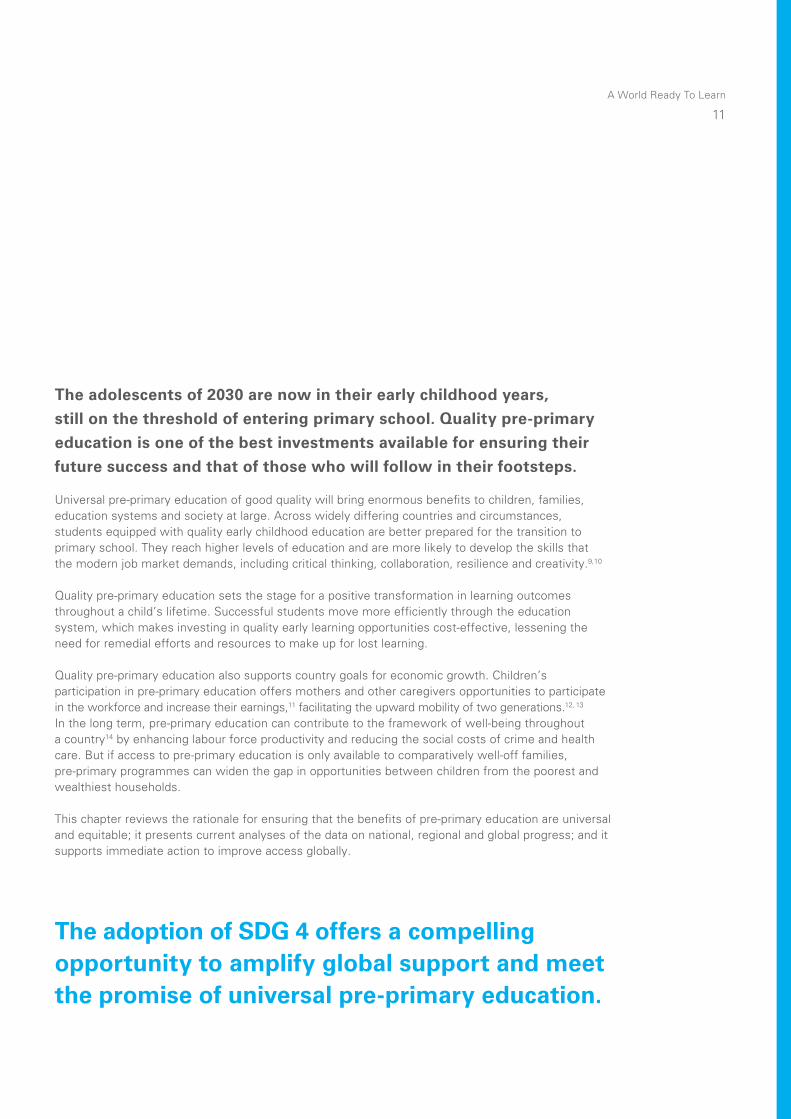
The adoption of SDG 4 offers a compelling opportunity to amplify global support and meet the promise of universal pre-primary education.
The adolescents of 2030 are now in their early childhood years,
still on the threshold of entering primary school. Quality pre-primary
education is one of the best investments available for ensuring their
future success and that of those who will follow in their footsteps.
Universal pre-primary education of good quality will bring enormous benefits to children, families, education systems and society at large. Across widely differing countries and circumstances, students equipped with quality early childhood education are better prepared for the transition to primary school. They reach higher levels of education and are more likely to develop the skills that the modern job market demands, including critical thinking, collaboration, resilience and creativity.9,10
Quality pre-primary education sets the stage for a positive transformation in learning outcomes throughout a child’s lifetime. Successful students move more efficiently through the education system, which makes investing in quality early learning opportunities cost-effective, lessening the need for remedial efforts and resources to make up for lost learning.
Quality pre-primary education also supports country goals for economic growth. Children’s participation in pre-primary education offers mothers and other caregivers opportunities to participate in the workforce and increase their earnings,11 facilitating the upward mobility of two generations.12, 13
In the long term, pre-primary education can contribute to the framework of well-being throughout a country14 by enhancing labour force productivity and reducing the social costs of crime and health care. But if access to pre-primary education is only available to comparatively well-off families, pre-primary programmes can widen the gap in opportunities between children from the poorest and wealthiest households.
This chapter reviews the rationale for ensuring that the benefits of pre-primary education are universal and equitable; it presents current analyses of the data on national, regional and global progress; and it supports immediate action to improve access globally.
12
Why focus on universal pre-primary education?
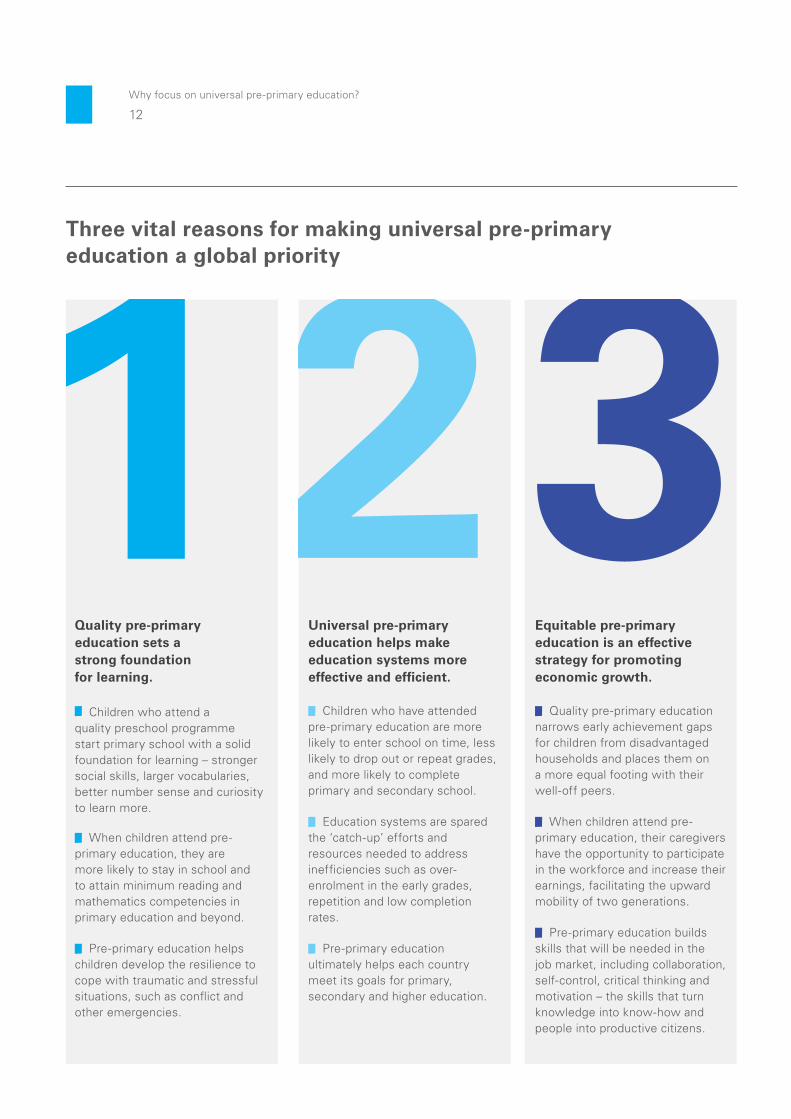
Quality pre-primary education sets a strong foundation for learning.
Children who attend a quality preschool programme start primary school with a solid foundation for learning – stronger social skills, larger vocabularies, better number sense and curiosity to learn more.
When children attend pre-primary education, they are more likely to stay in school and to attain minimum reading and mathematics competencies in primary education and beyond.
Pre-primary education helps children develop the resilience to cope with traumatic and stressful situations, such as conflict and other emergencies.
Universal pre-primary education helps make education systems more effective and efficient.
Children who have attended pre-primary education are more likely to enter school on time, less likely to drop out or repeat grades, and more likely to complete primary and secondary school.
Education systems are spared the ‘catch-up’ efforts and resources needed to address inefficiencies such as over-enrolment in the early grades, repetition and low completion rates.
Pre-primary education ultimately helps each country meet its goals for primary, secondary and higher education.
Equitable pre-primary education is an effective strategy for promoting economic growth.
Quality pre-primary education narrows early achievement gaps for children from disadvantaged households and places them on a more equal footing with their well-off peers.
When children attend pre-primary education, their caregivers have the opportunity to participate in the workforce and increase their earnings, facilitating the upward mobility of two generations.
Pre-primary education builds skills that will be needed in the job market, including collaboration, self-control, critical thinking and motivation – the skills that turn knowledge into know-how and people into productive citizens.
Three vital reasons for making universal pre-primary education a global priority
A World Ready To Learn
13
1.1.1 Starting school ready to learn and succeed
The world is facing a learning crisis: While millions of new children have entered education systems, many of them cannot read, write or do basic mathematics, even after several years of primary school. Recent estimates suggest more than 610 million children and adolescents are not achieving basic proficiency.19 This learning crisis has its roots in children’s earliest years, when failure to invest in quality early childhood education results in children starting school already behind in a host of developmental domains.20
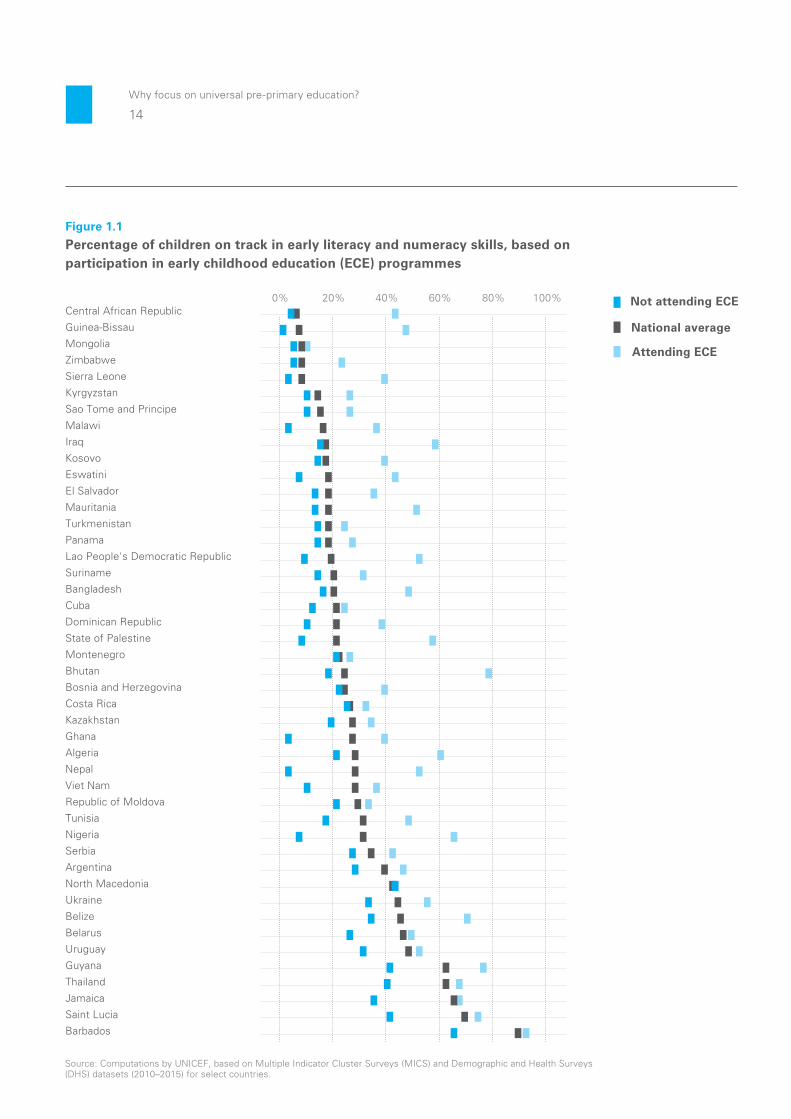
Figure 1.1 illustrates differences in children’s outcomes based on their attendance in early childhood education programmes across 45 countries. In Nigeria, for example, 66 per cent of children attending early childhood education programmes are on track in the early literacy and numeracy domain, compared to less than 8 per cent of children not attending such programmes.
Across 48 countries with available data, multivariate regressions demonstrate that higher national attendance
rates in early childhood education programmes are linked to a significantly higher percentage of children who are developmentally on track both in overall development and in emergent literacy and numeracy skills specifically, regardless of their countries’ income status or overall levels of support for learning at home.21 In fact, across these countries, 47 per cent of children who attend early childhood education programmes show appropriate developmental progress in the early literacy and numeracy domain, compared to only 20 per cent among children not attending an early childhood education programme.22
In-depth analysis in individual countries demonstrates even better the robust association between attendance in early childhood education programmes and developmental outcomes. In Nepal, for example, children who attended early childhood education programmes were 3 times more likely to be developmentally on track than their peers – and 17 times more likely to be on track for foundational early literacy and numeracy skills – even after controlling for numerous socio-economic variables.23
Applying the MICS data set to UNICEF’s analysis for
this report
Data on the developmental status of children aged 36–59 months are collected through MICS, which have a standard module on early childhood development and measure the developmental status of children in four domains – namely, literacy-numeracy, physical, social-emotional and learning. Domain-specific scores reflect the percentage of children who are developmentally on track in respective developmental areas, while the overall Early Childhood
Development Index (ECDI) score reflects the percentage of children who are developmentally on track in at least three of these four domains.17
While there is a broad range of research documenting the benefits of pre-primary education,18 this report offers analysis of a large number of national data sets compiled through the MICS and presented here for the first time. These data have made it possible to compare the outcomes for millions of children who have attended early childhood education programmes and those who have not.
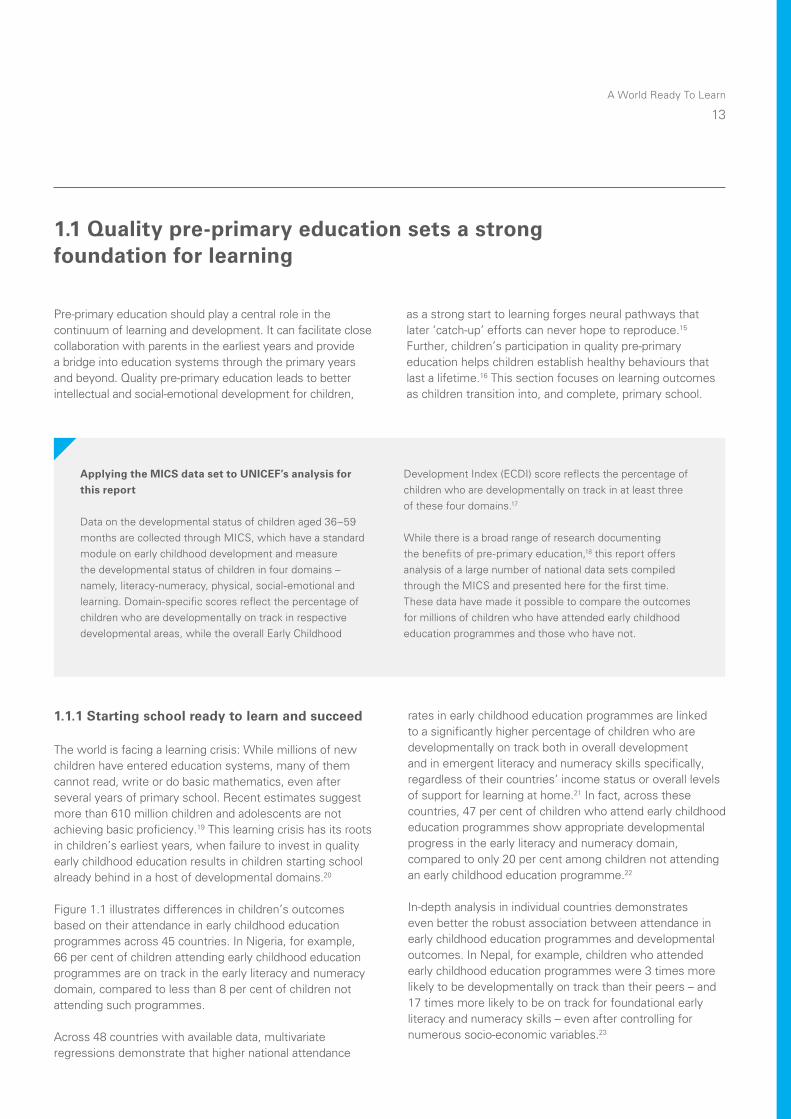
Pre-primary education should play a central role in the continuum of learning and development. It can facilitate close collaboration with parents in the earliest years and provide a bridge into education systems through the primary years and beyond. Quality pre-primary education leads to better intellectual and social-emotional development for children,
as a strong start to learning forges neural pathways that later ‘catch-up’ efforts can never hope to reproduce.15 Further, children’s participation in quality pre-primary education helps children establish healthy behaviours that last a lifetime.16 This section focuses on learning outcomes as children transition into, and complete, primary school.
1.1 Quality pre-primary education sets a strong foundation for learning
14
Why focus on universal pre-primary education?
Figure 1.1
Percentage of children on track in early literacy and numeracy skills, based on participation in early childhood education (ECE) programmes
Source: Computations by UNICEF, based on Multiple Indicator Cluster Surveys (MICS) and Demographic and Health Surveys (DHS) datasets (2010–2015) for select countries.
Barbados
Saint Lucia
Jamaica
Thailand
Guyana
Uruguay
Belarus
Belize
Ukraine
North Macedonia
Argentina
Serbia
Nigeria
Tunisia
Republic of Moldova
Viet Nam
Nepal
Algeria
Ghana
Kazakhstan
Costa Rica
Bosnia and Herzegovina
Bhutan
Montenegro
State of Palestine
Dominican Republic
Cuba
Bangladesh
Suriname
Lao People's Democratic Republic
Panama
Turkmenistan
Mauritania
El Salvador
Eswatini
Kosovo
Iraq
Malawi
Sao Tome and Principe
Kyrgyzstan
Sierra Leone
Zimbabwe
Mongolia
Guinea-Bissau
Central African Republic
Attending ECE
Not attending ECE
National average
0% 20% 40% 60% 80% 100%
A World Ready To Learn
15
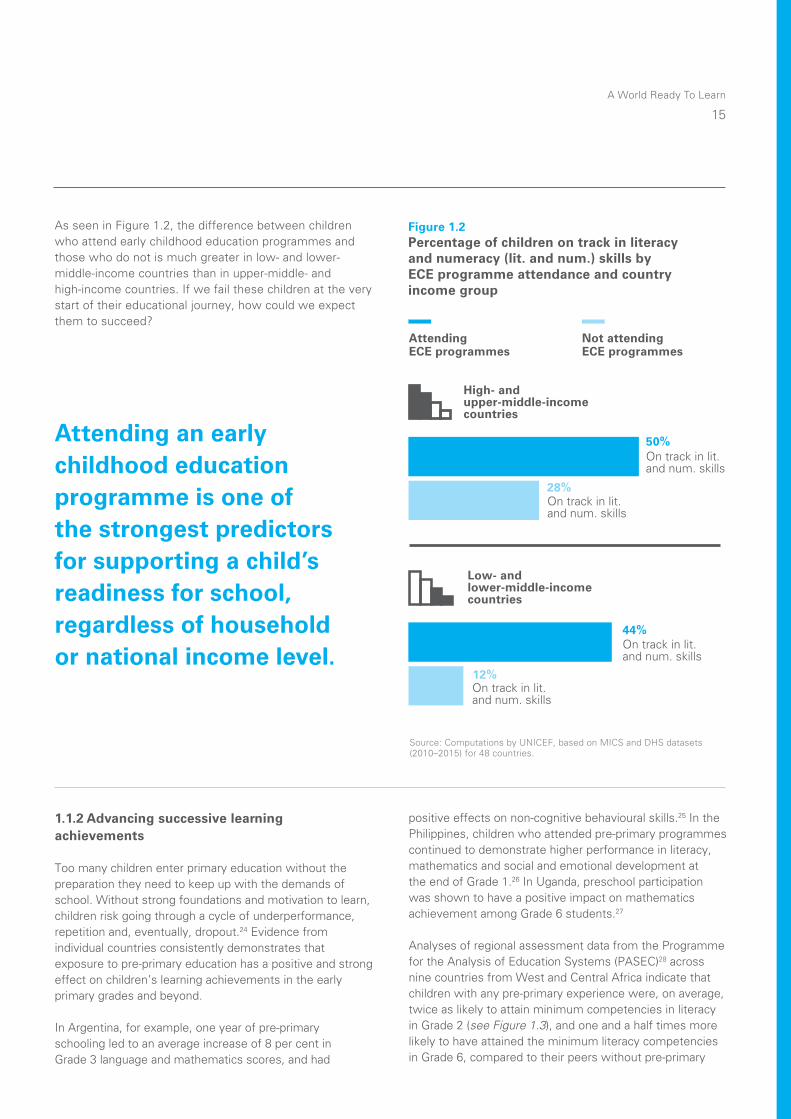
As seen in Figure 1.2, the difference between children who attend early childhood education programmes and those who do not is much greater in low- and lower-middle-income countries than in upper-middle- and high-income countries. If we fail these children at the very start of their educational journey, how could we expect them to succeed?
Attending an early childhood education programme is one of the strongest predictors for supporting a child’s readiness for school, regardless of household or national income level.
1.1.2 Advancing successive learning achievements
Too many children enter primary education without the preparation they need to keep up with the demands of school. Without strong foundations and motivation to learn, children risk going through a cycle of underperformance, repetition and, eventually, dropout.24 Evidence from individual countries consistently demonstrates that exposure to pre-primary education has a positive and strong effect on children’s learning achievements in the early primary grades and beyond.
In Argentina, for example, one year of pre-primary schooling led to an average increase of 8 per cent in Grade 3 language and mathematics scores, and had
positive effects on non-cognitive behavioural skills.25 In the Philippines, children who attended pre-primary programmes continued to demonstrate higher performance in literacy, mathematics and social and emotional development at the end of Grade 1.26 In Uganda, preschool participation was shown to have a positive impact on mathematics achievement among Grade 6 students.27
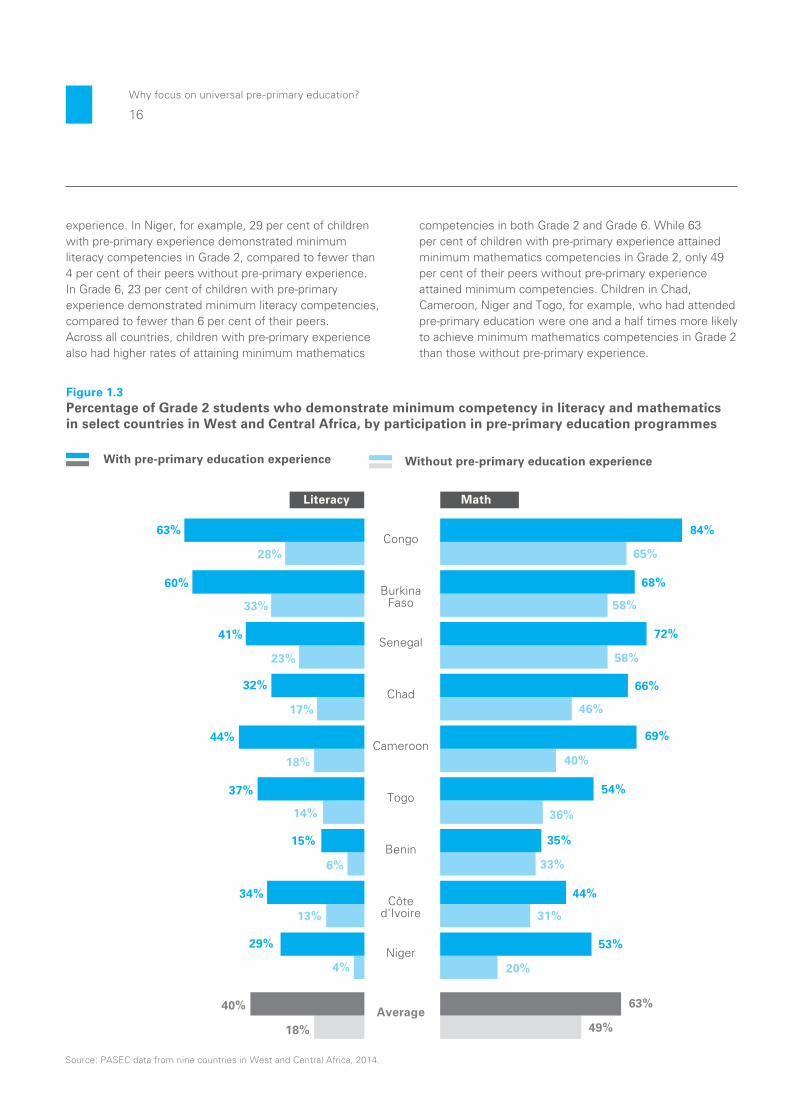
Analyses of regional assessment data from the Programme for the Analysis of Education Systems (PASEC)28 across nine countries from West and Central Africa indicate that children with any pre-primary experience were, on average, twice as likely to attain minimum competencies in literacy in Grade 2 (see Figure 1.3), and one and a half times more likely to have attained the minimum literacy competencies in Grade 6, compared to their peers without pre-primary
High- and upper-middle-income countries
Source: Computations by UNICEF, based on MICS and DHS datasets (2010–2015) for 48 countries.
On track in lit. and num. skills
On track in lit. and num. skills
On track in lit. and num. skills
On track in lit. and num. skills
50%
28%
44%
12%
Figure 1.2Percentage of children on track in literacy and numeracy (lit. and num.) skills by ECE programme attendance and country income group
Low- and lower-middle-income countries
Not attending ECE programmes
Attending ECE programmes
16
Why focus on universal pre-primary education?
experience. In Niger, for example, 29 per cent of children with pre-primary experience demonstrated minimum literacy competencies in Grade 2, compared to fewer than 4 per cent of their peers without pre-primary experience. In Grade 6, 23 per cent of children with pre-primary experience demonstrated minimum literacy competencies, compared to fewer than 6 per cent of their peers.Across all countries, children with pre-primary experience also had higher rates of attaining minimum mathematics
competencies in both Grade 2 and Grade 6. While 63 per cent of children with pre-primary experience attained minimum mathematics competencies in Grade 2, only 49 per cent of their peers without pre-primary experience attained minimum competencies. Children in Chad, Cameroon, Niger and Togo, for example, who had attended pre-primary education were one and a half times more likely to achieve minimum mathematics competencies in Grade 2 than those without pre-primary experience.
Average
Niger
Côted'Ivoire
Benin
Togo
Cameroon
Chad
Senegal
BurkinaFaso
Congo
40%
18%
63%
60%
41%
32%
44%
37%
15%
34%
29%
28%
33%
23%
17%
18%
14%
6%
13%
4%
49%
63%
84%
68%
72%
66%
69%
54%
35%
44%
53%
65%
58%
58%
46%
40%
36%
33%
31%
20%
With pre-primary education experience Without pre-primary education experience
Figure 1.3Percentage of Grade 2 students who demonstrate minimum competency in literacy and mathematics in select countries in West and Central Africa, by participation in pre-primary education programmes
Source: PASEC data from nine countries in West and Central Africa, 2014.
Literacy Math
A World Ready To Learn
17
Regression analysis conducted using learning outcomes data across 58 countries further supports the powerful association between pre-primary enrolment rates and learning proficiency levels across counties. In countries where more children attend pre-primary programmes, significantly more children attain minimum competencies in both reading and mathematics by the time they finish primary school. A 10 per cent increase in access to pre-primary education is associated with, on average, a 5 per cent increase in the proportion of children in that
country who achieve minimum mathematics and reading competencies by the end of primary school.
In other words, for a prototypical country, increasing national pre-primary enrolment levels from 25 per cent to 75 per cent is associated with a 27 per cent increase in the proportion of children meeting minimum mathematics competencies in primary school and a 25 per cent increase in the proportion of children meeting minimum reading competencies.29
In countries where more children attend pre-primary programmes, more children attain minimum competencies in reading and mathematics by the end of primary school.
18
Why focus on universal pre-primary education?
100%
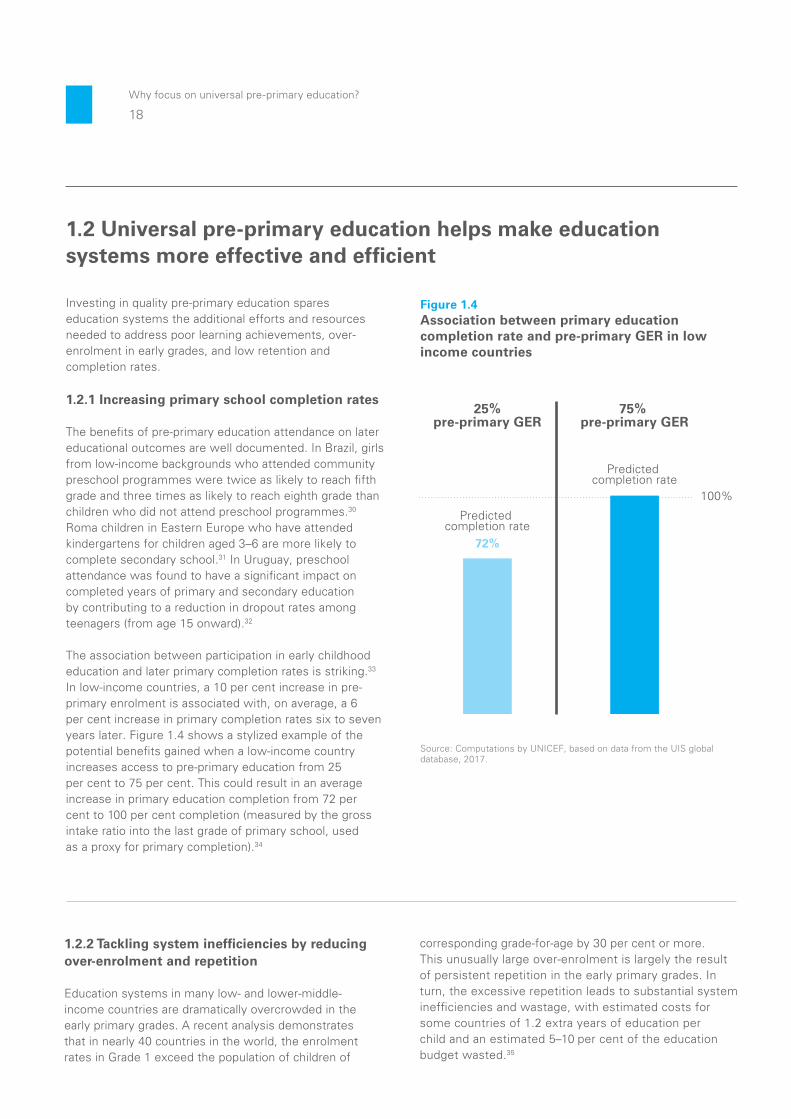
Figure 1.4Association between primary education completion rate and pre-primary GER in low income countries
25%pre-primary GER
Predicted completion rate
72%
75% pre-primary GER
Predicted completion rate
Source: Computations by UNICEF, based on data from the UIS global database, 2017.
1.2.2 Tackling system inefficiencies by reducing over-enrolment and repetition
Education systems in many low- and lower-middle-income countries are dramatically overcrowded in the early primary grades. A recent analysis demonstrates that in nearly 40 countries in the world, the enrolment rates in Grade 1 exceed the population of children of
corresponding grade-for-age by 30 per cent or more. This unusually large over-enrolment is largely the result of persistent repetition in the early primary grades. In turn, the excessive repetition leads to substantial system inefficiencies and wastage, with estimated costs for some countries of 1.2 extra years of education per child and an estimated 5–10 per cent of the education budget wasted.35
Investing in quality pre-primary education spares education systems the additional efforts and resources needed to address poor learning achievements, over-enrolment in early grades, and low retention and completion rates.
1.2.1 Increasing primary school completion rates
The benefits of pre-primary education attendance on later educational outcomes are well documented. In Brazil, girls from low-income backgrounds who attended community preschool programmes were twice as likely to reach fifth grade and three times as likely to reach eighth grade than children who did not attend preschool programmes.30 Roma children in Eastern Europe who have attended kindergartens for children aged 3–6 are more likely to complete secondary school.31 In Uruguay, preschool attendance was found to have a significant impact on completed years of primary and secondary education by contributing to a reduction in dropout rates among teenagers (from age 15 onward).32
The association between participation in early childhood education and later primary completion rates is striking.33 In low-income countries, a 10 per cent increase in pre-primary enrolment is associated with, on average, a 6 per cent increase in primary completion rates six to seven years later. Figure 1.4 shows a stylized example of the potential benefits gained when a low-income country increases access to pre-primary education from 25 per cent to 75 per cent. This could result in an average increase in primary education completion from 72 per cent to 100 per cent completion (measured by the gross intake ratio into the last grade of primary school, used as a proxy for primary completion).34
1.2 Universal pre-primary education helps make education systems more effective and efficient
A World Ready To Learn
19
Increasing access to pre-primary education could help significantly improve over-enrolment in early grades and enhance system efficiency by decreasing dropout and repetition rates in primary school. If countries promote developmentally appropriate, child-centred pre-primary education with same-age peers, children can enter primary school at the right age, with better foundations, and have a greater likelihood of progressing through primary school efficiently, with less repetition and fewer dropouts.
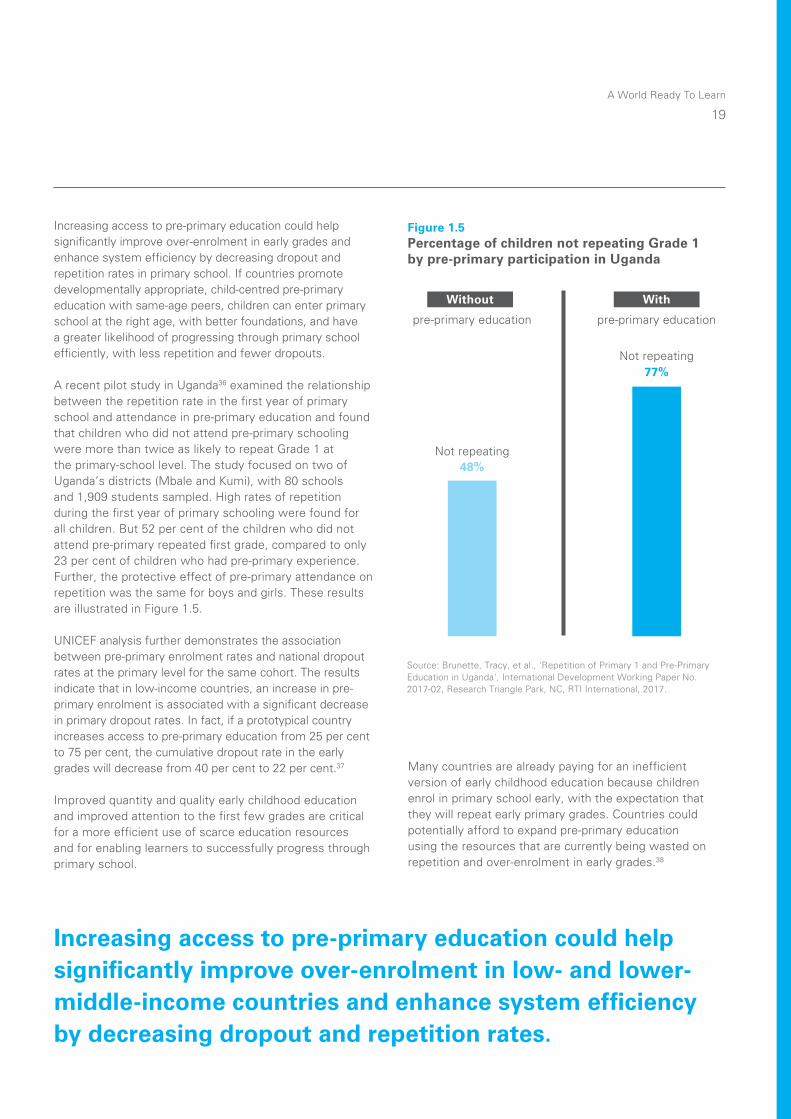
A recent pilot study in Uganda36 examined the relationship between the repetition rate in the first year of primary school and attendance in pre-primary education and found that children who did not attend pre-primary schooling were more than twice as likely to repeat Grade 1 at the primary-school level. The study focused on two of Uganda’s districts (Mbale and Kumi), with 80 schools and 1,909 students sampled. High rates of repetition during the first year of primary schooling were found for all children. But 52 per cent of the children who did not attend pre-primary repeated first grade, compared to only 23 per cent of children who had pre-primary experience. Further, the protective effect of pre-primary attendance on repetition was the same for boys and girls. These results are illustrated in Figure 1.5.
UNICEF analysis further demonstrates the association between pre-primary enrolment rates and national dropout rates at the primary level for the same cohort. The results indicate that in low-income countries, an increase in pre-primary enrolment is associated with a significant decrease in primary dropout rates. In fact, if a prototypical country increases access to pre-primary education from 25 per cent to 75 per cent, the cumulative dropout rate in the early grades will decrease from 40 per cent to 22 per cent.37
Improved quantity and quality early childhood education and improved attention to the first few grades are critical for a more efficient use of scarce education resources and for enabling learners to successfully progress through primary school.
Increasing access to pre-primary education could help significantly improve over-enrolment in low- and lower-middle-income countries and enhance system efficiency by decreasing dropout and repetition rates.
Figure 1.5Percentage of children not repeating Grade 1by pre-primary participation in Uganda
Source: Brunette, Tracy, et al., 'Repetition of Primary 1 and Pre-Primary Education in Uganda', International Development Working Paper No. 2017-02, Research Triangle Park, NC, RTI International, 2017.
Not repeating
pre-primary education
With
Not repeating
pre-primary education
Without
77%
48%
Many countries are already paying for an inefficient version of early childhood education because children enrol in primary school early, with the expectation that they will repeat early primary grades. Countries could potentially afford to expand pre-primary education using the resources that are currently being wasted on repetition and over-enrolment in early grades.38
20
Why focus on universal pre-primary education?
The association between participation in early childhood education and later educational attainment has already been discussed with respect to primary school persistence and completion. Emerging evidence is also beginning to link pre-primary education with secondary education outcomes. For example, using data obtained from the Young Lives Longitudinal Survey in Ethiopia, a recent analysis demonstrated that urban preschool children were 26 per cent more likely to complete secondary education at the proper age than their non-preschool counterparts.43 Results from a recent study across 12 countries showed that in 11 of the 12 countries, individuals who participated in an early childhood education programme had the tendency to stay in school 0.2–1.8 years longer than peers who did not. The average across countries was 0.9 years. These results control for differences in social origin, gender and age.44
Overall, the analysis demonstrates that the provision of funding for pre-primary education should not be seen as a loss of support for other subsectors of education; it should be embraced as a core strategy for strengthening the entire education system.
As attendance in pre-primary education helps children persist in their schooling and reduces the costs needed to address poor results, increasing funds for pre-primary education should be viewed as a core strategy to strengthen the entire education system.
1.2.3 Investing in the early years yields strong returns for all levels of education
The Education Commission’s report published in 2016 identifies the provision of universal pre-primary education as an essential foundation and powerful intervention to improve learning outcomes throughout primary schooling and into the secondary level (see Figure 1.6).39 While not comprehensive, the analysis in Figure 1.6 indicates the breadth of effective measures and their estimated cost to transform education outcomes – ranging from giving out micronutrients to providing students with cash incentives to investment in pre-primary education. It is clear that if pre-primary education were widely implemented, it could catalyse change and greatly improve education outcomes in developing countries.
Evidence from a wide range of studies supports the notion that investment in early childhood education programmes can bring returns that far exceed their cost, 40,41
with the highest returns on investment occurring in the period between birth and 5 years of age, especially for disadvantaged children.42

A World Ready To Learn
21
Figure 1.6Highly effective practices to increase access and learning outcomes in education
Cost
Interventions cost 0% to 3% of standard (basic) costsInterventions cost 4% to 9% of standard costsInterventions cost 10% or more of standard costs
Source: International Commission on Financing Global Education Opportunity, The Learning Generation: Investing in education for a changing world, Education Commission, 2016.
Impact
30%
Preschool (learningeffect by Grade 5)
Student performance incentives
New school in village
Mother-tongue/bilingual instruction
Better teaching methods
Community-based monitoring
School feeding
Remedial education for those behind
Cut waste – double learning time
Computer-assisted learning and materials
Malaria treatment (in high malaria areas)
Cash transfers
Washrooms and water
Group by ability
Provide info to teachers on student progress
User fee reduction
Providing instructional materials
Micronutrient intervention
Teacher performance incentives
Train school management
25%
21%
15%
13%
12%
11%
10%
7%
6%
6%
6%
4%
4%
4%
4%
4%
3%
2%
2%
2%
Combined impacts of increased access and learning (assuming a baseline value
of 50% enrolment and 50% learning)
22
Why focus on universal pre-primary education?
1.3 Equitable pre-primary education is an effective strategy for promoting economic growth
Quality pre-primary programmes can reduce the achievement gaps caused by poverty and help the most vulnerable children keep up with their peers.
achievement level that their wealthier counterparts with educated parents reach by age 8.45
Quality pre-primary programmes, however, can reduce the achievement gaps caused by poverty or other social factors, and help the most vulnerable children keep up with their peers, giving them a fairer chance in their educational journey.46 In Indonesia, a study comparing the effects of a village playgroup programme for children aged 4–6 on learning outcomes demonstrated a decrease in the achievement gap between richer and poorer children – particularly in social competence, communication and general knowledge, as well as pro-social behaviour.47 Studies have also found that early education programmes with greater enrolment and duration significantly increase equality of opportunity, as measured by a lower dependence of eighth-grade students’ test scores on their family background.48
When programmes are well targeted, universal quality pre-primary education provides countries with a preventive tool to address a host of deep-rooted issues and inequities, including those related to poverty. This section discusses its effect on closing learning achievement gaps and the long-term benefits for a country’s economic well-being.
1.3.1 Reducing achievement gaps and inequities
Learning inequities are visible before children start school, and often widen during the school years. Shaped particularly by disparities in wealth, these inequities in learning start early in life. In rural India, for example, by age 7 an achievement gap is already evident between poorer children who are first-generation learners and their richer counterparts who have educated parents. The combined effect of socio-economic status and gender means that poor girls with parents who did not attend school take until the age of 11 to reach the same learning
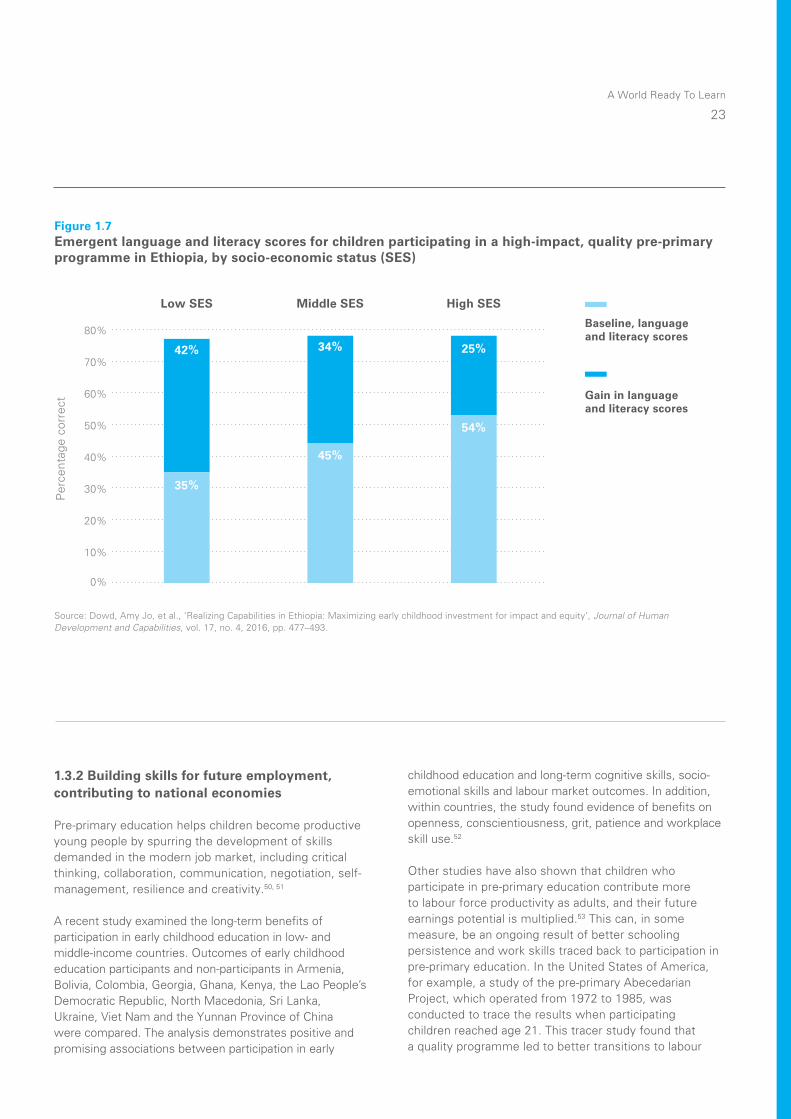
In Ethiopia, Save the Children implemented a high-impact, quality pre-primary programme focused on improving emergent literacy and mathematics skills. Children with the lowest socio-economic status in the programme made almost double the gains in their language and literacy scores as their better-off peers,
practically closing the learning gaps between these children by the start of Grade 1.49 Figure 1.7 illustrates the baseline differences and the gains in school readiness made over the course of a one-year intervention as measured by an International Development and Early Learning Assessment (IDELA) among children.
A World Ready To Learn
23
1.3.2 Building skills for future employment, contributing to national economies
Pre-primary education helps children become productive young people by spurring the development of skills demanded in the modern job market, including critical thinking, collaboration, communication, negotiation, self-management, resilience and creativity.50, 51
A recent study examined the long-term benefits of participation in early childhood education in low- and middle-income countries. Outcomes of early childhood education participants and non-participants in Armenia, Bolivia, Colombia, Georgia, Ghana, Kenya, the Lao People’s Democratic Republic, North Macedonia, Sri Lanka, Ukraine, Viet Nam and the Yunnan Province of China were compared. The analysis demonstrates positive and promising associations between participation in early
childhood education and long-term cognitive skills, socio-emotional skills and labour market outcomes. In addition, within countries, the study found evidence of benefits on openness, conscientiousness, grit, patience and workplace skill use.52
Other studies have also shown that children who participate in pre-primary education contribute more to labour force productivity as adults, and their future earnings potential is multiplied.53 This can, in some measure, be an ongoing result of better schooling persistence and work skills traced back to participation in pre-primary education. In the United States of America, for example, a study of the pre-primary Abecedarian Project, which operated from 1972 to 1985, was conducted to trace the results when participating children reached age 21. This tracer study found that a quality programme led to better transitions to labour
Source: Dowd, Amy Jo, et al., ‘Realizing Capabilities in Ethiopia: Maximizing early childhood investment for impact and equity’, Journal of Human Development and Capabilities, vol. 17, no. 4, 2016, pp. 477–493.
Figure 1.7Emergent language and literacy scores for children participating in a high-impact, quality pre-primary programme in Ethiopia, by socio-economic status (SES)
0%
10%
20%
30%
40%
50%
60%
70%
80%
Per
cent
age
corr
ect
42%
35%
Low SES
34%
45%
Middle SES
25%
54%
High SES
Baseline, language and literacy scores
Gain in language and literacy scores
24
Why focus on universal pre-primary education?
markets, with a much higher percentage of pre-primary participants engaged in skilled jobs later in life (47 per cent vs. 27 per cent). The effects were helped, in part, by a much lower percentage of teenage parents (26 per cent vs. 45 per cent).54
Our economic future depends on providing the tools for upward mobility and building a highly educated, skilled workforce. Early childhood education is one of the most efficient ways to accomplish these goals. In fact, every dollar invested in quality pre-primary education and related services for disadvantaged children could bring an additional return of up to 10 cents every year throughout that child’s lifetime.55 This is due to increased school and career achievement, which in turn reduces the recurrent costs to governments and communities of responding to the health, crime, learning disabilities and other issues that result from early childhood neglect and a lack of early education opportunities.56
When children attend pre-primary education, their caregivers also have the opportunity to participate in the workforce and increase their earnings, facilitating the upward mobility of two generations. Women’s
The benefits of quality pre-primary education extend well beyond formal attainment of academic qualifications by individual children – they also support a country’s long-term goals for economic growth.
participation in the labour force, in particular, is strengthened by the existence of good pre-primary education programmes, increasing mothers’ opportunities to participate in income-generating activities. A World Bank study in Indonesia found that access to public preschool for two hours a day led to a 13.3 per cent increase in women’s participation in the workforce.57 Preschool attendance of the youngest child in the household has been demonstrated to increase the probability of the mother’s full-time employment as well as her weekly hours of employment.58
A further means of strengthening economic growth is the provision of teaching positions through the pre-primary education subsector. In low-income countries, for example, expanding pre-primary education can generate hundreds of thousands of new job opportunities for young people, women and men, and often offers one of the few job opportunities that may be available to women in many communities.59 Nonetheless, one aim of the expansion process should be to increase diversity in the workforce, which also includes increasing the percentage of male pre-primary educators. This will give young children the benefit of role modeling from both male and female professionals.
A World Ready To Learn
25
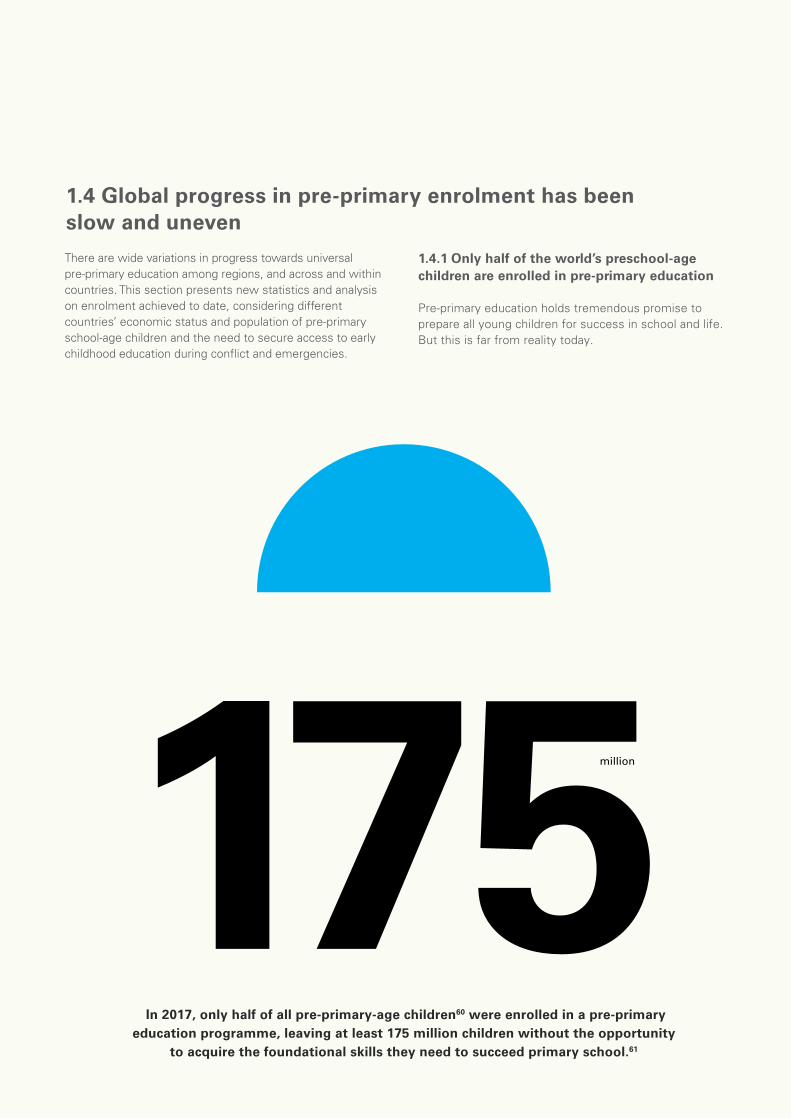
In 2017, only half of all pre-primary-age children60 were enrolled in a pre-primary education programme, leaving at least 175 million children without the opportunity
to acquire the foundational skills they need to succeed primary school.61
There are wide variations in progress towards universal pre-primary education among regions, and across and within countries. This section presents new statistics and analysis on enrolment achieved to date, considering different countries’ economic status and population of pre-primary school-age children and the need to secure access to early childhood education during conflict and emergencies.
1.4.1 Only half of the world’s preschool-age children are enrolled in pre-primary education
Pre-primary education holds tremendous promise to prepare all young children for success in school and life. But this is far from reality today.
1.4 Global progress in pre-primary enrolment has been slow and uneven
A World Ready To Learn
27
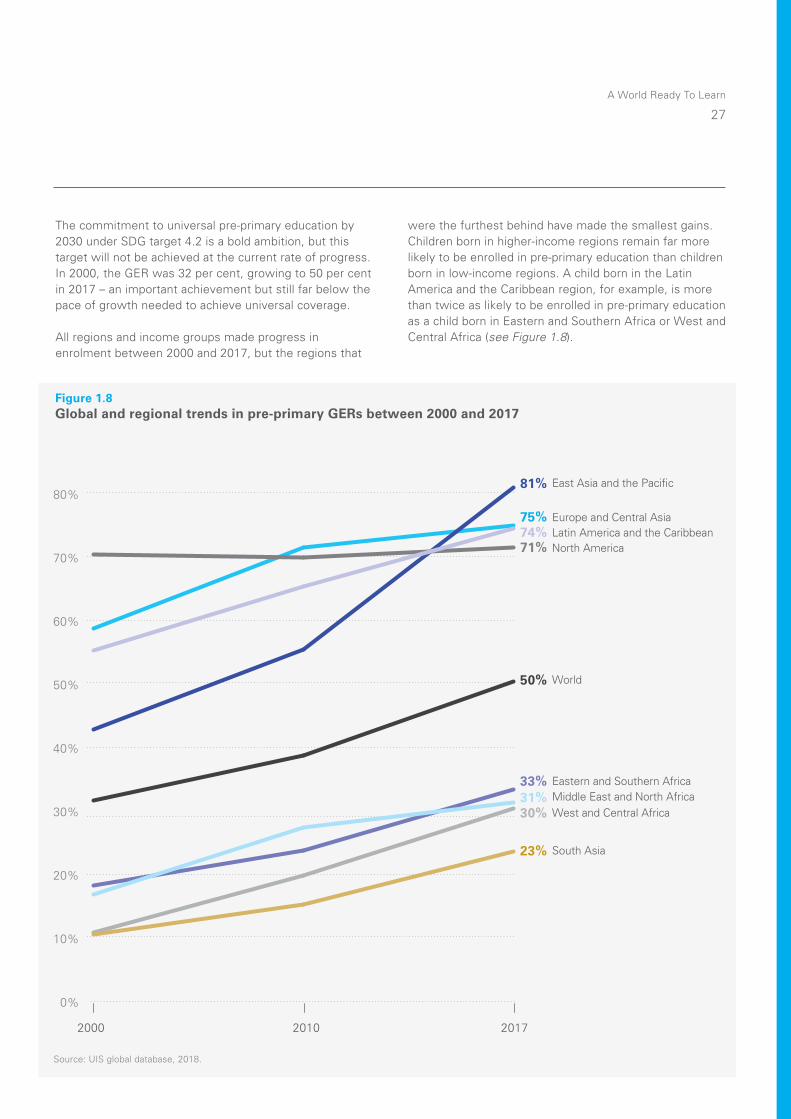
The commitment to universal pre-primary education by 2030 under SDG target 4.2 is a bold ambition, but this target will not be achieved at the current rate of progress. In 2000, the GER was 32 per cent, growing to 50 per cent in 2017 – an important achievement but still far below the pace of growth needed to achieve universal coverage.
All regions and income groups made progress in enrolment between 2000 and 2017, but the regions that
were the furthest behind have made the smallest gains. Children born in higher-income regions remain far more likely to be enrolled in pre-primary education than children born in low-income regions. A child born in the Latin America and the Caribbean region, for example, is more than twice as likely to be enrolled in pre-primary education as a child born in Eastern and Southern Africa or West and Central Africa (see Figure 1.8).
Figure 1.8Global and regional trends in pre-primary GERs between 2000 and 2017
Europe and Central Asia
West and Central Africa
South Asia
Eastern and Southern Africa
East Asia and the Pacific
North America
Middle East and North Africa
Latin America and the Caribbean
World
20%
10%
30%
50%
70%
40%
60%
80%
0%
20172000 2010
Source: UIS global database, 2018.
81%
75%74%71%
50%
33%31%30%
23%

28
Why focus on universal pre-primary education?
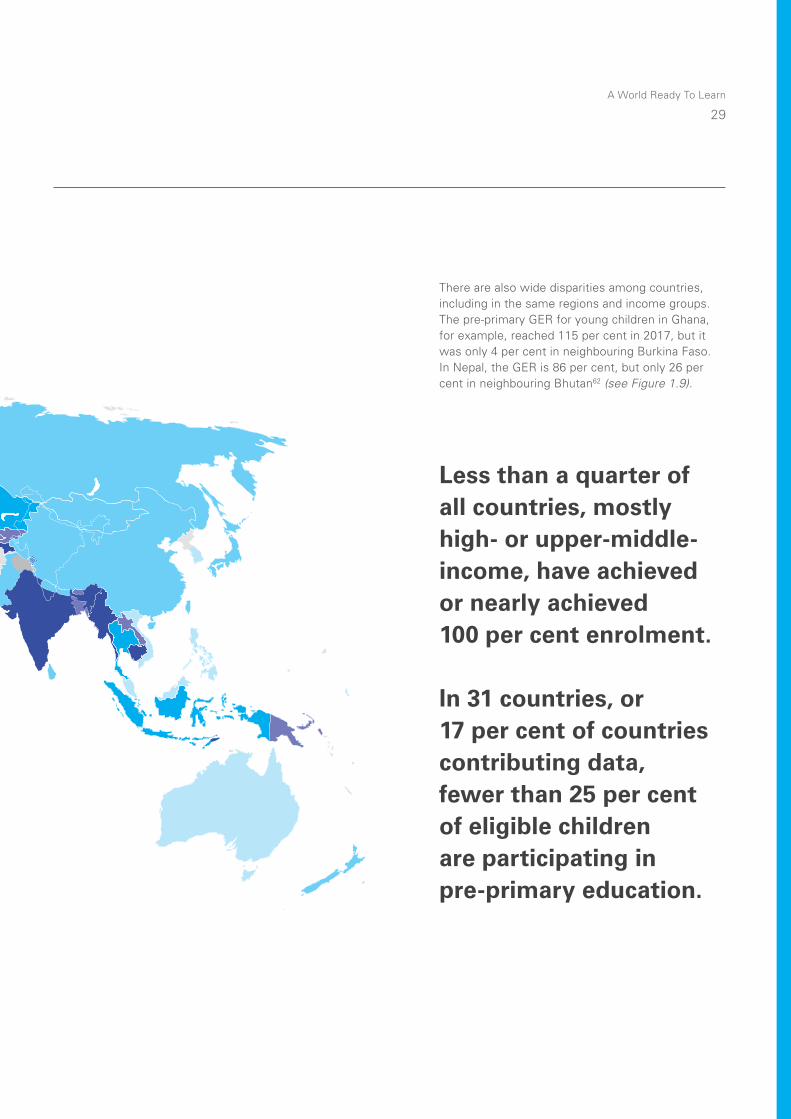
Figure 1.9Pre-primary gross enrolment ratios across countries
Note: This map does not reflect a position by UNICEF on the legal status of any country or territory or the delimitation of any frontiers. The dotted line represents approximately the Line of Control in Jammu and Kashmir agreed upon by India and Pakistan. The final status of Jammu and Kashmir has not yet been agreed upon by the parties. The final boundary between the Sudan and South Sudan has not yet been determined. The final status of the Abyei area has not yet been determined.
Source: UIS global database, 2018.
From 75% to 94.9% 95% and aboveFrom 25% to 49.9% From 50% to 74.9%Less than 25% No data
A World Ready To Learn
29
Less than a quarter of all countries, mostly high- or upper-middle-income, have achieved or nearly achieved 100 per cent enrolment.
In 31 countries, or 17 per cent of countries contributing data, fewer than 25 per cent of eligible children are participating in pre-primary education.
There are also wide disparities among countries, including in the same regions and income groups. The pre-primary GER for young children in Ghana, for example, reached 115 per cent in 2017, but it was only 4 per cent in neighbouring Burkina Faso. In Nepal, the GER is 86 per cent, but only 26 per cent in neighbouring Bhutan62 (see Figure 1.9).
Figure 1.9Pre-primary gross enrolment ratios across countries
Note: This map does not reflect a position by UNICEF on the legal status of any country or territory or the delimitation of any frontiers. The dotted line represents approximately the Line of Control in Jammu and Kashmir agreed upon by India and Pakistan. The final status of Jammu and Kashmir has not yet been agreed upon by the parties. The final boundary between the Sudan and South Sudan has not yet been determined. The final status of the Abyei area has not yet been determined.
Source: UIS global database, 2018.
From 75% to 94.9% 95% and aboveFrom 25% to 49.9% From 50% to 74.9%Less than 25% No data
30
Why focus on universal pre-primary education?
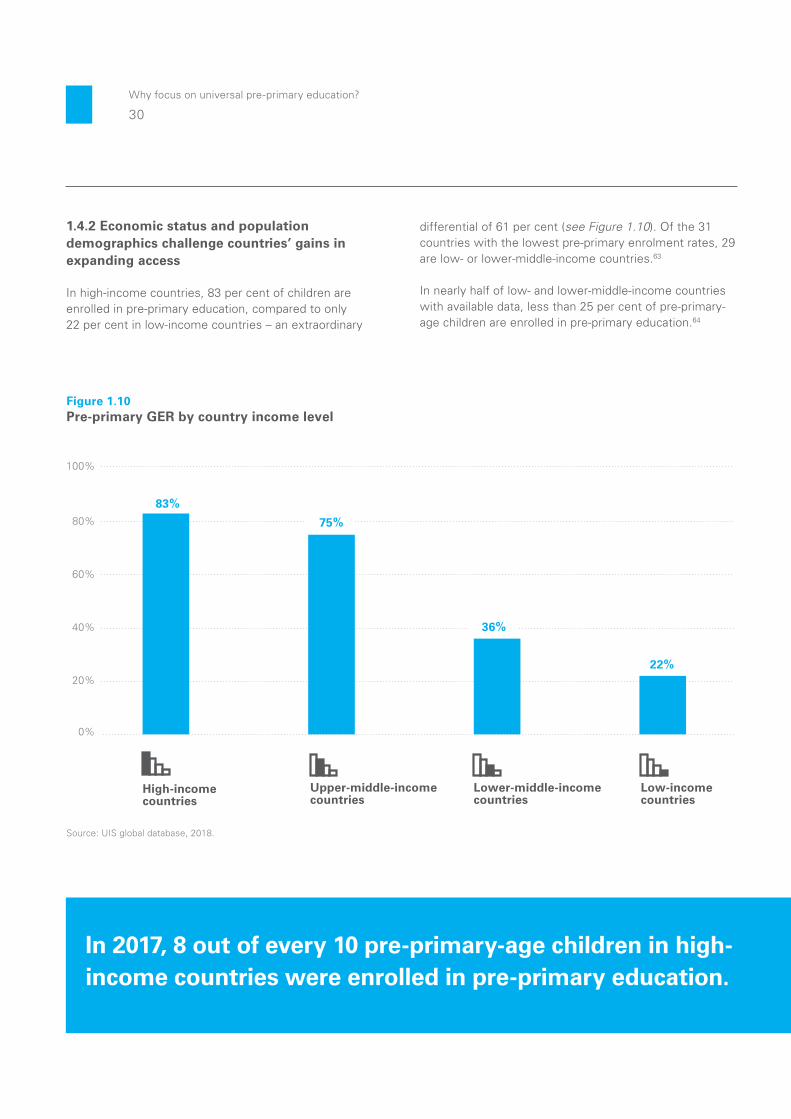
1.4.2 Economic status and population demographics challenge countries’ gains in expanding access
In high-income countries, 83 per cent of children are enrolled in pre-primary education, compared to only 22 per cent in low-income countries – an extraordinary
Figure 1.10 Pre-primary GER by country income level
Source: UIS global database, 2018.
20%
40%
60%
80%
100%
0%
Upper-middle-income countries
75%
Lower-middle-income countries
36%
Low-income countries
22%
High-income countries
83%
In 2017, 8 out of every 10 pre-primary-age children in high-income countries were enrolled in pre-primary education.
differential of 61 per cent (see Figure 1.10). Of the 31 countries with the lowest pre-primary enrolment rates, 29 are low- or lower-middle-income countries.63
In nearly half of low- and lower-middle-income countries with available data, less than 25 per cent of pre-primary-age children are enrolled in pre-primary education.64

A World Ready To Learn
31
In addition to the relative wealth of a country, its demography inherently has significant impacts on the ability of its government to ensure equitable access to pre-primary education. Broadening access is harder for countries with large populations of preschool-age children relative to the total population (demographic pressure). On average, countries with low demographic
pressure report enrolment rates over two and a half times higher than countries with high demographic pressure (see Figure 1.11).65 Preschool-age population size and relative growth in the coming decade will certainly need to be taken into strong consideration as countries develop plans to provide universal pre-primary services.
Source: Computations by UNICEF, based on data from the UIS global database, 2017.
Figure 1.11Percentage of children enrolled in pre-primary education, by proportion of pre-primary-age children in the overall population
Very high
34%
Moderate
77%
Low
89%
High
54%
Average GER
Demographic pressure
Only 2 out of every 10 pre-primary-age children were enrolled in low-income countries.
32
Why focus on universal pre-primary education?
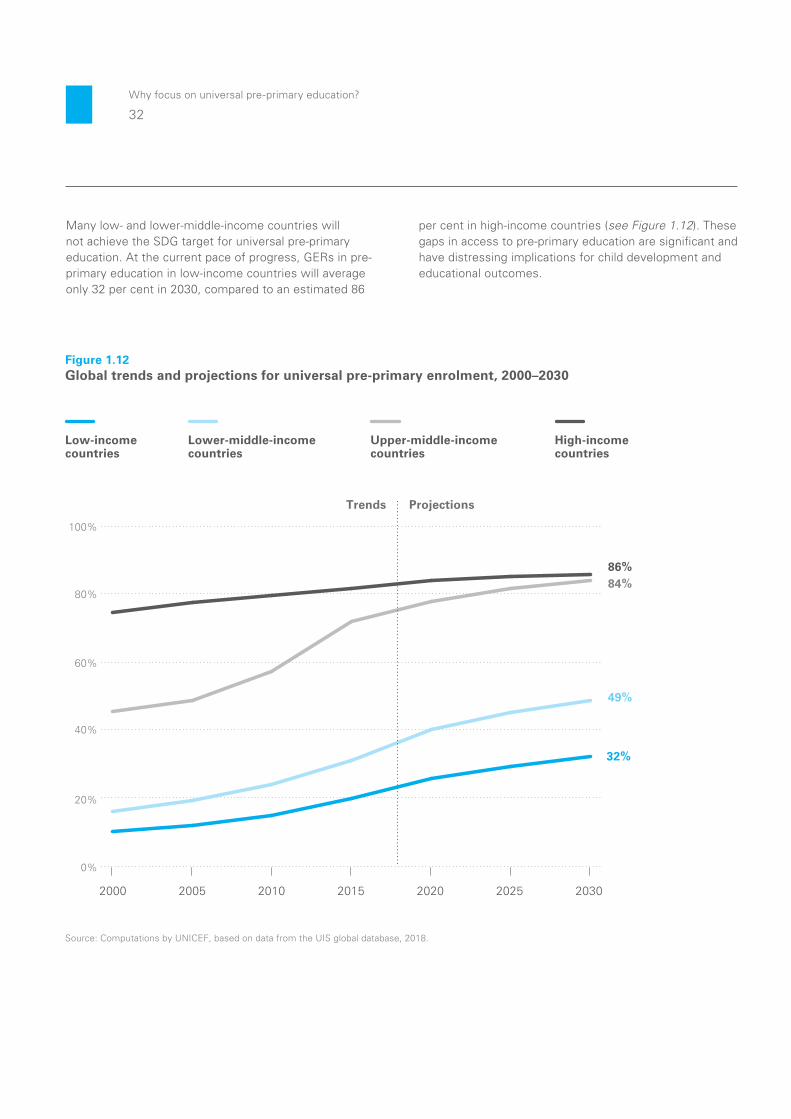
Many low- and lower-middle-income countries will not achieve the SDG target for universal pre-primary education. At the current pace of progress, GERs in pre-primary education in low-income countries will average only 32 per cent in 2030, compared to an estimated 86
per cent in high-income countries (see Figure 1.12). These gaps in access to pre-primary education are significant and have distressing implications for child development and educational outcomes.
Source: Computations by UNICEF, based on data from the UIS global database, 2018.
Figure 1.12Global trends and projections for universal pre-primary enrolment, 2000–2030
High-income countries
Upper-middle-income countries
Lower-middle-income countries
Low-incomecountries
ProjectionsTrends
60%
80%
100%
86%84%
49%
32%
20%
0%
40%
2000 2005 2010 2030202520202015
A World Ready To Learn
33
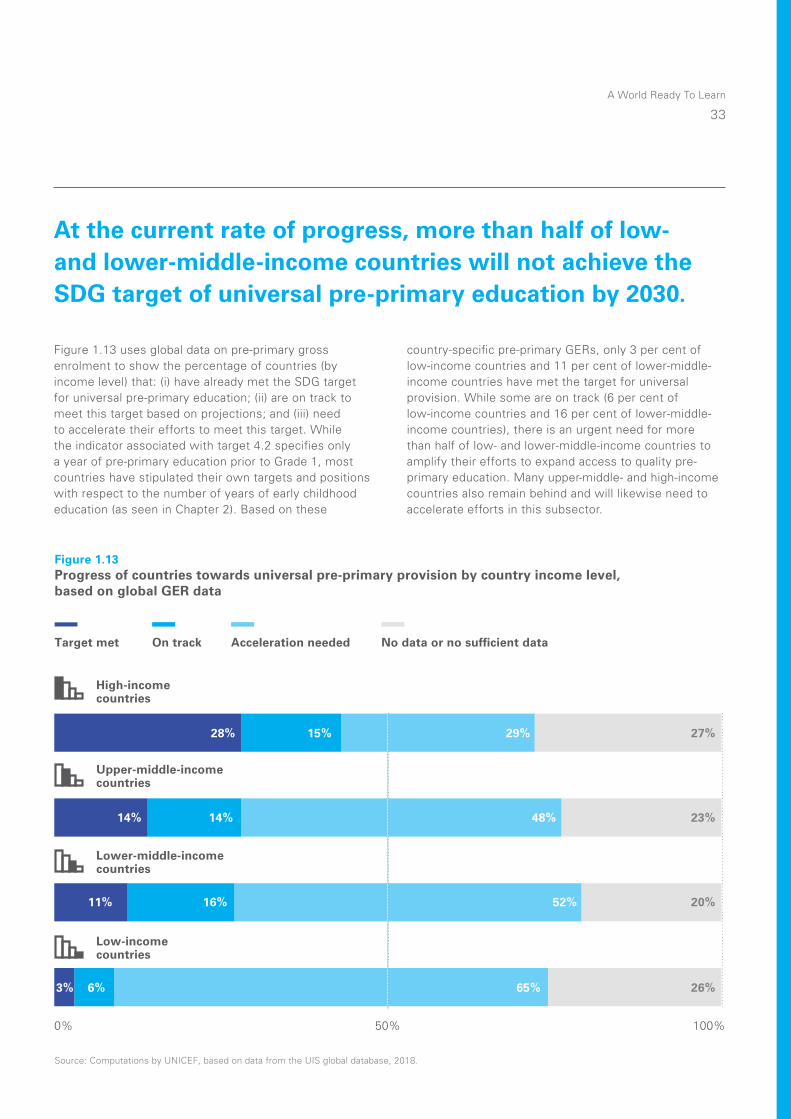
At the current rate of progress, more than half of low- and lower-middle-income countries will not achieve the SDG target of universal pre-primary education by 2030.
Figure 1.13 uses global data on pre-primary gross enrolment to show the percentage of countries (by income level) that: (i) have already met the SDG target for universal pre-primary education; (ii) are on track to meet this target based on projections; and (iii) need to accelerate their efforts to meet this target. While the indicator associated with target 4.2 specifies only a year of pre-primary education prior to Grade 1, most countries have stipulated their own targets and positions with respect to the number of years of early childhood education (as seen in Chapter 2). Based on these
country-specific pre-primary GERs, only 3 per cent of low-income countries and 11 per cent of lower-middle-income countries have met the target for universal provision. While some are on track (6 per cent of low-income countries and 16 per cent of lower-middle-income countries), there is an urgent need for more than half of low- and lower-middle-income countries to amplify their efforts to expand access to quality pre-primary education. Many upper-middle- and high-income countries also remain behind and will likewise need to accelerate efforts in this subsector.
Source: Computations by UNICEF, based on data from the UIS global database, 2018.
Figure 1.13Progress of countries towards universal pre-primary provision by country income level, based on global GER data
Lower-middle-income countries
Low-income countries
High-income countries
Upper-middle-income countries
No data or no sufficient dataTarget met
50%0% 100%
On track Acceleration needed
27%29%15%28%
23%48%14%14%
20%52%16%11%
26%65%6%3%
34
Why focus on universal pre-primary education?
1.4.3 Millions of children in emergency settings are denied access to pre-primary learning
While access to quality pre-primary education is inadequate globally, the opportunities for early childhood education are drastically restricted in emergency settings, where family and social networks are torn apart and social service delivery is interrupted. Data estimating risks to children living in conflict-affected countries or insecure conditions are limited, but it is clear these children are vulnerable to multiple risk factors, with amplified impacts on their development outcomes.66
In these contexts, very young children are frequently exposed to malnourishment, prolonged or acute trauma, or other forms of deprivation. This can lead to ‘toxic stress’, a condition that inhibits brain cell connections and the achievement of their developmental potential.67 Further, in countries facing widespread armed conflict, the proportions of children affected can be overwhelming. In the Syrian Arab Republic, for example, as of March 2016, an estimated 3.7 million children – or one in every three – have been born into conflict.68 Such circumstances can reverse otherwise positive schooling trends unless they are addressed effectively.
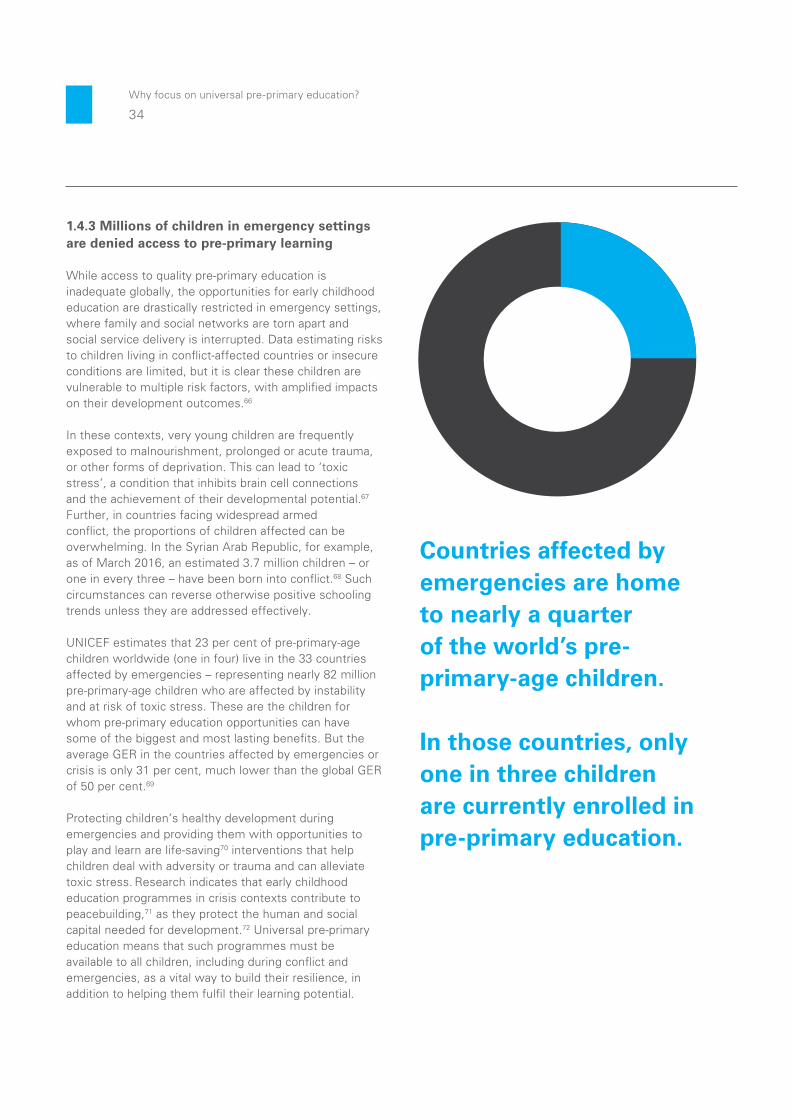
UNICEF estimates that 23 per cent of pre-primary-age children worldwide (one in four) live in the 33 countries affected by emergencies – representing nearly 82 million pre-primary-age children who are affected by instability and at risk of toxic stress. These are the children for whom pre-primary education opportunities can have some of the biggest and most lasting benefits. But the average GER in the countries affected by emergencies or crisis is only 31 per cent, much lower than the global GER of 50 per cent.69
Protecting children’s healthy development during emergencies and providing them with opportunities to play and learn are life-saving70 interventions that help children deal with adversity or trauma and can alleviate toxic stress. Research indicates that early childhood education programmes in crisis contexts contribute to peacebuilding,71 as they protect the human and social capital needed for development.72 Universal pre-primary education means that such programmes must be available to all children, including during conflict and emergencies, as a vital way to build their resilience, in addition to helping them fulfil their learning potential.
Countries affected by emergencies are home to nearly a quarter of the world’s pre-primary-age children.
In those countries, only one in three children are currently enrolled in pre-primary education.
A World Ready To Learn
35
Equitable access to quality pre-primary education can, and should, be achieved in every country.
1.5 A ‘business as usual’ approach will not fulfil the promise of universal pre-primary education
The positive impacts of pre-primary education are strong enough to be easily
measured a decade later in terms of individual achievements and well-being,
the effectiveness and efficiency of school systems, and the ability of societies
to tackle some of their most stubborn challenges. Yet more than half of low-
and lower-middle-income countries are not making sufficient progress to reach
the objective for SDG target 4.2. Nearly a third of upper-middle- and high-income
countries also need to accelerate their progress. The evidence presented in
this chapter leads to a foundational recommendation:
To address the massive gaps in access, the focus on pre-primary education must be intensified – especially in countries that are not on track to meet the universal target. Governments and the global education community should move decisively, now, to achieve universal access to pre-primary education by 2030.
The next chapters of this report lay out the specific challenges that a push
for universal pre-primary education will need to overcome in terms of equity, quality
and financing. As the report will show, universal quality pre-primary education is
an achievable target. There are difficult choices to be made to accelerate the trend
lines described above, including the duration of pre-primary programmes and the
reallocation of financing. But solutions are within reach for each of these challenges.
A World Ready To Learn
35

36
Why focus on universal pre-primary education?

A World Ready To Learn
37
38
Challenges to equity, pathways to overcome them
Challenges to equity, pathways to overcome them
Chapter 2
A World Ready To Learn
39
Pre-primary education offers an exceptionally powerful opportunity
to break intergenerational cycles of inequity. The importance of
securing access to at least one year of quality pre-primary education
for all girls and boys is also reflected in the global SDG target 4.2.
Yet, today, half of the world’s pre-primary-age children are not enrolled in any type of pre-primary education, many of whom live in low- and lower-middle-income countries. In most regions access to early childhood education programmes has been slow and inequitable, not only across but also within countries, as vulnerable children are disproportionately excluded from quality pre-primary education.
This chapter examines the barriers to attending early childhood education, including the evidence that the children most in need are the least likely to have access to pre-primary education and are often the most likely to receive substandard services. Further, it explores the strategies and measures that can help make universal access a reality.
Securing universal access to quality pre-primary education requires bold measures that benefit disadvantaged children at least as much as their better-off peers during each step of the process.
40
Challenges to equity, pathways to overcome them
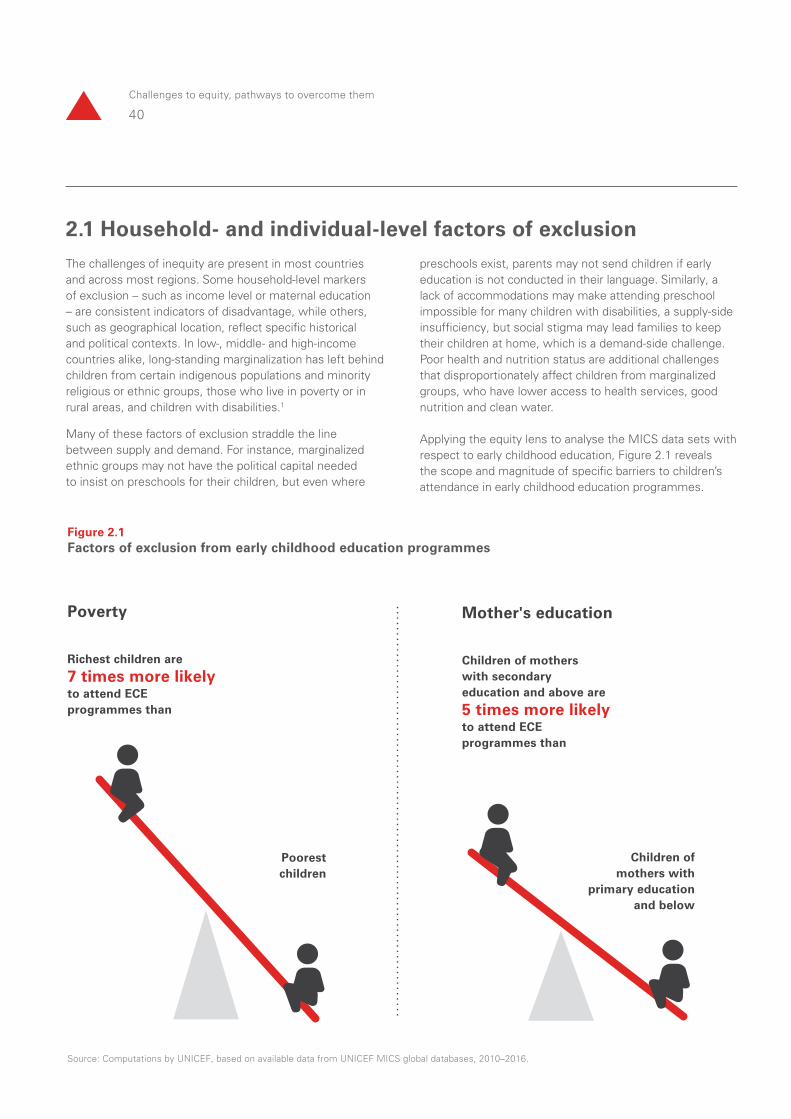
2.1 Household- and individual-level factors of exclusionpreschools exist, parents may not send children if early education is not conducted in their language. Similarly, a lack of accommodations may make attending preschool impossible for many children with disabilities, a supply-side insufficiency, but social stigma may lead families to keep their children at home, which is a demand-side challenge. Poor health and nutrition status are additional challenges that disproportionately affect children from marginalized groups, who have lower access to health services, good nutrition and clean water.
Applying the equity lens to analyse the MICS data sets with respect to early childhood education, Figure 2.1 reveals the scope and magnitude of specific barriers to children’s attendance in early childhood education programmes.
Figure 2.1Factors of exclusion from early childhood education programmes
Source: Computations by UNICEF, based on available data from UNICEF MICS global databases, 2010–2016.
Poorestchildren
Equitable attendance in ECE programmes among
Children living in urban areas are
2.5 times more likely to attend ECE programmes than
Childrenliving in
rural areas
Residence
Children of mothers with secondary education and above are
5 times more likely to attend ECE programmes than
Mother's educationPoverty Sex
Richest children are
7 times more likely to attend ECE programmes than
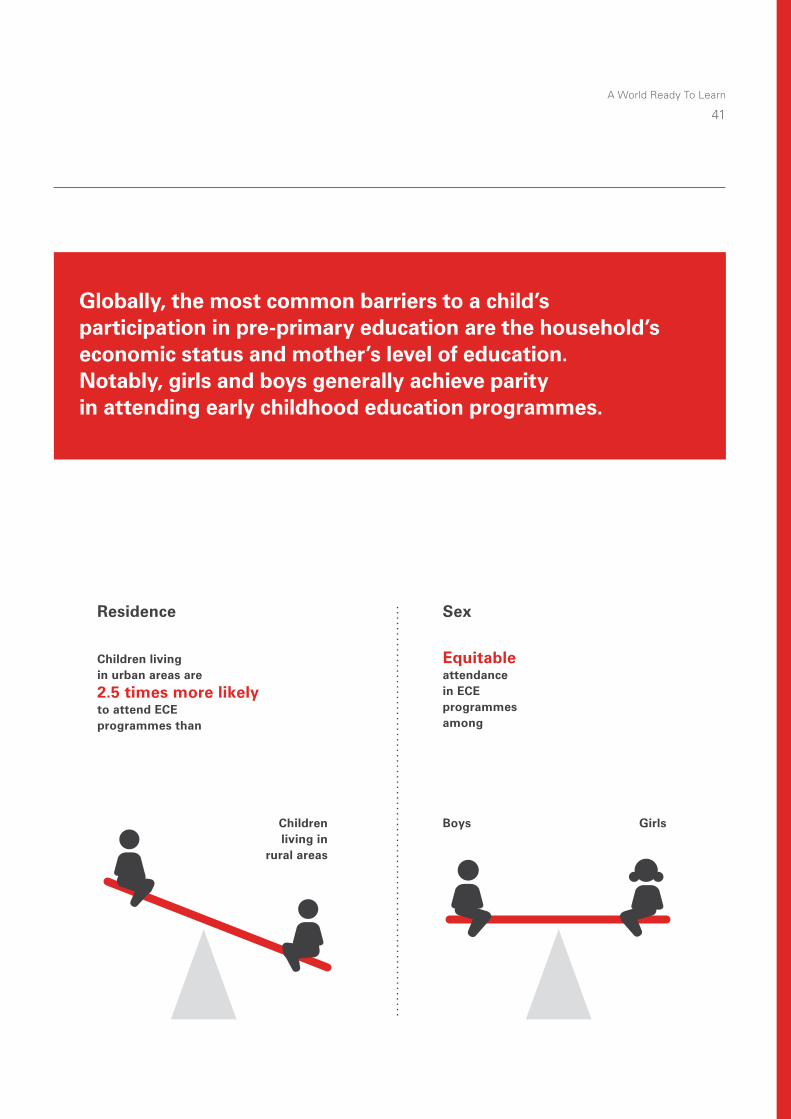
Boys Girls
Children of mothers with
primary education and below
The challenges of inequity are present in most countries and across most regions. Some household-level markers of exclusion – such as income level or maternal education – are consistent indicators of disadvantage, while others, such as geographical location, reflect specific historical and political contexts. In low-, middle- and high-income countries alike, long-standing marginalization has left behind children from certain indigenous populations and minority religious or ethnic groups, those who live in poverty or in rural areas, and children with disabilities.1
Many of these factors of exclusion straddle the line between supply and demand. For instance, marginalized ethnic groups may not have the political capital needed to insist on preschools for their children, but even where
A World Ready To Learn
41
Globally, the most common barriers to a child’s participation in pre-primary education are the household’s economic status and mother’s level of education. Notably, girls and boys generally achieve parity in attending early childhood education programmes.
Figure 2.1Factors of exclusion from early childhood education programmes
Source: Computations by UNICEF, based on available data from UNICEF MICS global databases, 2010–2016.
Poorestchildren
Equitable attendance in ECE programmes among
Children living in urban areas are
2.5 times more likely to attend ECE programmes than
Childrenliving in
rural areas
Residence
Children of mothers with secondary education and above are
5 times more likely to attend ECE programmes than
Mother's educationPoverty Sex
Richest children are
7 times more likely to attend ECE programmes than
Boys Girls
Children of mothers with
primary education and below
42
Challenges to equity, pathways to overcome them
2.1.1 The impacts of household-level factors: Poverty, maternal education and residence
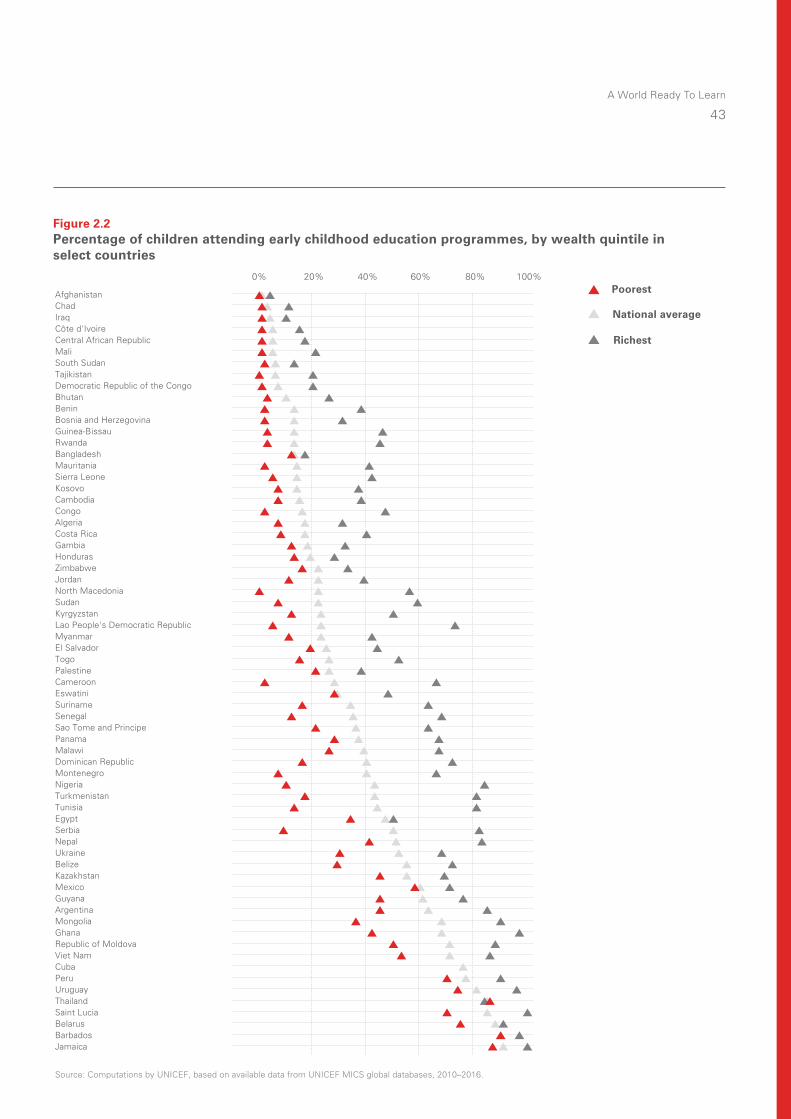
Household income, the education achieved by a child’s mother and geographical location are key factors that affect children’s attendance in early childhood education. But the strongest, universal factor affecting access to pre-primary education is whether a child lives in a poor or a rich household. Figure 2.2 shows the percentage of three- and four-year-olds attending early childhood education programmes by level of wealth (poorest and richest quintiles) for a selection of countries with available data. The difference between poor and rich children’s attendance is stark across nearly all countries. For example, attendance
for children from the poorest households is less than 1 per cent in Tajikistan and North Macedonia, compared to over 20 per cent in Tajikistan and over 50 per cent in North Macedonia for the richest households.
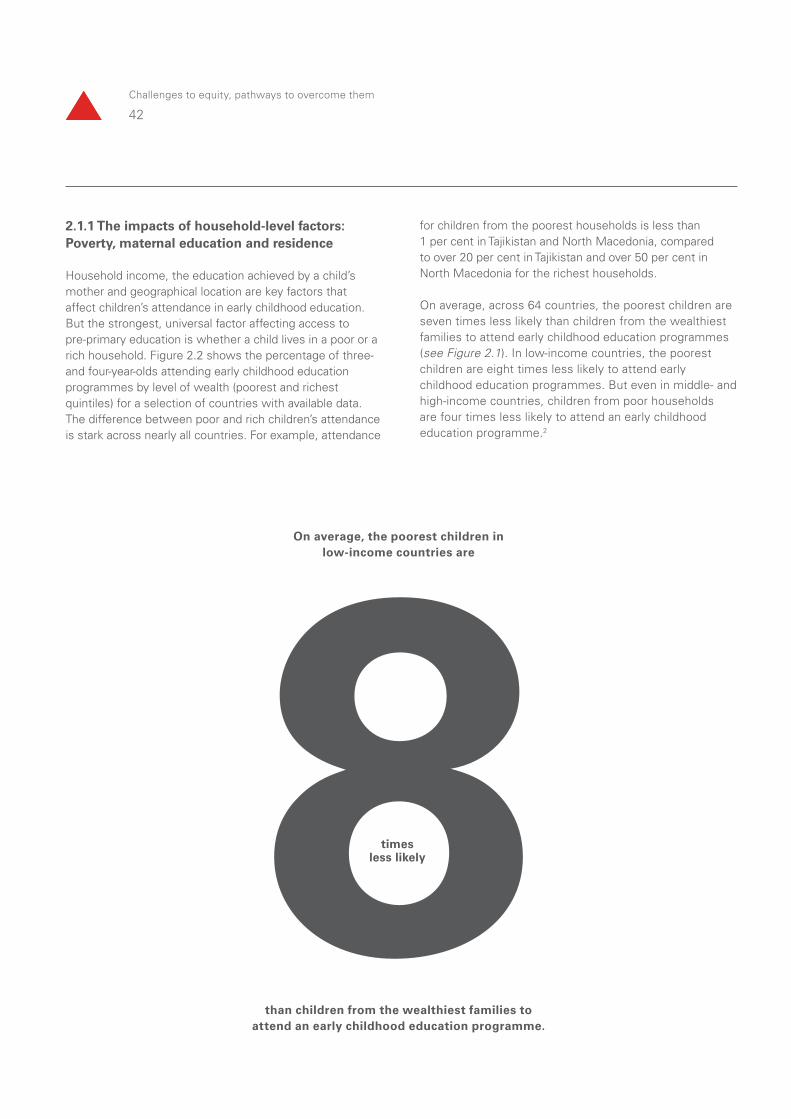
On average, across 64 countries, the poorest children are seven times less likely than children from the wealthiest families to attend early childhood education programmes (see Figure 2.1). In low-income countries, the poorest children are eight times less likely to attend early childhood education programmes. But even in middle- and high-income countries, children from poor households are four times less likely to attend an early childhood education programme.2
than children from the wealthiest families to attend an early childhood education programme.
On average, the poorest children in low-income countries are
times less likely
A World Ready To Learn
43
Figure 2.2Percentage of children attending early childhood education programmes, by wealth quintile in select countries
Source: Computations by UNICEF, based on available data from UNICEF MICS global databases, 2010–2016.
0% 20% 40% 60% 80% 100%
JamaicaBarbadosBelarusSaint LuciaThailandUruguayPeruCubaViet NamRepublic of MoldovaGhanaMongoliaArgentinaGuyanaMexicoKazakhstanBelizeUkraineNepalSerbiaEgyptTunisiaTurkmenistanNigeriaMontenegroDominican RepublicMalawiPanamaSao Tome and PrincipeSenegalSurinameEswatiniCameroonPalestineTogoEl SalvadorMyanmarLao People's Democratic RepublicKyrgyzstanSudanNorth MacedoniaJordanZimbabweHondurasGambiaCosta RicaAlgeriaCongoCambodiaKosovoSierra LeoneMauritaniaBangladeshRwandaGuinea-BissauBosnia and HerzegovinaBeninBhutanDemocratic Republic of the CongoTajikistanSouth SudanMaliCentral African RepublicCôte d'IvoireIraqChadAfghanistan
Richest
Poorest
National average
44
Challenges to equity, pathways to overcome them
The level of maternal education also has a strong association with the child’s likelihood of attending any form of early childhood education. Across countries with available data, children whose mothers have completed secondary education or higher are nearly five times more likely to attend an early education programme than children of mothers with primary education or no formal education. In Belize, Guinea-Bissau and North Macedonia, for example, the differential is more than 10 to 1.3
Many children also miss out on early childhood education opportunities simply because of geography. Where a child lives – whether in a rural or an urban setting – is a key socio-demographic determinant of access. Across 60 countries included in this analysis, children living in rural areas were 2.5 times less likely to attend early childhood education programmes than children living in urban areas. In low- and lower-middle-income countries, the gap is slightly wider.4
If a mother has completed secondary education, her children are, on average, nearly five times more likely to attend an early childhood education programme than children whose mothers have primary education or lower.
Gender equity in attendance of early childhood
education programmes
A positive finding in most countries is that girls and boys participate almost equally in early childhood education programmes. This underscores the opportunity presented by early childhood education to reduce or eliminate gender
inequities and change gender norms and socialization that otherwise might characterize the entire education system. As pre-primary programmes expand to include more children from disadvantaged backgrounds, this level of gender equity may be difficult to maintain without thoughtfully designed programmes that directly address factors of exclusion – to which girls may be most vulnerable.
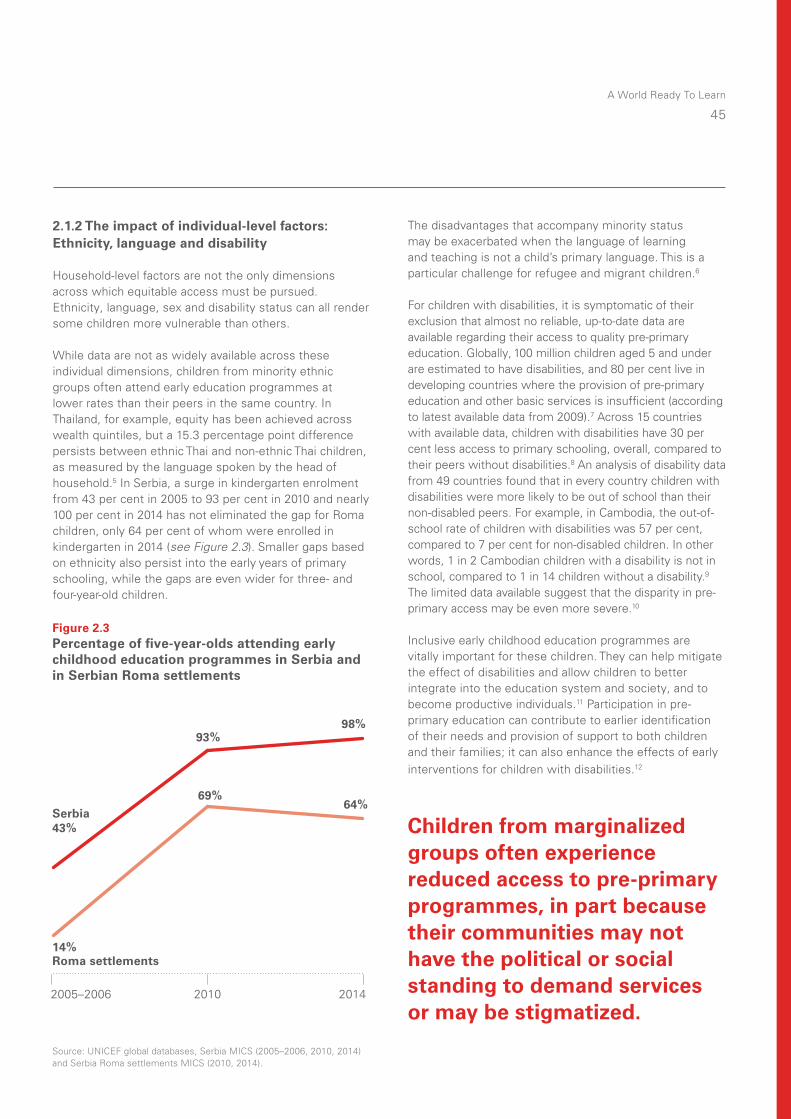
A World Ready To Learn
45
2.1.2 The impact of individual-level factors: Ethnicity, language and disability
Household-level factors are not the only dimensions across which equitable access must be pursued. Ethnicity, language, sex and disability status can all render some children more vulnerable than others.
While data are not as widely available across these individual dimensions, children from minority ethnic groups often attend early education programmes at lower rates than their peers in the same country. In Thailand, for example, equity has been achieved across wealth quintiles, but a 15.3 percentage point difference persists between ethnic Thai and non-ethnic Thai children, as measured by the language spoken by the head of household.5 In Serbia, a surge in kindergarten enrolment from 43 per cent in 2005 to 93 per cent in 2010 and nearly 100 per cent in 2014 has not eliminated the gap for Roma children, only 64 per cent of whom were enrolled in kindergarten in 2014 (see Figure 2.3). Smaller gaps based on ethnicity also persist into the early years of primary schooling, while the gaps are even wider for three- and four-year-old children.
The disadvantages that accompany minority status may be exacerbated when the language of learning and teaching is not a child’s primary language. This is a particular challenge for refugee and migrant children.6
For children with disabilities, it is symptomatic of their exclusion that almost no reliable, up-to-date data are available regarding their access to quality pre-primary education. Globally, 100 million children aged 5 and under are estimated to have disabilities, and 80 per cent live in developing countries where the provision of pre-primary education and other basic services is insufficient (according to latest available data from 2009).7 Across 15 countries with available data, children with disabilities have 30 per cent less access to primary schooling, overall, compared to their peers without disabilities.8 An analysis of disability data from 49 countries found that in every country children with disabilities were more likely to be out of school than their non-disabled peers. For example, in Cambodia, the out-of-school rate of children with disabilities was 57 per cent, compared to 7 per cent for non-disabled children. In other words, 1 in 2 Cambodian children with a disability is not in school, compared to 1 in 14 children without a disability.9 The limited data available suggest that the disparity in pre-primary access may be even more severe.10
Inclusive early childhood education programmes are vitally important for these children. They can help mitigate the effect of disabilities and allow children to better integrate into the education system and society, and to become productive individuals.11 Participation in pre-primary education can contribute to earlier identification of their needs and provision of support to both children and their families; it can also enhance the effects of early interventions for children with disabilities.12
Children from marginalized groups often experience reduced access to pre-primary programmes, in part because their communities may not have the political or social standing to demand services or may be stigmatized.
Source: UNICEF global databases, Serbia MICS (2005–2006, 2010, 2014) and Serbia Roma settlements MICS (2010, 2014).
Serbia
98%
43%
93%
69%64%
Figure 2.3Percentage of five-year-olds attending early childhood education programmes in Serbia and in Serbian Roma settlements
2005–2006 2010 2014
Roma settlements14%
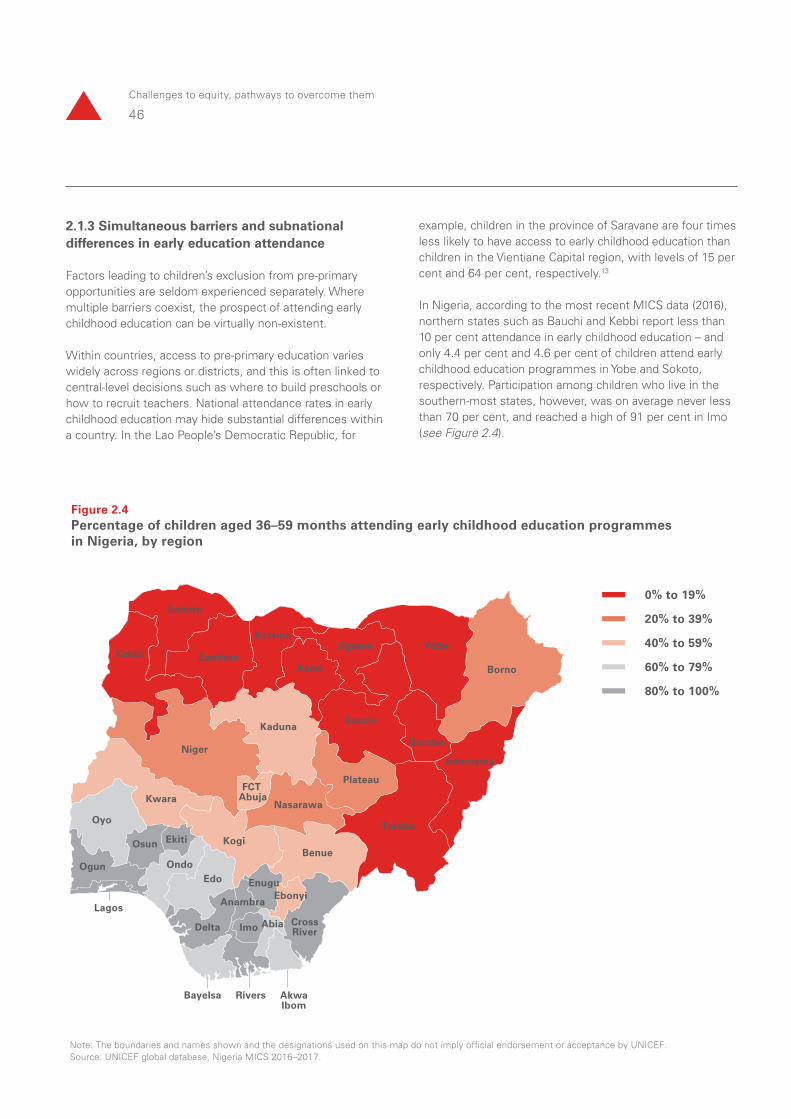
46
Challenges to equity, pathways to overcome them
2.1.3 Simultaneous barriers and subnational differences in early education attendance
Factors leading to children’s exclusion from pre-primary opportunities are seldom experienced separately. Where multiple barriers coexist, the prospect of attending early childhood education can be virtually non-existent.
Within countries, access to pre-primary education varies widely across regions or districts, and this is often linked to central-level decisions such as where to build preschools or how to recruit teachers. National attendance rates in early childhood education may hide substantial differences within a country. In the Lao People’s Democratic Republic, for
example, children in the province of Saravane are four times less likely to have access to early childhood education than children in the Vientiane Capital region, with levels of 15 per cent and 64 per cent, respectively.13
In Nigeria, according to the most recent MICS data (2016), northern states such as Bauchi and Kebbi report less than 10 per cent attendance in early childhood education – and only 4.4 per cent and 4.6 per cent of children attend early childhood education programmes in Yobe and Sokoto, respectively. Participation among children who live in the southern-most states, however, was on average never less than 70 per cent, and reached a high of 91 per cent in Imo (see Figure 2.4).
Note: The boundaries and names shown and the designations used on this map do not imply official endorsement or acceptance by UNICEF.Source: UNICEF global database, Nigeria MICS 2016–2017.
YobeJigawa
Bauchi
Gombe
Sokoto
ZamfaraKano
Katsina
Borno
Adamawa
Taraba
Plateau
Kaduna
Niger
Kwara
Ogun
Oyo
Osun Ekiti
OndoEdo
Delta
Bayelsa Rivers
Anambra
EnuguEbonyi
AbiaImo
AkwaIbom
Lagos
KogiBenue
CrossRiver
FCT Abuja
Nasarawa
Kebbi
Figure 2.4 Percentage of children aged 36–59 months attending early childhood education programmes in Nigeria, by region
0% to 19%
20% to 39%
40% to 59%
60% to 79%
80% to 100%
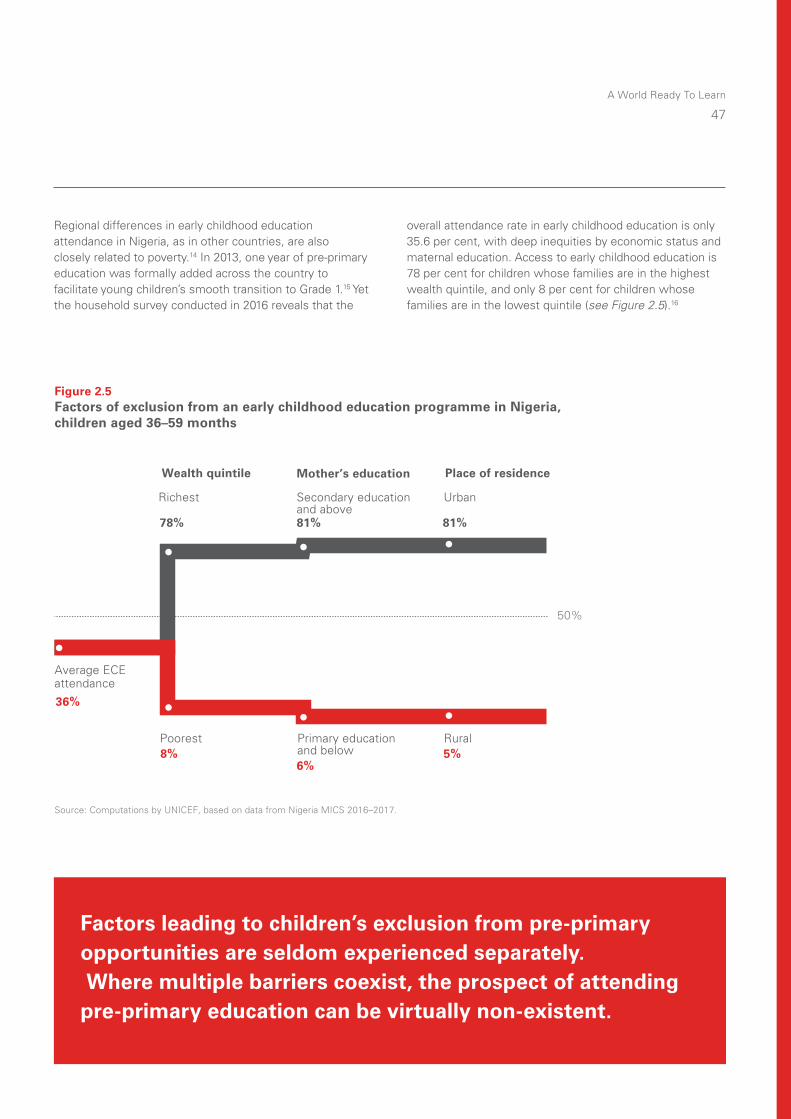
A World Ready To Learn
47
Regional differences in early childhood education attendance in Nigeria, as in other countries, are also closely related to poverty.14 In 2013, one year of pre-primary education was formally added across the country to facilitate young children’s smooth transition to Grade 1.15 Yet the household survey conducted in 2016 reveals that the
overall attendance rate in early childhood education is only 35.6 per cent, with deep inequities by economic status and maternal education. Access to early childhood education is 78 per cent for children whose families are in the highest wealth quintile, and only 8 per cent for children whose families are in the lowest quintile (see Figure 2.5).16
Factors leading to children’s exclusion from pre-primary opportunities are seldom experienced separately. Where multiple barriers coexist, the prospect of attending pre-primary education can be virtually non-existent.
50%
Average ECEattendance
36%
78%
8%Poorest
UrbanRichest
Rural
81%
5%
Figure 2.5Factors of exclusion from an early childhood education programme in Nigeria,children aged 36–59 months
Source: Computations by UNICEF, based on data from Nigeria MICS 2016–2017.
Place of residence Wealth quintile
Primary education and below
Mother’s education
Secondary education and above81%
6%

48
Challenges to equity, pathways to overcome them
2.2 Some countries have made substantial gains. What strategies can help accelerate universal progress?
Source: UIS global database, 2019.
Nepal Lao People's Democratic Republic EthiopiaBangladeshMongolia Low-income countries
2000 2005 2010 2015 2017
40%
0%
100%
80%
60%
10%
Figure 2.6Gross enrolment ratio in pre-primary education between 2000 and 2017 in select high-performing low- and lower-middle-income countries
40%
46%
87%86%
22%
43%
While Chapter 1 concluded that ‘business as usual’ will not fulfil the promise of universal quality pre-primary education because many countries are severely behind on this ambition, a number of low- and lower-middle-income countries have demonstrated that equity and expansion can be advanced in tandem. These countries have found ways to navigate the policy choices to be made between setting aspirational goals for three or more years of pre-primary education for a small, often privileged subset of families and children, or targeting their initiatives to cover one year of quality pre-primary education for all children, while progressively expanding the duration of pre-primary
education as the pre-primary system is strengthened and resources become available.
The ‘high performers’ have made progress towards increased access to pre-primary education despite the apparent obstacles, and some of them have also worked to close equity gaps. Figure 2.6 shows pre-primary education gross enrolment trends for a number of countries featured in this report, many of which reported very low enrolment rates in the early 2000s but have progressively made gains and moved up past 25 per cent, and in the case of Nepal and Mongolia, for example, are nearing universal access.
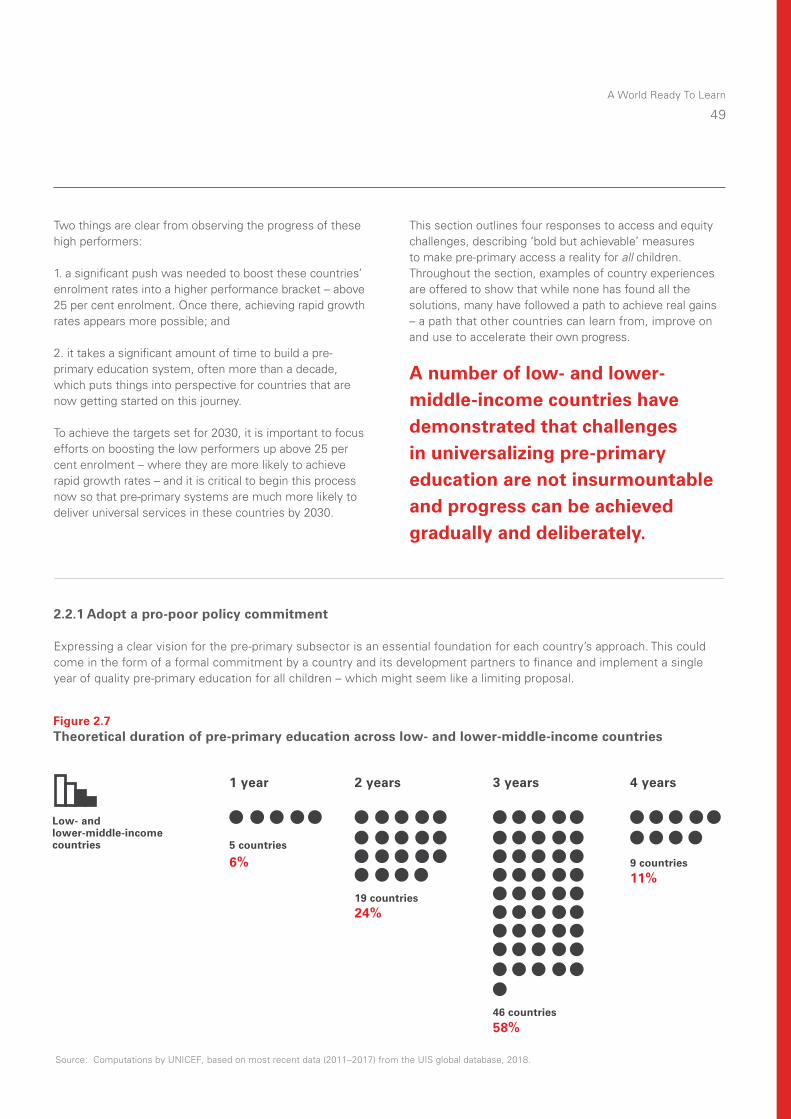
A World Ready To Learn
49
A number of low- and lower-middle-income countries have demonstrated that challenges in universalizing pre-primary education are not insurmountable and progress can be achieved gradually and deliberately.
2.2.1 Adopt a pro-poor policy commitment
Expressing a clear vision for the pre-primary subsector is an essential foundation for each country’s approach. This could come in the form of a formal commitment by a country and its development partners to finance and implement a single year of quality pre-primary education for all children – which might seem like a limiting proposal.
1 year 2 years 3 years 4 years
Figure 2.7Theoretical duration of pre-primary education across low- and lower-middle-income countries
Source: Computations by UNICEF, based on most recent data (2011–2017) from the UIS global database, 2018.
5 countries
19 countries
9 countries
46 countries
Low- and lower-middle-income countries
58%
24%
6%11%
Two things are clear from observing the progress of these high performers:
1. a significant push was needed to boost these countries’ enrolment rates into a higher performance bracket – above 25 per cent enrolment. Once there, achieving rapid growth rates appears more possible; and
2. it takes a significant amount of time to build a pre-primary education system, often more than a decade, which puts things into perspective for countries that are now getting started on this journey.
To achieve the targets set for 2030, it is important to focus efforts on boosting the low performers up above 25 per cent enrolment – where they are more likely to achieve rapid growth rates – and it is critical to begin this process now so that pre-primary systems are much more likely to deliver universal services in these countries by 2030.
This section outlines four responses to access and equity challenges, describing ‘bold but achievable’ measures to make pre-primary access a reality for all children. Throughout the section, examples of country experiences are offered to show that while none has found all the solutions, many have followed a path to achieve real gains – a path that other countries can learn from, improve on and use to accelerate their own progress.
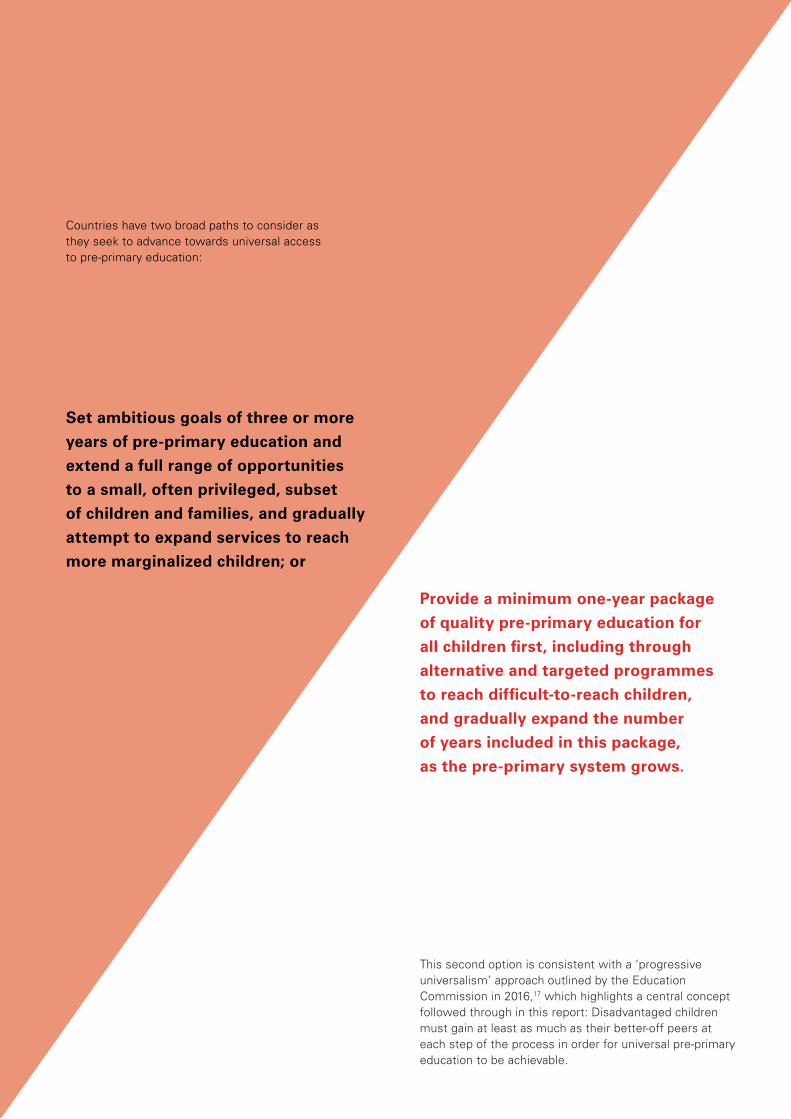
Provide a minimum one-year package
of quality pre-primary education for
all children first, including through
alternative and targeted programmes
to reach difficult-to-reach children,
and gradually expand the number
of years included in this package,
as the pre-primary system grows.
Set ambitious goals of three or more
years of pre-primary education and
extend a full range of opportunities
to a small, often privileged, subset
of children and families, and gradually
attempt to expand services to reach
more marginalized children; or
Countries have two broad paths to consider as they seek to advance towards universal access to pre-primary education:
This second option is consistent with a ‘progressive universalism’ approach outlined by the Education Commission in 2016,17 which highlights a central concept followed through in this report: Disadvantaged children must gain at least as much as their better-off peers at each step of the process in order for universal pre-primary education to be achievable.

A World Ready To Learn
51
Already 193 countries – including most of the world’s low-income countries – have announced their intention to achieve SDG target 4.2.18 In 70 per cent of low- and lower-middle-income countries, the theoretical duration of pre-primary education currently stands at three or four years, as shown in Figure 2.7. Moving to a shorter duration initially comes in the category of ‘bold but achievable’ policies. For countries significantly behind in pre-primary education, the choice is between making two or three years of preschooling available to a limited number of children – at the risk of widening the gap between poor and rich households – or making a single year available to all, including marginalized and vulnerable households, and in the process laying the foundations of a strong and equitable pre-primary education system that can grow over time.
The intention to provide a full course of early childhood education opportunities is laudable but can actually result in systems that further exacerbate socio-economic disparities and deliver poor-quality services. The most recent evidence indicates that current financing is not available to ensure access for all children for three or four years,19 especially where the pre-primary subsector is nascent and requires substantial support and time to develop. Under these circumstances, a push for extended duration is likely to lead to uneven access favouring wealthier families.
A more limited number of countries have focused their pre-primary expansion efforts on the last year of pre-primary education – or one year before primary education. A closer look at pre-primary enrolment rates shows that access to pre-primary education increases towards the end of the pre-primary education cycle.
The most recent data show that, for the majority of countries, the adjusted net enrolment rate (ANER) for one year before the primary entry age is higher than the GER for multiple pre-primary years. Approximately 69 per cent of the world’s children were enrolled in the last year of pre-primary education, compared to a GER of 50 per cent for pre-primary as a whole (see Figure 2.8).
All regions are somewhat closer to universal last-year pre-primary attendance than they are to universal pre-primary as a whole. West and Central Africa, for instance, has an overall GER for pre-primary of only 30 per cent, but 43 per cent of the region’s children were enrolled for at least part of the final year of pre-primary in 2017. Strengthening the focus on setting pro-poor and practical policy goals can help advance equitable access by 2030 significantly.
Figure 2.8 Comparison of pre-primary gross enrolment ratio and adjusted net enrolment rate one year before the official primary entry age, by UNICEF region
ANERGER
East Asia and the Pacific
North America
81%
75%
74%
33%
31%
30%
23%
87%
95%
71%
93%
South Asia
Europe and Central Asia
Latin America and the Caribbean
Eastern and Southern Africa
43%
87%
48%
43%
No data for ANER
69%
50%
Middle East and North Africa
West and Central Africa
World
Note: Most regional estimates are from 2017, apart from Eastern and Southern Africa and West and Central Africa, where estimates are from 2016. South Asia does not have available data for adjusted net enrolment rate.Source: Data are from the UIS global database, 2019, and estimates are calculated for UNICEF regions.
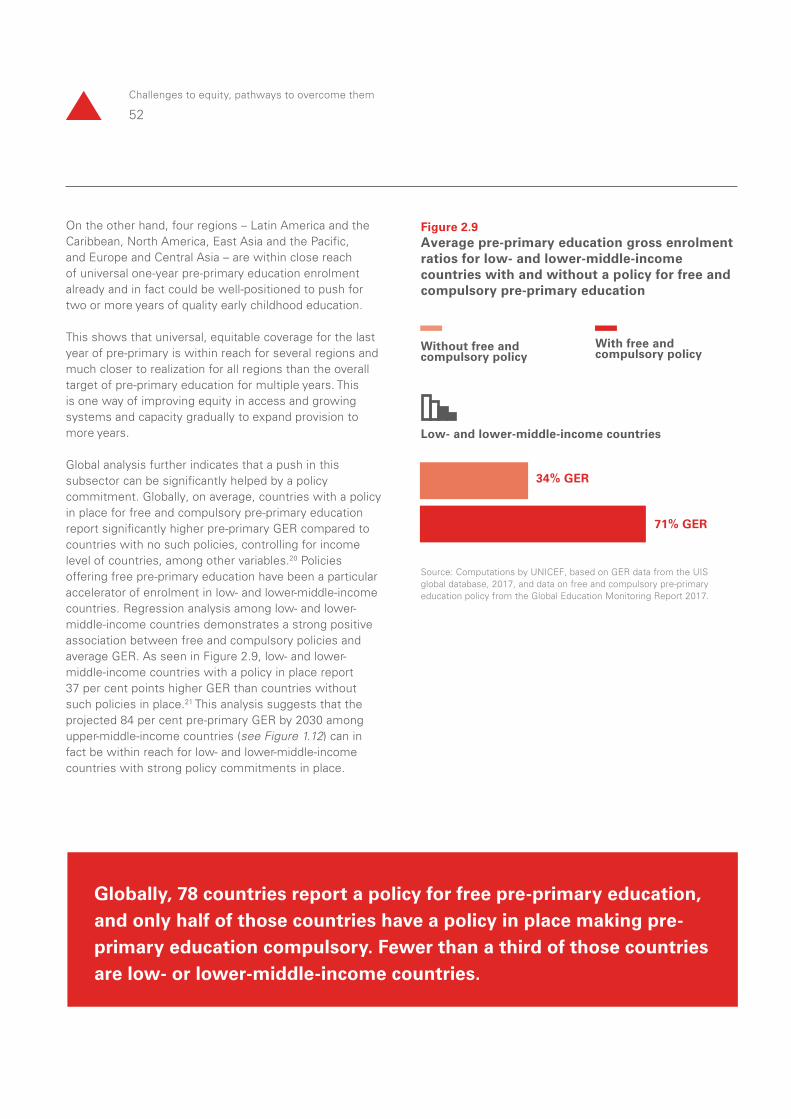
52
Challenges to equity, pathways to overcome them
Globally, 78 countries report a policy for free pre-primary education, and only half of those countries have a policy in place making pre-primary education compulsory. Fewer than a third of those countries are low- or lower-middle-income countries.
On the other hand, four regions – Latin America and the Caribbean, North America, East Asia and the Pacific, and Europe and Central Asia – are within close reach of universal one-year pre-primary education enrolment already and in fact could be well-positioned to push for two or more years of quality early childhood education.
This shows that universal, equitable coverage for the last year of pre-primary is within reach for several regions and much closer to realization for all regions than the overall target of pre-primary education for multiple years. This is one way of improving equity in access and growing systems and capacity gradually to expand provision to more years.
Global analysis further indicates that a push in this subsector can be significantly helped by a policy commitment. Globally, on average, countries with a policy in place for free and compulsory pre-primary education report significantly higher pre-primary GER compared to countries with no such policies, controlling for income level of countries, among other variables.20 Policies offering free pre-primary education have been a particular accelerator of enrolment in low- and lower-middle-income countries. Regression analysis among low- and lower-middle-income countries demonstrates a strong positive association between free and compulsory policies and average GER. As seen in Figure 2.9, low- and lower-middle-income countries with a policy in place report 37 per cent points higher GER than countries without such policies in place.21 This analysis suggests that the projected 84 per cent pre-primary GER by 2030 among upper-middle-income countries (see Figure 1.12) can in fact be within reach for low- and lower-middle-income countries with strong policy commitments in place.
Figure 2.9Average pre-primary education gross enrolment ratios for low- and lower-middle-income countries with and without a policy for free and compulsory pre-primary education
Source: Computations by UNICEF, based on GER data from the UIS global database, 2017, and data on free and compulsory pre-primary education policy from the Global Education Monitoring Report 2017.
71% GER
With free and compulsory policy
34% GER
Without free and compulsory policy
Low- and lower-middle-income countries
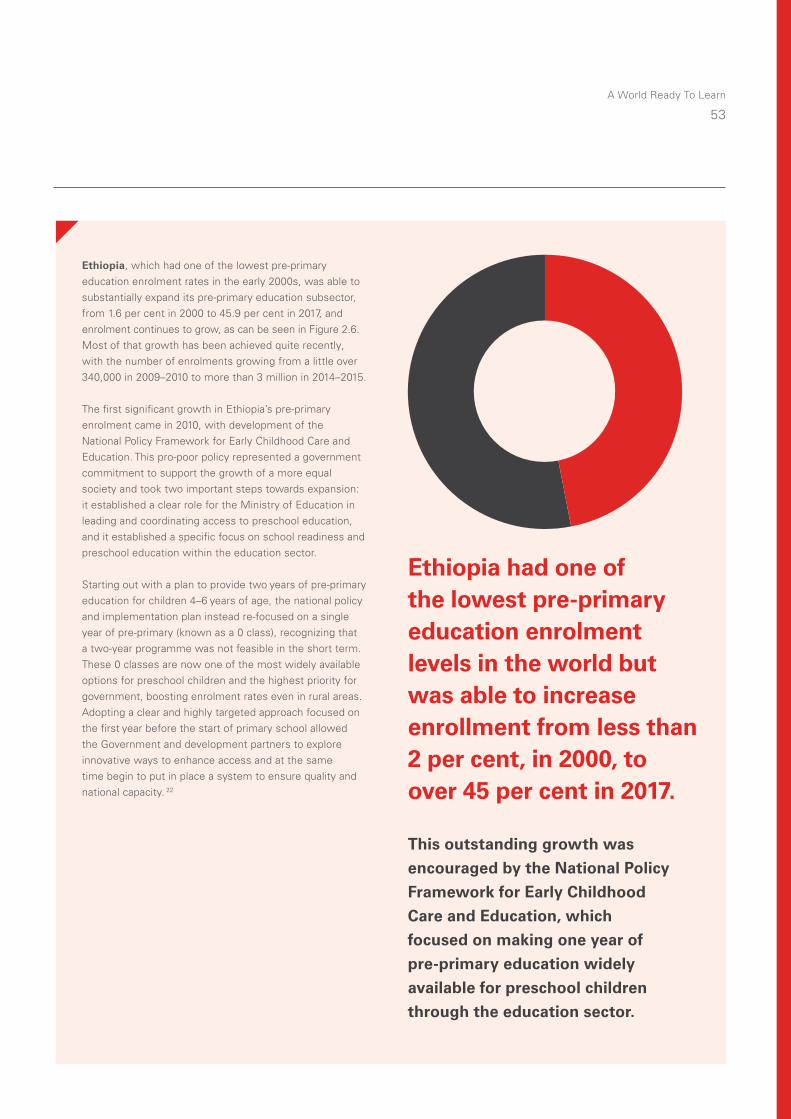
A World Ready To Learn
53
Ethiopia had one of the lowest pre-primary education enrolment levels in the world but was able to increase enrollment from less than 2 per cent, in 2000, to over 45 per cent in 2017.
This outstanding growth was
encouraged by the National Policy
Framework for Early Childhood
Care and Education, which
focused on making one year of
pre-primary education widely
available for preschool children
through the education sector.
Ethiopia, which had one of the lowest pre-primary education enrolment rates in the early 2000s, was able to substantially expand its pre-primary education subsector, from 1.6 per cent in 2000 to 45.9 per cent in 2017, and enrolment continues to grow, as can be seen in Figure 2.6. Most of that growth has been achieved quite recently, with the number of enrolments growing from a little over 340,000 in 2009–2010 to more than 3 million in 2014–2015.
The first significant growth in Ethiopia’s pre-primary enrolment came in 2010, with development of the National Policy Framework for Early Childhood Care and Education. This pro-poor policy represented a government commitment to support the growth of a more equal society and took two important steps towards expansion: it established a clear role for the Ministry of Education in leading and coordinating access to preschool education, and it established a specific focus on school readiness and preschool education within the education sector.
Starting out with a plan to provide two years of pre-primary education for children 4–6 years of age, the national policy and implementation plan instead re-focused on a single year of pre-primary (known as a 0 class), recognizing that a two-year programme was not feasible in the short term. These 0 classes are now one of the most widely available options for preschool children and the highest priority for government, boosting enrolment rates even in rural areas. Adopting a clear and highly targeted approach focused on the first year before the start of primary school allowed the Government and development partners to explore innovative ways to enhance access and at the same time begin to put in place a system to ensure quality and national capacity. 22
54
Challenges to equity, pathways to overcome them
elements such as improved infrastructure, teaching and management personnel, support systems and training.
In cases where other sectors and ministries have responsibility over pre-primary education, collaboration with the Ministry of Education remains a critical factor in successful and equitable expansion of quality pre-primary education, as the Ministry of Education can play a key role in terms of advocacy, support for the establishment of quality standards, teacher training and contributions to financing.
2.2.2 Strengthen leadership to prioritize pre-primary education in education sector plans
Leadership from the education sector is crucial to making measurable shifts in pre-primary education policies and to implementing new strategies. This will typically require that existing education sector plans are revised to prioritize one year (or more) of universal pre-primary education. It may also require extensive work with partners, such as the Global Partnership for Education, to prepare scenarios for subsector expansion, and to develop or identify key
Nepal is an outstanding example of a country that established clear policies through its education sector plan, which eventually led to an unprecedented expansion in pre-primary enrolment – from 12 per cent in 2000 to 86 per cent in 2017. In 2003, Nepal had 1,038 pre-primary centres; by 2005, there were more than 4,000. Growth continued to accelerate, with the establishment of 16,336 centres by 2006 and, remarkably, 35,991 by 2015.23 This upsurge in the number of centres opened the space for increased enrolment. The rapid increase was achieved primarily through high-level political support, the leadership of the education sector, and the coordinated partnerships it fostered to increase the number of community- and school-based centres for early childhood education.
High-level political support for pre-primary education was strengthened initially in 2007, when the Interim Constitution of Nepal declared education a fundamental right.24 In that context, Nepal outlined a strategy for financing and managing early childhood care and education and set ambitious goals to expand comprehensive services
for all children. At that stage, political support for early childhood development was vocal, with the President noting the State’s responsibility to ensure early childhood development as fundamental to the realization of children’s rights.25 Early childhood education was subsequently included in the Department of Education’s Sector Reform Plan (2009–2015), and one year of pre-primary education was recently incorporated into law and formally recognized as part of Nepal’s free and compulsory basic education in the 8th Amendment to the Education Act.26
As of 2019, the country’s vastly expanded network of pre-primary schools demonstrates a growing pre-primary subsector that is looking ahead to a potential expansion of the programme to two years. At the same time, the subsector continues to face challenges with ensuring a consistently high quality of service delivery for all children and ensuring that all vulnerable children have full access to a pre-primary centre, with compensatory programmes as needed for children at risk of falling behind, so work is ongoing to strengthen these aspects.
2.2.3 Plan for universal access, while ensuring the poorest and hardest to reach are not the last to benefit
When a country’s foremost goal is to scale up the pre-primary education system as quickly as possible, there is a strong temptation to first provide services to the children who are easiest to reach – who are typically children living in urban
areas or those from wealthier households and already have advantages relative to their rural or less affluent peers.
Government strategies and plans should plan to reach all children and build a sustainable pre-primary subsector, but they also need to be explicit in ensuring that poorer and harder-to-reach children are not the last to benefit. Prioritizing the most vulnerable children in policies and plans
A World Ready To Learn
55
Mongolia, which has made great strides in expanding pre-primary education services in the last decade (see Figure 2.6), also has the lowest population density in the world, making it difficult to apply a one-size-fits-all approach to early childhood education. Mongolia ensured that children of nomadic families could access early childhood education by designing a programme responding to location, climate and poverty. Since nearly a quarter of Mongolia’s population is nomadic and always on the move, it is operationally and logistically challenging for children to access regular kindergartens. Innovative initiatives to address this challenge have included portable ger (tent) kindergartens that operate as satellite locations seasonally.27 Each ger kindergarten accommodates 20–25 preschool-age children. The kindergartens operate mainly in the summer, for 21 days between June and July, and employ travelling
kindergarten teachers who are often on summer break during these months, thus leveraging trained educators. These facilities provide school readiness programmes as well as time for children to socialize together.
Simultaneously, ger kindergartens have also been used to provide additional classroom space in very densely populated urban areas, affiliated with a fixed facility, in essence doubling facility space. Mongolia’s education policies prioritize and strengthen the value of early childhood education programmes for the whole country and recognize the need for a specific focus on disadvantaged groups of remote rural children and children with disabilities. Preschool education receives more than 20 per cent of the education sector budget – a higher share than in most other countries.28
Seasonal preschools have been developed in Kyrgyzstan to provide services for children residing in the country’s mountainous regions. This is a targeted strategy to expand and improve comprehensive early childhood education for the most vulnerable and disadvantaged children. Other countries are also exploring alternative models to complement the more widely available school-based or public model that cannot always reach all children. The United Republic of Tanzania, for example, is piloting satellite centres to provide pre-primary schooling for children in very remote areas. And Fiji has committed to universal kindergarten programmes and strives to reach those who still do not have access by testing and researching the potential of a mobile ‘kindy’ programme
that reaches the most disadvantaged children living in squatter settlements.
Programmes supported by the UNICEF Country Office in the Philippines, such as the Supervised Neighborhood Play, Kinder Catch-up Education Program (KCEP) and Tahderiyyah, are also designed to reach children in remote, disadvantaged regions. The Tahderiyyah programme provides an alternative for parents in conflict-affected Bangsamoro communities to educate their children in a system that respects their religious values and improves their school readiness. The Department of Education also runs KCEP as an alternative model for children aged 5 and over who are unable to attend or finish kindergarten during the school year.
is ultimately more equitable – and a cost-effective use of limited government resources.
More than one programming approach might be needed to develop a comprehensive universal pre-primary education strategy that caters to the needs and circumstances of all families and children. Luckily, the early childhood education landscape in most countries is diverse, with multiple programme models often implemented by various service providers – public, private, and non-state – with a wide-range of modalities. Figure 2.10 demonstrates both the complexity of provision of early childhood education in many countries that governments need to navigate as well as the tremendous opportunity that exists to leverage diverse programmes and models in order to arrive at an
expansion strategy that could make pre-primary education universal. While many governments will focus their efforts on expanding a particular public pre-primary model (half- or full-day; school or community-based), only by complementing such models with additional programme approaches, alternative and context specific, will we make the universal target achievable.
Efforts to reach universal pre-primary education will require accompanying measures for overcoming exclusion, including pro-poor strategies to fill existing gaps linked to known factors of marginalization and interim approaches tailor-made to fit the country context. Many countries are already demonstrating success in developing equity-focused expansion plans for early childhood education.
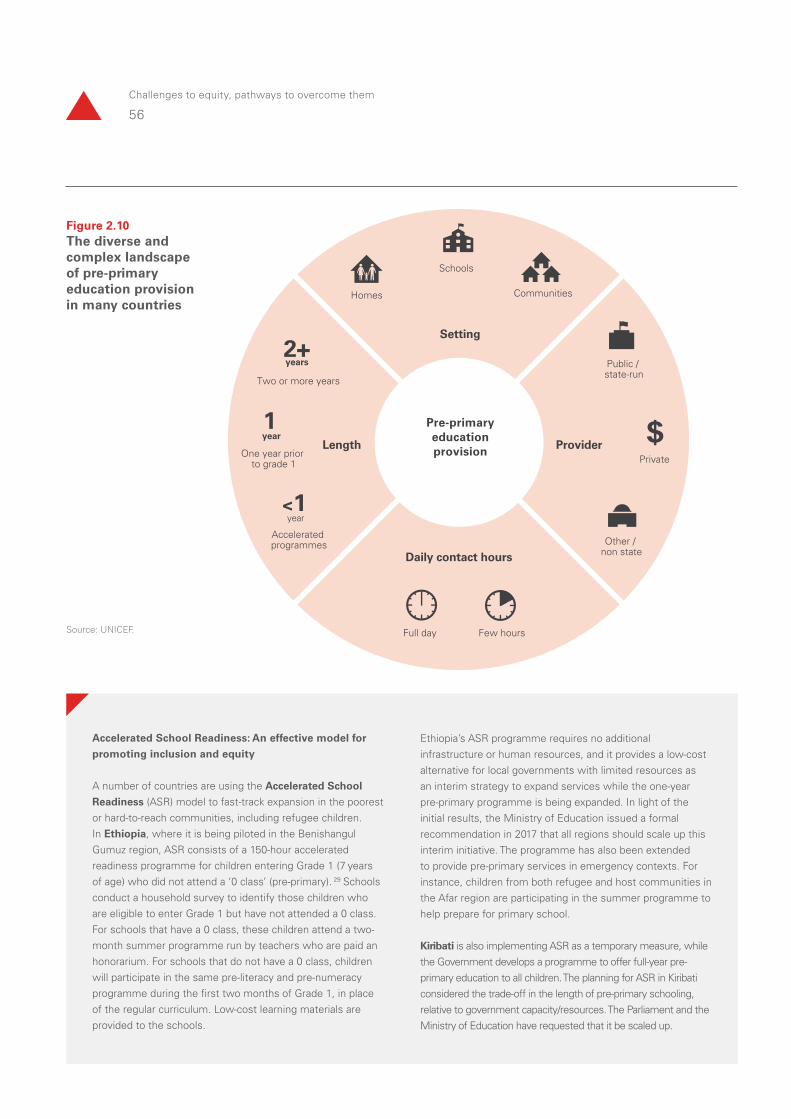
56
Challenges to equity, pathways to overcome them
Accelerated School Readiness: An effective model for
promoting inclusion and equity
A number of countries are using the Accelerated School
Readiness (ASR) model to fast-track expansion in the poorest or hard-to-reach communities, including refugee children. In Ethiopia, where it is being piloted in the Benishangul Gumuz region, ASR consists of a 150-hour accelerated readiness programme for children entering Grade 1 (7 years of age) who did not attend a ‘0 class’ (pre-primary). 29 Schools conduct a household survey to identify those children who are eligible to enter Grade 1 but have not attended a 0 class. For schools that have a 0 class, these children attend a two-month summer programme run by teachers who are paid an honorarium. For schools that do not have a 0 class, children will participate in the same pre-literacy and pre-numeracy programme during the first two months of Grade 1, in place of the regular curriculum. Low-cost learning materials are provided to the schools.
Ethiopia’s ASR programme requires no additional infrastructure or human resources, and it provides a low-cost alternative for local governments with limited resources as an interim strategy to expand services while the one-year pre-primary programme is being expanded. In light of the initial results, the Ministry of Education issued a formal recommendation in 2017 that all regions should scale up this interim initiative. The programme has also been extended to provide pre-primary services in emergency contexts. For instance, children from both refugee and host communities in the Afar region are participating in the summer programme to help prepare for primary school. Kiribati is also implementing ASR as a temporary measure, while the Government develops a programme to offer full-year pre-primary education to all children. The planning for ASR in Kiribati considered the trade-off in the length of pre-primary schooling, relative to government capacity/resources. The Parliament and the Ministry of Education have requested that it be scaled up.
Other / non state
Public / state-run
One year prior to grade 1
Two or more years
Accelerated programmes
Full day
Setting
Length
Daily contact hours
Provider
years
year
year
Few hours
Pre-primary education provision
Private
Homes Communities
Schools
Figure 2.10The diverse and complex landscape of pre-primary education provision in many countries
Source: UNICEF.
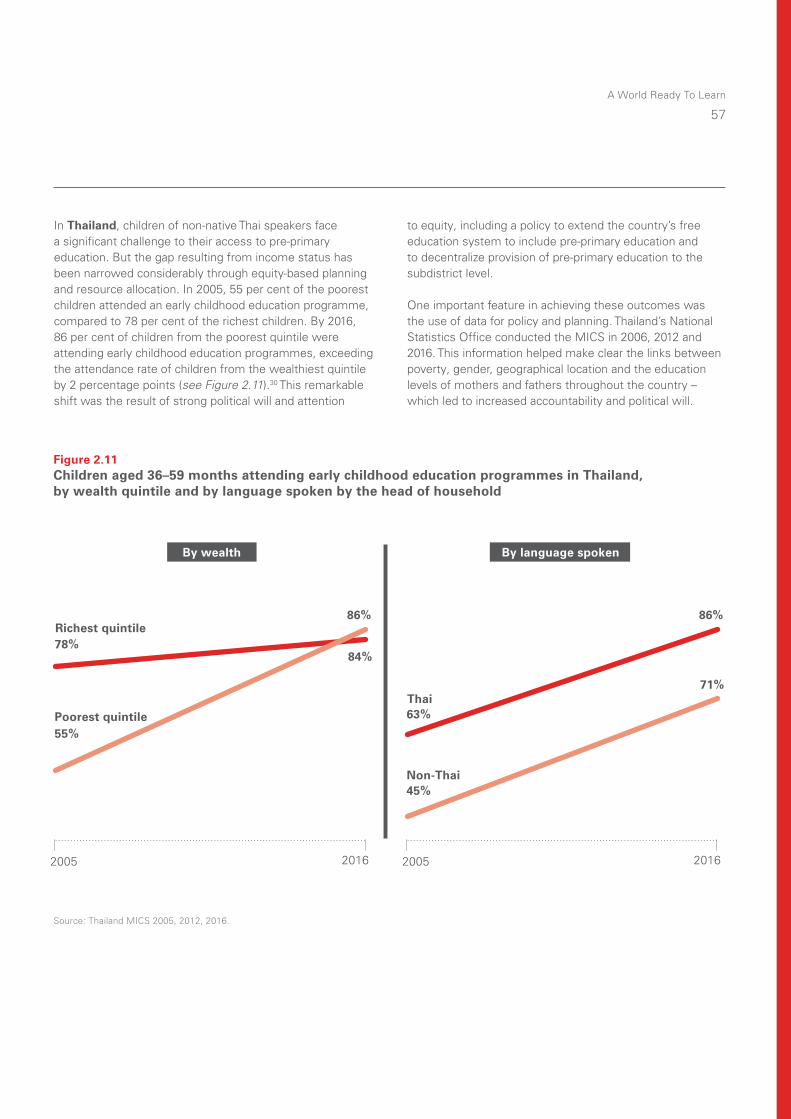
A World Ready To Learn
57
Figure 2.11Children aged 36–59 months attending early childhood education programmes in Thailand, by wealth quintile and by language spoken by the head of household
Source: Thailand MICS 2005, 2012, 2016.
By wealth By language spoken
Poorest quintile
Richest quintile
84%78%
86%
55%
2005 2016
Non-Thai
Thai71%
63%
86%
45%
2005 2016
In Thailand, children of non-native Thai speakers face a significant challenge to their access to pre-primary education. But the gap resulting from income status has been narrowed considerably through equity-based planning and resource allocation. In 2005, 55 per cent of the poorest children attended an early childhood education programme, compared to 78 per cent of the richest children. By 2016, 86 per cent of children from the poorest quintile were attending early childhood education programmes, exceeding the attendance rate of children from the wealthiest quintile by 2 percentage points (see Figure 2.11).30 This remarkable shift was the result of strong political will and attention
to equity, including a policy to extend the country’s free education system to include pre-primary education and to decentralize provision of pre-primary education to the subdistrict level.
One important feature in achieving these outcomes was the use of data for policy and planning. Thailand’s National Statistics Office conducted the MICS in 2006, 2012 and 2016. This information helped make clear the links between poverty, gender, geographical location and the education levels of mothers and fathers throughout the country – which led to increased accountability and political will.
58
Challenges to equity, pathways to overcome them
All of these interventions have one thing in common: they start with a careful consideration of why marginalized communities are not receiving services. Perhaps there is no government policy advocating for equitable access to facilities and services for marginalized populations. Perhaps they are logistically unable to access the facilities. Perhaps they fear that the curriculum is not inclusive of their traditions. Perhaps the fees put services out of reach. The answers will be different in every context and should be found through consultation with members of the marginalized community, as well as other avenues of
inquiry. The results of this investigation hold the keys to implementing an equity-focused pre-primary education strategy. Further, cooperation with other sectors, including health, nutrition and hygiene, will also be needed to make pre-primary services more holistic, accessible and effective. Activities such as deworming and providing nutritious meals and good water and hygiene facilities in preschools have been shown to encourage the participation of poor children in early childhood care and education programmes and effective learning.31
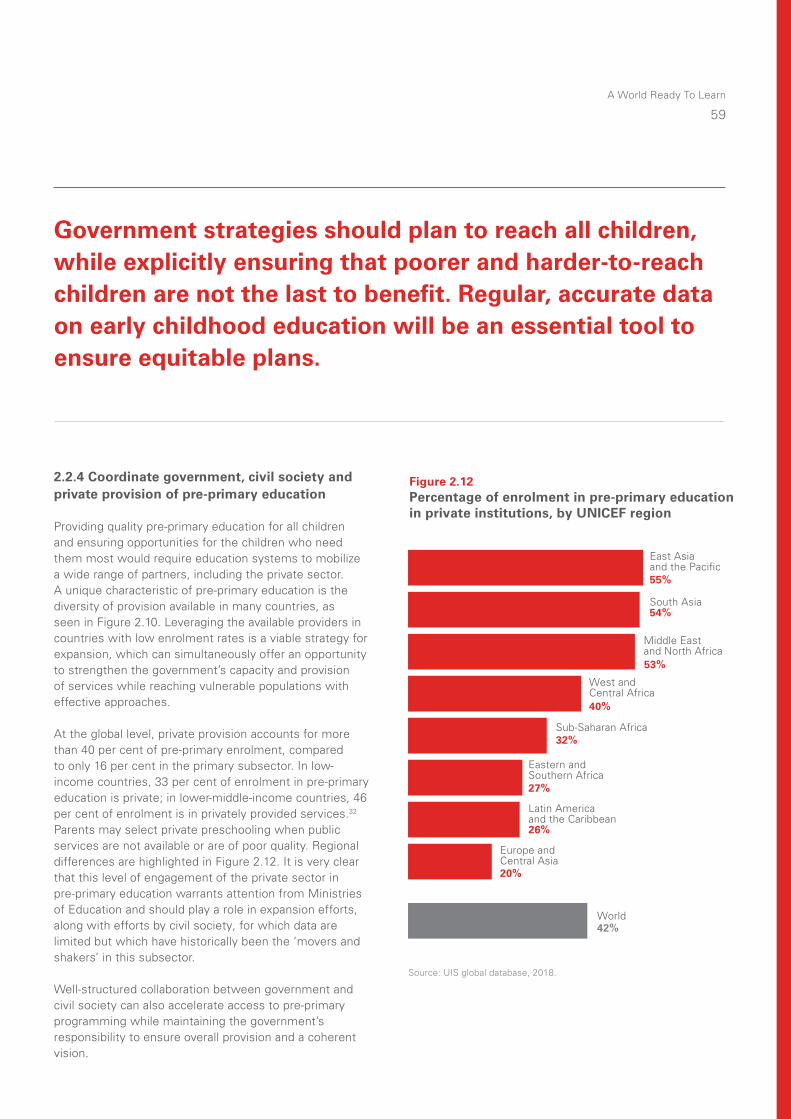
A World Ready To Learn
59
2.2.4 Coordinate government, civil society and private provision of pre-primary education
Providing quality pre-primary education for all children and ensuring opportunities for the children who need them most would require education systems to mobilize a wide range of partners, including the private sector. A unique characteristic of pre-primary education is the diversity of provision available in many countries, as seen in Figure 2.10. Leveraging the available providers in countries with low enrolment rates is a viable strategy for expansion, which can simultaneously offer an opportunity to strengthen the government’s capacity and provision of services while reaching vulnerable populations with effective approaches.
At the global level, private provision accounts for more than 40 per cent of pre-primary enrolment, compared to only 16 per cent in the primary subsector. In low-income countries, 33 per cent of enrolment in pre-primary education is private; in lower-middle-income countries, 46 per cent of enrolment is in privately provided services.32 Parents may select private preschooling when public services are not available or are of poor quality. Regional differences are highlighted in Figure 2.12. It is very clear that this level of engagement of the private sector in pre-primary education warrants attention from Ministries of Education and should play a role in expansion efforts, along with efforts by civil society, for which data are limited but which have historically been the ‘movers and shakers’ in this subsector.
Well-structured collaboration between government and civil society can also accelerate access to pre-primary programming while maintaining the government’s responsibility to ensure overall provision and a coherent vision.
Figure 2.12Percentage of enrolment in pre-primary education in private institutions, by UNICEF region
Source: UIS global database, 2018.
East Asia and the Pacific55%
53%
54%
27%
26%
20%
40%
32%
42%
South Asia
Europe and Central Asia
Latin America and the Caribbean
Eastern and Southern Africa
Sub-Saharan Africa
Middle East and North Africa
West and Central Africa
World
Government strategies should plan to reach all children, while explicitly ensuring that poorer and harder-to-reach children are not the last to benefit. Regular, accurate data on early childhood education will be an essential tool to ensure equitable plans.
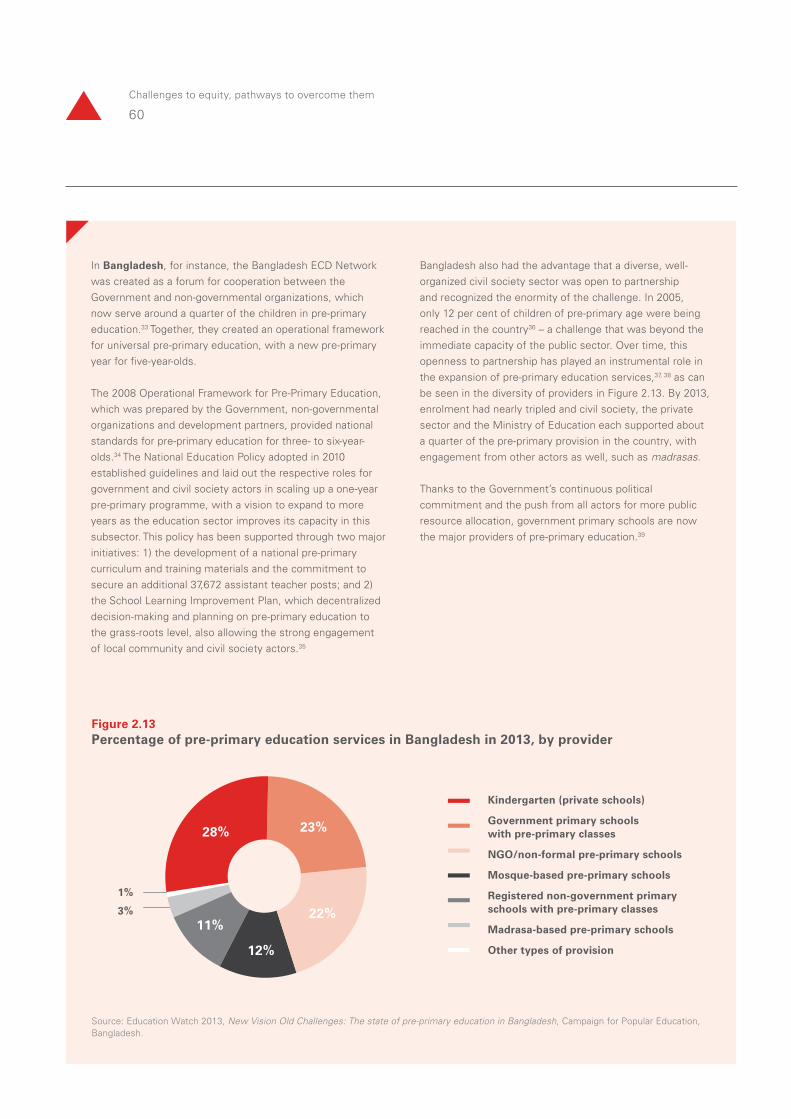
60
Challenges to equity, pathways to overcome them
In Bangladesh, for instance, the Bangladesh ECD Network was created as a forum for cooperation between the Government and non-governmental organizations, which now serve around a quarter of the children in pre-primary education.33 Together, they created an operational framework for universal pre-primary education, with a new pre-primary year for five-year-olds.
The 2008 Operational Framework for Pre-Primary Education, which was prepared by the Government, non-governmental organizations and development partners, provided national standards for pre-primary education for three- to six-year-olds.34 The National Education Policy adopted in 2010 established guidelines and laid out the respective roles for government and civil society actors in scaling up a one-year pre-primary programme, with a vision to expand to more years as the education sector improves its capacity in this subsector. This policy has been supported through two major initiatives: 1) the development of a national pre-primary curriculum and training materials and the commitment to secure an additional 37,672 assistant teacher posts; and 2) the School Learning Improvement Plan, which decentralized decision-making and planning on pre-primary education to the grass-roots level, also allowing the strong engagement of local community and civil society actors.35
Bangladesh also had the advantage that a diverse, well-organized civil society sector was open to partnership and recognized the enormity of the challenge. In 2005, only 12 per cent of children of pre-primary age were being reached in the country36 – a challenge that was beyond the immediate capacity of the public sector. Over time, this openness to partnership has played an instrumental role in the expansion of pre-primary education services,37, 38 as can be seen in the diversity of providers in Figure 2.13. By 2013, enrolment had nearly tripled and civil society, the private sector and the Ministry of Education each supported about a quarter of the pre-primary provision in the country, with engagement from other actors as well, such as madrasas.
Thanks to the Government’s continuous political commitment and the push from all actors for more public resource allocation, government primary schools are now the major providers of pre-primary education.39
Figure 2.13Percentage of pre-primary education services in Bangladesh in 2013, by provider
Source: Education Watch 2013, New Vision Old Challenges: The state of pre-primary education in Bangladesh, Campaign for Popular Education, Bangladesh.
28% 23%
22%
12%
11%
1%
3%
Kindergarten (private schools)
Government primary schools with pre-primary classes
NGO/non-formal pre-primary schools
Mosque-based pre-primary schools
Registered non-government primary schools with pre-primary classes
Madrasa-based pre-primary schools
Other types of provision
A World Ready To Learn
61
Sri Lanka and Indonesia are other examples of the potential coordination of private provision to support government efforts to expand access. In Sri Lanka, the pre-primary GER is now over 90 per cent,40 with over 70 per cent of early childhood development centres privately managed.41 In Indonesia, pre-primary education has been growing rapidly, although it lags well behind primary education. Only 5 per cent of enrolment is through public provision;42 most is through communities and private providers. However, as in Sri Lanka, children from poorer families in Indonesia are far less likely to have access to pre-primary education.43
Providing quality early education opportunities to all children often requires mobilizing a wide range of partners, including the private sector and non-governmental organizations. It is important for governments to maintain a central role in quality assurance and standard-setting, including policies to ensure equity of access.
Each of these countries demonstrates the opportunity associated with leveraging the capacity and provision by the private sector and by civil society organizations and underscores the importance of a strong role for government in coordination, quality assurance and standard-setting, including policies to ensure equity of access.
62
Challenges to equity, pathways to overcome them
2.3 Unlocking the potential of universal access
The evidence presented in Chapter 2 supports the premise that ‘progressive universalism’ is the most effective pathway to universal pre-primary education, unlocking its potential to break the intergenerational transmission of inequity and securing sustainable results.
Several countries, including Bangladesh, Ethiopia, Mongolia and Nepal, have shown how such an approach can be adapted to fit a country’s context and capacities. Bangladesh, for example, followed a policy-driven approach, while Nepal followed a planning-driven approach, and policy eventually followed. Ethiopia’s model combined elements of both, although caution is warranted given the limited coverage achieved to date. Mongolia focused squarely on closing the gaps in equitable access. Thailand focused not only on closing the gaps in equitable access but also on improving the quality of services.
The keys to countries’ achievements in making pre-primary education universally accessible are: leadership committed to results; a process for accelerating expansion of services; and an ability to leverage existing resources and institutions in creative ways.
The following recommendations are consistent with the application of progressive universalism to pre-primary education, and with the conviction that by taking action now, it will be possible to dramatically reduce inequities in pre-primary opportunity among children within a generation.
62
Challenges to equity, pathways to overcome them
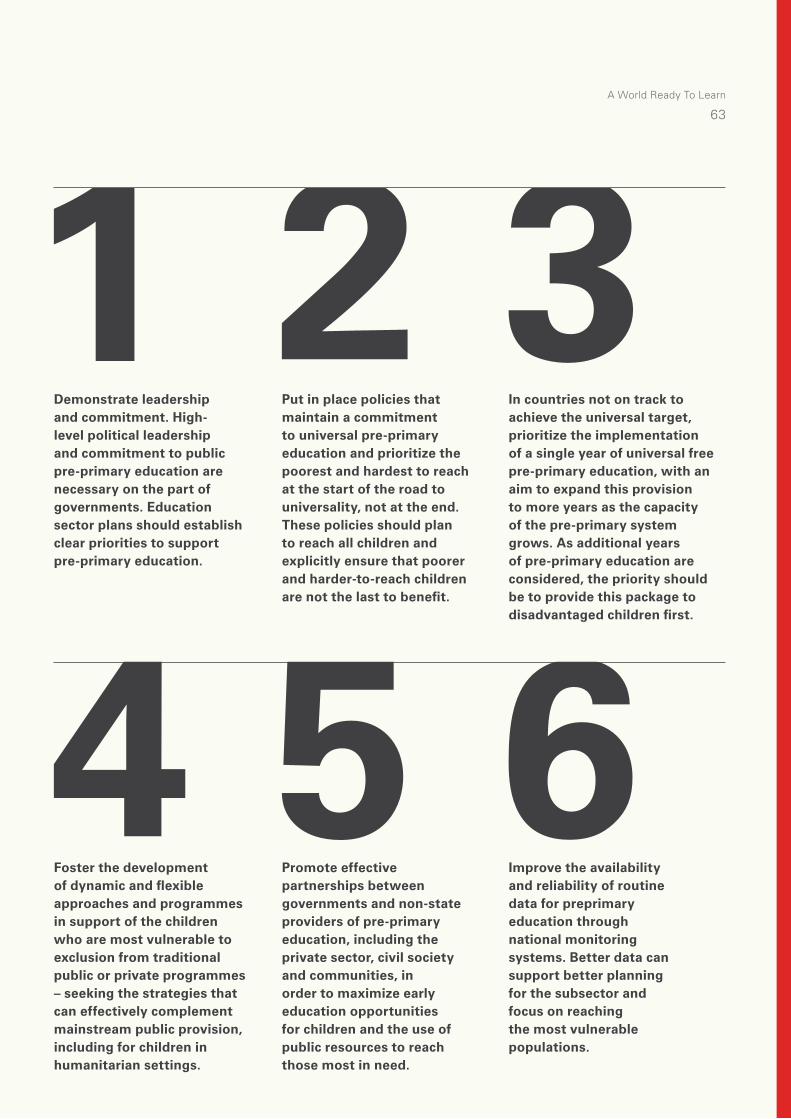
Demonstrate leadership and commitment. High-level political leadership and commitment to public pre-primary education are necessary on the part of governments. Education sector plans should establish clear priorities to support pre-primary education.
Foster the development of dynamic and flexible approaches and programmes in support of the children who are most vulnerable to exclusion from traditional public or private programmes – seeking the strategies that can effectively complement mainstream public provision, including for children in humanitarian settings.
Put in place policies that maintain a commitment to universal pre-primary education and prioritize the poorest and hardest to reach at the start of the road to universality, not at the end. These policies should plan to reach all children and explicitly ensure that poorer and harder-to-reach children are not the last to benefit.
Promote effective partnerships between governments and non-state providers of pre-primary education, including the private sector, civil society and communities, in order to maximize early education opportunities for children and the use of public resources to reach those most in need.
In countries not on track to achieve the universal target, prioritize the implementation of a single year of universal free pre-primary education, with an aim to expand this provision to more years as the capacity of the pre-primary system grows. As additional years of pre-primary education are considered, the priority should be to provide this package to disadvantaged children first.
Improve the availabilityand reliability of routine data for preprimaryeducation through national monitoring systems. Better data can support better planning for the subsector and focus on reaching the most vulnerable populations.
A World Ready To Learn
63
64
Challenges to equity, pathways to overcome them
A World Ready To Learn
65
66
Building pre-primary systems to deliver quality at scale
Building pre-primary systems to deliver quality at scale
Chapter 3
A World Ready To Learn
67
Quality universal pre-primary education requires a systems approach, with pre-primary education recognized and supported on a similar basis to other education subsectors.
Perhaps the greatest lesson learned from Education for All
initiatives during the past decades is that quality and access
must always be linked. All children need to have access to
pre-primary education, but low-quality programmes depress
demand, waste resources and do little to close the learning
gap for disadvantaged children. This is made clear in UNICEF’s
analysis for this report, as well as the existing research.1,2
This chapter3 addresses the crucial question: How can pre-primary education systems progressively reach all children and improve quality at the same time? It begins with a definition of ‘quality’ within the conceptual framework for effective pre-primary education systems and calls for a systems-strengthening approach to the subsector – with pre-primary education recognized and supported on a similar basis to other education subsectors, and pre-primary teachers recognized as the driving force needed to achieve quality pre-primary programmes.
Because the human and financial resources available to governments are finite, there are predictable trade-offs governments will face as they expand access to pre-primary education. But, here, the choices are discussed within the perspective of win–win approaches that embrace quality as an essential component of successful expansion, similar to equity, as outlined in the previous chapter. Further, it addresses the appropriate role of governments in terms of quality assurance in a sector that has multiple service providers, and where active engagement with parents and other care providers is vital to long-term success.

68
Building pre-primary systems to deliver quality at scale
3.1 The meaning of ‘quality’ and its vital role in pre-primary education
Definitions of ‘quality’ in pre-primary programmes are contextually and culturally bound and do not necessarily stay the same over time.4 But quality can nonetheless be conceptualized as culminating in the day-to-day experiences and interactions that have the most immediate influence on children. Fundamentally, quality in pre-primary education is measured by how well the learning environment supports children in gaining the knowledge and skills that will enable them to develop intellectually, physically, socially and emotionally.
The basic elements of UNICEF’s conceptual framework for an effective pre-primary subsector5 are shown in Figure 3.1.
In this framework, quality is not a stand-alone entity of education for young children, but the sum of many interlinked components, including teachers, families and communities, quality assurance, planning and use of resources, and a curriculum designed to help children learn and grow to their full potential.
Building this system can deliver quality programmes at scale, but no single component will lead to quality education if the others are under-resourced or neglected. Four principles guide how the elements should be linked:
Equity: Decisions about pre-primary services must ensure fair access for all children.
Efficiency: Thoughtful, evidence-based decisions must consider how to create the greatest benefits with the available resources.
Responsiveness: The design of pre-primary systems and services must take local contexts, cultures and needs into account and be nimble and responsive as the system grows.
Coordination: The process of developing the pre-primary subsector must reflect dynamic, ongoing interactions with other subsectors (i.e., primary education), as well as other sectors beyond education.
Quality pre-primary classrooms, which feature positive teaching approaches and interactions, lead to greater gains for children in their academic, language and executive function skills.6 In comparison to children who attend lower-quality programmes – and those who do not have any access –, children who experience higher-quality pre-primary education show better outcomes in the short term and well into the future.7
However, it is also clear that low-quality programmes compromise learning and development. If early education programmes take place in overcrowded or unstimulating environments, with curricula that are not suitable for young children, the gains individual children can make through their participation will be limited. In fact, poor-quality early childhood education can be potentially harmful through the overemphasis on testing8 or the use of inappropriate teaching methods. By reducing demand, low quality will also restrict efforts to achieve universal access.
Data from many countries suggest that insufficient attention has been paid to ensuring the quality of services during the expansion of pre-primary education.9,10 Research from Nepal, South Africa and the United Republic of Tanzania demonstrates that rapid expansion of pre-primary coverage in those countries has left gaps in learning for children in the poorest regions.11,12,13 In South Africa, during the expansion of the Grade R class,14 teachers received less support in poorer districts during the initial expansion phase, leading to a two-tiered system of quality based on the overall wealth of the district.15 In Nepal, as mentioned in Chapter 2, quality remains a challenge despite impressive progress in access.
Without adequate safeguards to ensure quality, expansion efforts can have the adverse effect of intensifying education inequities. When access to pre-primary education expands, it is ever more urgent that trade-offs affecting access and quality be understood and addressed. Trade-offs that reduce quality can, and must, be avoided.
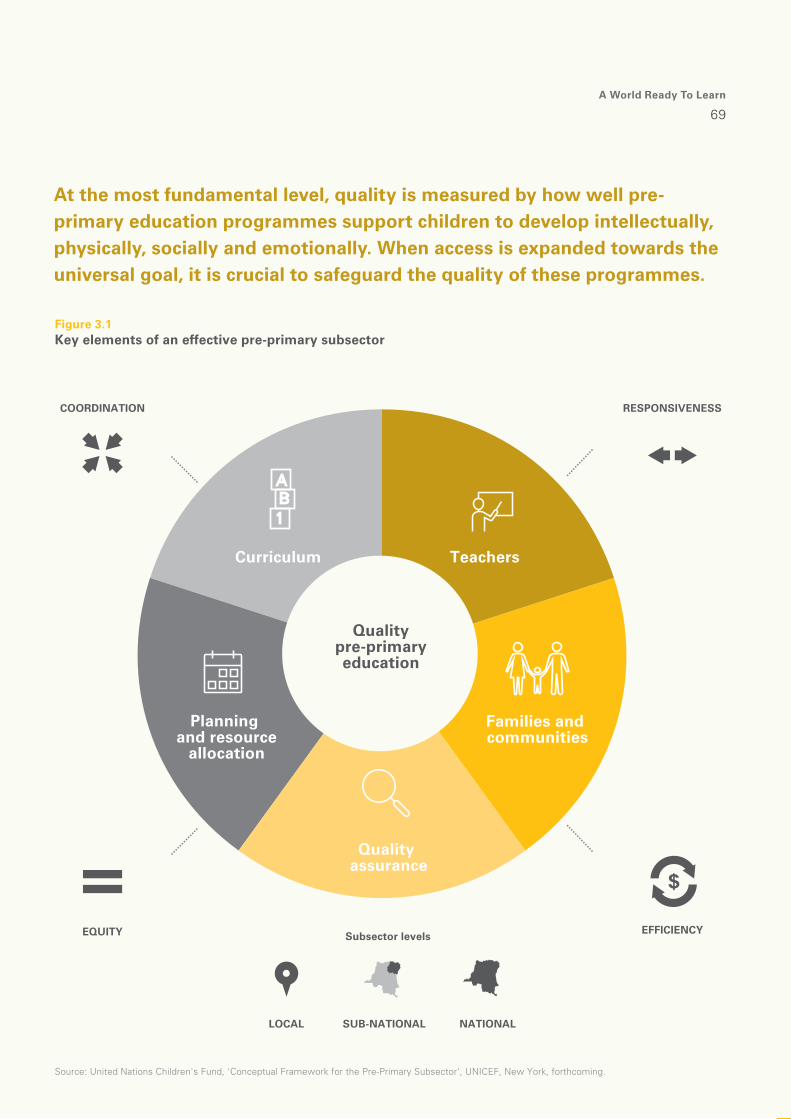
A World Ready To Learn
69
At the most fundamental level, quality is measured by how well pre-primary education programmes support children to develop intellectually, physically, socially and emotionally. When access is expanded towards the universal goal, it is crucial to safeguard the quality of these programmes.
COORDINATION RESPONSIVENESS
LOCAL NATIONAL
Subsector levels
SUB-NATIONAL
Qualitypre-primaryeducation
Planning and resource
allocation
Quality assurance
Families and communities
TeachersCurriculum
Figure 3.1Key elements of an effective pre-primary subsector
Source: United Nations Children's Fund, 'Conceptual Framework for the Pre-Primary Subsector', UNICEF, New York, forthcoming.
EQUITY EFFICIENCY
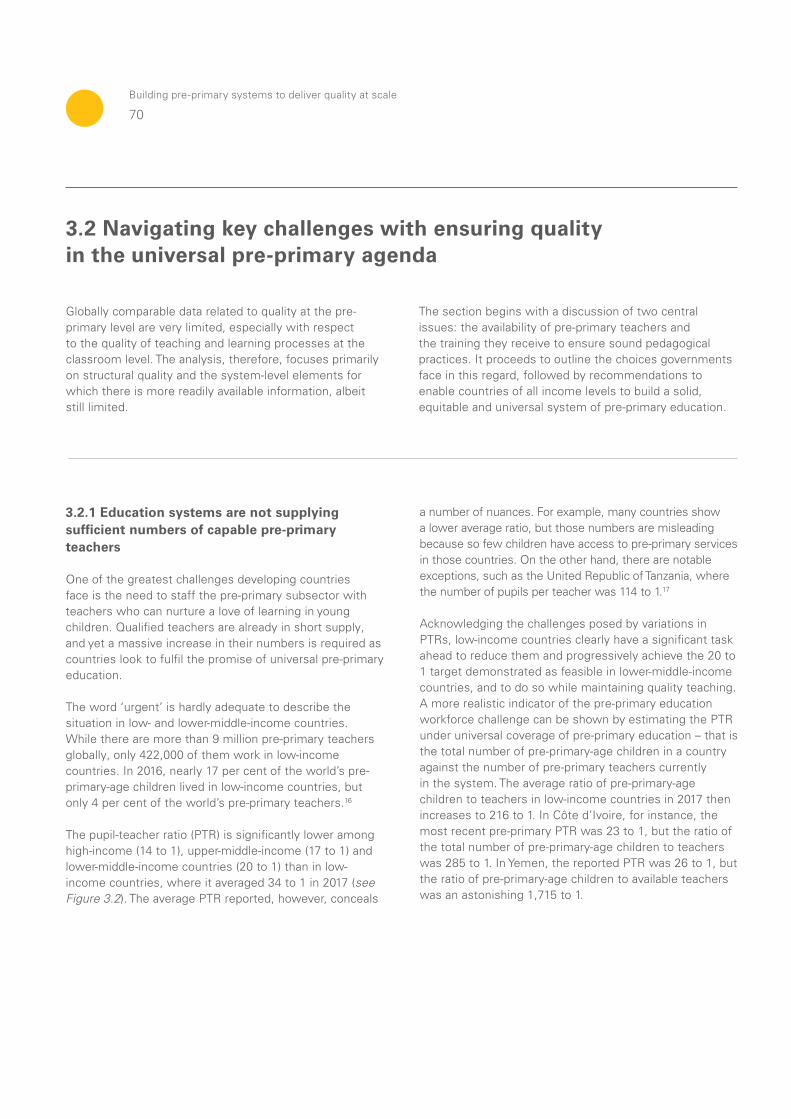
70
Building pre-primary systems to deliver quality at scale
Globally comparable data related to quality at the pre-primary level are very limited, especially with respect to the quality of teaching and learning processes at the classroom level. The analysis, therefore, focuses primarily on structural quality and the system-level elements for which there is more readily available information, albeit still limited.
The section begins with a discussion of two central issues: the availability of pre-primary teachers and the training they receive to ensure sound pedagogical practices. It proceeds to outline the choices governments face in this regard, followed by recommendations to enable countries of all income levels to build a solid, equitable and universal system of pre-primary education.
3.2 Navigating key challenges with ensuring quality in the universal pre-primary agenda
3.2.1 Education systems are not supplying sufficient numbers of capable pre-primary teachers
One of the greatest challenges developing countries face is the need to staff the pre-primary subsector with teachers who can nurture a love of learning in young children. Qualified teachers are already in short supply, and yet a massive increase in their numbers is required as countries look to fulfil the promise of universal pre-primary education.
The word ‘urgent’ is hardly adequate to describe the situation in low- and lower-middle-income countries. While there are more than 9 million pre-primary teachers globally, only 422,000 of them work in low-income countries. In 2016, nearly 17 per cent of the world’s pre-primary-age children lived in low-income countries, but only 4 per cent of the world’s pre-primary teachers.16
The pupil-teacher ratio (PTR) is significantly lower among high-income (14 to 1), upper-middle-income (17 to 1) and lower-middle-income countries (20 to 1) than in low-income countries, where it averaged 34 to 1 in 2017 (see Figure 3.2). The average PTR reported, however, conceals
a number of nuances. For example, many countries show a lower average ratio, but those numbers are misleading because so few children have access to pre-primary services in those countries. On the other hand, there are notable exceptions, such as the United Republic of Tanzania, where the number of pupils per teacher was 114 to 1.17
Acknowledging the challenges posed by variations in PTRs, low-income countries clearly have a significant task ahead to reduce them and progressively achieve the 20 to 1 target demonstrated as feasible in lower-middle-income countries, and to do so while maintaining quality teaching. A more realistic indicator of the pre-primary education workforce challenge can be shown by estimating the PTR under universal coverage of pre-primary education – that is the total number of pre-primary-age children in a country against the number of pre-primary teachers currently in the system. The average ratio of pre-primary-age children to teachers in low-income countries in 2017 then increases to 216 to 1. In Côte d’Ivoire, for instance, the most recent pre-primary PTR was 23 to 1, but the ratio of the total number of pre-primary-age children to teachers was 285 to 1. In Yemen, the reported PTR was 26 to 1, but the ratio of pre-primary-age children to available teachers was an astonishing 1,715 to 1.
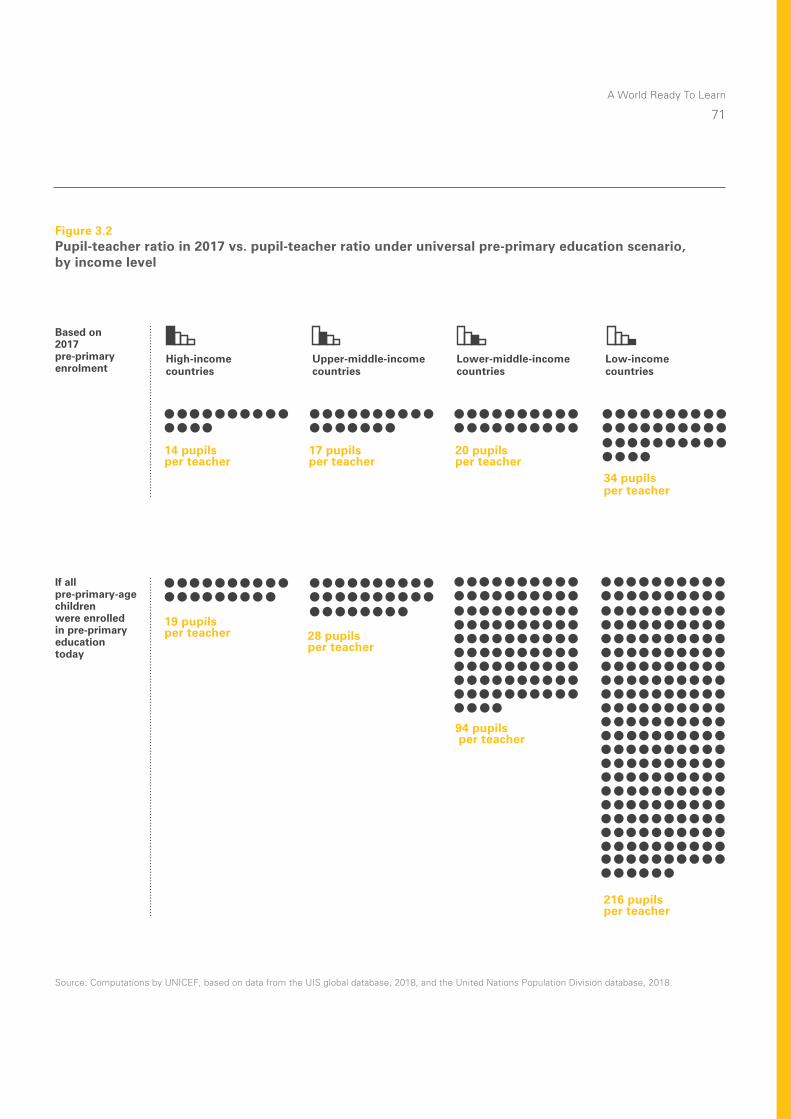
A World Ready To Learn
71
Source: Computations by UNICEF, based on data from the UIS global database, 2018, and the United Nations Population Division database, 2018.
Figure 3.2Pupil-teacher ratio in 2017 vs. pupil-teacher ratio under universal pre-primary education scenario, by income level
20 pupils per teacher
94 pupils per teacher
Lower-middle-income countries
34 pupils per teacher
216 pupils per teacher
Low-income countries
14 pupils per teacher
19 pupils per teacher
High-income countries
17 pupils per teacher
28 pupils per teacher
Upper-middle-income countries
Based on 2017 pre-primary enrolment
If all pre-primary-age children were enrolled in pre-primary education today
72
Building pre-primary systems to deliver quality at scale
Smaller PTRs and group sizes are a key predictor of child outcomes in the early years and support positive relationships between staff and children in centres for children of age 3–6 in most research studies conducted.18 In 2016, there were 9.7 million pre-primary teachers globally. Assuming a PTR of 20 to 1,19 the world will need 9.3 million new teachers to meet the universal target for pre-primary education by 2030. Nearly 90 per cent of these teachers will be needed in low- and lower-middle-income countries, as shown in Figure 3.3. The projections for 2030 consider the expected increase in the pre-primary population, which will be highest in low- and lower-middle-income countries.
Projected number of additional teachers needed by 2030
Number of teachers in 2016
100,000 teachers
Source: Computations by UNICEF, based on data from the UIS global database and the United Nations Population Division database, 2018.
Figure 3.3Projected number of teachers needed in 2030 to achieve universal access to pre-primary education, by income level
269,000 additional teachers
High-income countries
2,973,000 additional teachers
Low-income countries
743,000 additional teachers
Upper-middle-income countries
5,352,000 additional teachers
Lower-middle-income countries
Together, low- and lower-middle-income countries are home to more than 60 per cent of the world’s pre-primary-age children, but scarcely 32 per cent of all pre-primary teachers.
Only 422,000 pre-primary teachers currently teach in low-income countries.
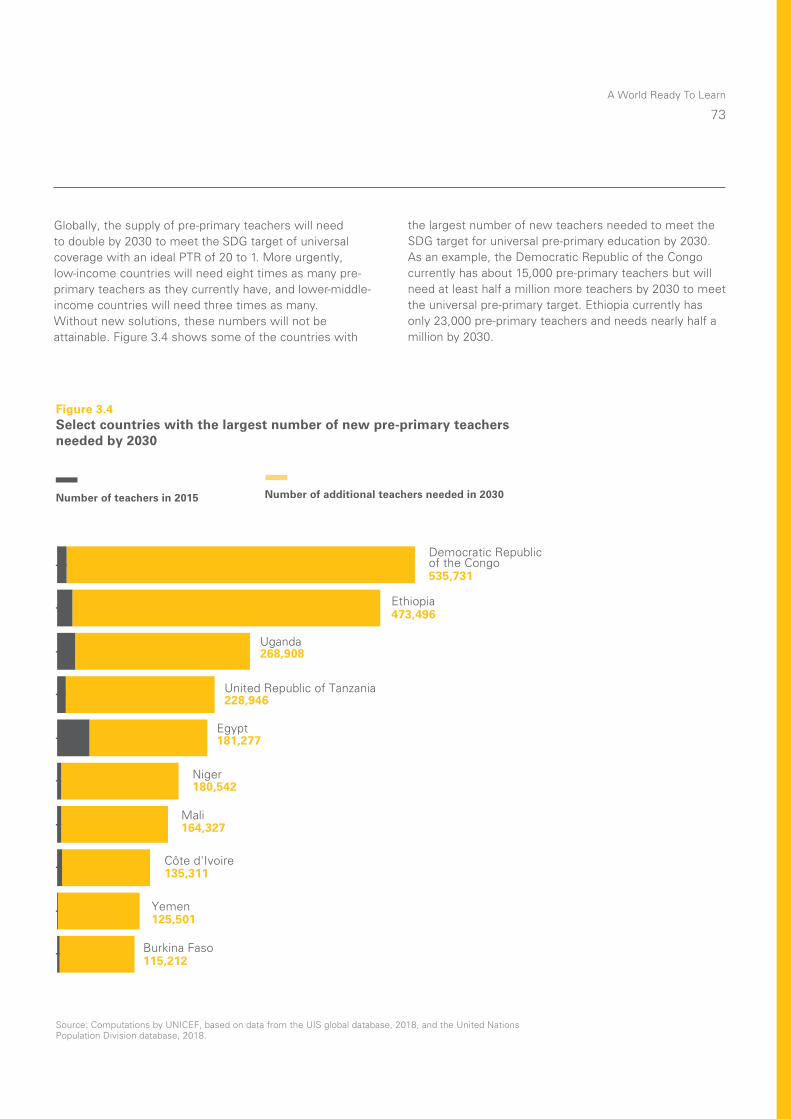
A World Ready To Learn
73
Number of additional teachers needed in 2030Number of teachers in 2015
Figure 3.4Select countries with the largest number of new pre-primary teachers needed by 2030
Democratic Republicof the Congo535,731
Ethiopia473,496
Uganda268,908
United Republic of Tanzania228,946
Egypt181,277
Niger180,542
Mali164,327
Côte d'Ivoire135,311
Yemen125,501
Burkina Faso115,212
Source: Computations by UNICEF, based on data from the UIS global database, 2018, and the United Nations Population Division database, 2018.
Globally, the supply of pre-primary teachers will need to double by 2030 to meet the SDG target of universal coverage with an ideal PTR of 20 to 1. More urgently, low-income countries will need eight times as many pre-primary teachers as they currently have, and lower-middle-income countries will need three times as many. Without new solutions, these numbers will not be attainable. Figure 3.4 shows some of the countries with
the largest number of new teachers needed to meet the SDG target for universal pre-primary education by 2030. As an example, the Democratic Republic of the Congo currently has about 15,000 pre-primary teachers but will need at least half a million more teachers by 2030 to meet the universal pre-primary target. Ethiopia currently has only 23,000 pre-primary teachers and needs nearly half a million by 2030.
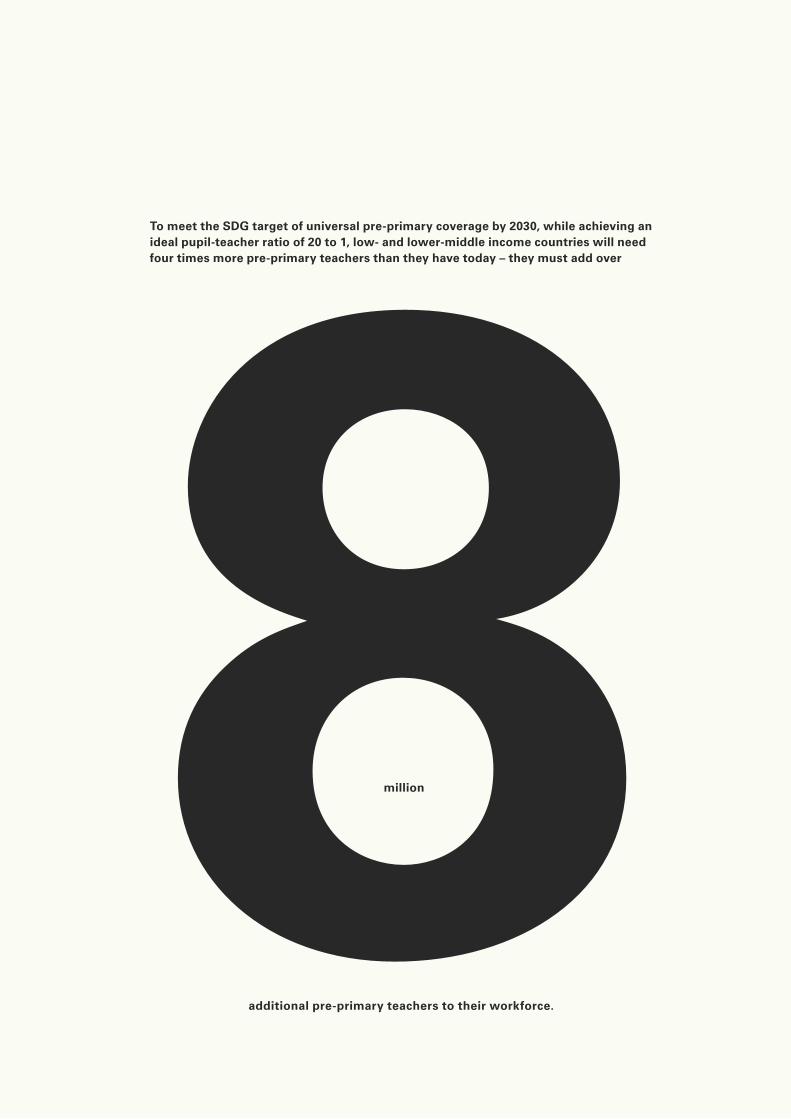
74
Building pre-primary systems to deliver quality at scale
To meet the SDG target of universal pre-primary coverage by 2030, while achieving an ideal pupil-teacher ratio of 20 to 1, low- and lower-middle income countries will need four times more pre-primary teachers than they have today – they must add over
8million
additional pre-primary teachers to their workforce.
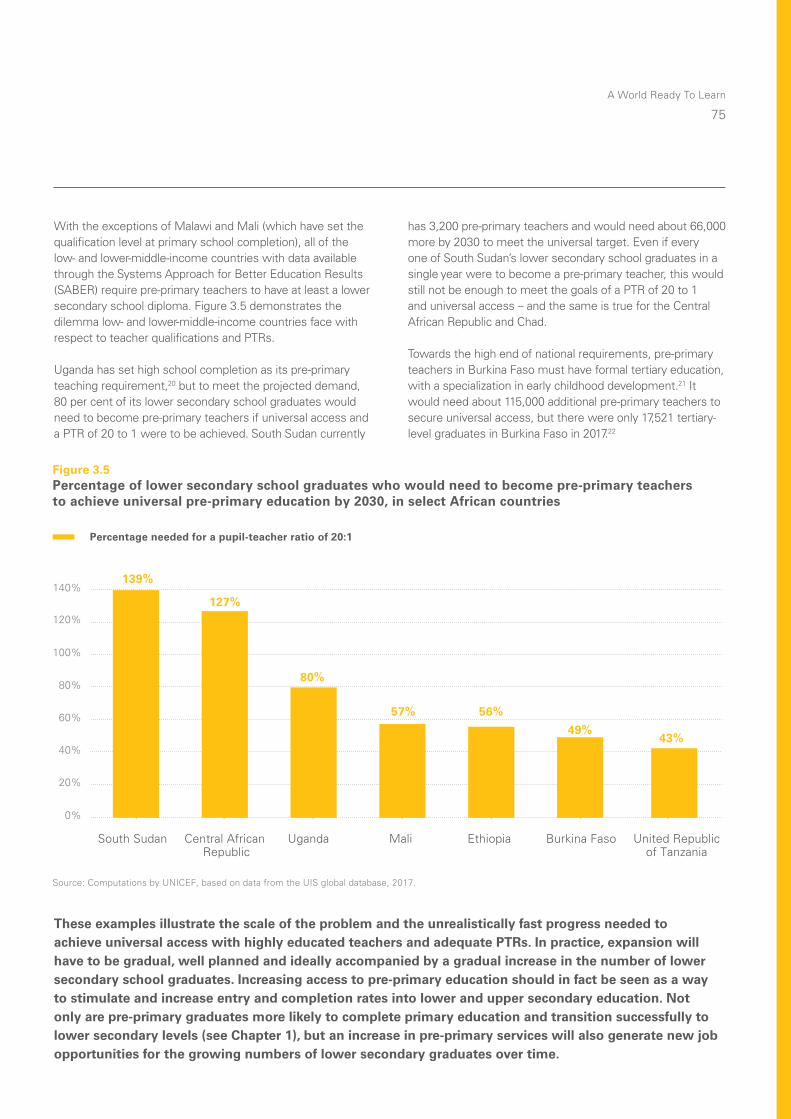
A World Ready To Learn
75
With the exceptions of Malawi and Mali (which have set the qualification level at primary school completion), all of the low- and lower-middle-income countries with data available through the Systems Approach for Better Education Results (SABER) require pre-primary teachers to have at least a lower secondary school diploma. Figure 3.5 demonstrates the dilemma low- and lower-middle-income countries face with respect to teacher qualifications and PTRs.
Uganda has set high school completion as its pre-primary teaching requirement,20 but to meet the projected demand, 80 per cent of its lower secondary school graduates would need to become pre-primary teachers if universal access and a PTR of 20 to 1 were to be achieved. South Sudan currently
has 3,200 pre-primary teachers and would need about 66,000 more by 2030 to meet the universal target. Even if every one of South Sudan’s lower secondary school graduates in a single year were to become a pre-primary teacher, this would still not be enough to meet the goals of a PTR of 20 to 1 and universal access – and the same is true for the Central African Republic and Chad.
Towards the high end of national requirements, pre-primary teachers in Burkina Faso must have formal tertiary education, with a specialization in early childhood development.21 It would need about 115,000 additional pre-primary teachers to secure universal access, but there were only 17,521 tertiary-level graduates in Burkina Faso in 2017.22
20%
0%
40%
60%
80%
100%
120%
140%
Figure 3.5Percentage of lower secondary school graduates who would need to become pre-primary teachers to achieve universal pre-primary education by 2030, in select African countries
South Sudan Central African Republic
Uganda Mali Ethiopia Burkina Faso United Republicof Tanzania
127%
139%
80%
57% 56%
49%43%
Source: Computations by UNICEF, based on data from the UIS global database, 2017.
Percentage needed for a pupil-teacher ratio of 20:1
These examples illustrate the scale of the problem and the unrealistically fast progress needed to achieve universal access with highly educated teachers and adequate PTRs. In practice, expansion will have to be gradual, well planned and ideally accompanied by a gradual increase in the number of lower secondary school graduates. Increasing access to pre-primary education should in fact be seen as a way to stimulate and increase entry and completion rates into lower and upper secondary education. Not only are pre-primary graduates more likely to complete primary education and transition successfully to lower secondary levels (see Chapter 1), but an increase in pre-primary services will also generate new job opportunities for the growing numbers of lower secondary graduates over time.
76
Building pre-primary systems to deliver quality at scale
3.2.2 Pre-primary teachers need stronger support
Every teacher’s ability to create an engaging environment through sensitive, positive and stimulating interactions with young children makes a major difference in children’s learning and development.23 Smaller group sizes may facilitate these kinds of interactions, but specialized training in early childhood education – augmented with ongoing support and professional development – help build the skills needed for pre-primary teachers to understand how young children learn and develop, and build relationships with children and their families.24
A core objective of pre- and in-service training programmes must be to transform pre-primary education to make it the foundation of a dynamic education sector focused on children’s learning and developmental needs.
A national impact evaluation in Bhutan considered quality from the perspective of a wide range of factors that affect the classroom environment, including the availability of teaching and learning materials, the teacher’s ability to promote and stimulate interactions with and among children, and the teacher’s ability to foster a nurturing environment. The study found that children attending classrooms that addressed these issues demonstrated, on average, a much higher gain in learning and development than children in lower-quality classrooms (28 per cent vs. 11 per cent).25
In addition to recruiting and training new teachers, many of those who are already in the system need opportunities to enhance their skills.
In sub-Saharan Africa, the share of trained pre-primary teachers dropped from 57 per cent in 2000 to 46 per cent in 2014, suggesting that early childhood programmes may be scaling up without a sufficient number of trained teachers to ensure quality.26 SABER is the only source to date on early childhood education teacher qualifications, and the limited data indicate that only 5 of the 13 low-income countries with available data provide specialized early childhood development/education training for pre-primary teacher candidates. It is important to note that the extent and quality of the training provided or available across countries is not documented in global databases, and it is likely this training is inadequate to ensure effective pedagogical approaches for young children.
Very few low- and lower-middle-income countries systematically offer in-service training opportunities for pre-primary teachers. The absence of regular in-service professional development impedes pre-primary teachers’ ability to maintain and improve their competencies or upgrade skillsets, and thus impacts the quality of their teaching.
SABER data indicate that just over one third of low-income countries with data have some form of in-service training for pre-primary teachers at least every two years; it is only mandatory in two of these countries.
Distinctive characteristics of the pre-primary teaching
workforce
Although there are variations among countries, pre-primary teachers globally tend to be younger than teachers of other levels – a factor that indicates they have fewer years of professional experience.
In Kenya, while half of primary teachers in 2005 were over age 50, only 13 per cent of pre-primary teachers were age 50 or older. In Jordan, 80 per cent of pre-primary teachers
were below age 30 in 2006.27 In almost all countries, the share of women among pre-primary teachers is greater than among primary teachers.
In fact in 2017, according to UIS data, the percentage of female teachers at pre-primary level in low and lower-middle-income countries was 86 per cent and 88 per cent, respectively. This is much higher than percentage of female teachers at the primary level in these countries, which stood at 41 per cent and 59 per cent respectively.

A World Ready To Learn
77
In low-income countries, in 2017, only 50 per cent of pre-primary teachers
had received training, compared to 74 per cent at the primary level.28
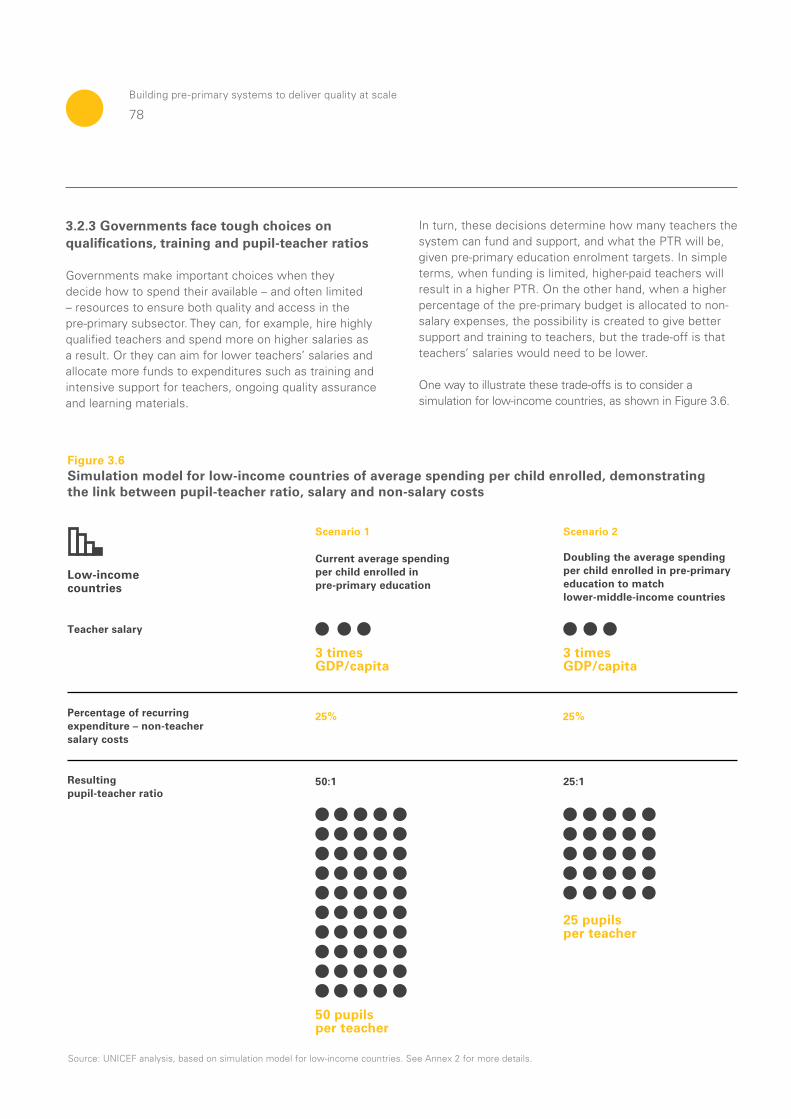
78
Building pre-primary systems to deliver quality at scale
3.2.3 Governments face tough choices on qualifications, training and pupil-teacher ratios
Governments make important choices when they decide how to spend their available – and often limited – resources to ensure both quality and access in the pre-primary subsector. They can, for example, hire highly qualified teachers and spend more on higher salaries as a result. Or they can aim for lower teachers’ salaries and allocate more funds to expenditures such as training and intensive support for teachers, ongoing quality assurance and learning materials.
In turn, these decisions determine how many teachers the system can fund and support, and what the PTR will be, given pre-primary education enrolment targets. In simple terms, when funding is limited, higher-paid teachers will result in a higher PTR. On the other hand, when a higher percentage of the pre-primary budget is allocated to non-salary expenses, the possibility is created to give better support and training to teachers, but the trade-off is that teachers’ salaries would need to be lower.
One way to illustrate these trade-offs is to consider a simulation for low-income countries, as shown in Figure 3.6.
Figure 3.6Simulation model for low-income countries of average spending per child enrolled, demonstrating the link between pupil-teacher ratio, salary and non-salary costs
Source: UNICEF analysis, based on simulation model for low-income countries. See Annex 2 for more details.
Teacher salary
Percentage of recurring expenditure – non-teacher salary costs
Low-income countries
Resulting pupil-teacher ratio
3 timesGDP/capita
Current average spending per child enrolled in pre-primary education
Scenario 1
25%
50:1
50 pupils per teacher
25%
3 times GDP/capita
Scenario 2
Doubling the average spending per child enrolled in pre-primary education to match lower-middle-income countries
25:1
25 pupils per teacher
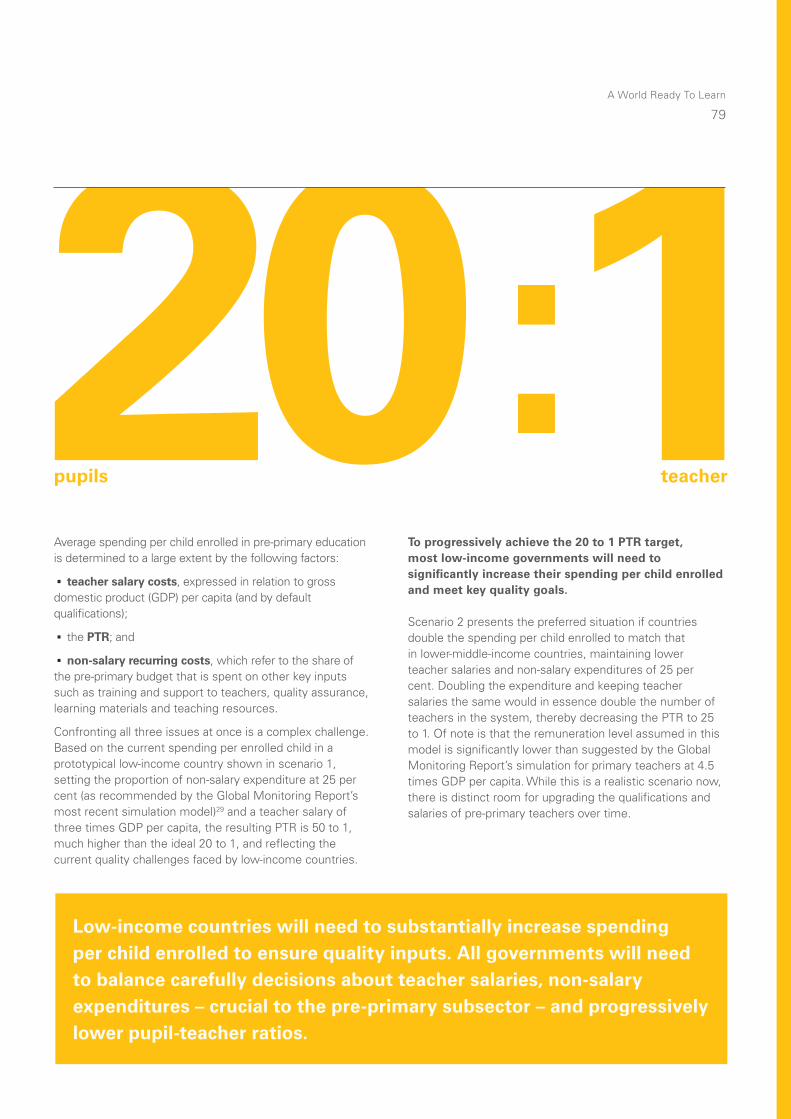
A World Ready To Learn
79
pupils teacher
Low-income countries will need to substantially increase spending per child enrolled to ensure quality inputs. All governments will need to balance carefully decisions about teacher salaries, non-salary expenditures – crucial to the pre-primary subsector – and progressively lower pupil-teacher ratios.
Average spending per child enrolled in pre-primary education is determined to a large extent by the following factors:
· teacher salary costs, expressed in relation to gross domestic product (GDP) per capita (and by default qualifications);
· the PTR; and
· non-salary recurring costs, which refer to the share of the pre-primary budget that is spent on other key inputs such as training and support to teachers, quality assurance, learning materials and teaching resources.
Confronting all three issues at once is a complex challenge. Based on the current spending per enrolled child in a prototypical low-income country shown in scenario 1, setting the proportion of non-salary expenditure at 25 per cent (as recommended by the Global Monitoring Report’s most recent simulation model)29 and a teacher salary of three times GDP per capita, the resulting PTR is 50 to 1, much higher than the ideal 20 to 1, and reflecting the current quality challenges faced by low-income countries.
To progressively achieve the 20 to 1 PTR target, most low-income governments will need to significantly increase their spending per child enrolled and meet key quality goals.
Scenario 2 presents the preferred situation if countries double the spending per child enrolled to match that in lower-middle-income countries, maintaining lower teacher salaries and non-salary expenditures of 25 per cent. Doubling the expenditure and keeping teacher salaries the same would in essence double the number of teachers in the system, thereby decreasing the PTR to 25 to 1. Of note is that the remuneration level assumed in this model is significantly lower than suggested by the Global Monitoring Report’s simulation for primary teachers at 4.5 times GDP per capita. While this is a realistic scenario now, there is distinct room for upgrading the qualifications and salaries of pre-primary teachers over time.
80
Building pre-primary systems to deliver quality at scale
3.2.4 An interim workforce strategy can be used to lower pupil-teacher ratios while maintaining quality
Increases in the pre-primary teacher workforce of the magnitude required in low- and lower-middle-income countries will not happen with a business-as-usual approach. There are simply not enough lower or upper secondary school graduates, and not nearly enough training capacity in the present education systems. Given that allowing PTRs to grow too large would severely damage quality, an entirely new approach is needed. There are two possible paths governments can take:
Education ministries can set high
qualification requirements and spend
more on salaries for better-educated
teachers – thereby expanding access
at a slower pace, given limited
budget, or increasing PTRs to cover
more children with fewer teachers.
This would mean that either PTRs
would grow to accommodate
universal access, or that only a
smaller proportion of children would
benefit from pre-primary education.
Education ministries can hire greater
numbers of teachers with initially lower
academic qualifications but who are
carefully selected and supported to
ensure they are nurturing individuals
capable of providing a positive learning
experience for children. This will allow
for lower PTRs at more affordable
cost, offer the potential to reach more
children in the short term, and begin to
grow the pre-primary education system.
This approach would be accompanied
by significant investment in intensive
ongoing training for teachers and
gradual upgrade of qualifications as well
as a focus on quality control measures.
A World Ready To Learn
81
82
Building pre-primary systems to deliver quality at scale
While high- and upper-middle-income countries may be able to push for well-educated and compensated teachers within their respective budgets, for many low- and lower-middle-income countries, the second approach may be the most achievable path to universal pre-primary coverage by 2030. An interim, two-tiered strategy acknowledges the lack of qualified preschool teachers and insufficient financial resources to cover the salaries of an adequate number of pre-primary teachers immediately. Alternative short-term approaches to growing the pre-primary teaching workforce can succeed if they are part of a long-term plan for continuous upgrades in teacher and programme quality, as the lower and upper secondary subsectors also expand the number of their graduates. This is not only a practical approach, but also backed by evidence. While pre-service educational qualifications
do not guarantee better child outcomes, research is more conclusive that participation in in-service training is the most consistent predictor of quality staff–child interactions and also has direct links to child development and learning.30 Further, providing ongoing professional development and relevant on-the-job training is efficient in supporting children’s learning and ultimately more cost-effective.31 This approach has significant scope for improvements as the system grows and before the quality ceiling is reached, which means that the pre-primary subsector would need to be responsive and alert to ensure continuous improvements could be accommodated.
The examples of the United Republic of Tanzania and Ghana provide insight into the use of interim strategies .
Applying an interim workforce strategy in mainland
Tanzania
The qualifications officially required of pre-primary teachers in mainland Tanzania are the same as those for any primary teacher, which has greatly limited the number of pre-primary teachers who could be hired with the available funds. In 2013, the national ratio of learners to qualified pre-primary teachers was 158 to 1.32 As a coping tactic, many schools secured local paraprofessionals to teach in pre-primary classrooms, with salaries paid by families.
The launch of a new education and training policy that extended free, compulsory education to include one year of pre-primary education eliminated the option of parent-funded paraprofessionals, with negative consequences. Many schools were forced to deploy primary teachers to teach pre-primary classes, in addition to the grades they were already teaching. While this resulted in a slight lowering of the PTR, it remained at an unmanageable 104 to 1 in 2016.33 In response, the Government developed an interim strategy with two key points of policy:
· To bridge the gap in current levels of specialization in pre-primary education, nationwide training was rolled out with the aim of reaching one teacher from every primary school with an orientation on the pre-primary curriculum and pre-primary pedagogy. Further, a national framework for school-based continuous professional development was
approved, and new pre-primary modules were developed, to be piloted in 2018 and rolled out in 2019. The framework provides guidance on how in-service accredited training can be rolled out nationally through a combination of self-study and school-based and cluster meetings, starting initially with a focus on the pre-primary and early primary levels.34
·The option of drawing on paraprofessionals in remote locations and satellite centres is being discussed. Plans have been made to recruit large numbers of paraprofessionals, who will participate in 30-day training programmes. Although an official option for their integration into the workforce has not been put in place, longer-term plans include a professional development pathway to enable paraprofessionals to upgrade their qualifications through long-distance learning.
The interim strategy does not call into question the importance of recruiting fully qualified teachers as an important long-term goal for the Government. But the immediate focus is placed on improving access to pre-primary training for the existing workforce – taking advantage of what is achievable with the existing human resources capacity to improve quality for newly enrolled learners.
A World Ready To Learn
83
Applying an interim training strategy in Ghana
In 2012, Ghana faced persistent challenges with training of kindergarten and primary school teachers (and, consequently, in children’s learning outcomes), as well as disparities between the economically and educationally disadvantaged districts of northern Ghana and the more affluent districts further south. Nearly two thirds of the kindergarten teachers in the disadvantaged districts, and nearly half of the teachers in wealthier districts were untrained. The ratio of pupils to trained teachers across disadvantaged districts was 169 to 1.
With support from a grant from the Global Partnership for Education to improve basic education in the country, the Ministry of Education decided to channel resources into an innovative teacher training programme, under which nearly 8,000 young teachers from disadvantaged districts were selected to receive training. Training took place during the
holiday season (summer break or holidays) and through distance learning, allowing teachers to keep teaching in their schools and in their communities while at the same time upgrading their skills through the Untrained Teachers Diploma in Basic Education (UTDBE) programme. The training was conducted using the same curriculum as the three-year pre-service programme (known as the Diploma in Basic Education or DBE) but took place over four years instead of three.
All nine districts sampled confirmed that the UTDBE programme was used as the main strategy for closing the trained teacher resource gap in their basic schools and had strengthened teacher retention and skills, including the use of teaching and learning materials, in these areas. The percentage of trained teachers at kindergarten level who were a part of the pilot program in disadvantaged districts increased from 34 per cent at baseline to 65 per cent at endline – a remarkable improvement in just a few years.35
To compensate for the lack of qualified teachers with high
academic qualifications and specialized degrees, ministries
of education can expand the workforce by initially lowering
qualification requirements and dedicating more funds to
intensive training and support for teachers.
Greater investments in quality assurance and teaching and
learning materials would be needed, resulting in a higher share
dedicated to non-salary items in total recurrent expenditures.
84
Building pre-primary systems to deliver quality at scale
3.2.5 Quality standards and regulatory mechanisms must be established and their implementation prioritized
Building or rebuilding the pre-primary sector is not an overnight transformation. Quality assurance will need to be established in a progressive manner, with capacity built across the system gradually within the vision for a holistic quality framework (see Section 3.1). Whether considering an interim strategy or already transitioning to a stable, long-term approach for securing universal access, all pre-primary education systems need the capacity to monitor the quality of programmes, and ideally the outcomes for children, and to provide ongoing opportunities for training and other forms of support to educators and service providers.
A well-functioning pre-primary subsector has a quality assurance system that supports greater equity and ensures consistent quality in service delivery. There are typically three aspects covered by such systems:
· development of clear and consistent standards;
· design of a monitoring or regulatory mechanism; and
· data analysis for ongoing improvement, including regular feedback loops to pre-primary institutions.36
Standards ideally include not only contextual factors such as class size and classroom building requirements but also aspects linked to the teaching and learning process – such as teacher skills, classroom practices, curriculum
Only 20 of the 34 countries for which data were available have a public authority in charge of regulating pre-service training for early childhood care and education professionals. In only six of those countries more than half of the early childhood care and education professionals meet pre-service training standards and professional qualifications.
implementation, and the share of the budget made available for non-salary expenditures on quality-enhancing inputs such as teacher training and teaching and learning materials. Standards should ideally be applicable across all providers, but given the wide variations in service provision in pre-primary education, some countries may opt for specific standards for different categories of providers (such as public, private non-profit, private for-profit, community) to ensure that they are held to minimum levels of quality and to oversee the quality of their operations.37
Quality assurance mechanisms in turn need to assess service standards comprehensively. Many countries give inspectors the responsibility for performing ongoing site visits and documenting their reviews – both to determine compliance levels and to support service providers in fulfilling administrative procedures and improving the quality of services. Many middle- and high-income countries, however, have expanded their quality assurance systems and the use of multiple tools and processes, including surveys, interviews, observations and self-evaluation, to collect information from a range of stakeholders (including inspectors, staff, parents and children). The critical element in these efforts is an effective accreditation procedure and relevant incentives for strengthening quality across both public and private institutions in order to enhance and protect children’s development, health and safety.38
While global data on quality standards and quality monitoring in early childhood education are not readily available, SABER data indicate that quality assurance is widely neglected or under-resourced.
If training requirements are inconsistent across public and private provision or by geographical area, this often leads to inequities of quality. In rural and marginalized areas, children at the margins may be taught by those who are also at the margins of the profession. This makes it a necessity for ministries of education to develop a coherent framework for
monitoring the quality of pre-primary programmes across both public and non-state/private providers.
There are notable exceptions and examples of countries working to address quality monitoring gaps and lessons learned that can benefit other efforts.
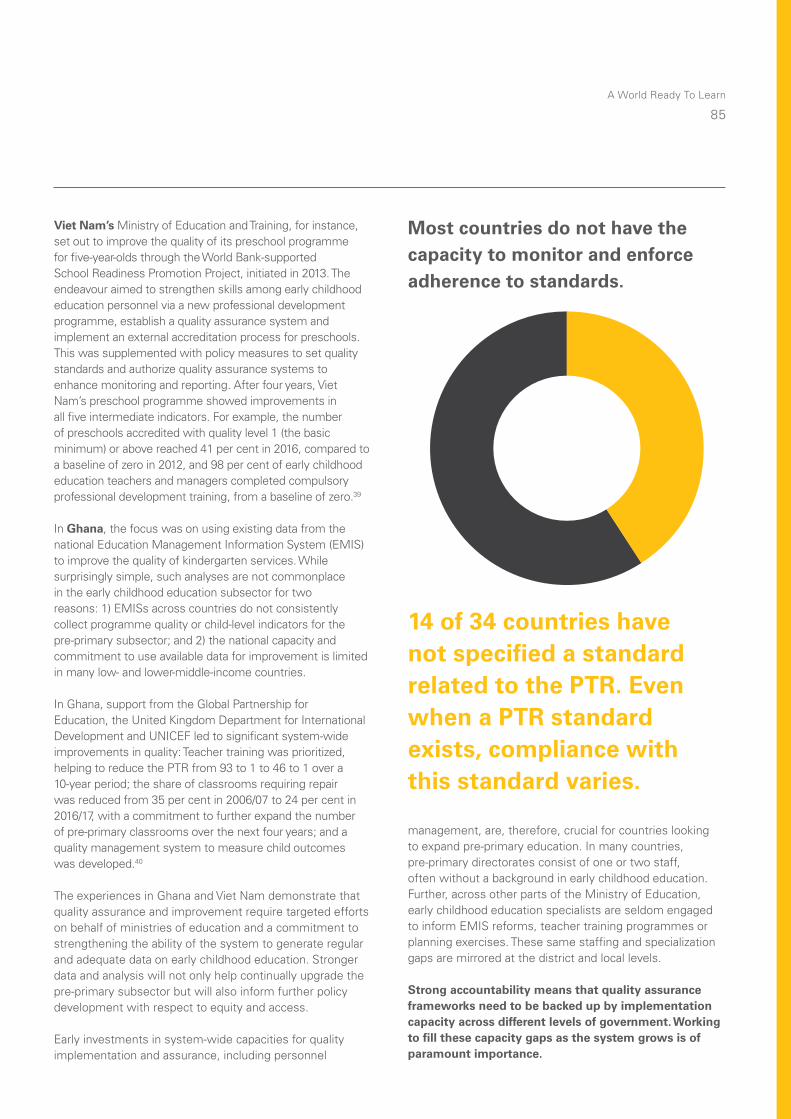
A World Ready To Learn
85
Viet Nam’s Ministry of Education and Training, for instance, set out to improve the quality of its preschool programme for five-year-olds through the World Bank-supported School Readiness Promotion Project, initiated in 2013. The endeavour aimed to strengthen skills among early childhood education personnel via a new professional development programme, establish a quality assurance system and implement an external accreditation process for preschools. This was supplemented with policy measures to set quality standards and authorize quality assurance systems to enhance monitoring and reporting. After four years, Viet Nam’s preschool programme showed improvements in all five intermediate indicators. For example, the number of preschools accredited with quality level 1 (the basic minimum) or above reached 41 per cent in 2016, compared to a baseline of zero in 2012, and 98 per cent of early childhood education teachers and managers completed compulsory professional development training, from a baseline of zero.39
In Ghana, the focus was on using existing data from the national Education Management Information System (EMIS) to improve the quality of kindergarten services. While surprisingly simple, such analyses are not commonplace in the early childhood education subsector for two reasons: 1) EMISs across countries do not consistently collect programme quality or child-level indicators for the pre-primary subsector; and 2) the national capacity and commitment to use available data for improvement is limited in many low- and lower-middle-income countries.
In Ghana, support from the Global Partnership for Education, the United Kingdom Department for International Development and UNICEF led to significant system-wide improvements in quality: Teacher training was prioritized, helping to reduce the PTR from 93 to 1 to 46 to 1 over a 10-year period; the share of classrooms requiring repair was reduced from 35 per cent in 2006/07 to 24 per cent in 2016/17, with a commitment to further expand the number of pre-primary classrooms over the next four years; and a quality management system to measure child outcomes was developed.40
The experiences in Ghana and Viet Nam demonstrate that quality assurance and improvement require targeted efforts on behalf of ministries of education and a commitment to strengthening the ability of the system to generate regular and adequate data on early childhood education. Stronger data and analysis will not only help continually upgrade the pre-primary subsector but will also inform further policy development with respect to equity and access.
Early investments in system-wide capacities for quality implementation and assurance, including personnel
Most countries do not have the capacity to monitor and enforce adherence to standards.
management, are, therefore, crucial for countries looking to expand pre-primary education. In many countries, pre-primary directorates consist of one or two staff, often without a background in early childhood education. Further, across other parts of the Ministry of Education, early childhood education specialists are seldom engaged to inform EMIS reforms, teacher training programmes or planning exercises. These same staffing and specialization gaps are mirrored at the district and local levels.
Strong accountability means that quality assurance frameworks need to be backed up by implementation capacity across different levels of government. Working to fill these capacity gaps as the system grows is of paramount importance.
14 of 34 countries have not specified a standard related to the PTR. Even when a PTR standard exists, compliance with this standard varies.
86
Building pre-primary systems to deliver quality at scale
3.2.6 Implementing a developmentally appropriate and child-centred curriculum is vital
The content of a pre-primary curriculum is an important aspect of quality, and it should be designed to foster the positive learning attitudes in children that will be crucial to their education experience far beyond pre-primary school.
A well-designed curriculum would ideally reflect a child-centred, inclusive approach, promoting holistic learning and development, including emergent language, literacy, numeracy and social-emotional development, through a clear vision and articulation of goals and/or standards for children’s learning and development. Alignment with the primary curriculum (and with curricula that may exist for children aged 0–3 years) to ensure coherence and continuity in learning and development is central to the success of the subsector.46
What is the difference between pre-primary and
primary classrooms?
Pre-primary classrooms are not simply a downward extension of primary classrooms and schools – they are very different in terms of purpose, organization and function. Pre-primary education usually employs play-based, child-centred and active learning techniques to create a nurturing learning environment. Good pre-primary programmes foster and facilitate children’s holistic learning, including key social and emotional skills such as sharing, collaborating and managing feelings.42 This contrasts with what is often a more structured academic approach at the primary level.
Pre-primary education programmes lay a solid foundation for learning emergent skills in language and mathematics and help children develop positive socialization (including positive gender socialization) as they develop personal skills and the ability to plan and make decisions.43 Continuity between pre-primary and primary schooling is important.44 This does not mean succumbing to the all-too-frequent pressure to shift content from primary schooling to pre-primary, but rather nurturing the upward influence of pre-primary practices on primary schooling itself.45
To ensure that funds are available for critical investments in quality assurance and better implementation, governments should aim to reserve 25 per cent of their recurrent pre-primary budgets for non-salary costs such as quality assurance mechanisms, teacher training, learning and teaching materials and curriculum development, which is advised for other subsectors as well.41
Appropriate teaching and learning materials that can support active and child-centred teaching and learning and help teachers accommodate children’s different capacities and learning styles are vital yet often neglected in pre-primary expansion efforts. Curricula ideally include clear standards that help teachers understand their responsibilities and goals and offer enough flexibility to respond to local contexts, reflecting children’s life experiences while encouraging innovation and sharing across providers.47
Again, globally comparable data on curriculum standards are scarce and very few education systems collect routine data related to curriculum implementation.
SABER data show that 24 of 35 countries surveyed have standards for what children should know and be able to do, yet one in three countries with data did not have a curriculum that is approved and available for teachers to use.
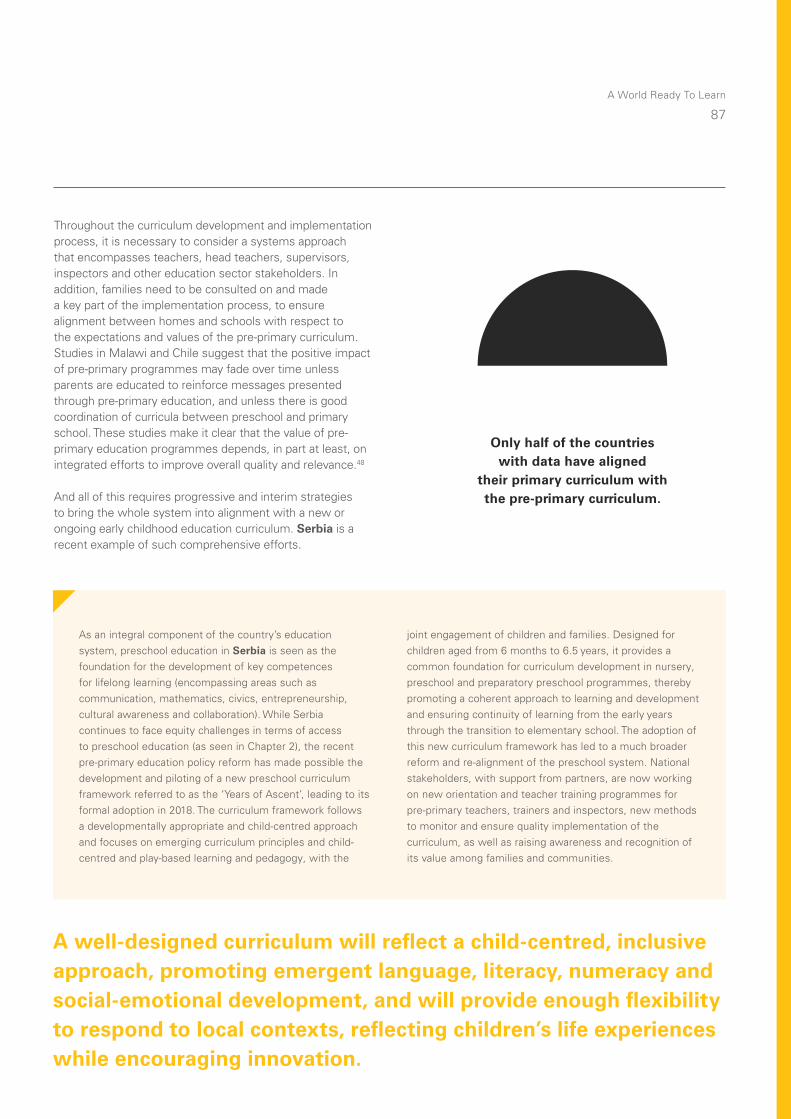
A World Ready To Learn
87
Throughout the curriculum development and implementation process, it is necessary to consider a systems approach that encompasses teachers, head teachers, supervisors, inspectors and other education sector stakeholders. In addition, families need to be consulted on and made a key part of the implementation process, to ensure alignment between homes and schools with respect to the expectations and values of the pre-primary curriculum. Studies in Malawi and Chile suggest that the positive impact of pre-primary programmes may fade over time unless parents are educated to reinforce messages presented through pre-primary education, and unless there is good coordination of curricula between preschool and primary school. These studies make it clear that the value of pre-primary education programmes depends, in part at least, on integrated efforts to improve overall quality and relevance.48
And all of this requires progressive and interim strategies to bring the whole system into alignment with a new or ongoing early childhood education curriculum. Serbia is a recent example of such comprehensive efforts.
As an integral component of the country’s education system, preschool education in Serbia is seen as the foundation for the development of key competences for lifelong learning (encompassing areas such as communication, mathematics, civics, entrepreneurship, cultural awareness and collaboration). While Serbia continues to face equity challenges in terms of access to preschool education (as seen in Chapter 2), the recent pre-primary education policy reform has made possible the development and piloting of a new preschool curriculum framework referred to as the ‘Years of Ascent’, leading to its formal adoption in 2018. The curriculum framework follows a developmentally appropriate and child-centred approach and focuses on emerging curriculum principles and child-centred and play-based learning and pedagogy, with the
joint engagement of children and families. Designed for children aged from 6 months to 6.5 years, it provides a common foundation for curriculum development in nursery, preschool and preparatory preschool programmes, thereby promoting a coherent approach to learning and development and ensuring continuity of learning from the early years through the transition to elementary school. The adoption of this new curriculum framework has led to a much broader reform and re-alignment of the preschool system. National stakeholders, with support from partners, are now working on new orientation and teacher training programmes for pre-primary teachers, trainers and inspectors, new methods to monitor and ensure quality implementation of the curriculum, as well as raising awareness and recognition of its value among families and communities.
A well-designed curriculum will reflect a child-centred, inclusive approach, promoting emergent language, literacy, numeracy and social-emotional development, and will provide enough flexibility to respond to local contexts, reflecting children’s life experiences while encouraging innovation.
Only half of the countries with data have aligned
their primary curriculum with the pre-primary curriculum.
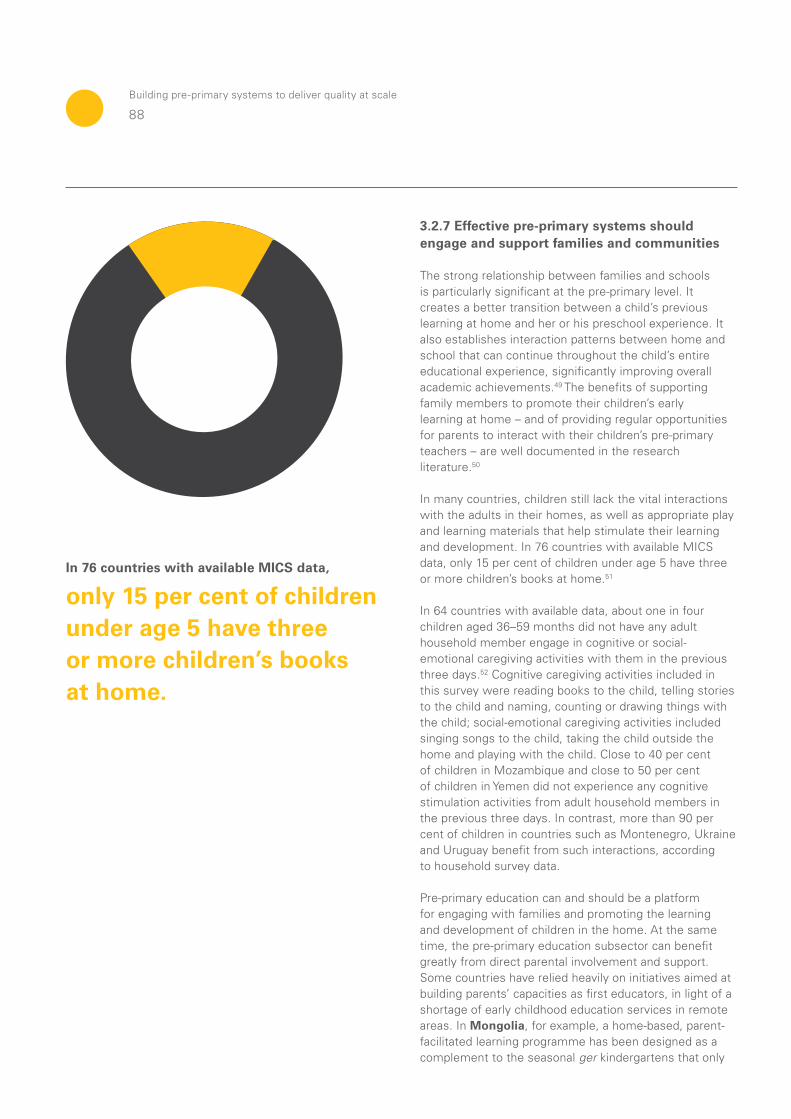
88
Building pre-primary systems to deliver quality at scale
3.2.7 Effective pre-primary systems should engage and support families and communities
The strong relationship between families and schools is particularly significant at the pre-primary level. It creates a better transition between a child’s previous learning at home and her or his preschool experience. It also establishes interaction patterns between home and school that can continue throughout the child’s entire educational experience, significantly improving overall academic achievements.49 The benefits of supporting family members to promote their children’s early learning at home – and of providing regular opportunities for parents to interact with their children’s pre-primary teachers – are well documented in the research literature.50
In many countries, children still lack the vital interactions with the adults in their homes, as well as appropriate play and learning materials that help stimulate their learning and development. In 76 countries with available MICS data, only 15 per cent of children under age 5 have three or more children’s books at home.51
In 64 countries with available data, about one in four children aged 36–59 months did not have any adult household member engage in cognitive or social-emotional caregiving activities with them in the previous three days.52 Cognitive caregiving activities included in this survey were reading books to the child, telling stories to the child and naming, counting or drawing things with the child; social-emotional caregiving activities included singing songs to the child, taking the child outside the home and playing with the child. Close to 40 per cent of children in Mozambique and close to 50 per cent of children in Yemen did not experience any cognitive stimulation activities from adult household members in the previous three days. In contrast, more than 90 per cent of children in countries such as Montenegro, Ukraine and Uruguay benefit from such interactions, according to household survey data.
Pre-primary education can and should be a platform for engaging with families and promoting the learning and development of children in the home. At the same time, the pre-primary education subsector can benefit greatly from direct parental involvement and support. Some countries have relied heavily on initiatives aimed at building parents’ capacities as first educators, in light of a shortage of early childhood education services in remote areas. In Mongolia, for example, a home-based, parent-facilitated learning programme has been designed as a complement to the seasonal ger kindergartens that only
In 76 countries with available MICS data,
only 15 per cent of children under age 5 have three or more children’s books at home.
A World Ready To Learn
89
The impact of the ‘Preschool for All’ campaign in
Montenegro
In the context of a broader framework for the expansion of equitable, quality early childhood education in Montenegro, an integral component was the focus on boosting the demand from parents/caregivers for early childhood education programmes. To this end, the Ministry of Education, with support from partners, launched and carried out the ‘Preschool for All’ campaign in 2015 and 2016, targeting northern municipalities in the country, which are most stricken by poverty and where enrolment was the lowest. The goal of the campaign was to increase enrolment by raising awareness among parents and caregivers of the importance of preschool education.54
The campaign used an innovative and multifaceted approach that included music and theatrical performances in city centres. These events were complemented by demonstrations of early childhood education services in open spaces, so that parents and children could engage
in a preschool experience at first hand. Even more so, it was the direct involvement of grandparents, together with preschool teachers, teachers in training and artists, in promoting the importance of early childhood education that proved to be a key factor in the campaign’s success. In northern Montenegro, many children live with extended families, and grandparents often care for children when both parents are employed, so it was vital to ensure that the grandparents’ role was recognized and that they participated in the campaign.
In five municipalities targeted by the campaign, preschool enrolment increased by an average 20 per cent in 2015 compared to the year before. In 2016, the number of children enrolling increased by as much as 22 per cent compared to 2015.55 It is important to note that the campaign was accompanied by comprehensive and systemic policy and programmatic reforms, which further contributed to Montenegro’s success in the initiative to expand the reach of early childhood education.
Engaging with families as partners is a vital element of increasing demand for universal access and quality of services as well as for ensuring a continuum of learning between home and school over time.
operate during the summer (see Section 2.2.3). Parents receive training on ways to support children’s learning at home and are equipped with resources, including a guidance book for parents and a workbook for children supplemented by digital tools (recorded instructions for parents). Evidence shows positive outcomes for the children.53
Parents not only can help build strong transitions between homes and schools, but they also shape
demand for services and quality. Engaging with families as partners in scaling up pre-primary education is, therefore, a vital element of securing universal access. Equipped with the knowledge and understanding of what creates quality in early childhood education, families can demand quality programmes from their local governments and policymakers. This can in turn help improve the quality of pre-primary programmes and support the equitable participation of all age-eligible children within the community.
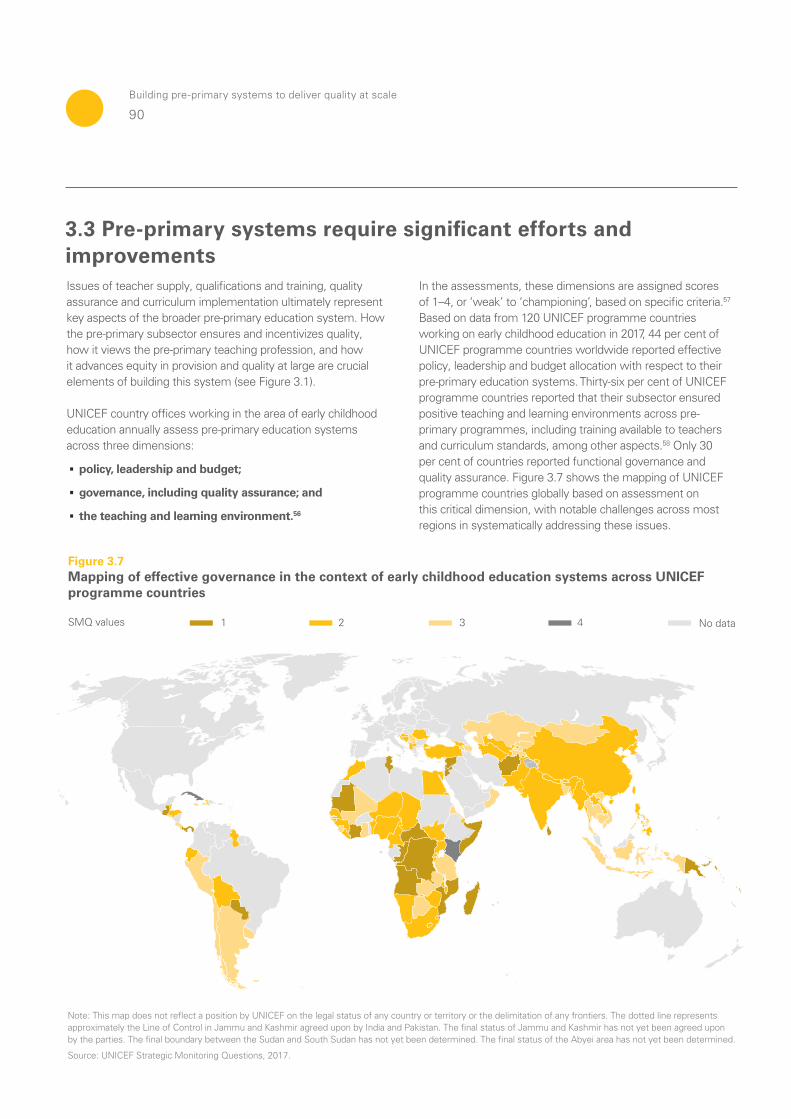
90
Building pre-primary systems to deliver quality at scale
Figure 3.7Mapping of effective governance in the context of early childhood education systems across UNICEF programme countries
21 No data43SMQ values
Note: This map does not reflect a position by UNICEF on the legal status of any country or territory or the delimitation of any frontiers. The dotted line represents approximately the Line of Control in Jammu and Kashmir agreed upon by India and Pakistan. The final status of Jammu and Kashmir has not yet been agreed upon by the parties. The final boundary between the Sudan and South Sudan has not yet been determined. The final status of the Abyei area has not yet been determined.
Source: UNICEF Strategic Monitoring Questions, 2017.
Issues of teacher supply, qualifications and training, quality assurance and curriculum implementation ultimately represent key aspects of the broader pre-primary education system. How the pre-primary subsector ensures and incentivizes quality, how it views the pre-primary teaching profession, and how it advances equity in provision and quality at large are crucial elements of building this system (see Figure 3.1).
UNICEF country offices working in the area of early childhood education annually assess pre-primary education systems across three dimensions:
· policy, leadership and budget;
· governance, including quality assurance; and
· the teaching and learning environment.56
In the assessments, these dimensions are assigned scores of 1–4, or ‘weak’ to ‘championing’, based on specific criteria.57 Based on data from 120 UNICEF programme countries working on early childhood education in 2017, 44 per cent of UNICEF programme countries worldwide reported effective policy, leadership and budget allocation with respect to their pre-primary education systems. Thirty-six per cent of UNICEF programme countries reported that their subsector ensured positive teaching and learning environments across pre-primary programmes, including training available to teachers and curriculum standards, among other aspects.58 Only 30 per cent of countries reported functional governance and quality assurance. Figure 3.7 shows the mapping of UNICEF programme countries globally based on assessment on this critical dimension, with notable challenges across most regions in systematically addressing these issues.
3.3 Pre-primary systems require significant efforts and improvements
A World Ready To Learn
91
The task ahead for governments and partners in ensuring quality is no small matter: Many low- and lower-middle-income countries will need to start with the foundations of a nascent pre-primary system while tackling persistent challenges throughout the education sector.
According to this analysis, the task ahead for governments and partners in building an effective pre-primary subsector is no small matter: Many low- and lower-middle-income countries will need to start by building the foundations of a nascent pre-primary system while tackling persistent challenges throughout the education sector. They will also need to consider crucial issues of governance and quality assurance, along with measures to recruit and retain effective early childhood educators and ensuring that teaching and learning environments are favourable for young children. Addressing how well the pre-primary subsector functions as a whole and balancing between the three dimensions mentioned above is a key consideration for countries.
As governments look ahead towards providing universal pre-primary education, a first important step is to develop a coherent, evidence-based implementation plan for
pre-primary services, which ideally includes short- and long-term visions for the subsector as a whole. A strong implementation plan not only sets out clear and realistic goals for the subsector, it also includes practical considerations for the quality and duration of programmes as well as the capacity and finances needed to achieve these goals.
Institutional technical capacity can progressively be developed to support implementation of the subsector plan. Investment in system-wide capacity building for quality assurance is crucial – much of it provided at the district level or cluster/school level in the form of training, coaching and supervisory visits to educators. To ensure consistency across programmes, along with a solid financial base and careful personnel management, the implementation of a subsector plan is ideally lead by the same ministry that holds responsibility for primary education overall, most often the Ministry of Education.59
In Ethiopia, the expansion in access to pre-primary education in recent years resulted from policy commitments that were complemented by an implementation road map (the Strategic Operational Plan and Guidelines).60 This document set out the operational details, along with short- and long-term arrangements to be made to universalize pre-primary education. It also outlined how interim strategies would gradually be phased out as the subsector develops. Similarly, Nepal’s achievement in pre-primary enrolment was backed up by thorough, budgeted implementation plans that were integrated into wider education sector plans. Other countries, such as Mali, Montenegro and Ghana, have taken the same approach to reinforcing policies with systematic and
comprehensive implementation plans for the subsector to ensure sufficient focus on capacity development and quality inputs.
In the context of building strong pre-primary systems, governments should seek to leverage technical capacities across partners, to develop and implement effective curricula, quality standards and quality assurance mechanisms. Support from external partners should focus on helping governments develop the technical and coordinating capacity needed to manage diverse service providers and to provide intensive real-time support to interim teachers, moving beyond the interim plan as resources permit.
Governments need to approach the questions related to quality as a systems-strengthening issue and develop a strong implementation plan to support policy initiatives.

3.4 Win–win scenarios to advance both access and quality
The SDG target 4.2 aims to ensure that, by 2030, all girls and boys have access to quality early childhood development, care and pre-primary education so that they are ready for primary education. This report places a durable emphasis on ‘all children’ and ‘quality’ – highlighting the need to understand these concepts as being closely linked and mutually reinforcing.
Pre-primary education provides an irreplaceable bridge between children’s homes and primary education. The quality standards established in pre-primary education can have profound effects on the quality of the entire education system. This includes the creation of teacher support networks and coaching at the local level; the development of robust quality assurance mechanisms covering both public and private provision; a focus on improving learning and psychosocial outcomes; and the use of data to inform ongoing decision-making. All of these factors help establish precedents with the potential to increase the impact of pre-primary education on subsequent learning patterns.
It is only by investing in quality as the system grows – not after – that stakeholders can find a balance between expanding access and maintaining quality.
92
Building pre-primary systems to deliver quality at scale

Develop strong implementation plans for the pre-primary subsector, to back up policy commitments. Solid investments in quality and capacity development are needed as the system grows, not after. Bolstering the technical and coordinating capacity of the government is critical to ensure its ability to monitor quality, provide intensive real-time support to teachers and grow the pre-primary system over time.
Dedicate at least 25 per cent of recurrent pre-primary budgets to non-salary expenditures, so that key quality investments, such as teacher training and on-the-job support, curriculum development, teaching and learning materials and quality assurance mechanisms, can be prioritized.
Strengthen the engagement with families as active participants in their children’s development and education so that they can drive the demand and mandate for quality early education programmes and improve the support for learning available at home.
Implement clear quality standards for the subsector and put in place a functional framework for regular monitoring of pre-primary programmes across both public and non-state/private providers. Progressively lowering the PTR to no more than 20 children per teacher should be a key quality goal.
Fortify curricular frameworks to ensure they reflect a child-centred, inclusive and holistic approach to learning and development, aligned with early grades. Ensure flexibility of curricular frameworks to respond to local contexts and encourage innovation and sharing across providers.
Develop robust strategies for growing and supporting the pre-primary workforce. In the short term, greater numbers of teachers with lower initial qualifications can be hired to grow the system, compensating with investments in intensive continuous professional development and on-the-job mentoring. A longer-term strategy for gradually upgrading teacher qualifications and retaining quality teachers should complement this approach.
A World Ready To Learn
93
94
Building pre-primary systems to deliver quality at scale
A World Ready To Learn
95
96
The first step towards SDG 4: Significantly increasing financing for pre-primary education
The first step towards SDG 4:
Significantly increasing financing for pre-primary education
Chapter 4
A World Ready To Learn
97
This chapter provides an overview of current financing trends
for pre-primary education. It describes how shortfalls in
domestic and international funding are impeding access to
quality pre-primary education and demonstrates that major
increases in financing are achievable. At the most basic level,
the issue is twofold: More funds are urgently needed, and it is
crucial to determine how funds can be used most efficiently.
As a starting point, this underscores the need for governments to assess how financing is allocated and to find ways to better use the funds in hand – ultimately, this will prepare education systems for the most effective application of new and increased financing for the pre-primary subsector. Examples from country experiences are highlighted throughout the chapter. In its conclusion, the chapter offers specific policy recommendations to shift financing patterns to pre-primary education and strengthen governance.
Shortfalls in domestic and international funding are impeding access to quality pre-primary education. But major increases in financing can be achieved by prioritizing the subsector in budget decisions and strengthening its governance and accountability.
98
The first step towards SDG 4: Significantly increasing financing for pre-primary education
Pre-primary education is deeply underfunded relative to other education levels, particularly in low- and middle-income countries, by both governments and international donors. There is no single explanation for the current lack of funding, which persists despite the demonstrated cost-effectiveness of pre-primary education and the importance attributed to it in the SDGs.
The current budgetary priorities of most governments fail to reflect the value of pre-primary education, which is often seen as being in competition for funding with other levels of education, instead of as a key strategy to strengthen results in other subsectors. Yet, as this chapter aims to explain, the solution may come from a better integration of pre-primary education funding into existing financing for other core education services, and a better understanding of how increased financing for pre-primary education contributes to achieving goals at all levels of education.
The need to reverse these trends is clear. The Education Commission, for example, estimates that providing universal access to pre-primary education in low- and lower-middle-income countries by 2030 would require an investment of $44 billion per year if countries pursue the guidelines that are often recommended.1,2 According to data for 2015, however, only $0.45 billion of government and donor resources combined has been invested annually in pre-primary education in low-income countries, and $10.7 billion in lower-middle-income countries.3
Recent analyses indicate an investment gap of almost 90 per cent in low-income countries and 75 per cent in lower-middle-income countries.
Most of the resources needed to meet the SDG education targets, including those for pre-primary education, must come from government budgets.4,5 At the global level, domestic spending on education as a share of GDP has increased modestly, from 4.3 per cent in 2000–2005 to 4.7 per cent in 2010–2016. This trend is also true for low-income countries, where spending on education increased, on average, from 3.4 per cent to 4.1 per cent of GDP over the same period.6 Despite these increases in overall education spending, levels of public spending on pre-primary education remain extremely low.
In 2017, an average of 6.6 per cent of domestic education budgets globally were allocated to pre-primary education, with many regions allocating less than 3 per cent. Figure 4.1 presents regional spending on pre-primary education. The Middle East and North Africa, West and Central Africa and Eastern and Southern Africa regions allocate less than 3 per cent of education budgets to this subsector. This is far less than countries in Europe and Central Asia, where governments dedicate more than 11 per cent of their education budgets to pre-primary education.7
4.1 Evaluating the persistence of underfunding
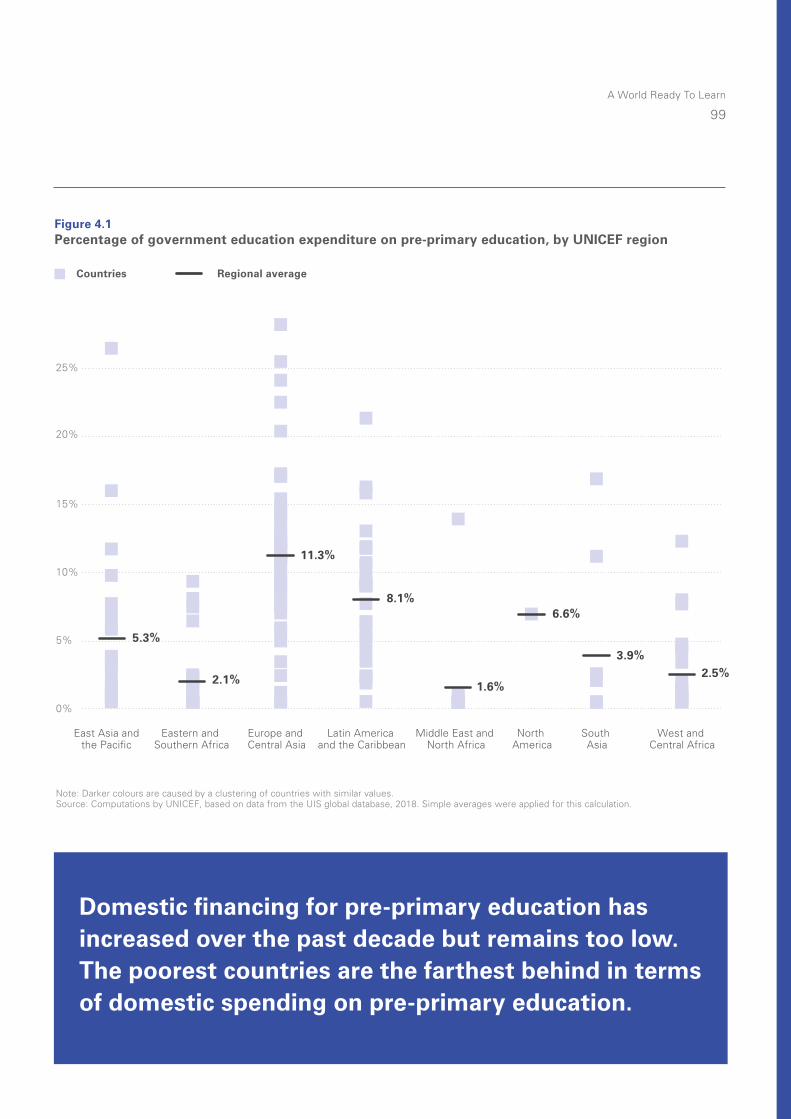
A World Ready To Learn
99
Domestic financing for pre-primary education has increased over the past decade but remains too low. The poorest countries are the farthest behind in terms of domestic spending on pre-primary education.
10%
5%
15%
25%
0%
20%
East Asia andthe Pacific
Eastern and Southern Africa
Europe and Central Asia
Latin America and the Caribbean
Middle East and North Africa
North America
South Asia
West and Central Africa
Note: Darker colours are caused by a clustering of countries with similar values.Source: Computations by UNICEF, based on data from the UIS global database, 2018. Simple averages were applied for this calculation.
Countries Regional average
11.3%
5.3%
2.1%
8.1%
1.6%
6.6%
3.9%2.5%
Figure 4.1Percentage of government education expenditure on pre-primary education, by UNICEF region
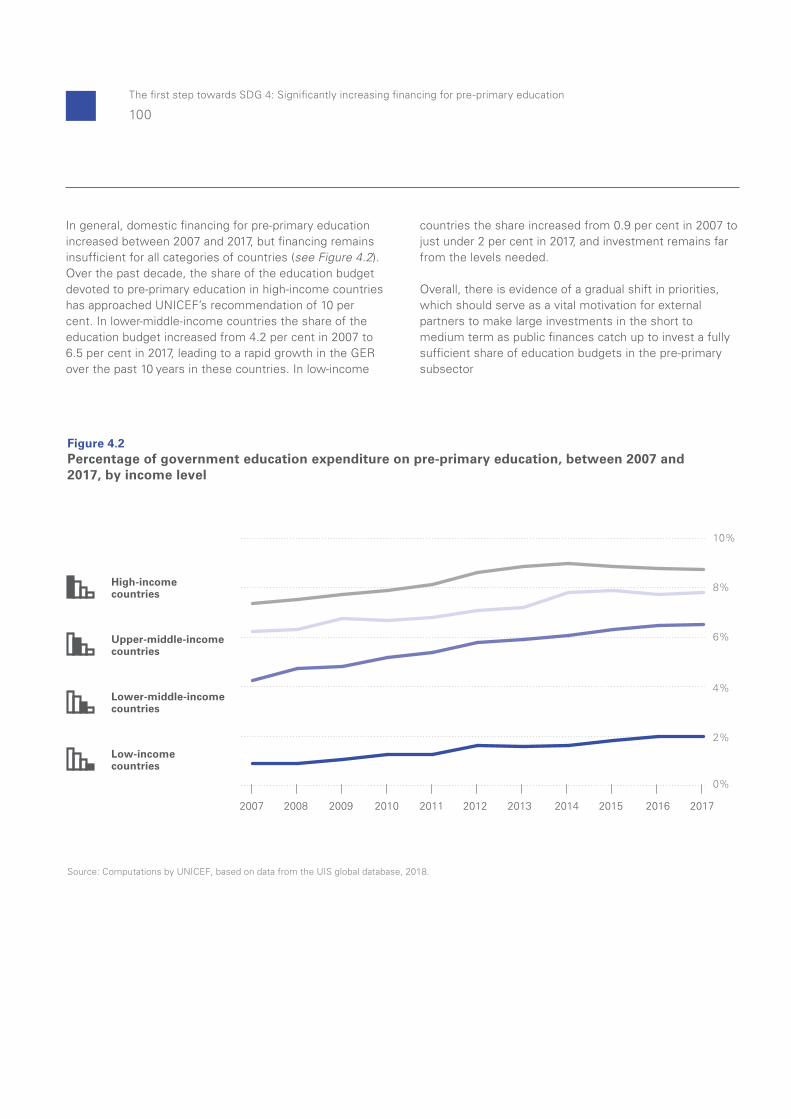
100
The first step towards SDG 4: Significantly increasing financing for pre-primary education
Figure 4.2Percentage of government education expenditure on pre-primary education, between 2007 and 2017, by income level
2007 2008 2009 2010 2011 2012 2013 2014 2015 20172016
4%
2%
10%
8%
6%
0%
Source: Computations by UNICEF, based on data from the UIS global database, 2018.
Lower-middle-income countries
Low-income countries
High-income countries
Upper-middle-income countries
In general, domestic financing for pre-primary education increased between 2007 and 2017, but financing remains insufficient for all categories of countries (see Figure 4.2). Over the past decade, the share of the education budget devoted to pre-primary education in high-income countries has approached UNICEF’s recommendation of 10 per cent. In lower-middle-income countries the share of the education budget increased from 4.2 per cent in 2007 to 6.5 per cent in 2017, leading to a rapid growth in the GER over the past 10 years in these countries. In low-income
countries the share increased from 0.9 per cent in 2007 to just under 2 per cent in 2017, and investment remains far from the levels needed.
Overall, there is evidence of a gradual shift in priorities, which should serve as a vital motivation for external partners to make large investments in the short to medium term as public finances catch up to invest a fully sufficient share of education budgets in the pre-primary subsector
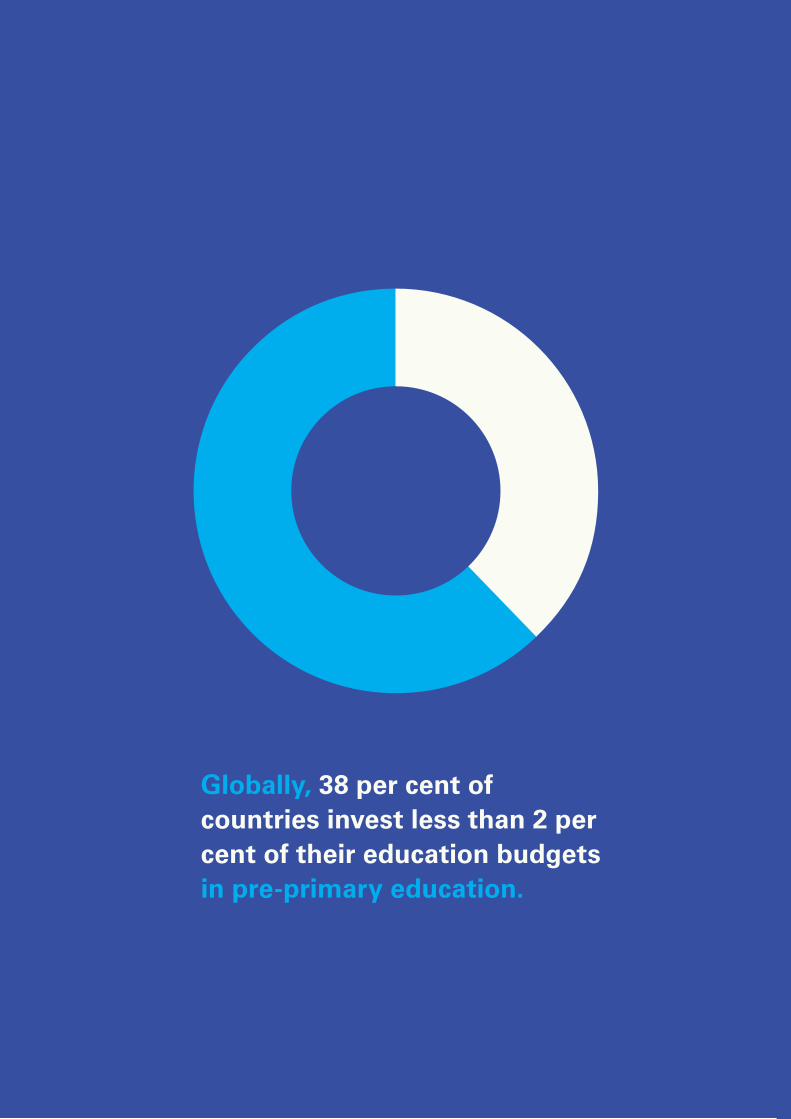
A World Ready To Learn
101
Globally, 38 per cent of countries invest less than 2 per cent of their education budgets in pre-primary education.
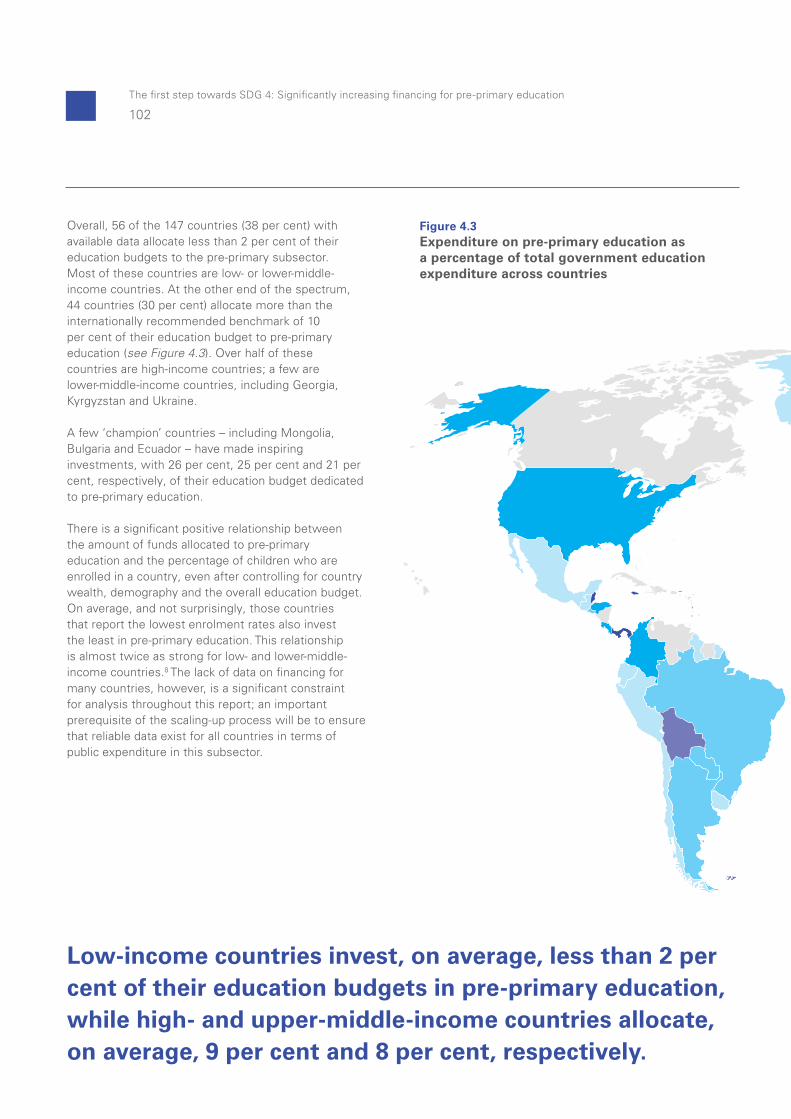
102
The first step towards SDG 4: Significantly increasing financing for pre-primary education
5% to 7.9%0% to 1.9% 2% to 4.9% No data10% and above 8% to 9.9%
Figure 4.3Expenditure on pre-primary education asa percentage of total government education expenditure across countries
Note: This map does not reflect a position by UNICEF on the legal status of any country or territory or the delimitation of any frontiers. The dotted line represents approximately the Line of Control in Jammu and Kashmir agreed upon by India and Pakistan. The final status of Jammu and Kashmir has not yet been agreed upon by the parties. The final boundary between the Sudan and South Sudan has not yet been determined. The final status of the Abyei area has not yet been determined.
Source: UIS global database, 2018.
Overall, 56 of the 147 countries (38 per cent) with available data allocate less than 2 per cent of their education budgets to the pre-primary subsector. Most of these countries are low- or lower-middle-income countries. At the other end of the spectrum, 44 countries (30 per cent) allocate more than the internationally recommended benchmark of 10 per cent of their education budget to pre-primary education (see Figure 4.3). Over half of these countries are high-income countries; a few are lower-middle-income countries, including Georgia, Kyrgyzstan and Ukraine.
A few ‘champion’ countries – including Mongolia, Bulgaria and Ecuador – have made inspiring investments, with 26 per cent, 25 per cent and 21 per cent, respectively, of their education budget dedicated to pre-primary education.
There is a significant positive relationship between the amount of funds allocated to pre-primary education and the percentage of children who are enrolled in a country, even after controlling for country wealth, demography and the overall education budget. On average, and not surprisingly, those countries that report the lowest enrolment rates also invest the least in pre-primary education. This relationship is almost twice as strong for low- and lower-middle-income countries.8 The lack of data on financing for many countries, however, is a significant constraint for analysis throughout this report; an important prerequisite of the scaling-up process will be to ensure that reliable data exist for all countries in terms of public expenditure in this subsector.
Low-income countries invest, on average, less than 2 per cent of their education budgets in pre-primary education, while high- and upper-middle-income countries allocate, on average, 9 per cent and 8 per cent, respectively.

A World Ready To Learn
103
5% to 7.9%0% to 1.9% 2% to 4.9% No data10% and above 8% to 9.9%
Figure 4.3Expenditure on pre-primary education asa percentage of total government education expenditure across countries
Note: This map does not reflect a position by UNICEF on the legal status of any country or territory or the delimitation of any frontiers. The dotted line represents approximately the Line of Control in Jammu and Kashmir agreed upon by India and Pakistan. The final status of Jammu and Kashmir has not yet been agreed upon by the parties. The final boundary between the Sudan and South Sudan has not yet been determined. The final status of the Abyei area has not yet been determined.
Source: UIS global database, 2018.

104
The first step towards SDG 4: Significantly increasing financing for pre-primary education
Governments make very different choices about how funding is distributed across levels of education. Many governments provide significantly greater education resources to wealthier groups of children than to the poorest and most marginalized (see section 2.1).9 According to recent analyses, 46 per cent of public education resources in low-income countries are allocated to educate the 10 per cent most educated students, who are often also the wealthiest.10
Pre-primary education provides the highest return on investment of all education subsectors11 – it increases primary school intake, strengthens efficiency and improves learning.12 Yet, as a general pattern across country income levels, pre-primary education received a smaller share of the education budget than primary, secondary or tertiary education over the past 10 years.
The trend of underinvesting in pre-primary education, relative to other subsectors, has been stable over time in low-income countries, as seen in Figure 4.4.
Fewer than 1 per cent of children in the poorest half of the population will reach higher education in many sub-Saharan African countries, yet all of these countries continue to spend far more on higher education than on pre-primary education.13
As seen in Figure 4.5, in 2017, low-income countries on average spent nearly half of their education budget on primary education (46.9 per cent), followed by spending on secondary education (25.7 per cent) and post-secondary education (21.7 per cent). Only 1.95 per cent was spent on pre-primary education.
4.2 The distribution of funds across education levels is highly inequitable in low- and lower-middle-income countries
Figure 4.4Distribution of government expenditure on education across subsectors between 2007 and 2017, in low-income countries
Pre-primary Primary Secondary Tertiary
10%
50%
60%
20%
30%
40%
0%
Source: Computations by UNICEF, based on data from the UIS global database, 2018.
2007 2008 2009 2010 2011 2012 2013 2014 2015 20172016
21.7%25.7%
46.9%
1.9%
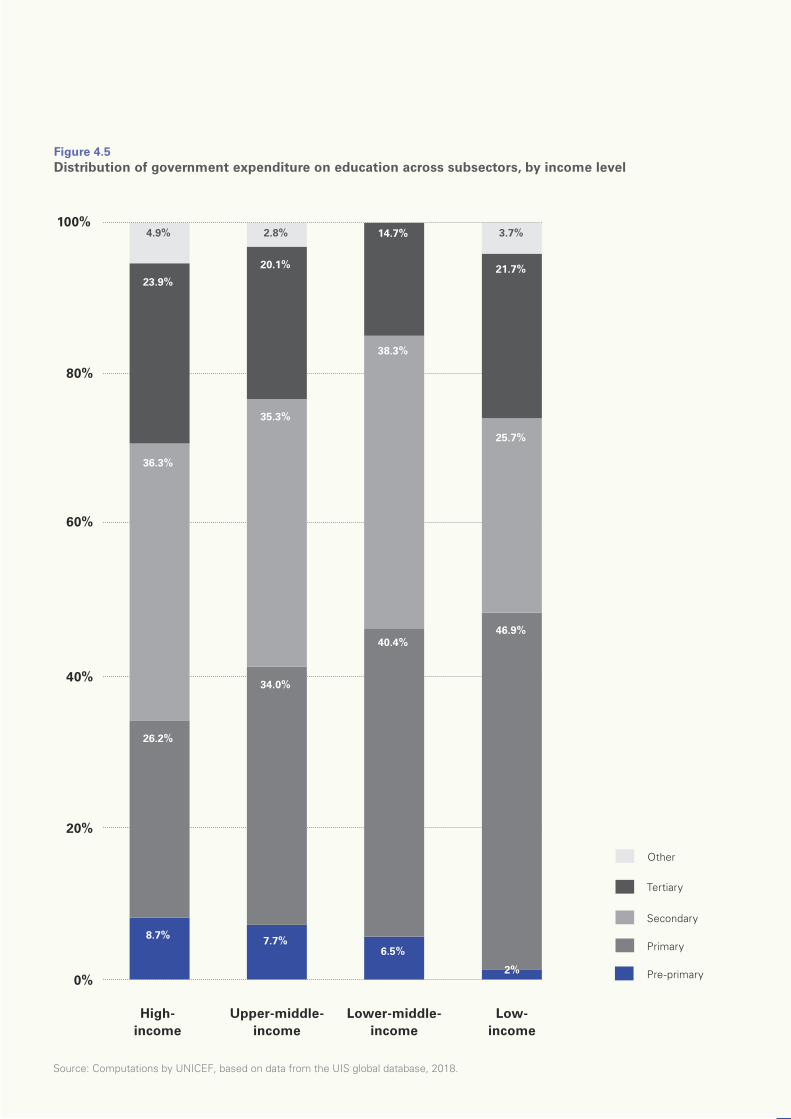
Figure 4.5 Distribution of government expenditure on education across subsectors, by income level
0%
20%
40%
60%
80%
100%
High- income
Low- income
Upper-middle- income
Lower-middle- income
Pre-primary
Primary
Tertiary
Other
Secondary
2.8%
20.1%
35.3%
34.0%
7.7%
23.9%
4.9%
36.3%
26.2%
8.7%
2%
46.9%
25.7%
21.7%
3.7%
6.5%
40.4%
38.3%
14.7%
Source: Computations by UNICEF, based on data from the UIS global database, 2018.
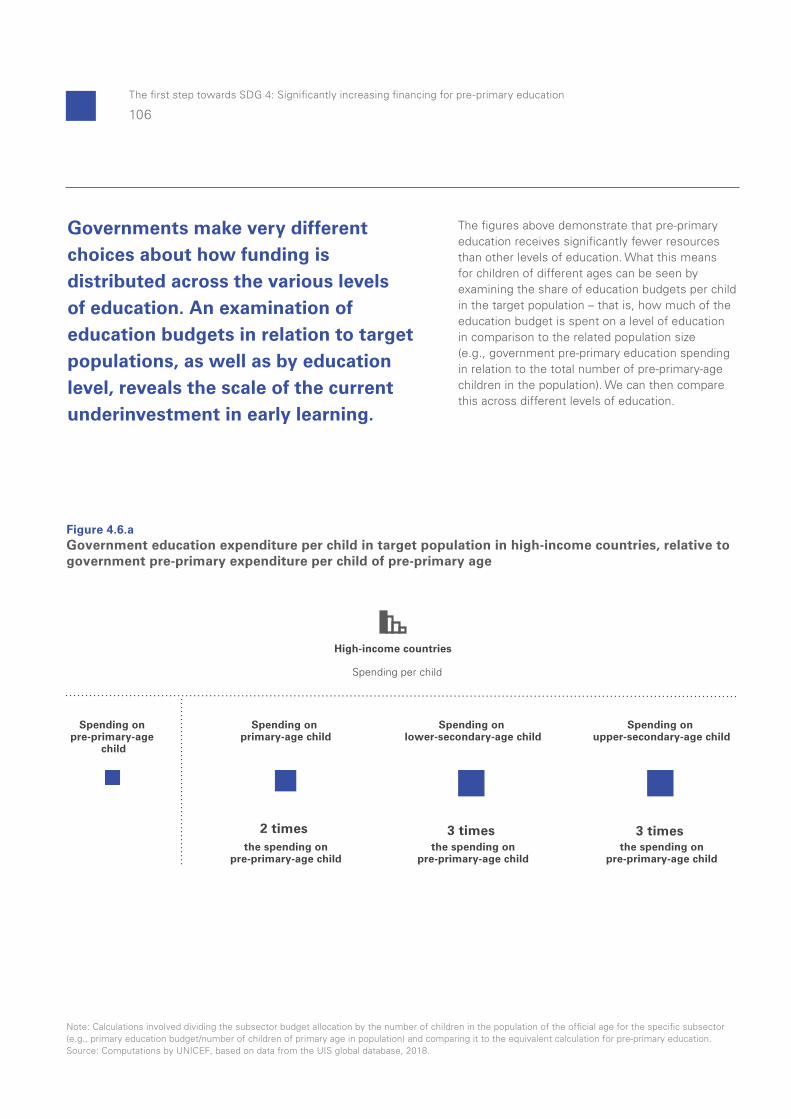
106
The first step towards SDG 4: Significantly increasing financing for pre-primary education
Spending on upper-secondary-age child
Spending on pre-primary-age
child
Spending on primary-age child
Spending on lower-secondary-age child
the spending on pre-primary-age child
the spending on pre-primary-age child
the spending on pre-primary-age child
Note: Calculations involved dividing the subsector budget allocation by the number of children in the population of the official age for the specific subsector (e.g., primary education budget/number of children of primary age in population) and comparing it to the equivalent calculation for pre-primary education.Source: Computations by UNICEF, based on data from the UIS global database, 2018.
Figure 4.6.aGovernment education expenditure per child in target population in high-income countries, relative to government pre-primary expenditure per child of pre-primary age
2 times 3 times
3 times
Spending per child
High-income countries
Governments make very different choices about how funding is distributed across the various levels of education. An examination of education budgets in relation to target populations, as well as by education level, reveals the scale of the current underinvestment in early learning.
The figures above demonstrate that pre-primary education receives significantly fewer resources than other levels of education. What this means for children of different ages can be seen by examining the share of education budgets per child in the target population – that is, how much of the education budget is spent on a level of education in comparison to the related population size (e.g., government pre-primary education spending in relation to the total number of pre-primary-age children in the population). We can then compare this across different levels of education.
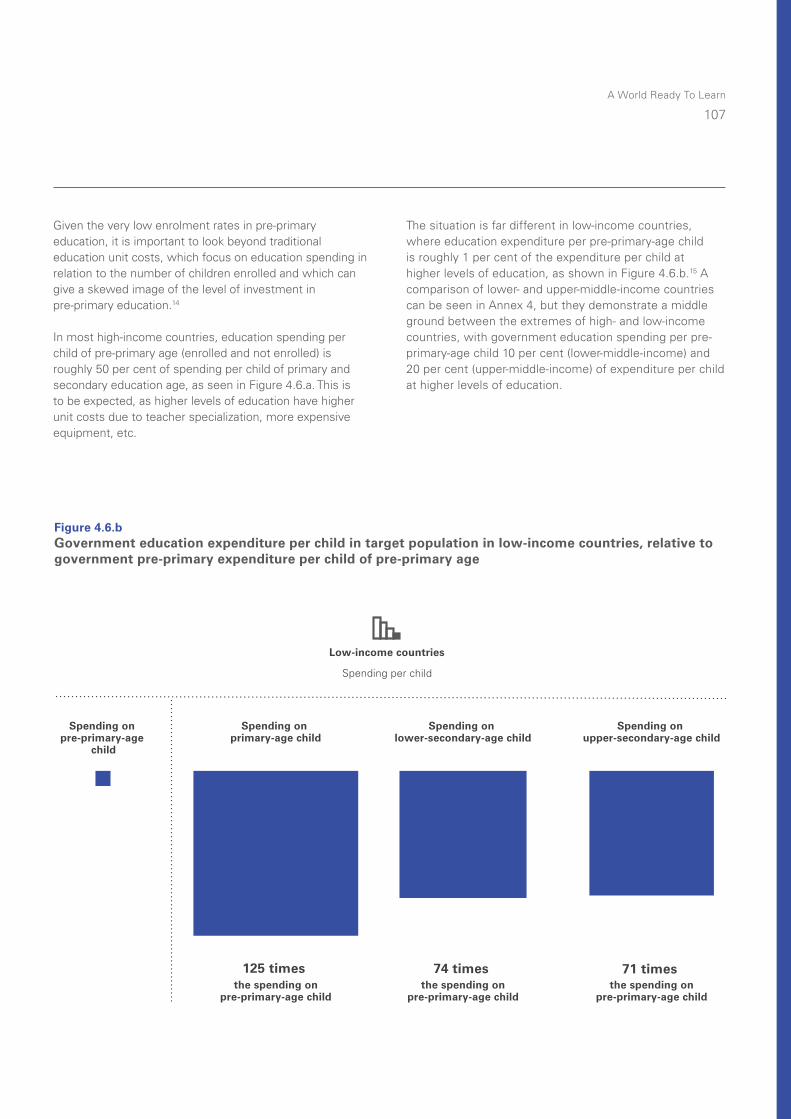
A World Ready To Learn
107
Low-income countries
Note: Calculations involved dividing the subsector budget allocation by the number of children in the population of the official age for the specific subsector (e.g., primary education budget/number of children of primary age in population) and comparing it to the equivalent calculation for pre-primary education.Source: Computations by UNICEF, based on data from the UIS global database, 2018.
Figure 4.6.bGovernment education expenditure per child in target population in low-income countries, relative to government pre-primary expenditure per child of pre-primary age
Spending on upper-secondary-age child
Spending on pre-primary-age
child
Spending on primary-age child
Spending on lower-secondary-age child
the spending on pre-primary-age child
the spending on pre-primary-age child
the spending on pre-primary-age child
125 times 74 times
71 times
Spending per child
Given the very low enrolment rates in pre-primary education, it is important to look beyond traditional education unit costs, which focus on education spending in relation to the number of children enrolled and which can give a skewed image of the level of investment in pre-primary education.14
In most high-income countries, education spending per child of pre-primary age (enrolled and not enrolled) is roughly 50 per cent of spending per child of primary and secondary education age, as seen in Figure 4.6.a. This is to be expected, as higher levels of education have higher unit costs due to teacher specialization, more expensive equipment, etc.
The situation is far different in low-income countries, where education expenditure per pre-primary-age child is roughly 1 per cent of the expenditure per child at higher levels of education, as shown in Figure 4.6.b.15 A comparison of lower- and upper-middle-income countries can be seen in Annex 4, but they demonstrate a middle ground between the extremes of high- and low-income countries, with government education spending per pre-primary-age child 10 per cent (lower-middle-income) and 20 per cent (upper-middle-income) of expenditure per child at higher levels of education.
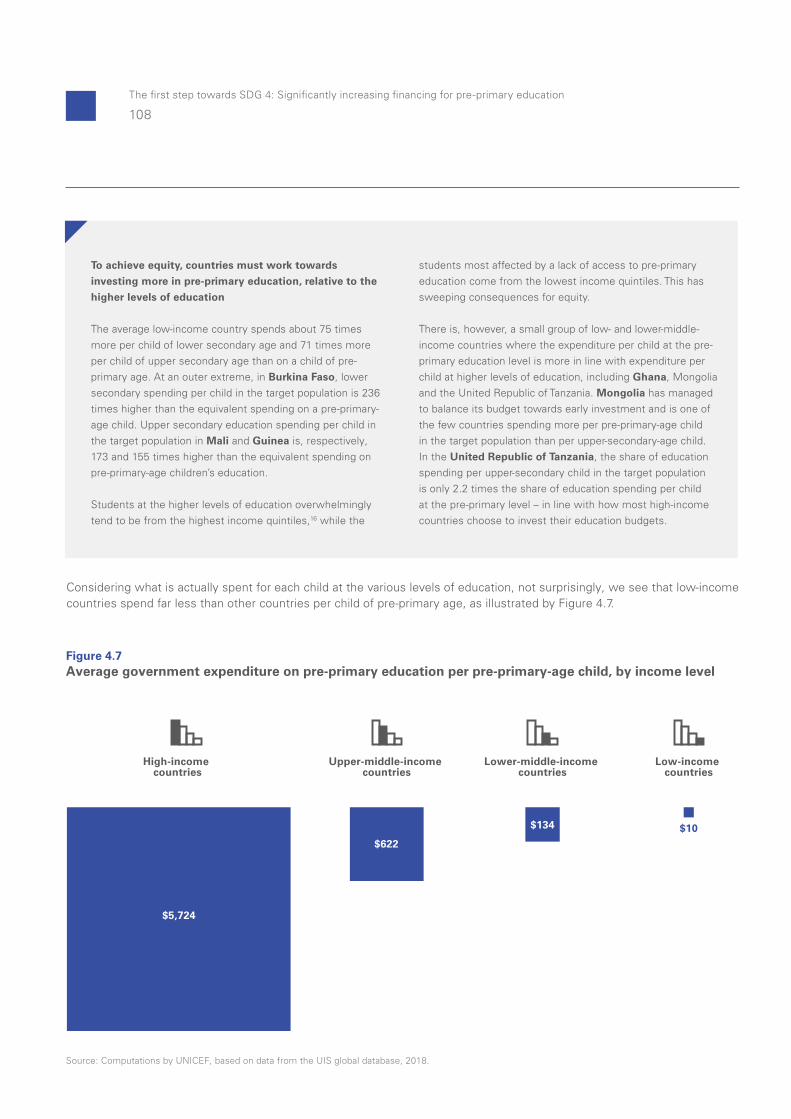
108
The first step towards SDG 4: Significantly increasing financing for pre-primary education
To achieve equity, countries must work towards
investing more in pre-primary education, relative to the
higher levels of education
The average low-income country spends about 75 times more per child of lower secondary age and 71 times more per child of upper secondary age than on a child of pre-primary age. At an outer extreme, in Burkina Faso, lower secondary spending per child in the target population is 236 times higher than the equivalent spending on a pre-primary-age child. Upper secondary education spending per child in the target population in Mali and Guinea is, respectively, 173 and 155 times higher than the equivalent spending on pre-primary-age children’s education.
Students at the higher levels of education overwhelmingly tend to be from the highest income quintiles,16 while the
students most affected by a lack of access to pre-primary education come from the lowest income quintiles. This has sweeping consequences for equity.
There is, however, a small group of low- and lower-middle-income countries where the expenditure per child at the pre-primary education level is more in line with expenditure per child at higher levels of education, including Ghana, Mongolia and the United Republic of Tanzania. Mongolia has managed to balance its budget towards early investment and is one of the few countries spending more per pre-primary-age child in the target population than per upper-secondary-age child. In the United Republic of Tanzania, the share of education spending per upper-secondary child in the target population is only 2.2 times the share of education spending per child at the pre-primary level – in line with how most high-income countries choose to invest their education budgets.
Considering what is actually spent for each child at the various levels of education, not surprisingly, we see that low-income countries spend far less than other countries per child of pre-primary age, as illustrated by Figure 4.7.
Source: Computations by UNICEF, based on data from the UIS global database, 2018.
Figure 4.7Average government expenditure on pre-primary education per pre-primary-age child, by income level
$134 $10
$5,724
$622
Lower-middle-income countries
Low-income countries
High-income countries
Upper-middle-income countries
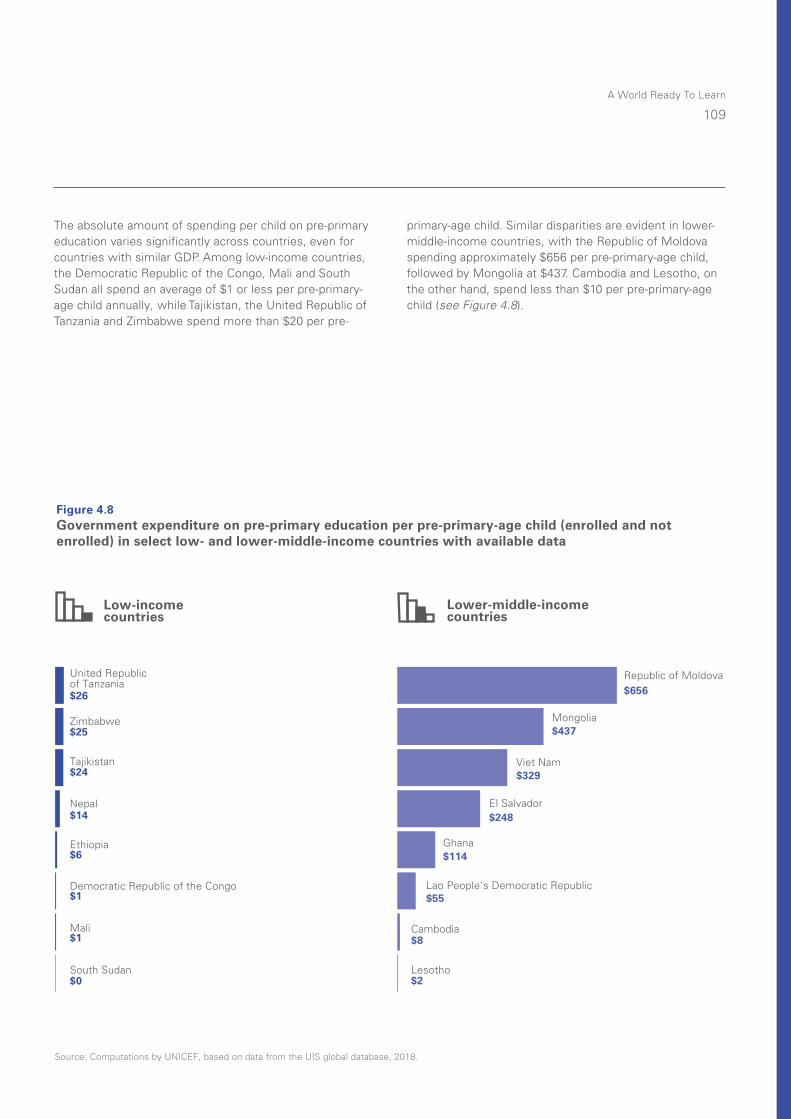
A World Ready To Learn
109
The absolute amount of spending per child on pre-primary education varies significantly across countries, even for countries with similar GDP. Among low-income countries, the Democratic Republic of the Congo, Mali and South Sudan all spend an average of $1 or less per pre-primary-age child annually, while Tajikistan, the United Republic of Tanzania and Zimbabwe spend more than $20 per pre-
primary-age child. Similar disparities are evident in lower-middle-income countries, with the Republic of Moldova spending approximately $656 per pre-primary-age child, followed by Mongolia at $437. Cambodia and Lesotho, on the other hand, spend less than $10 per pre-primary-age child (see Figure 4.8).
Source: Computations by UNICEF, based on data from the UIS global database, 2018.
Figure 4.8Government expenditure on pre-primary education per pre-primary-age child (enrolled and not enrolled) in select low- and lower-middle-income countries with available data
Low-income countries
United Republic of Tanzania
Zimbabwe
Tajikistan
Nepal
Ethiopia
Democratic Republic of the Congo
Mali
South Sudan
$26
$25
$24
$14
$6
$1
$1
$0
Republic of Moldova
Mongolia
Viet Nam
El Salvador
Ghana
Lao People's Democratic Republic
Cambodia
Lesotho
$656
$437
$329
$248
$114
$55
$8
$2
Lower-middle-income countries
110
The first step towards SDG 4: Significantly increasing financing for pre-primary education
Funding for pre-primary education
in emergency contexts
Pre-primary education has long been recognized as particularly important in emergency contexts, to promote psychosocial and cognitive development, as well as the life skills for tolerance, gender sensitivity and cooperation. In 2015, it was estimated that 16 million infants were born into conflict. Yet, in 2016, just 10 out of 38 humanitarian response plans, flash appeals and refugee response plans made any mention of early childhood development, early childhood education or similar terminology.19 The gap in financing available for pre-primary education in emergency context is critical and requires immediate attention by both governments and donors.
Increasing pre-primary education financing would require governments to look at education sector financing as a whole, and to understand the challenges of financing pre-primary education as part of broader efforts to improve internal efficiency and pro-poor financing.
Improving the situation of pre-primary education is not a simple matter of moving money from one subsector to another – in many low-income countries, secondary education will also need increased investment to meet the needs of graduating primary school children and to gradually upgrade the qualifications of the pre-primary educators needed in this subsector. Further, even though primary education receives a substantial share of education budgets, many low-income countries still face low primary completion rates and low levels of learning.17
Strategies to increase pre-primary financing might include lowering the government unit cost of higher levels of education through innovation, greater efficiency and cost-sharing mechanisms that prioritize the use of public resources for the most marginalized populations. Redirecting spending from primary or secondary education may be difficult in practice, but policymakers can consider freezing spending at these levels while increasing spending on pre-primary education to jump-start the subsector. Funding the pre-primary subsector is also linked to efficiencies in the primary and secondary subsectors associated with the benefits gained by increasing enrolment in pre-primary education.
As discussed in Chapter 1, many countries are already paying for an inefficient form of early childhood education, as early enrolment in primary school is common, and so are repetition and dropouts. Countries could potentially afford to expand pre-primary education by redirecting the resources that are currently wasted on repetition and over-enrolment in the early grades towards the pre-primary subsector.18
These trade-offs demonstrate the need to look at financing the education sector as a whole, and to understand the challenges of financing pre-primary education as part of broader strategies to improve internal efficiency and pro-poor financing. Nevertheless, significantly increasing the spending per child, especially in low- and a number of lower-middle-income countries, should be a key aspect of the financing plan for pre-primary education, to ensure relevant quality goals can be achieved (see Chapter 3).
A World Ready To Learn
111
It is often difficult to obtain a complete picture of the total levels of domestic spending on pre-primary education because the available data on government expenditures do not include household and other private contributions. Yet, it is clear that household contributions to pre-primary education are sizeable in many countries.20
A recent study of four peri-urban areas in sub-Saharan Africa,21 for example, found that a surprisingly high 84 per cent of three- to six-year-old children in the Mukuru slum in Nairobi were enrolled in preschool, but that 94 per cent of them were attending informal private schools – placing a very high financial burden on their families. Poor families are also at risk of receiving low-quality services from private schools.22 The study found that families in Ghana, Kenya and Nigeria spent approximately 20 per cent of GDP per capita on preschool-related expenditures annually. In many other countries, households pay fees and provide in-kind support and voluntary contributions. Such household contributions can support pre-primary education, but they are often burdensome and lead to inequitable delivery and low quality.
Data from national education accounts in Côte d’Ivoire, Nepal, Uganda and Viet Nam provide a rare glimpse into national household spending on pre-primary education. The analysis clearly demonstrates that when it comes to this subsector, countries rely on households for funding. In Nepal and Uganda, for example, household contributions to pre-primary education accounted for a large proportion of total national pre-primary expenditure. In Viet Nam, household contributions accounted for 21 per cent of total national pre-primary expenditure.23
The burden on household spending is much greater at the pre-primary level than at other levels of education across countries.
In Nepal, while households accounted for an average of 63 per cent of pre-primary spending, they accounted for only 36 per cent of primary spending. In Uganda, households accounted for nearly 100 per cent of pre-primary spending, but only 52 per cent of primary and 63 per cent of secondary spending.24
Underinvestment in pre-primary education by the public sector means that households in most countries have had to assume a large proportion of the costs of their children’s attendance. In theory, such private contributions could increase equity if scarce public resources were then directed to poorer and less advantaged children.25 But this is rarely the case.
In some low-income countries, including Chad, Madagascar, Malawi and Mali, tertiary education is disproportionately available to wealthy families and almost completely subsidized by the government, while poor households are asked to contribute significantly for pre-primary schooling.26 In Malawi, for example, families are often expected to contribute food or support physical infrastructure, and communities are expected to contribute cash to support caregivers’ salaries.27 This imbalance contributes to perpetuating the very inequities within societies that broad access to pre-primary education is meant to reduce.
4.3 Failing to treat pre-primary education as a public good leads to over-reliance on household contributions
112
The first step towards SDG 4: Significantly increasing financing for pre-primary education
When local governments are already under-financed, they may not be held accountable for poor results in delivering education services. Without adequate resources, clear responsibilities and accountability mechanisms, lower levels of government may be unable to effectively follow through on commitments. As local governments have varied assets
and levels of ability to raise funds for pre-primary education, additional support from central government authorities is essential. In Serbia, for example, under-financing by local governments has limited the participation of low-income families in pre-primary schooling.
Serbia: Pre-primary education is disproportionately
affected by system-level constraints
A national education law in Serbia provided for the decentralization of a certain proportion of education financing. In a country where the share of public expenditures for education was already below the mean for Organisation for Economic Co-operation and Development (OECD) countries (4.5 per cent of GDP in Serbia versus 5.5 per cent in OECD countries, and 11 per cent of public expenditure for education in Serbia versus 12.9 per cent in OECD countries in 2012), this had the unanticipated result of reducing funding for the pre-primary education subsector as a whole.
Until 2017, local governments were bearing 80 per cent of preschool education costs for children up to five and a half years old. More recently, changes to the legislation in 2017 reduced the local government’s funding obligation from “at least 80%” to “up to 80%”, which opened up the possibility for local governments to underinvest in pre-primary education and to transfer the financial burden to families, which in turn may undermine access and equity.
Pre-primary education is especially exposed, as the subsector was less developed in the country and has greater needs. Enrolments have been constrained and the impact has been greatest on poverty-affected families, and Roma in particular.30
4.4 Weak governance and a lack of capacities in the subsector form a barrier to better financing
Decentralization of authority for pre-primary education often comes without sufficient financing and adequate governance to deliver quality services. In recent years, a number of countries have devolved pre-primary education to subnational governments without necessarily ensuring sufficient financing or clarifying the links and responsibilities between national and local governments. While decentralization provides lower levels of government with the flexibility to identify how they want to finance and deliver programmes, it has often come without the necessary investments in local-level capacity and insufficient resources for services, given the lack of prioritization of the subsector.
In Kenya, the recent devolution of authority for early childhood development and education services to the county level challenged resource mobilization. The County Early Childhood Education Bill, passed in 2014, gave counties the responsibility for delivering early childhood education services. However, the central government provided insufficient resources to counties that were unable to deliver the intended services. In Nairobi City County, for example, a lack of funding limited public preschool attendance to only 12,000 children out of more than 250,000 who were eligible in 2014.28 In addition, there was some confusion around responsibilities for various aspects of service delivery – for example, whether the central government continues to be responsible for hiring and managing teachers.29
While decentralization provides lower levels of government with more flexibility to identify how they want to finance and deliver programmes, it is often applied without sufficient funding and capacity development from the central government.
A World Ready To Learn
113
Transparent funding formulas, clear accountability mechanisms and robust management and monitoring capacities are all part of ensuring that allocations are sufficient – and that funds are used effectively. However, these are often not in place. In Nepal, for example, the amount of funding provided to school-based early childhood education centres is meant to be contingent on whether centres meet agreed standards. Due to weak monitoring
mechanisms, however, in practice it is difficult to base funding allocations on this criterion.31 On the other hand, in Indonesia, a programme that introduced block grants for early childhood education found that guidelines on how funds could be used helped communities identify the best ways to invest their financing. Since the amount that could be spent on infrastructure was limited, communities receiving the block grant looked for existing spaces to repurpose, saving on the cost of facilities.32
Although domestic financing for pre-primary education is expected to comprise the largest source of funding to meet the SDG target, the availability of external financing is critical, especially for the poorest countries, which have the lowest enrolment rates, the greatest inequities and the largest funding gaps.
Over the last five years for which data are available (2012–2016), an average of only $76 million per year – or well under 1 per cent – of the total international aid to education was used to support pre-primary education (see Figure 4.9).33 Over the same time period, an average of $3.6 billion in international aid per year was dedicated to post-secondary education, benefitting the most advantaged children.
In 2015, the absolute volume of aid disbursed for scholarships for students to study in rich countries was 26 times the amount spent on pre-primary education – a spending pattern replicating the inequitable distribution of domestic resources and favouring more advantaged children, who are already far more likely to reach these higher levels of education.34
International aid to pre-primary education has been drastically lower than funding for any other level of education. Less than 1 per cent of international aid for education is invested in pre-primary education.
4.5 External financing for pre-primary education is extremely limited
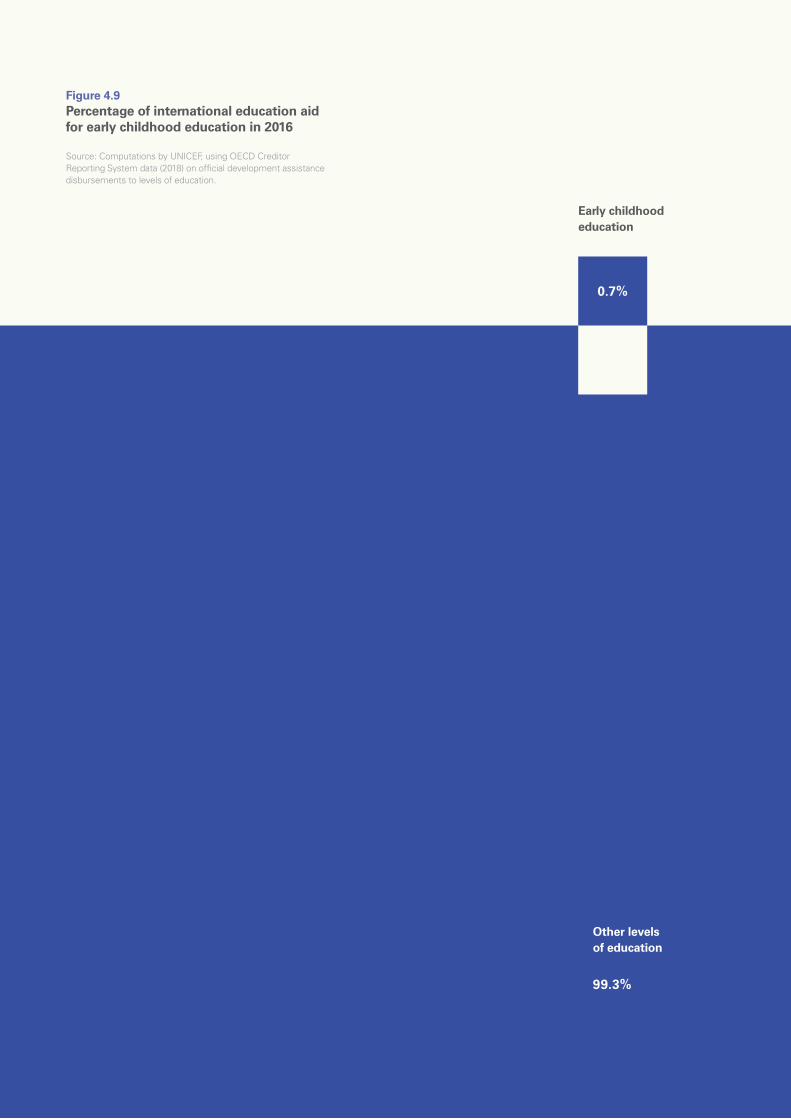
114
The first step towards SDG 4: Significantly increasing financing for pre-primary education
99.3%
0.7%
Figure 4.9Percentage of international education aid for early childhood education in 2016
Source: Computations by UNICEF, using OECD Creditor Reporting System data (2018) on official development assistance disbursements to levels of education.
Early childhood education
Other levels of education
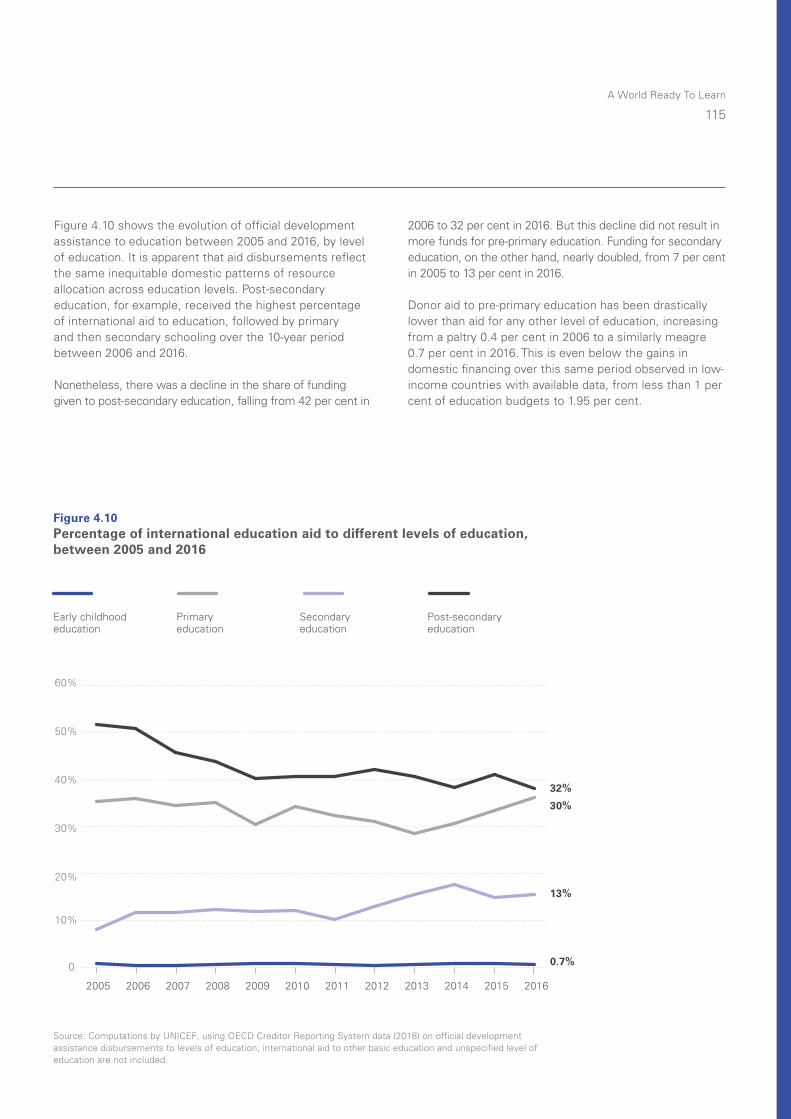
A World Ready To Learn
115
Figure 4.10Percentage of international education aid to different levels of education, between 2005 and 2016
Source: Computations by UNICEF, using OECD Creditor Reporting System data (2018) on official development assistance disbursements to levels of education; international aid to other basic education and unspecified level of education are not included.
Early childhood education
Primary education
Secondary education
Post-secondary education
10%
20%
30%
40%
50%
60%
0
2007 2008 2009 2010 2011 2012 2013 2014 2015 20162005 2006
32%
30%
13%
0.7%
Figure 4.10 shows the evolution of official development assistance to education between 2005 and 2016, by level of education. It is apparent that aid disbursements reflect the same inequitable domestic patterns of resource allocation across education levels. Post-secondary education, for example, received the highest percentage of international aid to education, followed by primary and then secondary schooling over the 10-year period between 2006 and 2016.
Nonetheless, there was a decline in the share of funding given to post-secondary education, falling from 42 per cent in
2006 to 32 per cent in 2016. But this decline did not result in more funds for pre-primary education. Funding for secondary education, on the other hand, nearly doubled, from 7 per cent in 2005 to 13 per cent in 2016.
Donor aid to pre-primary education has been drastically lower than aid for any other level of education, increasing from a paltry 0.4 per cent in 2006 to a similarly meagre 0.7 per cent in 2016. This is even below the gains in domestic financing over this same period observed in low-income countries with available data, from less than 1 per cent of education budgets to 1.95 per cent.
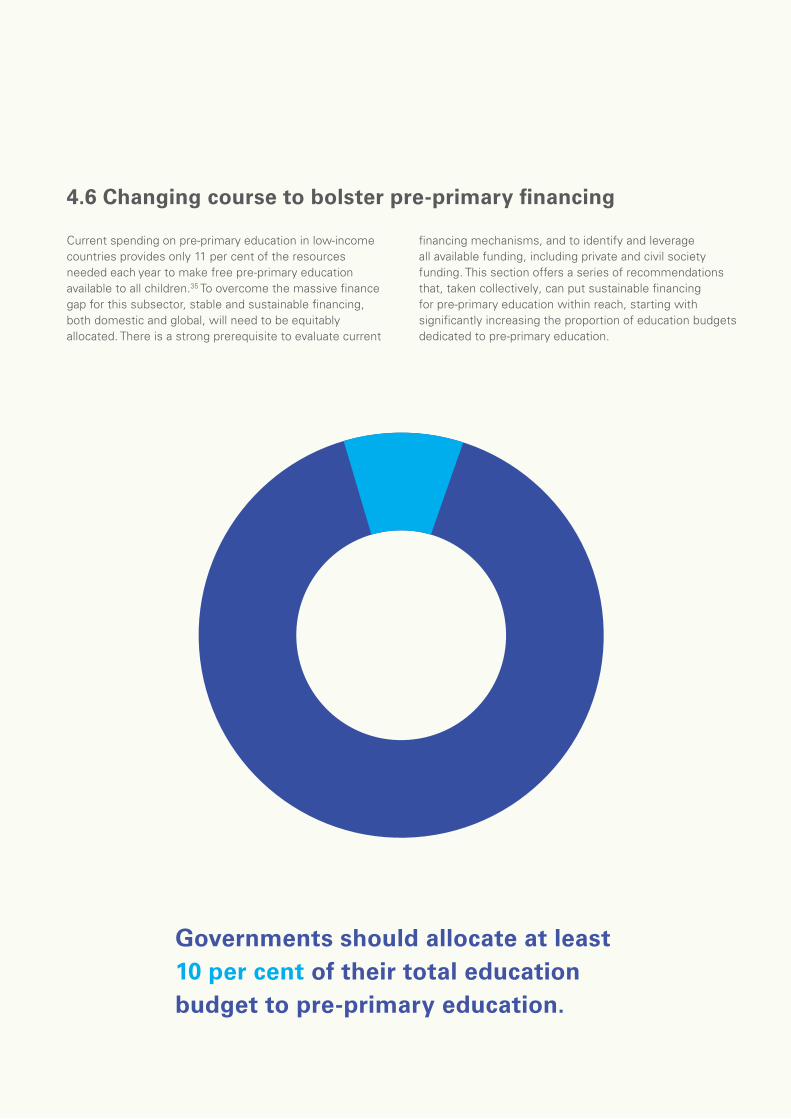
116
The first step towards SDG 4: Significantly increasing financing for pre-primary education
Current spending on pre-primary education in low-income countries provides only 11 per cent of the resources needed each year to make free pre-primary education available to all children.35 To overcome the massive finance gap for this subsector, stable and sustainable financing, both domestic and global, will need to be equitably allocated. There is a strong prerequisite to evaluate current
financing mechanisms, and to identify and leverage all available funding, including private and civil society funding. This section offers a series of recommendations that, taken collectively, can put sustainable financing for pre-primary education within reach, starting with significantly increasing the proportion of education budgets dedicated to pre-primary education.
4.6 Changing course to bolster pre-primary financing
Governments should allocate at least 10 per cent of their total education budget to pre-primary education.
A World Ready To Learn
117
Mali: Increasing domestic financing by developing
priorities in planning and budgets
Mali provides an example of how a low-income country can increase domestic financing by deploying three key strategies: establishing clear priorities; conducting a thoughtful and inclusive planning process, including financial modeling; and taking a progressive approach to increasing budgets.
Within the context of its new education sector planning cycle, Mali began working on a Ten-Year Education Development Program (‘PRODEC2’) in 2015. This provided a timely opportunity to reflect on the state of the country’s pre-primary subsector and review the budget allocation by the Ministry of Education to this subsector, which was set at only about 0.01 per cent of the overall education budget.
In preparation for PRODEC2, key studies and analyses were conducted, including:
· financial modelling, which suggested several costing and financing options for quality early childhood education services;
· an early learning assessment that examined the knowledge and skills of children entering primary school, while revealing key characteristics of pre-primary services (including access, demographics, types of settings); and
· a pre-primary subsector diagnostic exercise, which analysed the strengths, weaknesses and capacity gaps across all aspects of the subsector, including workforce, quality assurance, curriculum and others.
This evidence supported the development of a strategic expansion plan under PRODEC2 and strengthened the case for increasing investments in pre-primary education. Complementary advocacy efforts among development partners, such as UNICEF, UNESCO’s International Institute for Educational Planning,36 the World Bank and other key stakeholders, were also crucial. These well-strategized and well-timed processes resulted in a budget increase for pre-primary education from a 0.01 per cent share of the total education budget to at least 3.9 per cent – a remarkable achievement for the pre-primary subsector, and one that flowed naturally from the establishment of pre-primary as a priority and the subsequent planning.37
The success in Mali highlights the importance of evidence-based subsector analysis and diagnostic work that should inform advocacy efforts and budgetary allocations. Furthermore, coordinated and collective action by development partners is crucial to improve the financing for pre-primary education. Synergistic efforts by partners in Mali were able to address the lack of data processing and analysis within the subsector and develop a compelling case for investing in pre-
primary education – ultimately resulting in the development of a comprehensive, and achievable, pre-primary expansion plan.
In similar achievements, Kyrgyzstan, Viet Nam and Mongolia significantly increased expenditure on pre-primary education as a result of their respective education policy initiatives. Pre-primary education in Kyrgyzstan is one of the priority areas in the National Sustainable Development Strategy 2013–2017
4.6.1 Place pre-primary education on a firm financial footing by allocating 10 per cent of education budgets to the subsector
If countries want to ensure universal access, it is necessary to integrate preschool services into existing financing for other core education services. It is imperative for all countries to boost domestic financing, including upper- and high-income countries. In low- and lower-middle-income countries, maintaining the current spending on pre-primary education will not suffice to reach the target of universal access by 2030.
Securing adequate funding for universal quality pre-primary education will no doubt take place incrementally and progressively, but the aim of allocating at least 10 per cent of domestic education budget to the pre-primary subsector must be clear from the start. While adequate financing is not a guarantee for success, it does create a pathway for expanding services, which, if planned equitably, can have a substantial effect on education systems and children alike. A number of countries have demonstrated that increases in pre-primary financing can be incorporated into routine budgetary exercises, if accompanied with appropriate planning measures and given political support. This section considers some of these success stories, as well as the strategies used by countries to successfully increase financing for pre-primary programmes.
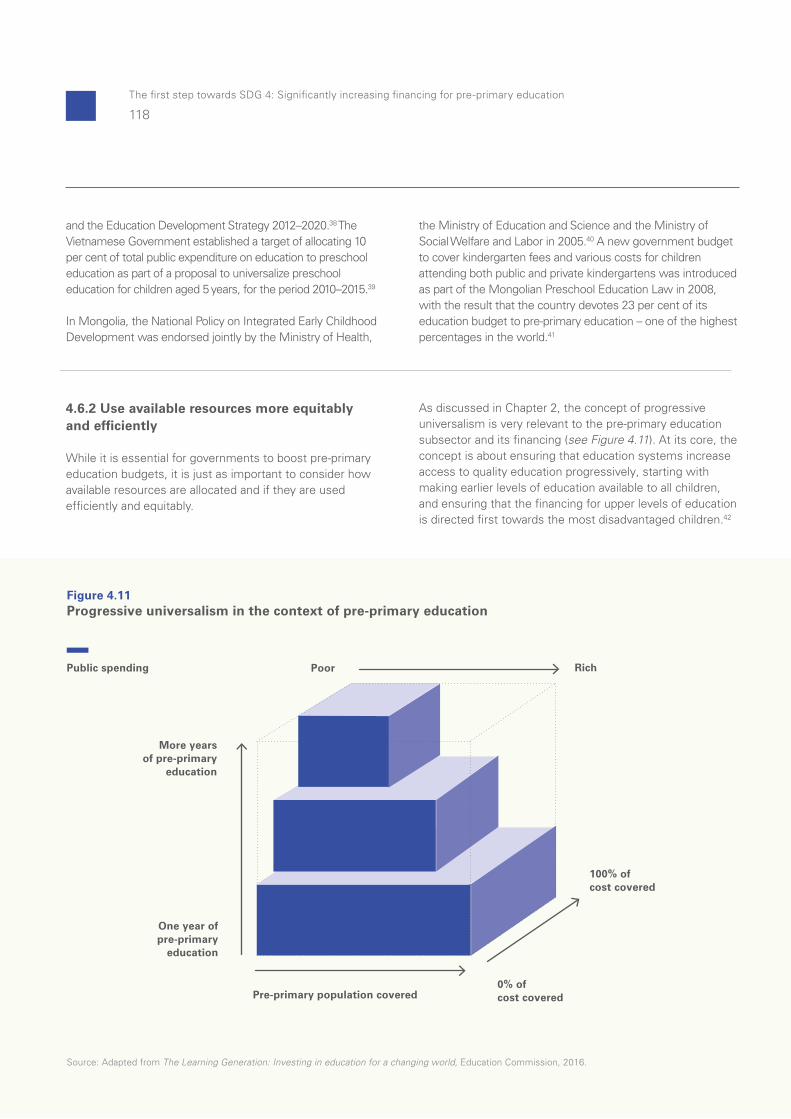
118
The first step towards SDG 4: Significantly increasing financing for pre-primary education
and the Education Development Strategy 2012–2020.38 The Vietnamese Government established a target of allocating 10 per cent of total public expenditure on education to preschool education as part of a proposal to universalize preschool education for children aged 5 years, for the period 2010–2015.39
In Mongolia, the National Policy on Integrated Early Childhood Development was endorsed jointly by the Ministry of Health,
the Ministry of Education and Science and the Ministry of Social Welfare and Labor in 2005.40 A new government budget to cover kindergarten fees and various costs for children attending both public and private kindergartens was introduced as part of the Mongolian Preschool Education Law in 2008, with the result that the country devotes 23 per cent of its education budget to pre-primary education – one of the highest percentages in the world.41
Source: Adapted from The Learning Generation: Investing in education for a changing world, Education Commission, 2016.
Figure 4.11Progressive universalism in the context of pre-primary education
Public spending
0% of cost covered
Poor Rich
One year ofpre-primary
education
More yearsof pre-primary
education
100% ofcost covered
Pre-primary population covered
4.6.2 Use available resources more equitably and efficiently
While it is essential for governments to boost pre-primary education budgets, it is just as important to consider how available resources are allocated and if they are used efficiently and equitably.
As discussed in Chapter 2, the concept of progressive universalism is very relevant to the pre-primary education subsector and its financing (see Figure 4.11). At its core, the concept is about ensuring that education systems increase access to quality education progressively, starting with making earlier levels of education available to all children, and ensuring that the financing for upper levels of education is directed first towards the most disadvantaged children.42
A World Ready To Learn
119
United Republic of Tanzania: Distributing capitation
grants with a pro-equity approach
In the United Republic of Tanzania, after the Government abolished school fees, the capitation grant system was introduced in 2002 to support the quality of education by providing funds directly to schools. A capitation grant of 10,000 Tanzanian shillings (about $5) is allocated to each pre-primary child irrespective of socio-economic status. This amount was divided into two portions: 4,000 Tanzanian shillings is held back at the national level to cover the cost of textbooks; the balance is paid directly to the school in monthly instalments of 500 shillings per pupil.
A policy decision was taken in 2014 to include one year of pre-primary education (and four years of lower secondary education) in free, basic education, which then extended the capitation grant to pre-primary pupils. Family contributions to schooling were eliminated, including contributions for paraprofessional teacher allowances,
building repairs and construction, materials and equipment. The new policy boosted the national enrolment ratio of five-year-old children from 35 per cent to 47 per cent in 2016; however, it also contributed to unacceptably high PTRs.
While the inclusion of pre-primary pupils as capitation grant beneficiaries was welcomed by schools, the amount of the grants is considered inadequate, especially in some districts. In 2017, the Government of Tanzania developed a new formula designed to achieve a more equity-based distribution of funds. Rather than providing a flat rate per child, the proposed formula takes into account total school enrolment, as well as distance from district headquarters, poverty and students with special needs. This ensures that small schools receive a minimum per-school allocation and increases the amount provided in high-poverty and remote areas. The new formula is still under approval but is a promising way forward to ensure capitation grants for pre-primary education use a pro-equity approach.
Translating the progressive universalist concept to the pre-primary education subsector is twofold. First, governments should use limited public resources to provide a minimum one-year package of free quality pre-primary services for all children, including through alternative and targeted efforts to reach vulnerable children. Subsequently, as more funding is made available, system capacity grows and the subsector can expand to additional years of pre-primary education, government priority should be to direct public resources first to disadvantaged children and ensure they are the ones benefiting first from extended services and additional years of preschooling.
This approach can inform spending decisions when public funds are limited, and balance allocations to prioritize the highest social returns.43 Where even a minimum package of services is not financially feasible for all and fees are
needed, an effort should be made to reduce or remove the financial burden for the poorest families first. A number of countries have already demonstrated potential pro-equity financing strategies that can underpin expansion efforts. For example, in the expansion of the Grade R class, South Africa introduced pro-poor subsidies to provide additional funds to the poorest 40 per cent of schools, primarily used to supply additional learning materials and to reduce the number of children per classroom. Indonesia’s School Operational Fund provides funds to all registered early childhood care and education centres to cover operational costs. Additional funding is provided to those facilities with poor students or students with disabilities and those affected by emergencies.44 In Chile, a mix of public and government-subsidized providers offer pre-primary education, with subsidies available to support children in the bottom three income quintiles.45 Similarly, the experience of the United Republic of Tanzania is described in more detail below.
Efficient use of resources should also be of paramount importance to governments. Evidence-based and cost-effective programme approaches that can deliver real results for children should be a priority. Further, resource allocation will seek to maximize enrolment while ensuring
lower PTRs as well as key quality inputs by allocating sufficient budgets to non-salary expenditures. As discussed in Chapter 3, this may require important trade-offs with respect to teacher salaries and qualifications in the short term.
120
The first step towards SDG 4: Significantly increasing financing for pre-primary education
There are important lessons that can be applied from the experience of countries such as South Africa that have recently taken on the ambitious agenda of universalizing one year of pre-primary education – referred to as ‘R class’. Shifting responsibility from the central government to provinces or counties needs to be done in phases
and gradually, with attention to building the requisite capacities of lower levels of government. While pro-poor subsidies can help meet the challenges faced by schools in lower-income areas, compensatory financing may be needed to improve quality in schools that are already under-resourced.
Brazil: Scaling up pre-primary provision through
transfers to municipalities
Some decentralized systems have identified ways to reduce the risks when local levels of government assume the responsibility for service delivery. In Brazil, responsibility for early childhood education, as well as for primary and lower secondary, rests at the municipal government level, while the federal and state governments have primary responsibility for higher levels of education.
To secure financing, municipalities pay into a state fund that is redistributed to municipalities based on the number of students enrolled in public schools. Municipalities
are mandated to spend at least 25 per cent of revenue on education, and municipal governments spend more than 95 per cent of public financing on early childhood education. If the funds received by municipalities are lower than a certain established amount per child, the federal government provides additional transfers.
In this way, municipalities contribute to financing education in Brazil, but the federal government ensures that any unanticipated shortfalls at the local level do not compromise the availability of funding. Thus, a significant share of municipalities’ expenditure for early childhood education originates from transfers from state and federal governments.49
National governments must ensure that decentralized spending is both adequate and equitable. This requires clarifying responsibilities at different levels of government, establishing, and implementing support and accountability mechanisms.
In Brazil, municipalities are responsible for pre-primary education and pay into a state fund; this money is then redistributed to municipalities based on the number of students enrolled in public schools. Additional transfers are provided to help equalize funding per child across municipalities.47 In the United States, the federal
government will cover 80 per cent of costs in supporting Head Start programmes if local grantees contribute 20 per cent of funds, either in kind or as cash contributions. Local programmes can apply for waivers if they are unable to meet these requirements.48
4.6.3 Coordinate national and subnational budgets, while building accountability mechanisms and capacities for implementation
Funding for pre-primary education is frequently provided by a mix of central, regional and local sources. The share of public funding originating from each level varies significantly from country to country. The Ministry of Finance may also provide education funding directly to regional or local entities, which then decide how to
allocate funding to or within the pre-primary subsector. In the Lao People’s Democratic Republic, provincial and district education offices receive funding directly from the Ministry of Finance to cover staff salaries, teaching and learning materials and other recurrent expenses. Capital investment funds, however, are channelled through the national Ministry of Education and Sports.46 The generation of funding may also be decentralized, and regional or local governments may be granted taxation or revenue-generating responsibilities.
A World Ready To Learn
121
South Africa: Building implementation capacity and
financial responsibility at various levels of government
South Africa offers an example of how the transfer of national funds to local governments should be complemented with building implementation capacity into the process. In 1997, South Africa launched a three-year pilot project to test the feasibility of introducing a year of pre-primary education at scale. The national reception year, or Grade R, was officially introduced in 2001 for children aged 5 years, with the goal of reaching universal access by 2010 and making Grade R compulsory by 2019.
For the first three years of its roll-out, the National Treasury provided conditional grants to various levels of government to fund 4,500 sites, train practitioners and monitor and support the programme. But in this initial phase, less than one third of the funds were actually spent in 2001, due to limited personnel and inadequate capacities at the provincial level. By 2004, however, 75 per cent of these grants were spent thanks to improved planning and implementation capacity. In addition, provincial education
departments were required to include Grade R in their budgets for the 2004–2005 academic year.
In 2003–2004, Grade R became centralized in the Department of Basic Education. It now forms the first year of primary education, with more than 90 per cent of classes housed in public primary schools; the remainder of Grade R classes take place in community-based early childhood development centres or private schools. Funding for Grade R is provided by the National Treasury through the Department of Basic Education, with provincial allocations designed to address equity issues. Provincial departments allocate the funds in two ways: (1) to public primary schools and school governing bodies for employing teachers and purchasing materials for Grade R; and (2) a per-learner grant is provided to community-based centres that are registered with the Department of Basic Education to provide the Grade R programme. However, ensuring that the provinces spend the funds as intended and equitably with respect to salaries, subsidies and learning materials remain a challenge. The government continues to steadily increase funding for Grade R to make it universal and compulsory. 50
4.6.4 Increase aid to pre-primary education to at least 10 per cent of international education investments, catalysing and complementing public resources
Domestic and sustainable sources of financing are fundamental to ensuring wide coverage of pre-primary education services and closing equity gaps in access. Yet it is clear that domestic finance alone will not solve the problem of underinvestment: International donors must lead by example, by making substantial investments in this subsector to support initial progress as public finances catch up.
Most governments of low-income countries face a two-part challenge: (1) to increase the pre-primary share of the overall education budget from the current average of 2 per cent to the recommended share of 10 per cent; and (2) to significantly increase their spending per child enrolled in order to achieve key quality goals, as discussed in Chapter 3, including a reasonable PTR. With both these parameters in mind, according to the results of a simulation model
developed by UNICEF,51 low-income countries would not be able to universalize access with domestic resources alone.
Even as governments of low-income countries progressively allocate a higher share of education budgets to this subsector, they will experience both short- and medium-term gaps in funding. Therefore, additional external financing for this subsector will be crucial to jump-start national efforts, complement public resources and fill funding gaps in the medium term.
In addition to increasing the total amount of funding, international aid can be used to catalyse domestic and more sustainable sources of funding, as well as to reach the most disadvantaged children. Further, partner support in planning and budgeting better for this subsector is critical. For example, the engagement of partners such as UNESCO’s International Institute for Educational Planning (IIEP) or Global Partnership for Education in strengthening capacities for planning and managing of the early childhood education subsector in the context of the broader education system is very timely.52
122
The first step towards SDG 4: Significantly increasing financing for pre-primary education
4.6.5 Leverage non-state funding sources to expand access to affordable opportunities
Demand for pre-primary education will continue to grow in low- and middle-income countries. Access to quality pre-primary education for all children in resource-constrained contexts requires that education systems harness a range of funding sources, including private finance, and stimulate non-state financing. There are important considerations around the role of the profit motive in education and the effectiveness of particular delivery mechanisms, such as public–private partnerships. Yet, the key question for govern-ments in low- and middle-income countries is not whether to leverage private investments in pre-primary education, but how to do so equitably and effectively in order to ensure that money is not a barrier to access for disadvantaged families.
Public–private partnerships that involve the contracting of private providers by the government to deliver pre-primary
education may bring a host of potential benefits, including improved effectiveness of programme delivery and greater innovation. There are also risks to this approach, including declining quality of public programmes, complexities in design and implementation, and widening disparities in access and quality.58 In India, for example, affordable private schools at the pre-primary level have become increasingly popular. A recent study of 4,407 low-income households found that 95 per cent enrolled their children aged 2–5 years in preschool, and 87 per cent opted for private providers. The quality of these privately provided services varies significantly, however, demonstrated by assessments of children entering Grade 1 who were found to have learned very little during their preschool years.59
Therefore, a crucial element of public–private models is the ability of governments to assure quality by monitoring and supporting non-state providers while also clarifying their role and autonomy to deliver services.60
International donors must lead by example, by making large investments in this subsector to support initial progress and complement public finances as they catch up.
Lao People’s Democratic Republic: Leveraging
international aid to catalyse domestic financing for pre-
primary and primary education
Attention to pre-primary schooling at the policy level in the Lao People’s Democratic Republic led to increased funding and support for strengthening the pre-primary system.
The Education Sector Development Plan (ESDP) 2011–2015 positioned early childhood education as the start of basic education followed by five years of primary education and four years of lower secondary education.53 Developed through consultations between the Government and development partners, the plan provided a tool for leveraging financial support for education generally, and pre-primary education specifically, through the Education for All-Fast Track Initiative Catalytic Fund Programme 2010–2014.54 The fund, in turn, aimed to support the country in increasing coverage of quality pre-primary and primary education, with a focus on
disadvantaged children. This was achieved by improving preschool infrastructure, including the construction of new schools, and providing learning and teaching materials, workforce training and capacity-building.55
By 2014, spending on pre-primary education composed 6.55 per cent of the overall education budget.56 Though this was not sufficient to address the learning needs of all young children in the country, it allowed additional capital to be leveraged through bilateral and multilateral development partners. The Global Partnership for Education, together with other partners, provided key support.
In 2013, a comprehensive midterm review of the ESDP was conducted, leading to development of the 2016–2020 ESDP, which continues to prioritize increasing access and quality for pre-primary education, focusing on expanding the one-year pre-primary programme for five-year-olds and improving quality in rural areas.57
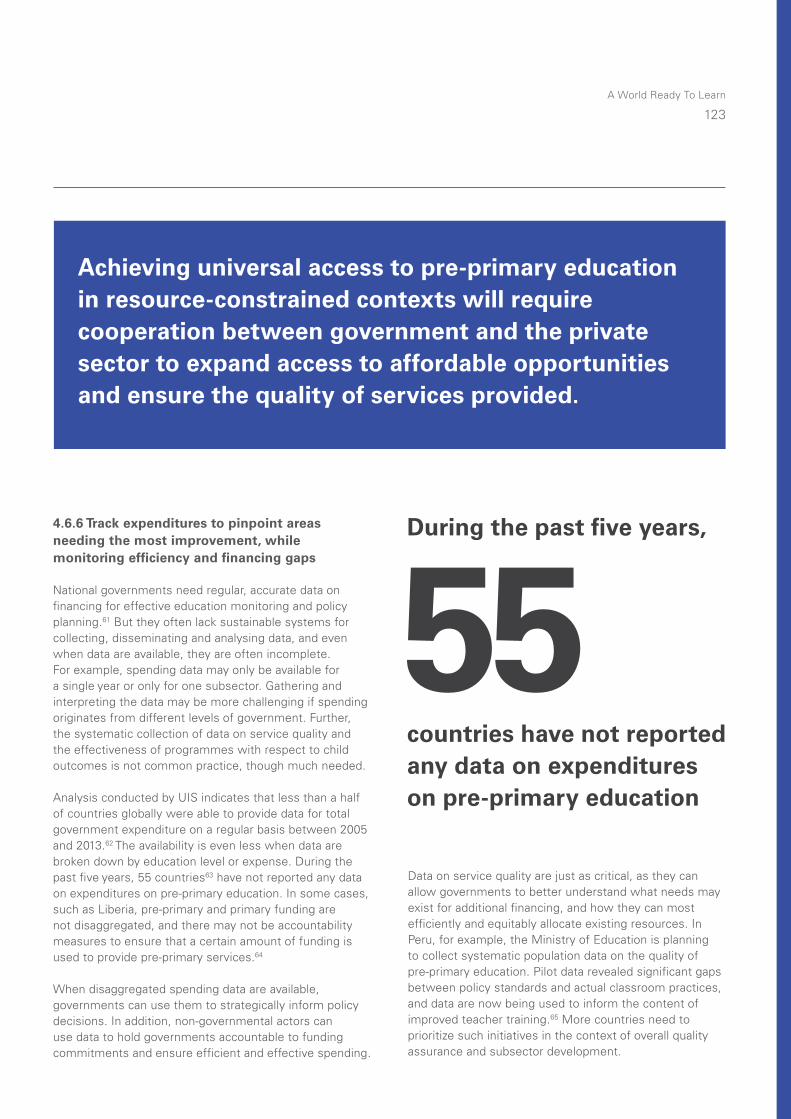
A World Ready To Learn
123
Achieving universal access to pre-primary education in resource-constrained contexts will require cooperation between government and the private sector to expand access to affordable opportunities and ensure the quality of services provided.
4.6.6 Track expenditures to pinpoint areas needing the most improvement, while monitoring efficiency and financing gaps
National governments need regular, accurate data on financing for effective education monitoring and policy planning.61 But they often lack sustainable systems for collecting, disseminating and analysing data, and even when data are available, they are often incomplete. For example, spending data may only be available for a single year or only for one subsector. Gathering and interpreting the data may be more challenging if spending originates from different levels of government. Further, the systematic collection of data on service quality and the effectiveness of programmes with respect to child outcomes is not common practice, though much needed.
Analysis conducted by UIS indicates that less than a half of countries globally were able to provide data for total government expenditure on a regular basis between 2005 and 2013.62 The availability is even less when data are broken down by education level or expense. During the past five years, 55 countries63 have not reported any data on expenditures on pre-primary education. In some cases, such as Liberia, pre-primary and primary funding are not disaggregated, and there may not be accountability measures to ensure that a certain amount of funding is used to provide pre-primary services.64
When disaggregated spending data are available, governments can use them to strategically inform policy decisions. In addition, non-governmental actors can use data to hold governments accountable to funding commitments and ensure efficient and effective spending.
countries have not reported any data on expenditures on pre-primary education
During the past five years,
Data on service quality are just as critical, as they can allow governments to better understand what needs may exist for additional financing, and how they can most efficiently and equitably allocate existing resources. In Peru, for example, the Ministry of Education is planning to collect systematic population data on the quality of pre-primary education. Pilot data revealed significant gaps between policy standards and actual classroom practices, and data are now being used to inform the content of improved teacher training.65 More countries need to prioritize such initiatives in the context of overall quality assurance and subsector development.
4.7 Conclusion and recommendations: Budgeting and planning for universal pre-primary coverage will advance the possibilities
Sustained and adequate public financing of pre-primary education is essential to achieving high levels of enrolment and good quality. Yet many governments and donors have neglected pre-primary education in favour of higher levels of education. The current distribution of investments disproportionately benefits children from the wealthiest households and is detrimental to the most disadvantaged, who are the least likely to progress to higher levels of education. In addition, the quality of higher education is compromised for all children by underachievement and inefficiencies in earlier years that ultimately reduce the capacities of incoming students and teachers alike.
Some of the poorest countries in the world have shown that substantial increases in financing for pre-primary education can be achieved and sustained, and that these increases in financing can be expected to lead directly to increases in pre-primary enrolment and to improved quality and outcomes in the education system overall.
Perhaps the most important lesson learned from their experiences is the importance of making pre-primary education a policy priority, and developing a sense of promise and possibility through the budgeting and planning process.
124
The first step towards SDG 4: Significantly increasing financing for pre-primary education
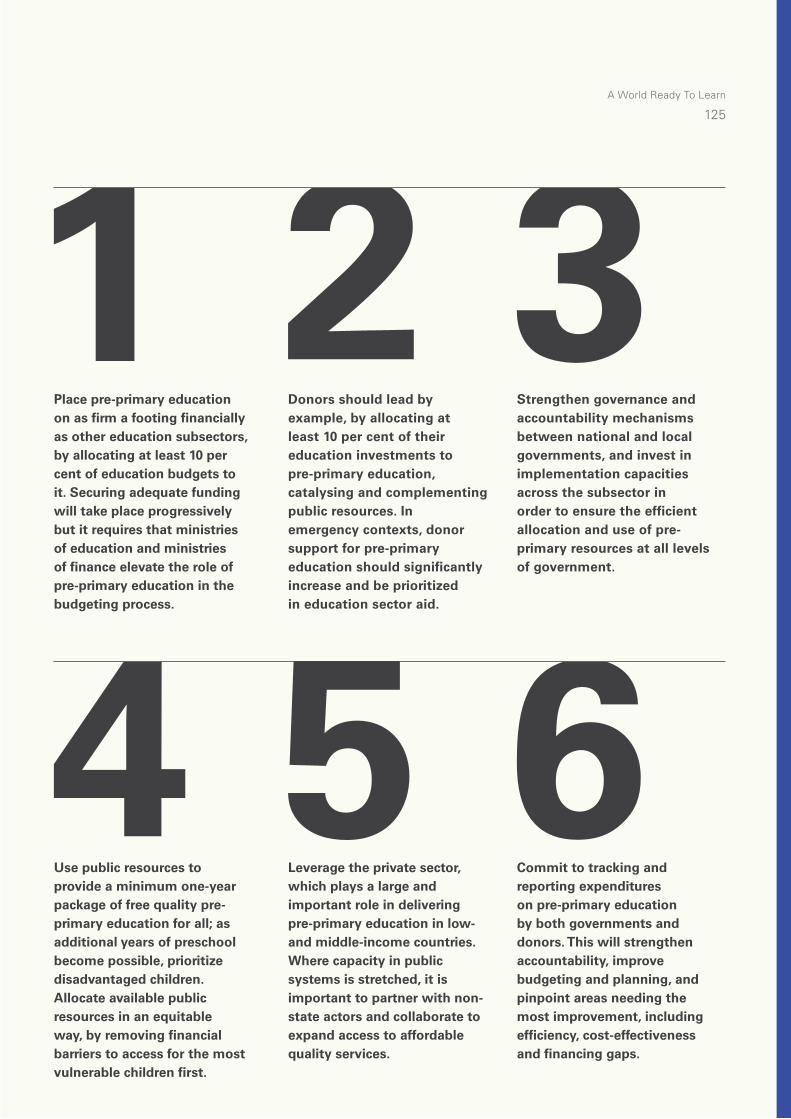
Place pre-primary education on as firm a footing financially as other education subsectors, by allocating at least 10 per cent of education budgets to it. Securing adequate funding will take place progressively but it requires that ministries of education and ministries of finance elevate the role of pre-primary education in the budgeting process.
Use public resources to provide a minimum one-year package of free quality pre-primary education for all; as additional years of preschool become possible, prioritize disadvantaged children. Allocate available public resources in an equitable way, by removing financial barriers to access for the most vulnerable children first.
Donors should lead by example, by allocating at least 10 per cent of their education investments to pre-primary education, catalysing and complementing public resources. In emergency contexts, donor support for pre-primary education should significantly increase and be prioritized in education sector aid.
Leverage the private sector, which plays a large and important role in delivering pre-primary education in low- and middle-income countries. Where capacity in public systems is stretched, it is important to partner with non-state actors and collaborate to expand access to affordable quality services.
Strengthen governance and accountability mechanisms between national and local governments, and invest in implementation capacities across the subsector in order to ensure the efficient allocation and use of pre-primary resources at all levels of government.
Commit to tracking and reporting expenditures on pre-primary education by both governments and donors. This will strengthen accountability, improve budgeting and planning, and pinpoint areas needing the most improvement, including efficiency, cost-effectiveness and financing gaps.
A World Ready To Learn
125
A World Ready To Learn
127
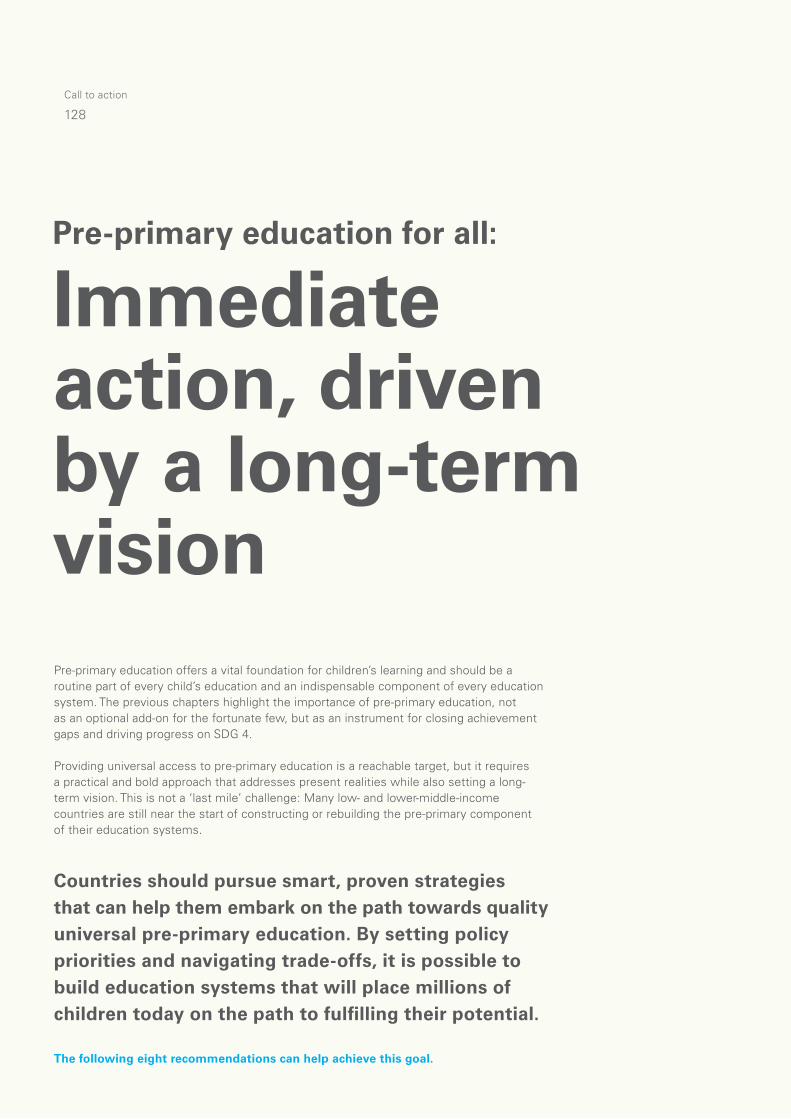
128
Section
Pre-primary education for all:
Immediate action, driven by a long-term visionPre-primary education offers a vital foundation for children’s learning and should be a routine part of every child’s education and an indispensable component of every education system. The previous chapters highlight the importance of pre-primary education, not as an optional add-on for the fortunate few, but as an instrument for closing achievement gaps and driving progress on SDG 4.
Providing universal access to pre-primary education is a reachable target, but it requires a practical and bold approach that addresses present realities while also setting a long-term vision. This is not a ‘last mile’ challenge: Many low- and lower-middle-income countries are still near the start of constructing or rebuilding the pre-primary component of their education systems.
Countries should pursue smart, proven strategies that can help them embark on the path towards quality universal pre-primary education. By setting policy priorities and navigating trade-offs, it is possible to build education systems that will place millions of children today on the path to fulfilling their potential.
The following eight recommendations can help achieve this goal.
128
Call to action

A World Ready To Learn
129
Raise the profile of pre-primary education within education sector plans and policies, and urgently accelerate efforts to address access gaps.
At least 175 million young children are not enrolled in any type of pre-primary
education programme. This calls for high-level political commitment to public
pre-primary education on the part of governments, and an urgent response
to develop an interim strategy that introduces rapid and tangible changes,
complemented by medium- to long-term strategies to make at least one year
of quality pre-primary education a routine part of education systems and of every
child’s life.
Pre-primary education must move from the margins of education sector plans
to their centre. There are difficult short-term policy choices to be made to
accelerate the trend lines, including the duration of pre-primary programmes
and the reallocation of financing. But with strong political, technical and financial
support, solutions are within reach for each of these challenges.
A World Ready To Learn
129
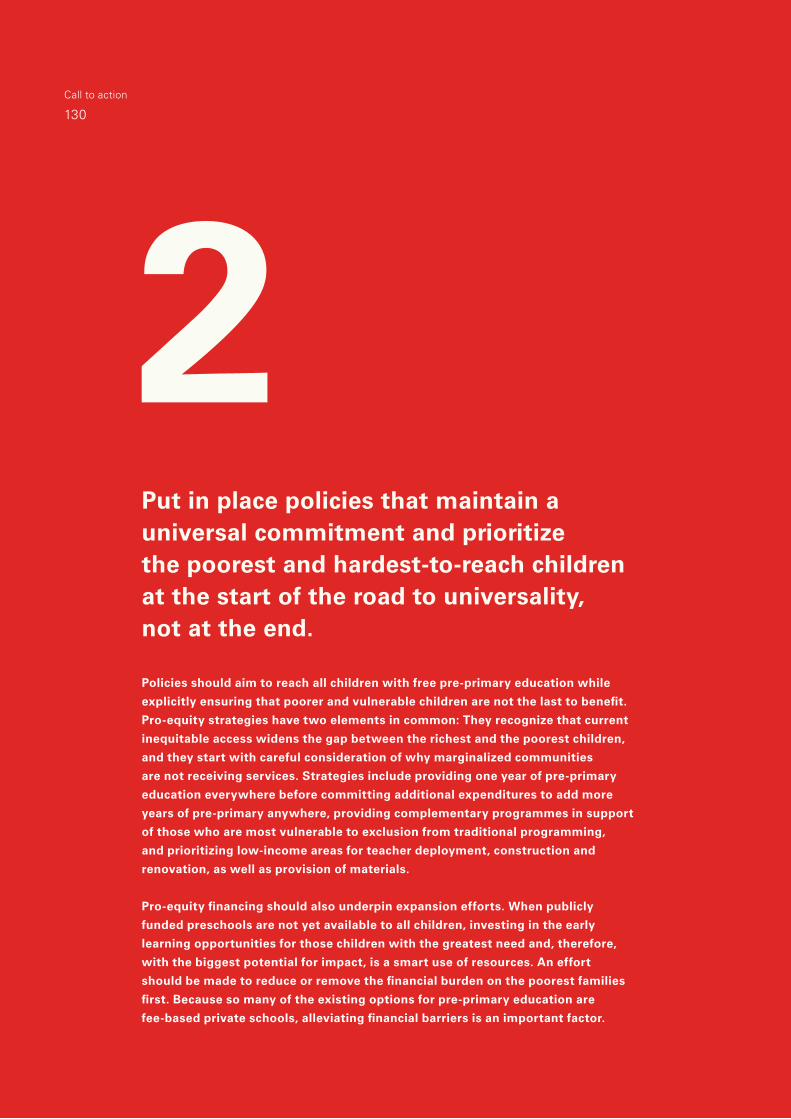
Put in place policies that maintain a universal commitment and prioritize the poorest and hardest-to-reach children at the start of the road to universality, not at the end.
Policies should aim to reach all children with free pre-primary education while
explicitly ensuring that poorer and vulnerable children are not the last to benefit.
Pro-equity strategies have two elements in common: They recognize that current
inequitable access widens the gap between the richest and the poorest children,
and they start with careful consideration of why marginalized communities
are not receiving services. Strategies include providing one year of pre-primary
education everywhere before committing additional expenditures to add more
years of pre-primary anywhere, providing complementary programmes in support
of those who are most vulnerable to exclusion from traditional programming,
and prioritizing low-income areas for teacher deployment, construction and
renovation, as well as provision of materials.
Pro-equity financing should also underpin expansion efforts. When publicly
funded preschools are not yet available to all children, investing in the early
learning opportunities for those children with the greatest need and, therefore,
with the biggest potential for impact, is a smart use of resources. An effort
should be made to reduce or remove the financial burden on the poorest families
first. Because so many of the existing options for pre-primary education are
fee-based private schools, alleviating financial barriers is an important factor.
130
Call to action
A World Ready To Learn
131
In countries not on track to achieve the universal target, prioritize the implementation of a single year of free pre-primary education, with an aim to expand this provision to more years as the capacity of the pre-primary system grows.
Far too many countries are off track against the target of universal pre-primary
education, often severely. Governments and their development partners in
these countries should focus on the implementation of a single year of universal
free pre-primary education as a first priority, while aiming to increase universal
provision to two years as the pre-primary system grows. As additional years
of pre-primary education are considered, the priority should be to provide this
expanded package to disadvantaged children first.
To reach the target by 2030, these countries will need to substantially increase
the size and quality of their early childhood education workforce. Governments
and ministries of education will need to foster partnerships with non-state
providers of pre-primary education, including civil society, the private sector,
families and communities, to maximize early learning opportunities for children
and leverage innovative programmes and models to reach all children.
A World Ready To Learn
131
Invest in quality as the system grows – not after – striking a balance between expanding access and maintaining quality so that pre-primary education results in real benefits for all children.
Given the massive shortage of pre-primary teachers, many governments and partners will
need to pursue an interim strategy of recruiting local-hire teachers without higher education
or specialized early childhood education training but possessing the nurturing qualities
required to provide a positive learning experience for children. This will make it possible to
keep class sizes and pupil-teacher ratios low enough to provide consistent quality.
To compensate for the lack of qualified teachers with high academic qualifications and
specialized degrees, while producing equivalent outcomes and lower unit costs,
governments will need to emphasize intensive continuous professional development
and relevant on-the-job mentoring and training. At the same time, they will need to make a
major commitment at all levels of education systems to develop the teaching workforce over
time and promote new cohorts of well-qualified teachers with specialized training
in child-centred approaches.
Priority should be given to establishing clear quality standards to ensure outcomes for
children, including progressively reaching a pupil-teacher ratio of no more than 20 children
per teacher. Putting in place an effective quality assurance framework for the pre-primary
programmes across both public and non-state/private providers and building national capacity
to use data for improving quality will be just as important. Finally, governments need to
consider the role of the private sector and include it in the wider subsector; this will require
building inclusive quality assurance efforts, rather than risking having two parallel systems.
132
Call to action
A World Ready To Learn
133
Strengthen the governance and implementation capacity of the pre-primary system across all levels of government.
Leveraging the rich array of funding and programming models that are appropriate
for this subsector will hinge not only on a coherent policy/strategy and solid financial
base, but also on strong governance, accountability and implementation capacity
to back it up. Many low- and lower-middle-income countries will need to start with
the foundations of a nascent pre-primary system, while tackling persistent challenges
throughout the education sector. It is essential to ensure that responsibilities at
different levels of governments are clear and accountability mechanisms are in place.
Early investments in system-wide capacities for quality implementation and
assurance, including personnel management, are crucial. Much of this will need
to be provided at the district level or cluster/school level in the form of training,
coaching and supervisory visits to pre-primary educators. Developing implementation
capacity will empower local governments, administrators and parents. This will
include the availability of much better real-time information for decision-makers and
stakeholders at all levels about who is attending preschool and who is not, and much
greater system capacity to ensure the participation of the most vulnerable, ensuring
a greater voice for their parents.
A systems-strengthening approach to pre-primary education investments by both
governments and donors will be a critical aspect of achieving universal pre-primary
education. Support from external partners should, therefore, focus on helping the
pre-primary subsector develop the necessary technical and coordinating capacities.
A World Ready To Learn
133
134
Section
Significantly increase financing for pre-primary education and ensure an adequate level of public and international resources for this subsector.
This report demonstrates that the provision of funding for pre-primary education
should not be understood as a loss of support for other subsectors of education,
but rather a core strategy for strengthening the entire system. Across all
countries, adequate and predictable financing is necessary to make a meaningful
difference in expanding provision. Governments should dedicate at least 10 per
cent of their total education budget to pre-primary education. Donors should lead
by example, by making the same commitment and allocating at least 10 per cent
of their education investments to this subsector, including in humanitarian crisis,
catalysing and complementing public resources and filling in short-term gaps.
Expanded access cannot come at the expense of diminished quality. Therefore,
governments should commit at least 25 per cent of recurrent pre-primary
budgets for non-salary expenditures such as training for teachers, curriculum
development, teaching and learning materials and quality assurance mechanisms.
Finally, a commitment to fully report financing of pre-primary education for
improved international monitoring and advocacy is needed across policymakers,
international partners and donors.
134
Call to action
A World Ready To Learn
135
Establish a common vision for the subsector among governments, donors and partners and shape priorities in a complementary manner to make funding and technical assistance available where and when it is most needed.
Reaching the target of universal pre-primary education will take a broad coalition of partners
supporting multiple service providers – including public, private and non-profit providers such
as religious and civil society organizations. Parents are likewise vital partners in raising the
demand for reaching the goal.
In the pre-primary subsector, the role of the Ministry of Education will differ from its role
in other subsectors: It will need to become more nimble, with greater emphasis on quality
assurance and implementation of an enabling regulatory framework for service providers.
As programmes are taken to scale, education ministries will also need to develop an equity
assurance role to match the focus on quality, ensuring that those most in need of services
have the most access to public financing.
Domestic and international partners are key to infusing investments in this fledgling subsector,
providing flexible resources to fill the gaps that domestic financing alone cannot address.
Capacity-building, training and other technical support will be key, with a commitment to work
with local institutions and ensure the transfer of capacities to a stable pre-primary subsector.
When it comes to preparing children for success in school and life, decisions about appropriate
trade-offs cannot rest solely in the hands of policymakers. Families and communities need to be
engaged in the process, as they support children’s learning at home and drive the mandate for
quality programmes that can help provide the best start in life for their children.
A World Ready To Learn
135

136
Section
Move decisively, now, to achieve universal pre-primary education by 2030. Progress on many important goals within the education sector has ground to a
virtual halt during the past decade. After rapid increases in enrolment under the
Millennium Development Goals, the number of children out of school has remained
stubbornly resistant to further declines. Similarly, efforts to improve students’
progress through multiple levels of the school system have been hampered by
high rates of repetition and dropout. While many partners are working closely with
governments to improve quality, overall learning levels remain low. And, in all cases,
the poorest and most vulnerable children continue to have the least access to both
preschool and primary-school services.
The evidence provided in this report makes it clear that quality pre-primary
education can and will make a difference on all of these fronts. It will not solve all
existing problems, but it can reverse the trend of stagnation within the subsector
and jump-start the momentum with a solid platform for embracing the possibilities.
136
Call to action
A World Ready To Learn
137
Pre-primary education must move from the margins of education sector plans to their centre. There are difficult short-term policy choices to be made to accelerate the trend lines – but with strong political, technical and financial support, solutions are within reach for each of the challenges.
Armed with these recommendations – and the evidence to back them up – governments
and partners around the world can build the foundations that will ensure that universal
quality pre-primary education services reach all children, including the most vulnerable.
This can be achieved, if the work is approached as a shared goal: seeing every young
person benefit from education, learning, training or employment by 2030. Those young
people are ready for pre-primary education today. It is crucial to make significant progress
in the short term and, over the next decade, offer every young child the opportunity
to participate in early education that aims to develop the child’s talents and intellectual,
social and physical abilities to their fullest potential.
A World Ready To Learn
137
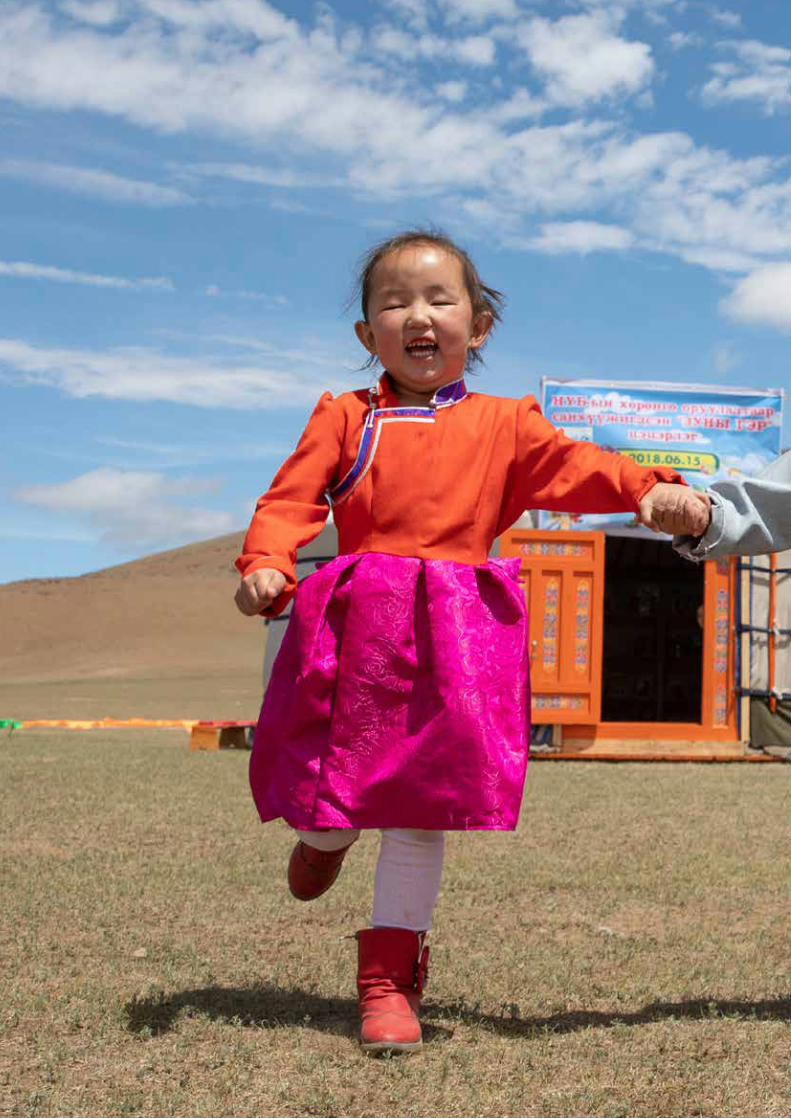
138
Section

A World Ready To Learn
139
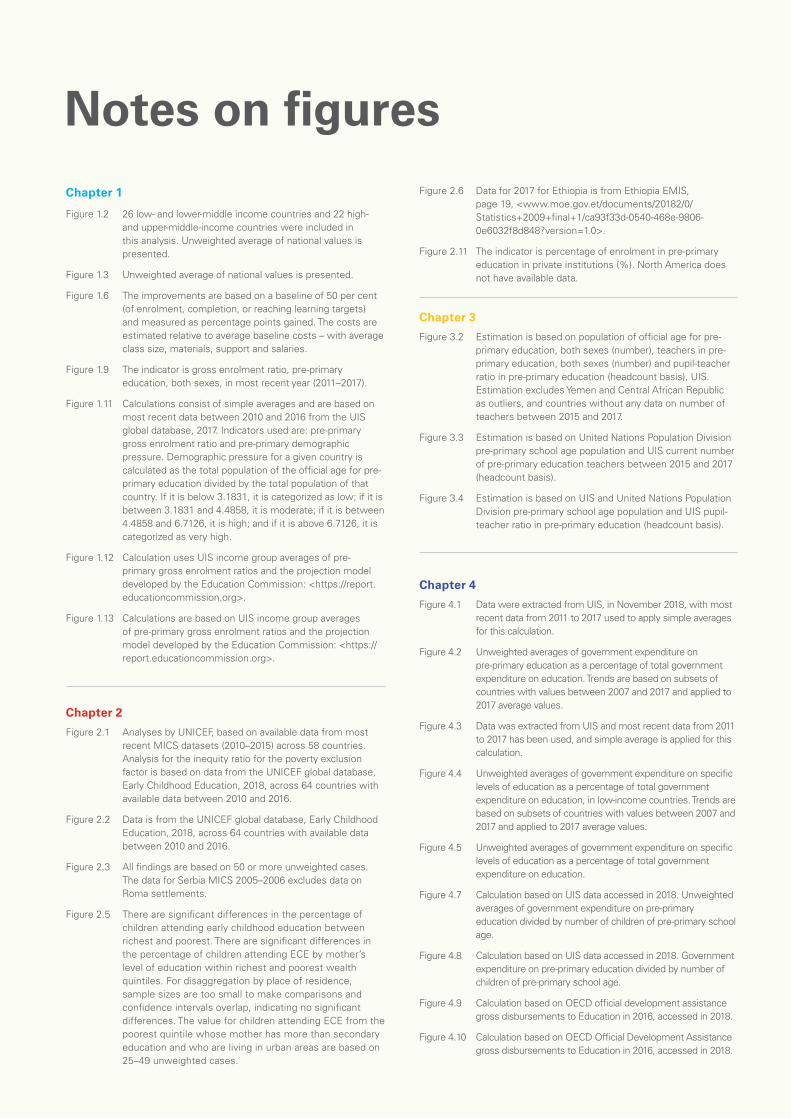
140SectionNotes on figuresChapter 1
Figure 1.2 26 low- and lower-middle income countries and 22 high- and upper-middle-income countries were included in this analysis. Unweighted average of national values is presented.
Figure 1.3 Unweighted average of national values is presented.
Figure 1.6 The improvements are based on a baseline of 50 per cent (of enrolment, completion, or reaching learning targets) and measured as percentage points gained. The costs are estimated relative to average baseline costs – with average class size, materials, support and salaries.
Figure 1.9 The indicator is gross enrolment ratio, pre-primary education, both sexes, in most recent year (2011–2017).
Figure 1.11 Calculations consist of simple averages and are based on most recent data between 2010 and 2016 from the UIS global database, 2017. Indicators used are: pre-primary gross enrolment ratio and pre-primary demographic pressure. Demographic pressure for a given country is calculated as the total population of the official age for pre-primary education divided by the total population of that country. If it is below 3.1831, it is categorized as low; if it is between 3.1831 and 4.4858, it is moderate; if it is between 4.4858 and 6.7126, it is high; and if it is above 6.7126, it is categorized as very high.
Figure 1.12 Calculation uses UIS income group averages of pre-primary gross enrolment ratios and the projection model developed by the Education Commission: <https://report.educationcommission.org>.
Figure 1.13 Calculations are based on UIS income group averages of pre-primary gross enrolment ratios and the projection model developed by the Education Commission: <https://report.educationcommission.org>.
Chapter 2
Figure 2.1 Analyses by UNICEF, based on available data from most recent MICS datasets (2010–2015) across 58 countries. Analysis for the inequity ratio for the poverty exclusion factor is based on data from the UNICEF global database, Early Childhood Education, 2018, across 64 countries with available data between 2010 and 2016.
Figure 2.2 Data is from the UNICEF global database, Early Childhood Education, 2018, across 64 countries with available data between 2010 and 2016.
Figure 2.3 All findings are based on 50 or more unweighted cases. The data for Serbia MICS 2005–2006 excludes data on Roma settlements.
Figure 2.5 There are significant differences in the percentage of children attending early childhood education between richest and poorest. There are significant differences in the percentage of children attending ECE by mother’s level of education within richest and poorest wealth quintiles. For disaggregation by place of residence, sample sizes are too small to make comparisons and confidence intervals overlap, indicating no significant differences. The value for children attending ECE from the poorest quintile whose mother has more than secondary education and who are living in urban areas are based on 25–49 unweighted cases.
Figure 2.6 Data for 2017 for Ethiopia is from Ethiopia EMIS, page 19, <www.moe.gov.et/documents/20182/0/Statistics+2009+final+1/ca93f33d-0540-468e-9806-0e6032f8d848?version=1.0>.
Figure 2.11 The indicator is percentage of enrolment in pre-primary education in private institutions (%). North America does not have available data.
Chapter 3
Figure 3.2 Estimation is based on population of official age for pre-primary education, both sexes (number), teachers in pre-primary education, both sexes (number) and pupil-teacher ratio in pre-primary education (headcount basis), UIS. Estimation excludes Yemen and Central African Republic as outliers, and countries without any data on number of teachers between 2015 and 2017.
Figure 3.3 Estimation is based on United Nations Population Division pre-primary school age population and UIS current number of pre-primary education teachers between 2015 and 2017 (headcount basis).
Figure 3.4 Estimation is based on UIS and United Nations Population Division pre-primary school age population and UIS pupil-teacher ratio in pre-primary education (headcount basis).
Chapter 4
Figure 4.1 Data were extracted from UIS, in November 2018, with most recent data from 2011 to 2017 used to apply simple averages for this calculation.
Figure 4.2 Unweighted averages of government expenditure on pre-primary education as a percentage of total government expenditure on education. Trends are based on subsets of countries with values between 2007 and 2017 and applied to 2017 average values.
Figure 4.3 Data was extracted from UIS and most recent data from 2011 to 2017 has been used, and simple average is applied for this calculation.
Figure 4.4 Unweighted averages of government expenditure on specific levels of education as a percentage of total government expenditure on education, in low-income countries. Trends are based on subsets of countries with values between 2007 and 2017 and applied to 2017 average values.
Figure 4.5 Unweighted averages of government expenditure on specific levels of education as a percentage of total government expenditure on education.
Figure 4.7 Calculation based on UIS data accessed in 2018. Unweighted averages of government expenditure on pre-primary education divided by number of children of pre-primary school age.
Figure 4.8 Calculation based on UIS data accessed in 2018. Government expenditure on pre-primary education divided by number of children of pre-primary school age.
Figure 4.9 Calculation based on OECD official development assistance gross disbursements to Education in 2016, accessed in 2018.
Figure 4.10 Calculation based on OECD Official Development Assistance gross disbursements to Education in 2016, accessed in 2018.
A World Ready To Learn
141Endnotes
9 World Bank, World Development Report 2018: Learning to realize education’s promise, World Bank, Washington, D.C., 2018, <www.worldbank.org/en/publication/wdr2018>, accessed 14 February 2019.
10 United Nations Children’s Fund, Reimagining Life Skills and Citizenship Education in the Middle East and North Africa: A four-dimensional and systems approach to 21st century skills, UNICEF Middle East and North Africa Regional Office, Amman, 2017, <http://education2030-arab-states.org/PDF/d816129f-5d08-40d1-9984-d587631e1b14_report1.pdf>, accessed 14 February 2019.
11 Naudeau, Sophie, et al., Investing in Young Children: An early childhood development guide for policy dialogue and project preparation, World Bank, Washington, D.C., 2010, <http://documents.worldbank.org/curated/en/691411468153855017/pdf/578760REPLACEM053783B09780821385265.pdf>, accessed 20 February 2019.
12 García, Jorge Luis, et al., ‘The Life-Cycle Benefits of an Influential Early Childhood Program’, NBER Working Paper No. 22993, National Bureau of Economic Research, Cambridge, Mass., December 2016, <www.nber.org/papers/w22993.pdf>, accessed 22 February 2019.
13 United Nations Children’s Fund, The Investment Case for Education and Equity, UNICEF, New York, January 2015, <www.unicef.org/publications/files/Investment_Case_for_Education_and_Equity_FINAL.pdf>, accessed 20 February 2019.
14 Walker, Susan P., et al., ‘Inequality in Early Childhood: Risk and protective factors for early child development’, The Lancet, vol. 378, no. 9799, 2011, pp. 1325–1338, <www.thelancet.com/action/showPdf?pii=S0140-6736%2811%2960555-2>, accessed 18 February 2019.
15 Center on the Developing Child at Harvard University, From Best Practices to Breakthrough Impacts: A science-based approach to building a more promising future for young children and families, Cambridge, Mass., May 2016, p. 7, <https://bit.ly/2EZEDIH>, accessed 18 February 2019.
16 Neal, David, et al., The Science of Habit: Creating disruptive and sticky behavior change in handwashing behavior, USAID/WASHplus Project, Washington, D.C., October 2015, p. 14, <https://bit.ly/2V8N6AN>, accessed 18 February 2019.
17 The ECDI measures the developmental status of children aged 36–59 months in four domains and identifies them as on track if they meet the following criteria: Literacy-numeracy: The child can do at least two of the following: identify at least 10 letters of the alphabet; read at least four simple words; and/or know the name and recognize the symbols of all numbers from 1 to 10. Physical: The child can pick up a small object with two fingers, such as a stick or rock from the ground, and/or the mother/primary caregiver does not indicate that the child is sometimes too sick to play. Social-emotional: At least two of the following are true: The child gets along well with other children; the child does not kick, bite or hit other children; and the child does not get distracted easily. Learning: The child follows simple directions on how to do something correctly and/or when given something to do, is able to do it independently. The overall ECDI score reflects the percentage of children who are developmentally on track in at least three of these four domains. For more information, see <https://data.unicef.org/topic/early-childhood-development/early-childhood-education/>.
18 Research includes: Berlinski, Samuel, Sebastian Galiani and Paul J. Gertler, ‘The Effect of Pre-Primary Education on Primary School Performance’, Journal of Public Economics, vol. 93, no. 1–2, February 2009, pp. 219–234, <www.sciencedirect.com/science/article/pii/S0047272708001308>; Pianta, Robert C., et al., ‘The Effects of Preschool Education: What we know, how public policy is or is not aligned with the evidence base, and what we need to
Chapter 1Why focus on universal pre-primary education?
1 Rose, Pauline, and Benjamin Alcott, ‘How Can Education Systems Become Equitable by 2030?’, DFID Think Pieces – Learning and Equity, United Kingdom Department for International Development, London, August 2015, pp.12–14, <http://uis.unesco.org/sites/default/files/documents/how-can-education-systems-become-equitable-by-2030-learning-and-equity_pauline-rose_benjamin-alcott_heart_2015-en.pdf>, accessed 27 February 2019.
2 Computations by UNICEF, based on the United Nations Educational, Scientific and Cultural Organization (UNESCO) Institute for Statistics (UIS) global database, 2018. Estimation based on UIS pre-primary-age population and gross enrolment ratio (GER) of pre-primary education in the most recent year available (2011–2017).
3 International Commission on Financing Global Education Opportunity, The Learning Generation: Investing in education for a changing world, Education Commission, New York, 2016, p. 90, <https://bit.ly/2T1DA4T>, accessed 14 February 2019.
4 World Bank, World Development Report 2018: Learning to realize education’s promise, World Bank, Washington, D.C., 2018, <www.worldbank.org/en/publication/wdr2018>, accessed 14 February 2019.
5 United Nations Educational, Scientific and Cultural Organization, Education for All Global Monitoring Report 2007: Strong foundations – Early childhood care and education, UNESCO, Paris, 2006, <https://unesdoc.unesco.org/ark:/48223/pf0000147794>; United Nations Educational, Scientific and Cultural Organization, Global Education Monitoring Report 2019: Migration, displacement and education – Building bridges, not walls, UNESCO, Paris, 2018, <https://unesdoc.unesco.org/ark:/48223/pf0000265866>, accessed 28 February 2019.
6 United Nations Educational, Scientific and Cultural Organization and UNESCO Institute for Statistics, International Standard Classification of Education (ISCED) 2011, UNESCO and UIS, Paris and Montreal, 2012, <http://uis.unesco.org/sites/default/files/documents/international-standard-classification-of-education-isced-2011-en.pdf>, accessed 28 February 2019.
7 United Nations Children’s Fund, Early Moments Matter for Every Child, UNICEF, New York, 2017. <www.unicef.org/publications/files/UNICEF_Early_Moments_Matter_for_Every_Child.pdf>, accessed 28 February 2019.
8 United Nations Children’s Fund, ‘Early Childhood Education’, UNICEF, New York, December 2017, <https://data.unicef.org/topic/early-childhood-development/early-childhood-education>, accessed 28 February 2019.
Introduction
A World Ready To Learn
141
142
Section
know’, Psychological Science in the Public Interest, vol. 10, no. 2, pp. 49–88, <https://doi.org/10.1177/1529100610381908>; Nores, Milagros, and W. Steven Barnett, ‘Benefits of Early Childhood Interventions Across the World: (Under) Investing in the very young’, Economics of Education Review, vol. 29, no. 2, 2010, pp. 271–282, <www.sciencedirect.com/science/article/abs/pii/S027277570900106X>, accessed 18 February 2019.
19 UNESCO Institute for Statistics, ‘More than One-Half of Children and Adolescents Are Not Learning Worldwide’, UIS Fact Sheet No. 46, UNESCO, Paris, September 2017, <http://uis.unesco.org/sites/default/files/documents/fs46-more-than-half-children-not-learning-en-2017.pdf>, accessed 18 February 2019. As custodian agency of SDG indicator 4.2.1, UNICEF has been given the mandate to undertake the methodological work to develop, test and validate a data collection instrument that can be used to track progress towards achieving target 4.2. To this end, UNICEF has undertaken a systematic review of items used to collect data on early childhood development outcomes, as well as testing and validating a core set of items in Belize, Bulgaria, India, Jamaica, Mexico, Palestine, Uganda and the United States. To oversee the work, UNICEF established the Inter-Agency Expert Group on ECD Measurement (IAEG-ECD), i.e., a global inter-agency advisory and coordination body whose overarching purpose is to oversee the revision, testing and validation of the new measure. The final output is a standardized and validated tool to measure ECD outcomes that can be integrated in national household surveys for use by all countries, high-, middle- and low-income countries alike. The final measurement tool, along with guidance on its implementation, is expected to be ready for data collection in 2019.
20 RTI International and World Bank, ‘Over-Enrollment in the Early Grades’, brief summarizing findings from a longer forthcoming report (Crouch, Luis, Katherine Merseth and Amanda Devercelli, ‘Over-Enrollment in the Early Grades’, World Bank, Washington, D.C., forthcoming).
21 Multivariate regressions are based on MICS data across 48 countries. Regressions control for countries’ income status and national levels of support for learning available at home. Regression analyses demonstrate that, on average, a 10 per cent increase in national early childhood education attendance is associated with a 3.3 per cent increase in the proportion of children who are on track in early literacy and numeracy skills development.
22 Computations by UNICEF, based on MICS and DHS data sets (2010–2015) for 48 countries (26 low- and lower-middle-income countries and 22 high- and upper-middle-income countries); unweighted averages.
23 The logistic regression analysis is based on data from Nepal MICS 2014, controlling for wealth, sex, mother’s education, and level of support for learning available at home.
24 ‘Over-Enrollment in the Early Grades’ (brief).
25 Berlinski, Galiani and Gertler, ‘The Effect of Pre-Primary Education on Primary School Performance’.
26 United Nations Children’s Fund, Philippines Early Childhood Care and Development Longitudinal Study: Longitudinal study of the effects of early childhood care and development on the learning experiences and performance of kindergarten students through Grade 2 in the Philippines – Rounds 1, 2 and 3 (out of 4 rounds), longitudinal report, UNICEF, New York, 2017, p.11.
27 Hungi, Njora, and Moses Ngware, ‘The Effects of Preschool Participation on Mathematics Achievement of Grade 6 Pupils in Uganda’, Educational Research for Policy and Practice, vol. 17, no. 3, 2017, pp 105–126, <https://doi.org/10.1007/s10671-017-9218-y>, accessed 22 February 2019.
28 PASEC 2014 is an international large-scale assessment of student competencies developed by the Conférence des ministres de l’Éducation des États et gouvernements de la Francophonie (CONFEMEN). The sample includes close to 40,000 students overall, surveyed in more than 1,800 schools in 10 countries (Benin, Burkina Faso, Burundi, Cameroon, Chad, the Congo, Côte d’Ivoire, the Niger, Senegal and Togo).
29 The analysis uses linear regression and includes 55 countries across six regions for reading proficiency, and 58 countries across five regions for mathematics proficiency. Gross domestic product (GDP) per capita is set at the world average of $10,880, based on <http://statisticstimes.com/economy/world-gdp-capita-ranking.php>. Morocco was excluded from the analysis of reading proficiency. Data for pre-primary GER are from the UIS database, 2017, and income grouping is from the World Bank, 2017. Data for reading and mathematics proficiency are from the World Inequality Database on Education (WIDE), 2017, <www.education-inequalities.org>. Reading proficiency, data are from LLECE 2013, PIRLS 2011 assessment, and mathematics proficiency data are from TIMSS 2011 and LLECE 2013 assessment. Data years are: 2006 (for GER – with interpolation), 2011 (for mathematics Grade 4) or 2013 (for mathematics Grade 6).
30 Learning Generation: Investing in education for a changing world.
31 World Bank, Toward an Equal Start: Closing the early learning gap for Roma children in Eastern Europe, World Bank, Washington, D.C., 2012, <https://bit.ly/2GARsgE>, accessed 19 February 2019.
32 Berlinski, Samuel, Sebastian Galiani and Marco Manacorda, ‘Giving Children a Better Start: Preschool attendance and school-age profiles’, Journal of Public Economics, vol. 92, no. 5–6, June 2008, pp.1416–1440, <https://bit.ly/2SdhsQO>, accessed 19 February 2019.
33 ‘Over-Enrollment in the Early Grades’ (brief).
34 Linear regressions were used to analyse the relationship between pre-primary enrolment rate and primary completion/dropout, controlling for country income level and pupil-teacher ratio (PTR) at primary level. UNICEF’s analysis is based on GER of pre-primary education, gross intake ratio to the last grade of primary education (as a proxy indicator for primary completion) and PTR in primary education from the UIS global database 2017, and country income groupings from the World Bank in 2017. Data years are: most recent data between 2010 and 2016 (for primary completion and primary PTR – without interpolation), 2008 (for pre-primary GER – with interpolation). Angola and Liberia are excluded from the analysis.
35 ‘Over-Enrollment in the Early Grades’ (brief).
36 Brunette, Tracy, et al., ‘Repetition of Primary 1 and Pre-Primary Education in Uganda’, International Development Working Paper No. 2017-02, RTI International, Research Triangle Park, North Carolina, June 2017, <https://bit.ly/2GAVMMU>, accessed 19 February 2019.
37 Linear regressions were used to analyse the relationship between pre-primary enrolment rate and primary completion/dropout, controlling for country income level and PTR at primary level. UNICEF’s analysis is based on GER of pre-primary education, gross intake ratio to the last grade of primary education (as a proxy indicator for primary completion) and PTR in primary education from the UIS global database 2017, and country income groupings from the World Bank in 2017. Linear regressions were used to analyse the relationship between pre-primary enrolment ratio and primary completion/dropout.
38 ‘Over-Enrollment in the Early Grades’ (brief).
142
Endnotes
A World Ready To Learn
143
39 Learning Generation: Investing in education for a changing world.
40 Engle, Patrice L., et al., ‘Strategies for Reducing Inequalities and Improving Developmental Outcomes for Young Children in Low-Income and Middle-Income Countries’, The Lancet, vol. 378, no. 9799, October 2011, pp.1339−1353, <www.sciencedirect.com/science/article/pii/S0140673611608891>, accessed 19 February 2019.
41 Barnett, W. Steven, and Leonard N. Masse, ‘Comparative Benefit-Cost Analysis of the Abecedarian Program and Its Policy Implications’, Economics of Education Review, vol. 26, no.1, February 2007, pp.113−125, <www.sciencedirect.com/science/article/abs/pii/S0272775706000239>, accessed 19 February 2019; Learning Generation: Investing in education for a changing world.
42 García, et al., ‘Life-Cycle Benefits of an Influential Early Childhood Program’.
43 Woldehanna, Tessew, and Mesele W. Araya, ‘Early Investment in Preschool and Completion of Secondary Education in Ethiopia: Lessons from young lives’, Working Paper No. 168, Young Lives, Oxford, 2017, <https://bit.ly/2DYE56b>, accessed 19 February 2019.
44 Shafiq, M. Najeeb, Amanda Devercelli and Alexandria Valerio, ‘Are There Long-Term Benefits from Early Childhood Education in Low- and Middle-Income Countries?’ Education Policy Analysis Archives, vol. 26, no. 122, 2018, <http://dx.doi.org/10.14507/epaa.26.3239>, accessed 19 February 2019.
45 Alcott, Benjamin, and Pauline Rose, ‘Learning in India’s Primary Schools: How do disparities widen across the grades?’, International Journal of Educational Development, vol. 56, 2017, pp. 42–51, <www.sciencedirect.com/science/article/pii/S0738059316303807>, accessed 21 February 2019.
46 Currie, Janet, ‘Early Childhood Education Programs’, Journal of Economic Perspectives, vol. 15, no. 2, 2001, pp. 213−238, <https://pubs.aeaweb.org/doi/pdfplus/10.1257/jep.15.2.213>; <https://bit.ly/2GRXR6L>, accessed 19 February 2019.
47 Jung, Haeil, and Amer Hasan, ‘The Impact of Early Childhood Education on Early Achievement Gaps: Evidence from the Indonesia early childhood education and development (ECED) project’, Policy Research Working Paper No. 6794, World Bank, Washington, D.C., 2014, <https://bit.ly/2SJMTau>, accessed 19 February 2019.
48 Schütz, Gabriela, Heinrich W. Ursprung and Ludger Wössmann, ‘Education Policy and Equality of Opportunity’, Kyklos, vol. 61, no. 2, May 2008, pp. 279−308, <www.econstor.eu/bitstream/10419/33448/1/510229980.pdf>, accessed 25 February 2019; Engle, Patrice L., et al., ‘Strategies for reducing inequalities and improving developmental outcomes for young children in low-income and middle-income countries’, The Lancet, vol. 378, no. 9799, October 2011, pp. 1339–1353, <https://doi.org/10.1016/S0140-6736(11)60889-1>, accessed 27 February 2019.
49 Dowd, Amy J., et al., ‘Realizing Capabilities in Ethiopia: Maximizing early childhood investment for impact and equity’, Journal of Human Development and Capabilities, vol. 17, no. 4, 2016, pp. 477−493, <www.tandfonline.com/doi/full/10.1080/19452829.2016.1225702>, accessed 20 February 2019.
50 World Bank, World Development Report 2018.
51 United Nations Children’s Fund, Reimagining Life Skills and Citizenship Education in Middle-East and North Africa.
52 Shafiq, Devercelli, and Valerio, ‘Are There Long-Term Benefits from Early Childhood Education in Low- and Middle-Income Countries?’.
53 García, et al., ‘Life-Cycle Benefits of an Influential Early Childhood Program’.
54 Campbell, Frances A., et al, ‘Early Childhood Education: Young adult outcomes from the Abecedarian Project’, Applied Developmental Science, vol. 6, no. 1, 2002, pp. 422–57, <www.researchgate.net/publication/240519150_Early_Childhood_Education_Young_Adult_Outcomes_From_the_Abecedarian_Project>, accessed 23 February 2019.
55 Heckman, James J., et al., ‘The Rate of Return to the HighScope Perry Preschool Program’, Journal of Public Economics, vol. 94, no. 1–2, 2010, pp. 114–128, <www.sciencedirect.com/science/article/abs/pii/S0047272709001418>, accessed 23 February 2019.
56 See, for example: Black, Maureen M., et al., ‘Early Childhood Development Coming of Age: Science through the life course’, The Lancet, vol. 389, no. 10064, January 2017, pp.77–90, <www.sciencedirect.com/science/article/pii/S0140673616313897>, accessed 23 February 2019; Lancet Series ‘Early Child Development in Developing Countries 2011’, <www.thelancet.com/series/child-development-in-developing-countries-2>, accessed 25 February 2019.
57 Halim, Daniel, Hillary Johnson and Elizaveta Perova, Preschool Availability and Female Labor Force Participation: Evidence from Indonesia, East Asia Pacific Gender Innovation Lab, World Bank, Washington, D.C., October 2017, <http://documents.worldbank.org/curated/en/104221518802443897/pdf/123476-WP-PUBLIC-PreschoolavailabilityandfemaleLFPOctoberUpload.pdf>, accessed 22 February 2019.
58 Berlinski, Samuel, Sebastian Galiani and Patrick J. McEwan, ‘Preschool and Maternal Labour Market Outcomes: Evidence from a regression discontinuity design’, IFS Working Paper No. W09/05, Institute for Fiscal Studies, London, November 2008, <https://opendocs.ids.ac.uk/opendocs/bitstream/handle/123456789/11901/Pre-school_maternal.pdf?sequence=1&isAllowed=y>, accessed 25 February 2019.
59 Wallet, Peter, ‘Pre-Primary Teachers: A global analysis of several key education indicators’, background paper prepared for the Education for All Global Monitoring Report 2007, Strong Foundations: Early childhood care and education, UNESCO, Paris, 2006.
60 In most countries, preschool-age children are 3–5 years of age. This age varies by country, however, and some countries define preschool as one-year or two-year programmes, making universal comparisons difficult.
61 Computations by UNICEF, based on the UIS global database, 2018. The estimation is based on UIS pre-primary-age population and GER of pre-primary education, both sexes, in the most recent year available (2011–2017).
62 UIS global database, 2018. The indicator is GER of pre-primary education, both sexes.
63 Computations by UNICEF, based on data from the UIS global database, 2018. The indicator is GER of pre-primary education, both sexes, in the most recent year (2010–2017).
64 Ibid.
65 For every 1 per cent decrease in demographic pressure, there is, on average, a 7 per cent increase in pre-primary enrolment, controlling for GDP per capita.
66 Murphy, Katie M., Hirokazu Yoshikawa and Alice J. Wuermli, ‘Implementation Research for Early Childhood Development
A World Ready To Learn
143
Programming in Humanitarian Contexts’, Annals of the New York Academy of Sciences, vol. 1419, no. 1, May 2018, pp. 90–101, <doi: 10.1111/nyas.13691>; <https://nyaspubs.onlinelibrary.wiley.com/doi/10.1111/nyas.13691>, accessed 20 February 2019.
67 Center on the Developing Child at Harvard University, ‘Toxic Stress’, Harvard University, Cambridge, Mass., 2019, <https://developingchild.harvard.edu/science/key-concepts/toxic-stress/>, accessed 20 February 2019.
68 United Nations Children’s Fund, ‘1 in 3 Syrian Children Has Grown Up Knowing Only Crisis As Conflict Reaches 5 Year Point – UNICEF’, Press Release, UNICEF, Amman, 14 March 2016, <www.unicef.org/media/media_90453.html>, accessed 20 February 2019.
69 Computations by UNICEF, based on data from the UIS global database, 2018; emergency countries were identified based on UNICEF Humanitarian Action for Children (HAC) groupings in 2018. The estimation is based on UIS pre-primary-age population and pre-primary education GER in the most recent year (2011–2017). For countries that do not have available administrative data (Afghanistan, the Democratic People’s Republic of Korea, Haiti and Nigeria), adjusted net attendance rate one year before primary
entry age is used. Libya and Somalia do not have available data.
70 Huebner, G., et al., ‘Beyond Survival: The case for investing in young children globally’, Discussion Paper, National Academy of Medicine, Washington, D.C., June 2016, <https://bit.ly/2T1hP5t>, accessed 20 February 2019.
71 Yale University and AÇEV Partnership, The Ecology of Peace: Formative childhoods and peace building, Yale-AÇEV Partnership, New Haven, Conn., and Istanbul, August 2012, <https://medicine.yale.edu/childstudy/fcpb/research/publications/briefnote_online_FINAL_171407_28959_v2.pdf>, accessed 20 February 2019.
72 Lacroix, L., et al., ‘Immigrant and Refugee Preschoolers’ Sandplay Representations of the Tsunami’, The Arts in Psychotherapy, vol. 34, no. 2, 2007, pp. 99–113, <www.sciencedirect.com/science/article/abs/pii/S0197455606000918>, accessed 20 February 2019.
1 United Nations Children’s Fund and United Nations Educational, Scientific and Cultural Organization Institute for Statistics, Education Equity Now! A regional analysis of the situation of out-of-school children in Central and Eastern Europe and the Commonwealth of Independent States, UNICEF, Geneva, January 2014, <www.unicef.org/eca/media/971/file>, accessed 19 February 2019.
2 Computations based on data from the most recent MICS data sets (2010–2015) across 64 countries with available data.
3 Computations based on data from the most recent MICS data sets (2010–2015) across 35 countries with available data.
4 Computations based on data from the most recent MICS data sets (2010–2015) across 60 countries with available data.
5 Computations by UNICEF, based on data from Thailand MICS 2015–2016 (p. 117).
6 Theirworld, Safe Spaces: The urgent need for early childhood development in emergencies and disasters, Theirworld, London, September 2016, <https://s3.amazonaws.com/theirworld-site-resources/Reports/Safespaces_report.pdf>, accessed 19 February 2019; Anera, ‘Early Childhood Education Gets Help in Lebanon Refugee Camp’, Anera, Washington, D.C., <www.anera.org/stories/early-childhood-education-gets-help-lebanon-refugee-camp>, accessed 18 February 2019.
7 United Nations Educational, Scientific and Cultural Organization, ‘Inclusion of Children with Disabilities: The early childhood imperative’, Policy Brief on Early Childhood No. 46, April–June 2009, UNESCO, Paris, 2009, <https://unesdoc.unesco.org/ark:/48223/pf0000183156>, accessed 19 February 2019; World Health Organization and United Nations Children’s Fund, ‘Early Childhood Development and Disability: A discussion paper’, WHO and UNICEF, Geneva, 2012, <https://apps.who.
int/iris/bitstream/handle/10665/75355/9789241504065_eng.pdf?sequence=1&isAllowed=y>, accessed 19 February 2019.
8 Mizunoya, Suguru, Sophie Mitra and Izumi Yamasaki, ‘Towards Inclusive Education: The impact of disability on school attendance in developing countries’, Innocenti Working Paper No. 2016-03, UNICEF Office of Research, Florence, 20 May 2016, <www.unicef-irc.org/publications/pdf/IWP3%20-%20Towards%20Inclusive%20Education.pdf>. The analysis is based on surveys conducted across 15 countries.
9 Theirworld, ‘Left Behind from the Start: How governments and donors are failing children with disabilities in their early years’, Policy Brief, Theirworld, London, 2016, <https://theirworld.org/resources/detail/left-behind-from-the-start-how-governments-and-donors-are-failing-children-with-disabilities-in-their-early-years>, accessed 18 February 2019.
10 United Nations Educational, Scientific and Cultural Organization, ‘Inclusion of Children with Disabilities’.
11 Theirworld, ‘Left Behind from the Start’.
12 Brambring, Michael, Hellgard Rauh and Andreas Beelmann (eds), Early Childhood Intervention: Theory, evaluation, and practice, Walter de Gruyter, Berlin, 1996; Vagas-Barón, Emily, and Ulf Janson with Natalia Mufel, Early Childhood Intervention, Special Education and Inclusion: Focus on Belarus, UNICEF, Geneva, 2009, <https://www.unicef.by/uploads/models/2017/02/belarus.eci.english.pdf>; ‘Early Childhood Development and Disability: A discussion paper’.
13 Lao Statistics Bureau, Lao Social Indicator Survey II 2017, Survey Findings Report, Lao Statistics Bureau and United Nations Children’s Fund, Vientiane, June 2018, p. 256, <www.lsb.gov.la/wp-content/uploads/2017/05/Lao-Social-Inndicator-Survey-Lsis-II-2017.pdf>, accessed 18 February 2019.
14 Note: There are significant differences in the percentage of children attending early childhood education between richest and poorest populations, including by the mother’s level of education
Chapter 2Challenges to equity, pathways to overcome them
144
Endnotes
A World Ready To Learn
145
within richest and poorest wealth quintiles. For disaggregation by place of residence, sample sizes are too small to make comparisons, and confidence intervals overlap, indicating no significant differences.
15 Federal Ministry of Education, Education for All 2015 National Review Report: Nigeria, Government of Nigeria, Abuja, 2014, <https://unesdoc.unesco.org/ark:/48223/pf0000231081>, accessed 18 February 2019.
16 Computations by UNICEF, based on data from Nigeria MICS 2016–2017.
17 International Commission on Financing Global Education Opportunity, The Learning Generation: Investing in education for a changing world, Education Commission, New York, 2016, <https://bit.ly/2T1DA4T>, accessed 19 February 2019.
18 United Nations, ‘Sustainable Development Goals Knowledge Platform’, <https://sustainabledevelopment.un.org/sdgs>, accessed 21 February 2019.
19 Zubairi, Asma, and Pauline Rose, Bright and Early: How financing pre-primary education gives every child a fair start in life – Moving towards quality early childhood development for all, TheirWorld, London, 2017, <www.ungei.org/resources/files/Theirworld-Report-Bright-and-Early-June-2017_2.pdf>, accessed 27 February 2019.
20 Analysis by UNICEF, using linear regression, controlling for demographic pressure and GDP per capita.
21 Analysis by UNICEF, using linear regression, controlling for pre-primary education expenditure out of education budget, country wealth and pre-primary demographic pressure.
22 The case study on Ethiopia in this report was developed based on Rossiter, Jack, et al., Early Learning in Ethiopia: Equitable access and learning – System diagnostic report for World Bank Early Learning Program, University of Cambridge, Cambridge, June 2018, <www.educ.cam.ac.uk/centres/real/downloads/ELP%20System%20Diagnostic%20Final_Nov%202018_updated.pdf> and Woodhead, Martin, et al., ‘Scaling-up Early Learning in Ethiopia: Exploring the potential of O-class’, Working Paper No. 163, Young Lives, Oxford, January 2017, <www.younglives.org.uk/content/scaling-early-learning-ethiopia-exploring-potential-o-class>, accessed 21 February 2019.
23 Ministry of Education, Science and Technology, Flash Reports 2003, 2004–2015, 2016, Government of Nepal, Kathmandu.
24 Government of Nepal, Ministry of Education, Education for All National Review Report 2001–2015, UNESCO, Kathmandu, 2015, p. 7, <https://unesdoc.unesco.org/ark:/48223/pf0000232769>, accessed 18 February 2019.
25 United Nations Development Programme, Participatory Constitution Making in Nepal: Issues of process and substance, UNDP, Kathmandu, 2014, <www.np.undp.org/content/dam/nepal/docs/projects/UNDP_NP_SPCBN_participatory-constituton-making-vol-1.pdf>, accessed 18 February 2019.
26 Ministry of Education, School Sector Reform Plan 2009–2015, Government of Nepal, Kathmandu, August 2009, <www.moe.gov.np/assets/uploads/files/SSRP_English.pdf>, accessed 18 February 2019; Ministry of Education, School Sector Development Plan 2016–2023, Government of Nepal, Kathmandu, October 2016, <http://doe.gov.np/assets/uploads/files/87b3287f8f46c497
c2cb97d7d4504f5a.pdf> accessed 18 February 2019>.
27 World Bank, ‘Pre-primary Education in Mongolia: Access, quality of service delivery and child development outcomes’, Working Paper,
World Bank, Washington, D.C., March 2017, <http://documents.worldbank.org/curated/en/481101490364915103/pdf/113752-WP-PUBLIC-P152905-QualityJanWithExecMarchclean.pdf>, accessed 18 February 2019.
28 UIS global database, 2019. The indicator is expenditure on pre-primary education as a percentage of government expenditure on education.
29 Center for Education Innovations, ‘Accelerated School Readiness’, 2015, <https://educationinnovations.org/program/accelerated-school-readiness>.
30 National Statistical Office of Thailand, Thailand Multiple Indicator Cluster Survey December 2005 – February 2006, National Statistical Office of Thailand, Bangkok, 2006, Table 38, <https://mics-surveys-prod.s3.amazonaws.com/MICS3/East%20Asia%20and%20the%20Pacific/Thailand/2005-2006/Final/Thailand%202005-06%20MICS_English.pdf>; National Statistical Office of Thailand, Thailand Multiple Indicator Cluster Survey 2012, National Statistical Office of Thailand, Bangkok, 2012, p. 84, <https://mics-surveys-prod.s3.amazonaws.com/MICS4/East%20Asia%20and%20the%20Pacific/Thailand/2012-2013/Final/Thailand%202012%20MICS_English.pdf>, accessed 18 February 2019.
31 World Health Organization, School Deworming at a Glance, WHO, Geneva, 2003, <www.who.int/intestinal_worms/resources/en/at_a_glance.pdf?ua=1>, accessed 18 February 2019.
32 Computations by UNICEF, based on data from the UIS global database, 2019. The indicator is percentage of enrolment in pre-primary education in private institutions.
33 United Nations Educational, Scientific and Cultural Organization, Bangladesh Pre-Primary Education and the School Learning Improvement Plan: Promising EFA practices in the Asia-Pacific region, UNESCO, Bangkok, 2015, <https://unesdoc.unesco.org/ark:/48223/pf0000233004>, accessed 18 February 2019.
34 Ministry of Primary and Mass Education, Operational Framework for Pre-Primary Education, Government of the People’s Republic of Bangladesh, Dhaka, March 2008, <http://ecd-bangladesh.net/document/documents/Operational_Framework_for_PPE.pdf>, accessed 18 February 2019.
35 United Nations Educational, Scientific and Cultural Organization, Promising Practices in the Asia-Pacific Region: Bangladesh pre-primary and the school learning improvement plan – Case study, abridged version, UNESCO, Paris, 2015, <https://unesdoc.unesco.org/ark:/48223/pf0000233988>, accessed 18 February 2019.
36 UIS global database, 2019, GER, pre-primary, both sexes (percentage).
37 Zahar, Zannatum, Shishuder Jonno and Khosneara Khondker, From Small to Scale: The expansion of pre-primary in Bangladesh, Bernhard van Leer Foundation, The Hague, 2017, <https://bernardvanleer.org/ecm-article/2017/small-scale-expansion-pre-primary-bangladesh/>, accessed 18 February 2019.
38 Ministry of Education, National Education Policy 2010, Government of Bangladesh, Dhaka, 2010, <https://moedu.gov.bd/site/page/318a22d2-b400-48a7-8222-303ab11cc205/->, accessed 26 February 2019.
39 The country’s 2013 comprehensive policy on early childhood care and development aimed to establish a strong foundation for the development of all Bangladeshi children, irrespective of ethnicity, geographical location, gender, religion, special needs and socio-economic conditions.
40 UIS global database, 2019, GER, pre-primary, both sexes (percentage).
A World Ready To Learn
145
1 Organisation for Economic Co-operation and Development, Engaging Young Children: Lessons from research about quality in early childhood education and care, Starting Strong, OECD Publishing, Paris, 2018, <https://doi.org/10.1787/9789264085145-en>, accessed 20 February 2019.
2 Woodhead, Martin, et al., ‘Equity and quality? Challenges for early childhood and primary education in Ethiopia, India and Peru’, Working Papers in Early Childhood Development No. 55, Bernard van Leer Foundation, The Hague, 2009, <www.younglives.org.uk/sites/www.younglives.org.uk/files/BvLF-ECD-WP55-Woodhead-Equity%26Quality.pdf>, accessed 20 February.
3 In this chapter, where reference is made to the Systems Approach for Better Education Results (SABER) data, the analyses are based on information from SABER – Early Childhood Development (ECD) ratings and data, <http://saber.worldbank.org/index.cfm?indx=8&pd=6&sub=1>, accessed 20 February 2019.
4 Organisation for Economic Co-operation and Development, Starting Strong IV: Monitoring quality in early childhood education and care, Starting Strong, OECD Publishing, Paris, 2015, <https://doi.org/10.1787/9789264233515-en>, accessed 20 February 2019.
5 United Nations Children’s Fund, ‘Conceptual Framework for the Pre-Primary Subsector’, UNICEF, New York, forthcoming.
6 Burchinal, Margaret, ‘Measuring Early Care and Education Quality’, Child Development Perspectives, vol. 12, no. 1, 2018, pp. 3–9, <https://www.researchgate.net/publication/320305656_Measuring_Early_Care_and_Education_Quality>, accessed 20 February 2019.
7 Burger, Kaspar, ‘How Does Early Childhood Care and Education Affect Cognitive Development? An international review of the effects of early interventions for children from different social backgrounds’, Early Childhood Research Quarterly, vol. 25, no. 2, 2010, pp. 140–165, <https://www.researchgate.net/publication/222546839_How_Does_Early_Childhood_Care_and_Education_Affect_Cognitive_Development_An_International_Review_of_the_Effects_of_Early_Interventions_for_Children_from_Different_Social_Backgrounds>, accessed 20 February 2019; Rao, Nirmala, et al, ‘Effectiveness of Early Childhood Interventions in Promoting Cognitive Development in Developing Countries: A systematic review and meta-analysis’, Hong Kong Journal of Paediatrics, vol. 22, 2017, p. 14, <http://www.hkjpaed.org/pdf/2017;22;14-25.pdf>, accessed 20 February 2019.
8 Currie, Janet, ‘Early Childhood Education Programs’, Journal of Economic Perspectives, vol. 15, no. 2, 2001, pp. 213–238,
<https://pubs.aeaweb.org/doi/pdfplus/10.1257/jep.15.2.213>, accessed 20 February 2019.
9 Wong, Ho Lun, et al., 2013, ‘The Impact of Vouchers on Preschool Attendance and Elementary School Readiness: A randomized controlled trial in rural China’, Economics of Education Review, vol. 35, 2013, pp. 53–65, <https://www.researchgate.net/publication/257106415_The_impact_of_vouchers_on_preschool_attendance_and_elementary_school_readiness_A_randomized_controlled_trial_in_rural_China>, accessed 20 February 2019.
10 Helburn, Suzanne W., Cost, Quality and Child Outcomes in Child Care Centers – Technical report, public report, and executive summary, Department of Economics, Colorado University, Denver, Colorado, 1995, <https://eric.ed.gov/?id=ED386297>, accessed 20 February 2019; Streuli, Natalia, ‘Early Childhood Care and Education in Peru: Evidence from young lives’, Policy Brief No. 18, Young Lives, Oxford, 2012, <https://www.younglives.org.uk/sites/www.younglives.org.uk/files/YL-PolicyBrief-18.pdf>, accessed 20 February 2019.
11 Van der Berg, Servaas, et al., The Impact of the Introduction of Grade R on Learning Outcomes: Final full report for the Department of Basic Education and the Department of Performance Monitoring and Evaluation in the Presidency, University of Stellenbosch, Stellenbosch, South Africa, 2013, <https://www.education.gov.za/Portals/0/Documents/Publications/Impact%20of%20introduction%20of%20Grade%20R%20on%20subsequent%20learning%20outcomes.pdf?ver=2015-04-07-114045-213>, accessed 20 February 2019.
12 Government of Nepal and United Nations Children’s Fund, Monitoring the Situation of Children and Women: Nepal Multiple Indicator Cluster Survey 2014, Government of Nepal and UNICEF, Kathmandu, 2014, <https://mics-surveys-prod.s3.amazonaws.com/MICS5/South%20Asia/Nepal/2014/Final/Nepal%202014%20MICS_English.pdf>, accessed 20 February 2019.
13 Anderson, Kate, and Rebecca Sayre, Measuring Early Learning and Quality Outcomes in Tanzania: Institutional assessment for integrating early childhood measurement in the pre-primary system, Brookings Institution, Washington, D.C., October 2016, <https://www.brookings.edu/wp-content/uploads/2017/06/melqo-measuring-early-learning-quality-outcomes-in-tanzania_2016oct.pdf>, accessed 20 February 2019.
14 Grade R is the year before learners in South Africa start formal schooling.
15 Biersteker, Linda, ‘Scaling-up Early Child Development in South Africa: Introducing a Reception Year (Grade R) for children aged five years as the first year of schooling’, Wolfensohn Center for Development Working Paper No. 17, Brookings Institution, Washington, D.C., 2010, <https://www.brookings.edu/wp-content/uploads/2016/06/04_child_development_south_africa_biersteker.pdf>, accessed 20 February 2019; Department of Basic Education, Action Plan to 2019: Towards the realization of Schooling 2030,
Chapter 3Building pre-primary systems to deliver quality at scale
41 Ministry of Women and Child Affairs, National Census of Early Childhood Development Centers 2016, Government of Sri Lanka, Colombo, 2018.
42 UIS global database, 2019, enrolment in pre-primary education in private institutions (percentage).
43 Organisation for Economic Co-operation and Development and Asian Development Bank, Education in Indonesia: Rising to the challenge, OECD Publishing, Paris, 2015, p.29, <http://dx.doi.org/10.1787/9789264230750-en>, accessed 26 February 2019.
146
Endnotes
A World Ready To Learn
147
Department of Basic Education, Pretoria, 2015, <https://www.education.gov.za/Portals/0/Documents/Publications/Action%20Plan%202019.pdf?ver=2015-11-11-162424-417>, accessed 20 February 2019.
16 Computations by UNICEF, based on data from the UIS global database, 2018. The indicators are population of official age for pre-primary education, both sexes (number), and teachers in pre-primary education, both sexes (number).
17 UIS global database, 2019. The indicator is PTR in pre-primary education (headcount basis).
18 Engaging Young Children: Lessons from research about quality in early childhood education and care.
19 This estimate is aligned with the current PTR of lower-middle-income countries as well as with the assumptions made in the costing model presented in United Nations Educational, Scientific and Cultural Organization, ‘Pricing the Right to Education: The cost of reaching new targets by 2030’, Policy Paper No. 18, July 2015 update, UNESCO, Paris, 2015, <https://unesdoc.unesco.org/ark:/48223/pf0000232197>, accessed 1 March 2019.
20 World Bank, SABER ECD database, accessed January 2019.
21 Ibid., accessed July 2015.
22 UIS global database, 2019.
23 Engaging Young Children: Lessons from research about quality in early childhood education and care.
24 Ibid.
25 Pisani, Lauren, et al., ‘Bhutan’s National ECCD Impact Evaluation: Local, national, and global perspectives’, Early Child Development and Care, vol.187, no. 10, 2017, pp. 1511–1527, <https://www.
tandfonline.com/doi/full/10.1080/03004430.2017.1302944? scroll=top&needAccess=true>, accessed 19 February 2019.
26 UIS global database, 2017. The indicator is percentage of teachers in pre-primary education who are trained (both sexes).
27 Neuman, Michelle J., Kimberly Josephson and Peck Gee Chua, ‘A Review of the Literature: Early childhood care and education (ECCE) personnel in low-and middle-income countries’, Early Childhood Care and Education Working Papers Series No. 4, UNESCO, Paris, 2015, <https://unesdoc.unesco.org/ark:/48223/pf0000234988 >, accessed 4 March 2019.
28 UIS global database, 2019. The indicators are percentage of teachers in pre-primary education who are trained (both sexes) and percentage of teachers in primary education who are trained (both sexes).
29 Wils, Annababette, ‘Reaching Education Targets in Low and Lower-Middle Income Countries: Costs and finance gaps to 2030 for pre-primary, primary, lower- and upper secondary schooling’, Background Paper for the 2015 EFA Global Monitoring Report, UNESCO, Paris, 2015, <https://en.unesco.org/gem-report/sites/gem-report/files/background%20paper%20-%20costing%20education.pdf>, accessed 4 March 2019.
30 Engaging Young Children: Lessons from research about quality in early childhood education and care.
31 Namit, Kabira, ‘Lessons from Ghana: A cost-effective way to train teachers’, World Bank Education for Global Development blog, 15 March 2017, <http://blogs.worldbank.org/education/lessons-ghana-cost-effective-way-train-teachers>, accessed 20 February 2019.
32 UIS global database, 2019, ratio of pupils to qualified teachers in pre-primary education (headcount basis).
33 UIS global database, 2019, PTR in pre-primary education (headcount basis).
34 Ministry of Education, Science and Technology, Global Partnership for Education Programme Implementation Grant, Evaluation Report, Ministry of Education, Science and Technology, Dar es Salaam, 2018.
35 This case study draws on the World Bank’s Education for Global Development blog ‘Lessons from Ghana: A cost-effective way to train teachers’, <http://blogs.worldbank.org/education/es/comment/3329>, and the 2016 Impact Assessment of the Untrained Teacher Diploma in Basic Education (UTDBE) in Ghana, <https://docsend.com/view/dzwwrxy>. Based on EMIS–Ministry of Education statistics from the start of the pilot programme in 2012–2013 and the data in 2015–2016, the percentage of trained teachers across the districts increased from 53 per cent at baseline to 66 per cent at endline. These numbers reflect teacher training patterns beyond the specific subset of teachers who were targeted in the pilot.
36 ‘Conceptual Framework for the Pre-Primary Subsector’, forthcoming; United Nations Children’s Fund, ‘Background Paper on Quality Standards and Quality Assurance Systems for Pre-Primary Education’, UNICEF, New York, 2018.
37 Ibid.
38 Starting Strong IV: Monitoring quality in early childhood education and care.
39 World Bank, ‘Implementation Completion and Results Report IDA-52070 for the Vietnam School Readiness Promotion Project’, Report No. ICR00004231, World Bank, Washington, D.C., 26 December 2017, p. 13, <http://documents.worldbank.org/curated/en/360901514912748005/pdf/ICR00004231-12282017.pdf>, accessed 20 February 2019.
40 United Nations Children’s Fund, ‘Formative Assessment of UNICEF’s Support to the Ghana Education Services Kindergarten Programme’, UNICEF Ghana, Accra, 2016.
41 United Nations Educational, Scientific and Cultural Organization, ‘Pricing the Right to Education: The cost of reaching new targets by 2030’, Policy Paper No. 18, July 2015 update, UNESCO, Paris, 2015, <https://unesdoc.unesco.org/ark:/48223/pf0000232197>, accessed 20 February 2019.
42 Wechsler, Marjorie, et al., ‘The Building Blocks of High-Quality Early Childhood Education Programs’, Learning Policy Institute, Palo Alto, Calif., 2016, <https://learningpolicyinstitute.org/sites/default/files/product-files/LPI_ECE-quality-brief_WEB-022916.pdf>, <https://eric.ed.gov/?id=ED555247>, accessed 20 February 2019.
43 Copple, Carole, and Sue Bredekamp (eds), ‘Developmentally Appropriate Practice in Early Childhood Programs Serving Children from Birth through Age 8’, National Association for the Education of Young Children. Washington, D.C., 2009, <https://www.naeyc.org/sites/default/files/globally-shared/downloads/PDFs/resources/position-statements/PSDAP.pdf>, accessed 20 February 2019.
44 Skouteris, Helen, Brittany Watson and Jarrad Lum, ‘Preschool Children’s Transitions to Formal Schooling: The importance of collaboration between teachers, parents and children’, Australasian Journal of Early Childhood, vol. 37, no. 4, 2012, pp. 78–88, <http://mnprek-3.wdfiles.com/local--files/research-studies/Transition%20to%20formal%20schooling%20-%20collaboration.pdf>, accessed 20 February 2019.
A World Ready To Learn
147
148
Section
45 Briggs, Mary, and Alice Hansen, Play-based learning in the primary school. SAGE Publications, London, 2012, <https://uk.sagepub.com/en-gb/eur/play-based-learning-in-the-primary-school/book235838#contents>, accessed 20 February 2019.
46 ‘Conceptual Framework for the Pre-Primary Subsector’, forthcoming.
47 Kagan, Sharon Lynn, Pia Rebello Britto and Patrice Engle, ‘Early Learning Standards: What can America learn? What can America teach?’, Phi Delta Kappan, vol. 87, no. 3, November 2005, pp. 205–208. doi: 10.1177/003172170508700309.
48 Özler, Berk, et al., ‘Combining Pre-School Teacher Training with Parenting Education: A cluster-randomized controlled trial’, Journal of Economic Development, vol. 133, 2018, <www.sciencedirect.com/science/article/pii/S0304387818303808>, <http://documents.worldbank.org/curated/en/580351473691118169/pdf/WPS7817.pdf>, accessed 20 February 2019; Yoshikawa, Hirokazu, et al., Investing in Our Future: The evidence base on preschool education, Society for Research on Child Development, Washington, D.C., 2013, <https://www.fcd-us.org/assets/2013/10/Evidence20Base20on20Preschool20Education20FINAL.pdf>, accessed 20 February 2019.
49 Harris, Alma, and Janet Goodall, ‘Parental Involvement in Education: An overview of the literature’, unpublished manuscript, prepared for the Specialist Schools and Academies Trust, London, 2006; Powell, Douglas R., et al., ‘Parent–School Relationships and Children’s Academic and Social Outcomes in Public School Pre-Kindergarten’, Journal of School Psychology, vol. 48, no. 4, 2010, pp. 269–292, <http://mnprek-3.wdfiles.com/local--files/research-studies/parent%20school%20relationships%20and%20outcomes.pdf>, accessed 20 February 2019.
50 Henderson, Anne T., and Nancy Berla, A New Generation of Evidence: The family is critical to student achievement, National Committee for Citizens in Education, Washington, D.C., 1994, <https://files.eric.ed.gov/fulltext/ED375968.pdf>, accessed 20 February 2019; Edwards, Carolyn P., Susan M. Sheridan and Lisa Knoche, ‘Parent Engagement and School Readiness: Parent-child relationships in early learning’, Faculty Publications, Department of Child, Youth, and Family Studies, University of Nebraska – Lincoln, Lincoln, Nebraska, 2008, p. 60, <http://digitalcommons.unl.edu/cgi/viewcontent.cgi?article=1060&context=famconfacpub>, accessed 20 February 2019.
51 United Nations Children’s Fund, Early Moments Matter for Every Child, UNICEF, New York, 2017, <https://www.unicef.org/media/files/UNICEF_Early_Moments_Matter_for_Every_Child_report.pdf>, accessed 20 February 2019.
52 Ibid.
53 World Bank, Pre-primary education in Mongolia: Access, quality of service delivery and child development outcomes, World Bank, Washington, D.C., March 2017, <http://documents.worldbank.org/curated/en/481101490364915103/pdf/113752-WP-PUBLIC-P152905-QualityJanWithExecMarchclean.pdf>, accessed 20 February 2019.
54 United Nations Children’s Fund, Evaluation of UNICEF’s Programme ‘Montenegro Investment Case for Early Childhood Development’, UNICEF, New York, 2017, <https://www.unicef.org/evaldatabase/files/MNE_ECE_Investment_Case_FinalEvalReport_vol1_Montenegro_2017-001.pdf>, accessed 20 February 2019.
55 Ibid.
56 United Nations Children’s Fund, Strategic Monitoring Questions, UNICEF, New York, 2017. For the scoring criteria in each dimension, see Annex 3.
57 Ibid.
58 Ibid.
59 Kagan, Sharon Lynn, and Kristie Kauerz (eds), Early childhood systems: Transforming early learning, Teachers College Press, New York, 2012, <https://eric.ed.gov/?id=ED529873>, accessed 20 February 2019; Vargas-Barón, Emily, ‘Building and Strengthening National Systems for Early Childhood Development’, Handbook of early childhood development research and its impact on global policy, Oxford University Press, Oxford, 2013, pp. 443–466, <http://www.oxfordscholarship.com/view/10.1093/acprof:oso/9780199922994.001.0001/acprof-9780199922994-chapter-24>, accessed 20 February 2019.
60 Woodhead, Martin, et al., ‘Scaling-up Early Learning in Ethiopia: Exploring the potential of O-class’, Working Paper No. 163, Young Lives, Oxford, 2017, <http://www.younglives.org.uk/sites/www.younglives.org.uk/files/YL-WP163-Woodhead%20(2).pdf>, accessed 20 February 2019.
Chapter 4The achievable goal of improved financing for pre-primary education
1 International Commission on Financing Global Education Opportunity, The Learning Generation: Investing in education for a changing world, Education Commission, New York, 2016, <https://bit.ly/2T1DA4T>, accessed 19 February 2019.
2 Dollar amounts were calculated at 2015 prices. Zubairi, Asma, and Pauline Rose, Bright and Early: How financing pre-primary education gives every child a fair start in life, TheirWorld, London, 2017, <https://s3.amazonaws.com/theirworld-site-resources/Reports/Theirworld-Report-Bright-and-Early-June-2017.pdf>, accessed 25 February 2019.
3 Zubairi and Rose, Bright and Early.
4 United Nations Educational, Scientific and Cultural Organization, ‘Pricing the Right to Education: The cost of reaching new targets by 2030’, Policy Paper No. 18, UNESCO, Paris, 2015, <https://unesdoc.unesco.org/ark:/48223/pf0000232197>, accessed 25 February 2019.
5 Niculescu, Mara, ‘Impact Investment to Close the SDG Funding Gap’, UNDP Our Perspectives blog, 13 July 2017, <www.undp.org/content/undp/en/home/blog/2017/7/13/What-kind-of-blender-do-we-need-to-finance-the-SDGs-.html>, accessed 25 February 2019.
6 Zubairi and Rose, Bright and Early.
148
Endnotes
A World Ready To Learn
149
7 Data were extracted from the UIS global database, 2018, with most recent data from 2011–2017 used to apply simple averages for this calculation.
8 UNICEF analyses, based on UIS data, extracted 2017. The most recent data used are for key indicators between 2010 and 2016. Linear regression was used.
9 United Nations Children’s Fund, The Investment Case for Education and Equity, UNICEF, New York, 2015, <www.unicef.org/publications/files/Investment_Case_for_Education_and_Equity_FINAL.pdf>, accessed 25 February 2019.
10 Investment Case for Education and Equity; Ilie, Sonia, and Pauline Rose, ‘Is Equal Access to Higher Education in South Asia and Sub-Saharan Africa Achievable by 2030?’, Higher Education, vol. 72, no. 4, 2016, pp. 435–455, <https://link.springer.com/article/10.1007/s10734-016-0039-3>, accessed 25 February 2019.
11 García, Jorge Luis, et al., ‘The Life-Cycle Benefits of an Influential Early Childhood Program’, Working Paper No. 22993, National Bureau of Economic Research, Cambridge, Mass., 2016, <www.nber.org/papers/w22993.pdf>, accessed 25 February 2019.
12 Jaramillo, Adriana, and Alain Mingat, ‘Can Early Childhood Programs Be Financially Sustainable in Africa?’, ch. 23 in Africa’s Future – Africa’s Challenge: Early childhood care and development (ECCD) in sub-Saharan Africa, edited by Marito Garcia, Alan Pence and Judith L. Evans, International Bank for Reconstruction,
World Bank, Washington, D.C., 2008, pp. 459–485, <http://siteresources.worldbank.org/EXTAFRREGTOPEDUCATION/Resources/444707-1291071725351/Africa_Challenge_Africa_Future_2008_final.pdf>, accessed 25 February 2019.
13 Ilie and Rose, ‘Is Equal Access Achievable by 2030?’.
14 Tertiary education is not used for this population-based comparison, as universal tertiary education is not a common target, hence the tertiary-age population is not comparable.
15 Calculation involves dividing the subsector government expenditure by the number of children in the population of the official age for the specific subsector (e.g., primary education expenditure/number of children of primary age in population) and comparing it to the equivalent calculation for pre-primary education.
16 Investment Case for Education and Equity; Ilie and Rose, ‘Is Equal Access Achievable by 2030?’.
17 Learning Generation.
18 ‘Over-Enrollment in the Early Grades’.
19 Safe Spaces: The urgent need for early childhood development in emergencies and disasters.
20 Ogawa, Keiichi, et al., ‘Asia-Pacific Regional Report: Financing for early childhood care and education’, Working Paper, UNESCO, Bangkok, 2016, <https://unesdoc.unesco.org/ark:/48223/pf0000245777>, accessed 25 February 2019.
21 Bidwell, Kelly, and Loïc Watine, Exploring Early Education Programs in Peri-Urban Settings in Africa, Innovations for Poverty Action, New Haven, Conn., 2014, <www.poverty-action.org/sites/default/files/publications/final_ecd_report_full.pdf>, accessed 25 February 2019.
22 Ibid.
23 Ogawa, Keiichi, et al., ‘Asia-Pacific Regional Report: Financing for early childhood care and education’.
24 Ibid.
25 Investment Case for Education and Equity.
26 Ibid.
27 Putcha, Vidya, et al., Financing Early Childhood Development: An analysis of international and domestic sources, Results for Development, Washington, D.C., 2016, <www.r4d.org/resources/financing-early-childhood-development-analysis-international-domestic-sources/>, accessed 25 February 2019.
28 Ibid.
29 World Bank, ‘Scaling Up Preschool in Kenya: Costs, constraints and opportunities’, Policy Brief, World Bank, Washington,
D.C., 2016, <http://documents.worldbank.org/curated/en/762961482316633811/pdf/111215-BRI-ELPPolicyBriefKenya-PUBLIC.pdf>, accessed 25 February 2019.
30 Sources: United Nations Children’s Fund, ‘Investing in Early Childhood Education in Serbia, Belgrade’, Working Paper, UNICEF, September 2012; and Statistical Office of the Republic of Serbia and United Nations Children’s Fund, Serbia Multiple Indicator Cluster Survey 2014 and Serbia Roma Settlements Multiple Indicator Cluster Survey 2014, Statistical Office of the Republic of Serbia and UNICEF, Belgrade, 2015, <https://mics-surveys-prod.s3.amazonaws.com/MICS5/Europe%20and%20Central%20Asia/Serbia/2014/Final/Serbia%20%28National%20and%20Roma%20Settlements%29%202014%20MICS_English.pdf>, accessed 28 February 2019.
31 Putcha, Vidya, et al., Financing Early Childhood Development.
32 Ibid.
33 Computations by UNICEF, based on data from OECD, 2005 to 2016.
34 Zubairi and Rose, Bright and Early.
35 Ibid.
36 IIEP-Pôle de Dakar is the IIEP’s Africa-based specialized institute with the mandate to strengthen the capacity of Member States to plan and manage their education systems.
37 Sources for the case study on Mali: UIS global database, 2017; Mingat, Alain, Perspectives pour le cadrage du programme décennal du Mali en matière de Développement de la Petite Enfance, January 2016; Bilan des compétences des enfants à l’entrée au primaire au Mali, 2017; ‘Early Learning and Development Standards in Mali (2017)’; Summary Report on Pre-Primary Sub-Sector Diagnostic and Planning Workshop (October 2017).
38 National Council for Sustainable Development of the Kyrgyz Republic, National Sustainable Development Strategy for the Kyrgyz Republic for the Period of 2013–2017, National Council for Sustainable Development of the Kyrgyz Republic, Bishkek, 2013, <www.un-page.org/files/public/kyrgyz_national_sustainable_development_strategy.pdf>, accessed 25 February 2019; Kyrgyz Republic, Education Development Strategy of the Kyrgyz Republic for 2012-2020, Kyrgyz Republic, Bishkek, 2012, <www.globalpartnership.org/download/file/fid/44406>, accessed 25 February 2019.
39 World Bank, ‘Project Information Document (PID) Appraisal Stage, Report No.: PIDA629: Vietnam School Readiness Promotion Project (P117393)’, World Bank, Washington, D.C., 2012, <http://documents.worldbank.org/curated/en/390651468119652902/pdf/PID-Appraisal-Print-P117393-11272012-1354047073485.pdf>, accessed 25 February 2019.
A World Ready To Learn
149
40 World Bank, Pre-Primary Education in Mongolia: Access, quality of service delivery and child development outcomes, World Bank, Washington, D.C., March 2017, <http://documents.worldbank.org/curated/en/481101490364915103/pdf/113752-WP-PUBLIC-P152905-QualityJanWithExecMarchclean.pdf>, accessed 25 February 2019.
41 United Nations Educational, Scientific and Cultural Organization, ‘Financing for Early Childhood Care and Education (ECCE): Investing in the foundation for lifelong learning and sustainable development’, UNESCO, Paris, 2016, <https://unesdoc.unesco.org/ark:/48223/pf0000245511>, accessed 25 February 2019; Schleicher, Andreas, Jo Bourne and Jordan Naidoo, ‘A World Ready to Learn’, UNICEF blog, 3 January 2019, <https://blogs.unicef.org/blog/world-ready-to-learn/>, accessed 25 February 2019.
42 Learning Generation.
43 Ibid.
44 Kobe University, ‘Asia-Pacific Regional Report: Financing for Early Childhood Care and Education (ECCE)’, Background paper for UNESCO Bangkok, Kobe University, Kobe, 2016, <https://unesdoc.unesco.org/ark:/48223/pf0000245777>, accessed 25 February 2019.
45 United Nations Educational, Scientific and Cultural Organization, Education for All 2000-2015: Achievements and Challenges, UNESCO, Paris, 2015, <https://en.unesco.org/gem-report/report/2015/education-all-2000-2015-achievements-and-challenges>, accessed 25 February 2019.
46 United Nations Educational, Scientific and Cultural Organization International Institute for Education Planning, Public and External Financing Report 2009-2014 in Lao PDR, UNESCO IIEP, Paris, 2016, <http://uis.unesco.org/sites/default/files/lao-final-national-nea-report-en.pdf>, accessed 25 February 2019.
47 Evans, David E., and Katrina Kosec, Early Child Education: Making programs work for Brazil’s most important generation, International Bank for Reconstruction and Development, World Bank, Washington, D.C., 2012, <http://documents.worldbank.org/curated/en/314411468014441852/pdf/693070PUB0publ067926B09780821389317.pdf>, accessed 25 February 2019.
48 Office of Head Start, ‘Head Start Non-Federal Share Match’, Office of Head Start, Washington, D.C., 2014, <https://eclkc.ohs.acf.hhs.gov/sites/default/files/pdf/nonfederal-share-at-a-glance.pdf>, accessed 25 February 2019.
49 Putcha, Vidya, and Jacques van der Gaag, ‘Investing in Early Childhood Development: What is being spent, and what does it cost?’, Global Economy & Development Working Paper No. 81, Brookings Institution, Washington, D.C., 2016, <www.brookings.edu/wp-content/uploads/2016/07/ECD-Costing-Paper-Final-highres.pdf>, accessed 25 February 2019.
50 This case study draws on the following sources: Biersteker, Linda, ‘Scaling-up Early Child Development in South Africa: Introducing a reception year (Grade R) for children aged five years as the first year of schooling’, Wolfensohn Center for Development Working Paper No. 17, Brookings Institution, Washington, D.C., 2016, <www.brookings.edu/wp-content/uploads/2016/06/04_child_development_south_africa_biersteker.pdf>, accessed 25 February 2019; Department of Basic Education, Action Plan to 2019: Towards the realization of Schooling 2030, Department of Basic Education, Pretoria, 2015, <www.education.gov.za/Portals/0/Documents/Publications/Action%20Plan%202019.pdf?ver=2015-11-11-162424-417>, accessed 25February 2019;
Van der Berg, Servaas, et al., ‘The Impact of the Introduction of Grade R on Learning Outcomes: Final full report for the Department of Basic Education and the Department of Performance Monitoring and Evaluation in the Presidency’, University of Stellenbosch, Stellenbosch, 2013, <http://resep.sun.ac.za/wp-content/uploads/2014/06/Grade-R-Evaluation-1-3-25-Final-Unpublished-Report-13-06-17.pdf>, accessed 25 February 2019; Richter, Linda, and M.-L. Samuels, ‘The South African Universal Preschool Year: A case study of policy development and implementation’, Child Care, Health and Development, vol. 44, no. 1, 2018, pp. 12–18, <www.researchgate.net/publication/321779984_The_South_African_universal_preschool_year_a_case_study_of_policy_development_and_implementation_The_South_African_universal_preschool_year>, accessed 25 February 2019.
51 See Appendix 2.
52 See <www.iiep.unesco.org/en/institute> and <www.globalpartnership.org/>, accessed 25 February 2019.
53 The ESDP and its policy planning matrix consist of three pillars: (i) expanding equitable access; (ii) improving quality and relevance; and (iii) strengthening planning and management, and outlining a detailed sector plan of 19 key policies and 96 strategies with targets, costing, legislative requirements and central-level responsibilities, based on a set of goals, policy directions and objectives.
54 Commonwealth of Australia, Australia-Laos Education Delivery Strategy 2013–18, Commonwealth of Australia, Canberra, 2014, <https://dfat.gov.au/about-us/publications/Documents/aus-laos-education-delivery-strategy.pdf>; World Bank, ‘Independent Evaluation Group ICR Review’, Report Number: ICRR14758, World Bank, Washington, D.C., 2015, <http://documents.worldbank.org/curated/en/778431467999702100/pdf/ICRR14758-P114609-Box393191B-PUBLIC.pdf>, accessed 25 February 2019.
55 World Bank, Lao People’s Democratic Republic - Education for All-Fast Track Initiative (EFA-FTI) Catalytic Fund Application Project (English), World Bank, Washington, D.C., 2015, <http://documents.worldbank.org/curated/en/778431467999702100/Lao-Peoples-Democratic-Republic-Education-for-All-Fast-Track-Initiative-EFA-FTI-Catalytic-Fund-Application-Project>; World Bank, ‘Independent Evaluation Group ICR Review’, Report Number: ICRR14758, World Bank, Washington, D.C., 2015, <http://documents.worldbank.org/curated/en/778431467999702100/pdf/ICRR14758-P114609-Box393191B-PUBLIC.pdf>, accessed 25 February 2019.
56 UIS global database, 2019, expenditure on pre-primary as a percentage of government expenditure on education.
57 World Bank Global Practice Education East Asia and Pacific Region, ‘International Development Association Project Appraisal on a Global Partnership for Education Grant to the Lao People’s Democratic Republic for a Second Global Partnership for Education Project’, Report No: PAD1055, World Bank, Washington, D.C., 2015, <http://documents.worldbank.org/curated/en/780161468272073196/pdf/PAD10550PAD0P100002015004013020-02.pdf>, accessed 25 February 2019; Lao People’s Democratic Republic, Ministry of Education and Sports, ‘Education and Sports Sector Development Plan (2016-2020)’, Lao People’s Democratic Republic, Vientiane.
58 Ibid.
150
Endnotes
A World Ready To Learn
151
59 Jain, Vikram, Ahmed Irfan and Gauri Kirtane Vanikar, ‘Program to Improve Private Early Education (PIPE): A case study of a systems approach for scaling quality early education solution – A systems approach to scale good early education’, Annals of the New York Academy of Sciences, vol. 1419, no. 1, 2018, pp. 38–56, <www.researchgate.net/publication/325325257_Program_to_Improve_Private_Early_Education_PIPE_a_case_study_of_a_systems_approach_for_scaling_quality_early_education_solutions_A_systems_approach_to_scale_good_early_education>, accessed 25 February 2019.
60 Gustafsson-Wright, Emily, Katie Smith and Sophie Gardiner, ‘Public-Private Partnerships in Early Childhood Development: The role of publicly funded private provision’, Working Paper, Brookings Institution, Washington, D.C., 2017, <www.brookings.edu/wp-content/uploads/2017/12/ecd-public-private-partnerships-20171227.pdf>, accessed 25 February 2019.
61 UNESCO Institute for Statistics , ‘A Roadmap to Better Data on Education Financing’, Information Paper No. 27, UIS, Montreal, 2016, <http://uis.unesco.org/sites/default/files/documents/a-roadmap-to-better-data-on-education-financing-2016-en.pdf>, accessed 25 February 2019.
62 Ibid.
63 Data are extracted from the UIS global database 2019, and data from the most recent years over 2011–2017 are used for the analysis.
64 Ministry of Education of Liberia, Liberia Education Sector Analysis, Ministry of Education, Monrovia, 2016.
65 Raikes, Abbie, and Ivelina Borisova, ‘Building National Early Childhood Data Systems: Laying the groundwork for equitable, quality early childhood services’, Early Childhood Matters 2017, Bernard van Leer Foundation, The Hague, 2017, <https://bernardvanleer.org/ecm-article/2017/building-national-early-childhood-data-systems-laying-groundwork-equitable-quality-early-childhood-services/>, accessed 4 March 2017.
A World Ready To Learn
151

Annex 1
MICS and DHS datasetsFor this global report, unless otherwise specified, the following MICS and DHS datasets have been used.
Annexes
Country Year of dataset MICS/DHS
Afghanistan 2010–2011 MICS4
Algeria 2012–2013 MICS4
Argentina 2011–2012 MICS4
Bangladesh 2012–2013 MICS5
Barbados 2012 MICS4
Belarus 2012 MICS4
Belize 2011, 2015 MICS4, MICS5
Benin 2014 MICS5
Bhutan 2010 MICS4
Bosnia and Herzegovina 2011–2012 MICS4
Cambodia 2014 DHS
Cameroon 2011, 2014 DHS, MICS5
Central African Republic 2010 MICS4
Chad 2014–2015 DHS
Congo 2011–2012 DHS
Costa Rica 2011 MICS4
Côte d’Ivoire 2011–2012 DHS
Cuba 2014 MICS5
Democratic Republic of the Congo 2013–2014 DHS
Dominican Republic 2014 MICS5
Egypt 2014 DHS
El Salvador 2014 MICS5
Eswatini 2014 MICS5
The Gambia 2010 MICS4
Ghana 2011 MICS4
Guinea-Bissau 2014 MICS5
Guyana 2014 MICS5
Honduras 2011–2012 DHS
Iraq 2011 MICS4
Jamaica 2011 MICS4
Jordan 2012 DHS
Kazakhstan 2015 MICS5
Kosovo 2013–2014 MICS5
Kyrgyzstan 2014 MICS5
Lao People’s Democratic Republic 2011–2012 MICS4
Malawi 2013–2014 MICS5
Mali 2015 MICS5
Mauritania 2011 MICS4
Mexico 2015 MICS5
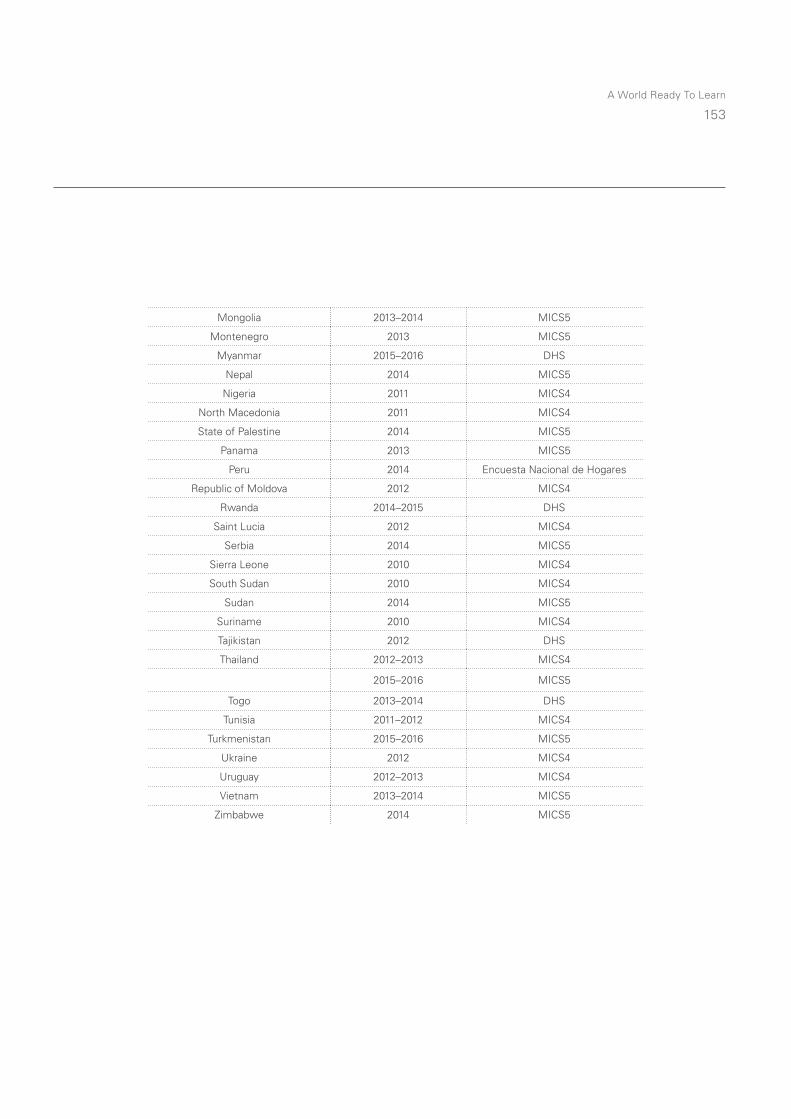
A World Ready To Learn
153
Mongolia 2013–2014 MICS5
Montenegro 2013 MICS5
Myanmar 2015–2016 DHS
Nepal 2014 MICS5
Nigeria 2011 MICS4
North Macedonia 2011 MICS4
State of Palestine 2014 MICS5
Panama 2013 MICS5
Peru 2014 Encuesta Nacional de Hogares
Republic of Moldova 2012 MICS4
Rwanda 2014–2015 DHS
Saint Lucia 2012 MICS4
Serbia 2014 MICS5
Sierra Leone 2010 MICS4
South Sudan 2010 MICS4
Sudan 2014 MICS5
Suriname 2010 MICS4
Tajikistan 2012 DHS
Thailand 2012–2013 MICS4
2015–2016 MICS5
Togo 2013–2014 DHS
Tunisia 2011–2012 MICS4
Turkmenistan 2015–2016 MICS5
Ukraine 2012 MICS4
Uruguay 2012–2013 MICS4
Vietnam 2013–2014 MICS5
Zimbabwe 2014 MICS5
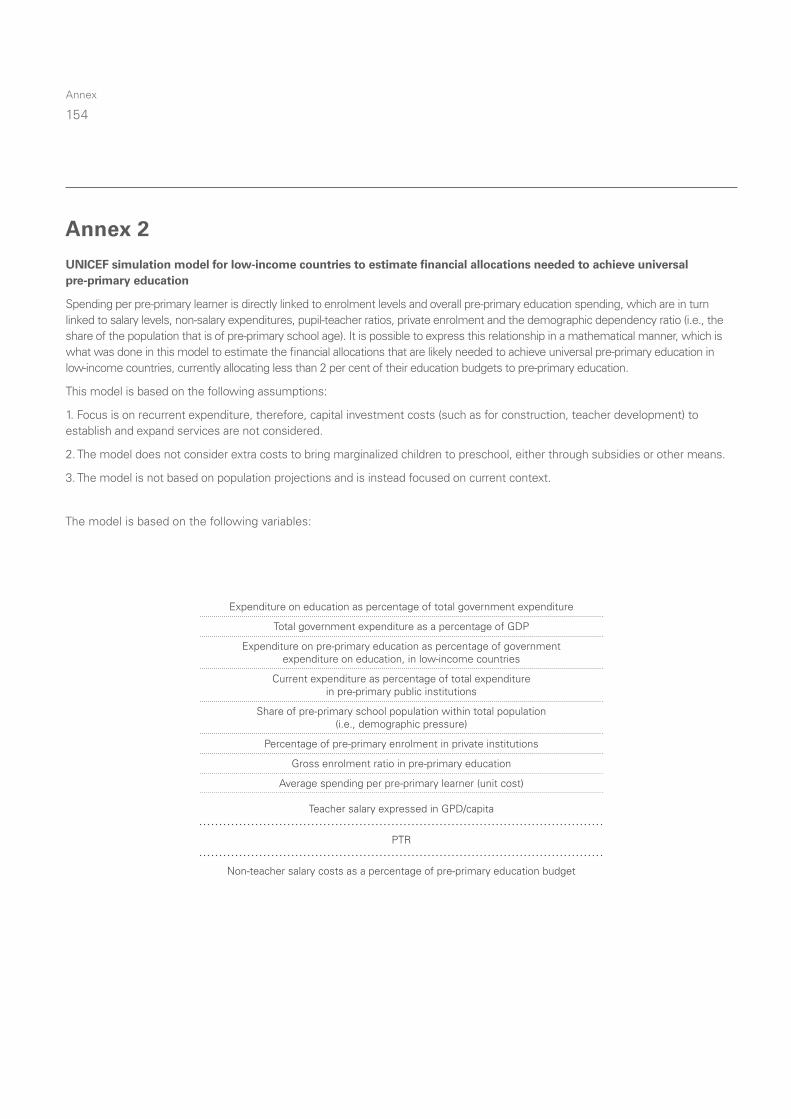
154
Annex
The model is based on the following variables:
Annex 2
UNICEF simulation model for low-income countries to estimate financial allocations needed to achieve universal pre-primary education
Spending per pre-primary learner is directly linked to enrolment levels and overall pre-primary education spending, which are in turn linked to salary levels, non-salary expenditures, pupil-teacher ratios, private enrolment and the demographic dependency ratio (i.e., the share of the population that is of pre-primary school age). It is possible to express this relationship in a mathematical manner, which is what was done in this model to estimate the financial allocations that are likely needed to achieve universal pre-primary education in low-income countries, currently allocating less than 2 per cent of their education budgets to pre-primary education.
This model is based on the following assumptions:
1. Focus is on recurrent expenditure, therefore, capital investment costs (such as for construction, teacher development) to establish and expand services are not considered.
2. The model does not consider extra costs to bring marginalized children to preschool, either through subsidies or other means.
3. The model is not based on population projections and is instead focused on current context.
Expenditure on education as percentage of total government expenditure
Total government expenditure as a percentage of GDP
Expenditure on pre-primary education as percentage of government expenditure on education, in low-income countries
Current expenditure as percentage of total expenditure in pre-primary public institutions
Share of pre-primary school population within total population (i.e., demographic pressure)
Percentage of pre-primary enrolment in private institutions
Gross enrolment ratio in pre-primary education
Average spending per pre-primary learner (unit cost)
Teacher salary expressed in GPD/capita
PTR
Non-teacher salary costs as a percentage of pre-primary education budget
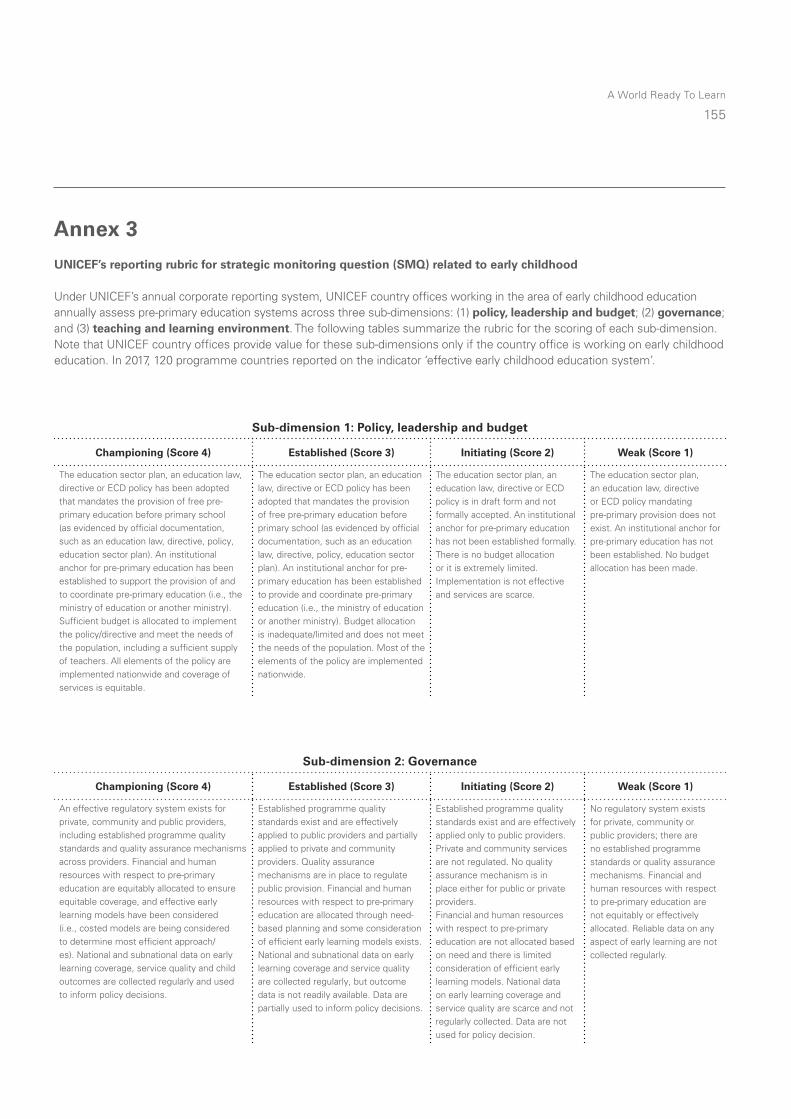
A World Ready To Learn
155
Annex 3
UNICEF’s reporting rubric for strategic monitoring question (SMQ) related to early childhood
Under UNICEF’s annual corporate reporting system, UNICEF country offices working in the area of early childhood education annually assess pre-primary education systems across three sub-dimensions: (1) policy, leadership and budget; (2) governance; and (3) teaching and learning environment. The following tables summarize the rubric for the scoring of each sub-dimension. Note that UNICEF country offices provide value for these sub-dimensions only if the country office is working on early childhood education. In 2017, 120 programme countries reported on the indicator ‘effective early childhood education system’.
Sub-dimension 1: Policy, leadership and budget
Championing (Score 4) Established (Score 3) Initiating (Score 2) Weak (Score 1)
The education sector plan, an education law, directive or ECD policy has been adopted that mandates the provision of free pre-primary education before primary school (as evidenced by official documentation, such as an education law, directive, policy, education sector plan). An institutional anchor for pre-primary education has been established to support the provision of and to coordinate pre-primary education (i.e., the ministry of education or another ministry). Sufficient budget is allocated to implement the policy/directive and meet the needs of the population, including a sufficient supply of teachers. All elements of the policy are implemented nationwide and coverage of services is equitable.
The education sector plan, an education law, directive or ECD policy has been adopted that mandates the provision of free pre-primary education before primary school (as evidenced by official documentation, such as an education law, directive, policy, education sector plan). An institutional anchor for pre-primary education has been established to provide and coordinate pre-primary education (i.e., the ministry of education or another ministry). Budget allocation is inadequate/limited and does not meet the needs of the population. Most of the elements of the policy are implemented nationwide.
The education sector plan, an education law, directive or ECD policy is in draft form and not formally accepted. An institutional anchor for pre-primary education has not been established formally. There is no budget allocation or it is extremely limited. Implementation is not effective and services are scarce.
The education sector plan, an education law, directive or ECD policy mandating pre-primary provision does not exist. An institutional anchor for pre-primary education has not been established. No budget allocation has been made.
Sub-dimension 2: Governance
Championing (Score 4) Established (Score 3) Initiating (Score 2) Weak (Score 1)
An effective regulatory system exists for private, community and public providers, including established programme quality standards and quality assurance mechanisms across providers. Financial and human resources with respect to pre-primary education are equitably allocated to ensure equitable coverage, and effective early learning models have been considered (i.e., costed models are being considered to determine most efficient approach/es). National and subnational data on early learning coverage, service quality and child outcomes are collected regularly and used to inform policy decisions.
Established programme quality standards exist and are effectively applied to public providers and partially applied to private and community providers. Quality assurance mechanisms are in place to regulate public provision. Financial and human resources with respect to pre-primary education are allocated through need-based planning and some consideration of efficient early learning models exists. National and subnational data on early learning coverage and service quality are collected regularly, but outcome data is not readily available. Data are partially used to inform policy decisions.
Established programme quality standards exist and are effectively applied only to public providers. Private and community services are not regulated. No quality assurance mechanism is in place either for public or private providers.Financial and human resources with respect to pre-primary education are not allocated based on need and there is limited consideration of efficient early learning models. National data on early learning coverage and service quality are scarce and not regularly collected. Data are not used for policy decision.
No regulatory system exists for private, community or public providers; there are no established programme standards or quality assurance mechanisms. Financial and human resources with respect to pre-primary education are not equitably or effectively allocated. Reliable data on any aspect of early learning are not collected regularly.
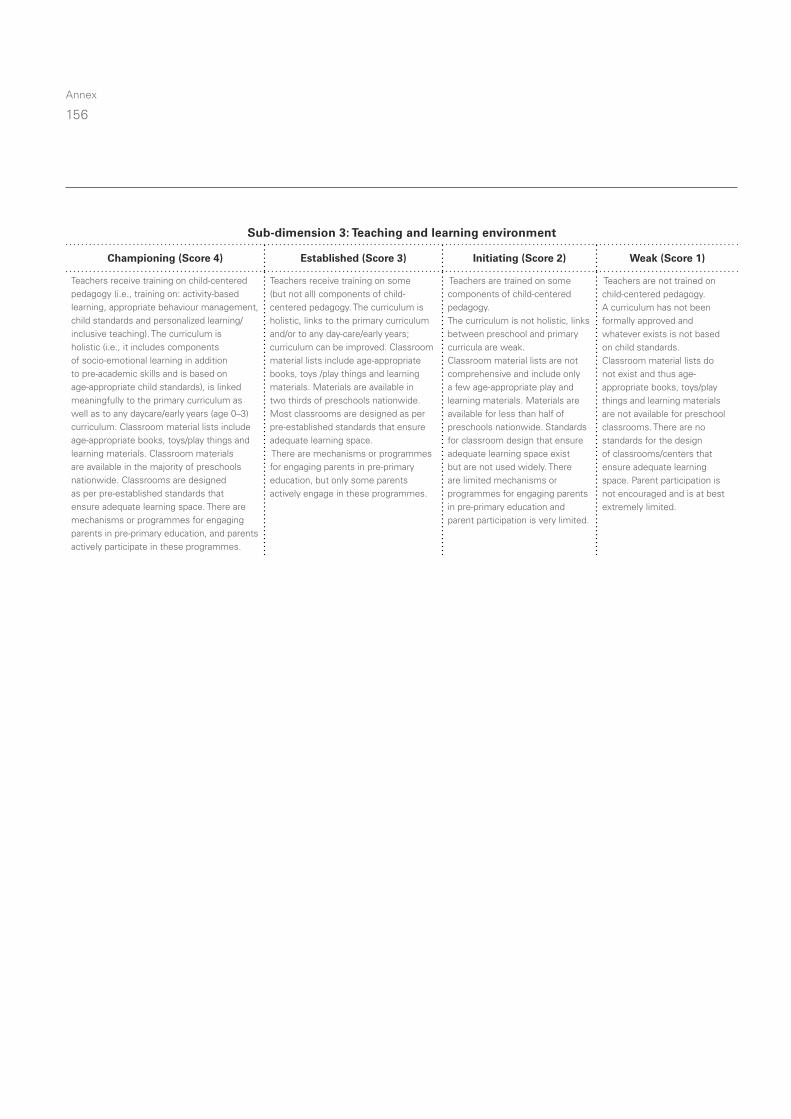
156
Annex
Sub-dimension 3: Teaching and learning environment
Championing (Score 4) Established (Score 3) Initiating (Score 2) Weak (Score 1)
Teachers receive training on child-centered pedagogy (i.e., training on: activity-based learning, appropriate behaviour management, child standards and personalized learning/inclusive teaching). The curriculum is holistic (i.e., it includes components of socio-emotional learning in addition to pre-academic skills and is based on age-appropriate child standards), is linked meaningfully to the primary curriculum as well as to any daycare/early years (age 0–3) curriculum. Classroom material lists include age-appropriate books, toys/play things and learning materials. Classroom materials are available in the majority of preschools nationwide. Classrooms are designed as per pre-established standards that ensure adequate learning space. There are mechanisms or programmes for engaging parents in pre-primary education, and parents actively participate in these programmes.
Teachers receive training on some (but not all) components of child-centered pedagogy. The curriculum is holistic, links to the primary curriculum and/or to any day-care/early years; curriculum can be improved. Classroom material lists include age-appropriate books, toys /play things and learning materials. Materials are available in two thirds of preschools nationwide. Most classrooms are designed as per pre-established standards that ensure adequate learning space. There are mechanisms or programmes for engaging parents in pre-primary education, but only some parents actively engage in these programmes.
Teachers are trained on some components of child-centered pedagogy. The curriculum is not holistic, links between preschool and primary curricula are weak.Classroom material lists are not comprehensive and include only a few age-appropriate play and learning materials. Materials are available for less than half of preschools nationwide. Standards for classroom design that ensure adequate learning space exist but are not used widely. There are limited mechanisms or programmes for engaging parents in pre-primary education and parent participation is very limited.
Teachers are not trained on child-centered pedagogy. A curriculum has not been formally approved and whatever exists is not based on child standards. Classroom material lists do not exist and thus age-appropriate books, toys/play things and learning materials are not available for preschool classrooms. There are no standards for the design of classrooms/centers that ensure adequate learning space. Parent participation is not encouraged and is at best extremely limited.
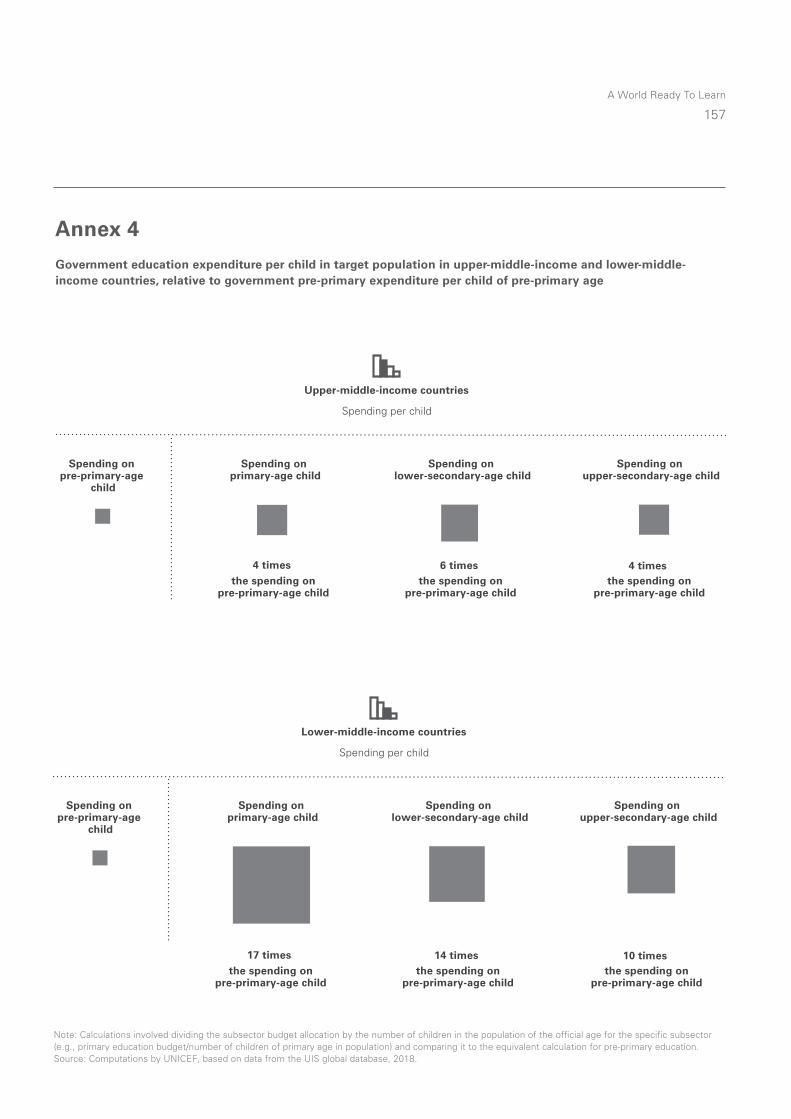
A World Ready To Learn
157
Note: Calculations involved dividing the subsector budget allocation by the number of children in the population of the official age for the specific subsector (e.g., primary education budget/number of children of primary age in population) and comparing it to the equivalent calculation for pre-primary education.Source: Computations by UNICEF, based on data from the UIS global database, 2018.
Figure 4.6.cGovernment education expenditure per child in target population in lower-middle income countries, relative to government pre-primary expenditure per child of pre-primary age
the spending on pre-primary-age child
the spending on pre-primary-age child
the spending on pre-primary-age child
17 times 14 times
10 times
Lower-middle-income countries
Spending on upper-secondary-age child
Spending on pre-primary-age
child
Spending on primary-age child
Spending on lower-secondary-age child
Spending per child
Note: Calculations involved dividing the subsector budget allocation by the number of children in the population of the official age for the specific subsector (e.g., primary education budget/number of children of primary age in population) and comparing it to the equivalent calculation for pre-primary education.Source: Computations by UNICEF, based on data from the UIS global database, 2018.
Figure 4.6.dGovernment education expenditure per child in target population in lower-middle income countries, relative to government pre-primary expenditure per child of pre-primary age
the spending on pre-primary-age child
the spending on pre-primary-age child
the spending on pre-primary-age child
4 times 6 times
4 times
Upper-middle-income countries
Spending on upper-secondary-age child
Spending on pre-primary-age
child
Spending on primary-age child
Spending on lower-secondary-age child
Spending per child
Annex 4
Government education expenditure per child in target population in upper-middle-income and lower-middle-income countries, relative to government pre-primary expenditure per child of pre-primary age
158
Section
ANER adjusted net enrolment rate
ANER, one year before the official primary entry age
The participation rate in organized learning (one year before the official primary entry age), by sex as defined as the percentage of children in the given age range who participate in one or more organized learning programme, including programmes that offer a combination of education and care. Participation in early childhood and in primary education are both included. The age range will vary by country, depending on the official age for entry to primary education.
Attendance in early childhood education programme
Percentage of children aged 36 to 59 months who are attending any type of early childhood education programme.
Completion rate Proportion of a student cohort that completes a given level of education. Completion rates are often approximated using a proxy: the gross intake ratio to the last grade of the level considered, e.g., primary or lower secondary education.
CONFEMEN Conférence des ministres de l’Éducation des États et gouvernements de la Francophonie (Conference of the Ministers of Education of French-speaking countries).
DHS Demographic and Health Surveys
DHS collect and disseminate accurate, nationally representative data on health and population in developing countries.
Cumulative dropout rate to the last grade of primary education
Proportion of pupils from a cohort enrolled in a given grade at a given school year who are no longer enrolled in the following school year. Cumulative dropout rate in primary education is calculated by subtracting the survival rate from 100 at a given grade.
ECD early childhood development
ECD refers to the holistic and multidimensional development of a child from prenatal stage to age 8. The essential elements for healthy ECD include health care, adequate nutrition, protection, responsive caregiving and early learning opportunities.
ECDI Early Childhood Development Index
The ECDI is generated from a set of indicators that measure the developmental potential in early childhood using data from MICS. The ECDI measures the developmental status of children aged 3–4 years in the following four domains: literacy-numeracy, social-emotional, physical and cognitive development. Each of these four domains is measured through instruments based on real-time observation. The MICS surveys calculate an overall index score as the percentage of children aged 36–59 months who are developmentally on track in at least three of the four domains.
EFA Education for All
GDP gross domestic product
GDP is the sum of gross value added by all resident producers in the economy, including distributive trades and transport, plus any product taxes and minus any subsidies not included in the value of the products.
GER gross enrolment ratio
The GER is the number of students enrolled in a given level of education, regardless of age, expressed as a percentage of the official school-age population corresponding to the same level of education. The GER can exceed 100 per cent because of early or late entry and/or grade repetition.
GPE Global Partnership for Education
Abbreviations and glossary of key terms
A World Ready To Learn
159
Gross intake ratio to the last grade of primary (or lower secondary) education
Total number of new entrants in the last grade of primary education, regardless of age, expressed as a percentage of the population at the theoretical entrance age to the last grade of primary education.
IIEP International Institute for Education Planning
ISCED International Standard Classification of Education
MICS Multiple Indicator Cluster Surveys
MICS is an international household survey programme developed by UNICEF. MICS is designed to collect statistically sound, internationally comparable estimates of about 130 indicators to assess the situation of children, women and men in the areas of health, education and child protection, among many others.
OECD Organisation for Economic Co-operation and Development
ODA official development assistance
ODA grants and concessional loans that flow to countries on the OECD Development Assistance Committee (DAC) list of ODA recipients, and to multilateral institutions with the promotion of the economic development and welfare of developing countries as their main objective. The definition of ODA is currently being revised.
PASEC Programme for the Analysis of Education Systems
PASEC is a supporting tool for monitoring education systems in CONFEMEN Member States and governments for improved quality education.
Pôle de Dakar An education sector analysis unit set up within UNESCO’s International Institute for Education Planning (IIEP).
PTR pupil-teacher ratio
Pre-primary education In reference to the ‘pre-primary’ level, this report applies the International Standard Classification of Education (ISCED) definition. Under ISCED level 0, pre-primary education programmes are intentionally designed to include educational content for children aged 3 years up to the start of primary education, often around age 6.
SDGs Sustainable Development Goals
SDGs are a set of 17 goals endorsed by governments at the United Nations in September 2015 for achievement by 2030. These cover a broad range of sustainable development issues, including ending poverty and hunger, improving education and health, making cities more sustainable, combating climate change and protecting oceans and forests. The fourth SDG focuses on education.
SDG 4 Sustainable Development Goal 4 is one of the 17 SDGs and seeks to “Ensure inclusive and equitable quality education and promote lifelong learning opportunities for all.” One of the targets, SDG 4.2, specifically aims to “ensure that all girls and boys have access to quality early childhood development, care and pre-primary education so that they are ready for primary education by 2030.”
UIS UNESCO Institute for Statistics
The UIS is the official United Nations statistical agency for the international collection of data in science and technology and is the lead agency for elaborating statistical standards for developing countries, particularly in science, technology and innovation. It operates an online database (<http://data.uis.unesco.org>) that provides internationally comparable statistics on education, among other fields, with a number of key indicators focused on pre-primary education.
UNESCO United Nations Educational, Scientific and Cultural Organization
UNICEF United Nations Children’s Fund
WIDE World Inequality Database on Education
WIDE is a database produced by the Education for All Global Monitoring Report and UNESCO, gathering DHS and MICS data from more than 60 countries (<www.education-inequalities.org>).
160
Section
A World Ready To Learn
161Photo credits
Cover: © UNICEF/UN0220814/Matas
Page 5: © UNICEF/UN0240308/Vishwanathan
Page 9: © UNICEF/UN0282816/Frank Dejongh
Page 25: © UNICEF/UN035744/LeMoyne
Pages 36, 37: © UNICEF/UN040641
Pages 64, 65: © UNICEF/UNI123643/Znidarcic
Pages 94, 95: © UNICEF/UN074047/Pirozzi
Pages 126, 127: © UNICEF/UNI143924/Zaidi
Pages 138, 139: © UNICEF/UN0220810/Matas
Page 160: © UNICEF/UN050570/Mukwazhi
Published by United Nations Children’s Fund
3 United Nations Plaza, New York, NY 10017, USA
ISBN: 978-92-806-5007-5
© United Nations Children’s Fund (UNICEF)
April 2019