Embed Size (px)
Citation preview

37? Aten
A/0 8.
FACTORS ASSOCIATED WITH AGEISM: A SURVEY
OF COLLEGE STUDENTS
DISSERTATION
Presented to the Graduate Council of the
University of North Texas in Partial
Fulfillment of the Requirements
For the Degree of
DOCTOR OF PHILOSOPHY
By
Patricia Ann Campo Nation, B.S., M.S,
Denton, Texas
May, 1997
•vi., ,, i. ,j P i-iru^A/c

Nation, Patricia Ann Campo, Factors Associated with
Ageism: A Survey of College Students. Doctor of Philosophy
(Sociology), May 1997, 122 pp., 14 tables, 1 figure, 1
appendix, bibliography, 120 titles.
Questionnaires were administered to 254 university
students in a north Texas city whose population is
approximately 65,000.
The relevant literature dates from 1922 to 1996 and
examines a wide range of concepts associated with the
definition of ageism, attitudes and beliefs in society, the
development of stereotypes and discrimination against the
aged.
The primary question addressed was, "What effect does
educational attainment and acquired knowledge of ageing have
on negative ageism?" Subsidiary questions are, "What effect
does; age, sex, and positive/negative experiences with aged
individuals, have on ageism?" Nine hypotheses were tested:
One, the younger the respondent, the more negative the
response toward older individuals. Two, the more knowledge
a respondent has about the aging process, the less likely
the respondent is to respond to the aged in a negative
manner. Both of these hypotheses were supported by the
research findings. The third, fourth and fifth hypotheses

all examined educational attainment of mother, father, and
respondent and their attitudes toward the aged, expecting
that the higher the educational level, the less likely to
respond in a negative manner toward the aged. These
hypotheses were not supported by the findings in this
research. Six, male students would respond more negatively
toward older individuals than would female students. This
hypothesis was not supported by the research findings.
Seven, students that reported their education major as being
gerontology, would respond less negatively toward the aged
than non-gerontology students. This hypothesis was
supported by the research findings. Eight, the more courses
completed in gerontology, the less likely to respond
negatively toward the aged. This hypothesis was not
supported in the research findings. Nine, individuals that
encounter predominantly positive experiences with the aged
would respond more positively toward the aged. This
hypothesis was supported by the research findings.

TABLE OF CONTENTS
Page
LIST OF TABLES v
I. INTRODUCTION 1
Introductory Statements Statement of Problem Design of the Research Significance of the Study Limitations Major Divisions of the Research Report
II. REVIEW OF THE LITERATURE 8
Introductory Remarks Ageism Attitudes and Beliefs Stereotyping Discrimination
III. THEORETICAL FRAMEWORK 31
Introductory Remarks Theoretical Frame of Reference Explanation of Model Model Hypotheses Variables Definition of Terms
IV. METHODOLOGY 43
Introductory Remarks Techniques of Data Collection Research Design Techniques of Data Analysis Instrument
V. DATA ANALYSIS AND DISCUSSION OF FINDINGS . . . 67
Introductory Remarks Description of Sample Data Analysis
xix
VI. SUMMARY AND CONCLUSIONS 94
Introductory Remarks Summary of Problem Summary of Findings Implications of Findings Suggestions Conclusion
APPENDIX 104
REFERENCES 114
xv

LIST OF TABLES
PAGE
FIGURE 1 37
TABLE
1. Negative and Positive Attitude Scale 47
2. Frequencies of Data 72
3. Age and Negative Attitude-- One-Way Analysis of Variance 7 5
4. Knowledge and Negative Attitude One-Way Analysis of Variance 77
5. Mother's Education and Negative Attitude— One-Way Analysis of Variance 79
6. Father's Education and Negative Attitude--One-Way Analysis of Variance 81
7. Education and Negative Attitude--One-Way Analysis of Variance 83
8. Sex and Negative Attitude— One-Way Analysis of Variance 84
9. Major and Negative Attitude--One-Way Analysis of Variance 86
10. Aging Courses and Negative Attitude--One-Way Analysis of Variance 87
11. Outcome, Interaction, and Experience with Positive Attitude Multiple Regression 88
12. Interaction and Positive Attitude--One-Way Analysis of Variance 91
13. Outcome and Positive Attitude--One-Way Analysis of Variance 92
14. Experience and Positive Attitude--One-Way Analysis of Variance 93
v

CHAPTER I
INTRODUCTION
The aging of society is rapidly becoming one of the most
distinct features of modernity. Older individuals will
exist in our society in greater numbers than ever before,
which draws focus to not only significant changes in the age
composition of our society, but in various changes in the
norms, values, and attitudes concerning the elderly. In the
21st century, approximately one in five persons will be age
65 or over, a demographic reality that suggests enormous
implications.
The overall life expectancy in the United States in
1900 was 47.3, in 1987 we see an increase in longevity of
nearly 50 percent, averaging 75.0 years. In 1900 only 4
percent of the total population of the United States were 65
years old or older. In 1940 the population consisted of 7
percent of individuals 65 years of age and older, which
constituted 9 million people. By 1987 the numbers had
increased to 29.8 million or about 12.3 percent of the
population (Cockerham, 1991).
Currently there are approximately 25 million persons
age 65 years or older in the United States (Sloane, Slatt, &
Baker, 1988). The population of individuals 65 years or
older in the United States is expected to rise to 39 million
1

people by the year 2010 (Schick, 1986). Furthermore, it is
estimated that 68.5 million people will reach the age of 65
years by the year 2050 and will represent 22.9 percent of
the estimated total of population for that year (U.S. Bureau
of the Census, 1989).
Not only have we seen an increase in longevity, but
since 1958 the birthrate in the United Sates has been
declining. The lower death rate coupled with the lower
birthrate, has resulted in a much higher proportion of older
Americans in relation to the overall total population
(Cockerham, 1991). With this marked increase and the current
demographic projections, a clear trend emerges that
Americans are living longer, and the percentage of elderly
in the population is significantly increasing.
This trend will bring about a marked change in American
society, including heightened societal pressures. We will
see an aged population that will be healthier, better
educated, and more affluent than any comparable cohorts of
elderly persons in the past (Cockerham, 1991). Even though
elderly Americans will be healthier than pervious
generations, pressure is likely to be put on health care
delivery systems and public health insurance to keep them
fit (Cockerham, 1991). Pressure will also be put on the
Social Security system to maintain or increase payments for
old-age benefits. With relatively fewer children resulting
from the Baby Boom generation that were born between 1946

and 1964 and is currently passing into middle age, the
financing of old-age benefits will require increasingly more
money in the future from a much smaller working population.
In 1955, there were 8.6 taxpayers per Social Security
beneficiary; but by 2005, the ratio is expected to be 2.7
taxpayers per retiree. By 20"35, the ratio is expected to
drop to about 1.9 taxpayers per retiree. A future crisis in
the financing and provision of services for the elderly
population of the United States is certain (Cockerham,
1991).
As the rising number of older Americans increases, in
relations to our areas of societal pressures associated with
this dramatic demographic change, our perception tends to
focus on the factors that are associated with attitudes of
society toward our elders. Attitudes are positive or
negative positions we take toward the aged.
Ageism is a primary concern in association with
perceptions, and has been defined as "thinking or believing
in a negative manner about the process of becoming old or
about old people" (Butler, 1989) . Ageism can be represented
in thinking, or believing leading to prejudicial attitudes
against the aged, and or in actions, such as discrimination
of the aged.
Statement of Problem
The central question addressed in this study is what
effect educational attainment and acquired knowledge of

aging have on negative ageism? Subsidiary questions are
what effect does; age, sex, and positive/negative
experiences with aged individuals, have on negative ageism.
This study is concerned with the examination of specific
factors associated with negative ageism in our current
society.
Design of the Research
This was a study of university students, both at the
undergraduate and graduate levels. The sample was drawn
from a university in a north Texas city whose population is
estimated to be about 65,000. Volunteer classes
participated during the summer months of 1996. The students
responded to a survey questionnaire. A copy of the
questionnaire is included in the Appendix of this
dissertation. The sample size was 254 voluntary students
that chose to participate in this sample. Specific
procedures of data collection and analysis are delineated in
succeeding chapters.
Significance of Study
There are numerous possibilities for the utilization of
this study. Since many older Americans may be involved in
an intensive rehabilitation program, this study may be
essential by aiding in the development of strategies in
vocational and medical rehabilitation, in addition to
improving the quality of patient care in the hospital by
addressing the negative attitudes toward the elders.

Governmental agencies will be able to utilize
information obtained in this study by developing programs
that will directly affect the elders. By focusing on the
factors that are associated with ageism, the quality of
service can be improved.
Sociologists and Gerontologists will be able to utilize
information obtained in this study to expand their present
knowledge. The information obtained from this study can be
utilized by both academic and applied professionals for the
expansion of knowledge and the development of future
research.
Limitations
There are limitations associated with this particular
study: The size of the sample is limited to the number of
instructors and students willing to participate in this
study. The respondent's biases are always a concern
whenever relying on self-reporting information. The
limitations of the setting as being used as an indicator for
societal implications. All of these factors represent less
than ideal research situations. This is a sample from one
university and may not reflect the general population.
Major Divisions of the Research Report
Chapter One indicates the problems with which this
dissertation was concerned. The problem explored in this
study is, what effect does educational attainment and
acquired knowledge of aging have on ageism. The first

chapter is an introduction to the dissertation as well as a
concise indication of the scope and purpose of the research.
Chapter Two includes a review of literature in the
field of Gerontology, with direct focus on attitudes
associated with the aged/aging process. Chapter two
indicates the types of studies that have been conducted as
well as the generalized findings on attitudes and aging.
Chapter Three examines the theoretical considerations
of this research. Key concepts and major terms used in this
study are defined. The theoretical model to be used in this
research is examined and the nine hypotheses to be tested
are delineated.
Chapter Four contains the methodological considerations
of this study. Techniques of data collection and data
analysis are operationalized. The research variables are
operationalized, as well as an indepth examination of the
instrument is presented in this chapter.
Chapter Five discusses the findings of the research.
The data analysis procedures are addressed. The results are
discussed in terms of each of the stated hypotheses.
Chapter Six contains the summary and conclusions that
were drawn from this research. An analysis of each of the
nine hypotheses are examined, as well as how several
theoretical and practical conclusions can be drawn from this
research. This last chapter also contains numerous
suggestions for future research which are suggested as a

result of this study.
Summary
In this dissertation, research, analyses, and
conclusions from a sociological perspective focus on the
impact educational attainment and acquired knowledge of
aging have on negative ageism. Subsidiary questions
addressed in this research are; how does age, sex, and
positive/negative experiences with aged individuals effect
attitudes of ageism?

CHAPTER II
REVIEW OF LITERATURE
Introduction
This chapter presents a review of the literature
relating to the subject of this study. It will begin by
examining a range of literature associated with the
definition of ageism, then examine attitudes and beliefs in
society, moving to the development of stereotypes and
concluding with discrimination against the aged. This
chapter will include relevant literature dating from 1930's
to 1996.
Ageism
Numerous authors have attempted to define the meaning
of the term "ageism." The term "ageism" was originally
coined by Robert N. Butler in 1968. He was acting chairman
of the District of Columbia Advisory Committee on Aging at
the time. He had been actively involved in the acquisition
of public housing for older people. When Butler was ask to
. give a definition of the term ageism, he replied with the
following; "Ageism can be seen as a systematic stereotyping
of and discrimination against people because they are old,
just as racism and sexism accomplish this with skin color
and gender. Old people are categorized as senile, rigid in
thought and manner, old-fashioned in morality and skills...
8

Ageism allows the younger generation to see older people as
different from themselves; thus they subtly cease to
identify with their elders as human beings" (Butler, 1969a).
His concern was that he was seeing ageism manifested in a
wide range of phenomena, on both individual and
institutional levels with stereotypes, myths, outright
disdain and dislike, and simple subtle avoidance of contact,
as well as discriminatory practices in housing, employment,
and services of all kinds (Butler, 1989). Ageism has been
described as "thinking or believing in a negative manner
about the process of becoming old or about old people"
(Doty, 1987). Ageism, or age prejudice, can be summarized
by saying it is a "dislike of aging and older people based
on the belief that aging makes people unattractive,
unintelligent, asexual, unemployable, and senile" (Comfort,
1976) . Laws (1995) indicates that ageism is a product of
our dislike of the aged body. This disdain for the aged
body is socially constructed as the target for ageist
practices.
Attitudes and Beliefs
Society's attitudes and beliefs about aging are
culturally embedded and can have a profound effect on how-
people view themselves as well as others who are aging
(Grant, 1996). It may be that only a quarter or less of the
general public endorses this extreme and inaccurate view of
the aged, (McTavish, 1971), but most Americans probably

10
subscribe to some erroneous beliefs about aging and have at
least a mild degree of prejudice against the aged and the
overall process of aging.
When we are dealing with specific older people in
specific social roles and situations, age is seldom seen as
a negative trait. " But when we deal with older people as a
social category, especially in terms of social policy, we
tend to do so in terms of negative images or perceptions, or
beliefs. Being widely held has nothing to do with whether
or not beliefs are actually true or not. An example of this
is a sample done by Harris and Associates in 1981, in which
65 percent of the general public was found to believe that
most older people were lonely, but only 13 percent of older
people in the sample said that loneliness was a problem for
them.
Another example of general beliefs about the aged
population is the acceptance by many that suicide rates
increase after the age of 65, which implies that entering
the older population increases the risk of suicide. This is
both true and misleading. It is true that suicide rates
increase with age after age 65, but it is misleading to
imply that before 65 suicide rates do not increase. Suicide
rates do increase with age steadily after the age of 15, and
there is no change in the rate of increase at 65 or any
other older age (Atchley, 1991).
Beliefs are used to make inferences and draw

11
conclusions. To the extent that our beliefs are faulty, so
too will be our conclusions. Our beliefs are our ideas
about what is true. Beliefs are difficult to study because
they tend to be specific. Tuckman and Lorge (1953) asked
people if they agreed or disagreed with over 150 specific
beliefs about older people. Some of the questions or
beliefs they were asked to respond to were statements such
as; "Older people are set in their ways," "Older people walk
slowly," Older people worry about their health," "Older
people are forgetful," "Older people are able to learn new
things," "Older people can manage their own affairs." This
research showed that in the 1950's, before the rapid
increase in older people in the population, beliefs about
people were often as negative as they were positive. The
research results showed that some of the responses or
beliefs were accurate and sometimes they were inaccurate.
Sometimes their accuracy or inaccuracy had not been
determined. Negative beliefs were more likely than positive
beliefs to be inaccurate.
Attitudes are positive or negative positions we take
toward experiences, physical objects, people and/or ideas.
Attitudes contain elements of both emotional liking or
disliking and positive or negative cognitive evaluation.
This may develop out of purely personal preferences, but
often they are logical extensions of beliefs and values.
One main way people learn what to think about aging is

12
through the media portrayals. The media is one of the most
potent informal sources of socialization in our current
culture. The recognition of this source has resulted in
increasing research attention to the role of the media in
promoting or supporting common societal stereotypes
associated with aging. It is likely that the media plays a
very important role in the shaping and formation of
attitudes toward the elderly, particularly among children
who have limited, superficial, or no contact with the
elderly in society (Vasil, 1993). One study conducted by
Aronoff (1974) examined television and'the portrayal of the
aged. It was found that older characters were portrayed as
"bad guys," prone to failure, and generally unhappy.
Jeffreys-Fox (1977) found that older characters were rated
as less attractive.
Vasil and Wass (1993) conducted an analysis of twenty-
eight published studies conducted between 1974 and 1988.
The under-representation of the elderly was particularly
obvious in prime-time programming, with elders comprising
only 1.5% to 4.9% of the overall prime-time television
population (Bell, 1992). Of the studies analyzed, the
largest sample of characters (16,688) reported a
particularly low percentage of elderly characterizations on
television (2.3%) (Gerbner, 1980; Davis, 1986). Of the nine
studies that actually assessed the quality of elderly
character portrayal on television, five concluded that the

13
elderly were generally depicted in a negative light (Vasil,
1993). Aronoff (1974) found that only 40% of older males
and even fewer older female characters were portrayed as
successful, happy, and good. Northcott (1975) found that
elderly characters were predominantly relegated to minor
roles and that negative comments about aging far outnumbered
the positive. Gerbner (1980) observed that the elderly
characters, more than other age groups, were treated
with disrespect and older characters were more likely to be
depicted as eccentric of foolish. Especially on prime-time
programs, "the elderly tend to be shown as more comical,
stubborn, eccentric, and foolish than other character. They
are more likely to be treated with disrespect" (Davis,
1986) . "It is likely that the media is increasingly
influential in shaping children's perceptions and attitudes
toward the elderly and the overall aging process given
recent sociocultural shifts in American society that have
resulted in less contact between children and elderly people
than in previous time periods" (Vasil, 1993).
Stereotypes
Stereotypes are composites of beliefs we attribute to .
categories of people. Stereotypes provide the foundation
for ageist ideology. Unfortunately, negative stereotypes
about aging are still quite prevalent (Rowe, 1987).
Utilizing the psychological process of stimulus
generalization, stereotypes allow us to treat widely

14
differing individuals as a member of a single category. In
this process, stereotypes never capture diversity because
they are intended to reflect central tendency. All
stereotypes are ethnocentric in that the ideas used to
categorize people reflect the value hierarchies of the group
creating the stereotype. Some stereotypes are basically
accurate descriptions of characteristics within a social
category, and others are inaccurate and disparaging
composites. "Negative stereotyping of the elderly
circumscribes their potential by allowing the placement
emphasis on the unproductive and unsuccessful older person
and may become a self-fulfilling prophecy, limiting
capacities and experiences of aged persons" (Vasil, 1993) .
Palmore (1990) discusses some of the major societal
stereotypes about the elderly in his book, Ageism: Negative
and Positive. Negative stereotypes include the belief that
the elderly are in poor health, asexual, lacking in physical
attractiveness, senile or mentally ill, useless, poor, and
depressed, all of which is untrue. Even the seemingly
positive view of the elderly can have negative consequences.
Positive beliefs have been used to justify scaling back
programs for the elderly. Binstock (1983) believes that the
elderly have been made scapegoats for a depletion of
societal resources, which has in turn, created a "shrinking
of compassion" on the part of society. Negative
stereotyping and ageism may not only affect the elderly, but

15
also may serve to create negative expectations, fear, and
dread of aging in the young (Vasil, 1993).
Many studies report that respondents view the aged and
the specific problems that they face negatively. The
elderly are judged to be weak, in poor health and dependent;
to be of lower competence, intelligence, and attractiveness
than are the young; and to be asexual and socially isolated
(Seccombe, 1991). We find the reports of these negative
sentiments by children (Mitchell, 1985), adolescents (Doka,
1986), college students (Levin, 1988,; Palmore, 1988), and
adults at large (Harris, 1981; Locke-Conner, 1980).
According to Schmidt and Boland (1986), stereotypes of
older people in general differ from stereotypes of older
workers, older volunteers, and so on. They found that older
people are characterized according to three separate kinds
of stereotypes: physical characteristics, negative social
characteristics, and positive social characteristics. The
physical stereotype of older people included; gray hair,
wrinkled skin, false teeth, hearing impediment, poor
eyesight, gnarled hands, and hair loss. The negative social
stereotype included negative affect characteristics such as;
needing nursing care, being dependent on family, or being
senile, and vulnerabilities to crime. There were some
shrewish characteristics such as; complaining, demanding,
being selfish, or having no sense of humor, and some
inflexible characteristics such as living in the past,

16
finding it difficult to change, or being old-fashioned. The
positive social stereotypes included conservative
characteristics such as; patriotism, being Republican, or
not liking handouts, and patriarchal/matriarchal traits such
as living through the children. There were some exemplary
characteristics such as being capable, wise, useful,
understanding and generous. These indicate that there is no
single umbrella stereotype of a so-called "older person."
Instead, there are numerous stereotypes of older people
based on appearance, behavior, and capabilities. Certain
combinations of characteristics are put together to form a
stereotype projected in society.
Based on appearance alone, young people generally call
up negative stereotypes when dealing with older adults.
DeRenzo and Malley (1992) focus their attention on the
linguistic representation of the "elder" as a negative
aspect and possible encourager of ageism in our culture.
Contemporary reactions to growing or being "old" are
consistently negative in our Western culture (Vasil, 1993;
McTavish, 1971; Butler, 1975; Harris, 1975; Rodin, 1980;
Issaks, 1986} . "Biases associated with aging are culturally
transmitted; adults pass beliefs on to children. Therefore,
the same myths and misconceptions about the elderly and the
aging process that exist among adults are to a large extent
shared by children" (Kupetz, 1994; McTavish, 1971). The
images of the elderly were examined, concentrating on

17
children's perceptions of the elderly. It was found that
children as young as 3 years old had overwhelmingly negative
attitudes toward the aged, (DeRenzo, 1992; Burke, 1982;
Jantz, 1977; Treybig, 1974) and unfortunately these views
coincide with those of the adults in our society (Kupetz,
1994). With significant support of continued findings
indicating negative images of the aged, DeRenzo decided to
examine a popular magazine and analyze it for occurrence of
use of ageist language. They examined the magazine and
analyzed it for occurrence of use of ageist language. They
examined the magazine, Vogue from 1969 through 1988. Five
ageist root words were selected; age, young, old, wrinkle,
line. They examined the advertising for various products
for occurrences of these words. Variations of occurrences
were found. In 1969, 25.77 were found, it declined to 17.86
for 1978. Between 1978 and 1984 it climbed to 40.28
occurrences. By 1988 it was at 66.81. So in spite of the
population increase of our aged, and more information on the
topic of age, we see a continued increase in words
associated with ageism in one examination of popular
literature. We see the possible formation of societal
attitudes toward the aged (DeRenzo, 1992) .
Historically, from the 1930's through the late 1970's,
stereotypes of the elderly were compassionate ones, based on
the belief that the elderly were; (1) poor, frail, and
required assistance; (2) that they were politically

18
ineffective; and (3) that they were among the "deserving
poor" whose needs should be met by the wealthy nation that
they supported (Binstock, 1983). By the 1980's the images
and stereotypes about the elderly had dramatically changed.
The elderly were perceived as wealthy, politically powerful,
and self-interested. Due to the demographic changes, the
elderly begem to be perceived as a threat to the future
financial stability of the country (Binstock, 1983). What
Binstock is basically stating is that this new negative
image of the elderly has recently emerged and is taking
hold in our attitudes throughout our society. Several
social scientist might disagree as the time period of the
beginning of this societal "change" in attitudes toward our
elders, (Aronoff, 1974; Jeffreys-Fox, 1977) citing a earlier
beginning for this social phenomenon.
With attention to the socialization that children are
receiving from the media, special concern has risen over the
depiction of the elderly for children in print. Ten studies
examined the depiction of the elderly, yielding a sample of
922 books, 101 magazines, and 24 basal reader series. Eight
studies quantified the portrayal of the elderly of which 7
found that the elderly were under-represented in children's
picture books, basal readers, children's literature, and
magazines. The only close exception to this was found in
adolescent literature. In the children's literature that
included the elderly, it was done in a stereotypical and

19
negative fashion in picture books and children's literature.
Ansello (1977) reported that the adjectives, "old,"
"little," and "ancient," represented 85% of all physical
descriptions of elderly characters. Hurst (1981) and
Janelli (1988) found that the majority of elderly characters
were depicted with little diversi-ty in appearance. The
older characters were frequently portrayed with gray hair,
wearing glasses, and using a cane or walking stick.
Upon examination of the representation of the elderly
in magazine cartoons, (2,217) magazine advertisements,
(17,662) newspapers, (383) and birthday cards (736) it is
found that the elderly were under-represented (Vasil, 1993) .
Negative themes such as sexual dysfunction and extreme
conservatism were prevalent. Buchholz and Bynum (1982)
reported that only 3% of the newspaper stories about the
elderly and aging dealt with significant issues such as
health, retirement, housing, crime, employment, income,
transportation, and demographic shifts. Demos and Jache
(1981) found that negative portrayals of aging was clearly
the trend in birthday cards. It was found that 88% of the
cards that had an aging theme portrayed aging in a negative
light. Despite efforts and impressive advances in
gerontological research, service, and training over the past
few decades, stereotyping and ageism are still very common
and perpetuated in the mass media (Vasil, 1993) .
Many studies report that respondents view the aged and

20
the specific problems that they face negatively. The
elderly are judged to be weak, in poor health and dependent;
to be of lower competence, intelligence, and attractiveness
than are the young; and to be asexual and socially isolated
(Seccombe, 1991). We find the reports of these negative
sentiments by children (Mitchell, 1985), adolescents (Doka,
1986), college students (Levin, 1988,; Palmore, 1988), and
adults at large (Harris, 1981; Locke-Conner, 1980).
Whitbourne and Hulicka (1990) analyzed 139 psychology
textbooks written over 40 years for any evidence of ageism.
It was discovered that aging issues received very little
attention, even in the later editions. When aging was
addressed, the texts tended to focus primarily on problems
rather than successes. Older adults were consistently
described as suffering from multiple deficits and handicaps
that were attributed to the aging process. Infrequently
mentioned was intellectual plasticity, the difference
between normal aging and disease processes, and the ways in
which individuals can compensate for losses associated with
the aging process. Conclusions indicated that the texts
exposed students to a "narrow and permanently fixed view of
the aging process."
Discrimination
Age discrimination is some sort of negative treatment
that is unjustly applied to members of a category of people
due to their age. It is treating people in some unjustly

21
negative manner because of their chronological age or their
appearance and for no other reason. Age discrimination
occurs when human beings are avoided or excluded in everyday
activities because they are "the wrong age." In 1981, 80
percent of adults believed that most employers discriminate
against older people and make it difficult for them to find
work, and 61 percent of employers agreed with this
assessment (U.S. Senate Special Committee on Aging, 1986) .
Older people sometimes must intrude into various
spheres of daily life in order to make people aware that
they have something to offer. Most older people are riot
willing to fight for this recognition, and as a result,
there is a great deal of age segregation in many activities
and interactions. Only in the family do older people
usually escape this sort of informal age discrimination
(Atchley, 1991).
Equally important is the impact of age discrimination
on opportunities for beginning or continuing participation
in various organizations. Job discrimination makes it more
difficult for the older individuals to continue in the labor
force or find jobs if unemployed. The stigma of implied
inability and the resulting discrimination sometimes extend
past paying jobs and can even be found in volunteer jobs as
well. Organizations, especially for the older adults, offer
an alternative to those who have been rejected by
organizations in the "mainstream" of society, but at the

22
cost of segregation. Many older adults prefer to associate
with their cige peers, but for those who do not, alternatives
are not easily found.
Age discrimination can also be found in the form of un-
equal treatment by public agencies. In a report from the
U.S. Commission of Civil Rights conducted in 1977, it was
found that age discrimination was present in numerous
federally funded program; community mental health centers,
legal services, vocational rehabilitation, social services
to low-income individuals and families, employment and
training services, the Food Stamp Program, Medicaid, and
vocational education. This problem was found to exist in
all regions of the country. People in the oldest cohorts
were more likely to experience discrimination from public
agencies, than were the younger cohorts.
In addition to age discrimination, it was often
compounded by other factors of race, sex, national origin,
or handicap status. The Commission on Civil Rights
concluded that much of this discrimination stems from a
narrow interpretation of the goals of legislation. For
example, community health centers generally interpret
"preventative health care" as applying only to children and
adolescents, excluding the elderly. Directors of employment
programs see their most appropriate clients as males age 22
to 44. Even age 22 is considered too old for some job-
training programs. The Commission of Civil Rights found

23
that state legislatures sometimes convert federal programs,
designed to serve all Americans, into categorical programs
aimed at specific age groups. One example they gave was a
strong child abuse and neglect law passed by the State of
Missouri, a worthy goal, but the state didn't have the money
to put it into action. Instead, federal funds for social
services to everyone were earmarked to support the child
abuse program, and as a result, most cities in the state
discontinued their adult protective services programs. In
many cases where the state or local governments are
responsible for defining the population' eligible for federal
programs, age discrimination results. One example of this
is that several states exclude older people from vocational
rehabilitation programs because they were not of "employable
age." Age discrimination sometimes occurs when services are
provided under contract with agencies that limit the ages of
people they will serve. For example, a general social
services contract with a child welfare agency is very
unlikely to result in social services to older adults. The
commission also found that outreach programs tended to be
aimed at specific age groups, which lessens the probability
that older age groups will find out about programs for which
they are eligible.
One overall conclusion that the Commission of Civil
Rights in 1977 reached was that general age discrimination
in public and private job market was an important underlying

24
factor in age discrimination in employment, training, and
vocational rehabilitation programs. As long as older adults
are denied jobs, agencies see little value in preparing them
for jobs. It appears that it is seen as a waste of money,
time and effort on the part of the various agencies.
Subtle ageism may be partly to blame for the deficits
in service delivery to the elder population. Kimmel (1988)
reviewed the effects of ageism on public policy, finding
that 45 percent of U.S. community mental health centers
reported having no programs that were specifically for the
elderly people and that 41 percent did not have any clinical
staff members trained to deliver geriatric services. Roybal
(1988) called for an expansion of mental health services to
meet the needs of the aged. He points out that the elderly
are greatly under-represented empirically in mental health
services, accounting for only 6 percent of people served by
mental health centers.
The American Psychological Association and the American
Psychological Society were co-sponsors of a report entitled,
"Vitality for Life: Psychological Research for Productive
Aging" (Adler, 1993). This report addresses the lack of
representation in research and funding of the aged. There
are four priorities in the area of aging: (1) learning how
best to maximize elderly people's productivity at work, (2)
developing mental health assessment and treatment strategies
to enhance vitality, (3) learning how to change older

25
people's health behavior, and (4) increasing research on how
to optimize the functioning of those over age 75. This
report is being used by Congress to address the growing
needs of the elderly. Grant (1996) is urging professionals
that work with the elderly population to make a concerted
effort to confront ageism in society as a whole in a very
active manner. Perhaps the need to write an article
addressing the "effects" ageism has on health care speaks
for the prevailing problems.
Discrimination in Health Care
The issue of health care in our country has been both a
public issue as well as political. The attitudes of health
care providers or professionals toward the geriatric
population affects the quality of care they receive,
according to numerous findings in recent publications
(Kenyon, 1992; Belgrave, et. al., 1982: Coccaro & Miles,
1984; Coe, Miller, & Prendergast, 1982: Jarvik et. al.,
1981; Levenson, Thornby, & Tollett, 1980) . It is alarming
to note that numerous researchers have found health care
workers in general, have negative attitudes toward the
elderly. These negative attitudes tend to focus on
perceived deterioration, rigidity, dependence, and
resistance to treatment in the elderly population. Jarvik
et. al. (1981) suggests that the physicians' negative
attitudes result from the chronic conditions found in the
aged that can be treated but not actually cured. Butler

26
(1969b) describes "medical ageism" with it's roots ascending
from medical school. The use of terms like; "crock" -
originally applying to patients with no organic basis for
disease thought to be hypochondriacal-applied to middle-aged
women and older persons, "gomer" ("get out of my emergency
room"); "vegetable"; and "gork" (God only really knows" the
basis of this persons's many symptoms). The medical schools
enhance this "virus" routinely with it's general procedures.
The first older person that the medical students encounters
is a cadaver. These young people, fresh out of college are
confronted with death and their own personal anxieties about
the death experience, yet no group or individual counseling
is provided them. Shortly after, they are exhausted with
sleeplessness and hostility for not learning everything fast
enough; by the time they are in their third or fourth year
of medical school, they are ripe from cynicism. Next, is
the internship, where they are working in excess of eighty
hours per week, up in the middle of the night, dragging
themselves in to see one more "gork" (Butler, 1969b). Few
medical school graduates enter the field of geriatrics. On
the whole, physicians do not invest the same amount of time
in dealing with the elderly patients as they do their
younger ones. "Doctors question why they should even bother
treating certain problems of the aged; after all, the
patients are old. The problems are irreversible,
unexciting, and unprofitable" (Butler, 1969b).

27
Studies attempting to assess medical students'
attitudes toward the elderly have been somewhat ambiguous.
There is some indications that students adopt the attitude
of their role models, viewing the care of the elderly as
frustrating (Green, Keith, & Pawlson, 1983), and are
uncomfortable asking elderly patients about their feelings
(Prendergast et. al., 1984). The issue of health care is
examined by Callahan, who proposed an elaborate and
extensive proposal that as a society health care has to be
rationed. He uses the rationing of health care to be done
on the basis of old age, that is, to withhold high-
technology health care designed principally to extend the
lives of persons once they reach a certain chronological
age, estimating age 80 years, (Callahan, 1987: Callahan,
1990, Levinsky, 1990). There appears to be evidence in our
literature that indicates that implicit age-based
rationing is already the norm for certain medical
technologies in the United States (Kilner, 1988: Fuchs,
1984: Schitovsky, 1984) as well as existing in other
countries (Aciron & Schwartz, 1984) . Supporters of such a
policy that limits medical care for those over a certain
designated age argue: (1) that the old have obligations to
the young that necessitate that they relinquish demand for
expensive health care at the end of life; (2) that society
overall should expend fewer resources on the elderly in
order to have greater resources to expend on the welfare of

28
children; (3) that the old can find meaning in old age by-
returning to the acceptance of death common in earlier
times; (4) that withholding care from the old is acceptable
because death is not premature, e.g., the old have already-
had the opportunity to live a natural life span; and (5)
that if health care has to be rationed, it is more fair to
ration by age, since age is a criterion that affects all
persons equally (Zweibel, Cassel, & Karrison, 1993).
Discrimination in Employment
In society, employability is often seen as a primary-
measure of one's ability to contribute meaningfully to
society and also serves as a source of self-identity and
self-esteem (Moody, 1988). Botwinck (1984) reviewed the
literature on the effects of ageism on employment. It was
found that although age was not an important factor in the
evaluation of work competence, "older age" was given as one
of the reasons for the evaluation of a poor applicant if the
person was not hired. It was discovered that when a younger
applicant was not hired, lack of effort or inability was
typically given as the reason for rejection.
Snyder and Barrett (1988) reviewed 272 federal court
cases that dealt with age discrimination and employment,
filed between 1970 and 1986. The analysis of the outcomes
found that 65 percent were decided in favor of the employer.
Upon further analysis the researchers found numerous
problems associated with how these decisions were reached.

29
First, there were frequent use of generalities about the
differences between older and younger worker's abilities,
despite the fact that there was no documentation of
supportive evidence of consistent group differences in
actual job performance. Often, neither the employers nor
the expert witnesses were asked for specific evidence
concerning the plaintiff's actual physical capabilities and
the specific job requirements. Second, the variability of
decreased physical strength and fitness with age was
frequently not addressed. Third, the consideration of
possibly redesigning the work place to accommodate older
employees was often not considered.
Bodily (1991) surveyed inactive nurses to find out why
they were not working. Many of the respondents cited their
age as the major reason for not being able to work. The
biggest concern that Bodily expressed was the ease in which
acceptance for work exclusion due primarily to age was
expressed consistently, exemplifying how societal attitudes
can affect not only how elderly people are perceived, but
also how they view themselves. "Negative stereotyping in
society can lead to viewing elderly people in a depreciatory
manner and as less valuable members of society" (Grant,
1996). Elderly people who adopt these aging myths may see
decline as inevitable and comply (Rodin, 1980). With the
compliance to stereotypes, comes reinforcement of acceptance
of the misconceptions (Butler, 1987).
30
"Ageism affects relations between people; it makes a
difference to our daily lives. It is oppressive and
limiting" (Laws, 1995).
Summary
Chapter Two is a review of the literature that relates
to the subject of ageism. The review began by addressing
the term ageism. This overview demonstrated the diverse
nature of the problems associated with ageism. From the
literature it is obvious that the scope of this social
problem is a complex issue and that no single factor is
adequate to explain the entire social phenomena related to
ageism.

CHAPTER III
THEORETICAL FRAMEWORK
Introduction
This chapter will focus on the theoretical frame of
reference which served to guide this research. Key concepts
and basic terms that are used in the study are defined and
the major hypothetical propositions which were tested are
presented.
Theoretical Framework of the Study
Individuals live in a symbolic world in which they
determine the meanings of objects through interaction with
others. The term "symbolic interaction" refers to the
distinctive character of interaction as it takes place
between human beings. Humans beings interpret or define
each other's actions instead of merely reacting to each
other's actions. Their response is not made directly to the
actions of one another, but instead is based on the meaning
which they attach to these actions.
Thus, human interaction is mediated by the use of
symbols, by interpretation, or by ascertaining the
gathered meaning of another's actions (Blumer, 1969) .
Several symbolic interactionists (Blumer, 1969; Manis, 1978;
Rose, 1962) have enumerated the basic assumptions of this
theory. There are seven basic elements: (1) Humans live in
31

32
a symbolic world of learned meanings. (2) Symbols arise in
the social process and are shared; (3) Symbols have
motivational significance; meanings and symbols allow
individuals to carry out distinctively human action and
interaction; (4) The mind is a functional, volitional,
teleological entity serving the interests of the individual.
Humans, unlike the lower animals, are endowed with the
capacity for thought; The capacity for thought is shaped by
social interaction; (5) The self is a social construct; just
as individuals are born mindless, so too, are they born
selfless; our selves arise in social interaction with
others; (6) Society is a linguistic or symbolic construct
arising out of the social process; it consists of
individuals interacting. (7) Sympathetic introspection is a
mandatory mode of inquiry (Herman, 1995).
Humans live in a symbolic world of learned meanings.
We begin at birth through our interactions to develop an
understanding of our world through our learned meanings of
the symbols we experience. We develop the understanding
that our parents smiles mean pleasure. Through our
continued interaction and shared meaning, we begin to
emulate the expression of the symbol through our
interactions in society. Symbols arise in the social
process and are shared. The symbol of smiling is achieved
through our interaction and it's meaning develops with it's
continuation of exposure. We interact with others and

33
various symbols arise and through the interaction meaning of
the symbols are established. Symbols have motivational
significance; meanings and symbols allow individuals to
carry out distinctively human action and interaction. In
order to interact successfully and be understood the shared
meanings of the symbols is vital.
The mind is a functional, volitional, teleological
entity serving the interests of the individual. The mind
allows us to explore variations of symbols with an endless
range. The mind allows individuals to continue the
development of ourselves and our societal understanding of
successful interaction.
The self is a social construct; just as individuals are
born mindless, so too, are they born selfless; our selves
arise in social interaction with others. We develop our
selves through our interactions with others and the shared
meaning that we develop as a result of these interactions.
Society constructs the individual through the meaning of the
symbols of interaction.
Society is a linguistic or symbolic construct arising
out of the social process; it consists of individuals
interacting. The language or the symbols that we construct
arise out of the social process of interaction. As the
linguistic or symbolic meanings change through our social
process, our interaction will reflect these changes.
Sympathetic introspection is a mandatory mode of

34
inquiry (Herman, 1995). The awareness of the meaning of the
symbols in our interaction affects the social interaction.
Individuals pursue the route of sympathetic introspection
for successful societal interaction. To gain a clear
understanding, an introspective analysis is continuously
examined through our interaction in society.
Social meanings are conceived as social products
arising through the defining acts of individuals as they
engage in social interaction. Social products may, in
return, exert influences upon them. These socially created
and socially shared meanings function in determining the
behavior of individuals (Herman, 1995).
The self is one object whose meaning is socially
determined (Quadagno, 1996). Symbolic interactionism
emphasizes the dynamic and meaningful processes of social
interaction (Blumer, 1969; Mead, 1934). "Symbolic
interaction, as a distinctive perspective in social
psychology, focuses on the nature of human social
interaction" (Herman, 1995). Symbolic interactionists view
humans as self-conscious beings; individuals possess selves
and minds, which although absent at birth, originate as a
consequence of their participation in society (Herman,
1995). From this perspective, individuals develop a sense
of self through interpreting others' responses to their
behavior. The interaction is ongoing and social order is
contingent on the shared meanings that develop. As people

35
grow older, their sense of self-worth, is shaped by-
evaluations others hold about the nature of aging. Some of
these evaluations may be based on fact, but much of what we
understand as characteristic of aging is fundamentally based
on stereotypes (Quadagno, 1996). For the purpose of
research, there have been instruments devised to measure how
stereotypes affect attitudes toward elderly people. In one
study, pictures of the same man at age 25, 52, and 73 were
shown to college students. The students rated the 73 year-
old man significantly more negatively on a number of
dimensions than the younger men (Levin, 1988) . There have
been "quizzes" developed to try to identify what facts and
myths people "know" about the elderly in society (Palmore,
1977) . These quizzes demonstrate that many people hold
erroneous ideas about the elderly. People believe that most
older people in society experience a high degree of social
isolation, that people who are old tend to be poor, and that
few older people are interested in sex. These are examples
of stereotypes that are untrue for the majority of the aged
population. Walter Lippman (1922) states that ageism is
more than a tendency to discriminate, it also consists of
"pictures in our heads" (Lippman, 1922). We develop these
pictures through our interactions and shared meanings with
others in society.
Explanation of Model
Following these propositions of symbolic interationism

36
theory, symbolic interactionism became the basis of the
theoretical framework for this study, and has served as the
foundation for the development of the model in this section,
the hypotheses and the operationalization of concepts and
variables that were tested. Our interaction in groups,
intervened by selective variables are factors that affect
our attitudes about the aged and/or the aging process.
The examination of the term "group" in the sociological
sense, has the following characteristics: (1) its members
are linked by a distinctive set of relationships; (2) they
are interdependent; (3) they feel that the behavior of each
is relevant to the others; and (4) they share a sense of
togetherness, a "we" feeling. Groups may vary in size, in
the intensity of their bonds, and in stability over time,
but all groups share two elements; mutual awareness of and
responsiveness to the other members of the group.
We primarily interact in groups which are similar to
ourselves and reflect a homogeneous format in which our
attitudes about aging and the aging process begin to
formulate. These attitudes are tested with interaction
within groups. Numerous intervening factors may intervene
in this process, thus allowing continuation of development
of attitudes toward the aged and the aging process, or may
alter the formation of attitude. Finally leading to the
development of attitude toward the aged and the aging
process.

37
FIGURE 1
THEORETICAL MODEL
INTERACTION IN
KNOWLEDGE
AGE
EDUCATION
SEX
EXPERIENCE
PERSONAL
ATTITUDES
AGED/AGING
ABOUT
INTERVENING
VARIABLES

38
Hypotheses
1. The younger the respondent, the more negative the
response toward older individuals.
Hypothesis number one is based on the assumption that
with maturation will come understanding and increased
acceptance for the aged.
2. The more knowledge a respondent has about the aging
process, the less likely the respondent is to respond in a
negative manner to the aged.
Hypothesis number two is based on the assumption that
our knowledge affects our attitudes. The more knowledge the
respondent has about aging, the less likely the respondent
is to have negative responses toward the aged.
3. The higher the level of reported educational
achievement of respondents' mother, the less likely to
respond in a negative manner toward older persons.
Hypothesis number three is based on the assumption that
the education level of the mother will affect the students'
attitude toward the older student. The expectations are
that the higher achievement of education, the less likely
the student is to exhibit negative attitudes toward older
persons.
4. The higher the level of reported educational
achievement of respondents' father, the less likely the
student is to respond in a negative manner to older persons.
Hypothesis number four is based on the assumption that

39
the education level of the father will affect the students'
attitude toward older individuals. The expectations are
that the higher achievement of education, the less likely it
is for negative attitudes to exist toward the aged.
5. The higher the level of reported educational
achievement of respondent, the less" likely respondent is to
respond in a negative manner to older students.
Hypothesis number five is based on the assumption that
the higher the education level, reported as student
classification, the less likely it is for negative attitudes
to be directed toward the aged.
6. Male students will respond in a more negative manner
toward older individuals than will female students.
Hypothesis number six is based on the assumption that
male students will be less nurturing and understanding of
the aged than will be the female students.
7. Students that have self-reported their education
major as being "Aging or Gerontology" will respond less
negatively toward the aged.
Hypothesis number seven is based on the assumption that
students that are pursuing an educational direction in the
area of "Aging" will respond to the aged in a less negative
manner than those students whose majors are not "Aging."
8. The more courses in Aging/Gerontology, the less
likely students will respond negatively to the aged.
Hypothesis number eight is based on the assumption that

40
the more interaction and exposure to correct information in
an educational setting toward aging, the less likely
students are to have a negative response to the aged.
9. Individuals that encounter predominantly positive
experiences with the aged will respond more positive toward
the aged.
Hypothesis number nine is based on the assumption that
the more positive the interaction between individuals and
the aged, the more positive an attitude toward the aged
emerges.
Specification of Variables
This section will identify and examine both the
dependent and the intervening variables.
Dependent Variable
Ageism is the dependent variable in this study. Ageism is a
dislike of aging and older people based on the belief that
aging makes people unattractive, unintelligent, asexual,
unemployable, and senile {Comfort, 1976). Ageism is defined
as any prejudice or discrimination against an age group
{Palmore, 1990) .
Intervening Variables
Nine intervening variables have been chosen for this
study:
1. Age of Respondent
2. Knowledge of aging
3. Education level of Mother

41
4 Education level of Father
5. Education level of Respondent
6. Sex of Respondent
7. Major area of study
8. Number of course work in "Aging"
9. Positive/Negative Experiences with aged individuals
Definition of Terms
Age- will be defined as the current age of respondent.
The respondent will be requested to report his or her
current age. The research instrument will question age
directly by asking respondent to report age.
Gender- will be defined as either male or female, and
will be self-reported on questionnaire.
Education- will be defined by respondent on self-
reporting questionnaire by requesting the classification of
the current student; freshman, sophomore, junior, senior,
and graduate student. Each will be presented for respondent
to circle appropriate classification.
Education level of Mother- The respondent will self-
report the level of educational achievement obtained by his
or her mother. The levels of; less than high school, high
school, some college, college degree, and
advanced/professional degree, will be presented and
respondent will be requested to circle the appropriate
level.
Education level of Father- The respondent will self-

42
report the level of educational achievement obtained by his
or her father. The levels of; less than high school, high
school, some college, college degree, and
advanced/professional degree, will be presented and
respondent will be requested to circle the appropriate
level.
Major Department- The respondent will self-report
whether or not their primary area of study is in the area of
Aging.
Aging Courses- The respondent will self-report the
number of courses in the area of aging they have completed.
Summary
This chapter focuses on the theoretical frame of
reference which served to guide this research. Key concepts
and basic terms that are used in the study are defined and
the major hypothetical propositions which were tested are
presented.

CHAPTER IV
METHODOLOGY
Introduction
This section will focus on the research methodology-
used in this study. It will begin with a restatement of the
problem and will continue with a description of the research
methods used to test certain major hypotheses relevant to
the stated purpose of the study.
The research variables used in the research will also
be operationalized. First, the operationalization of the
dependent variable for the sample will be described, and
then the intervening variables will be operationalized.
Techniques of Data Collection
A sample of college students was drawn in the following
manner. Numerous instructors at the University of North
Texas were contacted at random, general information
concerning the study was explained and permission to survey
their students was sought. The acceptance of the survey
into the classroom was determined either by the instructor
or, as in many situations, the students voted to allow
classroom participation time or not. This resulted in 254
voluntary student participants in this sample.
This particular university was located in a medium
sized metropolitan community with an approximate population
43

44
of 65,000 people. At the beginning of fall 1996 the
enrollment of students was 24,964. The student enrollment
for the summer of 1996 was divided into two short semesters,
summer I and summer II. Summer I had an enrollment of
11,505 students. Summer II had an enrollment of 9,105
students. A variety of departments participated in the
study, which include; Sociology, Psychology, Business,
Aging (Gerontology). The participating classes ranged from
introductory courses to graduate classes.
Research Design
The data were collected during the summer months during
1996, using self report questionnaire survey techniques. A
pre-test was conducted to establish the clarity of the
instrument and potential of findings. Based on the
examination of the pre-test findings, a determination to
continue data collection was made.
Description of Sample
This study investigated the effect educational
attainment and acquired knowledge of aging have on ageism.
Subsidiary questions addressed; age, sex, and
positive/negative experiences with aged individuals in
regard to possible effect on negative ageism.
This study utilized survey generated data (collected
during the summer of 1996). The data were gathered from a
university located in a north Texas city whose population is
approximately 65,000, with a student enrollment of about

45
27,000 during long semesters. Major questions of this study,
were developed from the theoretical framework of symbolic
interaction theory. Two major questions addressed are:
What are the factors that intervene between the interaction
in groups and the development of attitudes about aged/aging?
What is the relative strength of these factors?
Techniques of Data Analysis
Nine hypotheses were listed in Chapter Three which
emerged from the theoretical framework which guided this
research. The hypotheses were tested using Oneway Analysis
of Variance (ANOVA) procedures for hypotheses 1 through 9,
and in addition, Multiple Regression Analysis was used for
hypothesis number 9.
The first section, "The Facts on Aging Quiz" is a
questionnaire that contains 25 questions that address the
respondent's knowledge about aging. Each of the questions
weighed 4 pts each. The closer the score to 100 percent,
the more knowledge of aging or the aged is presumed.
The second section consists of items consisting of both
positive and negative attitudes toward the aged. The items
alternate between negative and positive, and responses range
on a scale ranging from possible responses; "strongly
disagree, disagree, slightly disagree, slightly agree,
agree, strongly agree" (see Table 1). Each item was
assigned a number and responses categories were scored 1, 2,
3, 4, 5, 6. The scale is in two separate parts, one is a

46
negative attitudinal direction, the other scale is a
positive attitudinal direction. Thus on the negative scale,
the higher the score the more negative the attitude toward
the aged, the lower the score the more positive the attitude
toward the aged. The higher the score on the positive
scale, the more positive the attitude toward the aged, the
lower the score the more negative the attitude toward the
aged. Each attitude item was assigned a value of 3, with a
maximum score possible of 104 for each attitude direction of
negative and positive. The negative scale was used to
reflect the hypotheses in analyzing hypotheses 1 through 8.
The positive attitude scale was used to reflect the
hypothesis in analyzing hypothesis number 9. The negative
scale is divided into intervals of 1, 2, 3, representing a
score of 1= 0 to 34, very positive, 2= 35 to 68, negative,
and 3= 69 to 102, very negative. The positive scale was
divided into intervals of 1, 2, 3, with 1= 0 to 34 is a very
negative attitude, 2= 35 to 68 is a positive attitude, 3 =
69 to 102 is a very positive attitude.

47
Table 1
Negative Attitude Scale
Original coding Alpha=.89 l=Strongly Disagree, 2=Disagree, 3=Slightly Disagree, 4=Slightly Agree, 5=Agree, 6=Strongly Agree.
Negative Statements: 1. It would probably be better if most old people lived in
residential units with people their own age. 2. There is something different about most older people;
it's hard to figure out what makes them tick. 3. Most old people get set in their ways and are unable to
change. 4. Most old people would prefer to quit work as soon as
pensions or their children can support them. 5. Most old people tend to let their homes become shabby
and unattractive. 6. It is foolish to claim that wisdom comes with old age. 7. Old people have too much power in business and politics. 8. Most old people make one feel ill at ease. 9. Most old people bore others by their insistence on
talking about the "good old days." 10. Most old people spend too much time prying into the
affairs of others and in giving unsought advice. 11. If old people expect to be liked, their first step is to
try to get rid of their irritating faults. 12. In order to maintain a nice residential neighborhood, it
would be best if too many old people did not live in it. 13. There are a few exceptions, but in general most old
people are pretty much alike. 14. Most old people should be more concerned with their
personal appearance, they're too untidy. 15. Most old people are irritable, grouchy, and unpleasant. 16. Most old people are constantly complaining about the
behavior of the younger generation. 17. Most old people make excessive demands for love and
reassurance.

48
Table 1 cont.
Positive Attitude Scale
Alpha=.85 1= Strongly Disagree, 2=Disagree, 3=Slightly Disagree, 4=Slightly Agree, 5=Agree, 6=Strongly Agree.
Positive Statements:
1. It would probably be better if most old people lived in residential units that also housed younger people.
2. Most old people are really no different from anybody else: they're as easy to understand as younger people.
3. Most old people are capable of new adjustments when the situation demands it.
4. Most old people would prefer to continue working just as long as they possibly can rather than be dependent on anybody.
5. Most old people can generally be counted on to maintain a clean, attractive home.
6. People grow wiser with the coming of old age. 7. Old people have too little power in business and
politics. 8. Most old people are very relaxing to be with. 9. One of the most interesting qualities of old people is
their accounts of their past experiences. 10. Most old people respect others' privacy and give advice
only when asked. 11. When you think about it, old people have the same faults
as anybody else. 12. You can count on finding a nice residential neighborhood
when there is a sizeable number of old people living in it.
13. It is evident that most old people are very different from one another.
14. Most old people seem to be quite clean and neat in their personal appearance.
15. Most old people are cheerful, agreeable, and good humored.
16. One seldom hears old people complaining about the behavior of the younger generation.
17. Most old people need no more love and reassurance than anyone else.
The third section consists of self-reported information
about the respondent used for this study were ; age, major
area of study, courses in Gerontology, personal experience

49
with the aged, school classification, parental education.
The range of the ages of the respondents were from age 19 to
age 61. Age was represented in survey question 60 and
recoded to represent group 1= 19 to 25 years of age, group
2= 2 6 to 31 years of age, and group 3= above age 31 years.
Major area of study was represented by 1= Gerontology major,
and 2= Non-Gerontology major. Personal experience with the
aged were represented by survey questions; 64, 67, 68.
Courses in Gerontology were represented by question 62.
School classification was represented by survey question 71.
Parental education was represented by survey questions 73
and 7 4.
Survey researchers often find that a given dependent
variable is affected simultaneously by several independent
variables. Multiple regression analysis provides a means of
analyzing this situation in testing the weight of the
intervening variables and was used in analyzing the three
intervening variables associated with hypothesis number
nine; experience, interaction, and outcome (Babbie, 1990) .
Instrument
The instrument chosen for use in this study is a self-
reporting questionnaire. The questionnaire is divided into
three sections; the first section is "The Facts on Aging
Quiz" created by Erdman B. Palmore, the second section
consists of a series of questions that relate to our biases
concerning aging and the aged, the third section requests
50
self-reporting SES information.
Section I consists of twenty-five statements in which
the respondent is asked to evaluate and respond to each
statement with either a "T" for True or "F" for False. The
instrument was developed by Dr. Erdman B. Palmore in 1975 in
order to stimulate class discussions at Duke University
Medical Center and to cover the basic physical, mental, and
social facts and the most common misconceptions about aging.
"The Facts on Aging Quiz" has been used in well over 100
documented research studies since it's first publication
appeared in The Gerontoloqist in 1977. According to the
permissions editor at The Gerontoloqist, more requests have
been made for the reprint of "The Facts on Aging Quiz" than
any other article. There has even been a video-tape series
produced on the "Quiz" (Courtenay & Suhart 1980). It still
remains today the only published tests of knowledge about
aging that are both short and extensively documented.
Palmore selected twenty-five known users of the "Facts on
Aging Quiz," to compile a generalization of the findings
(Palmore, 1988).
The groups to whom the quiz was administered varied in
size and educational background. Size of the groups ranged
from 10 to 15 persons to larger groups of 250 to 300. The
most frequent application was to groups in sizes of 50 to
100 participants. Groups were most often made up of
undergraduate students (15), followed next by nurses, agency

51
staff personnel, and the general public (6 groups).
The mean scores on the quiz achieved by the various
groups ranged from a high of 66%, attained by nurses, to a
low score of 54% attained by the high-school students. The
mean score of all undergraduate groups is 56%, which is
lower than several other groups, including general public
groups, which had a mean score of 61%. A college faculty
group of home economics department members scored 62%, while
a group of high-school faculty scored 61%. Overall, the
reported means scores from the various applications were not
impressive, when one takes in consideration that a 50% score
can be attributed to chance factors alone.
Some of the major findings of the studies using the
"Facts on Aging Quiz," were:
1. The average person with a high-school education has
almost as many misconceptions as correct items of
information about aging.
2. The average person with some college education has
misconceptions on about one-third of the items.
3. The average person with at least a college-level
course in gerontology gets over 80% of the items correct.
4. The most frequent misconceptions, with a majority of
respondents not knowing the correct answer, include three
psychological items numbers; 11, 16, and 24; and four
socioeconomic items; 7, 19 21 and 23.
5. The average person tends to have more anti-aged bias

52
than pro-aged bias.
6. Bias toward the aged is associated with lack of
knowledge about the aged.
7. The quiz can measure learning about aging.
8. Both knowledge levels and the most frequent
misconceptions tend to be similar in all the countries
studied.
9. Knowledge level tend to be similar in all age, sex,
and racial groups. The only variables consistently related
to knowledge levels are education and attitudes toward the
aged.
10. Intergroup and test-retest reliability on the quiz
is relatively high.
In contrast to the extensive use of Palmore's "Facts on
Aging Quiz," statistical analysis is confined to the
calculations of a mean score. Palmore's direction was in
establishing a mean for comparison of different groups and
their knowledge of the aged and the aging process, which is
well noted throughout his documentation of findings
(Palmore, 1988) .
The most statistically documented use of this
instrument was conducted by Carmel, ET AL, in 1992. This
study evaluated short and long term effects of courses in
gerontology and geriatrics on changes in knowledge,
attitudes, and work preferences among medical, nursing, and
social work students in Israel. The comparisons among group

53
scores were tested by t-test and by Duncan's multiple range
test. Pearson Correlation Coefficients were calculated to
assess relationships among scores on knowledge, attitudes,
and work preferences within each of the studied groups.
The results showed that nursing and social work students
increased their knowledge measured by Palmore's "Facts on
Aging Quiz." No significant changes were found in the level
of knowledge of medical students and in the attitudes and
work preferences of any of the studied groups. No
correlation was found among knowledge, attitudes, and work
preferences within each of the three groups, which implies
that increases in knowledge about the elderly does not
necessarily lead to changes in negative attitudes and work
preferences. Gerontology course(s) did have a positive
effect among nursing students in the short run (t test=
p<_.05) and among social work students in the long run
(Duncan's multiple range test= p<_.05).
This instrument was used to measure and compare levels
of knowledge and most frequent misconceptions in different
groups. Such comparisons are useful in aiding the
development of understanding of the
causes of ignorance and prejudice toward the aged. These
comparisons can also be helpful in determining which groups
are most in need of information to correct their
misconceptions about the aged and the aging process
(Palmore, 1988).

54
Palmore gives account for each question with the
following documentation (with some updated current
literature and findings to add further support):
Question number one is "false." The majority of
people aged 65 and over are not senile; that is, they do not
have defective memory, nor are they disoriented or demented.
Only an estimated 2% of persons aged 65 or over are
institutionalized with a primary diagnosis of psychiatric
illness (George, 1984). Community studies of
psychopathology among the aged agree that less than 10% have
significant or severe mental illness and another 10% to 32%
have mild to moderate mental impairment; but the majority
are without impairment (Blazer, 1980).
Question number two is "true." All five senses do.tend
to decline in old age. Most studies of taste and smell show
that the taste and odor sensitivity decreases with age.
Some of these decreases may be the result of other factors,
such as disease, drugs, and smoking (Schiffman, 1987).
Nearly all studies of touch, hearing, and vision agree that
these specific senses tend to decline in old age (Birren,
1977; Corso, 1987; Hoyer, 1987).
Question number three is "false." The majority of
persons past age 65 continue to have both interest in and
capacity for sexual relations. If was found by Masters and
Johnson (1966) that the capacity for.satisfying sexual
relations usually continues into the decades of the

55
seventies and eighties for healthy couples. The Duke
Longitudinal Studies (Palmore, 1981) found that sex
continues to play a very important role in the lives of the
majority of men and women through their seventies. Starr
and Weiner (1981) found that most aged individuals indicated
that sex after 60 was as satisfying or even more satisfying
than when they were younger.
Question number four is "true." Research indicates that
lung vital capacity tends to decline about 3 or 4 deciliters
per decade, regardless of whether measured longitudinally or
cross-sectionally (Kannel, 1982). This decline is even
greater for those who smoke.
Question number five is "false." The majority of old
people do not feel miserable most of the time. Studies of
happiness, morale, and life satisfaction either find no
significant difference by age group or find about one-fifth
to one-third of the aged score "low" on various happiness or
morale scales (Larson, 1978; Palmore, 1981). One study
found that only one-fourth of persons aged 65 or older
reporting that "This is the dreariest time of my life,"
while about half said "I am just as happy as when I was
younger," and one-third said "These are the best years of
my life" (Harris, 1981).
Question number six is "true." Physical strength does
tend to decline in old age. Physiological, biochemical,
anatomic, and histocytological measurements of muscle all

56
exhibit decreased levels with age from about thirty years of
age on. About one-third of the muscle mass is lost by age
80 (Tonna, 1987) .
Question number seven is "false." Only 5% of persons
aged 65 or over are residents of any long-stay institution
at any one time (E. Kahana, 1987). Only 9% of those aged
75 and over are residents of institutions. However, about
25% to 30% of the elderly spend time in a nursing home at
some point in their lifetimes.
Question number eight is "true." Drivers aged 65 and
over have fewer accident per drive than drivers under age
65. Older drivers have about the same accident rates per
100 as those drivers in middle-age. They have a much lower
rate than drivers under age 30 (National Safety Council
1981). If has been found that older drivers tend to drive
less miles per year and apparently compensate for declines
in perception, as well as reaction speed by driving more
carefully (Hogue, 1980).
Question number nine is "false." The majority of older
workers can work as effectively as younger workers. Despite
declines in perception and reaction speed under laboratory
conditions among the general aged population, studies of
employed older persons under actual working conditions
generally show that they perform as well as, if not better
than younger workers on most measures (Krauss, 1987; Riley,
1968). When speed and accuracy of movement are important to

57
the job, some studies indicate decline with age (Rhodes,
1983). If has been found that intellectual performance, on
which much of work performance depends, does not show
decline until the seventies in most individuals and even
later in others (Labouvie-Vief, 1985). The consistency of
output tends to increase with age, and older workers have
less job turnover, fewer accidents, and less absenteeism
than do younger workers (Riley, 1968).
Question number ten is "true." About 78% of the aged
are healthy enough to engage in their normal activities.
About 5% of those 65 years of age and over are institution-
alized and another 17% among the non-institutionalized say
they are unable to engage in their major activity (such as
work or housework) due to chronic conditions (National
Center for Health Statistics, 1981). About 81% of the non-
institutionalized elderly have no limitation in their
activities of daily living; eating, bathing, dressing,
toileting, and so forth (Soldo, 1983).
Question number eleven is "false." The majority of
older persons are able to adapt to change. It is obvious
and clear that most older persons do adapt and change to the
many changes that occur in old age, such as retirement,
children leaving home, widowhood, moving to new homes, and
serious illness. The political and social attitudes of the
aged also tend to shift with the rest of society with
approximately the same rate of change (Cutler, 1987).

58
Question number twelve is "true." Older people do
tend to take longer to learn something new, compared with
their own performances when they were younger or with
performances of a younger cohort {Poon, 1987). However age
may not be the only variable of explanation; illness,
motivation, learning style, lack of practice needs to -also
be considered. When these other variables are taken into
account, chronological age does not provide a significant
amount of influence on learning ability.
Question number thirteen is "false." It is not
impossible for the average old person to learn new things.
Studies show that most older people can eventually learn new
things about as well as younger persons, if given enough
time and repetitions of the material to be learned (Poon,
1987).
Question number fourteen is "true." The reaction time
of most older persons tends to be slower than that of
younger people. This appears to be true regardless of the
kind of reaction that is measured (krauss, 1987). However,
the increased reaction time in the usual experiment is only
a small fraction of a second, which does not prevent
adequate performance in most ordinary activities.
Question number fifteen is "false." Old people, like
any other group of people in society are not pretty much
alike. There is at least as much variation among older
people as there is at any age; there are the rich and poor,

59
happy and sad, healthy and ill, and those of high and low
intelligence. In fact, some evidence indicates that as
people age they tend to become less alike and more
heterogeneous on many dimensions (Maddox, 1974).
Question number sixteen is "true." The majority of old
people do say they are seldom bored. Only 21% say that
"Most of the things I do are boring or monotonous" (Harris,
1981), and only 17% say that "not enough to do to keep busy"
is a problem for them (Harris, 1975). The Duke Second
Longitudinal Study of Aging (Palmore, 1981) indicated that
87% said that they had not been bored in the past week.
Question number seventeen is "false." The majority of
old people are not socially isolated. According to the U.S.
Bureau of Census,(1983) about two-third live with their
spouse or family. Only about 4% of the elderly are
extremely isolated and most of these have had lifelong
histories of withdrawal (Kahana, 1987). It has been found
that most elders have close relatives within easy visiting
distance, and contacts between them are relatively frequent
(Binstock, 1976).
Question number eighteen is "true." Older worker do
tend to have fewer accidents than do younger worker (Root,
1981), it may be because they tend to avoid dangerous
situations and hazardous jobs (Krauss, 1987) . A study of
manufacturing workers found that those aged 65 years old and
over had about one-half the rate of non-disabling injuries

60
as those under 65 years of age, and also substantially lower
rates of disabling injuries (Kossoris, 1948).
Question number nineteen is "false." The number of
persons 65 years of age and over doubled between 1960 and
1990, going from 16.7 million to 31.2 million or from 9.2 to
12.6 percent of the population (Aday, 1993). The-number is
expected to increase to nearly forty million or 14 percent
by the year 2010 (Aday, 1993), and may reach 21% by the year
2030 (U.S.Bureau of the Census, 1984).
Question number twenty is "true." The majority of
medical practitioners do tend to give low priority to the
aged. All studies of attitudes toward the aged among
medical and human service professionals agree that they tend
to believe the negative stereotypes about the aged and
prefer to work with younger adults or children rather than
to work with the aged (Quinn, 1987). There are few that
specialize in geriatrics and the interest is specializing in
this area is low. The aged are labeled resistant to
treatment, rigid in outlook, senile, unreliable, and unable
to learn new things or to change their ways.
Question number twenty-one is "false." The majority of
persons aged 65 and older have incomes well above the
poverty level. In 1984 only 12.4% had incomes below the
official poverty level. This was a lower poverty rate than
for persons under 65 years of age. The near poor are
included, the total in or near poverty was only 29% (U.S.

61
Senate Special Committee on Aging, 1986).
Question number twenty-two is "true." Over three-
fourths of old people are working or would like to have some
kind of work to do (this includes housework and volunteer
work). About 7% of persons 65 years of age and older are
employed, 21% are retired, but say they would like to be
employed, 17% work as homemakers, 19% are not employed but
do volunteer work, and another 9% are not employed or doing
volunteer work but would like to do volunteer work (Harris,
1975, 1981).
Question number twenty-three is "false." Older people
do not tend to become more religious as they age. While it
is true that the present generation of older persons tends
to be more religious than the younger generations, this
appears to be a generational difference due to the older
persons' more religious upbringing, rather than an effect of
aging. Basically, members of the present older generation
have been more religious all their lives, rather than
becoming more religious as they aged (Blazer, 1976;
Markides, 1987).
Question number twenty-four is "true." The majority of
old people do say they are seldom irritated or angry. The
Duke Second Longitudinal Study (Palmore, 1981) found that
90% of persons aged 65 or older said that they were never
angry during the past week. About three-fourth of the aged
in the Kansas City Study said they were never or hardly ever
62
angry (Deal, 1962).
Question number twenty-five is "false." The health and
economic status of old people (compared to younger people)
in the year 2000 is expected to improve. Measure of health,
income, occupation, and education among older people are all
rising in comparison to those of younger people. The gaps
between older and younger people on these dimensions will
probably be substantially less (Palmore, 1976, 1986) . This
reduction in gaps is due to the many improvements in health,
income, occupation, and education among the younger cohorts
moving into the 65 and older age category.
Section II Consists of 17 positive and negative
statements concerning the aged. This scale, "Old People
Scale" (OP) was designed by Kogan in 1961 to measure
attitudes toward old people with respect to norms and
individual differences. Items are concerned with such
things as the residential aspect of old people's lives,
vague feelings of discomfort and tension in the presence of
old people, qualities of old people, and interpersonal
relationship across age generations. The set of items
expressing negative sentiments about old people was
constructed, and then the set of positive items was
formulated in such a way that the content was the reverse of
the negative ones.
Kogan administered this scale to introductory
psychology students from Northeastern University (two male

63
samples, Ns = 128 and 186) and Boston University (N= 168, 87
males and 81 females). Kogan reports a "high degree of
consistency among the sample means." A test for the
statistical significance of these overall means differences
yields t's significant beyond the .01 level for each of the
samples. The variable of sex showed no significant
differences in this particular study. Reliability
coefficients and interscale correlations range from .66 to
.85. Kogan reports "a greater reliability for the OP- as
opposed to the OP+ scale, but falls short of an acceptable
reliability level."
Product-moment coefficients between positively and
negatively worded scales are uniformly positive. The r's
between OP+ and OP- range from .46 to .52 in the three
samples, all significant beyond the .01 level. "Given
correlations that can theoretically range from +1.00
(perfect logical consistency) to -1.00 (perfect logical
inconsistency) , content must necessarily be a more powerful
influence than response set for the OP items of the present
battery" (Kogan, 1961). This scale was found to "have,
reasonably good content validity" (Shaw, 1967).
Reliability Analysis (ALPHA) was conducted for both the
knowledge scale and attitude scales. The knowledge scale
was found to have a moderately strong reliability with Alpha
at .5500. The attitude scales were tested separately,
positive and negative, as well a total combined scale of

64
positive and negative statements. The positive attitude
scale was found to have a moderately strong reliability with
Alpha at .8456. The negative attitude scales not recoded
was found to have a strong reliability with Alpha at .8889.
The total combined scale of positive and negative statements
were found to have a very strong reliability with Alpha at
.9201. The negative attitude scale with the items recoded
to reverse the scores was found to have a strong reliability
with Alpha at .8508. The total overall attitude scale based
on the positive and reversed negative scores reflect a
strong reliability in a negative direction with Alpha at -
.81. The reliability of the attitude scale was found to
have a strong reliability.
Section III contains several items pertaining to the
individual respondent's background. There are fifteen items
in this section that requires the respondent to complete.
Item number 1 asks the respondent's "age." Item number 2
asks the respondent "Is your major area of study gerontology
(aging)?" Item number 3 asks the respondent "How many
courses in Aging have you completed?" Item number 4 asks
the respondent to "check any and all courses from a list of
courses in Aging which they have completed." A space is
provided for the student to add any possible "Aging" courses
that the student may have completed that does not appear on
the list. Item number 5 asks the respondent to indicate as
to whether or not "In your experience have you known aged
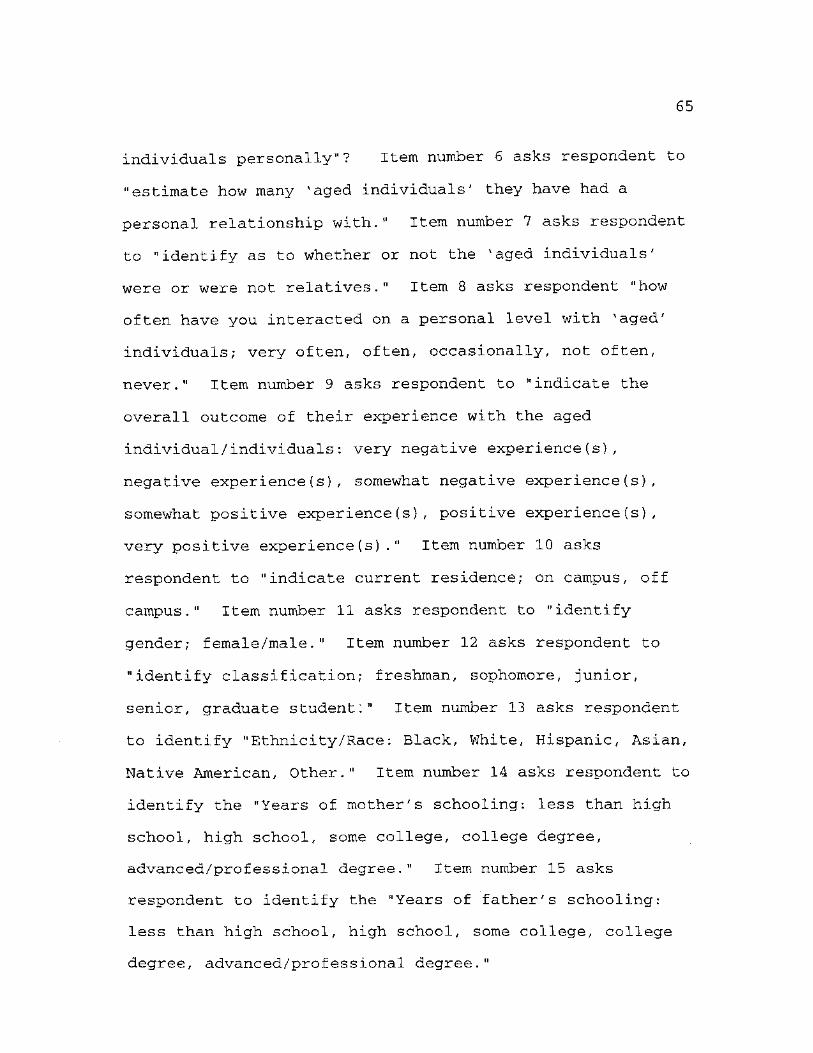
65
individuals personally"? Item number 6 asks respondent to
"estimate how many 'aged individuals' they have had a
personal relationship with." Item number 7 asks respondent
to "identify as to whether or not the 4aged individuals'
were or were not relatives." Item 8 asks respondent "how
often have you interacted on a personal level with 'aged'
individuals; very often, often, occasionally, not often,
never." Item number 9 asks respondent to "indicate the
overall outcome of their experience with the aged
individual/individuals: very negative experience(s),
negative experience(s), somewhat negative experience(s),
somewhat positive experience(s), positive experience(s),
very positive experience(s)." Item number 10 asks
respondent to "indicate current residence; on campus, off
campus." Item number 11 asks respondent to "identify
gender; female/male." Item number 12 asks respondent to
"identify classification; freshman, sophomore, junior,
senior, graduate student:" Item number 13 asks respondent
to identify "Ethnicity/Race: Black, White, Hispanic, Asian,
Native American, Other." Item number 14 asks respondent to
identify the "Years of mother's schooling: less than high
school, high school, some college, college degree,
advanced/professional degree." Item number 15 asks
respondent to identify the "Years of father's schooling:
less than high school, high school, some college, college
degree, advanced/professional degree."

66
Summary
This chapter contains the sample, techniques of data
collection, research design, and techniques of data
analysis. This chapter also contains a detailed description
of the instrument.

CHAPTER V
DATA ANALYSIS AND DISCUSSION OF FINDINGS
Introduction
This chapter contains a discussion of the data analysis
procedures and tests of hypotheses. Each hypothesis is
individually examined and a discussion of the findings will
be presented. The failure to reject or failure to accept
each hypothesis will be qualified.
Description of Sample
The sampling procedure produced a total sample size of
254. Table 2 provides an overview of frequency
distributions and valid percentages according to each
Variable. The discussion that follows are based on the
findings demonstrated in Table 1. The sample is broken down
by sex (see Table 2). The sample findings indicate that 115
or 45.3 percent of the sample are male students and 137 or
53.9 percent of the sample are female.
The age distribution of the respondents in this sample
range from age 19 to age 61, with a mean of 25.4498, the
median age was found to be 23.000, with a standard deviation
of 6.6677. The number of valid cases were 249.0 with 5.0
missing cases (2 percent).
The respondent's school classification was categorized
as; freshman, sophomore, junior, senior, and graduate
67

68
student (see Table 2). The findings indicate that 2 (.8
percent) of the respondents were freshman, 4 (1.6 percent)
of the respondents were sophomore, 55 (21.7 percent) of the
respondents were juniors, 172 (67.7 percent) of the
respondents were seniors, and 17 (6.7 percent) of the
respondents were graduate students. There are 4 (1.6
percent) missing cases.
The sample is broken down by division of major areas of
study. The findings indicate that 10 (3.9 percent) of the
sample are gerontology or "Aging" majors. This sample
represents 10 percent of the aging majors at this
university. The sample findings indicate that 241 (94.9
percent) of this sample are not gerontology or Aging majors.
There are 3 (1.2 percent) missing cases.
The sample is broken down by the number of courses in
"Aging" the student has completed, ranging from 0 to 9. The
majority (136) of the students responded to this question
(53.5 percent of the sample population) reported having
completed no courses in aging. Twenty-one (8.3 percent)
students report completing one course in aging. Eight (3.1
percent) students report completing 2 courses in aging. Two
(.8 percent) students report completing 4 courses in aging.
One (.4 percent) student reports completing 5 courses in
aging. Three (1.2 percent) students report completing 6
courses in aging. One (.4 percent) student reports
completing 7 courses in aging. One (.4 percent) student

69
reports completing 9 courses in aging.
Respondents that reported having personal experience
with aged individuals resulted in the majority (245, 96.5
percent) indicated that in their personal experience they
had known aged individuals. Seven (2.8 percent) students
reported that they had not known aged individuals
personally; 81 (31.9 percent) of the students did not
respond to this question. Respondents were asked to
estimate the number of aged individuals with whom they have
had a personal relationship with. Three (1.2 percent)
respondents reported having no personal relationship with
aged individuals. Ninety-two (36.3 percent) respondents
reported having had a personal relationship with 1-5 aged
individuals. Eighty-seven (34.4 percent) of respondents
reported having had a personal relationship with 6-15 aged
individuals. Seventy-two (28.4 percent) respondents
reported having had a personal relationship with 16 to 99
aged individuals. There are 22 missing cases.
The frequency of interaction on a personal level with
aged individuals ranged from very often to never. Forty-
seven (18.5 percent) respondents report interacting on a
personal level with aged individuals very often. Ninety-nine
(39.0 percent) respondents report interacting often on a
personal level with aged individuals. Eighty-three (32.7
percent) respondents report interacting occasionally on a
personal level with aged individuals. Twenty-two (8.7

70
percent) respondents report interacting not often on a
personal level with aged individuals. No persons responded
as never interacting with aged individuals. There are 3
{1.2 percent) missing cases.
The respondents reported the relationship(s) with aged
individual^ s) as being relatives, not relatives or both.
One hundred and forty-one (55.1 percent) respondents report
their relationship(s) with aged individual(s) were
familial/ relative(s). Thirty-two {12.5 percent)
respondents reported their relationship(s) with aged
individual (s) as not being familial/relatives.- Seventy-
three (28.5 percent) respondents report their
relationship(s) with aged individuals consisted of both
familial/relatives and non-familial/relative. There are 10
(3.9 percent) missing cases.
The overall outcome of the respondent's experience
with the aged individual(s) range from very negative to very
positive. One (.4 percent) respondent reports their
experience(s) to be very negative. One (.4 percent)
respondent reports their experience(s) to be negative. Five
(2.0 percent) respondents reports their experience(s) to be
somewhat negative. Forty-five (17.9 percent) respondents
reports their experience(s) to be somewhat positive. One-
hundred and twenty-three (48.4 percent) respondents reports
their experience(s) to be positive. Seventy-six (29.9
percent) respondents reports their experience(s) to be very

71
positive. Three (1.2 percent) persons did not respond to
this question.
The respondent's mother's educational level ranges from
less than high school to advanced/professional degree.
Thirteen (5.1 percent) respondents report their mother's
education level to be less than high school-. Sixty-eight
(26.8 percent) respondents report their mother's education
level to be high school. Eighty-eight (34.6 percent)
respondents report their mother's educational achievement
level to include some college. Forty-nine (19.3 percent)
respondents report their mother's educational achievement
level to have college degrees. Twenty-seven (10.6 percent)
respondents report their mother's educational achievement
level to be advanced/professional degree obtained.
Nine persons (3.5 percent) did not respond to this question.
Respondents father's educational level ranges from less
than high school to advanced/professional degree. Fourteen
(5.5 percent) respondents report their father's educational
level to be less than high school. Fifty-eight (22.8
percent) respondents report their father's educational level
to be high school. Sixty-three (24.8 percent) respondents
report their father's educational level to include some
college. Seventy-seven (30.3 percent) respondents report
their father's educational level to have college degrees.
Thirty-two (12.6 percent) respondents report their father's
educational level to have advanced/professional degrees.

72
Ten individuals (3.9 percent) did not respond to this
question.
Table 2 Frequencies of Data
Variable Frequency (N) Valid Percentage
Gender Male Female Missing Cases
Total
115 137
2 254
45.3 53 .9
J3 100
Age 19 20 21 22 23 24 25 26 27 28 29 30 31
32-44 45-61 Missing Cases
Total
4 20 35 43 33 21 19 14 10 4 8 3 2
25 8
_5 254
1.6 8 . 0 14. 17 . 13 . 8.
7 . 5, 4. 1. 3 1
1 3 3 4 6 6 0 6 2 2 8
10.0 3.2
100.0
School Classification Freshman Sophomore Junior Senior Graduate Missing Cases
Total
2 4 55 172 17 4
254
1 21 67 6 1
8 6 7 7 .7 6
100
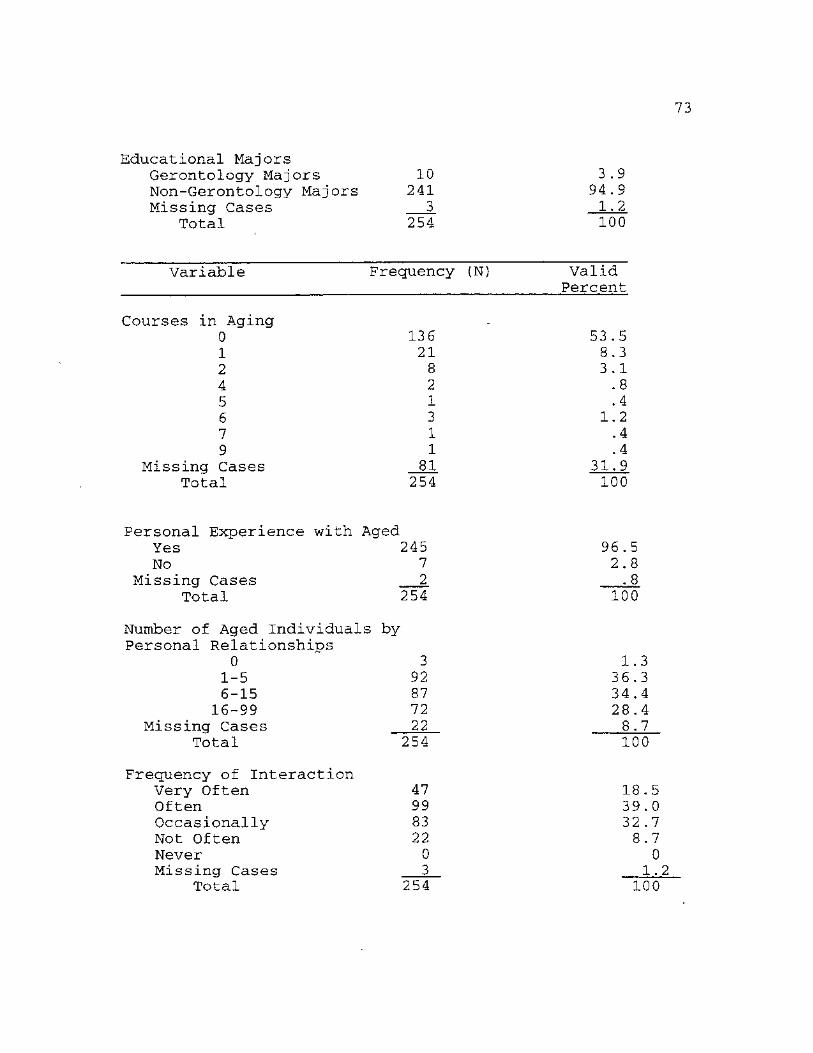
73
Educational Majors Gerontology Majors 10 3.9 Non-Gerontology Majors 241 94.9 Missing Cases 3 1.2
Total 254 100
Variable Frequency (N) Valid Percent
Courses in Aging 0 136 53 .5 1 21 8.3 2 8 3.1 4 2 .8 5 1 .4 6 3 1.2 7 1 .4 9 1 .4
Missing Cases 81 31.9 Total 254 100
Personal Experience with. Aged Yes 245 96.5 No 7 2.8
Missing Cases 2 .8 Total 254 100
Number of Aged Individuals by Personal Relationships
0 3 1.3 1-5 92 36.3 6-15 87 34.4 16-99 72 28.4
Missing Cases 22 8.7 Total 254 100
Frequency of Interaction Very Often 47 18.5 Often 99 39.0 Occasionally 83 32 .7 Not Often 22 8.7 Never 0 0 Missing Cases 3 1.2
Total 254 100

74
Familial/Non-Familial Relationship Familial 141 Non-Familial 32 Both Familial/ Non-Familial 73 Missing Cases 10
Total 256
Overall Outcome of Experience Very Negative 1 Negative 1 Somewhat Negative 5 Somewhat Positive 45 Positive 123 Very Positive 76 Missing Cases 3 Total 254
55 12
29 3 100
.4 ,4 ,0
,7 ,4 ,9 ,2
2 17 48 29 1
100.0
Variable
Parental Education Freq. Valid Freq. Valid
(N) Percent (N) Percent Father Mother
Less than High School 14 5.5 13 5.1 High School 58 22.8 68 26.8 Some College 63 24.8 88 34.6 College Degree 77 30.3 49 19.3 Advanced/Professional Degree 32 12.6 27 10.6 Missing Cases 10 3.9 9 3.5
Total 254 100 254 100
Hypotheses
Hypothesis one states that, the younger the respondent,
the more negative the response toward older individuals.
The overall findings of the study support this hypothesis.
An analysis of variance (ANOVA) was conducted to
determine the effect of age and negative attitude between

75
groups and within groups. One-hundred and sixty-seven
respondents fell into the age range of 19 years of age to 25
years of age, with a mean score of 1.7006, indicating a
positive attitude toward the aged. Forty respondents fell
into the age range of 26 years of age to 31 years of age,
with a mean score of 1.7750, -indicating a positive attitude
toward the aged. Thirty-two respondents fell into the age
range of 32 years of age to 61 years of age, with a mean
score of 1.5000, indicating a positive attitude toward the
aged. Respondents at the higher range of age indicated a
more positive attitude than did respondents at the lesser
age ranges. This resulted in an F-ratio of 3.31 and F-
probability of .038. This is significant at the p<..05 level
(see Table 3). Examination of the results of the ANOVA
confirms that younger persons have more negative than
positive attitudes toward the aged.
Table 3
One-Way Analysis of Variance Age and Negative Attitudes
Sum of Mean F df Squares Squares F-Ratio Probability
Between Groups 2 1.4595 .7297 3.31116 .0382 Within Groups 236 52.0049 .2204 Total 238 53.4644

76
Standard Standard Group Count Mean Deviation Error 95 Pet Conf Int for Mean
Grp 1 167 Grp 2 40 Grp 3 32
1.7006 1.7750 1.5000
Total 239 1.6862
4723 4229 ,5080
.4740
0365 0669 0898
0307
1.6284 1.6397 1.3168
TO TO TO
1.6258 TO
1.7728 1.9103 1.6832
1.7466
Hypothesis two states that, that the more knowledge a
respondent has about the aging process, the less likely the
respondent is to respond in a negative manner to the aged. A
one-way analysis of variance was conducted to determine
effect of knowledge between groups and within groups based
on negative attitudes. The overall findings from this study
support this hypothesis.
An analysis of variance was conducted to determine the
significance of knowledge and negative attitude between
groups and within groups. Group one consisted of forty-two
respondents with scores between 32 and 52 on the facts on
aging test, had a mean score of 1.8333, indicating a
negative attitude toward the aged. Group two consisted of
sixty-four respondents with scores between 56 and 60 on the
facts on aging test, with a mean score of 1.7 031, indicating
a more positive attitude toward aged individuals than group
one. Group three consisted of ninety-two respondents with
scores between 64 and 72 on the facts on aging test, with a
mean score of 1.6957, indicating a more positive attitude
toward the aged than group two. Group four consisted of

77
forty-five respondents with scores between 76 and 100 on the
facts on aging test, with a mean score of 1.5333, indicating
a more positive attitude toward the aged than any of the
previous groups mentioned. This resulted in an F-ratio of
2.9294 and F-probability of .0343. This is significant at
the p<..05 level (see Tahle 4). Examination of the results
of the ANOVA confirms that the more knowledge an respondent
has about the aging process, the less likely the respondent
is to respond in a negative manner toward the aged.
Table 4
One-Way Analysis of Variance Knowledge and Negative Attitudes
Sum of Mean F df Squares Squares F-Ratio Probability
Between Groups 3 1.9809 .6603 2.9294 .0343 Within Groups 239 53.8710 .2254 Total 242 55.8519
Standard Standard Group Count Mean Deviation Error 95 Pet Conf Int for Mean Grp 1 42 1. 8333 .4371 .0674 1. 6971 TO 1. 9695 Grp 2 64 1. 7031 .4605 .0576 1. 5881 TO 1. 8182 Grp 3 92 1. 6957 .4858 .0507 1. 5950 TO 1. 6849 Grp 4 45 1. 5333 .5045 .0752 1. 3818 TO 1. 6849
Total 243 1. 6914 .4804 .0308 1. 6307 TO 1. 7521
Hypothesis three states that, the higher the level of
reported educational achievement of respondents' mother, the
less likely to respond in a negative manner toward the aged.
A one-way analysis of variance (ANOVA) was conducted to

78
determine effect of mother's education between groups based
on negative attitudes. The overall findings of this study-
led to the rejection of this hypothesis.
An analysis of variance was conducted to determine the
significance of mother's education and negative attitude
between groups and within groups. Thirteen respondents
report their mother's education level to be less than high
school, with a mean score of 1.6923, indicating a positive
attitude. Sixty-five respondents report their mother's
education level to be completion of high school, with a mean
score of 1.6769,.indicating a positive attitude toward the
aged. Eighty-six respondents report their mother's
education level to include some college, with a mean score
of 1.6628, indicating a positive attitude toward the aged.
Forty-six respondents report their mother's education level
to have a college degree, with a mean score of 1.7826,
indicating a positive attitude toward the aged. Twenty-five
respondents report their mother's education to have an
advanced/professional degree, with a mean score of 1.6400,
indicating a positive attitude toward the aged. This
resulted in an F-ratio of .5684 and F-probability of .6858.
This is not significant at the p<_.05 level (see Table 5).
Analysis of Variance of mother's level of education and
respondents negative attitude indicates that there is no
significance between the groups or within the groups.
Therefore it is concluded that mother's level of education

79
is not significant in determining respondents attitude
toward the aged.
Table 5 One-Way Analysis of Variance of
Mother's Education and Negative Attitudes
Sum of Mean F df Squares Squares F-Ratio Probability
Between Groups Within Groups Total
4 .5318 .13229 230 53.7916 .2339 234 54.3234
5684 .6858
Standard Standard Group Count Mean Deviation Error 95 Pet Conf Int for ;
Grp 1 13 1.6923 .4804 .1332 1 .4020 TO 1 .9826 Grp 2 65 1.6769 .4713 .0585 1 .5601 TO 1 .7937 Grp 3 86 1.6628 .4997 .0539 1 .5557 TO 1 .7699 Grp 4 46 1.7826 .4673 .0689 1 .6438 TO 1 .9214 Grp 5 25 1.6400 .4899 .0980 1 .4378 TO 1 .8422
Total 235 1.6894 .4818 .0314 1 .6274 TO 1 .7513
Hypothesis four states that, the higher the level of
education of the respondents' father, the less likely to
respond in a negative manner toward the aged. A one-way
analysis of variance (ANOVA) was conducted to determine
interaction of father's education between groups based on
negative attitudes. The overall findings of this study led
to the rejection of this hypothesis.
An Analysis of Variance was conducted to determine the
significance of father's education and negative attitude
between groups and within groups. Thirteen respondents
report their father's education level to be less than high
80
school, with a mean score of 1.6923, indicating a positive
attitude toward the aged. Fifty-seven respondents report
their father's education level to be a high school graduate,
with a mean score of 1.7193, indicating a positive attitude.
Sixty-two respondents report their father's education level
to include some college, with a mean score of 1.5806,
indicating a positive attitude toward the aged. Seventy-
five respondents report their father's education level to be
a college graduate, with a mean score of 1.6933, indicating
a positive attitude toward the aged. Twenty-eight
respondents report their father's education level to be
advanced/professional degree, with a mean score of 1.8571,
indicating a positive attitude toward the aged. This
resulted in an F-ratio of 1.7 and F-probability of .1475.
This is not significant at the p<.05 level {see Table 6).
The Analysis of Variance of father's education and
respondents negative attitude indicates that there is no
significance between the groups or within the groups.
There-fore it is concluded that father's level of education
is not significant in determining respondents attitude
toward the aged.

81
Table 6 One-Way Analysis of Variance
of Father's Education and Negative Attitudes
Sum of Mean F df Squares Squares F-Ratio Probability
Between Groups Within Groups Total
4 1.5734 .3933 230 52.7500 .2293 234 54.3234
1.7151 1475
Standard Standard Group Count Mean Deviation Error 95 Pet Conf Int for Mean
Grp 1 13 1.6923 .4804 .1332 1 .4020 TO 1.9826 Grp 2 57 1.7193 .4533 .0600 1 .5990 TO 1.8396 Grp 3 62 1.5806 .5294 .0672 1 .4462 TO 1.7151 Grp 4 75 1.6933 .4925 .0569 1 .5800 TO 1.8066 Grp 5 28 1.8571 .3563 .0673 1 .7190 TO 1.9953
Total 235 1.6894 .4818 .0314 1 .6274 TO 1.7513
Hypothesis five states that, the higher the level of
reported educational achievement of respondent, the less
likely it was for the respondent to have negative attitudes
directed toward the aged. A One-way Analysis of Variance
was conducted to determine interaction of education between
groups based on negative attitudes. The overall findings of
this study led to the rejection of this hypothesis.
An Analysis of Variance was conducted to determine the
effect of education and negative attitude between groups and
within groups. Two respondents report their educational
level to be freshman, with a mean score of 2.000, indicating
a negative attitude toward the aged. Four individuals
report their educational level to be sophomore, with a mean
score of 1.7500, indicating a positive attitude toward the

82
aged. Fifty-four respondents report their educational level
to be junior, with a mean score of 1.7593, indicating a
positive attitude toward the aged. One-hundred and sixty-
four respondents report their educational level to be
senior, with a mean score of 1.6951, indicating a positive
attitude toward the aged. Sixteen respondents report their
educational level to be graduate, with a mean score of
1.3750, indicating a positive attitude toward the aged.
This resulted in an F-ratio of 2.27 and F-probability of
.0620. This is not significant at the p<_.05 level (see
Table 7).
The Analysis of Variance of education and negative
attitude indicates that there is no significance between the
groups of within the groups at p<.005 level. The ANOVA
indicates a possible significance at the p<,.006 level.
Therefore if the probability had been set at p<..10 this
hypothesis would be confirmed. However, in keeping within
the standard p<.05 it can be concluded that the educational
level of the respondent is not significant in determining
respondents attitude toward the aged.

83
Table 7 One-Way Analysis of Variance
Education and Negative Attitudes
Sum of Mean F df Squares Squares F-Ratio Probability
Between Groups Within Groups Total
4 2.0569 .5142 235 53.1265 .2261 239 55.1833
2.2746 . 0620
Standard Standard Group Count Mean Deviation Error 95 Pet Conf : Int for :
Grp 1 2 2.0000 .0000 .0000 2 .0000 TO 2 .0000 Grp 2 4 1.7500 .5000 .2500 .9544 TO 2 .5456 Grp 3 54 1.7593 .4733 .0644 1 .6301 TO 1 .8884 Grp 4 164 1.6951 .4749 .0371 1 .6219 TO 1 .7683 Grp 5 16 1.3750 .5000 .1250 1 .1086 TO 1 .6414
Total 240 1.6917 .4805 .0310 1 .6306 TO 1 .7528
Hypothesis six states that, male students will respond
in a more negative manner toward older individuals than will
female students. The overall findings of this study led to
the rejection of this hypothesis. The findings indicate
that females respond in a more negative manner toward the
aged than do males.
A One-way Analysis of Variance was conducted to
determine effect of sex between groups and within groups
based on negative attitude. An Analysis of Variance was
conducted to determine the significance of sex and negative
attitude between groups and within groups. One-hundred and
eight males had a mean score of 1.7778, indicating a
positive attitude toward the aged. One-hundred and thirty-
four female respondents had a mean score of 1.62 69,

84
indicating a positive attitude toward the aged. This
resulted in an F-ratio of 6.0 and F-probability of .0146.
This is significant at the p<..05 level (see Table 8) . Males
responses range from 1 to 2, female responses range from 1
to 3, indicating that females in this sample had more
negative attitudes toward the aged than did the male
students.
These analysis indicate that sex of respondent is
significant. However, there are mixed results when
comparing males and females. It appears that females are
more negative toward the aged than males. Thus the
hypothesis that male students will respond in a more
negative manner toward older individuals than will female
students is rejected.
Table 8
One-Way Analysis of Variance Sex and Negative Attitudes
Sum of Mean F df Squares Squares F-Ratio Probability
Between Groups I 1.3620 1.3620 6.0520 .0146 Within Groups 240 54.0100 .2250 Total 241 55.3719
Standard Standard Group Count Mean Deviation Error 95 Pet Conf Int for Mean
Grp 1 108 1.7778 .4177 .0402 1.6981 TO 1.8575 Grp 2 134 1.6269 .5155 .0445 1.5388 TO 1.7149
Total 242 1.6942 .4793 .0308 1.6335 TO 1.7549

85
Table 8 cont.
GROUP MINIMUM
Grp 1 Grp 2
TOTAL
1.0000 1.0000
1.0000
MAXIMUM
2 . 0 0 0 0 3 .0000
3.0000
Hypothesis seven states that, those students that self-
report their educational major as being Gerontology "Aging"
would respond in a less negative manner toward the aged. A
One-way Analysis of Variance was conducted to determine
effect of major between groups and within groups based on
negative attitude. The overall findings of this study
support this hypothesis.
An Analysis of Variance was conducted to determine the
significance of major and negative attitude between groups
and within groups. Ten respondents report their educational
major as being Gerontology, with a mean score of 1.4000,
indicating a positive attitude toward the aged. Two-hundred
and thirty respondents report that Gerontology is not their
educational major, with a mean score of 1.6957, indicating a
positive attitude toward the aged. This resulted in an F-
ratio of 3.75 and F-probability of .053. This is
significant at the p<_.05 level (see Table 9).
Examination of the ANOVA confirms that those students
that report their major as being Gerontology ("Aging")
responded in a less negative manner toward the aged than

86
students that report Gerontology as not being their major
area of study. Thus the major concentration of study in
Gerontology is significant in determining respondents
attitude toward the aged.
Table 9
One-Way Analysis of Variance Major and Negative Attitudes
Sum of Mean F df Squares Squares F-Ratio Probability
Between Groups 1 .8377 .8377 3.7549 .0538 Within Groups 238 53.0957 .2231 Total 239 53.9333
Standard Standard Group Count Mean Deviation Error 95 Pet Conf Int for Mean
Grp 1 10 1.4000 .5164 .1633 1.0306 TO 1.7694 Grp 2 230 1.6957 .4705 .0310 1.6345 TO 1.7568
Total 240 1.6833 .4750 .0307 1.6229 TO 1.7437
Hypothesis eight states that, the more courses students
take in aging, the less likely students will respond
negatively to the aged. An ANOVA was conducted to determine
interaction of aging courses between groups and within
groups based on negative attitude. The overall findings of
this study led to the rejection of this hypothesis.
An ANOVA was conducted to determine the significance
of aging courses and negative attitude between groups and
within groups. One-Hundred and thirty-three respondents
report having no courses in aging, with a mean score of
1.6842, indicating a positive attitude toward the aged.
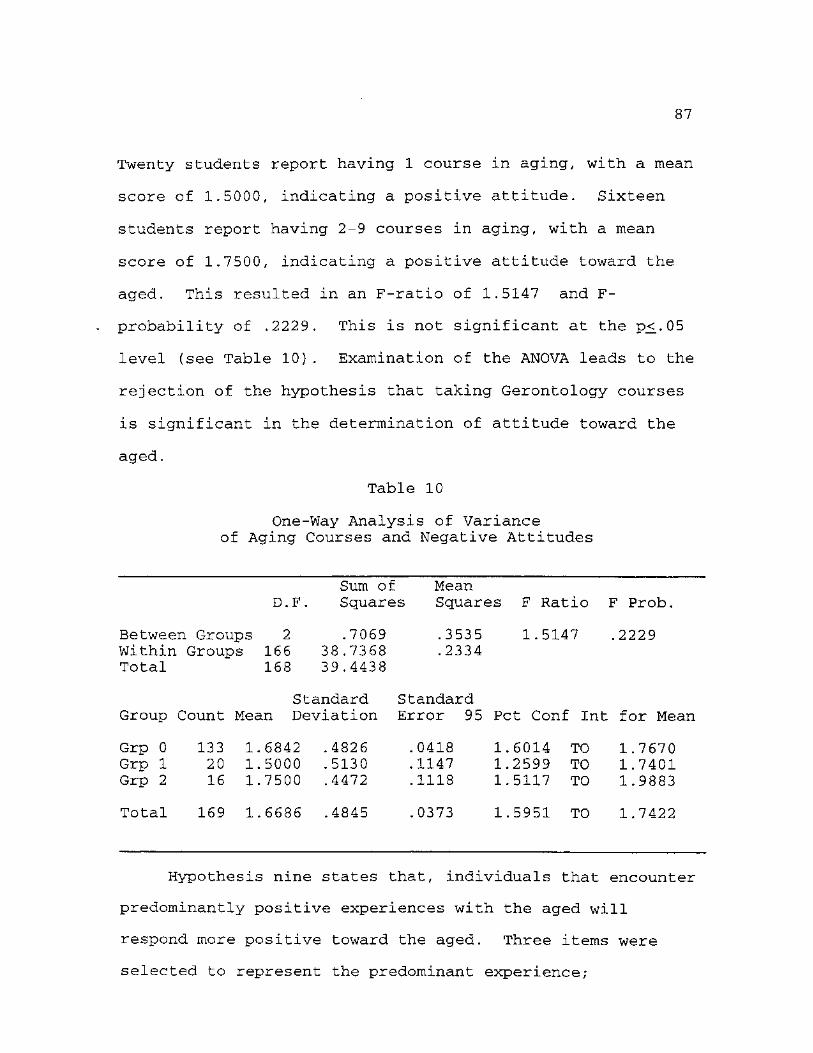
87
Twenty students report having 1 course in aging, with a mean
score of 1.5000, indicating a positive attitude. Sixteen
students report having 2-9 courses in aging, with a mean
score of 1.7500, indicating a positive attitude toward the
aged. This resulted in an F-ratio of 1.5147 and F-
probability of .2229. This is not significant at the p<..05
level (see Table 10). Examination of the ANOVA leads to the
rejection of the hypothesis that taking Gerontology courses
is significant in the determination of attitude toward the
aged.
Table 10
One-Way Analysis of Variance of Aging Courses and Negative Attitudes
Sum of Mean D.F. Squares Squares F Ratio F Prob.
Between Groups 2 .7069 .3535 1.5147 .2229 Within Groups 166 38.7368 .2334 Total 168 39.4438
Standard Standard Group Count Mean Deviation Error 95 Pet Conf : Int for Mean
Grp 0 133 1.6842 .4826 .0418 1.6014 TO 1.7670 Grp 1 20 1.5000 .5130 .1147 1.2599 TO 1.7401 Grp 2 16 1.7500 .4472 .1118 1.5117 TO 1.9883
Total 169 1.6686 .4845 .0373 1.5951 TO 1.7422
Hypothesis nine states that, individuals that encounter
predominantly positive experiences with the aged will
respond more positive toward the aged. Three items were
selected to represent the predominant experience;

88
experience, interaction and outcome. A combination score of
the three items; experience, interaction and outcome,
creates a fourth category; overall experience with aged.
Multiple Regression Analysis was conducted. An ANOVA was
also conducted on interaction and positive attitude, outcome
and positive attitude, and experience and positive attitude.
The overall findings of this study support this hypothesis.
Table 11
Multiple Regression with Positive Attitude
SE of 95% Variable B Beta Confidence• Beta t-Value t-Sig.
Outcome .090 .04 .011 .15 2.2 .03 Interact .081 .03 -.15 -.14 -2.2 .03 Experience -.16 .18 -.52 -.05 -8.69 .39
R-Square=.07 F-Ratio= 6.6 Sign. F= .0003
The findings indicate that outcome and interaction have
more affect on positive attitudes on individuals toward the
aged than did experience. Outcome weights the heaviest and
has the most significant impact on positive attitude toward
the aged. Experience has no significance when paired with
the variables; outcome and interaction. Therefore,
concluding that individuals are most impacted by the overall
outcome of the experience with the aged in forming
attitudes.
From R-Square we conclude that in our sample we can
explain 7% of the variance which indicates that there are
other factors that determine our positive attitude that are

89
not included in this grouping of variables. The F-Ratio
indicates a significance of relationships between groups and
tests the hypothesis that all of the groups have the same
mean in the population. The results of F-Ratio of 6.6 and
Sign. F of .0003 is significant at the p<..05 level, which
indicate that we must reject the hypothesis that all the
means are equal. The Standardized Regression Coefficient
(Beta) evaluates the net change in standard deviation, if
the independent changes on standard deviation, then the
dependent variable will change that same amount if
correlated. The findings suggest that there is a
correlation between interaction, outcome and positive
attitude with Beta for outcome at .15 and interaction at
-.14, and lacked a correlation with experience at -.05.
The possible reason that experience was not found to be
significant is the use of the term "personally" in the
questionnaire, leaving the respondent to conclude their own
interpretation, therefore lacking uniformity in responses.
The unstandardized regressions coefficient (B) is the
unexplained variance in the dependent variable that is not
related to the independent variable. The findings of
outcome at .09 and interaction at .08 indicates that 91% and
92% of the variance is explained. The findings of
experience at -.16 indicates that 84% of the variance is
explained (see Table 11).
An ANOVA was conducted to determine the significance of

90
interaction and positive attitude between groups and within
groups. Forty-seven respondents indicate their interaction
with aged individuals was very often, with a mean score of
2.8085, indicating a positive to very positive attitude
toward the aged. Ninety-nine respondents indicate their
interaction with aged individuals was often, with a mean
score of 2.6768, indicating a positive to very positive
attitude toward the aged. Eighty-three respondents indicate
their interaction with aged individuals were occasional,
with a mean score of 2.5542, indicating a positive attitude
toward the aged. Twenty-two respondents indicate their
interaction with aged individuals is not often, with a mean
of 2.4545, indicating a positive attitude toward the aged.
This resulted in an F-ratio of 4.2527 and F-probability of
.0060. This is significant at the p^.05 level (see Table
12) .

91
Table 12
One-Way Analysis of Variance of Interaction and Positive Attitude
Sum Mean F df Squares Squares F-Ratio Probability
Between Groups 3 2.8354 .9451 4.2527 .0060 Within Groups 247 54.8937 .2222 Total 250 57.7291
Standard Standard Group Count Mean Deviation Error 95 Pet Conf Int for Mean
Group 1 47 2.8085 .3977 .0580 2 . 6917 To 2.9253 Group 2 99 2.6768 .4701 .0472 2 . 5830 To 2.7705 Group 3 83 2.5542 .5001 .0549 2. 4450 To 2.6634 Group 4 22 2.4545 .5096 .1087 2. 2286 To 2.6805
Total 251 2.6414 .4805 .0303 2. 5817 To 2.7012
An ANOVA was conducted to determine the significance of
outcome and positive attitude between groups and within
groups. One respondent indicates their outcome of
experience with aged individuals to be very negative, with a
mean score of 3, indicating a very negative attitude toward
the aged. One respondent indicates their outcome of
experience with aged individuals to be negative, with a mean
score of 2.000, indicating a positive attitude toward the
aged. Five respondents indicate their outcome of experience
with aged individuals to be somewhat negative, with a mean
score of 2.4000, indicating a positive attitude toward the
aged. Forty-five respondents indicate their outcome of
experience with aged individuals to be somewhat positive,
with a mean of 2.4000, indicating a positive attitude toward

92
the aged. One-hundred and twenty-three respondents indicate
their outcome of experience with aged individuals to be
positive, with a mean score of 2.6748, indicating a positive
attitude toward the aged. Seventy-six respondents indicate
their outcome of experience with aged individuals to be very
positive, with a mean -score of 2.7500, indicating a positive
attitude toward the aged. This resulted in an F-ratio of
4.1297 and F-probability of .0013. This is significant at
the p<..05 level (see Table 13).
Table 13
One-Way Analysis of Variance of Outcome and Positive Attitude
Sum Mean F df ' Squares Squares F-Ratio Probability
Between Groups 5 4.4872 .8974 4.1297 .0013 Within Groups 245 53.2419 .2173 Total 250 57.7291
Standard Standard Group Count Mean Deviation Error 95 Pet Conf : Int for Mean
Group 1 1 3 .0000 Group 2 1 2 .0000 Group 3 5 2.4000 .5477 .2449 1 .7199 To 3.0801 Group 4 45 2.4000 .4954 .0739 2 .2512 To 2.5488 Group 5 123 2.6748 .4359 .0500 2 .6504 To 2.8496
Total 251 2 .6414 .4805 .0303 2 .5817 To 2.7012
An ANOVA was conducted to determine the significance of
experience and positive attitude between groups and within
groups. Two-hundred and forty-five respondents indicates
that they have known aged individuals personally, with a
mean score of 2.6531, indicating a very positive attitude

93
toward the aged. Seven respondents indicates that they have
not known aged individuals personally, with a mean score of
2.2857, indicating a somewhat positive attitude toward the
aged. This resulted in an F-ratio of 4.0323 and F-
probability of .0457. This is significant at the p<..05
level (see Table 14).
Table 14
One-Way Analysis of Variance of Experience and Positive Attitude
Sum Mean F df Squares Squares F-Ratio Probability
Between Groups 1 .9184 .9184 4.0323 .0457 Within Groups 250 56.9388 .2278 Total 251 57.8571
Standard Standard Group Count Mean Deviation Error 95 Pet Conf Int for Mean
Group 1 245 2.6531 .4770 .0305 2.5930 To 2.7131 Group 2 7 2.2857 .4880 .1844 1.8344 To 2.7370
Total 252 2.6429 .4801 .0302 2.5833 To 2.7024
Summary
This chapter began with an examination of each of the
individual hypotheses. The data analysis procedures and
tests of hypothesis were reported and discussed. The
acceptance or rejection of each of the hypotheses is
presented. Hypotheses numbered 1,2,7 and 9 were found to be
supported. Hypotheses numbered 3,4,5,6 and 8 were not
supported.

CHAPTER VI
SUMMARY AND CONCLUSIONS
Introduction
This study has investigated a selection of various
factors that affect ageism. The final chapter describes
what has been done in this research, and identifies several
theoretical and practical conclusions that can be drawn from
the research, as well as suggestions for further research.
Summary of Problem
The central problem of this study was what effect does
educational attainment and acquired knowledge of aging have
on ageism. Subsidiary questions addressed; age, sex and
positive/negative experiences with aged individuals in
regard to possible effect on negative ageism.
Summary of Findings
To address the central problem of this study nine
hypothesis were selected. Hypothesis number one states that
they younger the respondent, the more negative the response
toward older individuals. In an overall examination of the
findings from this study, it is indicated that the
respondents moved toward a more negative direction toward
the aged than positive overall. In reviewing the past
findings of Palmore's studies, these findings are congruent
in direction.
94

95
This sample produced a total sample size of 254
respondents, with ages ranging from 19 to 61 years of age.
The average age of the sample was 25 years. The majority of
the sample that answered the age question, 175 out of 249
respondents, were 25 years of age and younger. The overall
findings of this research support this hypothesis. The
younger persons had more negative than positive attitudes
toward the aged. Thus we can conclude that with maturation
comes increase in understanding and increased acceptance for
the aged.
Hypothesis number two states that the more knowledge a
respondent has about the aging process, the less likely the
respondent is to respond in a negative manner to the aged.
The overall findings of this research support this
hypothesis. The more knowledge respondents had about the
aging process, the less likely the respondent was to respond
in a negative manner toward the aged. This supports the
major findings concluded by Palmore; bias toward the aged is
associated with lack of knowledge about the age. Therefore,
with increased knowledge about the aged and the aging
process, we can conclude that negative ageism will decrease.
Hypotheses three and four states that the higher the
level of reported educational achievement of respondents'
mother/father, the less likely to respond in a negative
manner toward the aged. The overall findings of this study
do not support either of theses hypotheses, therefore

96
leading to the rejection of these hypotheses. Concluding
that parental education was not found to be significant in
determining the attitude of the respondents toward the aged.
Hypothesis five states that the higher the level of
reported educational achievement of respondent, the less
likely it was for the respondent to have negative attitudes
directed toward the aged. This hypothesis was also found to
be unsupported by the overall findings of this study,
leading to the rejection of this hypothesis. However, the
F-probability of .06 should be considered. Even though
significance was set at .05, the findings are close enough
to merit further examination, if the significance had been
.10, the hypothesis would have been supported. Overall,
based on the findings of these three hypothesis it can be
concluded that the educational achievement level does not
appear to affect attitudes toward the aged, however,
knowledge does impact respondents attitudes toward the aged.
Hypothesis number six states that male students will
respond in a more negative manner toward older individuals
than will female students. The findings did not support
this hypothesis, therefore leading to the rejection of this
hypothesis. However, findings indicated that females
responded in a more negative manner toward the aged than did
the males in this study. Females were much more decisive in
their attitudes than were the males. The males tended to
stay in the middle range, whereas the females responded more

97
decisively negative or positive in their attitudes toward
the aged. This could conclude that females view aging as
more negative, with strong perceptions about the loss of
status associated with aging. This finding could also
represent how females perceive themselves as being in a more
care giving role to the aged than did the male respondents,
leading to more decisive conclusions due to directness of
perceptual repercussions. Conceivably the males were unsure
of how they felt about the aged and aging. This uncertainty
could be due to lack of experience with the aged or the
comparatively lessened perception of loss of status in
society with age, than with the female. Even though this
hypothesis is rejected, we can conclude that the sex of the
respondent impacts the attitude.
Hypothesis number seven states that those students that
self-report their educational major as being Gerontology or
"Aging" would respond in a less negative manner toward the
aged. The overall findings of this study support this
hypothesis. The students that reported their major area of
study to be Gerontology or Aging had less negative responses
toward the aged than did those respondents that were not
Gerontology or Aging majors. The majority of this sample
reported not being a Gerontology or Aging major (241) and 10
of the respondents reported Gerontology or Aging as being
their major area of study. The 10 Gerontology majors
represented ten percent of the overall Gerontology majors,

98
both undergraduate and graduate combined, of this university
population.
When hypotheses 3, 4, 5, and hypothesis 7 are examined,
parental education, respondents' education and the major
area of education, the conclusion can be made that the level
of education is not as significant in determining attitudes
toward the aged as is the specific focus of the education.
This leads us to conclude that specific educational
direction that offers specific knowledge about the aged will
have the most impact on the formation of attitudes toward
the aged.
Hypothesis number eight states that the more courses
completed in the area of aging, the less likely students
will respond negatively to the aged. The overall findings
of this study does not support this hypothesis. The more
courses completed by the students, did not indicate a
lessening of negative attitude toward the aged. The majority
(13 6) or 53 percent of the respondents reported having
completed no courses in Gerontology, with (81) or 32% of the
cases missing, gives us a understanding of the effects of
not having courses in aging. The conclusion that can be
drawn from these findings are that specific courses, were
not as significant as were the obtaining of specific
knowledge about the aged and the aging process. With this
finding, a case could be made for the potential significance
of inclusion of basic Gerontology to be included in the core

99
curriculum of institutions for higher learning. This
inclusion would need to contain specific units of knowledge
about the aged and the aging process addressed for the
optimum impact on the formation of negative attitudes toward
the aged.
Hypothesis number nine states that individuals that
encounter predominantly positive experiences with the aged
will respond more positive toward the aged. The overall
findings support this hypothesis. This hypothesis is
actually the reverse of direction of the previous
hypotheses. This hypothesis directs toward examining the
positive direction. Three survey items were selected to
represent the predominant experience; experience,
interaction and outcome. These were selected due to the
perception of significance in relationship to the
hypothesis. In item 64, the respondent was ask "In your
experience have you known 'aged individuals' personally?"
This question was designed to give an indication as to
whether or not a relationship with an aged individual(s) has
existed for the respondent. The findings suggest that this
question was found to be significant singularly, but when
grouped with the other two items it was found to be
insignificant. When Multiple Regression was conducted the
t-significance was found to be .38. In retrospect the use
of the term "personally" may have been too vague, lacking
clarity for a true representation.

100
The next item examined in this grouping was item number
67 of the survey instrument. The respondents were ask to
indicate "How often have you interacted on a personal level
with 'aged' individuals." This item was found to be
significant in determining the attitude of the respondents
toward the aged. It appears to indicate that the negative
attitude is more impacted by interaction than positive
attitude was. It is interested to note that the term
"personal" was also used in this item, and evidently -was
perceived with more clarity than the previous item.
The final item in this grouping was the outcome of
their contact with the aged. Item number 68 asks the
respondent to "Please indicate the overall outcome of your
experience with the 'aged' individual/individuals." This
item weighed the most in determining the impact that the
predominate experience has in determining the direction of
attitude. How we perceive the overall outcome of the
predominate experience(s) will impact our attitudes toward
the aged.
The basic conclusions can be made about this study are;
hypotheses numbered 1, 2, 7, and 9 were all supported by the
findings in this research, hypotheses numbered 3, 4, 5, 6
and 8 were not supported by the findings of this research
and therefore rejected. These conclusions support the
theoretical model in that the intervening variables of age,
knowledge, education, sex, and personal experiences impact

101
the attitudes about aged and aging.
Implications of Findings
Governmental agencies may be able to gain a better
understanding of the factors that are associated with
ageism. These insights can be used to design new or
redesign existing programs that may encounter problems
associated with ageism. Ageism associated with employment
can be better understood and steps taken to lessen ageism in
the work place, especially in regard to preventative
measures.
Sociologists and Gerontologists, especially at the
academic level can devise new courses that take in
consideration of the factors that are associated with
ageism. As we face the aging of the baby-boomer generation,
the largest aging population in the history of recorded
time, measures need to be explored now, that could lessen
the potential of ageism.
Suggestions
With critical examination, both during the research
process and in retrospect, numerous suggestions for future
research emerge. The sample population was in keeping with
the direction of this study. However, even though the
Gerontology students were an acceptable representation of
that discipline (10%), a larger sample of these students
would be recommended in hopes of generating stronger
significance in overall outcome of findings. Consideration

102
needs to be given of the gathering time of data. It proved
to be very challenging, on a university campus, to gather
data during the summer semesters. The representation of the
Gerontology students was a maximum representation of the
designated time period.
The attitude section of the instrument was found to be
challenging. The reversal of the attitudinal direction of
the questions were obvious and represented a paradox to the
respondents, which may or may not have influenced their
overall attitude scores. An instrument that could determine
attitude of respondents without the complexities mentioned,
would add ease to the research process as well as
potentially add to the strength of the overall findings.
Even though parental education was not found to be
significant in this particular study, it would be of
interest to survey the knowledge of the parents on aging.
It could be of interest to determine if the parental
knowledge of the aged and aging process had an impact on
their children's attitude toward the aged. With parents as
the primary agent of socialization, it could be potentially
significant in overall understanding of the formation of
attitudes toward the aged and the aging process.
The impact of the media on the development of attitudes
toward the aged and the aging process would be another
direction to explore in the future. The review of
literature indicates that pre-school children have negative

103
attitudes toward the aged, does this attitude come from
parental or media influence. There are numerous references
throughout the review of literature that suggests the
influence of the media on the development of negative
attitudes toward the aged and the aging process. It would
be interesting, as well as potentially useful, to determine
the specifics of the source or sources of the development of
these attitudes. For the purpose of this study, the
inclusion of the media was not possible.
Another possible direction for a separate study would
be race/ethnicity. This variable was not being tested in
this particular study. Race/ethnicity is well documented
throughout specific literature. When this variable was
examined, it was found that a variance between the groups
existed.
The final conclusions of this dissertation were based
upon one study, whose limitations were clearly defined in
the dissertation. What this research indicates is that
there are various factors, or variables that affect our
formation of attitude toward the aged. These data suggests
that; age, knowledge, sex, education, experiences with the
aged affect negative ageism, therefore supporting the
theoretical model.

APPENDIX
104

105
AGING SURVEY
Read each statement ana respond by cnecking either the "True" column if the statement is true, or the "False" coiumn if the statement is false.
Section
S ta tement j True False
1. The majority of old people (age 65+) are senile (have defective memory, are disoriented, or demented). -
2. The five senses (sight, hearing, taste, touch, and smell) all tend to weaken in oid age.
3. The majority of old people have no interest in, nor J capacity for. sexual relations. |
4. Lung vital capacity tends to decline in old age.
5. The majority of old people feel miserable most of the time.
6. Physical strength tends to decline in old age.
7. At least one-tenth of the aged are living in long-stay institutions (such as nursing homes, mental hospitals, homes for the aged, etc.).
8. Aged drivers have fewer accidents per driver than those under age 65.
9. Older workers usually cannot work as effectively as younger workers.
10. Over three-fourths of the aged are healthy enough ! to carry out their normal activities. |
11. The majority of old people are unable to adapt to change.
12. Old people usually take longer to learn something new.
13. It is almost impossible for the average old person to learn something new.
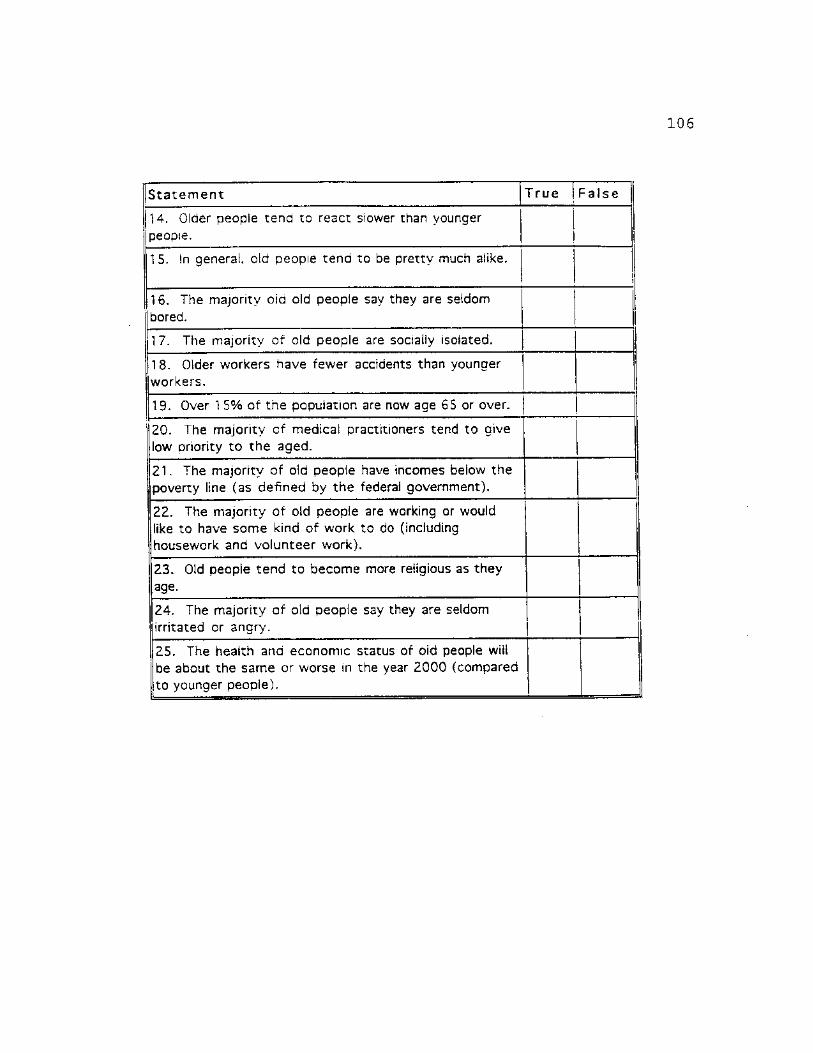
106
Sta tement T rue Fa lse |
14. Older people tend to react slower than younger people.
115. In general, old people tend to be pretty much alike.
I l6 . The majority oid old people say they are seldom j bored.
17. The majority of old people are socially isolated.
|18. Older workers have fewer accidents than younger workers.
19. Over 1 5% of the population are now age 65 or over.
20. The majority of medical practitioners tend to give low priority to the aged.
21. The majority of old people have incomes below the poverty line (as defined by the federal government).
22. The majority of old people are working or would like to have some kind of work to do (including housework and volunteer work).
23. Old people tend to become more religious as they age.
24. The majority of old people say they are seldom (irritated or angry.
25. The health ana economic status of oid people wiil be about the same or worse in the year 2000 (compared
Jto younger people).

107
SECTION II
In the following pages, you will fina a number of statements expressing opinions with which you may or may not agree. Following each statement there are six columns representing specific responses. Please read eacn of the statements ana check the number column that best reflects your desired response.
1 =StrongSv Disagree. 2=Dtsagree. 3= Slightly Otsaaree. 4-Shahtly Aaree. 5=Aaree. 6=Stronaiy Agree.
Statement . j 1 2 3 4 5 ! 6 |
26. 1 would probably be better if most old people lived in residential units with people their own age.
27. It would probably be better if most old people lived in residential units that also housed younger people.
28. There is something different about most older people; it 's hard to figure out what makes them tick.
29. Most old people are really no different from anybody else; they're as easy to understand as younger people.
30. Most old people get set in their ways and are unable to change.
31. Most old people are capable of new adjustments when the situation demands it.
32. Most old people would prefer to quit work as soon as pensions or their children can support them.
33. Most old people would prefer to continue working just as long as they possibly can rather than be dependent on anybody.
34. Most old people tend to let their homes become shabby and unattractive.

108
Sta temen t 1 2 3 4 5 6
35. Most old people can generally be counted | J on to maintain a clean, attractive home. | j
1 1
i 36. It is foolish to claim that wisdom comes with old age.
37. People grow wiser with the coming of old age. !
38. Old people have too much power in business and politics.
39. Old people have too little power in business and politics.
40. Most old people make one feel ill at ease.
41. Most old people are very relaxing to be with.
42. Most old people bore others by their insistence on talking about the "good old days."
43. One of the most interesting qualities of old people is their accounts of their past experiences.
44. Most old people spend too much time prying into the affairs of others and in giving unsought advice.
45. Most old people respect others' privacy and give advice only when asked.
46. If old people expect to be liked, their first step is to try to get rid of their irritating faults.
47. When you think about it. old people have the same faults as anybody else.

109
Statement 1 2 3 4 j 5 6
48. In order to maintain a nice residential neighborhood, it would be best if too many old people did not live in it.
| 1 1 1 ! i i i * i ! 1
49. You can count on finding a nice residential neighborhood when there is a sizeable number of old people living in it.
j j 1 i
50. There are a few exceptions, but in general i 1 j j ! ! most old people are pretty much alike. j ! j | | j
51. It is evident that most old people are very different from one another.
I 1
i
. 1
52. Most old people should be more concerned with their personal appearnace; they're too untidy.
53. Most old people seem to be quite clean and neat in their personal appearance.
54. Most old people are irritabie, grouchy, and unpleasant.
55. Most old people are cheerful, agreeable, and good humored.
56. Most old people are constantly complaining about the behavior of the younger generation.
57. One seidom hears old people complaining about the behavior of the younger generation.
58. Most old people make excessive demands for love and reassurance.
i
! 59. Most old people need no more love and reassurance than anyone eise.

110
Section III
Please answer the following qustions aoout yourself by writing an answer in the blank or Dy putting a check mark in the desired response column.
60. Age: 61. Is your major area of study gerontology (aging) ? Yes No_ 62. How many courses in "Aging"' have you completed?
63. Please read the title and course number of each course listed below and check "yes"' if you have completed that course and "no" if you have not completed the course.
Course number Course tit le Yes No
4020 Psychology of Death and Dying
4060 Leisure and Aging
4250 Topics in Gerontology
4550 Sociology of Aging
4780 Aging Programs and Services
4840-4850 Studies in Aging Field Practicum
4960-4970 Studies in Aging Institute
5200 Seminar on Research Methods and Design
5250 Topics in Gerontology
5300 Computer Applications in Long-Term Care
5400 Health Delivery Systems
5500 Retirement and Retirement Preparation
5600 Houseing for the Elderly: Planning, Public Policy and Research.
5650 Ethnic and Cultural Variations in Service Delivery
5700 Social Gerontology
5710 Health Aspects of Human Aging

I l l
Course number Course tit le Yes No
5750 Processes of Aging
5780 Federal. State and Local Programs in Aging ] |
5790 Developing community Programs for the Elderly
5800 Seminar on Programs in Aging
5810 Seminar on Administration of Programs in Aging
5840-5850 Internship in Administration of Programs in Aging
5860 Seminar on the Psychology of Aging
5890 Psychological Counseling for Late Maturity and Old Age
5900-5910 Special Problems
5960-5970 Studies in Aging Institute
Please List Any Courses in Gerontology (Aging) that you have compieted that were not on the check list.
Question Yes No
64. In your experience have you known "aged individuals" personally?
65. How many "aged individuals" would you estimate that you have had a personal relationship with?
Question Yes No
66. Were these individuals relatives?

112
l=Very Often. 2=Often, 3=Occasionailv, 4=Not often, 5=Never 1 j j jQuestion 1 j 2 |3 14 ! 5 |i
! ! H
I 67. How often have you interacted on a personal level with 4laged" individuals:
1 1 1 1 I I ! I l l i It 1 1 1 ! »
1»Very Negative Experience (s) 2=Neaative Experience (s) 3«Somewnat Neaatiave Exoenence(s) -Somewhat Positive Experience \s) 5»Positive txpenence(s) 6«Verv Positive Experienced).
i lQuestion i>
1 1 2 1 3 1 4 1 5 I 6 1! 1 > : 1 i \\
||68. Please indicate the overall outcome of your j experience with the "aged" individual/individuals: (Please check one response). !
i
i i i i
I i l 1
1 =On Campus 2=0ff Campus
Quest ion 1 2
69. Where do you currently reside?
1 =Male 2=Femaie
Question 1 2
70. What is your gender/sex?
1 =freshman.2=sophomore.3=junior.4=sentor, 5=graduate student
Question 1 2 3 4 5
71. School Classification: 1
1 =Black,2=White,3=Hispanic.4=Asian.5=Native American.6-0ther
Quest ion 1 2 3 • 4 6
72. Your Race/Ethnicity:

113
1 *ksss than high school, 2=h«ah scnool. 3=some coiieae. 4=coiJeae aearee, 5=3avanced/professional degree
Quest ion 1 2 3 4 51
73. Years of Mother's Education 1 i
i
74. Years of Father's Education j i !
— i j
i i — i i

REFERENCES
Aaron, H., Schwart, W. 1984. The Painful Prescription: Rationing Hospital Care. Washington, D.C.:The Brookings Institution.
Aday, L. 1993. At Risk in America. - San Francisco: Josey-Bass Publishers.
Adler, T. 1993. "Experts in Aging Outline Research, Funding Focus." In Grant, L. 1996. "Effects of Ageism on Individual and Health Care Providers' Responses to Health Aging." National Association of Social Workers, 21, 9-15.
Ansello, E. 1977. "Age and Ageism in Children's First Literature." Educational Gerontology. 2, 255-274.
Aronoff, C. 1974. "Old Age in Prime Time." In Vasil, L. 1993 "Elderly in the Media." Educational Gerontology. 19, 71-85.
Atchley, R. 1991. Social Forces and Aging. Wadsworth Publishing.
Babbie, E. 1990. Survey Research Methods. Second Edition Wadsworth Publishing.
Belgrave, L. et. al. 1982. "Stereotyping of the Aged by Medical Students." Gerontology and Geriatrics Education, 3, 37-44.
Bell, J. 1992. "In Search of a Discourse on Aging: The Elderly on Television." The Gerontologist. 32, 305-311.
Binstock, R., & Shanas, E. (Eds.). 1976. Handbook of Aging and the Social Sciences. New York: Van Nostrand Reinhold.
Binstock, R. 1983. "The Aged as Scapegoat." The Gerontologist, 23, no. 2:136-143.
Birren, J., & Schaie, W. 1977. (Eds.) Handbook of the Psychology of Aging. New York: Van Nostrand Reinhold.
Blazer, D., & Palmore, E. 1976. "Religion and Aging in a Longitudinal Panel." The Gerontologist. 16, 82-85.
114

115
Blazer, D. 1980. "The Epidemiology of Mental Illness in Late Life." In E. Busse & D. Blazer (Ed.), Handbook of Geriatric Psychiatry. New York: Van Nostrand Reinhold.
Blumer, H. 1969. Symbolic Interaction. Englewood Cliffs N.J.: Prentice Hall.
Bodily, C. 1991. "I have no opinions. I'm 73 Years Old! Rethinking Ageism." Journal of Aging Studies, 5, 245-264.
Botwinck, J. 1984. Aging and Behavior, (3rd. ed.). New York: Springer.
Buchholz, M., & Bynum, J. 1982. "Newspaper Presentation of America's Aged: A Content Analysis of Image and Role." The Gerontologist. 22, 83-87.
Burke, J. 1982. "Young Children's Attitudes and Perceptions of Older Adults." International Journal of Aging and Human Development, 14, 205-222.
Butler, R. 1969a. "Ageism: Another Form of Bigotry." Gerontologist, 9:243-46.
Butler, R. 1969b. "The Effects of Medical and Health Progress on the Social and Economic Aspects of the Life Cycle." (Paper delivered at the National Institute of Industrial Gerontology, Washington D.C. 13 March).
Butler, R. 1975. Why Survive? Being Old in America. New York: Harper & Row.
Butler, R. 1989. "Dispelling Ageism: The Cross-Cutting Intervention." Annals of the American Academy of Political and Social Sciences, 503:138-147.
Callahan, L. 1987. Setting Limits: Medical Gods in an Aging Society. New York: Simon & Schuster.
Carmel, S., Cwikel,J., and Galinsky, D. 1992. "Changes in Knowledge, Attitudes, and Work Preferences Following Courses in Gerontology Among Medical, Nursing, and Social Work Students." Educational Gerontology, 18:329-342.
Cockerham, W. 1991. This Aging Society. Prentice Hall, Englewood Cliffs, N.J.
Coccaro, E., Miles, A. 1984. "The Attitudinal Impact of Training in Gerontology/Geriatrics in Medical School: A

116
Coe, R., D., Prendergast, J. 1982. "Faculty Resources for Teaching Geriatric Medicine." Journal of the American Geriatrics Society, 30, 63-66
Corso, J. 1987. "Hearing." In G. Maddox (Ed.), The Encyclopedia of Aging. New York: Springer.
Combort, A. 1976. "Age Prejudice in America." Social Policy, 7 (3). 3-8.
Cooley, C. H. 1962, original 1909. Social Organization, New York: Schocken Books.
Cutler, S. 1987. "Attitudes; Crime; Group Membership." In G. Maddox (Ed.), The Encyclopedia of Aging. New York: Springer.
Davis, R., & Davis, J. 1986. "Tv's Image of the Elderly: A Practical Guide for Change." In Bell, J. 1992. The Gerontologist. 32, 305-311.
Deal, L. 1962. "Aging and Decline of Affect." Journal of Gerontology, 17, 440-446.
Demos, V., & Jache, A. 1981. "When You Care Enough: An Analysis of Attitudes Toward Aging in Humorous Birth-day Cards." The Gerontologist. 21: 209-215.
DeRenzo, E., Mally, J. 1992. "Increasing Use of Ageist Language in Skin-Care Product Advertising: 1969 Through 1988." Journal of Women & Aging, Vol. 4 (3) 105-126.
Doka, K. 1986. "Adolescent Attitudes and Beliefs Toward Aging and the Elderly. International Journal of Aging and Human Development, 22, 173-187.
Doty, L. 1987. Communication and Assertion Skills for Older Persons. New York: Hemisphere.
Eshleman, J. 1994. The Family. 7th Edition. Allyn and Bacon.
Fuchs, V. 1984. "The Rationing of Medical Care." New England Journal of Medicine, 322, 1813-1815.
George, L. 1984. "The Institutionalized." In E. Palmore (Ed.), Handbook on the Aged in the United States." Westport, CT: Greenwood Press.

117
Gerbner, G., Gross, L., Signorielli, N., & Morgan, M. 1980. "Aging with television: Images on Television Dramas and Conceptions of Social Reality. In Vasil, L. 1993. Educational Gerontology. 19, 71-85.
Grant, L. 1996. "Effects of Ageism on Individual and Health Care Providers' Responses to Healthy Aging." National Association of Social Workers, 21, 9-15.
Green, S., Keith, K., Pawlson, L. 1983. "Medical Students' Attitudes Toward The Elderly." Journal of the American Geriatrics Society, 31, 305-309.
Harris, L. 1975. The Myth and Reality of Aging in America. Washington, D.C.: National Council on the Aging.
Harris, & Associates. 1981. Aging in the Eighties: America in Transition. Washington, D.C.: National Council on the Aging.
Herman, N., & Reynolds, L. 1995. Symbolic Interaction: An Introduction to Social Psychology. New York: General Hall, Inc.
Hogue, C. 1980. "Epidemiology of Injury in Old Age." In S. Haynes (Ed.). Second Conference on the Epidemiology of Aging. (Publication no. 80-969). Washington, D.C.: National Institutes of Health.
Hoyer, W. 1987. "Vision and Visual Perception." In G. Maddox (Ed.), The Encyclopedia of Aging. New York: Springer.
Hurst, J. 1981. "Images in Children's Picture Books." In Vasil, L. 1993. Educational Gerontology 19, 71-85.
Isaacs, L., & Bearison, D. 1986. "The Development of Children's Prejudice Against the Aged. International Journal of Aging and Human Development. 23: 175-194.
Jantz, R., & Seefeldt, C., & Galper, A., & Serlock, K. 1977. "Children's Attitude Toward the Elderly." Social Education, 41, 518-523.
Janelli, L. 1988. "Depictions of Grandparents in Children's Literature." Educational Gerontology. 14, 193-202.
Jarvik, L., et. al. 1981. "First-year Medical Students and the Aging Patient: A Curricular Model." Journal of the American Geriatrics Society, 29, 135-138.

118
Jeffreys-Fox, B. 1977. How Realistic Are Television's Portrayal of the Elderly? University Park, Penn: The Annenber School of Communications.
Kahana, B. 1987. "Isolation." In G. Maddox (Ed.), The Encyclopedia of Aging. New York: Springer.
Kahana, E. 1987. "Institutionalization." In G. Maddox (Ed.), The Encyclopedia of Aging. New York: Springer.
Kannel, W., & Hubert, H. 1982. "Vital Capacity as a Biomarker of Aging." In M. Reff & E. Schneider (Eds.), Biological Markers of Aging. Washington, D.C.: National Institutes of Health.
Kenyon, G. 1992. "Why is Ageism a Serious Social Problem and What Can Be Done About It?" Canadian Journal on Aging. 11, 2-5.
Kilner, J. 1988. "Selecting Patients When Resources Are Limited."- American Journal of Public Health. 78, 144-1.47. ~~ "
Kimmel, D. 1988. "Ageism, Psychology, and Public Policy." American Psychologist, 11, 175-178.
Kogan, N. 1961. "Attitudes Toward Old People: The Development of a Scale and an Examination of Correlates." Journal of Abnormal and Social Psychology. 62, No. 1, 44-55.
Kossoris, M. 1948. "Absenteeism and Injury Experience of Older Worker." Monthly Labor Review, 67, 16-19.
Krauss, L. 1987. "Employment: Reaction Time." In G. Maddox (Ed.), The Encyclopedia of Aging. New York: Springer.
Kupetz, B. 1994. "Ageism: A Prejudice Touching Both Young and Old." Day Care and Early Education. Spring, 34-37.
Labouvie-Vief, G. 1985. "Intelligence and Cognition." In J.E. Birren & K. W. Schaie (Eds.), Handbook of the Psychology of Aging (2nd ed.). New York: Van Nostrand Reinhold.
Larson, R. 1978. "Thirty Years of Research on the Subjective Well-Being of Older Americans. Journal of Gerontology. 40, 109-129.

119
Laws, G. 1995. "Understanding Ageism: Lessons From Feminism and Postmodernism." The Gerontologist. 35, No. 1, 112-118.
Levensky, N. 1990. "Sounding Board: Age as a Criterion for Rationing Health Care." New England Journal of Medicine, 322, 1813-1815.
Levin, W. 1988. "Age Stereotyping: College Student Evaluation. Research on Aging, 10, 134-148.
Levinson, A., Thornly, J., Tollett, S. 1980. "Gerontological and Geriatric Training in Medical School: Curricular Preferences Shown by Medical Students, Educators, and General Practitioners." Journal of the American Geriatrics Society, 28, 157-163 .
Lippman, W. 1922. Public Opinion. In J. Levin, & W. Levin. 1980. Ageism: Prejudice and Discrimination Against the Elderly. Wadsworth Publishing Co.
Locke-Conner, C., & Walsh, R. 1980. "Attitudes Toward the Older Job Applicant: Just as Competent, But More Likely To Fail. Journal of Gerontology, 35, 920-927.
Maddox, G., & Douglas, E. 1974. "Aging and Individual Differences." Journal of Gerontology, 29, 555-563.
Marks, S. 1994. "Intimacy in the Public Realm: The Case of Co-Workers," Social Forces, 72: 843-858.
Manis, J., & Meltzer, B. 1978. Symbolic Interaction: A Reader in Social Psychology. Third edition. Boston: Allyn and Bacon.
Markides,K. 1987. "Religion." In G. Maddox (Ed.), The Encyclopedia of Aging, New York: Springer.
Masters, W., & Johnson, V. 1966. Human Sexual Response. Boston: Little Brown Co.
McTavish, D. 1971. "Perceptions of Old People: A Review of Research, Methodologies and Findings." The Gerontologist, 11, 90-101.
Mead, G. 1934. Mind, Self, and Society: From the Standpoint of a Social Behaviorist. Morris, C. (Ed.). Chicago: University of Chicago Press.
120
Mitchell, J., & Wilson, K., & Revicki, D. , Sc Parker, L. 1985. "Children's Perceptions of Aging: A Multidimensional Approach to Differences by Age, Sex, and Race." The Gerontoloqist, 25, 182-187.
Moody, H. 1988. The Abundance of Life: Human Development Policies for an Aging Society. New York: Columbia University Press.
National Center for Health Statistics. 1981. Health Characteristics of Persons with Chronic Activity Limitation (Series 10, no 137). Washington, D.C.: U.S. Government Printing Office.
National Safety Council. 1981. Accident Facts. Chicago: National Safety Council.
Northc.ott, H. 1975. "Too Young, Too Old- Age in the World of Television." The Gerontoloqist. 15, 184-186.
Palmore, E. 1976. "The Future Status of the Aged." The Gerontoloqist, 16, 297-302.
Palmore, E. 1981. Social Patterns in Normal Aging. Durham, N.C.: Duke University Press.
Palmore, E. 1986. "Trends in the Health of the Aged." The Gerontologist. 26, 298-302.
Palmore, E. 1988. The Facts on Aging Quiz. Adulthood and Aging, Vol. 21, Springer Series. Springer Publishing.
Palmore, E. B. 1990. Ageism: Negative and Positive. Adulthood and Aging, Vol. 25, Springer Series. Springer Publishing.
Poon, L. 1987. "Learning." In G. Maddox (Ed.), The Encyclopedia of Aging. New York: Springer.
Prendergast, C., Coe, R., Echsner, C., Galofre, A. 1984. "Analysis of Practice Interviews of Medical Students With Elderly Persons." Journal of Medical Education. 59, 600-602. ~~
Quadagno, J., & Street, D. 1996. Aging For The Twenty—First Century: Readings In Social Gerontology. New York: St. Martin's Press.
Quinn, J. 1987. "Attitudes of Professional Toward the Aged." In G. Maddox (Ed.), The Encyclopedia of Aging. New York: Springer.

121
Riley, M., & Foner, A. 1968. Aging and Society, (Vol. 1). New York: Russell Sage.
Riley, M. 1994. "Aging and Society: Past, Present, and Future." The Gerontologist, 34, 436-446.
Rhodes, S. 1983. "Age Related Differences in Work Attitudes and Behavior." Psychological Bulletin. 93, 328-367.
Rodin, J., & Langer, E. 1980. "Aging labels: The Decline of Control and the fall of Self-esteem." Journal of Social Issues, 36, 12-29.
Root, N. 1981. "Injuries at Work are Fewer Among Older Employees." Monthly Labor Review, 104, 30-34.
Rose, A. 1962. Human Behavior and Social Processes. Boston: Houghton Mifflin.
Rowe, J., & Kahn, R. 1987. "Human Aging: Usual and Successful Aging." Science, 237, 143-149.
Roybal, E. 1988. "Mental Health and Aging." American Psychologist, 43, 189-194.
Schmidt, D., Boland, D. 1986. "Structure of Perceptions of Older Adults: Evidence for Multiple Stereotypes." Psychology and Aging, 1, 255-260.
Schiffman, S. 1987. "Taste; Smell." In G. Maddox (Ed.), The Encyclopedia of Aging, New York: Springer.
Schitovsky, A. 1984. "The Last Year of Life." Generations, 9 (4) 27-29.
Seccombe, K., & Ishii-Kuntz, M. 1991. "Perceptions of Problems Associated with Aging Comparisons Among Four Older Age Cohorts." The Gerontologist, 31, (4) 527-533 .
Sloane, P., Slatt, L., Baker, R. 1988. Essential of Family Medicine. Baltimore, MD: Williams & Wilkins.
Snyder, C.,& Barrett, G. 1988. "The Age Discrimination in Employment Act: A Review of Court Decisions." Experimental Aging Research, 14(1) 3-47.
Soldo, B., & Manton, K. 1983. "Health Service Needs of the Oldest Old. Milbank Memorial Fund Quarterly: Health and Society, 63(2), 266-319.

122
Tonna, E. 1987. "Musculoskeletal System." In G. Maddox (Ed.), Encyclopedia of Aging. New York: Springer.
Treybig, D. 1974. "Language, Children and Attitudes Toward The Aged." Gerontolooist, 14, 14-75.
Tuckman, J., Lorge, I. 1953. "Attitudes Toward Old People." Journal of Social Psychology, 37, 249-260.
U.S. Bureau of the Census. 1975. Historical Statistics of the United States: Colonial Times to 1970. Washington, D. C.: United States Government Printing Office.
U.S. Bureau of the Census. 1983. Current Population Survey, March 1983. Washington, D.C.: U.S. Government Printing Office.
U. S. Bureau of the Census. 1984. Current Population Reports (Series P-25, nos. 925 & 952). Washington, D.C.: U.S. Government Printing Office.
U.S. Senate Special Committee on Aging. 1986. Developments in Aging: 1985, Vol. 3. Washington, D.C.: U.S. Government Printing Office.
Vasil, L., Wass, H. 1993. "Portrayal of the Elderly in the Media: A Literature Review and Implications for Educational Gerontologists." Educational Gerontologist, 19:71-85.
Whitbourne, S., & Hulicka, I. 1990. "Ageism in Undergraduate Psychology Texts." American Psychologist, 11, 1127-1136.
Wirth, L. 1938. "Urbanism As a Way of Life," American Journal of Sociology, 44, No. 1. 1-24.
Zweibel, N., Cassel, C. Karrison, T. 1993. "Public Attitudes About the Use of Chronological Age as a Criterion for Allocating Health Care Resources." The Gerontologist, 33, No. 1. 74-80.