Embed Size (px)
Citation preview

A86045 Accounting and Financial Reporting (2018/2019)
Session 2Financial Analysis: Ratio Analysis
Paul G. Smith B.A., F.C.A.

SESSION 2 SESSION OBJECTIVES & OVERVIEW
A 86045 Accounting and Financial Reporting 2

Session 2 Overview
Mins
Session objectives and overview 5
Review of pre-work and session 1 recap 15
Financial and ratio analysis 30
Market measures, analysts focus and other considerations 15
Ratio analysis, trend analysis and common size analysis 15
Required reading and assignment for next session 5
Summary and validation and overview Session 3 5
90
3A 86045 Accounting and Financial Reporting

Course Objectives
A 86045 Accounting and Financial Reporting 4
At the end of this course students will be able to:• Read and perform a high level
interpretation of the financial statements of companies applying international accounting standards
• Identify and evaluate the impact on a companies accounts of alternative accounting methods
• Carry out a high level assessment of thethe economic- financial position of a company reporting under IAS/IFRS.

Course Overview
A 86045 Accounting and Financial
Reporting
1. Financial reporting under IFRS 13. Inventories
2. Financial analysis: Ratio analysis 14. Construction contracts
3. Financial analysis: Segments and EPS 15. Non-financial liabilities
4. Review session 16. Review session
5. Revenues 17. Mid term test
6. Costs and expenses 18. Financial Instruments 1
7. Taxation - Direct and Indirect 19. Financial Instruments 2
8. Non-current assets - Intangible assets 20. Cash Flow Statement
9. Non-current assets - Tangible assets 21. Group accounts/Business comb
10. Financial leases 22. Review session
11. Impairment of assets 23. Final test
12. Review session
PGS
PT
PT
PGS
5

Objectives of Session 2 & 3
A 86045 Accounting and Financial Reporting
6
At the end of these two sessions, and the following review session, students will be able to:
• Apply the basic techniques of financial analysis• Ratio analysis• Trend analysis• Common size analysis
• Perform a high level assessment of a company’s:• Profitability• Liquidity• Efficiency• Investment risk

SESSION 1 RECAP AND PRE-WORK
A 86045 Accounting and Financial Reporting 7
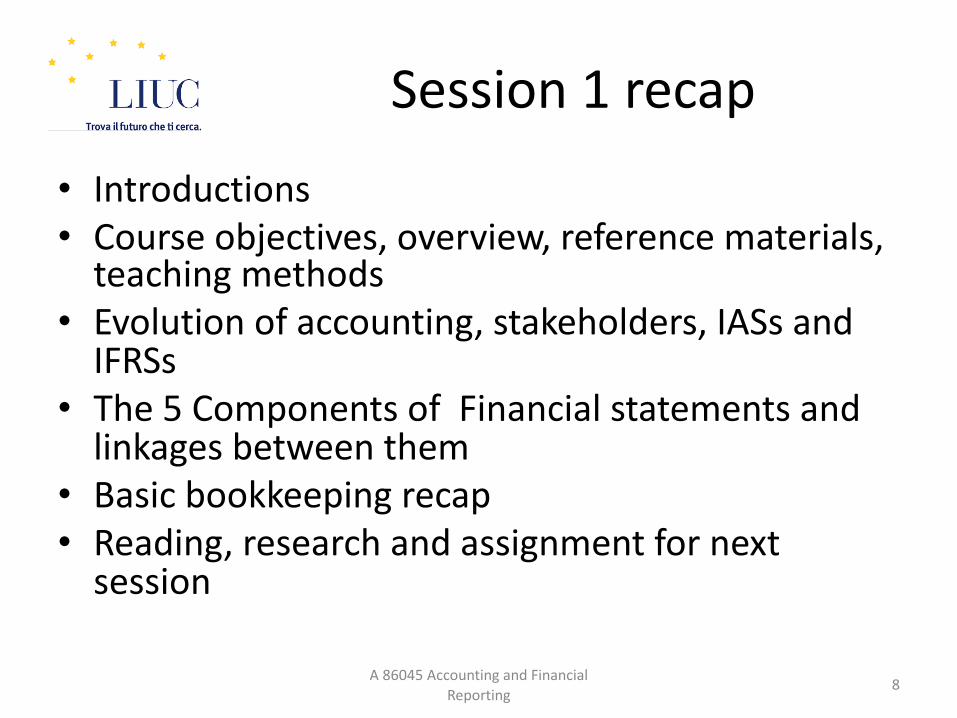
Session 1 recap
• Introductions• Course objectives, overview, reference materials,
teaching methods• Evolution of accounting, stakeholders, IASs and
IFRSs• The 5 Components of Financial statements and
linkages between them• Basic bookkeeping recap• Reading, research and assignment for next
session
A 86045 Accounting and Financial Reporting
8

• Understanding the Financial Statements Required by IAS 1– Profit or loss and other comprehensive income (one or two
statements, by nature or destination)
– Financial position (classified or unclassified)
– Changes in equity
– Cash flows (Direct or indirect method)
– Notes
• Currents Assets
• Current Liabilities
• The Linkages among the 4 Financial Statements
A 86045 Accounting and Financial
Reporting9
Session 1 recap - Cont’d

Required Reading and research
assignment
• Reading
– Melville
• Chapter 1 – The Regulatory Framework (14 pages)
• Chapter 2 – The IASB Conceptual Framework (19 pages)
• Chapter 3 – Presentation of Financial Statements (30 pages)• Chapter 4 – Accounting policies, accounting estimates and errors (5 pages)
• Chapter 21 – Related Parties and Changes in foreign exchange rates (7 pages)
– IFRS
• IAS 1 Presentation of Financial Statements (38 pages)• Exercises
– Melville Exercises 3.1 – 3.6
– Melville On-line multiple choice questions for the above chapters
– Exercise EX 1 Financial Statements
• Research assignment
– European companies in the Top Global 100 companies using IFRS
• RA 1 Financial Statement Presentation options
• RA 2 Data collection template for chosen companies
A 86045 Accounting and Financial
Reporting10

• Choose a company from the list of Europe’s Top Companies
• Obtain the 2017/2018 Annual Report and/or Form 20F (for US SEC Registrants)
• Locate the Consolidated Financial Statements prepared under IFRS
• Complete the template for the profit and loss accounts and statements of financial position
• Obtain an understanding of the company’s Business Model.
Research Assignment 2 Data collection
A 86045 Accounting and Financial Reporting
11

Research Assignment 1 - Financial
Statement Presentation Options
A 86045 Accounting and Financial
Reporting
Single Statement or Two Separate Statements
Expense by Nature or Expenses by destination or Function
Statement of Profit or Loss and Other Comprehensive Income
Statement of Financial Position
Current/Non-current
distinction
or By Order of Liquidity
Statement of Cash Flows
Indirect Method or Direct Method
�
�
�
�
�
�
�
�
Company_________________
RA 1Financial Statement Presentation Options 12
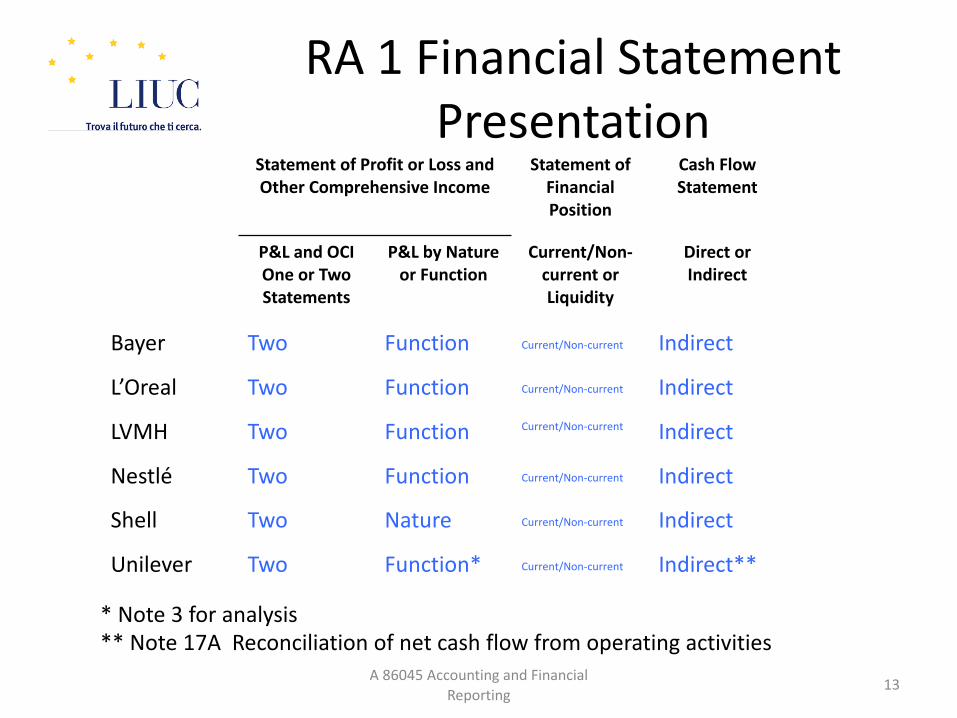
RA 1 Financial Statement Presentation
A 86045 Accounting and Financial Reporting
13
Statement of Profit or Loss and Other Comprehensive Income
Statement of Financial Position
Cash Flow Statement
P&L and OCI One or Two Statements
P&L by Nature or Function
Current/Non-current or Liquidity
Direct or Indirect
Bayer Two Function Current/Non-current Indirect
L’Oreal Two Function Current/Non-current Indirect
LVMH Two Function Current/Non-current Indirect
Nestlé Two Function Current/Non-current Indirect
Shell Two Nature Current/Non-current Indirect
Unilever Two Function* Current/Non-current Indirect**
* Note 3 for analysis** Note 17A Reconciliation of net cash flow from operating activities

Business Models
• How a company plans to make money.• Spreadsheets made it possible to model
businesses – by accident more than by design.• Two part model– 1. activities associated with making something:
design, purchase of raw materials, manufacturing etc.– 2. activities associated with selling something: finding
and reaching customers, transacting a sale etc.• Not to be confused with strategy – i.e. offering a
better business model or to a different market
A 86045 Accounting and Financial Reporting
14

RATIO ANALYSIS
A 86045 Accounting and Financial Reporting 15

Ratio analysis
• Profitability• Liquidity• Efficiency• Investment
A 86045 Accounting and Financial Reporting
16
Facilitates trend analysis (comparison over time) and the comparison with other companies in the same and/or other
industries irrespective of the company’s size or currency used to prepare the financial
statements (Common size analysis)

Profitability ratios
A 86045 Accounting and Financial Reporting 17
Gross profit margin %*(Net sales – cost of sales)
Sales=
Operating profit margin %**(Gross Profit – operating expenses) Sales
=
Net profit margin %Net income
Sales=
X 100
X 100
X 100
Gross Profit*
Operating Profit**
Sales = net sales/sales excluding VAT/sales revenues/consolidated sales revenues/revenue(s)/total revenues/group revenues/turnoverGross profit = gross marginOperating profit = operating income/income from operationsNet income = income for the period/consolidated net income/net profit/net profit for the year/profit after tax/profit for the period (year) (financial year)
Relative to sales

Profitability ratios Cont’d
A 86045 Accounting and Financial Reporting
18
Return on capital employed (ROCE) % **
Profit before Interest expense and tax (PBIT/EBIT)
Shareholders equity* + Long-term debt*=
Return on equity (ROE) %
Profit after tax
Shareholder’s equity*=
X 100
X 100
Relative to Investment
*Technically should be based on the average of beginning and ending amounts** Melville uses Non-current liabilities as opposed to Long-term debt
Shareholders’ equity = Net assets, Capital employed, Equity, Total equity, stockholders’ equity

Liquidity ratios
A 86045 Accounting and Financial Reporting
19
Current ratioCurrent assets
Current liabilities=
Quick ratio (acid test)
=Current assets – inventories*
Current liabilities
* Inventories = Inventories and work-in-progress, stock-in-trade
X : 1
X : 1

Efficiency ratios
A 86045 Accounting and Financial Reporting
20
Asset turnover**Sales
Non-current assets*=
Inventory turnover = Cost of sales
Inventory*
Inventory holding period (DOI)
= Inventory*
Cost of salesX 365
*Technically should be based on average of beginning and ending amounts** Melville uses net assets or capital employed
Cost of sales = Cost of revenuesInventories = Inventories and work-in-progress, stock-in-trade
Times
Times
Days

Efficiency ratios Cont’d
A 86045 Accounting and Financial
Reporting21
Accounts receivable
collection period
(DSO)
= *Accounts receivable (less VAT)
Credit Sales
X 365
Accounts payable
collection period
(DPO)
= *Accounts payable (less VAT)
Credit purchases
X 365
* Technically should be based on average of beginning and ending amounts
Accounts receivable = trade accounts receivable, receivables, trade receivables
Accounts payable = trade accounts payable, accounts payable trade, current
trade and other payables
Days
Days

Investment ratios
A 86045 Accounting and Financial Reporting
22
Dividend coverNet income
Dividends=
Earnings per share(IAS 33)
Net income
Weighted average number of ordinary shares outstanding during the year
=
Price/Earnings (P/E)Share market price
Earning per share (EPS)=
Dividend Yield %Dividend per share
Share market price= X 100
Dividend per shareOR Earning per share (EPS)

Investment ratios cont’d
A 86045 Accounting and Financial Reporting 23
Capital Gearing Long-term debt
*Equity=
Interest cover Profit before interest expense and tax (PBIT/EBIT)
Interest expense=
Long-term debt = financial liabilities, long-term borrowings, financial debts, interest bearing loans and borrowings, debt, financial debt, non-current financial debt, non-current borrowings and debt, borrowings and other financial liabilitiesInterest expense = finance costs, financing costs, financial expenses, finance expense, financial interest on debt, cost of net financial debt, finance costs on gross debt
* Melville uses Equity + Non-current liabilities
MARKET MEASURES, ANALYSTS FOCUS AND OTHER CONSIDERATIONS
A 86045 Accounting and Financial Reporting 24

Measures that Matter1. Execution of corporate strategy2. Management credibility3. Quality of corporate strategy4. Innovativeness5. Ability to attract and retain talented people6. Market share7. Management experience8. Alignment of compensation with shareholder
interests9. Research leadership10. Quality of major business processes
A 86012 Management and Principles of Accounting
25Source: Ernst & Young LLP Measures that matter
A86012 Session 10 Financia
l
Management

Analysts Focus
• EBITDARM• EBITDAR• EBITDA• EBIT• EBT
A 86045 Accounting and Financial Reporting 26
Earnings before tax, interest, depreciation, amortization, rents and restructuring, management fees

Other useful ratios/information
• Effective tax rate (Income taxes as a % of Pre-tax income)
• Intangibles as a % total assets• Intangibles as a % of equity• Debt maturities/covenants• Market Capitalization vs. Net equity• R&D as a % of revenues• Contingencies
A 86045 Accounting and Financial Reporting 27
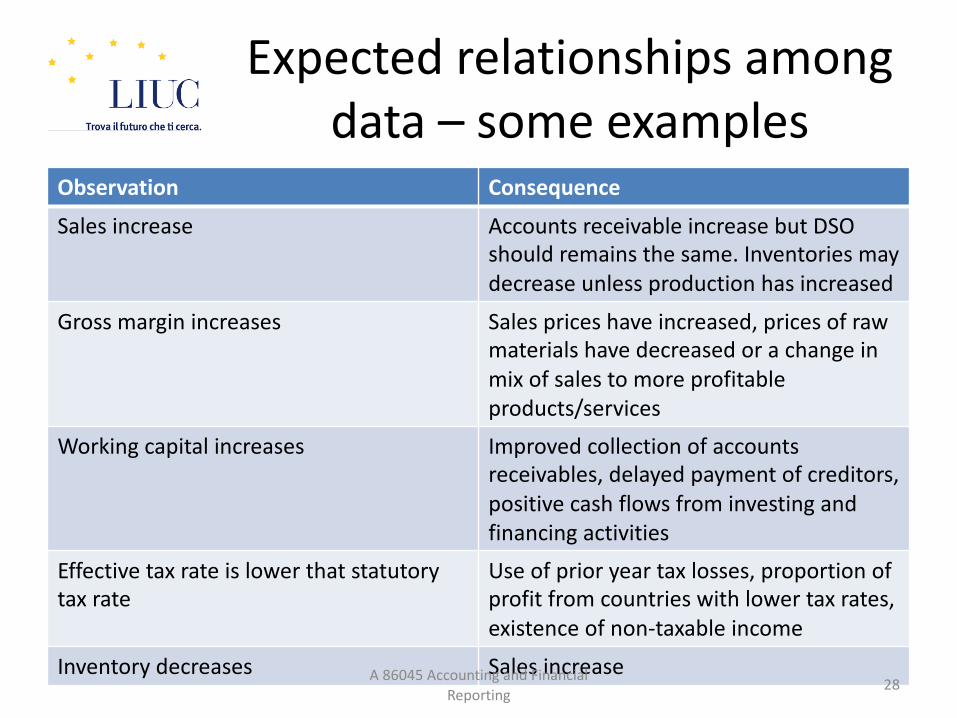
Expected relationships among data – some examples
Observation ConsequenceSales increase Accounts receivable increase but DSO
should remains the same. Inventories may decrease unless production has increased
Gross margin increases Sales prices have increased, prices of raw materials have decreased or a change in mix of sales to more profitable products/services
Working capital increases Improved collection of accounts receivables, delayed payment of creditors, positive cash flows from investing and financing activities
Effective tax rate is lower that statutory tax rate
Use of prior year tax losses, proportion of profit from countries with lower tax rates, existence of non-taxable income
Inventory decreases Sales increaseA 86045 Accounting and Financial Reporting
28

RATIO, TREND & COMMON SIZE ANALYSIS
A 86045 Accounting and Financial Reporting 29

Ratio Analysis
A 86045 Accounting and Financial Reporting
30
ProfitabilityGross margin (Gross profit/Revenues) % #DIV/0!Operating margin (Operating profit/Revenues) % #DIV/0!Net profit margin (Net profit/Revenues) % #DIV/0!Return on equity (Net profit/Shareholders' equity) % #DIV/0!Return on Capital employed (PBIT/Shareholders' equity + Long-term debt) % #DIV/0!
LiquidityCurrent ratio (Current assets/Current liabilities) Ratio:1 #DIV/0!Quick ratio (Current assets - inventory/Current liabilities) Ratio:1 #DIV/0!
Efficiency ratiosAsset Turnover (Sales/Non-current assets) Times #DIV/0!Inventory holding period (DOI) (Cost of sales/inventory x 365) Days #DIV/0!Inventory turnover (Cost of sales/inventory) Times #DIV/0!Trade receivables collection period (DSO) Days #DIV/0!Trade payable payment period (DPO) Days #DIV/0!
Investment ratiosEarnings per share (EPS) USD #DIV/0!Price Earnings ratio (P/E) (Share price/EPS x CHF Xrate) Times #DIV/0!Dividend cover Times #DIV/0!Dividend yield % #DIV/0!Debt/Equity ratio (Gearing) Ratio #DIV/0!Interest cover Times #DIV/0!
OtherEffective tax rate % #DIV/0!R&D as a % of revenues % #DIV/0!Intangibles as a % of total assets % #DIV/0!Intangibles as a % of equity % #DIV/0!
Com
paris
ons a
mon
gst d
ata

Trend Analysis
A 86045 Accounting and Financial Reporting
31
Profitability Year 1 Year 2 Year 3Gross margin (Gross profit/Revenues) % #DIV/0! #DIV/0! #DIV/0!Operating margin (Operating profit/Revenues) % #DIV/0! #DIV/0! #DIV/0!Net profit margin (Net profit/Revenues) % #DIV/0! #DIV/0! #DIV/0!Return on equity (Net profit/Shareholders' equity) % #DIV/0! #DIV/0! #DIV/0!Return on Capital employed (PBIT/Shareholders' equity + Long-term debt) % #DIV/0! #DIV/0! #DIV/0!
LiquidityCurrent ratio (Current assets/Current liabilities) Ratio:1 #DIV/0! #DIV/0! #DIV/0!Quick ratio (Current assets -inventory/Current liabilities) Ratio:1 #DIV/0! #DIV/0! #DIV/0!
Efficiency ratiosAsset Turnover (Sales/Non-current assets) Times #DIV/0! #DIV/0! #DIV/0!Inventory holding period (DOI) (Cost of sales/inventory x 365) Days #DIV/0! #DIV/0! #DIV/0!Inventory turnover (Cost of sales/inventory) Times #DIV/0! #DIV/0! #DIV/0!Trade receivables collection period (DSO) Days #DIV/0! #DIV/0! #DIV/0!Trade payable payment period (DPO) Days #DIV/0! #DIV/0! #DIV/0!
Investment ratiosEarnings per share (EPS) USD #DIV/0! #DIV/0! #DIV/0!Price Earnings ratio (P/E) (Share price/EPS x CHF Xrate) Times #DIV/0! #DIV/0! #DIV/0!Dividend cover Times #DIV/0! #DIV/0! #DIV/0!Dividend yield % #DIV/0! #DIV/0! #DIV/0!Debt/Equity ratio (Gearing) Ratio #DIV/0! #DIV/0! #DIV/0!Interest cover Times #DIV/0! #DIV/0! #DIV/0!
OtherEffective tax rate % #DIV/0! #DIV/0! #DIV/0!R&D as a % of revenues % #DIV/0! #DIV/0! #DIV/0!Intangibles as a % of total assets % #DIV/0! #DIV/0! #DIV/0!Intangibles as a % of equity % #DIV/0! #DIV/0! #DIV/0!
Comparison over time

Common Size Analysis
A 86045 Accounting and Financial Reporting
32
Profitability Co A Co B Co CGross margin (Gross profit/Revenues) % #DIV/0! #DIV/0! #DIV/0!Operating margin (Operating profit/Revenues) % #DIV/0! #DIV/0! #DIV/0!Net profit margin (Net profit/Revenues) % #DIV/0! #DIV/0! #DIV/0!Return on equity (Net profit/Shareholders' equity) % #DIV/0! #DIV/0! #DIV/0!Return on Capital employed (PBIT/Shareholders' equity + Long-term debt) % #DIV/0! #DIV/0! #DIV/0!
LiquidityCurrent ratio (Current assets/Current liabilities) Ratio:1 #DIV/0! #DIV/0! #DIV/0!Quick ratio (Current assets -inventory/Current liabilities) Ratio:1 #DIV/0! #DIV/0! #DIV/0!
Efficiency ratiosAsset Turnover (Sales/Non-current assets) Times #DIV/0! #DIV/0! #DIV/0!Inventory holding period (DOI) (Cost of sales/inventory x 365) Days #DIV/0! #DIV/0! #DIV/0!Inventory turnover (Cost of sales/inventory) Times #DIV/0! #DIV/0! #DIV/0!Trade receivables collection period (DSO) Days #DIV/0! #DIV/0! #DIV/0!Trade payable payment period (DPO) Days #DIV/0! #DIV/0! #DIV/0!
Investment ratiosEarnings per share (EPS) USD #DIV/0! #DIV/0! #DIV/0!Price Earnings ratio (P/E) (Share price/EPS x CHF Xrate) Times #DIV/0! #DIV/0! #DIV/0!Dividend cover Times #DIV/0! #DIV/0! #DIV/0!Dividend yield % #DIV/0! #DIV/0! #DIV/0!Debt/Equity ratio (Gearing) Ratio #DIV/0! #DIV/0! #DIV/0!Interest cover Times #DIV/0! #DIV/0! #DIV/0!
OtherEffective tax rate % #DIV/0! #DIV/0! #DIV/0!R&D as a % of revenues % #DIV/0! #DIV/0! #DIV/0!Intangibles as a % of total assets % #DIV/0! #DIV/0! #DIV/0!Intangibles as a % of equity % #DIV/0! #DIV/0! #DIV/0!
Comparison with other companiesIrrespective of size or reporting currency

REQUIRED READING AND RESEARCH ASSIGNMENT
A 86045 Accounting and Financial Reporting 33
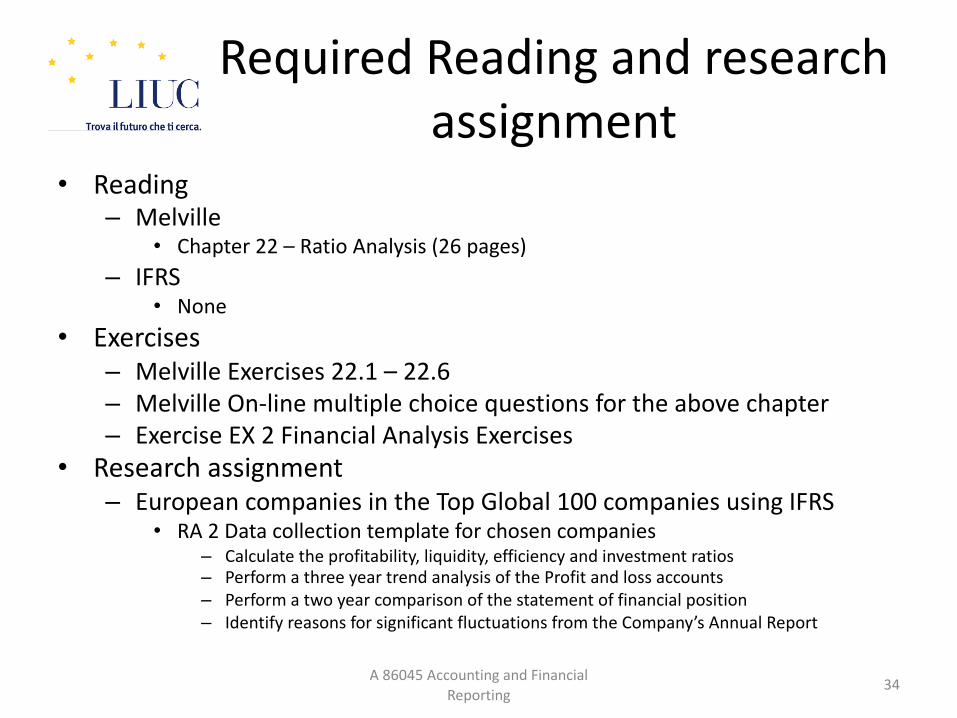
Required Reading and research
assignment
• Reading
– Melville
• Chapter 22 – Ratio Analysis (26 pages)
– IFRS
• None
• Exercises
– Melville Exercises 22.1 – 22.6
– Melville On-line multiple choice questions for the above chapter
– Exercise EX 2 Financial Analysis Exercises
• Research assignment
– European companies in the Top Global 100 companies using IFRS
• RA 2 Data collection template for chosen companies
– Calculate the profitability, liquidity, efficiency and investment ratios
– Perform a three year trend analysis of the Profit and loss accounts
– Perform a two year comparison of the statement of financial position
– Identify reasons for significant fluctuations from the Company’s Annual Report
A 86045 Accounting and Financial
Reporting34

RA1Researchassignmenttemplate
A86045AccountingandFinanciaklReporting PaulG.Smith
ResearchassignmenttemplateCompany
2016 2015 2014 2016 2015IncomeStatement Statementoffinancialposition €millions €millions
€millions €millions €millions Non-currentassetsNetsales GoodwillOtherrevenues Intangibleassets
Totalrevenues 0 0 0 Property,plant&equipmentCostofsales Investments
Grossprofit 0 0 0 DeferredtaxesOperatingexpenses OtherResearch&development 0 0Selling,generalandadministrativeexpenses CurrentassetsDepreciation,ammortizationandprovisions Inventories/Long-termcontractsOtherincome(expense) Tradereceivables
Operatingprofit 0 0 0 OthercurrentassetsFinanceincome(expense) Short-terminvestmentsShareofresultofassociatedcompanies Cashandcashequivalents
Pre-taxprofit 0 0 0 AssetsheldfordisposalIncometax 0 0
Netprofitcontinuingoperations 0 0 0Discontinuedoperations Totalassets 0 0
Netprofit 0 0 0
CurrentliabilitiesShort-termBorrowingsTradepayablesIncometaxesProvisionsOthercurrentliabilitiesLiabilitiesheldfordisposal
0 0
Non-currentliabilitiesLong-termBorrowingsProvisionsDeferredtaxliabilitiesPensionsandemployeebenefitsOther
0 0Shareholders'equityTotalequityandliabilities 0 0
WeightedAveragenumberofsharesoutstandingSharepriceMarketcapitalization 0 0Dividendpershare
NBIntheincomestatementinsertnega?venumberswithaminussign
RA 2 Research Assignment Template
A 86045 Accounting and Financial Reporting
RA2 Research assignment template
If the company classifies expenses by nature put all
expenses into operating expenses
35

Session 2 summary
• Recap Session 1 and the 4 basic financial statements
• Financial analysis• Ratio analysis (profitability, liquidity, efficiency
and investment)• Ratio, trend and common size analysis• Reading, research and assignment for next
sessionA 86045 Accounting and Financial
Reporting 36

Overview of Session 3
• Segment Analysis – (IFRS 8)• Earnings per share – (IAS 33)• Hands on application and discussion of
financial analysis techniques using the companies researched– Common size analysis– Trend analysis– Ratio analysis– Industry comparisons
A 86045 Accounting and Financial Reporting
37

Session Validation
• Name the key ratio (s) used to assess liquidity• What type of analysis do we perform to
compare companies of different sizes and across different industries?
• What ratio would you use to assess a company’s ability to continue to pay the interest on its loans as it becomes due?
• How many years data do we need to perform a meaningful trend analysis?
A 86045 Accounting and Financial Reporting
38