Embed Size (px)
Citation preview
Aalborg Universitet
An assessment of business intelligence in public hospitals
Gaardboe, Rikke; Sandalgaard, Niels; Nyvang, Tom
Published in:International Journal of Information Systems and Project Management
DOI (link to publication from Publisher):10.12821/ijispm050401
Publication date:2017
Document VersionPublisher's PDF, also known as Version of record
Link to publication from Aalborg University
Citation for published version (APA):Gaardboe, R., Sandalgaard, N., & Nyvang, T. (2017). An assessment of business intelligence in public hospitals.International Journal of Information Systems and Project Management, 5(4), 5-18.https://doi.org/10.12821/ijispm050401
General rightsCopyright and moral rights for the publications made accessible in the public portal are retained by the authors and/or other copyright ownersand it is a condition of accessing publications that users recognise and abide by the legal requirements associated with these rights.
? Users may download and print one copy of any publication from the public portal for the purpose of private study or research. ? You may not further distribute the material or use it for any profit-making activity or commercial gain ? You may freely distribute the URL identifying the publication in the public portal ?
Take down policyIf you believe that this document breaches copyright please contact us at [email protected] providing details, and we will remove access tothe work immediately and investigate your claim.
Downloaded from vbn.aau.dk on: November 30, 2021
ISSN (print):2182-7796, ISSN (online):2182-7788, ISSN (cd-rom):2182-780X
Available online at www.sciencesphere.org/ijispm
International Journal of Information Systems and Project Management, Vol. 5, No. 4, 2017, 5-18
◄ 5 ►
An assessment of business intelligence in public hospitals
Rikke Gaardboe
Department of Communication and Psychology, Aalborg University
Rendsburggade 14, 9000 Aalborg
Denmark
www.shortbio.org/[email protected]
Niels Sandalgaard
Department of Business and Management, Aalborg University
Fibigerstraede 11, 9220 Aalborg OE
Denmark
www.shortbio.org/[email protected]
Tom Nyvang
Department of Communication and Psychology, Aalborg University
Rendsburggade 14, 9000 Aalborg
Denmark
www.shortbio.org/[email protected]
Abstract:
In this paper, DeLone and McLean's information systems success model is empirically tested on 12 public hospitals in
Denmark. The study aims to investigate the factors that contribute to business intelligence (BI) success. 1,352 BI end-
users answered the questionnaire. A partial least square structural equation model was used to empirically test the
model. We find that system quality is positively and significantly associated with use and user satisfaction, and that
information quality is positively and significantly associated with user satisfaction. User satisfaction is positively and
significantly related to individual impact. The other paths in the model are insignificant. Our findings also provide
empirical support for the role of user satisfaction as a mechanism that mediates the relationship between information
quality or system quality and individual impact. User satisfaction is not only a critical construct in the information
systems success model but it also serves as a mediator. Generally, the model finds empirical support, as it has a good fit
and predictive value.
Keywords: IS success; evaluation; business intelligence; healthcare information system; quantitative method.
DOI: 10.12821/ijispm050401
Manuscript received: 28 April 2017
Manuscript accepted: 20 November 2017
Copyr ight © 2017, SciKA. General permission to republ ish in pr int or electronic forms, but not for profit , a ll or part of this mater ial is granted, provided that the
Internat ional Journal o f Informat ion Systems and Pro ject Management copyr ight notice is given and that reference made to the publicat ion, to it s date of issue, and to
the fact that reprint ing pr ivileges were granted by permiss ion o f SciKA - Associat ion for Promotion and Disseminat ion o f Scient ific Knowledge.
An assessment of business intelligence in public hospitals
International Journal of Information Systems and Project Management, Vol. 5, No. 4, 2017, 5-18
◄ 6 ►
1. Introduction
Business intelligence and analytics are increasingly important technologies for organizations. In many organizations,
Information Technology (IT) managers prioritize investments focused on establishing or operating a technology
infrastructure that is not only able to handle the increasing volume of data but also make that data accessible to analysts
and decision makers [1]. One driver of this development is the desire of many executives to develop data-driven
organizations [2]. According to Madsen [3], “data-driven” means that “information must be consumable and contextual,
to encourage action that will modify behavior over time.”
One sector that generates large amounts of data is the healthcare industry owing to its need to meet requirements related
to patient records, compliance, and patient care [4]. Therefore, use of business intelligence (BI) to data from healthcare
information systems (HIS) is relevant. BI is an umbrella term that covers the applications, infrastructure, tools, and best
practices that enable organizations to access and analyze information with the aim of improving and optimizing
decisions and performance [5]. Notably, a study by Parente and Dunbar shows that healthcare organizations that use
HIS have higher operating margins and total margins than organizations without HIS [6].
Healthcare is one of the most knowledge-driven and complex sectors in the world. In addition, the area represents one
of the most significant economic challenges [7]. As such, BI has the potential to improve the quality, efficiency, and
effectiveness of health services [8]. More specifically, Mettler and Vimarlund [8] suggest that, in the field of healthcare,
BI can add value to patient services, marketing management, operational analyses, and personal development, as well as
enhance financial strength. These authors also point out that real-time data is essential for improving the quality of
healthcare services and decreasing the risk for patients. However, implementing and succeeding with BI is a
complicated process [9], and BI technologies are expensive, given the costs associated with software, licenses, training,
and wages [10]. Notably, many organizations fail to realize the expected benefits of BI [10–12].
In the Scandinavian countries, the majority of hospitals are funded and operated by the public sector. Private hospitals
and privately funded health insurance account for only a small part of the industry. According to the Scandinavian
welfare model, citizens have a fundamental right to proper care and equal treatment. A fundamental principle in this
regard is that all citizens have a right to healthcare regardless of their social background, and healthcare benefits are not
linked to health insurance or other forms of user payment [13]. Notably, however, the Scandinavian healthcare sector
has been reluctant to use BI in conjunction with its data because of the complexity of such systems and the data itself
[3]. However, in Denmark, the public hospitals use BI in combination with HIS, accounting, and payroll systems, and
the users of BI have a variety of job functions (e.g., doctors, nurses, managers, administrative staff). In some cases,
users have access to both the source system and BI, while the BI systems must be used to access certain types of
information in other cases.
A theoretical issue that has dominated the information systems (IS) research for many years is IS success. The literature
offers numerous definitions and measures of IS success [14]. DeLone and McLean introduced the IS success model,
which consists of six constructs: system quality, information quality, user satisfaction, use, individual impact, and
organizational impact [15]-[16]. Like the healthcare sector, the public sector has a significant amount of data and a
complex system landscape [17]. Moreover, there are differences between IS evaluations in private and public
organizations [18]. Most studies of IS success have been carried out in private organizations [14], while empirical
assessments of IS success are lacking in the public sector [14]/ [19]. Consequently, research on IS success in relation to
BI in the healthcare setting is needed and, for this purpose, DeLone and McLean’s model [15] is relevant. In this regard,
our goal is to assess business intelligence success in public hospitals in Denmark. In this paper, we extend the paper
presented at the HCIST 2017 conference [2].
We test DeLone and McLean’s IS success model on 12 public hospitals and their administrations. The article
contributes to the subfield of "BI success," especially "BI success in public hospitals." The remainder of the article is
organized as follows. In the next section, we present the IS success model, while we discuss our method in Section 3. In
Section 4, we present the results, which are discussed in Section 5. The final section covers our conclusions.
An assessment of business intelligence in public hospitals
International Journal of Information Systems and Project Management, Vol. 5, No. 4, 2017, 5-18
◄ 7 ►
2. Related literature and research model
2.1 Business intelligence systems
A wide range of BI systems can be found in organizations [20]. BI can be understood from both technical and business
perspectives [21]. Technical definitions of BI focus on applications, infrastructure, tools, and best practices [5]. In such
contexts, BI systems are often categorized as: (a) extraction-transformation-load (ETL) systems in which data are
transferred from the transaction systems to the data warehouse; (b) data warehouses (DWs), which are databases for
storing and aggregating data; (c) analytical tools, such as online analytics processing (OLAP), which enable users to
access, analyze, and share the information stored in DWs; and (d) the presentation layer, which is the user interface
[21].
The definitions that adopt a business perspective emphasize BI as concepts and methods aimed at improving decision
making in the organization [22] and distributing “the right information to the right people at the right time” [23].
According to Bach et al. is the importance of BI related to; “…the generation of timely, relevant and easy to use
information which will have positive impact on making better and faster decisions at different management levels.”[51].
Wixom and Watson [24] define BI as “commonly used to describe the technologies, applications, and processes for
gathering, storing, accessing, and analyzing data to help users make better decisions.” This definition implies that if BI
is utilized to enhance decision making, it can affect the organization's performance.
A considerable amount of literature focuses on the value of BI. The general finding is that BI enhances organizational
performance by accomplishing a goal, such as increasing revenue and productivity, or reducing costs [25]. BI also
contributes to customer and employee satisfaction. A second discussion in the extant literature centers on the
organizational impact of BI. In this regard, “impact” refers to “a state when organizations have achieved one or more of
following outcomes: improved operational efficiency of processes; new/improved products or services; and/or
strengthened organizational intelligence and dynamic organizational structure” [25]. Several researchers have shown
that BI can have an impact on transforming business processes [26], minimizing mistargeted customers [26], enhancing
organizational intelligence, and developing products or services [25].
In sum, the definition of BI contains technical, organizational, and individual perspectives. The technology makes it
possible for system users to make better decisions. Against this background, behavioral change and, thereby, an impact
on organizational performance occur.
2.2 Information systems success
A common method of assessing the success of information systems is DeLone and McLean's IS success model [27]. At
the first International Conference on Information Systems in 1980, Peter Keen asked: “What is the dependent variable?”
[28]. From 1980 to 1992, numerous researchers contributed to the debate with research on the dependent variable.
Based on these contributions, DeLone and McLean prepared the IS success model. In his 1980 article, Keen also called
for a theoretical foundation for IS research [28]. In response, DeLone and McLean chose to anchor their model in
Shannon and Weaver’s three levels of communication [29] and in Mason’s information influence theory [30]. The
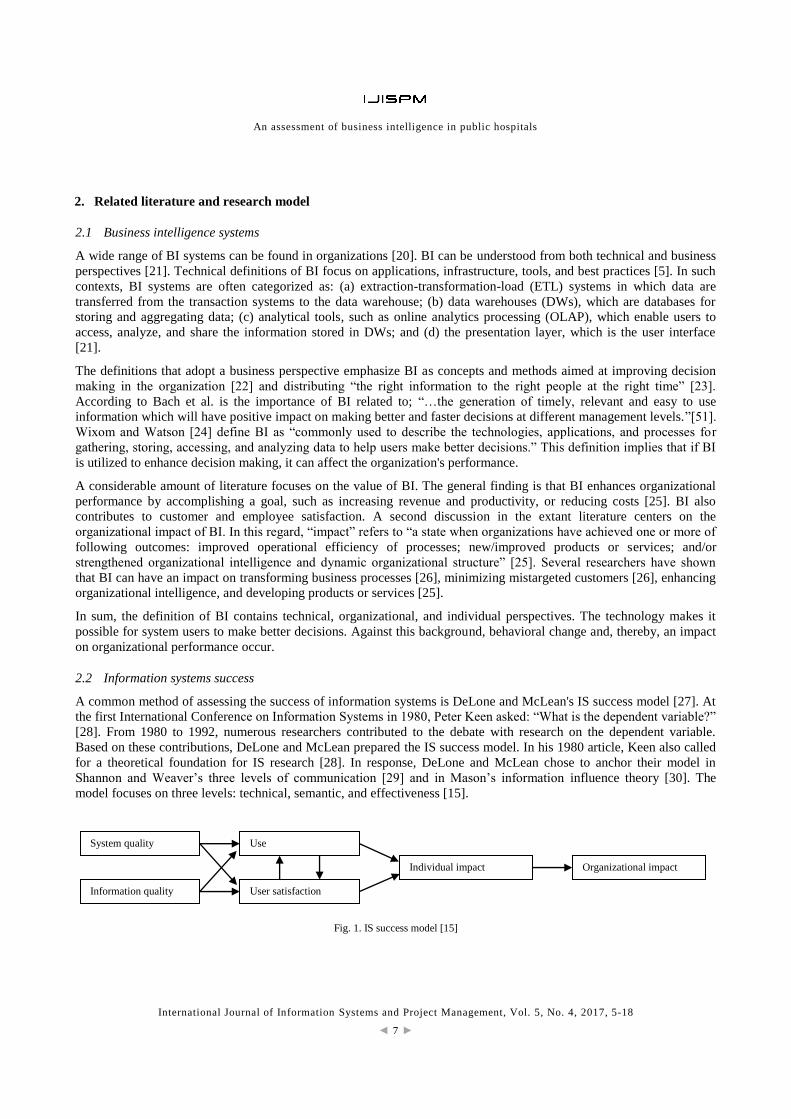
model focuses on three levels: technical, semantic, and effectiveness [15].
Fig. 1. IS success model [15]
System quality
Information quality User satisfaction
Use
Individual impact Organizational impact
An assessment of business intelligence in public hospitals
International Journal of Information Systems and Project Management, Vol. 5, No. 4, 2017, 5-18
◄ 8 ►
Figure 1 illustrates the interrelated IS success factors. System quality and information quality characterize the IS. An
end-user operating the system can experience various levels of satisfaction, which influence the individual impact.
Finally, the individual impact affects the impact at the organizational level. According to the model, system quality
occurs at the technical level, while information quality is on the semantic level. User satisfaction, individual impact, and
organizational impact reflect the effectiveness of the system [15]-[16].
System quality measures the quality of the inputs and of the IS itself as a piece of software [31]. Petter, DeLone, and
McLean [32] define system quality as the desirable characteristics of the system. Often, this aspect is measured in terms
of ease of learning, ease of use, flexibility, and response times. Information quality refers to the quality of the
information produced by the IS. It is an essential construct because the information user makes decisions based on the
information provided by the IS [33]. The construct is typically measured in terms of understandability, accuracy,
relevance, conciseness, completeness, understandability, currency, usability, and timeliness [32]. Use is defined as the
manner and extent to which the staff utilizes the IS’s capabilities [32]. According to Seddon [33], use is related to the
benefits of the system [33]. The construct can be measured as the frequency of use, the nature of use, the amount of use,
the extent of use, or the purpose of use [32]. User satisfaction can be defined as “the sum of one's feelings or attitudes
toward a variety of factors affecting [a certain] situation” [34]. It can be measured as transactional or overall
satisfaction. Transactional satisfaction is the satisfaction associated with an individual transaction, while a series of
transactions give rise to overall satisfaction [35]. DeLone and McLean define individual impact as “an indication that
an information system has given a user better understanding of the decision context, has improved his or her decision-
making productivity, has produced a change in user activity or has changed the decision maker’s perception of the
importance or usefulness of the information system” [15]. The final construct in DeLone and McLean's IS success
model is organizational impact, which measures the impact arising from the use of the system in terms of organizational
performance [15]. This measure may focus on organizational costs, cost reductions, overall productivity, e-government,
and business-process change [32].
DeLone and McLean encouraged other researchers to validate and further develop their model. Based on numerous
contributions, DeLone and McLean then updated the model in 2003 by introducing three changes. First, individual
impact and organizational impact were incorporated into a new "net benefits" construct to reflect the fact that IS success
can affect workgroups, industries, and societies [36]-[37]. With this revision, the model could be applied to any level of
analysis that a researcher found relevant [32]. Second, DeLone and McLean clarified the construct of “use.” The
construct “intention to use” was included in the updated version of the model because increased user satisfaction can
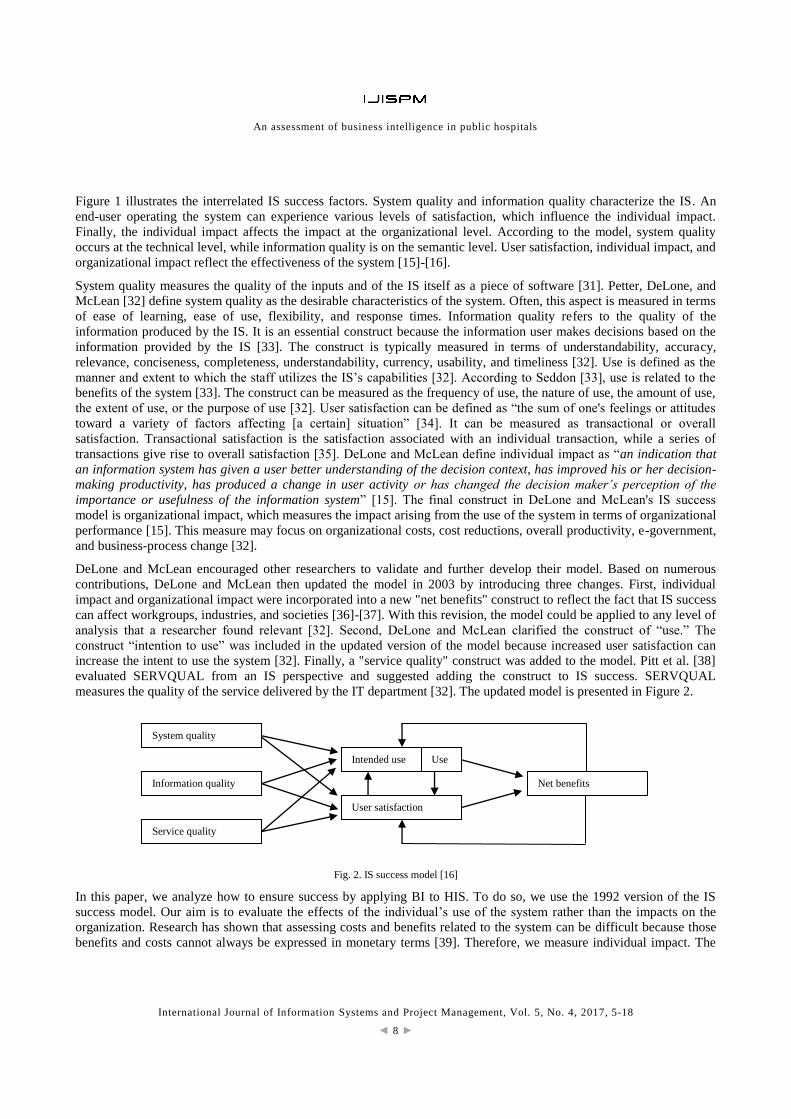
increase the intent to use the system [32]. Finally, a "service quality" construct was added to the model. Pitt et al. [38]
evaluated SERVQUAL from an IS perspective and suggested adding the construct to IS success. SERVQUAL
measures the quality of the service delivered by the IT department [32]. The updated model is presented in Figure 2.
Fig. 2. IS success model [16]
In this paper, we analyze how to ensure success by applying BI to HIS. To do so, we use the 1992 version of the IS
success model. Our aim is to evaluate the effects of the individual’s use of the system rather than the impacts on the
organization. Research has shown that assessing costs and benefits related to the system can be difficult because those
benefits and costs cannot always be expressed in monetary terms [39]. Therefore, we measure individual impact. The
Net benefits
User satisfaction
Intended use Use
System quality
Information quality
Service quality
An assessment of business intelligence in public hospitals
International Journal of Information Systems and Project Management, Vol. 5, No. 4, 2017, 5-18
◄ 9 ►
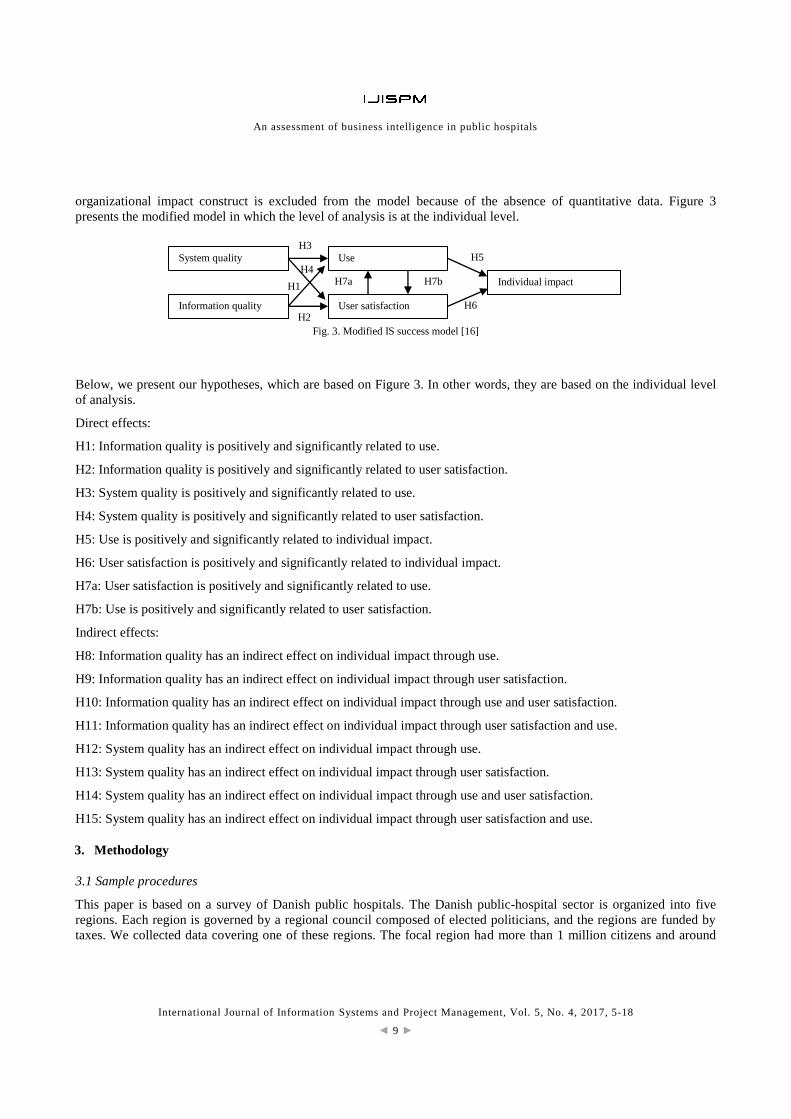
organizational impact construct is excluded from the model because of the absence of quantitative data. Figure 3
presents the modified model in which the level of analysis is at the individual level.
Fig. 3. Modified IS success model [16]
Below, we present our hypotheses, which are based on Figure 3. In other words, they are based on the individual level
of analysis.
Direct effects:
H1: Information quality is positively and significantly related to use.
H2: Information quality is positively and significantly related to user satisfaction.
H3: System quality is positively and significantly related to use.
H4: System quality is positively and significantly related to user satisfaction.
H5: Use is positively and significantly related to individual impact.
H6: User satisfaction is positively and significantly related to individual impact.
H7a: User satisfaction is positively and significantly related to use.
H7b: Use is positively and significantly related to user satisfaction.
Indirect effects:
H8: Information quality has an indirect effect on individual impact through use.
H9: Information quality has an indirect effect on individual impact through user satisfaction.
H10: Information quality has an indirect effect on individual impact through use and user satisfaction.
H11: Information quality has an indirect effect on individual impact through user satisfaction and use.
H12: System quality has an indirect effect on individual impact through use.
H13: System quality has an indirect effect on individual impact through user satisfaction.
H14: System quality has an indirect effect on individual impact through use and user satisfaction.
H15: System quality has an indirect effect on individual impact through user satisfaction and use.
3. Methodology
3.1 Sample procedures
This paper is based on a survey of Danish public hospitals. The Danish public-hospital sector is organized into five
regions. Each region is governed by a regional council composed of elected politicians, and the regions are funded by
taxes. We collected data covering one of these regions. The focal region had more than 1 million citizens and around
System quality
Information quality User satisfaction
Use
Individual impact
H5
H6
H7b H7a
H3
H4
H1
H2
An assessment of business intelligence in public hospitals
International Journal of Information Systems and Project Management, Vol. 5, No. 4, 2017, 5-18
◄ 10 ►
25,000 employees. At the time of the study, the region used the Tableau BI system for several purposes, including
follow-up on Key Performance Indicators (KPIs), resource planning, and different kinds of analyses.
The data were collected by sending out a questionnaire to employees at 12 hospitals in the focal region. Hence, the unit
of analysis is the individual user level and not the organizational level. Only employees registered as users of the BI
system were chosen to participate. First, a general email was sent out that explained the project and encouraged
employees to participate. Then each respondent received an email with a link to the questionnaire. The questionnaire
was prepared using an online survey program. The first question focused on whether the respondent had actually used
the BI system. If the respondent answered “no,” then no further questions were asked. The questionnaire was sent to a
total of 4,232 employees, including members of management, nurses, doctors, and administrative staff. We sent a
reminder two weeks after the initial distribution of the survey to encourage respondents to complete the questionnaire.
In general, we followed the guidelines set by Dillman [40].
Of the 4,232 employees invited to participate, 1,351 responded, giving a response rate of 32%. Of these, 605 indicated
that they did not use the BI system. This left us with 746 responses to be used for the data analysis.
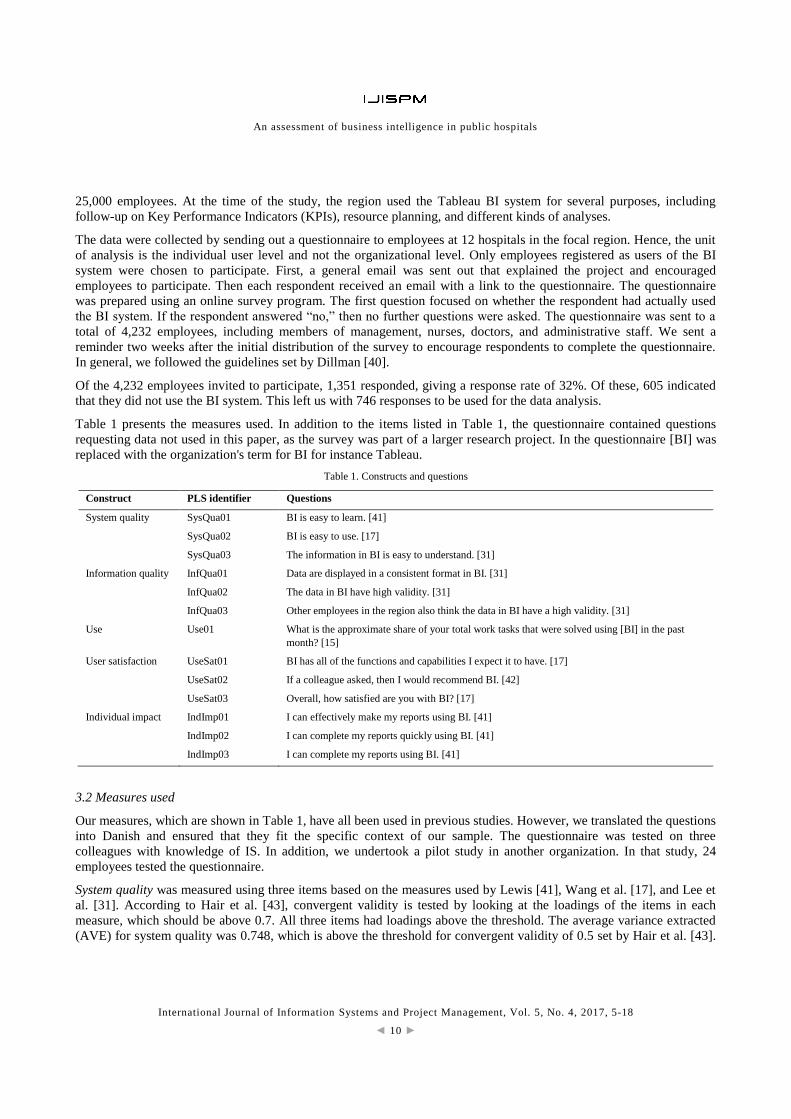
Table 1 presents the measures used. In addition to the items listed in Table 1, the questionnaire contained questions
requesting data not used in this paper, as the survey was part of a larger research project. In the questionnaire [BI] was
replaced with the organization's term for BI for instance Tableau.
Table 1. Constructs and questions
Construct PLS identifier Questions
System quality SysQua01 BI is easy to learn. [41]
SysQua02 BI is easy to use. [17]
SysQua03 The information in BI is easy to understand. [31]
Information quality InfQua01 Data are displayed in a consistent format in BI. [31]
InfQua02 The data in BI have high validity. [31]
InfQua03 Other employees in the region also think the data in BI have a high validity. [31]
Use Use01 What is the approximate share of your total work tasks that were solved using [BI] in the past
month? [15]
User satisfaction UseSat01 BI has all of the functions and capabilities I expect it to have. [17]
UseSat02 If a colleague asked, then I would recommend BI. [42]
UseSat03 Overall, how satisfied are you with BI? [17]
Individual impact IndImp01 I can effectively make my reports using BI. [41]
IndImp02 I can complete my reports quickly using BI. [41]
IndImp03 I can complete my reports using BI. [41]
3.2 Measures used
Our measures, which are shown in Table 1, have all been used in previous studies. However, we translated the questions
into Danish and ensured that they fit the specific context of our sample. The questionnaire was tested on three
colleagues with knowledge of IS. In addition, we undertook a pilot study in another organization. In that study, 24
employees tested the questionnaire.
System quality was measured using three items based on the measures used by Lewis [41], Wang et al. [17], and Lee et
al. [31]. According to Hair et al. [43], convergent validity is tested by looking at the loadings of the items in each
measure, which should be above 0.7. All three items had loadings above the threshold. The average variance extracted
(AVE) for system quality was 0.748, which is above the threshold for convergent validity of 0.5 set by Hair et al. [43].
An assessment of business intelligence in public hospitals
International Journal of Information Systems and Project Management, Vol. 5, No. 4, 2017, 5-18
◄ 11 ►
The reliability of system quality was analyzed by calculating composite reliability and Cronbach's alpha. Both of these
measures were above the threshold of 0.7 recommended by Hair et al. [43]. Furthermore, the Heterotrait-Monotrait ratio
(HTMT) did not include the number 1, which indicates acceptable discriminant validity.
Information quality was based on the measure used by Lee et al. [31]. It consisted of three items rated using a five-point
Likert scale. All three items had high loadings (above 0.7), which indicates good convergent validity. The AVE of
0.657 also supports this conclusion. Composite reliability for information quality was 0.851, while the Cronbach’s alpha
was 0.744, indicating good reliability. The HTMT did not include the number 1, which suggests acceptable discriminant
validity.
Use was measured using one item asking about the share of the respondent’s total work tasks that were resolved with
the help of the BI system. The respondents were asked to indicate their responses on a five-point Likert scale. The
measure was based on a similar measure developed by Delone and McLean [15].
User satisfaction was measured using three items. Two of the items were based on Wang et al. [17], while the third had
previously been used by Batenburg et al. [42]. The item focused on the respondent’s willingness to recommend the
system. All three items had high loadings (above 0.85) and the AVE for the measure was 0.809, indicating convergent
validity. The composite reliability of 0.927 and Cronbach’s alpha of 0.882 indicate high reliability. The HTMT did not
include the number 1, which suggests acceptable discriminant validity.
Individual impact was measured using three items based on Lewis [41]. All of the items had high loadings (above 0.80),
and the AVE was 0.762, which indicates good convergent validity. With a composite reliability and a Cronbach’s alpha
of 0.906 and 0.844, respectively, the reliability is also satisfactory. As the HTMT did not include the number 1,
discriminant validity also appears to be acceptable.
4. Results
The fifteen hypotheses were tested based on DeLone and Mclean’s model [15], as illustrated in Figure 3. The tests used
smart PLS (version 3.2) with 5,000 bootstrap replications. Even though our sample was sufficient in size to use
covariance-based structural equation modeling, we used the PLS approach because it makes no distributional
assumption. As our measure of use was not normally distributed, we found PLS to be the most appropriate approach.
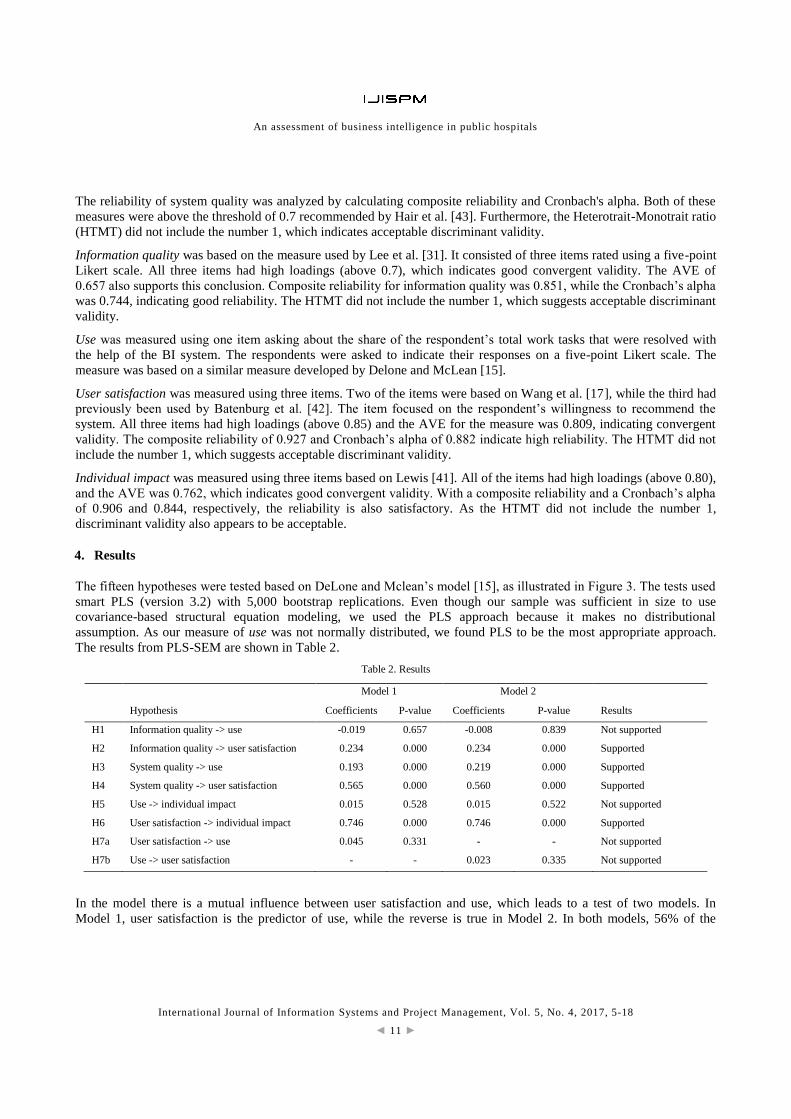
The results from PLS-SEM are shown in Table 2.
Table 2. Results
Hypothesis
Model 1 Model 2
Results Coefficients P-value Coefficients P-value
H1 Information quality -> use -0.019 0.657 -0.008 0.839 Not supported
H2 Information quality -> user satisfaction 0.234 0.000 0.234 0.000 Supported
H3 System quality -> use 0.193 0.000 0.219 0.000 Supported
H4 System quality -> user satisfaction 0.565 0.000 0.560 0.000 Supported
H5 Use -> individual impact 0.015 0.528 0.015 0.522 Not supported
H6 User satisfaction -> individual impact 0.746 0.000 0.746 0.000 Supported
H7a User satisfaction -> use 0.045 0.331 - - Not supported
H7b Use -> user satisfaction - - 0.023 0.335 Not supported
In the model there is a mutual influence between user satisfaction and use, which leads to a test of two models. In
Model 1, user satisfaction is the predictor of use, while the reverse is true in Model 2. In both models, 56% of the
An assessment of business intelligence in public hospitals
International Journal of Information Systems and Project Management, Vol. 5, No. 4, 2017, 5-18
◄ 12 ►
variance in individual impact is explained (R2). The R2 for user satisfaction is 51.5% in Model 1 and 51.4% in Model 2.
The p-values are less than 0.001 for all of the hypotheses listed as “supported” in Table 2.
Information quality is positively and significantly associated with user satisfaction (p < 0.001) but not with use. System
quality is positively and significantly associated with user satisfaction and with use (p < 0.001). User satisfaction is
positively and significantly associated with individual impact (p < 0.001), but the hypothesis about a relation between
use and individual impact is not supported. The mutual relation between user satisfaction and use is not supported.
We also assessed the effect size, which is referred to as f2 [43]. To do so, we follow the guidelines provided by Cohen
[44]. In Model 1, information quality has a medium effect on user satisfaction of 0.234 and no effect on use. System
quality has a substantial effect of 0.565 on user satisfaction and a medium effect of 0.193 on use. User satisfaction has a
low effect on use of 0.045. User satisfaction has a large effect of 0.746 on individual impact, while use does not affect
individual impact. In Model 2, information quality has a medium effect of 0.234 on user satisfaction and no effect on
use. System quality has a large effect on user satisfaction of 0.560 and a medium effect on use of 0.219. Use has a low
effect of 0.023 on user satisfaction. User satisfaction has a large effect of 0.746 on individual impact, while use does not
affect individual impact.
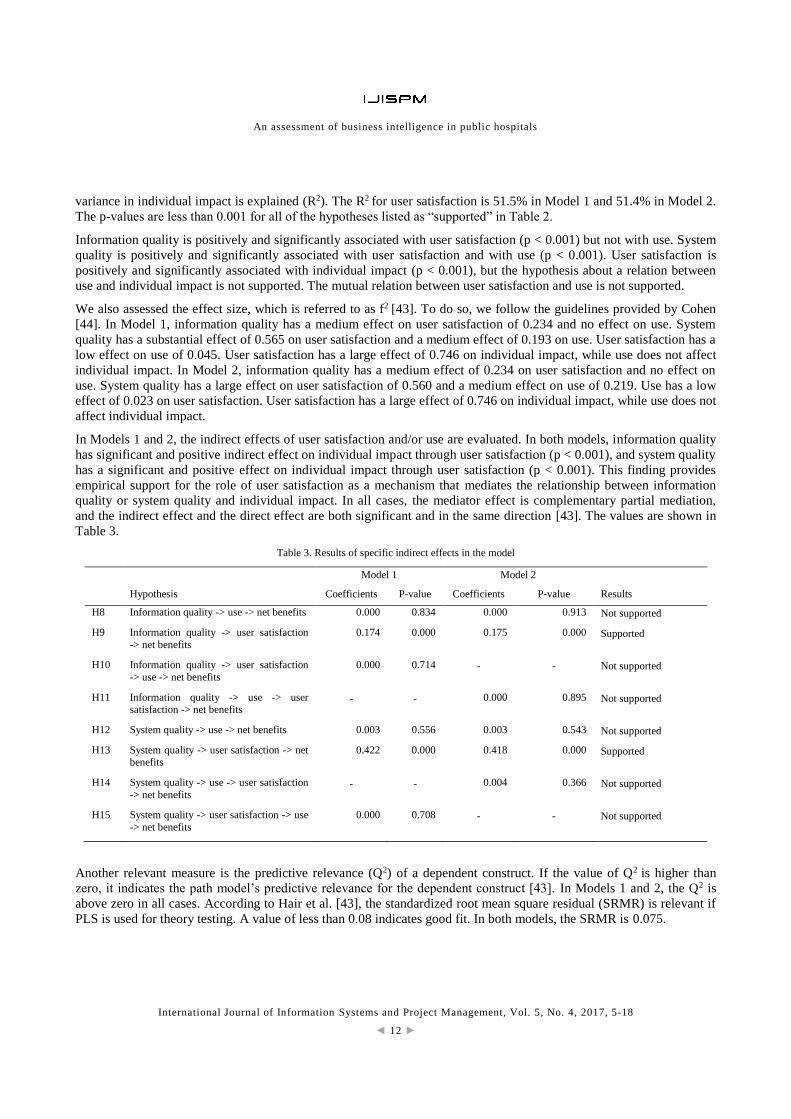
In Models 1 and 2, the indirect effects of user satisfaction and/or use are evaluated. In both models, information quality
has significant and positive indirect effect on individual impact through user satisfaction (p < 0.001), and system quality
has a significant and positive effect on individual impact through user satisfaction (p < 0.001). This finding provides
empirical support for the role of user satisfaction as a mechanism that mediates the relationship between information
quality or system quality and individual impact. In all cases, the mediator effect is complementary partial mediation,
and the indirect effect and the direct effect are both significant and in the same direction [43]. The values are shown in
Table 3.
Table 3. Results of specific indirect effects in the model
Hypothesis
Model 1 Model 2
Results Coefficients P-value Coefficients P-value
H8 Information quality -> use -> net benefits 0.000 0.834 0.000 0.913 Not supported
H9 Information quality -> user satisfaction
-> net benefits
0.174 0.000 0.175 0.000 Supported
H10 Information quality -> user satisfaction
-> use -> net benefits
0.000 0.714 - - Not supported
H11 Information quality -> use -> user satisfaction -> net benefits
- - 0.000 0.895 Not supported
H12 System quality -> use -> net benefits 0.003 0.556 0.003 0.543 Not supported
H13 System quality -> user satisfaction -> net benefits
0.422 0.000 0.418 0.000 Supported
H14 System quality -> use -> user satisfaction
-> net benefits - - 0.004 0.366 Not supported
H15 System quality -> user satisfaction -> use
-> net benefits
0.000 0.708 - - Not supported
Another relevant measure is the predictive relevance (Q2) of a dependent construct. If the value of Q2 is higher than
zero, it indicates the path model’s predictive relevance for the dependent construct [43]. In Models 1 and 2, the Q2 is
above zero in all cases. According to Hair et al. [43], the standardized root mean square residual (SRMR) is relevant if
PLS is used for theory testing. A value of less than 0.08 indicates good fit. In both models, the SRMR is 0.075.
An assessment of business intelligence in public hospitals
International Journal of Information Systems and Project Management, Vol. 5, No. 4, 2017, 5-18
◄ 13 ►
5. Discussion
This study set out to empirically test DeLone and McLean’s IS success model in a public hospital setting. The results of
this study show that user satisfaction is an essential construct in the IS success model. System quality is positively
related to user satisfaction (H4), which is similar to findings described in Iivari [19], Tona et al. [14], and Wang and
Liao [17]. We can conclude that employees in public hospitals will utilize BI more if the system is easy to understand
and use. This is not surprising, but one should keep in mind that those who use BI in hospitals (i.e., nurses, doctors, and
medical secretaries) are not typical BI users [45].
Our finding of a positive and significant relationship between information quality and user satisfaction (H2) is
consistent with previous research (e.g., [14]/[17]/[46]). Furthermore, we find that information quality has a medium
effect on use. In relation to data collection, respondents were provided with our email addresses, and some sent
additional comments after the data had been collected. In addition, respondents were given an opportunity to comment
in the questionnaire. In their comments, respondents generally highlighted areas of dissatisfaction with BI rather than
aspects that worked well. This echoes the experience of Tona et al. [14]. Some users were unsure of data availability
because they could not match the BI system with the source system (such as HIS). This may be a validity-related
problem or it may be that the calculation methods in the two systems differ. Other users found that the data sets were
incomplete and, therefore, difficult to use. This user type was generally excited to work with BI, but this group’s data
needs had not been met. The result was that they were somewhat unsatisfied. The last user type found BI challenging to
use because it was only relevant to a small part of their job. In other words, these users did not regularly rely on BI. As
mentioned above, many different employee types use BI in this context, ranging from administrative staff to
management to health professionals. Therefore, perceptions of user-friendliness can differ.
Surprisingly, we found no relationship between information quality and use (H1) in either Model 1 or Model 2.
Therefore, our findings indicate that an improvement in information quality does not lead to more use of BI. These
findings are consistent with those of Tona et al. [14], while Iivari [19] found a relationship between information quality
and use at p < 0.1. Moreover, McGill et al. [47] measured intended use instead of use and did not find a relationship
between information quality and use.
Our study did find a positive and significant relationship between system quality and use (H3). These results are
identical to Tona et al. [14] and Iivari [19]. If the BI system is easy to use and understand, then users will utilize it more.
There are several possible explanations for this relationship. Of all of the items about system quality, users gave the
item "The information in BI is easy to understand" the highest rating. Subsequently, users found the system "easy to
use" and "easy to learn." It is not surprising that users rated system quality high, as the focal region used Tableau. In
2017, Gartner undertook a survey about which BI system was easiest to use. The results of that survey pointed to
Tableau as one of the best [48], together with QlikView and Microsoft. Another explanation could be that the region
focuses on ease of use by encouraging, for example, user involvement and work with personas in the development and
maintenance of the system. Therefore, one possible explanation may be the combination of BI tools and the way in
which the region chose to implement and maintain its BI solution.
In this study, the relationship between use and user satisfaction, and vice versa, is insignificant (H7a and H7b). Rodan
and Leal [49] derived the same finding. Against this background, Rodan and Leal [49] proposed using intended use
instead of use. Another possible explanation is that BI was implemented less than two years prior to the start of the
study. According to Pick [50], the use of the system over time increases user satisfaction. This explanation is also
supported by the fact that the results for H5 are insignificant, which implies that there is no relation between use and
individual impact. In other words, our findings indicate that more use does not lead to a higher impact. This is
equivalent to Iivari's [19] finding. In their 2003 article, DeLone and McLean's [16] emphasize that a relationship exists
between use and individual impact when use is voluntary. In our study, the use of the BI system is mandated, as there
are several KPIs and statistics that cannot be analyzed with the help of other systems. This might explain the lack of
significance.
An assessment of business intelligence in public hospitals
International Journal of Information Systems and Project Management, Vol. 5, No. 4, 2017, 5-18
◄ 14 ►
We find a significant and positive relationship between user satisfaction and individual impact (H6), which is consistent
with several studies [14]/[19]. This can be interpreted as follows: if the BI system's capabilities support users’ needs,
then users will experience the benefits of using the technology. Another interesting finding is that user satisfaction
serves as a mediator between the two quality constructs and individual impact. Moreover, user satisfaction, which is an
attitude, plays an essential role in the IS success model, as there are not only significant and positive relationships, but
the construct also functions as a mediator. At the same time, use (i.e., behavior) is not significantly related to individual
impact. Although there may be other explanations, the fact that it is a mandated system implies that management can
instruct employees to use the system to resolve tasks, regardless of the quality of the information or the system.
6. Conclusion
In this paper, DeLone and McLean's [15] IS success model is tested in relation to the BI used in 12 public hospitals. The
model is partially confirmed. In the study, eight direct relationships are tested along with eight indirect relationships
including one or two mediators. Four direct relationships were significant at p < 0.001: information quality and system
quality are significantly and positively related to user satisfaction; user satisfaction is positively and significantly related
to individual impact; and system quality is positively and significantly related to use. The other paths are insignificant.
The largest effects are the effect of system quality on user satisfaction and the effect of user satisfaction on individual
impact. Moreover, user satisfaction has a mediating effect on the relationship between system quality and individual
impact, and on the relationship between information quality and individual impact. Therefore, information quality,
system quality, and user satisfaction are essential elements in relation to achieving individual impact. Use does not play
the same role, probably because the use of BI is mandated in the focal region. The study also shows that the model has a
good fit and predictive value.
Although the study is based on many respondents and validated questions, we highlight several limitations that should
be addressed in future research. First, this study is based on Danish public-sector hospitals using a universal BI system.
Two comments must be made in this regard. Denmark has a central public register. In principle, this means that all
personally identifiable data can be combined if allowed by law. Moreover, the hospitals are managed according to the
principles of the Scandinavian welfare-state model. This model is not necessarily transferable to, for example, private
hospitals. Therefore, the IS success model must be tested on other BI systems, and on both private and public hospitals
in other countries.
Another limitation is that the “use” construct is not fully explained in the model. As mentioned above, this may be
because the use of BI is mandated in this context. Use is a behavior that can be determined to a certain extent by
management, while the key construct of user satisfaction is an attitude that can only be controlled by the user. This
aspect should be addressed in future research. In addition, it may be relevant to use other independent variables, such as
task compatibility, user characteristics, BI experience, level of education, and job features.
Third, the study only measures the impact on the individual level. Therefore, it may be useful to measure the effects of
BI when used for HIS at an organizational level. There may be situations in which the individual user does not
experience an impact, but there is still an impact on the organization.
Finally, the model was validated using quantitative data supplemented with users' own comments. A better
understanding of the circumstances of BI success could be gained through the use of qualitative methods.
An assessment of business intelligence in public hospitals
International Journal of Information Systems and Project Management, Vol. 5, No. 4, 2017, 5-18
◄ 15 ►
References
[1] A. Teague, “No innovation without quality,” in The Drivers of Digital Transformation, F. Abolhassan, Ed. Cham,
Switzerland: Springer International Publishing, 2017, pp. 73–81.
[2] R. Gaardboe, T. Nyvang and N. Sandalgaard, “Business intelligence success applied to healthcare information
systems,” in International Conference on Health and Social Care Information Systems and Technologies, Barcelona,
Spain, 2017
[3] L. B. Madsen, Data-driven Healthcare: How Analytics and BI Are Transforming the Industry, Hoboken, New
Jersey, USA: John Wiley and Sons, Inc., 2014.
[4] W. Raghupathi and V. Raghupathi, “An overview of health analytics,” Journal of Health & Medical Informatics,
vol. 4, no. 3, pp. 1-11, 2013.
[5] Gartner, Inc. (2017,11,16). Business Intelligence (BI) [online]. Available: http://www.gartner.com/it-
glossary/business-intelligence-bi/.
[6] S. T. Parente and J. L. Dunbar, “Is health information technology investment related to the financial performance of
US hospitals? An exploratory analysis,” International Journal of Healthcare Technology and Management, vol. 3, no.
48, pp. 48-58, 2001.
[7] P. Brooks, O. El-Gayar and S. Sarnikar, “A framework for developing a domain specific business intelligence
maturity model: application to healthcare,” International Journal of Information Management, vol. 35, pp. 337-345,
2015.
[8] T. Mettler and V. Vimarlund, “Understanding business intelligence in the context of healthcare,” Health Informatics
Journal, vol. 15, pp. 254-264, 2009.
[9] W. Yeoh and A. Koronios, “Critical success factors for business intelligence systems,” Journal of Computer
Information Systems, vol. 50, pp. 23-32, 2010.
[10] L. Dawson and J.-P. Van Belle, “Critical success factors for business intelligence in the South African financial
services sector,” South African Journal of Information Management, vol. 15, 2013.
[11] P. Hawking and C. Sellitto, “Business intelligence (BI) critical success factors,” in 21st Australian Conference on
Information Systems, Brisbane, Australia, 2010.
[12] A. Riabacke, A. Larsson and M. Danielson, “Business intelligence in relation to other information systems,” in
International Conference on advances in ICT for Emerging Regions (ICTer), Colombo, Sri Lanka, 2014, pp. 103-108.
[13] T. A. Eikemo and C. Bambra, “The welfare state: a glossary for public health,” Journal of Epidemiology &
Community Health, vol. 62, pp. 3-6, 2008.
[14] O. Tona, S. A. Carlsson and S. Eom, “An empirical test of DeLone and McLean’s information system success
model in a public organization,” in 18th Americas Conference on Information Systems 2012, Seattle, USA, 2012. pp.
1374-1382.
[15] W. H. DeLone and E. R. McLean, “Information systems success: the quest for the dependent variable,”
Information Systems Research, vol. 3, pp. 60-95, 1992.
[16] W. H. DeLone, E. R. McLean, “The DeLone and McLean model of information systems success: a ten-year
update,” Journal of Management Information Systems, vol. 19, pp. 9-30, 2003.
[17] Y.-S. Wang and Y.-W. Liao, “Assessing eGovernment systems success: a validation of the DeLone and McLean
model of information systems success,” Government Information Quarterly, vol. 25, pp. 717-733, 2008.
An assessment of business intelligence in public hospitals
International Journal of Information Systems and Project Management, Vol. 5, No. 4, 2017, 5-18
◄ 16 ►
[18] K. M. Rosacker and D. L. Olson, “Public sector information system critical success factors,” Transforming
Government: People, Process and Policy, vol. 2, pp. 60-70, 2008.
[19] J. Iivari, “An empirical test of the DeLone-McLean model of information system success,” ACM SIGMIS
Database, vol. 36, pp. 8-27, 2005.
[20] T. H. Davenport, “Competing on analytics,” Harvard Business Review, vol. 84, pp. 98-107, 2006.
[21] C. M. Olszak and E. Ziemba, “Critical success factors for implementing business intelligence systems in small and
medium enterprises on the example of upper Silesia, Poland,” Interdisciplinary Journal of Information, Knowledge, and
Management, vol. 7, pp. 129-150, 2012.
[22] I. J. Chen, “Planning for ERP systems: analysis and future trend,” Business Process Management Journal, vol. 7,
pp. 374-386, 2001.
[23] M. Nakayama, S. Olbrich and N. Sutcliffe, “Changing with grassroots business intelligence at a large global
manufacturing firm,” in Perspectives in Business Informatics Research, B. Johansson, C. Møller, A. Chaudhuri and F.
Sudzina, Eds., Cham, Switzerland: Springer International Publishing, 2017, pp. 148-156.
[24] B. Wixom and H Watson, “The BI-based organization,” International Journal of Business Intelligence Research,
vol. 1, pp. 13-28, 2010.
[25] V.-H. Trieu, “Getting value from business intelligence systems: a review and research agenda,” Decision Support
Systems, vol. 93, pp. 111-124, 2017.
[26] S.-H. Park, S.-Y. Huh, W. Oh and S. P. Han, “A social network-based inference model for validating customer
profile data,” MIS Quarterly, vol. 36, pp. 1217-1237, 2012.
[27] G. Schryen, “Revisiting IS business value research: what we already know, what we still need to know, and how
we can get there,” European Journal of Information Systems, vol. 22, pp. 139–169, 2012.
[28] P. G. Keen, “MIS research: reference disciplines and a cumulative tradition” in ICIS 1980 Proceedings. Center for
Information Systems Research, Alfred P. Sloan School of Management, 1980.
[29] C. E. Shannon and W. Weaver, The Mathematical Theory of Communication. Urbana, IL, USA: University of
Illinois Press, 1948.
[30] R. O. Mason, “Measuring information output: a communication systems approach,” Information & Management,
vol. 1, pp. 219-234, 1978.
[31] Y. W. Lee, D. M. Strong, B. K. Kahn, and R. Y. Wang, “AIMQ: a methodology for information quality
assessment,” Information & Management, vol. 40, pp. 133-146, 2002.
[32] S. Petter, W. DeLone and E. McLean, “Measuring information systems success: models, dimensions, measures,
and interrelationships,” European Journal of Information Systems, vol. 17, pp. 236-263, 2008.
[33] P. B. Seddon, “A respecification and extension of the DeLone and McLean model of IS success,” Information
Systems Research, vol. 8, pp. 240-253, 1997.
[34] J. E. Bailey and S. W. Pearson, “Development of a tool for measuring and analyzing computer user satisfaction,”
Management Science, vol. 29, pp. 530-545, 1983.
[35] V. Shankar, A. K. Smith and A Rangaswamy, “Customer satisfaction and loyalty in online and offline
environments,” International Journal of Research in Marketing, vol. 20, pp. 153-175, 2003.
[36] B. Myers, L. Kappelman and V. R. Prybutok, A Comprehensive Model for Assessing the Quality and Productivity
of the Information Systems Function, 1997.
An assessment of business intelligence in public hospitals
International Journal of Information Systems and Project Management, Vol. 5, No. 4, 2017, 5-18
◄ 17 ►
[37] P. B. Seddon and S. Staples, R. Patnayakuni and M. Bowtell, “Dimensions of information systems success,”
Communications of the AIS, vol. 2, no. 5, pp. 1-61, 1999.
[38] L. F. Pitt, R. T. Watson and C. B. Kavan, “Service quality: a measure of information systems effectiveness,” MIS
Quarterly, vol. 19, pp. 173-187, 1995.
[39] A. Pattavina, Ed, Information Technology and the Criminal Justice System. Thousand Oaks, CA, USA: Sage
Publications, 2005.
[40] D. A. Dillman, J. D. Smyth and L. M. Christian, Internet, Phone, Mail, and Mixed-mode Surveys: The Tailored
Design Method. Hoboken, NJ, USA: Wiley, 2014.
[41] J. R. Lewis, “IBM computer usability satisfaction questionnaires: psychometric evaluation and instructions for
use,” International Journal of Human-Computer Interaction, vol. 7, pp. 57-78, 1995.
[42] R. Batenburg and E. Van den Broek, “Pharmacy information systems: the experience and user satisfaction within a
chain of Dutch pharmacies,” International Journal of Electronic Healthcare, vol. 4, pp. 119-131, 2008.
[43] J. F. Hair, G. T. M. Hult, C. Ringle and M. Sarstedt, Eds, A Primer on Partial Least Squares Structural Equation
Modeling (PLS-SEM). Los Angeles, CA, USA: Sage, 2017.
[44] J. Cohen, Statistical Power Analysis for the Behavioral Sciences. Hillsdale, NJ, USA: L. Erlbaum Associates 1988.
[45] L. Madsen, Healthcare Business Intelligence: A Guide to Empowering Successful Data Reporting and Analytics.
Hoboken, NJ, USA: John Wiley & Sons, Inc., 2012.
[46] P. Seddon and M.-Y. Kiew, “A partial test and development of DeLone and McLean’s model of IS success,”
Australasian Journal of Information Systems, vol. 4, pp. 90-109, 1996.
[47] T. McGill, V. Hobbs and J. Klobas, “User-developed applications and information systems success: a test of
DeLone and McLean’s model,” Information Resources Management Journal, vol. 16, pp. 24-45, 2003.
[48] Gartner Reprint, https://www.gartner.com/doc/reprints?id=1-3TYE0CD&ct=170221&st=sb.,
[49] J. J. Cano, Ed, Critical Reflections on Information Systems: A Systemic Approach. Hershey, Pennsylvania: IGI
Global, 2003.
[50] R. A. Pick, “Benefits of decision support systems,” in Handbook on Decision Support Systems 1.
Berlin/Heidelberg, German: Springer Berlin Heidelberg, 2008, pp. 719-730.
[51] M. Pejić Bach, J. Zoroja and A. Čeljo, “An extension of the technology acceptance model for business intelligence
systems: project management maturity perspective.” International Journal of Information Systems and Project
Management, vol. 5, pp. 5-21, 2017.
An assessment of business intelligence in public hospitals
International Journal of Information Systems and Project Management, Vol. 5, No. 4, 2017, 5-18
◄ 18 ►
Biographical notes
Rikke Gaardboe
Rikke Gaardboe has an M.Sc. (human-centered informatics) and is currently a Ph.D. student at the
Department of Communication and Psychology at Aalborg University. Her research centers on the
factors contributing to business intelligence in the public sector.
www.shortbio.org/[email protected]
Niels Sandalgaard
Niels Sandalgaard, Ph.D., is an Associate Professor at the Department of Business and Management
at Aalborg University. His research focuses on the use of management information and new
management accounting models in practice. He was previously employed by a large Danish firm as a
business analyst.
www.shortbio.org/[email protected]
Tom Nyvang
Tom Nyvang, Ph.D., is an Associate Professor at the Department of Communication and Psychology
at Aalborg University. His research focuses on the intersection between organizational development
and the implementation of information systems. He has a special interest in information systems that
support learning in organizations and educational institutions.
www.shortbio.org/[email protected]