Embed Size (px)
Citation preview

Aalborg Universitet
Laboratory Exercise Instructions for Miniproject in High Voltage Engineering
Reigosa, Paula Diaz; Bak, Claus Leth
Publication date:2015
Link to publication from Aalborg University
Citation for published version (APA):Reigosa, P. D., & Bak, C. L. (2015). Laboratory Exercise Instructions for Miniproject in High VoltageEngineering.
General rightsCopyright and moral rights for the publications made accessible in the public portal are retained by the authors and/or other copyright ownersand it is a condition of accessing publications that users recognise and abide by the legal requirements associated with these rights.
? Users may download and print one copy of any publication from the public portal for the purpose of private study or research. ? You may not further distribute the material or use it for any profit-making activity or commercial gain ? You may freely distribute the URL identifying the publication in the public portal ?
Take down policyIf you believe that this document breaches copyright please contact us at [email protected] providing details, and we will remove access tothe work immediately and investigate your claim.
Downloaded from vbn.aau.dk on: April 06, 2020

Paula Diaz Reigosa, PhD. Fellow, Claus Leth Bak, Professor
Department of Energy Technology, Aalborg University, Pontoppidanstraede 101, 9220 Aalborg, Denmark
Email: [email protected] ,[email protected]
HIGH VOLTAGE ENGINEERING
LABORATORY EXCERCISE INSTRUCTIONS FOR MINIPROJECT

1 Introduction
The High Voltage engineering laboratory exercises will be held after the lectures in order to apply the theoretical concepts given during the lecture. There is one mandatory demonstration of HV laboratory safety. The students should read the safety rules prior to the lecture, which can be found in the following: http://www.et.aau.dk/digitalAssets/48/48085_rules_highvoltage_lab.pdfattend.
The student MUST sign the document and return it to Claus Leth Bak before any work in the HV lab is allowed.
It is mandatory to attend the laboratory demonstrations carried out by the lecturer and his assistant (duration ½ - 1 hour). After the demonstration, the students are free to work for each laboratory exercise on their own and supervised by the lecturer or his assistant. This is highly recommended, but not mandatory.
A miniproject must be handed out at the end of the semester. The student should include all the measurements carried out during the laboratory sessions following the instructions for each laboratory exercise.
The following skills will be gained:
Fundamentals of High Voltage Engineering Measurements, according to IEC standards, of high AC, DC and
impulse voltages for testing purposes in the HV laboratory. Sphere gap measurements Electrostatic field theory for simple insulation systems. Non-destructive tests methods in HV engineering. Dynamic properties of dielectrics in time and frequency domain Insulation ageing and lifetime assessment- test methods. Modelling of dielectric properties by means of electrical equivalent
circuits. Dielectric loss and capacitance measurement – the Schering Bridge External partial discharges, origin and practical importance for HV
power system components, corona, overhead line audible noise and measurements of corona phenomena.
Internal partial discharges, origin and practical importance for HV power system components.

2 1. Inductive Voltage Transformer
SAFETY MEASURES: Interlocks are provided to prevent high voltage to be switched on while the gates/ doors are open. Despite these measures it is necessary to connect the safety earth stick to the HV parts before touching. (There could be some charge left on the capacitors). Special safety rules for the High Voltage laboratory must be read, understood, signed and always followed to every detail!
1.1 Objectives
The student must gain the following knowledge and comprehension in the following topics:
General description and understanding of inductive voltage transformer. Dielectric design description. Nameplate parameters and specifications, understanding of all the data
provided by the manufacturer. Theoretical calculation and experimental measurement of transformer
transfer ratio.
1.2 General Description
The ABB Inductive Voltage Transformer EMF (EMF 52-170) is a voltage transformer which is used for voltage metering and protection in high voltage network systems. The purpose is to transform the high voltage into low voltage adequate to be processed in measuring and protecting instruments in the secondary side. Therefore, a voltage transformer isolates the measuring
instruments from the high voltage side.
The standard design of the EMF 52-170, which is depicted in Figure 1, has a single high voltage terminal and three low voltage terminals (e.g., 1a-1n, 2a-2n and da-dn). The last one, da-dn, is normally used for measuring ground faults, but other configurations can be made available if required.
Figure 1. ABB EMF 72 kV inductive voltage transformer.

3 1.3 Dielectric Design
The dielectric characteristics of the inductive voltage transformer will be explained during the laboratory session. The student is expected to take notes and pictures.
There are two types of insulators; the student must point out the purpose of using them:
Outer insulator: ceramic insulator. Inner insulator: oil, paper insulator, quartz filling, etc.
1.4 Nameplate
The nameplate contains information about the transformer, e.g., voltage, current, frequency, voltage factor, etc. The student is expected to take notes of the information provided by the manufacturer. The student must describe and understand the data given in the nameplate.
Table I. ABB inductive voltage transformer.
Table II. Data described in the terminal.
Terminal data A-N 1a-1n 2a-2n da-dn
10 Voltage (phase-neutral)
11 Load
12 Class
1.5 Transfer Ratio
The number of turns on each winding determines the transfer ratio between the primary, which in this case is the high voltage side and the secondary, the low voltage side. The transfer ratio, m, is given by:
Nameplate Size Unit1 Type 2 Number 3 Isolation level 4 Max. constant voltage 5 Frequency 6 Norm 7 Voltage factor 8 Total mass 9 Production year

4
The student has to calculate the rated transfer ratio with the information given on the transformer’s nameplate and further on, verify the transfer ratio by means of experimental tests. Several measurements must be conducted (e.g., primary voltage range from 5 kV up to 30 kV) in order to demonstrate the good functionality and linearity of the inductive voltage transformer. The student must provide a comprehensive description of the experimental setup and explain the differences observed between the theory and experimental results:
Why the maximum voltage applied at the high side should not exceed 35 kV? How the voltage is measured on HV side? Which equipment is used? How the voltage is measured on LV side? Which equipment is used? How many secondary windings on the LV side are tested? At least two of them must be
tested. Asses the linearity of the voltage transformer ratio. Illustrate in a graph the relationship
between the voltage measured on HV side and the voltage measured on LV side. Asses the measurement accuracy of the measured transfer ratio, both high voltage and low
voltage measurement.
Please draw a schematic of the circuit with all the equipment that has been used:

5 Secondary winding tested: _____________________
Primary side [kV] Secondary side [V] Transfer Ratio
Secondary winding tested: _____________________
Primary side [kV] Secondary side [V] Transfer Ratio

6
2. Impulse Voltages: Lightning Impulse
SAFETY MEASURES: Interlocks are provided to prevent high voltage to be switched on while the gates/ doors are open. Despite these measures it is necessary to connect the safety earth stick to the HV parts before touching. (There could be some charge left on the capacitors). Special safety rules for the High Voltage laboratory must be read, understood, signed and always followed to every detail!
2.1 Objectives
The student must gain the following knowledge and comprehension in the following topics:
General description of the lightning test procedure and become familiar with the experimental setup.
Conduct first lightning test without DUT (Device Under Test) and describe the procedure.
Insulationcharacteristicsandrandomnessoftheappearanceofdischarge.
Statisticaltreatmentoftheexperimentalresults.
2.2 General Description
There are two types of overvoltage pulses which power systems should withstand – lightning and switching. In the field, these transients can take different wave shapes. Lightning overvoltage typically occur due to lightning strokes hitting the phase wires of overhead lines or outdoor bus bars. Amplitudes are very high (i.e., 1000 kV), therefore the insulation may breakdown and the voltage is chopped, however it is also possible that the insulation may not breakdown and withstand the overvoltage. In case that the insulation does not breakdown a full lightning impulse voltage shape can be observed. In case that the there is a breakdown of the insulation; the voltage can be chopped on the front or on the tail.
Lightning impulses have very fast voltage rise, the standard lightning impulse is described as 1.2/50 μs wave. On the other hand, switching impulses have slower voltage rise, typically 250/2500 μs. Switching impulses are not the scope of this laboratory session; therefore no further details are given.
In order to generate a wave with the required shape, a single-stage generator circuit is used. The student must carry out the following tasks:
7 Draw as detailed as possible the schematic of the setup, equipment, etc., and explain the
charging and discharging processes.
Identify: C1 (discharge capacitance), C2 (load capacitance), R1 (front resistance), R2 (discharge resistance) and sphere gap.
Which type of single‐stage impulse generator circuit is implemented?
How is the impulse generator adjusted to obtain a higher impulse?
Identify from the setup the type of lightning impulse: positive or negative? Why?
Remember to take a picture of the setup and include it in the mini-project.
2.3 Lightning test
Once the student becomes familiar with the setup and understands the principle of the lightning impulse, the next step is to conduct the first lightning impulse without any device under test.
The procedure will be explained during the laboratory session so the student is expected to take notes
and include them in the mini‐project. Figure 1 represents a typical negative lightning impulse without
breakdown.
Hint: pay attention to the input voltage applied and how the sphere gap spacing adjusts when conducting the lighting test, write down the peak voltage obtained as well as T1 and T2.
Please draw a schematic of the setup with all the equipment that has been used:

8
Figure 1. 40 kV negative lightning impulse without breakdown: T1 = 1.876 µs & T2 = 80.133 µs
2.4 Insulation characteristics and randomness of the appearance of discharge
High voltage insulation can be made out of several types of dielectric materials which in turn can be made from solids, gases or liquids. When carrying out voltage stress tests, the results present a random nature; therefore the insulation can withstand or discharge.
This means that the same stress applied several times in the same conditions may not always cause disruptive discharge. The randomness can be modelled following a statistical procedure, for example, the most commonly used distribution function is the normal (Gaussian) distribution. However, a more convenient form of the normal distribution is the cumulative distribution function, which can be expressed as:
1
√2 ⁄
where P is the probability of discharge, V is the applied voltage, is the standard deviation and V50 is 50% probability of discharge. A plot of the cumulative distribution function is shown in Figure 2.
Figure 2: Gaussian cumulative distribution function.
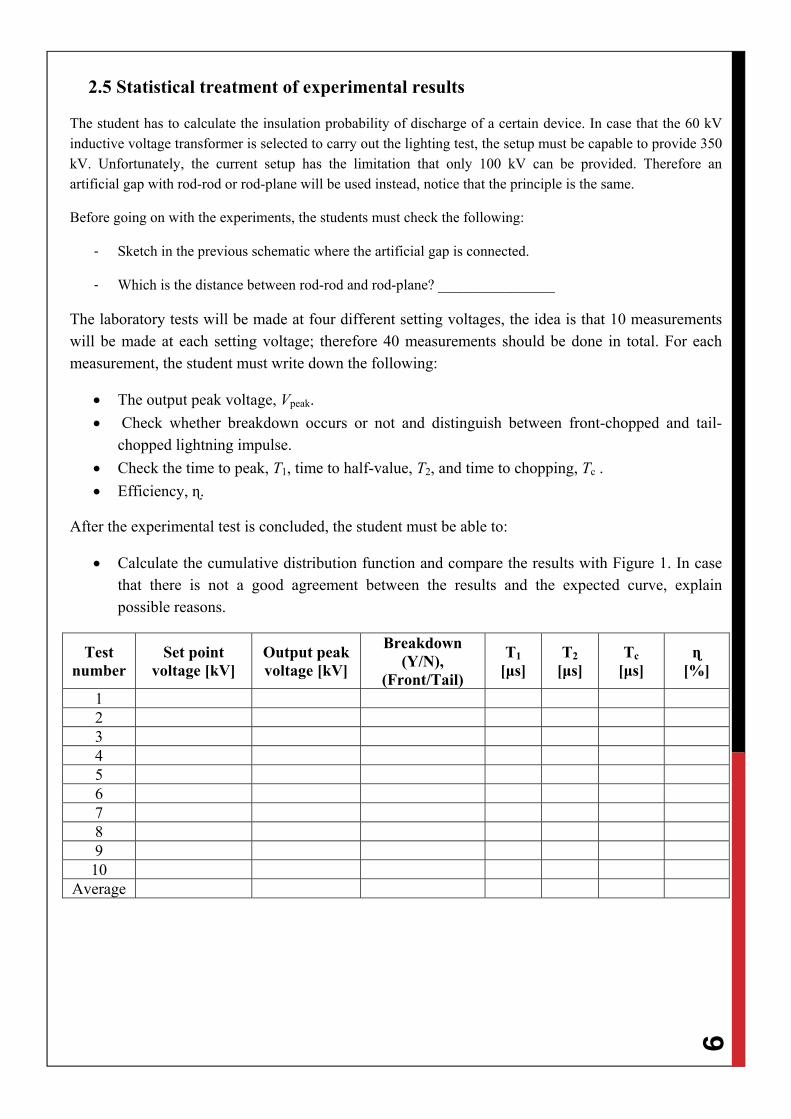
9 2.5 Statistical treatment of experimental results
The student has to calculate the insulation probability of discharge of a certain device. In case that the 60 kV inductive voltage transformer is selected to carry out the lighting test, the setup must be capable to provide 350 kV. Unfortunately, the current setup has the limitation that only 100 kV can be provided. Therefore an artificial gap with rod-rod or rod-plane will be used instead, notice that the principle is the same.
Before going on with the experiments, the students must check the following:
‐ Sketch in the previous schematic where the artificial gap is connected.
‐ Which is the distance between rod-rod and rod-plane? ________________
The laboratory tests will be made at four different setting voltages, the idea is that 10 measurements will be made at each setting voltage; therefore 40 measurements should be done in total. For each measurement, the student must write down the following:
The output peak voltage, Vpeak.
Check whether breakdown occurs or not and distinguish between front-chopped and tail-chopped lightning impulse.
Check the time to peak, T1, time to half-value, T2, and time to chopping, Tc .
Efficiency, ɳ.
After the experimental test is concluded, the student must be able to:
Calculate the cumulative distribution function and compare the results with Figure 1. In case that there is not a good agreement between the results and the expected curve, explain possible reasons.
Test number
Set point voltage [kV]
Output peak voltage [kV]
Breakdown (Y/N),
(Front/Tail)
T1
[μs] T2
[μs] Tc
[μs] ɳ
[%]
1 2 3 4 5 6 7 8 9 10
Average

10 Test
number Set point
voltage [kV] Output peak voltage [kV]
Breakdown (Y/N),
(Front/Tail)
T1
[μs] T2
[μs] Tc
[μs] ɳ
[%]
1 2 3 4 5 6 7 8 9
10 Average
Test number
Set point voltage [kV]
Output peak voltage [kV]
Breakdown (Y/N),
(Front/Tail)
T1
[μs] T2
[μs] Tc
[μs] ɳ
[%]
1 2 3 4 5 6 7 8 9
10 Average

11
3. Dielectric Loss Angle
SAFETY MEASURES: Interlocks are provided to prevent high voltage to be switched on while the gates/ doors are open. Despite these measures it is necessary to connect the safety earth stick to the HV parts before touching. (There could be some charge left on the capacitors). Special safety rules for the High Voltage laboratory must be read, understood, signed and always followed to every detail!
3.1 Objectives
The student must gain the following knowledge and comprehension in the following topics:
General description of the non-destructive high voltage test method: Schering-bridge.
Assessment of the capacitance, Cx, and the dissipation factor, tan δx: ABB inductive voltage transformer, circuit I.
Assessment of the capacitance, Cx, and the dissipation factor, tan δx: ABB inductive voltage transformer, circuit II.
Assessment of the capacitance, Cx, and the dissipation factor, tan δx: ideal homemade capacitor .
3.2 General Description: Schering-bridge
The loss factor or dissipation factor, tan δ, is an indicator of the quality of solid or liquid dielectrics. In order to measure the capacitance and dissipation factor, tan δ, a non-destructive test is performed with the high voltage Schering-bridge, which schematic is shown in Figure 1 and the test equipment is shown in Figure 2. Such tests are usually carried out at different voltage levels in order to ensure that both capacitance and dissipation factor are constant, i.e., linear with respect to voltage. The Schering-bridge adjusts the resistance and capacitance values automatically. In case that some deviations are observed when measuring the loss angle at different applied voltage levels; two possible explanations can be given: i) non linearity of the system (please explain this with the polarization processes as being non-linear), ii) indication of partial discharges.
The student must provide a general description of the Schering-bridge:
Operating principle.
Schematic of the Schering-bridge including all its components.

12 Mathematical expression to calculate the dielectric losses, Pdiel, the dielectric loss factor, tan
δ, and the capacitance, C, of the balanced Schering-bridge.
Figure 1. Typical Schering-bridge setup. Figure 2. Capacitance and Dissipation Factor Measuring Bridge Type TG-3MOD.
3.3 ABB Inductive Voltage Transformer: Circuit I.
3.3.1 Setup Description
During the first experiment, the capacitance and the loss angle of the 60 kV ABB inductive voltage
transformer EMF (EMF 52‐170) will be measured. The test object is connected between the primary terminals (High Voltage side, point (a) from Figure 1) and the ground (point (d) from Figure 1). The normal capacitor, CN, consists of a pressurized gas capacitor which represents an ideal capacitor, therefore it can be assumed that φN = 0. The low voltage branch is included inside the measuring equipment (capacitance and tan δ measuring bridge).
Please draw a schematic of the Schering-bridge including the current path inside ABB inductive voltage transformer.

13 3.3.2. Results and discussions
The 60 kV inductive voltage transformer must be tested at different voltage levels in a range between
0
√ kV.
V [kV] Cx [pF] tanδx δx [º] I [µA]
Please make sure to discuss the following:
Are the results reasonable? Why? Why not?
Are the capacitance and the loss angle constant? Remember to provide a detailed explanation for all your statements.
3.4 ABB Inductive Voltage Transformer: Circuit II
3.4.1 Setup Description
During the second experiment, the capacitance and the loss angle of the 60 kV ABB inductive voltage
transformer EMF (EMF 52‐170) will be measured again. The test object is connected between the primary terminals (High Voltage side, point (a) from Figure 1) and the secondary terminal (point (d) from Figure 1). The normal capacitor, CN, consists of a pressurized gas capacitor which represents an ideal capacitor, therefore it can be assumed that φN = 0. The low voltage branch is included inside the measuring equipment (capacitance and tan δ measuring bridge).
Please draw a schematic of the Schering-bridge including the current path inside ABB inductive voltage transformer.

14 3.4.2 Results and Discussions
The 60 kV inductive voltage transformer must be tested at different voltage levels in a range
between0 4 . The tank of the voltage transformer is now at high potential, in order to avoid
a flash over between the tank and the connection of the secondary terminals, the voltage must be not
higher than 4 kV.
V [kV] Cx [pF] tanδx δx [º] I [µA]
Please make sure to discuss the following:
Are the results reasonable? Why? Why not?
Are the capacitance and the loss angle constant? Remember to provide a detailed explanation for all your statements.
3.5 Ideal Homemade Capacitor
3.5.1 Setup Description
During the third experiment, the inductive voltage transformer will be replaced with a homemade capacitor which is purely capacitive. The purpose is to conclude with a clearer idea of the experimental setup and understand the fundamental principle of the Schering-bridge.
Please draw a schematic of the Schering-bridge including the current path inside ABB inductive voltage transformer.

15 3.5.2 Results and Discussions
The homemade capacitor must be tested at different voltage levels, in a range between 0 kV – 25 kV.
V [kV] Cx [pF] tanδx δx [º] I [µA]
Please make sure to discuss the following:
Which are the main differences between using a voltage transformer or an ideal capacitor as a test object?
In case that the test object is replaced with a normal capacitor (e.g., any HV capacitor), what do you expect to observe?
Comment on the linearity or non-linearity of the insulation material.

16 4. Dielectric Spectroscopy Test
SAFETY MEASURES: Interlocks are not provided to prevent high voltage to be switched on while the gates/ doors are open. Therefore only one student is allowed to be inside the high-voltage cage, taking special care of high-voltage equipment. Special safety rules for the High Voltage laboratory must be read, understood, signed and always followed to every detail!
4.1 Objectives
The student must gain the following knowledge and comprehension in the following topics:
Discuss the aim for conducting dielectric response measurements and describe the theoretical approach.
Describe the dielectric spectroscopy equipment. Evaluate and understand the basics of the loss angle frequency dependence
and the concept of the complex permittivity. Measure the moisture content and oil conductivity of the inductive voltage
transformer.
4.2 Why dielectric spectroscopy?
The goal is to evaluate the condition (e.g., amount of degradation) of the inductive voltage transformer insulation, which can be obtained by means of dielectric frequency response tests. The effects of moisture and ionic contamination lead to
the degradation of the oil‐paper and therefore accelerate the insulation aging. There
are three dangerous situations: i) it decreases the dielectric withstand strength, ii) accelerates cellulose aging, and, iii) causes the emission of gas bubbles at high temperatures.
In order to measure the moisture content and the oil conductivity, the DIRANA device from OMICRON will be used. DIRANA derives the moisture content in paper or pressboard from properties such as polarization current, complex capacitance, and dissipation factor. Each of these parameters is strongly affected by moisture. The dissipation factor plotted together with the frequency range can give information about the moisture content as shown in Figure 1.
Frequency range: 10 Hz – 1000 Hz. Dominated by the cellulose insu- lation, cables and connection techniques.
Frequency range: 0.01 Hz – 1 Hz. Dominated by the oil conductivity.
Frequency: 0.003 Hz. Dominated by insulation geometry.
Frequencies bellow 0.0005 Hz. Dominated by the cellulose insulation.
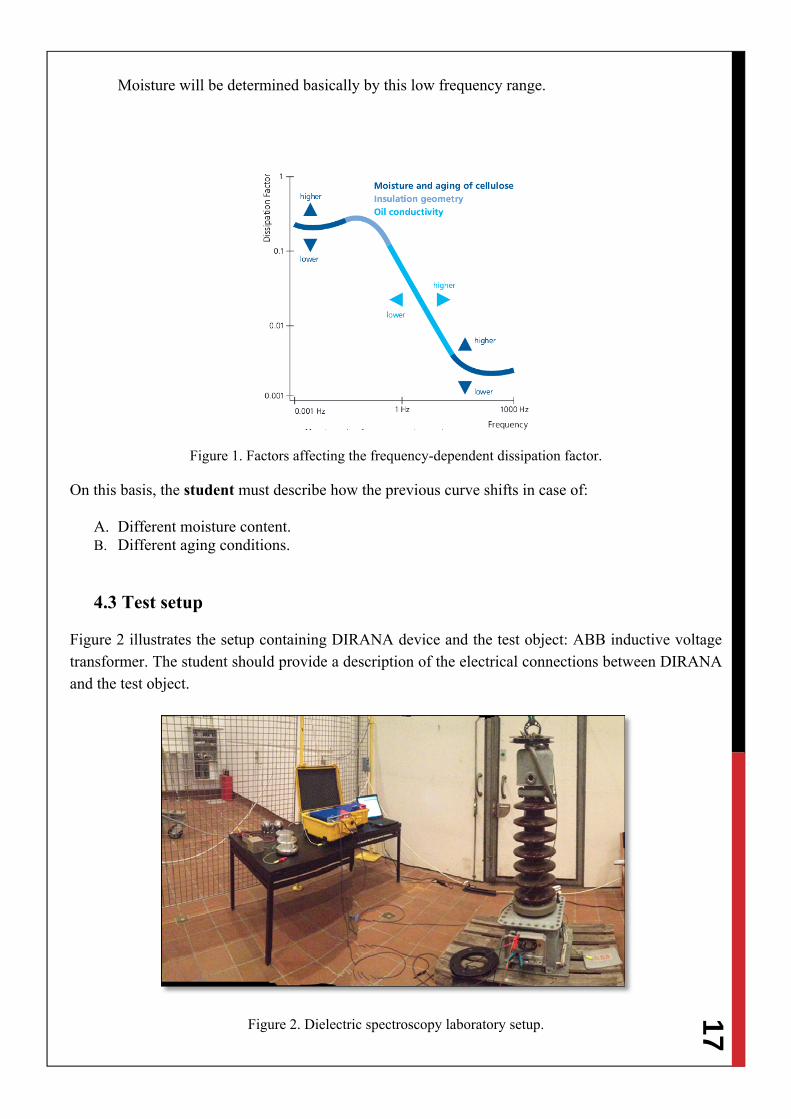
17 Moisture will be determined basically by this low frequency range.
Figure 1. Factors affecting the frequency-dependent dissipation factor.
On this basis, the student must describe how the previous curve shifts in case of:
A. Different moisture content. B. Different aging conditions.
4.3 Test setup
Figure 2 illustrates the setup containing DIRANA device and the test object: ABB inductive voltage transformer. The student should provide a description of the electrical connections between DIRANA and the test object.
Figure 2. Dielectric spectroscopy laboratory setup.

18
4.4 Experimental results: moisture content and conductivity.
DIRANA is used to conduct dielectric spectroscopy test to analyze the properties of insulation systems across a wide frequency range (e.g., 1000 Hz to 0.0001 Hz).
The student will be able to measure:
Dissipation factor for a wide frequency range. Moisture content of the solid insulation. Oil conductivity.
At the end of the experimental test, the student must be able to:
Define the moisture category. Is it necessary to apply any dry methods? Discuss the results and give an assessment of the condition of the voltage transformer.
Moisture Categories Value Dry < 2.2 % Moderately wet >2,2 % and < 3.7 % Wet >3.7 % and < 4.8 % Extremely wet >4.8 %
Please draw the schematic of the dielectric spectroscopy test setup.

19 5. Partial Discharges
SAFETY MEASURES: Interlocks are provided to prevent high voltage to be switched on while the gates/ doors are open. Despite these measures it is necessary to connect the safety earth stick to the HV parts before touching. (There could be some charge left on the capacitors). Special safety rules for the High Voltage laboratory must be read, understood, signed and always followed to every detail!
5.1 Objectives
The student must gain the following knowledge and comprehension in the following topics:
Definition and types of partial discharges: how to distinguish between internal and external partial discharges.
Description of the partial discharge test circuit. Identify which type of partial discharges takes place when testing: ABB
voltage transformer, homemade capacitor and rod-plane, plane-rod and rod-rod electrode gap.
5.2 Definition and types of partial discharges
The International Standard 60270 of the IEC (International Electrotechnical Commission) defines Partial Discharge (PD) as:
Partial discharge (PD) is a localized electrical discharge that only partially bridges the insulation between conductors and which may or may not occur adjacent to a conductor
Partial Discharges can be classified into:
Internal discharges: occurs inside cavities of a dielectric material. External discharges: i) corona, discharge in a gaseous dielectric due to
inhomogeneous field distribution (discharges ON electrodes), ii) surface discharges, discharge in boundaries between different dielectrics.
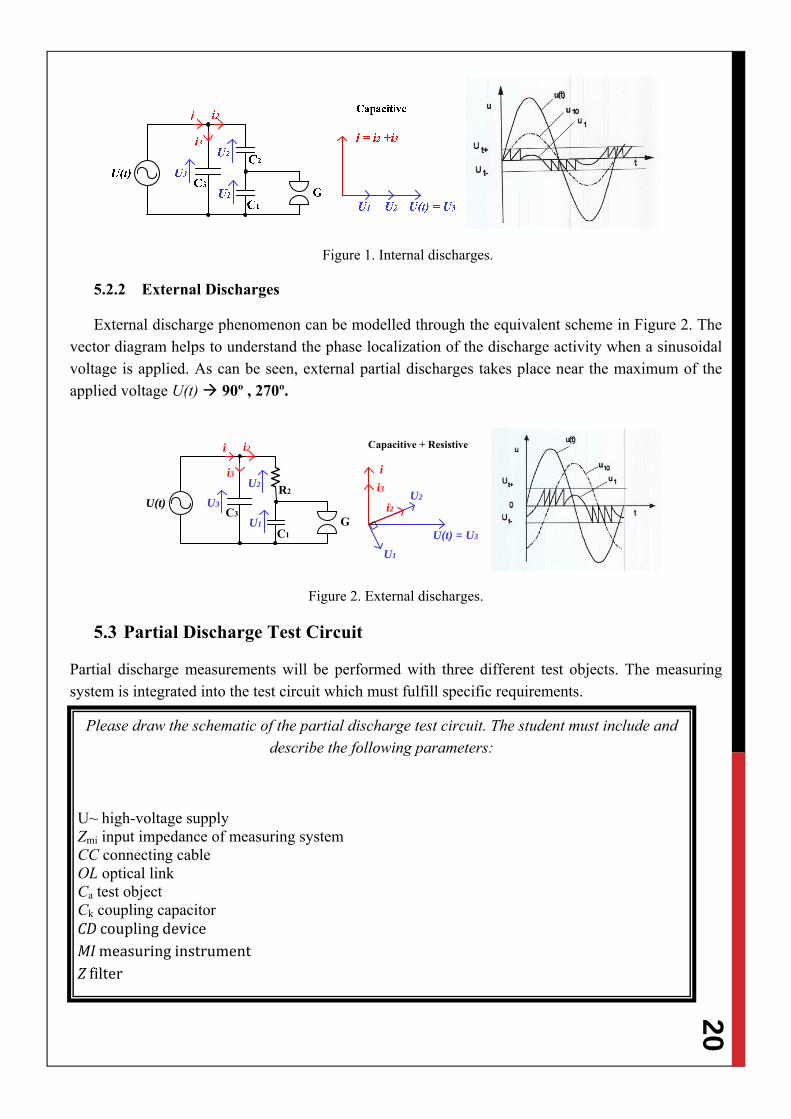
5.2.1 Internal Discharges
Internal discharge phenomenon can be modelled through the equivalent scheme in Figure 1. The vector diagram helps to understand the phase localization of the discharge activity when a sinusoidal voltage is applied. As it can be seen, internal partial discharges takes place around the zero crossing of the applied voltage U(t) 0º, 180º, 360º.
20
Figure 1. Internal discharges.
5.2.2 External Discharges
External discharge phenomenon can be modelled through the equivalent scheme in Figure 2. The vector diagram helps to understand the phase localization of the discharge activity when a sinusoidal voltage is applied. As can be seen, external partial discharges takes place near the maximum of the applied voltage U(t) 90º , 270º.
U(t) U3C3
R2
C1
G
U2
U1
i
i3
i2
i
Capacitive + Resistive
U(t) = U3
U2
U1
i3
i2
Figure 2. External discharges.
5.3 Partial Discharge Test Circuit
Partial discharge measurements will be performed with three different test objects. The measuring system is integrated into the test circuit which must fulfill specific requirements.
Please draw the schematic of the partial discharge test circuit. The student must include and describe the following parameters:
U~ high-voltage supply Zmi input impedance of measuring system CC connecting cable OL optical link Ca test object Ck coupling capacitor CDcouplingdeviceMImeasuringinstrumentZfilter

21 5.4 Experimental Results and Discussion
Partial discharge measurements will be performed for three different test objects:
ABB voltage transformer Homemade capacitor Rod-to-plane electrode or rod-to-rod electrode
The student must be able to identify whether internal partial discharges/external partial discharges takes place. The student must acquire the measured partial discharges in a 3D-graph which includes information of the number of partial discharges in the y-axis, the discharge charge (Q) in the z-axis and the location of the discharge in the x-axis.
Test Object Voltage applied [kV] Charge [Q] Location of PD Type of PD
Three samples from previous measurements are included (Figures 3, 4 and 5). Each figure represents the number of PD pulses Hn as a function of phase angle ϕ and apparent charge q. The task is to recognize the PD type on each figure.
Figure 3. Partial discharge type A Figure 4. Partial discharge type B
Figure 5. Partial discharge type C.

22
Literature
[1] E. Kuffel, W.S.Zaengl and J. Kuffel, High Voltage Engineering: Fundamentals,second edition 2000, Newnes, ISBN 0 7506 3634 3.
[2] Hayakawa et al., Partial Discharge Characteristics of Inverter-Fed Motor Coil Samples under AC and Surge Voltage Conditions, DEIS 2005.
[3] J. Kuruvilla, “ Assesing the health of your transformer – dielectric frequency response determine the moisture content in transformer insulation,” 2012.
[4] ABB, Oil insulated Outdoor Instrument Transformers Buyer’s Guide, 2012.


![[PPT]PowerPoint Presentation - Rajkumar Kuppapillai | … · Web viewMesurement Of High Voltages & High Currents Unit 4 Resistive Shunt * Used for high impulse current measurements](https://img.pdfslide.net/doc/110x75/5af13f0e7f8b9ac62b8fb5af/pptpowerpoint-presentation-rajkumar-kuppapillai-viewmesurement-of-high.jpg)