Embed Size (px)
Citation preview
Aalborg Universitet
Modal Identification of Output-Only Systems using Frequency Domain Decomposition
Brincker, Rune; Zhang, L.; Andersen, P.
Published in:Proceedings of the European COST F3 Conference on System Identification & Structural HealthMonitoring, 6-9 June, 2000, Universidad Politécnica de Madrid, Spain
Publication date:2000
Document VersionPublisher's PDF, also known as Version of record
Link to publication from Aalborg University
Citation for published version (APA):Brincker, R., Zhang, L., & Andersen, P. (2000). Modal Identification of Output-Only Systems using FrequencyDomain Decomposition. In J. A. Güemes (Ed.), Proceedings of the European COST F3 Conference on SystemIdentification & Structural Health Monitoring, 6-9 June, 2000, Universidad Politécnica de Madrid, Spain (pp. 273-282). Universidad Politécnica de Madrid.
General rightsCopyright and moral rights for the publications made accessible in the public portal are retained by the authors and/or other copyright ownersand it is a condition of accessing publications that users recognise and abide by the legal requirements associated with these rights.
? Users may download and print one copy of any publication from the public portal for the purpose of private study or research. ? You may not further distribute the material or use it for any profit-making activity or commercial gain ? You may freely distribute the URL identifying the publication in the public portal ?
Take down policyIf you believe that this document breaches copyright please contact us at [email protected] providing details, and we will remove access tothe work immediately and investigate your claim.
Downloaded from vbn.aau.dk on: juli 18, 2018
Modal Identification of Output-Only Systems using Frequency Domain Decomposition
Rune Brincker'l, Lingmi Zhang2l and Palle Andersen3l
IJ Department of Building Technology and Structural Engineering Aalborg University, Sonhgaardsholmsvej 57, DK 9000, Aalborg
lJ Institute of Vibration Engineering, Nanjing University of Aeronautics and Astronautics, Nanjing, 210016, China, P.R.
J)Structural Vibration Solutions ApS NOVI Science Park,Niels Jernes Vej 10, DK 9220 Aalborg East, Denmark
SUMMARY: In this paper a new frequency domain technique is introduced for the modal identification of output-only systems, i.e. in the case where the modal parameters must be estimated without knowing the input exciting the system. By its user friendliness the technique is closely related to the classical approach where the modal parameters are estimated by simple peak picking. However, by introducing a decomposition of the spectral density function matrix, the response spectra can be separated into a set of single degree of freedom systems, each corresponding to an individual mode. By using this decomposition technique close modes can be identified with high accuracy even in the case of strong noise contamination of the signals. Also, the technique clearly indicates harmonic components in the response signals.
INTRODUCTION
Modal identification of output-only systems is normally associated with the identification of modal parameters from the natural responses of civil engineering structures, space structures and large mechanical structures. Normally, in these cases the loads are unknown, and thus, the modal identification has to be carried out based on the responses only. Real case examples on some civil engineering structures can be found in Ventura and Horyna [1] or Andersen et al. [2].
The present paper deals with a new way of identifying the modal parameters of a structure from the responses only when the structure is loaded by a broad-banded excitation.
The technique presented in this paper is an extension of the classical frequency domain approach often referred to as the Basic Frequency Domain (BFD) technique, or the Peak Picking technique. The classical approach is based on simple signal processing using the Discrete Fourier Transform, and is using the fact that well separated modes can be estimated
273
directly from the power spectral density matrix at the peak, Bendat and Piersol [3]. Other implementations of the technique make use of the coherence between channels, Felber [ 4] .
The classical technique gives reasonable estimates of natural frequencies and mode shapes if the modes are well separated. However, in the case of close modes, it can be difficult to detect the close modes, and even in the case where close modes are detected, estimates becomes heavily biased. Further, the frequency estimates are limited by the frequency resolution of the spectral density estimate, and in all cases, damping estimation is uncertain or impossible.
Even though the classical approach has limitations concerning accuracy in the identification process, the classical approach has important advantages when compared to other approaches. It is natural to compare with classical two-stage time domain approaches such as the Polyreference technique, V old et al [5], the Ibrahim Time Domain tehcnique, Ibrahim and Milkulcik [6], and the Eigensystem Realization Algorithm, Juang and Papa [7], or to compare with the new one-stage time domain identification tehcniques know as the Stochastic Subspace Identification algorithms, Van Overschee and De Moor [8]. The main advantages compared to these other techniques is that the classical approach is much more user-friendly, it is faster, simpler to use, and gives the user a "feeling" of the data he or she is dealing with. The fact that the user works directly with the spectral density functions helps the user in figuring out what is structural just by looking at the spectral density functions. This reinforces the users understanding of the physics and thus provides a valuable basis for a meaningful identification.
The technique presented in this paper is a Frequency Domain Decomposition (FDD) technique. It removes all the disadvantages associated with the classical approach, but keeps the important features of user-friendliness and even improves the physical understanding by dealing directly with the spectral density function. Further, the technique gives a clear indication of harmonic components in the response signals.
In this paper it is shown that taking the Singular Value Decomposition (SVD) of the spectral matrix, the spectral matrix is decomposed into a set of auto spectral density functions, each corresponding to a single degree of freedom (SDOF) system. This result is exact in the case where the loading is white noise, the structure is lightly damped, and when the mode shapes of close modes are geometrically orthogonal. If these assumptions are not satisfied, the decomposition into SDOF systems is approximate, but still the results are significantly more accurate than the results of the classical approach.
THEORETICAL BACKGROUND OF FREQUENCY DOMAIN DECOMPOSTION
The relationship between the unknown inputs x(t) and the measured responses y(t) can be
expressed as, Bendat & Piersol [9] :
(1)
WhereGxx(jw)is the r x r Power Spectral Density (PSD) matrix of the input, ris the
number of inputs, Gyy(Jw)is the m x m PSD matrix of the responses, m is the number of
274
[3]. Other lber [4).
. e shapes if difficult to , estimates frequency ncertain or
ntification to other
es such as rahim and >compare )tochastic ivantages ·-friendly, ling with. e user in -einforces :!aningful
1 (FDD) 1ut keeps 'lding by
a clear
spectral ns, each the case :shapes ied, the ly more
[ON
can be
(1)
is the
ber of
responses, H(jm) is the mxr Frequency Response Function (FRF) matrix, and "-"and
superscript T denote complex conjugate and transpose, respectively .
The FRF can be written in prutial fraction, i.e. pole/residue form
n R R H(jm) = L k + k
k=I jm- J.k jm- J.k (2)
where n is the number of modes, J.k is the pole and Rk is the residue
(3)
where iflk, 1 k is the mode shape vector and the modal participation vector, respectively.
Suppose the input is white noise, i.e. its PSD is a constant matrix, i.e. G xx (jm) = C, then
Equation (1) becomes
(4)
where superscript H denotes complex conjugate and transpose. Multiplying the two partial fraction factors and making use of the Heaviside partial fraction theorem, after some mathematical manipulations, the output PSD can be reduced to a pole/residue form as follows
n A A B B G (jm) = L k + k + k + k
YY k=t }w - J.k }w-:tk - }w -:tk - }w - :tk (5)
where Ak is the k th residue matrix of the output PSD. As the output PSD itself the residue
matrix is an mxm hermitian matrix and is given by
(6)
The contribution to the residue from the k th mode is given by
(7)
whereak is minus the real part of the pole J.k = - ak + jmk . As it appears, this term becomes
dominating when the damping is light, and thus, is case of light damping, the residue becomes propmtional to the mode shape vector
- T T Ak oc RkCRk = (PkYk Cykiflk
= dkiflk<Pl (8)
275
where d k is a scalar constant. At a certain frequency m only a limited number of modes will
contribute significantly, typically one or two modes. Let this set of modes be denoted by Sub(m). Thus, in the case of a lightly damped structure, the response spectral density can
always be written
(9)
This is a modal decomposition of the spectral matrix. The expression is similar to the results one would get directly from Equation (1) under the assumption of independent white noise input, i.e. a diagonal spectral input matrix.
IDENTIFICATION ALGORITHM
In the Frequency Domain Decomposition (FDD) identification, the first step is to estimate the
power spectral density matrix. The estimate of the output PSD GyyCiOJ) known at discrete
frequencies m= mi is then decomposed by taking the Singular Value Decomposition (SVD)
of the matrix
(10)
where the matrix Ui = [uil,ui2 ,K ,uim] is a unitary matrix holding the singular vectors uiJ,
and Si is a diagonal matrix holding the scalar singular values siJ. Near a peak corresponding
to the k th mode in the spectrum this mode or may be a possible close mode will be dominating. If only the k th mode is dominating there will only be one term in Equation (9). Thus, in this case, the first singular vector u il is an estimate of the mode shape
(11)
and the corresponding singular value is the auto power spectral density function of the corresponding single degree of freedom system, refer to Equation (9). This power spectral
density function is identified around the peak by comparing the mode shape estimate ~ with
the singular vectors for the frequency lines around the peak. As long as a singular vector is
found that has high MAC value with ~ the corresponding singular value belongs to the
SDOF density function .
From the piece of the SDOF density function obtained around the peak of the PSD, the natural frequency and the damping can be obtained. In this paper the piece of the SDOF PSD was taken back to time domain by inverse FFT, and the frequency and the damping was simply estimated from the crossing times and the logarithmic decrement of the corresponding SDOF auto correlation function .
In the case two modes are dominating, the first singular vector will always be a good estimate of the mode shape of the strongest mode. However, in case the two modes are orthogonal, the first two singular vectors are unbiased estimates of the corresponding mode shape vectors. In
276
~swill
ted by ty can
(9)
:esults noise
tte the
screte
SVD)
(10)
s u!i,
nding
ill be n (9).
.1)
1f the ectral
with
tor is
o the
I, the PSD
:was 1ding
imate 1, the s. In I
I
J
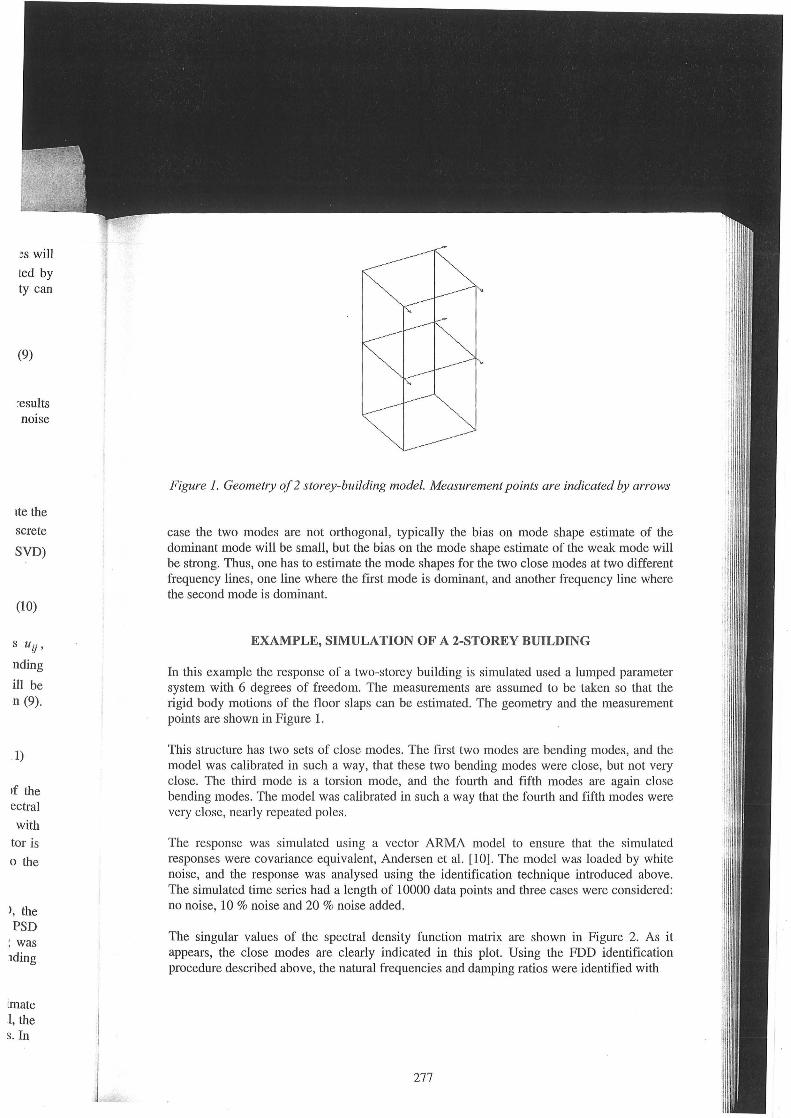
Figure 1. Geometry of 2 storey-building model. Measurement points are indicated by arrows
case the two modes are not orthogonal, typically the bias on mode shape estimate of the dominant mode will be small, but the bias on the mode shape estimate of the weak mode will be strong. Thus, one has to estimate the mode shapes for the two close modes at two different frequency lines, one line where the first mode is dominant, and another frequency line where the second mode is dominant.
EXAMPLE, SIMULATION OF A 2-STOREY BUILDING
In this example the response of a two-storey building is simulated used a lumped parameter system with 6 degrees of freedom. The measurements are assumed to be taken so that the rigid body motions of the floor slaps can be estimated. The geometry and the measurement points are shown in Figure 1.
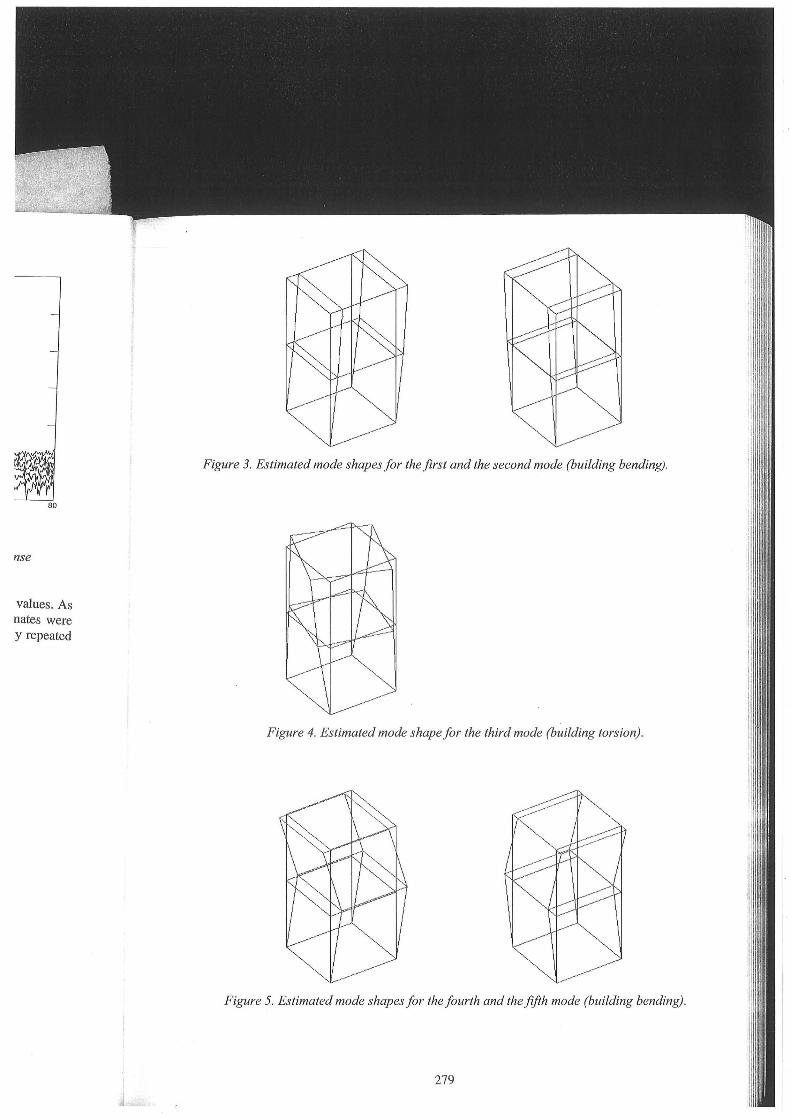
This structure has two sets of close modes. The first two modes are bending modes, and the model was calibrated in such a way, that these two bending modes were close, but not very close. The third mode is a torsion mode, and the fourth and fifth modes are again close bending modes . The model was calibrated in such a way that the fourth and fifth modes were very close, nearly repeated poles.
The response was simulated using a vector ARMA model to ensure that the simulated responses were covariance equivalent, Andersen et al. [10]. The model was loaded by white noise, and the response was analysed using the identification technique introduced above. The simulated time series had a length of 10000 data points and three cases were considered: no noise, 10% noise and 20% noise added.
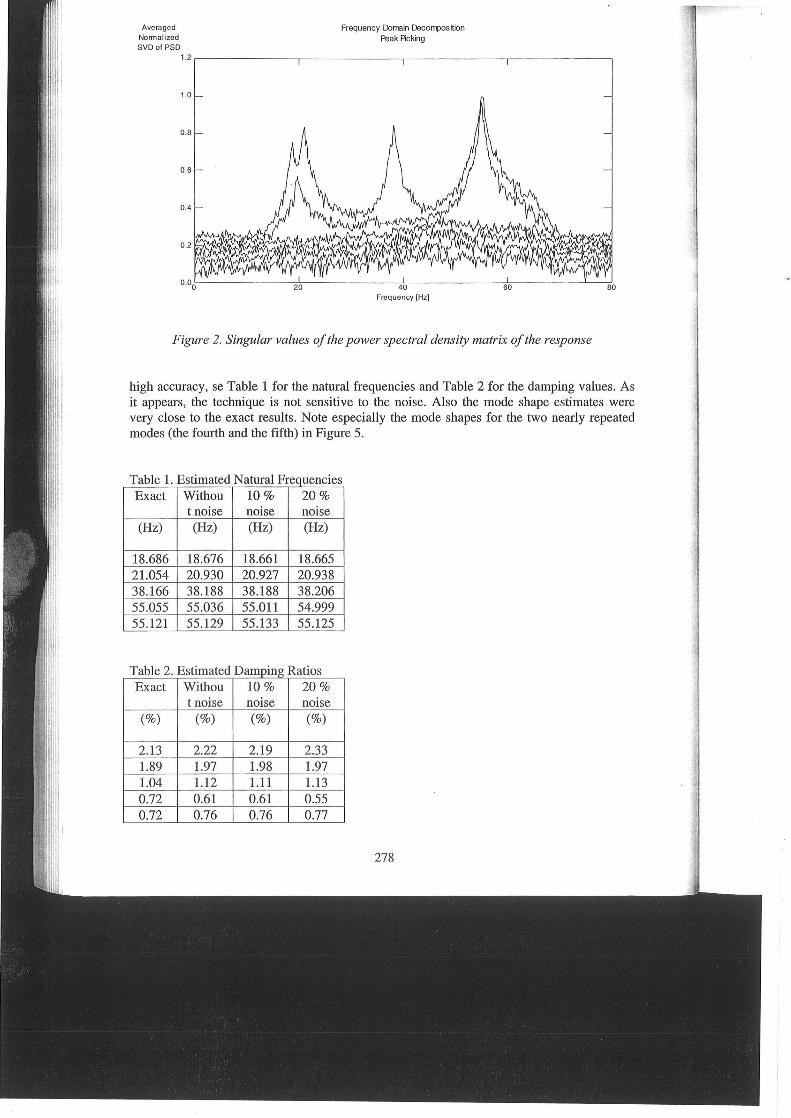
The singular values of the spectral density function matrix are shown in Figure 2. As it appears, the close modes are clearly indicated in this plot. Using the FDD identification procedure described above, the natural frequencies and damping ratios were identified with
277
Averaged Normalized SVD of PSD
Frequency Dcrrain Oecorrposition Peak Acking
1.2 ,------- --r------ -,--------.----------,
Frequency (Hz]
Figure 2. Singular values of the power spectral density matrix of the response
high accuracy, se Table 1 for the natural frequencies and Table 2 for the damping values. As it appears, the technique is not sensitive to the noise. Also the mode shape estimates were very close to the exact results. Note especially the mode shapes for the two nearly repeated modes (the fourth and the fifth) in Figure 5.
T bl 1 E . a e . stimate dN atura lF requenc1es Exact Withou 10% 20%
t noise noise noise (Hz) (Hz) (Hz) (Hz)
18.686 18.676 18.661 18.665 21.054 20.930 20.927 20.938 38.166 38.188 38.188 38.206 55.055 55.036 55.011 54.999 55.121 55.1 29 55.133 55.125
T bl 2 E . a e stlmate dD ampmg R. at! os Exact Withou 10% 20%
t noise noise noise (%) (%) (%) (%)
2.13 2.22 2.19 2.33 1.89 1.97 1.98 1.97 1.04 1.12 1.11 1.13 0.72 0.61 0.61 0.55 0.72 0.76 0.76 0.77
278
nse
values. As nates were y repeated
Figure 3. Estimated mode shapes for the first and the second mode (building bending).
Figure 4. Estimated mode shape for the third mode (building torsion).
Figure 5. Estimated mode shapes for the fourth and the fifth mode (building bending) .
279
INDICATION OF HARMONICS
As explained earlier, the frequency domain decomposition (FDD) technique presented in this paper decomposes the spectral density into a set auto spectral density functions each one corresponding to one of the single degree of freedom system representing the corresponding mode. If a harmonic is present, this corresponds a local amplification of the auto spectral density function of all the SDOF systems, i.e. all - or nearly all - of the singular values in the spectral plot will show a peak at the frequency where the harmonic is present. This result holds also in the case of a quasi-stationary harmonic, i.e. in the case of a harmonic with a slowly varying frequency.
Thus, if one observes, that not only the first singular value has a peak at a certain frequency , but most of the other singular also have a peak at that same frequency, then this is strong indication, that the peak does not represent a structural response, but a harmonic. An example of the application of this feature of the FDD technique is given in Brincker et al [15] .
If a structural mode is close to the harmonic, the harmonic does not destroy the mode shape estimate. However, one should be careful not using the amplified values of the SDOF bell (amplified by the harmonic) when using the inverse Fourier transform to estimate frequency and damping in the time domain. This will heavily bias the frequency and damping estimate.
CONCLUSIONS
In this paper a new frequency domain identification technique denoted Frequency Domain Decomposition (FDD) has been introduced.
The technique is based on decomposing the power spectral density function matrix using the Singular Value Decomposition. It has been shown that this decomposes the spectral response into a set of single degree of freedom systems, each corresponding to one individual mode.
The technique has been illustrated on a simulation example with noise and close modes. The results clearly indicate that the present technique is able to estimate close modes with high accuracy and that the technique is not sensitive to noise.
In the case of close modes that are not orthogonal, the mode shape of the dominant mode is still well estimated. However, if the other mode is not dominating a any frequency, other ways of estimating the mode shape for such a mode must be introduced.
The technique has been applied successfully to several civil engineering cases, Brincker et al. [11] , [12] and to several cases of identification in mechanical engineering where the the structure was loaded by rotating machinery, Brincker et al. [13] , Mpller et al. [14] and Brincker et al. [1 5].
The technique clearly indicates the presence of harmonics in the response signal, i.e. without further indication the user directly separates harmonic peaks from structural response peaks.
280
!din this !ach one ;ponding spectral
es in the is result c with a
:quency, s strong !xample
e shape OF bell :quency imate.
>omain
ing the sponse Jde.
s. The h high
ode is other
·et al. te the ] and
thout tks.
REFERENCES
[1] Ventura, Carlos E. and Tomas Horyna: "Structural Assesment by Modal Analysis in Western Canada", Proc. of the 15th International Modal Analysis Conference, Orlando, Flmida, Orlando, 1997.
[2] Andersen, P, R. Brincker, B. Peeters, G. De Roeck, L. Hermans and C. Kramer: "Comparison of system Identification Methods Using Ambient Bridge Test Data", ", Proc. of the 1 ih International Modal Analysis Conference, Kissimee, Florida, 1999.
[3] Bendat, Julius S and Allan G. Piersol: "Engineering Applications of Correlation and Spectral Analysis", John Wiley & Sons, 1993.
[4] Felber, A.J.: "Development of a Hybrid Bridge Evaluation System", Ph.D. thesis, Department of Civil Engineering, University of British Columbia, Vancouver, Canada, 1993.
[5] Vold, H., Kundrat, J., Rocklin, G. T., Russel, R.: "A Multi-Input Modal Estimation Algorithm For Mini-Computer", SAE Technical Paper Series, No. 820194, 1982
[6] lbrahim, S. R. & Milkulcik, E. C., 'The Experimental Determination of Vibration Test Parameters From Time Responses", The Shock and Vibration Bulletin, Vol. 46, No. 5, 1976,pp. 187-196
[7] Juang, J.-N. & Pappa, R. S., " An Eigensystem Realization Algorithm For Modal Parameter Identification And Modal Reduction", J. of. Guidance, Control and Dynamics, Vol. 8, No. 5, 1985, pp. 620-627
[8] Van Overshcee, Peter and Bart De Moor: "Subspace Identification for Linear Systems", Kluwer Academic Publishers, 1996
[9] Bendat, Julius S and Allan G. Piersol: "Random Data, Analysis and Measurement Procedures", John Wiley & Sons, 1986.
[10] Andersen, P., R. Brincker, and P.H. Kirkegaard: "Theory of Covariance Equivalent ARMA V Models of Civil Engineering Structures", Proc of the 14th International Modal Analysis Conference, IMAC, Dearborn, 1996.
[11] Brincker, R, P. Andersen: "Ambient Response Analysis of the Heritage Court Tower Building Structure", Proc. of the 18th International Modal analysis Conference, San Antonio, Texas, February 7-10,2000.
[12] Brincker, R., J. Frandsen and P. Andersen: "Ambient Response Analysis of the Great Belt Bridge", Proc. of the 18th International Modal analysis Conference, San Antonio, Texas, February 7-10, 2000.
[13] Brincker, R., P. Andersen and Nis M0ller.: "Output-Only Modal Testing of a Car Body Bubject to Engine Excitation", Proc. of the 18th International Modal analysis Conference, San Antonio, Texas, February 7-10, 2000.
[14] M0ller, N., R. Brincker and P. Andersen: "Modal Extraction on a Diesel Engine in Operation", Proc. of the 18th International Modal analysis Conference, San Antonio, Texas, February 7-10,2000
[15] Brincker, R., P. Andersen and Nis M0ller: "An Indicator for Separation of Structural and Harmonic Modes in Output-Only Modal Testing, . Proc. of the European COST F3 Conference on System Identification & Structural Health Monitoring, Universidad Politecnica de Madrid, Spain, 6-9 June, 2000.
281