Embed Size (px)
Citation preview
Aalborg Universitet
Next Generation Die Design for Biomass Pelleting
Nielsen, Simon Klinge
Publication date:2020
Document VersionPublisher's PDF, also known as Version of record
Link to publication from Aalborg University
Citation for published version (APA):Nielsen, S. K. (2020). Next Generation Die Design for Biomass Pelleting. Aalborg Universitetsforlag. Ph.d.-serien for Det Ingeniør- og Naturvidenskabelige Fakultet, Aalborg Universitet
General rightsCopyright and moral rights for the publications made accessible in the public portal are retained by the authors and/or other copyright ownersand it is a condition of accessing publications that users recognise and abide by the legal requirements associated with these rights.
? Users may download and print one copy of any publication from the public portal for the purpose of private study or research. ? You may not further distribute the material or use it for any profit-making activity or commercial gain ? You may freely distribute the URL identifying the publication in the public portal ?
Take down policyIf you believe that this document breaches copyright please contact us at [email protected] providing details, and we will remove access tothe work immediately and investigate your claim.
Downloaded from vbn.aau.dk on: October 28, 2021


SIMO
N K
LING
E NIELSEN
NEXT G
ENER
ATION
DIE D
ESIGN
FOR
BIO
MA
SS PELLETING
NEXT GENERATION DIE DESIGNFOR BIOMASS PELLETING
BYSIMON KLINGE NIELSEN
DISSERTATION SUBMITTED 2020


Next Generation Die Designfor Biomass Pelleting
Ph.D. DissertationSimon Klinge Nielsen
Dissertation submitted August, 2020

Dissertation submitted: August, 2020
University PhD Supervisor: Associate Professor Matthias Mandø Aalborg University
Company PhD Supervisor: Engineering Manager Andreas B. Rosenørn Andritz Feed & Biofuel
PhD committee: Associate Professor Henrik Sørensen (chairman) Aalborg University
Lead Chemistry Specialist Jens Kai Holm Markets & Bioenergy, Ørsted
Professor Sylvia Larsson Swedish University of Agricultural Sciences
PhD Series: Faculty of Engineering and Science, Aalborg University
Department: Department of Energy Technology
ISSN (online): 2446-1636ISBN (online): 978-87-7210-684-7
Published by:Aalborg University PressKroghstræde 3DK – 9220 Aalborg ØPhone: +45 [email protected]
© Copyright: Simon Klinge Nielsen
Printed in Denmark by Rosendahls, 2020

Abstract
The production of biomass pellets involves different design- and process pa-rameters of the pellet press, which affect the pellet properties and the oper-ational expense of the pellet production. In the pellet press, the feedstock iscompressed and converted from sawdust into solid pellets. The die has to becustom designed for each production site due to the different properties ofthe feedstock used. The design of dies is partly relying on experiences fromtrial-and-error processes, which may involve several design iterations beforethe final design is developed.
The die design is correlated to the pelleting pressure, which is determinedby the friction between the pellet and the die. Typical problems with diesare either that the pelleting pressure is too low to produce pellets with therequired density and mechanical durability, or the pelleting pressure becomestoo high. High pelleting pressure reduces the lifetime of the die and increasesthe power consumption of the pellet press. In case that the pelleting pressurebecomes too high, the feedstock blocks the die and causes a time-consumingshutdown of the pellet press.
In this thesis, existing pelleting studies are reviewed, and experimental,and modeling studies of the physical processes in the die are performed, toobtain a better understanding of the design parameters of the die, and howthese affect the pelleting process.
An extensive literature study shows that design and process parameters,such as the press channel inlet, die area, die speed, and gap size between dieand roller, are rarely considered in pelleting studies. However, a few studiesindicate that these parameters have a significant effect on energy consump-tion, and also affect the pellet durability. The literature study also shows thatthe existing methods for calculating the pelleting pressure in the die’s presschannels are based on a set of equations that only apply for calculation of apure cylindrical press channel.
A 1D model is developed for calculating the pelleting pressure in presschannels with a conical inlet section, and experimental single pelleting testsare performed for validation of the model. Simulations of the pressure con-tours in press channels show that the peak pressure is located where the
iii

conical inlet meets the cylindrical channel, which also is where the wear ofthe channel is most pronounced. In addition to the pelleting pressure, thepresented model is set up to calculate the feedstock density and the mass-specific energy consumption of the pelleting process.
Further investigation of the press channel inlet is performed by using anovel experimental method for analyzing the feedstock motion in the presschannel, and by setting up a Computational Fluid Dynamics model for sim-ulating the feedstock flow. The analyzes of feedstock motion in the presschannel show that the conical inlet design of the press channel affects theshape of the feedstock layers in pellets, which is shown to correlate with thepellet durability. The analyzes also show cases of stagnant feedstock on thedie surface and in the press channel inlet.
A pilot-scale pellet press is set up for experimental testing, where thethickness of the feedstock layer on the die surface and the gap size betweendie and roller are investigated. The results show that the energy consumptionof the pellet press decreases, and the pellet durability increases when thethickness of the feedstock layer on the die is increased. The test results of thegap size between die and roller show that the energy consumption increasesand the pellet durability decreases when the gap size is increased. Hence,the thickness of the feedstock layer on the die and the gap size between dieand roller are found to be important process parameters in the pellet press.
The mechanical behavior of biomass feedstock is studied via constitutivemodeling and experimental compression tests. The results of the constitutivemodeling show that the viscoplastic behavior of compressed biomass can bemodeled using an SLS Maxwell model, with two strain-hardening springsand a dashpot. The coefficients of the model elements are shown to corre-late with the energy that is required for compressing the biomass, while themodel’s dashpot work is lowest for pellets produced with small particles,which also have the highest durability measured from the experiments.

Resumé
Produktionen af biomasse piller indbærer forskellige design- og procespara-metre af pillepressen, som påvirker pillernes egenskaber og produktionsom-kostningerne. I pillepressen bliver råvaren komprimeret og omsat fra savs-muld til solide træpiller. Designet af matricen skal tilpasses specifikke pro-duktionssteder, grundet forskelle i råvareegenskaber. Matricedesignet er tildels baseret på erfaringer ved at prøve sig frem, hvilket kan betyde op tilflere designiterationer før et passende matricedesign er udviklet.
Matricedesignet korrelerer med pelleteringstrykket, som afhænger af frik-tionen mellem pillen og matricen. Typiske problemer med matricer er at pel-leteringstrykket enten er for lavt til at kunne producere piller med den på-krævede densitet og sammenhængskraft, eller at pelleteringstrykket er forhøjt. Højt pelleteringstryk reducerer holdbarheden af matricen og øger ener-giforbruget af pillepressen. I tilfælde af at pelleteringstrykket bliver for højt,blokeres matricen af råvaren og forårsager et tidskrævende driftsstop af pil-lepressen.
I denne afhandling er eksisterende pelleteringsstudier gennemgået samteksperimentelle og modelleringsstudier af de fysiske processer i matricener foretaget, for at opnå en bedre forståelse af matricens designparametre,og hvordan disse påvirker pelleteringsprocessen. Et grundigt litteraturstudieviser at design- og procesparametre, såsom pressekanalens indløb, matriceareal, matrice hastighed og afstanden mellem matrice og rulle sjældent erbetragtet i pelleteringsstudier. Dog har enkelte studier vist at disse parametrehar en signifikant effekt på energiforbruget, og samtidig påvirker pillernessammenhængskraft. Litteraturstudiet viser også at de eksisterende metodertil at beregne pelleteringstrykket i pressekanaler er baseret på et sæt ligninger,som er begrænset til beregning for en cylindrisk pressekanal.
En 1D model er blevet udviklet for at beregne pelleteringstrykket i pres-sekanaler med et konisk indløb, og eksperimentelle enkeltpelleteringsforsøger blevet udført til validering af modellen. Simuleringer af trykkonturerneviser at det højeste tryk er i overgangen mellem det koniske indløb og dencylindriske del af pressekanalen, hvilket også er her at sliddet af kanalen erkoncentreret. Ud over pelleteringstrykket, er den præsenterede model sat op
v

til at beregne råvaredensiteten og det massespecifikke energiforbrug.Videre undersøgelse af pressekanalens indløb er udført med en ny ekspe-
rimentel metode til at analysere råvarens bevægelse i pressekanalen, og vedat opsætte en Computational Fluid Dynamics model til at simulere råvare-strømningen. Analyserne af råvarestrømning i pressekanalen viser at koniskeindløbsdesign påvirker formen af råvarelagene i piller, hvilke er påvist at kor-relere med pillernes sammenhængskraft. Analyserne viser også tilfælde medstillestående råvare på matricens overflade og i indløbet af pressekanalen.
En pilotskala pillepresse er blevet opstillet til eksperimentel test, hvorlagtykkelsen af råvaren på matriceoverfladen og afstanden mellem matriceog rulle er blevet undersøgt. Resultaterne af testene viser at energiforbrugetaf pillepressen falder, og pillernes sammenhængskraft stiger, når lagtykkel-sen af råvaren på matricen forøges. Testresultaterne af afstanden mellem ma-trice og rulle viser at energiforbruget stiger, og pillernes sammenhængskraftfalder, når afstanden forøges. Dermed er lagtykkelsen af råvaren på matricensamt afstanden mellem matrice og rulle påvist at være vigtige procesparame-tre i pelletpressen.
De mekaniske egenskaber af biomasse er undersøgt via konstitutiv mo-dellering og eksperimentelle kompressionstests. Resultaterne af den konsti-tutive modellering viser, at de visko-plastiske egenskaber af komprimeretbiomasse kan modelleres med en SLS Maxwell model, med to tøjningssti-vende fjedre og en dæmper. Modellens elementkoefficienter er påvist at kor-relere med energien, der er påkrævet til at komprimere biomassen, mens atdæmperarbejdet i modellen er lavest for piller produceret med små partikler,hvilke også har den højeste sammenhængskraft målt i eksperimenterne.
Contents
Abstract iii
Resumé v
Thesis Details ix
Preface xi
Nomenclature xiii
I Extended summary 1
1 Introduction 31.1 Motivation . . . . . . . . . . . . . . . . . . . . . . . . . . . . . . . 31.2 Objectives . . . . . . . . . . . . . . . . . . . . . . . . . . . . . . . 41.3 The Pelleting Process . . . . . . . . . . . . . . . . . . . . . . . . . 41.4 Outline of the Papers . . . . . . . . . . . . . . . . . . . . . . . . . 9
2 Press Channel Analysis 112.1 Pelleting Pressure . . . . . . . . . . . . . . . . . . . . . . . . . . . 112.2 1D Press Channel Model . . . . . . . . . . . . . . . . . . . . . . . 132.3 Model Results . . . . . . . . . . . . . . . . . . . . . . . . . . . . . 19
3 Constitutive Modelling of Pelleting Feedstock 253.1 Biomass Compression . . . . . . . . . . . . . . . . . . . . . . . . 253.2 Constitutive Model for Compression and Stress Relaxation . . . 293.3 Results of Experimental Compression Tests . . . . . . . . . . . . 303.4 Simulation Results . . . . . . . . . . . . . . . . . . . . . . . . . . 32
4 Effect of the Press Channel Inlet and the Feedstock Layer Shapes inPellets 394.1 Press Channel Inlet and Feedstock Layer Deformation . . . . . 39
vii

Contents
4.2 CFD Model . . . . . . . . . . . . . . . . . . . . . . . . . . . . . . 414.3 Layer Profile Analysis . . . . . . . . . . . . . . . . . . . . . . . . 43
5 Process Parameters of the Pellet Press 555.1 Feedstock Motion in the Press Channel . . . . . . . . . . . . . . 555.2 Pellet Press Set Up and Tests . . . . . . . . . . . . . . . . . . . . 59
6 Conclusion and Closing Remarks 69
References . . . . . . . . . . . . . . . . . . . . . . . . . . . . . . . . . . 72
II Papers 79
A 1D Model for Investigation of Energy Consumption and Wear inDie Designs Used for Biomass Pelleting 81
B Review of Die Design and Process Parameters in the Biomass Pel-leting Process 83
C Constitutive Modelling of Compression and Stress Relaxation inPine Pellets 85
D Experimental and Numerical Investigation of Die Designs in BiomassPelleting and the Effect on Layer Formation in Pellets 87
E Experimental Investigation of Feedstock Layer Thickness and Die-Roller Gap in Wood Pelleting 89
viii
Thesis Details
Thesis Title: Next Generation Die Design for Biomass PelletingPh.D. Student: Simon Klinge NielsenSupervisors: Associate Professor Matthias Mandø, Aalborg University
Engineering Manager Andreas B. Rosenørn, Andritz Feed& Biofuel
The body of the thesis consists of the following papers:
[A] S. K. Nielsen, M. Mandø, A. B. Rosenørn, "1D Model for Investigationof Energy Consumption and Wear in Die Designs Used for BiomassPelleting", Proceedings of the 26th European Biomass Conference and Ex-hibition, Copenhagen, Denmark, May 14-17, pp. 550-558, 2018, https:
//doi.org/10.5071/26thEUBCE2018-2CO.13.1.
[B] S. K. Nielsen, M. Mandø, A. B. Rosenørn, "Review of Die Design andProcess Parameters in the Biomass Pelleting Process", Powder Technol-ogy, Vol. 364, pp. 971-985, 2020, https://doi.org/10.1016/j.powtec.2019.10.051
[C] S. K. Nielsen, H. Rezaei, M. Mandø, S. Sokhansanj, "Constitutive Mod-elling of Compression and Stress Relaxation in Pine Pellets, Biomass &Bioenergy, Vol. 130, no. 105370, 2019, https://doi.org/10.1016/j.biombioe.2019.105370
[D] S. K. Nielsen, M. Mandø, "Experimental and Numerical Investigationof Die Designs in Biomass Pelleting and the Effect on Layer Formationin Pellets", 2020, submitted to Biosystems Engineering (revised version underreview).
[E] S. K. Nielsen, M. Mandø, A. B. Rosenørn, "Experimental Investigationof Feedstock Layer Thickness and Die-Roller Gap in Wood Pelleting",Proceedings of the World Sustainable Energy Days, Wels, Austria, March 4-6,pp. 1-10, 2020.
ix

Thesis Details
x

Preface
This thesis is submitted as a collection of papers in fulfillment of the require-ments for the degree of Doctor of Philosophy at the Department of EnergyTechnology, Aalborg University, Denmark. The Ph.D. project is a part of theIndustrial Ph.D. program by Innovation Fund Denmark under File No. 7038-00016B, with Andritz Feed & Biofuel and Aalborg University as the projectpartners. Andritz is a global manufacturer of equipment for pelleting, withan annual production of more than 16.000 dies for pellet presses.
The study has been carried out at Andritz in Esbjerg and the Departmentof Energy Technology at Aalborg University, Campus Esbjerg. The work wasconducted in the period from September 2017 to August 2020 under the su-pervision of Associate Professor Matthias Mandø and Engineering ManagerAndreas Brinch Rosenørn.
During the project, I had a three months stay in the Autumn 2019 as a vis-iting researcher at the University of British Columbia in Vancouver, Canada,with supervision from Dr. Hamid Rezaei and Professor Shahab Sokhansanj.
I want to thank Andritz for the opportunity of doing this Ph.D. and thanksto my colleagues at Andritz, Aalborg University, and the University of BritishColumbia for providing a resourceful and enjoyable research environment.Thanks to Application Manager Torben Poulsen for taking me under hiswings and giving me the chance to experience industrial pelleting plants,and always providing a technical aspect. Thanks to Service Technician JensVester and Automation Engineers Ole Bank and Thomas Jørgensen, for help-ing with the installation of the pellet press setup. Thanks to Andreas BrinchRosenørn for providing helpful supervision through the project.
A special thanks to my supervisor Matthias Mandø. Thank you for ourmany valuable discussions, both on- and off-topic, and for always being sup-portive and taking the time whenever needed. Also, thanks to Christian GejlPedersen, without whom this project never had been established.
Finally, I am grateful for the support of my family and friends. Speciallythanks to my girlfriend and son.
Simon Klinge NielsenAalborg University, August 1, 2020
xi

Preface
xii

Nomenclature
β Press channel inlet angle [◦]
∆t Time step [s]
γ Shear rate [1/s]
γc Critical shear rate [1/s]
m Mass flow rate [kg/s]
ε Strain [−]
ε1 Strain of system 1 in the SLS model [−]
ε2 Strain of system 2 in the SLS model [−]
εs2 Strain of spring 2 in the SLS model [−]
η non-Newtonian viscosity [Pa · s]
µ Viscosity [Pa · s]
µw Coefficient of friction [−]
ν Poisson’s ratio [−]
ωd Rotational frequency of the die [1/s]
φs Solid ratio [−]
φv Void ratio [−]
ρ Density [kg/m3]
ρb Bulk density [kg/m3]
ρs Density of the solid spring [kg/m3]
σ Stress [Pa]
xiii

Nomenclature
σ1 Stress of system 1 in the SLS model [Pa]
σ2 Stress of system 2 in the SLS model [Pa]
τ0 Yield stress [Pa]
τw Wall shear stress [Pa]
a Empirical coefficient [kg]
Aa Cross-sectional area of the press channel [m2]
Ar Area of the press channel wall [m2]
Ad Area of the die’s inner surface [m2]
AR Ratio of active and transition area to the total surface area of the die[−]
D Press channel diameter [m]
Ec Compression energy [J]
E1−2 Spring modulus [Pa]
Fp Pelleting force, static [N]
Fr Radial force [N]
F0 Outlet or initial resistance force [N]
Fµ Friction force [N]
Fe Pelleting force, kinetic [N]
Frn Radial force component acting normal to the die wall [N]
Frp Radial force component acting parallel to the die wall [N]
h Countersink inlet depth [m]
h f Thickness of the feedstock layer [m]
h f c Thickness of the compressed feedstock layer [m]
kr Ratio of axial to lateral stress [−]
k1−3 Empirical coefficients
L Press channel length [m]
m f Mass of the feedstock layer [kg]
xiv

Nomenclature
N Number of elements [−]
n Element number [−]
Nr Number of rollers in the pellet press [−]
Nch Number of press channels in the die [−]
p Pressure [Pa]
Pc Compression pressure [Pa]
PNo Prestressing pressure [Pa]
Pp Pelleting pressure [Pa]
Px Local pelleting pressure [Pa]
r Radial axis of the press channel [−]
T Temperature [°C]
t Time [s]
v Specific volume [m3/kg]
v1 Initial specific volume [m3/kg]
v2 Final specific volume [m3/kg]
vr Axial velocity in the press channel [m/s]
vz Radial velocity in the press channel [m/s]
w Mass-specific energy [J/kg]
wc Mass-specific compression energy [J/kg]
wµ Mass-specific friction energy [J/kg]
x Position in the press channel [m]
xe Position of the press stop [m]
xp Position for the static pelleting force [m]
x1−2 Spring coefficients [Pa]
z Longitudinal axis of the press channel [−]
Wµ Frictional power dissipation [W]
xv

Nomenclature
xvi

Part I
Extended summary
1


Chapter 1
Introduction
This chapter presents the motivation of this study and brief introduction to thebiomass pelleting process. It also presents the main objectives of this work togetherwith an outline of the papers included in the thesis.
1.1 Motivation
The global consumption of wood pellets experiences massive growth, andthe production has more than doubled in five years, from 24.9 Mt in 2013 itreached 55.7 Mt in 2018, and is expected to continue increasing [1, 2]. Themain reason for the increasing pellet production is due to the replacementof fossil fuels with biofuels, where political initiatives and economic viabilityare the main drivers of the transition [3]. In the European Union, biomassis foreseen to play an essential role in obtaining the target of 27% renewableenergy by 2030 [4, 5]. Also, in Japan and South Korea, the consumption ofwood pellets is rapidly increasing due to government initiatives such as theRenewable Portfolio Standard and the Feed-in Tariff [6, 7].
In the supply chain costs for wood pellets, pellet plants are associatedwith a high Operating Expense (OPEX), and together with the feedstock cost,these are the most expensive parts of the supply chain [8]. For the pellet pressitself, the OPEX is mainly based on the electrical power consumption and themaintenance cost to wear parts as dies and rollers [9]. Due to differences infeedstock species, particle size, and process conditions as temperature andmoisture content, the design of the pellet press die needs to be fitted to eachproduction site. In the industry, the design of dies is somewhat relying on ex-periences from trial-and-error processes, where the optimal die should facil-itate a low energy consumption while maintaining the production of qualitypellets that fulfills the international standards or certifications [10, 11].
Specifying a die for a new production site or a new feedstock may involve
3

Chapter 1. Introduction
several design iterations before a final die design is developed. The frictionbetween the pellet and the die determines the pelleting pressure. Typicalproblems with dies are either that the pelleting pressure is insufficient toproduce pellets with the required density and mechanical durability, or thepelleting pressure becomes too high. High pelleting pressure decreases thelifetime of the die and rollers and increases the power consumption of thepellet press [12], which increase the OPEX. In case that the pelleting pressurebecomes too high, the die blocks and cause a time-consuming shutdown ofthe pellet press.
1.2 Objectives
The objectives of this project are as follows:
• Obtain a better understanding of the design parameters of the die andhow these affect the pelleting process.
• Develop a model that is capable of solving the pelleting pressure andenergy consumption in the die, which can be used when designing newdies and may reduce the lead time for designing feedstock-specific dies.
• Identify important process parameters in the pelleting process, whichcan and lead to reduction of the mass-specific energy consumption ofpellet presses.
1.3 The Pelleting Process
The purpose of pelleting is to raise the energy density of the raw material,which lowers the cost for transportation, and to produce pellets with stan-dardized properties for combustion purposes [13, 14]. Figure 1.1 illustratesthe processing steps in a typical pellet production and lists the physical prop-erties of the feedstock throughout the process. As shown in figure 1.1, thefeedstock is processed before being pelleted, where the feedstock moisturecontent, particle size, and temperature are adjusted to facilitate productionof high quality pellets.
Studies of the pelleting process have shown that the energy consumptionfor pelleting wood is negatively correlated with feedstock moisture content,whereas an optimum for the mechanical pellet durability is in the range 10-15% [16,17]. The moisture content of the feedstock is adjusted via the dryingand conditioning stages shown in figure 1.1.
Hammer mills grind the feedstock particles, to ensure that the particlesentering the pellet press are in a size range, where the particles are suitablefor pelleting. The particle size affects the durability of the pellets, and the
4

1.3. The Pelleting Process
ρb ≈150 kg/m3
T ≈20oCMC≈10%
Drying
Pelleting
Milling
Conditioning
Cooling
Feedstock
ρb ≈225 kg/m3
T ≈25oCMC≈8%
ρb ≈240 kg/m3
T ≈70oCMC≈14%
ρb ≈700 kg/m3
T ≈95oCMC≈8%
Final product
Figure 1.1: Processing of feedstock for pelleting, illustrating the change in feedstock propertiesduring the process. ρb is the bulk density, and MC is the moisture content on dry basis (d.b)(figure from paper B [15]).
compressive strength measured from single pellet tests, where particles sizesbelow 2 mm have shown to produce more durable pellets, and pellets witha higher compressive strength compared to pellets made from larger par-ticle sizes [18, 19]. However, the energy required for milling increases whensmaller particles are produced, which also reduces the milling capacity. Thus,the degree of size reduction sometimes becomes a tradeoff between produc-ing small particles and mill capacity.
The conditioning process is the final process step of the feedstock beforepelleting. The primary purpose of the conditioning is to pre-heat the feed-stock by adding steam, and to increase the moisture content before pelleting.Increasing the feedstock temperature to 60-70 °C before pelleting significantlydecreases the energy consumption of the pellet press, where the elevated tem-perature of the feedstock reduces the friction in the die of pellet press [16,20].
The conditioned feedstock is pressed to pellets, which increases the bulkdensity of the feedstock above 600 kg/m3 [14]. The specific energy consump-tion of the pellet press typically is in the range 30–60 kWh/ton dependenton the feedstock properties and pellet press configuration, but for some casesenergy consumption exceeds 70-80 kWh/ton [21–24]. The production capac-ity of industrial-scale pellet presses is in the range from a few tonnes perhour and up to 12 tonnes per hour.
5

Chapter 1. Introduction
Pellet Press Configuration and Die Design
Pellet presses are based on a die and roller configuration, where the feedstockis compressed between the die and roller. The compression between die androller presses feedstock into and through press channels in the die. Figure1.2a shows a ring die with a two-roller configuration, where the arrows indi-cate the rotational motion of the parts. The press motor drives the die. Therotation of the rollers is caused by friction between the die, the feedstock, andthe rollers. The die is designed with press channels oriented normal to theinner die surface. It is in the press channels that the feedstock is pressed intothe cylindrical pellet shape. Figure 1.2b illustrates a cross-sectional view ofthe ring die and roller. In front of the roller, feedstock is distributed in a layeracross the inner die surface. The rotation of the die causes that the feedstocklayer is compressed as the spacing between die and roller decreases. At somepoint, the compressional force between die and roller exceeds the frictionalresistance of the feedstock in the press channel, and the compressed layer offeedstock is pressed into the press channels.
(a) Rotating ring die with two rollers. (b) Cross-sectional view of a ring die and roller.
Figure 1.2: Ring die pellet press (figure from paper B [15]).
Pressing the feedstock layer into the press channels initiates motion of thefeedstock in the channels, which is illustrated by the red arrows in figure1.2b. The motion causes compressed cylinders of feedstock being extrudedfrom the outside of the die, where a knife break the compressed feedstockinto pellets. The pressure required for pressing the feedstock into the presschannels is specified as the pelleting pressure. The pelleting pressure is chal-lenging to measure directly in the pellet press, and not many studies havereported such measurements. However, a few studies have stated the pres-sure to be in the range 100-410 MPa [18, 25]. Hence, the dies are produced ofhigh strength alloys to resist deformations caused by the pelleting pressure,
6

1.3. The Pelleting Process
causing that the cost price for one die can reach 10,000 e.Based on experiences from the industry, the life time before replacement
or renovation of the wear parts of pellet press are highly dependent on theprocess and type of feedstock. Dies used for wood pelleting can have a lifetime up to approximate 2500 hours, while productions with abrasive feed-stocks as agricultural crops, that have higher contents of silicate, generallyhave shorter life times.
The design of the die is primarily focused on the design of the press chan-nel itself, while the distribution and number of channels in the die rarely areused as active design parameters. For ring dies, press channels are typicallydistributed in hexagonal patterns. For industrial dies, the number of presschannels is typically selected to equal 30-40% opening area of the total diearea. The opening area is defined as the accumulated area of the press chan-nels and is a tradeoff between die strength and increasing the number ofpress channels.
Figure 1.3 illustrates a cross-sectional drawing of a press channel, whichconsists of an active and inactive section. The active section is where thefeedstock is in sliding contact with the die and consists of a conical inlet anda cylindrical channel. The inactive section has no direct effect on the pelletingprocess, other than adding strength to the die to resist it from breaking.
Figure 1.3: Cross-sectional view of a press channel (figure from paper B [15]).
The ratio of length and diameter, L/D, of the press channel’s active partis a commonly used design parameter when designing the die. Increasingthe L/D ratio increases the frictional resistance between feedstock and die,and thereby increases the pelleting pressure [26]. The typical press channelis between 6 and 8 mm in diameter with an L/D between 3-7 for wood and7-12 for agricultural feedstock [15].
The conical inlet is specified by the angle, β, and depth, h. The inletis where the feedstock layer is pressed from the die surface and into thepress channel. The effect of the inlet design on the pelleting process is notwell understood in the apparent literature, which is shown by the literaturereview in paper B. However, Nielsen et al. [25] showed via single pelletingtests that a significant part of the energy consumption is consumed in the
7

Chapter 1. Introduction
inlet section, when using an 8 mm channel with a typical inlet design ofβ = 60◦ and h = 2.5mm .
The die is the central part of the pellet press, and must be designed cor-rectly to produce pellets with sufficient density and mechanical durabilitywithout using excess energy, which increases the OPEX of the production.
From the literature review of the pelleting process performed in paper B,the following points are highlighted:
• The L/D ratio of the die is likely the most commonly used design pa-rameter of the die, while the effect of parameters such as die area, presschannel inlet design, roller gap, and rotational die speed are rarely re-ported in papers of pelleting studies.
• A few studies have indicated that the press channel inlet has an effecton the pellet durability and energy consumption. However, the researchhas not resulted in correlations between the design and the process orpellet properties have been shown.
• Consideration of the feedstock’s mechanical properties, such as stressrelaxation, varying frictional coefficients, and changes in feedstock prop-erties could improve the understanding of pelleting process, and im-prove existing calculation models for the pelleting pressure, which arediscussed in chapter 2.
8

1.4. Outline of the Papers
1.4 Outline of the Papers
The thesis is structured as an extended summary based on the contributionof five papers. The extended summary describes the background and moti-vation for the project and a summary of the papers. Figure 1.4 illustrates thechronology of the papers in this thesis, and the description of the papers asfollows:
Paper A
1D Model for Investigation
of Energy Consumption
and Wear in Die Designs
Used for Biomass Pelleting
Paper C
Constitutive Modelling of
Compression and Stress
Relaxation in Pine Pellets
Paper D
Experimental and
Numerical Investigation of
Die Designs in Biomass
Pelleting and the Effect on
Layer Formation in Pellets
Paper E
Experimental Investigation
of Feedstock Layer
Thickness and Die-Roller
Gap in Wood Pelleting
Paper B
Review of Die Design and
Process Parameters in the
Biomass Pelleting Process
Figure 1.4: Chronology of the five papers in this thesis.
1D Model for Investigation of Energy Consumption and Wear in Die De-signs Used for Biomass Pelleting
– This paper aims to improve the understanding of the physical processesin terms of die wall friction and feedstock compression in the presschannel of the die. A 1D model of a press channel is set up, which iscapable of simulating the pelleting pressure and energy consumptionfor compression and friction in press channels.
Review of Die Design and Process Parameters in the Biomass PelletingProcess
– This paper presents a literature review, and covers the effect of design-and process parameters in the pelleting process. In the paper, an overviewd of designs and process settings used in previous pelleting studies ispresente. Together with Paper A, this paper forms the basis for thefollowing work in this project, where limitations of the 1D model andidentified gaps in the current state-of-the-art, are used as topics for thepapers C-E.
9

Chapter 1. Introduction
Constitutive Modelling of Compression and Stress Relaxation in Pine Pel-lets
– From the more simple constitutive model employed in the 1D modelfrom paper A, a model that captures the viscoplastic properties of biomassfibers is presented. The model is a Maxwell representation of the Stan-dard Linear Solid (SLS) model with non-linear elastic properties. Themechanical feedstock properties for six different particle size samplesof spruce and three compression speeds were derived by fitting themodel to experimental compression tests. The constitutive model andmechanical properties give new insight into the behavior of biomassparticle compression and have utility for improving simulations of thepelleting process by capturing the stress relaxation effects of the feed-stock.
Experimental and Numerical Investigation of Die Designs in Biomass Pel-leting and the Effect on Layer Formation in Pellets
– The review in paper B showed that a minimal number of research stud-ies had been dedicated to the design parameters of the press channelinlet and the effect on the pelleting process. However, the review alsoshowed that the inlet tends to have a significant effect on the pelletingprocess, which also was found from the experimental and simulationresults in paper A. This paper presents a Computational Fluid Dynamic(CFD) model that is capable of simulating the feedstock motion in thepress channel inlet. Also, the paper presents an analysis of the feed-stock layers shapes in the pellets, and shows a link between the presschannel inlet and the mechanical durability of the pellets.
Experimental Investigation of Feedstock Layer Thickness and Die-RollerGap in Wood Pelleting
– The results of paper A showed a significant difference between theexperimental and simulated energy consumptions of the tested presschannels. A reason for this is probably that the 1D model does not cap-ture the transient effects of the start-stop motion in the press channelwhen subsequent feedstock layers are pressed into the channel. Theliterature review in paper B, also showed that a very limited researchhas been dedicated to studying the effects of the feedstock’s start-stopmotion, die speed, and roller gap size.
This paper aims to show the effect of the start-stop motion, where ex-perimental pelleting tests are carried out using a pilot-scale pellet press,which was set up for this study. By varying the feedstock mass flow-rate and die speed, a range of different feedstock layers was tested. Thestudy also includes tests with different die-roller gaps.
10

Chapter 2
Press Channel Analysis
In this chapter, a brief review of equations for calculation of pelleting pressure isgiven. The review is followed by a presentation of a 1D model for calculating thepelleting pressure and the energy consumption for pelleting, which is based on ananalysis of the governing forces in the die press channels. Finally, model calculationsare presented together with an evaluation of the model capability and limits.
2.1 Pelleting Pressure
As discussed in the thesis introduction, the pellet press die shall facilitatethe production of pellets that have a quality according to the requirements,without using excessive energy and reducing the production capacity of thepellet press.
The press channel design is directly correlated to the pelleting pressure[26], which affects the degree of compression of the feedstock and the powerconsumption required for the pellet production [12]. When pressing the feed-stock through the press channels, the pelleting force equals the accumulatedresisting forces of pressing feedstock into the press channel and the frictionbetween the feedstock and the wall of the press channel.
Figure 2.1 illustrates the forces in the press channel, where Fr is a radialforce in the feedstock, Fµ is the friction force between the feedstock and thewall of the press channel, and Fp is the pelleting force. As illustrated in figure2.1, the friction force acts in the opposite direction to the pelleting force. Theradial force is the normal force acting on the wall due to the radial expansionof the feedstock, which is constrained by the die wall.
11

Chapter 2. Press Channel Analysis
A-A ( 5 : 1 )
B-B ( 5 : 1 )
C ( 7: 1 )
A
A
B
B
C
1
1
2
2
3
3
4
4
5
5
6
6
7
7
8
8
A A
B B
C C
D D
E E
F F
1 A2
Press channel and pellet.idwState Changes Date Name
Drawn
Checked
Standard
Date Name27-04-2020 ESBSIM04
L
D
β
h
Fp
FrFμ
Figure 2.1: Cross-sectional drawing of the active section of the press channel, and an illustrationof the forces that acts in the channel, where Fp is the pelleting force, Fr is the radial force, Fµ isthe friction force.
Pelleting Pressure Calculation
Calculation of the pelleting pressure for a specific press channel design, canhelp to identify if the pressure is within the typical range of pelleting pres-sures, and be used for stress calculations of the die [27]. Previous studieshave used formulas for calculating the pelleting pressure, where the effect offeedstock properties and geometrical press channel parameters are included.Equation 2.1 by Holm et al. [26] and equation 2.2 by Crawford et al. [12]are examples of pelleting pressure equations. In paper B, a table with moreequations and a thorough description of them can be found.
Pp =PNo
ν·(
e4·µw ·ν·L/D − 1)
(2.1)
Pp = Pc · e4·µw ·kr ·L/D (2.2)
In equation 2.1, Pp is the pelleting pressure, PNo is a prestressing pressure,ν is the Poisson’s ratio of the feedstock, and µw is the coefficient of frictionbetween the feedstock and die wall. In equation 2.2, Pc is a compressionpressure, and kr is the axial to radial stress ratio of the feedstock.
Equation 2.1 by Holm et al. [26] is based on an elastic-plastic stress-strainmodel for calculating the radial force in the press channel as a function ofthe applied pelleting pressure. The radial prestressing pressure, PNo, is aconstant pressure which is added to the elastic response of the applied forces.In their study, Holm et al. [26] assumed the biomass fibers to be orientednormal to the die wall, which affects the value of Poisson’s ratio. The effectof fiber orientation is caused by the anisotropic properties of biomass, whichexperimentally is shown to affect the pelleting process [28].
12

2.2. 1D Press Channel Model
Equation 2.2 by Crawford et al. [12] is very similar to the equation byHolm et al. [26]. However, Crawford et al. [12] only utilizes an elastic stress-strain model for calculating the radial force, and introduces an compressionpressure, Pc, which is the pressure required for compressing the feedstockto a desired density. Crawford et al. [12] showed a correlation between theelectrical power consumption of the pellet press and the calculated pelletingpressure. In addition, Crawford et al. [12] found that the friction account for60-80% of the energy consumption, while the remaining part of the energy isused for compression.
By evaluating the equations for the pelleting pressure in equation 2.1,2.2, and the equation framework [26, 29–32] that is shown in paper B, thereare several similarities, where properties as Poisson’s ratio, or axial to radialstress ratio of the feedstock, the coefficient of friction, and the press channelL/D, all recur in the equations. The equations are limited to calculation ofthe pelleting pressure or force for a pure cylindrical press channel, exceptequation 2.3 by Osobov [29], which is based on the calculation of a conicalbriquetting channel that is comparable to the inlet section of the press chan-nel. However, instead of calculating the required pelleting pressure, equation2.3 by Osobov [29] uses the pelleting pressure as input and calculates thelocal pressure in the press channel, Px, where x is the distance from the topof the inlet.
Px =Pp ·(
D − 2 · x · tan(β)
D
)n
n =2k
tan(β)· (sin(β) + µ · cos(β))
(2.3)
The pressure equations for a cylindrical press channel demonstrates apositive exponential correlation between the pelleting pressure and the L/Dratio of the press channel. The same exponential correlation has been shownin single pelleting studies [16, 33, 34].
2.2 1D Press Channel Model
As mentioned, the presented equations for calculating the pelleting pressureare restricted to calculation of pure cylindrical press channels. Thus, a 1Dmodel that accounts for the inlet design parameters, β and h, for calculationof the pelleting pressure is set up. Also, the model calculates the feedstockdensity and energy required for the feedstock compression and friction.
The assumptions for the model are as follows:
• The model is based on a steady-state model of the pelleting process,with a constant mass flow rate through the press channel.
13

Chapter 2. Press Channel Analysis
• No transverse velocity gradients of the feedstock in the press channel,in other words, the feedstock moves as a plug.
• Feedstock properties are taken from properties for solid wood, wherethe orientation of the feedstock fibers are transverse the press channel.
• Isothermal conditions applies, and thereby effects of frictional heatingof the feedstock in the press channel are neglected.
The calculation of the pelleting pressure is based on the force balance inequation 2.4, where the force of the pelleting pressure, Fp in figure 2.1, equalsthe friction force, Fµ, which is a function of the radial force, Fr.
Fp = Fµ + F0 (2.4)
In equation 2.4, F0 is introduced as an imaginary outlet force that acts in theopposite direction Fp. F0 is used when discretizing the press channel, whichis described in section 2.2.
Calculation of Fr is performed using equation 2.5. Equation 2.5 is basedon the formulation by Holm et at. [26], where the radial force is derived fromtwo terms; elastic and plastic, where the elastic force, based on Hook’s law,is a function of the pelleting force in the channel, and the plastic term is aconstant stress.
Fr =Ar
Aa· ν · Fp︸ ︷︷ ︸
Elastic
+ PNo · Ar︸ ︷︷ ︸Plastic
(2.5)
In equation 2.5, Ar is the area of the press channel wall on which theradial force acts, Aa is the cross-sectional area of the press channel on whichthe pelleting force acts, ν is Poisson’s ratio, and PNo is the constant stress inthe plastic term.
For a cylindrical channel, Fµ is calculated as the product of Fr and µw.However, in the conical part, Fr is split into two components, which are il-lustrated in figure 2.2, with the first component, Frn, acting normal to the diewall, and the second component, Frp, acting parallel to the wall.
Based in the illustration in figure 2.2, Fµ is calculated from equation 2.6.
Fµ = cos (β/2) ·(
Frn · µw + Frp)
(2.6)
For the cylindrical channel with β = 0◦, equation 2.6 reduces to the prod-uct of Fr and µw.
From the force balance in equation 2.4, the expression for Fp is set up inequation 2.7 by combining equation 2.5 and 2.6.
Fp =F0 + cos (β/2) · PNo · Ar · (cos (β/2) · µw + sin (β/2))
1 − cos(β/2) · ArAa
· ν · (cos (β/2) · µw + sin (β/2))(2.7)
14

2.2. 1D Press Channel Model
Die wall
Sym
met
ry a
xis Fr
Fµ
β/2
0
β/2
0
Figure 2.2: Illustration of the force components of Fr and Fµ in the conical inlet of the presschannel (figure from paper A [35]).
Energy Consumption in the Press Channel
The 1D model is set up to calculate the frictional and compressional energythat is consumed in the press channel. The energy is calculated as outlinedin figure 2.3.
Frictional Work
The frictional power dissipation, Wµ, is calculated via equation 2.8
Wµ = Fµ · mρ · Aa
(2.8)
In equation 2.8, m is the feedstock mass flow rate, and ρ is the feedstockdensity. Wµ is converted to a mass-specific energy consumption, wµ, by usingequation 2.9.
wµ =Wµ
m(2.9)
Compressional Work
The compressional work consumed for compressing the feedstock is calcu-lated as the definite integral of compression pressure over the change inmass-specific volume during compression of the feedstock. The compres-sional work is illustrated as the blue-colored area in figure 2.4, where equa-tion 2.10 is the expression of pelleting pressure as a function of the specificvolume for the feedstock, v. The function in equation 2.10 is derived froma power function that was fitted to experimental compression tests. Furtherinformation about the experimental compression test and the power function
15

Chapter 2. Press Channel Analysis
Obtain pelleting pressure
via equation 2.7
Calculate friction forces via
equation 2.4
Friction power dissipation
via equation 2.8
Calculate the feedstock density
from the applied pressure
via empirical power correlation
Mass-specific compressional
work via equation 2.11
Mass-specific frictional work
via equation 2.9
Mass-specific energy
consumption
Figure 2.3: Outline of the algorithm for the energy calculation from friction and feedstock com-pression.
16

2.2. 1D Press Channel Model
is described in paper A.
Pp(v) =(
1k1 · v
− k3
k1
) 1k2
(2.10)
In equation 2.10, k1−3 are empirical coefficients obtained by fitting thepower function to the experimental compression data. The coefficients valuesare: k1 = 318.892, k2 = 0.276, and k3 = 12.634.
0 0.5 1 1.5 2 2.5 3 3.5
Specific Volume [m3/kg] 10-3
0
100
200
300
Pel
letin
g pr
essu
re [M
Pa]
Specific compressional work
Equation 2.6Feedstock compressionSpecific compressional work
Compression
Figure 2.4: Plot of the pelleting pressure as a function of the specific volume of the feedstock,where the blue colored area is the mass-specific compression energy (figure from paper A [35]).
The mass-specific energy consumed for compression of the feedstock, wc,is calculated via the integral in equation 2.11.
wc =∫ v2
v1
Pp(v) dv (2.11)
In equation 2.11, v1 and v2 are the initial and final specific volume of thefeedstock.
Press Channel Discretization
To calculate Fp in equation 2.7, the press channel is discretized into N-numberof even spaced elements, where each element represents a disk of the presschannel. Figure 2.5 illustrates a discretized press channel, with the boundarycondition that Fo(n = N) equals zero. Fp(n = 1)is the overall pelleting force.
The elements in the press channel are coupled by the expression in equa-tion 2.12.
Fp(n) = F0(n − 1) (2.12)
17

Chapter 2. Press Channel Analysis
1
1
2
2
3
3
4
4
5
5
6
6
7
7
8
8
A A
B B
C C
D D
SHEET 1 OF 1
DRAWN
CHECKED
QA
MFG
APPROVED
Simon_Klinge_Nielsen
12-07-2020
DWG NO
TITLE
SIZE
D
SCALE
REV
5 : 1
n = N
n = 1
F = 0o
Figure 2.5: Discretized press channel with N-number of elements, and the boundary condition,F0 = 0.
Figure 2.6 shows a plot of the calculated pelleting pressure for differentdiscretization levels of a pure cylindrical press channel, with element num-bers between 10 and 13,000. The pelleting pressure is calculated as Fp di-vided by Aa. The 1D model results are compared to the pelleting pressurecalculated using equation 2.1 by Holm et al. [26]. Figure 2.6 shows that byincreasing the number of elements in the 1D model, the pressure approachesthe analytical solution from equation 2.1. Figure 2.6 also shows, that the 1Dmodel becomes more or less independent of the discretization with approxi-mate 1000 elements, and adding more elements to the model does not affectthe pelleting pressure calculation considerably.
101 102 103 104
Element count, N [-]
0
500
1000
1500
Pel
letin
g
pr
essu
re [M
Pa]
Discretization dependence, cylindrical channel
Holm et al. 1D model
Figure 2.6: Comparison between the 1D model with different numbers of elements and theequation by Holm et al. [26]. The pressure is calculated for a 50 mm press channel with adiameter of 6 mm.
18
2.3. Model Results
2.3 Model Results
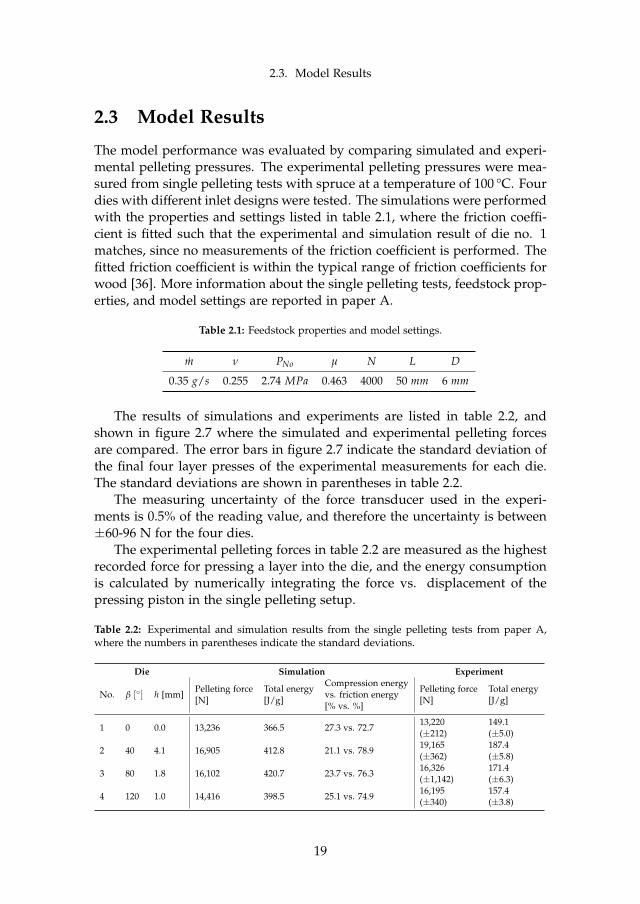
The model performance was evaluated by comparing simulated and experi-mental pelleting pressures. The experimental pelleting pressures were mea-sured from single pelleting tests with spruce at a temperature of 100 °C. Fourdies with different inlet designs were tested. The simulations were performedwith the properties and settings listed in table 2.1, where the friction coeffi-cient is fitted such that the experimental and simulation result of die no. 1matches, since no measurements of the friction coefficient is performed. Thefitted friction coefficient is within the typical range of friction coefficients forwood [36]. More information about the single pelleting tests, feedstock prop-erties, and model settings are reported in paper A.
Table 2.1: Feedstock properties and model settings.
m ν PNo µ N L D
0.35 g/s 0.255 2.74 MPa 0.463 4000 50 mm 6 mm
The results of simulations and experiments are listed in table 2.2, andshown in figure 2.7 where the simulated and experimental pelleting forcesare compared. The error bars in figure 2.7 indicate the standard deviation ofthe final four layer presses of the experimental measurements for each die.The standard deviations are shown in parentheses in table 2.2.
The measuring uncertainty of the force transducer used in the experi-ments is 0.5% of the reading value, and therefore the uncertainty is between±60-96 N for the four dies.
The experimental pelleting forces in table 2.2 are measured as the highestrecorded force for pressing a layer into the die, and the energy consumptionis calculated by numerically integrating the force vs. displacement of thepressing piston in the single pelleting setup.
Table 2.2: Experimental and simulation results from the single pelleting tests from paper A,where the numbers in parentheses indicate the standard deviations.
Die Simulation Experiment
No. β [◦] h [mm]Pelleting force[N]
Total energy[J/g]
Compression energyvs. friction energy[% vs. %]
Pelleting force[N]
Total energy[J/g]
1 0 0.0 13,236 366.5 27.3 vs. 72.713,220(±212)
149.1(±5.0)
2 40 4.1 16,905 412.8 21.1 vs. 78.919,165(±362)
187.4(±5.8)
3 80 1.8 16,102 420.7 23.7 vs. 76.316,326(±1,142)
171.4(±6.3)
4 120 1.0 14,416 398.5 25.1 vs. 74.916,195(±340)
157.4(±3.8)
19

Chapter 2. Press Channel Analysis
1 1.2 1.4 1.6 1.8 2
Fp, simulated [N] 104
1
1.2
1.4
1.6
1.8
2
Fp, e
xper
imen
tal [
N]
104 Simulation vs. experiments
Die 1Die 2Die 3Die 4
Figure 2.7: Plotted results of the simulated and experimental pelleting forces from paper A.
The results in figure 2.7 and table 2.2 show that the model, to some ex-tend, is capable of simulating the pelleting force for the four press channels.However, the simulated pelleting force is lower than the experimental forcefor die no. 2 and no. 4.
Besides calculating the pelleting force, the model can simulate the pres-sure and feedstock density inside the press channel. As an example, figure2.8 shows contour plots of the simulated pressure and feedstock density inpress channel no. 3 from the tests. The pressure is calculated as Fp divided bythe area, Aa, of the model elements. The feedstock compression is assumedto be irreversible, meaning that when the pressure is decreases, the densitydoes not decrease.
(a) Pressure (b) Feedstock density.
Figure 2.8: Contour plots of the simulated pressure and feedstock density in the upper part ofpress channel no. 3.
Figure 2.8a shows that the pressure peaks at the transition between theinlet and the cylindrical part of the press channel. The simulated density in
20
2.3. Model Results
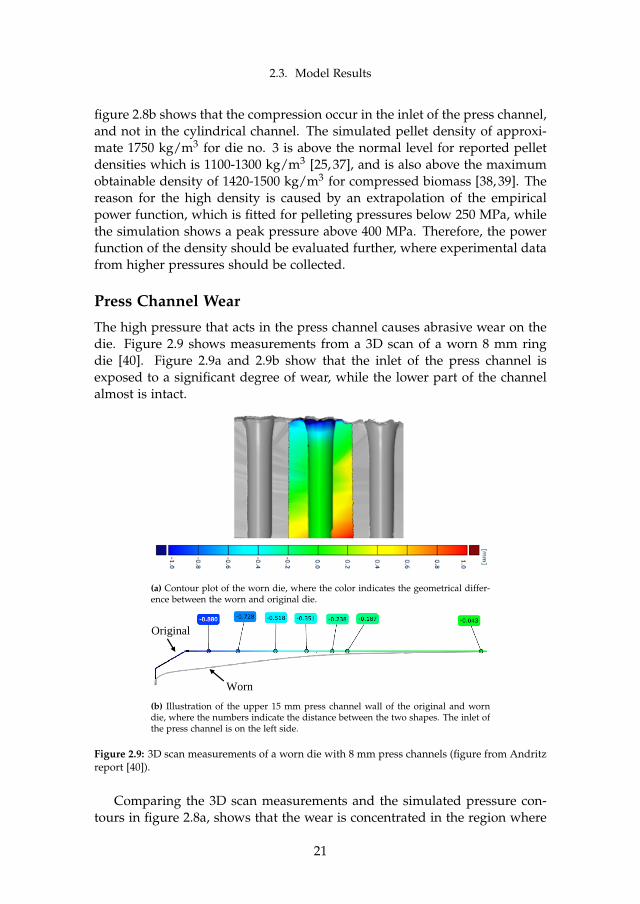
figure 2.8b shows that the compression occur in the inlet of the press channel,and not in the cylindrical channel. The simulated pellet density of approxi-mate 1750 kg/m3 for die no. 3 is above the normal level for reported pelletdensities which is 1100-1300 kg/m3 [25, 37], and is also above the maximumobtainable density of 1420-1500 kg/m3 for compressed biomass [38, 39]. Thereason for the high density is caused by an extrapolation of the empiricalpower function, which is fitted for pelleting pressures below 250 MPa, whilethe simulation shows a peak pressure above 400 MPa. Therefore, the powerfunction of the density should be evaluated further, where experimental datafrom higher pressures should be collected.
Press Channel Wear
The high pressure that acts in the press channel causes abrasive wear on thedie. Figure 2.9 shows measurements from a 3D scan of a worn 8 mm ringdie [40]. Figure 2.9a and 2.9b show that the inlet of the press channel isexposed to a significant degree of wear, while the lower part of the channelalmost is intact.
(a) Contour plot of the worn die, where the color indicates the geometrical differ-ence between the worn and original die.
Original
Worn
(b) Illustration of the upper 15 mm press channel wall of the original and worndie, where the numbers indicate the distance between the two shapes. The inlet ofthe press channel is on the left side.
Figure 2.9: 3D scan measurements of a worn die with 8 mm press channels (figure from Andritzreport [40]).
Comparing the 3D scan measurements and the simulated pressure con-tours in figure 2.8a, shows that the wear is concentrated in the region where
21

Chapter 2. Press Channel Analysis
the highest pressure in the press channel is observed.
Model Limitations and Future Work
The plot in figure 2.7 shows a deviation between the 1D model and the experi-mental pelleting pressures for die no. 2 and no. 4. A reason to the differencemay be explained by the model not accounting for internal friction in thefeedstock, when it is deformed or folded in the conical inlet. According toresults from Nielsen et al. [25], the press channel inlet has a significant im-pact on the pelleting energy. The 1D model accounts for the friction betweenthe feedstock and press channel wall, but the assumption of no transversevelocity gradients in the press channel, neglects the viscous resistance frominternal folding or layer deformation of the feedstock, which may influencethe 1D model performance. The effect of the press channel inlet on the feed-stock folding or layer deformation is the scope of paper D and is describedand discussed in chapter 4 of this thesis.
The results in table 2.2 show that the energy consumption for the ex-perimental results is in the range 149.1-187.4 J/g, corresponding to 37.6-47.2kWh/t, which are comparable to normal energy consumptions for industrial-scale pellet presses [21–24]. However, the simulated energy consumptionsare 2.2-2.5 times higher than the energy consumption of the experimentalresults. This difference may be caused by the assumption of simulating thepelleting process a steady-state, where the pelleting pressure is assumed tobe constant. Thus, the 1D model does not account for the frictional effects ofthe feedstock’s start-stop motion in the press channel, which occurs in pelletpress and in the performed single pelleting tests. In pellet presses, the frictionconstantly switches between a static and kinetic level when feedstock layersare pressed into the channels, which causes a dynamic pelleting pressure.The start-stop of the feedstock in the press channel is the topic of chapter 5,where the effects will be analyzed.
In addition to inlet and start-stop effects, the use of constant feedstockproperties, and neglecting frictional heating are likely to affect the model ac-curacy. At elevated temperatures, the extractives in the feedstock, as oil andwax, migrate to the surface of the compressed feedstock, which may reducethe friction [16]. Another effect of increased temperature is the transition tem-perature of the lignin, at which the polymer stiffness decreases when shiftingfrom its glassy phase towards the rubbery phase [41]. The lignin transi-tion temperature for biomass ranges between 50-140 °C [42–45], and dependson the feedstock specie and moisture content [37, 46]. By reaching pellet-ing temperatures above the lignin transition temperature, the inter-particlecontact area is likely increased from softened lignin filling the gaps in thecompressed feedstock [47, 48], which enables stronger bonding between theparticles [49, 50]. Solving the die and feedstock temperature, and applying
22

2.3. Model Results
the mechanical properties, ν and µw, as functions of temperature, could im-prove the model performance. Also, simulation of the feedstock temperaturecan show if and when the lignin or other lignocellulosic components are soft-ened during the pelleting process. Thereby, the simulation could be used foranalyzing if the feedstock temperature is in the range that may improve thepellet durability due to softened lignin.
23

Chapter 2. Press Channel Analysis
24
Chapter 3
Constitutive Modelling ofPelleting Feedstock
In this chapter, the compressional characteristics of biomass grinds are investigated.A brief review is given on existing constitutive models for simulating the feedstockstress and strain during compression and stress relaxation. The review is followed bya presentation of a constitutive model for deriving rheological properties of a feedstockand the correlation of these to relevant pelleting properties as energy consumption andpellet durability.
3.1 Biomass Compression
The compression of feedstock is essential to the pelleting process, as the bulkdensity of wood pellets shall be minimum 600 kg/m3, according to the ISO17225-2:2014 [10]. The densification of feedstock between the pellet pressdie and roller depends on the level of compression, or strain, of the feed-stock, when reaching the stress level of the pelleting pressure. By knowingthe stress-strain relation of the feedstock it is therefore possible to calculatethe required level of pelleting pressure to obtain a given density of the com-pressed feedstock. The mechanical behavior for biomass feedstock is charac-terized by viscoplastic properties [51]. Figure 3.1 illustrates a force vs. timerecording from a uniaxial compression of spruce, and the corresponding pis-ton displacement that compresses the spruce.
The plot in figure 3.1 is split into two phases; compression and stressrelaxation. The compression phase is marked by the blue-shaded area, wherethe applied force increases nonlinearly. The nonlinearity is caused by changesin the mechanical behavior of the compact, as different physical mechanismsprevail during the compression [52, 53]. Generally, the compression can be
25

Chapter 3. Constitutive Modelling of Pelleting Feedstock
0 10 20 30 40 50 60 70 80 90 100
Time [s]
0
2000
4000
6000
8000
10000
For
ce [N
]
0
20
40
60
Pis
ton
disp
lace
men
t[m
m]
Force vs. time of spruce compression
Compression forcePiston displacementCompressionStress relaxatation
Figure 3.1: Plot of force and piston measurements during compression of a spruce sample,showing the characteristic viscoplastic stress relaxation of the compressed biomass (data fromcompression test for paper A [35]).
split into two phases:
1. The initial compression phase is dominated by rearrangement of theparticles, where a high porosity from air voids is present in the com-pact. Faborode et al. [54] defined the end of this phase using a criticaldensity, which they suggested to be at the peak of the Cauchy num-ber, which is the ratio of the inertia and elastic forces of the compact. Intheir study, Faborode et al. [54] reported a critical density of 411 kg/m3,which was obtained at a compression pressure at approximately 4 MPa.Kaliyan et al. [55] analyzed the force gradients to define the end of theinitial compression phase, which they reported to occur at 1.5 MPa.Compared to figure 3.1, 1.5-4 MPa is equal to forces of approximately100-300 N. Thereby, the initial compression phase is more or less in-significant to the pelleting process and the energy required to compressfeedstock to densities of pellets.
2. In the second phase, the compression of the particles begins as theparticle contact increases, and the porosity decreases. When the airis expelled from the compact, elastic forces become dominant in thecompact [54].
After the compression phase, the stress relaxation appears, which is markedby the red-shaded area in figure 3.1. As indicated by the piston displacementplot in figure 3.1, the compressed sample is exposed to a static strain, and theapparent forces in the feedstock are measured from the piston. The physi-cal mechanisms of the stress relaxation are governed by a plastic flow of thecompressed biomass particles [56]. The decreasing stress is caused by thecompressed particles rearranging as the elastic energy of the particles is con-verted to plastic deformations. Under static conditions, the residual stress ofthe compacted biomass approximates an asymptotic level, where no furtherrelaxation occurs [57].
In the pellet press die, the stress relaxation occurs while the compressed
26

3.1. Biomass Compression
feedstock is pressed through the press channels. When the feedstock is re-leased from the die, residual stresses in the feedstock are transformed intoaxial and radial expansions of the pellet [58, 59]. High residual stresses ofthe compressed feedstock, causes more expansion, which has been foundto decrease the durability of the pellets [60]. Peleg [57] defined the asymp-totic modulus from stress relaxation curves of compressed biomass samplesand found that samples with high asymptotic modulus were more rigid andcould sustain higher residual stresses.
Constitutive Models
The constitutive modeling approach is based on a theoretical approach, wheresystems of rheological elements are set up to simulate materials mechanicalstress-strain responses. Elements as springs and Coulomb friction are ap-plied to describe pure elastic and plastic behavior. Time-dependent responsesof viscoelastic and -plastic materials are modeled using dashpot elements,where the stress is a function of the strain rate. Using constitutive models,ease the interpretation of the model parameters to the feedstocks mechanicalproperties.
In figure 3.2, schematic drawings of four general constitutive models areshown. More models and a detailed description of them are found in paperC.
(a) Maxwell (b) Kelvin-Voigt (c) SLS, Maxwell (d) SLS, Kelvin-Voigt
Figure 3.2: Representation of constitutive models presented in previous compression studies.Symbol explanation: spring1, dashpot2 (figure from paper C [61]).
The capability of the four models in figure 3.2 to simulate compressionand stress relaxation responses is evaluated by the simulations in figure 3.3,where the time up to t1 is the compression phase, and after t1 is the stressrelaxation phase.
Evaluated from the plots in figure 3.3, the Standard Linear Solid (SLS)Maxwell and SLS Kelvin-Voigt models are capable of simulating a stressrelaxation that is similar to the experimental compression data in figure3.1, where the stress gradually decreases towards an asymptotic level. The
27

Chapter 3. Constitutive Modelling of Pelleting Feedstock
0 t1
Time
0
0.2
0.4
0.6
0.8
1N
orm
aliz
ed s
tres
s [-
]
Simulated stress responsesKelvin-Voigt Maxwell SLS - Maxwell SLS - Kelvin-Voigt
Figure 3.3: Simulated responses from the constitutive models in figure 3.2 (figure from paperC [61]).
Maxwell model is not capable of simulating the asymptotic stress level of therelaxed feedstock, due to the serial connection of the spring and dashpot.Hence, the elastic energy stored in the spring is dissipated to the viscousdeformation of the dashpot.
The Kelvin-Voigt model fails in simulating the gradual stress decrease ofthe stress relaxation, since all the elastic energy of the spring is maintainedunder static conditions, and no viscous dissipation occurs.
The simulated responses in figure 3.3 also show that the four models arenot capable of modeling the nonlinear behavior of the compression phase asobserved in figure 3.1.
Nonlinear Mechanical Properties
Different approaches for modeling the nonlinearity of the stress-strain duringbiomass compression has been proposed. Peleg [62], Faborode et al. [63], andKaliyan et al. [55] applied strain-hardening springs to their models, wherethe spring is modeled with a linear and nonlinear term. Molari et al. [64]used a nonlinear spring formulation based on conical springs to model thecompression of straw bales. The need for applying elements with nonlinearcharacteristics, such as strain hardening springs, is due to the mechanicalproperties of the bulk feedstock, such as the density, which is dependenton the mechanical stress. Carone et al. [65] found a positive exponentialcorrelation between Young’s modulus of pellets and the pellet density likethey also found it to be dependent on the feedstock particle size, temperature,and moisture content.
28

3.2. Constitutive Model for Compression and Stress Relaxation
3.2 Constitutive Model for Compression and StressRelaxation
A constitutive model based on the SLS Maxwell model that is capable ofsimulating compression and stress relaxation of biomass is set up. The SLSMaxwell model is chosen due to its low complexity with three elements.To model changes in the mechanical behavior of the feedstock during com-pression, nonlinear strain-hardening properties are added to the model’s twosprings. The assumptions for the model are as follows:
• The feedstock behaves as a continuum.
• The friction between die and feedstock is neglected, and thereby, thereare no pressure or density variations inside the compressed sample.
• The initial compression phase is neglected [55].
Figure 3.4 shows a detailed mechanical representation of the SLS Maxwellmodel, which is split into two parallel systems. In figure 3.4, system 1 is
Figure 3.4: Detailed mechanical representation of the SLS Maxwell model (figure from paperC [61]).
based on a single spring, with the spring modulus E1. System 2 is a Maxwellsystem, with a serial connection of a spring, with the spring modulus E2,and a dashpot with the viscosity, µ. From the SLS Maxwell configuration,the asymptotic value of the residual stress can be interpreted as the stress insystem 1, as system 2 eventually relaxes to zero stress. The constrains of SLSMaxwell model in figure 3.4 are expressed in equation 3.1, where σ is thetotal stress, σ1 and σ2 are the system stresses, ε is the total strain, and ε1 andε2 are the system strains.
ε = ε1 = ε2 (3.1a)
σ = σ1 + σ2 (3.1b)
29

Chapter 3. Constitutive Modelling of Pelleting Feedstock
The model stress is calculated via the expression in equation 3.2, which isderived in paper C by using a numerical approach with a temporal discretiza-tion of the compression.
σ(t + ∆t) = E1 · ε1(t + ∆t)︸ ︷︷ ︸System 1 stress
+ E2 ·ε(t + ∆t)− (ε(t)− εs2 (t))
1 + E2·∆tµ︸ ︷︷ ︸
System 2 stress
(3.2)
Equation 3.2 is based on a temporal discretization, ∆t, where t is the timeand εs2 is the strain of the spring in system 2.
The spring modulus, E1 and E2, in the SLS Maxwell model are modeledusing a pseudo spring porosity, which is based on a solid ratio vs. void ratioof the spring. The nonlinear spring modulus are calculated via equation 3.3c,which is derived by combining equation 3.3a and 3.3b.
E =x · φs
φv, φv > 0 (3.3a)
φs =ρbρs
, φv = 1 − ρbρs
(3.3b)
E = x· ρbρs − ρb
, ρb < ρs (3.3c)
In equation 3.3, x is a spring coefficient, φv is the void ratio of the spring,φs is the solid ratio of the spring, ρb is the bulk spring density, and ρs is thetrue density of the solid spring. The bulk density of the feedstock duringcompression is inserted as ρb in equation 3.3c, and ρs is a constant fitted toeach spring. The limiting condition for the expression in equation 3.3c, whereρb approaches the value of ρs, may be interpreted as the condition where theporosity of the compact goes toward zero, causing the spring modulus toapproach infinity.
3.3 Results of Experimental Compression Tests
The performance of the SLS Maxwell model is evaluated by fitting the modelfitted to experimental compression data of six spruce samples with differentparticle sizes. Figure 3.5 shows images of the five sieved spruce samples usedfor the experimental single pelleting tests, where the particle size ranges from0.25-2.8 mm. The sixth sample is unsieved, and therefore has particle sizesranging from 0-2.8 mm. The particle size samples are tested at three differentcompression speeds; 1, 5, and 10 mm/min, and each test combination ofcompression speed and particle size are repeated four times resulting in atotal of 72 pellets produced.
30

3.3. Results of Experimental Compression Tests
(a) 0.25-0.5 mm (b) 0.5-0.8 mm (c) 0.8-1 mm (d) 1-1.4 mm (e) 2-2.8 mm
Figure 3.5: Sieved pine samples used for single pelleting tests (figure from paper C [61]).
The compression data were recorded from single pelleting tests, wherepellets of feedstock samples were produced in two steps; first, the samplewas compressed and after that pressed, or extruded, out of the die. Figure 3.6illustrates a cross-sectional drawing of the single pelleting setup, where figure3.6a shows the uncompressed feedstock, figure 3.6b shows the compressedfeedstock, and figure 3.6c shows the extrusion of the pellet.
(a) Uncompressed (b) Compressed (c) Extrusion
Figure 3.6: The closed-end die setup used for the feedstock compression tests (figure from paperC [61]).
The compression and extrusion data were used for calculating the energyconsumption of the process, and also, the durability was measured of thepellets produced from the different particle size samples. The die was heatedto 90 °C, and the moisture content of the spruce was 14 % on dry basis.
The experimental results of compression energy, extrusion energy, andpellet durability are shown in figure 3.7, where the error bars represent the
31

Chapter 3. Constitutive Modelling of Pelleting Feedstock
standard deviation of the four repetitions for each combination of particlesize and compression speed
0.25
-0.5
0.5-
0.8
0.8-
11-
1.4
2-2.
8M
ix
40
60
80
100
Spe
cific
ene
rgy
[kJ/
kg] Extrusion energy
0.25
-0.5
0.5-
0.8
0.8-
11-
1.4
2-2.
8M
ix30
40
50
60S
peci
fic e
nerg
y [k
J/kg
] Compression energy
1 mm/s 5 mm/s 10 mm/s Linear fit
0.25
-0.5
0.5-
0.8
0.8-
11-
1.4
2-2.
8M
ix
Particle size [mm]
0.6
0.8
1
Dur
abili
ty [-
]
Pellet durability
Figure 3.7: Experimental results of the specific compression energy, specific extrusion energy,total energy, and pellet durability (figure from paper C [61]).
In figure 3.7, the tendencies for the compression and extrusion energy aresimilar, where the energy is positively correlated with the particle size, whilethere is no significant effect of the compression speed. For the durability, thehighest durability is produced of the two samples with the smallest particlesizes and the sample with mixed particle sizes. Further description of theexperiments and information about the measurements are presented in paperC.
3.4 Simulation Results
The three constants of the SLS Maxwell model, x1, x2, µ are fitted to each ofthe 72 experimental data set, while ρs1 = 1206 kg/m3 and ρs2 = 1417 kg/m3
are based on a best fit to all 72 tests, and are kept constant. Figure 3.8shows two plots where the simulated and experimental stress response for
32

3.4. Simulation Results
the mixed particle size sample is shown for the three different compressionspeeds.
0 500 1000 1500 2000 2500 3000Time [s]
0
5
10
15S
tres
s [P
a]#107 Stress response, 1 mm/min
ExperimentSLS Maxwell model
0 100 200 300 400 500 600 700
Time [s]
0
5
10
15
Str
ess
[Pa]
#107 Stress response, 5 and 10 mm/min
Figure 3.8: Experimental and simulated stress responses for the three compression speeds withthe mixed particle size sample (figure from paper C [61]).
Generally, the simulated responses in figure 3.8 captures the compressionand stress relaxation. The most considerable deviations between the exper-imental and simulated stresses are observed in the low-stress regions (<50MPa), while the high stresses are matching well.
Figure 3.9 shows a plot of the simulated strain of the three model elementsduring a compression test. The strain of spring 1 increases linearly during thecompression and is constant when the compression is stopped. For springtwo, the strain increases and peaks after approximately 175 s whereafter itdecreases, and the dashpot dissipates the elastic energy of the spring. Thestrain of the dashpot shows that a significant part of the damping, or stressrelaxation, occurs during the compression phase, and only a small amount ofenergy is stored in spring two when the compression is stopped.
Mechanical Feedstock Properties
The fitted spring and damper coefficients from the model fits are plotted infigure 3.10, where the error bars represent the standard deviation of fourreplicates for each test combination, and the dotted lines are linear fits of theaverage element coefficients.
33

Chapter 3. Constitutive Modelling of Pelleting Feedstock
0 50 100 150 200 250 300 350
Time [s]
0
0.5
1
Str
ain
[-]
Strain response of the model elements
Spring 1Spring 2Dashpot
Figure 3.9: Simulated strain of the model elements during compression of the mixed particlesize sample at a compression speed of 10 mm/min (figure from paper C [61]).
Spring 1
The coefficients of spring one in figure 3.10, shows that x1 is more or less in-dependent of particle size and compression speed for the 5 and 10 mm/mindata. The x1 coefficient for the 1 mm/min tests are slightly lower than thetwo other compression speeds and is negatively correlated to the feedstockparticle size. As mentioned in section 3.2, the stress in spring one can be in-terpreted as the asymptotic value of the stress relaxation. Thus, the indepen-dence of particle size and compression speed for the 5 and 10 mm/min datamight be explained by the pellets having reached a low porosity, and there-fore the feedstock is homogenous, and its mechanical properties reassem-ble the properties of the solid feedstock. The lower x1 coefficients of the 1mm/min test might be explained by drying effects of the feedstock, due toa long retention time in the die compared to the 5 and 10 mm/min tests,since the elastic properties of biomass depend on the feedstock moisture con-tent [36]. The drying effects were observed by an increased mass-loss of thepellets produced at 1 mm/min in the experimental test, which is describedin paper C.
Spring 2
The coefficients of x2 in figure 3.10 are positively correlated to the feedstockparticle size, where x2 for the largest particle sizes, 2-2.8 mm, is approxi-mately double the value of the smallest particles, 0.25-0.5 mm. The coeffi-cients of x2 decreases when the compression speed is increased.
Dashpot
Figure 3.10 shows that the dashpot µ is positively correlated with the particlesize, which is similar to the trend for x2. Considerable differences of theviscosity are observed between the three compression speeds, where the 5and 10 mm/min coefficients range between 1-4·109 Pa·s, while the 1 mm/min
34

3.4. Simulation Results
0.25
-0.5
0.5-
0.8
0.8-
11-
1.4
2-2.
8M
ix0
2
4
6x 2
[Pa]
107 Spring 2
1 mm/s 5 mm/s 10 mm/s
0.25
-0.5
0.5-
0.8
0.8-
11-
1.4
2-2.
8M
ix4
4.5
5
x 1[P
a]
107 Spring 1
0.25
-0.5
0.5-
0.8
0.8-
11-
1.4
2-2.
8M
ix
Particle size [mm]
0
2
4
5an
d10
mm
/s[P
as]
109
0
1
2
1 m
m/s
[Pa
s]
1010Dashpot
Figure 3.10: Fitted coefficients of x1, x2, and µ for particle sizes and compression speeds (figurefrom paper C [61]).
coefficients are in the range of 1-2.5·1010 Pa·s.
Correlation Between Model Elements and Pelleting Properties
The energy and durability data from the single pelleting tests were correlatedto the mechanical properties of the model elements. In figure 3.11, a plot ofthe compression energy and x2 of the 72 pellets are shown. The linear plotsin the figure are fitted to the data for each compression speed.
The plot in figure 3.11 shows a positive linear correlation between thespring coefficient, x2, and the energy consumed for compressing the energy.It seems valid that x2 is the parameter that affects the difference in compres-sion energy of the SLS Maxwell model, since the x1 coefficient, or asymptoticstress of the pellets, is more or less independent of particle size.
35

Chapter 3. Constitutive Modelling of Pelleting Feedstock
0 1 2 3 4 5 6x2 [Pa] 107
30
40
50
60
Spe
cific
com
pres
sion
ener
gy [k
J/kg
]
Spring 2
1 mm/s 5 mm/s 10 mm/s
0 100 200 300 400 500 600 700Dashpot viscosity [Pa s]
0.6
0.7
0.8
0.9
1
Spe
cific
com
pres
sion
ener
gy [k
J/kg
]
DashpotFigure 3.11: Plot of the experimental compression energy and spring coefficient, x2, for the 72pellets, and linear plots fitted to the data for each compression speed (figure from paper C [61]).
36

3.4. Simulation Results
In figure 3.12, the measured pellet durability and mass-specific work ofthe dashpot in the SLS Maxwell are plotted.
10 15 20 25 30 35 40 45
Specific dashpot work [kJ/kg]
0.6
0.7
0.8
0.9
1D
urab
ility
[-]
0.25-0.5 0.5-0.8 0.8-1 1-1.4 2-2.8
Figure 3.12: Pellet durability vs. mass-specific dashpot work in the SLS Maxwell model for thesieved particle sizes (figure from paper C [61]).
The plot in figure 3.12, shows that the specific dashpot work is lowest forthe small particles, while more damping energy is dissipated for the largerparticles. Also, the pellets produced with a low specific dashpot work, havethe highest durability. The higher specific dashpot work that is exerted whencompressing the large particle sizes can be caused by the larger particlesstoring more elastic energy, which is released as mechanical interlocking andplastic deformations of the particles.
Contribution
The constitutive SLS Maxwell model, presented in paper C, is capable ofsimulating both the compression and stress relaxation of the spruce particles.The primary contributions of the study are as follows:
• Presentation of an SLS Maxwell model for simulating both the com-pression and stress relaxation in biomass.
• A pseudo spring porosity is presented for modeling the nonlinearity ofthe feedstock properties during compression.
• Rheological parameters are derived for different particle sizes of spruce.
• Spring coefficient 1 of the model, composing the asymptotic level of theresidual stress, is independent of the feedstock particle size.
• Spring coefficient 2 of the model is positively correlated to the compres-sion energy.
• The mass-specific dashpot work exerted during the compression andstress relaxation is lowest for the small particles, which also producedthe pellets with the highest mechanical durability.
37

Chapter 3. Constitutive Modelling of Pelleting Feedstock
The capability of the model to simulate the time-dependent stress relax-ation of the compressed feedstock may be utilized in future studies for cre-ating more detailed simulations of the pressure in the press channel of thedie, such as the 1D model presented in chapter 2 of this thesis. Furthermore,such simulations may be used for estimating the residual stresses of the pel-lets when exiting the die, which has been shown to correlate negatively withthe pellet durability.
38
Chapter 4
Effect of the Press ChannelInlet and the Feedstock LayerShapes in Pellets
In this chapter, the effect of the inlet design of the press channel is investigated.A Computational Fluid Dynamic (CFD) model is set up to simulate the flow, ordeformation, of compressed feedstock layers in press channel inlet. Results fromexperimental single pelleting tests using different combinations of the die inlet angle,β, and depth, h, are presented, together with a novel method to measure the layershapes in pellets.
4.1 Press Channel Inlet and Feedstock Layer De-formation
The few studies focusing on the press channel inlet have shown, that the inletaffects the energy consumption and pellet durability. The effect on energyconsumption was shown via experimental single pelleting tests by Nielsen etal. [25], but also the experimental results for the 1D model, included in thisthesis and paper A, showed that the energy consumption varied from 37 to48 kWh/ton for four different inlet designs.
Other studies have presented results of the inlet’s effect on pellet durabil-ity. Winter [31] found via single pelleting tests, that an inlet with β = 28◦
produced pellets with higher durability than pellets produced in dies withlower values of β. Winter [31] argued the feedstock in the pellets producedfrom the β = 28◦ die was more interwoven than the pellets produced inthe other dies. Mišljenovic et al. [66] observed differences in the breaking
39

Chapter 4. Effect of the Press Channel Inlet and the Feedstock Layer Shapes inPellets
behavior of pellets produced in a β = 37.6◦ die and a pellet produced viacompression in a pure cylindrical channel. The ends of the pellets producedin the β = 37.6◦ die had a parabolic shape, while the pellets produced in thecylindrical channel had flat ends. Via three-point bending tests [67], Mišljen-ovic et al. [66] found the pellets from the β = 37.6◦ die, being more durableand better bonded than the pellets from the cylindrical channel.
Generally, all the results from existing studies of the press channel inlet,are based on quantitative analyzes of experimental tests, while no qualita-tive analyzes of the press channel inlet have been presented. The lack ofqualitative analyzes is probably caused by the difficulty of visualizing theprocess in the press channel, especially in pellet presses, but also in singlepelleting tests. Other similar industries as tablet production [68] and metalextrusion [69] have used Computational Fluid Dynamics (CFD) for simula-tions of flow fields, to understand and optimize their processes. However, tothe knowledge of the authors, the CFD technique or other Computer-AidedEngineering tools have not been used for simulation of the pelleting process.
Die Surface
The design parameters of the press channel inlet also affect the design of thedie surface. The die surface can be split into three types of area, as describedin paper B; active area, transition area, and inactive area, which are shown infigure 4.1.
A ( 4 : 1 )
A
Active
Transition
Inactive
X/2
X
Figure 4.1: Figure from paper D. Sectional view of a die surface with a hexagonal distributionof press channels. The designated press area for a single channel is marked by the red dottedline, where X is the distance between centers of the press channels (figure from paper D [70]).
In figure 4.1, a sectional view of a pellet press die is illustrated, wherethe active area, or opening area, is the total area composed by the presschannels, defined as the product of the cross-sectional press channel areaand the number of press channels. The transition area is the projected area ofthe countersink, and the inactive area is the remaining area between the presschannel inlets. As described in section 1.3, the active area usually composes30-40% of the die area, but to the knowledge of the authors, no numbers are
40

4.2. CFD Model
available for the transition and inactive area. The inlet design affects the ratioof inactive and transition area on the die surface since the transient area isdirectly correlated to inlet dimensions, β, and h.
4.2 CFD Model
In paper D, CFD simulations of the feedstock motion on the die surface andin the press channel inlet are presented.
The assumptions for the model are as follows:
• Steady-state model, and thereby neglecting the start-stop motion offeedstock in the press channel.
• The feedstock is modeled as an isotropic continuum, and thereby ne-glecting the effects of fiber orientation [28] or varying particle sizes.
• Isothermal conditions, and thereby neglecting frictional heating fromthe die walls.
The model is based on a 2D-axis symmetric representation of a press chan-nel, where the axis in the center of the press channel. The model geometryand the applied boundary conditions are shown in figure 4.2.
B-B ( 10 : 1 )
B
B
1
1
2
2
3
3
4
4
5
5
6
6
A A
B B
C C
D D
model.idw
ESBSIM04 17-12-2019
Designed by Checked by Approved byDate
1 / 1
Edition Sheet
Date
Wall shear
stress
Wall slip
Axis of rotational sym
metry
Velocity inlet
Pressure outlet
Figure 4.2: 2D axis-symmetric geometry of a die with the applied boundary conditions, wherethe wall slip is τw = 0 Pa, and the wall shear stress is τw = 107 Pa (figure from paper D [70]).
The CFD model is based on the continuity equation in equation 4.1 andthe momentum equations in equation 4.2.
1r
δ(rvr)
δr+
δvz
δz= 0 (4.1)
41

Chapter 4. Effect of the Press Channel Inlet and the Feedstock Layer Shapes inPellets
ρ
(vr
δvr
δr+ vz
δvr
δz
)= − δp
δr+ η
[1r
δ
δr
(r
δvr
δr
)− vr
r2 +δ2vr
δz2
](4.2a)
ρ
(vr
δvz
δr+ vz
δvz
δz
)= − δp
δz+ η
[1r
δ
δr
(r
δvz
δr
)+
δ2vz
δz2
](4.2b)
In equation 4.1 and 4.2, ρ is the density, r and z are the radial and axialorientation of the press channel, vr and vz are the radial and axial velocity, pis the pressure, and η is the non-Newtonian viscosity.
The feedstock viscosity is modeled as a simplified Bingham plastic, whichis a commonly used idealization of viscoplastic fluids [71]. The Binghammodel utilizes a yield stress criterion, τ0, where the fluid behaves as a rigidsolid when the shear stress is below τ0, and assumes fluid behavior when theshear stress exceeds τ0 [72].
The Bingham model is reduced by setting the viscosity to zero in theapplied Bingham model, causing the viscosity model to depend on τ0. Theviscosity model is defined in equation 4.3.
η =
{ τ0γ for γ ≥ γc
τ0(2−γ/γc)
γcfor γ < γc
(4.3)
In equation 4.3, γ is the shear rate, and γc is the critical shear rate [73].
Model Settings
The model parameters are listed in table 4.1. A wall slip condition withconstant shear stress, τw, is applied to the wall of the press channel. The slipcondition is commonly used for simulations of viscoplastic fluids [74,75]. Thefeedstock is assumed to move as a plug in the press channel, causing τw isset lower than τ0 of the feedstock. Further information about the CFD modelsetup can be found in paper D.
Table 4.1: Settings used in the CFD simulations.
Model settings
Yield stress, τ0 1.1 · 107 PaCritical shear rate, γc 10−2 s−1
Density 1100 kg·m−3
Wall shear stress, τw 107 PaVelocity inlet 1.25 mm· s−1
Pressure outlet 0 Pa
42

4.3. Layer Profile Analysis
4.3 Layer Profile Analysis
Experimental Pelleting Test and Layer Profile Analysis
Single pelleting tests with spruce (Picea abies) was performed, where sevendifferent inlet designs were tested. Information about the properties of thespruce is found in paper D. The purpose of the tests was twofold:
1. Measure the energy consumption for continuous pelleting in the dies,and measure the durability of the produced pellets.
2. Analyze the shapes of the feedstock layers in the produced pellets,which are used as validation of the CFD model.
In figure 4.3, drawings of the single pelleting equipment are shown.
A-A ( 1:1.5 )
A
A
Exchange-
able die
Piston
Stop
piston
(a) Complete setup.
A-A ( 1:1.5 )
A
A
Exchange-
able die
Piston
Stop
piston
(b) Cross-sectional view.
A-A ( 2 : 1 )
A
A
6 mm
β
h
10 mm
P
r
e
s
s
a
r
e
a
(c) Single die.
A-A ( 2 : 1 )
A
A
6 mm
β
h
10 mm
P
r
e
s
s
a
r
e
a
(d) Cross-sectional view.
Figure 4.3: Illustration of the single pelleting unit and single dies (figure from paper D [70]).
The single pelleting setup in figure 4.3 was designed and produced forthis test. The dies were selected to represent different values of β and h.A design parameter, AR, representing the ratio of inlet and transition area
43

Chapter 4. Effect of the Press Channel Inlet and the Feedstock Layer Shapes inPellets
to the total area of the die surface, was set up for comparison of the dies.Calculation of AR is shown in equation 4.4
AR =active area + transition area
total area(4.4)
The design parameters of the tested dies are listed in table 4.2.
Table 4.2: Table from paper D. Dimensions of exchangeable die units. The length of the dies is10 mm and the diameters is 6 mm.
Die β [◦] h [mm] AR [−]
1 - 0 0.352 60 1.58 0.603 60 2.63 0.804 60 3.55 1.005 100 0.77 0.606 100 1.27 0.807 100 1.72 1.00
A detailed description of the test procedure for the continuous pelletingtest is found in paper D, where:
• The energy consumption of the continuous pelleting test was calculatedfrom the force vs. displacement of the pressing piston when pressingfeedstock layers into the die.
• The mechanical durability was measured via tumbling of single pellets[76], where three pellets were produced from each die.
• The shape of the layer profiles was evaluated by pressing five layers ofalternately blue and red colored spruce into the die. After that, the castof colored feedstock layers sitting in the die was ejected and embeddedin epoxy. After hardening, the embedded pellets were sanded, suchthat a cross-sectional view of the die-cast was visible, as shown in figure4.4a.
By using image processing, the profiles between the colored feedstocklayers were evaluated from photos of the sanded die casts. Figure 4.4 showsthe steps of the image processing.
In figure 4.4, the first processing step is cropping the blue/green coloredlayers of the pellet, as shown in figure 4.4b. Next, a binary image is generatedin figure 4.4c, and finally, all small regions are filtered out in figure 4.4d. Thelayer profiles of the pellets are then evaluated from the edge between thebottom blue and red layer.
44

4.3. Layer Profile Analysis
(a) Raw photo. (b) Cropped. (c) Binary. (d) Filtered binary.
Figure 4.4: Image processing of the cast part from die 1 (figure from paper D [70]).
Experimental Results
Energy Consumption and Pellet Durability
The energy consumptions from the single pelleting tests and the measuredpellet durabilities are shown in figure 4.5, where the error bars in figure 4.5arepresent the standard deviations of the measurements.
0.3 0.4 0.5 0.6 0.7 0.8 0.9 1
AR [-]
40
45
50
55
60
65
Spe
cific
ene
rgy
[kW
h/to
n]
Specific energy vs. AR
= 0o = 60o = 100o
(a) Specific energy consumption for the tested dies.
0.3 0.4 0.5 0.6 0.7 0.8 0.9 1
AR [-]
0.9
0.92
0.94
0.96
0.98
1
Dur
abili
ty [-
]
Pellet durability vs. AR
= 0o = 60o = 100o
(b) Durability of pellets produced in the tested dies.
Figure 4.5: Experimental results of energy and durability (figure from paper D [70]).
The mass-specific energy consumptions from the single pelleting tests arerepresented in the unit of kWh/ton, which is often used by the industry. The
45

Chapter 4. Effect of the Press Channel Inlet and the Feedstock Layer Shapes inPellets
energy consumptions in figure 4.5a show that the β = 100◦ die consumesmore energy compared to the β = 60◦ dies, while the consumption of theblank die with β = 0◦, is between the β = 60◦ and β = 100◦ dies. Figure 4.5aalso shows that the energy consumption for the β = 60◦ decreases when ARincreases from 0.60 to 0.80, and the die with AR = 1.00 consumes similar tothe 0.80 die. An opposite effect of the AR is observed for the β = 100o dies,where the highest energy consumption is observed for the die with an AR of1.00.
The measured pellet durabilities in figure 4.5b, shows that the durabilityis highest for the pellets produced in the dies with an AR of 0.60 and 0.80,and the durability is more or less independent of the tested values of β. Thelowest durability was measured for the pellets that were produced in theβ = 0◦ die. It was observed, that the pellets produced in the β = 0◦ die brokeinto two smaller pellets during the pellet tumbling, while all other pelletsremained in one pellet. The broken pellets might be a reason for the lowerdurability values of the β = 0◦ pellets.
Layer Profiles
The photos of the embedded and sanded pellets are shown in figure 4.6.The layer profiles from the pellets in figure 4.6 are plotted in figure 4.7.
The general observations from figure 4.7 are that by increasing the AR ofthe dies, the layer profiles become steeper from the perimeter of the pellettowards the pellet center, and the β = 0◦ die produces a layer profile that isrelatively flat in the center and steep near the perimeter. An interesting ob-servation from the photos in figure 4.6, is the stagnant regions of the pellets,that are observed by the uncolored spruce in the inlets of the dies. Stagnantregions are observed in the inactive area for die 1, 2, and 4, which are thedies with the lowest AR. Also, in the inlet of die 6 and 7, with β = 100◦, thestagnant feedstock is observed, which creates a new secondary inlet angledefined by the interface between moving and stagnant feedstock.
46

4.3. Layer Profile Analysis
(a) Die 1.
(b) Die 2. (c) Die 3. (d) Die 4.
(e) Die 5. (f) Die 6. (g) Die 7.
Figure 4.6: Photos of the casts from the dies (figure from paper D [70]).
47
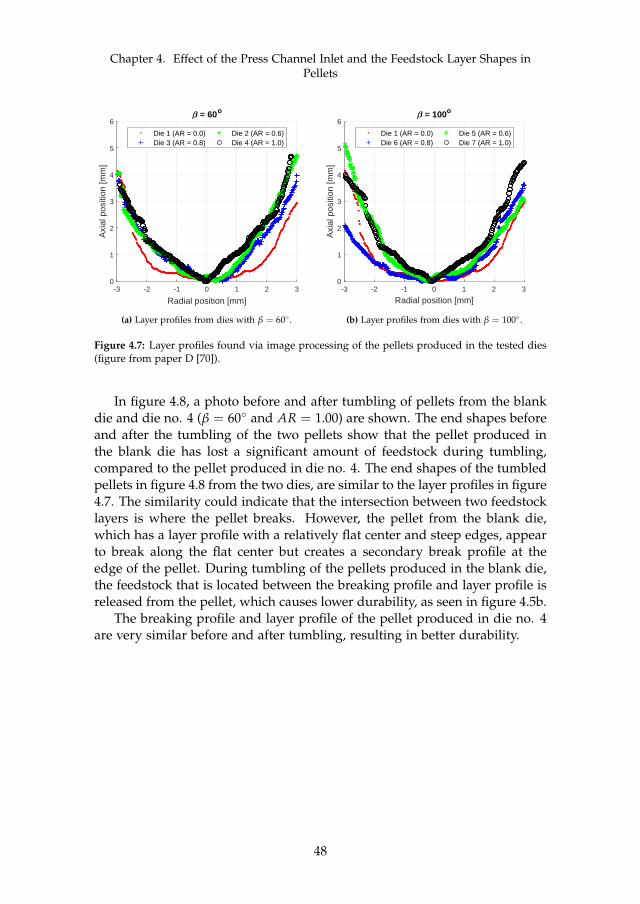
Chapter 4. Effect of the Press Channel Inlet and the Feedstock Layer Shapes inPellets
-3 -2 -1 0 1 2 3
Radial position [mm]
0
1
2
3
4
5
6
Axi
al p
ositi
on [m
m]
= 60o
Die 1 (AR = 0.0)Die 3 (AR = 0.8)
Die 2 (AR = 0.6)Die 4 (AR = 1.0)
-3 -2 -1 0 1 2 3
Radial position [mm]
0
1
2
3
4
5
6
Axi
al p
ositi
on [m
m]
= 100o
Die 1 (AR = 0.0)Die 6 (AR = 0.8)
Die 5 (AR = 0.6)Die 7 (AR = 1.0)
(a) Layer profiles from dies with β = 60◦ .
-3 -2 -1 0 1 2 3
Radial position [mm]
0
1
2
3
4
5
6
Axi
al p
ositi
on [m
m]
= 60o
Die 1 (AR = 0.0)Die 3 (AR = 0.8)
Die 2 (AR = 0.6)Die 4 (AR = 1.0)
-3 -2 -1 0 1 2 3
Radial position [mm]
0
1
2
3
4
5
6
Axi
al p
ositi
on [m
m]
= 100o
Die 1 (AR = 0.0)Die 6 (AR = 0.8)
Die 5 (AR = 0.6)Die 7 (AR = 1.0)
(b) Layer profiles from dies with β = 100◦ .
Figure 4.7: Layer profiles found via image processing of the pellets produced in the tested dies(figure from paper D [70]).
In figure 4.8, a photo before and after tumbling of pellets from the blankdie and die no. 4 (β = 60◦ and AR = 1.00) are shown. The end shapes beforeand after the tumbling of the two pellets show that the pellet produced inthe blank die has lost a significant amount of feedstock during tumbling,compared to the pellet produced in die no. 4. The end shapes of the tumbledpellets in figure 4.8 from the two dies, are similar to the layer profiles in figure4.7. The similarity could indicate that the intersection between two feedstocklayers is where the pellet breaks. However, the pellet from the blank die,which has a layer profile with a relatively flat center and steep edges, appearto break along the flat center but creates a secondary break profile at theedge of the pellet. During tumbling of the pellets produced in the blank die,the feedstock that is located between the breaking profile and layer profile isreleased from the pellet, which causes lower durability, as seen in figure 4.5b.
The breaking profile and layer profile of the pellet produced in die no. 4are very similar before and after tumbling, resulting in better durability.
48

4.3. Layer Profile Analysis
Figure 4.8: Comparison of a pellet from the blank die and die no. 4, before and after tumbling.The red marker shows the region with a significant difference in pellet shape before and aftertumbling (figure from paper D [70]).
49

Chapter 4. Effect of the Press Channel Inlet and the Feedstock Layer Shapes inPellets
Simulation Results
In figure 4.9, three contour plots from the CFD simulation of die no. 2 areshown. Figure 4.9a shows the simulated feedstock velocity, where it is seenthat the feedstock moves as a plug in the press channel. Also, the stagnantregion on the die’s inactive area is observed, which is similar to the photoin figure 4.6b. The edge of the inactive area is also seen by the simulatedshear rate in figure 4.9c, where a high shear rate is observed at the interfacebetween the stagnant and moving feedstock. The dark blue areas in figure4.9c indicate that the feedstock moves as a solid, and thereby obey γ < γc.
The simulated retention time is shown by colored streamlines in figure4.9b. The simulated feedstock layer profiles are derived as the feedstockposition at the retention time before the feedstock exits the model domain.
(a) Velocity. (b) Streamlines with colors representing thefeedstock retention time.
(c) Shear rate.
Figure 4.9: CFD simulation results of die no. 2, β = 60◦ and AR = 0.60 (figure from paperD [70]).
The experimental and simulated layer profiles are plotted in figure 4.10,
50

4.3. Layer Profile Analysis
showing that the CFD models are capable of qualitatively reproducing theexperimental layer profiles. However, the asymmetry of the experimentallayer profiles is not captured by the model, which is likely caused by thefeedstock not behaving as a continuum, as assumed in the CFD model.
-2 0 2
Radial position [mm]
0
2
4
6
Axi
al p
ositi
on [m
m]
Die 1
SimulationExperimental
-2 0 2
Radial position [mm]
0
2
4
6
Axi
al p
ositi
on [m
m]
Die 2
-2 0 2
Radial position [mm]
0
2
4
6
Axi
al p
ositi
on [m
m]
Die 3
-2 0 2
Radial position [mm]
0
2
4
6
Axi
al p
ositi
on [m
m]
Die 4
-2 0 2
Radial position [mm]
0
2
4
6
Axi
al p
ositi
on [m
m]
Die 5
-2 0 2
Radial position [mm]
0
2
4
6
Axi
al p
ositi
on [m
m]
Die 6
-2 0 2
Radial position [mm]
0
2
4
6
Axi
al p
ositi
on [m
m]
Die 7
Figure 4.10: Comparison of experimental and simulated layer profiles in the pellets (figure frompaper D [70]).
51

Chapter 4. Effect of the Press Channel Inlet and the Feedstock Layer Shapes inPellets
Effect of Layer Profile
To quantify the differences in layer profiles produced from the seven dies, thekurtosis [77] of the layer profiles is calculated, by assuming the layer profilesas an upward-facing distribution. A description of the kurtosis calculation isfound in paper D.
Figure 4.11 shows two plots with the kurtosis, the pellet durability, andAR of the dies.
0.3 0.4 0.5 0.6 0.7 0.8 0.9 1
AR [-]
1.9
2
2.1
Kur
tosi
s [-
]
Kurtosis vs AR
Experimental data Linear fit (r2 = 0.72)
1.85 1.9 1.95 2 2.05 2.1 2.15Kurtosis [-]
0.9
0.92
0.94
0.96
0.98
1
Dur
abili
ty [-
]
Durability vs kurtosis
Experimental data 2nd degree poly fit (r2 = 0.73)
(a) Plot of kurtosis and pellet durability.
0.3 0.4 0.5 0.6 0.7 0.8 0.9 1
AR [-]
1.9
2
2.1
Kur
tosi
s [-
]
Kurtosis vs AR
Experimental data Linear fit (r2 = 0.72)
1.85 1.9 1.95 2 2.05 2.1 2.15Kurtosis [-]
0.9
0.92
0.94
0.96
0.98
1
Dur
abili
ty [-
]
Durability vs kurtosis
Experimental data 2nd degree poly fit (r2 = 0.73)
(b) Plot of layer profile kurtosis and AR.
Figure 4.11: Plots of the profile layer kurtosis (figure from paper D [70]).
In figure 4.11a, a 2nd degree polynomial function is fitted to the kurtosisand the pellet durability data. The fitted function has a r2 = 0.73. Figure4.11a shows that the pellets with a layer profile kurtosis of 2.00-2.05 have thehighest durability.
Figure 4.11b shows a linear correlation between AR and the kurtosis. Thefitted linear function with r2 = 0.72 and a p-value = 0.016, meaning that thereis a significant correlation between AR of the die design and the layer profilekurtosis.
52

4.3. Layer Profile Analysis
Contribution
The CFD model presented in paper D is capable of simulating the feedstockmotion in press channel, which has been validated from experimental obser-vations of the layer shapes in pellets. The primary contributions of the studyare as follows:
• The feedstock motion in press channels can be simulated with a CFDmodel using a simplified Bingham viscosity model, which can simulatewhere the feedstock behaves as a solid or as fluid in the press channel.
• The design parameter AR, which specifies the ratio of active and tran-sition area on the die, correlates linearly with the kurtosis of the layerprofiles in the pellets. The kurtosis correlates to the durability of thepellets, where the highest durability was produced with a kurtosis of2.00-2.05.
• Regions with stagnant feedstock was observed on the inactive area ofthe tested dies, and in the inlet part of two dies with β = 100◦ and ARof 0.80 and 1.00.
• From continuous single pelleting tests with seven different dies, it wasfound that the dies with β = 60◦ consume less energy compared to theβ = 100◦ dies and that the β = 60◦ dies with an AR of 0.80 and 1.00had the lowest energy consumption.
• The highest pellet durability was produced with the dies having an ARof 0.60 and 0.80, while no considerable difference in pellet durabilitywas found between the β = 60◦ and β = 100◦ dies.
The CFD model in paper D provides a basis for future simulations, whichcan be extended to simulate patterns of press channels in the die, and therebyinvestigate the motion of the feedstock between the press channels, whichhave not been done before. Also, a method should be developed for measur-ing the yield stress, τ0, for simulating different feedstock species.
53

Chapter 4. Effect of the Press Channel Inlet and the Feedstock Layer Shapes inPellets
54

Chapter 5
Process Parameters of thePellet Press
In this chapter, the effects of the thickness of the feedstock layer on the die and theinfluence of the gap size between die and roller are analyzed, where a pilot-scale ringdie pellet press was set up for experimental testing.
5.1 Feedstock Motion in the Press Channel
The results of the 1D model in chapter 2, showed that the simulated energyconsumption were 2.2-2.5 times higher than the energy consumption foundfrom the experimental single pelleting tests. The overestimation of the energyconsumption might be caused by the assumption of a steady-state process,where the pelleting force is constant. However, from single pelleting tests,the applied force for pressing a feedstock layer into the press channel wasfound to vary. Figure 5.1 shows the applied force that has been recordedwhile pressing one layer of feedstock into a single press channel.
The force recording in figure 5.1 is split into three phases:
1. Feedstock is being compressed and is not being conveyed in the chan-nel. In this phase there is a static friction between the channel wall andthe forming pellet.
2. When reaching a peak in applied force, the wall friction shifts to atransition phase, which initiates the motion of feedstock in the presschannel. During the transition phase, the force decreases. The transitionphase is a complex interaction of multiple mechanisms, such as thestick-slip phenomenon, which is an effect of alternating sticking and
55

Chapter 5. Process Parameters of the Pellet Press
0 2 4 6 8 10 12 14 16 18 20
Displacement [mm]
0
0.2
0.4
0.6
0.8
1
1.2
1.4
1.6
1.8
2
For
ce [N
]
#104
StaticTransitionKinetic
Piston movement
Figure 5.1: Force recordings from pelleting of spruce in a single pellet press (figure from paperB [15]).
slipping of the feedstock, caused by the system properties of elasticity,damping, and inertia [78].
3. In the final phase, the force reaches a steady level with kinetic friction,where feedstock is pressed through the press channel.
In figure 5.1, the frictional work in the press channel is represented by thecolored areas in the transition and kinetic phases, while the marked area inthe static region can be interpreted as the compressional work.
The 1D model calculates the pelleting force as the peak force, measuredat the transition between the static and transition phase in figure 5.1, but itdoes not account for the effects of the lower friction in the kinetic phase.
Pellet Press Layer Thickness and Roller Gap
In figure 5.2a, the ring die and the two rollers of the pellet press that is usedfor the pelleting tests in paper E are illustrated. Figure 5.2b illustrates thefeedstock layer in front of the roller and the roller gap between die and roller.The mass of feedstock being pressed into the press channels per roller passingis directly correlated to the thickness of the feedstock layer.
By increasing the thickness of the feedstock layer, the duration of the tran-sition and kinetic friction phase is extended, and the number of start-stops inthe press channel is reduced pr. unit mass of pelleted feedstock. Reducing thenumber of start-stops could decrease the mass-specific energy consumption,which also was commented in a study by Winter [31]. However, minimal re-search on the effect of the feedstock layer has been performed. Wu et al. [80]
56

5.1. Feedstock Motion in the Press Channel A-A ( 1 : 2 )
B ( 2 : 1 )
A
A
B
1
1
2
2
3
3
4
4
5
5
6
6
7
7
8
8
A A
B B
C C
D D
E E
F F
1 A2
test.idwState Changes Date Name
Drawn
Checked
Standard
Date Name24-01-2020 ESBSIM04
Feedstock layer
Roller
Die
Roller gap
(a) Ring die with two rollers.
A-A ( 1 : 2 )
B ( 2 : 1 )
A
A
B
1
1
2
2
3
3
4
4
5
5
6
6
7
7
8
8
A A
B B
C C
D D
E E
F F
1 A2
test.idwState Changes Date Name
Drawn
Checked
Standard
Date Name24-01-2020 ESBSIM04
Feedstock layer
Roller
Die
Roller gap
(b) Cross sectional view of the die and roller,where the feedstock layer and roller gap aremarked.
Figure 5.2: Illustration of die and rollers, and the two operational parameters, feedstock layer,and roller gap (figure from paper E [79]).
studied the effect of rotational die speed with a constant feedstock mass flowrate. They found the energy consumption of the pellet press to increase withthe die speed, which is correlated with the thickness of feedstock layer.
The feedstock layer is quantified as the mass of feedstock, m f , that ispressed into one press channel at each roller pass, and the correspondingthickness of the feedstock layer, h f .
The mass of the feedstock layer is calculated via equation 5.1. In thecalculation of m f , it is assumed that the feedstock is distributed evenly onthe die surface.
m f =m
Nr · ωd · Nch(5.1)
In equation 5.1, Nr is the number of rollers in the pellet press, ωd is therotational frequency of the die, m is the feedstock mass flow, and Nch is thenumber of press channels in the die.
The thickness of the feedstock layer, h f , is calculated via equation 5.2.
h f =m
Nr · ωd · ρb · Ad(5.2)
In equation 5.2, Ad is the area of the die’s inner surface, and ρb is the bulkdensity of the feedstock.
Pelleting Energy Calculation
Based on the static and kinetic friction phases in figure 5.1, a simple expres-sion for calculating the energy consumption is proposed, which is derivedfrom the simplified friction plot in figure 5.3.
57

Chapter 5. Process Parameters of the Pellet Press
x0
xp
xe
Position [mm]
0
Fe
Fp
For
ce [N
]
Simplified force plot
Compression (static) Extrusion (kinetic)
hfc
Figure 5.3: Illustration of the pelleting force with a simplified transition between the static (com-pression) and kinetic (extrusion) phase (figure from paper E [79]).
In figure 5.3, Fp is the static pelleting force and xp is its correspondingposition, Fe is the kinetic pelleting force and xe is the position where the pressstops. The difference between xp and xe can be interpreted as the thicknessof the compressed feedstock layer, h f c.
From the simplified friction plot in figure 5.3, the mass-specific energyconsumption, w, is calculated using equation 5.3.
w =Ec + Fe · h f c
m f(5.3)
In equation 5.3, Ec is the energy required to compress the feedstock. In figure5.3, Ec is equal to the blue-colored area in the compression phase, and theproduct of Fe and h f c is the red-colored area, which is the friction work. Inthis study, the values for h f are used instead of h f c, since the compressedheights of the feedstock layers are unknown.
The expression of h f is directly correlated to m f , causing that the mass-specific friction work in equation 5.3 is constant, if assuming Fe to be inde-pendent of m f . Hence, it is only the compression energy that depends on m f ,as shown in equation 5.4.
w =Ec
m f+ Fe ·
NchAd · ρb
(5.4)
Pellet Durability Calculation
Handling and transportation of pellets include impacts and wear of the pel-lets, which may release particles from the pellets ends, reducing the dura-bility of the pellets. Observations from the analysis of feedstock layer pro-files, described in section 4.3, showed that the shapes of the pellet ends were
58

5.2. Pellet Press Set Up and Tests
similar to the layer profiles and that the pellets tend to break between thefeedstock layers. Based on this observation, the number of compressed feed-stock layers in a pellet is thought to affect the pellet durability, since morelayers could cause more pellet breaks. To test this hypothesis, a simple em-pirical expression of the pellet durability is set up in equation 5.5, where m fis inversely proportional to a fitting parameter, a.
Durability = 100 − am f
(5.5)
The expressions set up in equation 5.3 and 5.5, are fitted to experimen-tal data from pelleting tests, to investigate if the proposed equations can bevalidated and if the effects of the feedstock layer are as assumed.
5.2 Pellet Press Set Up and Tests
An experimental setup with a 15 kW ring die pellet press was build as a partof the work in this Ph.D. project. The pellet press is equipped with frequencydrives on the main motor and feed-screw motor, to allow a controlled varia-tion of the rotational die speed and mass flow rate of the feedstock. Figure5.4a shows a photo of the setup, where the feedstock is conveyed from thehopper to the pellet press. On top of the pellet press, the feedstock is fed intoa conditioner, where steam can be added to the feedstock, which is suppliedfrom a 15 kW electrical steam boiler. After the conditioner, the feedstock isfeed into the press chamber of the die, which is shown in figure 5.4b. In thepress chamber, the scrapers’ positions are adjusted to distribute the feedstockevenly in front of the rollers. The gap between die and roller is adjusted bythe angular position of the latch on each roller.
After the pellet press, the pellets are conveyed to a pellet cooler, where asuction hose generates an airflow through the pellet bed and cools the pellets.
59
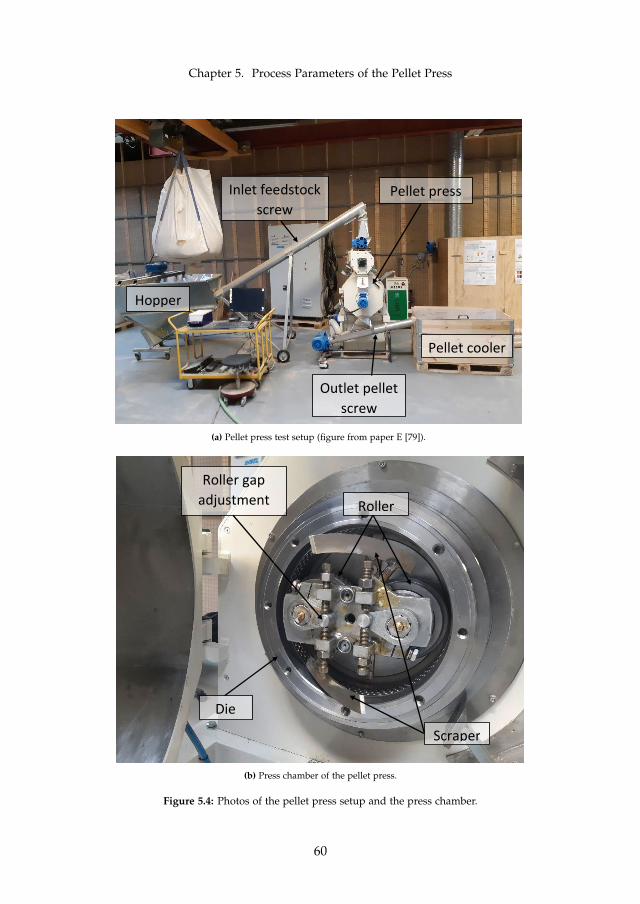
Chapter 5. Process Parameters of the Pellet Press
Pellet press
Pellet cooler
Outlet pellet screw
Inlet feedstock screw
Hopper
(a) Pellet press test setup (figure from paper E [79]).
Die
Roller
Scraper
Roller gap adjustment
(b) Press chamber of the pellet press.
Figure 5.4: Photos of the pellet press setup and the press chamber.
60

5.2. Pellet Press Set Up and Tests
Pelleting Tests
Pelleting test was performed with spruce, with a moisture content of approx-imately 9.9% on wet basis (w.b), and no steam conditioning.
The specifications and applied settings of the pellet press and die for thepelleting tests are listed in table 5.1. A full-factorial test of rotational diespeed, feedstock mass flow rate, and roller gap was performed, where eachfactor was tested at three levels:
• Rotational die speed: 60 Hz, 48 Hz, and 36 Hz, corresponding to 5.10m/s, 4.08 m/s, and 3.06 m/s. Plus, two tests at 24 Hz (2.04 m/s).
• Feedstock mass flow rate: 90 kg/h, 120 kg/h, and 150 kg/h.
• Roller gap: 0.2 mm, 0.9 mm, and 1.6 mm.
Due to problems with the frequency converter, only two tests were per-formed at a rotational die speed of 24 Hz. A total of 29 pelleting tests wereperformed, and approximately 1.5 tons of pellets were produced.
Table 5.1: Pellet press and die configurations (table from paper E [79]).
Pellet press
Feed-screw capacity 150 kg/hPress motor power 15 kWNo. of rollers 2 pcs.Roller gap 0.0-1.6 mmDie speed 3.1-5.1 m/sInner die diameter 250 mmDie width 26 mmNo. of press channels 252 pcs.
Die press channels
Diameter 6 mmLength 35 mmInlet angle, β 60◦
Inlet depth, h 1.6 mm
During the tests, the power consumption of the pellet press main motorwas monitored and recorded for five minutes when reaching a steady levelfor each test. A sample of pellets was collected from each test to measure thebulk density of the pellets according to ISO 17828:2015 [81] and the feedstockmass flow rate. The mechanical durability of the pellets was measured ac-cording to ISO 17831-1:2015 [82] and was measured three times for each testsample.
61

Chapter 5. Process Parameters of the Pellet Press
A comparison of pellet length was performed by measuring the averagepellet length for each test using image processing. The image processingwas performed by spreading a sample of pellets on a white paper with asize of 297x210 mm which was photographed with a resolution of 4608x3456pixels. The software Matlab was used to process the pellet images. Thepellet lengths were calculated by measuring the longitudinal and diametraldimensions of each pellet, and assuming the average diametral dimensionof the pellets to be 6 mm. The image processing steps are illustrated infigure 5.5. Figure 5.5a and 5.5b show the raw photo of the pellets and thecorresponding binary image. The red dots in figure 5.5b indicates that thedistance between two pellets is too small, and thereby are excluded from theanalysis. The distribution of the pellet lengths is shown in figure 5.5c.
The image processing method allows many pellets to be analyzed in ashort amount of time compared to manual techniques as caliber measure-ments. The image processing method requires that the pellets are lying onthe side. However, tiny pellets may face an end upwards, and therefore willappear to have a length equal to its diameter.
Pellet length distribution
0 5 10 15 20 25
Length [mm]
0
20
40
60
80
Cou
nt [-
]
Binary image
Included Excluded
Photo
(a) Raw photo of a pellet sample.Pellet length distribution
0 5 10 15 20 25
Length [mm]
0
20
40
60
80
Cou
nt [-
]
Binary image
Included Excluded
Photo
(b) Processed binary image.
Pellet length distribution
0 5 10 15 20 25
Length [mm]
0
20
40
60
80
Cou
nt [-
]
Binary image
Included Excluded
Photo
(c) Plot of pellet length distribution.
Figure 5.5: Image analysis of a pellet sample produced with die speed 3.08 m/s, mass flow rate90 kg/h, and roller gap 0.2 mm (figure from paper E [79]).
62
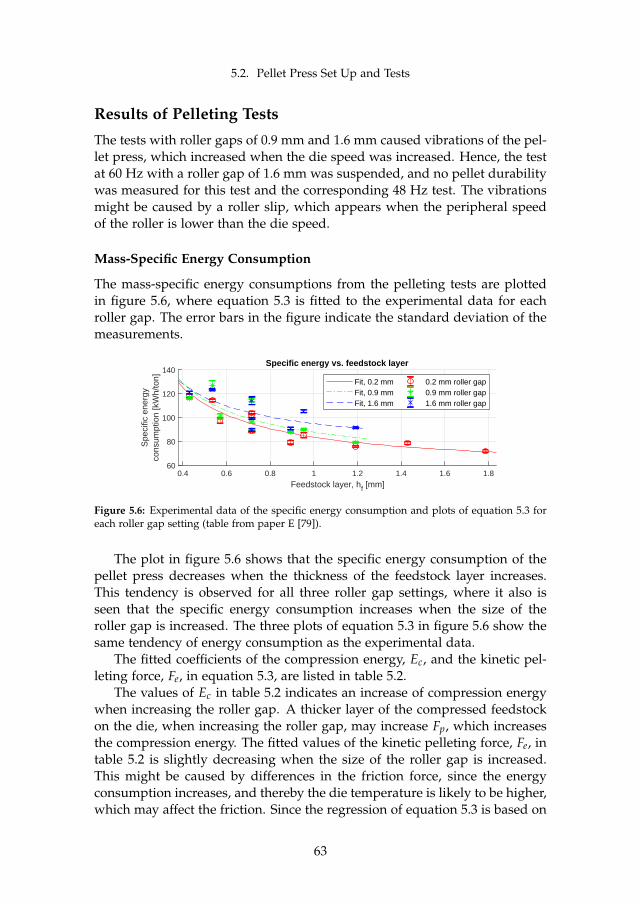
5.2. Pellet Press Set Up and Tests
Results of Pelleting Tests
The tests with roller gaps of 0.9 mm and 1.6 mm caused vibrations of the pel-let press, which increased when the die speed was increased. Hence, the testat 60 Hz with a roller gap of 1.6 mm was suspended, and no pellet durabilitywas measured for this test and the corresponding 48 Hz test. The vibrationsmight be caused by a roller slip, which appears when the peripheral speedof the roller is lower than the die speed.
Mass-Specific Energy Consumption
The mass-specific energy consumptions from the pelleting tests are plottedin figure 5.6, where equation 5.3 is fitted to the experimental data for eachroller gap. The error bars in the figure indicate the standard deviation of themeasurements.
0.4 0.6 0.8 1 1.2 1.4 1.6 1.8Feedstock layer, hf [mm]
60
80
100
120
140
Spe
cific
ene
rgy
cons
umpt
ion
[kW
h/to
n]
Specific energy vs. feedstock layer
Fit, 0.2 mmFit, 0.9 mmFit, 1.6 mm
0.2 mm roller gap0.9 mm roller gap1.6 mm roller gap
0.008 0.01 0.012 0.014 0.016 0.018 0.02 0.022 0.024 0.026Feedstock layer mass, mf [g]
40
60
80
100
Dur
abili
ty [-
]
Pellet durability vs. feedstock layer
Fit, 0.2 mmFit, 0.9 mmFit, 1.6 mm
0.2 mm roller gap0.9 mm roller gap1.6 mm roller gap
Figure 5.6: Experimental data of the specific energy consumption and plots of equation 5.3 foreach roller gap setting (table from paper E [79]).
The plot in figure 5.6 shows that the specific energy consumption of thepellet press decreases when the thickness of the feedstock layer increases.This tendency is observed for all three roller gap settings, where it also isseen that the specific energy consumption increases when the size of theroller gap is increased. The three plots of equation 5.3 in figure 5.6 show thesame tendency of energy consumption as the experimental data.
The fitted coefficients of the compression energy, Ec, and the kinetic pel-leting force, Fe, in equation 5.3, are listed in table 5.2.
The values of Ec in table 5.2 indicates an increase of compression energywhen increasing the roller gap. A thicker layer of the compressed feedstockon the die, when increasing the roller gap, may increase Fp, which increasesthe compression energy. The fitted values of the kinetic pelleting force, Fe, intable 5.2 is slightly decreasing when the size of the roller gap is increased.This might be caused by differences in the friction force, since the energyconsumption increases, and thereby the die temperature is likely to be higher,which may affect the friction. Since the regression of equation 5.3 is based on
63

Chapter 5. Process Parameters of the Pellet Press
Table 5.2: Regression results of equation 5.3 and the experimental data (table from paper E [79]).
Roller gap Coefficient r2 RMSEEc Fe
0.2 mm 250.8 0.1241 0.8585 6.29280.9 mm 270.0 0.1226 0.6324 10.22891.6 mm 327.0 0.0987 0.5842 9.5650
h f , and not the correct parameter h f c, the coefficients in table 5.2 can only betaken as relative differences when changing the roller gap, and not absolutevalues. The vibrations that were observed for the 0.9 mm and 1.6 mm rollergap tests might explain the larger error bars for some of the data in figure5.6, and the lower values of r2 compared to the roller gap of 0.2 mm in table5.2.
The general level of the measured specific energy consumptions are higherthan the typical 30-60 kWh/ton consumed by industrial pellet presses [21–24], which could be caused by the feedstock not being conditioned beforepelleting [20], and differences in the feedstock layer in the pilot-scale pelletpress and industrial pellet presses.
Pellet Durability
Figure 5.7 shows a plot of the pellet durabilities and values of m f , togetherwith three fits of equation 5.5. The error bars represent the standard deviationof the durability measurements.
0.4 0.6 0.8 1 1.2 1.4 1.6 1.8Feedstock layer, hf [mm]
60
80
100
120
140
Spe
cific
ene
rgy
cons
umpt
ion
[kW
h/to
n]
Specific energy vs. feedstock layer
Fit, 0.2 mmFit, 0.9 mmFit, 1.6 mm
0.2 mm roller gap0.9 mm roller gap1.6 mm roller gap
0.008 0.01 0.012 0.014 0.016 0.018 0.02 0.022 0.024 0.026Feedstock layer mass, mf [g]
40
60
80
100
Dur
abili
ty [-
]
Pellet durability vs. feedstock layer
Fit, 0.2 mmFit, 0.9 mmFit, 1.6 mm
0.2 mm roller gap0.9 mm roller gap1.6 mm roller gap
Figure 5.7: Experimental data points of the pellet durability and plots of equation 5.5 for eachroller gap setting (table from paper E [79]).
The plot in figure 5.7 shows that the pellet durability increases when themass of the feedstock layer is increased and that increasing the roller gapdecreases the pellet durability. The effect of the roller gap on pellet durabilityis opposite to what was reported by Kaliyan et al. [18], who stated that the
64

5.2. Pellet Press Set Up and Tests
durability of feed pellets increased when increasing the roller gap up to 2-2.5 mm. The difference might be explained by differences between feed andbiomass, where pelleting of feed requires 3-4 times less energy than biomasspelleting [24]. Generally, the durability of the pellets are low compared tothe requirements of ISO 17225-2:2014 [10], which is likely caused by the lowfeedstock moisture content of 9.9% (w.b) [16], and no steam conditioning ofthe feedstock.
The plots of equation 5.5 in figure 5.7 fits well to the experimental data,suggesting that there is a correlation between the pellet durability and themass of the feedstock layers in the pellets. The fitted coefficients of a inequation 5.5 are listed in table 5.3.
Table 5.3: Regression results of equation 5.5 and the experimental data (table from paper E [79]).
Roller gapCoefficient,a
r2 RMSE
0.2 mm 0.1021 0.8221 1.28670.9 mm 0.1921 0.8111 2.71581.6 mm 0.3406 0.8784 2.6887
Bulk Density and Pellet Length
Figure 5.8 shows the measured bulk density of the pellet samples. No clearcorrelation between the bulk density and the feedstock layer was observed.However, the die speed and roller gap showed to affect the bulk density,which is shown by the plot in figure 5.8.
0.2 0.4 0.6 0.8 1 1.2 1.4 1.6
Roller gap [mm]
600
650
700
Bul
k de
nsity
[kg/
m3 ]
Bulk density vs roller gap
[2.04 m/s] [3.06 m/s] [4.08 m/s] [5.10 m/s]
Figure 5.8: Effect of roller gap and die speed on the pellet bulk density (figure from paper E [79]).
Figure 5.8 shows that the bulk density decreases when the die speed androller gap are increased. Generally, the bulk densities in figure 5.8 fulfill theminimum requirement of 600 kg/m3 in ISO 17225-2:2014 [10].
65

Chapter 5. Process Parameters of the Pellet Press
The results of the pellet length measurements and corresponding feed-stock layers are plotted in figure 5.9.
0.01 0.012 0.014 0.016 0.018 0.02 0.022 0.024 0.026
Feedstock layer, mf [g]
8
10
12
14
Ave
rage
pel
let
leng
th [m
m]
Pellet length vs feedstock layer
0.2 mm, linear fit0.9 mm, linear fit1.6 mm, linear fit
0.2 mm roller gap0.9 mm roller gap1.6 mm roller gap
Figure 5.9: Plot of average pellet length and feedstock layer with linear fits for each roller gapsize (figure from paper E [79]).
The linear functions in figure 5.9 are fitted to the data for each of the threeroller gap sizes. The plot shows that there is a positive correlation betweenthe average pellet length and the feedstock layer, while a negative correlationis observed for the size of the roller gap.
The pellet length is likely correlated to the adhesion or bonding strengthbetween the feedstock layers. Thus, the correlations in figure 5.9 may becaused by poor adhesion between the feedstock layers of the pellets that havethe smallest feedstock layers, and are produced with the largest roller gapsize. A reason for low adhesion strength could be a decrease of the pelletmoisture content, due to increased frictional heating in the die, caused bythe increased specific energy consumption of the pellet press, when runningwith thin feedstock layers and a high roller gap.
Hence, increased drying and poor adhesion between the feedstock layerscould also explain the effects of roller gap and feedstock layer on the pelletdurability in figure 5.7.
Contribution
From tests using a pilot-scale pellet press, the results are as follows:
• The specific energy consumption of the pellet press is negatively corre-lated to the thickness of the feedstock layer on the die and is positivelycorrelated to the size of the roller gap.
• The pellet durability is positively correlated to the thickness of the feed-stock layer and is negatively correlated to the roller gap size.
• The bulk density of the pellets is negatively correlated to rotational diespeed and the size of the roller gap.
66

5.2. Pellet Press Set Up and Tests
• The average pellet length is positively correlated to the thickness of thefeedstock layer on the die and is negatively correlated to the size of theroller gap.
• Empirical functions presented for the pellet durability and mass-specificenergy consumption of the pellet press were found to match the exper-imental data.
These findings are applicable to the pellet industry, where the feedstocklayer can be used as a parameter to reduce the energy consumption of thepellet press and increase the pellet durability. However, an optimum has yetto be found, since an upper limit of the feedstock layer thickness must exist,related to the size of the die and rollers.
The size of the roller gap should not be above 0.2 mm in terms of opti-mizing energy consumption and pellet durability. However, eliminating thegap between die and roller could cause significant wear due to direct contactbetween the rotating parts.
urldate = 01/08/2020,
67

Chapter 5. Process Parameters of the Pellet Press
68
Chapter 6
Conclusion and ClosingRemarks
The gathered conclusion of the studies in this thesis is presented in this chapter.
This thesis considers the effects of die design and process parameters inbiomass pelleting. By reviewing the current state-of-the-art, experimentsand models have been developed to qualitative and quantitatively analyzeselected design and process parameters of the pelleting process.
The main contributions lie within:
• The 1D model for simulation of pelleting pressure in press channelswith a conical inlet.
• The literature review in paper B, leading to an identification of researchgaps.
• The constitutive model for simulating the viscoplastic behavior of biomassin paper C.
• The CFD model and experimental analysis of feedstock layers in pelletspresented in paper D.
• The experimental analysis of the feedstock layers thickness and rollergap size using a pilot-scale pellet press in paper E.
The literature review showed that die parameters, such as the die areaand the inlet design of the press channel, are rarely considered in pelletingstudies. However, a few studies have indicated that the press channel in-let has a significant effect on energy consumption, and also affect the pelletdurability.
69

Chapter 6. Conclusion and Closing Remarks
The methods for calculation of the pelleting pressure in press channelswere found to be based on a set of equations that all utilize the same govern-ing properties of the feedstock and only apply for calculation of the pelletingpressure in a pure cylindrical press channel.
A 1D model was developed, which accounts for the design of the conicalpress channel inlet. Simulations performed with the 1D model show that thepressure in the press channel peaks at the transition between the press chan-nel inlet and the cylindrical part of the press channel, which also is where thewear is concentrated. Also, the model is capable of simulating the feedstockdensity and the mass-specific energy consumption, which is calculated fromthe frictional and compressional work exerted in the press channel. However,the mass-specific energy consumption found from the simulations indicatesthat the model needs further development due to the overestimation of thefrictional work exerted in the press channel. The presented model does notaccount for the dynamics of the start-stop motion of the feedstock in the presschannel, which probably is the main reason for the overestimated energy con-sumption.
The study of the press channel inlet was continued, by qualitatively ana-lyzing the feedstock layer shapes in pellets produced from continuous singlepelleting tests. The layer shapes in pellets produced from dies with differentinlet designs were quantified by the kurtosis of the layer shape, which wasintroduced as a shape factor. The kurtosis was found to correlate with thedurability of the pellets and the inlet design of the press channel. Hence, thelayer shapes have been shown to compose a link between the inlet design andthe pellet durability.
In the study of feedstock layer shapes, the motion of the feedstock in thepress channel was simulated using a CFD model, where a simplified Bing-ham model was utilized to model the feedstock viscosity. The CFD modelprovides valuable insight to the feedstock motion inside the press channel,and together with the experimental analysis of layer shapes, regions of stag-nant feedstock on the inactive part of the die surface were observed togetherwith cases of stagnant feedstock creating a new secondary inlet angle, de-fined by the interface between moving and stagnant feedstock.
With further investigation, the presented CFD model can form the basisfor simulations of larger sections of the die, where the feedstock motion be-tween press channels can be investigated to clarify effects between the diesurface and the roller.
Via experimental tests using a pilot-scale pellet press, the effects of thestart-stop motion in the press channel were investigated. It was found thatthe mass-specific energy consumption of the pellet press decreases when thethickness of the feedstock layer on the die is increased, which is equivalentto reducing the number of start-stop movements in the press channel. Thetrend observed from the experimental results was also shown with a simple
70

empirical expression of the mass-specific energy consumption based on thestatic and kinetic friction in the press channel. The results support the ideathat the neglected effect of the start-stop motion in the presented 1D modelis causing the overestimation of frictional work in the simulations.
The pellet press tests also showed a positive correlation between the thick-ness of the feedstock layer and the mechanical durability of the pellets. Hence,the thickness of the feedstock layer is considered to be an important param-eter in the pelleting process. In the extend of this study, industry-scale testsare ongoing to analyze the effects of the feedstock layer further, and the pos-sibility to reduce the energy consumption of pellet presses.
A Maxwell representation of the SLS constitutive model with two springsand a dashpot was found capable of simulating the visco-plastic behavior ofthe biomass. A pseudo spring porosity was developed and applied to the SLSMaxwell model for modeling the nonlinear elastic properties of biomass. Byfitting the model to experimental compression tests, mechanical propertiesof spruce with different particle sizes were derived, and one of the model’sspring coefficients was found to correlate to the energy required for com-pressing the biomass. Also, the stress relaxation of the feedstock, quantifiedby the mass-specific dashpot work, was found to be lowest for pellet pro-duced with small particles, which also had the highest durability.
A trend in the industry of biomass pelleting is that the share of non-woody feedstock used for pellet production is increasing [1], causing a widervariety of the feedstock base, which also is shown by many recent studiesof different feedstock types, such as sugarcane bagasse [83], harvest residuesof corn [84], lemon trees [85], cassava rhizome [86], tree-leafs [87], and fruitand vegetable waste [88]. Combined with compression tests, the presentedconstitutive model can be used as a tool for deriving and comparing themechanical properties of different types of feedstock. With further work,these properties can be applied to the 1D model to simulate die performanceand facilitate a quicker design phase for the production of customized diedesigns for a specific feedstock.
71

References
References
[1] C. Calderón, M. Colla, J.-M. Jossart, N. Hemeleers, G. Cancian, N. Aveni, andC. Caferri, “Bioenergy Europe Statistical Report 2019,” Bioenergy Europe, Tech.Rep., 2019. [Online]. Available: https://epc.bioenergyeurope.org/wp-content/uploads/2020/02/SR19_Pellet_final-web-1.pdf (Accessed 01/08/2020).
[2] W. Strauss and S. Walker, “Global pellet market outlook in 2018,”2018. [Online]. Available: https://www.canadianbiomassmagazine.ca/pellets/increasing-demand-6705 (Accessed 01/08/2020).
[3] D. Thrän, “Global Wood Pellet Industry and Trade Study 2017,” IEA BioenergyTask 40, p. 222, 2017.
[4] European Commision, “A policy framework for climate and energy in the periodfrom 2020 to 2030,” 2014.
[5] R. Jonsson and F. Rinaldi, “The impact on global wood-product markets of in-creasing consumption of wood pellets within the European Union,” Energy, vol.133, pp. 864–878, 2017. doi: 10.1016/j.energy.2017.05.178
[6] C. Calderón, G. Gauthier, and J.-M. Jossart, “AEBIOM statistical report 2017 -Full Report,” pp. 1–264, 2017. [Online]. Available: https://ibtc.bioenergyeurope.org/aebiom-2017-statistical-report/ (Accessed 01/08/2020).
[7] J. Carter, “Demand for Biomass Pellets and Chips : Japan and SouthKorea,” pp. 1–8, 2016. [Online]. Available: https://blog.forest2market.com/new-opportunities-for-biomass-growth-japan-and-south-korea (Accessed01/08/2020).
[8] L. Visser, R. Hoefnagels, and M. Junginger, “Wood pellet supply chain costs – areview and cost optimization analysis,” Renewable and Sustainable Energy Reviews,vol. 118, p. 109506, 2020. doi: https://doi.org/10.1016/j.rser.2019.109506
[9] G. Thek and I. Obernberger, “Wood pellet production costs under austrian andin comparison to swedish framework conditions,” Biomass and Bioenergy, vol. 27,no. 6, pp. 671 – 693, 2004. doi: https://doi.org/10.1016/j.biombioe.2003.07.007Pellets 2002. The first world conference on pellets.
[10] “ISO 17225-2:2014, Fuel specifications and classes - Part 2: Graded wood pellets,”pp. 1–13, 2014.
[11] European Pellet Council, “ENplus Quality Certification SchemePart 3: Pellet Quality Requirements,” p. 10, 2015. [Online].Available: https://enplus-pellets.eu/en-in/?option=com_attachments&task=download&id=103:ENplusHandbook_part3_V3 (Accessed 01/08/2020).
[12] N. C. Crawford, A. E. Ray, N. A. Yancey, and N. Nagle, “Evaluating the pelleti-zation of "pure" and blended lignocellulosic biomass feedstocks,” Fuel ProcessingTechnology, vol. 140, pp. 46–56, 2015. doi: 10.1016/j.fuproc.2015.08.023
[13] D. S. Bajwa, T. Peterson, N. Sharma, J. Shojaeiarani, and S. G. Bajwa,“A review of densified solid biomass for energy production,” Renewableand Sustainable Energy Reviews, vol. 96, pp. 296 – 305, 2018. doi:https://doi.org/10.1016/j.rser.2018.07.040
72

References
[14] I. Obernberger and G. Thek, “Physical characterisation and chemicalcomposition of densified biomass fuels with regard to their combustionbehaviour,” Biomass and Bioenergy, vol. 27, no. 6, pp. 653 – 669, 2004. doi:https://doi.org/10.1016/j.biombioe.2003.07.006 Pellets 2002. The first worldconference on pellets.
[15] S. K. Nielsen, M. Mandø, and A. B. Rosenørn, “Review of die design andprocess parameters in the biomass pelleting process,” Powder Technology, vol.364, pp. 971 – 985, 2020. doi: https://doi.org/10.1016/j.powtec.2019.10.051
[16] W. Stelte, J. K. Holm, A. R. Sanadi, S. Barsberg, J. Ahrenfeldt, and U. B. Henrik-sen, “Fuel pellets from biomass: The importance of the pelletizing pressure andits dependency on the processing conditions,” Fuel, vol. 90, no. 11, pp. 3285–3290,2011. doi: 10.1016/j.fuel.2011.05.011
[17] R. Samuelsson, S. H. Larsson, M. Thyrel, and T. A. Lestander, “Moisturecontent and storage time influence the binding mechanisms in biofuelwood pellets,” Applied Energy, vol. 99, pp. 109 – 115, 2012. doi:https://doi.org/10.1016/j.apenergy.2012.05.004
[18] N. Kaliyan and R. V. Morey, “Factors affecting strength and durability of densi-fied biomass products,” Biomass and Bioenergy, vol. 33, no. 3, pp. 337–359, 2009.doi: 10.1016/j.biombioe.2008.08.005
[19] D. Bergström, S. Israelsson, M. Öhman, S. A. Dahlqvist, R. Gref, C. Boman, andI. Wästerlund, “Effects of raw material particle size distribution on the charac-teristics of Scots pine sawdust fuel pellets,” Fuel Processing Technology, vol. 89,no. 12, pp. 1324–1329, 2008. doi: 10.1016/j.fuproc.2008.06.001
[20] M. Segerström and S. H. Larsson, “Clarifying sub-processes in continuous ringdie pelletizing through die temperature control,” Fuel Processing Technology, vol.123, pp. 122–126, 2014. doi: 10.1016/j.fuproc.2014.02.008
[21] T. B. Reed and B. Bryant, Densified biomass: A new form of solid fuel. Dept. ofEnergy, Solar Energy Research Institute, 1978.
[22] R. Jannasch, Y. Quan, and R. Samson, “A Process and Energy Analysis ofPelletizing Switchgrass,” Resource Efficient Agricultural Production Canada,Tech. Rep., 2001. [Online]. Available: https://reap-canada.com/online_library/feedstock_biomass/11AProcess.pdf
[23] L. Tabil and S. Sokhansanj, “Process conditions affecting the physical quality ofalfalfa pellets,” Applied Engineering in Agriculture, vol. 12, no. 3, pp. 345–350, 1996.doi: 10.13031/2013.25658
[24] L. Tellefsen, Handbook in Pelleting Technique (Danish: Håndbog i pilleteringsteknik).Esbjerg: Sprout-Matator, 1999.
[25] N. P. K. Nielsen, D. Gardner, T. Poulsen, and C. Felby, “Importance of tempera-ture, moisture content, and species for the conversion process of wood residuesinto fuel pellets,” Wood and Fiber Science, vol. 41, no. 4, pp. 414–425, 2009.
[26] J. K. Holm, U. B. Henriksen, J. E. Hustad, and L. H. Sørensen, “Toward an under-standing of controlling parameters in softwood and hardwood pellets produc-tion,” Energy and Fuels, vol. 20, no. 6, pp. 2686–2694, 2006. doi: 10.1021/ef0503360
73

References
[27] Shi Shuijuan, Wu Kai, Peng Binbin, Wang Shuanhu, and Sun Yu, “Mechanicalmodel and fea of ring die of three-roller pellet mill,” in 2010 International Confer-ence on Mechanic Automation and Control Engineering, 2010, pp. 76–80.
[28] N. P. K. Nielsen, J. K. Holm, and C. Felby, “Effect of fiber orientation on com-pression and frictional properties of sawdust particles in fuel pellet production,”Energy and Fuels, vol. 23, no. 6, pp. 3211–3216, 2009. doi: 10.1021/ef800923v
[29] V. I. Osobov, “Theoretical principles of compressing fibrous plant materials,”Trudy Viskhom, vol. 55, 1967.
[30] M. O. Faborode, “Analysis of extrusion compaction of fibrous agriculturalresidues for fuel applications,” Biomass, vol. 21, no. 2, pp. 115–128, 1990. doi:10.1016/0144-4565(90)90053-M
[31] E. Winter, “Fundamental considerations for preparing densified refuse-derivedfuel,” U.S. Environmental Protection Agency, Municipal Environmental ResearchLaboratory, Tech. Rep., 1981.
[32] J. K. Holm, W. Stelte, D. Posselt, J. Ahrenfeldt, and U. B. Henriksen, “Optimiza-tion of a multiparameter model for biomass pelletization to investigate temper-ature dependence and to facilitate fast testing of pelletization behavior,” Energyand Fuels, vol. 25, no. 8, pp. 3706–3711, 2011. doi: 10.1021/ef2005628
[33] J. K. Holm, U. B. Henriksen, K. Wand, J. E. Hustad, and D. Posselt, “Experimentalverification of novel pellet model using a single pelleter unit,” Energy and Fuels,vol. 21, no. 4, pp. 2446–2449, 2007. doi: 10.1021/ef070156l
[34] M. Puig-Arnavat, J. Ahrenfeldt, and U. B. Henriksen, “Validation of aMultiparameter Model to Investigate Torrefied Biomass Pelletization Be-havior,” Energy and Fuels, vol. 31, no. 2, pp. 1644–1649, 2017. doi:10.1021/acs.energyfuels.6b02895
[35] S. K. Nielsen, M. Mandø, and A. B. Rosenørn, “1D Model for investiga-tion of energy consumption and wear in die designs used for biomass pellet-ing,” European Biomass Conference and Exhibition, vol. 26, pp. 550–558, 2018. doi:10.5071/26thEUBCE2018-2CO.13.1
[36] R. J. Ross, Wood handbook : wood as an engineering material. Departmentof Agriculture, Forest Service, General Technical Report (GTR), 2010. ISBN1892529025
[37] P. Zaini, S. Sokansanj, X. Bi, C. J. Lim, S. Mani, S. Melin, and J. Kadla, “Density,heating value, and composition of pellets made from lodgepole pine (Pinus con-corta Douglas) infested with mountain pine beetle (Dendroctonus ponderosaehopkins),” Canadian Biosystems Engineering / Le Genie des biosystems au Canada,vol. 50, pp. 47–55, 2008.
[38] C. A. Hill and G. A. Ormondroyd, “Dimensional changes in Corsican pine(Pinus nigra Arnold) modified with acetic anhydride measured using a he-lium pycnometer,” Holzforschung, vol. 58, no. 5, pp. 544–547, 2004. doi:10.1515/HF.2004.082
[39] R. M. Kellogg and F. F. Wangaard, “Variation in the cell-wall density of wood,”Wood and Fiber Science, vol. 1, no. 3, pp. 180–204, 1969.
74

References
[40] Andritz Feed & Biofuel, “3D wear measurements of a ring die,” Esbjerg, Tech.Rep., 2015.
[41] W. Stelte, C. Clemons, J. K. Holm, J. Ahrenfeldt, U. B. Henriksen, andA. R. Sanadi, “Thermal transitions of the amorphous polymers in wheatstraw,” Industrial Crops and Products, vol. 34, no. 1, pp. 1053–1056, 2011. doi:10.1016/j.indcrop.2011.03.014
[42] A. S. Olsson and L. Salmen, “Viscoelasticity of Insitu Lignin as Affected by Struc-ture - Softwood vs Hardwood,” ACS Symposium Series, vol. 489, pp. 133–143,1992.
[43] S. Z. Chow and K. J. Pickles, “Thermal Softening and Degradation of Wood andBark,” Wood and Fiber Science, vol. 3, pp. 166–178, 1971.
[44] L. Salmén, “Viscoelastic properties of in situ lignin under water-saturated con-ditions,” Journal of Materials Science, vol. 19, no. 9, pp. 3090–3096, 1984. doi:10.1007/BF01026988
[45] G. M. Irvine, “The Glass Transitions of Lignin and Hemicellulose and Their Mea-surement by Differential Thermal-Analysis,” Tappi Journal, vol. 67, no. 5, pp. 118–121, 1984.
[46] A. Zafari and M. H. Kianmehr, “Factors affecting mechanical properties ofbiomass pellet from compost,” Environmental Technology (United Kingdom), vol. 35,no. 4, pp. 478–486, 2014. doi: 10.1080/09593330.2013.833639
[47] W. Stelte, J. K. Holm, A. R. Sanadi, S. Barsberg, J. Ahrenfeldt, and U. B. Henrik-sen, “A study of bonding and failure mechanisms in fuel pellets from differentbiomass resources,” Biomass and Bioenergy, vol. 35, no. 2, pp. 910–918, 2011. doi:10.1016/j.biombioe.2010.11.003
[48] L. G. Tabil Jr. and S. Sokhansanj, “Bulk properties of alfalfa grind in relation toits compaction characteristics,” Applied Engineering in Agriculture, vol. 13, no. 4,pp. 499–505, 1997, cited By :34.
[49] J. S. Tumuluru, C. T. Wright, J. R. Hess, and K. L. Kenney, “A review of biomassdensification systems to develop uniform feedstock commodities for bioenergyapplication,” Biofuels, Bioproducts and Biorefining, vol. 6, no. 3, pp. 246–256, 2012.doi: 10.1002/bbb
[50] D. J. Gardner and M. Tajvidi, “Hydrogen Bonding in Wood-Based Materials: Anupdate,” Wood and Fiber Science, vol. 48, no. 4, pp. 234–244, 2016.
[51] C. Macosko, Rheology: principles, measurements, and applications, ser. Advances ininterfacial engineering series. VCH, 1994. ISBN 978-0-471-18575-8
[52] P. J. Denny, “Compaction equations: A comparison of the Heckel andKawakita equations,” Powder Technology, vol. 127, no. 2, pp. 162–172, 2002. doi:10.1016/S0032-5910(02)00111-0
[53] K. D. Nona, B. Lenaerts, E. Kayacan, and W. Saeys, “Bulk compression charac-teristics of straw and hay,” Biosystems Engineering, vol. 118, no. 1, pp. 194–202,2014. doi: 10.1016/j.biosystemseng.2013.12.005
75

References
[54] M. O. Faborode and J. R. O’Callaghan, “Theoretical analysis of the compres-sion of fibrous agricultural materials,” Journal of Agricultural Engineering Research,vol. 35, pp. 175–191, 1986. doi: 10.1016/S0021-8634(86)80055-5
[55] N. Kaliyan and R. V. Morey, “Constitutive model for densification of corn stoverand switchgrass,” Biosystems Engineering, vol. 104, no. 1, pp. 47–63, 2009. doi:10.1016/j.biosystemseng.2009.05.006
[56] I. Krycer, D. G. Pope, and J. A. Hersey, “The interpretation of powder compactiondata - A critical review,” Drug Dev. Ind. Pharm., vol. 9045, no. November, p. 307,1982. doi: 10.3109/03639048209022103
[57] M. Peleg, “Linearization of relaxation and creep curves of solid biological mate-rials,” Journal of Rheology, vol. 24, no. 4, pp. 451–463, 1980. doi: 10.1122/1.549567
[58] M. O. Faborode and J. R. O’Callaghan, “Optimizing the compression/briquettingof fibrous agricultural materials,” Journal of Agricultural Engineering Research,vol. 38, pp. 245–262, 1987. doi: 10.1016/0021-8634(87)90092-8
[59] M. D. Shaw and L. G. Tabil, “Compression, Relaxation, and Adhesion Proper-ties of Selected Biomass Grinds,” Agricultural Engineering International: the CIGREjournal, vol. IX, pp. 1–16, 2007.
[60] N. Mohsenin and J. Zaske, “Stress relaxation and energy requirements in com-paction of unconsolidated materials,” Journal of Agricultural Engineering Research,vol. 21, no. 2, pp. 193–205, 1976. doi: 10.1016/0021-8634(76)90074-3
[61] S. K. Nielsen, H. Rezaei, M. Mandø, and S. Sokhansanj, “Constitutive modellingof compression and stress relaxation in pine pellets,” Biomass and Bioenergy, vol.130, p. 105370, 2019. doi: https://doi.org/10.1016/j.biombioe.2019.105370
[62] K. Peleg, “A Rheological Model of Nonlinear Viscoplastic Solids,” Journal of Rhe-ology, vol. 27, no. 5, pp. 411–431, 1983. doi: 10.1122/1.549714
[63] M. O. Faborode and J. R. O’Callaghan, “A rheological model for the compactionof fibrous agricultural materials,” Journal of Agricultural Engineering Research,vol. 42, no. 3, pp. 165–178, 1989. doi: 10.1016/0021-8634(89)90048-6
[64] L. Molari, M. Maraldi, and G. Molari, “Non-linear rheological model of strawbales behavior under compressive loads,” Mechanics Research Communications,vol. 81, pp. 32–37, 2017. doi: 10.1016/j.mechrescom.2017.02.010
[65] M. T. Carone, A. Pantaleo, and A. Pellerano, “Influence of process parametersand biomass characteristics on the durability of pellets from the pruning residuesof Olea europaea L,” Biomass and Bioenergy, vol. 35, no. 1, pp. 402–410, 2011. doi:10.1016/j.biombioe.2010.08.052
[66] N. Mišljenovic, R. Colovic, D. Vukmirovic, T. Brlek, and C. S. Bringas, “Theeffects of sugar beet molasses on wheat straw pelleting and pellet quality.A comparative study of pelleting by using a single pellet press and a pilot-scale pellet press,” Fuel Processing Technology, vol. 144, pp. 220–229, 2016. doi:10.1016/j.fuproc.2016.01.001
[67] Y. Li, D. Wu, J. Zhang, L. Chang, D. Wu, Z. Fang, and Y. Shi, “Measurementand statistics of single pellet mechanical strength of differently shapedcatalysts,” Powder Technology, vol. 113, no. 1, pp. 176 – 184, 2000. doi:https://doi.org/10.1016/S0032-5910(00)00231-X
76

References
[68] S. Hemamanjushree and V. K. Tippavajhala, “Review Article Simulation ofUnit Operations in Formulation Development of Tablets Using ComputationalFluid Dynamics,” AAPS PharmSciTech, vol. 21, no. 3, p. 103, 2020. doi:10.1208/s12249-020-1635-1
[69] G. Pashos, G. Pantazopoulos, and I. Contopoulos, “A Comprehensive CFDModel for Dual-Phase Brass Indirect Extrusion Based on Constitutive Laws:Assessment of Hot-Zone Formation and Failure Prognosis,” Metals, vol. 8,no. 12, p. 1043, 2018. doi: 10.3390/met8121043
[70] S. K. Nielsen and M. Mandø, “Experimental and numerical investigation of diedesigns in biomass pelleting and the effect on layer formation in pellets,” 2020.
[71] N. J. Balmforth, I. A. Frigaard, and G. Ovarlez, “Yielding to Stress: RecentDevelopments in Viscoplastic Fluid Mechanics,” Annual Review of FluidMechanics, vol. 46, no. 1, pp. 121–146, 2014. doi: 10.1146/annurev-fluid-010313-141424
[72] E. C. Bingham, “An Investigation of the Laws of Plastic Flow,” Bulletin of theBureau of Standards, vol. 13, no. 2, pp. 309–353, 1916. doi: 10.6028/bulletin.304
[73] ANSYS Inc., “FLUENT user guide, 8.4.5 Viscosity for Non-Newtonian Fluids,”2009.
[74] Y. Liu and J. R. D. Bruyn, “Start-up flow of a yield-stress fluid in a verticalpipe,” Journal of Non-Newtonian Fluid Mechanics, vol. 257, pp. 50 – 58, 2018. doi:https://doi.org/10.1016/j.jnnfm.2018.03.005
[75] S. K. Kim, “Flow rate based framework for solving viscoplastic flow withslip,” Journal of Non-Newtonian Fluid Mechanics, vol. 269, pp. 37 – 46, 2019. doi:https://doi.org/10.1016/j.jnnfm.2019.06.002
[76] S. H. Larsson and R. Samuelsson, “Prediction of ISO 17831-1:2015 mechanicalbiofuel pellet durability from single pellet characterization,” Fuel Processing Tech-nology, vol. 163, pp. 8–15, 2017. doi: 10.1016/j.fuproc.2017.04.004
[77] R. Shanmugam and C. Rajan, Skewness and Kurtosis. John Wiley & Sons,Ltd, 2016, ch. 4, pp. 89–110. ISBN 9781119047063. [Online]. Available:https://onlinelibrary.wiley.com/doi/abs/10.1002/9781119047063.ch4
[78] Dietmar Schulze, Powders and Bulk Solids Behavior, Characterization, Storage andFlow. Springer, Berlin, Heidelberg, 2008. ISBN 978-3-540-73767-4
[79] S. K. Nielsen, M. Mandø, and A. B. Rosenørn, “Experimental investigation offeedstock layer thickness and die-roller gap in wood pelleting,” in World Sustain-able Energy Days 2020. Linz/Wels: OÖ Energiesparverband, 2020, pp. 1–10.
[80] K. Wu, S. Shi, W. Ding, B. Peng, and Y. Sun, “Influence of die speed on theenergy consumption in the pelleting process,” 2010 International Conference onComputing, Control and Industrial Engineering, CCIE 2010, vol. 1, pp. 247–250, 2010.doi: 10.1109/CCIE.2010.70
[81] “ISO 17828:2015, Solid biofuels — Determination of bulk density,” pp. 1–8, 2015.
[82] “ISO17831-1:2015: Solid biofuels; Determination of mechanical durability of pel-lets and briquettes - Part 1: Pellets,” pp. 1–12, 2016.
77

References
[83] L. De Almeida, A. Sola, and J. Behainne, “Sugarcane bagasse pellets:Characterization and comparative analysis [pellets de bagaço de cana-de-açúcar:Caracterização e análise comparativa],” Acta Scientiarum - Technology, vol. 39,no. 4, pp. 461–468, 2017. doi: 10.4025/actascitechnol.v39i4.30198
[84] D. Djatkov, M. Martinov, and M. Kaltschmitt, “Influencing parameterson mechanical–physical properties of pellet fuel made from corn harvestresidues,” Biomass and Bioenergy, vol. 119, pp. 418–428, 2018. doi:10.1016/j.biombioe.2018.10.009
[85] M. Dagtekin, G. Gürdil, and B. DemiRel, “Bio-energy potential from lemonorchards,” 2019, pp. 109–112.
[86] N. Soponpongpipat, P. Comsawang, and S. Nanetoe, “Quality properties andpyrolysis characteristics of cassava rhizome pellets produced by alternatingbetween pelletizing and torrefaction,” Processes, vol. 7, no. 12, 2019. doi:10.3390/PR7120930
[87] L. Clavijo, S. Zlatanovic, G. Braun, M. Bongards, A. Dieste, andS. Barbe, “Eucalyptus kraft lignin as an additive strongly enhances themechanical resistance of tree-leaf pellets,” Processes, vol. 8, no. 3, 2020. doi:10.3390/PR8030376
[88] M. Arulprakasajothi, N. Beemkumar, J. Parthipan, and N. Battu, “Investigatingthe physio-chemical properties of densified biomass pellet fuels from fruit andvegetable market waste,” Arabian Journal for Science and Engineering, vol. 45,no. 2, pp. 563–574, 2020. doi: 10.1007/s13369-019-04294-8
78

Part II
Papers
79


Paper A
1D Model for Investigation of Energy Consumptionand Wear in Die Designs Used for Biomass Pelleting
Simon Klinge Nielsen, Matthias Mandø, and Andreas Brinch Rosenørn
The paper has been published in theProceedings of the 26th European Biomass Conference and Exhibition, pp. 550–558,
2018

Paper A. 1D Model for Investigation of Energy Consumption and Wear in DieDesigns Used for Biomass Pelleting
© 2018 ETA FlorenceThe layout has been revised, and small editorial changes have been made. Contentrelevant changes, if any, are marked with explicit footnotes.
82

Paper B
Review of Die Design and Process Parameters in theBiomass Pelleting Process
Simon Klinge Nielsen, Matthias Mandø, and Andreas Brinch Rosenørn
The paper has been published inPowder Technology Vol. 364, pp. 971-985, 2020.

Paper B. Review of Die Design and Process Parameters in the Biomass PelletingProcess
© 2019 Elsevier B.VThe layout has been revised.
84

Paper C
Constitutive Modelling of Compression and StressRelaxation in Pine Pellets
Simon Klinge Nielsen, Hamid Rezaei, Matthias Mandø, and ShahabSokhansanj
The paper has been published inBiomass & Bioenergy Vol. 130, no. 105370, 2019.

Paper C. Constitutive Modelling of Compression and Stress Relaxation in PinePellets
© 2019 Elsevier B.VThe layout has been revised.
86
Paper D
Experimental and Numerical Investigation of DieDesigns in Biomass Pelleting and the Effect on Layer
Formation in Pellets
Simon Klinge Nielsen and Matthias Mandø
The paper has been submitted toBiosystems Engineering (revised paper under review).

Paper D. Experimental and Numerical Investigation of Die Designs in BiomassPelleting and the Effect on Layer Formation in Pellets
© 2020 AuthorsThe layout has been revised.
88

Paper E
Experimental Investigation of Feedstock LayerThickness and Die-Roller Gap in Wood Pelleting
Simon Klinge Nielsen, Matthias Mandø, and Andreas Brinch Rosenørn
The paper has been published in theProceedings of the World Sustainable Energy Days, Wels, Austria, March 4-6, pp.
1-10, 2020.

Paper E. Experimental Investigation of Feedstock Layer Thickness and Die-RollerGap in Wood Pelleting
© 2019 OÖ EnergiesparverbandThe layout has been revised, and small editorial changes have been made. Contentrelevant changes, if any, are marked with explicit footnotes.
90

SIMO
N K
LING
E NIELSEN
NEXT G
ENER
ATION
DIE D
ESIGN
FOR
BIO
MA
SS PELLETING
ISSN (online): 2446-1636ISBN (online): 978-87-7210-684-7