Embed Size (px)
Citation preview

2021 EU Wide Stress Test
Our First Glance at Results
Highest capital depletion in stress history will not prevent the return of
dividends and buybacks – Winners and Losers of Stress Test Results
July 2021

12021 EBA Stress Test Results | July 2021
Contents
Highlights
1 Capital Stress Test Impacts
2 Potential for Capital Distribution – Dividends and Buybacks
3 Stress Tests Going Forward
Appendix 1 – Scenarios Used
Appendix 2 – List of Banks in EBA 2021 ST
Appendix 3 – A&M Authors
22021 EBA Stress Test Results | July 2021
Highlights
Stress Test Impacts
Capital Distribution
Summary by Country
Stress Tests Going
Forward
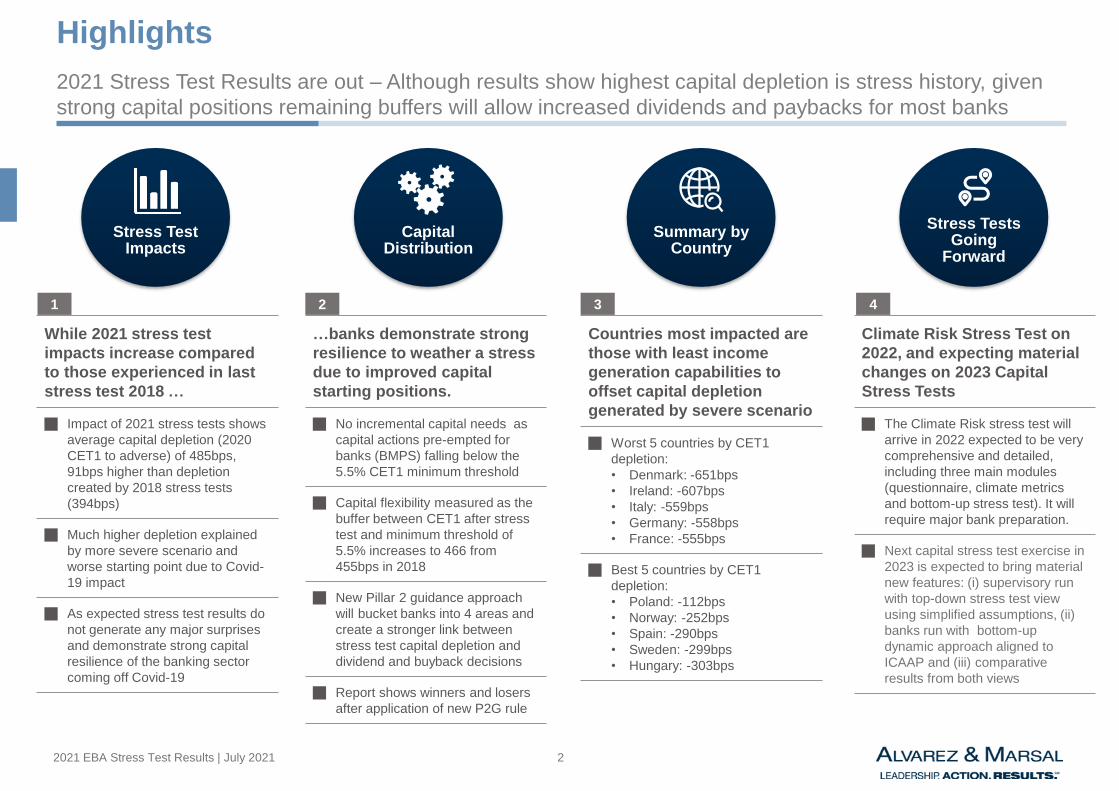
While 2021 stress test
impacts increase compared
to those experienced in last
stress test 2018 …
Impact of 2021 stress tests shows
average capital depletion (2020
CET1 to adverse) of 485bps,
91bps higher than depletion
created by 2018 stress tests
(394bps)
Much higher depletion explained
by more severe scenario and
worse starting point due to Covid-
19 impact
As expected stress test results do
not generate any major surprises
and demonstrate strong capital
resilience of the banking sector
coming off Covid-19
…banks demonstrate strong
resilience to weather a stress
due to improved capital
starting positions.
No incremental capital needs as
capital actions pre-empted for
banks (BMPS) falling below the
5.5% CET1 minimum threshold
Capital flexibility measured as the
buffer between CET1 after stress
test and minimum threshold of
5.5% increases to 466 from
455bps in 2018
New Pillar 2 guidance approach
will bucket banks into 4 areas and
create a stronger link between
stress test capital depletion and
dividend and buyback decisions
Report shows winners and losers
after application of new P2G rule
Countries most impacted are
those with least income
generation capabilities to
offset capital depletion
generated by severe scenario
Worst 5 countries by CET1
depletion:
• Denmark: -651bps
• Ireland: -607bps
• Italy: -559bps
• Germany: -558bps
• France: -555bps
Best 5 countries by CET1
depletion:
• Poland: -112bps
• Norway: -252bps
• Spain: -290bps
• Sweden: -299bps
• Hungary: -303bps
Climate Risk Stress Test on
2022, and expecting material
changes on 2023 Capital
Stress Tests
The Climate Risk stress test will
arrive in 2022 expected to be very
comprehensive and detailed,
including three main modules
(questionnaire, climate metrics
and bottom-up stress test). It will
require major bank preparation.
Next capital stress test exercise in
2023 is expected to bring material
new features: (i) supervisory run
with top-down stress test view
using simplified assumptions, (ii)
banks run with bottom-up
dynamic approach aligned to
ICAAP and (iii) comparative
results from both views
1 2 3 4
2021 Stress Test Results are out – Although results show highest capital depletion is stress history, given
strong capital positions remaining buffers will allow increased dividends and paybacks for most banks

Section | Stress Test Impacts1

42021 EBA Stress Test Results | July 2021
1. Stress Test Impacts2021 stress test capital depletion increased compared to depletion observed in last stress test 2018
(485bps vs. 394bps Fully Loaded).
Impact of 2021 stress tests shows average capital depletion (2020 CET1 fully loaded to adverse 2023) of 485 bps, 90bps higher than
depletion created by 2018 stress tests (394bps)
• European G-SIBs display average capital depletion of 489 bps in line with total average
• Worst 3 capital depletion countries measured on fully loaded basis (measured as Adverse CET1 depletion 2020-2023) are Denmark,
Ireland and Italy. Top 3 countries are Poland, Norway and Spain.
• Worst 3 capital depletion banks measured on fully loaded basis (Banca Monte dei Paschi, BNG and La Banque Postale)
• Best 3 capital depletion banks measured on fully loaded basis (Länförsäkringa, Polska and Bankinter)
Much higher depletion explained by a more severe scenario and worse starting point due to the impact of Covid-19. By main driver of
CET1 depletion:
• Credit Risk: -423 bps
• Market Risk (inc. CCR): -102 bps
• Conduct & Other Op. Risk: 68 bps
• NII & NFCI: impact of 176 bps and 73 bps respectively, measured as lower capital formation respectively compared to constant SP
Capital Depletion
All Banks European G-
SIBs
Worst 3 Countries Best 3 Countries Worst 3 Banks Best 3 Banks
CET Fully Loaded
Adverse-485bps -489bps
Denmark, Ireland
and Italy
Poland, Norway
and Spain
Banca Monte dei
Paschi, BNG and
La Banque Postale
Länförsäkringa,
Polska and
Bankinter

52021 EBA Stress Test Results | July 2021
Total Depletion Depletion by Country Capital Waterfall
9,0
15,0
0,0
3,0
1,0
5,0
2,0
4,0
12,0
13,0
6,0
14,0
16,0
7,0
8,0
11,0
10,0
ECB 2014
394 bps
304 bps
455bps390 bps
EBA 2014
with 2016
Perimeter
EBA 2016
320 bps
CET1 Ratio (%)
110 bps
EBA 2021EBA 1 ’10
120 bps
270 bps
EBA 2 ’11
281 bps
266 bps
296 bps
EBA 2014
380 bps
245 bps
320 bps
EBA 2018
485 bps
466 bps
5.5% Minimum
Capital
Flexibility
Capital
Shortfall
CET1 Post Stress
Minimum
Total Depletion
1. Stress Test Impacts2021 stress test impact shows much higher capital depletion compared to ST’18 (measured as 2020 CET1 to
adverse FL) (485bps vs. 394bps). Capital flexibility however presents better results (466bps vs. 455bps).

62021 EBA Stress Test Results | July 2021
1. Stress Test ImpactsCapital flexibility has improved as compared to ST’18 due to a higher CET1 starting point level. Only 1
bank fells below 5.5% (Banca Monte dei Paschi) and 5 banks ends with low levels of buffer
Zone 1
- No Buffer
-2
0
2
4
6
8
10
12
14
16
18
20
22
24
26
28
30
32
34
36
38
-2 0 2 4 6 8 10 12 14 16 18 20 22 24 26 28 30 32 34 36 38
2021 FL (%)
20
18
FL
(%)
Zone 2
- Low Buffer
Zone 3
- Ample Buffer
1 Bank
44 Banks
5 Banks
Total Depletion Depletion by Country Capital WaterfallTotal Depletion
• Overall, highest capital
depletion in stress test
history (CET1 decline of
485bps, 91bps higher than
in 2018).
• In addition, results show
much higher dispersion
among banks, from 80 bps
of Länförsäkringar Bank to
996 of Banca Monte dei
Paschi.
• Banca Monte dei Paschi
results in a no buffer zone
due to its capital depletion,
and 5 banks end the 2023
adverse CET1 witihin a low
buffer zone (Deutsche
Bank, Sabadell, Societe
Generale, HSBC France
and BPM)
Note: VWFS, BKT, OPO, HSBCF, MPS, MDB, NW & BCPSA assumes 2018 equal to 2021

72021 EBA Stress Test Results | July 2021
1. Stress Test ImpactsWorst capital depletion banks on fully loaded basis are Banca Monte dei Paschi, BNG and La Banque
Postale. Best capital depletion banks on fully loaded basis are Länförsäkringa, Polska and Bankinter.
Total Depletion Depletion by Country Capital WaterfallDepletion by Country/Bank
Fully
LoadedImpact Bps Qrt.
Fully
LoadedImpact Bps Qrt.
AT Erste Group Bank AG -401 -456 -55
AT Raiffeisen Bank International AG -462 -273 189
BE Belfius Banque SA -270 1st -296 -25
BE KBC Group NV -351 -236 1st 114
DE Bayerische Landesbank -590 -592 4th -2
DE Commerzbank AG -502 -341 162
DE Deutsche Bank AG -620 -576 4th 45
DE DZ BANK AG -489 -467 22
DE Landesbank Baden-Württemberg -643 4th -536 4th 107
DE Landesbank Hessen-Thüringen -585 -608 4th -23
DE Volkswagen Financial Services AG -262 1st - 262
DK Danske Bank -673 4th -532 4th 141
DK Jyske Bank -634 4th -432 202
DK Nykredit Realkredit -631 4th -484 4th 147
ES Banco Bilbao Vizcaya Argentaria S.A. -303 1st -193 1st 110
ES Banco de Sabadell S.A. -548 -446 103
ES Banco Santander S.A. -258 1st -141 1st 117
ES Bankinter, S.A. -104 1st - 104
FI Nordea Bank Abp -369 -265 104
FI OP Osuuskunta -619 - 619
FR BNP Paribas -440 -288 152
FR Groupe BPCE -580 -445 135
FR Groupe Crédit Agricole -634 4th -437 197
FR Group Crédit Mutuel -525 -405 120
FR La Banque Postale -916 4th -494 4th 422
Total G-SIBs Weighted Avg. -489 -390 99
Total EU Weighted Avg. -485 -394 91
Country Bank Name
EBA 2021 EBA 2018
Depletion Chg.
21 vs 18 (FL)
Stressed CET1 Depletion 2020-2023 Stressed CET1 Depletion 2017-2020

82021 EBA Stress Test Results | July 2021
1. Stress Test ImpactsWorst capital depletion banks on fully loaded basis are Banca Monte dei Paschi, BNG and La Banque
Postale. Best capital depletion banks on fully loaded basis are Länförsäkringa, Polska and Bankinter.
Total Depletion Depletion by Country Capital WaterfallDepletion by Country/Bank
Fully
LoadedImpact Bps Qrt.
Fully
LoadedImpact Bps Qrt.
FR Société Générale S.A. -562 -363 198
FR HSBC France -667 4th - 667
HU OTP Bank Nyrt. -303 1st -246 1st 57
IE Allied Irish Banks Group plc -677 4th -520 4th 157
IE Bank of Ireland Group plc -532 -468 4th 64
IT Banca Monte dei Paschi di Siena S.p.A. -996 4th - 996
IT Banco BPM S.p.A. -622 4th -453 169
IT Intesa Sanpaolo S.p.A. -466 -219 1st 248
IT UniCredit S.p.A. -592 -334 258
IT Mediobanca - Banca di Credito F. S.p.A. -478 - 478
NL ABN AMRO Group N.V. -418 -267 151
NL Coöperatieve Rabobank U.A. -679 4th -390 289
NL ING Groep N.V. -443 -381 62
NL N.V. Bank Nederlandse Gemeenten -989 4th -742 4th 246
NL Nederlandse Waterschapsbank N.V. -728 4th - 728
NO DNB Bank Group -252 1st -150 1st 102
PL Polska Kasa Opieki SA -98 1st -144 1st -46
PL Powszechna Kasa Oszczednosci Bank SA -120 1st -30 1st 90
PT Caixa Geral de Depósitos, SA -288 1st 810 1st -522
PT Banco Comercial Português, SA -406 - 406
SE Skandinaviska Enskilda Banken - group -357 -272 85
SE Svenska Handelsbanken - group -410 -307 103
SE Swedbank - group -217 1st -260 1st -43
SE Länförsäkringar Bank AB (publ) -80 1st - 80
SE SBAB Bank AB – group -108 1st - 108
Total G-SIBs Weighted Avg. -489 -390 99
Total EU Weighted Avg. -485 -394 91
Country Bank Name
EBA 2021 EBA 2018
Depletion Chg.
21 vs 18 (FL)
Stressed CET1 Depletion 2020-2023 Stressed CET1 Depletion 2017-2020

92021 EBA Stress Test Results | July 2021
1. Stress Test ImpactsWorst 3 capital depletion countries measured on fully loaded basis (measured as Adverse CET1 depletion
2020-2023) are Denmark, Ireland and Italy. Top 3 countries are Poland, Norway and Spain.
Total Depletion Depletion by Country Capital WaterfallDepletion by Country/Bank
Fully
LoadedImpact Bps Qrt.
Fully
LoadedImpact Bps Qrt.
AT Austria -428 -383 4th 45
BE Belgium -321 -257 64
DE Germany -558 4th -519 4th 38
DK Denmark -651 4th -502 4th 149
ES Spain -290 1st -189 1st 101
FI Finland -441 -326 116
FR France -555 -382 172
HU Hungary -303 -246 1st 57
IE Ireland -607 4th -497 4th 111
IT Italy -559 4th -304 255
NL Netherlands -533 -372 161
NO Norway -252 1st -150 1st 102
PL Poland -112 1st -73 1st 39
PT Portugal -353 - - -
SE Sweden -299 1st -279 20
G-SIBs Total G-SIBs Weighted Avg. -489 -390 99
EU Total EU Weighted Avg. -485 -394 91
Stressed CET1 Depletion 2020-2023 Stressed CET1 Depletion 2017-2020Country Bank Name
EBA 2021 EBA 2018
Depletion Chg. 21
vs 18 (FL)

102021 EBA Stress Test Results | July 2021
1. Stress Test ImpactsCET1 adverse depletion of 485bps (fully loaded) driven by loan losses (-420bps), Operating Profit (+140bps) and RWA
impacts (-120bps). Compared to ST18, higher impact driven mostly by Operating Profit and NTI.
• Positive impact is interpreted as beneficial, while a negative impact is considered detrimental to capital
Total Depletion Depletion by Country Capital WaterfallCapital Waterfall
EBA ST 2021 EBA ST 2018ST21-ST18
Var.
-101 bps
31 bps
-3 bps
28 bps
-29 bps
-74 bps
25 bps
43 bps
-4 bps
-11 bps
91 bps
15.0%
13.0%
10.2%
1.4%
0.0%
0.9%
4.9%
4.2%
0.5%
1.1%
1.2%
CET1R SP '20
Operating Profit
Loan Loss Impact
Net Trading Income
Other P&L Impact
CET1R after P&L Impact
Acc. OCI Impact
Other Capital Impact
RWA Impact
CET1R Adv. '23
CET1 3-Year Impact
14.0%
12.3%
10.1%
1.7%
0.2%
0.7%
3.9%
4.3%
0.3%
0.7%
1.3%

Section | Potential for Capital Distribution –
Dividends and Buybacks2

122021 EBA Stress Test Results | July 2021
2. Potential for Capital Distribution - Dividends and BuybacksNo incremental capital needs as capital actions pre-empted for banks (BMPS) falling below the 5.5% CET1
minimum threshold.
Scorecard Pillar 2 GuidanceCapital Flexibility
25
20
15
0
5
35
10
30
-5
40
45
50
HS
BC
F
MD
B
DB
K
SE
B
AIB
MP
S
BL
B
CO
PO
P
PB
P
CM
UT
DE
BK
SO
CG
BIR
E
BC
PS
A
CO
M
BN
PP
OP
O
LB
W
BP
CE
DZ
B
LH
TG
SA
N
BB
VA
ISP
SB
AB
RA
ZE
CO
OP
R
ER
ST
CA
ING
BK
T
OT
P
LB
P
JB
K
PL
K
SA
B
AB
N
BE
LF
CG
D
KB
C
UC
LB
AB
NO
RD
SH
AN
DN
B
NW
GE
M
SW
ED
NK
R
VW
FS
Max Capital Depletion
CET1 Adverse from Max Capital Depletion Year
5.5%

132021 EBA Stress Test Results | July 2021
2. Potential for Capital Distribution - Dividends and BuybacksWhen assessing a bank’s capital trajectory and its distribution plans, supervisors will take a forward-looking
view duly informed by the results of the 2021 stress test and new approach to calculate P2G.
Capital Flexibility Pillar 2 GuidancePillar 2 Guidance
www.bankingsupervision.europa.eu ©
Banks ranked by maximum CET1 capital depletion
1 2 3 4
Fixed set of thresholds
Bucket
1
Bucket
2
Bucket
3
Bucket
4P2G
starting
point
0%
From 2021 SREP: revised P2G methodology
9
New methodology in line with recent EBA draft guidelines on SREP
• Step 1: identification of the institution in a bucket according to the maximum CET1 depletion in the supervisory stress test exercise. Buckets
calibrated according to recent supervisory experience, SSM risk tolerance and severity of the stress test exercise.
• Step 2 JSTs expert judgement to adjust the P2G to the idiosyncratic profile of the institution. Adjustment within the ranges of the corresponding
bucket and exceptionally beyond the range of the relevant bucket, including for the last bucket.
Setting
the final
P2G
0%
JST adjustment
* Consultation Paper: Draft Guidelines on common procedures and
methodologies for the supervisory review and evaluation process (SREP) and
supervisory stress testing under Directive 2013/36/EU
Why: CRDV legislative changes + EBA Draft Guidelines on SREP(*)
Step 2:Step 1:
Enhancements: level playing field, consistency, no floors, no cliff effects (overlapping P2G ranges), institution-specific
adjustments, reasonable range of P2G outcomes including in cases of high capital depletion.
P2G calculated from maximum capital depletion observed in CET1 adverse stress test multiplied by 25% calibration factor rounded up to the next 25bps
Capital Depletion P2G Range
• Bucket 1 0 to 3% 0 to 100bps
• Bucket 2 3% to 6% 50 to 200bps
• Bucket 3 6% to 9% 100 to 275bps
• Bucket 4 + 9% From 175bps

142021 EBA Stress Test Results | July 2021
2. Potential for Capital Distribution - Dividends and BuybacksNew way of calculating P2G drives winners and losers in the dividend reset race.
Capital Flexibility Pillar 2 GuidancePillar 2 Guidance
Max Capital depletion = EBA Peak to Trough. Total Capital Requirements = SREP Requirements + P2G
P2G calculation based on A&M estimates, measured as maximum CET1 * 0.25 (estimated factor), and rounded up to next 25 bps
P2G (Bps)P2G Bucket
(%)CET 1 (%)
Total Capital
Requirement
(%)
Excess
Capital (%)Qrt.
Banca Monte dei Paschi di Siena S.p.A. 996 250 From 1.75% 9.86% 13.50% -3.64% 4th
N.V. Bank Nederlandse Gemeenten 989 250 From 1.75% 33.40% 12.75% 20.65% 1st
La Banque Postale 916 250 From 1.75% 20.40% 12.50% 7.90% 1st
Nederlandse Waterschapsbank N.V. 728 200 1% - 2.75% 45.10% 12.25% 32.85% 1st
Coöperatieve Rabobank U.A. 679 175 1% - 2.75% 16.81% 11.50% 5.31%
Allied Irish Banks Group plc 677 175 1% - 2.75% 15.56% 12.75% 2.81%
Danske Bank 673 175 1% - 2.75% 18.00% 14.32% 3.69%
HSBC France 667 175 1% - 2.75% 12.58% 12.75% -0.17% 4th
Nykredit Realkredit 647 175 1% - 2.75% 20.22% 12.70% 7.52% 1st
Landesbank Baden-Württemberg 643 175 1% - 2.75% 14.81% 11.50% 3.31%
Jyske Bank 634 175 1% - 2.75% 17.94% 13.40% 4.55%
Groupe Crédit Agricole 634 175 1% - 2.75% 16.94% 11.25% 5.69%
Banco BPM S.p.A. 622 175 1% - 2.75% 13.23% 12.00% 1.23% 4th
Deutsche Bank AG 620 175 1% - 2.75% 13.63% 12.25% 1.38% 4th
OP Osuuskunta 619 175 1% - 2.75% 18.87% 12.00% 6.87%
UniCredit S.p.A. 592 150 0.5% - 2% 15.14% 11.25% 3.89%
Bayerische Landesbank 590 150 0.5% - 2% 15.85% 11.50% 4.35%
Landesbank Hessen-Thüringen Girozentrale AdöR585 150 0.5% - 2% 14.41% 11.25% 3.16%
Groupe BPCE 580 150 0.5% - 2% 16.03% 11.25% 4.78%
Société Générale S.A. 562 150 0.5% - 2% 13.16% 11.25% 1.91% 4th
Banco de Sabadell S.A. 548 150 0.5% - 2% 12.02% 11.75% 0.27% 4th
Bank of Ireland Group plc 532 150 0.5% - 2% 13.37% 11.75% 1.62% 4th
Group Crédit Mutuel 525 150 0.5% - 2% 18.62% 11.25% 7.37% 1st
Commerzbank AG 502 150 0.5% - 2% 13.22% 11.50% 1.72% 4th
DZ BANK AG Deutsche Zentral-Genossenschaftsbank 489 125 0.5% - 2% 15.10% 11.00% 4.10%
Bank Name
Capital FlexibilityP2G Calculation
Maximum CET1
Depletion (Bps)

152021 EBA Stress Test Results | July 2021
2. Potential for Capital Distribution - Dividends and BuybacksNew way of calculating P2G drives winners and losers in the dividend reset race.
Capital Flexibility Pillar 2 GuidancePillar 2 Guidance
Max Capital depletion = EBA Peak to Trough. Total Capital Requirements = SREP Requirements + P2G
P2G calculation based on A&M estimates, measured as maximum CET1 * 0.25 (estimated factor), and rounded up to next 25 bps
P2G (Bps)P2G Bucket
(%)CET 1 (%)
Total Capital
Requirement
(%)
Excess
Capital (%)Qrt.
Mediobanca - Banca di Credito Finanziario S.p.A.478 125 0.5% - 2% 14.51% 10.50% 4.01%
Intesa Sanpaolo S.p.A. 466 125 0.5% - 2% 14.04% 10.75% 3.29%
Raiffeisen Bank International AG 462 125 0.5% - 2% 13.65% 11.50% 2.15% 4th
ING Groep N.V. 443 125 0.5% - 2% 15.41% 11.00% 4.41%
BNP Paribas 440 125 0.5% - 2% 12.61% 10.50% 2.11% 4th
ABN AMRO Group N.V. 418 125 0.5% - 2% 17.69% 11.25% 6.44%
Banco Comercial Português, SA 413 125 0.5% - 2% 12.20% 11.50% 0.70% 4th
Skandinaviska Enskilda Banken - group 411 125 0.5% - 2% 20.97% 11.58% 9.39% 1st
Svenska Handelsbanken - group 410 125 0.5% - 2% 20.26% 9.25% 11.01% 1st
Erste Group Bank AG 401 125 0.5% - 2% 14.20% 11.00% 3.20%
Nordea Bank - group 369 100 0.5% - 2% 17.08% 10.75% 6.33%
KBC Group NV 362 100 0.5% - 2% 17.58% 10.75% 6.83%
Banco Santander S.A. 324 100 0.5% - 2% 11.89% 10.50% 1.39% 4th
OTP Bank Nyrt. 303 100 0.5% - 2% 14.24% 10.38% 3.86%
Banco Bilbao Vizcaya Argentaria S.A. 303 100 0.5% - 2% 11.72% 10.50% 1.22% 4th
Caixa Geral de Depósitos, SA 300 75 0% - 1% 18.22% 11.00% 7.22% 1st
DNB Bank Group 294 75 0% - 1% 19.60% 10.75% 8.85% 1st
Belfius Banque SA 270 75 0% - 1% 16.36% 10.75% 5.61%
Volkswagen Financial Services AG 262 75 0% - 1% 18.10% 10.75% 7.35% 1st
Swedbank - group 257 75 0% - 1% 17.50% 10.74% 6.76%
Powszechna Kasa Oszczednosci Bank Polski SA143 50 0% - 1% 16.39% 8.50% 7.89% 1st
SBAB Bank AB – group 140 50 0% - 1% 13.43% 10.23% 3.20%
Länförsäkringar Bank AB (publ) 126 50 0% - 1% 16.70% 8.50% 8.20% 1st
Bankinter, S.A. 122 50 0% - 1% 12.29% 9.70% 2.59%
Polska Kasa Opieki SA 121 50 0% - 1% 16.39% 8.51% 7.88% 1st
Bank Name
P2G Calculation Capital Flexibility
Maximum CET1
Depletion (Bps)

162021 EBA Stress Test Results | July 2021
2. Potential for Capital Distribution - Dividends and BuybacksNew P2G calculations will drive dividend / stock buyback decisions going forward.
Capital Flexibility Pillar 2 GuidancePillar 2 Guidance
-4 -3 -2 -1 0 1 2 3 4 5 6 7 8 9 10 11 12
0,2
2,2
1,0
2,6
1,6
1,2
0,4
2,4
2,0
1,4
0,0
0,8
1,8
0,6
OPO
BKT
Excess Capital (%)
DBK
CA
SAB
SOCG
PLK
BPCE
NKR
Imp
lie
d P
2G
(%
)
UC
ERST
LBW
RAZE
BBVA
NORD
BELF
KBC
BLB
DZBCOM
DEBK
LHTG
VWFS
AIB
JBK
MPS
SEB
SAN
CMUT
LBP
HSBCF
BNPP
OTP
BIRE
COPOP
ISP MDBABN
COOPR
LBAB
DNB
PBP
CGD
BCPSA SHAN
SWED
SBAB
ING
High Capital
Resilience – Low
Capital Flexibility
High Capital
Resilience –
High Capital
Flexibility
Low Capital
Resilience – Low
Capital Flexibility
Low Capital
Resilience –
High Capital
Flexibility
Max Capital depletion = EBA Peak to Trough. Total Capital Requirements = SREP Requirements + P2G
P2G calculation based on A&M estimates, measured as maximum CET1 * 0.25 (estimated factor), and rounded up to next 25 bps
Graphs divisions in banks distribution median
GEM & NW left out for visual purposes

Section | Stress Tests Going Forward3

182021 EBA Stress Test Results | July 2021
Banks should prepare now. Climate risk is here to stay and should be taken as a strategic priority
Three Modules Key Elements
ECB CR
ST 2022
Questionnaire
▪ Goal: qualitative assessment of climate risk stress testing framework with 77 questions
▪ 11 areas including general use, governance and RAF, integration with strategy, methodology,
scenarios, data, ICAAP, future plans, internal audit, parent company and bottom-up projections
Climate Metrics
Benchmarking
▪ Goal: benchmark banks’ income reliance to transition risk sectors and financed GHG emissions
▪ Metric 1: Gross Interest and Fee Income from NFCs to cover 80% of income / max 5 countries
▪ Metric 2: Scope 1, 2 & 3 Emissions, Revenue and Loans for top 20 per sector non-SME corporates
Bottom up
Stress Test
▪ Bottom-up stress test projections for subset of banks under transition and physical risk scenarios
▪ 5 individual tests with different scope, metrics and horizons: 2 transition risk tests (one short term
covering credit and market and one long term covering credit) 2 physical risk tests (one Drought &
heat and one flood) and 1 operational & reputation risk test
Priority Actions
Areas for
response
Data HIGH ▪ Big challenge to capture GHG scope 3 data for Corporates and EPC / NUTS
3 data for Mortgages & CRE. Some data gaps for NACE 2 breakdowns.
Models HIGH ▪ Development of Transition Risk, Physical Risk and Operational Risk Models.
▪ Introduce dynamic projections over 30 year horizon for Transition Risk
Scenario LOW ▪ Scenario guidance provided with some needs for scenario extension
Other
Climate Risk Framework
MEDIUM
▪ Need to develop and formalize climate risk framework, policy and procedures
Documentation ▪ Need to develop comprehensive explanatory note for modules 1, 2 and 3
Industry Collaboration ▪ Explore industry collaboration for sharing of methods and data (e.g., Scope 3)
New ECB’s Climate Risk Stress Test will arrive in 2022
CR ST 2022 will test bank capabilities to evaluate climate risk in three modules, which will require major
banks’ preparation

192021 EBA Stress Test Results | July 2021
New ECB’s Climate Risk Stress Test will arrive in 2022
Workstreams by Module and Template
Modules Template Data Models Scenarios Other
Questionnaire M1 Questionnaire
Climate Metrics
Benchmarking
Metric 1 M2 Metric 1
Metric 2 M2 Metric 2
Bottom up
Stress Test
Test 1
M3 TR ST CR
M3 TR ST MR
Test 2
M3 TR LT OD CR
M3 TR LT DO CR
M3 TR LT HH CR
Test 3 M3 PR DH CR
Test 4 M3 PR FL CR
Test 5
M3 OR
M3 RR
Climate
Risk
Framework
Scope
3 Data
Global Gross Income & Exposure
Corp+SMEs per NACE 2
Top 20 Corp GHG S1, S2 & S3
Emissions, Exposure & Income Data
Transition Risk Static Credit – 3 yr
Physical Risk 1 yr - Flood
Physical Risk 1yr – Drought & Heat
Transition Risk Dynamic – 30yr
3 yr Projection OR Models
Exp
lan
ato
ry N
ote
& S
up
po
rtin
g D
ocu
men
tati
on
Global Corporate+SME by NACE 2
Global Mortgage+CRE by EPC
Global HFT Bond+Equity
EU Corporate+SME by NACE 2
EU Mortgage+CRE by NUTS 3
Conduct OR 5yr history
Physical OR 5yr history
Reputational 5yr history Top 6 case studies
Transition Risk Market – 3 yr
Baseline
Disorderly
Baseline
Disorderly
Global Corporate+SME by NACE 2
Global Mortgage+CRE by EPC
Orderly
Disorderly
Hot House
Baseline
Stress
Baseline
Stress
Ind
ustr
y W
ork
ing
Gro
up
/ B
en
ch
mark
ing

202021 EBA Stress Test Results | July 2021
Data
▪ Availability of income data for Corporate and SME segments per NACE (sectorial classification)
▪ Availability of Scope 1, 2 and 3 emission data for all Corporates, at a counterparty level
▪ Access to Energy Performance Certificate (EPC) data across countries
▪ Project balance-sheet strategies, in line with banks’ internal climate strategy (portfolio alignment)
▪ Availability to data on insurance companies and public natural disaster relief schemes
▪ Availability of historical data for operational and reputational events related to climate and split between conduct and physical risks
Modelling
▪ Develop credit risk models or approaches:
▪ Credit Stress Test models by Industry and by EPC classification
▪ Transition risk models
▪ Physical risk models
▪ Balance sheet projection models by region, asset class, EPC and industry
▪ Assess impacts (losses and recoveries) of new and known operational risk events related to climate
▪ Identify channel through which historical reputational event have the greatest impact on their income
Others
▪ Questionnaire: As-Is vs. To-be on submission date
▪ Documentation: develop explanatory note draft that includes details on calculation approaches for modules 2 & 3
New ECB’s Climate Risk Stress Test will arrive in 2022
ECB’s Climate Risk ST2022 – Deep Dive on Key Challenges

212021 EBA Stress Test Results | July 2021
UK Europe
Scope• Participants: 7 banks and 11 insurance companies
• Transition and Physical risk with a focus on Credit Risk
(market risk and operational risk not considered)
• Participants: ECB supervised banks with no bottom-up
stress test for a smaller set of banks
• Transition and Physical risk with a focus on Credit Risk,
Market risk for trading bond and equity positions (transition
risk short term) and operational & reputational risks
Qualitative
Evaluation
• 6 assessment areas (in 78 questions for banks)
including ST results and narrative, management
responses, qualitative view of climate risks, climate risk
management framework, action plans for improvements
and quantitative methodologies used
• 11 assessment areas (in 77 questions) including general
use, governance and RAF, integration with strategy,
methodology, scenarios, data, ICAAP, future plans, internal
audit, parent company and bottom-up projections
• Explanatory note covering results narrative and
assumptions
Emission
and Income
Data
• Not in scope of exercise justified by low maturity of
climate emission metrics available
• In scope with two metrics: Metric 1 (Gross Interest and Fee
Income from NFCs to cover 80% of income / max 5
countries); Metric 2 (Scope 1, 2 & 3 Emissions, Revenue
and Loans for top 20 per sector non-SME corporates)
• Counterparty treatment Metric 2: at least 440 clients
Transition
Risk
• 30-year horizon with projections every 5 years
Scope: All asset classes including mortgages,
consumer, corporate, CRE and SMEs, government
• Risk types: only credit risk
• Counterparty treatment: at least top 100 clients
• NGFS scenarios
• Short term exercise (3 years) and long-term exercise (30-
year horizon with projections every 10 years)
• Scope: Asset classes included are mortgages, corporate,
CRE and SMEs (consumer or government not included)
• Risk types: Credit risk and market risk for trading book
• NGFS scenarios
Physical Risk• Event types: Drought & heat, flood, severe weather,
sea level rise, tropical storm and wildfire events
• Horizon: 30 years
• Event types: Drought & heat and flood events
• Horizon: 1 years
Operational
Risks• Not in scope
• Operational (conduct and physical events) and
reputational risks included in scope
1
2
3
5
4
6
New ECB’s Climate Risk Stress Test will arrive in 2022
Comparing PRA CBES 2021 with ECB CR ST 2022 we can conclude that ECB’s test is more ambitious
222021 EBA Stress Test Results | July 2021
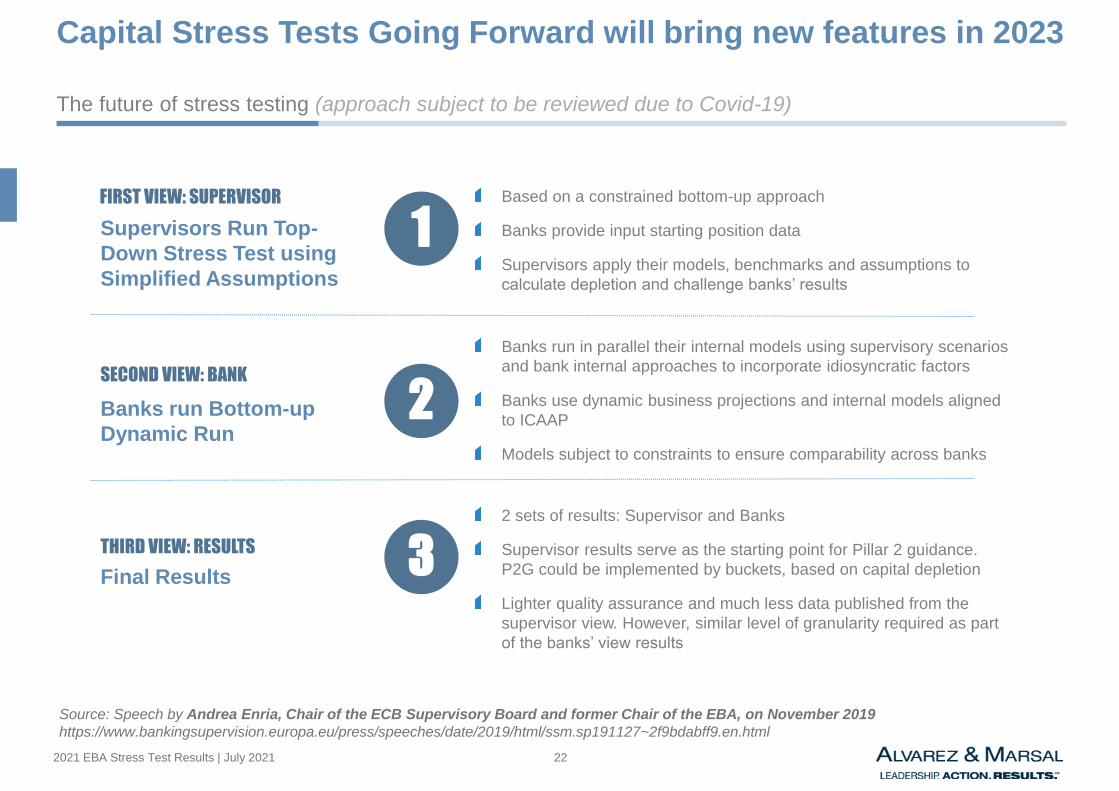
Capital Stress Tests Going Forward will bring new features in 2023
The future of stress testing (approach subject to be reviewed due to Covid-19)
Banks run Bottom-up
Dynamic Run
Final Results
Supervisors Run Top-
Down Stress Test using
Simplified Assumptions
1
2
3
FIRST VIEW: SUPERVISOR
SECOND VIEW: BANK
THIRD VIEW: RESULTS
Based on a constrained bottom-up approach
Banks provide input starting position data
Supervisors apply their models, benchmarks and assumptions to
calculate depletion and challenge banks’ results
Banks run in parallel their internal models using supervisory scenarios
and bank internal approaches to incorporate idiosyncratic factors
Banks use dynamic business projections and internal models aligned
to ICAAP
Models subject to constraints to ensure comparability across banks
2 sets of results: Supervisor and Banks
Supervisor results serve as the starting point for Pillar 2 guidance.
P2G could be implemented by buckets, based on capital depletion
Lighter quality assurance and much less data published from the
supervisor view. However, similar level of granularity required as part
of the banks’ view results
Source: Speech by Andrea Enria, Chair of the ECB Supervisory Board and former Chair of the EBA, on November 2019
https://www.bankingsupervision.europa.eu/press/speeches/date/2019/html/ssm.sp191127~2f9bdabff9.en.html

Appendix 1
Scenarios Used

242021 EBA Stress Test Results | July 2021
ST 2021 ST 2020 ST 2021 ST 2020 ST 2021 ST 2020
France -343 -357 -15 413 243 +170 -1536 -1457 +78
Germany -388 -500 -112 421 279 +142 -1849 -1510 +339
Greece -357 -600 -243 560 314 +246 -987 -580 +407
Ireland -302 -568 -266 431 536 -105 -1323 -1350 -27
Italy -388 -369 +19 541 285 +255 -652 -902 -250
Netherlands -427 -348 +79 596 424 +172 -1851 -2244 -393
Portugal -445 -530 -84 415 257 +158 -2543 -1602 +941
Spain -323 -377 -54 612 370 +242 -1697 -1186 +512
Sweden -444 -644 -201 563 630 -67 -2756 -3185 -429
European Union -356 -429 -72 474 377 +98 -1611 -1636 -25
GDP (Net shock)1
Difference
(bps)
Difference
(bps)
Unemployment (Net shock)1
House Price Index (Net shock)1
Difference
(bps)
SUMMARY OF SCENARIOS - MACRO EU COUNTRIES
Mixed ST’21 scenario impacts vs. ST’20: much more severe scenarios for unemployment rate in most regions and less severe shocks for GDP,
except for Netherlands and Italy. House Price Index shows much more severe impacts for some countries (e.g., Portugal or Spain), but less
adverse for other jurisdictions.
Southern countries (Spain, Portugal, Italy and Greece) present overall the worst scenarios compared to ST’20, whereas Ireland and Sweden
show much benign ones compared to the previous exercise.
Note: (1) Net shocks reflect the total adverse effect to the macroeconomic indicator from 2020 levels (3-year shock), measured as bps

252021 EBA Stress Test Results | July 2021
ST 2021 ST 2020 ST 2021 ST 2020
United Kingdom 0.0 0.0 +0.0 2.6 3.3 -0.7 -2.6
United States 0.0 0.0 +0.0 3.7 8.5 -4.8 -3.7
Turkey 27.1 24.0 +3.1 37.2 68.7 -31.6 -10.1
Norway 0.0 0.0 +0.0 3.4 5.4 -2.0 -3.4
Brazil 27.1 24.0 +3.1 24.0 27.0 -3.0 +3.1
Mexico 27.1 24.0 +3.1 19.5 27.9 -8.4 +7.6
Chile 27.1 24.0 +3.1 4.1 7.8 -3.7 +23.0
ST 2021
Interest Rate
DisparityFX (Net shock)
1 Interest Rates Spread
(implicit FX depreciation)2
Difference (pp) Difference (pp)
ST 2021 ST 2020 ST 2021 ST 2020 ST 2021 ST 2020
United Kingdom -414 -454 -40 351 413 -62 -2328 -2443 -116
United States -373 -484 -111 94 412 -317 -2328 -1878 +449
Turkey -359 -589 -229 202 501 -299 -2328 -1878 +449
Norway -326 -258 +68 215 265 -50 -2729 -2516 +213
LATAM -503 -506 -3 187 458 -271 n.a. n.a. n.a.
Brazil -457 -373 +85 246 449 -203 -2328 -1878 +449
Mexico -455 -358 +97 250 378 -127 -2328 -1878 +449
Chile -455 -424 +31 93 386 -293 -2328 -1878 +449
Difference
(bps)
Unemployment (Net shock)1
House Price Index (Net shock)1
GDP (Net shock)1
Difference
(bps)
Difference
(bps)
SUMMARY OF SCENARIOS - MACRO NON-EU COUNTRIES
Mixed ST’21 scenario impacts vs. ST’20 also for non-EU countries: much more severe scenarios for House Price Index and much lower shock
for Unemployment Rate.
Emerging market economies display materially higher shocks in GDP vs. ST’20, in contrast of UK, US and Turkey.
Emerging countries’ FX show is higher that in ST’20 (27.1% vs. 24%), and depreciation assumed for the USD, GBP or NOK.
Turkey, US, UK and Norway FX shock significantly lower to the implied, whereas LATAM presents the opposite sign.
Note: (1) Net shocks reflect the total adverse effect to the macroeconomic indicator from 2020 levels (3-year shock), measured as bps

Appendix 2
List of Banks in EBA 2021 ST

272021 EBA Stress Test Results | July 2021
List of Banks in EBA 2021 STName of Banks and their respective country
ERST AT Erste Group Bank AG
RAZE AT Raiffeisen Bank International AG
BELF BE Belfius Banque SA
KBC BE KBC Group NV
BLB DE Bayerische Landesbank
COM DE Commerzbank AG
DEBK DE Deutsche Bank AG
DZB DE DZ BANK AG
LBW DE Landesbank Baden-Württemberg
LHTG DE Landesbank Hessen-Thüringen
VWFS DE Volkswagen Financial Services AG
DBK DK Danske Bank
JBK DK Jyske Bank
NKR DK Nykredit Realkredit
BBVA ES Banco Bilbao Vizcaya Argentaria S.A.
SAB ES Banco de Sabadell S.A.
SAN ES Banco Santander S.A.
BKT ES Bankinter, S.A.
NORD FI Nordea Bank Abp
OPO FI OP Osuuskunta
BNPP FR BNP Paribas
BPCE FR Groupe BPCE
CA FR Groupe Crédit Agricole
CMUT FR Group Crédit Mutuel
LBP FR La Banque Postale
Code Country Bank Name
SOCG FR Société Générale S.A.
HSBCF FR HSBC France
OTP HU OTP Bank Nyrt.
AIB IE Allied Irish Banks Group plc
BIRE IE Bank of Ireland Group plc
MPS IT Banca Monte dei Paschi di Siena S.p.A.
COPOP IT Banco BPM S.p.A.
ISP IT Intesa Sanpaolo S.p.A.
UC IT UniCredit S.p.A.
MDB IT Mediobanca - Banca di Credito F. S.p.A.
ABN NL ABN AMRO Group N.V.
COOPR NL Coöperatieve Rabobank U.A.
ING NL ING Groep N.V.
GEM NL N.V. Bank Nederlandse Gemeenten
NW NL Nederlandse Waterschapsbank N.V.
DNB NO DNB Bank Group
PLK PL Polska Kasa Opieki SA
PBP PL Powszechna Kasa Oszczednosci Bank SA
CGD PT Caixa Geral de Depósitos, SA
BCPSA PT Banco Comercial Português, SA
SEB SE Skandinaviska Enskilda Banken - group
SHAN SE Svenska Handelsbanken - group
SWED SE Swedbank - group
LBAB SE Länförsäkringar Bank AB (publ)
SBAB SE SBAB Bank AB – group
Code Country Bank Name

Appendix 2
A&M Authors

292021 EBA Stress Test Results | July 2021
European Financial Services Risk &
Regulatory Lead and expert in stress
testing for US and European Banks
Responsible for A&M Spain and Portugal
and coleader of the financial services
practice in Europe
More than 25 years of experience in bank
consulting, in the US and Europe
Expert in risk management, stress testing,
capital and governance
Clients include global financial services
firms, investment bank, regional banks,
insurance companies, asset managers
and hedge funds
Fernando de la Mora
Head of Financial Services
Over 13 years of experience in financial
consulting and banking in the US, Spain
and the UK
Led several risk and capital
management projects for major
European banks
Expert in stress testing, credit risk
modeling, capital management and
regulation
Experienced in credit Due Diligence for
European financial institutions
Former Banco Santander and Bankinter
Rocio Falcones
Senior Director
4 years of experience in banking
analysis
Ms. Cilio’ primary areas of concentration
are risk and regulatory advisory.
Participated in several projects
regarding the financial impact of
COVID-19 and Climate Change in the
Spanish Banking Sector.
Collaborated in projects related to EBA
stress testing.
Ivonne Cilio
Analyst
7 years of experience in regulation and banking prudential supervision.
Primary areas of concentration are capital management, risk analysis and regulatory advisory.
He spent three years within the Banking
Supervision Unit of the Malta Financial
Services Authority (MFSA).
His main responsibilities included risk
assessments, evaluation of Internal
Capital Adequacy Assessment Process
(ICAAP), Supervisory Review and
Evaluation Process (SREP).
Roi Barreira
Associate
A&M Authors

© Copyright 2021
“The information contained in this document is of a general nature and has been obtained from publicly available information plus market
insights. The information is not intended to address the specific circumstances of an individual or institution. There is no guarantee that
the information is accurate at the date received by the recipient or that it will be accurate in the future. All parties should seek appropriate
professional advice to analyze their particular situation before acting on any of the information contained herein.”
Alvarez & Marsal
Companies, investors and government entities around the world turn to Alvarez & Marsal (A&M) when conventional approaches are not
enough to activate change. Privately-held since 1983, A&M is a leading global professional services firm that delivers business
performance improvement, turnaround management and advisory services to organizations seeking to transform operations, catapult
growth and accelerate results through decisive action. Our senior professionals are experienced operators, world-class consultants and
industry veterans who leverage the firm's restructuring heritage to help leaders turn change into a strategic business asset, manage risk
and unlock value at every stage