Embed Size (px)
Citation preview

Aberdeen Select PortfolioAnnual Report and Financial Statements 1 October 2016 to 30 September 2017
Contents
Review for the year ended 30 September 2017
Aberdeen American Opportunities Fund 1Aberdeen Asian Smaller Companies Fund 2Aberdeen China Opportunities Fund 3Aberdeen European Opportunities Fund 4Aberdeen Global Emerging Markets Fund 5Aberdeen Global Opportunities Fund 6Aberdeen Global Technology Fund 7Aberdeen India Opportunities Fund 8Aberdeen Indonesia Equity Fund 9Aberdeen Japan Equity Fund 10Aberdeen Malaysian Equity Fund 11Aberdeen Pacific Equity Fund 12Aberdeen Singapore Equity Fund 14Aberdeen Thailand Equity Fund 15
Report to Unitholders for the year ended 30 September 2017
Aberdeen American Opportunities Fund 17Aberdeen Asian Smaller Companies Fund 20Aberdeen China Opportunities Fund 23Aberdeen European Opportunities Fund 26Aberdeen Global Emerging Markets Fund 29Aberdeen Global Opportunities Fund 32Aberdeen Global Technology Fund 35Aberdeen India Opportunities Fund 37Aberdeen Indonesia Equity Fund 40Aberdeen Japan Equity Fund 42Aberdeen Malaysian Equity Fund 44Aberdeen Pacific Equity Fund 46Aberdeen Singapore Equity Fund 49Aberdeen Thailand Equity Fund 51
Financial Statements for the year ended 30 September 2017
Statements of Total Return for the year ended 30 September 2017 59Statements of Financial Position as at 30 September 2017 64Statements of Movements of Unitholders’ Funds for the year ended 30 September 2017 67Statements of Portfolio as at 30 September 2017 72Notes to the Financial Statements for the year ended 30 September 2017 96
1Source: Aberdeen Asset Management Asia Limited The performance returns are sourced from Lipper, based on percentage growth, calculated on a NAV-to-NAV basis with gross income reinvested.
Aberdeen American Opportunities FundAnnual report to 30 September 2017
Performance reviewThe Aberdeen American Opportunities Fund rose by 16.00% in Singapore dollar terms for the year under review, underperforming the benchmark MSCI North America Index’s total return of 17.84%.
Market reviewNorth American equities recorded significant gains for the 12-month period ended 30 September 2017, amid investors’ optimism regarding generally favourable economic data and corporate earnings reports. This offset numerous periods of uncertainty surrounding the policies of President Donald Trump’s administration. Oil prices rose on expectations that OPEC will continue trimming production, as well as the growing tension between Iraqi and Kurdish forces in the oil-rich city of Kirkuk. The US dollar appreciated after the Federal Reserve (Fed) said it would begin unwinding its balance sheet in October, but pared its gains towards the period-end.
Among notable news over the first eight months of the new presidential administration, Trump and the Republican party majority in the US Congress failed to agree on two separate proposals to “repeal and replace” the Affordable Care Act (dubbed “Obamacare”) in June and September 2017. On the monetary policy front, the Fed increased the federal funds rate to a range of 1.00% to 1.25% in three increments of 25 basis points in December 2016, and March and June 2017. GDP growth rates varied from 1.2% to 3.5%, bolstered largely by continued strength in consumer spending. Meanwhile, the labour market remains solid with unemployment rate falling to a 16-year low of 4.2%, despite a weak reading in September due to disruptions caused by Hurricanes Harvey and Irma.
Portfolio ReviewFund performance for the review period was bolstered primarily by stock selection in the consumer discretionary and healthcare sectors, as well as an overweight to financials. The largest contributors were diversified financial services company M&T Bank Corp, specialty auto-components manufacturer BorgWarner, and IT services provider Cognizant Technology Solutions. Shares of M&T Bank were buoyed by rising interest rates and hopes for deregulation and tax reform under the Trump administration. Furthermore, the company benefited from healthy loan growth and higher fee income. BorgWarner benefited from strength in both its engine and drive-train segments, as well as higher operating margins. Management also raised its earnings forecast for the 2017 fiscal year. Cognizant Technology Solutions posted healthy revenue growth, attributable mainly to an increase in demand for digital solutions in the consulting and technology services business.
Conversely, an overweight allocation to consumer staples and an underweight to information technology weighed on fund performance. The most notable individual stock detractors included credit-reporting services provider Equifax and retail convenience-store chain operator Casey’s General Stores, as well as the lack of exposure to Apple. Shares of Equifax declined sharply towards the end of the review period after the company disclosed a data breach that affected more than 145 million US consumers between mid-May and late July of this year. Casey’s General Stores’ quarterly results were hindered by reduced customer traffic, which led to relatively slower same-store sales growth in the company’s grocery and prepared foods and fountain units. While we acknowledge Apple's innovations, we historically have had issues with the lack of visibility into its business and its high dependence on a single product. We also have questioned the sustainability of the company’s revenue growth and margin profile over longer periods.
2Source: Aberdeen Asset Management Asia Limited The performance returns are sourced from Lipper, based on percentage growth, calculated on a NAV-to-NAV basis with gross income reinvested.
Aberdeen Asian Smaller Companies FundAnnual report to 30 September 2017
Performance reviewThe Aberdeen Asian Smaller Companies Fund rose by 11.06% in Singapore dollar terms for the year under review, slightly underperforming the benchmark MSCI AC Asia Pacific ex-Japan Small Cap Index’s total return of 11.77%.
Market reviewStocks of smaller companies in Asia rose during the year, rebounding from an early lull in the wake of Donald Trump’s unexpected US election victory. Indian equities chalked up a multi-month rally, as investors were encouraged by Prime Minister Narendra Modi’s political reforms. Chinese equities rallied on positive corporate earnings and surprisingly robust economic. Conversely, Indonesian stocks were moribund, while South Korea’s markets were under pressure from escalating geopolitical tensions on its doorstep.
Portfolio ReviewThe fund benefited the most from its positioning in South Korea, where the underweight exposure and stock selection shielded it from the full effects of an equities slump. Stock selection in Singapore also lifted performance.
Several holdings saw their share prices rise on news of potential takeovers. Top contributor Yingde Gases was one of them, after it emerged that it was a takeover target. We divested our holdings in the Chinese industrial gas company at HK$6 a share. MP Evans, a UK-listed oil-palm company with a focus on Indonesia and Malaysia, also faced an unsolicited takeover attempt. It successfully fought off the bid, which had undervalued its plantations portfolio. Singaporean developer Bukit Sembawang Estates was subject to speculation that it was a possible target, given its valuable and highly sought-after land bank. It also enjoyed a re-rating after a slight relaxation of government measures buoyed real-estate stocks.
Other key contributors included Singapore’s Venture Corp, which reported stellar earnings results, underpinned by broad-based growth and decent year-on-year growth in net profits; and Hong Kong’s Pacific Basin Shipping, which saw a recovery in freight rates amid a rosier operating backdrop.
In contrast, gains were capped by our overweight position in Indonesia, as the market there softened on poor economic performance. Chocolate company Delfi, one of the key detractors, suffered as investors worried about its pallid sales in its domestic market, despite owning well-established brands and experience in bringing products to market.
Stock selection in Malaysia also detracted, with retailer Aeon Co being the portfolio’s top detractor. Investors were disappointed by its results which were hit by weak consumer sentiment.
Elsewhere, Singapore’s Raffles Medical saw softer-than-expected demand from foreign patients, while staff costs rose. Muted results hurt China’s Tong Ren Tang Technologies as a couple of its blockbuster medical products faced competition from cheaper alternatives.
During the year in review, we introduced several companies. They are: Australian healthcare operator Healthscope, for its good growth outlook in view of demographic changes; luggage maker Samsonite, which has clear growth prospects in the emerging markets, particularly Asia; Taiwan FamilyMart, the island’s second-largest convenience store operator; Australia’s health supplements company Blackmores, given its robust balance sheet; and Beijing Capital International Airport, an airport operator in China’s capital that can benefit from structural trends in tourism, trade, and government initiatives. We also introduced Korea’s furniture-maker Hanssem, Chinese blood plasma and derivatives firm China Biologics, and Pakistan’s cement manufacturer Maple Leaf, as they showed solid fundamentals and the ability to tap into growing markets. We also participated in the initial public offer of Shell Philippines, as its wide distribution network, technical backing from its parent, and the country’s favourable demographics give it good growth trajectory.
Against this, we sold India’s Tata Consultancy Services (TCS), a large-cap stock that we inherited via a share swap when TCS acquired CMC, an Indian small-cap IT services company. We exited Hong Kong’s Dah Sing Banking on valuation grounds, and also Korea’s BNK Financial and Manila Water in the Philippines because of uncertainties they face.
3Source: Aberdeen Asset Management Asia Limited The performance returns are sourced from Lipper, based on percentage growth, calculated on a NAV-to-NAV basis with gross income reinvested.
Aberdeen China Opportunities FundAnnual report to 30 September 2017
Performance reviewThe Aberdeen China Opportunities Fund rose by 18.60% in Singapore dollar terms for the year under review, underperforming the benchmark MSCI Zhong Hua Index’s total return of 28.03%.
Market Review Equities in China and Hong Kong were buoyant over the review period. Despite early concerns over capital outflows, increased regulatory scrutiny and government curbs on leverage, Chinese equities recovered quickly amid upbeat corporate earnings and growth data, while worries over capital flight receded. MSCI’s decision to include A-shares to its influential indices and a continued rise in Chinese internet stocks further propelled the mainland market.
In Hong Kong, sustained inflows from China and encouraging domestic economic data drove the market higher. Gains, however, were pared towards the period-end as the decline in shares of property developers and renewed concerns over capital outflows hampered the market. Property shares dipped after eight major Chinese cities announced additional cooling measures to curb rising house prices, while worries about capital flight from Hong Kong resurfaced on the back of a stronger US dollar and the prospect of further rate hikes in the US.
Portfolio ReviewThe fund delivered healthy returns over the year, although it lagged the benchmark. Broadly, our buy-and-hold style was hurt by sector rotation and momentum trading, both of which were evident in markets over the period under review.
Information technology (IT) was a key detractor from performance. The sector rallied, driven by the sustained rise in domestic internet giants, notably Alibaba and Tencent; momentum trading and solid results boosted their share prices. Hence, not holding Alibaba and our light exposure to Tencent hurt performance. We introduced a small position in Tencent in May. This reflects our growing conviction in, and comfort with, its business, corporate structure and governance. We think that valuations reflect its high-quality growth potential. Tencent has succeeded in diversifying its presence in the Chinese internet space, creating a powerful eco-system that leverages on the network effects of its various offerings while at the same time navigating the migration of gaming from PC to mobile. This combination of a growing ecosystem and a growing monetisation of the user base will drive earnings growth. We’re more circumspect when it comes to Alibaba. While Alibaba has a strong competitive moat and impressive business model, we see potential downside risks from poor corporate governance.
In other technology sub-sector, our holdings in both video-surveillance supplier Hangzhou Hikvision and semiconductor-equipment supplier ASM Pacific did well: Hikvision gained from solid growth in both its domestic and overseas operations; it is also branching out from its traditional video surveillance business. ASM Pacific posted solid numbers that were driven by several factors, including increased output, ongoing cost reduction efforts and a favourable product mix.
In healthcare, downbeat results hurt holding Tong Ren Tang Technologies (TRT) as a couple of its blockbuster products faced competition from cheaper alternatives. That said, TRT is a well-known company in the mainland. We believe its established brand is still able to differentiate it from other less trusted competitors in China.
Conversely, our financial holdings in HSBC, China Merchants Bank (CMB) and China Construction Bank (CCB) did well on the back of good results. The Chinese lenders, in general, saw a fall in provisions while asset quality and net interest margins stabilised. HSBC benefited from expectations that higher interest rates would push up margins. It also reported robust interim results and is returning more cash to shareholders via a new US$2 billion share buyback, adding to more than US$3 billion already pledged over the past year.
In significant portfolio activity, we introduced five new stocks: Tencent (mentioned earlier); blood plasma products company China Biologic Products; China Construction Bank; automotive-parts supplier Nexteer; and Chinese travel information provider Travelsky Technology. China Biologic stands to benefit from structural growth in domestic demand for blood plasma products. We like the company’s direct sales model and initiated at a reasonable valuation. We introduced CCB to the portfolio, as we believe it to be one of the better managed state-owned lenders, and is well positioned amid the government’s deleveraging campaign. Nexteer is a beneficiary of the industry’s move from hydraulic to electrical power steering, and has a growing business in Asia. Its financials are robust, while management is sensible and has a good track record. Travelsky enjoys a domestic monopoly in airline-ticket distribution and is a proxy to the mainland’s growing tourism market fuelled by rising affluence.
Against these, we tidied our small positions in Texwinca and Hongkong & Shanghai Hotels on deteriorating prospects.
4Source: Aberdeen Asset Management Asia Limited The performance returns are sourced from Lipper, based on percentage growth, calculated on a NAV-to-NAV basis with gross income reinvested.
Aberdeen European Opportunities FundAnnual report to 30 September 2017
Performance reviewThe Aberdeen European Opportunities Fund rose by 17.61% in Singapore dollar terms for the year under review, underperforming the benchmark FTSE World - Europe Index’s total return of 22.65%.
Market reviewEuropean equities rose in the year under review. At the start of the period, investors were spooked by the sell-off in Chinese equities and the continued fall in the oil price. Sentiment was also dampened in the wake of the UK’s shock decision to leave the European Union and by worries over the health of the global economy. But the market recovered subsequently on the back of a rosier global economic backdrop, a resilient Eurozone economy and a rebound in the oil price. Second-quarter Eurozone GDP accelerated at its fastest in six years, underpinned by a boom across regional labour markets, with ratings agency Moody’s anticipating above-trend growth both this year and the next. Sentiment was also supported by the US Federal Reserve’s well-telegraphed interest-rate normalisation and its measured approach to interest rate hikes, as well as the European Central Bank’s accommodative policy stance. However, the gains were capped by rising populist discontent in Germany which shaved Angela Merkel’s winning margin at the national election, Catalonia’s violent secession referendum in Spain, and uncertainty from the ongoing Brexit negotiations.
Portfolio review At the stock level, detractors included Grandvision, which was hurt by quarterly results that were affected by the timing of Easter holidays and the impact of French regulatory changes on its business; Fugro, whose shares were buffeted over the quarter as it strove to adapt its capacity and organisation to the still-challenging conditions in the offshore oil & gas market; and Vopak, after it posted weaker-than-expected results due to soft storage demand, reflecting a shift in long-term oil price assumptions among oil traders.
Mitigating the underperformance were Temenos, which benefited from upbeat investor sentiment on potential new contract wins, alongside earnings upgrades; MTU Aero Engines, as investors responded positively to its robust order backlog, improvement in the MRO division, as well as positive sales and margin forecasts for the current year; and a lack of exposure to Anheuser Busch Inbev, as its shares suffered from weak FY16 numbers reflecting profitability which was hurt by weakness in the Brazilian business, soft pricing, and adverse foreign exchange movements.
In portfolio activity, we sold Assa Abloy on strength, Linde after its shares rose on the back of a proposed merger with Praxair, Nordea Bank as its shares rose after a re-rating; and Royal Dutch Shell in light of the quality of its business, juxtaposed against the returns from alternative investments and its through-cycle growth potential. We also divested Engie, Ericsson and LafargeHolcim in favour of more attractive opportunities elsewhere.
Against this we introduced world-leading hearing-aid retailer Amplifon, with its market leadership providing it cost advantages over its rivals. It also stands to benefit from significant secular tailwinds as the demand for hearing aids is set to grow from a low base. Another new inclusion was Fuchs, a world-leading maker of lubricant that has a wide array of industrial uses. We like the company for its healthy balance sheet, a good track record and a focus on delivering high returns on invested capital. We also initiated a position in well-diversified testing, inspection and certification company SGS, which has a relatively defensive growth profile and a robust balance sheet. Last, we initiated a holding in well-capitalised Swedish banking group Svenska Handelsbanken, which presents superior growth opportunities relative to its peers, while supported by an attractive and growing dividend.
5Source: Aberdeen Asset Management Asia Limited The performance returns are sourced from Lipper, based on percentage growth, calculated on a NAV-to-NAV basis with gross income reinvested.
Aberdeen Global Emerging Markets FundAnnual report to 30 September 2017
Performance reviewThe Aberdeen Global Emerging Markets Fund returned 14.70% in Singapore dollar terms for the year under review, underperforming the benchmark MSCI Emerging Markets Index’s total return of 22.41%.
Market reviewEmerging market equities posted substantial gains over the year. Markets initially sold-off in a knee-jerk reaction to Donald Trump’s election victory. But in 2017, an improving global economy lifted corporate earnings, which underpinned continued inflows into the asset class on the back of upbeat sentiment. Currencies broadly strengthened against the US dollar, shrugging off three Federal Reserve rate hikes, amid growing worries about the Trump administration and subdued US inflation. Oil prices were volatile, as an OPEC-led agreement to limit output was counterweighed by booming US shale production.
Portfolio ReviewThe fund underperformed the benchmark, largely due to the underweight to both China and the technology sector, as internet stars, such as Tencent and Alibaba, have re-rated substantially and driven the market higher. While we recognise opportunities that Chinese internet businesses enjoy, we remain concerned over their corporate structures, known as VIEs, designed to circumvent domestic laws restricting direct foreign control, as Beijing remains ambiguous about the structures’ legality.
We are optimistic about Tencent. Since its 2004 listing, we have conducted extensive due diligence regarding its corporate structure and founder, and engaged management on these issues. Over time, we have come to appreciate its disciplined capital allocation, and ability to expand and monetise its social media-based ecosystem. Therefore, we recently introduced Tencent into our portfolio. While not cheap, we believe its valuations reflect its high-quality growth potential. While we also appreciate Alibaba’s operational strengths, its poor governance track record by comparison continues to be a stumbling block.
Elsewhere, our non-benchmark position in Hong Kong proved costly. Hang Lung Group was a key detractor, due to concerns over its property subsidiary’s recovery. Stock selection was also negative in Indonesia, as Astra International fell on weaker margins due to more promotional activities in 2017. Conversely, stock selection in India contributed positively. Mortgage lender HDFC was buoyed by the post-demonetisation recovery and continued reforms, while Grasim Industries was lifted by expectations about its restructuring into a broader conglomerate.
Latin America bolstered performance. Both stock selection and our overweight to Brazil proved beneficial, amid evidence of recovering growth and earnings after a deep recession. Fashion retailer Lojas Renner outperformed on expectations for improved consumer spending, while lender Bradesco also performed well. Miner Vale was additionally boosted by the move to a single share-class. In Mexico, negative asset allocation due to the market’s post-US election weakness was outweighed by robust stock selection, as bank Banorte delivered solid results.
In EMEA, our overweight to Turkey dragged, as the market was weak in 2016 due to political uncertainty and a credit-rating downgrade. Stock selection in Poland was also negative, with Bank Pekao hampered by worries over the impact of partial state ownership. The weakness was mitigated by our underweight to South Africa, given its ongoing political turmoil and deteriorating domestic economy. Our lack of exposure to Qatar was also a bright spot, due to heightened geopolitical tensions in the Middle East.
Apart from Tencent, mentioned earlier, we introduced four other mainland holdings over the year: pure-play restaurant operator Yum China, airport operator Shanghai International Airport, appliances manufacturer Midea, and property developer China Resources Land. We also initiated Korean cosmetics business AmorePacific, diversified Chilean retailer Falabella, and well-managed Indian private-sector lender Kotak Mahindra Bank.
Against this, we sold SABMiller by tendering the shares to AB InBev; Yum Brands to reinvest the proceeds into Yum China; as well as CIMB, ICICI Bank and E-mart in favour of better opportunities elsewhere. We also exited Infosys, due to lower confidence from the resignation of Vishal Sikka as CEO and growing governance concerns.
6Source: Aberdeen Asset Management Asia Limited The performance returns are sourced from Lipper, based on percentage growth, calculated on a NAV-to-NAV basis with gross income reinvested.
Aberdeen Global Opportunities FundAnnual report to 30 September 2017
Performance reviewThe Aberdeen Global Opportunities Fund rose by 14.41% in Singapore dollar terms for the year under review, underperforming the benchmark MSCI World Index’s total return of 18.35%.
Market reviewGlobal equities extended gains in the year under review. Investors focused on banks’ corporate performance and the growth potential of technology firms in Asia and the US, where the weaker currency helped American exporters. In the Eurozone, investors’ sentiment was propped by the elections of French independent Emmanuel Macron and incumbent Dutch centrist Mark Rutte as leaders of their respective nations.
This counterbalanced rising populist discontent in Germany and a deadlock in Brexit talks. After the UK government triggered Article 50 to kickstart Brexit negotiations, UK Prime Minister Theresa May called for a snap election, which unexpectedly resulted in a hung parliament and reduced her bargaining power. Markets were also worried that US policymakers would be hamstrung by political wrangling in the White House, while the failure to overhaul healthcare extended doubts over other proposed reforms, including cuts in corporate taxes.
On the policy front, central bankers in the US and Eurozone were confounded by muted inflation and wage growth, which lagged economic growth and improved unemployment levels. But the Federal Reserve moved to tighten monetary policy and end quantitative easing, while the European Central Bank contemplated reducing bond purchases, raising concerns about potential government policy missteps.
Portfolio review Our overweight to the UK weighed on fund performance, as its slowing economy and political instability resulting from infighting within the ruling Conservative party, coupled with a logjam in Brexit negotiations curbed risk appetite. Our lack of exposure to France also detracted from performance, as its share prices were lifted by President Emmanuel Macron’s election victory, which allowed him to push for labour market reforms and closer European integration. In contrast, our non-benchmark exposure to South Korea benefited the fund. Following President Moon Jae-In’s election, he has pursued economic reforms to improve corporate governance at chaebols, which lifted market sentiment. Our non-benchmark exposure to Brazil also contributed to performance, underpinned by an improving economy and the government’s wider budget deficit goals.
At the stock level, Japan Tobacco (JT) detracted because investors were concerned about the potential impact of higher excise taxes and the implementation of regulations aimed at curbing tobacco consumption. JT was additionally weighed down by concerns that its competitors’ novel nicotine products would cause erosion in its share of the domestic market. Nonetheless, JT remains as the world’s third-largest cigarette company, with a track record of sensible acquisitions, and returning excess capital to shareholders. CVS Health also hurt fund returns after its management modestly lowered its earnings forecast for its full year. While the company saw an increase in revenue, profitability was flat in its pharmacy benefit manager segment, and retail sales declined. Separately, EOG Resources was hampered by oil price volatility, amid a slew of natural calamities and geopolitical tensions. Nonetheless EOG’s continues to uses its innovative technological capabilities to its advantage, to lower its cost of production and remain attractively profitable.
Conversely, earnings news in the IT industry largely exceeded expectations. South Korea’s Samsung Electronics’ record profits for the quarter ending June stood out. Growing demand for memory chips and brisk turnover of its Galaxy S8 phone led to a 20% increase in sales. Similarly, Israel’s Check Point achieved better profits and maintained its full-year targets, although a slowdown in billings dampened sentiment slightly. Elsewhere, our holding in Brazil’s Banco Bradesco also benefited the fund, as its second-quarter results exceeded market expectations, on the back of lower provisions and a rapid recovery in credit quality, despite lower interest income and slower loan growth.
During the period we introduced Diageo, a global alcoholic beverages producer that has scope for operational efficiencies and is generating healthy cash flows. We also introduced Sysmex, a Japanese market-leading diagnostic supplier, following a pullback in share price. The business has attractive long-term opportunities for growth.
7Source: Aberdeen Asset Management Asia Limited The performance returns are sourced from Lipper, based on percentage growth, calculated on a NAV-to-NAV basis with gross income reinvested.
Aberdeen Global Technology FundAnnual report to 30 September 2017
Performance reviewThe Aberdeen Global Technology Fund rose by 20.97% in Singapore dollar terms for the year under review, underperforming the benchmark Bank of America Merrill Lynch Technology 100 Index’s total return of 28.46%.
Market reviewTechnology shares extended gains during the year under review and outperformed global markets. Investors generally saw the sector as a proxy for companies with solid growth prospects, regardless of the economic backdrop. American companies with substantial foreign income were helped by a weaker US dollar; and earnings from tech-sector bellwethers, such as Facebook, Amazon, Netflix and Alphabet (the so-called ‘Fangs’), hit an upbeat note. Notably, Apple delivered higher-than-expected iPhone and iPad sales and profits. Suppliers of semiconductors for computing also gained pace, given a rising demand for storage and processing of data, driven by artificial intelligence, driverless technology and internet of things. Within Asia, solid earnings growth achieved by Chinese internet stocks, aided by protectionist government policies, whetted investor appetite and continued to bolster their share prices, despite some profit-taking later in the period. Nonetheless, geopolitical tensions and the impending end to quantitative easing in the US and Europe capped investors’ optimism. The sector also faced greater regulatory pressures, particularly from the European Union, with new guidelines and the proposed taxation of digital companies.
Portfolio review At the stock level, not holding Nvidia detracted from performance. The maker of graphics chips rallied on news that driverless cars enabled by its proprietary computer chips, will go on trial in Germany next year. This positions Nvidia ahead of its competitors in a key development area within the technology industry. Not holding Chinese social media platform Weibo hurt fund returns, as the name benefited from a foray into livestreaming, which attracted active users and boosted profits. Naver also declined as its earnings disappointed, owing to investments in newer growth platforms and its Japan-listed subsidiary Line Corp. However, Naver’s core search-engine business in the domestic market remains solid.
Conversely, Samsung Electronics lifted returns. Its record profits for the quarter ending June stood out. Growing demand for memory chips and brisk sales of its Galaxy S8 phone led to a 20% increase in revenue. The semiconductor business is expected to remain robust, even though it has lowered guidance, with rising component costs pressuring margins in its mobile handset business. Separately, the fund also benefited from holding Cognizant Tech Solutions. Sentiment about the IT services provider improved after it responded to activist shareholder Elliot Management’s proposal to start an accelerated share repurchase and payout a quarterly dividend of US$0.15. Its management also indicated that it will be more focused on acquisitions in the digital space, and refresh its board over the next two years. Check Point Software also buoyed performance, following the extension of its share repurchase programme, along with an exceptional growth in sales and market share.
In portfolio activity, we initiated positions in Apple in view of its solid business model and financials; Manhattan Associates, a supply-chain software provider with attractive fundamentals; South Korean search portal Naver, given its established market position and good growth opportunities; Nice Systems, an Israel-based provider of software solutions with a solid market position, high free cash flow yield, and recurring revenue; and also global semiconductor manufacturer Texas Instruments, in view of its diverse customer base and good financial discipline in returning cash to shareholders. To fund these introductions, we sold Alliance Data Systems; Qualcomm; Singtel; Taiwan Mobile; Telus Corp; and Verizon.
8Source: Aberdeen Asset Management Asia Limited The performance returns are sourced from Lipper, based on percentage growth, calculated on a NAV-to-NAV basis with gross income reinvested.
Aberdeen India Opportunities FundAnnual report to 30 September 2017
Performance reviewThe Aberdeen India Opportunities Fund rose by 12.40% in Singapore dollar terms for the year under review, underperforming the benchmark MSCI India Index’s total return of 13.72%.
Market reviewIndian equities rose in the year under review, which was marked by two momentous policy reforms – demonetisation and GST. Both initially unnerved markets, causing short-term pain to some segments of the population and the corporate world. The cash crunch from demonetisation receded quickly, and our holdings held up relatively well during the transition. A Reserve Bank of India report released several months after the exercise revealed that 99% of cancelled notes were deposited or exchanged for fresh currency. While this means that most of the ‘black money’ the Narendra Modi government had hoped to wipe out remains in circulation, other long-term benefits should not be overlooked, such as expanding the tax base and bringing more people into the formal banking system. Meanwhile, the launch of the new national sales tax was fairly benign, helped in part by the government proactively raising awareness and offering training and outreach programmes. This cushioned some teething problems, such as technical glitches with the online platform. While GST-related disruptions remain, most companies we spoke to expect the issues to be resolved and demand to normalise by the end of the year. Politically, Modi’s Bharatiya Janata Party remains popular as evidenced by a number of key state election victories during the year, notably in the most-populous state of Uttar Pradesh. On the economic front, June-quarter GDP growth of 5.7% was the slowest pace of expansion in three years, but retains India’s status among the world’s fastest-growing countries.
Portfolio review Health care was the worst performing sector, and stocks like Sun Pharmaceutical were a drag on performance due to declining prices and stepped-up scrutiny from US regulators. However, robust stock selection in this sector more than shielded the fund. The lack of exposure to Dr Reddy’s Laboratories helped, and our largest exposure in healthcare, Piramal Enterprises, outperformed. Its share price rose on the back of an improving outlook for its financing business, especially in light of the company’s willingness to raise more capital to support growth. Among our financial sector holdings, HDFC Bank and Kotak Mahindra Bank both gained from demonetisation, posting solid income growth driven largely by net interest income. Not holding Axis Bank was another contributor, as the stock fell after reporting a sharp increase in provisions for bad loans.
Our exposure to materials lifted returns, as it was one of the best-performing sectors over the review period. The cash-reliant sector rebounded when it became apparent that demonetisation’s effects were abating. Notably, Grasim Industries rose on expectations of its restructuring. This outweighed the negative effect of not holding Vedanta, which was buoyed by improving commodity prices.
Consumer stocks also resumed their rally as the disruptive effects of demonetisation faded and spending recovered, so our positioning in both consumer staples and the discretionary space were positive. Not holding Maruti Suzuki detracted, but not holding Tata Motors, which disappointed on the earnings front, more than made up for this. Our consumer stocks such as Hindustan Unilever and Godrej Consumer Products did well.
The fund’s lack of exposure to energy, particularly to Reliance Industries, was a key detractor. The stock rebounded on better refining margins and an improving outlook for its telecommunications business. We do not hold Reliance due to its leveraged balance sheet and discretionary capital allocation policies which are not always shareholder friendly.
In portfolio activity, we participated in the TCS and Mphasis share buyback schemes, which were priced at attractive premiums to the market. As shareholders in Grasim Industries, we received shares in Aditya Birla Capital (ABC), a well-run diversified financial services group owned by Grasim, and trimmed other positions whose share prices had been strong to build on our position in ABC. The distribution of its shares gives ABC greater financial flexibility to access capital markets in its own name.
Against this, we reduced our exposure to Infosys by half, after careful consideration. We engaged with management when they called for shareholder feedback. While the dust appears to have settled from recent acrimonious developments, we think that Infosys could continue to face uncertainty on several fronts – strategy, management, board and leadership. Nandan Nilekani, the widely respected Infosys alumnus, has returned as non-executive chairman following Vishal Sikka’s resignation as chief executive officer in August. While we welcome Nilekani’s appointment, the selection of a new CEO will take time. That said, Infosys is still among India’s best software developers. It continues to generate steady cash flow, backed by a solid balance sheet, and is moving in the right direction in addressing the issues that confront it. Finally, we trimmed our position in ICICI Bank, taking profits from its resilient share price as we rebalance the portfolio to selectively position for a credit recovery while reducing the risk of exposure to stress in the banking system as a whole.
9Source: Aberdeen Asset Management Asia Limited The performance returns are sourced from Lipper, based on percentage growth, calculated on a NAV-to-NAV basis with gross income reinvested.
Aberdeen Indonesia Equity FundAnnual report to 30 September 2017
Performance reviewThe Aberdeen Indonesia Equity Fund rose by 9.43% in Singapore dollar terms for the year under review, outperforming the benchmark Jakarta Composite Index’s rise of 8.27%.
Market reviewIndonesian equities rose over the year under review. Sentiment was bolstered by Standard & Poor’s decision to return the country’s credit rating to investment-grade. The financial sector was among the best performers, driven by two consecutive rate cuts that led smaller banks to rally, as well as Moody’s upgrade of domestic lenders’ outlook to positive. However, toward the period-end, foreign investors exited the market on concerns about slow execution of infrastructure projects and disappointing results from the tax-amnesty programme.
On the economic front, inflation remained benign on the back of sluggish household consumption growth. The trade balance returned to surplus, as exports continued to outpace imports, mainly supported by commodity shipments such as crude palm oil. Foreign currency reserves rose steadily to US$128.7 billion in August, underpinning the rupiah’s strength against the US dollar. Against that backdrop, the central bank cut its policy rate for the second month in a row in September and signalled that current rates should be adequate to boost growth. In another move to support the economy, President Joko Widodo announced the 16th stimulus package, which aimed to speed up the investment process and improve the ease of doing business.
Portfolio ReviewThe fund’s outperformance was attributable to positive stock selection, specifically in the consumer discretionary sector.
MP Evans was a key contributor. Sales grew significantly on the back of higher crude palm oil price and increased production volumes. The company was further buoyed by news that Malaysia-based KL Kepong was looking to take over it. KL Kepong had initially offered 640p a share but later sweetened this to 740p. Shareholders rejected both offers. Similarly, our non-benchmark exposure to Indo Tambangraya Megah aided performance, as better coal prices and higher demand from China helped bolster its profits. Meanwhile, the fund benefited from not holding Matahari Department Store, which continued to face pressure from specialty store operators and subdued same-store sales growth, compelling it to close two of its outlets.
Conversely, Bank Rakyat was the main detractor. Not holding the state-owned lender hurt performance, as its share price rose after it reported good first-quarter net profits on the back of decent loan growth to small-and-medium enterprises, as well as higher fee income. We prefer to gain exposure to the financial sector through Bank OCBC NISP and Bank Central Asia, both of which are more prudently managed and have better standards of credit controls.
On the other hand, our non-benchmark exposure to Delfi and Holcim Indonesia detracted from performance. Delfi suffered from lacklustre sales growth and profitability in an environment of subdued consumer demand. However, we still like the confectionery manufacturer for its leadership position and superior manufacturing capabilities. Holcim Indonesia’s results were below expectation, as competition outgrew demand, leading to softer cement prices, and thus, weaker earnings. That said, the country’s cement per capita consumption still ranks lower than most of its ASEAN peers.
In portfolio activity, we initiated Astra Agro Lestari on the back of an attractive valuation, its solid fundamentals and bright outlook.
Against this, we exited Vale Indonesia. Despite being an excellent low-cost operator, the miner continues to face non-operating challenges such as licensing renewal, stake sales by its principal shareholders and investments into expensive smelters that continue to weigh on its share price.
10Source: Aberdeen Asset Management Asia Limited The performance returns are sourced from Lipper, based on percentage growth, calculated on a NAV-to-NAV basis with gross income reinvested.
Aberdeen Japan Equity FundAnnual report to 30 September 2017
Performance reviewThe Aberdeen Japan Equity Fund rose by 5.26% in Singapore dollar terms for the year under review, underperforming the benchmark Topix Index’s total return of 15.82%.
Market reviewJapanese equities rose in the review period. Sentiment has been underpinned by an improved outlook for corporate earnings, which was supported in turn by yen weakness. On the policy front, the Bank of Japan unsurprisingly held its monetary-policy course amid still subdued inflation. Further afield, a slew of external events also moved the stockmarket. In particular, the UK’s shock decision to leave the European Union and Theresa May’s subsequent snap-election gamble that left her weakened ahead of Brexit negotiations, Donald Trump’s unexpected election as US president last November, which had initially whet risk appetite on hopes that he would usher in a raft of pro-business reform. However, these did not materialise after repeated failure to repeal and replace Obamacare, on which major fiscal reforms were predicated.
Portfolio ReviewFor the review period, we view the fund’s performance as wholly consistent with our high-quality portfolio that has remained defensively positioned. The underlying holdings, made up of better-run companies, tend to do well amid tougher market conditions, with their businesses relatively unperturbed by yen appreciation. In contrast, poorer quality companies that have benefited more from yen weakness, were favoured by the market during the period, particularly those that have exhibited more aggressive growth.
Detracting from relative performance was Japan Tobacco, which saw its shares come under pressure as competing novel nicotine products continued to take market share from its domestic cigarette sales. The company launched a competing product in the key Tokyo market in June and expects to expand sales nationwide by year-end. Also costing the fund was bicycle component maker Shimano, as its share price dropped after it lowered its full-year forecast amid rising raw material prices. Nevertheless, Shimano retains a strong market share and is the de facto industry standard for bicycle gears. We remain confident in these companies and their longer-term performances are in-line with our expectations. Last, Suruga Bank also detracted, following proposals from an industry group to place a limit on banks’ consumer finance loans. However, we like the lender as it is probably the most progressively run bank in Japan.
Mitigating the underperformance was reduction-gear maker Nabtesco and sensor company Keyence, both of which posted excellent results driven by rising demand for automation. Similarly, Daito Trust Construction made a positive contribution to performance as the builder of rental homes saw good orders.
In key portfolio activity, we sold both Canon and Unicharm on concerns over their deteriorating business prospects; and auto-components supplier Aisin Seiki after a period of outperformance and even though it retains a robust position in automatic transmissions. Against this, we initiated a position in Nippon Paint for its strong franchise in the highly-profitable decorative paints across Asia; Shionogi, a drugmaker with an edge in infectious diseases such as HIV, given its management’s focus, the diversified pipelines for both existing and new drugs, with no concerns over expiring patents in the near term; and cosmetics company Shiseido that has made good progress on restructuring the business under the new president, Masahiko Uotani, who has addressed underperforming brands, executed on cost structure reforms, and aligned executives behind an incentive-based pay structure. We also introduced Stanley Electric, one of the world’s largest automotive-lighting manufacturers that is well positioned to benefit from an industry-wide structural shift from halogen to LED headlamps as demand for energy efficiency increases while its unique in-house LED manufacturing capabilities will improve cost efficiencies that will result in improved profitability. Another addition was leading local furniture and home-furnishings retailer Nitori Holdings, with 30 consecutive years of sales and profit growth and is looking to accelerate earnings momentum by expanding into urban city centres with its interior decorating stores. Its unique vertically-integrated operation allows it to achieve superior margins and management of this largely domestic business is now looking to replicate its success in key overseas markets such as China. Finally, we also initiated a position in leading automotive chip-maker Renesas Electronics, which is well-positioned to benefit from growing focus on vehicle electrification, autonomous driving, and the increasing connectivity between industrial applications. This is underpinned by its cutting-edge technology in miniaturised microcontrollers, which improves energy consumption and enhances memory size, while its analogue semiconductor technology is used in a broad range of applications.
11Source: Aberdeen Asset Management Asia Limited The performance returns are sourced from Lipper, based on percentage growth, calculated on a NAV-to-NAV basis with gross income reinvested.
Aberdeen Malaysian Equity FundAnnual report to 30 September 2017
Performance reviewThe Aberdeen Malaysian Equity Fund fell by 0.15% in Singapore dollar terms for the year under review, underperforming the benchmark FTSE Bursa Malaysia KLCI Index’s total return of 6.87%.
Market reviewMalaysian equities rose over the period in review. Leading the gains were companies in the financials and consumer discretionary sectors, as their businesses benefited from domestic economic growth. Exports grew, aided by a competitive ringgit. Although Bank Negara’s move to restrict ringgit trading in offshore hedging markets buoyed the currency, it largely faltered following the Federal Reserve’s decision to taper quantitative easing. Shipments of electronics rose in tandem with an improvement in global semiconductor sales. Energy products also notched higher, supported by rising oil prices following a slew of natural disasters battering the Americas, political tension in the Middle East as well as in the Korean Peninsula. Elsewhere, domestic consumption improved partially driven by fading pressures from the Goods and Services Tax (GST) introduced two years ago, and the distribution of fiscal stimulus ahead of general elections. Inflation remained within admissible levels, and the central bank maintained its key interest rate at 3%, underscoring its accommodative monetary policy stance.
Portfolio ReviewAt the stock level, our non-benchmark exposure to Aeon Co detracted from performance. The retail backdrop remained challenging, with consumer sentiment improving marginally. However, we expect retail sales and consumer sentiment to pick up, following the boost from fiscal stimulus. Our underweight to lender CIMB and lack of exposure to Maybank also hurt fund returns. We hold CIMB for its restructuring story, and are positive about the improvement in earnings and loan growth. That said, we remain underweight the benchmark as we continue to see risks in some of their regional businesses. Maybank’s performance reflected the overall domestic bank recovery. Although fears of weakening asset quality in the domestic economy did not materialise, its Oil & Gas exposure bears monitoring.
On the other hand, our non-benchmark exposure to Allianz Malaysia benefited the fund. The two-pronged growth in its life-insurance business and general-insurance business continues to impress, and we expect it to benefit from the liberalisation of the insurance industry. Not holding Petronas Gas also helped fund performance, as worries about pricing pressures from the government’s plan to liberalise the domestic gas market hampered its share price. Separately, the lack of exposure to Tenaga Nasional lifted fund performance. Negative sentiment weighed on the stock, given the uncertainty of adjustments in electricity tariffs in the lead-up to the upcoming general elections.
In portfolio activity, we introduced DKSH, a market expansion services provider, given its decent valuation and upbeat growth prospects. We also introduced IHH Healthcare Berhad, the biggest private hospital operator in Asia. IHH’s core strengths lie in its branding, capable management and good reputation in providing high-quality complex treatments. With a good pipeline of new hospitals, the group is well positioned to tap the growing demand for healthcare across the region. While it has strong and mature businesses in Singapore and Malaysia, we see long-term potential in its forays into China, Hong Kong and India.
12Source: Aberdeen Asset Management Asia Limited The performance returns are sourced from Lipper, based on percentage growth, calculated on a NAV-to-NAV basis with gross income reinvested.
Aberdeen Pacific Equity FundAnnual report to 30 September 2017
Performance reviewThe Aberdeen Pacific Equity Fund rose by 17.72% in Singapore dollar terms for the year under review, underperforming the benchmark MSCI AC Asia Pacific ex Japan Index’s total return of 20.51%.
Market reviewAsian equities posted solid gains over the year, driven by improving fundamentals across the region and a recovery in global trade. Gains, however, were capped by doubts over US President Donald Trump’s ability to deliver on his economic agenda, geopolitical tensions on the Korean peninsula, and the prospect of major central banks withdrawing stimulus.
China’s equity market outpaced the region. Upbeat growth data, along with MSCI’s decision to include A-shares to its influential indices and a sustained rise in Chinese internet stocks, drove the mainland market, despite Beijing’s increased regulatory scrutiny and efforts to tighten leverage. Meanwhile, a re-rating of the technology sector underpinned Korea and Taiwan. Companies in the Apple supply chain were among the beneficiaries, although they dipped on profit-taking towards the period-end. Korea also gained on hopes that tensions with China over the Thaad missile system would thaw after President Moon Jae-in took office in May.
The Philippines, Malaysia and Indonesia, however, were the key regional laggards. Shares in the Philippines declined after an extended run, hampered by President Rodrigo Duterte’s unpredictability and domestic political events. Indonesia’s private consumption and consumer confidence remained sluggish, despite favourable economic conditions. In Malaysia, the impact of the goods and services tax introduced two years ago continued to be felt, with inflation rising, while a weaker ringgit pushed up the costs of imports.
Portfolio ReviewThe fund delivered healthy returns over the review period, although it trailed the benchmark.
China accounted for the bulk of the underperformance. Our light exposure to the market detracted, as the local benchmark led the region. As highlighted earlier, China’s rally was also underpinned by a sharp increase in internet stocks. Tencent and Alibaba stood out, buoyed by momentum trading and solid results. Hence, our underweight to Tencent and lack of exposure to Alibaba detracted. We introduced a small position in Tencent towards the end of the period. This reflects our growing conviction in, and comfort with, its business, corporate structure and governance. We think that valuations reflect its high-quality growth potential. Tencent has succeeded in diversifying its presence in the Chinese internet space, creating a powerful eco-system that leverages on the network effects of its various offerings while at the same time navigating the migration of gaming from PC to mobile. This combination of a growing ecosystem and a growing monetisation of the user base will drive earnings growth. We’re more circumspect when it comes to Alibaba. While Alibaba has a strong competitive moat and impressive business model, we see potential downside risks from poor corporate governance.
The surge in Chinese internet stocks helped propel the overall software and services into the best-performing segment in the region. As a result, our underweight to this segment detracted. Our main exposure to software and services is via Korean internet holding Naver. Its earnings disappointed owing to investments in newer growth platforms and its Japan-listed subsidiary Line Corp. However, Naver’s core search-engine business in the domestic market remains solid. That, coupled with the lack of exposure to another tech stock, SK Hynix, which performed well, hurt stock selection in Korea.
Elsewhere in the technology sector, our holding in Samsung Electronics (SEC) outperformed both the local and regional indices. SEC reported yet another solid quarter of profits, underpinned by the upswing in the semiconductor cycle that should last for the rest of the year. With its steady cash flow generation, the company continues to invest in the business and improve shareholder returns through share buybacks and dividends.
13Source: Aberdeen Asset Management Asia Limited The performance returns are sourced from Lipper, based on percentage growth, calculated on a NAV-to-NAV basis with gross income reinvested.
Aberdeen Pacific Equity FundAnnual report to 30 September 2017
Portfolio Review (continued)Meanwhile, we are seeing encouraging signs emerging from our commodity and financial holdings which had weighed on performance in previous periods. In Australia, miners Rio Tinto and BHP Billiton rallied as iron ore prices rebounded on the back of China’s improving macroeconomic outlook. Our other Australian holding, blood plasma manufacturer CSL, was also a strong contributor. We trimmed our position in CSL after its stock price rose sharply this year on the back of firm earnings from its immunoglobulin and specialty products. We like the business, given its decent growth pipeline and its wide moat in a sector that has consolidated.
Elsewhere, several of our financial holdings also performed well, as asset quality concerns eased and fee income improved. These included regional lenders DBS, UOB and OCBC, which reported better-than-expected results in the latest quarter, driven by healthy fee income from wealth management and good cost controls. While asset quality appears to have stabilised, non-performing loan formation in the oil and gas sector remains a concern. However, all three benefited from growth in regional operations. HSBC benefited from expectations that higher interest rates would push up margins. The lender also reported robust interim results and is returning more cash to shareholders via a new US$2 billion share buyback, adding to more than US$3 billion already pledged over the past year. Domestically focused banks such as Malaysia’s CIMB Group and Indonesia’s Bank Central Asia also performed well.
In India, our core holding Grasim Industries outperformed after restructuring its business and realising substantial hidden value in spinning off its financial holding company, Aditya Birla Capital. While we continue to rate the quality of Indian corporates highly and remain optimistic about their long-term prospects, we are conscious of valuations and have been taking profits over the year.
Apart from the portfolio movements mentioned earlier, we also introduced Hong Kong-listed developer China Resources Land, given its superior profitability, substantial land bank, good mix of property development and investment; and Beijing Capital International Airport, which operates both aeronautical and non-aeronautical businesses in the capital. We view it as an attractive infrastructure asset in a gateway city, benefiting from structural trends in tourism, trade and government initiatives, and one that is well positioned to gain from an improvement in its traffic mix over time. Earnings and cash flow are stable, while valuations are reasonable. Meanwhile, ICICI Bank’s share price rally provided us the opportunity to exit the stock, as the lender’s balance sheet was saddled with significant non-performing loans.
14Source: Aberdeen Asset Management Asia Limited The performance returns are sourced from Lipper, based on percentage growth, calculated on a NAV-to-NAV basis with gross income reinvested.
Aberdeen Singapore Equity FundAnnual report to 30 September 2017
Performance reviewThe Aberdeen Singapore Equity Fund rose by 18.17% in Singapore dollar terms for the year under review, outperforming the benchmark Straits Times Index’s (STI) total return of 16.01%.
Market reviewSingapore equities were resilient in the face of volatility, and rode on a synchronised global economic recovery to chalk up gains over the period under review. Initial worries about a populist Donald Trump entering the White House gave way to optimism about his promised US tax reforms and stimulus. A rate hike by the US Federal Reserve at the end of 2016, together with signalling of more to come, gave momentum to banking names in Singapore. China’s stable economic growth and controlled deleveraging of financial risks lifted investor sentiment in the region. In Europe, the election of Emmanuel Macron as French president was viewed as a rebuke of populist politics in the European Union. That buoyed investors’ optimism further, as the bloc is a major trading partner of the city-state.
Domestically, Singapore’s economic growth continued to beat expectations, driven by robust external demand for its electronic goods. At the same time, the central bank kept its policy stance accommodative, which lent more support to the export-oriented economy and consequently, earnings growth for Singapore-listed companies. Share prices of real-estate names were boosted by a tweak to property-cooling measures that was interpreted as a precursor to more easing. A flurry of news about real-estate deals and property firms replenishing their land banks whetted investors’ appetite for real-estate names further, pushing some of them to become big gainers during this period.
Portfolio ReviewOur non-index exposure to electronics services provider Venture Corp contributed the most to fund performance. It had a stellar run during this period, underpinned by good earnings results that showed broad-based growth and decent year-on-year growth in net profits. Venture’s chief executive’s S$6-million purchase of shares he does not already own also pushed its stock price to a 10-year high.
General industrial holdings, in particular Jardine Strategic, also aided performance. Jardine Strategic had a good run, driven by its inclusion in the MSCI World Index and expectations that its subsidiaries’ fundamentals will continue to improve. The fact that it was a non-benchmark holding for most of the period under review also benefited the portfolio, as the STI missed out on its gains.
Good selection of property stocks was a boon to the portfolio. Bukit Sembawang Estates and City Developments benefited from the upbeat sentiment in the sector as investors poured into companies with good quality assets but traded at low valuations. Not holding Hongkong Land and CapitaLand Mall Trust also helped, as their share prices sank on concerns over their resilience.
Conversely, non-benchmark exposure Raffles Medical was the portfolio’s single-largest detractor, as its share price was hit by softer-than-expected demand from foreign patients, while staff costs rose. We remain optimistic about its longer-term growth, which is supported by its ongoing expansion in Singapore and China. Chocolate maker Delfi, which is not included in the index, also weighed on performance. Investors were disappointed by its dismal sales in its key market of Indonesia, despite having well-received brands and good experience in bringing its products to market.
For lender DBS, another laggard, a slight increase in bad loans rattled investors. Investors sold off transport operator ComfortDelGro’s shares on intensifying competition from private-car operators in its taxi business. We still believe that the stock looks attractive, as the company continues to generate cashflow from its rail and bus segments, and the latter should see profitability improving under a more favourable regulatory framework.
In portfolio activity, we initiated BreadTalk, a bakery and restaurant business that is attractively valued and has potential to improve profitability; IHH Healthcare, as we believe the group will benefit from growing healthcare demand in the region; and beverage maker Fraser & Neave, which should profit from growing consumption in emerging Asia. We re-introduced Singapore Post, which is now in a better position for growth, even as it continues to restructure and transition its business. We also participated in the initial public offering of HRnetGroup. We like its robust balance sheet, local market dominance and flexibility in recruitment across North Asia that should give it room to expand into the region.
We exited Global Logistic Properties following a privatisation bid at a price close to the offer of S$3.38 per share. We dropped KrisEnergy after its share price doubled on the announcement of its financial restructuring plan. The revised proposal did not seem favourable to shareholders and we were uncertain about how the plan would be funded, as well as the company’s growth prospects. We also sold Singapore Airlines as its business outlook remains challenging amid climbing oil prices and an increasingly competitive environment.
15Source: Aberdeen Asset Management Asia Limited The performance returns are sourced from Lipper, based on percentage growth, calculated on a NAV-to-NAV basis with gross income reinvested.
Aberdeen Thailand Equity FundAnnual report to 30 September 2017
Performance reviewThe Aberdeen Thailand Equity Fund rose by 15.70% in Singapore dollar terms for the year under review, underperforming the benchmark Thailand SET Index’s total return of 20.48%.
Market reviewWhile markets were relatively stable for the bulk of the twelve-months in review, the period was book-ended by decent rallies, which pushed equities considerably higher overall. Early on, stocks were buoyed by an influx of indiscriminate passive buying, via exchange-traded or index tracker funds, meaning the larger SET50 companies were the chief beneficiaries. Later, investor sentiment was roused by encouraging economic signals, with GDP growing by 3.7% year-on-year in the second quarter, its fastest pace in four years and well ahead of expectations. Yingluck Shinawatra’s decision to abscond rather than take trial for criminal negligence also had an uplifting effect on markets, given it alleviated fears of violence and instability that might have followed a guilty verdict. The economy maintained its steady course, with the recovery backed by tourism, government spending and a double-digit jump in exports driven by marked improvements in global demand. However, the passing of King Bhumibol in October 2016 and the subsequent year-long mourning period, dampened already sluggish domestic consumption. Private investment also struggled to make meaningful headway.
Portfolio ReviewThe fund underperformed the index. Not holding Airports of Thailand was the biggest detractor from relative returns, as the airport operator benefited from the impressive growth in tourist arrivals. We do not hold the stock due to governance concerns. Meanwhile, BEC World suffered from challenging operating conditions, exacerbated by the mourning period for the late King as advertising spending plunged. We retain a relatively small position in the company because we continue to believe in the firm’s well-established franchise and are confident of an earnings recovery in the near term. Relative performance was further hampered by a lack of exposure to mainstays of the local benchmark, such as PTT, that did well on the back of firmer oil prices and a flurry of passive buying. We already have exposure to this company through its subsidiary PTT Exploration & Production.
Conversely, Hana Microelectronics was the top contributor, as its revenues were bolstered by a cyclical upturn and increased exports. Tisco Financial Group’s share price rose steadily on the back of decent results, as well as its acquisition and subsequent integration of Standard Chartered Bank Thailand’s retail portfolio. Meanwhile, Kiatnakin Bank’s earnings benefited from one-off divestment gains. Elsewhere, retail property developer Central Pattana proved resilient on the back of relatively decent second-quarter results, which pointed to good growth in rental income. Its shares drew further support when its property fund was approved for conversion into a Real Estate Investment Trust.
During the period, we participated in the IPO of Banpu subsidiary Banpu Power, an electricity-generation company with quality management, robust financials and a decent growth profile. We also introduced Land & Houses, one of Thailand’s leading property developers. It has a good land bank and experienced management and seems decently valued, with a healthy dividend yield. We also participated in TOA Paints’ initial public offering as a cornerstone investor. Thailand’s leading paints manufacturer and distributor, TOA has significant production operations throughout the region, including in Vietnam.
Against this, we sold Amarin Printing & Publishing, a long-held stock that has suffered following a generally tough advertising environment in recent years, as well as its investment in digital television. We also exited Ratchaburi Electricity Generating due to concerns over its business direction and strategy. Separately, we accepted Berli Jucker’s tender offer for all of Big C Supercenter’s outstanding shares. Big C is now delisted.

16
Aberdeen Select Portfolio Report to Unitholders
for the year ended 30 September 2017
17
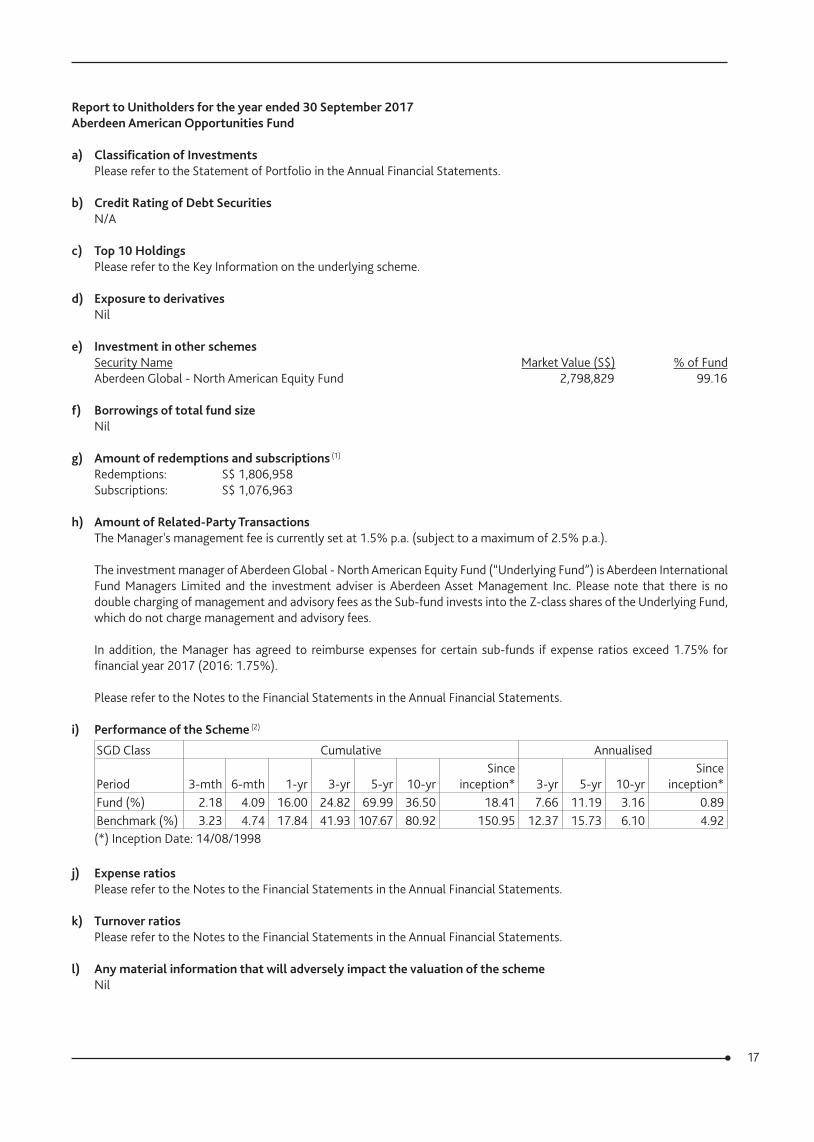
Report to Unitholders for the year ended 30 September 2017Aberdeen American Opportunities Fund
a) Classification of InvestmentsPlease refer to the Statement of Portfolio in the Annual Financial Statements.
b) Credit Rating of Debt SecuritiesN/A
c) Top 10 HoldingsPlease refer to the Key Information on the underlying scheme.
d) Exposure to derivativesNil
e) Investment in other schemesSecurity Name Market Value (S$) % of Fund Aberdeen Global - North American Equity Fund 2,798,829 99.16
f) Borrowings of total fund sizeNil
g) Amount of redemptions and subscriptions (1)
Redemptions: S$ 1,806,958 Subscriptions: S$ 1,076,963
h) Amount of Related‑Party TransactionsThe Manager's management fee is currently set at 1.5% p.a. (subject to a maximum of 2.5% p.a.).
The investment manager of Aberdeen Global - North American Equity Fund (“Underlying Fund”) is Aberdeen International Fund Managers Limited and the investment adviser is Aberdeen Asset Management Inc. Please note that there is no double charging of management and advisory fees as the Sub-fund invests into the Z-class shares of the Underlying Fund, which do not charge management and advisory fees.
In addition, the Manager has agreed to reimburse expenses for certain sub-funds if expense ratios exceed 1.75% for financial year 2017 (2016: 1.75%).
Please refer to the Notes to the Financial Statements in the Annual Financial Statements.
i) Performance of the Scheme (2)
SGD Class Cumulative Annualised
Period 3-mth 6-mth 1-yr 3-yr 5-yr 10-yrSince
inception* 3-yr 5-yr 10-yrSince
inception*Fund (%) 2.18 4.09 16.00 24.82 69.99 36.50 18.41 7.66 11.19 3.16 0.89Benchmark (%) 3.23 4.74 17.84 41.93 107.67 80.92 150.95 12.37 15.73 6.10 4.92(*) Inception Date: 14/08/1998
j) Expense ratios Please refer to the Notes to the Financial Statements in the Annual Financial Statements.
k) Turnover ratios
Please refer to the Notes to the Financial Statements in the Annual Financial Statements.
l) Any material information that will adversely impact the valuation of the schemeNil
18
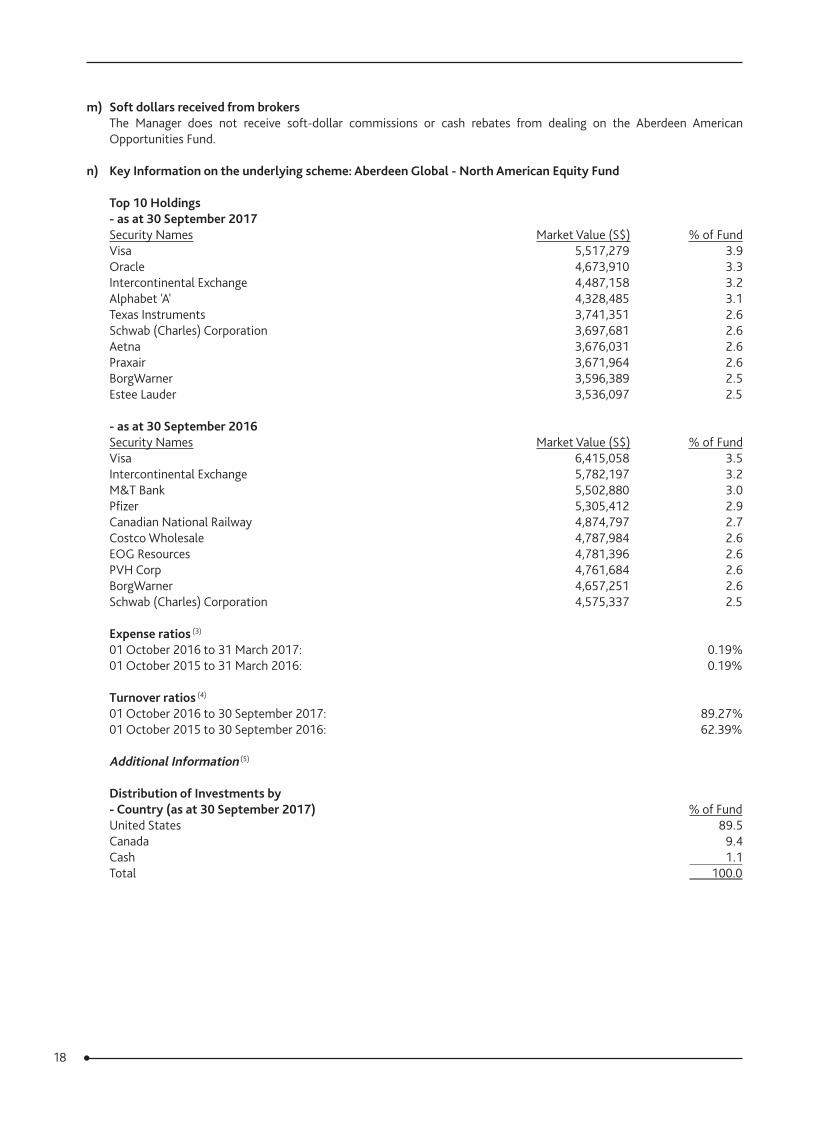
m) Soft dollars received from brokersThe Manager does not receive soft-dollar commissions or cash rebates from dealing on the Aberdeen American Opportunities Fund.
n) Key Information on the underlying scheme: Aberdeen Global ‑ North American Equity Fund
Top 10 Holdings ‑ as at 30 September 2017Security Names Market Value (S$) % of Fund Visa 5,517,279 3.9 Oracle 4,673,910 3.3 Intercontinental Exchange 4,487,158 3.2 Alphabet 'A' 4,328,485 3.1 Texas Instruments 3,741,351 2.6 Schwab (Charles) Corporation 3,697,681 2.6 Aetna 3,676,031 2.6 Praxair 3,671,964 2.6 BorgWarner 3,596,389 2.5 Estee Lauder 3,536,097 2.5
‑ as at 30 September 2016Security Names Market Value (S$) % of Fund Visa 6,415,058 3.5 Intercontinental Exchange 5,782,197 3.2 M&T Bank 5,502,880 3.0 Pfizer 5,305,412 2.9 Canadian National Railway 4,874,797 2.7 Costco Wholesale 4,787,984 2.6 EOG Resources 4,781,396 2.6 PVH Corp 4,761,684 2.6 BorgWarner 4,657,251 2.6 Schwab (Charles) Corporation 4,575,337 2.5
Expense ratios (3)
01 October 2016 to 31 March 2017: 0.19% 01 October 2015 to 31 March 2016: 0.19%
Turnover ratios (4)
01 October 2016 to 30 September 2017: 89.27% 01 October 2015 to 30 September 2016: 62.39%
Additional Information (5)
Distribution of Investments by‑ Country (as at 30 September 2017) % of FundUnited States 89.5 Canada 9.4 Cash 1.1 Total 100.0
19
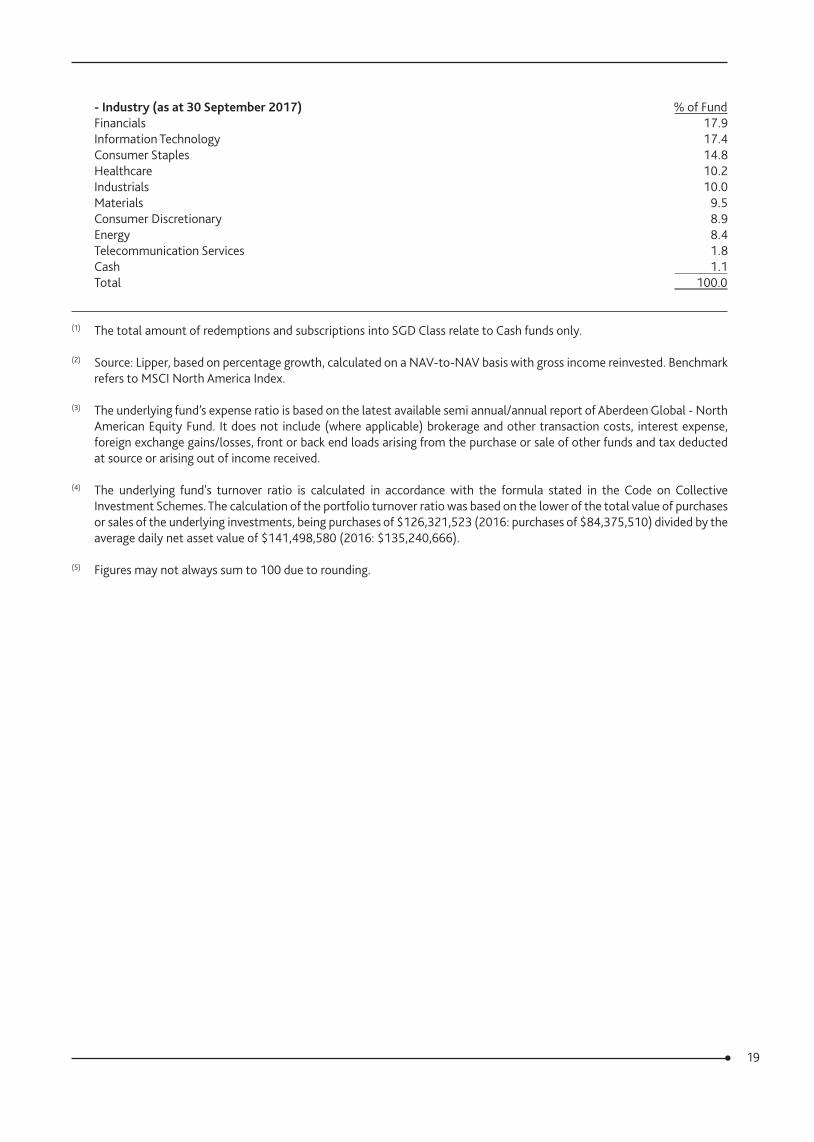
‑ Industry (as at 30 September 2017) % of FundFinancials 17.9 Information Technology 17.4 Consumer Staples 14.8 Healthcare 10.2 Industrials 10.0 Materials 9.5 Consumer Discretionary 8.9 Energy 8.4 Telecommunication Services 1.8 Cash 1.1 Total 100.0
(1) The total amount of redemptions and subscriptions into SGD Class relate to Cash funds only.
(2) Source: Lipper, based on percentage growth, calculated on a NAV-to-NAV basis with gross income reinvested. Benchmark refers to MSCI North America Index.
(3) The underlying fund’s expense ratio is based on the latest available semi annual/annual report of Aberdeen Global - North American Equity Fund. It does not include (where applicable) brokerage and other transaction costs, interest expense, foreign exchange gains/losses, front or back end loads arising from the purchase or sale of other funds and tax deducted at source or arising out of income received.
(4) The underlying fund's turnover ratio is calculated in accordance with the formula stated in the Code on Collective Investment Schemes. The calculation of the portfolio turnover ratio was based on the lower of the total value of purchases or sales of the underlying investments, being purchases of $126,321,523 (2016: purchases of $84,375,510) divided by the average daily net asset value of $141,498,580 (2016: $135,240,666).
(5) Figures may not always sum to 100 due to rounding.
20
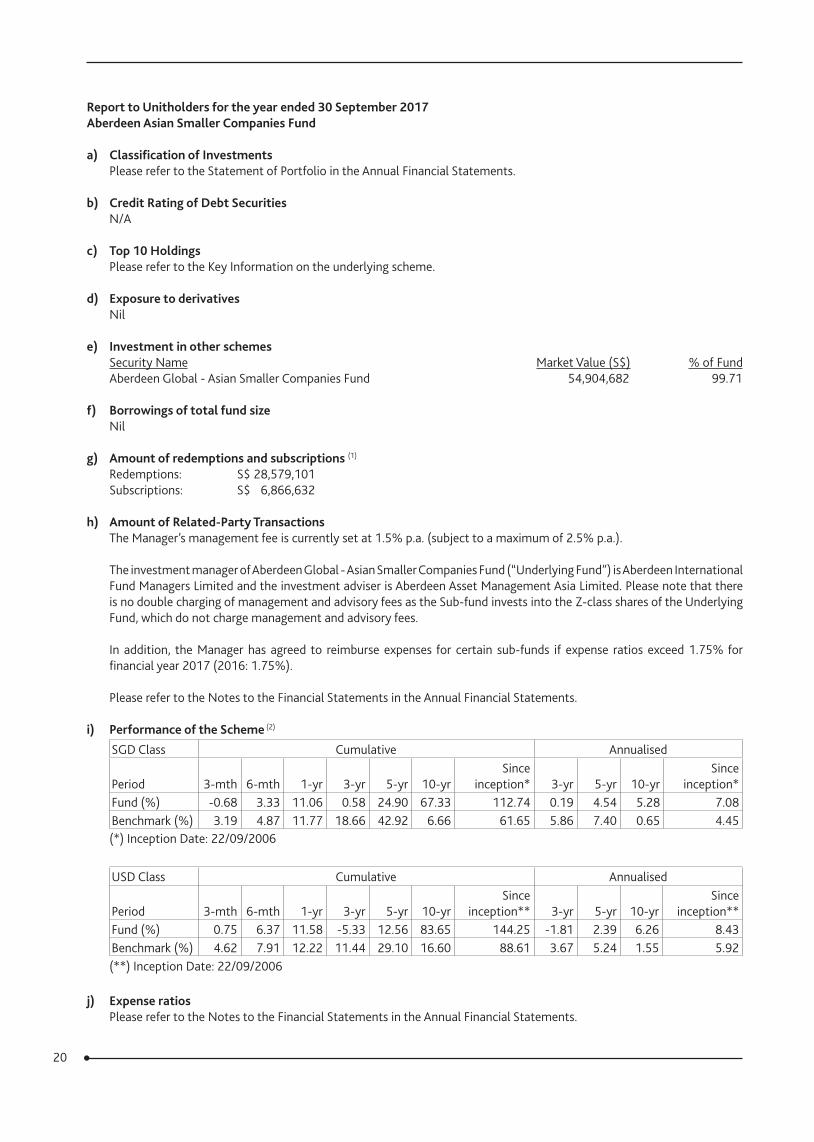
Report to Unitholders for the year ended 30 September 2017Aberdeen Asian Smaller Companies Fund
a) Classification of InvestmentsPlease refer to the Statement of Portfolio in the Annual Financial Statements.
b) Credit Rating of Debt SecuritiesN/A
c) Top 10 HoldingsPlease refer to the Key Information on the underlying scheme.
d) Exposure to derivativesNil
e) Investment in other schemesSecurity Name Market Value (S$) % of Fund Aberdeen Global - Asian Smaller Companies Fund 54,904,682 99.71
f) Borrowings of total fund sizeNil
g) Amount of redemptions and subscriptions (1)
Redemptions: S$ 28,579,101 Subscriptions: S$ 6,866,632
h) Amount of Related‑Party TransactionsThe Manager’s management fee is currently set at 1.5% p.a. (subject to a maximum of 2.5% p.a.).
The investment manager of Aberdeen Global - Asian Smaller Companies Fund (“Underlying Fund”) is Aberdeen International Fund Managers Limited and the investment adviser is Aberdeen Asset Management Asia Limited. Please note that there is no double charging of management and advisory fees as the Sub-fund invests into the Z-class shares of the Underlying Fund, which do not charge management and advisory fees.
In addition, the Manager has agreed to reimburse expenses for certain sub-funds if expense ratios exceed 1.75% for financial year 2017 (2016: 1.75%).
Please refer to the Notes to the Financial Statements in the Annual Financial Statements.
i) Performance of the Scheme (2)
SGD Class Cumulative Annualised
Period 3-mth 6-mth 1-yr 3-yr 5-yr 10-yrSince
inception* 3-yr 5-yr 10-yrSince
inception*Fund (%) -0.68 3.33 11.06 0.58 24.90 67.33 112.74 0.19 4.54 5.28 7.08Benchmark (%) 3.19 4.87 11.77 18.66 42.92 6.66 61.65 5.86 7.40 0.65 4.45(*) Inception Date: 22/09/2006
USD Class Cumulative Annualised
Period 3-mth 6-mth 1-yr 3-yr 5-yr 10-yrSince
inception** 3-yr 5-yr 10-yrSince
inception**Fund (%) 0.75 6.37 11.58 -5.33 12.56 83.65 144.25 -1.81 2.39 6.26 8.43Benchmark (%) 4.62 7.91 12.22 11.44 29.10 16.60 88.61 3.67 5.24 1.55 5.92(**) Inception Date: 22/09/2006
j) Expense ratios
Please refer to the Notes to the Financial Statements in the Annual Financial Statements.
21
k) Turnover ratios
Please refer to the Notes to the Financial Statements in the Annual Financial Statements.
l) Any material information that will adversely impact the valuation of the schemeNil
m) Soft dollars received from brokersThe Manager does not receive soft-dollar commissions or cash rebates from dealing on the Aberdeen Asian Smaller Companies Fund.
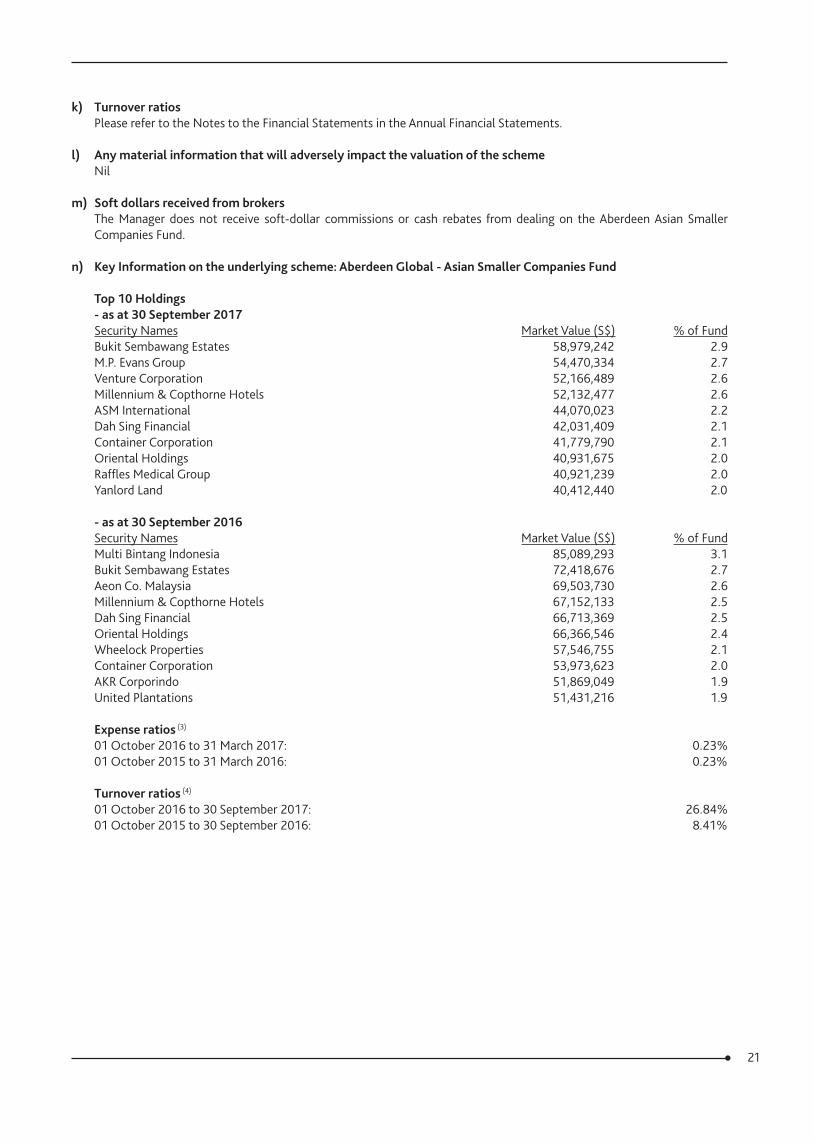
n) Key Information on the underlying scheme: Aberdeen Global ‑ Asian Smaller Companies Fund
Top 10 Holdings ‑ as at 30 September 2017Security Names Market Value (S$) % of Fund Bukit Sembawang Estates 58,979,242 2.9 M.P. Evans Group 54,470,334 2.7 Venture Corporation 52,166,489 2.6 Millennium & Copthorne Hotels 52,132,477 2.6 ASM International 44,070,023 2.2 Dah Sing Financial 42,031,409 2.1 Container Corporation 41,779,790 2.1 Oriental Holdings 40,931,675 2.0 Raffles Medical Group 40,921,239 2.0 Yanlord Land 40,412,440 2.0
‑ as at 30 September 2016Security Names Market Value (S$) % of Fund Multi Bintang Indonesia 85,089,293 3.1 Bukit Sembawang Estates 72,418,676 2.7 Aeon Co. Malaysia 69,503,730 2.6 Millennium & Copthorne Hotels 67,152,133 2.5 Dah Sing Financial 66,713,369 2.5 Oriental Holdings 66,366,546 2.4 Wheelock Properties 57,546,755 2.1 Container Corporation 53,973,623 2.0 AKR Corporindo 51,869,049 1.9 United Plantations 51,431,216 1.9
Expense ratios (3)
01 October 2016 to 31 March 2017: 0.23% 01 October 2015 to 31 March 2016: 0.23%
Turnover ratios (4)
01 October 2016 to 30 September 2017: 26.84% 01 October 2015 to 30 September 2016: 8.41%
22
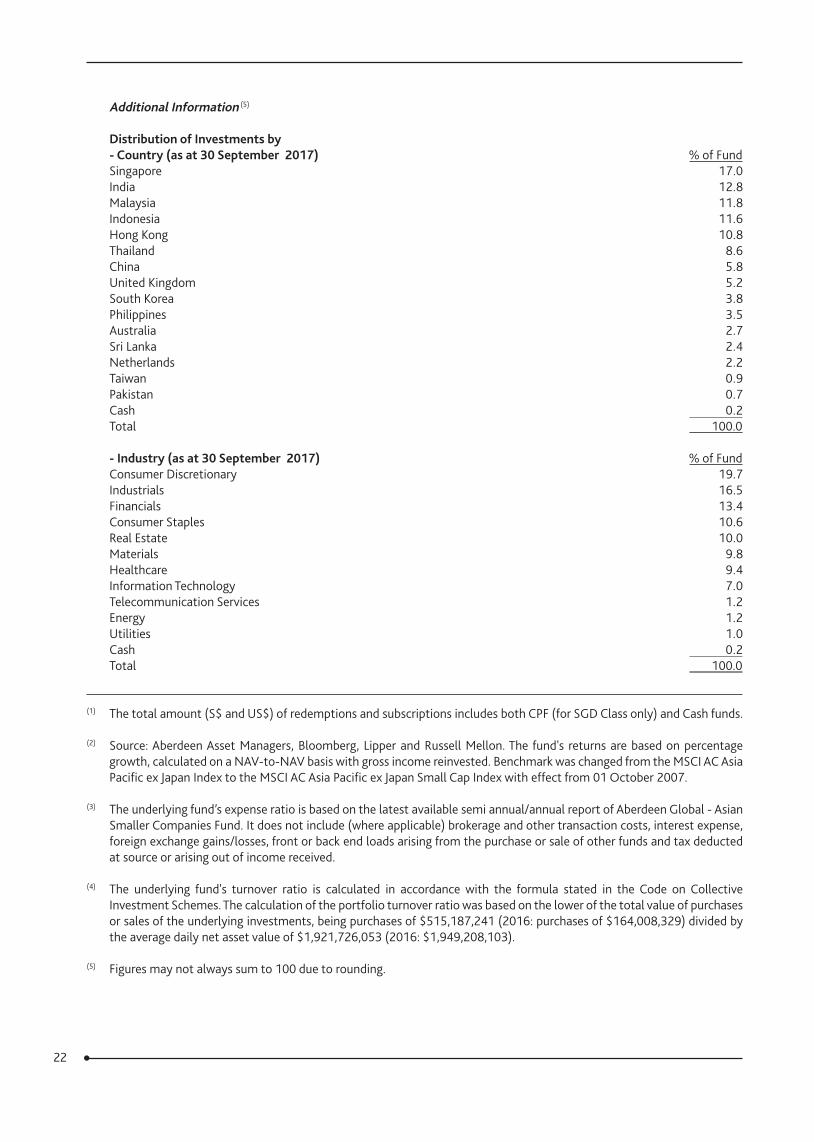
Additional Information (5)
Distribution of Investments by‑ Country (as at 30 September 2017) % of FundSingapore 17.0 India 12.8 Malaysia 11.8 Indonesia 11.6 Hong Kong 10.8 Thailand 8.6 China 5.8 United Kingdom 5.2 South Korea 3.8 Philippines 3.5 Australia 2.7 Sri Lanka 2.4 Netherlands 2.2 Taiwan 0.9 Pakistan 0.7 Cash 0.2 Total 100.0
‑ Industry (as at 30 September 2017) % of FundConsumer Discretionary 19.7 Industrials 16.5 Financials 13.4 Consumer Staples 10.6 Real Estate 10.0 Materials 9.8 Healthcare 9.4 Information Technology 7.0 Telecommunication Services 1.2 Energy 1.2 Utilities 1.0 Cash 0.2 Total 100.0
(1) The total amount (S$ and US$) of redemptions and subscriptions includes both CPF (for SGD Class only) and Cash funds.
(2) Source: Aberdeen Asset Managers, Bloomberg, Lipper and Russell Mellon. The fund's returns are based on percentage growth, calculated on a NAV-to-NAV basis with gross income reinvested. Benchmark was changed from the MSCI AC Asia Pacific ex Japan Index to the MSCI AC Asia Pacific ex Japan Small Cap Index with effect from 01 October 2007.
(3) The underlying fund’s expense ratio is based on the latest available semi annual/annual report of Aberdeen Global - Asian Smaller Companies Fund. It does not include (where applicable) brokerage and other transaction costs, interest expense, foreign exchange gains/losses, front or back end loads arising from the purchase or sale of other funds and tax deducted at source or arising out of income received.
(4) The underlying fund's turnover ratio is calculated in accordance with the formula stated in the Code on Collective Investment Schemes. The calculation of the portfolio turnover ratio was based on the lower of the total value of purchases or sales of the underlying investments, being purchases of $515,187,241 (2016: purchases of $164,008,329) divided by the average daily net asset value of $1,921,726,053 (2016: $1,949,208,103).
(5) Figures may not always sum to 100 due to rounding.

23
Report to Unitholders for the year ended 30 September 2017Aberdeen China Opportunities Fund
a) Classification of InvestmentsPlease refer to the Statement of Portfolio in the Annual Financial Statements.
b) Credit Rating of Debt SecuritiesN/A
c) Top 10 HoldingsPlease refer to the Key Information on the underlying scheme.
d) Exposure to derivativesNil
e) Investment in other schemesSecurity Name Market Value (S$) % of Fund Aberdeen Global - Chinese Equity Fund 152,873,425 99.35
f) Borrowings of total fund sizeNil
g) Amount of redemptions and subscriptions (1)
Redemptions: S$ 103,137,075 Subscriptions: S$ 15,334,069
h) Amount of Related‑Party TransactionsThe Manager's management fee is currently set at 1.5% p.a. (subject to a maximum of 2.5% p.a.).
The investment manager of Aberdeen Global - Chinese Equity Fund (“Underlying Fund”) is Aberdeen International Fund Managers Limited and the investment adviser is Aberdeen Asset Management Asia Limited. Please note that there is no double charging of management and advisory fees as the Sub-fund invests into the Z-class shares of the Underlying Fund, which do not charge management and advisory fees.
In addition, the Manager has agreed to reimburse expenses for certain sub-funds if expense ratios exceed 1.75% for financial year 2017 (2016: 1.75%).
Please refer to the Notes to the Financial Statements in the Annual Financial Statements.
i) Performance of the Scheme (2)
SGD Class Cumulative Annualised
Period 3-mth 6-mth 1-yr 3-yr 5-yr 10-yrSince
inception* 3-yr 5-yr 10-yrSince
inception*Fund (%) 0.65 5.54 18.60 18.76 29.96 7.83 262.05 5.89 5.38 0.76 8.25Benchmark (%) 10.63 19.58 28.03 50.29 85.80 25.44 N/A 14.53 13.18 2.29 N/A(*) Inception Date: 13/07/2001
USD Class Cumulative Annualised
Period 3-mth 6-mth 1-yr 3-yr 5-yr 10-yrSince
inception** 3-yr 5-yr 10-yrSince
inception**Fund (%) 2.01 8.56 18.96 11.32 17.13 17.13 183.57 3.64 3.21 1.59 8.13Benchmark (%) 12.17 23.05 28.55 41.15 67.84 37.13 429.10 12.16 10.91 3.21 13.30(**) Inception Date: 01/06/2004
j) Expense ratios
Please refer to the Notes to the Financial Statements in the Annual Financial Statements.
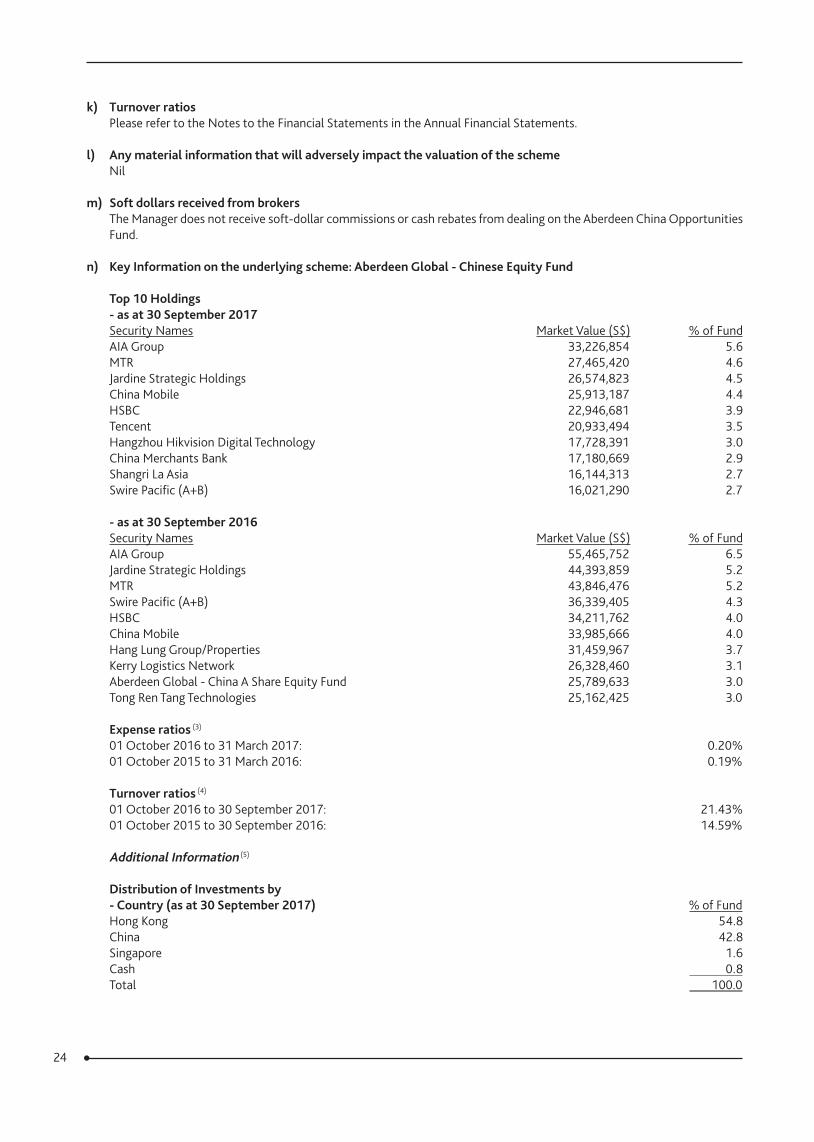
24
k) Turnover ratios Please refer to the Notes to the Financial Statements in the Annual Financial Statements.
l) Any material information that will adversely impact the valuation of the schemeNil
m) Soft dollars received from brokersThe Manager does not receive soft-dollar commissions or cash rebates from dealing on the Aberdeen China Opportunities Fund.
n) Key Information on the underlying scheme: Aberdeen Global ‑ Chinese Equity Fund
Top 10 Holdings ‑ as at 30 September 2017Security Names Market Value (S$) % of Fund AIA Group 33,226,854 5.6 MTR 27,465,420 4.6 Jardine Strategic Holdings 26,574,823 4.5 China Mobile 25,913,187 4.4 HSBC 22,946,681 3.9 Tencent 20,933,494 3.5 Hangzhou Hikvision Digital Technology 17,728,391 3.0 China Merchants Bank 17,180,669 2.9 Shangri La Asia 16,144,313 2.7 Swire Pacific (A+B) 16,021,290 2.7
‑ as at 30 September 2016Security Names Market Value (S$) % of Fund AIA Group 55,465,752 6.5 Jardine Strategic Holdings 44,393,859 5.2 MTR 43,846,476 5.2 Swire Pacific (A+B) 36,339,405 4.3 HSBC 34,211,762 4.0 China Mobile 33,985,666 4.0 Hang Lung Group/Properties 31,459,967 3.7 Kerry Logistics Network 26,328,460 3.1 Aberdeen Global - China A Share Equity Fund 25,789,633 3.0 Tong Ren Tang Technologies 25,162,425 3.0
Expense ratios (3)
01 October 2016 to 31 March 2017: 0.20% 01 October 2015 to 31 March 2016: 0.19%
Turnover ratios (4)
01 October 2016 to 30 September 2017: 21.43% 01 October 2015 to 30 September 2016: 14.59%
Additional Information (5)
Distribution of Investments by‑ Country (as at 30 September 2017) % of FundHong Kong 54.8 China 42.8 Singapore 1.6 Cash 0.8 Total 100.0
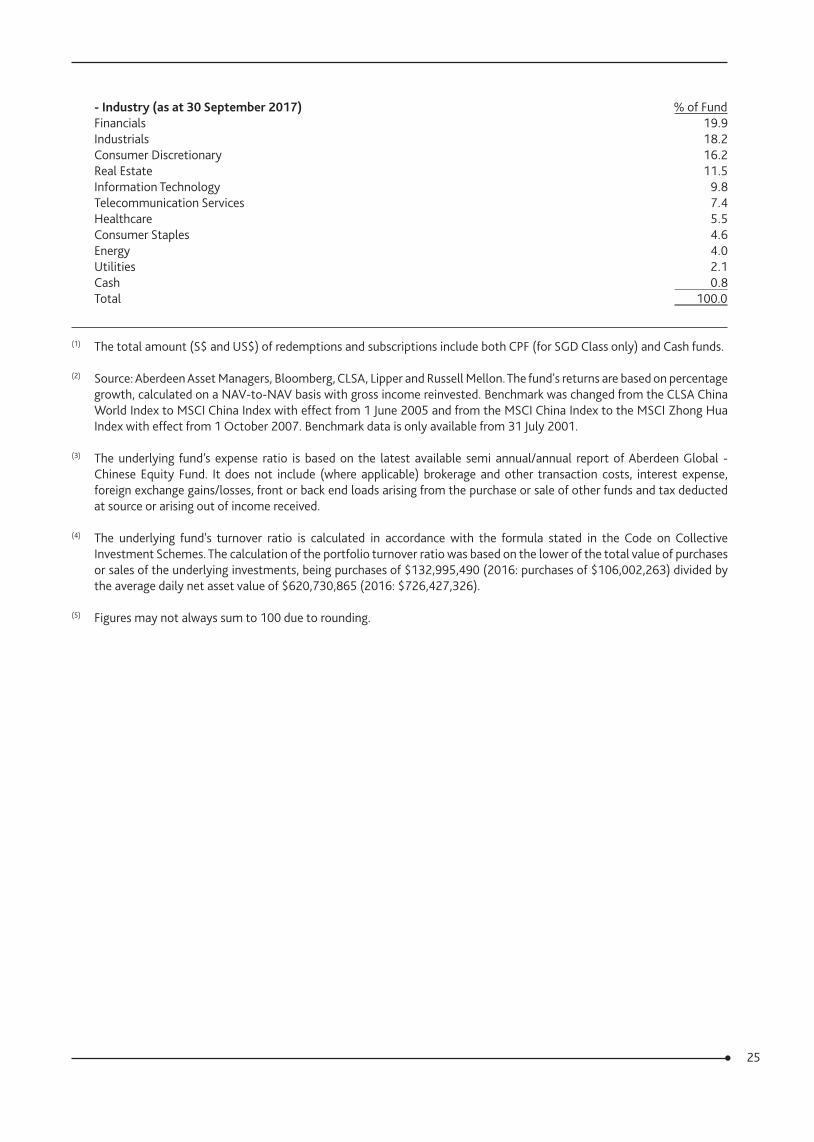
25
‑ Industry (as at 30 September 2017) % of FundFinancials 19.9 Industrials 18.2 Consumer Discretionary 16.2 Real Estate 11.5 Information Technology 9.8 Telecommunication Services 7.4 Healthcare 5.5 Consumer Staples 4.6 Energy 4.0 Utilities 2.1 Cash 0.8 Total 100.0
(1) The total amount (S$ and US$) of redemptions and subscriptions include both CPF (for SGD Class only) and Cash funds.
(2) Source: Aberdeen Asset Managers, Bloomberg, CLSA, Lipper and Russell Mellon. The fund's returns are based on percentage growth, calculated on a NAV-to-NAV basis with gross income reinvested. Benchmark was changed from the CLSA China World Index to MSCI China Index with effect from 1 June 2005 and from the MSCI China Index to the MSCI Zhong Hua Index with effect from 1 October 2007. Benchmark data is only available from 31 July 2001.
(3) The underlying fund’s expense ratio is based on the latest available semi annual/annual report of Aberdeen Global - Chinese Equity Fund. It does not include (where applicable) brokerage and other transaction costs, interest expense, foreign exchange gains/losses, front or back end loads arising from the purchase or sale of other funds and tax deducted at source or arising out of income received.
(4) The underlying fund's turnover ratio is calculated in accordance with the formula stated in the Code on Collective Investment Schemes. The calculation of the portfolio turnover ratio was based on the lower of the total value of purchases or sales of the underlying investments, being purchases of $132,995,490 (2016: purchases of $106,002,263) divided by the average daily net asset value of $620,730,865 (2016: $726,427,326).
(5) Figures may not always sum to 100 due to rounding.

26
Report to Unitholders for the year ended 30 September 2017Aberdeen European Opportunities Fund
a) Classification of InvestmentsPlease refer to the Statement of Portfolio in the Annual Financial Statements.
b) Credit Rating of Debt SecuritiesN/A
c) Top 10 HoldingsPlease refer to the Key Information on the underlying scheme.
d) Exposure to derivativesNil
e) Investment in other schemesSecurity Name Market Value (S$) % of Fund Aberdeen Global - European Equity Fund 34,175,809 98.68
f) Borrowings of total fund sizeNil
g) Amount of redemptions and subscriptions (1)
Redemptions: S$ 25,237,566 Subscriptions: S$ 7,412,623
h) Amount of Related‑Party TransactionsThe Manager's management fee is currently set at 1.5% p.a. (subject to a maximum of 2.5% p.a.).
The investment manager of Aberdeen Global - European Equity Fund (“Underlying Fund”) is Aberdeen International Fund Managers Limited and the investment adviser is Aberdeen Asset Managers Limited. Please note that there is no double charging of management and advisory fees as the Sub-fund invests into the Z-class shares of the Underlying Fund, which do not charge management and advisory fees.
In addition, the Manager has agreed to reimburse expenses for certain sub-funds if expense ratios exceed 1.75% for financial year 2017 (2016: 1.75%).
Please refer to the Notes to the Financial Statements in the Annual Financial Statements.
i) Performance of the Scheme (2)
SGD Class Cumulative Annualised
Period 3-mth 6-mth 1-yr 3-yr 5-yr 10-yrSince
inception* 3-yr 5-yr 10-yrSince
inception*Fund (%) 1.87 9.71 17.61 10.10 37.41 -15.75 49.48 3.26 6.56 -1.70 2.12Benchmark (%) 5.03 11.73 22.65 23.49 70.37 8.36 100.35 7.28 11.24 0.81 3.70(*) Inception Date: 14/08/1998
j) Expense ratios Please refer to the Notes to the Financial Statements in the Annual Financial Statements.
k) Turnover ratios Please refer to the Notes to the Financial Statements in the Annual Financial Statements.
l) Any material information that will adversely impact the valuation of the schemeNil
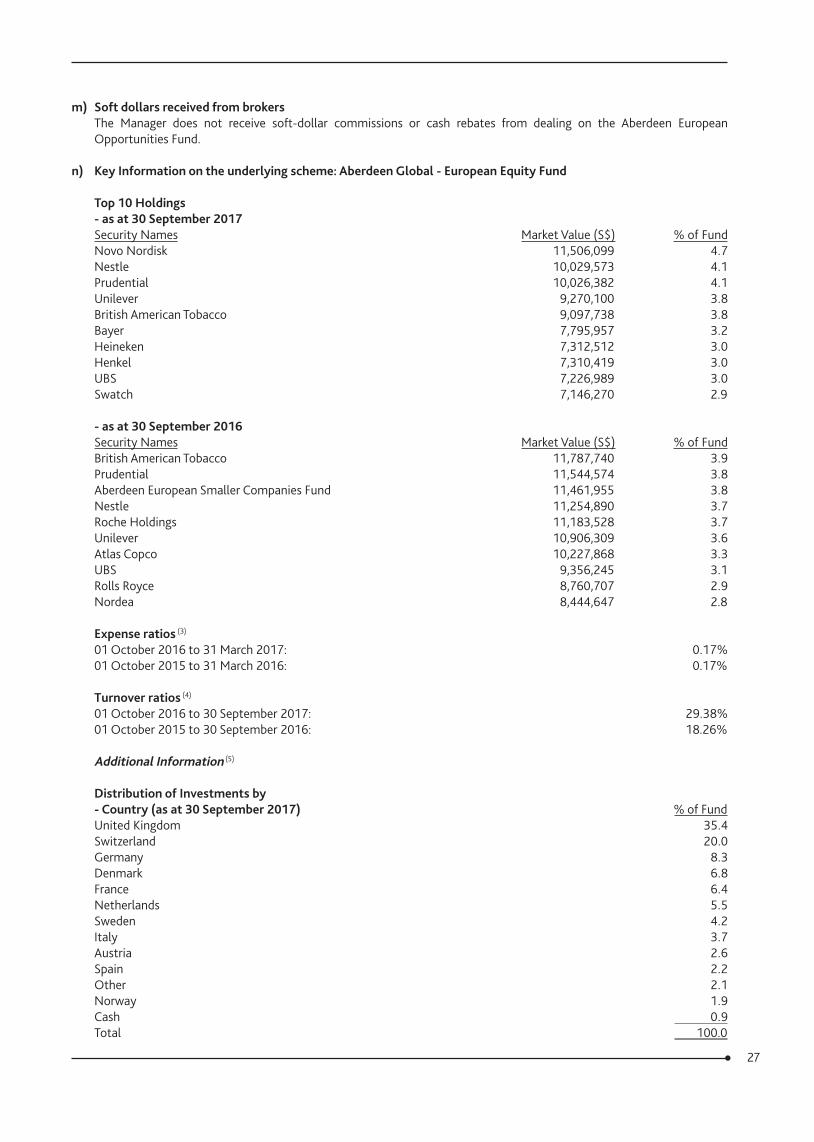
27
m) Soft dollars received from brokersThe Manager does not receive soft-dollar commissions or cash rebates from dealing on the Aberdeen European Opportunities Fund.
n) Key Information on the underlying scheme: Aberdeen Global ‑ European Equity Fund
Top 10 Holdings ‑ as at 30 September 2017Security Names Market Value (S$) % of Fund Novo Nordisk 11,506,099 4.7 Nestle 10,029,573 4.1 Prudential 10,026,382 4.1 Unilever 9,270,100 3.8 British American Tobacco 9,097,738 3.8 Bayer 7,795,957 3.2 Heineken 7,312,512 3.0 Henkel 7,310,419 3.0 UBS 7,226,989 3.0 Swatch 7,146,270 2.9
‑ as at 30 September 2016Security Names Market Value (S$) % of Fund British American Tobacco 11,787,740 3.9 Prudential 11,544,574 3.8 Aberdeen European Smaller Companies Fund 11,461,955 3.8 Nestle 11,254,890 3.7 Roche Holdings 11,183,528 3.7 Unilever 10,906,309 3.6 Atlas Copco 10,227,868 3.3 UBS 9,356,245 3.1 Rolls Royce 8,760,707 2.9 Nordea 8,444,647 2.8
Expense ratios (3)
01 October 2016 to 31 March 2017: 0.17% 01 October 2015 to 31 March 2016: 0.17%
Turnover ratios (4)
01 October 2016 to 30 September 2017: 29.38% 01 October 2015 to 30 September 2016: 18.26%
Additional Information (5)
Distribution of Investments by‑ Country (as at 30 September 2017) % of FundUnited Kingdom 35.4 Switzerland 20.0 Germany 8.3 Denmark 6.8 France 6.4 Netherlands 5.5 Sweden 4.2 Italy 3.7 Austria 2.6 Spain 2.2 Other 2.1 Norway 1.9 Cash 0.9 Total 100.0
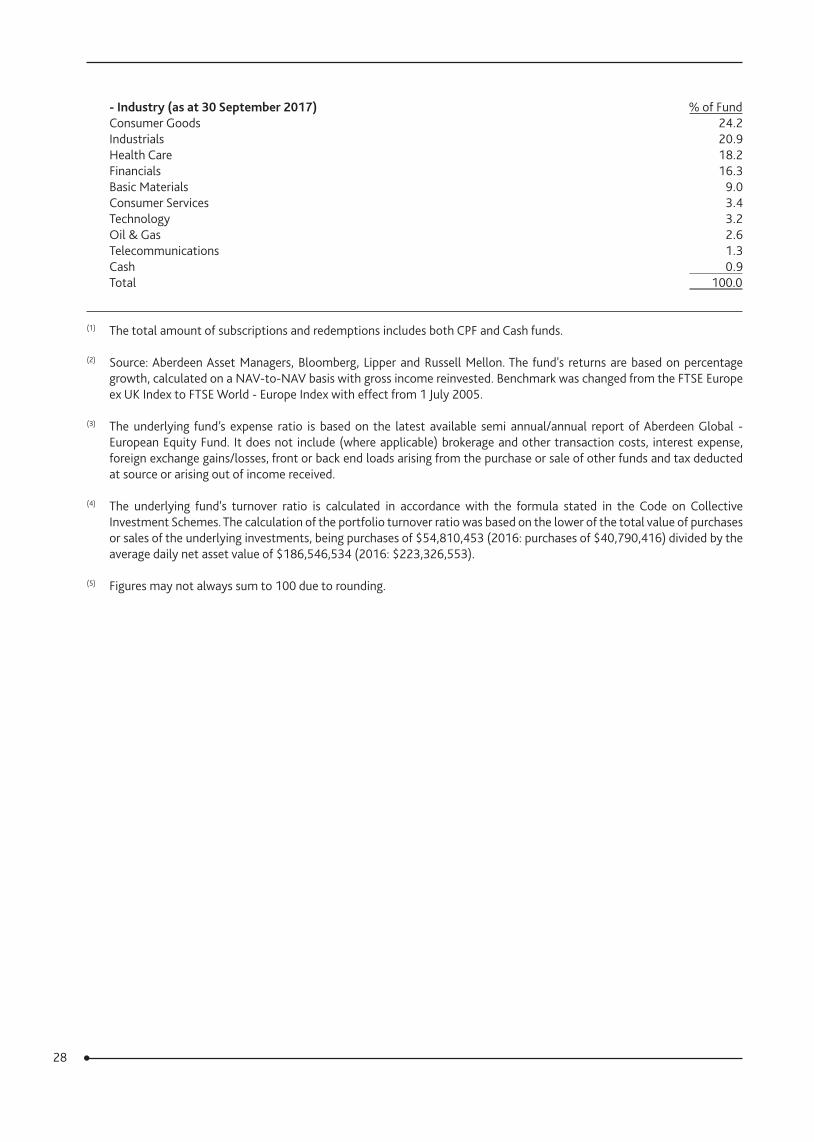
28
‑ Industry (as at 30 September 2017) % of FundConsumer Goods 24.2 Industrials 20.9 Health Care 18.2 Financials 16.3 Basic Materials 9.0 Consumer Services 3.4 Technology 3.2 Oil & Gas 2.6 Telecommunications 1.3 Cash 0.9 Total 100.0
(1) The total amount of subscriptions and redemptions includes both CPF and Cash funds.
(2) Source: Aberdeen Asset Managers, Bloomberg, Lipper and Russell Mellon. The fund's returns are based on percentage growth, calculated on a NAV-to-NAV basis with gross income reinvested. Benchmark was changed from the FTSE Europe ex UK Index to FTSE World - Europe Index with effect from 1 July 2005.
(3) The underlying fund’s expense ratio is based on the latest available semi annual/annual report of Aberdeen Global - European Equity Fund. It does not include (where applicable) brokerage and other transaction costs, interest expense, foreign exchange gains/losses, front or back end loads arising from the purchase or sale of other funds and tax deducted at source or arising out of income received.
(4) The underlying fund's turnover ratio is calculated in accordance with the formula stated in the Code on Collective Investment Schemes. The calculation of the portfolio turnover ratio was based on the lower of the total value of purchases or sales of the underlying investments, being purchases of $54,810,453 (2016: purchases of $40,790,416) divided by the average daily net asset value of $186,546,534 (2016: $223,326,553).
(5) Figures may not always sum to 100 due to rounding.
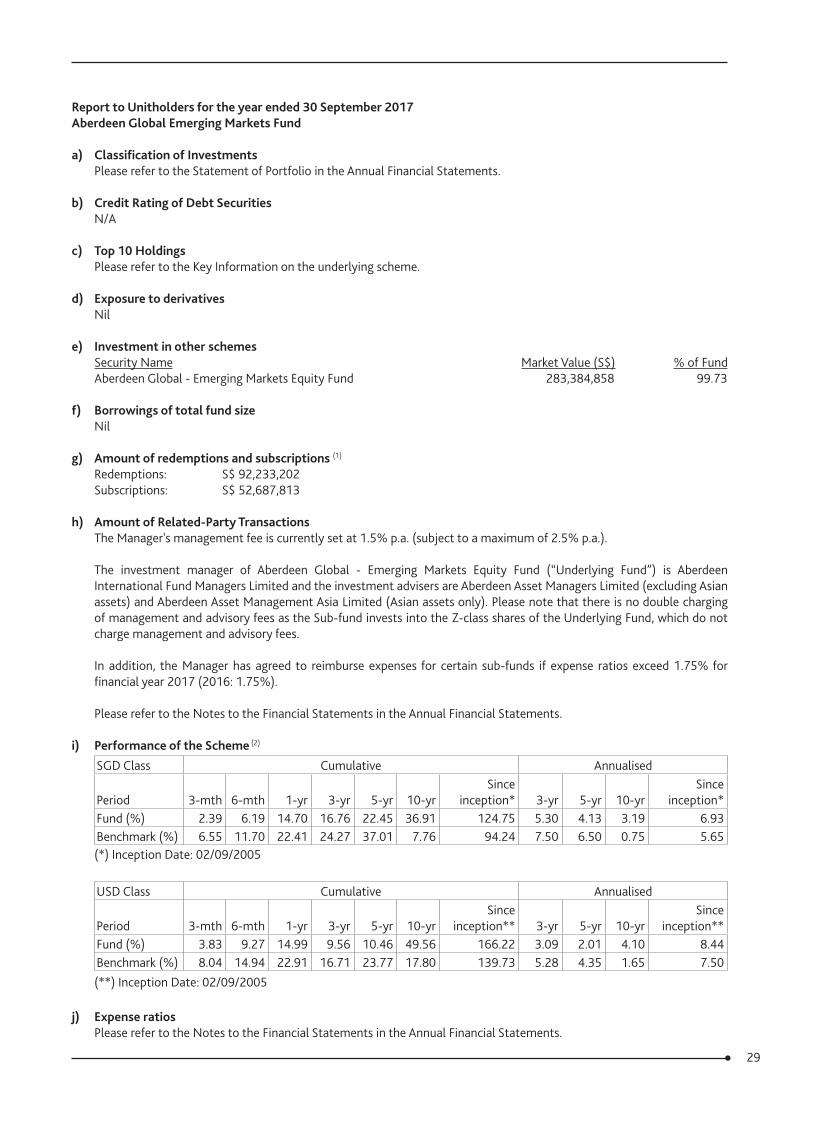
29
Report to Unitholders for the year ended 30 September 2017Aberdeen Global Emerging Markets Fund
a) Classification of InvestmentsPlease refer to the Statement of Portfolio in the Annual Financial Statements.
b) Credit Rating of Debt SecuritiesN/A
c) Top 10 HoldingsPlease refer to the Key Information on the underlying scheme.
d) Exposure to derivativesNil
e) Investment in other schemesSecurity Name Market Value (S$) % of Fund Aberdeen Global - Emerging Markets Equity Fund 283,384,858 99.73
f) Borrowings of total fund sizeNil
g) Amount of redemptions and subscriptions (1)
Redemptions: S$ 92,233,202 Subscriptions: S$ 52,687,813
h) Amount of Related‑Party TransactionsThe Manager's management fee is currently set at 1.5% p.a. (subject to a maximum of 2.5% p.a.).
The investment manager of Aberdeen Global - Emerging Markets Equity Fund (“Underlying Fund”) is Aberdeen International Fund Managers Limited and the investment advisers are Aberdeen Asset Managers Limited (excluding Asian assets) and Aberdeen Asset Management Asia Limited (Asian assets only). Please note that there is no double charging of management and advisory fees as the Sub-fund invests into the Z-class shares of the Underlying Fund, which do not charge management and advisory fees.
In addition, the Manager has agreed to reimburse expenses for certain sub-funds if expense ratios exceed 1.75% for financial year 2017 (2016: 1.75%).
Please refer to the Notes to the Financial Statements in the Annual Financial Statements.
i) Performance of the Scheme (2)
SGD Class Cumulative Annualised
Period 3-mth 6-mth 1-yr 3-yr 5-yr 10-yrSince
inception* 3-yr 5-yr 10-yrSince
inception*Fund (%) 2.39 6.19 14.70 16.76 22.45 36.91 124.75 5.30 4.13 3.19 6.93Benchmark (%) 6.55 11.70 22.41 24.27 37.01 7.76 94.24 7.50 6.50 0.75 5.65(*) Inception Date: 02/09/2005
USD Class Cumulative Annualised
Period 3-mth 6-mth 1-yr 3-yr 5-yr 10-yrSince
inception** 3-yr 5-yr 10-yrSince
inception**Fund (%) 3.83 9.27 14.99 9.56 10.46 49.56 166.22 3.09 2.01 4.10 8.44Benchmark (%) 8.04 14.94 22.91 16.71 23.77 17.80 139.73 5.28 4.35 1.65 7.50(**) Inception Date: 02/09/2005
j) Expense ratios
Please refer to the Notes to the Financial Statements in the Annual Financial Statements.
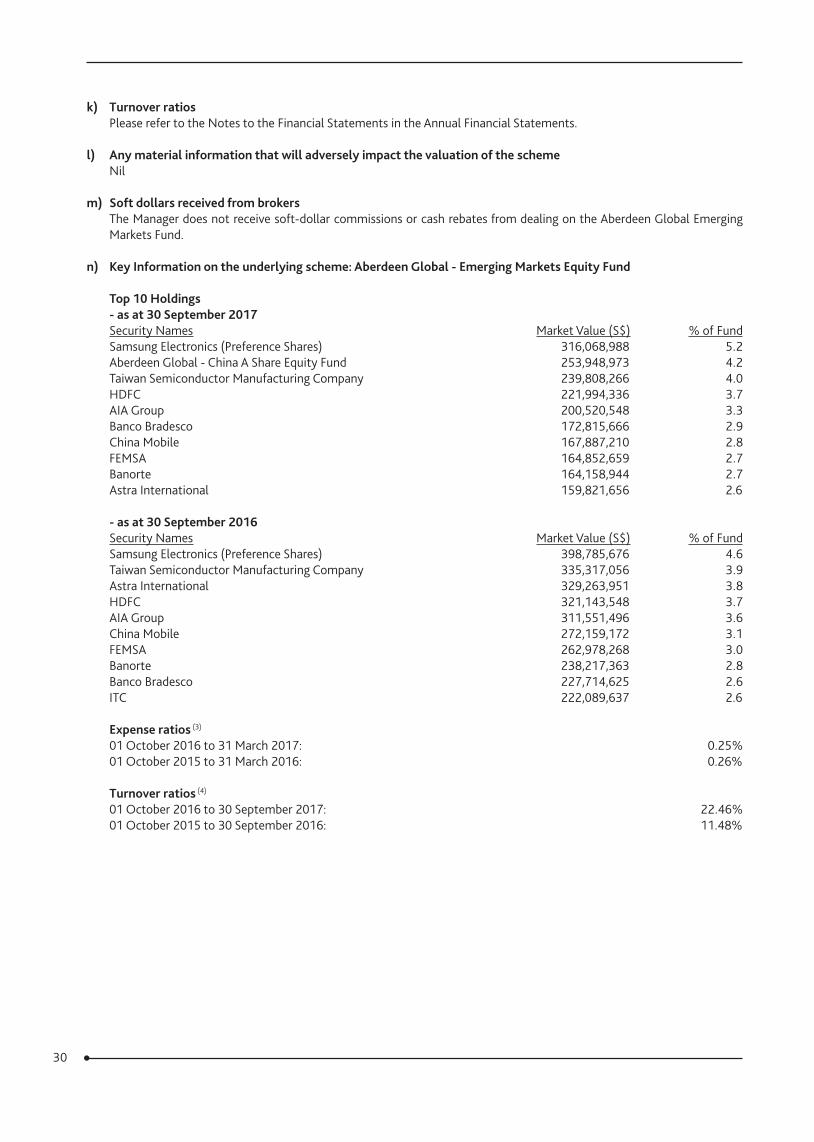
30
k) Turnover ratios Please refer to the Notes to the Financial Statements in the Annual Financial Statements.
l) Any material information that will adversely impact the valuation of the schemeNil
m) Soft dollars received from brokersThe Manager does not receive soft-dollar commissions or cash rebates from dealing on the Aberdeen Global Emerging Markets Fund.
n) Key Information on the underlying scheme: Aberdeen Global ‑ Emerging Markets Equity Fund
Top 10 Holdings ‑ as at 30 September 2017Security Names Market Value (S$) % of Fund Samsung Electronics (Preference Shares) 316,068,988 5.2 Aberdeen Global - China A Share Equity Fund 253,948,973 4.2 Taiwan Semiconductor Manufacturing Company 239,808,266 4.0 HDFC 221,994,336 3.7 AIA Group 200,520,548 3.3 Banco Bradesco 172,815,666 2.9 China Mobile 167,887,210 2.8 FEMSA 164,852,659 2.7 Banorte 164,158,944 2.7 Astra International 159,821,656 2.6
‑ as at 30 September 2016Security Names Market Value (S$) % of Fund Samsung Electronics (Preference Shares) 398,785,676 4.6 Taiwan Semiconductor Manufacturing Company 335,317,056 3.9 Astra International 329,263,951 3.8 HDFC 321,143,548 3.7 AIA Group 311,551,496 3.6 China Mobile 272,159,172 3.1 FEMSA 262,978,268 3.0 Banorte 238,217,363 2.8 Banco Bradesco 227,714,625 2.6 ITC 222,089,637 2.6
Expense ratios (3)
01 October 2016 to 31 March 2017: 0.25% 01 October 2015 to 31 March 2016: 0.26%
Turnover ratios (4)
01 October 2016 to 30 September 2017: 22.46% 01 October 2015 to 30 September 2016: 11.48%
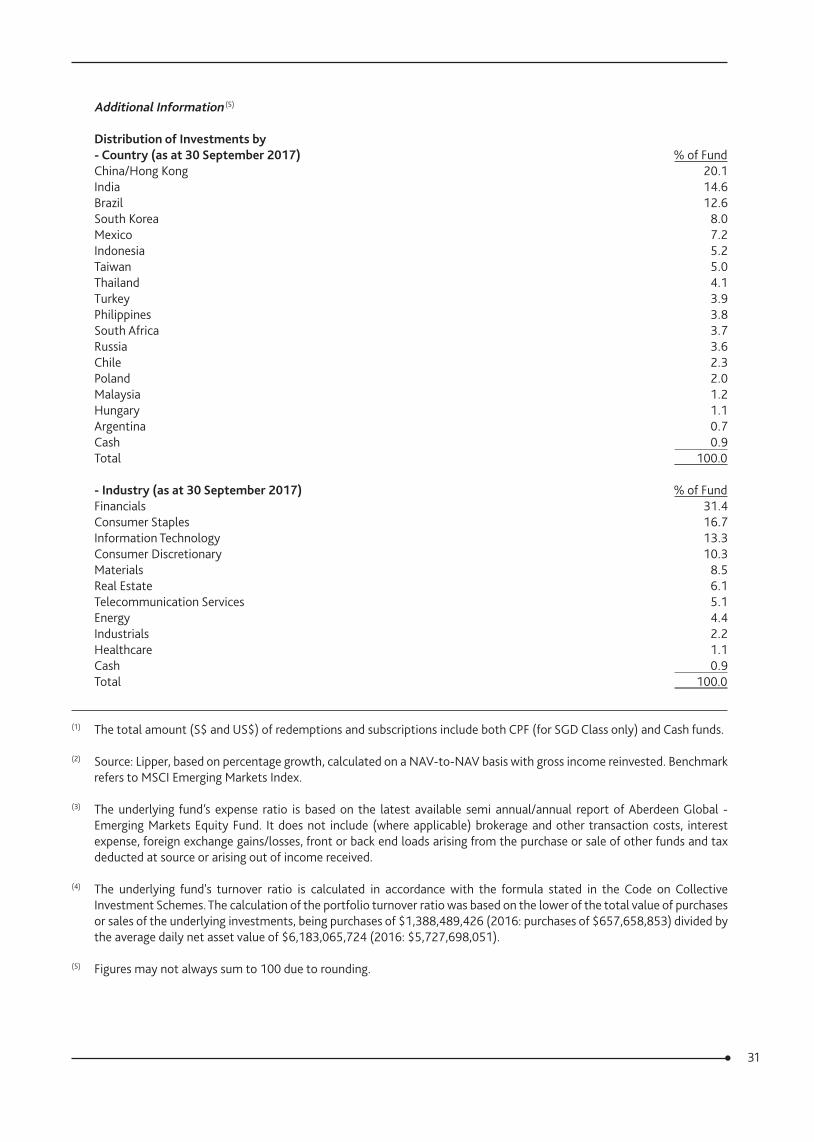
31
Additional Information (5)
Distribution of Investments by‑ Country (as at 30 September 2017) % of FundChina/Hong Kong 20.1 India 14.6 Brazil 12.6 South Korea 8.0 Mexico 7.2 Indonesia 5.2 Taiwan 5.0 Thailand 4.1 Turkey 3.9 Philippines 3.8 South Africa 3.7 Russia 3.6 Chile 2.3 Poland 2.0 Malaysia 1.2 Hungary 1.1 Argentina 0.7 Cash 0.9 Total 100.0
‑ Industry (as at 30 September 2017) % of FundFinancials 31.4 Consumer Staples 16.7 Information Technology 13.3 Consumer Discretionary 10.3 Materials 8.5 Real Estate 6.1 Telecommunication Services 5.1 Energy 4.4 Industrials 2.2 Healthcare 1.1 Cash 0.9 Total 100.0
(1) The total amount (S$ and US$) of redemptions and subscriptions include both CPF (for SGD Class only) and Cash funds.
(2) Source: Lipper, based on percentage growth, calculated on a NAV-to-NAV basis with gross income reinvested. Benchmark refers to MSCI Emerging Markets Index.
(3) The underlying fund’s expense ratio is based on the latest available semi annual/annual report of Aberdeen Global - Emerging Markets Equity Fund. It does not include (where applicable) brokerage and other transaction costs, interest expense, foreign exchange gains/losses, front or back end loads arising from the purchase or sale of other funds and tax deducted at source or arising out of income received.
(4) The underlying fund's turnover ratio is calculated in accordance with the formula stated in the Code on Collective Investment Schemes. The calculation of the portfolio turnover ratio was based on the lower of the total value of purchases or sales of the underlying investments, being purchases of $1,388,489,426 (2016: purchases of $657,658,853) divided by the average daily net asset value of $6,183,065,724 (2016: $5,727,698,051).
(5) Figures may not always sum to 100 due to rounding.
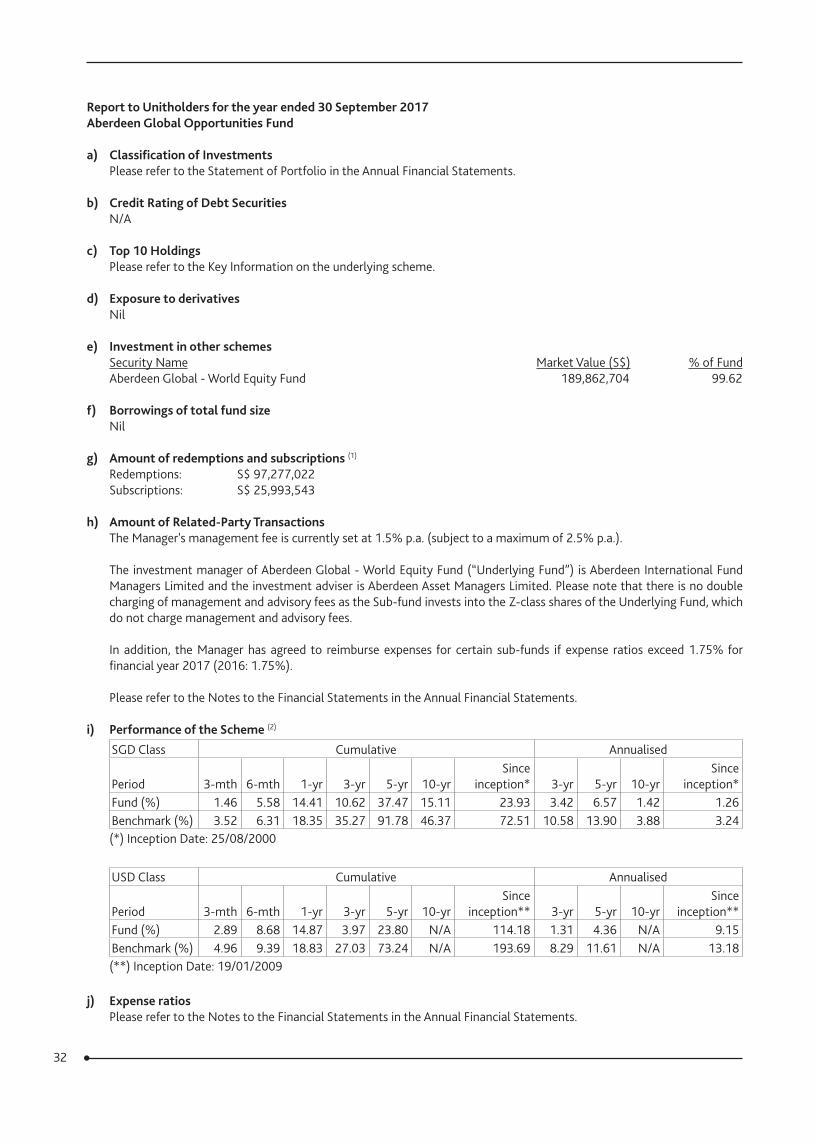
32
Report to Unitholders for the year ended 30 September 2017Aberdeen Global Opportunities Fund
a) Classification of InvestmentsPlease refer to the Statement of Portfolio in the Annual Financial Statements.
b) Credit Rating of Debt SecuritiesN/A
c) Top 10 HoldingsPlease refer to the Key Information on the underlying scheme.
d) Exposure to derivativesNil
e) Investment in other schemesSecurity Name Market Value (S$) % of Fund Aberdeen Global - World Equity Fund 189,862,704 99.62
f) Borrowings of total fund sizeNil
g) Amount of redemptions and subscriptions (1)
Redemptions: S$ 97,277,022 Subscriptions: S$ 25,993,543
h) Amount of Related‑Party TransactionsThe Manager's management fee is currently set at 1.5% p.a. (subject to a maximum of 2.5% p.a.).
The investment manager of Aberdeen Global - World Equity Fund (“Underlying Fund”) is Aberdeen International Fund Managers Limited and the investment adviser is Aberdeen Asset Managers Limited. Please note that there is no double charging of management and advisory fees as the Sub-fund invests into the Z-class shares of the Underlying Fund, which do not charge management and advisory fees.
In addition, the Manager has agreed to reimburse expenses for certain sub-funds if expense ratios exceed 1.75% for financial year 2017 (2016: 1.75%).
Please refer to the Notes to the Financial Statements in the Annual Financial Statements.
i) Performance of the Scheme (2)
SGD Class Cumulative Annualised
Period 3-mth 6-mth 1-yr 3-yr 5-yr 10-yrSince
inception* 3-yr 5-yr 10-yrSince
inception*Fund (%) 1.46 5.58 14.41 10.62 37.47 15.11 23.93 3.42 6.57 1.42 1.26Benchmark (%) 3.52 6.31 18.35 35.27 91.78 46.37 72.51 10.58 13.90 3.88 3.24(*) Inception Date: 25/08/2000
USD Class Cumulative Annualised
Period 3-mth 6-mth 1-yr 3-yr 5-yr 10-yrSince
inception** 3-yr 5-yr 10-yrSince
inception**Fund (%) 2.89 8.68 14.87 3.97 23.80 N/A 114.18 1.31 4.36 N/A 9.15Benchmark (%) 4.96 9.39 18.83 27.03 73.24 N/A 193.69 8.29 11.61 N/A 13.18(**) Inception Date: 19/01/2009
j) Expense ratios Please refer to the Notes to the Financial Statements in the Annual Financial Statements.
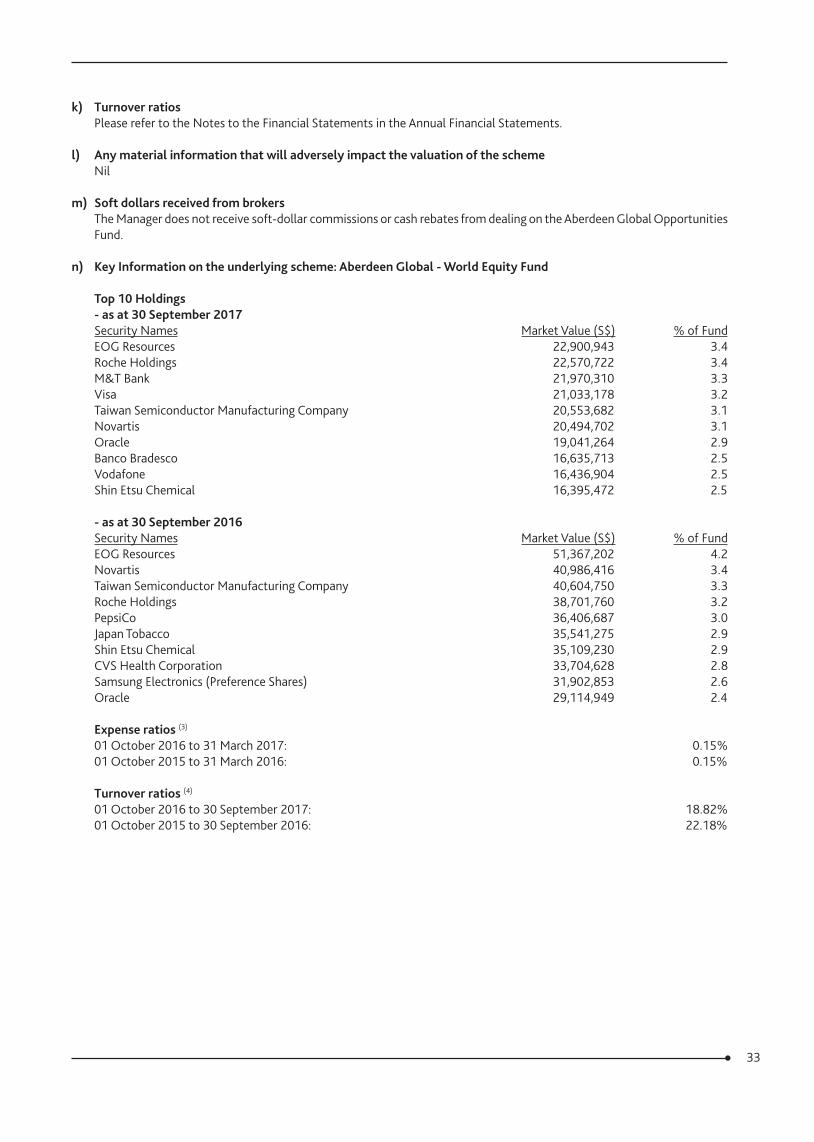
33
k) Turnover ratios Please refer to the Notes to the Financial Statements in the Annual Financial Statements.
l) Any material information that will adversely impact the valuation of the schemeNil
m) Soft dollars received from brokersThe Manager does not receive soft-dollar commissions or cash rebates from dealing on the Aberdeen Global Opportunities Fund.
n) Key Information on the underlying scheme: Aberdeen Global ‑ World Equity Fund
Top 10 Holdings ‑ as at 30 September 2017Security Names Market Value (S$) % of Fund EOG Resources 22,900,943 3.4 Roche Holdings 22,570,722 3.4 M&T Bank 21,970,310 3.3 Visa 21,033,178 3.2 Taiwan Semiconductor Manufacturing Company 20,553,682 3.1 Novartis 20,494,702 3.1 Oracle 19,041,264 2.9 Banco Bradesco 16,635,713 2.5 Vodafone 16,436,904 2.5 Shin Etsu Chemical 16,395,472 2.5
‑ as at 30 September 2016Security Names Market Value (S$) % of Fund EOG Resources 51,367,202 4.2 Novartis 40,986,416 3.4 Taiwan Semiconductor Manufacturing Company 40,604,750 3.3 Roche Holdings 38,701,760 3.2 PepsiCo 36,406,687 3.0 Japan Tobacco 35,541,275 2.9 Shin Etsu Chemical 35,109,230 2.9 CVS Health Corporation 33,704,628 2.8 Samsung Electronics (Preference Shares) 31,902,853 2.6 Oracle 29,114,949 2.4
Expense ratios (3) 01 October 2016 to 31 March 2017: 0.15% 01 October 2015 to 31 March 2016: 0.15%
Turnover ratios (4)
01 October 2016 to 30 September 2017: 18.82% 01 October 2015 to 30 September 2016: 22.18%
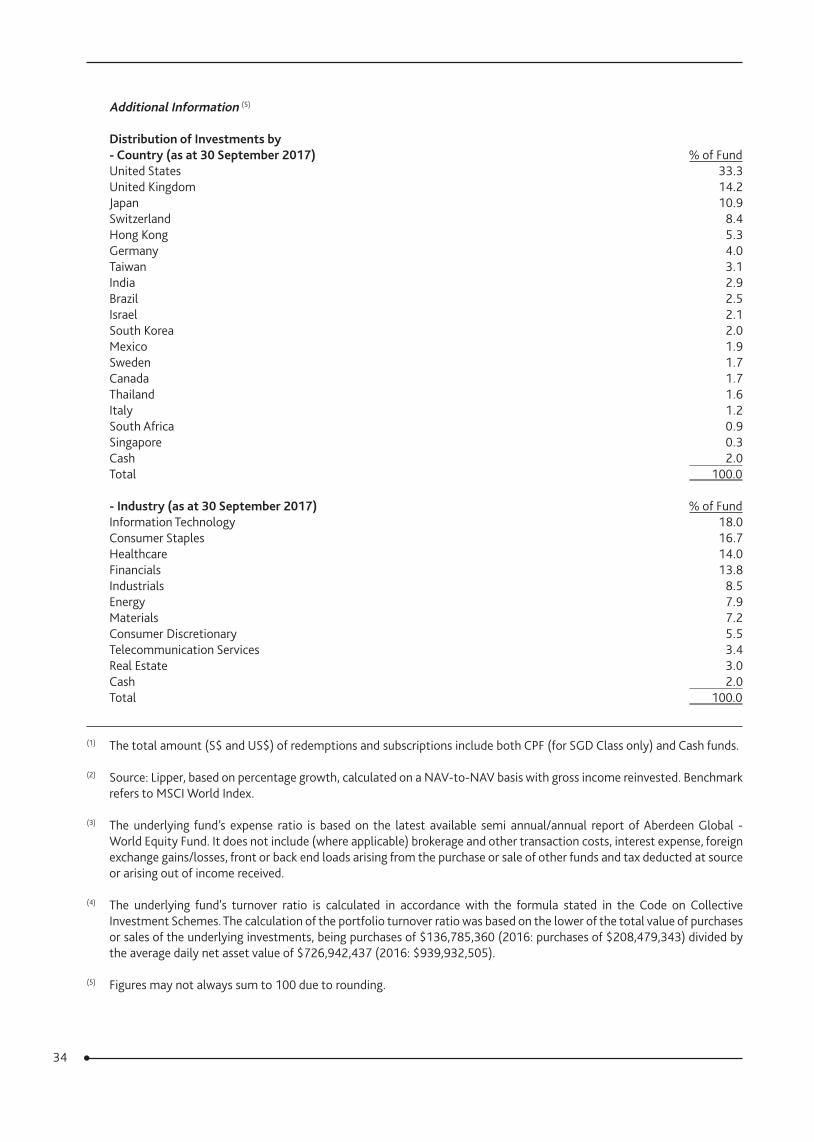
34
Additional Information (5)
Distribution of Investments by‑ Country (as at 30 September 2017) % of FundUnited States 33.3 United Kingdom 14.2 Japan 10.9 Switzerland 8.4 Hong Kong 5.3 Germany 4.0 Taiwan 3.1 India 2.9 Brazil 2.5 Israel 2.1 South Korea 2.0 Mexico 1.9 Sweden 1.7 Canada 1.7 Thailand 1.6 Italy 1.2 South Africa 0.9 Singapore 0.3 Cash 2.0 Total 100.0
‑ Industry (as at 30 September 2017) % of FundInformation Technology 18.0 Consumer Staples 16.7 Healthcare 14.0 Financials 13.8 Industrials 8.5 Energy 7.9 Materials 7.2 Consumer Discretionary 5.5 Telecommunication Services 3.4 Real Estate 3.0 Cash 2.0 Total 100.0
(1) The total amount (S$ and US$) of redemptions and subscriptions include both CPF (for SGD Class only) and Cash funds.
(2) Source: Lipper, based on percentage growth, calculated on a NAV-to-NAV basis with gross income reinvested. Benchmark refers to MSCI World Index.
(3) The underlying fund’s expense ratio is based on the latest available semi annual/annual report of Aberdeen Global - World Equity Fund. It does not include (where applicable) brokerage and other transaction costs, interest expense, foreign exchange gains/losses, front or back end loads arising from the purchase or sale of other funds and tax deducted at source or arising out of income received.
(4) The underlying fund's turnover ratio is calculated in accordance with the formula stated in the Code on Collective Investment Schemes. The calculation of the portfolio turnover ratio was based on the lower of the total value of purchases or sales of the underlying investments, being purchases of $136,785,360 (2016: purchases of $208,479,343) divided by the average daily net asset value of $726,942,437 (2016: $939,932,505).
(5) Figures may not always sum to 100 due to rounding.
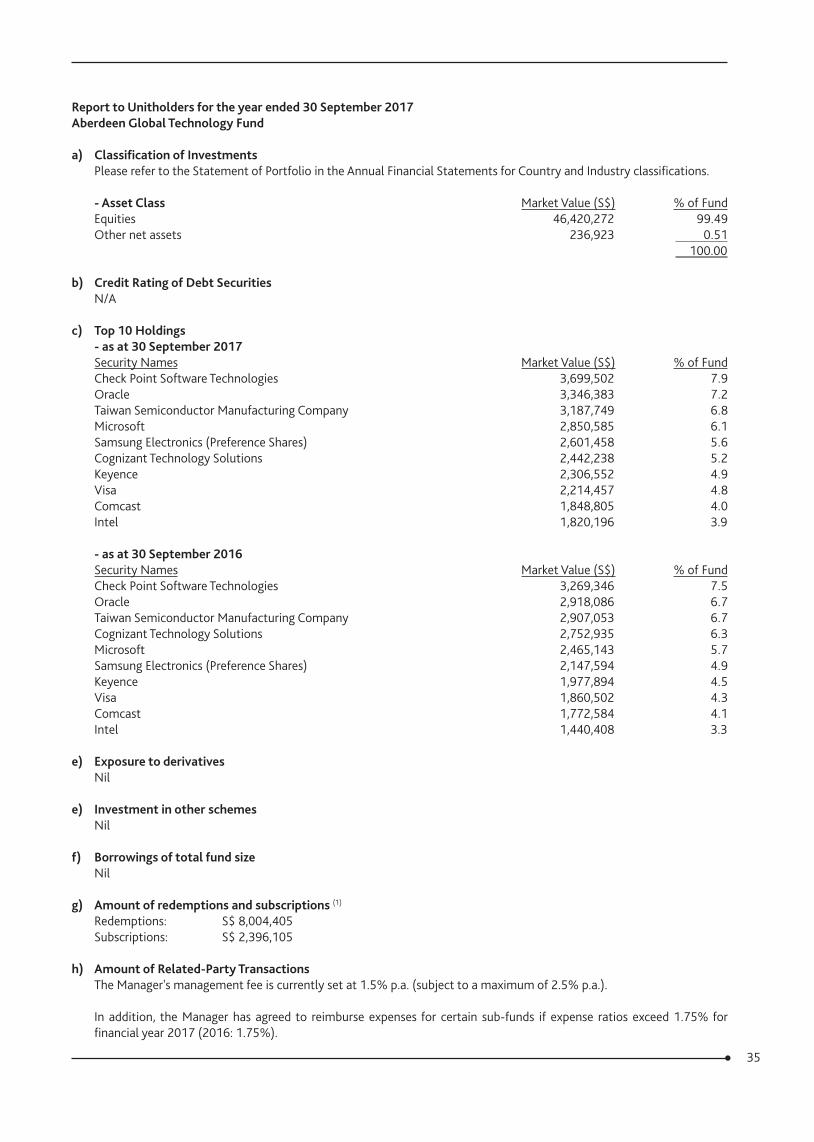
35
Report to Unitholders for the year ended 30 September 2017Aberdeen Global Technology Fund
a) Classification of InvestmentsPlease refer to the Statement of Portfolio in the Annual Financial Statements for Country and Industry classifications.
‑ Asset Class Market Value (S$) % of Fund Equities 46,420,272 99.49 Other net assets 236,923 0.51 100.00
b) Credit Rating of Debt SecuritiesN/A
c) Top 10 Holdings‑ as at 30 September 2017Security Names Market Value (S$) % of Fund Check Point Software Technologies 3,699,502 7.9 Oracle 3,346,383 7.2 Taiwan Semiconductor Manufacturing Company 3,187,749 6.8 Microsoft 2,850,585 6.1 Samsung Electronics (Preference Shares) 2,601,458 5.6 Cognizant Technology Solutions 2,442,238 5.2 Keyence 2,306,552 4.9 Visa 2,214,457 4.8 Comcast 1,848,805 4.0 Intel 1,820,196 3.9
‑ as at 30 September 2016Security Names Market Value (S$) % of Fund Check Point Software Technologies 3,269,346 7.5 Oracle 2,918,086 6.7 Taiwan Semiconductor Manufacturing Company 2,907,053 6.7 Cognizant Technology Solutions 2,752,935 6.3 Microsoft 2,465,143 5.7 Samsung Electronics (Preference Shares) 2,147,594 4.9 Keyence 1,977,894 4.5 Visa 1,860,502 4.3 Comcast 1,772,584 4.1 Intel 1,440,408 3.3
e) Exposure to derivativesNil
e) Investment in other schemesNil
f) Borrowings of total fund sizeNil
g) Amount of redemptions and subscriptions (1)
Redemptions: S$ 8,004,405 Subscriptions: S$ 2,396,105
h) Amount of Related‑Party TransactionsThe Manager's management fee is currently set at 1.5% p.a. (subject to a maximum of 2.5% p.a.).
In addition, the Manager has agreed to reimburse expenses for certain sub-funds if expense ratios exceed 1.75% for financial year 2017 (2016: 1.75%).
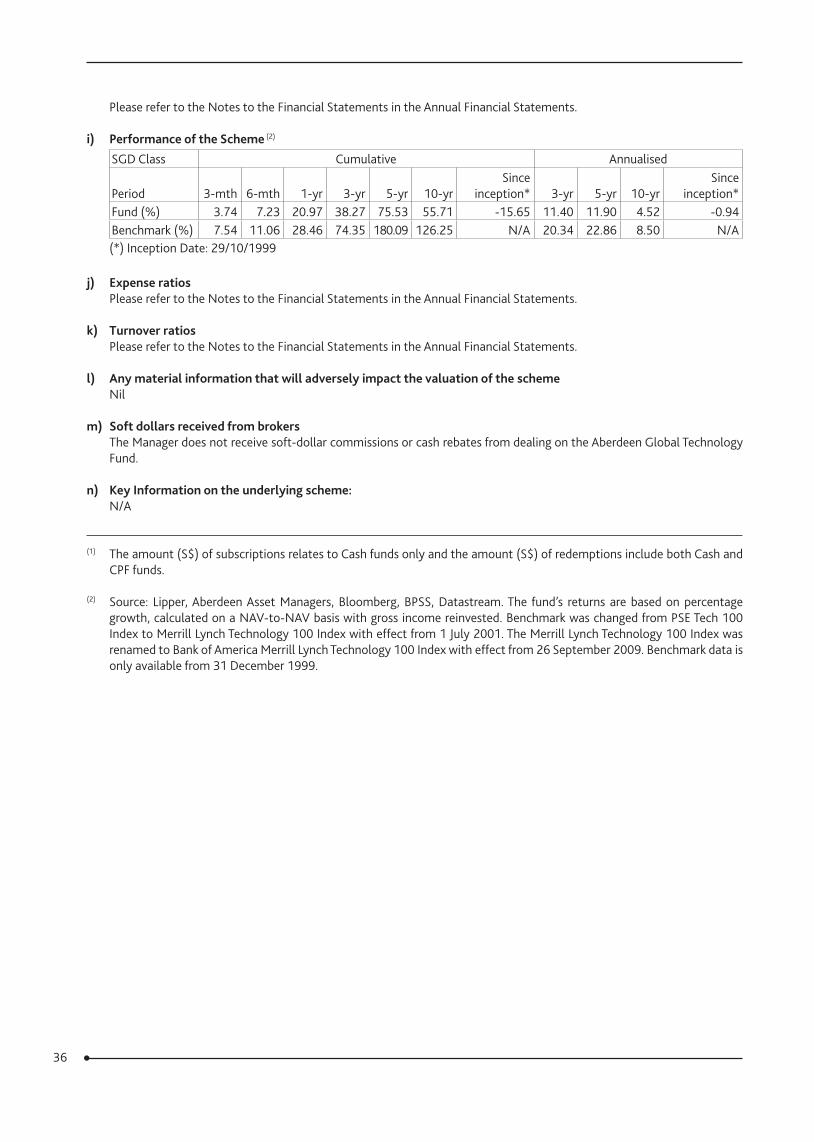
36
Please refer to the Notes to the Financial Statements in the Annual Financial Statements.
i) Performance of the Scheme (2)
SGD Class Cumulative Annualised
Period 3-mth 6-mth 1-yr 3-yr 5-yr 10-yrSince
inception* 3-yr 5-yr 10-yrSince
inception*Fund (%) 3.74 7.23 20.97 38.27 75.53 55.71 -15.65 11.40 11.90 4.52 -0.94Benchmark (%) 7.54 11.06 28.46 74.35 180.09 126.25 N/A 20.34 22.86 8.50 N/A(*) Inception Date: 29/10/1999
j) Expense ratios Please refer to the Notes to the Financial Statements in the Annual Financial Statements.
k) Turnover ratios Please refer to the Notes to the Financial Statements in the Annual Financial Statements.
l) Any material information that will adversely impact the valuation of the schemeNil
m) Soft dollars received from brokersThe Manager does not receive soft-dollar commissions or cash rebates from dealing on the Aberdeen Global Technology Fund.
n) Key Information on the underlying scheme:N/A
(1) The amount (S$) of subscriptions relates to Cash funds only and the amount (S$) of redemptions include both Cash and CPF funds.
(2) Source: Lipper, Aberdeen Asset Managers, Bloomberg, BPSS, Datastream. The fund’s returns are based on percentage growth, calculated on a NAV-to-NAV basis with gross income reinvested. Benchmark was changed from PSE Tech 100 Index to Merrill Lynch Technology 100 Index with effect from 1 July 2001. The Merrill Lynch Technology 100 Index was renamed to Bank of America Merrill Lynch Technology 100 Index with effect from 26 September 2009. Benchmark data is only available from 31 December 1999.
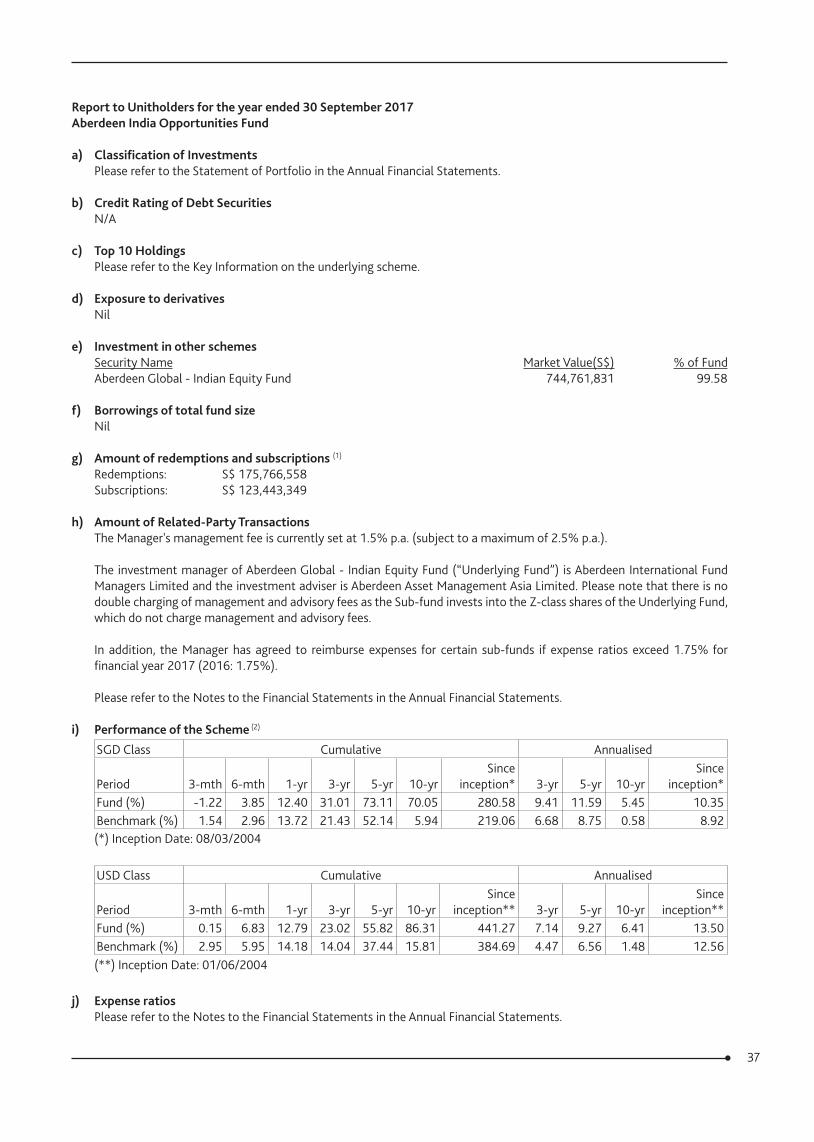
37
Report to Unitholders for the year ended 30 September 2017Aberdeen India Opportunities Fund
a) Classification of InvestmentsPlease refer to the Statement of Portfolio in the Annual Financial Statements.
b) Credit Rating of Debt SecuritiesN/A
c) Top 10 HoldingsPlease refer to the Key Information on the underlying scheme.
d) Exposure to derivativesNil
e) Investment in other schemesSecurity Name Market Value(S$) % of Fund Aberdeen Global - Indian Equity Fund 744,761,831 99.58
f) Borrowings of total fund sizeNil
g) Amount of redemptions and subscriptions (1)
Redemptions: S$ 175,766,558 Subscriptions: S$ 123,443,349
h) Amount of Related‑Party TransactionsThe Manager's management fee is currently set at 1.5% p.a. (subject to a maximum of 2.5% p.a.).
The investment manager of Aberdeen Global - Indian Equity Fund (“Underlying Fund”) is Aberdeen International Fund Managers Limited and the investment adviser is Aberdeen Asset Management Asia Limited. Please note that there is no double charging of management and advisory fees as the Sub-fund invests into the Z-class shares of the Underlying Fund, which do not charge management and advisory fees.
In addition, the Manager has agreed to reimburse expenses for certain sub-funds if expense ratios exceed 1.75% for financial year 2017 (2016: 1.75%).
Please refer to the Notes to the Financial Statements in the Annual Financial Statements.
i) Performance of the Scheme (2)
SGD Class Cumulative Annualised
Period 3-mth 6-mth 1-yr 3-yr 5-yr 10-yrSince
inception* 3-yr 5-yr 10-yrSince
inception*Fund (%) -1.22 3.85 12.40 31.01 73.11 70.05 280.58 9.41 11.59 5.45 10.35Benchmark (%) 1.54 2.96 13.72 21.43 52.14 5.94 219.06 6.68 8.75 0.58 8.92(*) Inception Date: 08/03/2004
USD Class Cumulative Annualised
Period 3-mth 6-mth 1-yr 3-yr 5-yr 10-yrSince
inception** 3-yr 5-yr 10-yrSince
inception**Fund (%) 0.15 6.83 12.79 23.02 55.82 86.31 441.27 7.14 9.27 6.41 13.50Benchmark (%) 2.95 5.95 14.18 14.04 37.44 15.81 384.69 4.47 6.56 1.48 12.56(**) Inception Date: 01/06/2004
j) Expense ratios Please refer to the Notes to the Financial Statements in the Annual Financial Statements.
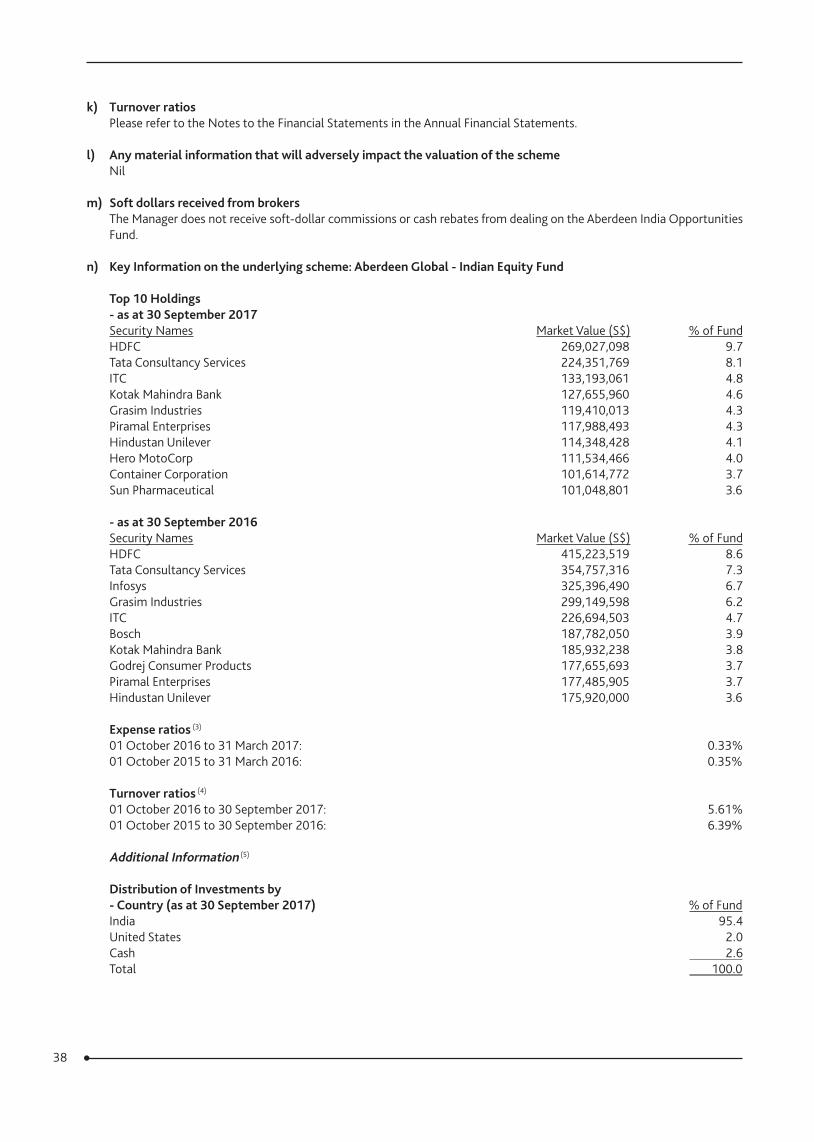
38
k) Turnover ratios
Please refer to the Notes to the Financial Statements in the Annual Financial Statements.
l) Any material information that will adversely impact the valuation of the schemeNil
m) Soft dollars received from brokersThe Manager does not receive soft-dollar commissions or cash rebates from dealing on the Aberdeen India Opportunities Fund.
n) Key Information on the underlying scheme: Aberdeen Global ‑ Indian Equity Fund
Top 10 Holdings ‑ as at 30 September 2017Security Names Market Value (S$) % of Fund HDFC 269,027,098 9.7 Tata Consultancy Services 224,351,769 8.1 ITC 133,193,061 4.8 Kotak Mahindra Bank 127,655,960 4.6 Grasim Industries 119,410,013 4.3 Piramal Enterprises 117,988,493 4.3 Hindustan Unilever 114,348,428 4.1 Hero MotoCorp 111,534,466 4.0 Container Corporation 101,614,772 3.7 Sun Pharmaceutical 101,048,801 3.6
‑ as at 30 September 2016Security Names Market Value (S$) % of Fund HDFC 415,223,519 8.6 Tata Consultancy Services 354,757,316 7.3 Infosys 325,396,490 6.7 Grasim Industries 299,149,598 6.2 ITC 226,694,503 4.7 Bosch 187,782,050 3.9 Kotak Mahindra Bank 185,932,238 3.8 Godrej Consumer Products 177,655,693 3.7 Piramal Enterprises 177,485,905 3.7 Hindustan Unilever 175,920,000 3.6
Expense ratios (3)
01 October 2016 to 31 March 2017: 0.33% 01 October 2015 to 31 March 2016: 0.35%
Turnover ratios (4)
01 October 2016 to 30 September 2017: 5.61% 01 October 2015 to 30 September 2016: 6.39%
Additional Information (5)
Distribution of Investments by‑ Country (as at 30 September 2017) % of FundIndia 95.4 United States 2.0 Cash 2.6 Total 100.0
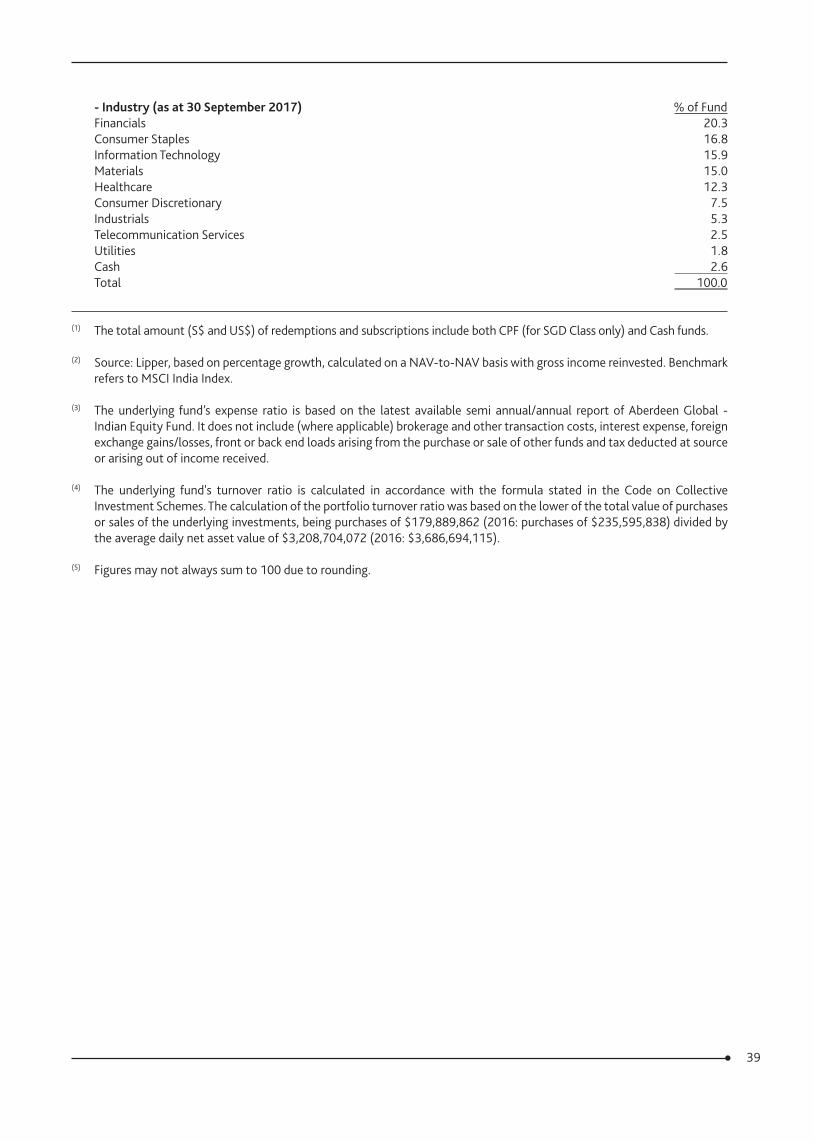
39
‑ Industry (as at 30 September 2017) % of FundFinancials 20.3 Consumer Staples 16.8 Information Technology 15.9 Materials 15.0 Healthcare 12.3 Consumer Discretionary 7.5 Industrials 5.3 Telecommunication Services 2.5 Utilities 1.8 Cash 2.6 Total 100.0
(1) The total amount (S$ and US$) of redemptions and subscriptions include both CPF (for SGD Class only) and Cash funds.
(2) Source: Lipper, based on percentage growth, calculated on a NAV-to-NAV basis with gross income reinvested. Benchmark refers to MSCI India Index.
(3) The underlying fund’s expense ratio is based on the latest available semi annual/annual report of Aberdeen Global - Indian Equity Fund. It does not include (where applicable) brokerage and other transaction costs, interest expense, foreign exchange gains/losses, front or back end loads arising from the purchase or sale of other funds and tax deducted at source or arising out of income received.
(4) The underlying fund's turnover ratio is calculated in accordance with the formula stated in the Code on Collective Investment Schemes. The calculation of the portfolio turnover ratio was based on the lower of the total value of purchases or sales of the underlying investments, being purchases of $179,889,862 (2016: purchases of $235,595,838) divided by the average daily net asset value of $3,208,704,072 (2016: $3,686,694,115).
(5) Figures may not always sum to 100 due to rounding.
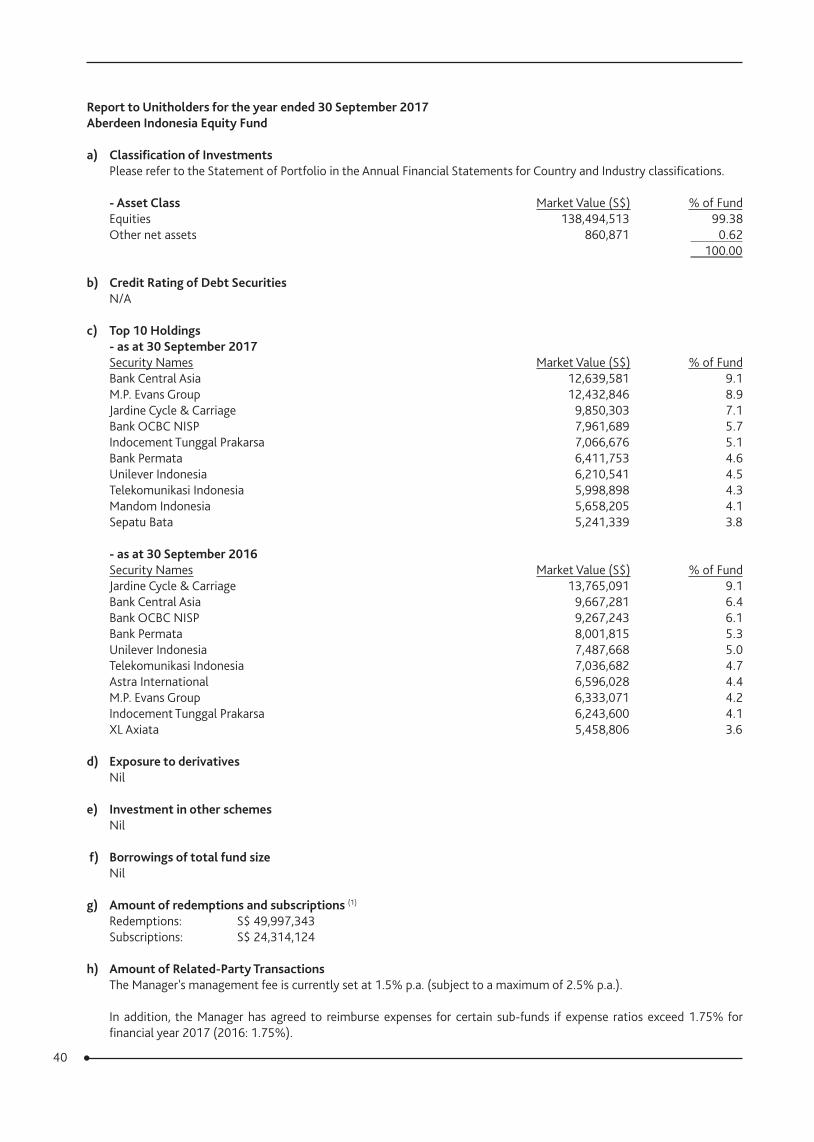
40
Report to Unitholders for the year ended 30 September 2017Aberdeen Indonesia Equity Fund
a) Classification of InvestmentsPlease refer to the Statement of Portfolio in the Annual Financial Statements for Country and Industry classifications.
‑ Asset Class Market Value (S$) % of Fund Equities 138,494,513 99.38 Other net assets 860,871 0.62 100.00
b) Credit Rating of Debt SecuritiesN/A
c) Top 10 Holdings‑ as at 30 September 2017Security Names Market Value (S$) % of Fund Bank Central Asia 12,639,581 9.1 M.P. Evans Group 12,432,846 8.9 Jardine Cycle & Carriage 9,850,303 7.1 Bank OCBC NISP 7,961,689 5.7 Indocement Tunggal Prakarsa 7,066,676 5.1 Bank Permata 6,411,753 4.6 Unilever Indonesia 6,210,541 4.5 Telekomunikasi Indonesia 5,998,898 4.3 Mandom Indonesia 5,658,205 4.1 Sepatu Bata 5,241,339 3.8
‑ as at 30 September 2016Security Names Market Value (S$) % of Fund Jardine Cycle & Carriage 13,765,091 9.1 Bank Central Asia 9,667,281 6.4 Bank OCBC NISP 9,267,243 6.1 Bank Permata 8,001,815 5.3 Unilever Indonesia 7,487,668 5.0 Telekomunikasi Indonesia 7,036,682 4.7 Astra International 6,596,028 4.4 M.P. Evans Group 6,333,071 4.2 Indocement Tunggal Prakarsa 6,243,600 4.1 XL Axiata 5,458,806 3.6
d) Exposure to derivativesNil
e) Investment in other schemesNil
f) Borrowings of total fund sizeNil
g) Amount of redemptions and subscriptions (1)
Redemptions: S$ 49,997,343 Subscriptions: S$ 24,314,124
h) Amount of Related‑Party TransactionsThe Manager's management fee is currently set at 1.5% p.a. (subject to a maximum of 2.5% p.a.).
In addition, the Manager has agreed to reimburse expenses for certain sub-funds if expense ratios exceed 1.75% for financial year 2017 (2016: 1.75%).
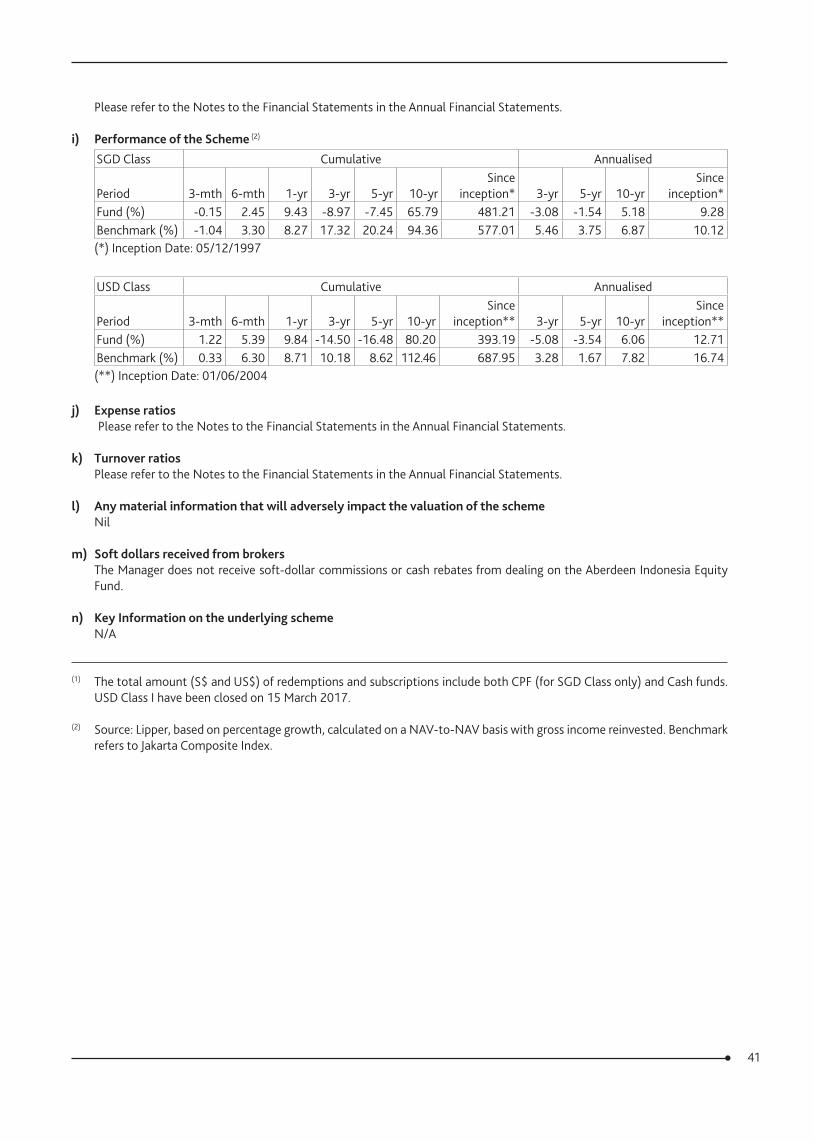
41
Please refer to the Notes to the Financial Statements in the Annual Financial Statements.
i) Performance of the Scheme (2)
SGD Class Cumulative Annualised
Period 3-mth 6-mth 1-yr 3-yr 5-yr 10-yrSince
inception* 3-yr 5-yr 10-yrSince
inception*Fund (%) -0.15 2.45 9.43 -8.97 -7.45 65.79 481.21 -3.08 -1.54 5.18 9.28Benchmark (%) -1.04 3.30 8.27 17.32 20.24 94.36 577.01 5.46 3.75 6.87 10.12(*) Inception Date: 05/12/1997
USD Class Cumulative Annualised
Period 3-mth 6-mth 1-yr 3-yr 5-yr 10-yrSince
inception** 3-yr 5-yr 10-yrSince
inception**Fund (%) 1.22 5.39 9.84 -14.50 -16.48 80.20 393.19 -5.08 -3.54 6.06 12.71Benchmark (%) 0.33 6.30 8.71 10.18 8.62 112.46 687.95 3.28 1.67 7.82 16.74(**) Inception Date: 01/06/2004
j) Expense ratios
Please refer to the Notes to the Financial Statements in the Annual Financial Statements.
k) Turnover ratios
Please refer to the Notes to the Financial Statements in the Annual Financial Statements.
l) Any material information that will adversely impact the valuation of the schemeNil
m) Soft dollars received from brokersThe Manager does not receive soft-dollar commissions or cash rebates from dealing on the Aberdeen Indonesia Equity Fund.
n) Key Information on the underlying schemeN/A
(1) The total amount (S$ and US$) of redemptions and subscriptions include both CPF (for SGD Class only) and Cash funds. USD Class I have been closed on 15 March 2017.
(2) Source: Lipper, based on percentage growth, calculated on a NAV-to-NAV basis with gross income reinvested. Benchmark refers to Jakarta Composite Index.
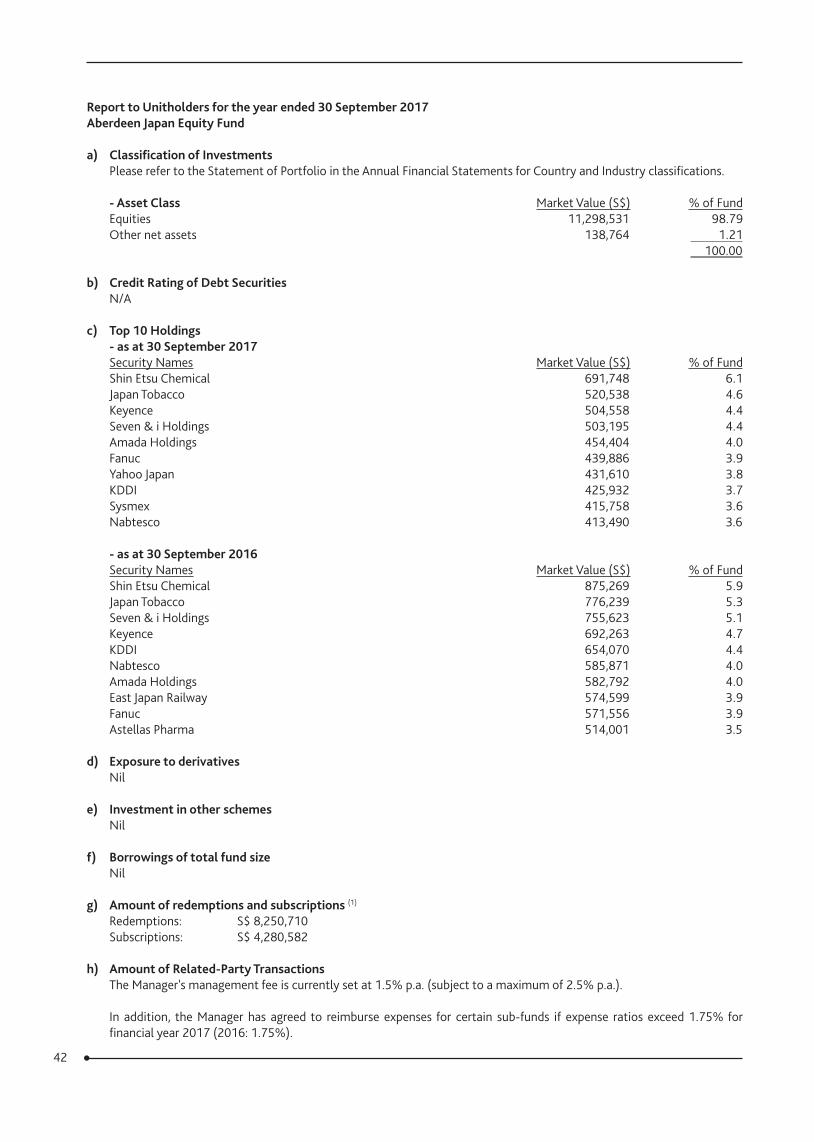
42
Report to Unitholders for the year ended 30 September 2017Aberdeen Japan Equity Fund
a) Classification of InvestmentsPlease refer to the Statement of Portfolio in the Annual Financial Statements for Country and Industry classifications.
‑ Asset Class Market Value (S$) % of Fund Equities 11,298,531 98.79 Other net assets 138,764 1.21 100.00
b) Credit Rating of Debt SecuritiesN/A
c) Top 10 Holdings‑ as at 30 September 2017Security Names Market Value (S$) % of Fund Shin Etsu Chemical 691,748 6.1 Japan Tobacco 520,538 4.6 Keyence 504,558 4.4 Seven & i Holdings 503,195 4.4 Amada Holdings 454,404 4.0 Fanuc 439,886 3.9 Yahoo Japan 431,610 3.8 KDDI 425,932 3.7 Sysmex 415,758 3.6 Nabtesco 413,490 3.6
‑ as at 30 September 2016Security Names Market Value (S$) % of Fund Shin Etsu Chemical 875,269 5.9 Japan Tobacco 776,239 5.3 Seven & i Holdings 755,623 5.1 Keyence 692,263 4.7 KDDI 654,070 4.4 Nabtesco 585,871 4.0 Amada Holdings 582,792 4.0 East Japan Railway 574,599 3.9 Fanuc 571,556 3.9 Astellas Pharma 514,001 3.5
d) Exposure to derivativesNil
e) Investment in other schemesNil
f) Borrowings of total fund sizeNil
g) Amount of redemptions and subscriptions (1)
Redemptions: S$ 8,250,710 Subscriptions: S$ 4,280,582
h) Amount of Related‑Party TransactionsThe Manager's management fee is currently set at 1.5% p.a. (subject to a maximum of 2.5% p.a.).
In addition, the Manager has agreed to reimburse expenses for certain sub-funds if expense ratios exceed 1.75% for financial year 2017 (2016: 1.75%).
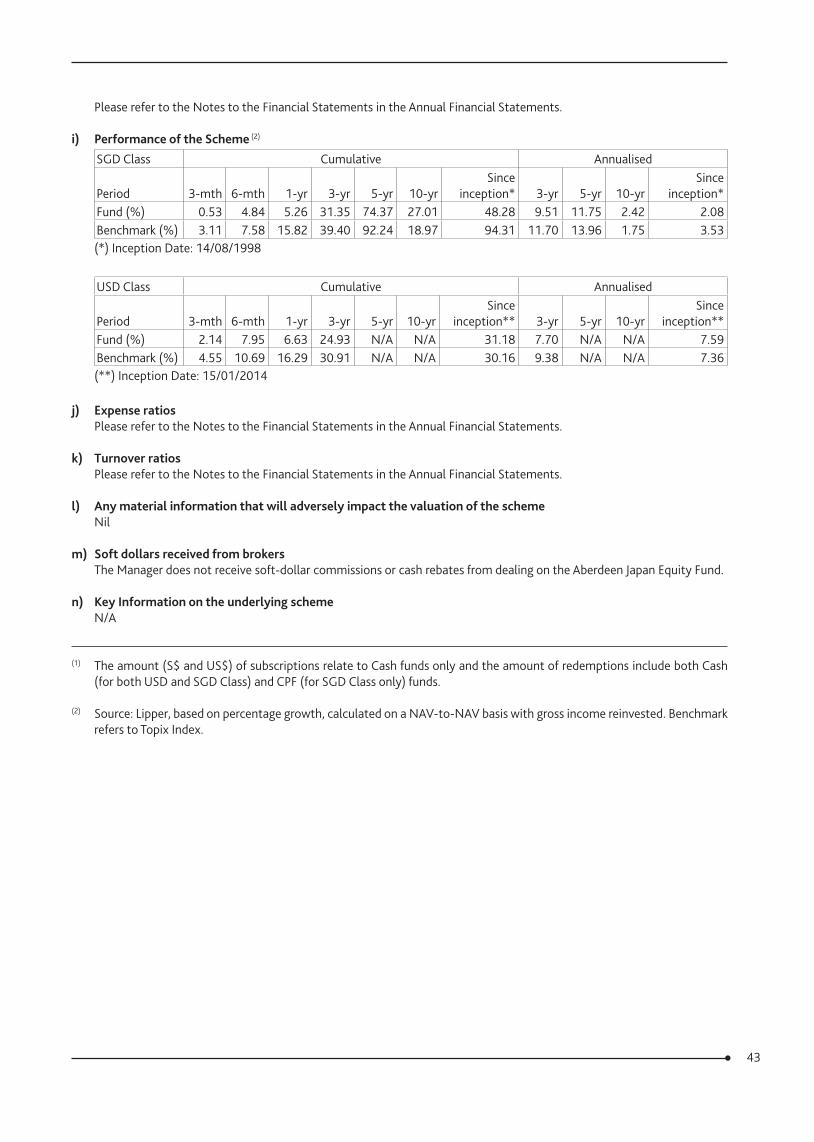
43
Please refer to the Notes to the Financial Statements in the Annual Financial Statements.
i) Performance of the Scheme (2)
SGD Class Cumulative Annualised
Period 3-mth 6-mth 1-yr 3-yr 5-yr 10-yrSince
inception* 3-yr 5-yr 10-yrSince
inception*Fund (%) 0.53 4.84 5.26 31.35 74.37 27.01 48.28 9.51 11.75 2.42 2.08Benchmark (%) 3.11 7.58 15.82 39.40 92.24 18.97 94.31 11.70 13.96 1.75 3.53(*) Inception Date: 14/08/1998
USD Class Cumulative Annualised
Period 3-mth 6-mth 1-yr 3-yr 5-yr 10-yrSince
inception** 3-yr 5-yr 10-yrSince
inception**Fund (%) 2.14 7.95 6.63 24.93 N/A N/A 31.18 7.70 N/A N/A 7.59Benchmark (%) 4.55 10.69 16.29 30.91 N/A N/A 30.16 9.38 N/A N/A 7.36(**) Inception Date: 15/01/2014
j) Expense ratios Please refer to the Notes to the Financial Statements in the Annual Financial Statements.
k) Turnover ratiosPlease refer to the Notes to the Financial Statements in the Annual Financial Statements.
l) Any material information that will adversely impact the valuation of the schemeNil
m) Soft dollars received from brokersThe Manager does not receive soft-dollar commissions or cash rebates from dealing on the Aberdeen Japan Equity Fund.
n) Key Information on the underlying schemeN/A
(1) The amount (S$ and US$) of subscriptions relate to Cash funds only and the amount of redemptions include both Cash (for both USD and SGD Class) and CPF (for SGD Class only) funds.
(2) Source: Lipper, based on percentage growth, calculated on a NAV-to-NAV basis with gross income reinvested. Benchmark refers to Topix Index.
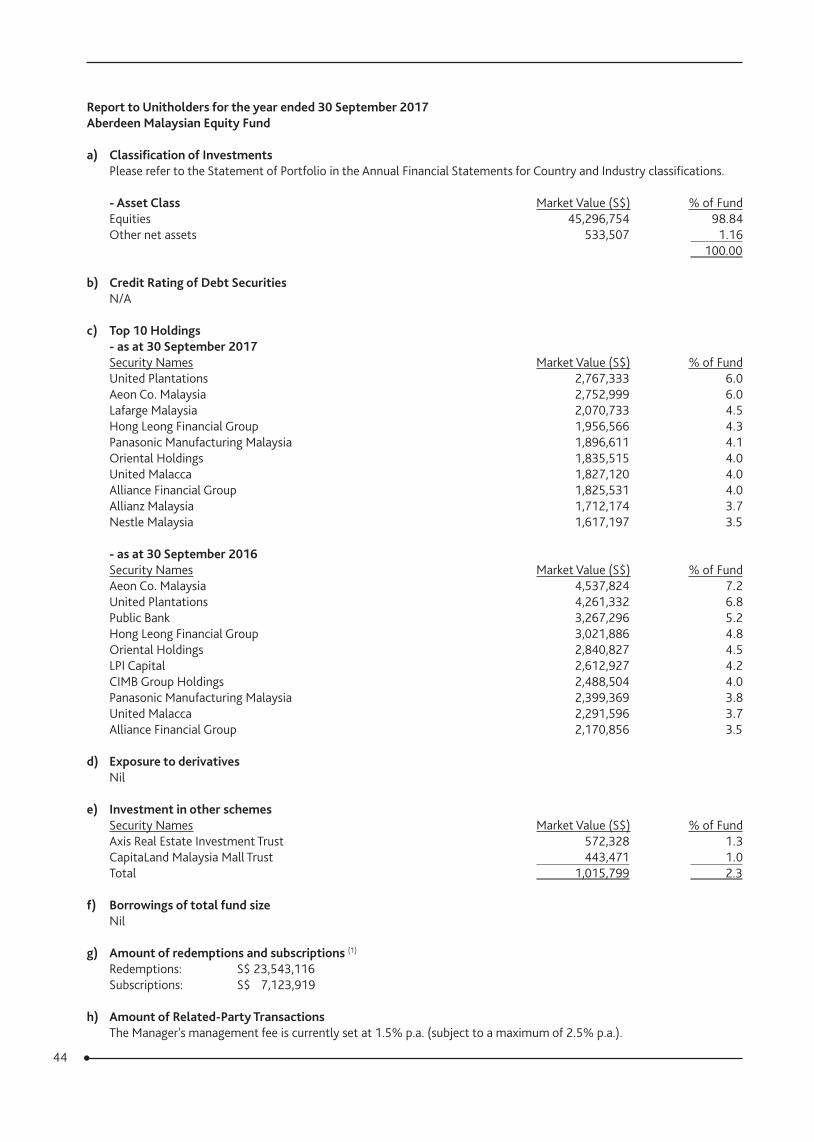
44
Report to Unitholders for the year ended 30 September 2017Aberdeen Malaysian Equity Fund
a) Classification of InvestmentsPlease refer to the Statement of Portfolio in the Annual Financial Statements for Country and Industry classifications.
‑ Asset Class Market Value (S$) % of Fund Equities 45,296,754 98.84 Other net assets 533,507 1.16 100.00
b) Credit Rating of Debt SecuritiesN/A
c) Top 10 Holdings‑ as at 30 September 2017Security Names Market Value (S$) % of Fund United Plantations 2,767,333 6.0 Aeon Co. Malaysia 2,752,999 6.0 Lafarge Malaysia 2,070,733 4.5 Hong Leong Financial Group 1,956,566 4.3 Panasonic Manufacturing Malaysia 1,896,611 4.1 Oriental Holdings 1,835,515 4.0 United Malacca 1,827,120 4.0 Alliance Financial Group 1,825,531 4.0 Allianz Malaysia 1,712,174 3.7 Nestle Malaysia 1,617,197 3.5
‑ as at 30 September 2016Security Names Market Value (S$) % of Fund Aeon Co. Malaysia 4,537,824 7.2 United Plantations 4,261,332 6.8 Public Bank 3,267,296 5.2 Hong Leong Financial Group 3,021,886 4.8 Oriental Holdings 2,840,827 4.5 LPI Capital 2,612,927 4.2 CIMB Group Holdings 2,488,504 4.0 Panasonic Manufacturing Malaysia 2,399,369 3.8 United Malacca 2,291,596 3.7 Alliance Financial Group 2,170,856 3.5
d) Exposure to derivativesNil
e) Investment in other schemesSecurity Names Market Value (S$) % of Fund Axis Real Estate Investment Trust 572,328 1.3 CapitaLand Malaysia Mall Trust 443,471 1.0 Total 1,015,799 2.3
f) Borrowings of total fund sizeNil
g) Amount of redemptions and subscriptions (1)
Redemptions: S$ 23,543,116 Subscriptions: S$ 7,123,919
h) Amount of Related‑Party TransactionsThe Manager's management fee is currently set at 1.5% p.a. (subject to a maximum of 2.5% p.a.).
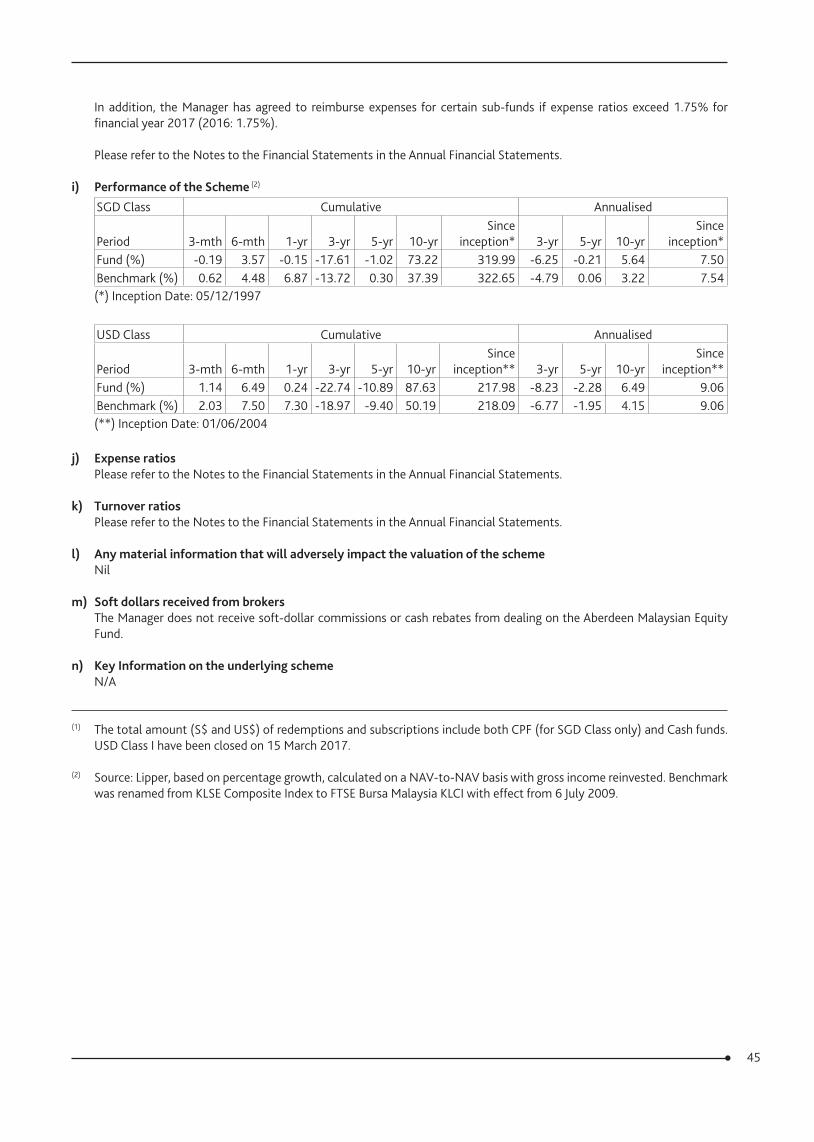
45
In addition, the Manager has agreed to reimburse expenses for certain sub-funds if expense ratios exceed 1.75% for financial year 2017 (2016: 1.75%).
Please refer to the Notes to the Financial Statements in the Annual Financial Statements.
i) Performance of the Scheme (2)
SGD Class Cumulative Annualised
Period 3-mth 6-mth 1-yr 3-yr 5-yr 10-yrSince
inception* 3-yr 5-yr 10-yrSince
inception*Fund (%) -0.19 3.57 -0.15 -17.61 -1.02 73.22 319.99 -6.25 -0.21 5.64 7.50Benchmark (%) 0.62 4.48 6.87 -13.72 0.30 37.39 322.65 -4.79 0.06 3.22 7.54(*) Inception Date: 05/12/1997
USD Class Cumulative Annualised
Period 3-mth 6-mth 1-yr 3-yr 5-yr 10-yrSince
inception** 3-yr 5-yr 10-yrSince
inception**Fund (%) 1.14 6.49 0.24 -22.74 -10.89 87.63 217.98 -8.23 -2.28 6.49 9.06Benchmark (%) 2.03 7.50 7.30 -18.97 -9.40 50.19 218.09 -6.77 -1.95 4.15 9.06(**) Inception Date: 01/06/2004
j) Expense ratios Please refer to the Notes to the Financial Statements in the Annual Financial Statements.
k) Turnover ratios Please refer to the Notes to the Financial Statements in the Annual Financial Statements.
l) Any material information that will adversely impact the valuation of the schemeNil
m) Soft dollars received from brokersThe Manager does not receive soft-dollar commissions or cash rebates from dealing on the Aberdeen Malaysian Equity Fund.
n) Key Information on the underlying schemeN/A
(1) The total amount (S$ and US$) of redemptions and subscriptions include both CPF (for SGD Class only) and Cash funds. USD Class I have been closed on 15 March 2017.
(2) Source: Lipper, based on percentage growth, calculated on a NAV-to-NAV basis with gross income reinvested. Benchmark was renamed from KLSE Composite Index to FTSE Bursa Malaysia KLCI with effect from 6 July 2009.
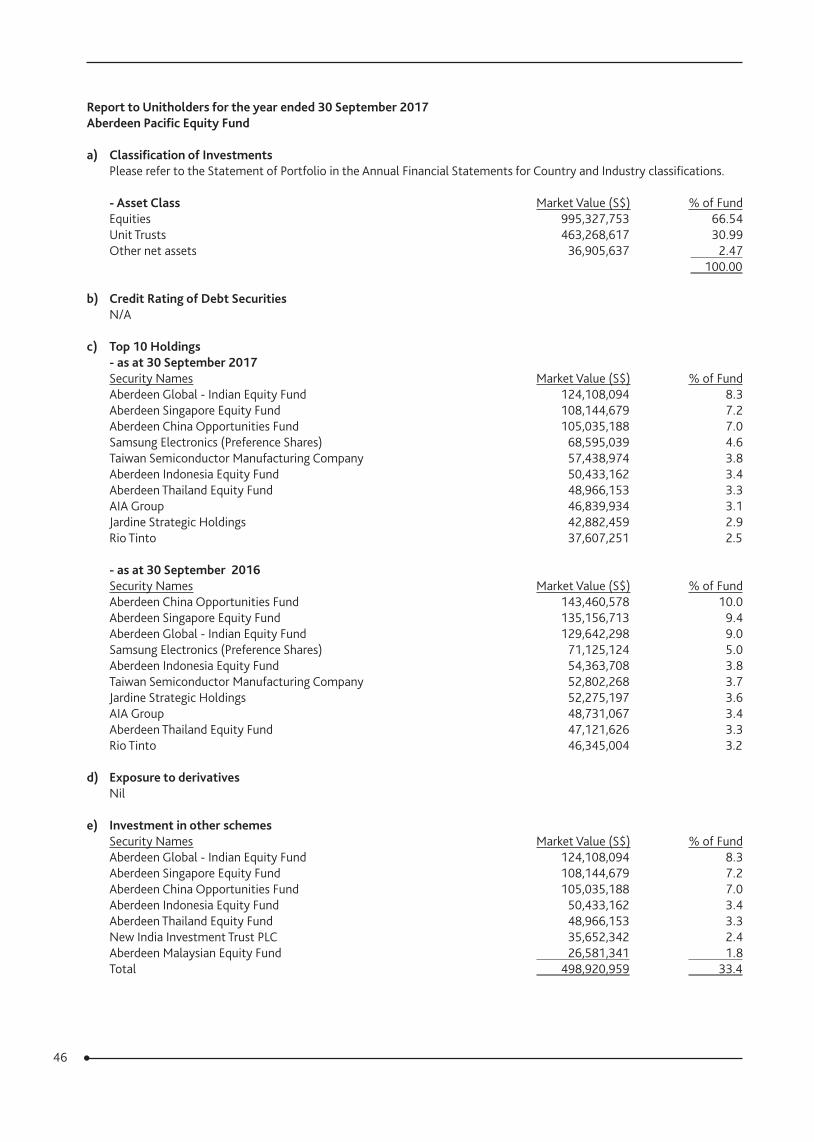
46
Report to Unitholders for the year ended 30 September 2017Aberdeen Pacific Equity Fund
a) Classification of InvestmentsPlease refer to the Statement of Portfolio in the Annual Financial Statements for Country and Industry classifications.
‑ Asset Class Market Value (S$) % of Fund Equities 995,327,753 66.54 Unit Trusts 463,268,617 30.99 Other net assets 36,905,637 2.47 100.00
b) Credit Rating of Debt SecuritiesN/A
c) Top 10 Holdings‑ as at 30 September 2017Security Names Market Value (S$) % of Fund Aberdeen Global - Indian Equity Fund 124,108,094 8.3 Aberdeen Singapore Equity Fund 108,144,679 7.2 Aberdeen China Opportunities Fund 105,035,188 7.0 Samsung Electronics (Preference Shares) 68,595,039 4.6 Taiwan Semiconductor Manufacturing Company 57,438,974 3.8 Aberdeen Indonesia Equity Fund 50,433,162 3.4 Aberdeen Thailand Equity Fund 48,966,153 3.3 AIA Group 46,839,934 3.1 Jardine Strategic Holdings 42,882,459 2.9 Rio Tinto 37,607,251 2.5
‑ as at 30 September 2016Security Names Market Value (S$) % of Fund Aberdeen China Opportunities Fund 143,460,578 10.0 Aberdeen Singapore Equity Fund 135,156,713 9.4 Aberdeen Global - Indian Equity Fund 129,642,298 9.0 Samsung Electronics (Preference Shares) 71,125,124 5.0 Aberdeen Indonesia Equity Fund 54,363,708 3.8 Taiwan Semiconductor Manufacturing Company 52,802,268 3.7 Jardine Strategic Holdings 52,275,197 3.6 AIA Group 48,731,067 3.4 Aberdeen Thailand Equity Fund 47,121,626 3.3 Rio Tinto 46,345,004 3.2
d) Exposure to derivativesNil
e) Investment in other schemesSecurity Names Market Value (S$) % of Fund Aberdeen Global - Indian Equity Fund 124,108,094 8.3 Aberdeen Singapore Equity Fund 108,144,679 7.2 Aberdeen China Opportunities Fund 105,035,188 7.0 Aberdeen Indonesia Equity Fund 50,433,162 3.4 Aberdeen Thailand Equity Fund 48,966,153 3.3 New India Investment Trust PLC 35,652,342 2.4 Aberdeen Malaysian Equity Fund 26,581,341 1.8 Total 498,920,959 33.4
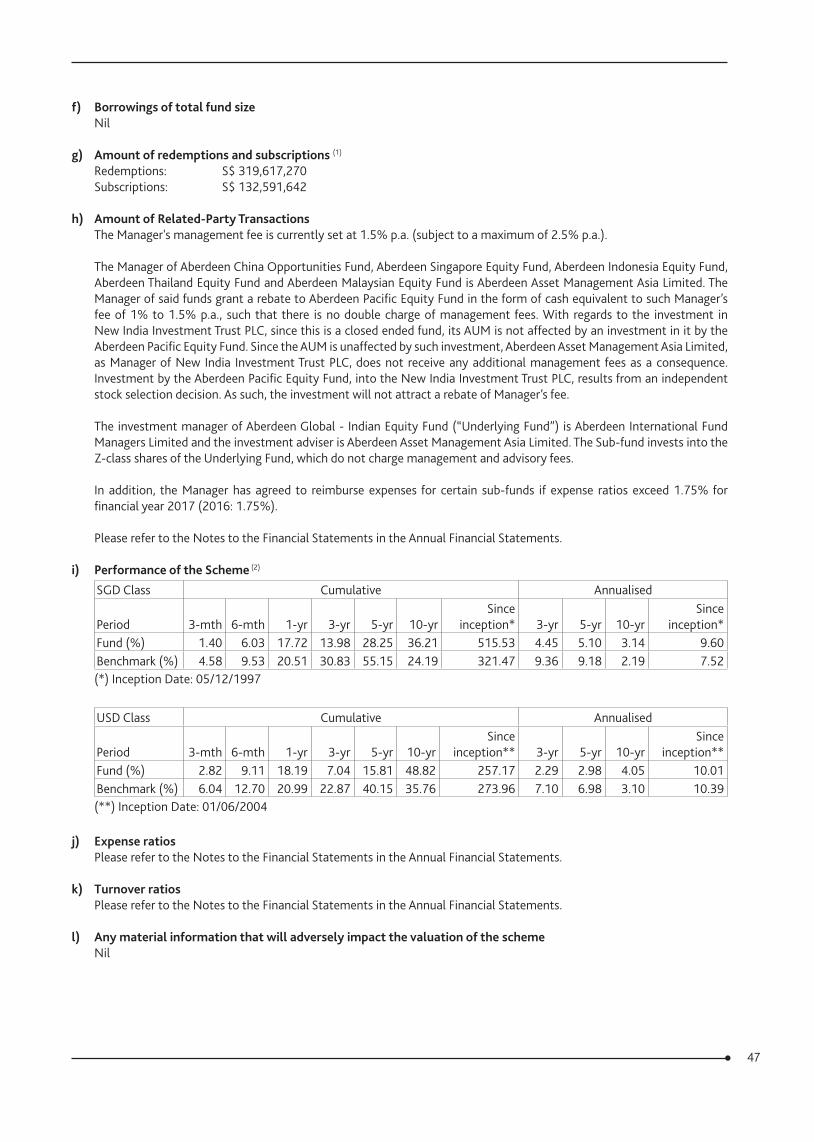
47
f) Borrowings of total fund sizeNil
g) Amount of redemptions and subscriptions (1)
Redemptions: S$ 319,617,270 Subscriptions: S$ 132,591,642
h) Amount of Related‑Party TransactionsThe Manager's management fee is currently set at 1.5% p.a. (subject to a maximum of 2.5% p.a.).
The Manager of Aberdeen China Opportunities Fund, Aberdeen Singapore Equity Fund, Aberdeen Indonesia Equity Fund, Aberdeen Thailand Equity Fund and Aberdeen Malaysian Equity Fund is Aberdeen Asset Management Asia Limited. The Manager of said funds grant a rebate to Aberdeen Pacific Equity Fund in the form of cash equivalent to such Manager’s fee of 1% to 1.5% p.a., such that there is no double charge of management fees. With regards to the investment in New India Investment Trust PLC, since this is a closed ended fund, its AUM is not affected by an investment in it by the Aberdeen Pacific Equity Fund. Since the AUM is unaffected by such investment, Aberdeen Asset Management Asia Limited, as Manager of New India Investment Trust PLC, does not receive any additional management fees as a consequence. Investment by the Aberdeen Pacific Equity Fund, into the New India Investment Trust PLC, results from an independent stock selection decision. As such, the investment will not attract a rebate of Manager’s fee.
The investment manager of Aberdeen Global - Indian Equity Fund (“Underlying Fund”) is Aberdeen International Fund Managers Limited and the investment adviser is Aberdeen Asset Management Asia Limited. The Sub-fund invests into the Z-class shares of the Underlying Fund, which do not charge management and advisory fees.
In addition, the Manager has agreed to reimburse expenses for certain sub-funds if expense ratios exceed 1.75% for financial year 2017 (2016: 1.75%).
Please refer to the Notes to the Financial Statements in the Annual Financial Statements.
i) Performance of the Scheme (2)
SGD Class Cumulative Annualised
Period 3-mth 6-mth 1-yr 3-yr 5-yr 10-yrSince
inception* 3-yr 5-yr 10-yrSince
inception*Fund (%) 1.40 6.03 17.72 13.98 28.25 36.21 515.53 4.45 5.10 3.14 9.60Benchmark (%) 4.58 9.53 20.51 30.83 55.15 24.19 321.47 9.36 9.18 2.19 7.52(*) Inception Date: 05/12/1997
USD Class Cumulative Annualised
Period 3-mth 6-mth 1-yr 3-yr 5-yr 10-yrSince
inception** 3-yr 5-yr 10-yrSince
inception**Fund (%) 2.82 9.11 18.19 7.04 15.81 48.82 257.17 2.29 2.98 4.05 10.01Benchmark (%) 6.04 12.70 20.99 22.87 40.15 35.76 273.96 7.10 6.98 3.10 10.39(**) Inception Date: 01/06/2004
j) Expense ratios
Please refer to the Notes to the Financial Statements in the Annual Financial Statements.
k) Turnover ratios
Please refer to the Notes to the Financial Statements in the Annual Financial Statements.
l) Any material information that will adversely impact the valuation of the schemeNil

48
m) Soft dollars received from brokersThe Manager does not receive soft-dollar commissions or cash rebates from dealing on the Aberdeen Pacific Equity Fund.
n) Key Information on the underlying schemeN/A
(1) The total amount (S$ and US$) of redemptions and subscriptions include both CPF (for SGD Class only) and Cash funds.
(2) Source: Lipper, based on percentage growth, calculated on a NAV-to-NAV basis with gross income reinvested. Benchmark refers to MSCI AC Asia Pacific ex Japan Index.
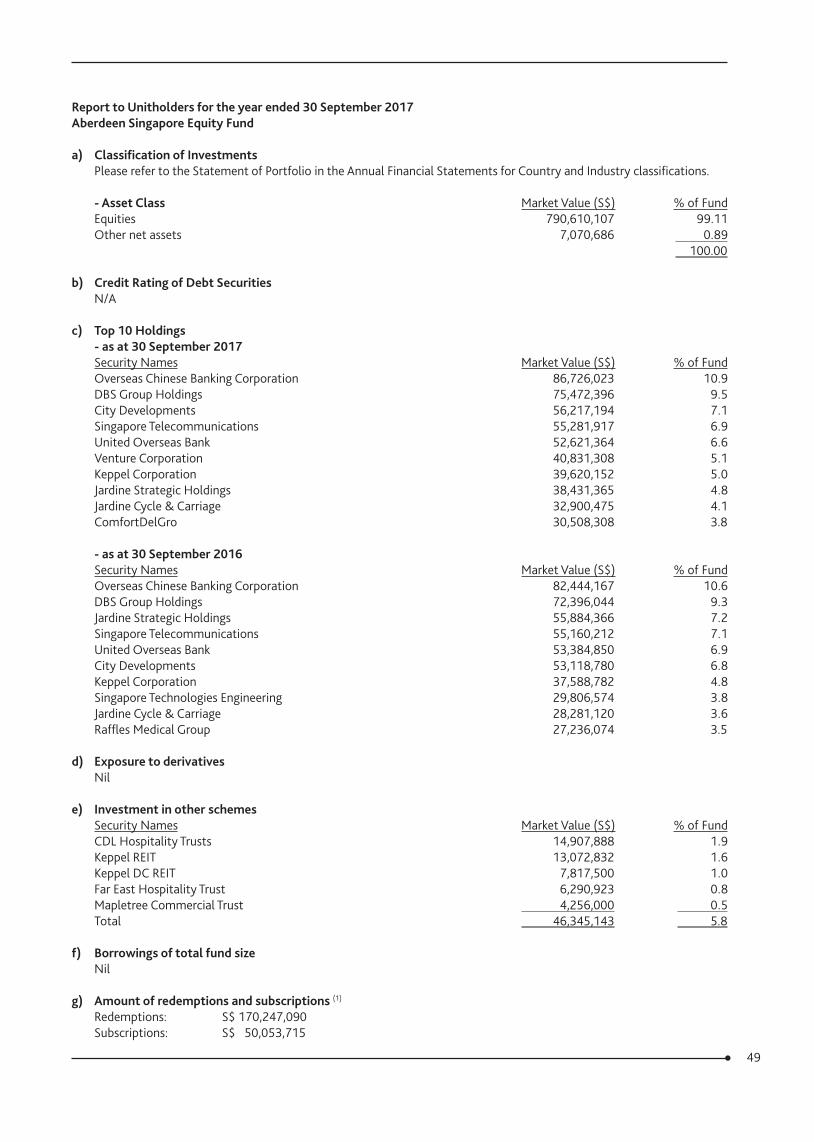
49
Report to Unitholders for the year ended 30 September 2017Aberdeen Singapore Equity Fund
a) Classification of InvestmentsPlease refer to the Statement of Portfolio in the Annual Financial Statements for Country and Industry classifications.
‑ Asset Class Market Value (S$) % of Fund Equities 790,610,107 99.11 Other net assets 7,070,686 0.89 100.00
b) Credit Rating of Debt SecuritiesN/A
c) Top 10 Holdings‑ as at 30 September 2017Security Names Market Value (S$) % of Fund Overseas Chinese Banking Corporation 86,726,023 10.9 DBS Group Holdings 75,472,396 9.5 City Developments 56,217,194 7.1 Singapore Telecommunications 55,281,917 6.9 United Overseas Bank 52,621,364 6.6 Venture Corporation 40,831,308 5.1 Keppel Corporation 39,620,152 5.0 Jardine Strategic Holdings 38,431,365 4.8 Jardine Cycle & Carriage 32,900,475 4.1 ComfortDelGro 30,508,308 3.8
‑ as at 30 September 2016Security Names Market Value (S$) % of Fund Overseas Chinese Banking Corporation 82,444,167 10.6 DBS Group Holdings 72,396,044 9.3 Jardine Strategic Holdings 55,884,366 7.2 Singapore Telecommunications 55,160,212 7.1 United Overseas Bank 53,384,850 6.9 City Developments 53,118,780 6.8 Keppel Corporation 37,588,782 4.8 Singapore Technologies Engineering 29,806,574 3.8 Jardine Cycle & Carriage 28,281,120 3.6 Raffles Medical Group 27,236,074 3.5
d) Exposure to derivativesNil
e) Investment in other schemesSecurity Names Market Value (S$) % of Fund CDL Hospitality Trusts 14,907,888 1.9 Keppel REIT 13,072,832 1.6 Keppel DC REIT 7,817,500 1.0 Far East Hospitality Trust 6,290,923 0.8 Mapletree Commercial Trust 4,256,000 0.5 Total 46,345,143 5.8
f) Borrowings of total fund sizeNil
g) Amount of redemptions and subscriptions (1)
Redemptions: S$ 170,247,090 Subscriptions: S$ 50,053,715
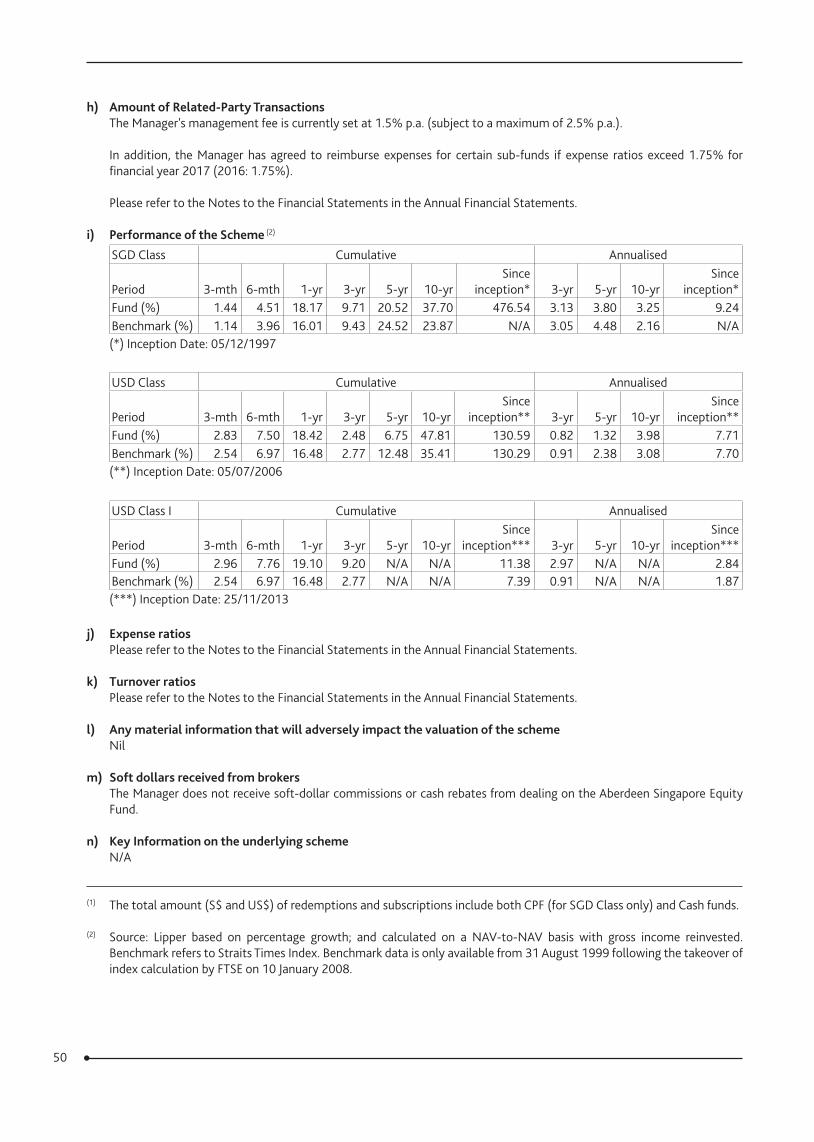
50
h) Amount of Related‑Party TransactionsThe Manager's management fee is currently set at 1.5% p.a. (subject to a maximum of 2.5% p.a.).
In addition, the Manager has agreed to reimburse expenses for certain sub-funds if expense ratios exceed 1.75% for financial year 2017 (2016: 1.75%).
Please refer to the Notes to the Financial Statements in the Annual Financial Statements.
i) Performance of the Scheme (2)
SGD Class Cumulative Annualised
Period 3-mth 6-mth 1-yr 3-yr 5-yr 10-yrSince
inception* 3-yr 5-yr 10-yrSince
inception*Fund (%) 1.44 4.51 18.17 9.71 20.52 37.70 476.54 3.13 3.80 3.25 9.24Benchmark (%) 1.14 3.96 16.01 9.43 24.52 23.87 N/A 3.05 4.48 2.16 N/A(*) Inception Date: 05/12/1997
USD Class Cumulative Annualised
Period 3-mth 6-mth 1-yr 3-yr 5-yr 10-yrSince
inception** 3-yr 5-yr 10-yrSince
inception**Fund (%) 2.83 7.50 18.42 2.48 6.75 47.81 130.59 0.82 1.32 3.98 7.71Benchmark (%) 2.54 6.97 16.48 2.77 12.48 35.41 130.29 0.91 2.38 3.08 7.70(**) Inception Date: 05/07/2006
USD Class I Cumulative Annualised
Period 3-mth 6-mth 1-yr 3-yr 5-yr 10-yrSince
inception*** 3-yr 5-yr 10-yrSince
inception***Fund (%) 2.96 7.76 19.10 9.20 N/A N/A 11.38 2.97 N/A N/A 2.84Benchmark (%) 2.54 6.97 16.48 2.77 N/A N/A 7.39 0.91 N/A N/A 1.87(***) Inception Date: 25/11/2013
j) Expense ratios Please refer to the Notes to the Financial Statements in the Annual Financial Statements.
k) Turnover ratios Please refer to the Notes to the Financial Statements in the Annual Financial Statements.
l) Any material information that will adversely impact the valuation of the schemeNil
m) Soft dollars received from brokersThe Manager does not receive soft-dollar commissions or cash rebates from dealing on the Aberdeen Singapore Equity Fund.
n) Key Information on the underlying schemeN/A
(1) The total amount (S$ and US$) of redemptions and subscriptions include both CPF (for SGD Class only) and Cash funds.
(2) Source: Lipper based on percentage growth; and calculated on a NAV-to-NAV basis with gross income reinvested. Benchmark refers to Straits Times Index. Benchmark data is only available from 31 August 1999 following the takeover of index calculation by FTSE on 10 January 2008.
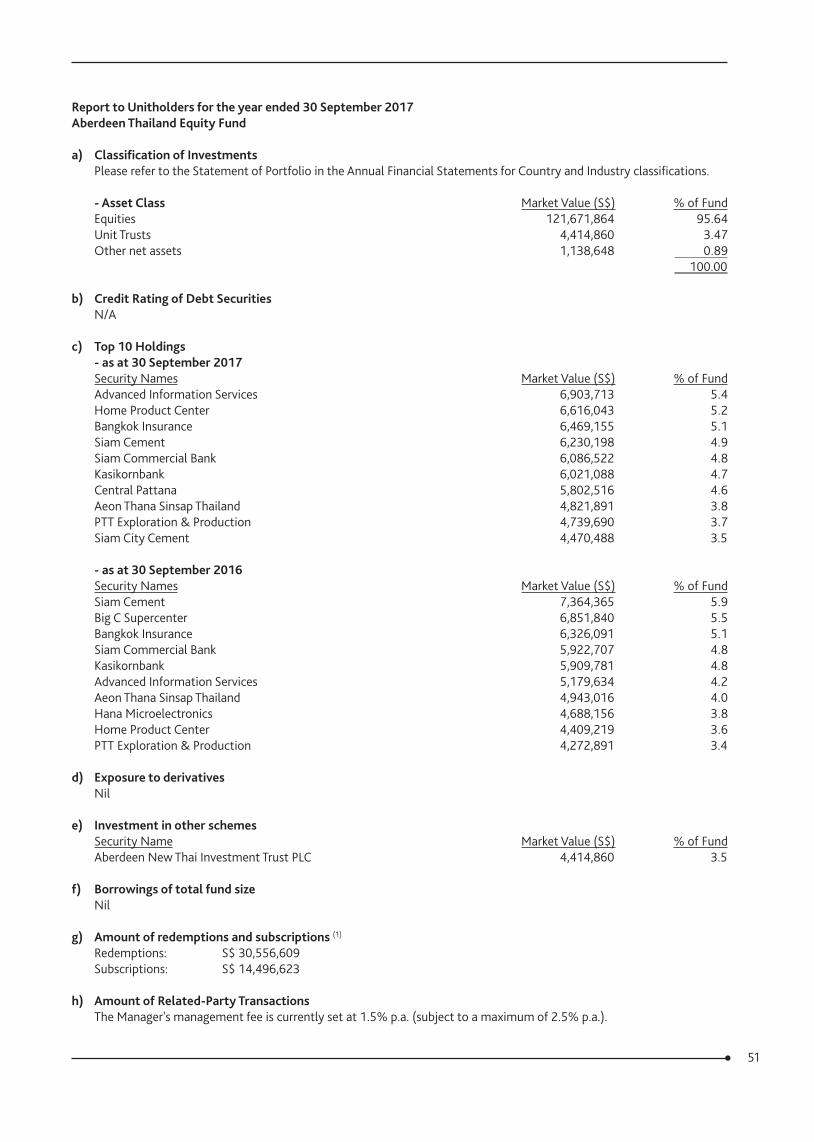
51
Report to Unitholders for the year ended 30 September 2017Aberdeen Thailand Equity Fund
a) Classification of InvestmentsPlease refer to the Statement of Portfolio in the Annual Financial Statements for Country and Industry classifications.
‑ Asset Class Market Value (S$) % of Fund Equities 121,671,864 95.64 Unit Trusts 4,414,860 3.47 Other net assets 1,138,648 0.89 100.00
b) Credit Rating of Debt SecuritiesN/A
c) Top 10 Holdings‑ as at 30 September 2017Security Names Market Value (S$) % of Fund Advanced Information Services 6,903,713 5.4 Home Product Center 6,616,043 5.2 Bangkok Insurance 6,469,155 5.1 Siam Cement 6,230,198 4.9 Siam Commercial Bank 6,086,522 4.8 Kasikornbank 6,021,088 4.7 Central Pattana 5,802,516 4.6 Aeon Thana Sinsap Thailand 4,821,891 3.8 PTT Exploration & Production 4,739,690 3.7 Siam City Cement 4,470,488 3.5
‑ as at 30 September 2016Security Names Market Value (S$) % of Fund Siam Cement 7,364,365 5.9 Big C Supercenter 6,851,840 5.5 Bangkok Insurance 6,326,091 5.1 Siam Commercial Bank 5,922,707 4.8 Kasikornbank 5,909,781 4.8 Advanced Information Services 5,179,634 4.2 Aeon Thana Sinsap Thailand 4,943,016 4.0 Hana Microelectronics 4,688,156 3.8 Home Product Center 4,409,219 3.6 PTT Exploration & Production 4,272,891 3.4
d) Exposure to derivativesNil
e) Investment in other schemesSecurity Name Market Value (S$) % of Fund Aberdeen New Thai Investment Trust PLC 4,414,860 3.5
f) Borrowings of total fund sizeNil
g) Amount of redemptions and subscriptions (1)
Redemptions: S$ 30,556,609 Subscriptions: S$ 14,496,623
h) Amount of Related‑Party TransactionsThe Manager's management fee is currently set at 1.5% p.a. (subject to a maximum of 2.5% p.a.).
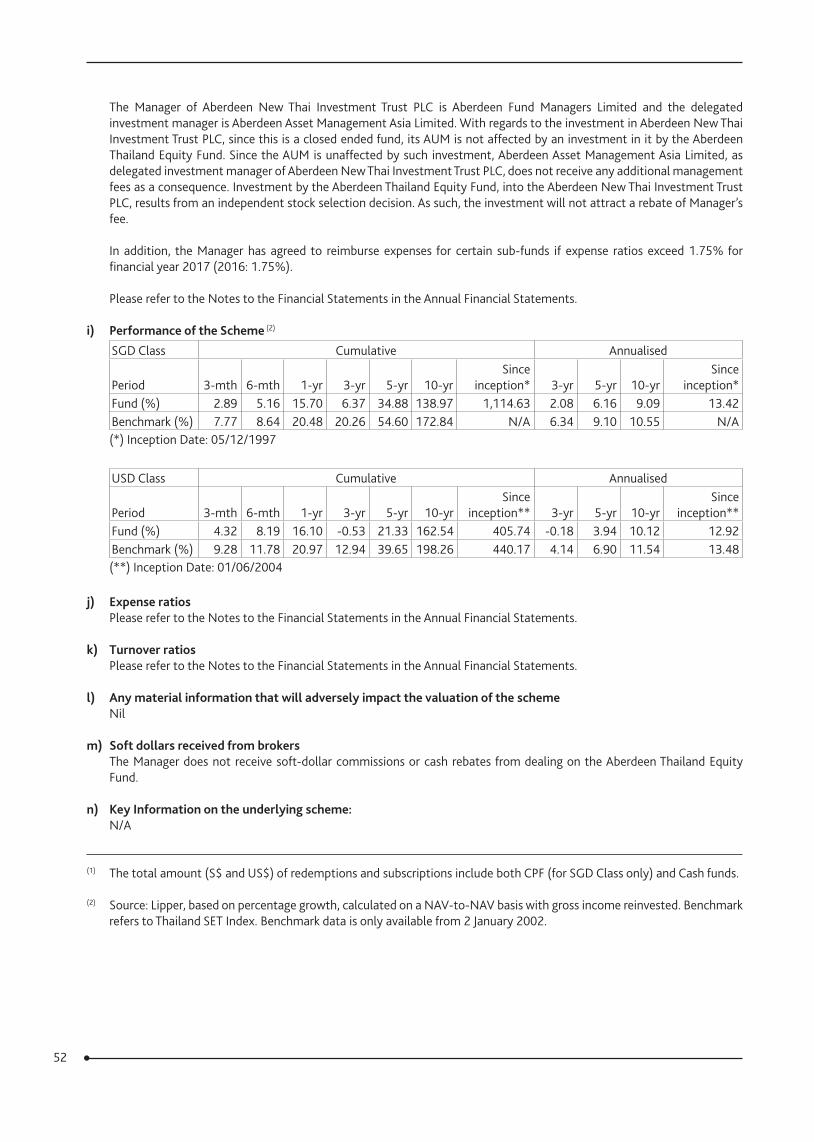
52
The Manager of Aberdeen New Thai Investment Trust PLC is Aberdeen Fund Managers Limited and the delegated investment manager is Aberdeen Asset Management Asia Limited. With regards to the investment in Aberdeen New Thai Investment Trust PLC, since this is a closed ended fund, its AUM is not affected by an investment in it by the Aberdeen Thailand Equity Fund. Since the AUM is unaffected by such investment, Aberdeen Asset Management Asia Limited, as delegated investment manager of Aberdeen New Thai Investment Trust PLC, does not receive any additional management fees as a consequence. Investment by the Aberdeen Thailand Equity Fund, into the Aberdeen New Thai Investment Trust PLC, results from an independent stock selection decision. As such, the investment will not attract a rebate of Manager’s fee.
In addition, the Manager has agreed to reimburse expenses for certain sub-funds if expense ratios exceed 1.75% for financial year 2017 (2016: 1.75%).
Please refer to the Notes to the Financial Statements in the Annual Financial Statements.
i) Performance of the Scheme (2)
SGD Class Cumulative Annualised
Period 3-mth 6-mth 1-yr 3-yr 5-yr 10-yrSince
inception* 3-yr 5-yr 10-yrSince
inception*Fund (%) 2.89 5.16 15.70 6.37 34.88 138.97 1,114.63 2.08 6.16 9.09 13.42Benchmark (%) 7.77 8.64 20.48 20.26 54.60 172.84 N/A 6.34 9.10 10.55 N/A(*) Inception Date: 05/12/1997
USD Class Cumulative Annualised
Period 3-mth 6-mth 1-yr 3-yr 5-yr 10-yrSince
inception** 3-yr 5-yr 10-yrSince
inception**Fund (%) 4.32 8.19 16.10 -0.53 21.33 162.54 405.74 -0.18 3.94 10.12 12.92Benchmark (%) 9.28 11.78 20.97 12.94 39.65 198.26 440.17 4.14 6.90 11.54 13.48(**) Inception Date: 01/06/2004
j) Expense ratios
Please refer to the Notes to the Financial Statements in the Annual Financial Statements.
k) Turnover ratios
Please refer to the Notes to the Financial Statements in the Annual Financial Statements.
l) Any material information that will adversely impact the valuation of the schemeNil
m) Soft dollars received from brokersThe Manager does not receive soft-dollar commissions or cash rebates from dealing on the Aberdeen Thailand Equity Fund.
n) Key Information on the underlying scheme:N/A
(1) The total amount (S$ and US$) of redemptions and subscriptions include both CPF (for SGD Class only) and Cash funds.
(2) Source: Lipper, based on percentage growth, calculated on a NAV-to-NAV basis with gross income reinvested. Benchmark refers to Thailand SET Index. Benchmark data is only available from 2 January 2002.

53
Aberdeen Select Portfolio Financial Statements
for the year ended 30 September 2017
54
Aberdeen Select Portfolio
Manager : Aberdeen Asset Management Asia Limited 21 Church Street, #01-01 Capital Square Two Singapore 049480 Directors of the Manager : Hugh Young Patrick James Justin Corfe Nicholas Philip Hugh Hadow Donald Roy Amstad Kang Puay Ju Ian Robert Macdonald Andrew Narracott Lim Sock Hwei Ng Hui Lin Flavia Cheong Mei Yi (appointed with effect from 30 December 2016) Tay Kheng Guet (appointed with effect from 11 May 2017) Terence Lim Ming Wan (appointed with effect from 21 March 2017) Solicitors to the Manager : Allen & Gledhill LLP One Marina Boulevard, #28-00 Singapore 018989 Trustee : BNP Paribas Trust Services Singapore Limited 20 Collyer Quay, #01-01 Singapore 049319 Custodian : BNP Paribas Securities Services, Singapore Branch 20 Collyer Quay, #01-01 Singapore 049319 Solicitors to the Trustee : Dentons Rodyk & Davidson LLP 80 Raffles Place, #33-00 UOB Plaza 1 Singapore 048624 Registrar : RBC Investors Services Trust Singapore Limited 77 Robinson Road, #18-00 Robinson 77 Singapore 068896 Auditors : KPMG LLP 16 Raffles Quay, #22-00 Hong Leong Building Singapore 048581
55
REPORT OF THE TRUSTEE
The Trustee is under a duty to take into custody and hold the assets of Aberdeen Select Portfolio (“the Trust”) in trust for the unitholders. In accordance with the Securities and Futures Act (Cap 289), its subsidiary legislation and the Code on Collective Investment Schemes, the Trustee shall monitor the activities of the Manager for compliance with the limitations imposed on the investment and borrowing powers as set out in the Trust Deed in each annual accounting period and report thereon to unitholders in an annual report.
To the best knowledge of the Trustee, the Manager has, in all material respects, managed the Trust during the year covered by these financial statements set out on pages 59 to 144 in accordance with the limitations imposed on the investment and borrowing powers set out in the Trust Deed.
For and on behalf of the TrusteeBNP Paribas Trust Services Singapore Limited
.................................................................................Authorised Signatory
Singapore30 November 2017
56
STATEMENT BY THE MANAGER
In the opinion of Aberdeen Asset Management Asia Limited, the accompanying financial statements set out on pages 59 to 144, comprising the Statements of Total Return, Statements of Financial Position, Statements of Movements of Unitholders' Funds, Statements of Portfolio and Notes to the Financial Statements are drawn up so as to present fairly, in all material respects, the financial position and the portfolio holdings of Aberdeen Select Portfolio as at 30 September 2017, and the financial performance and movements in unitholder's funds for the year then ended, in accordance with the recommendations of Statement of Recommended Accounting Practice 7 “Reporting Framework for Unit Trusts” issued by the Institute of Singapore Chartered Accountants.
At the date of this statement, there are reasonable grounds to believe that Aberdeen Select Portfolio will be able to meet its financial obligations as and when they materialise.
For and on behalf of Aberdeen Asset Management Asia Limited
.................................................................................Nicholas Philip Hugh HadowDirectorSingapore30 November 2017
57
Independent auditors’ report
UnitholdersAberdeen Select Portfolio (Constituted under a Trust Deed in the Republic of Singapore)
Opinion
We have audited the financial statements of Aberdeen Select Portfolio (‘the Trust’), which comprise the Statements of Financial Position and Statements of Portfolio as at 30 September 2017, the Statements of Total Return and Statements of Movements of Unitholders’ Funds for the year then ended, and notes to the financial statements, including a summary of significant accounting policies, as set out on pages 59 to 144.
In our opinion, the accompanying financial statements are properly drawn up in accordance with the recommendations of Statement of Recommended Accounting Practice 7 Reporting Framework for Unit Trusts (‘RAP 7’) issued by the Institute of Singapore Chartered Accountants so as to present fairly, in all material respects, the financial position and portfolio holdings of the Trust as at 30 September 2017 and the financial performance and movements in unitholders’ funds for the year ended on that date.
Basis for opinion
We conducted our audit in accordance with Singapore Standards on Auditing (‘SSAs’). Our responsibilities under those standards are further described in the ‘Auditors’ responsibilities for the audit of the financial statements section’ of our report. We are independent of the Trust in accordance with the Accounting and Corporate Regulatory Authority Code of Professional Conduct and Ethics for Public Accountants and Accounting Entities (‘ACRA Code’) together with the ethical requirements that are relevant to our audit of the financial statements in Singapore, and we have fulfilled our other ethical responsibilities in accordance with these requirements and the ACRA Code. We believe that the audit evidence we have obtained is sufficient and appropriate to provide a basis for our opinion.
Other information
Aberdeen Asset Management Asia Limited, the Manager of the Trust (‘the Manager’) is responsible for the other information contained in the annual report. Other information is defined as all information in the annual report other than the financial statements and our auditors’ report thereon.
We have obtained all other information prior to the date of the auditors’ report.
Our opinion on the financial statements does not cover the other information and we do not express any form of assurance conclusion thereon.
In connection with our audit of the financial statements, our responsibility is to read the other information and, in doing so, consider whether the other information is materially inconsistent with the financial statements or our knowledge obtained in the audit or otherwise appears to be materially misstated. If, based on the work we have performed, we conclude that there is a material misstatement of this other information, we are required to report that fact. We have nothing to report in this regard.
Responsibilities of the Manager for the financial statements
The Manager is responsible for the preparation and fair presentation of these financial statements in accordance with the recommendations of RAP 7 issued by the Institute of Singapore Chartered Accountants, and for such internal control as the Manager determines is necessary to enable the preparation of financial statements that are free from material misstatement, whether due to fraud or error.
In preparing the financial statements, the Manager is responsible for assessing the Trust’s ability to continue as a going concern, disclosing, as applicable, matters related to going concern and using the going concern basis of accounting unless the Manager either intends to terminate the Trust or to cease the Trust’s operations, or has no realistic alternative but to do so.
The Manager’s responsibilities include overseeing the Trust’s financial reporting process.
58
Independent auditors’ report (continued)
Auditors’ responsibilities for the audit of the financial statements
Our objectives are to obtain reasonable assurance about whether the financial statements as a whole are free from material misstatement, whether due to fraud or error, and to issue an auditors’ report that includes our opinion. Reasonable assurance is a high level of assurance, but is not a guarantee that an audit conducted in accordance with SSAs will always detect a material misstatement when it exists. Misstatements can arise from fraud or error and are considered material if, individually or in the aggregate, they could reasonably be expected to influence the economic decisions of users taken on the basis of these financial statements.
As part of an audit in accordance with SSAs, we exercise professional judgement and maintain professional scepticism throughout the audit. We also:
• Identify and assess the risks of material misstatement of the financial statements, whether due to fraud or error, design and perform audit procedures responsive to those risks, and obtain audit evidence that is sufficient and appropriate to provide a basis for our opinion. The risk of not detecting a material misstatement resulting from fraud is higher than for one resulting from error, as fraud may involve collusion, forgery, intentional omissions, misrepresentations, or the override of internal controls.
• Obtain an understanding of internal controls relevant to the audit in order to design audit procedures that are appropriate in the circumstances, but not for the purpose of expressing an opinion on the effectiveness of the Trust’s internal controls.
• Evaluate the appropriateness of accounting policies used and the reasonableness of accounting estimates and related disclosures made by the Manager.
• Conclude on the appropriateness of the Manager’s use of the going concern basis of accounting and, based on the audit evidence obtained, whether a material uncertainty exists related to events or conditions that may cast significant doubt on the Trust’s ability to continue as a going concern. If we conclude that a material uncertainty exists, we are required to draw attention in our auditors’ report to the related disclosures in the financial statements or, if such disclosures are inadequate, to modify our opinion. Our conclusions are based on the audit evidence obtained up to the date of our auditors’ report. However, future events or conditions may cause the Trust to cease to continue as a going concern.
• Evaluate the overall presentation, structure and content of the financial statements, including the disclosures, and whether the financial statements represent the underlying transactions and events in a manner that achieves fair presentation.
We communicate with the Manager regarding, among other matters, the planned scope and timing of the audit and significant audit findings, including any significant deficiencies in internal controls that we identify during our audit.
KPMG LLPPublic Accountants andChartered Accountants
Singapore30 November 2017
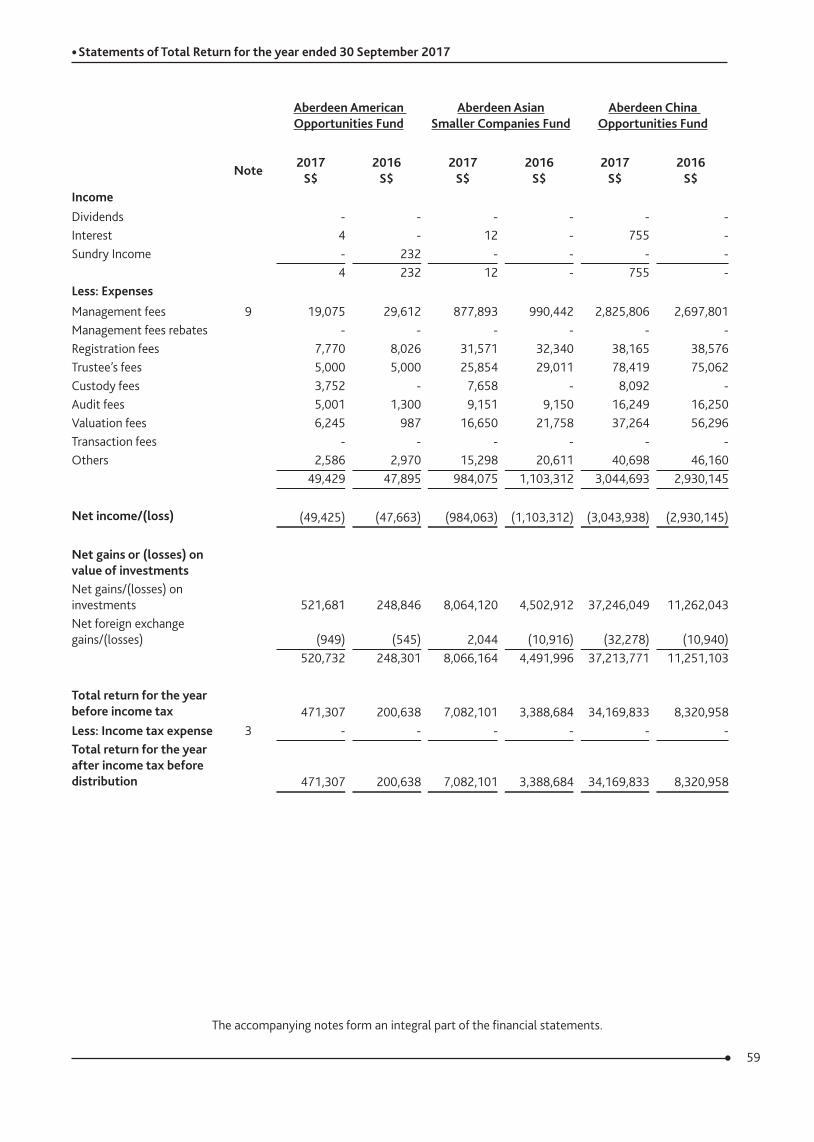
59
The accompanying notes form an integral part of the financial statements.
Aberdeen American Opportunities Fund
Aberdeen Asian Smaller Companies Fund
Aberdeen China Opportunities Fund
Note 2017 S$
2016 S$
2017 S$
2016 S$
2017 S$
2016 S$
IncomeDividends - - - - - -Interest 4 - 12 - 755 -Sundry Income - 232 - - - -
4 232 12 - 755 -Less: ExpensesManagement fees 9 19,075 29,612 877,893 990,442 2,825,806 2,697,801Management fees rebates - - - - - -Registration fees 7,770 8,026 31,571 32,340 38,165 38,576Trustee’s fees 5,000 5,000 25,854 29,011 78,419 75,062Custody fees 3,752 - 7,658 - 8,092 -Audit fees 5,001 1,300 9,151 9,150 16,249 16,250Valuation fees 6,245 987 16,650 21,758 37,264 56,296Transaction fees - - - - - -Others 2,586 2,970 15,298 20,611 40,698 46,160
49,429 47,895 984,075 1,103,312 3,044,693 2,930,145
Net income/(loss) (49,425) (47,663) (984,063) (1,103,312) (3,043,938) (2,930,145)
Net gains or (losses) on value of investments Net gains/(losses) on investments 521,681 248,846 8,064,120 4,502,912 37,246,049 11,262,043Net foreign exchange gains/(losses) (949) (545) 2,044 (10,916) (32,278) (10,940)
520,732 248,301 8,066,164 4,491,996 37,213,771 11,251,103
Total return for the year before income tax 471,307 200,638 7,082,101 3,388,684 34,169,833 8,320,958Less: Income tax expense 3 - - - - - -Total return for the year after income tax before distribution 471,307 200,638 7,082,101 3,388,684 34,169,833 8,320,958
• Statements of Total Return for the year ended 30 September 2017
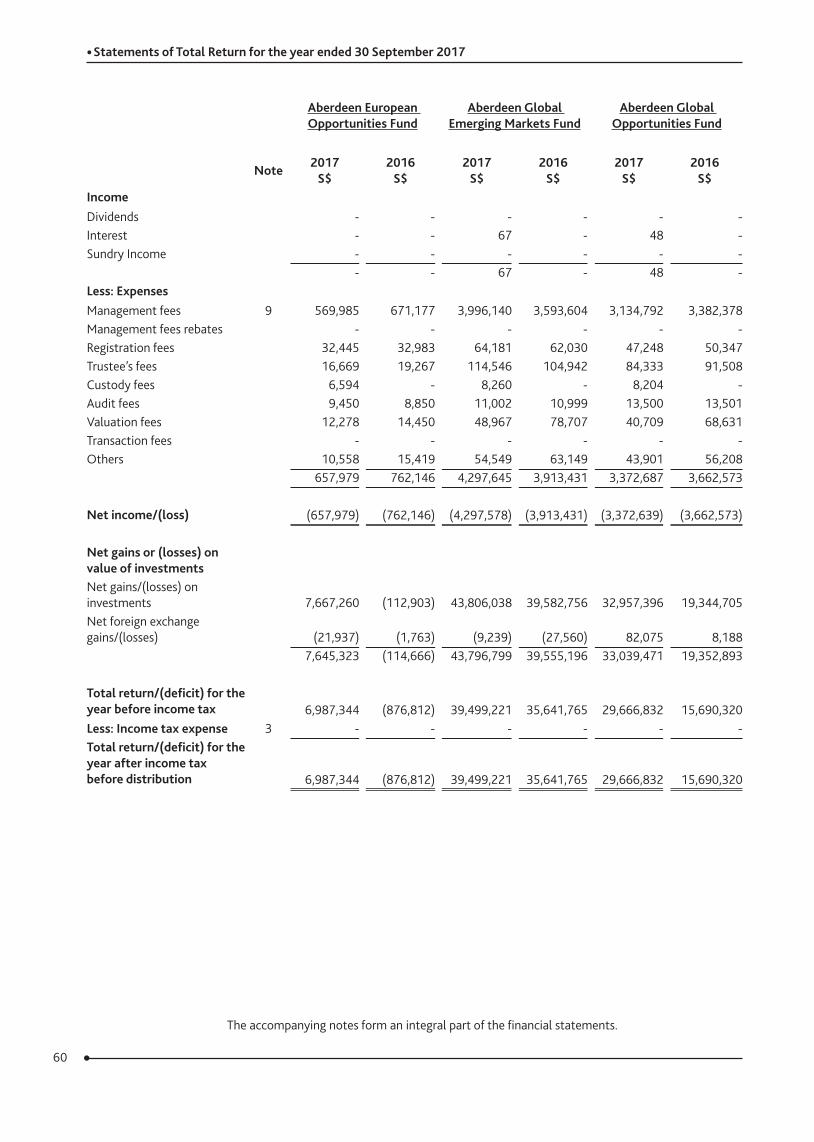
60
The accompanying notes form an integral part of the financial statements.
Aberdeen European Opportunities Fund
Aberdeen Global Emerging Markets Fund
Aberdeen Global Opportunities Fund
Note 2017 S$
2016 S$
2017 S$
2016 S$
2017 S$
2016 S$
IncomeDividends - - - - - -Interest - - 67 - 48 -Sundry Income - - - - - -
- - 67 - 48 -Less: ExpensesManagement fees 9 569,985 671,177 3,996,140 3,593,604 3,134,792 3,382,378Management fees rebates - - - - - -Registration fees 32,445 32,983 64,181 62,030 47,248 50,347Trustee’s fees 16,669 19,267 114,546 104,942 84,333 91,508Custody fees 6,594 - 8,260 - 8,204 -Audit fees 9,450 8,850 11,002 10,999 13,500 13,501Valuation fees 12,278 14,450 48,967 78,707 40,709 68,631Transaction fees - - - - - -Others 10,558 15,419 54,549 63,149 43,901 56,208
657,979 762,146 4,297,645 3,913,431 3,372,687 3,662,573
Net income/(loss) (657,979) (762,146) (4,297,578) (3,913,431) (3,372,639) (3,662,573)
Net gains or (losses) on value of investments Net gains/(losses) on investments 7,667,260 (112,903) 43,806,038 39,582,756 32,957,396 19,344,705Net foreign exchange gains/(losses) (21,937) (1,763) (9,239) (27,560) 82,075 8,188
7,645,323 (114,666) 43,796,799 39,555,196 33,039,471 19,352,893
Total return/(deficit) for the year before income tax 6,987,344 (876,812) 39,499,221 35,641,765 29,666,832 15,690,320Less: Income tax expense 3 - - - - - - Total return/(deficit) for the year after income tax before distribution 6,987,344 (876,812) 39,499,221 35,641,765 29,666,832 15,690,320
• Statements of Total Return for the year ended 30 September 2017
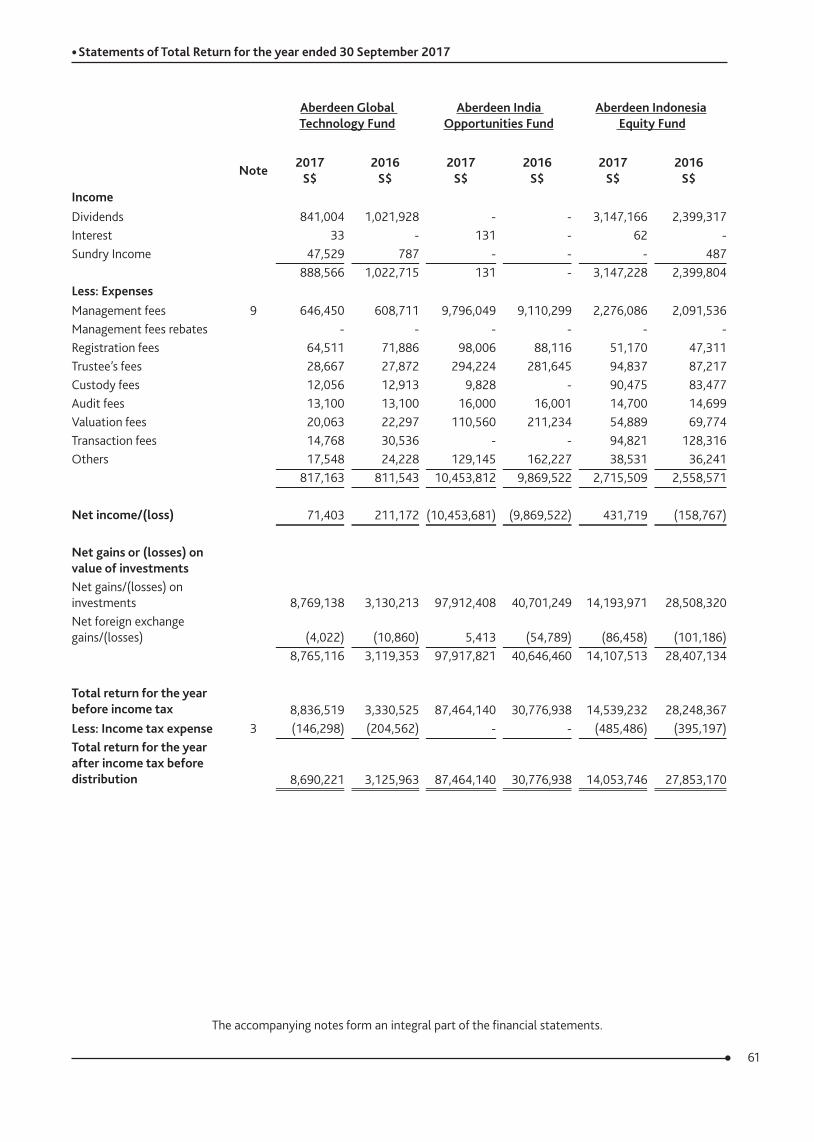
61
The accompanying notes form an integral part of the financial statements.
Aberdeen Global Technology Fund
Aberdeen India Opportunities Fund
Aberdeen Indonesia Equity Fund
Note 2017 S$
2016 S$
2017 S$
2016 S$
2017 S$
2016 S$
IncomeDividends 841,004 1,021,928 - - 3,147,166 2,399,317Interest 33 - 131 - 62 -Sundry Income 47,529 787 - - - 487
888,566 1,022,715 131 - 3,147,228 2,399,804Less: ExpensesManagement fees 9 646,450 608,711 9,796,049 9,110,299 2,276,086 2,091,536Management fees rebates - - - - - -Registration fees 64,511 71,886 98,006 88,116 51,170 47,311Trustee’s fees 28,667 27,872 294,224 281,645 94,837 87,217Custody fees 12,056 12,913 9,828 - 90,475 83,477Audit fees 13,100 13,100 16,000 16,001 14,700 14,699Valuation fees 20,063 22,297 110,560 211,234 54,889 69,774Transaction fees 14,768 30,536 - - 94,821 128,316Others 17,548 24,228 129,145 162,227 38,531 36,241
817,163 811,543 10,453,812 9,869,522 2,715,509 2,558,571
Net income/(loss) 71,403 211,172 (10,453,681) (9,869,522) 431,719 (158,767)
Net gains or (losses) on value of investments Net gains/(losses) on investments 8,769,138 3,130,213 97,912,408 40,701,249 14,193,971 28,508,320Net foreign exchange gains/(losses) (4,022) (10,860) 5,413 (54,789) (86,458) (101,186)
8,765,116 3,119,353 97,917,821 40,646,460 14,107,513 28,407,134
Total return for the year before income tax 8,836,519 3,330,525 87,464,140 30,776,938 14,539,232 28,248,367Less: Income tax expense 3 (146,298) (204,562) - - (485,486) (395,197)Total return for the year after income tax before distribution 8,690,221 3,125,963 87,464,140 30,776,938 14,053,746 27,853,170
• Statements of Total Return for the year ended 30 September 2017
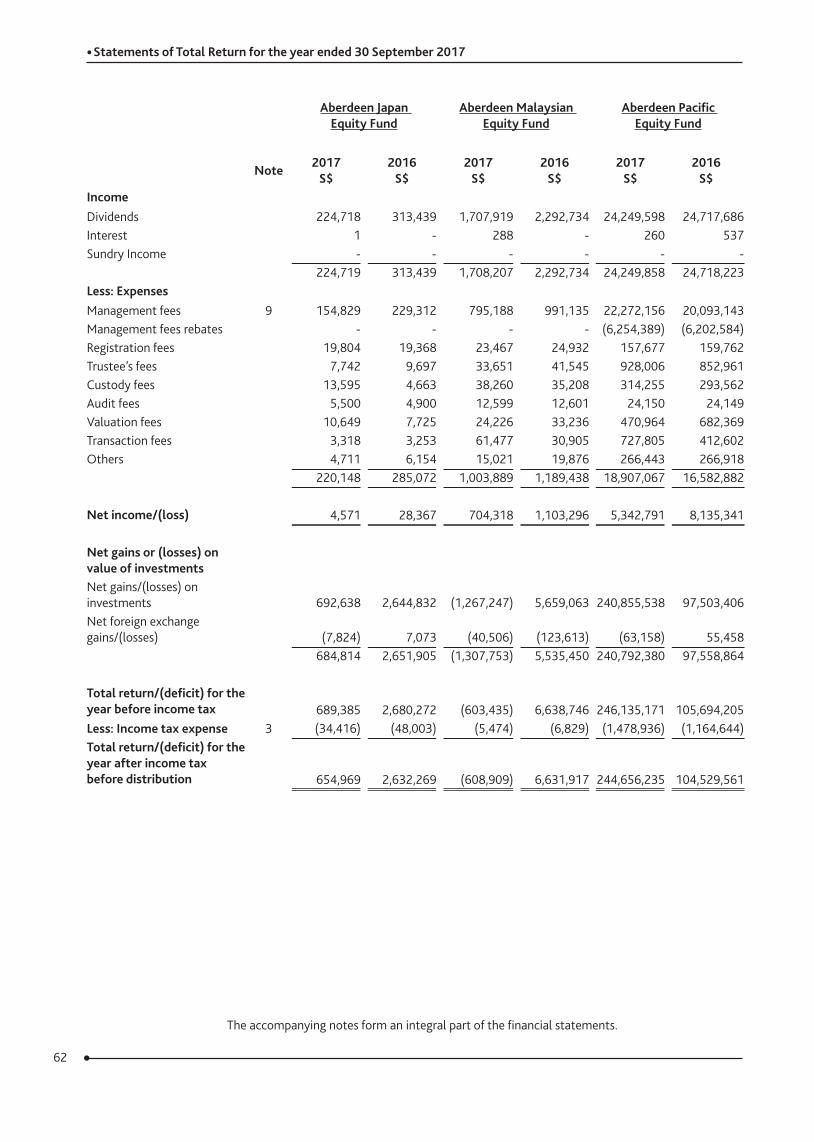
62
The accompanying notes form an integral part of the financial statements.
Aberdeen Japan Equity Fund
Aberdeen Malaysian Equity Fund
Aberdeen Pacific Equity Fund
Note 2017 S$
2016 S$
2017 S$
2016 S$
2017 S$
2016 S$
IncomeDividends 224,718 313,439 1,707,919 2,292,734 24,249,598 24,717,686Interest 1 - 288 - 260 537Sundry Income - - - - - -
224,719 313,439 1,708,207 2,292,734 24,249,858 24,718,223Less: ExpensesManagement fees 9 154,829 229,312 795,188 991,135 22,272,156 20,093,143Management fees rebates - - - - (6,254,389) (6,202,584)Registration fees 19,804 19,368 23,467 24,932 157,677 159,762Trustee’s fees 7,742 9,697 33,651 41,545 928,006 852,961Custody fees 13,595 4,663 38,260 35,208 314,255 293,562Audit fees 5,500 4,900 12,599 12,601 24,150 24,149Valuation fees 10,649 7,725 24,226 33,236 470,964 682,369Transaction fees 3,318 3,253 61,477 30,905 727,805 412,602Others 4,711 6,154 15,021 19,876 266,443 266,918
220,148 285,072 1,003,889 1,189,438 18,907,067 16,582,882
Net income/(loss) 4,571 28,367 704,318 1,103,296 5,342,791 8,135,341
Net gains or (losses) on value of investments Net gains/(losses) on investments 692,638 2,644,832 (1,267,247) 5,659,063 240,855,538 97,503,406Net foreign exchange gains/(losses) (7,824) 7,073 (40,506) (123,613) (63,158) 55,458
684,814 2,651,905 (1,307,753) 5,535,450 240,792,380 97,558,864
Total return/(deficit) for the year before income tax 689,385 2,680,272 (603,435) 6,638,746 246,135,171 105,694,205Less: Income tax expense 3 (34,416) (48,003) (5,474) (6,829) (1,478,936) (1,164,644)Total return/(deficit) for the year after income tax before distribution 654,969 2,632,269 (608,909) 6,631,917 244,656,235 104,529,561
• Statements of Total Return for the year ended 30 September 2017
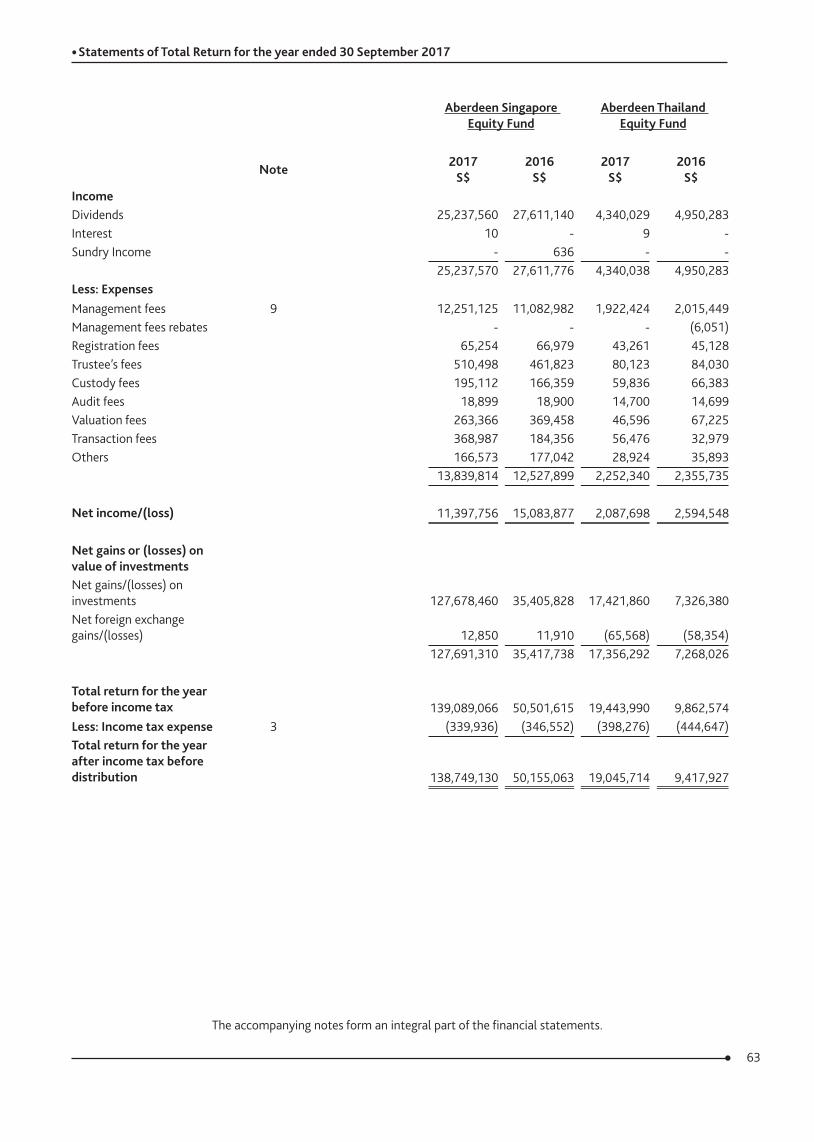
63
The accompanying notes form an integral part of the financial statements.
Aberdeen Singapore Equity Fund
Aberdeen Thailand Equity Fund
Note 2017 S$
2016 S$
2017 S$
2016 S$
IncomeDividends 25,237,560 27,611,140 4,340,029 4,950,283Interest 10 - 9 -Sundry Income - 636 - -
25,237,570 27,611,776 4,340,038 4,950,283Less: ExpensesManagement fees 9 12,251,125 11,082,982 1,922,424 2,015,449Management fees rebates - - - (6,051)Registration fees 65,254 66,979 43,261 45,128Trustee’s fees 510,498 461,823 80,123 84,030Custody fees 195,112 166,359 59,836 66,383Audit fees 18,899 18,900 14,700 14,699Valuation fees 263,366 369,458 46,596 67,225Transaction fees 368,987 184,356 56,476 32,979Others 166,573 177,042 28,924 35,893
13,839,814 12,527,899 2,252,340 2,355,735
Net income/(loss) 11,397,756 15,083,877 2,087,698 2,594,548
Net gains or (losses) on value of investments Net gains/(losses) on investments 127,678,460 35,405,828 17,421,860 7,326,380Net foreign exchange gains/(losses) 12,850 11,910 (65,568) (58,354)
127,691,310 35,417,738 17,356,292 7,268,026
Total return for the year before income tax 139,089,066 50,501,615 19,443,990 9,862,574Less: Income tax expense 3 (339,936) (346,552) (398,276) (444,647)Total return for the year after income tax before distribution 138,749,130 50,155,063 19,045,714 9,417,927
• Statements of Total Return for the year ended 30 September 2017
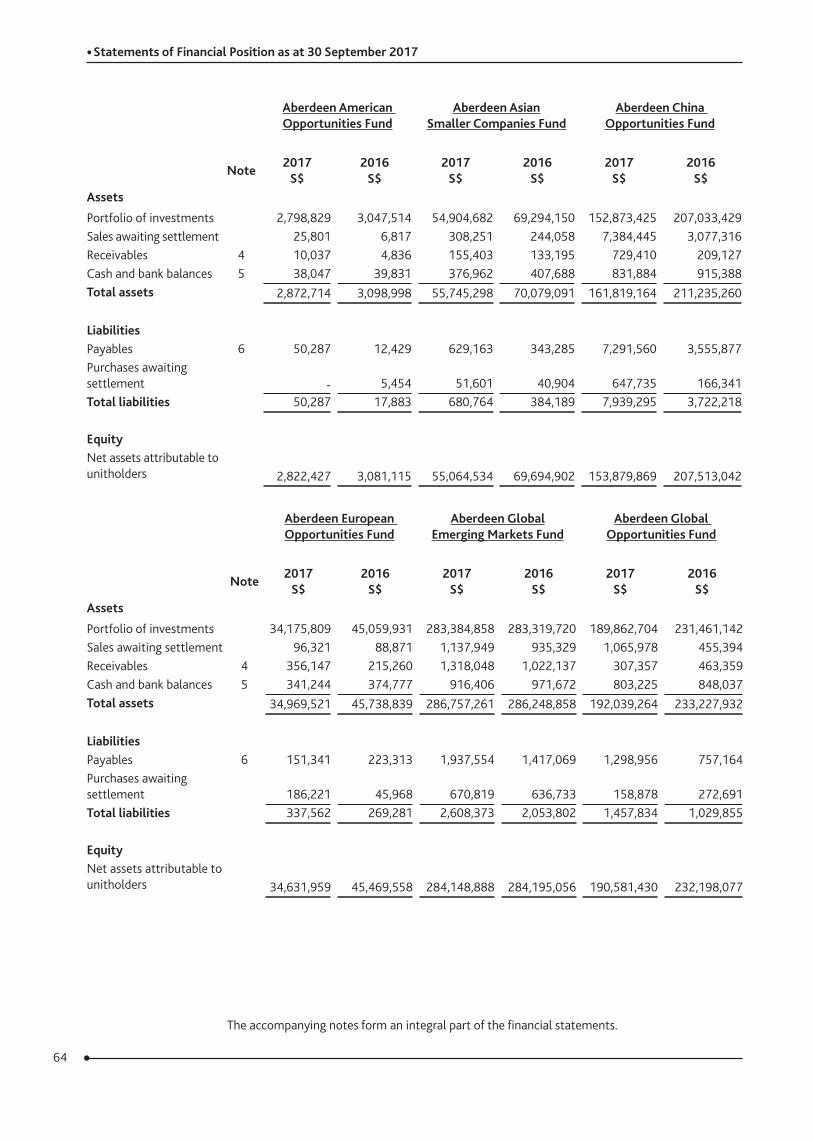
64
The accompanying notes form an integral part of the financial statements.
Aberdeen American Opportunities Fund
Aberdeen Asian Smaller Companies Fund
Aberdeen China Opportunities Fund
Note 2017 S$
2016 S$
2017 S$
2016 S$
2017 S$
2016 S$
Assets
Portfolio of investments 2,798,829 3,047,514 54,904,682 69,294,150 152,873,425 207,033,429Sales awaiting settlement 25,801 6,817 308,251 244,058 7,384,445 3,077,316Receivables 4 10,037 4,836 155,403 133,195 729,410 209,127Cash and bank balances 5 38,047 39,831 376,962 407,688 831,884 915,388Total assets 2,872,714 3,098,998 55,745,298 70,079,091 161,819,164 211,235,260
LiabilitiesPayables 6 50,287 12,429 629,163 343,285 7,291,560 3,555,877Purchases awaiting settlement - 5,454 51,601 40,904 647,735 166,341Total liabilities 50,287 17,883 680,764 384,189 7,939,295 3,722,218
EquityNet assets attributable to unitholders 2,822,427 3,081,115 55,064,534 69,694,902 153,879,869 207,513,042
Aberdeen European Opportunities Fund
Aberdeen Global Emerging Markets Fund
Aberdeen Global Opportunities Fund
Note 2017 S$
2016 S$
2017 S$
2016 S$
2017 S$
2016 S$
Assets
Portfolio of investments 34,175,809 45,059,931 283,384,858 283,319,720 189,862,704 231,461,142Sales awaiting settlement 96,321 88,871 1,137,949 935,329 1,065,978 455,394Receivables 4 356,147 215,260 1,318,048 1,022,137 307,357 463,359Cash and bank balances 5 341,244 374,777 916,406 971,672 803,225 848,037Total assets 34,969,521 45,738,839 286,757,261 286,248,858 192,039,264 233,227,932
LiabilitiesPayables 6 151,341 223,313 1,937,554 1,417,069 1,298,956 757,164Purchases awaiting settlement 186,221 45,968 670,819 636,733 158,878 272,691Total liabilities 337,562 269,281 2,608,373 2,053,802 1,457,834 1,029,855
EquityNet assets attributable to unitholders 34,631,959 45,469,558 284,148,888 284,195,056 190,581,430 232,198,077
• Statements of Financial Position as at 30 September 2017
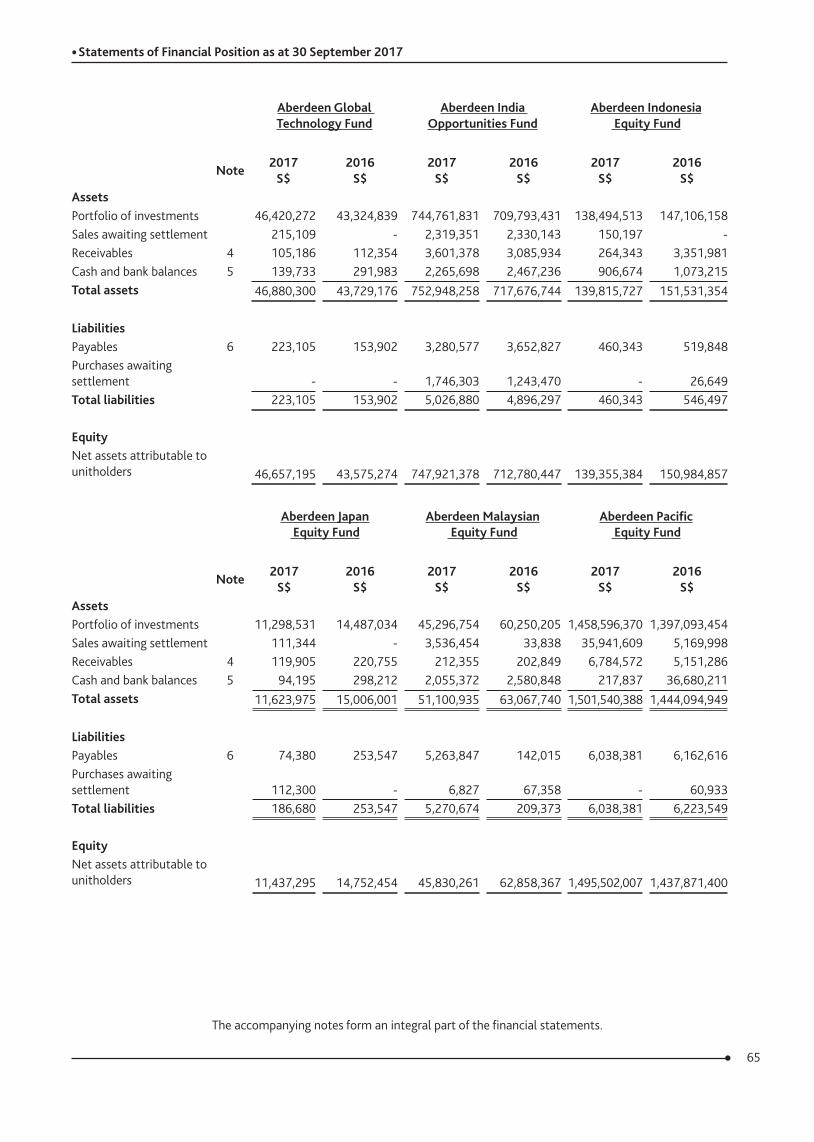
65
The accompanying notes form an integral part of the financial statements.
Aberdeen Global Technology Fund
Aberdeen India Opportunities Fund
Aberdeen Indonesia Equity Fund
Note 2017 S$
2016 S$
2017 S$
2016 S$
2017 S$
2016 S$
AssetsPortfolio of investments 46,420,272 43,324,839 744,761,831 709,793,431 138,494,513 147,106,158Sales awaiting settlement 215,109 - 2,319,351 2,330,143 150,197 -Receivables 4 105,186 112,354 3,601,378 3,085,934 264,343 3,351,981Cash and bank balances 5 139,733 291,983 2,265,698 2,467,236 906,674 1,073,215Total assets 46,880,300 43,729,176 752,948,258 717,676,744 139,815,727 151,531,354
LiabilitiesPayables 6 223,105 153,902 3,280,577 3,652,827 460,343 519,848Purchases awaiting settlement - - 1,746,303 1,243,470 - 26,649Total liabilities 223,105 153,902 5,026,880 4,896,297 460,343 546,497
EquityNet assets attributable to unitholders 46,657,195 43,575,274 747,921,378 712,780,447 139,355,384 150,984,857
Aberdeen Japan Equity Fund
Aberdeen Malaysian Equity Fund
Aberdeen Pacific Equity Fund
Note 2017 S$
2016 S$
2017 S$
2016 S$
2017 S$
2016 S$
AssetsPortfolio of investments 11,298,531 14,487,034 45,296,754 60,250,205 1,458,596,370 1,397,093,454Sales awaiting settlement 111,344 - 3,536,454 33,838 35,941,609 5,169,998Receivables 4 119,905 220,755 212,355 202,849 6,784,572 5,151,286Cash and bank balances 5 94,195 298,212 2,055,372 2,580,848 217,837 36,680,211Total assets 11,623,975 15,006,001 51,100,935 63,067,740 1,501,540,388 1,444,094,949
LiabilitiesPayables 6 74,380 253,547 5,263,847 142,015 6,038,381 6,162,616Purchases awaiting settlement 112,300 - 6,827 67,358 - 60,933Total liabilities 186,680 253,547 5,270,674 209,373 6,038,381 6,223,549
EquityNet assets attributable to unitholders 11,437,295 14,752,454 45,830,261 62,858,367 1,495,502,007 1,437,871,400
• Statements of Financial Position as at 30 September 2017
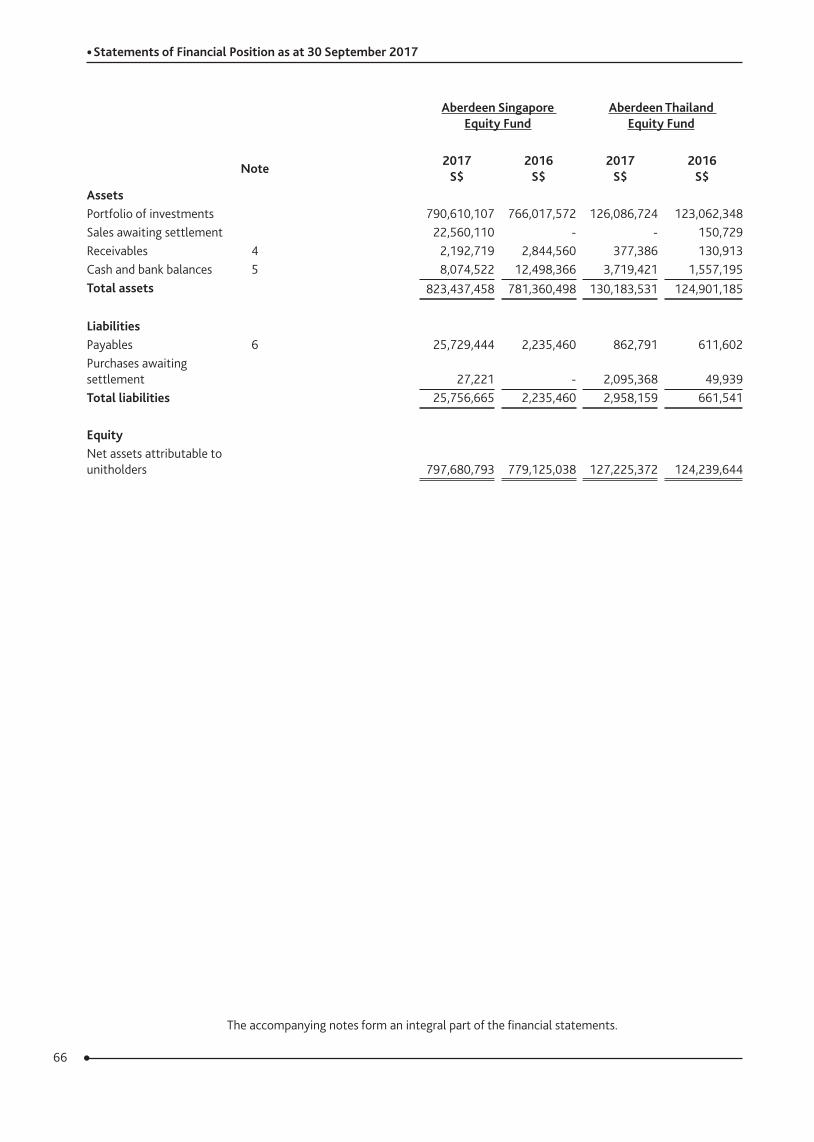
66
The accompanying notes form an integral part of the financial statements.
Aberdeen Singapore Equity Fund
Aberdeen Thailand Equity Fund
Note 2017 S$
2016 S$
2017 S$
2016 S$
AssetsPortfolio of investments 790,610,107 766,017,572 126,086,724 123,062,348Sales awaiting settlement 22,560,110 - - 150,729Receivables 4 2,192,719 2,844,560 377,386 130,913Cash and bank balances 5 8,074,522 12,498,366 3,719,421 1,557,195Total assets 823,437,458 781,360,498 130,183,531 124,901,185
LiabilitiesPayables 6 25,729,444 2,235,460 862,791 611,602Purchases awaiting settlement 27,221 - 2,095,368 49,939Total liabilities 25,756,665 2,235,460 2,958,159 661,541
EquityNet assets attributable to unitholders 797,680,793 779,125,038 127,225,372 124,239,644
• Statements of Financial Position as at 30 September 2017
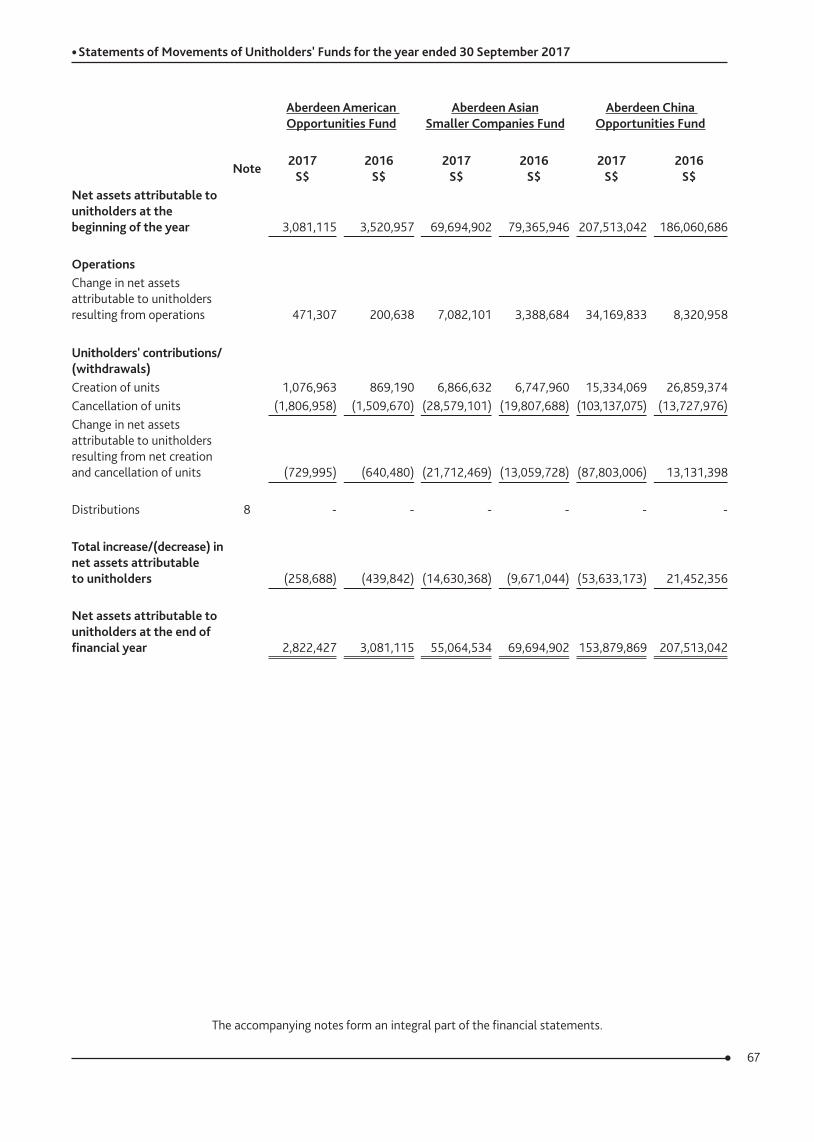
67
The accompanying notes form an integral part of the financial statements.
Aberdeen American Opportunities Fund
Aberdeen Asian Smaller Companies Fund
Aberdeen China Opportunities Fund
Note 2017 S$
2016 S$
2017 S$
2016 S$
2017 S$
2016 S$
Net assets attributable to unitholders at the beginning of the year 3,081,115 3,520,957 69,694,902 79,365,946 207,513,042 186,060,686
OperationsChange in net assets attributable to unitholders resulting from operations 471,307 200,638 7,082,101 3,388,684 34,169,833 8,320,958
Unitholders' contributions/ (withdrawals)Creation of units 1,076,963 869,190 6,866,632 6,747,960 15,334,069 26,859,374Cancellation of units (1,806,958) (1,509,670) (28,579,101) (19,807,688) (103,137,075) (13,727,976)Change in net assets attributable to unitholders resulting from net creation and cancellation of units
(729,995) (640,480) (21,712,469) (13,059,728) (87,803,006) 13,131,398
Distributions 8 - - - - - -
Total increase/(decrease) in net assets attributable to unitholders (258,688) (439,842) (14,630,368) (9,671,044) (53,633,173) 21,452,356
Net assets attributable to unitholders at the end of financial year 2,822,427 3,081,115 55,064,534 69,694,902 153,879,869 207,513,042
• Statements of Movements of Unitholders' Funds for the year ended 30 September 2017
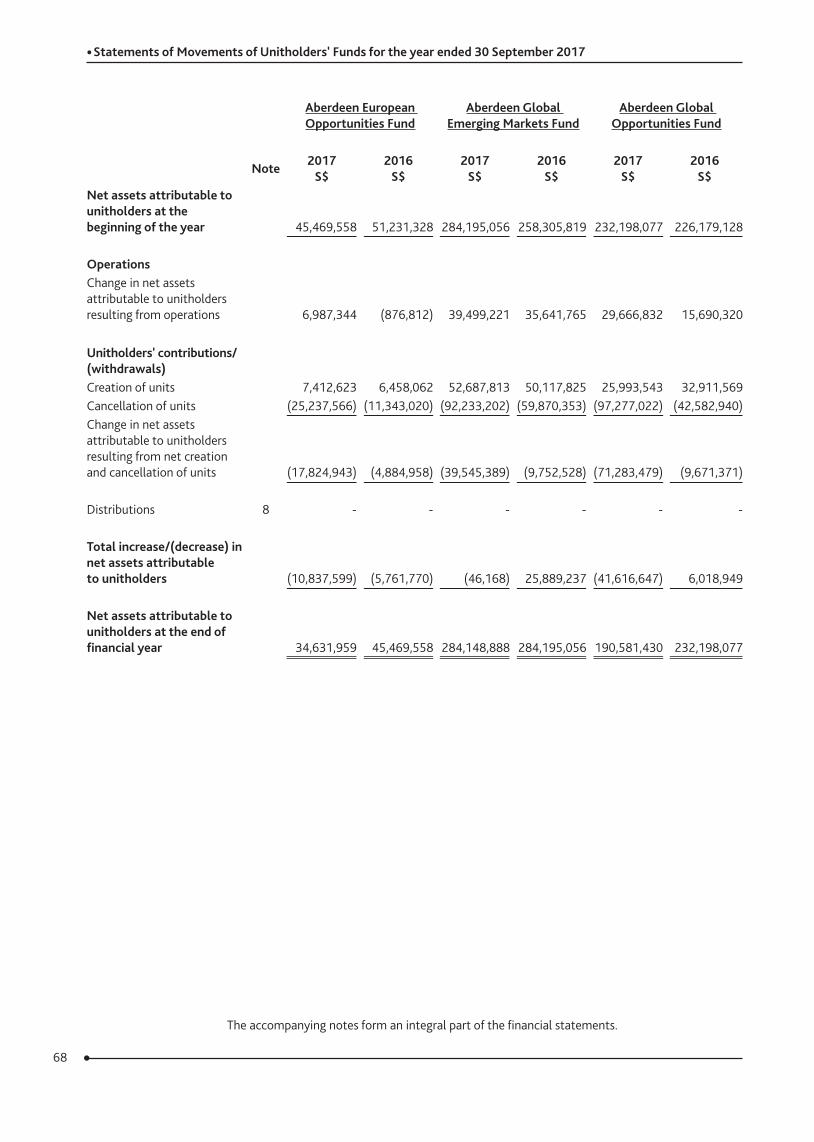
68
The accompanying notes form an integral part of the financial statements.
Aberdeen European Opportunities Fund
Aberdeen Global Emerging Markets Fund
Aberdeen Global Opportunities Fund
Note 2017 S$
2016 S$
2017 S$
2016 S$
2017 S$
2016 S$
Net assets attributable to unitholders at the beginning of the year 45,469,558 51,231,328 284,195,056 258,305,819 232,198,077 226,179,128
OperationsChange in net assets attributable to unitholders resulting from operations 6,987,344 (876,812) 39,499,221 35,641,765 29,666,832 15,690,320
Unitholders' contributions/ (withdrawals)Creation of units 7,412,623 6,458,062 52,687,813 50,117,825 25,993,543 32,911,569Cancellation of units (25,237,566) (11,343,020) (92,233,202) (59,870,353) (97,277,022) (42,582,940)Change in net assets attributable to unitholders resulting from net creation and cancellation of units
(17,824,943) (4,884,958) (39,545,389) (9,752,528) (71,283,479) (9,671,371)
Distributions 8 - - - - - -
Total increase/(decrease) in net assets attributable to unitholders (10,837,599) (5,761,770) (46,168) 25,889,237 (41,616,647) 6,018,949
Net assets attributable to unitholders at the end of financial year 34,631,959 45,469,558 284,148,888 284,195,056 190,581,430 232,198,077
• Statements of Movements of Unitholders' Funds for the year ended 30 September 2017
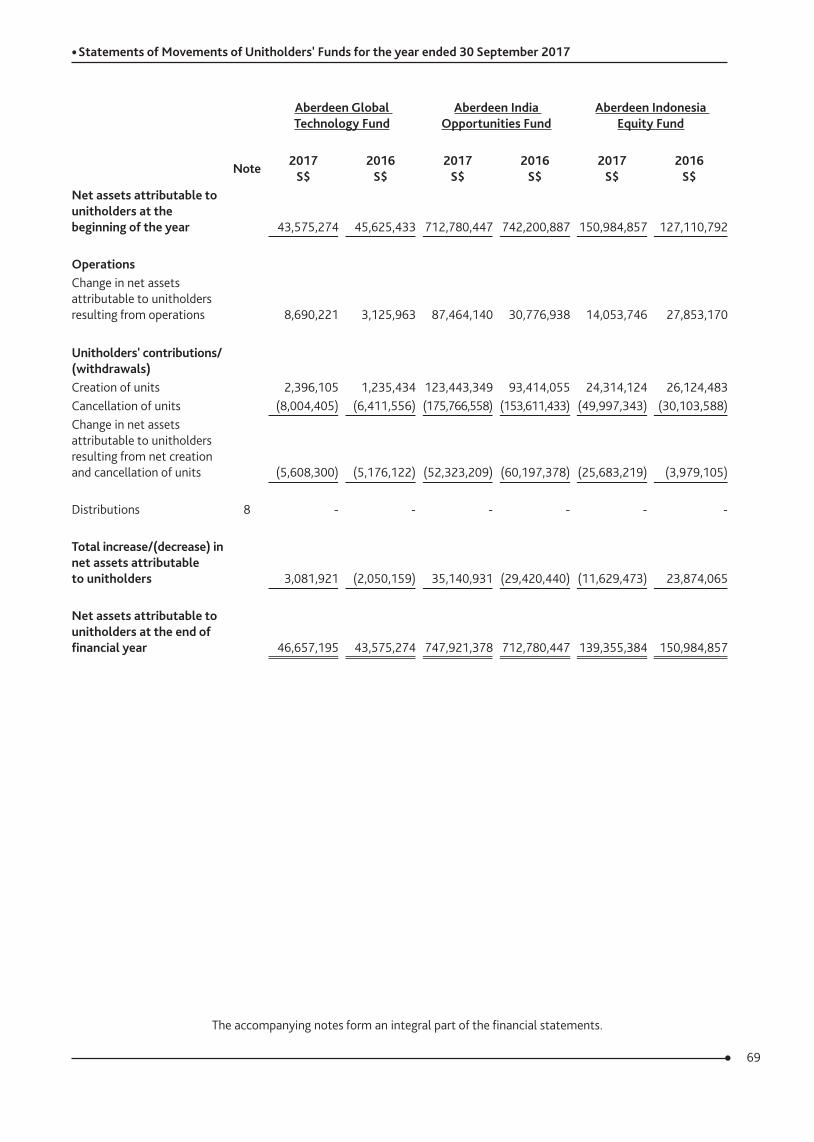
69
The accompanying notes form an integral part of the financial statements.
Aberdeen Global Technology Fund
Aberdeen India Opportunities Fund
Aberdeen Indonesia Equity Fund
Note 2017 S$
2016 S$
2017 S$
2016 S$
2017 S$
2016 S$
Net assets attributable to unitholders at the beginning of the year 43,575,274 45,625,433 712,780,447 742,200,887 150,984,857 127,110,792
OperationsChange in net assets attributable to unitholders resulting from operations 8,690,221 3,125,963 87,464,140 30,776,938 14,053,746 27,853,170
Unitholders' contributions/ (withdrawals)Creation of units 2,396,105 1,235,434 123,443,349 93,414,055 24,314,124 26,124,483Cancellation of units (8,004,405) (6,411,556) (175,766,558) (153,611,433) (49,997,343) (30,103,588)Change in net assets attributable to unitholders resulting from net creation and cancellation of units
(5,608,300) (5,176,122) (52,323,209) (60,197,378) (25,683,219) (3,979,105)
Distributions 8 - - - - - -
Total increase/(decrease) in net assets attributable to unitholders 3,081,921 (2,050,159) 35,140,931 (29,420,440) (11,629,473) 23,874,065
Net assets attributable to unitholders at the end of financial year 46,657,195 43,575,274 747,921,378 712,780,447 139,355,384 150,984,857
• Statements of Movements of Unitholders' Funds for the year ended 30 September 2017
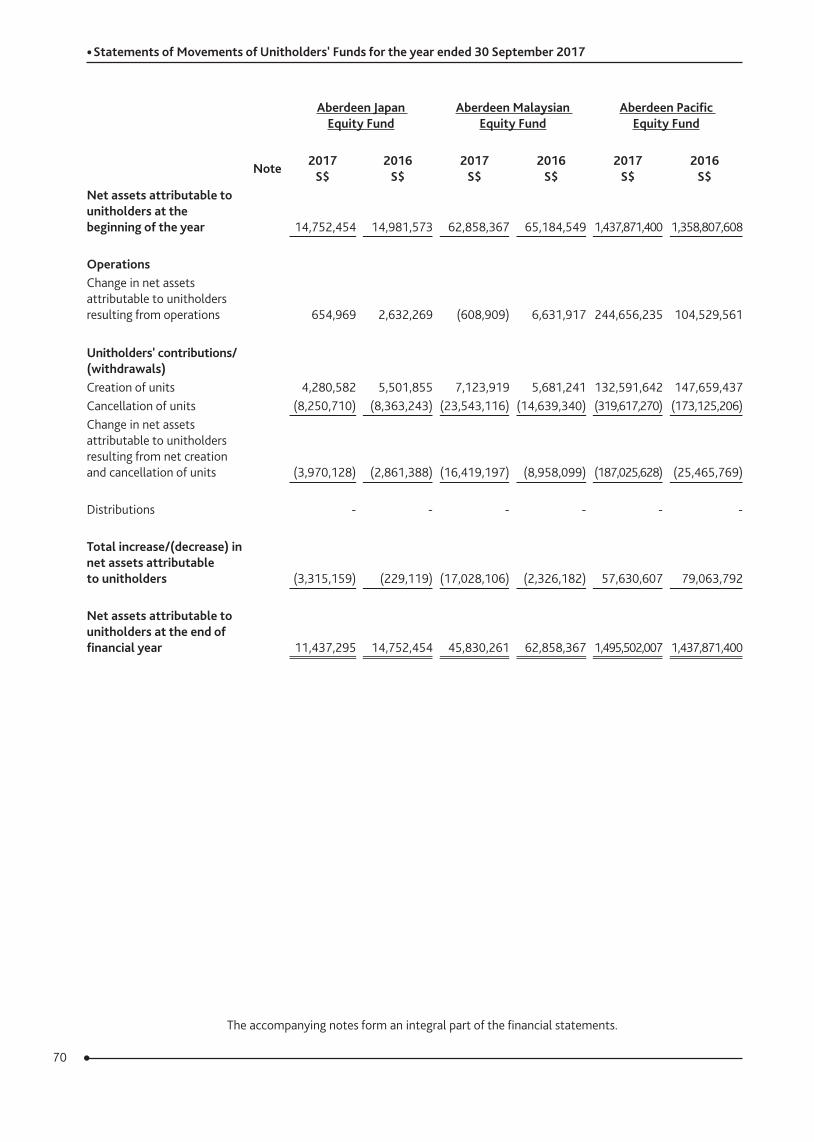
70
The accompanying notes form an integral part of the financial statements.
Aberdeen Japan Equity Fund
Aberdeen Malaysian Equity Fund
Aberdeen Pacific Equity Fund
Note 2017 S$
2016 S$
2017 S$
2016 S$
2017 S$
2016 S$
Net assets attributable to unitholders at the beginning of the year 14,752,454 14,981,573 62,858,367 65,184,549 1,437,871,400 1,358,807,608
OperationsChange in net assets attributable to unitholders resulting from operations 654,969 2,632,269 (608,909) 6,631,917 244,656,235 104,529,561
Unitholders' contributions/ (withdrawals)Creation of units 4,280,582 5,501,855 7,123,919 5,681,241 132,591,642 147,659,437Cancellation of units (8,250,710) (8,363,243) (23,543,116) (14,639,340) (319,617,270) (173,125,206)Change in net assets attributable to unitholders resulting from net creation and cancellation of units
(3,970,128) (2,861,388) (16,419,197) (8,958,099) (187,025,628) (25,465,769)
Distributions - - - - - -
Total increase/(decrease) in net assets attributable to unitholders (3,315,159) (229,119) (17,028,106) (2,326,182) 57,630,607 79,063,792
Net assets attributable to unitholders at the end of financial year 11,437,295 14,752,454 45,830,261 62,858,367 1,495,502,007 1,437,871,400
• Statements of Movements of Unitholders' Funds for the year ended 30 September 2017
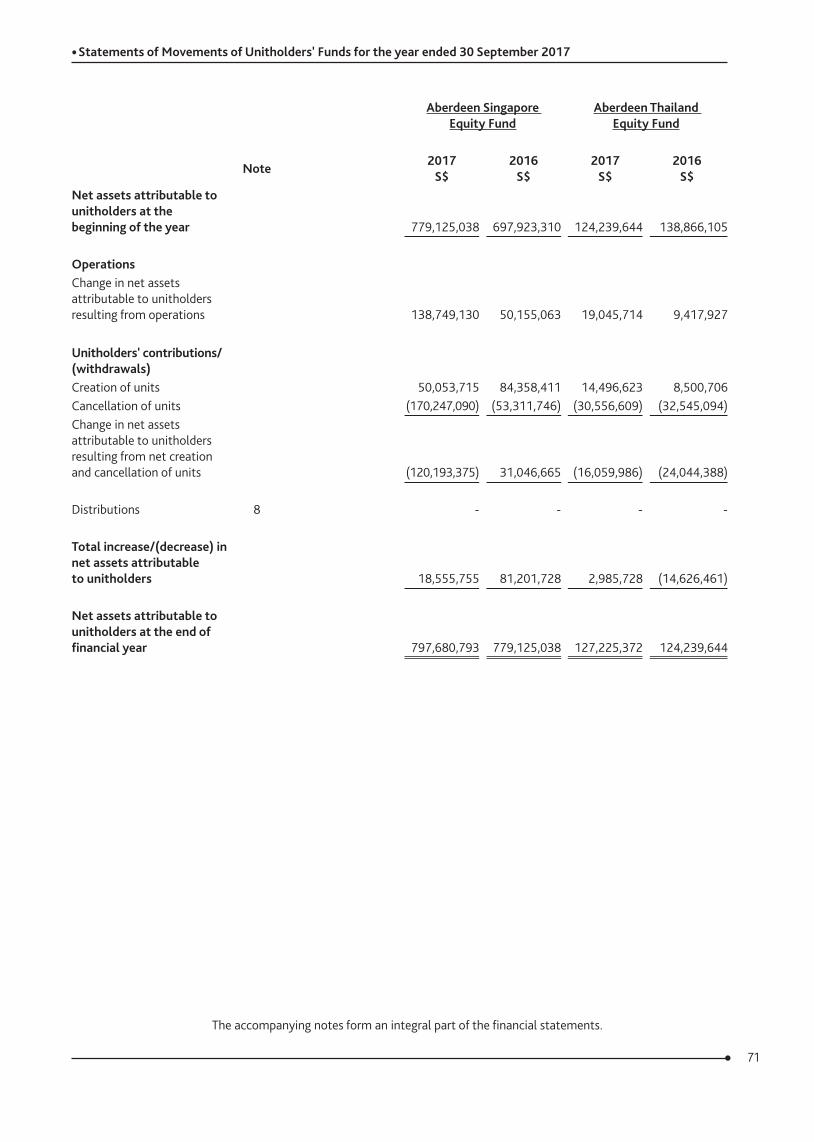
71
The accompanying notes form an integral part of the financial statements.
Aberdeen Singapore Equity Fund
Aberdeen Thailand Equity Fund
Note 2017 S$
2016 S$
2017 S$
2016 S$
Net assets attributable to unitholders at the beginning of the year 779,125,038 697,923,310 124,239,644 138,866,105
OperationsChange in net assets attributable to unitholders resulting from operations 138,749,130 50,155,063 19,045,714 9,417,927
Unitholders' contributions/ (withdrawals)Creation of units 50,053,715 84,358,411 14,496,623 8,500,706Cancellation of units (170,247,090) (53,311,746) (30,556,609) (32,545,094)Change in net assets attributable to unitholders resulting from net creation and cancellation of units
(120,193,375) 31,046,665 (16,059,986) (24,044,388)
Distributions 8 - - - -
Total increase/(decrease) in net assets attributable to unitholders 18,555,755 81,201,728 2,985,728 (14,626,461)
Net assets attributable to unitholders at the end of financial year 797,680,793 779,125,038 127,225,372 124,239,644
• Statements of Movements of Unitholders' Funds for the year ended 30 September 2017
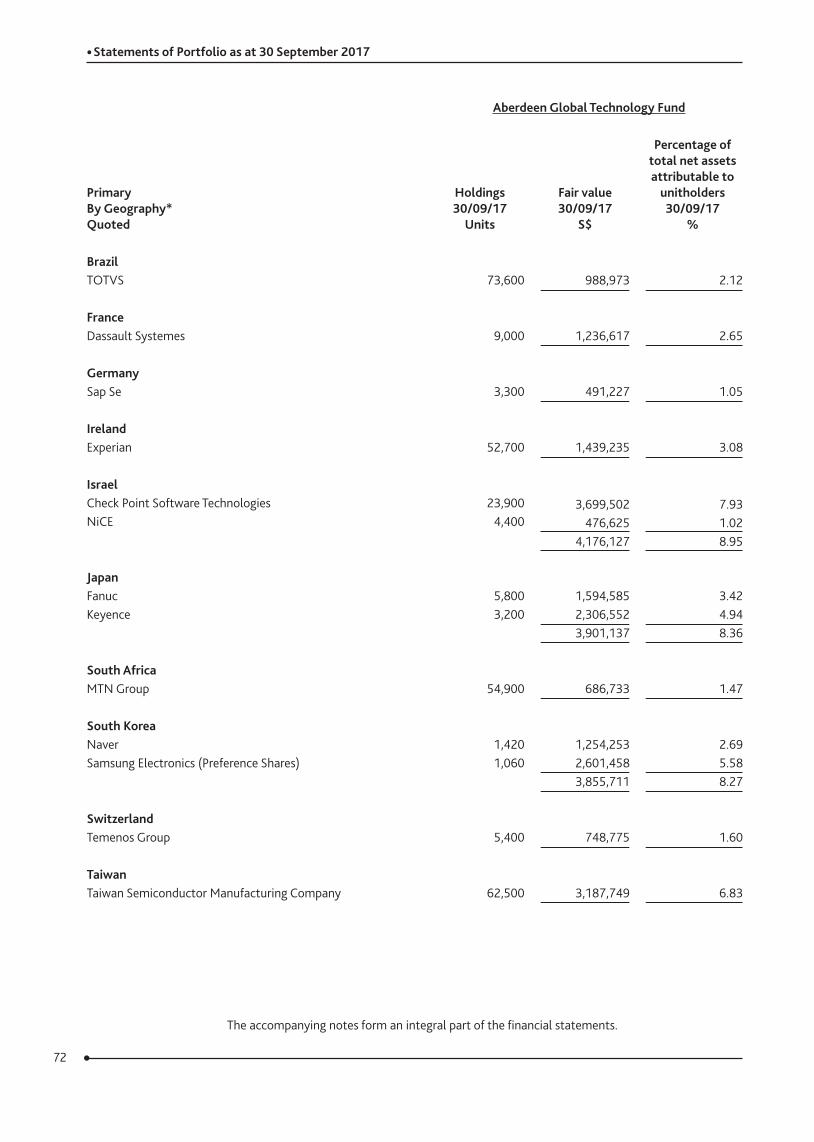
72
The accompanying notes form an integral part of the financial statements.
Aberdeen Global Technology Fund
Primary By Geography* Quoted
Holdings 30/09/17
Units
Fair value 30/09/17
S$
Percentage of total net assets attributable to
unitholders 30/09/17
%
BrazilTOTVS 73,600 988,973 2.12
FranceDassault Systemes 9,000 1,236,617 2.65
GermanySap Se 3,300 491,227 1.05
IrelandExperian 52,700 1,439,235 3.08
IsraelCheck Point Software Technologies 23,900 3,699,502 7.93NiCE 4,400 476,625 1.02
4,176,127 8.95
JapanFanuc 5,800 1,594,585 3.42Keyence 3,200 2,306,552 4.94
3,901,137 8.36
South AfricaMTN Group 54,900 686,733 1.47
South KoreaNaver 1,420 1,254,253 2.69Samsung Electronics (Preference Shares) 1,060 2,601,458 5.58
3,855,711 8.27
SwitzerlandTemenos Group 5,400 748,775 1.60
TaiwanTaiwan Semiconductor Manufacturing Company 62,500 3,187,749 6.83
• Statements of Portfolio as at 30 September 2017
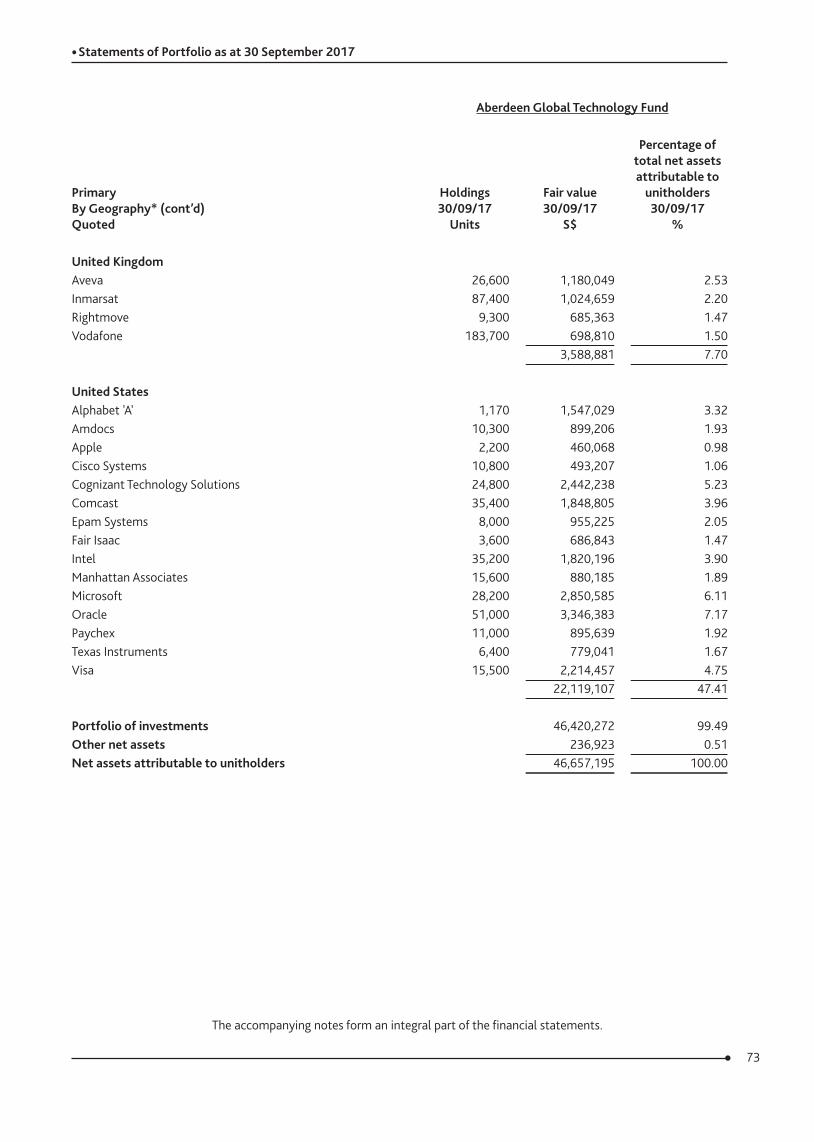
73
The accompanying notes form an integral part of the financial statements.
Aberdeen Global Technology Fund
Primary By Geography* (cont’d) Quoted
Holdings 30/09/17
Units
Fair value 30/09/17
S$
Percentage of total net assets attributable to
unitholders 30/09/17
%
United KingdomAveva 26,600 1,180,049 2.53Inmarsat 87,400 1,024,659 2.20Rightmove 9,300 685,363 1.47Vodafone 183,700 698,810 1.50
3,588,881 7.70
United StatesAlphabet 'A' 1,170 1,547,029 3.32Amdocs 10,300 899,206 1.93Apple 2,200 460,068 0.98Cisco Systems 10,800 493,207 1.06Cognizant Technology Solutions 24,800 2,442,238 5.23Comcast 35,400 1,848,805 3.96Epam Systems 8,000 955,225 2.05Fair Isaac 3,600 686,843 1.47Intel 35,200 1,820,196 3.90Manhattan Associates 15,600 880,185 1.89Microsoft 28,200 2,850,585 6.11Oracle 51,000 3,346,383 7.17Paychex 11,000 895,639 1.92Texas Instruments 6,400 779,041 1.67Visa 15,500 2,214,457 4.75
22,119,107 47.41
Portfolio of investments 46,420,272 99.49Other net assets 236,923 0.51Net assets attributable to unitholders 46,657,195 100.00
• Statements of Portfolio as at 30 September 2017
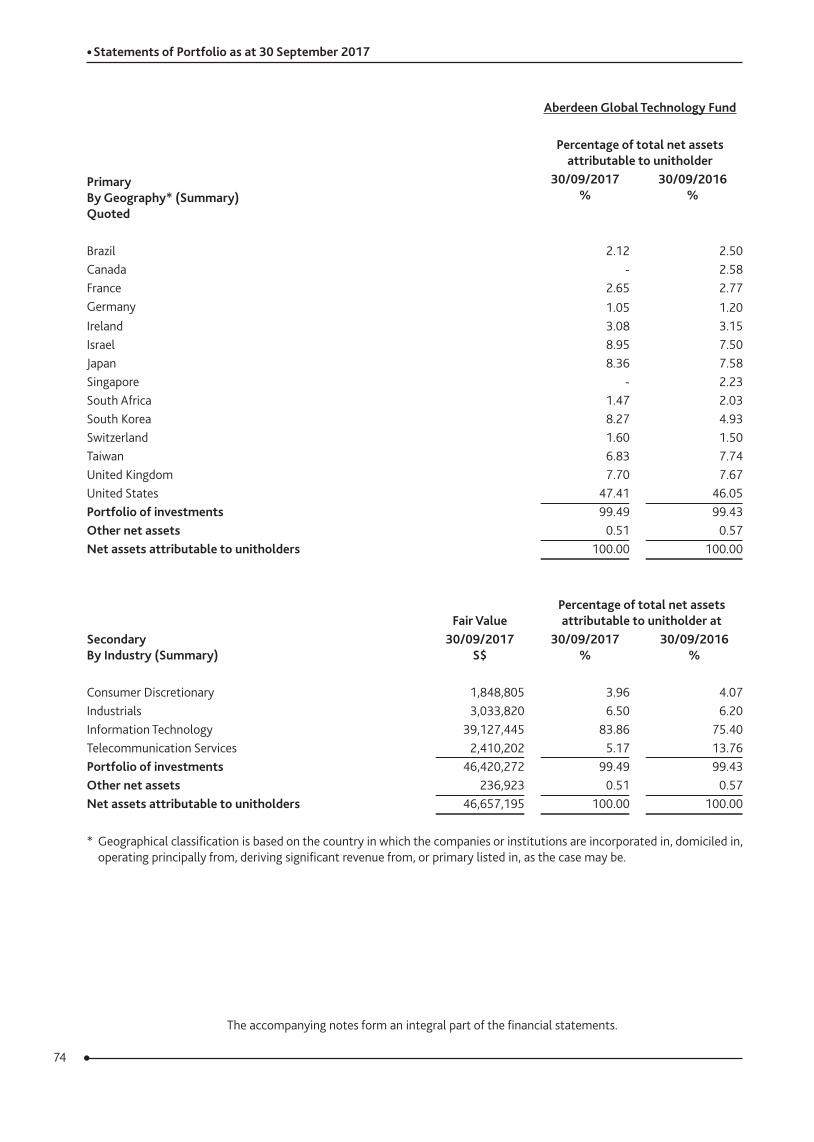
74
The accompanying notes form an integral part of the financial statements.
Aberdeen Global Technology Fund
Percentage of total net assets attributable to unitholder
Primary By Geography* (Summary) Quoted
30/09/2017 %
30/09/2016 %
Brazil 2.12 2.50Canada - 2.58France 2.65 2.77Germany 1.05 1.20Ireland 3.08 3.15Israel 8.95 7.50Japan 8.36 7.58Singapore - 2.23South Africa 1.47 2.03South Korea 8.27 4.93Switzerland 1.60 1.50Taiwan 6.83 7.74United Kingdom 7.70 7.67United States 47.41 46.05Portfolio of investments 99.49 99.43Other net assets 0.51 0.57Net assets attributable to unitholders 100.00 100.00
Secondary By Industry (Summary)
Fair ValuePercentage of total net assets attributable to unitholder at
30/09/2017 S$
30/09/2017 %
30/09/2016 %
Consumer Discretionary 1,848,805 3.96 4.07Industrials 3,033,820 6.50 6.20Information Technology 39,127,445 83.86 75.40Telecommunication Services 2,410,202 5.17 13.76Portfolio of investments 46,420,272 99.49 99.43Other net assets 236,923 0.51 0.57Net assets attributable to unitholders 46,657,195 100.00 100.00
* Geographical classification is based on the country in which the companies or institutions are incorporated in, domiciled in, operating principally from, deriving significant revenue from, or primary listed in, as the case may be.
• Statements of Portfolio as at 30 September 2017
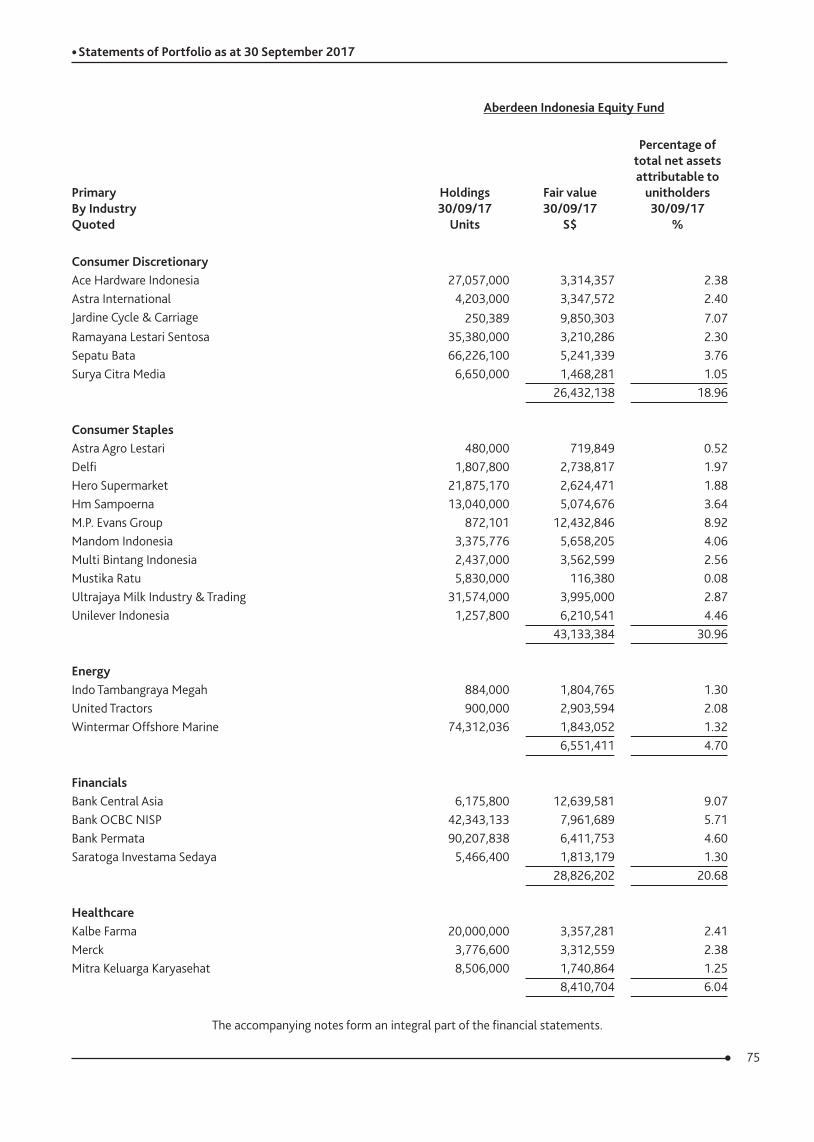
75
The accompanying notes form an integral part of the financial statements.
Aberdeen Indonesia Equity Fund
Primary By Industry Quoted
Holdings 30/09/17
Units
Fair value 30/09/17
S$
Percentage of total net assets attributable to
unitholders 30/09/17
%
Consumer DiscretionaryAce Hardware Indonesia 27,057,000 3,314,357 2.38Astra International 4,203,000 3,347,572 2.40Jardine Cycle & Carriage 250,389 9,850,303 7.07Ramayana Lestari Sentosa 35,380,000 3,210,286 2.30Sepatu Bata 66,226,100 5,241,339 3.76Surya Citra Media 6,650,000 1,468,281 1.05
26,432,138 18.96
Consumer StaplesAstra Agro Lestari 480,000 719,849 0.52Delfi 1,807,800 2,738,817 1.97Hero Supermarket 21,875,170 2,624,471 1.88Hm Sampoerna 13,040,000 5,074,676 3.64M.P. Evans Group 872,101 12,432,846 8.92Mandom Indonesia 3,375,776 5,658,205 4.06Multi Bintang Indonesia 2,437,000 3,562,599 2.56Mustika Ratu 5,830,000 116,380 0.08Ultrajaya Milk Industry & Trading 31,574,000 3,995,000 2.87Unilever Indonesia 1,257,800 6,210,541 4.46
43,133,384 30.96
EnergyIndo Tambangraya Megah 884,000 1,804,765 1.30United Tractors 900,000 2,903,594 2.08Wintermar Offshore Marine 74,312,036 1,843,052 1.32
6,551,411 4.70
FinancialsBank Central Asia 6,175,800 12,639,581 9.07Bank OCBC NISP 42,343,133 7,961,689 5.71Bank Permata 90,207,838 6,411,753 4.60Saratoga Investama Sedaya 5,466,400 1,813,179 1.30
28,826,202 20.68
HealthcareKalbe Farma 20,000,000 3,357,281 2.41Merck 3,776,600 3,312,559 2.38Mitra Keluarga Karyasehat 8,506,000 1,740,864 1.25
8,410,704 6.04
• Statements of Portfolio as at 30 September 2017
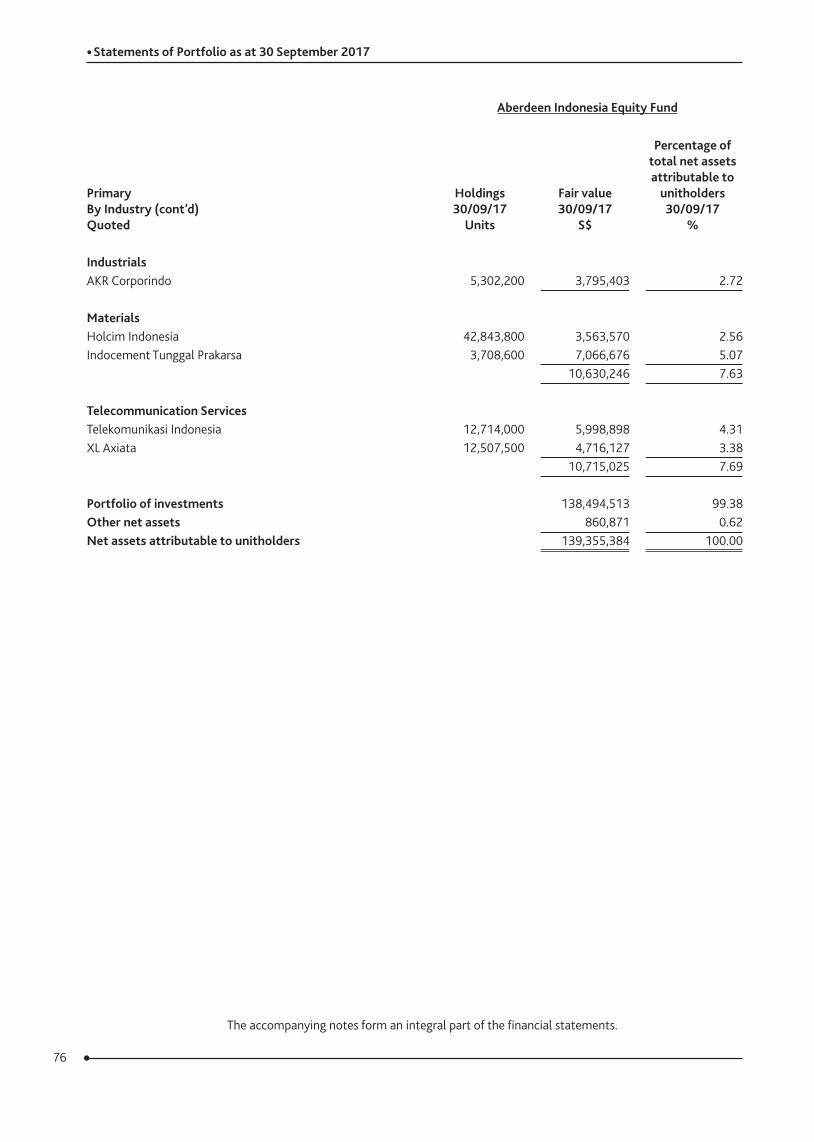
76
The accompanying notes form an integral part of the financial statements.
Aberdeen Indonesia Equity Fund
Primary By Industry (cont’d) Quoted
Holdings 30/09/17
Units
Fair value 30/09/17
S$
Percentage of total net assets attributable to
unitholders 30/09/17
%
IndustrialsAKR Corporindo 5,302,200 3,795,403 2.72
MaterialsHolcim Indonesia 42,843,800 3,563,570 2.56Indocement Tunggal Prakarsa 3,708,600 7,066,676 5.07
10,630,246 7.63
Telecommunication ServicesTelekomunikasi Indonesia 12,714,000 5,998,898 4.31XL Axiata 12,507,500 4,716,127 3.38
10,715,025 7.69
Portfolio of investments 138,494,513 99.38Other net assets 860,871 0.62Net assets attributable to unitholders 139,355,384 100.00
• Statements of Portfolio as at 30 September 2017
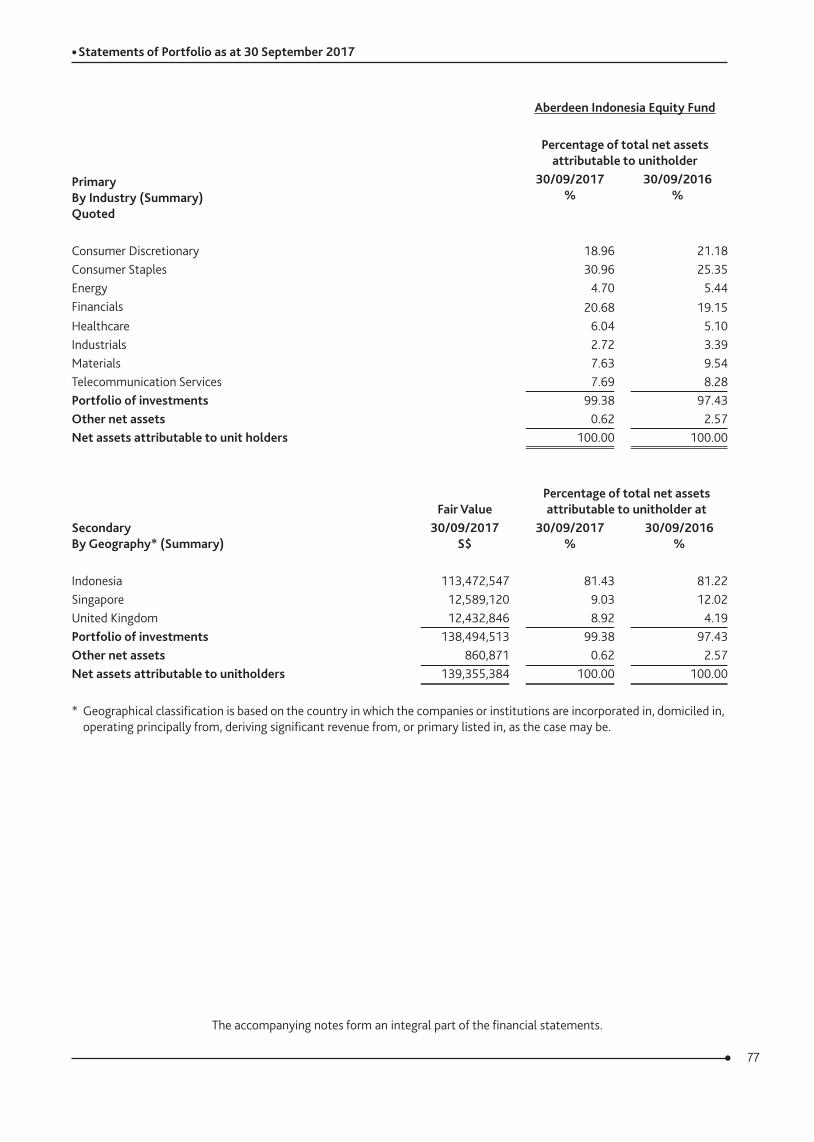
77
The accompanying notes form an integral part of the financial statements.
Aberdeen Indonesia Equity Fund
Percentage of total net assets attributable to unitholder
Primary By Industry (Summary) Quoted
30/09/2017 %
30/09/2016 %
Consumer Discretionary 18.96 21.18Consumer Staples 30.96 25.35Energy 4.70 5.44Financials 20.68 19.15Healthcare 6.04 5.10Industrials 2.72 3.39Materials 7.63 9.54Telecommunication Services 7.69 8.28Portfolio of investments 99.38 97.43Other net assets 0.62 2.57Net assets attributable to unit holders 100.00 100.00
Secondary By Geography* (Summary)
Fair ValuePercentage of total net assets attributable to unitholder at
30/09/2017 S$
30/09/2017 %
30/09/2016 %
Indonesia 113,472,547 81.43 81.22Singapore 12,589,120 9.03 12.02United Kingdom 12,432,846 8.92 4.19Portfolio of investments 138,494,513 99.38 97.43Other net assets 860,871 0.62 2.57Net assets attributable to unitholders 139,355,384 100.00 100.00
* Geographical classification is based on the country in which the companies or institutions are incorporated in, domiciled in, operating principally from, deriving significant revenue from, or primary listed in, as the case may be.
• Statements of Portfolio as at 30 September 2017
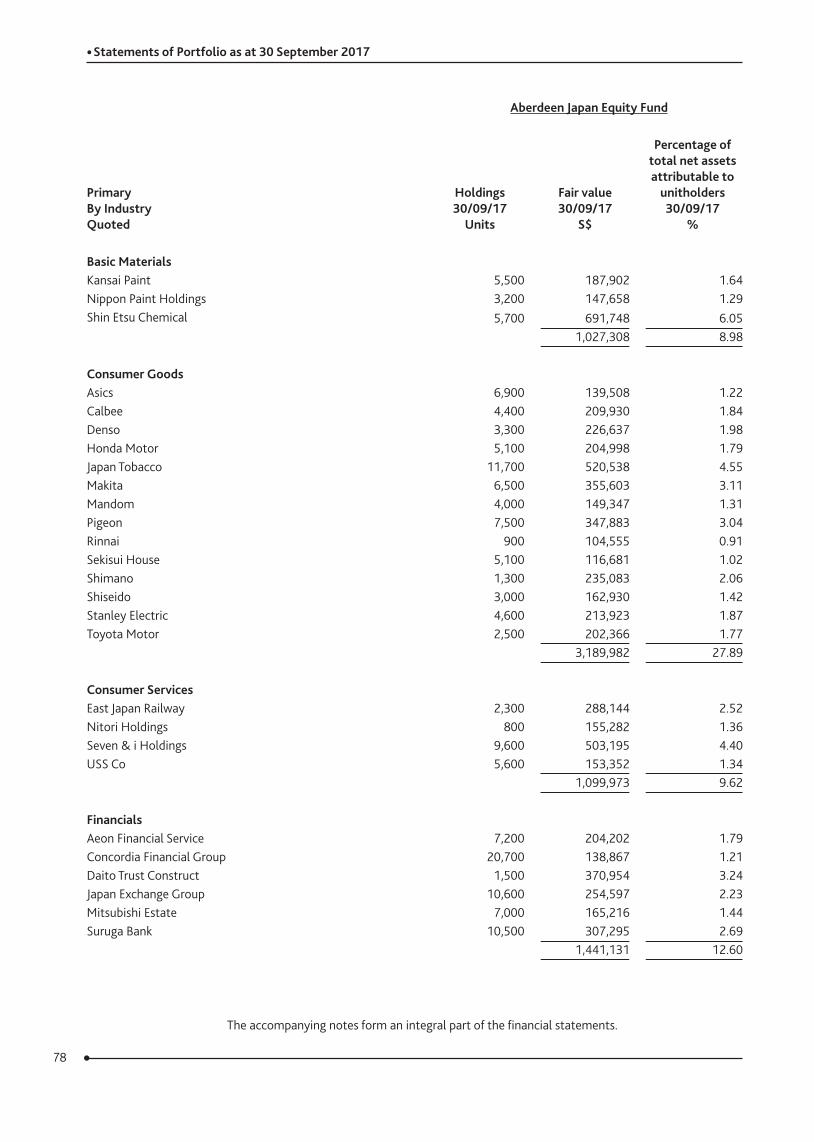
78
The accompanying notes form an integral part of the financial statements.
Aberdeen Japan Equity Fund
Primary By Industry Quoted
Holdings 30/09/17
Units
Fair value 30/09/17
S$
Percentage of total net assets attributable to
unitholders 30/09/17
%
Basic MaterialsKansai Paint 5,500 187,902 1.64Nippon Paint Holdings 3,200 147,658 1.29Shin Etsu Chemical 5,700 691,748 6.05
1,027,308 8.98
Consumer GoodsAsics 6,900 139,508 1.22Calbee 4,400 209,930 1.84Denso 3,300 226,637 1.98Honda Motor 5,100 204,998 1.79Japan Tobacco 11,700 520,538 4.55Makita 6,500 355,603 3.11Mandom 4,000 149,347 1.31Pigeon 7,500 347,883 3.04Rinnai 900 104,555 0.91Sekisui House 5,100 116,681 1.02Shimano 1,300 235,083 2.06Shiseido 3,000 162,930 1.42Stanley Electric 4,600 213,923 1.87Toyota Motor 2,500 202,366 1.77
3,189,982 27.89
Consumer ServicesEast Japan Railway 2,300 288,144 2.52Nitori Holdings 800 155,282 1.36Seven & i Holdings 9,600 503,195 4.40USS Co 5,600 153,352 1.34
1,099,973 9.62
FinancialsAeon Financial Service 7,200 204,202 1.79Concordia Financial Group 20,700 138,867 1.21Daito Trust Construct 1,500 370,954 3.24Japan Exchange Group 10,600 254,597 2.23Mitsubishi Estate 7,000 165,216 1.44Suruga Bank 10,500 307,295 2.69
1,441,131 12.60
• Statements of Portfolio as at 30 September 2017
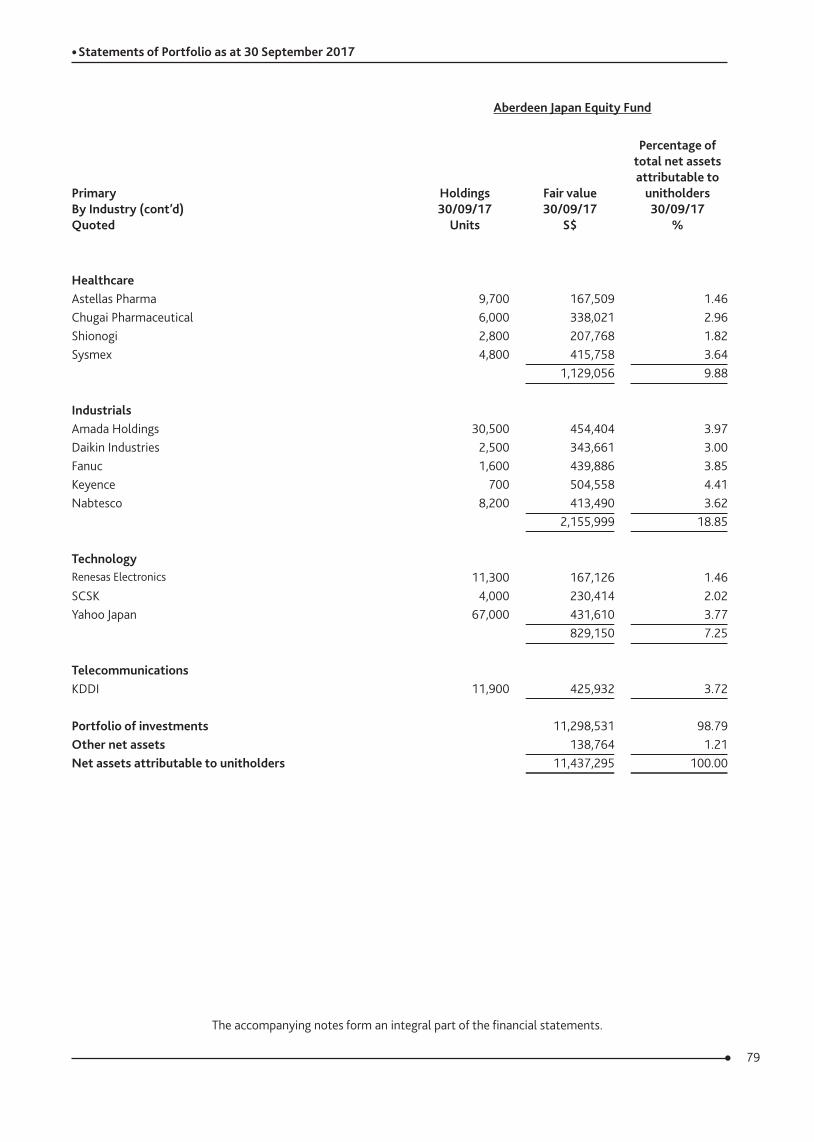
79
The accompanying notes form an integral part of the financial statements.
Aberdeen Japan Equity Fund
Primary By Industry (cont’d) Quoted
Holdings 30/09/17
Units
Fair value 30/09/17
S$
Percentage of total net assets attributable to
unitholders 30/09/17
%
HealthcareAstellas Pharma 9,700 167,509 1.46Chugai Pharmaceutical 6,000 338,021 2.96Shionogi 2,800 207,768 1.82Sysmex 4,800 415,758 3.64
1,129,056 9.88
IndustrialsAmada Holdings 30,500 454,404 3.97Daikin Industries 2,500 343,661 3.00Fanuc 1,600 439,886 3.85Keyence 700 504,558 4.41Nabtesco 8,200 413,490 3.62
2,155,999 18.85
TechnologyRenesas Electronics 11,300 167,126 1.46SCSK 4,000 230,414 2.02Yahoo Japan 67,000 431,610 3.77
829,150 7.25
TelecommunicationsKDDI 11,900 425,932 3.72
Portfolio of investments 11,298,531 98.79Other net assets 138,764 1.21Net assets attributable to unitholders 11,437,295 100.00
• Statements of Portfolio as at 30 September 2017
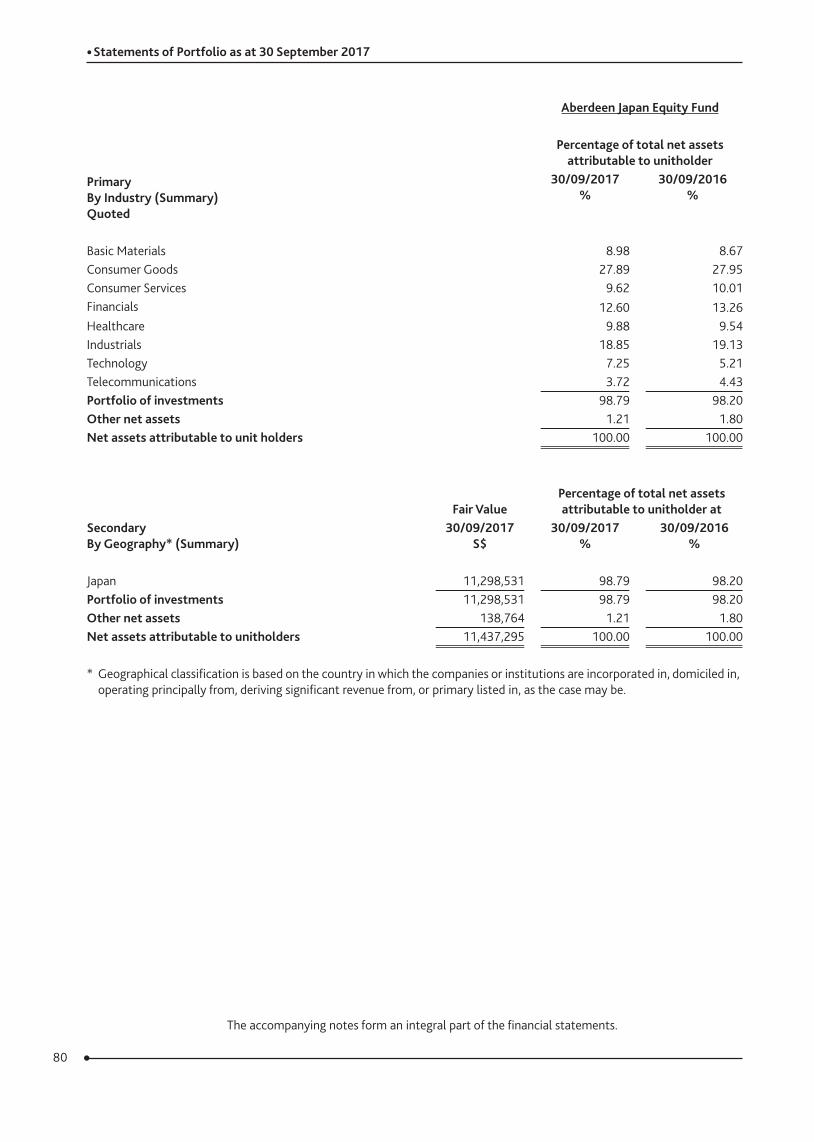
80
The accompanying notes form an integral part of the financial statements.
Aberdeen Japan Equity Fund
Percentage of total net assets attributable to unitholder
Primary By Industry (Summary) Quoted
30/09/2017 %
30/09/2016 %
Basic Materials 8.98 8.67Consumer Goods 27.89 27.95Consumer Services 9.62 10.01Financials 12.60 13.26Healthcare 9.88 9.54Industrials 18.85 19.13Technology 7.25 5.21Telecommunications 3.72 4.43Portfolio of investments 98.79 98.20Other net assets 1.21 1.80Net assets attributable to unit holders 100.00 100.00
Secondary By Geography* (Summary)
Fair ValuePercentage of total net assets attributable to unitholder at
30/09/2017 S$
30/09/2017 %
30/09/2016 %
Japan 11,298,531 98.79 98.20Portfolio of investments 11,298,531 98.79 98.20Other net assets 138,764 1.21 1.80Net assets attributable to unitholders 11,437,295 100.00 100.00
* Geographical classification is based on the country in which the companies or institutions are incorporated in, domiciled in, operating principally from, deriving significant revenue from, or primary listed in, as the case may be.
• Statements of Portfolio as at 30 September 2017
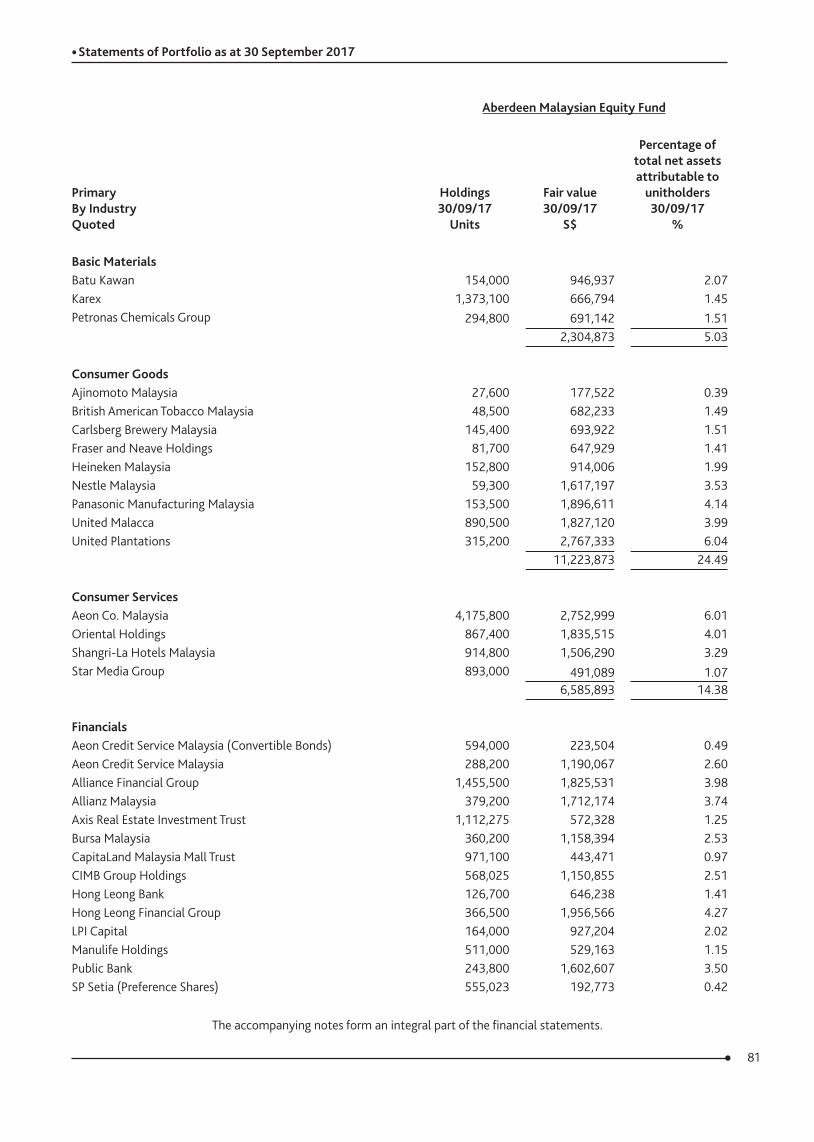
81
The accompanying notes form an integral part of the financial statements.
Aberdeen Malaysian Equity Fund
Primary By Industry Quoted
Holdings 30/09/17
Units
Fair value 30/09/17
S$
Percentage of total net assets attributable to
unitholders 30/09/17
%
Basic MaterialsBatu Kawan 154,000 946,937 2.07Karex 1,373,100 666,794 1.45Petronas Chemicals Group 294,800 691,142 1.51
2,304,873 5.03
Consumer GoodsAjinomoto Malaysia 27,600 177,522 0.39British American Tobacco Malaysia 48,500 682,233 1.49Carlsberg Brewery Malaysia 145,400 693,922 1.51Fraser and Neave Holdings 81,700 647,929 1.41Heineken Malaysia 152,800 914,006 1.99Nestle Malaysia 59,300 1,617,197 3.53Panasonic Manufacturing Malaysia 153,500 1,896,611 4.14United Malacca 890,500 1,827,120 3.99United Plantations 315,200 2,767,333 6.04
11,223,873 24.49
Consumer ServicesAeon Co. Malaysia 4,175,800 2,752,999 6.01Oriental Holdings 867,400 1,835,515 4.01Shangri-La Hotels Malaysia 914,800 1,506,290 3.29Star Media Group 893,000 491,089 1.07
6,585,893 14.38
FinancialsAeon Credit Service Malaysia (Convertible Bonds) 594,000 223,504 0.49Aeon Credit Service Malaysia 288,200 1,190,067 2.60Alliance Financial Group 1,455,500 1,825,531 3.98Allianz Malaysia 379,200 1,712,174 3.74Axis Real Estate Investment Trust 1,112,275 572,328 1.25Bursa Malaysia 360,200 1,158,394 2.53CapitaLand Malaysia Mall Trust 971,100 443,471 0.97CIMB Group Holdings 568,025 1,150,855 2.51Hong Leong Bank 126,700 646,238 1.41Hong Leong Financial Group 366,500 1,956,566 4.27LPI Capital 164,000 927,204 2.02Manulife Holdings 511,000 529,163 1.15Public Bank 243,800 1,602,607 3.50SP Setia (Preference Shares) 555,023 192,773 0.42
• Statements of Portfolio as at 30 September 2017
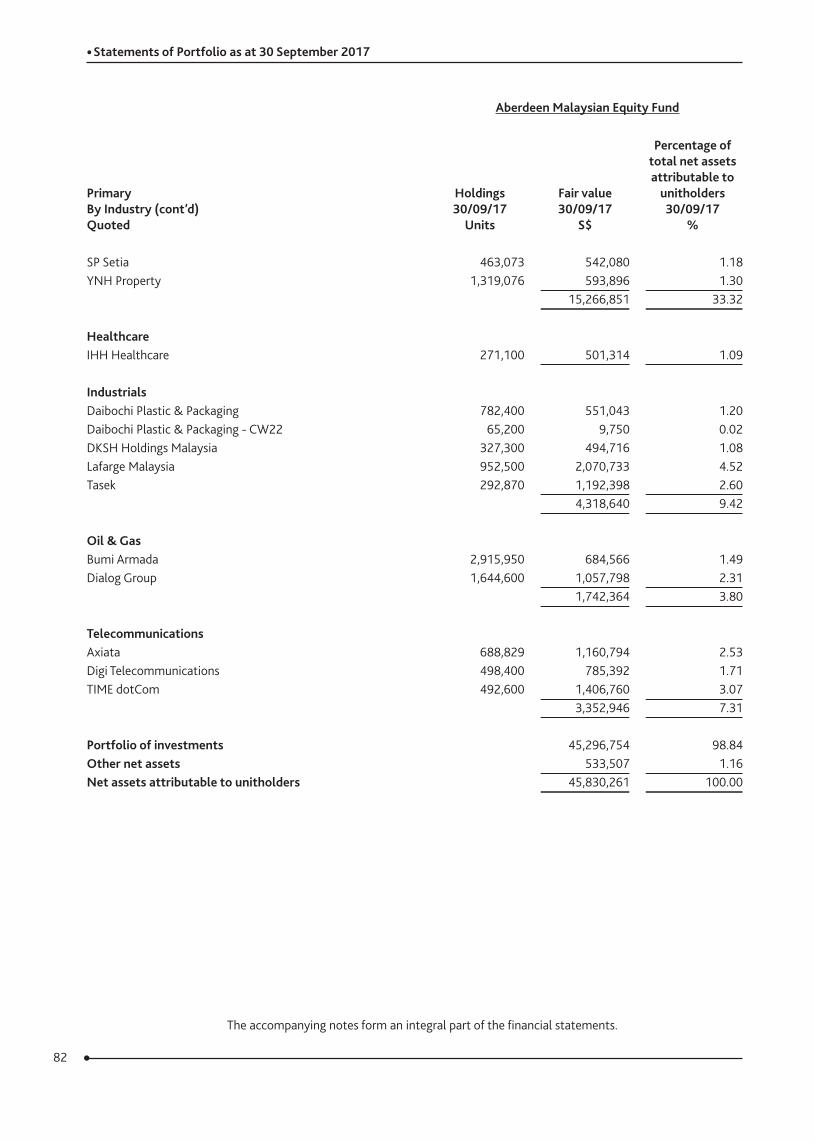
82
The accompanying notes form an integral part of the financial statements.
Aberdeen Malaysian Equity Fund
Primary By Industry (cont’d) Quoted
Holdings 30/09/17
Units
Fair value 30/09/17
S$
Percentage of total net assets attributable to
unitholders 30/09/17
%
SP Setia 463,073 542,080 1.18YNH Property 1,319,076 593,896 1.30
15,266,851 33.32
HealthcareIHH Healthcare 271,100 501,314 1.09
IndustrialsDaibochi Plastic & Packaging 782,400 551,043 1.20Daibochi Plastic & Packaging - CW22 65,200 9,750 0.02DKSH Holdings Malaysia 327,300 494,716 1.08Lafarge Malaysia 952,500 2,070,733 4.52Tasek 292,870 1,192,398 2.60
4,318,640 9.42 Oil & GasBumi Armada 2,915,950 684,566 1.49Dialog Group 1,644,600 1,057,798 2.31
1,742,364 3.80
TelecommunicationsAxiata 688,829 1,160,794 2.53Digi Telecommunications 498,400 785,392 1.71TIME dotCom 492,600 1,406,760 3.07
3,352,946 7.31
Portfolio of investments 45,296,754 98.84Other net assets 533,507 1.16Net assets attributable to unitholders 45,830,261 100.00
• Statements of Portfolio as at 30 September 2017
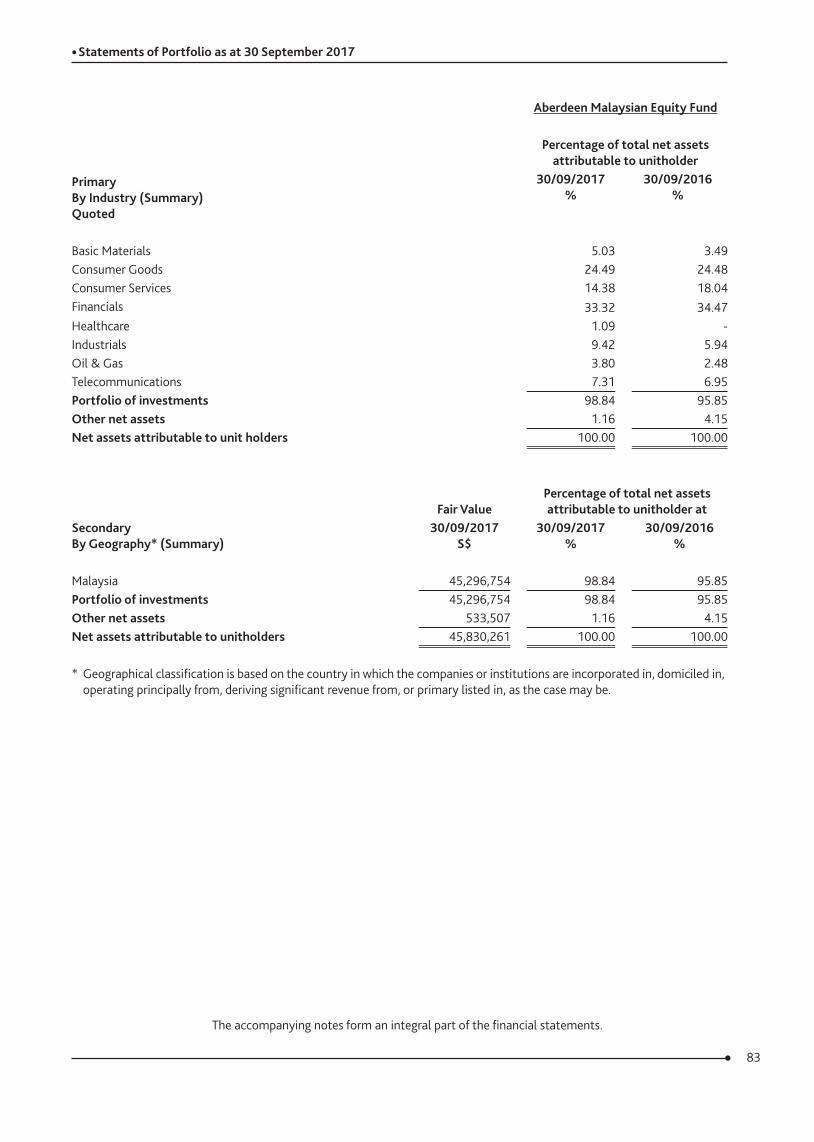
83
The accompanying notes form an integral part of the financial statements.
Aberdeen Malaysian Equity Fund
Percentage of total net assets attributable to unitholder
Primary By Industry (Summary) Quoted
30/09/2017 %
30/09/2016 %
Basic Materials 5.03 3.49Consumer Goods 24.49 24.48Consumer Services 14.38 18.04Financials 33.32 34.47Healthcare 1.09 -Industrials 9.42 5.94Oil & Gas 3.80 2.48Telecommunications 7.31 6.95Portfolio of investments 98.84 95.85Other net assets 1.16 4.15Net assets attributable to unit holders 100.00 100.00
Secondary By Geography* (Summary)
Fair ValuePercentage of total net assets attributable to unitholder at
30/09/2017 S$
30/09/2017 %
30/09/2016 %
Malaysia 45,296,754 98.84 95.85Portfolio of investments 45,296,754 98.84 95.85Other net assets 533,507 1.16 4.15Net assets attributable to unitholders 45,830,261 100.00 100.00
* Geographical classification is based on the country in which the companies or institutions are incorporated in, domiciled in, operating principally from, deriving significant revenue from, or primary listed in, as the case may be.
• Statements of Portfolio as at 30 September 2017
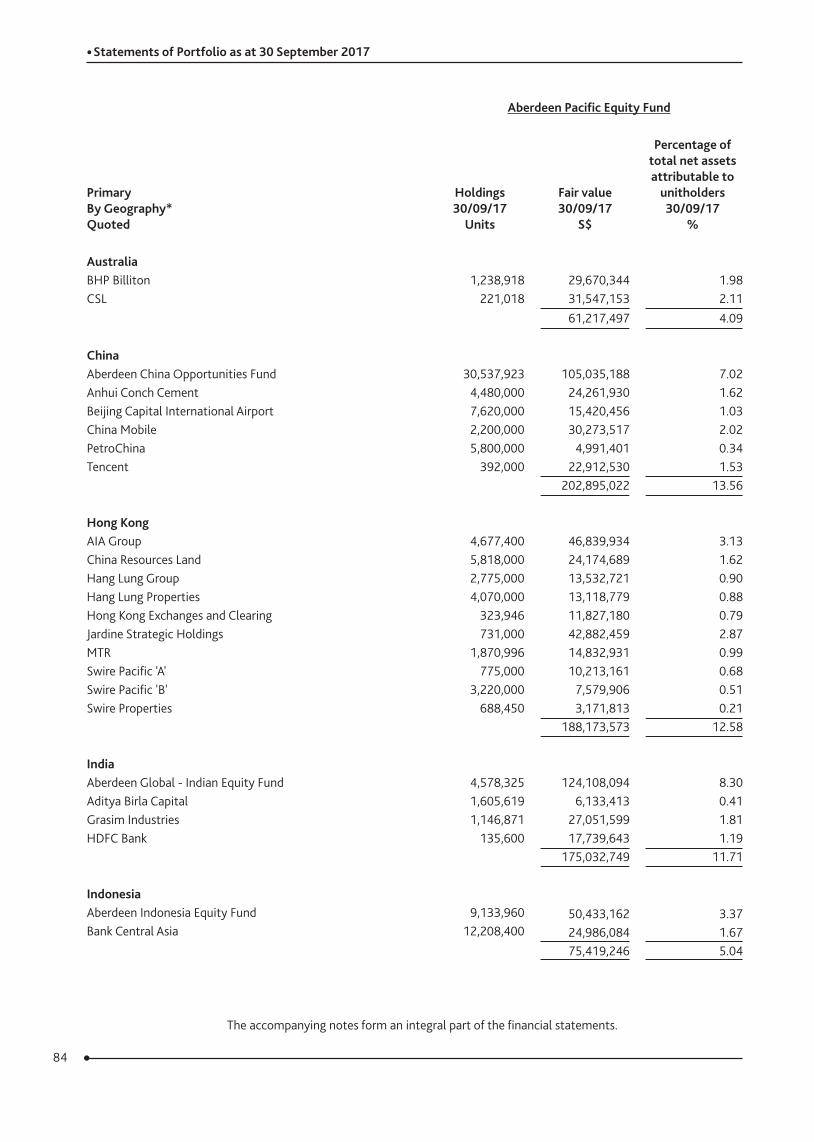
84
The accompanying notes form an integral part of the financial statements.
Aberdeen Pacific Equity Fund
Primary By Geography* Quoted
Holdings 30/09/17
Units
Fair value 30/09/17
S$
Percentage of total net assets attributable to
unitholders 30/09/17
%
AustraliaBHP Billiton 1,238,918 29,670,344 1.98CSL 221,018 31,547,153 2.11
61,217,497 4.09
ChinaAberdeen China Opportunities Fund 30,537,923 105,035,188 7.02Anhui Conch Cement 4,480,000 24,261,930 1.62Beijing Capital International Airport 7,620,000 15,420,456 1.03China Mobile 2,200,000 30,273,517 2.02PetroChina 5,800,000 4,991,401 0.34Tencent 392,000 22,912,530 1.53
202,895,022 13.56
Hong KongAIA Group 4,677,400 46,839,934 3.13China Resources Land 5,818,000 24,174,689 1.62Hang Lung Group 2,775,000 13,532,721 0.90Hang Lung Properties 4,070,000 13,118,779 0.88Hong Kong Exchanges and Clearing 323,946 11,827,180 0.79Jardine Strategic Holdings 731,000 42,882,459 2.87MTR 1,870,996 14,832,931 0.99Swire Pacific 'A' 775,000 10,213,161 0.68Swire Pacific 'B' 3,220,000 7,579,906 0.51Swire Properties 688,450 3,171,813 0.21
188,173,573 12.58
IndiaAberdeen Global - Indian Equity Fund 4,578,325 124,108,094 8.30Aditya Birla Capital 1,605,619 6,133,413 0.41Grasim Industries 1,146,871 27,051,599 1.81HDFC Bank 135,600 17,739,643 1.19
175,032,749 11.71
IndonesiaAberdeen Indonesia Equity Fund 9,133,960 50,433,162 3.37Bank Central Asia 12,208,400 24,986,084 1.67
75,419,246 5.04
• Statements of Portfolio as at 30 September 2017
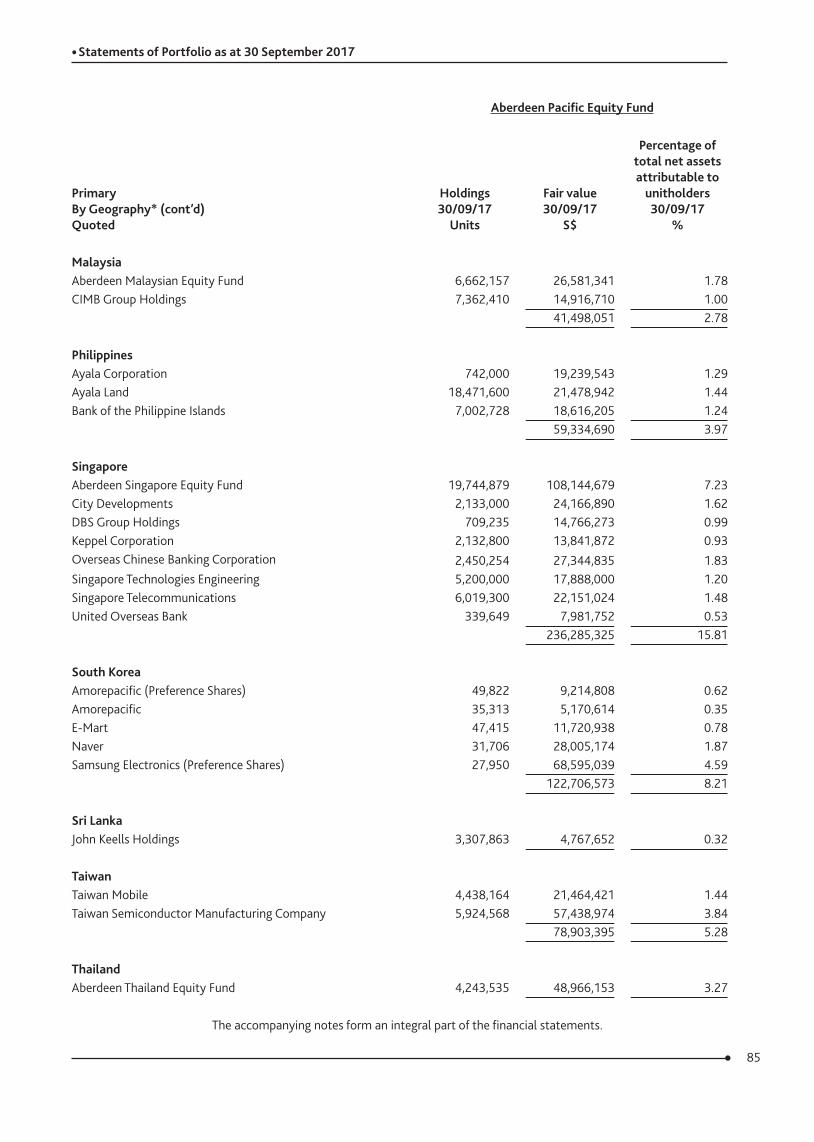
85
The accompanying notes form an integral part of the financial statements.
Aberdeen Pacific Equity Fund
Primary By Geography* (cont’d) Quoted
Holdings 30/09/17
Units
Fair value 30/09/17
S$
Percentage of total net assets attributable to
unitholders 30/09/17
%
MalaysiaAberdeen Malaysian Equity Fund 6,662,157 26,581,341 1.78CIMB Group Holdings 7,362,410 14,916,710 1.00
41,498,051 2.78
PhilippinesAyala Corporation 742,000 19,239,543 1.29Ayala Land 18,471,600 21,478,942 1.44Bank of the Philippine Islands 7,002,728 18,616,205 1.24
59,334,690 3.97
SingaporeAberdeen Singapore Equity Fund 19,744,879 108,144,679 7.23City Developments 2,133,000 24,166,890 1.62DBS Group Holdings 709,235 14,766,273 0.99Keppel Corporation 2,132,800 13,841,872 0.93Overseas Chinese Banking Corporation 2,450,254 27,344,835 1.83Singapore Technologies Engineering 5,200,000 17,888,000 1.20Singapore Telecommunications 6,019,300 22,151,024 1.48United Overseas Bank 339,649 7,981,752 0.53
236,285,325 15.81
South KoreaAmorepacific (Preference Shares) 49,822 9,214,808 0.62Amorepacific 35,313 5,170,614 0.35E-Mart 47,415 11,720,938 0.78Naver 31,706 28,005,174 1.87Samsung Electronics (Preference Shares) 27,950 68,595,039 4.59
122,706,573 8.21
Sri LankaJohn Keells Holdings 3,307,863 4,767,652 0.32
TaiwanTaiwan Mobile 4,438,164 21,464,421 1.44Taiwan Semiconductor Manufacturing Company 5,924,568 57,438,974 3.84
78,903,395 5.28
ThailandAberdeen Thailand Equity Fund 4,243,535 48,966,153 3.27
• Statements of Portfolio as at 30 September 2017
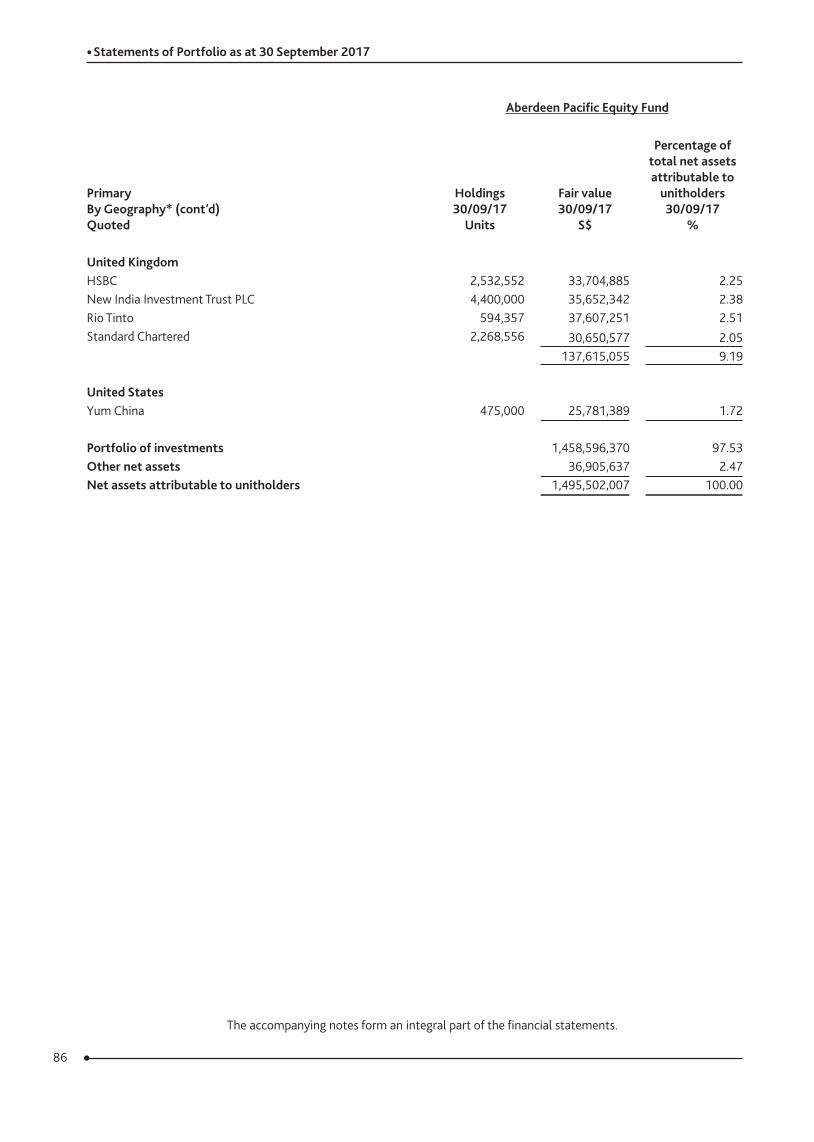
86
The accompanying notes form an integral part of the financial statements.
Aberdeen Pacific Equity Fund
Primary By Geography* (cont’d) Quoted
Holdings 30/09/17
Units
Fair value 30/09/17
S$
Percentage of total net assets attributable to
unitholders 30/09/17
%
United KingdomHSBC 2,532,552 33,704,885 2.25New India Investment Trust PLC 4,400,000 35,652,342 2.38Rio Tinto 594,357 37,607,251 2.51Standard Chartered 2,268,556 30,650,577 2.05
137,615,055 9.19
United StatesYum China 475,000 25,781,389 1.72
Portfolio of investments 1,458,596,370 97.53Other net assets 36,905,637 2.47Net assets attributable to unitholders 1,495,502,007 100.00
• Statements of Portfolio as at 30 September 2017
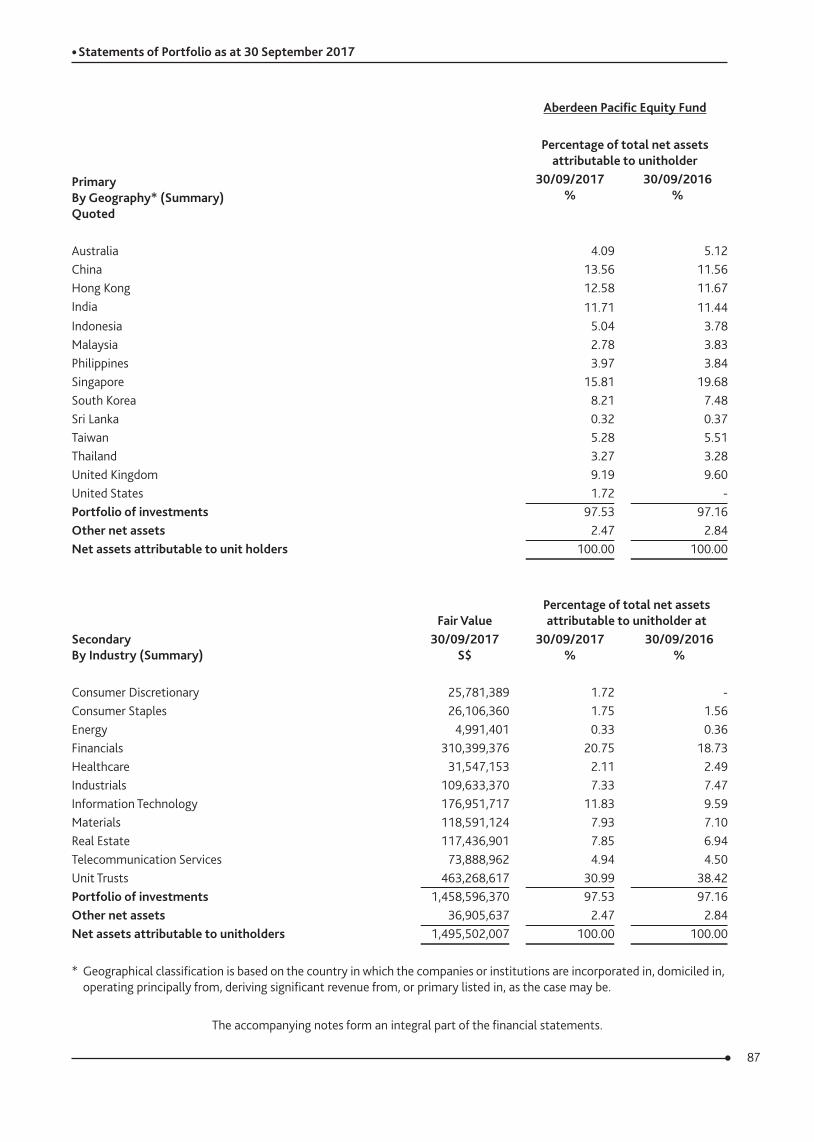
87
The accompanying notes form an integral part of the financial statements.
Aberdeen Pacific Equity Fund
Percentage of total net assets attributable to unitholder
Primary By Geography* (Summary) Quoted
30/09/2017 %
30/09/2016 %
Australia 4.09 5.12China 13.56 11.56Hong Kong 12.58 11.67India 11.71 11.44Indonesia 5.04 3.78Malaysia 2.78 3.83Philippines 3.97 3.84Singapore 15.81 19.68South Korea 8.21 7.48Sri Lanka 0.32 0.37Taiwan 5.28 5.51Thailand 3.27 3.28United Kingdom 9.19 9.60United States 1.72 -Portfolio of investments 97.53 97.16Other net assets 2.47 2.84Net assets attributable to unit holders 100.00 100.00
Secondary By Industry (Summary)
Fair ValuePercentage of total net assets attributable to unitholder at
30/09/2017 S$
30/09/2017 %
30/09/2016 %
Consumer Discretionary 25,781,389 1.72 -Consumer Staples 26,106,360 1.75 1.56Energy 4,991,401 0.33 0.36Financials 310,399,376 20.75 18.73Healthcare 31,547,153 2.11 2.49Industrials 109,633,370 7.33 7.47Information Technology 176,951,717 11.83 9.59Materials 118,591,124 7.93 7.10Real Estate 117,436,901 7.85 6.94Telecommunication Services 73,888,962 4.94 4.50Unit Trusts 463,268,617 30.99 38.42Portfolio of investments 1,458,596,370 97.53 97.16Other net assets 36,905,637 2.47 2.84Net assets attributable to unitholders 1,495,502,007 100.00 100.00
* Geographical classification is based on the country in which the companies or institutions are incorporated in, domiciled in, operating principally from, deriving significant revenue from, or primary listed in, as the case may be.
• Statements of Portfolio as at 30 September 2017
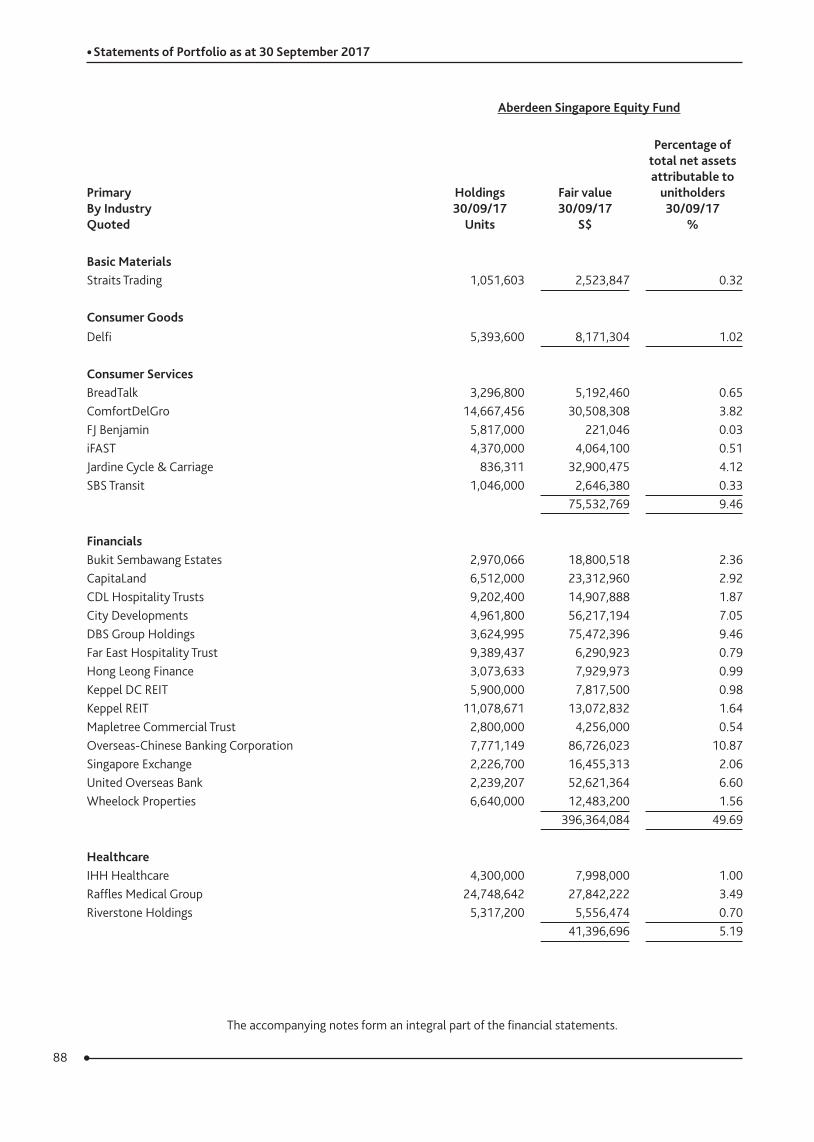
88
The accompanying notes form an integral part of the financial statements.
Aberdeen Singapore Equity Fund
Primary By Industry Quoted
Holdings 30/09/17
Units
Fair value 30/09/17
S$
Percentage of total net assets attributable to
unitholders 30/09/17
%
Basic MaterialsStraits Trading 1,051,603 2,523,847 0.32
Consumer GoodsDelfi 5,393,600 8,171,304 1.02
Consumer ServicesBreadTalk 3,296,800 5,192,460 0.65ComfortDelGro 14,667,456 30,508,308 3.82FJ Benjamin 5,817,000 221,046 0.03iFAST 4,370,000 4,064,100 0.51Jardine Cycle & Carriage 836,311 32,900,475 4.12SBS Transit 1,046,000 2,646,380 0.33
75,532,769 9.46
FinancialsBukit Sembawang Estates 2,970,066 18,800,518 2.36CapitaLand 6,512,000 23,312,960 2.92CDL Hospitality Trusts 9,202,400 14,907,888 1.87City Developments 4,961,800 56,217,194 7.05DBS Group Holdings 3,624,995 75,472,396 9.46Far East Hospitality Trust 9,389,437 6,290,923 0.79Hong Leong Finance 3,073,633 7,929,973 0.99Keppel DC REIT 5,900,000 7,817,500 0.98Keppel REIT 11,078,671 13,072,832 1.64Mapletree Commercial Trust 2,800,000 4,256,000 0.54Overseas-Chinese Banking Corporation 7,771,149 86,726,023 10.87Singapore Exchange 2,226,700 16,455,313 2.06United Overseas Bank 2,239,207 52,621,364 6.60Wheelock Properties 6,640,000 12,483,200 1.56
396,364,084 49.69
HealthcareIHH Healthcare 4,300,000 7,998,000 1.00Raffles Medical Group 24,748,642 27,842,222 3.49Riverstone Holdings 5,317,200 5,556,474 0.70
41,396,696 5.19
• Statements of Portfolio as at 30 September 2017
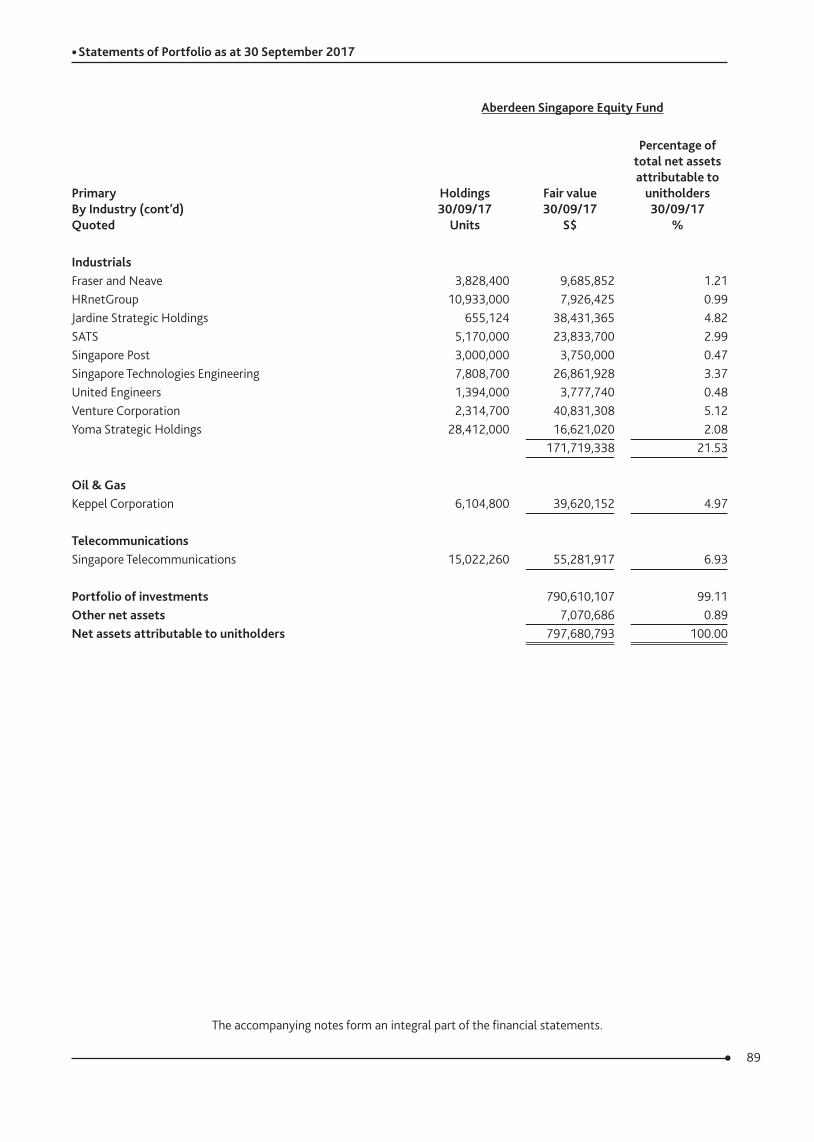
89
The accompanying notes form an integral part of the financial statements.
Aberdeen Singapore Equity Fund
Primary By Industry (cont’d) Quoted
Holdings 30/09/17
Units
Fair value 30/09/17
S$
Percentage of total net assets attributable to
unitholders 30/09/17
%
IndustrialsFraser and Neave 3,828,400 9,685,852 1.21HRnetGroup 10,933,000 7,926,425 0.99Jardine Strategic Holdings 655,124 38,431,365 4.82SATS 5,170,000 23,833,700 2.99Singapore Post 3,000,000 3,750,000 0.47Singapore Technologies Engineering 7,808,700 26,861,928 3.37United Engineers 1,394,000 3,777,740 0.48Venture Corporation 2,314,700 40,831,308 5.12Yoma Strategic Holdings 28,412,000 16,621,020 2.08
171,719,338 21.53
Oil & GasKeppel Corporation 6,104,800 39,620,152 4.97
TelecommunicationsSingapore Telecommunications 15,022,260 55,281,917 6.93
Portfolio of investments 790,610,107 99.11Other net assets 7,070,686 0.89Net assets attributable to unitholders 797,680,793 100.00
• Statements of Portfolio as at 30 September 2017
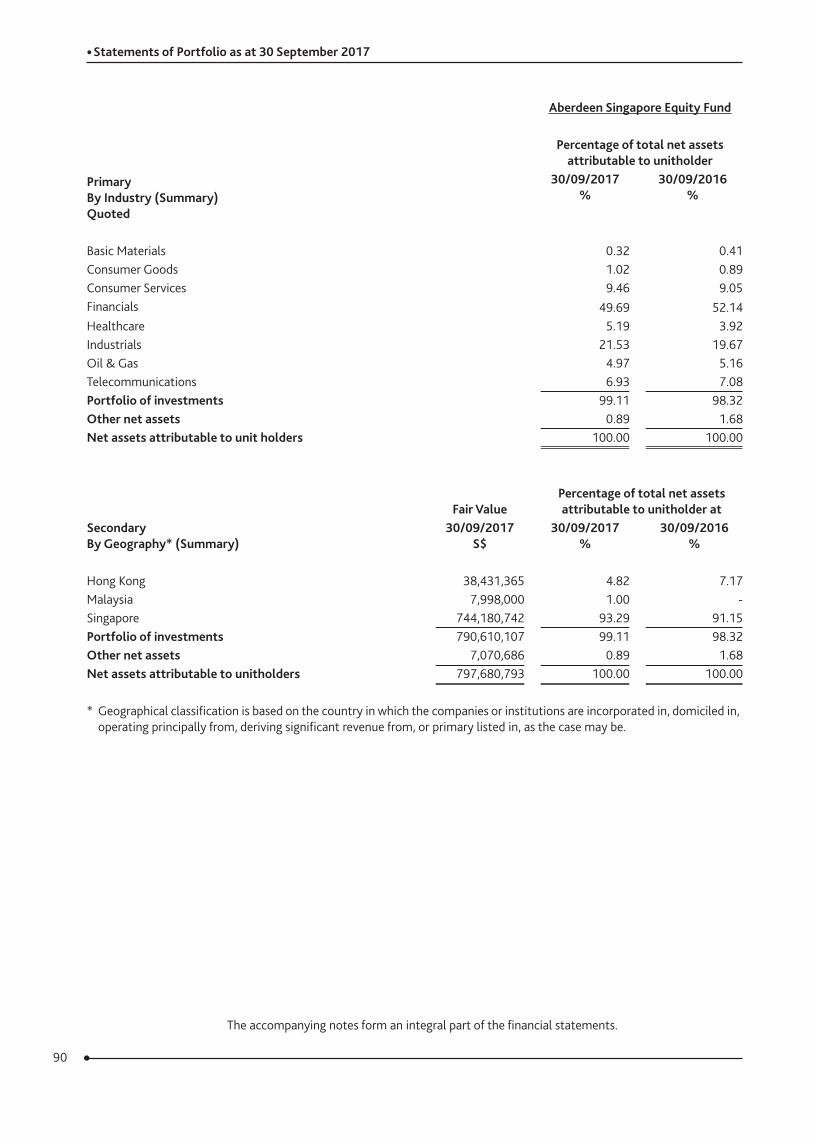
90
The accompanying notes form an integral part of the financial statements.
Aberdeen Singapore Equity Fund
Percentage of total net assets attributable to unitholder
Primary By Industry (Summary) Quoted
30/09/2017 %
30/09/2016 %
Basic Materials 0.32 0.41Consumer Goods 1.02 0.89Consumer Services 9.46 9.05Financials 49.69 52.14Healthcare 5.19 3.92Industrials 21.53 19.67Oil & Gas 4.97 5.16Telecommunications 6.93 7.08Portfolio of investments 99.11 98.32Other net assets 0.89 1.68Net assets attributable to unit holders 100.00 100.00
Secondary By Geography* (Summary)
Fair ValuePercentage of total net assets attributable to unitholder at
30/09/2017 S$
30/09/2017 %
30/09/2016 %
Hong Kong 38,431,365 4.82 7.17Malaysia 7,998,000 1.00 -Singapore 744,180,742 93.29 91.15Portfolio of investments 790,610,107 99.11 98.32Other net assets 7,070,686 0.89 1.68Net assets attributable to unitholders 797,680,793 100.00 100.00
* Geographical classification is based on the country in which the companies or institutions are incorporated in, domiciled in, operating principally from, deriving significant revenue from, or primary listed in, as the case may be.
• Statements of Portfolio as at 30 September 2017
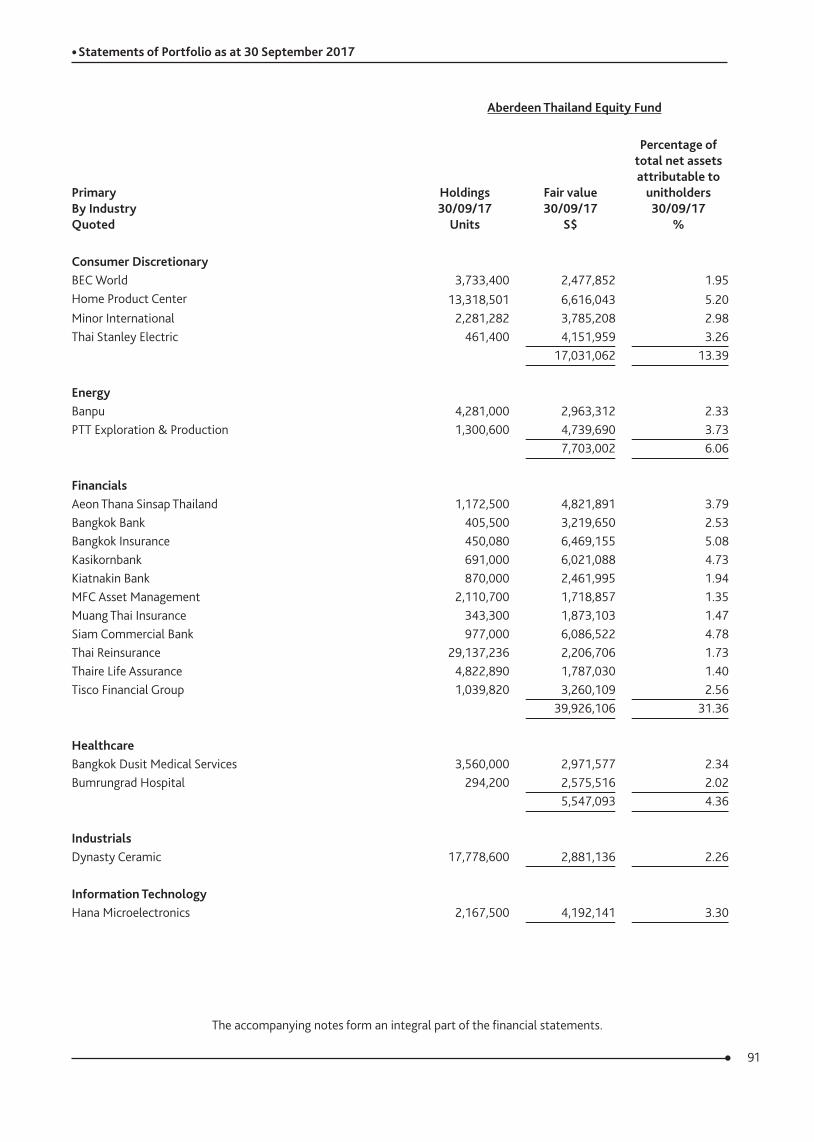
91
The accompanying notes form an integral part of the financial statements.
Aberdeen Thailand Equity Fund
Primary By Industry Quoted
Holdings 30/09/17
Units
Fair value 30/09/17
S$
Percentage of total net assets attributable to
unitholders 30/09/17
%
Consumer DiscretionaryBEC World 3,733,400 2,477,852 1.95Home Product Center 13,318,501 6,616,043 5.20Minor International 2,281,282 3,785,208 2.98Thai Stanley Electric 461,400 4,151,959 3.26
17,031,062 13.39
EnergyBanpu 4,281,000 2,963,312 2.33PTT Exploration & Production 1,300,600 4,739,690 3.73
7,703,002 6.06
FinancialsAeon Thana Sinsap Thailand 1,172,500 4,821,891 3.79Bangkok Bank 405,500 3,219,650 2.53Bangkok Insurance 450,080 6,469,155 5.08Kasikornbank 691,000 6,021,088 4.73Kiatnakin Bank 870,000 2,461,995 1.94MFC Asset Management 2,110,700 1,718,857 1.35Muang Thai Insurance 343,300 1,873,103 1.47Siam Commercial Bank 977,000 6,086,522 4.78Thai Reinsurance 29,137,236 2,206,706 1.73Thaire Life Assurance 4,822,890 1,787,030 1.40Tisco Financial Group 1,039,820 3,260,109 2.56
39,926,106 31.36
HealthcareBangkok Dusit Medical Services 3,560,000 2,971,577 2.34Bumrungrad Hospital 294,200 2,575,516 2.02
5,547,093 4.36
IndustrialsDynasty Ceramic 17,778,600 2,881,136 2.26
Information TechnologyHana Microelectronics 2,167,500 4,192,141 3.30
• Statements of Portfolio as at 30 September 2017
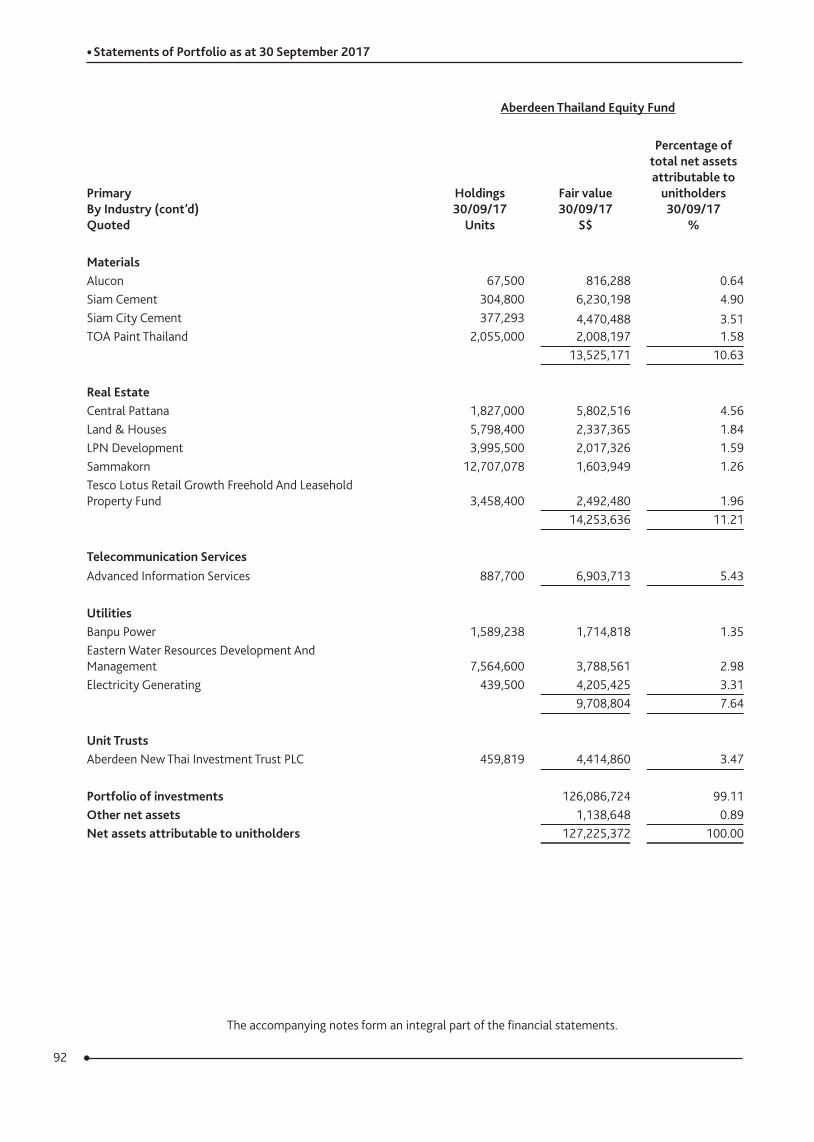
92
The accompanying notes form an integral part of the financial statements.
Aberdeen Thailand Equity Fund
Primary By Industry (cont’d) Quoted
Holdings 30/09/17
Units
Fair value 30/09/17
S$
Percentage of total net assets attributable to
unitholders 30/09/17
%
MaterialsAlucon 67,500 816,288 0.64Siam Cement 304,800 6,230,198 4.90Siam City Cement 377,293 4,470,488 3.51TOA Paint Thailand 2,055,000 2,008,197 1.58
13,525,171 10.63
Real EstateCentral Pattana 1,827,000 5,802,516 4.56Land & Houses 5,798,400 2,337,365 1.84LPN Development 3,995,500 2,017,326 1.59Sammakorn 12,707,078 1,603,949 1.26Tesco Lotus Retail Growth Freehold And Leasehold Property Fund 3,458,400 2,492,480 1.96
14,253,636 11.21
Telecommunication ServicesAdvanced Information Services 887,700 6,903,713 5.43
UtilitiesBanpu Power 1,589,238 1,714,818 1.35Eastern Water Resources Development And Management 7,564,600 3,788,561 2.98Electricity Generating 439,500 4,205,425 3.31
9,708,804 7.64
Unit TrustsAberdeen New Thai Investment Trust PLC 459,819 4,414,860 3.47
Portfolio of investments 126,086,724 99.11Other net assets 1,138,648 0.89Net assets attributable to unitholders 127,225,372 100.00
• Statements of Portfolio as at 30 September 2017
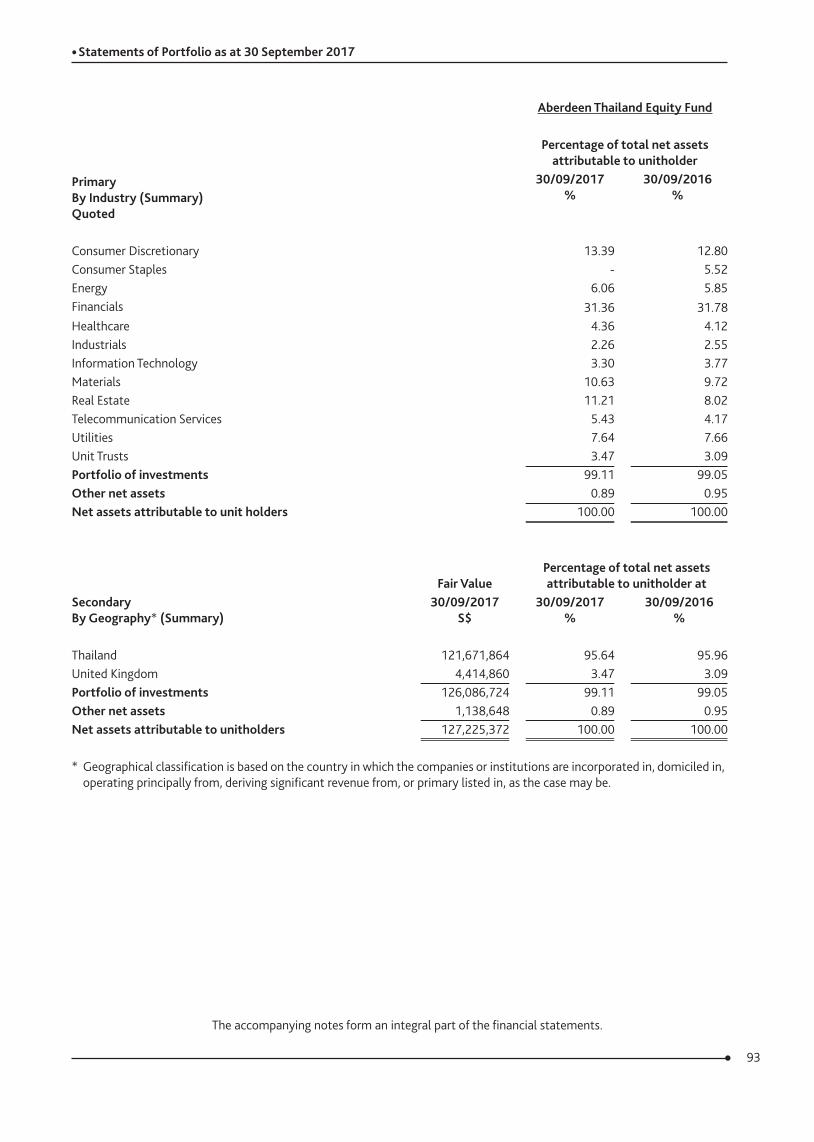
93
The accompanying notes form an integral part of the financial statements.
Aberdeen Thailand Equity Fund
Percentage of total net assets attributable to unitholder
Primary By Industry (Summary) Quoted
30/09/2017 %
30/09/2016 %
Consumer Discretionary 13.39 12.80Consumer Staples - 5.52Energy 6.06 5.85Financials 31.36 31.78Healthcare 4.36 4.12Industrials 2.26 2.55Information Technology 3.30 3.77Materials 10.63 9.72Real Estate 11.21 8.02Telecommunication Services 5.43 4.17Utilities 7.64 7.66Unit Trusts 3.47 3.09Portfolio of investments 99.11 99.05Other net assets 0.89 0.95Net assets attributable to unit holders 100.00 100.00
Secondary By Geography* (Summary)
Fair ValuePercentage of total net assets attributable to unitholder at
30/09/2017 S$
30/09/2017 %
30/09/2016 %
Thailand 121,671,864 95.64 95.96United Kingdom 4,414,860 3.47 3.09Portfolio of investments 126,086,724 99.11 99.05Other net assets 1,138,648 0.89 0.95Net assets attributable to unitholders 127,225,372 100.00 100.00
* Geographical classification is based on the country in which the companies or institutions are incorporated in, domiciled in, operating principally from, deriving significant revenue from, or primary listed in, as the case may be.
• Statements of Portfolio as at 30 September 2017
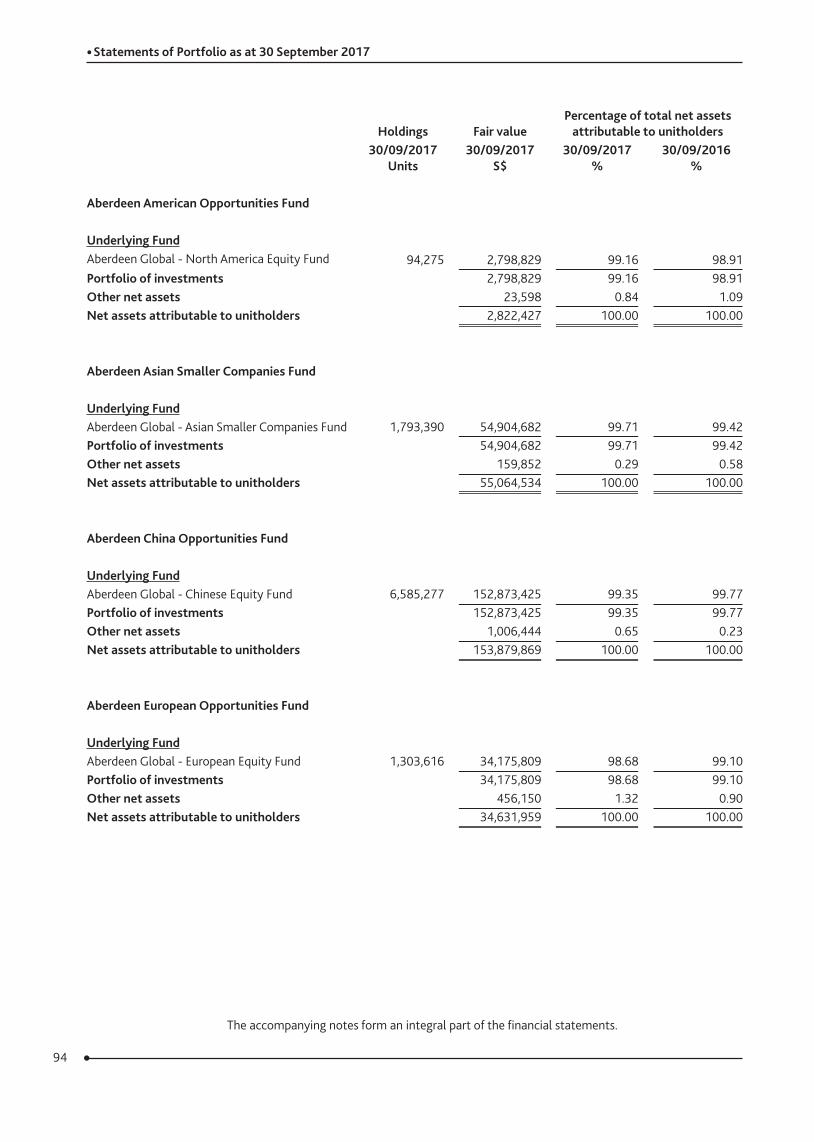
94
The accompanying notes form an integral part of the financial statements.
Holdings Fair valuePercentage of total net assets
attributable to unitholders30/09/2017
Units30/09/2017
S$30/09/2017
%30/09/2016
%
Aberdeen American Opportunities Fund
Underlying FundAberdeen Global - North America Equity Fund 94,275 2,798,829 99.16 98.91Portfolio of investments 2,798,829 99.16 98.91Other net assets 23,598 0.84 1.09Net assets attributable to unitholders 2,822,427 100.00 100.00
Aberdeen Asian Smaller Companies Fund
Underlying FundAberdeen Global - Asian Smaller Companies Fund 1,793,390 54,904,682 99.71 99.42Portfolio of investments 54,904,682 99.71 99.42Other net assets 159,852 0.29 0.58Net assets attributable to unitholders 55,064,534 100.00 100.00
Aberdeen China Opportunities Fund
Underlying FundAberdeen Global - Chinese Equity Fund 6,585,277 152,873,425 99.35 99.77Portfolio of investments 152,873,425 99.35 99.77Other net assets 1,006,444 0.65 0.23Net assets attributable to unitholders 153,879,869 100.00 100.00
Aberdeen European Opportunities Fund
Underlying FundAberdeen Global - European Equity Fund 1,303,616 34,175,809 98.68 99.10Portfolio of investments 34,175,809 98.68 99.10Other net assets 456,150 1.32 0.90Net assets attributable to unitholders 34,631,959 100.00 100.00
• Statements of Portfolio as at 30 September 2017
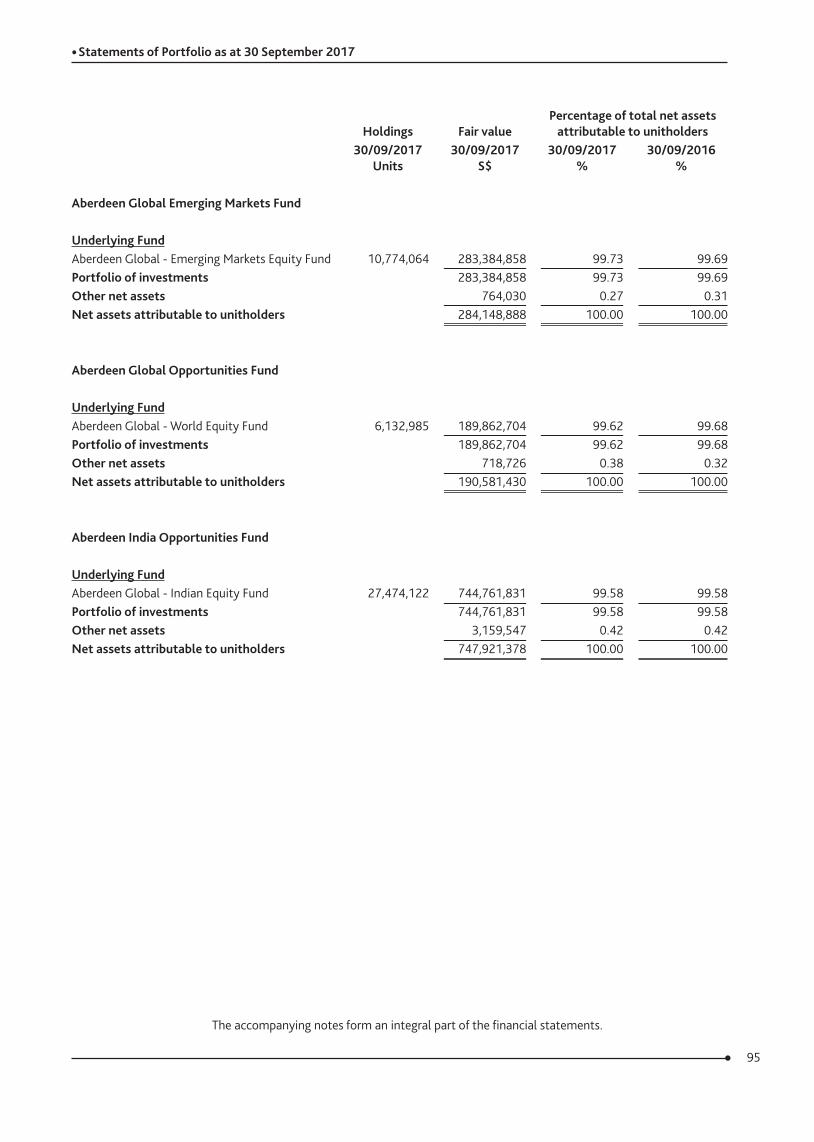
95
The accompanying notes form an integral part of the financial statements.
Holdings Fair valuePercentage of total net assets
attributable to unitholders30/09/2017
Units30/09/2017
S$30/09/2017
%30/09/2016
%
Aberdeen Global Emerging Markets Fund
Underlying FundAberdeen Global - Emerging Markets Equity Fund 10,774,064 283,384,858 99.73 99.69Portfolio of investments 283,384,858 99.73 99.69Other net assets 764,030 0.27 0.31Net assets attributable to unitholders 284,148,888 100.00 100.00
Aberdeen Global Opportunities Fund
Underlying FundAberdeen Global - World Equity Fund 6,132,985 189,862,704 99.62 99.68Portfolio of investments 189,862,704 99.62 99.68Other net assets 718,726 0.38 0.32Net assets attributable to unitholders 190,581,430 100.00 100.00
Aberdeen India Opportunities Fund
Underlying FundAberdeen Global - Indian Equity Fund 27,474,122 744,761,831 99.58 99.58Portfolio of investments 744,761,831 99.58 99.58Other net assets 3,159,547 0.42 0.42Net assets attributable to unitholders 747,921,378 100.00 100.00
• Statements of Portfolio as at 30 September 2017
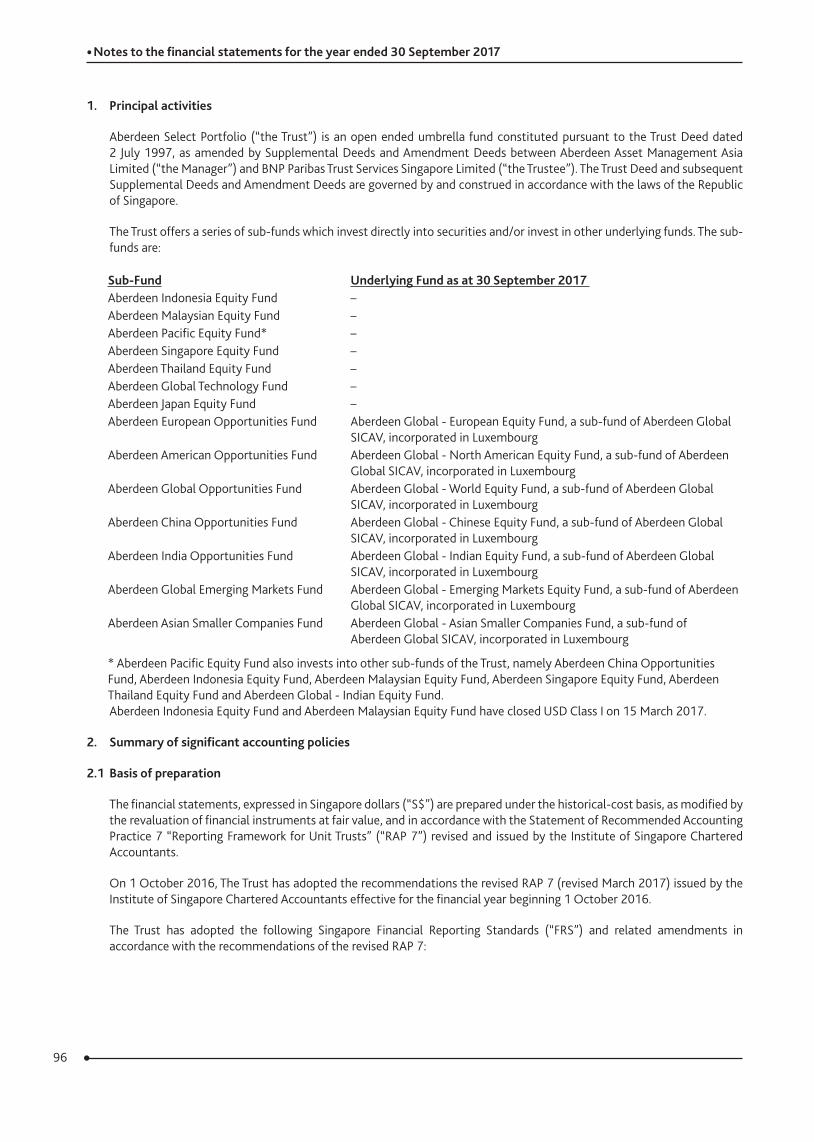
96
• Notes to the financial statements for the year ended 30 September 2017
1. Principal activities
Aberdeen Select Portfolio (“the Trust”) is an open ended umbrella fund constituted pursuant to the Trust Deed dated 2 July 1997, as amended by Supplemental Deeds and Amendment Deeds between Aberdeen Asset Management Asia Limited (“the Manager”) and BNP Paribas Trust Services Singapore Limited (“the Trustee”). The Trust Deed and subsequent Supplemental Deeds and Amendment Deeds are governed by and construed in accordance with the laws of the Republic of Singapore.
The Trust offers a series of sub-funds which invest directly into securities and/or invest in other underlying funds. The sub-funds are:
Sub‑Fund Underlying Fund as at 30 September 2017 Aberdeen Indonesia Equity Fund –Aberdeen Malaysian Equity Fund –Aberdeen Pacific Equity Fund* –Aberdeen Singapore Equity Fund –Aberdeen Thailand Equity Fund –Aberdeen Global Technology Fund –Aberdeen Japan Equity Fund –Aberdeen European Opportunities Fund Aberdeen Global - European Equity Fund, a sub-fund of Aberdeen Global
SICAV, incorporated in LuxembourgAberdeen American Opportunities Fund Aberdeen Global - North American Equity Fund, a sub-fund of Aberdeen
Global SICAV, incorporated in LuxembourgAberdeen Global Opportunities Fund Aberdeen Global - World Equity Fund, a sub-fund of Aberdeen Global
SICAV, incorporated in LuxembourgAberdeen China Opportunities Fund Aberdeen Global - Chinese Equity Fund, a sub-fund of Aberdeen Global
SICAV, incorporated in LuxembourgAberdeen India Opportunities Fund Aberdeen Global - Indian Equity Fund, a sub-fund of Aberdeen Global
SICAV, incorporated in LuxembourgAberdeen Global Emerging Markets Fund Aberdeen Global - Emerging Markets Equity Fund, a sub-fund of Aberdeen
Global SICAV, incorporated in LuxembourgAberdeen Asian Smaller Companies Fund Aberdeen Global - Asian Smaller Companies Fund, a sub-fund of
Aberdeen Global SICAV, incorporated in Luxembourg
* Aberdeen Pacific Equity Fund also invests into other sub-funds of the Trust, namely Aberdeen China Opportunities Fund, Aberdeen Indonesia Equity Fund, Aberdeen Malaysian Equity Fund, Aberdeen Singapore Equity Fund, Aberdeen Thailand Equity Fund and Aberdeen Global - Indian Equity Fund.Aberdeen Indonesia Equity Fund and Aberdeen Malaysian Equity Fund have closed USD Class I on 15 March 2017.
2. Summary of significant accounting policies
2.1 Basis of preparation
The financial statements, expressed in Singapore dollars (“S$”) are prepared under the historical-cost basis, as modified by the revaluation of financial instruments at fair value, and in accordance with the Statement of Recommended Accounting Practice 7 “Reporting Framework for Unit Trusts” (“RAP 7”) revised and issued by the Institute of Singapore Chartered Accountants.
On 1 October 2016, The Trust has adopted the recommendations the revised RAP 7 (revised March 2017) issued by the Institute of Singapore Chartered Accountants effective for the financial year beginning 1 October 2016.
The Trust has adopted the following Singapore Financial Reporting Standards (“FRS”) and related amendments in accordance with the recommendations of the revised RAP 7:
97
• Notes to the financial statements for the year ended 30 September 2017
(i) Consolidation and disclosure of interests in other entities
Under FRS 110, reporting entities were required to consolidate all investees they control, however the Investment Entities Amendment provides an exception and requires investment entities to measure particular subsidiaries at fair value through profit or loss, rather than consolidate them. The Investment Entities Amendment sets out disclosure requirements for investment entities.
FRS 27 (revised 2011), “Separate financial statements” and amendments to FRS 27: The objective of the standard is to prescribe the accounting and disclosure requirements when an entity prepares separate financial statements. The amendments require an investment entity as defined in FRS 110 to present separate financial statements as its only financial statements in the case where it measures all of its subsidiaries at fair value through profit or loss and disclose that fact.
FRS 112 Disclosure of Interests in Other Entities and the related amendments require entities to disclose significant judgements and assumptions made in determining whether the entity controls, jointly controls, significantly influences or has some interests in other entities. Entities are also required to provide disclosure around certain "structured entities". The adoption of FRS 112 introduces new disclosure requirements related to investment entities.
(ii) Offsetting financial assets and liabilities
Under the Amendments to FRS 32 “Financial Instruments: Presentation – Offsetting Financial Assets and Financial Liabilities”, to qualify for offsetting, the right to set off a financial asset and a financial liability must not be contingent on a future event and must be enforceable both in the normal course of business and in the event of default, insolvency or bankruptcy of the entity and all counterparties
(iii) Fair value measurement
FRS 113 “Fair value measurement” establishes a single framework for measuring fair value and making disclosures about fair value measurements. In particular, it unifies the definition of fair value as the price at which an orderly transaction to sell an asset or to transfer a liability would take place between market participants at the measurement date.
The adoption of this revised RAP 7 resulted in additional disclosures, but did not result in substantial changes to the accounting policies of the Funds and had no material effect on the amounts reported for the current or prior financial years.
2.2 Recognition of income
Dividend income is recognised when declared, interest income is recognised on an accrual basis. Dividend and interest income are stated gross of tax credits and withholding tax respectively.
2.3 Investments
The unrealised differences between the fair value and the original cost are taken directly to the Statements of Total Return. All realised gains and losses on disposal of investments are computed on the basis of the difference between weighted average cost and selling price and are taken directly to the Statements of Total Return.
2.4 Fair value
Fair value of investments in securities is based on quoted market prices at the reporting date. The quoted market price used is the last traded price or the current net asset value of the underlying sub-funds. When the last traded prices and asking prices are unavailable or are not fair value, the price of the most recent transaction is used to fair value the investments.
2.5 Foreign currency translation
Monetary assets and liabilities in currencies other than Singapore dollars (“S$”) are translated at the exchange rates ruling at the end of the accounting period and transactions in currencies other than Singapore dollars during the period are translated at rates of exchange ruling on transaction dates. All exchange differences are accounted for through the Statements of Total Return.
98
• Notes to the financial statements for the year ended 30 September 2017
2.6 Expenses of the Trust
Service and other charges which can be specifically identified to a particular sub-fund are allocated entirely to that sub-fund. Common charges are allocated to individual sub-funds, in the ratio of their net asset values at the end of each quarter.
2.7 Units
All units issued by the Trust provide the investors with the right to redeem for cash at the value proportionate to the investor’s share in the Trust’s net assets at redemption date. These units are classified as equity.
2.8 Offsetting financial instruments
Financial assets and liabilities are offset and the net amount presented in the statement of financial position when, and only when, the Group has a legal right to offset the amounts and intends either to settle on a net basis or to realise the asset and settle the liability simultaneously. The legally enforceable right must not be contingent on future events and must be enforceable in the normal course of business and in the event of default, insolvency or bankruptcy of the company or the counterparty.
2.9 Structured entities
A structured entity is an entity that has been designed so that voting or similar rights are not the dominant factor in deciding who controls the entity, such as when any voting rights relate to administrative tasks only and the relevant activities are directed by means of contractual arrangements.
A structured entity often has some or all of the following features or attributes:
(a) restricted activities;(b) a narrow and well defined objective, such as to provide investment opportunities for investors by passing on risks and
rewards associated with the assets of the structured entity to investors;(c) insufficient equity to permit the structured entity to finance its activities without subordinated financial support; and (d) financing in the form of multiple contractually linked instruments to investors that create concentrations of credit or
other risks (tranches).
The Trust considers all of their investments in other funds (individually, "Investee Fund" and collectively, “Investee Funds”) to be investments in unconsolidated structured entities. The Trust invests in Investee Funds whose objectives range from achieving medium to long term capital growth and whose investment strategy does not include the use of leverage.
The Investee Funds are managed by related asset managers and apply various investment strategies to accomplish their respective investment objectives.
The Investee Funds finance their operations by issuing redeemable shares which are placeable at the holder's option and entitles the holder to a proportional stake in the respective fund's net assets. The Trust holds redeemable shares in each of its Investee Funds.
The change in fair value of the Investee Funds are included in the statement of total return in "Net gains/(losses) on investments".
2.10 Investment entity
The Trust has multiple unrelated investors and indirectly holds multiple investments through the Investee Funds. Ownership interest in the Trust is in the form of redeemable shares or units and which are exposed to variable returns from changes in the fair value of the Trust’s net assets. The Trust has been deemed to meet the definition of an Investment Entity per FRS 110 as the following conditions exist:
(a) The Trust has obtained funds for the purpose of providing investors with investment management services;(b) The Trust’s business purpose, which was communicated directly to investors, is investing solely for returns from capital
appreciation and investment income; and(c) The performance of investments made through the Investee Funds are measured and evaluated on a fair value basis.
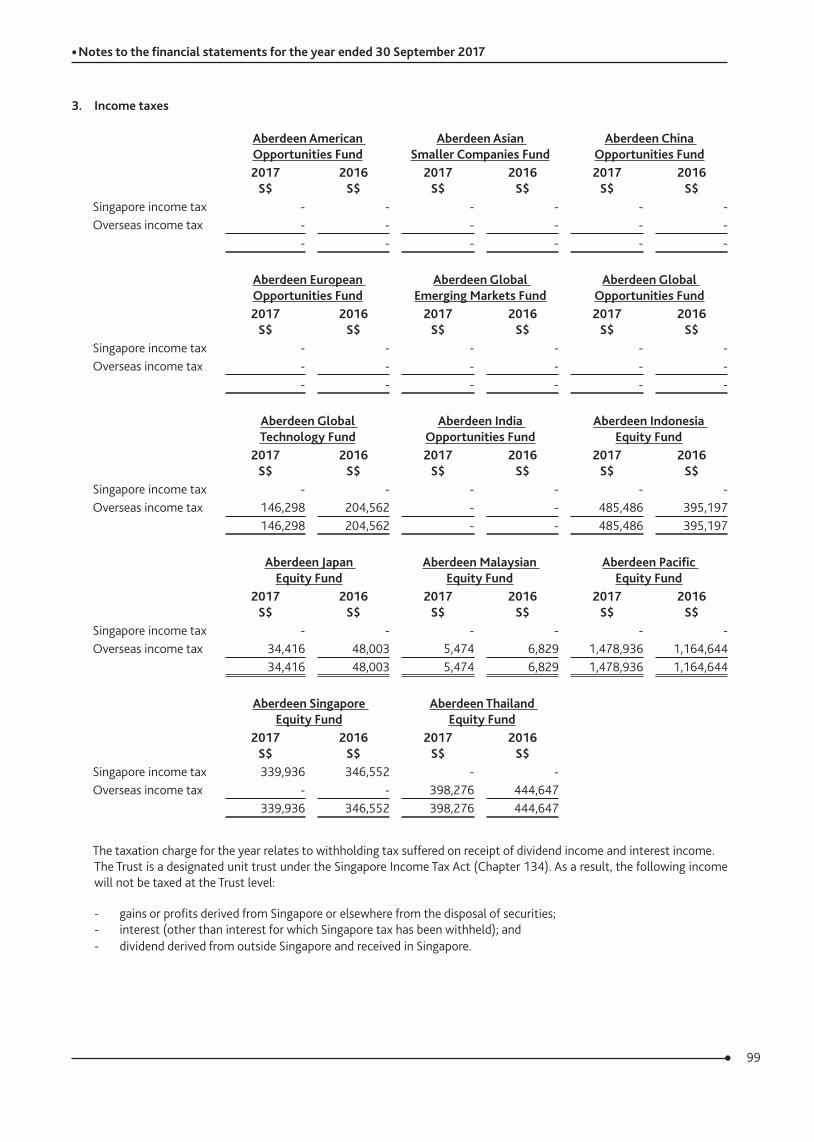
99
• Notes to the financial statements for the year ended 30 September 2017
3. Income taxes
Aberdeen American Opportunities Fund
Aberdeen Asian Smaller Companies Fund
Aberdeen China Opportunities Fund
2017S$
2016S$
2017S$
2016S$
2017S$
2016S$
Singapore income tax - - - - - -Overseas income tax - - - - - -
- - - - - -
Aberdeen European Opportunities Fund
Aberdeen Global Emerging Markets Fund
Aberdeen Global Opportunities Fund
2017S$
2016S$
2017S$
2016S$
2017S$
2016S$
Singapore income tax - - - - - -Overseas income tax - - - - - -
- - - - - -
Aberdeen Global Technology Fund
Aberdeen India Opportunities Fund
Aberdeen Indonesia Equity Fund
2017S$
2016S$
2017S$
2016S$
2017S$
2016S$
Singapore income tax - - - - - -Overseas income tax 146,298 204,562 - - 485,486 395,197
146,298 204,562 - - 485,486 395,197
Aberdeen Japan Equity Fund
Aberdeen Malaysian Equity Fund
Aberdeen Pacific Equity Fund
2017S$
2016S$
2017S$
2016S$
2017S$
2016S$
Singapore income tax - - - - - -Overseas income tax 34,416 48,003 5,474 6,829 1,478,936 1,164,644
34,416 48,003 5,474 6,829 1,478,936 1,164,644
Aberdeen Singapore Equity Fund
Aberdeen Thailand Equity Fund
2017S$
2016S$
2017S$
2016S$
Singapore income tax 339,936 346,552 - -Overseas income tax - - 398,276 444,647
339,936 346,552 398,276 444,647
The taxation charge for the year relates to withholding tax suffered on receipt of dividend income and interest income.The Trust is a designated unit trust under the Singapore Income Tax Act (Chapter 134). As a result, the following income will not be taxed at the Trust level:
- gains or profits derived from Singapore or elsewhere from the disposal of securities;- interest (other than interest for which Singapore tax has been withheld); and- dividend derived from outside Singapore and received in Singapore.
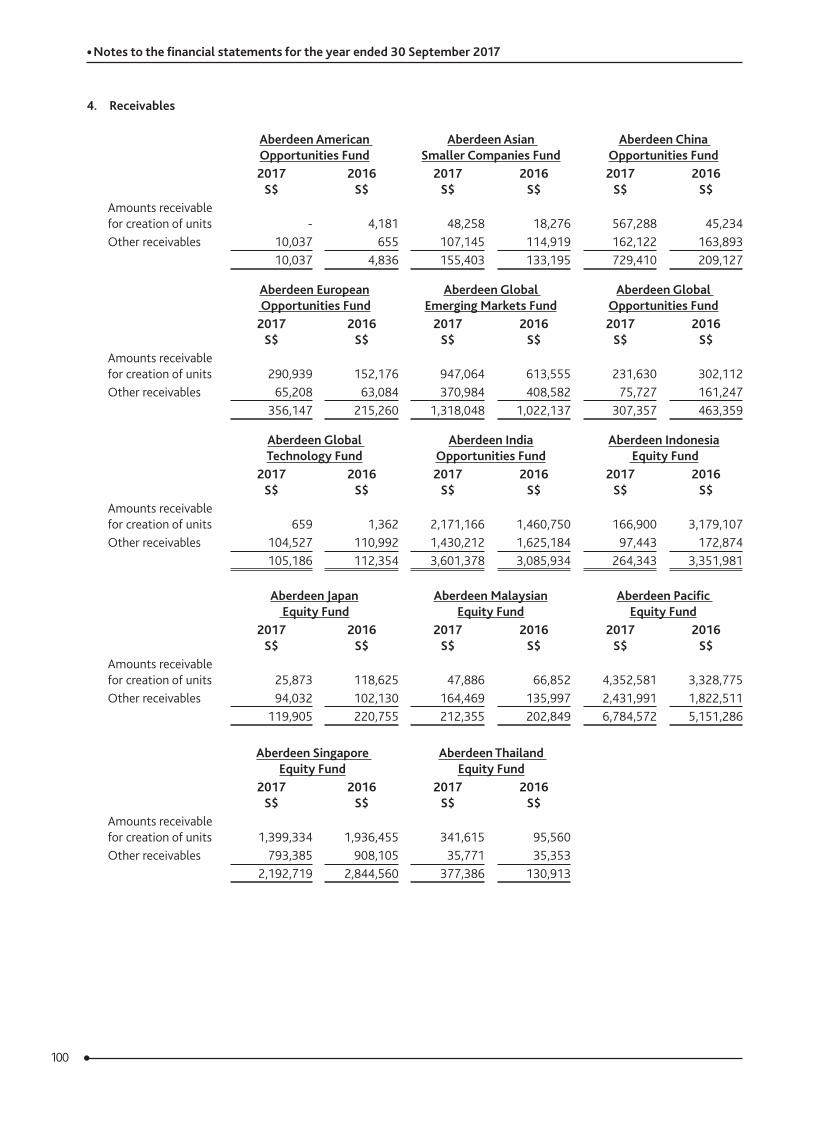
100
• Notes to the financial statements for the year ended 30 September 2017
4. Receivables
Aberdeen American Opportunities Fund
Aberdeen Asian Smaller Companies Fund
Aberdeen China Opportunities Fund
2017S$
2016S$
2017S$
2016S$
2017S$
2016S$
Amounts receivable for creation of units - 4,181 48,258 18,276 567,288 45,234Other receivables 10,037 655 107,145 114,919 162,122 163,893
10,037 4,836 155,403 133,195 729,410 209,127
Aberdeen European Opportunities Fund
Aberdeen Global Emerging Markets Fund
Aberdeen Global Opportunities Fund
2017S$
2016S$
2017S$
2016S$
2017S$
2016S$
Amounts receivable for creation of units 290,939 152,176 947,064 613,555 231,630 302,112Other receivables 65,208 63,084 370,984 408,582 75,727 161,247
356,147 215,260 1,318,048 1,022,137 307,357 463,359
Aberdeen Global Technology Fund
Aberdeen India Opportunities Fund
Aberdeen Indonesia Equity Fund
2017S$
2016S$
2017S$
2016S$
2017S$
2016S$
Amounts receivable for creation of units 659 1,362 2,171,166 1,460,750 166,900 3,179,107Other receivables 104,527 110,992 1,430,212 1,625,184 97,443 172,874
105,186 112,354 3,601,378 3,085,934 264,343 3,351,981
Aberdeen Japan Equity Fund
Aberdeen Malaysian Equity Fund
Aberdeen Pacific Equity Fund
2017S$
2016S$
2017S$
2016S$
2017S$
2016S$
Amounts receivable for creation of units 25,873 118,625 47,886 66,852 4,352,581 3,328,775Other receivables 94,032 102,130 164,469 135,997 2,431,991 1,822,511
119,905 220,755 212,355 202,849 6,784,572 5,151,286
Aberdeen Singapore Equity Fund
Aberdeen Thailand Equity Fund
2017S$
2016S$
2017S$
2016S$
Amounts receivable for creation of units 1,399,334 1,936,455 341,615 95,560Other receivables 793,385 908,105 35,771 35,353
2,192,719 2,844,560 377,386 130,913
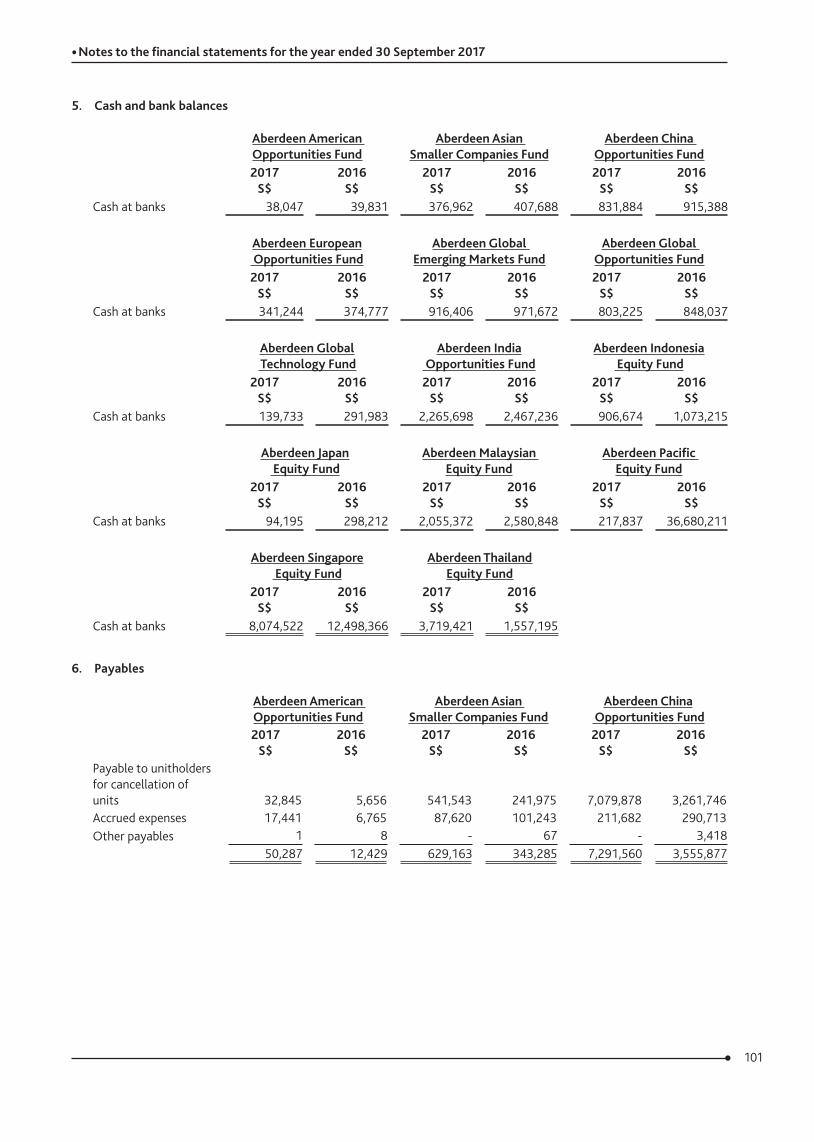
101
• Notes to the financial statements for the year ended 30 September 2017
5. Cash and bank balances
Aberdeen American Opportunities Fund
Aberdeen Asian Smaller Companies Fund
Aberdeen China Opportunities Fund
2017S$
2016S$
2017S$
2016S$
2017S$
2016S$
Cash at banks 38,047 39,831 376,962 407,688 831,884 915,388
Aberdeen European Opportunities Fund
Aberdeen Global Emerging Markets Fund
Aberdeen Global Opportunities Fund
2017S$
2016S$
2017S$
2016S$
2017S$
2016S$
Cash at banks 341,244 374,777 916,406 971,672 803,225 848,037
Aberdeen Global Technology Fund
Aberdeen India Opportunities Fund
Aberdeen Indonesia Equity Fund
2017S$
2016S$
2017S$
2016S$
2017S$
2016S$
Cash at banks 139,733 291,983 2,265,698 2,467,236 906,674 1,073,215
Aberdeen Japan Equity Fund
Aberdeen Malaysian Equity Fund
Aberdeen Pacific Equity Fund
2017S$
2016S$
2017S$
2016S$
2017S$
2016S$
Cash at banks 94,195 298,212 2,055,372 2,580,848 217,837 36,680,211
Aberdeen Singapore Equity Fund
Aberdeen Thailand Equity Fund
2017S$
2016S$
2017S$
2016S$
Cash at banks 8,074,522 12,498,366 3,719,421 1,557,195
6. Payables
Aberdeen American Opportunities Fund
Aberdeen Asian Smaller Companies Fund
Aberdeen China Opportunities Fund
2017S$
2016S$
2017S$
2016S$
2017S$
2016S$
Payable to unitholders for cancellation of units 32,845 5,656 541,543 241,975 7,079,878 3,261,746Accrued expenses 17,441 6,765 87,620 101,243 211,682 290,713Other payables 1 8 - 67 - 3,418
50,287 12,429 629,163 343,285 7,291,560 3,555,877
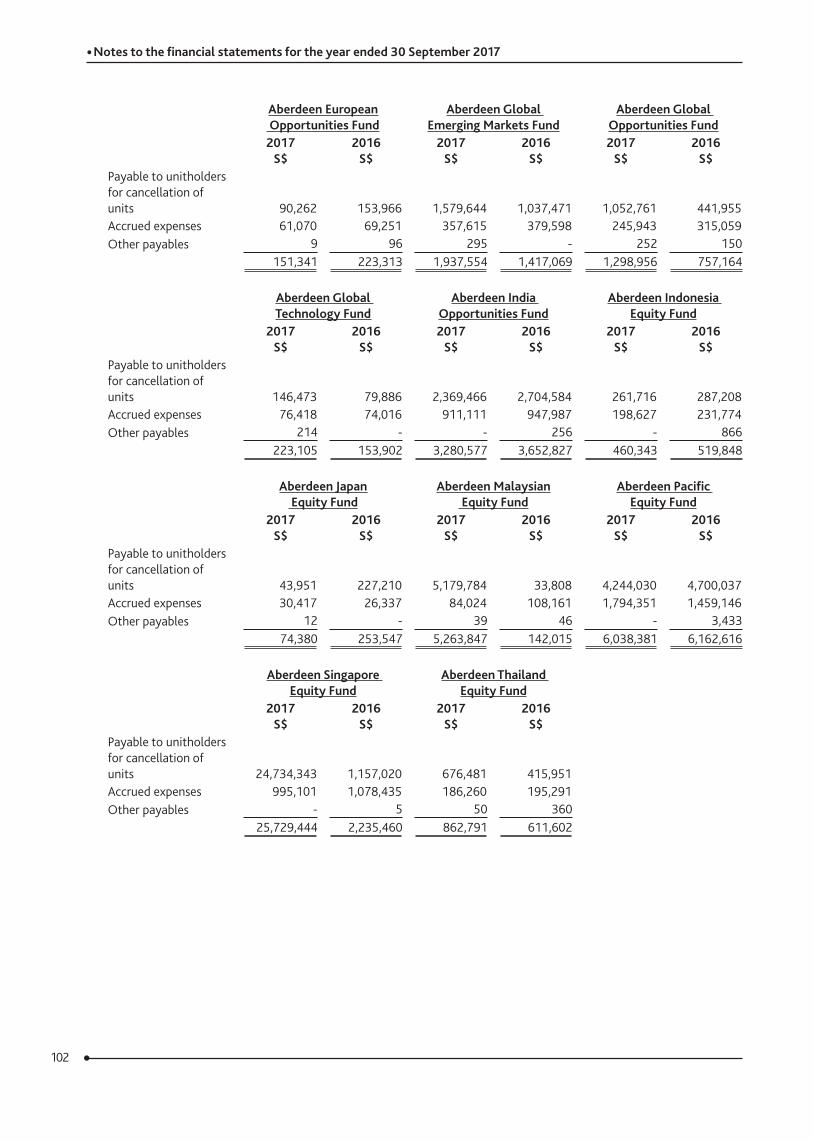
102
• Notes to the financial statements for the year ended 30 September 2017
Aberdeen European Opportunities Fund
Aberdeen Global Emerging Markets Fund
Aberdeen Global Opportunities Fund
2017S$
2016S$
2017S$
2016S$
2017S$
2016S$
Payable to unitholders for cancellation of units 90,262 153,966 1,579,644 1,037,471 1,052,761 441,955Accrued expenses 61,070 69,251 357,615 379,598 245,943 315,059Other payables 9 96 295 - 252 150
151,341 223,313 1,937,554 1,417,069 1,298,956 757,164
Aberdeen Global Technology Fund
Aberdeen India Opportunities Fund
Aberdeen Indonesia Equity Fund
2017S$
2016S$
2017S$
2016S$
2017S$
2016S$
Payable to unitholders for cancellation of units 146,473 79,886 2,369,466 2,704,584 261,716 287,208Accrued expenses 76,418 74,016 911,111 947,987 198,627 231,774Other payables 214 - - 256 - 866
223,105 153,902 3,280,577 3,652,827 460,343 519,848
Aberdeen Japan Equity Fund
Aberdeen Malaysian Equity Fund
Aberdeen Pacific Equity Fund
2017S$
2016S$
2017S$
2016S$
2017S$
2016S$
Payable to unitholders for cancellation of units 43,951 227,210 5,179,784 33,808 4,244,030 4,700,037Accrued expenses 30,417 26,337 84,024 108,161 1,794,351 1,459,146Other payables 12 - 39 46 - 3,433
74,380 253,547 5,263,847 142,015 6,038,381 6,162,616
Aberdeen Singapore Equity Fund
Aberdeen Thailand Equity Fund
2017S$
2016S$
2017S$
2016S$
Payable to unitholders for cancellation of units 24,734,343 1,157,020 676,481 415,951Accrued expenses 995,101 1,078,435 186,260 195,291Other payables - 5 50 360
25,729,444 2,235,460 862,791 611,602
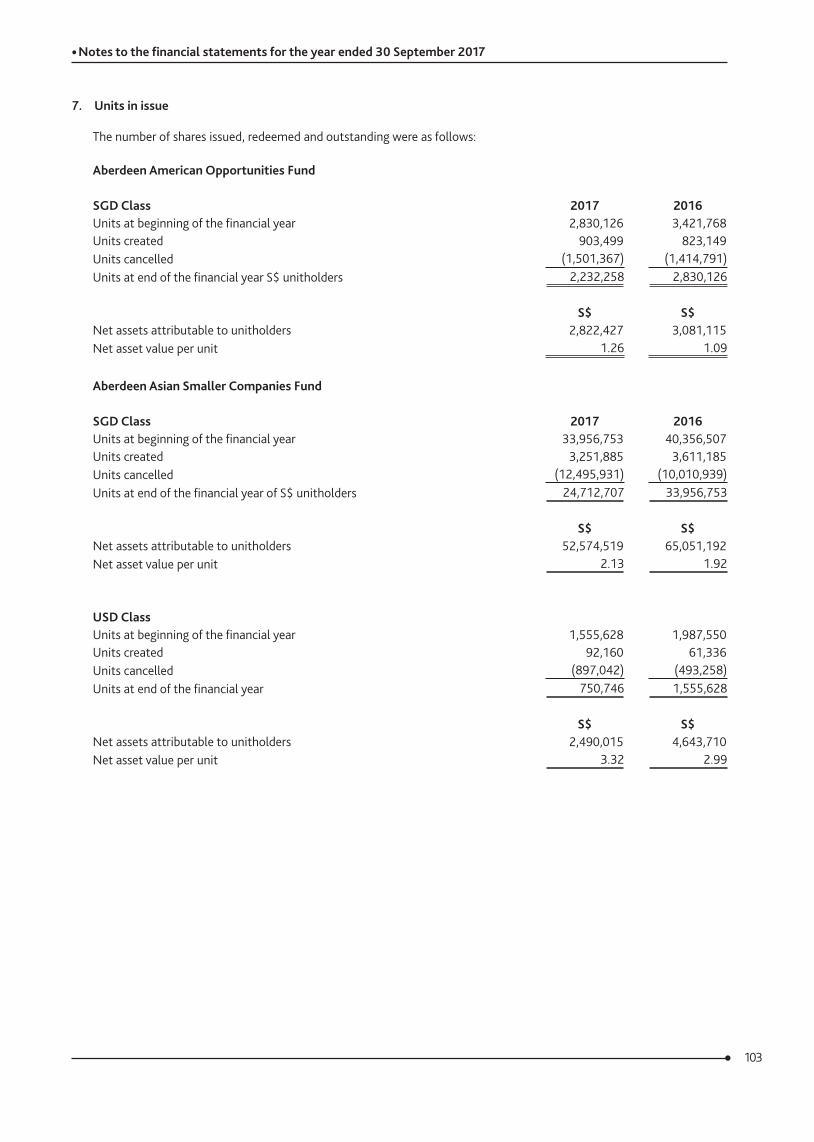
103
• Notes to the financial statements for the year ended 30 September 2017
7. Units in issue
The number of shares issued, redeemed and outstanding were as follows:
Aberdeen American Opportunities Fund
SGD Class 2017 2016Units at beginning of the financial year 2,830,126 3,421,768Units created 903,499 823,149Units cancelled (1,501,367) (1,414,791)Units at end of the financial year S$ unitholders 2,232,258 2,830,126
S$ S$Net assets attributable to unitholders 2,822,427 3,081,115Net asset value per unit 1.26 1.09
Aberdeen Asian Smaller Companies Fund
SGD Class 2017 2016Units at beginning of the financial year 33,956,753 40,356,507Units created 3,251,885 3,611,185Units cancelled (12,495,931) (10,010,939)Units at end of the financial year of S$ unitholders 24,712,707 33,956,753
S$ S$Net assets attributable to unitholders 52,574,519 65,051,192Net asset value per unit 2.13 1.92
USD ClassUnits at beginning of the financial year 1,555,628 1,987,550Units created 92,160 61,336Units cancelled (897,042) (493,258)Units at end of the financial year 750,746 1,555,628
S$ S$Net assets attributable to unitholders 2,490,015 4,643,710Net asset value per unit 3.32 2.99
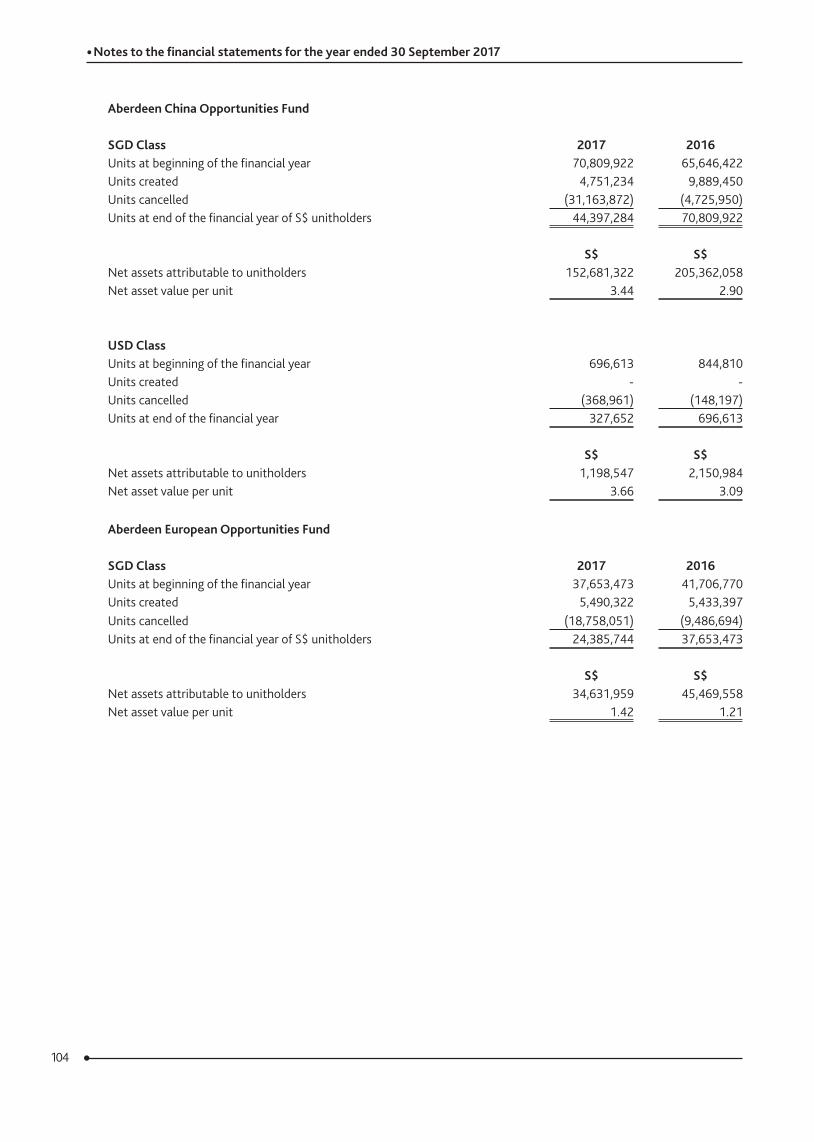
104
• Notes to the financial statements for the year ended 30 September 2017
Aberdeen China Opportunities Fund
SGD Class 2017 2016Units at beginning of the financial year 70,809,922 65,646,422Units created 4,751,234 9,889,450Units cancelled (31,163,872) (4,725,950)Units at end of the financial year of S$ unitholders 44,397,284 70,809,922
S$ S$Net assets attributable to unitholders 152,681,322 205,362,058Net asset value per unit 3.44 2.90
USD ClassUnits at beginning of the financial year 696,613 844,810Units created - -Units cancelled (368,961) (148,197)Units at end of the financial year 327,652 696,613
S$ S$Net assets attributable to unitholders 1,198,547 2,150,984Net asset value per unit 3.66 3.09
Aberdeen European Opportunities Fund
SGD Class 2017 2016Units at beginning of the financial year 37,653,473 41,706,770Units created 5,490,322 5,433,397Units cancelled (18,758,051) (9,486,694)Units at end of the financial year of S$ unitholders 24,385,744 37,653,473
S$ S$Net assets attributable to unitholders 34,631,959 45,469,558Net asset value per unit 1.42 1.21
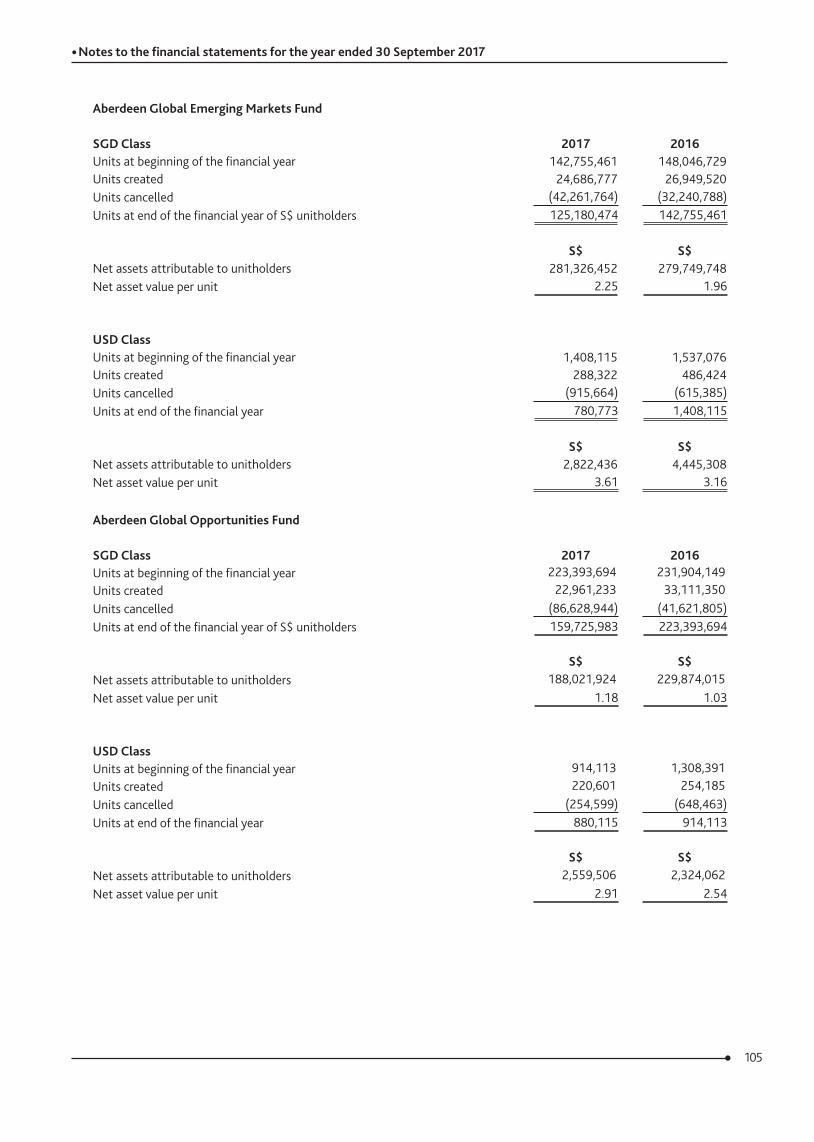
105
• Notes to the financial statements for the year ended 30 September 2017
Aberdeen Global Emerging Markets Fund
SGD Class 2017 2016Units at beginning of the financial year 142,755,461 148,046,729Units created 24,686,777 26,949,520Units cancelled (42,261,764) (32,240,788)Units at end of the financial year of S$ unitholders 125,180,474 142,755,461
S$ S$Net assets attributable to unitholders 281,326,452 279,749,748Net asset value per unit 2.25 1.96
USD ClassUnits at beginning of the financial year 1,408,115 1,537,076Units created 288,322 486,424Units cancelled (915,664) (615,385)Units at end of the financial year 780,773 1,408,115
S$ S$Net assets attributable to unitholders 2,822,436 4,445,308Net asset value per unit 3.61 3.16
Aberdeen Global Opportunities Fund
SGD Class 2017 2016Units at beginning of the financial year 223,393,694 231,904,149Units created 22,961,233 33,111,350Units cancelled (86,628,944) (41,621,805)Units at end of the financial year of S$ unitholders 159,725,983 223,393,694
S$ S$Net assets attributable to unitholders 188,021,924 229,874,015Net asset value per unit 1.18 1.03
USD ClassUnits at beginning of the financial year 914,113 1,308,391Units created 220,601 254,185Units cancelled (254,599) (648,463)Units at end of the financial year 880,115 914,113
S$ S$Net assets attributable to unitholders 2,559,506 2,324,062Net asset value per unit 2.91 2.54
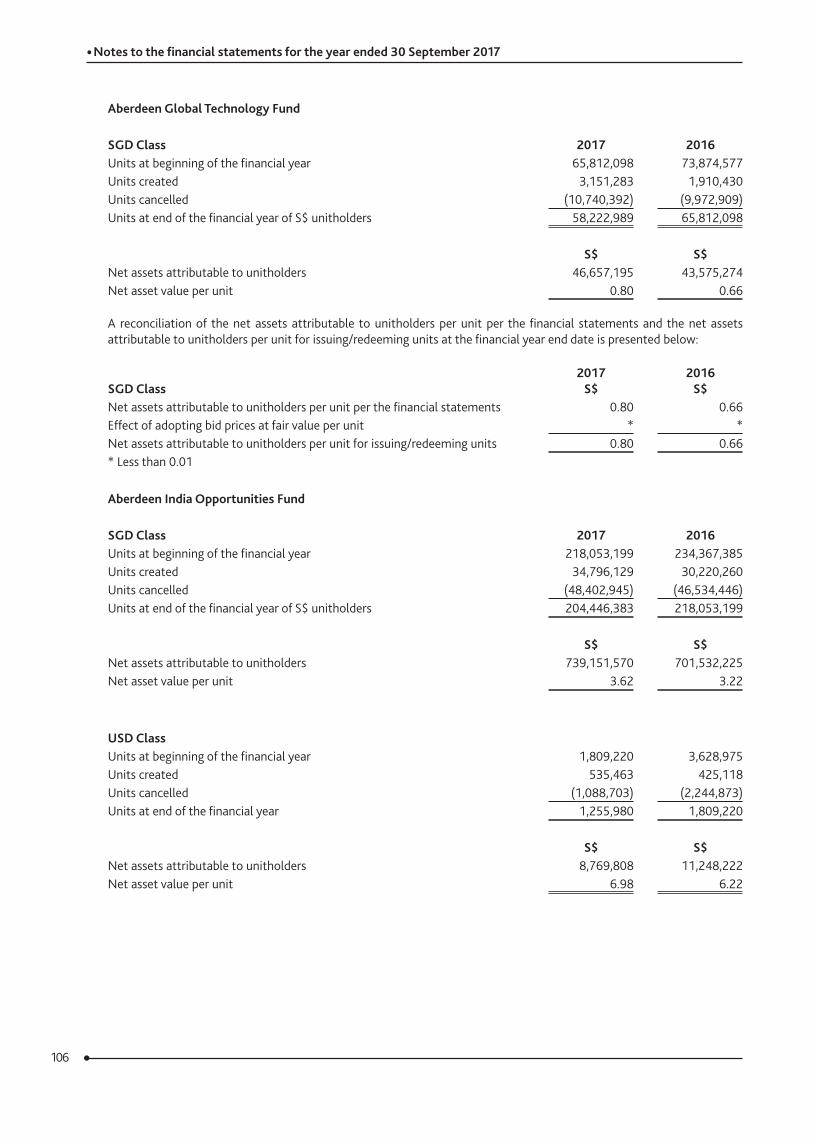
106
• Notes to the financial statements for the year ended 30 September 2017
Aberdeen Global Technology Fund
SGD Class 2017 2016Units at beginning of the financial year 65,812,098 73,874,577Units created 3,151,283 1,910,430Units cancelled (10,740,392) (9,972,909)Units at end of the financial year of S$ unitholders 58,222,989 65,812,098
S$ S$Net assets attributable to unitholders 46,657,195 43,575,274Net asset value per unit 0.80 0.66
A reconciliation of the net assets attributable to unitholders per unit per the financial statements and the net assets attributable to unitholders per unit for issuing/redeeming units at the financial year end date is presented below:
SGD Class2017
S$2016
S$Net assets attributable to unitholders per unit per the financial statements 0.80 0.66Effect of adopting bid prices at fair value per unit * *Net assets attributable to unitholders per unit for issuing/redeeming units 0.80 0.66* Less than 0.01
Aberdeen India Opportunities Fund
SGD Class 2017 2016Units at beginning of the financial year 218,053,199 234,367,385Units created 34,796,129 30,220,260Units cancelled (48,402,945) (46,534,446)Units at end of the financial year of S$ unitholders 204,446,383 218,053,199
S$ S$Net assets attributable to unitholders 739,151,570 701,532,225Net asset value per unit 3.62 3.22
USD ClassUnits at beginning of the financial year 1,809,220 3,628,975Units created 535,463 425,118Units cancelled (1,088,703) (2,244,873)Units at end of the financial year 1,255,980 1,809,220
S$ S$Net assets attributable to unitholders 8,769,808 11,248,222Net asset value per unit 6.98 6.22
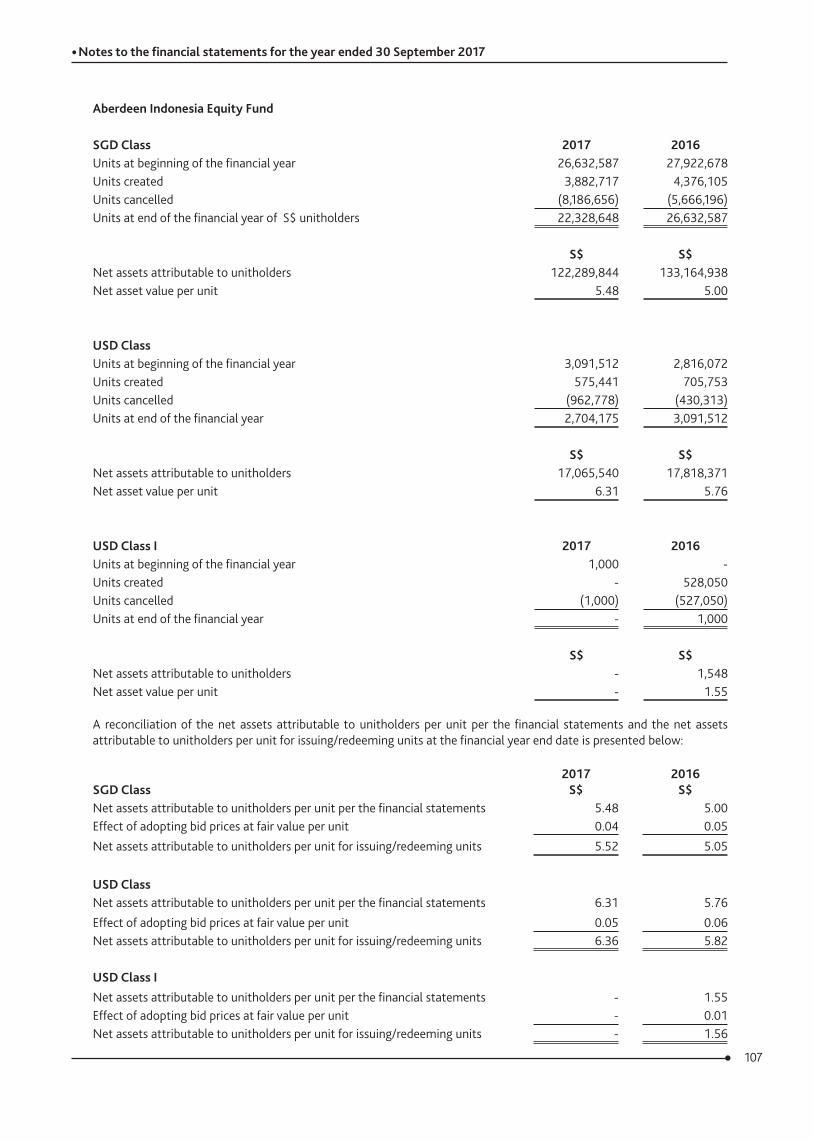
107
• Notes to the financial statements for the year ended 30 September 2017
Aberdeen Indonesia Equity Fund
SGD Class 2017 2016Units at beginning of the financial year 26,632,587 27,922,678Units created 3,882,717 4,376,105Units cancelled (8,186,656) (5,666,196)Units at end of the financial year of S$ unitholders 22,328,648 26,632,587
S$ S$Net assets attributable to unitholders 122,289,844 133,164,938Net asset value per unit 5.48 5.00
USD ClassUnits at beginning of the financial year 3,091,512 2,816,072Units created 575,441 705,753Units cancelled (962,778) (430,313)Units at end of the financial year 2,704,175 3,091,512
S$ S$Net assets attributable to unitholders 17,065,540 17,818,371Net asset value per unit 6.31 5.76
USD Class I 2017 2016Units at beginning of the financial year 1,000 -Units created - 528,050Units cancelled (1,000) (527,050)Units at end of the financial year - 1,000
S$ S$ Net assets attributable to unitholders - 1,548Net asset value per unit - 1.55
A reconciliation of the net assets attributable to unitholders per unit per the financial statements and the net assets attributable to unitholders per unit for issuing/redeeming units at the financial year end date is presented below:
SGD Class2017
S$2016
S$Net assets attributable to unitholders per unit per the financial statements 5.48 5.00Effect of adopting bid prices at fair value per unit 0.04 0.05Net assets attributable to unitholders per unit for issuing/redeeming units 5.52 5.05
USD ClassNet assets attributable to unitholders per unit per the financial statements 6.31 5.76Effect of adopting bid prices at fair value per unit 0.05 0.06Net assets attributable to unitholders per unit for issuing/redeeming units 6.36 5.82
USD Class INet assets attributable to unitholders per unit per the financial statements - 1.55Effect of adopting bid prices at fair value per unit - 0.01Net assets attributable to unitholders per unit for issuing/redeeming units - 1.56
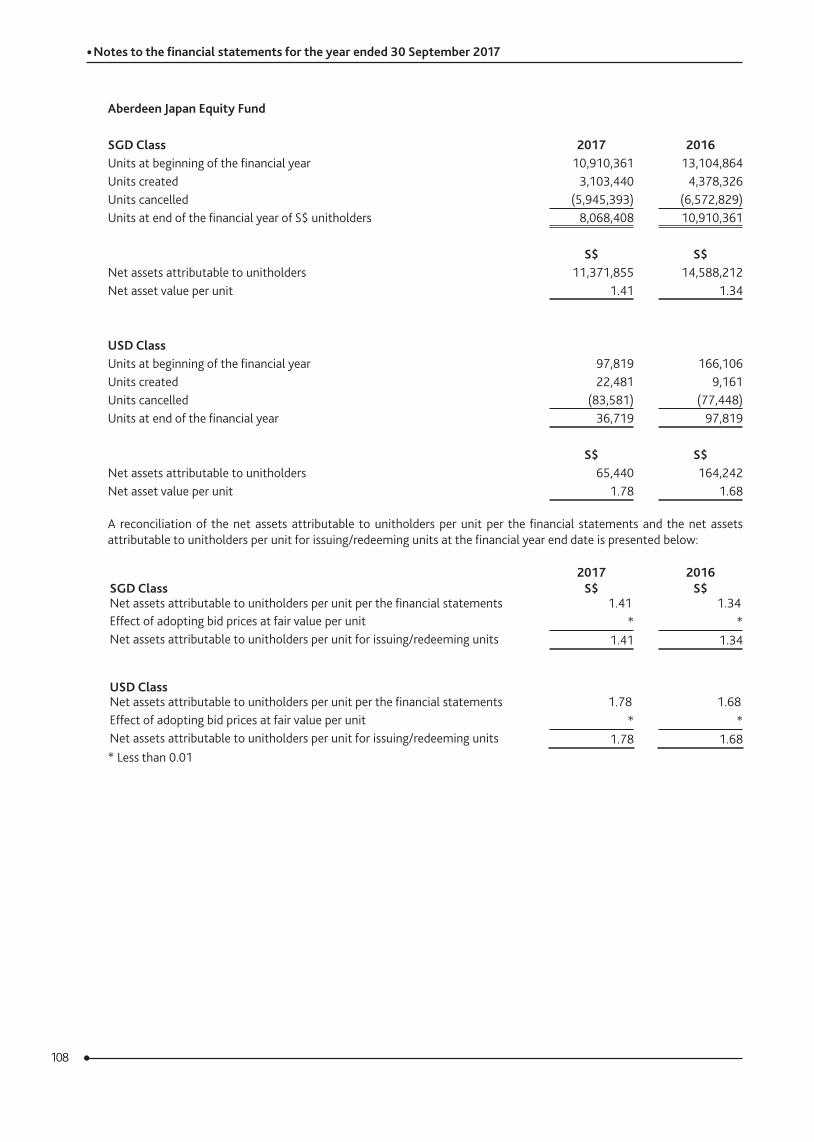
108
• Notes to the financial statements for the year ended 30 September 2017
Aberdeen Japan Equity Fund
SGD Class 2017 2016Units at beginning of the financial year 10,910,361 13,104,864Units created 3,103,440 4,378,326Units cancelled (5,945,393) (6,572,829)Units at end of the financial year of S$ unitholders 8,068,408 10,910,361
S$ S$Net assets attributable to unitholders 11,371,855 14,588,212Net asset value per unit 1.41 1.34
USD ClassUnits at beginning of the financial year 97,819 166,106Units created 22,481 9,161Units cancelled (83,581) (77,448)Units at end of the financial year 36,719 97,819
S$ S$Net assets attributable to unitholders 65,440 164,242Net asset value per unit 1.78 1.68
A reconciliation of the net assets attributable to unitholders per unit per the financial statements and the net assets attributable to unitholders per unit for issuing/redeeming units at the financial year end date is presented below:
SGD Class2017
S$2016
S$Net assets attributable to unitholders per unit per the financial statements 1.41 1.34Effect of adopting bid prices at fair value per unit * *Net assets attributable to unitholders per unit for issuing/redeeming units 1.41 1.34
USD ClassNet assets attributable to unitholders per unit per the financial statements 1.78 1.68Effect of adopting bid prices at fair value per unit * *Net assets attributable to unitholders per unit for issuing/redeeming units 1.78 1.68* Less than 0.01
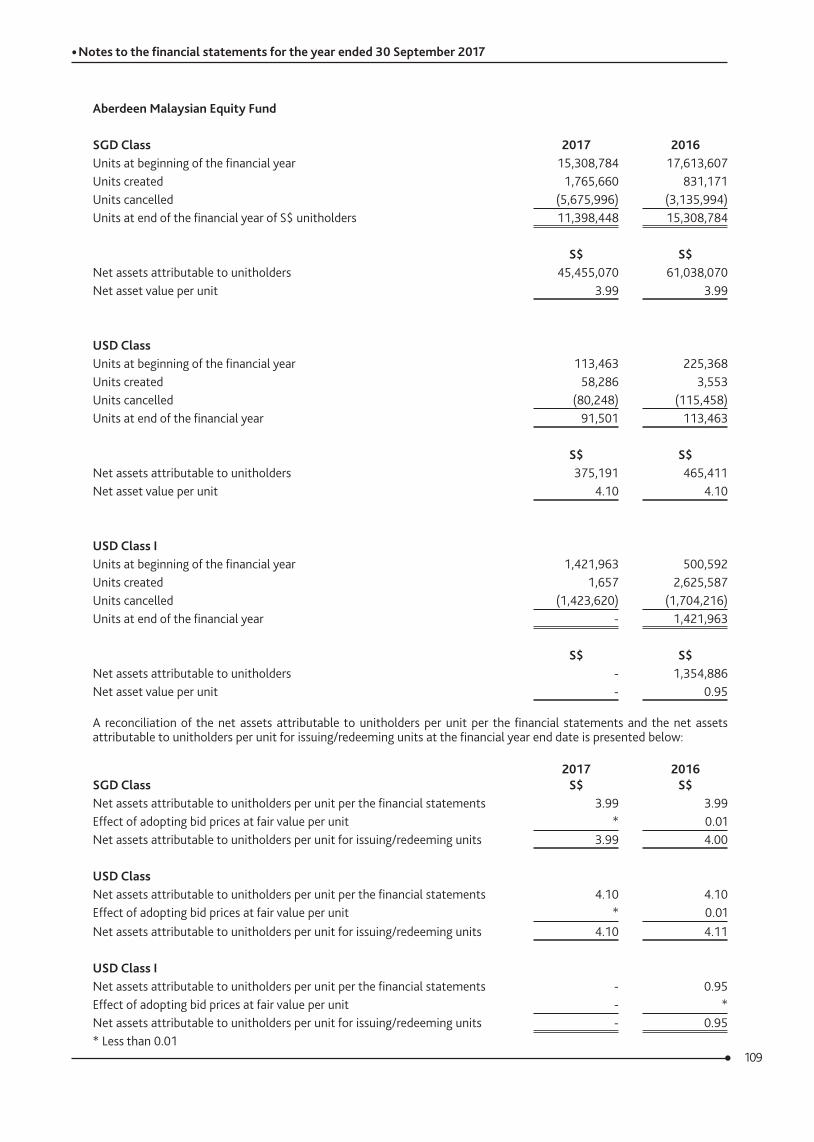
109
• Notes to the financial statements for the year ended 30 September 2017
Aberdeen Malaysian Equity Fund
SGD Class 2017 2016Units at beginning of the financial year 15,308,784 17,613,607Units created 1,765,660 831,171Units cancelled (5,675,996) (3,135,994)Units at end of the financial year of S$ unitholders 11,398,448 15,308,784
S$ S$Net assets attributable to unitholders 45,455,070 61,038,070Net asset value per unit 3.99 3.99
USD ClassUnits at beginning of the financial year 113,463 225,368Units created 58,286 3,553Units cancelled (80,248) (115,458)Units at end of the financial year 91,501 113,463
S$ S$Net assets attributable to unitholders 375,191 465,411Net asset value per unit 4.10 4.10
USD Class IUnits at beginning of the financial year 1,421,963 500,592Units created 1,657 2,625,587Units cancelled (1,423,620) (1,704,216)Units at end of the financial year - 1,421,963
S$ S$Net assets attributable to unitholders - 1,354,886Net asset value per unit - 0.95
A reconciliation of the net assets attributable to unitholders per unit per the financial statements and the net assets attributable to unitholders per unit for issuing/redeeming units at the financial year end date is presented below:
SGD Class2017
S$2016
S$Net assets attributable to unitholders per unit per the financial statements 3.99 3.99Effect of adopting bid prices at fair value per unit * 0.01Net assets attributable to unitholders per unit for issuing/redeeming units 3.99 4.00
USD ClassNet assets attributable to unitholders per unit per the financial statements 4.10 4.10Effect of adopting bid prices at fair value per unit * 0.01Net assets attributable to unitholders per unit for issuing/redeeming units 4.10 4.11
USD Class INet assets attributable to unitholders per unit per the financial statements - 0.95Effect of adopting bid prices at fair value per unit - *Net assets attributable to unitholders per unit for issuing/redeeming units - 0.95* Less than 0.01
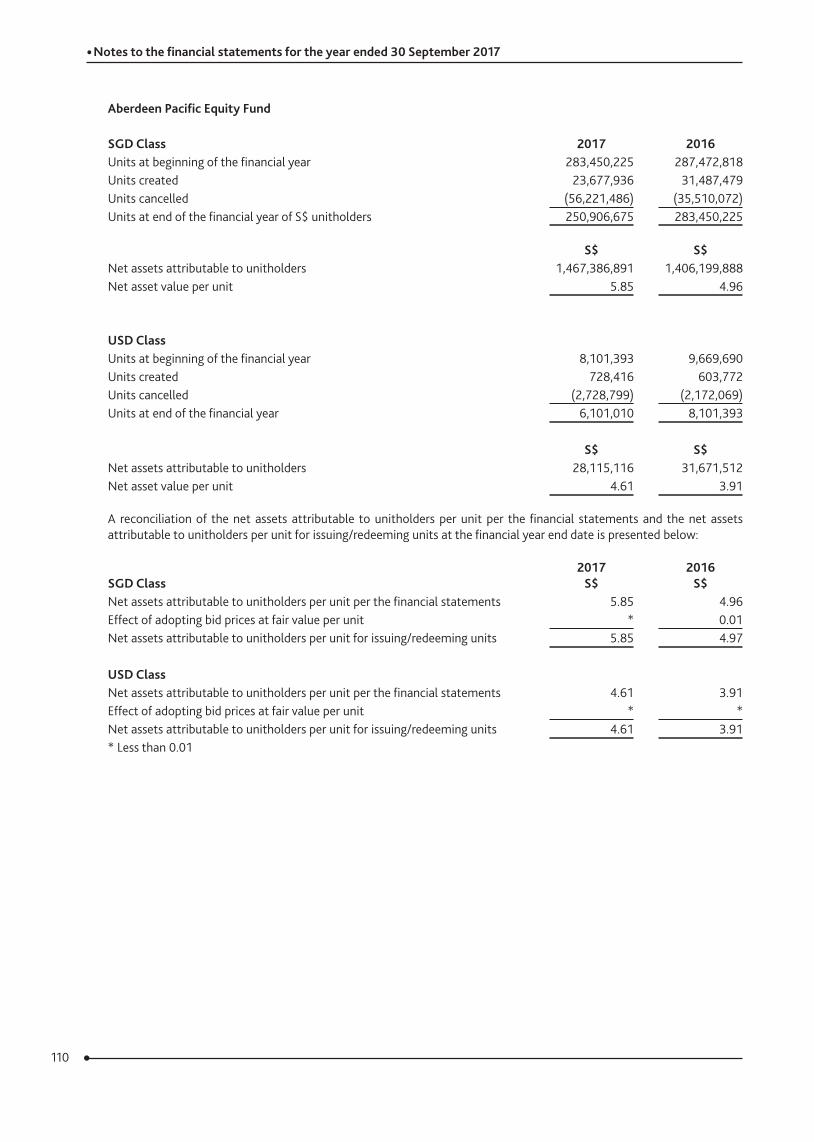
110
• Notes to the financial statements for the year ended 30 September 2017
Aberdeen Pacific Equity Fund
SGD Class 2017 2016Units at beginning of the financial year 283,450,225 287,472,818Units created 23,677,936 31,487,479Units cancelled (56,221,486) (35,510,072)Units at end of the financial year of S$ unitholders 250,906,675 283,450,225
S$ S$Net assets attributable to unitholders 1,467,386,891 1,406,199,888Net asset value per unit 5.85 4.96
USD ClassUnits at beginning of the financial year 8,101,393 9,669,690Units created 728,416 603,772Units cancelled (2,728,799) (2,172,069)Units at end of the financial year 6,101,010 8,101,393
S$ S$Net assets attributable to unitholders 28,115,116 31,671,512Net asset value per unit 4.61 3.91
A reconciliation of the net assets attributable to unitholders per unit per the financial statements and the net assets attributable to unitholders per unit for issuing/redeeming units at the financial year end date is presented below:
SGD Class2017
S$2016
S$Net assets attributable to unitholders per unit per the financial statements 5.85 4.96Effect of adopting bid prices at fair value per unit * 0.01Net assets attributable to unitholders per unit for issuing/redeeming units 5.85 4.97
USD ClassNet assets attributable to unitholders per unit per the financial statements 4.61 3.91Effect of adopting bid prices at fair value per unit * *Net assets attributable to unitholders per unit for issuing/redeeming units 4.61 3.91* Less than 0.01
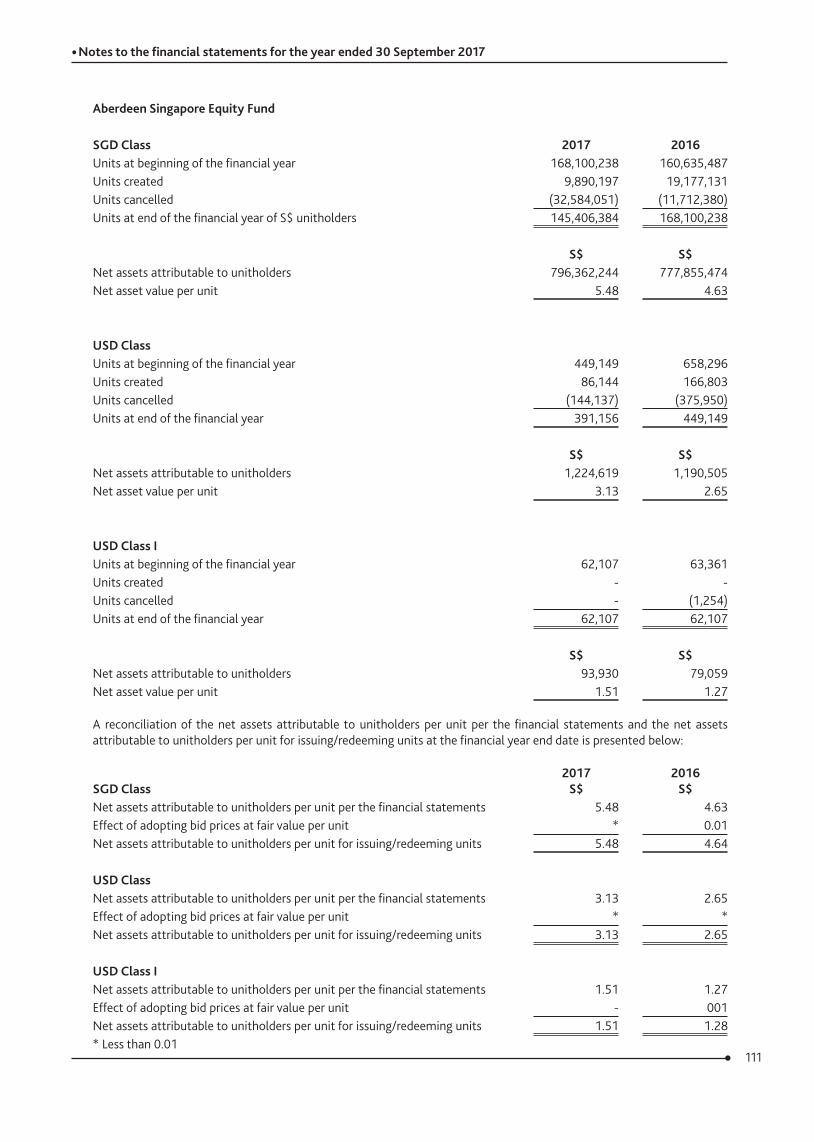
111
• Notes to the financial statements for the year ended 30 September 2017
Aberdeen Singapore Equity Fund
SGD Class 2017 2016Units at beginning of the financial year 168,100,238 160,635,487Units created 9,890,197 19,177,131Units cancelled (32,584,051) (11,712,380)Units at end of the financial year of S$ unitholders 145,406,384 168,100,238
S$ S$Net assets attributable to unitholders 796,362,244 777,855,474Net asset value per unit 5.48 4.63
USD ClassUnits at beginning of the financial year 449,149 658,296Units created 86,144 166,803Units cancelled (144,137) (375,950)Units at end of the financial year 391,156 449,149
S$ S$Net assets attributable to unitholders 1,224,619 1,190,505Net asset value per unit 3.13 2.65
USD Class IUnits at beginning of the financial year 62,107 63,361Units created - -Units cancelled - (1,254)Units at end of the financial year 62,107 62,107
S$ S$Net assets attributable to unitholders 93,930 79,059Net asset value per unit 1.51 1.27
A reconciliation of the net assets attributable to unitholders per unit per the financial statements and the net assets attributable to unitholders per unit for issuing/redeeming units at the financial year end date is presented below:
SGD Class2017
S$2016
S$Net assets attributable to unitholders per unit per the financial statements 5.48 4.63Effect of adopting bid prices at fair value per unit * 0.01Net assets attributable to unitholders per unit for issuing/redeeming units 5.48 4.64
USD ClassNet assets attributable to unitholders per unit per the financial statements 3.13 2.65Effect of adopting bid prices at fair value per unit * *Net assets attributable to unitholders per unit for issuing/redeeming units 3.13 2.65
USD Class INet assets attributable to unitholders per unit per the financial statements 1.51 1.27Effect of adopting bid prices at fair value per unit - 001Net assets attributable to unitholders per unit for issuing/redeeming units 1.51 1.28* Less than 0.01
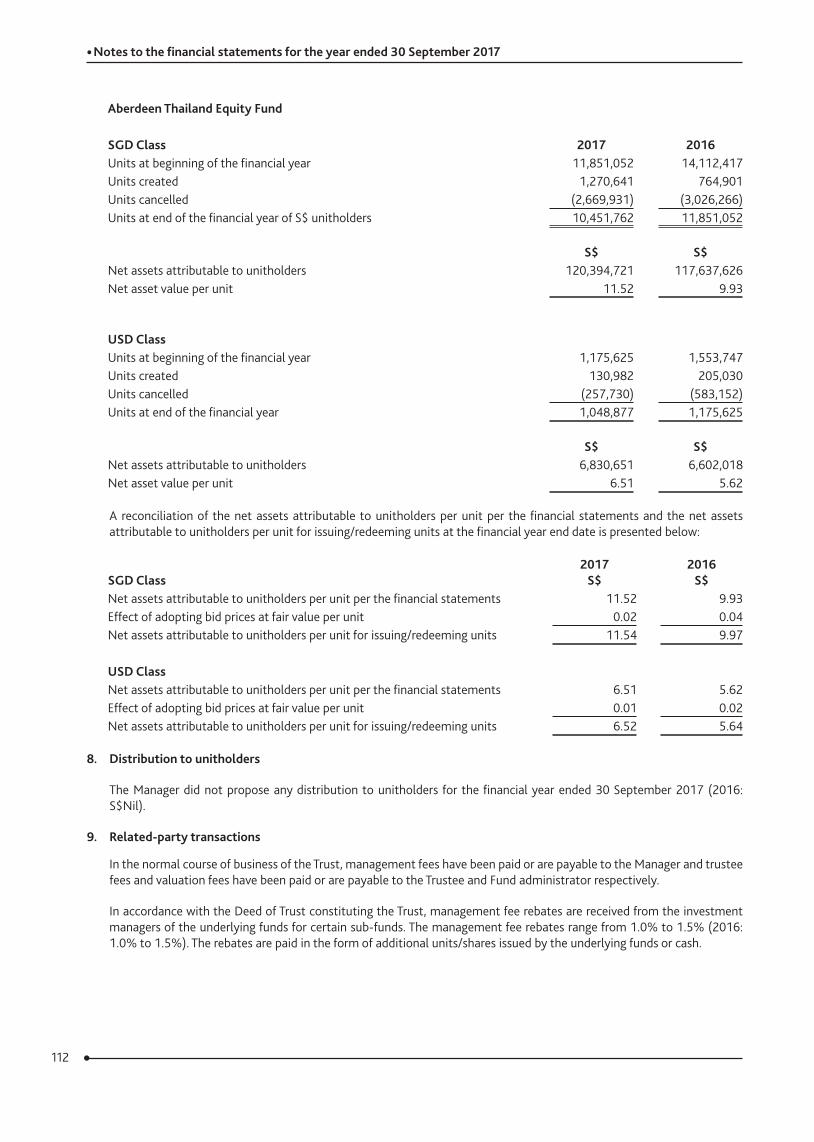
112
• Notes to the financial statements for the year ended 30 September 2017
Aberdeen Thailand Equity Fund
SGD Class 2017 2016Units at beginning of the financial year 11,851,052 14,112,417Units created 1,270,641 764,901Units cancelled (2,669,931) (3,026,266)Units at end of the financial year of S$ unitholders 10,451,762 11,851,052
S$ S$Net assets attributable to unitholders 120,394,721 117,637,626Net asset value per unit 11.52 9.93
USD ClassUnits at beginning of the financial year 1,175,625 1,553,747Units created 130,982 205,030Units cancelled (257,730) (583,152)Units at end of the financial year 1,048,877 1,175,625
S$ S$Net assets attributable to unitholders 6,830,651 6,602,018Net asset value per unit 6.51 5.62
A reconciliation of the net assets attributable to unitholders per unit per the financial statements and the net assets attributable to unitholders per unit for issuing/redeeming units at the financial year end date is presented below:
SGD Class2017
S$2016
S$Net assets attributable to unitholders per unit per the financial statements 11.52 9.93Effect of adopting bid prices at fair value per unit 0.02 0.04Net assets attributable to unitholders per unit for issuing/redeeming units 11.54 9.97
USD ClassNet assets attributable to unitholders per unit per the financial statements 6.51 5.62Effect of adopting bid prices at fair value per unit 0.01 0.02Net assets attributable to unitholders per unit for issuing/redeeming units 6.52 5.64
8. Distribution to unitholders
The Manager did not propose any distribution to unitholders for the financial year ended 30 September 2017 (2016: S$Nil).
9. Related‑party transactions
In the normal course of business of the Trust, management fees have been paid or are payable to the Manager and trustee fees and valuation fees have been paid or are payable to the Trustee and Fund administrator respectively.
In accordance with the Deed of Trust constituting the Trust, management fee rebates are received from the investment managers of the underlying funds for certain sub-funds. The management fee rebates range from 1.0% to 1.5% (2016: 1.0% to 1.5%). The rebates are paid in the form of additional units/shares issued by the underlying funds or cash.
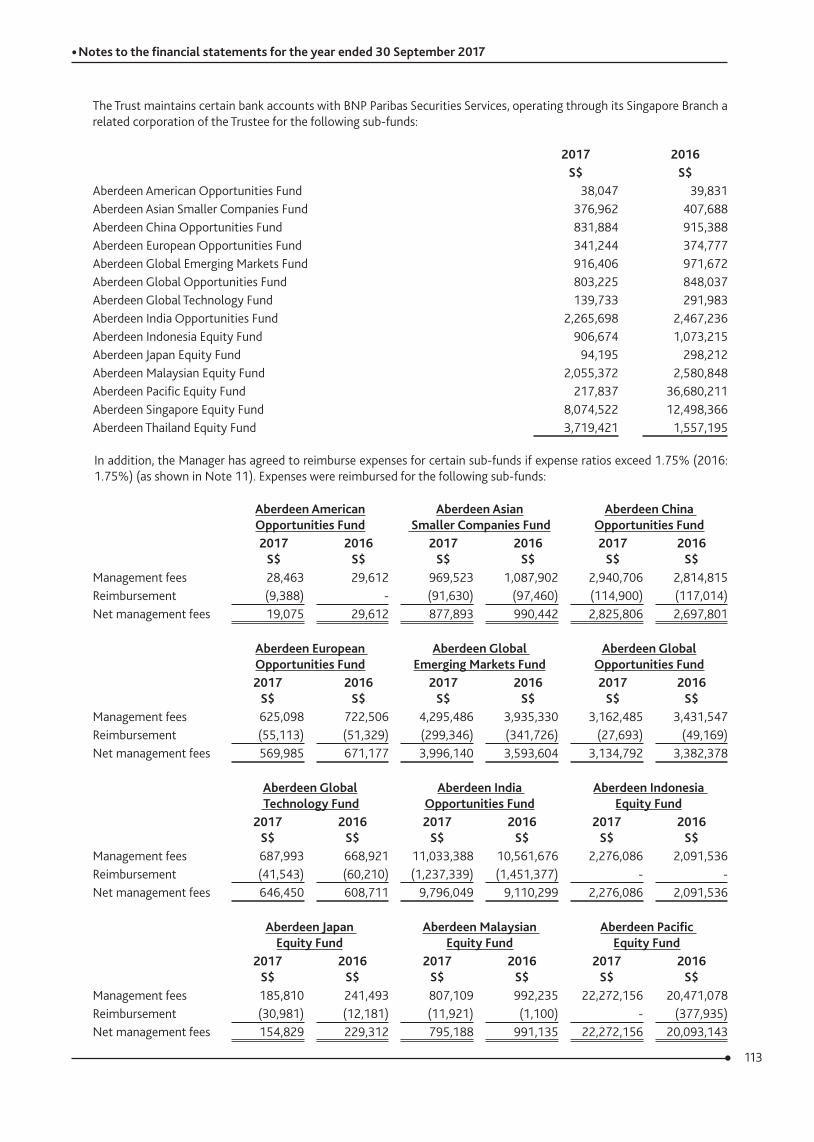
113
• Notes to the financial statements for the year ended 30 September 2017
The Trust maintains certain bank accounts with BNP Paribas Securities Services, operating through its Singapore Branch a related corporation of the Trustee for the following sub-funds:
2017 2016S$ S$
Aberdeen American Opportunities Fund 38,047 39,831Aberdeen Asian Smaller Companies Fund 376,962 407,688Aberdeen China Opportunities Fund 831,884 915,388Aberdeen European Opportunities Fund 341,244 374,777Aberdeen Global Emerging Markets Fund 916,406 971,672Aberdeen Global Opportunities Fund 803,225 848,037Aberdeen Global Technology Fund 139,733 291,983Aberdeen India Opportunities Fund 2,265,698 2,467,236Aberdeen Indonesia Equity Fund 906,674 1,073,215Aberdeen Japan Equity Fund 94,195 298,212Aberdeen Malaysian Equity Fund 2,055,372 2,580,848Aberdeen Pacific Equity Fund 217,837 36,680,211Aberdeen Singapore Equity Fund 8,074,522 12,498,366Aberdeen Thailand Equity Fund 3,719,421 1,557,195
In addition, the Manager has agreed to reimburse expenses for certain sub-funds if expense ratios exceed 1.75% (2016: 1.75%) (as shown in Note 11). Expenses were reimbursed for the following sub-funds:
Aberdeen American Opportunities Fund
Aberdeen Asian Smaller Companies Fund
Aberdeen China Opportunities Fund
2017S$
2016S$
2017S$
2016S$
2017S$
2016S$
Management fees 28,463 29,612 969,523 1,087,902 2,940,706 2,814,815Reimbursement (9,388) - (91,630) (97,460) (114,900) (117,014)Net management fees 19,075 29,612 877,893 990,442 2,825,806 2,697,801
Aberdeen European Opportunities Fund
Aberdeen Global Emerging Markets Fund
Aberdeen Global Opportunities Fund
2017S$
2016S$
2017S$
2016S$
2017S$
2016S$
Management fees 625,098 722,506 4,295,486 3,935,330 3,162,485 3,431,547Reimbursement (55,113) (51,329) (299,346) (341,726) (27,693) (49,169)Net management fees 569,985 671,177 3,996,140 3,593,604 3,134,792 3,382,378
Aberdeen Global Technology Fund
Aberdeen India Opportunities Fund
Aberdeen Indonesia Equity Fund
2017S$
2016S$
2017S$
2016S$
2017S$
2016S$
Management fees 687,993 668,921 11,033,388 10,561,676 2,276,086 2,091,536Reimbursement (41,543) (60,210) (1,237,339) (1,451,377) - -Net management fees 646,450 608,711 9,796,049 9,110,299 2,276,086 2,091,536
Aberdeen Japan Equity Fund
Aberdeen Malaysian Equity Fund
Aberdeen Pacific Equity Fund
2017S$
2016S$
2017S$
2016S$
2017S$
2016S$
Management fees 185,810 241,493 807,109 992,235 22,272,156 20,471,078Reimbursement (30,981) (12,181) (11,921) (1,100) - (377,935)Net management fees 154,829 229,312 795,188 991,135 22,272,156 20,093,143
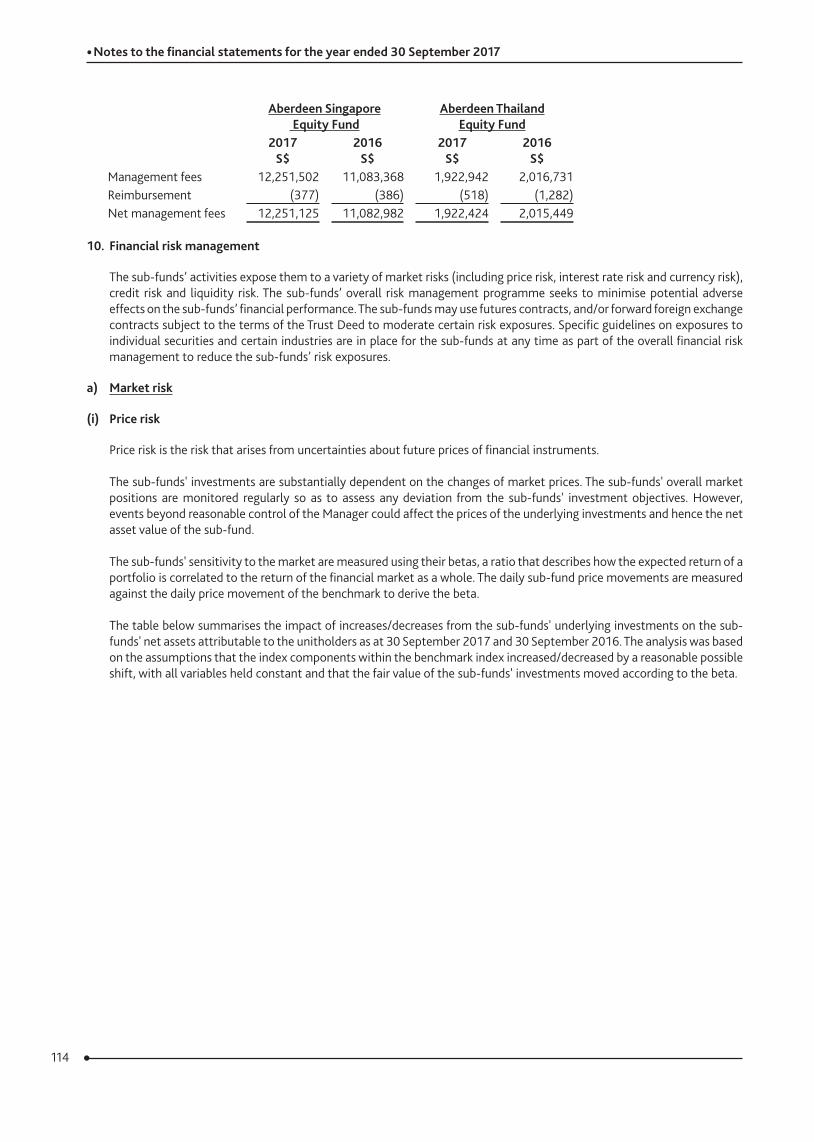
114
• Notes to the financial statements for the year ended 30 September 2017
Aberdeen Singapore Equity Fund
Aberdeen Thailand Equity Fund
2017S$
2016S$
2017S$
2016S$
Management fees 12,251,502 11,083,368 1,922,942 2,016,731Reimbursement (377) (386) (518) (1,282)Net management fees 12,251,125 11,082,982 1,922,424 2,015,449
10. Financial risk management
The sub-funds’ activities expose them to a variety of market risks (including price risk, interest rate risk and currency risk), credit risk and liquidity risk. The sub-funds’ overall risk management programme seeks to minimise potential adverse effects on the sub-funds’ financial performance. The sub-funds may use futures contracts, and/or forward foreign exchange contracts subject to the terms of the Trust Deed to moderate certain risk exposures. Specific guidelines on exposures to individual securities and certain industries are in place for the sub-funds at any time as part of the overall financial risk management to reduce the sub-funds’ risk exposures.
a) Market risk
(i) Price risk
Price risk is the risk that arises from uncertainties about future prices of financial instruments.
The sub-funds' investments are substantially dependent on the changes of market prices. The sub-funds' overall market positions are monitored regularly so as to assess any deviation from the sub-funds' investment objectives. However, events beyond reasonable control of the Manager could affect the prices of the underlying investments and hence the net asset value of the sub-fund.
The sub-funds' sensitivity to the market are measured using their betas, a ratio that describes how the expected return of a portfolio is correlated to the return of the financial market as a whole. The daily sub-fund price movements are measured against the daily price movement of the benchmark to derive the beta.
The table below summarises the impact of increases/decreases from the sub-funds' underlying investments on the sub-funds' net assets attributable to the unitholders as at 30 September 2017 and 30 September 2016. The analysis was based on the assumptions that the index components within the benchmark index increased/decreased by a reasonable possible shift, with all variables held constant and that the fair value of the sub-funds' investments moved according to the beta.
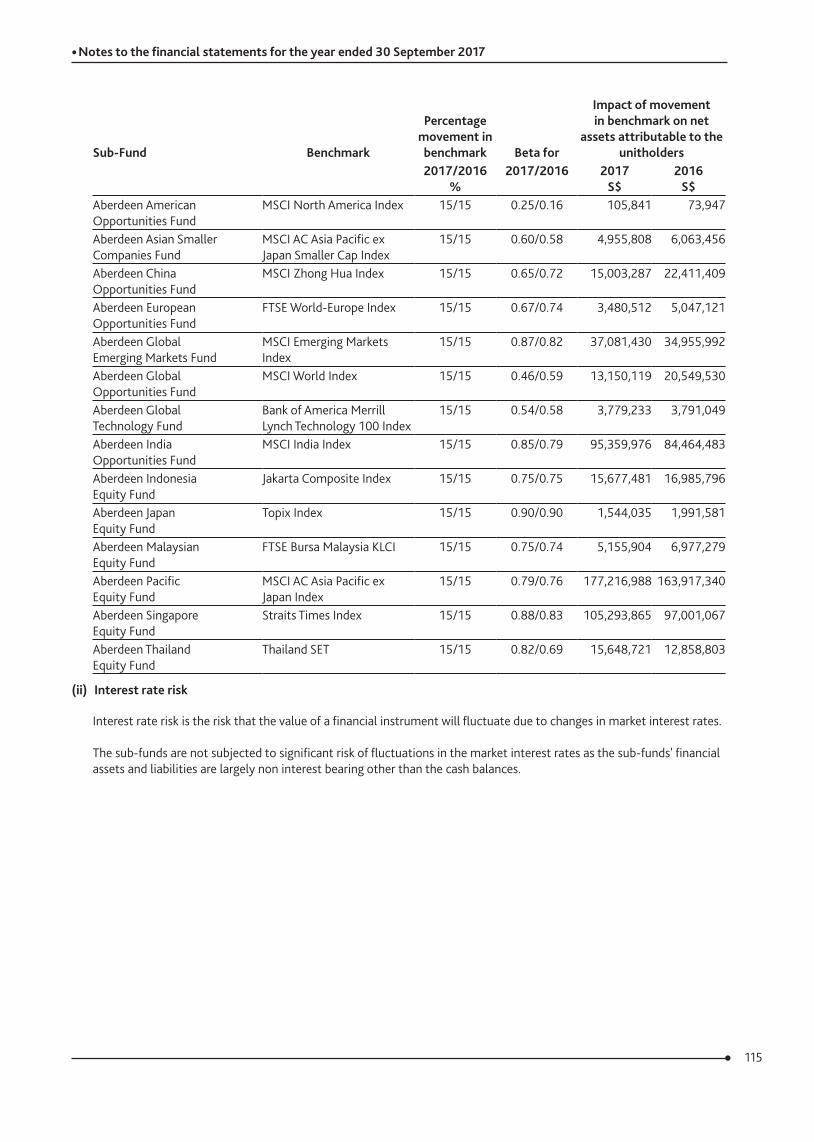
115
• Notes to the financial statements for the year ended 30 September 2017
Sub‑Fund Benchmark
Percentage movement in benchmark Beta for
Impact of movement in benchmark on net
assets attributable to the unitholders
2017/2016%
2017/2016 2017S$
2016S$
Aberdeen American Opportunities Fund
MSCI North America Index 15/15 0.25/0.16 105,841 73,947
Aberdeen Asian Smaller Companies Fund
MSCI AC Asia Pacific ex Japan Smaller Cap Index
15/15 0.60/0.58 4,955,808 6,063,456
Aberdeen China Opportunities Fund
MSCI Zhong Hua Index 15/15 0.65/0.72 15,003,287 22,411,409
Aberdeen European Opportunities Fund
FTSE World-Europe Index 15/15 0.67/0.74 3,480,512 5,047,121
Aberdeen Global Emerging Markets Fund
MSCI Emerging Markets Index
15/15 0.87/0.82 37,081,430 34,955,992
Aberdeen Global Opportunities Fund
MSCI World Index 15/15 0.46/0.59 13,150,119 20,549,530
Aberdeen Global Technology Fund
Bank of America Merrill Lynch Technology 100 Index
15/15 0.54/0.58 3,779,233 3,791,049
Aberdeen India Opportunities Fund
MSCI India Index 15/15 0.85/0.79 95,359,976 84,464,483
Aberdeen Indonesia Equity Fund
Jakarta Composite Index 15/15 0.75/0.75 15,677,481 16,985,796
Aberdeen Japan Equity Fund
Topix Index 15/15 0.90/0.90 1,544,035 1,991,581
Aberdeen Malaysian Equity Fund
FTSE Bursa Malaysia KLCI 15/15 0.75/0.74 5,155,904 6,977,279
Aberdeen Pacific Equity Fund
MSCI AC Asia Pacific ex Japan Index
15/15 0.79/0.76 177,216,988 163,917,340
Aberdeen Singapore Equity Fund
Straits Times Index 15/15 0.88/0.83 105,293,865 97,001,067
Aberdeen Thailand Equity Fund
Thailand SET 15/15 0.82/0.69 15,648,721 12,858,803
(ii) Interest rate risk
Interest rate risk is the risk that the value of a financial instrument will fluctuate due to changes in market interest rates.
The sub-funds are not subjected to significant risk of fluctuations in the market interest rates as the sub-funds' financial assets and liabilities are largely non interest bearing other than the cash balances.
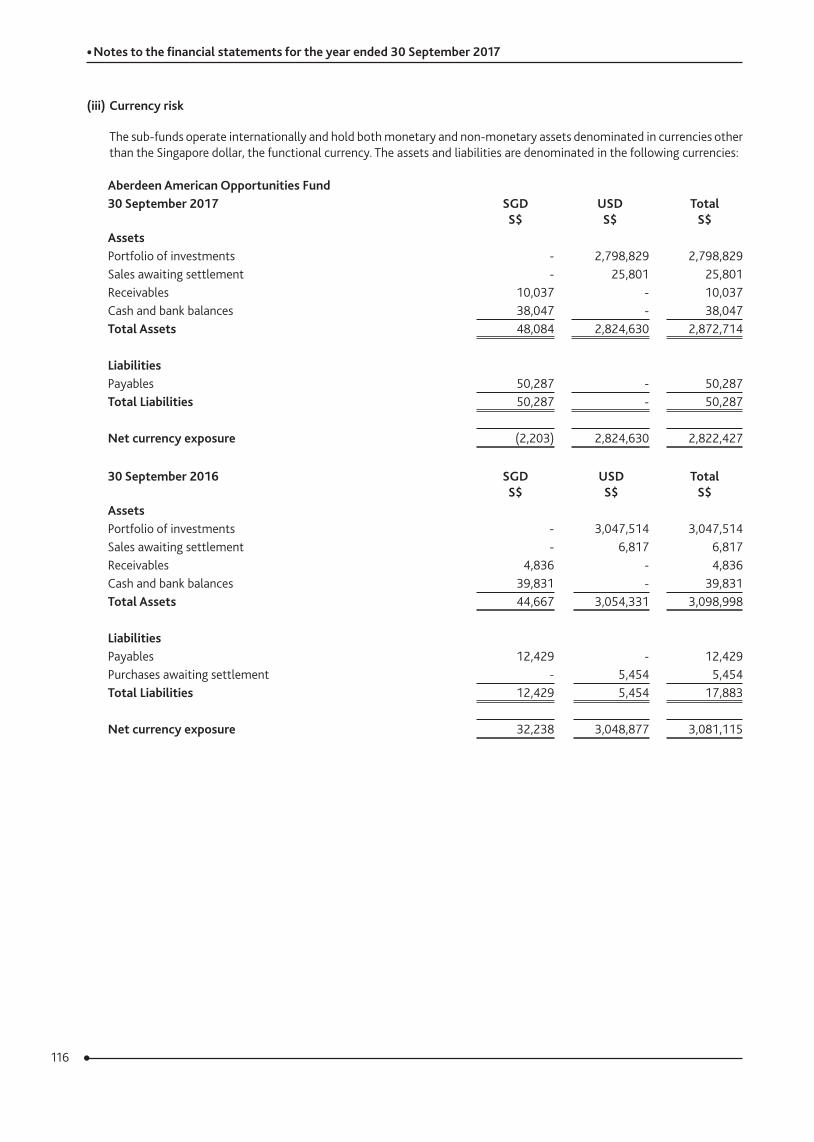
116
• Notes to the financial statements for the year ended 30 September 2017
(iii) Currency risk
The sub-funds operate internationally and hold both monetary and non-monetary assets denominated in currencies other than the Singapore dollar, the functional currency. The assets and liabilities are denominated in the following currencies:
Aberdeen American Opportunities Fund30 September 2017 SGD
S$USDS$
TotalS$
AssetsPortfolio of investments - 2,798,829 2,798,829Sales awaiting settlement - 25,801 25,801Receivables 10,037 - 10,037Cash and bank balances 38,047 - 38,047Total Assets 48,084 2,824,630 2,872,714
LiabilitiesPayables 50,287 - 50,287Total Liabilities 50,287 - 50,287
Net currency exposure (2,203) 2,824,630 2,822,427
30 September 2016 SGDS$
USDS$
TotalS$
AssetsPortfolio of investments - 3,047,514 3,047,514Sales awaiting settlement - 6,817 6,817Receivables 4,836 - 4,836Cash and bank balances 39,831 - 39,831Total Assets 44,667 3,054,331 3,098,998
LiabilitiesPayables 12,429 - 12,429Purchases awaiting settlement - 5,454 5,454Total Liabilities 12,429 5,454 17,883
Net currency exposure 32,238 3,048,877 3,081,115

117
• Notes to the financial statements for the year ended 30 September 2017
Aberdeen Asian Smaller Companies Fund30 September 2017 SGD
S$USDS$
TotalS$
AssetsPortfolio of investments - 54,904,682 54,904,682Sales awaiting settlement - 308,251 308,251Receivables 155,403 - 155,403Cash and bank balances 368,700 8,262 376,962Total Assets 524,103 55,221,195 55,745,298
LiabilitiesPayables 602,357 26,806 629,163Purchases awaiting settlement - 51,601 51,601Total Liabilities 602,357 78,407 680,764
Net currency exposure (78,254) 55,142,788 55,064,534
30 September 2016 SGDS$
USDS$
TotalS$
AssetsPortfolio of investments - 69,294,150 69,294,150Sales awaiting settlement - 244,058 244,058Receivables 133,195 - 133,195Cash and bank balances 407,688 - 407,688Total Assets 540,883 69,538,208 70,079,091
LiabilitiesPayables 324,745 18,540 343,285Purchases awaiting settlement - 40,904 40,904Total Liabilities 324,745 59,444 384,189
Net currency exposure 216,138 69,478,764 69,694,902
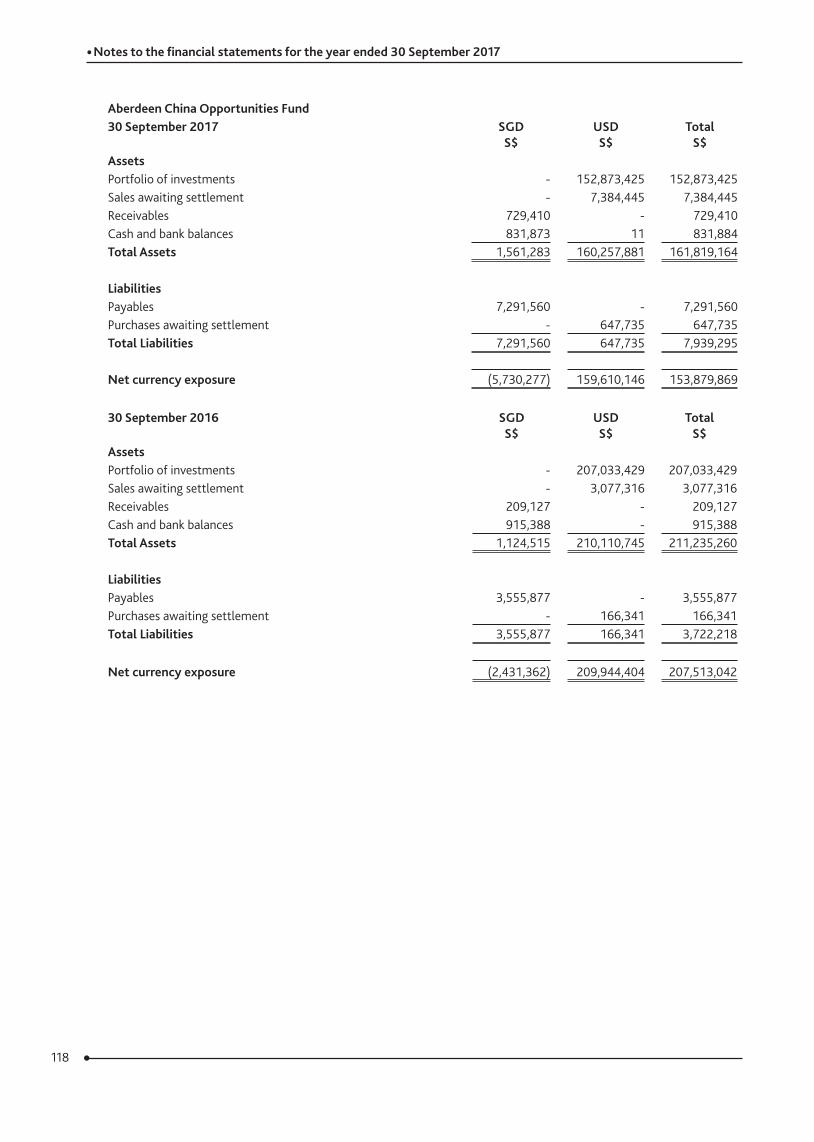
118
• Notes to the financial statements for the year ended 30 September 2017
Aberdeen China Opportunities Fund30 September 2017 SGD
S$USDS$
TotalS$
AssetsPortfolio of investments - 152,873,425 152,873,425Sales awaiting settlement - 7,384,445 7,384,445Receivables 729,410 - 729,410Cash and bank balances 831,873 11 831,884Total Assets 1,561,283 160,257,881 161,819,164
LiabilitiesPayables 7,291,560 - 7,291,560Purchases awaiting settlement - 647,735 647,735Total Liabilities 7,291,560 647,735 7,939,295
Net currency exposure (5,730,277) 159,610,146 153,879,869
30 September 2016 SGDS$
USDS$
TotalS$
AssetsPortfolio of investments - 207,033,429 207,033,429Sales awaiting settlement - 3,077,316 3,077,316Receivables 209,127 - 209,127Cash and bank balances 915,388 - 915,388Total Assets 1,124,515 210,110,745 211,235,260
LiabilitiesPayables 3,555,877 - 3,555,877Purchases awaiting settlement - 166,341 166,341Total Liabilities 3,555,877 166,341 3,722,218
Net currency exposure (2,431,362) 209,944,404 207,513,042
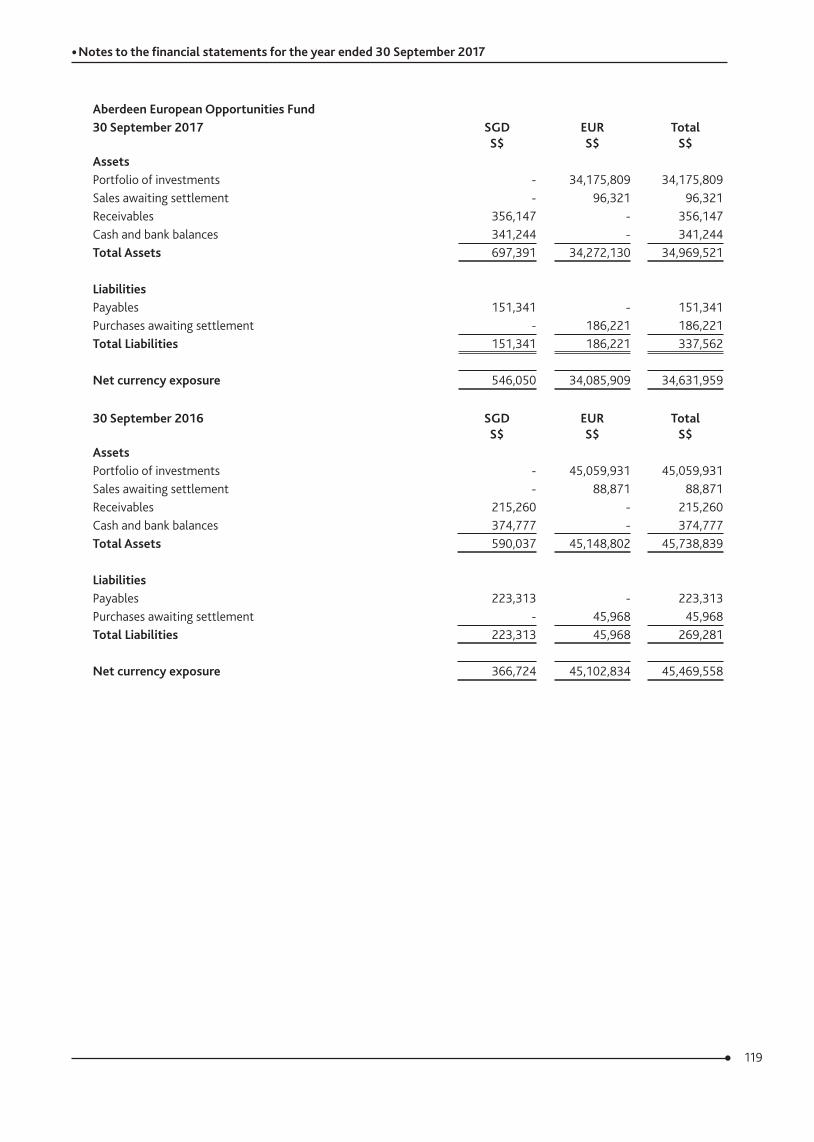
119
• Notes to the financial statements for the year ended 30 September 2017
Aberdeen European Opportunities Fund30 September 2017 SGD
S$EURS$
TotalS$
AssetsPortfolio of investments - 34,175,809 34,175,809Sales awaiting settlement - 96,321 96,321Receivables 356,147 - 356,147Cash and bank balances 341,244 - 341,244Total Assets 697,391 34,272,130 34,969,521
LiabilitiesPayables 151,341 - 151,341Purchases awaiting settlement - 186,221 186,221Total Liabilities 151,341 186,221 337,562
Net currency exposure 546,050 34,085,909 34,631,959
30 September 2016 SGDS$
EURS$
TotalS$
AssetsPortfolio of investments - 45,059,931 45,059,931Sales awaiting settlement - 88,871 88,871Receivables 215,260 - 215,260Cash and bank balances 374,777 - 374,777Total Assets 590,037 45,148,802 45,738,839
LiabilitiesPayables 223,313 - 223,313Purchases awaiting settlement - 45,968 45,968Total Liabilities 223,313 45,968 269,281
Net currency exposure 366,724 45,102,834 45,469,558
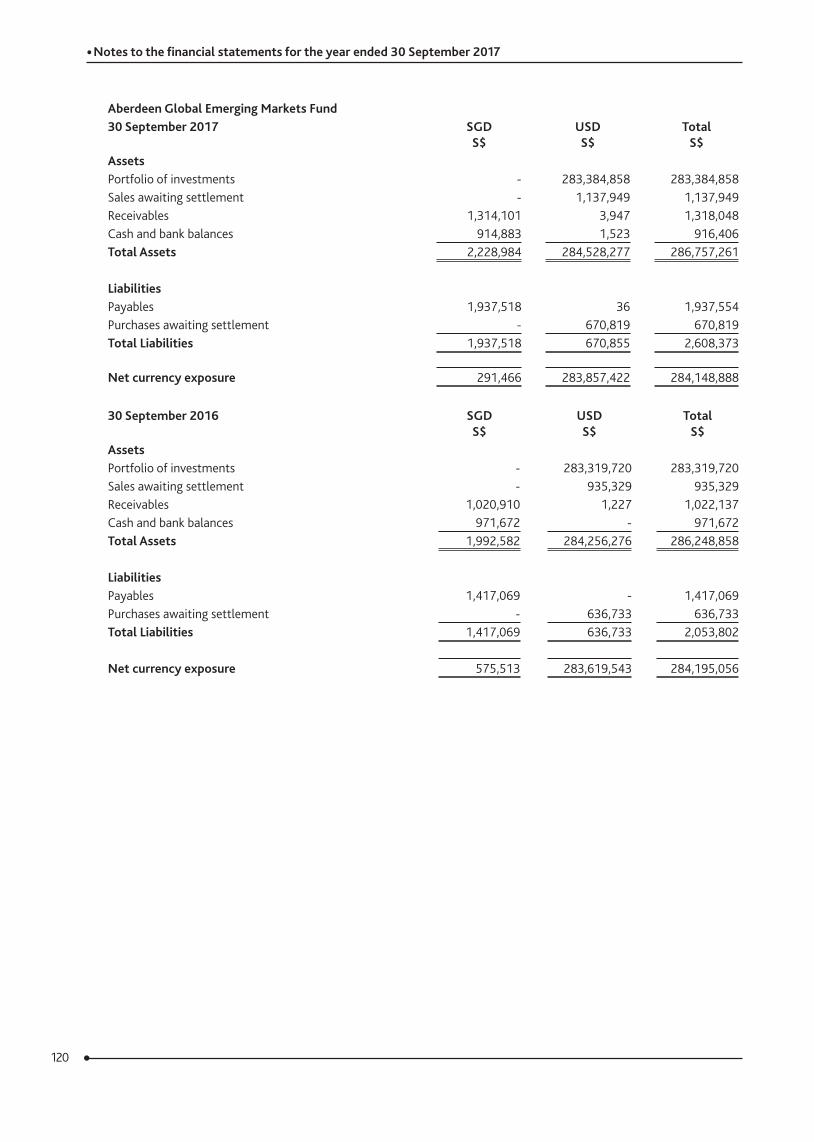
120
• Notes to the financial statements for the year ended 30 September 2017
Aberdeen Global Emerging Markets Fund30 September 2017 SGD
S$USDS$
TotalS$
AssetsPortfolio of investments - 283,384,858 283,384,858Sales awaiting settlement - 1,137,949 1,137,949Receivables 1,314,101 3,947 1,318,048Cash and bank balances 914,883 1,523 916,406Total Assets 2,228,984 284,528,277 286,757,261
LiabilitiesPayables 1,937,518 36 1,937,554Purchases awaiting settlement - 670,819 670,819Total Liabilities 1,937,518 670,855 2,608,373
Net currency exposure 291,466 283,857,422 284,148,888
30 September 2016 SGDS$
USDS$
TotalS$
AssetsPortfolio of investments - 283,319,720 283,319,720Sales awaiting settlement - 935,329 935,329Receivables 1,020,910 1,227 1,022,137Cash and bank balances 971,672 - 971,672Total Assets 1,992,582 284,256,276 286,248,858
LiabilitiesPayables 1,417,069 - 1,417,069Purchases awaiting settlement - 636,733 636,733Total Liabilities 1,417,069 636,733 2,053,802
Net currency exposure 575,513 283,619,543 284,195,056
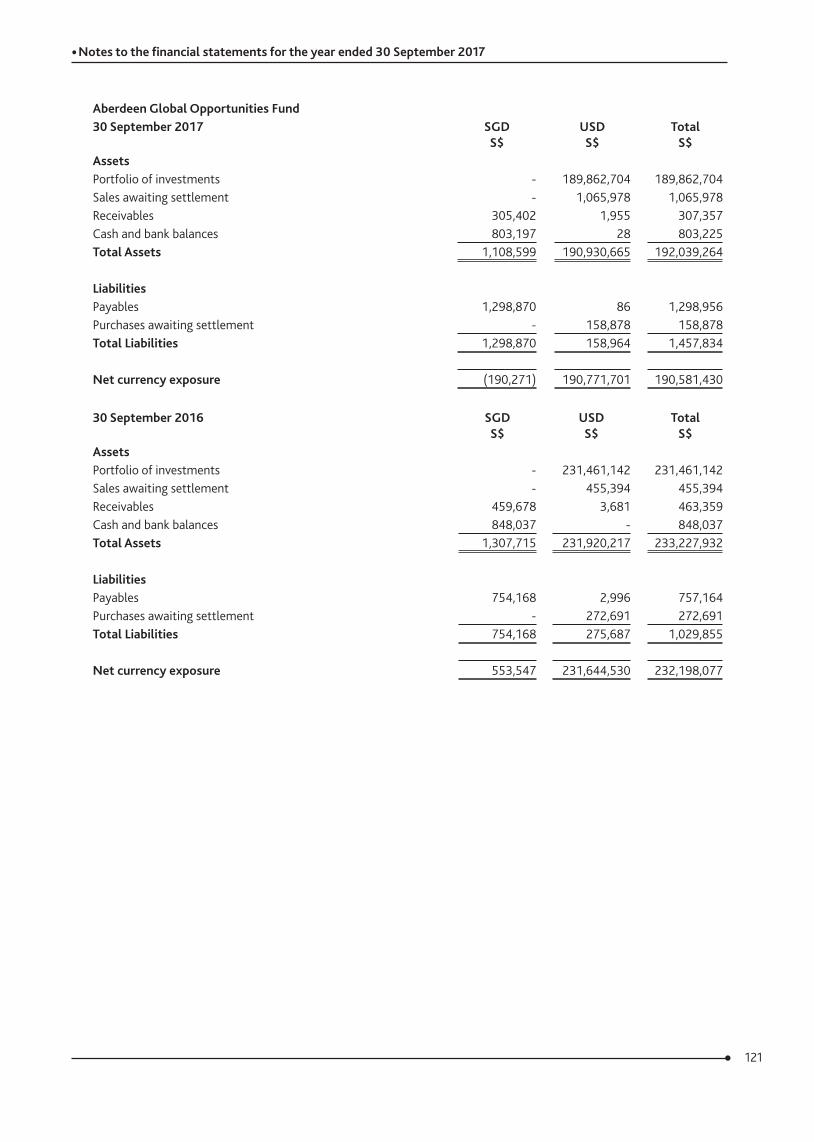
121
• Notes to the financial statements for the year ended 30 September 2017
Aberdeen Global Opportunities Fund30 September 2017 SGD
S$USDS$
TotalS$
AssetsPortfolio of investments - 189,862,704 189,862,704Sales awaiting settlement - 1,065,978 1,065,978Receivables 305,402 1,955 307,357Cash and bank balances 803,197 28 803,225Total Assets 1,108,599 190,930,665 192,039,264
LiabilitiesPayables 1,298,870 86 1,298,956Purchases awaiting settlement - 158,878 158,878Total Liabilities 1,298,870 158,964 1,457,834
Net currency exposure (190,271) 190,771,701 190,581,430
30 September 2016 SGDS$
USDS$
TotalS$
AssetsPortfolio of investments - 231,461,142 231,461,142Sales awaiting settlement - 455,394 455,394Receivables 459,678 3,681 463,359Cash and bank balances 848,037 - 848,037Total Assets 1,307,715 231,920,217 233,227,932
LiabilitiesPayables 754,168 2,996 757,164Purchases awaiting settlement - 272,691 272,691Total Liabilities 754,168 275,687 1,029,855
Net currency exposure 553,547 231,644,530 232,198,077
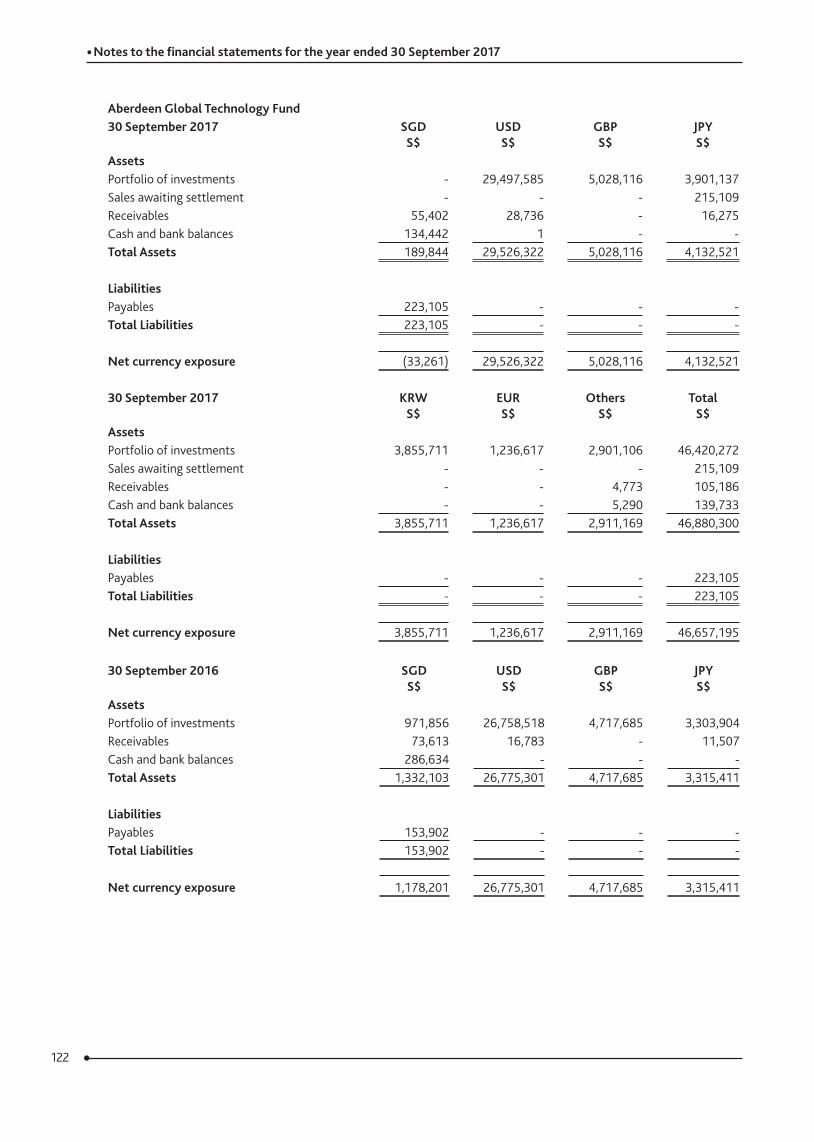
122
• Notes to the financial statements for the year ended 30 September 2017
Aberdeen Global Technology Fund30 September 2017 SGD
S$USDS$
GBPS$
JPYS$
AssetsPortfolio of investments - 29,497,585 5,028,116 3,901,137Sales awaiting settlement - - - 215,109Receivables 55,402 28,736 - 16,275Cash and bank balances 134,442 1 - -Total Assets 189,844 29,526,322 5,028,116 4,132,521
LiabilitiesPayables 223,105 - - -Total Liabilities 223,105 - - -
Net currency exposure (33,261) 29,526,322 5,028,116 4,132,521
30 September 2017 KRWS$
EURS$
OthersS$
TotalS$
AssetsPortfolio of investments 3,855,711 1,236,617 2,901,106 46,420,272Sales awaiting settlement - - - 215,109Receivables - - 4,773 105,186Cash and bank balances - - 5,290 139,733Total Assets 3,855,711 1,236,617 2,911,169 46,880,300
LiabilitiesPayables - - - 223,105Total Liabilities - - - 223,105
Net currency exposure 3,855,711 1,236,617 2,911,169 46,657,195
30 September 2016 SGDS$
USDS$
GBPS$
JPYS$
AssetsPortfolio of investments 971,856 26,758,518 4,717,685 3,303,904Receivables 73,613 16,783 - 11,507Cash and bank balances 286,634 - - -Total Assets 1,332,103 26,775,301 4,717,685 3,315,411
LiabilitiesPayables 153,902 - - -Total Liabilities 153,902 - - -
Net currency exposure 1,178,201 26,775,301 4,717,685 3,315,411
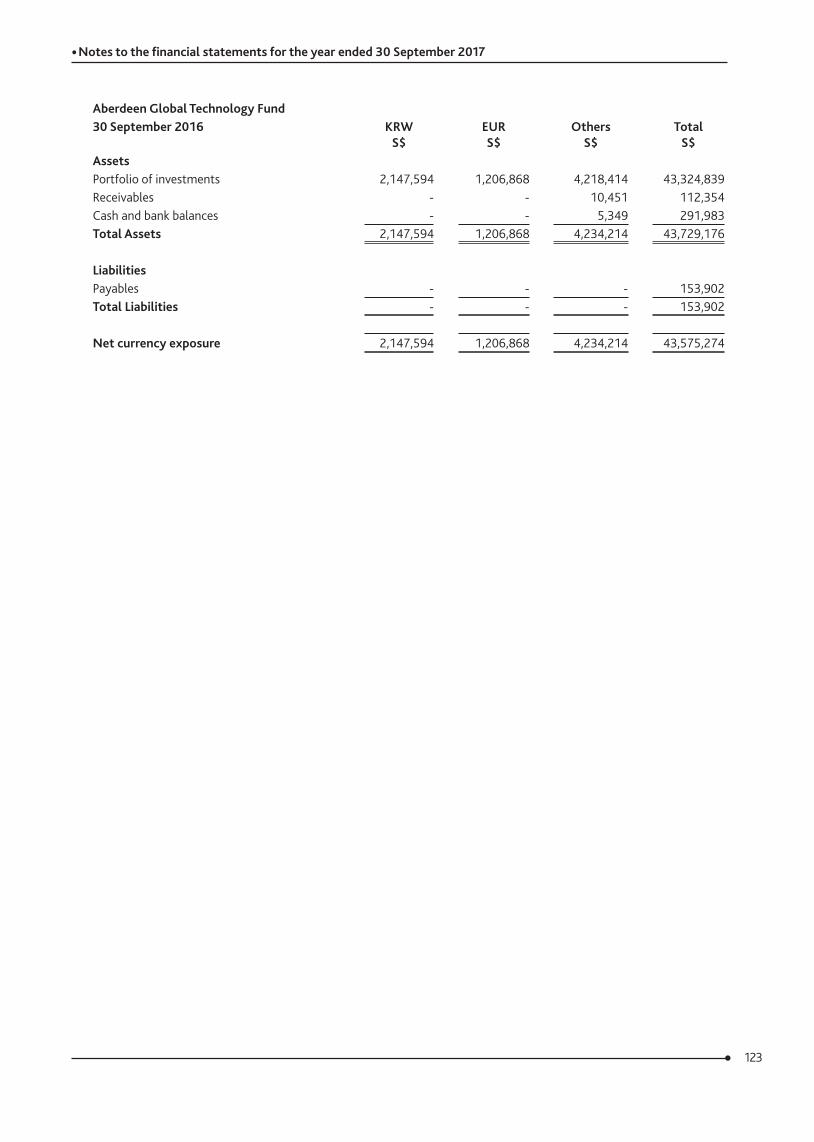
123
• Notes to the financial statements for the year ended 30 September 2017
Aberdeen Global Technology Fund30 September 2016 KRW
S$EURS$
OthersS$
TotalS$
AssetsPortfolio of investments 2,147,594 1,206,868 4,218,414 43,324,839Receivables - - 10,451 112,354Cash and bank balances - - 5,349 291,983Total Assets 2,147,594 1,206,868 4,234,214 43,729,176
LiabilitiesPayables - - - 153,902Total Liabilities - - - 153,902
Net currency exposure 2,147,594 1,206,868 4,234,214 43,575,274
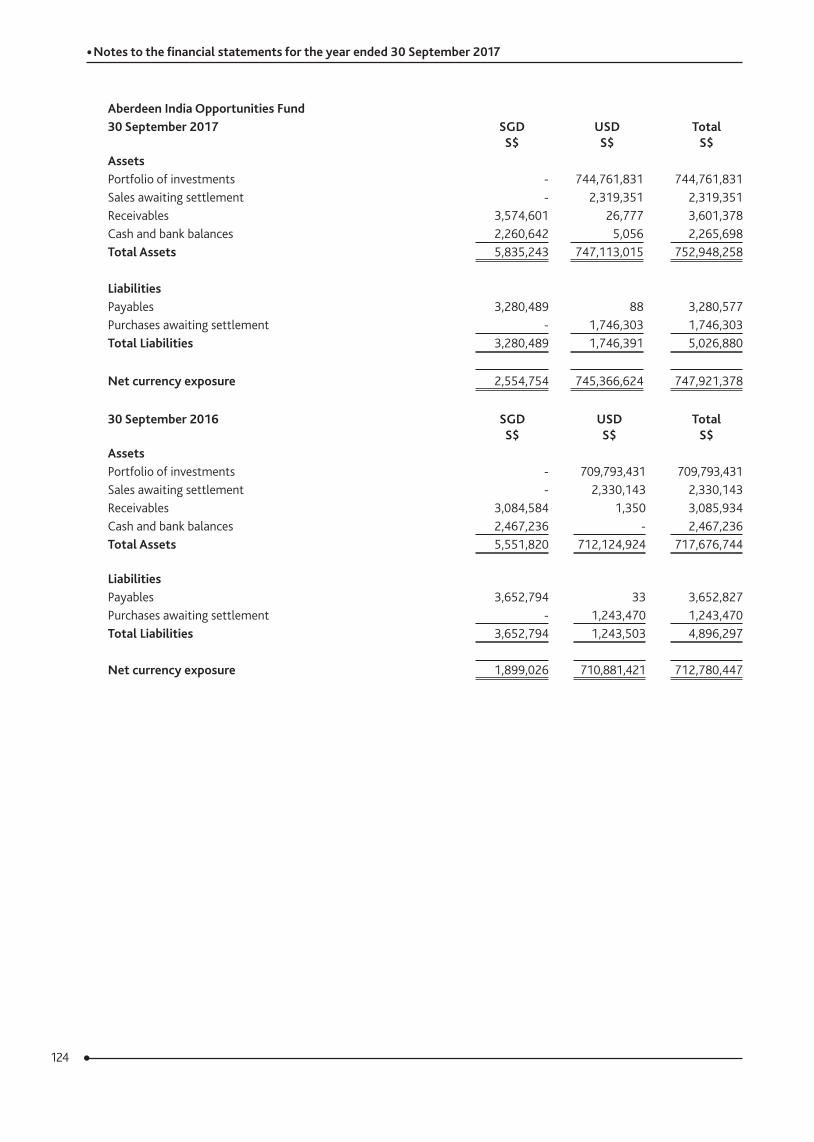
124
• Notes to the financial statements for the year ended 30 September 2017
Aberdeen India Opportunities Fund30 September 2017 SGD
S$USDS$
TotalS$
AssetsPortfolio of investments - 744,761,831 744,761,831Sales awaiting settlement - 2,319,351 2,319,351Receivables 3,574,601 26,777 3,601,378Cash and bank balances 2,260,642 5,056 2,265,698Total Assets 5,835,243 747,113,015 752,948,258
LiabilitiesPayables 3,280,489 88 3,280,577Purchases awaiting settlement - 1,746,303 1,746,303Total Liabilities 3,280,489 1,746,391 5,026,880
Net currency exposure 2,554,754 745,366,624 747,921,378
30 September 2016 SGDS$
USDS$
TotalS$
AssetsPortfolio of investments - 709,793,431 709,793,431Sales awaiting settlement - 2,330,143 2,330,143Receivables 3,084,584 1,350 3,085,934Cash and bank balances 2,467,236 - 2,467,236Total Assets 5,551,820 712,124,924 717,676,744
LiabilitiesPayables 3,652,794 33 3,652,827Purchases awaiting settlement - 1,243,470 1,243,470Total Liabilities 3,652,794 1,243,503 4,896,297
Net currency exposure 1,899,026 710,881,421 712,780,447
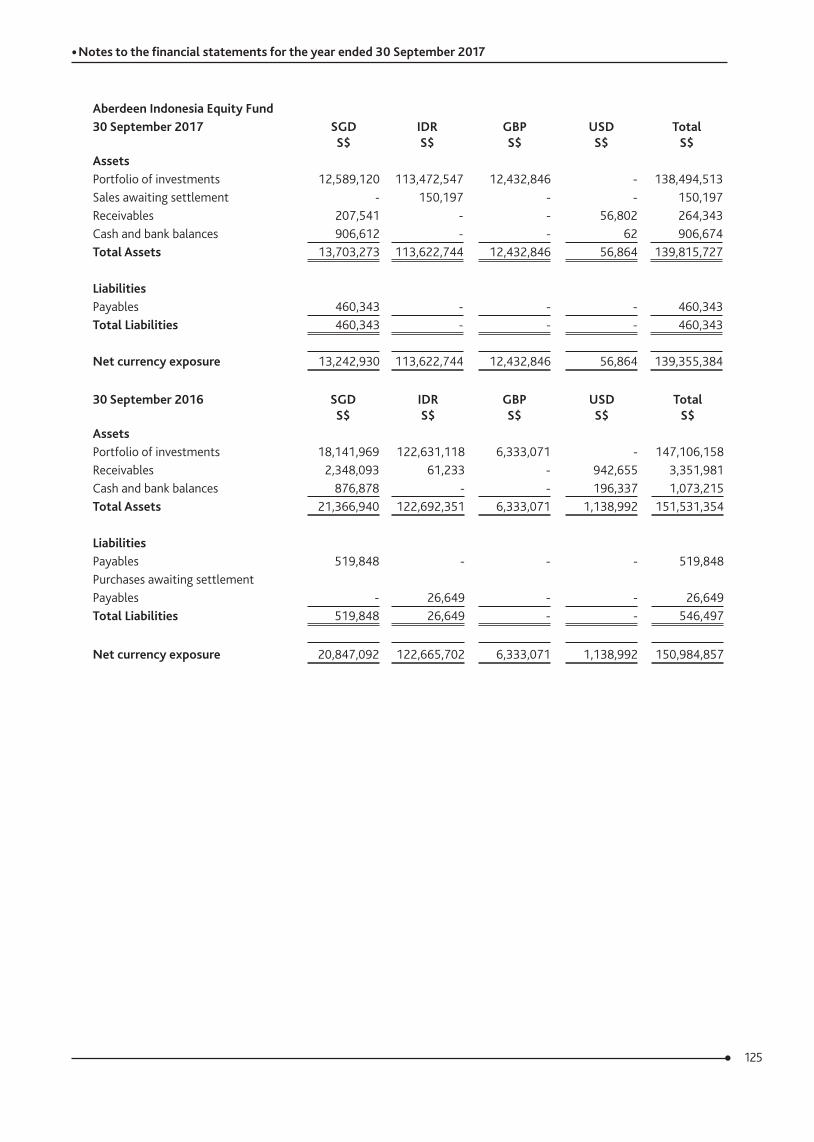
125
• Notes to the financial statements for the year ended 30 September 2017
Aberdeen Indonesia Equity Fund30 September 2017 SGD
S$IDRS$
GBPS$
USDS$
TotalS$
AssetsPortfolio of investments 12,589,120 113,472,547 12,432,846 - 138,494,513Sales awaiting settlement - 150,197 - - 150,197Receivables 207,541 - - 56,802 264,343Cash and bank balances 906,612 - - 62 906,674Total Assets 13,703,273 113,622,744 12,432,846 56,864 139,815,727
LiabilitiesPayables 460,343 - - - 460,343Total Liabilities 460,343 - - - 460,343
Net currency exposure 13,242,930 113,622,744 12,432,846 56,864 139,355,384
30 September 2016 SGDS$
IDRS$
GBPS$
USDS$
TotalS$
AssetsPortfolio of investments 18,141,969 122,631,118 6,333,071 - 147,106,158Receivables 2,348,093 61,233 - 942,655 3,351,981Cash and bank balances 876,878 - - 196,337 1,073,215Total Assets 21,366,940 122,692,351 6,333,071 1,138,992 151,531,354
LiabilitiesPayables 519,848 - - - 519,848Purchases awaiting settlementPayables - 26,649 - - 26,649Total Liabilities 519,848 26,649 - - 546,497
Net currency exposure 20,847,092 122,665,702 6,333,071 1,138,992 150,984,857
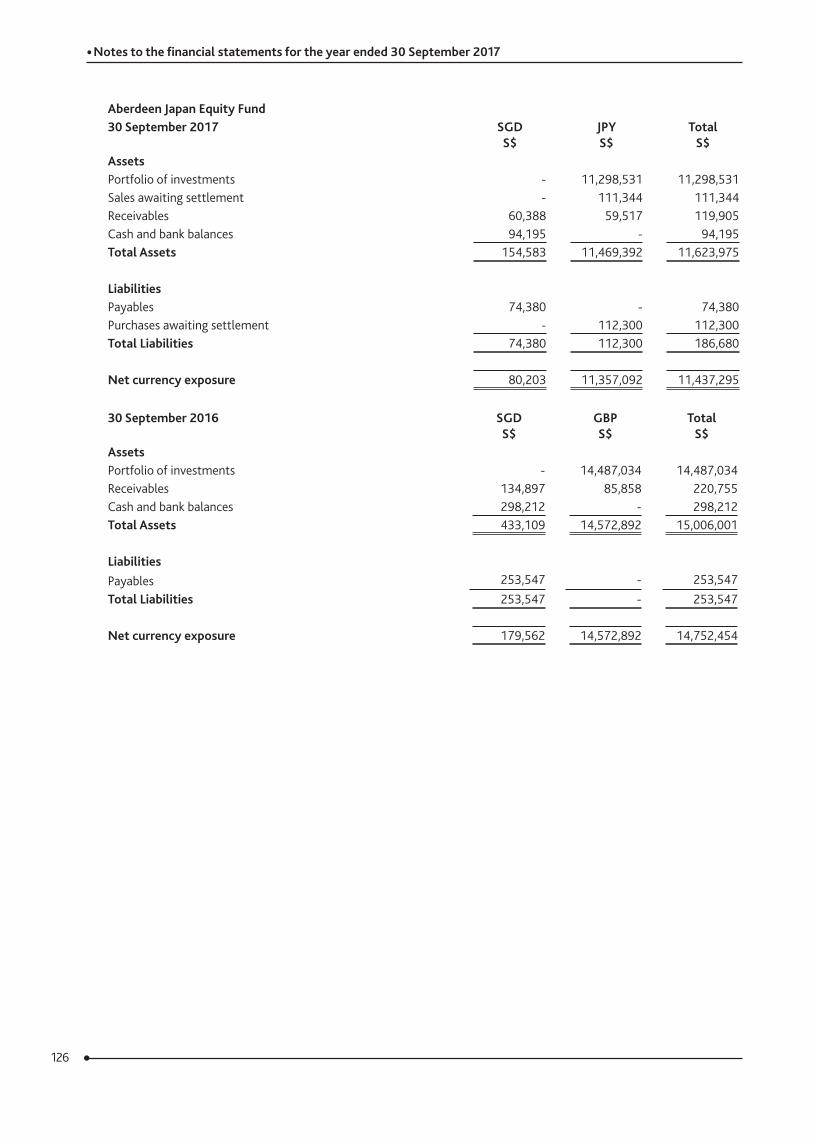
126
• Notes to the financial statements for the year ended 30 September 2017
Aberdeen Japan Equity Fund30 September 2017 SGD
S$JPYS$
TotalS$
AssetsPortfolio of investments - 11,298,531 11,298,531Sales awaiting settlement - 111,344 111,344Receivables 60,388 59,517 119,905Cash and bank balances 94,195 - 94,195Total Assets 154,583 11,469,392 11,623,975
LiabilitiesPayables 74,380 - 74,380Purchases awaiting settlement - 112,300 112,300Total Liabilities 74,380 112,300 186,680
Net currency exposure 80,203 11,357,092 11,437,295
30 September 2016 SGDS$
GBPS$
TotalS$
AssetsPortfolio of investments - 14,487,034 14,487,034Receivables 134,897 85,858 220,755Cash and bank balances 298,212 - 298,212Total Assets 433,109 14,572,892 15,006,001
LiabilitiesPayables 253,547 - 253,547Total Liabilities 253,547 - 253,547
Net currency exposure 179,562 14,572,892 14,752,454
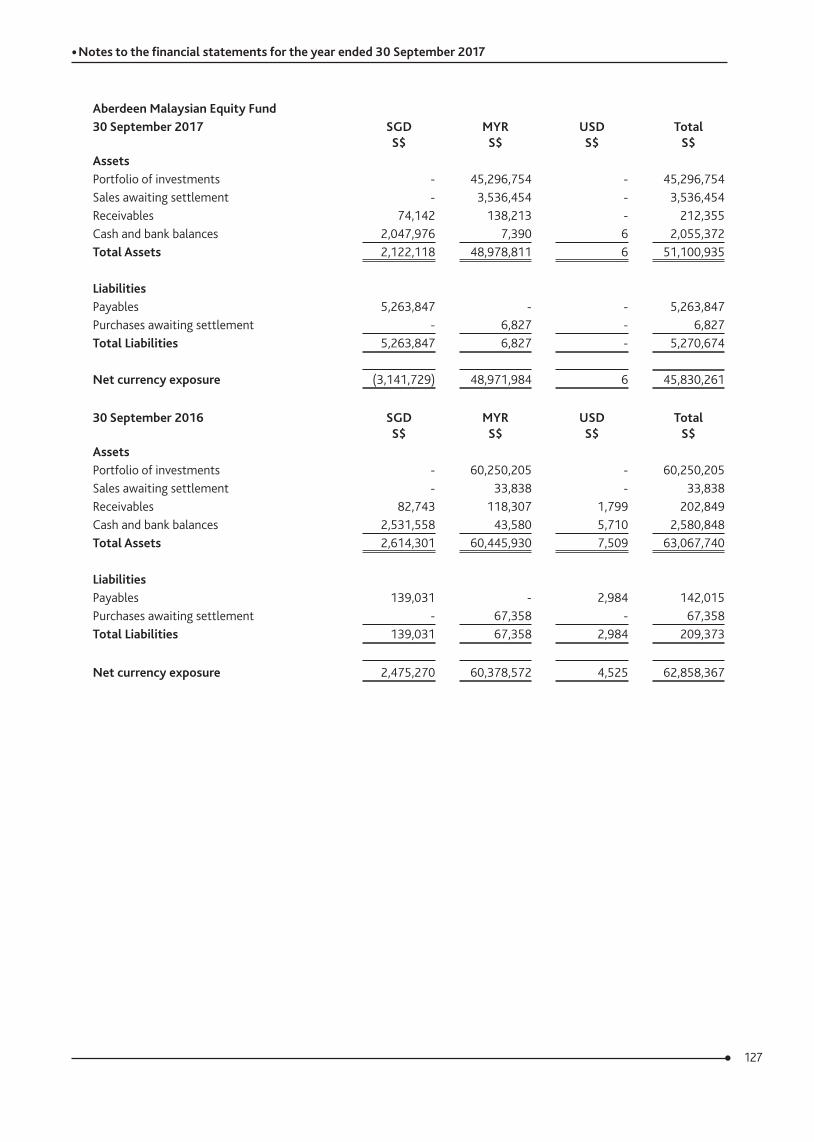
127
• Notes to the financial statements for the year ended 30 September 2017
Aberdeen Malaysian Equity Fund30 September 2017 SGD
S$MYR
S$USDS$
TotalS$
AssetsPortfolio of investments - 45,296,754 - 45,296,754Sales awaiting settlement - 3,536,454 - 3,536,454Receivables 74,142 138,213 - 212,355Cash and bank balances 2,047,976 7,390 6 2,055,372Total Assets 2,122,118 48,978,811 6 51,100,935
LiabilitiesPayables 5,263,847 - - 5,263,847Purchases awaiting settlement - 6,827 - 6,827Total Liabilities 5,263,847 6,827 - 5,270,674
Net currency exposure (3,141,729) 48,971,984 6 45,830,261
30 September 2016 SGDS$
MYRS$
USDS$
TotalS$
AssetsPortfolio of investments - 60,250,205 - 60,250,205Sales awaiting settlement - 33,838 - 33,838Receivables 82,743 118,307 1,799 202,849Cash and bank balances 2,531,558 43,580 5,710 2,580,848Total Assets 2,614,301 60,445,930 7,509 63,067,740
LiabilitiesPayables 139,031 - 2,984 142,015Purchases awaiting settlement - 67,358 - 67,358Total Liabilities 139,031 67,358 2,984 209,373
Net currency exposure 2,475,270 60,378,572 4,525 62,858,367
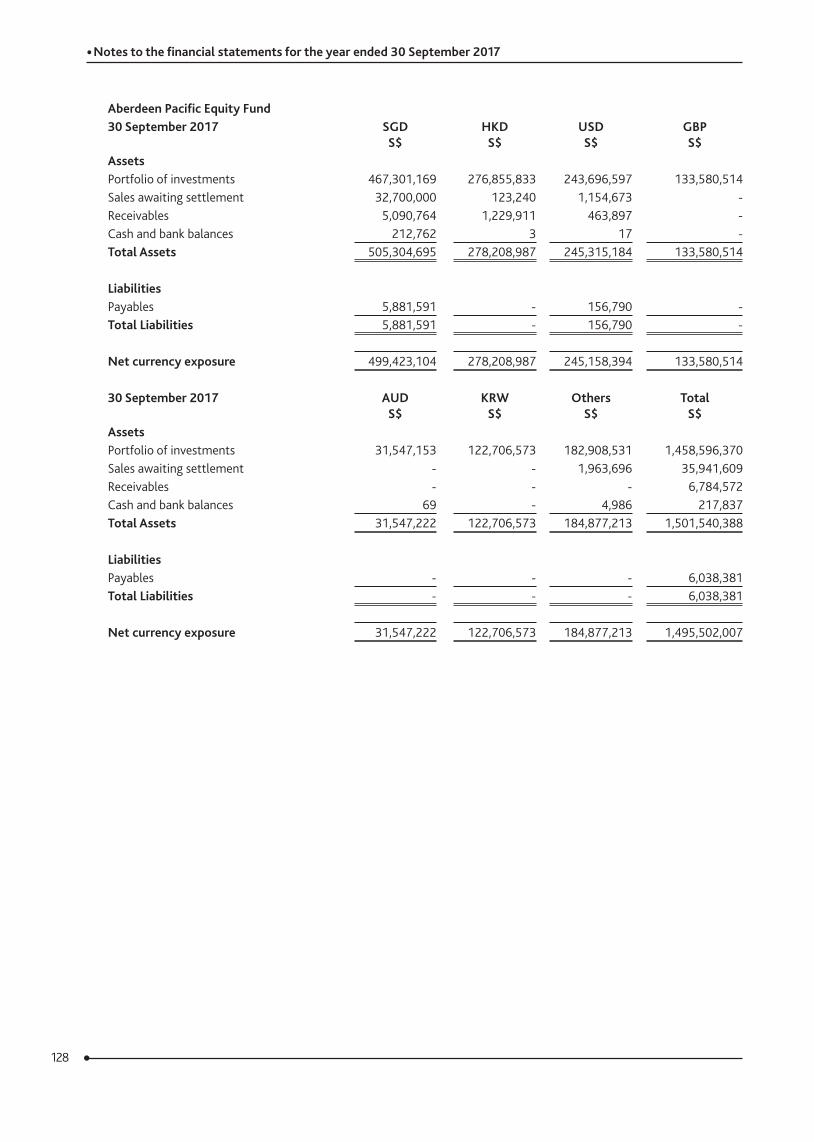
128
• Notes to the financial statements for the year ended 30 September 2017
Aberdeen Pacific Equity Fund30 September 2017 SGD
S$HKD
S$USDS$
GBPS$
AssetsPortfolio of investments 467,301,169 276,855,833 243,696,597 133,580,514Sales awaiting settlement 32,700,000 123,240 1,154,673 -Receivables 5,090,764 1,229,911 463,897 -Cash and bank balances 212,762 3 17 -Total Assets 505,304,695 278,208,987 245,315,184 133,580,514
LiabilitiesPayables 5,881,591 - 156,790 -Total Liabilities 5,881,591 - 156,790 -
Net currency exposure 499,423,104 278,208,987 245,158,394 133,580,514
30 September 2017 AUDS$
KRWS$
OthersS$
TotalS$
AssetsPortfolio of investments 31,547,153 122,706,573 182,908,531 1,458,596,370Sales awaiting settlement - - 1,963,696 35,941,609Receivables - - - 6,784,572Cash and bank balances 69 - 4,986 217,837Total Assets 31,547,222 122,706,573 184,877,213 1,501,540,388
LiabilitiesPayables - - - 6,038,381Total Liabilities - - - 6,038,381
Net currency exposure 31,547,222 122,706,573 184,877,213 1,495,502,007
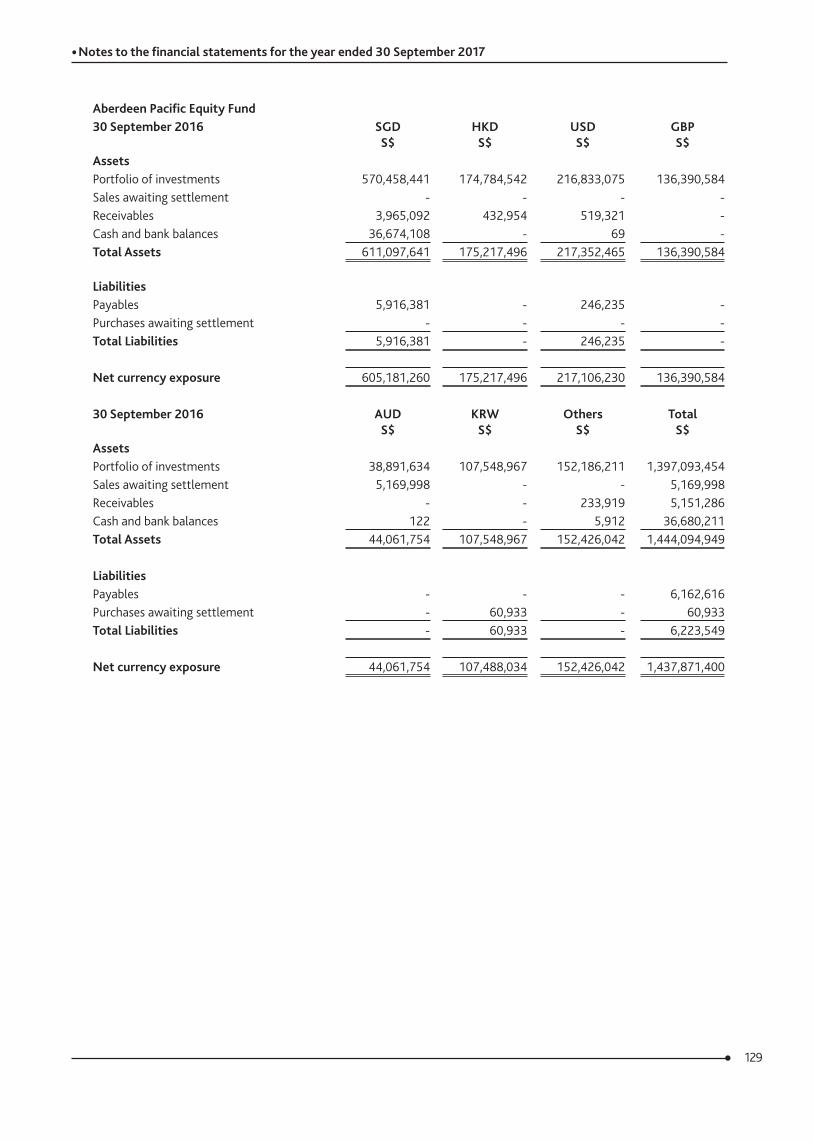
129
• Notes to the financial statements for the year ended 30 September 2017
Aberdeen Pacific Equity Fund30 September 2016 SGD
S$HKD
S$USDS$
GBPS$
AssetsPortfolio of investments 570,458,441 174,784,542 216,833,075 136,390,584Sales awaiting settlement - - - -Receivables 3,965,092 432,954 519,321 -Cash and bank balances 36,674,108 - 69 -Total Assets 611,097,641 175,217,496 217,352,465 136,390,584
LiabilitiesPayables 5,916,381 - 246,235 -Purchases awaiting settlement - - - -Total Liabilities 5,916,381 - 246,235 -
Net currency exposure 605,181,260 175,217,496 217,106,230 136,390,584
30 September 2016 AUDS$
KRWS$
OthersS$
TotalS$
AssetsPortfolio of investments 38,891,634 107,548,967 152,186,211 1,397,093,454Sales awaiting settlement 5,169,998 - - 5,169,998Receivables - - 233,919 5,151,286Cash and bank balances 122 - 5,912 36,680,211Total Assets 44,061,754 107,548,967 152,426,042 1,444,094,949
LiabilitiesPayables - - - 6,162,616Purchases awaiting settlement - 60,933 - 60,933Total Liabilities - 60,933 - 6,223,549
Net currency exposure 44,061,754 107,488,034 152,426,042 1,437,871,400
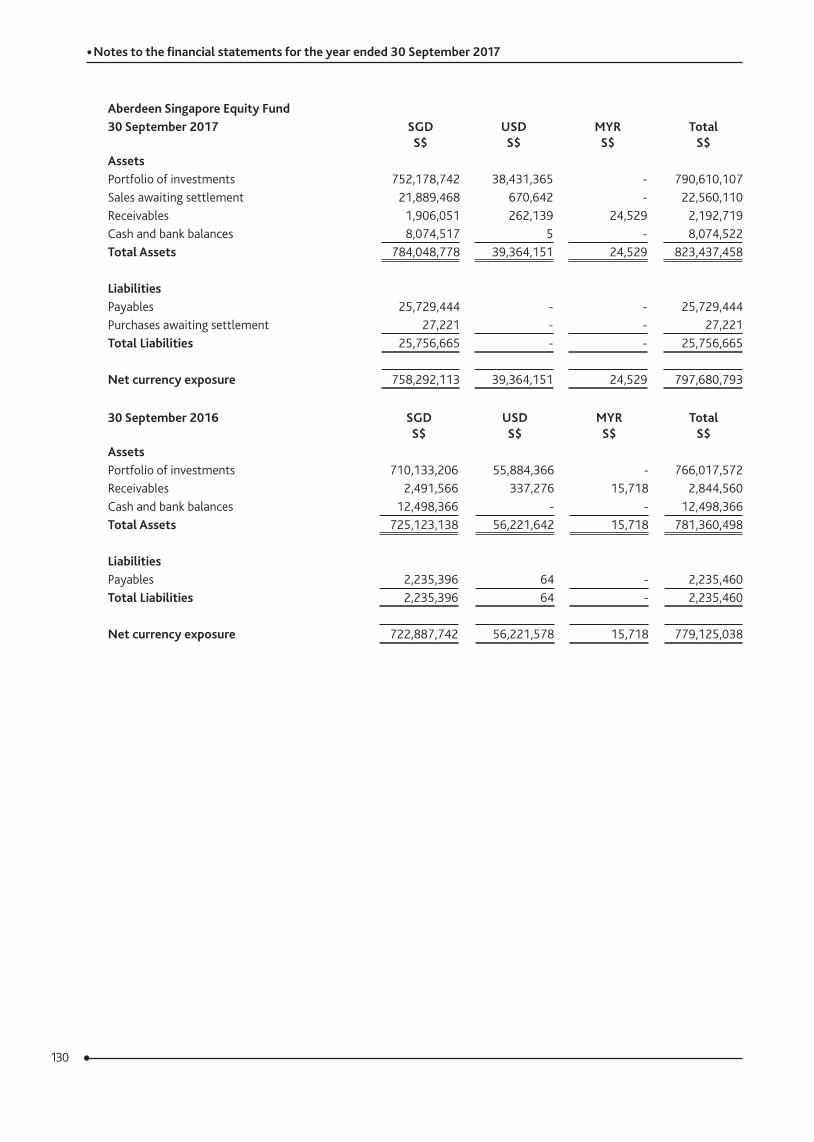
130
• Notes to the financial statements for the year ended 30 September 2017
Aberdeen Singapore Equity Fund30 September 2017 SGD
S$USDS$
MYRS$
TotalS$
AssetsPortfolio of investments 752,178,742 38,431,365 - 790,610,107Sales awaiting settlement 21,889,468 670,642 - 22,560,110Receivables 1,906,051 262,139 24,529 2,192,719Cash and bank balances 8,074,517 5 - 8,074,522Total Assets 784,048,778 39,364,151 24,529 823,437,458
LiabilitiesPayables 25,729,444 - - 25,729,444Purchases awaiting settlement 27,221 - - 27,221Total Liabilities 25,756,665 - - 25,756,665
Net currency exposure 758,292,113 39,364,151 24,529 797,680,793
30 September 2016 SGDS$
USDS$
MYRS$
TotalS$
AssetsPortfolio of investments 710,133,206 55,884,366 - 766,017,572Receivables 2,491,566 337,276 15,718 2,844,560Cash and bank balances 12,498,366 - - 12,498,366Total Assets 725,123,138 56,221,642 15,718 781,360,498
LiabilitiesPayables 2,235,396 64 - 2,235,460Total Liabilities 2,235,396 64 - 2,235,460
Net currency exposure 722,887,742 56,221,578 15,718 779,125,038
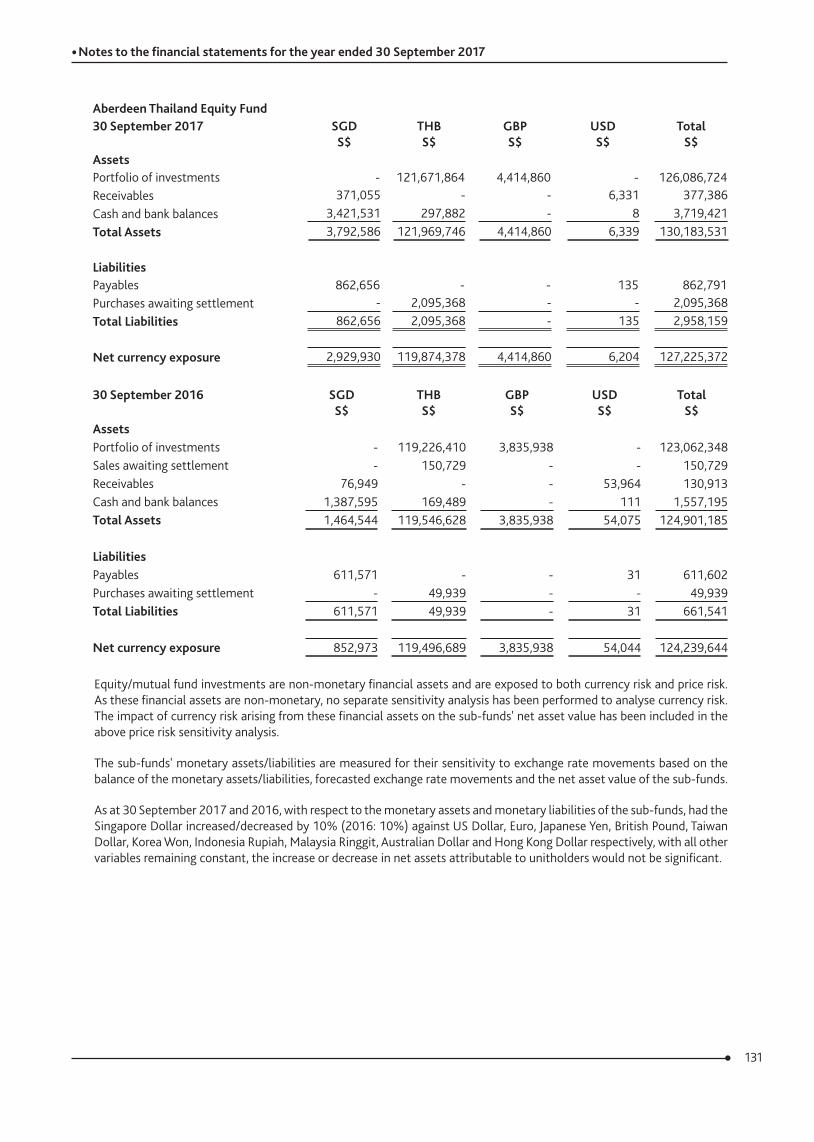
131
• Notes to the financial statements for the year ended 30 September 2017
Aberdeen Thailand Equity Fund30 September 2017 SGD
S$THBS$
GBPS$
USDS$
TotalS$
AssetsPortfolio of investments - 121,671,864 4,414,860 - 126,086,724Receivables 371,055 - - 6,331 377,386Cash and bank balances 3,421,531 297,882 - 8 3,719,421Total Assets 3,792,586 121,969,746 4,414,860 6,339 130,183,531
LiabilitiesPayables 862,656 - - 135 862,791Purchases awaiting settlement - 2,095,368 - - 2,095,368Total Liabilities 862,656 2,095,368 - 135 2,958,159
Net currency exposure 2,929,930 119,874,378 4,414,860 6,204 127,225,372
30 September 2016 SGDS$
THBS$
GBPS$
USDS$
TotalS$
AssetsPortfolio of investments - 119,226,410 3,835,938 - 123,062,348Sales awaiting settlement - 150,729 - - 150,729Receivables 76,949 - - 53,964 130,913Cash and bank balances 1,387,595 169,489 - 111 1,557,195Total Assets 1,464,544 119,546,628 3,835,938 54,075 124,901,185
LiabilitiesPayables 611,571 - - 31 611,602Purchases awaiting settlement - 49,939 - - 49,939Total Liabilities 611,571 49,939 - 31 661,541
Net currency exposure 852,973 119,496,689 3,835,938 54,044 124,239,644
Equity/mutual fund investments are non-monetary financial assets and are exposed to both currency risk and price risk. As these financial assets are non-monetary, no separate sensitivity analysis has been performed to analyse currency risk. The impact of currency risk arising from these financial assets on the sub-funds' net asset value has been included in the above price risk sensitivity analysis.
The sub-funds' monetary assets/liabilities are measured for their sensitivity to exchange rate movements based on the balance of the monetary assets/liabilities, forecasted exchange rate movements and the net asset value of the sub-funds.
As at 30 September 2017 and 2016, with respect to the monetary assets and monetary liabilities of the sub-funds, had the Singapore Dollar increased/decreased by 10% (2016: 10%) against US Dollar, Euro, Japanese Yen, British Pound, Taiwan Dollar, Korea Won, Indonesia Rupiah, Malaysia Ringgit, Australian Dollar and Hong Kong Dollar respectively, with all other variables remaining constant, the increase or decrease in net assets attributable to unitholders would not be significant.
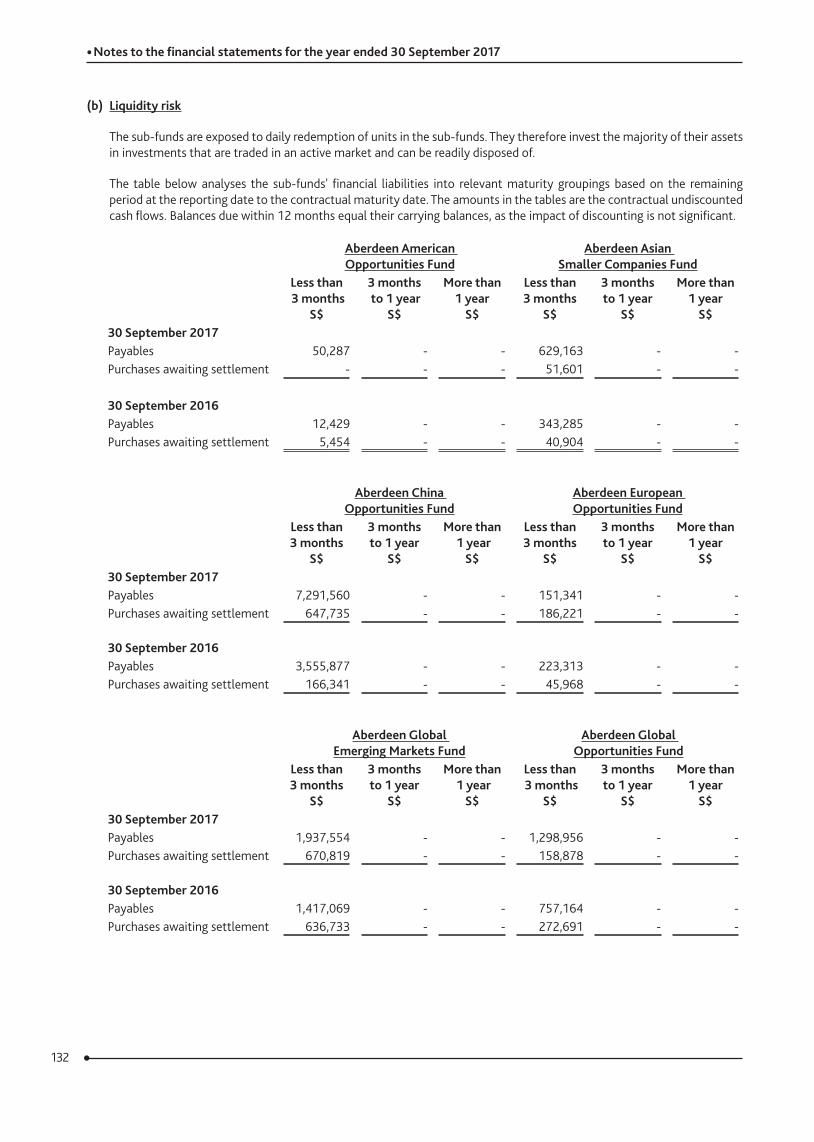
132
• Notes to the financial statements for the year ended 30 September 2017
(b) Liquidity risk
The sub-funds are exposed to daily redemption of units in the sub-funds. They therefore invest the majority of their assets in investments that are traded in an active market and can be readily disposed of.
The table below analyses the sub-funds' financial liabilities into relevant maturity groupings based on the remaining period at the reporting date to the contractual maturity date. The amounts in the tables are the contractual undiscounted cash flows. Balances due within 12 months equal their carrying balances, as the impact of discounting is not significant.
Aberdeen American Opportunities Fund
Aberdeen Asian Smaller Companies Fund
Less than 3 months
S$
3 months to 1 year
S$
More than 1 year
S$
Less than 3 months
S$
3 months to 1 year
S$
More than 1 year
S$30 September 2017Payables 50,287 - - 629,163 - -Purchases awaiting settlement - - - 51,601 - -
30 September 2016Payables 12,429 - - 343,285 - -Purchases awaiting settlement 5,454 - - 40,904 - -
Aberdeen China Opportunities Fund
Aberdeen European Opportunities Fund
Less than 3 months
S$
3 months to 1 year
S$
More than 1 year
S$
Less than 3 months
S$
3 months to 1 year
S$
More than 1 year
S$30 September 2017Payables 7,291,560 - - 151,341 - -Purchases awaiting settlement 647,735 - - 186,221 - -
30 September 2016Payables 3,555,877 - - 223,313 - -Purchases awaiting settlement 166,341 - - 45,968 - -
Aberdeen Global Emerging Markets Fund
Aberdeen Global Opportunities Fund
Less than 3 months
S$
3 months to 1 year
S$
More than 1 year
S$
Less than 3 months
S$
3 months to 1 year
S$
More than 1 year
S$30 September 2017Payables 1,937,554 - - 1,298,956 - -Purchases awaiting settlement 670,819 - - 158,878 - -
30 September 2016Payables 1,417,069 - - 757,164 - -Purchases awaiting settlement 636,733 - - 272,691 - -
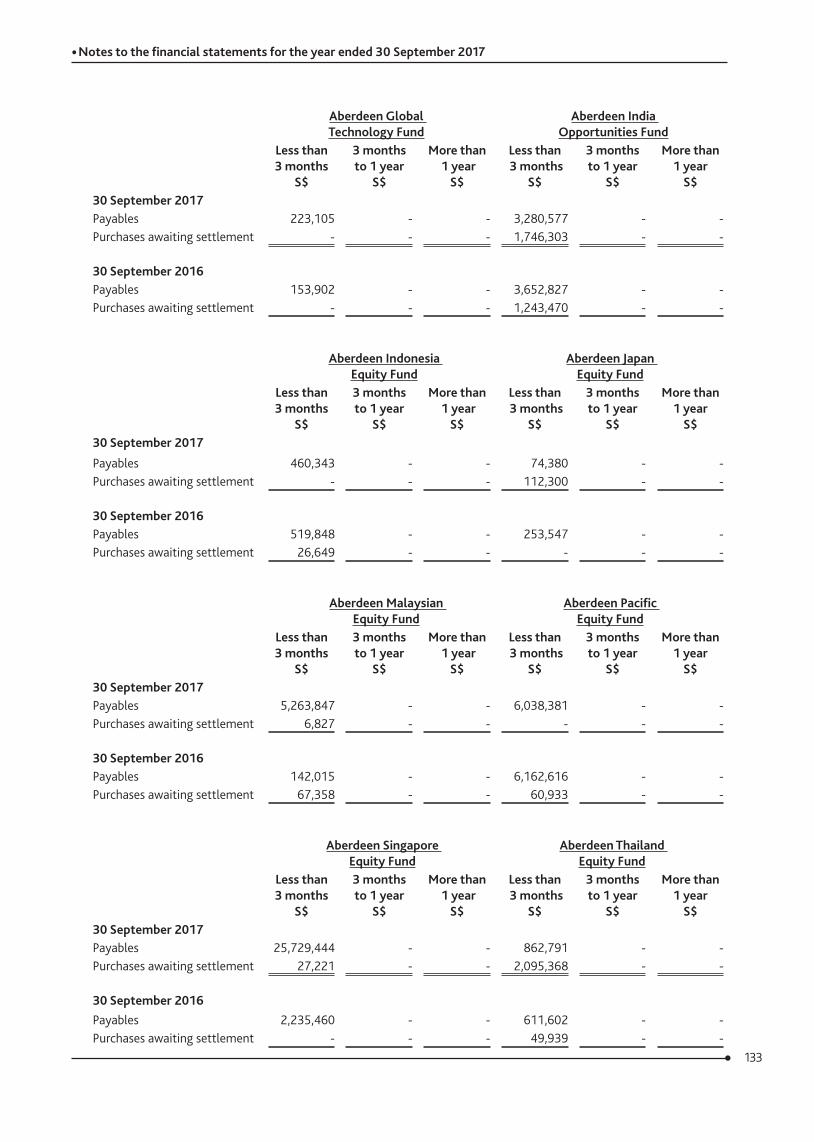
133
• Notes to the financial statements for the year ended 30 September 2017
Aberdeen Global Technology Fund
Aberdeen India Opportunities Fund
Less than 3 months
S$
3 months to 1 year
S$
More than 1 year
S$
Less than 3 months
S$
3 months to 1 year
S$
More than 1 year
S$30 September 2017Payables 223,105 - - 3,280,577 - -Purchases awaiting settlement - - - 1,746,303 - -
30 September 2016Payables 153,902 - - 3,652,827 - -Purchases awaiting settlement - - - 1,243,470 - -
Aberdeen Indonesia Equity Fund
Aberdeen Japan Equity Fund
Less than 3 months
S$
3 months to 1 year
S$
More than 1 year
S$
Less than 3 months
S$
3 months to 1 year
S$
More than 1 year
S$30 September 2017Payables 460,343 - - 74,380 - -Purchases awaiting settlement - - - 112,300 - -
30 September 2016Payables 519,848 - - 253,547 - -Purchases awaiting settlement 26,649 - - - - -
Aberdeen Malaysian Equity Fund
Aberdeen Pacific Equity Fund
Less than 3 months
S$
3 months to 1 year
S$
More than 1 year
S$
Less than 3 months
S$
3 months to 1 year
S$
More than 1 year
S$30 September 2017Payables 5,263,847 - - 6,038,381 - -Purchases awaiting settlement 6,827 - - - - -
30 September 2016Payables 142,015 - - 6,162,616 - -Purchases awaiting settlement 67,358 - - 60,933 - -
Aberdeen Singapore Equity Fund
Aberdeen Thailand Equity Fund
Less than 3 months
S$
3 months to 1 year
S$
More than 1 year
S$
Less than 3 months
S$
3 months to 1 year
S$
More than 1 year
S$30 September 2017Payables 25,729,444 - - 862,791 - -Purchases awaiting settlement 27,221 - - 2,095,368 - -
30 September 2016Payables 2,235,460 - - 611,602 - -Purchases awaiting settlement - - - 49,939 - -
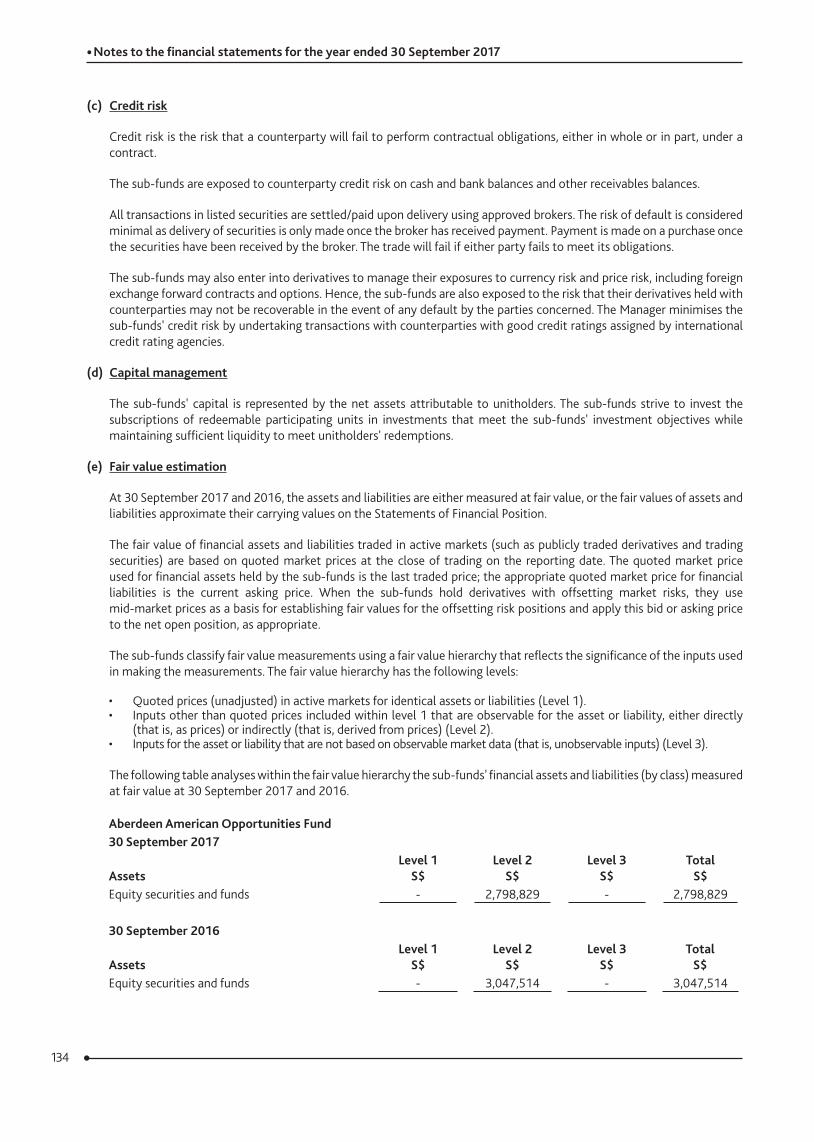
134
• Notes to the financial statements for the year ended 30 September 2017
(c) Credit risk
Credit risk is the risk that a counterparty will fail to perform contractual obligations, either in whole or in part, under a contract.
The sub-funds are exposed to counterparty credit risk on cash and bank balances and other receivables balances.
All transactions in listed securities are settled/paid upon delivery using approved brokers. The risk of default is considered minimal as delivery of securities is only made once the broker has received payment. Payment is made on a purchase once the securities have been received by the broker. The trade will fail if either party fails to meet its obligations.
The sub-funds may also enter into derivatives to manage their exposures to currency risk and price risk, including foreign exchange forward contracts and options. Hence, the sub-funds are also exposed to the risk that their derivatives held with counterparties may not be recoverable in the event of any default by the parties concerned. The Manager minimises the sub-funds' credit risk by undertaking transactions with counterparties with good credit ratings assigned by international credit rating agencies.
(d) Capital management
The sub-funds' capital is represented by the net assets attributable to unitholders. The sub-funds strive to invest the subscriptions of redeemable participating units in investments that meet the sub-funds' investment objectives while maintaining sufficient liquidity to meet unitholders' redemptions.
(e) Fair value estimation
At 30 September 2017 and 2016, the assets and liabilities are either measured at fair value, or the fair values of assets and liabilities approximate their carrying values on the Statements of Financial Position.
The fair value of financial assets and liabilities traded in active markets (such as publicly traded derivatives and trading securities) are based on quoted market prices at the close of trading on the reporting date. The quoted market price used for financial assets held by the sub-funds is the last traded price; the appropriate quoted market price for financial liabilities is the current asking price. When the sub-funds hold derivatives with offsetting market risks, they use mid-market prices as a basis for establishing fair values for the offsetting risk positions and apply this bid or asking price to the net open position, as appropriate.
The sub-funds classify fair value measurements using a fair value hierarchy that reflects the significance of the inputs used in making the measurements. The fair value hierarchy has the following levels:
• Quoted prices (unadjusted) in active markets for identical assets or liabilities (Level 1).• Inputs other than quoted prices included within level 1 that are observable for the asset or liability, either directly
(that is, as prices) or indirectly (that is, derived from prices) (Level 2).• Inputs for the asset or liability that are not based on observable market data (that is, unobservable inputs) (Level 3).
The following table analyses within the fair value hierarchy the sub-funds' financial assets and liabilities (by class) measured at fair value at 30 September 2017 and 2016.
Aberdeen American Opportunities Fund30 September 2017
AssetsLevel 1
S$Level 2
S$Level 3
S$Total
S$Equity securities and funds - 2,798,829 - 2,798,829
30 September 2016
AssetsLevel 1
S$Level 2
S$Level 3
S$Total
S$Equity securities and funds - 3,047,514 - 3,047,514
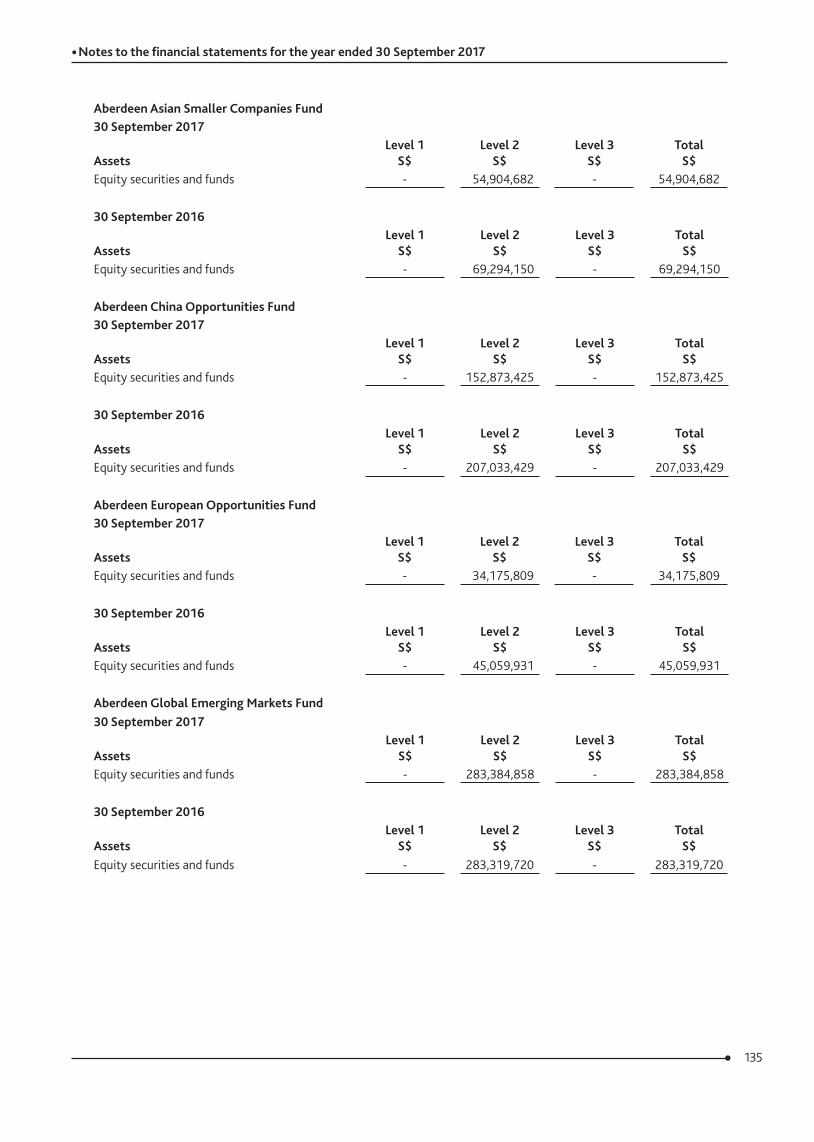
135
• Notes to the financial statements for the year ended 30 September 2017
Aberdeen Asian Smaller Companies Fund30 September 2017
AssetsLevel 1
S$Level 2
S$Level 3
S$Total
S$Equity securities and funds - 54,904,682 - 54,904,682
30 September 2016
AssetsLevel 1
S$Level 2
S$Level 3
S$Total
S$Equity securities and funds - 69,294,150 - 69,294,150
Aberdeen China Opportunities Fund30 September 2017
AssetsLevel 1
S$Level 2
S$Level 3
S$Total
S$Equity securities and funds - 152,873,425 - 152,873,425
30 September 2016
AssetsLevel 1
S$Level 2
S$Level 3
S$Total
S$Equity securities and funds - 207,033,429 - 207,033,429
Aberdeen European Opportunities Fund30 September 2017
AssetsLevel 1
S$Level 2
S$Level 3
S$Total
S$Equity securities and funds - 34,175,809 - 34,175,809
30 September 2016
AssetsLevel 1
S$Level 2
S$Level 3
S$Total
S$Equity securities and funds - 45,059,931 - 45,059,931
Aberdeen Global Emerging Markets Fund30 September 2017
AssetsLevel 1
S$Level 2
S$Level 3
S$Total
S$Equity securities and funds - 283,384,858 - 283,384,858
30 September 2016
AssetsLevel 1
S$Level 2
S$Level 3
S$Total
S$Equity securities and funds - 283,319,720 - 283,319,720
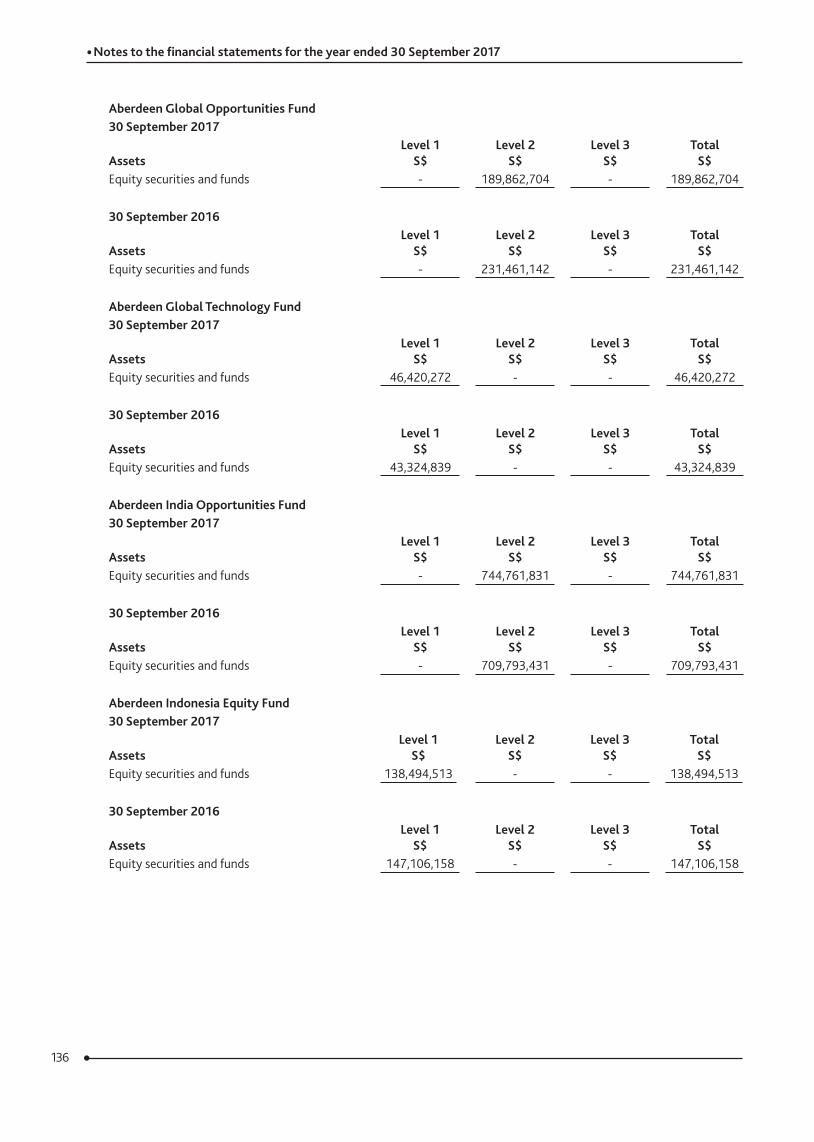
136
• Notes to the financial statements for the year ended 30 September 2017
Aberdeen Global Opportunities Fund30 September 2017
AssetsLevel 1
S$Level 2
S$Level 3
S$Total
S$Equity securities and funds - 189,862,704 - 189,862,704
30 September 2016
AssetsLevel 1
S$Level 2
S$Level 3
S$Total
S$Equity securities and funds - 231,461,142 - 231,461,142
Aberdeen Global Technology Fund30 September 2017
AssetsLevel 1
S$Level 2
S$Level 3
S$Total
S$Equity securities and funds 46,420,272 - - 46,420,272
30 September 2016
AssetsLevel 1
S$Level 2
S$Level 3
S$Total
S$Equity securities and funds 43,324,839 - - 43,324,839
Aberdeen India Opportunities Fund30 September 2017
AssetsLevel 1
S$Level 2
S$Level 3
S$Total
S$Equity securities and funds - 744,761,831 - 744,761,831
30 September 2016
AssetsLevel 1
S$Level 2
S$Level 3
S$Total
S$Equity securities and funds - 709,793,431 - 709,793,431
Aberdeen Indonesia Equity Fund30 September 2017
AssetsLevel 1
S$Level 2
S$Level 3
S$Total
S$Equity securities and funds 138,494,513 - - 138,494,513
30 September 2016
AssetsLevel 1
S$Level 2
S$Level 3
S$Total
S$Equity securities and funds 147,106,158 - - 147,106,158
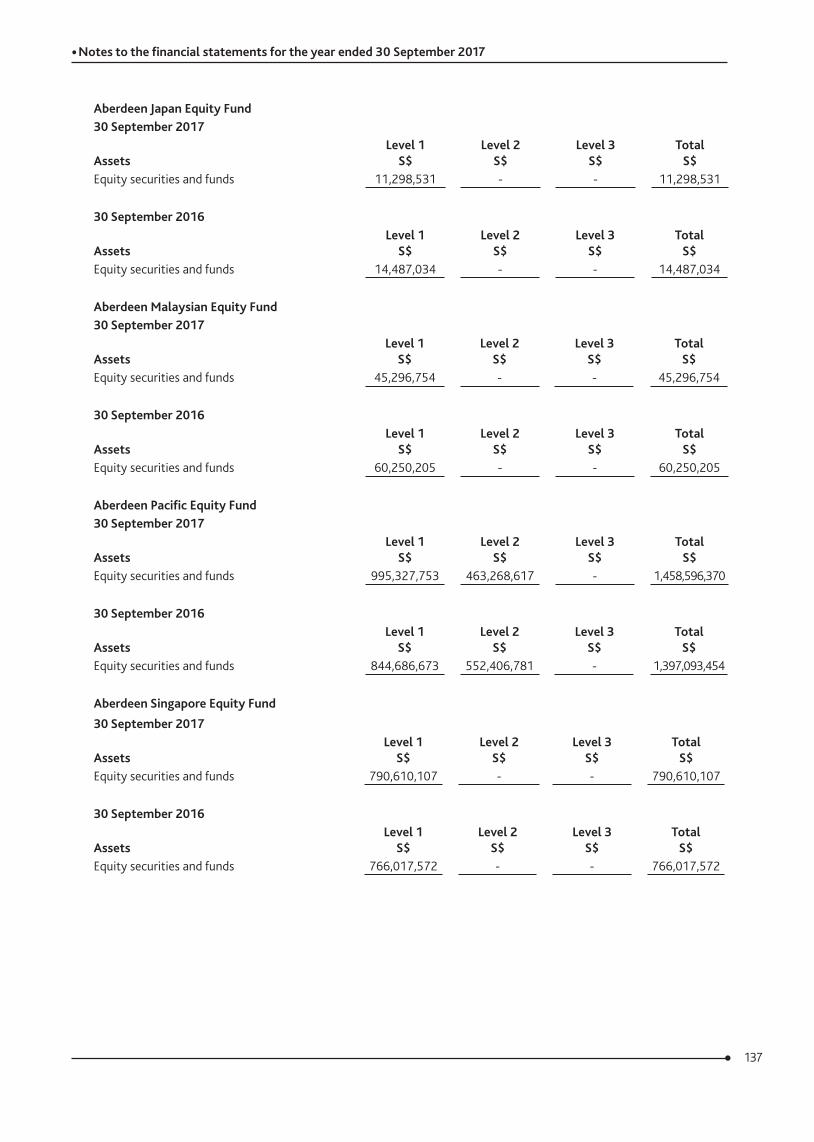
137
• Notes to the financial statements for the year ended 30 September 2017
Aberdeen Japan Equity Fund30 September 2017
AssetsLevel 1
S$Level 2
S$Level 3
S$Total
S$Equity securities and funds 11,298,531 - - 11,298,531
30 September 2016
AssetsLevel 1
S$Level 2
S$Level 3
S$Total
S$Equity securities and funds 14,487,034 - - 14,487,034
Aberdeen Malaysian Equity Fund30 September 2017
AssetsLevel 1
S$Level 2
S$Level 3
S$Total
S$Equity securities and funds 45,296,754 - - 45,296,754
30 September 2016
AssetsLevel 1
S$Level 2
S$Level 3
S$Total
S$Equity securities and funds 60,250,205 - - 60,250,205
Aberdeen Pacific Equity Fund30 September 2017
AssetsLevel 1
S$Level 2
S$Level 3
S$Total
S$Equity securities and funds 995,327,753 463,268,617 - 1,458,596,370
30 September 2016
AssetsLevel 1
S$Level 2
S$Level 3
S$Total
S$Equity securities and funds 844,686,673 552,406,781 - 1,397,093,454
Aberdeen Singapore Equity Fund30 September 2017
AssetsLevel 1
S$Level 2
S$Level 3
S$Total
S$Equity securities and funds 790,610,107 - - 790,610,107
30 September 2016
AssetsLevel 1
S$Level 2
S$Level 3
S$Total
S$Equity securities and funds 766,017,572 - - 766,017,572
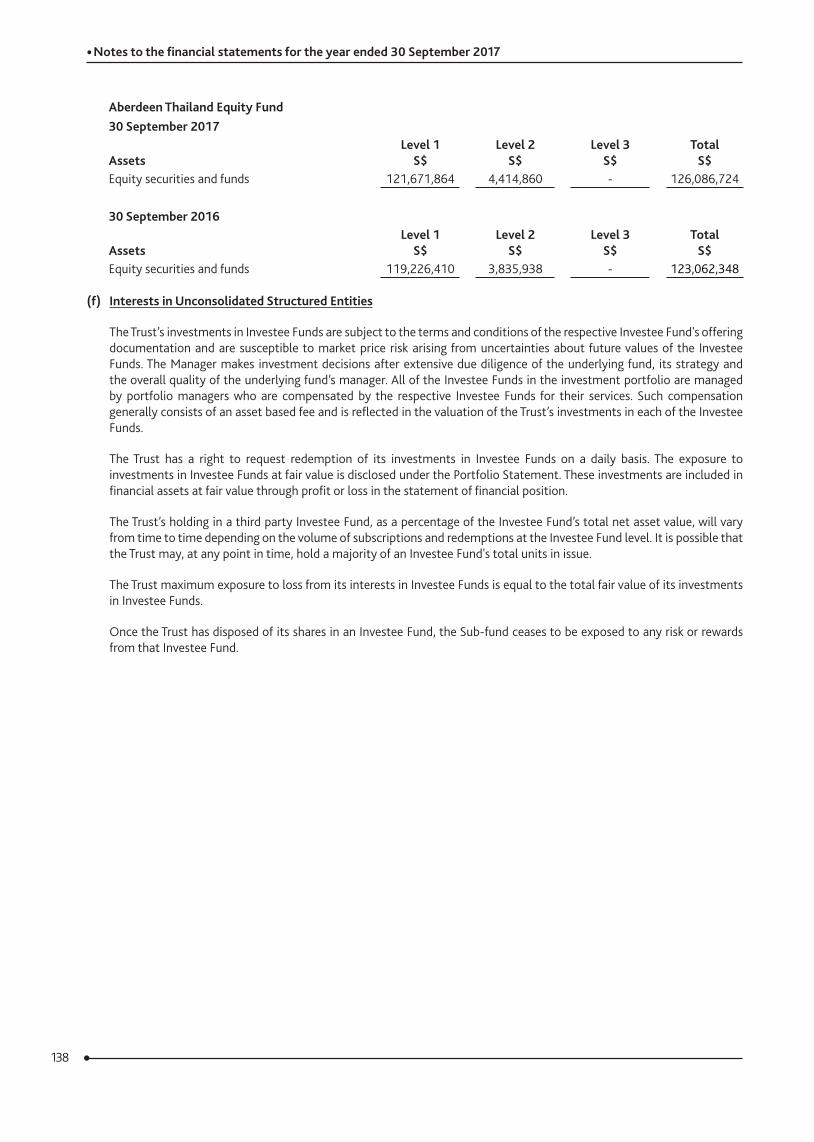
138
• Notes to the financial statements for the year ended 30 September 2017
Aberdeen Thailand Equity Fund30 September 2017
AssetsLevel 1
S$Level 2
S$Level 3
S$Total
S$Equity securities and funds 121,671,864 4,414,860 - 126,086,724
30 September 2016
AssetsLevel 1
S$Level 2
S$Level 3
S$Total
S$Equity securities and funds 119,226,410 3,835,938 - 123,062,348
(f) Interests in Unconsolidated Structured Entities
The Trust’s investments in Investee Funds are subject to the terms and conditions of the respective Investee Fund's offering documentation and are susceptible to market price risk arising from uncertainties about future values of the Investee Funds. The Manager makes investment decisions after extensive due diligence of the underlying fund, its strategy and the overall quality of the underlying fund’s manager. All of the Investee Funds in the investment portfolio are managed by portfolio managers who are compensated by the respective Investee Funds for their services. Such compensation generally consists of an asset based fee and is reflected in the valuation of the Trust’s investments in each of the Investee Funds.
The Trust has a right to request redemption of its investments in Investee Funds on a daily basis. The exposure to investments in Investee Funds at fair value is disclosed under the Portfolio Statement. These investments are included in financial assets at fair value through profit or loss in the statement of financial position.
The Trust’s holding in a third party Investee Fund, as a percentage of the Investee Fund’s total net asset value, will vary from time to time depending on the volume of subscriptions and redemptions at the Investee Fund level. It is possible that the Trust may, at any point in time, hold a majority of an Investee Fund's total units in issue.
The Trust maximum exposure to loss from its interests in Investee Funds is equal to the total fair value of its investments in Investee Funds.
Once the Trust has disposed of its shares in an Investee Fund, the Sub-fund ceases to be exposed to any risk or rewards from that Investee Fund.
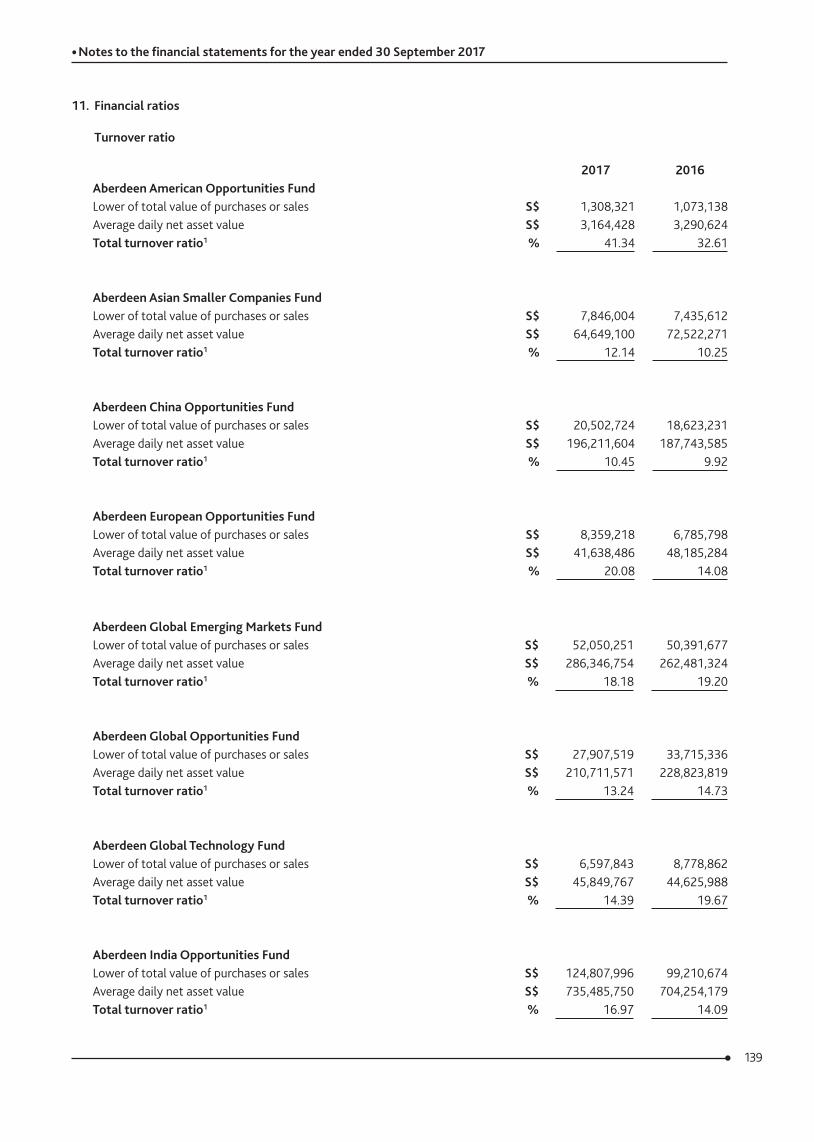
139
• Notes to the financial statements for the year ended 30 September 2017
11. Financial ratios
Turnover ratio
2017 2016Aberdeen American Opportunities FundLower of total value of purchases or sales S$ 1,308,321 1,073,138Average daily net asset value S$ 3,164,428 3,290,624Total turnover ratio1 % 41.34 32.61
Aberdeen Asian Smaller Companies FundLower of total value of purchases or sales S$ 7,846,004 7,435,612Average daily net asset value S$ 64,649,100 72,522,271Total turnover ratio1 % 12.14 10.25
Aberdeen China Opportunities FundLower of total value of purchases or sales S$ 20,502,724 18,623,231Average daily net asset value S$ 196,211,604 187,743,585Total turnover ratio1 % 10.45 9.92
Aberdeen European Opportunities FundLower of total value of purchases or sales S$ 8,359,218 6,785,798Average daily net asset value S$ 41,638,486 48,185,284Total turnover ratio1 % 20.08 14.08
Aberdeen Global Emerging Markets FundLower of total value of purchases or sales S$ 52,050,251 50,391,677Average daily net asset value S$ 286,346,754 262,481,324Total turnover ratio1 % 18.18 19.20
Aberdeen Global Opportunities FundLower of total value of purchases or sales S$ 27,907,519 33,715,336Average daily net asset value S$ 210,711,571 228,823,819Total turnover ratio1 % 13.24 14.73
Aberdeen Global Technology FundLower of total value of purchases or sales S$ 6,597,843 8,778,862Average daily net asset value S$ 45,849,767 44,625,988Total turnover ratio1 % 14.39 19.67
Aberdeen India Opportunities FundLower of total value of purchases or sales S$ 124,807,996 99,210,674Average daily net asset value S$ 735,485,750 704,254,179Total turnover ratio1 % 16.97 14.09
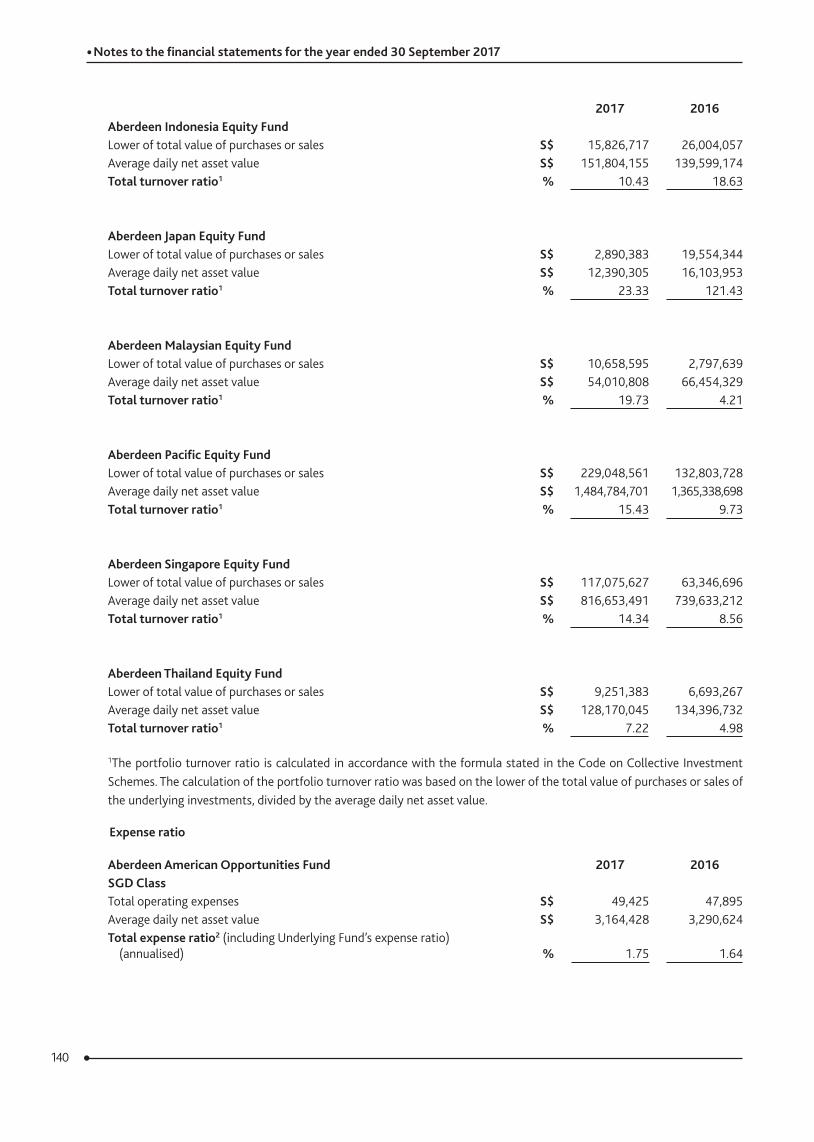
140
• Notes to the financial statements for the year ended 30 September 2017
2017 2016Aberdeen Indonesia Equity FundLower of total value of purchases or sales S$ 15,826,717 26,004,057Average daily net asset value S$ 151,804,155 139,599,174Total turnover ratio1 % 10.43 18.63
Aberdeen Japan Equity FundLower of total value of purchases or sales S$ 2,890,383 19,554,344Average daily net asset value S$ 12,390,305 16,103,953Total turnover ratio1 % 23.33 121.43
Aberdeen Malaysian Equity FundLower of total value of purchases or sales S$ 10,658,595 2,797,639Average daily net asset value S$ 54,010,808 66,454,329Total turnover ratio1 % 19.73 4.21
Aberdeen Pacific Equity FundLower of total value of purchases or sales S$ 229,048,561 132,803,728Average daily net asset value S$ 1,484,784,701 1,365,338,698Total turnover ratio1 % 15.43 9.73
Aberdeen Singapore Equity FundLower of total value of purchases or sales S$ 117,075,627 63,346,696Average daily net asset value S$ 816,653,491 739,633,212Total turnover ratio1 % 14.34 8.56
Aberdeen Thailand Equity FundLower of total value of purchases or sales S$ 9,251,383 6,693,267Average daily net asset value S$ 128,170,045 134,396,732Total turnover ratio1 % 7.22 4.98
1The portfolio turnover ratio is calculated in accordance with the formula stated in the Code on Collective Investment Schemes. The calculation of the portfolio turnover ratio was based on the lower of the total value of purchases or sales of the underlying investments, divided by the average daily net asset value.
Expense ratio
Aberdeen American Opportunities Fund 2017 2016SGD ClassTotal operating expenses S$ 49,425 47,895Average daily net asset value S$ 3,164,428 3,290,624Total expense ratio2 (including Underlying Fund’s expense ratio)
(annualised) % 1.75 1.64
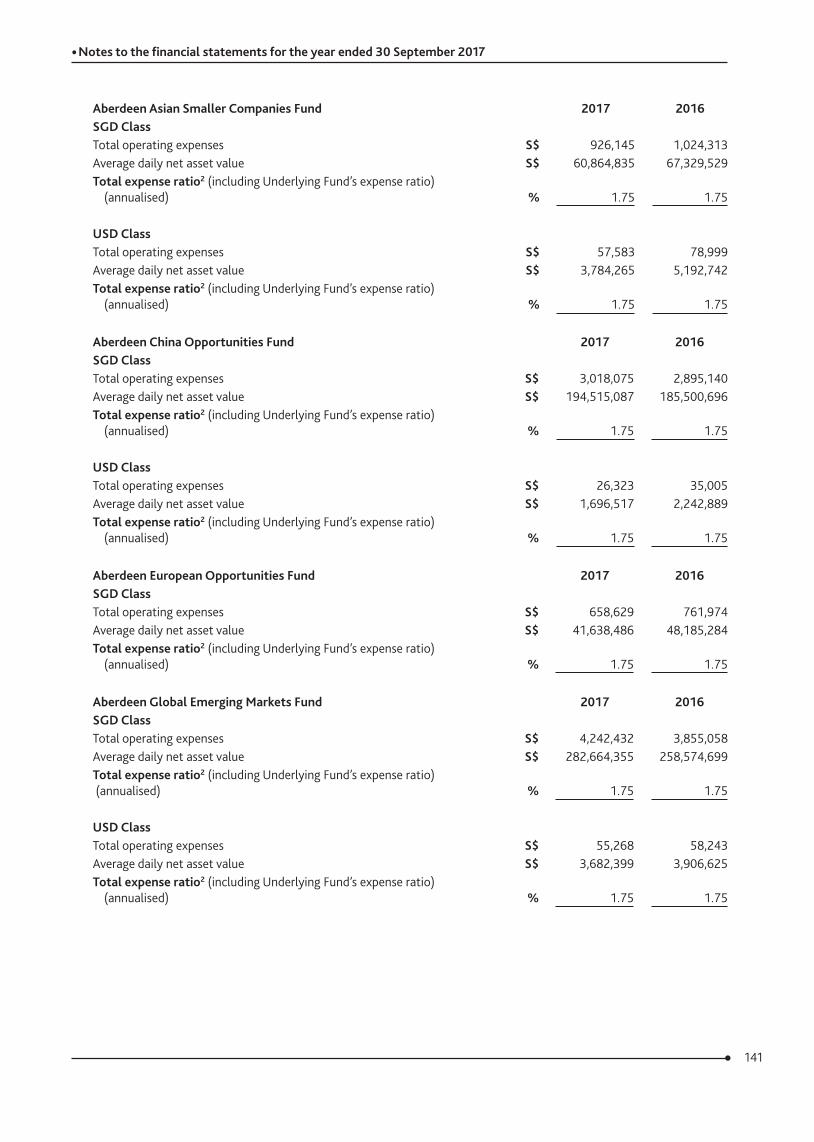
141
• Notes to the financial statements for the year ended 30 September 2017
Aberdeen Asian Smaller Companies Fund 2017 2016SGD ClassTotal operating expenses S$ 926,145 1,024,313Average daily net asset value S$ 60,864,835 67,329,529Total expense ratio2 (including Underlying Fund’s expense ratio)
(annualised) % 1.75 1.75
USD ClassTotal operating expenses S$ 57,583 78,999Average daily net asset value S$ 3,784,265 5,192,742Total expense ratio2 (including Underlying Fund’s expense ratio)
(annualised) % 1.75 1.75
Aberdeen China Opportunities Fund 2017 2016SGD ClassTotal operating expenses S$ 3,018,075 2,895,140Average daily net asset value S$ 194,515,087 185,500,696Total expense ratio2 (including Underlying Fund’s expense ratio)
(annualised) % 1.75 1.75
USD ClassTotal operating expenses S$ 26,323 35,005Average daily net asset value S$ 1,696,517 2,242,889Total expense ratio2 (including Underlying Fund’s expense ratio)
(annualised) % 1.75 1.75
Aberdeen European Opportunities Fund 2017 2016SGD ClassTotal operating expenses S$ 658,629 761,974Average daily net asset value S$ 41,638,486 48,185,284Total expense ratio2 (including Underlying Fund’s expense ratio)
(annualised) % 1.75 1.75
Aberdeen Global Emerging Markets Fund 2017 2016SGD ClassTotal operating expenses S$ 4,242,432 3,855,058Average daily net asset value S$ 282,664,355 258,574,699Total expense ratio2 (including Underlying Fund’s expense ratio) (annualised) % 1.75 1.75
USD ClassTotal operating expenses S$ 55,268 58,243Average daily net asset value S$ 3,682,399 3,906,625Total expense ratio2 (including Underlying Fund’s expense ratio)
(annualised) % 1.75 1.75
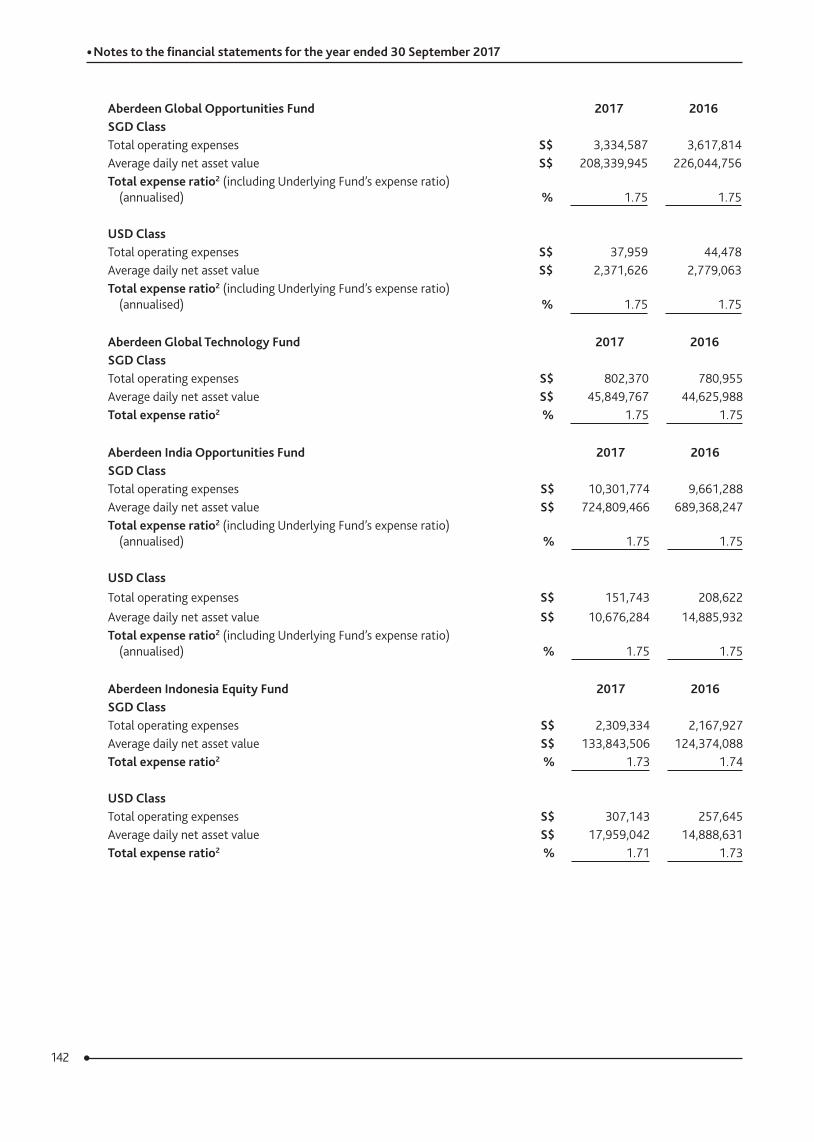
142
• Notes to the financial statements for the year ended 30 September 2017
Aberdeen Global Opportunities Fund 2017 2016SGD ClassTotal operating expenses S$ 3,334,587 3,617,814Average daily net asset value S$ 208,339,945 226,044,756Total expense ratio2 (including Underlying Fund’s expense ratio)
(annualised) % 1.75 1.75
USD ClassTotal operating expenses S$ 37,959 44,478Average daily net asset value S$ 2,371,626 2,779,063Total expense ratio2 (including Underlying Fund’s expense ratio)
(annualised) % 1.75 1.75
Aberdeen Global Technology Fund 2017 2016SGD ClassTotal operating expenses S$ 802,370 780,955Average daily net asset value S$ 45,849,767 44,625,988Total expense ratio2 % 1.75 1.75
Aberdeen India Opportunities Fund 2017 2016SGD ClassTotal operating expenses S$ 10,301,774 9,661,288Average daily net asset value S$ 724,809,466 689,368,247Total expense ratio2 (including Underlying Fund’s expense ratio)
(annualised) % 1.75 1.75
USD ClassTotal operating expenses S$ 151,743 208,622Average daily net asset value S$ 10,676,284 14,885,932Total expense ratio2 (including Underlying Fund’s expense ratio)
(annualised) % 1.75 1.75
Aberdeen Indonesia Equity Fund 2017 2016SGD ClassTotal operating expenses S$ 2,309,334 2,167,927Average daily net asset value S$ 133,843,506 124,374,088Total expense ratio2 % 1.73 1.74
USD ClassTotal operating expenses S$ 307,143 257,645Average daily net asset value S$ 17,959,042 14,888,631Total expense ratio2 % 1.71 1.73
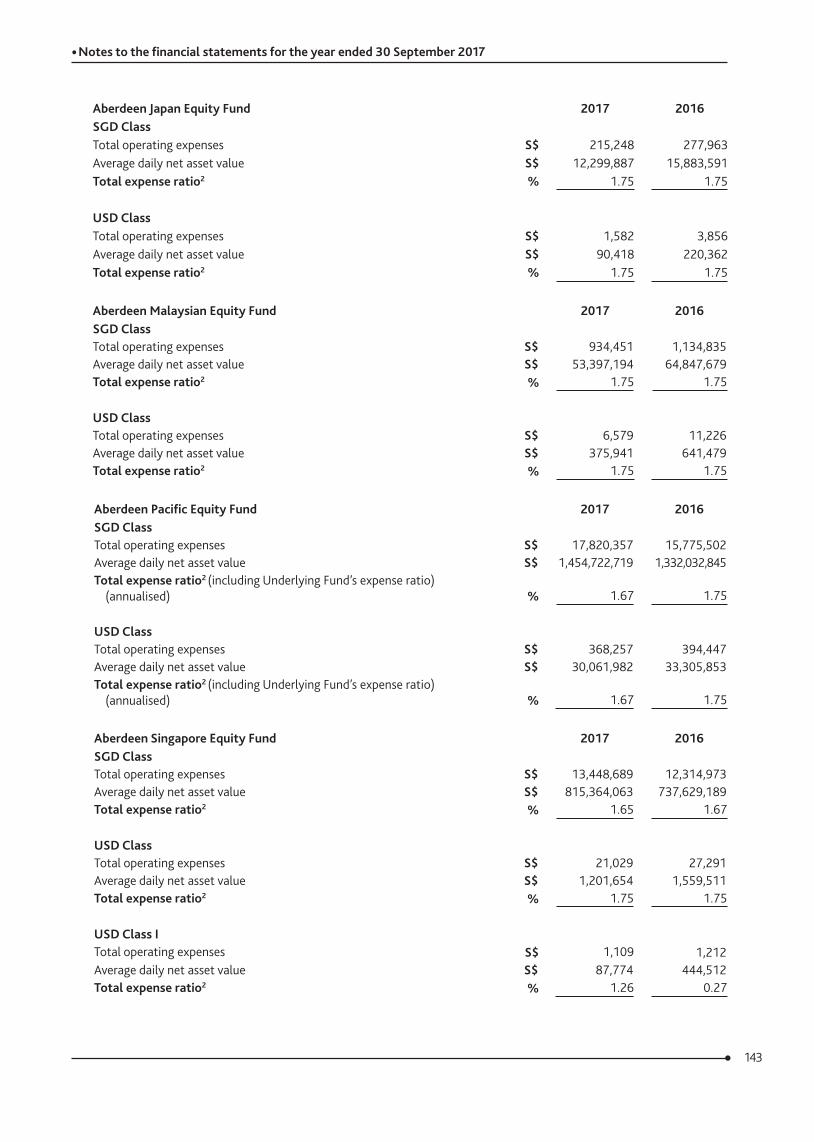
143
• Notes to the financial statements for the year ended 30 September 2017
Aberdeen Japan Equity Fund 2017 2016SGD ClassTotal operating expenses S$ 215,248 277,963Average daily net asset value S$ 12,299,887 15,883,591Total expense ratio2 % 1.75 1.75
USD ClassTotal operating expenses S$ 1,582 3,856Average daily net asset value S$ 90,418 220,362Total expense ratio2 % 1.75 1.75
Aberdeen Malaysian Equity Fund 2017 2016SGD ClassTotal operating expenses S$ 934,451 1,134,835Average daily net asset value S$ 53,397,194 64,847,679Total expense ratio2 % 1.75 1.75
USD ClassTotal operating expenses S$ 6,579 11,226Average daily net asset value S$ 375,941 641,479Total expense ratio2 % 1.75 1.75
Aberdeen Pacific Equity Fund 2017 2016SGD ClassTotal operating expenses S$ 17,820,357 15,775,502Average daily net asset value S$ 1,454,722,719 1,332,032,845Total expense ratio2 (including Underlying Fund’s expense ratio)
(annualised) % 1.67 1.75
USD ClassTotal operating expenses S$ 368,257 394,447Average daily net asset value S$ 30,061,982 33,305,853Total expense ratio2 (including Underlying Fund’s expense ratio)
(annualised) % 1.67 1.75
Aberdeen Singapore Equity Fund 2017 2016SGD ClassTotal operating expenses S$ 13,448,689 12,314,973Average daily net asset value S$ 815,364,063 737,629,189Total expense ratio2 % 1.65 1.67
USD ClassTotal operating expenses S$ 21,029 27,291Average daily net asset value S$ 1,201,654 1,559,511Total expense ratio2 % 1.75 1.75
USD Class ITotal operating expenses S$ 1,109 1,212Average daily net asset value S$ 87,774 444,512Total expense ratio2 % 1.26 0.27
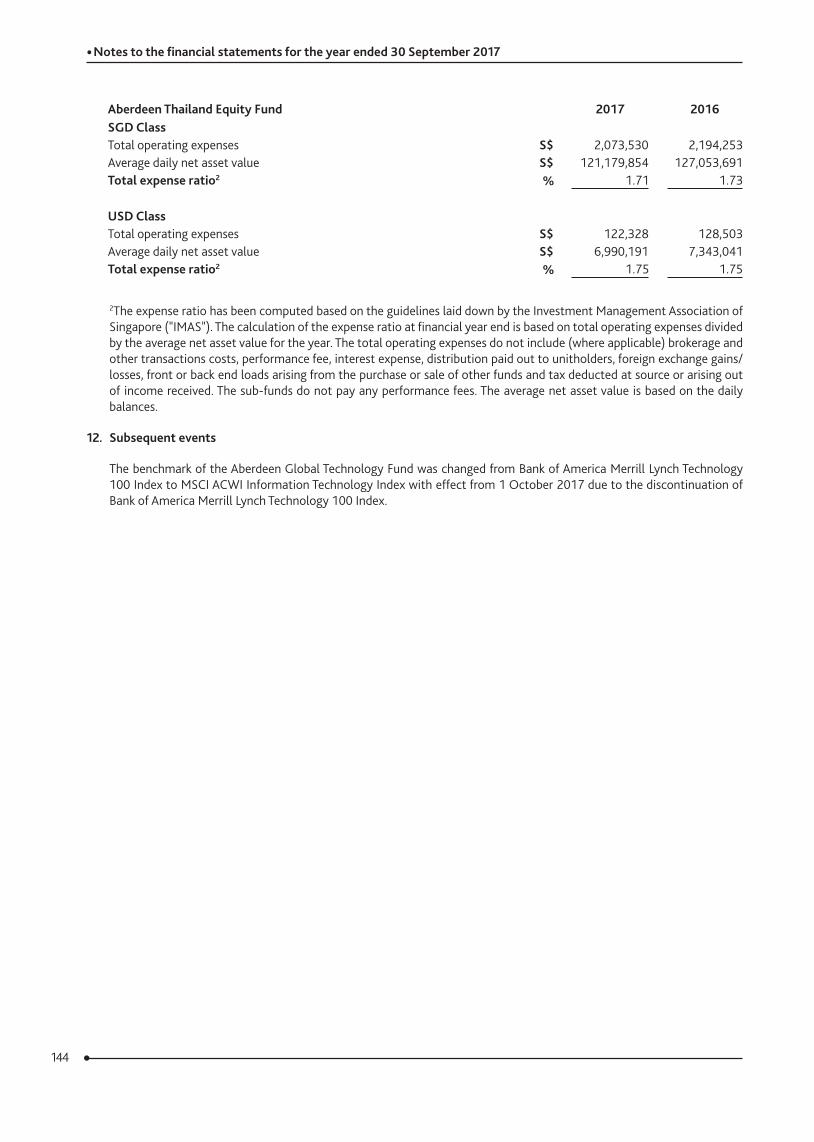
144
• Notes to the financial statements for the year ended 30 September 2017
Aberdeen Thailand Equity Fund 2017 2016SGD ClassTotal operating expenses S$ 2,073,530 2,194,253Average daily net asset value S$ 121,179,854 127,053,691Total expense ratio2 % 1.71 1.73
USD ClassTotal operating expenses S$ 122,328 128,503Average daily net asset value S$ 6,990,191 7,343,041Total expense ratio2 % 1.75 1.75
2The expense ratio has been computed based on the guidelines laid down by the Investment Management Association of Singapore ("IMAS"). The calculation of the expense ratio at financial year end is based on total operating expenses divided by the average net asset value for the year. The total operating expenses do not include (where applicable) brokerage and other transactions costs, performance fee, interest expense, distribution paid out to unitholders, foreign exchange gains/losses, front or back end loads arising from the purchase or sale of other funds and tax deducted at source or arising out of income received. The sub-funds do not pay any performance fees. The average net asset value is based on the daily balances.
12. Subsequent events
The benchmark of the Aberdeen Global Technology Fund was changed from Bank of America Merrill Lynch Technology 100 Index to MSCI ACWI Information Technology Index with effect from 1 October 2017 due to the discontinuation of Bank of America Merrill Lynch Technology 100 Index.
Important: The contents of this report are strictly for information purposes only and should not be considered an offer, or solicitation, to deal in any of the mentioned funds.
Aberdeen Asset Management Asia Limited (“Aberdeen Asia”) does not warrant the accuracy, adequacy or completeness of the information provided and expressly disclaims liability for any errors or omissions. Any projections or other forward looking statement regarding future events or performance of countries, markets or companies are not necessarily indicative of, and may differ from, actual events or results. No regard to the investment objectives, financial situation or particular needs of any specific investor has been taken into account in the preparation of the information provided.
Investments in and the rates of returns for any of the mentioned funds are not deposits in, obligations of, guaranteed or insured by Aberdeen Asia, the Aberdeen group of companies or Aberdeen Asia’s appointed distributors, and are subject to investment risks, including the possible loss of any principal amount invested. Unit values and any income therefrom for any of the mentioned funds may fall or rise. Past performance is not indicative of future performance.
Investors should read the prospectus and the product highlights sheet of the relevant funds, available from Aberdeen Asia or its website at www.aberdeen asia.com, and consider the suitability of any fund for his or her own needs or seek independent advice from a financial adviser, before making any investment commitment. Any person acting upon or in reliance of the information provided does so entirely at his or her own risk.
The fund(s) as well as their underlying fund(s) may use or invest in financial derivative instruments. Please refer to the prospectus of the fund(s) for more information.
The copyright in this report is owned by Aberdeen Asia. No part or parts hereof may be reproduced, copied, broadcast or transmitted in any manner or by any means or stored in any information retrieval systems without the written permission of Aberdeen Asia. The right to make any changes and corrections to the above information at any time and without notice, is hereby reserved.
Aberdeen Asset Management Asia Limited, Registration Number 199105448E

Aberdeen Asset Management Asia Limited(Registration Number 199105448E)
21 Church Street, #01-01 Capital Square TwoSingapore 049480Tel: 1800 395 2709Fax: +65 6632 2993
www.aberdeen-asia.com