Embed Size (px)
Citation preview
- 1 -
Ability grouping practices in the primary school: A survey
Susan Hallam, Judith Ireson, Veronica Lister, Indrani Andon Chaudhury, Institute of Education,
University of London and Jane Davies, University of Sunderland
Contact
Susan Hallam, Institute of Education, University of London, 20 Bedford Way, London,
WC1H OAA, E-mail [email protected]
Phone 020 7612 6371
Fax 020 7612 6766
- 2 -
Ability grouping practices in the primary school: A survey
Abstract
In 1997, the DfEE suggested that schools should consider ‘setting’ pupils by ability as it was
believed that this would contribute to raising standards. This survey of primary schools aimed to
establish the extent to which primary schools, with same and mixed age classes, implement
different grouping practices including setting, streaming, within class ability and mixed ability
groupings for different curriculum subjects. Schools were asked to complete a questionnaire
indicating their grouping practices for each subject in each year group. The findings showed that
schools predominantly adopted within class ability groupings, either mixed or ability grouped, for
most subjects. Ability grouping (within class and setting) was most common in mathematics,
followed by English and science. Its implementation increased as pupils progressed through
school. The type of setting adopted, same or cross age, tended to reflect the nature of the class
structures within the school.
- 3 -
Ability grouping practices in the primary school: A survey
Introduction
The education system in the UK has undergone considerable change over the last twenty years. A
National Curriculum has been introduced. All pupils take national tests at the ages of 7, 11 and
14. The results of these tests, public examinations taken at age 16 and 18, and figures for
attendance at school are made public for each individual school. National newspapers publish
performance league tables of schools and in each locality parents scrutinise performance when
selecting a school for their child. Schools are subject to rigorous inspection by the Office for
Standards in Education (Ofsted) and a form of performance related pay has been introduced for
teachers. At primary level, national Literacy and Numeracy Strategies have been implemented
which provide a pedagogical framework within which teachers ‘deliver the National Curriculum’.
In English, mathematics and science, schools are required to meet government targets for pupil
attainment placing them under considerable pressure to raise standards. To assist in achieving
these the government indicated that primary schools should consider ‘setting’ children by ability
(DfEE, 1997; OFSTED, 1998).
There is a long tradition of structured ability grouping in the UK. Following the separation of the
old ‘elementary’ schools into primary and secondary schools, the Primary School Report of 1930
recommended that children in primary schools should be grouped in classes according to ability
(streaming) where numbers allowed (Hadow Report, 1930). In practice, however, most primary
schools were too small to implement streaming. In 1944, the Butler Education Act, established
- 4 -
the need for ability grouping in primary schools to ensure effective selection for different types of
schooling at secondary level. Thus the practice of streaming became widespread in larger primary
schools throughout the 1940s and 1950s as pupils competed for grammar school places. Through
the 1950s it declined in popularity as research showed that it had no significant effect on overall
attainment, and had negative social consequences for certain pupils (Jackson, 1964; Barker Lunn,
1970). By the 1970s, surveys of primary school organisation found that of those schools that
were large enough to stream only about 20% chose to do so (Bealing, 1972; DES 1978). At this
time there was also a general trend in educational values towards a more child-centred approach
with emphasis on the overall development of the individual rather than on academic achievement;
and on equality of opportunity rather than the pursuit of excellence. The Plowden Report (1967)
reflected this trend, and was influential in encouraging schools towards ‘unstreaming’. With the
abolition of the 11+ examination and the spread of comprehensive secondary education, mixed
ability classes became the norm in primary schools, and there was a move away from formal
‘traditional’ teaching methods. In a survey of primary schools in 2 LEAs in the early 1990s, Lee
and Croll (1995) reported that less than 3% of the total adopted streaming by ability. Streaming
as a form of school organisation in primary schools had almost disappeared.
During the 1990s the main educational emphasis was on increasing standards. This coupled with
a widespread assumption that the best way to maximise academic success was by selective
grouping led to government guidelines promoting the use of setting. In 1993, all primary schools
were encouraged to introduce setting by the Department for Education (DfE Report, 16/93). This
was reinforced in 1997, by the Government White Paper ‘Excellence in Schools’ (1997) which
suggested that setting could be beneficial in raising standards. It stated that ‘setting should be the
- 5 -
norm in secondary schools. In some cases, it is worth considering in primary schools.’ The
document presented a case study of a primary school which implemented setting for maths. The
school reported significant benefits from the practice: it focused the range of attainment within a
class; it reduced the pressure on teachers; it enabled teachers to maintain appropriate pace and
challenge, and to make good use of whole-class teaching. The White Paper also set out national
targets for raising standards: by 2002 80% of 11-year-olds were required to reach standards
expected for their age in English, and 75% in maths. Schools were also required by law to
undertake baseline assessments of all children entering primary school, in the basics of language
and literacy, maths and personal and social development. These assessments were to be analysed
by LEAs to help schools measure children’s subsequent achievement.
Ofsted also took an interest in the ability grouping procedures adopted in schools. In the annual
report for 1995/6, it was noted that National Curriculum assessment was having a beneficial
influence on teaching. It led to a clearer focus on what was to be taught and there was more
precise targeting of groups of pupils, sometimes through teaching groups based on ability
(Ofsted, 1997). In 1998, the annual report (Ofsted, 1998) stated that the organisation of pupils
into sets was increasing, especially in years 5 and 6 for Maths and English. Against this
background, Ofsted commissioned a survey (Ofsted, 1998) exploring the prevalence of setting
and its effects. The survey analysed Ofsted inspection data, issued a postal questionnaire to a
random sample of 900 schools, conducted a telephone survey of a further 50 schools known to be
adopting setting procedures, made paired visits to a further 50 schools of varying types, sizes and
locations which were known to be using setting and visited a number of other schools with
distinctive features involving setting. The findings indicated that about 60% of junior schools set
- 6 -
for at least one subject in some year groups, while over one third of infant schools and about one
half of combined infant and junior schools did the same. The higher the number on roll, the more
likely the school was to use setting in one or more year groups. It was unusual to find a school of
one-form entry or below using setting. Most schools used setting in Years 5 and 6 only, with the
proportion of pupils setted for at least one subject falling steadily the younger the pupils were. Of
those schools that adopted setting procedures, the proportions that set for particular subjects were:
maths, 96%; English, 69%; Science, 9%. Very few schools set for other subjects. The inspection
evidence confirmed the above pattern and showed the use of setting to have increased compared
with previous years with a move away from within class ability groups in mixed ability classes
which had previously been the dominant form of grouping (Bealing, 1972).
The research reported here set out to provide detailed evidence regarding the ways that pupils are
currently grouped within the primary school either within or between classes for each National
Curriculum subject.
Methodology
A questionnaire was sent to 2000 primary, junior, and infant schools in England and Wales
randomly selected by computer to be representative of the school population. The first part of the
questionnaire requested information about: the type of LEA; whether the school was grant-
maintained; the type of school, i.e. primary, junior or infant; and the number of pupils on roll.
The second part requested information about the nature of grouping in and between classes for
different year groups and subjects. Alternative versions of this were provided to take account of
- 7 -
schools with only same-age classes or some or all mixed-age classes i.e. where pupils from
different year groups are registered together as a class. Schools were requested to complete a grid
where codes for grouping practices were to be entered for each year group or cross age class,
from reception to year 6 by subject: mathematics, English, science, geography, history,
information technology, art, design and technology, music, religious education, physical
education and other. The categories for different types of grouping were as follows:
Mixed ability groups within a mixed ability class;
Ability groups within a mixed ability class;
Set according to ability, i.e. children taken from different classes to make up groups based
on ability, regardless of age;
Set according to ability and age/s, i.e. children taken from different classes of children of
the same age/s and grouped according to ability;
Streamed, i.e. pupils assigned to a class, where they remain consistently, according to
their overall ability;
Combination of approaches
Other arrangements in place
Respondents were also able to indicate that a response was not applicable or that they did not
know the nature of the arrangements.
The response rate was marginally lower than that obtained (44%) in the Ofsted survey (1998).
Eight hundred and four schools responded representing a 40% response rate. Thirty four schools
returned the questionnaires incomplete or telephoned the researchers indicating that they were
under such pressure that they did not have time to complete them. To avoid increasing this
- 8 -
burden, a decision was taken not to send out follow up letters to increase the number of returned
questionnaires. Of the schools which returned usable questionnaires 498 (65%) were primary, 94
(12%) were junior, and 135 (18%) were infant. The remaining 5% did not specify. 16% of
schools had under 100 on roll, 30% under 200, 27% under 300, 13% under 400, 7% under 500,
and 2% over 500. Of the schools with under 100 on roll, 88 were primary, 17 were infant and
none were junior. Of the infant schools, most had between 200 and 400 on roll, with only 4
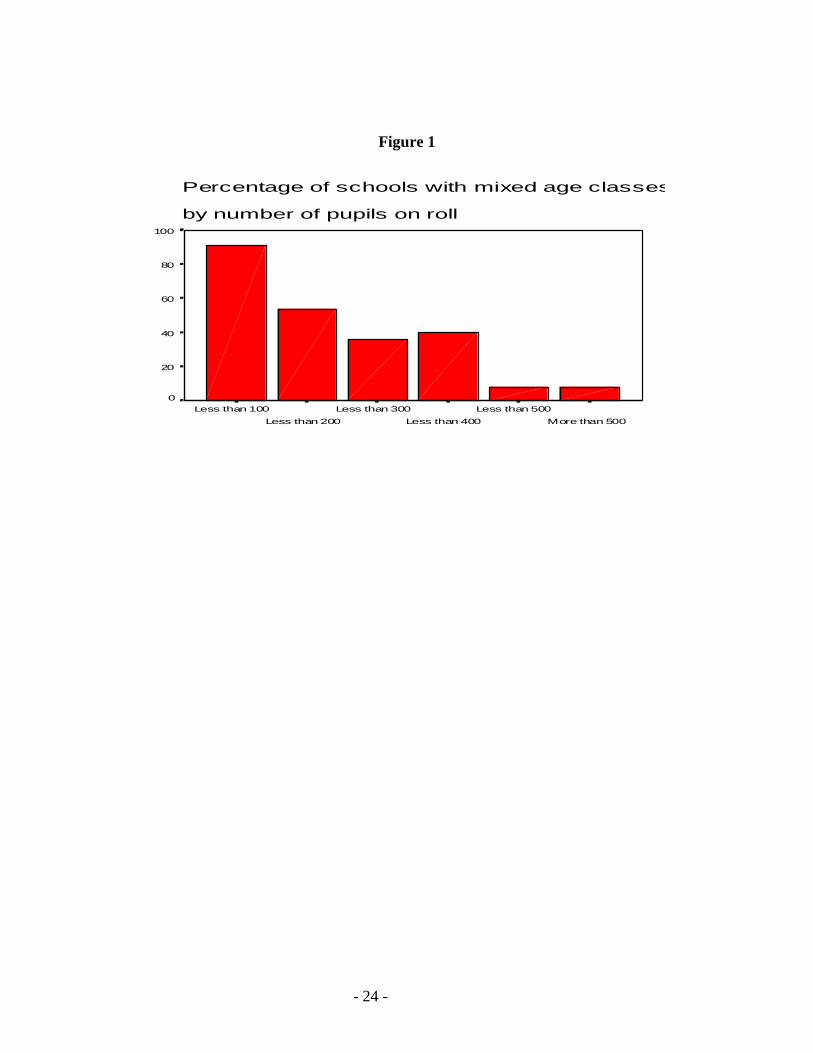
having over 400. Of those schools with less than 100 on roll, only 9% had no mixed age classes.
This percentage increased steadily. Of schools with over 400 on roll, 92% had no mixed-age
classes. Figure 1 shows the percentage of mixed age classes by number on roll. A substantial
proportion of schools with between 100 and 400 pupils on roll had mixed age classes increasing
to 91% with under 100 pupils.
Figure 1 about here
Of the schools returning questionnaires, 68% were from County LEAs, 23% were from
Metropolitan or Unitary Authorities and 9% were from London Boroughs. The largest percentage
of the smaller schools occurred in the County LEAs. The highest percentage of very large schools
were in the London Boroughs. 23% of the County schools had less than 100 on roll. 82% of
County schools had less than 300, compared to 72% of Metropolitan or Unitary Authorities and
53% of London schools.
Analysis of the data
- 9 -
The schools were fairly evenly divided between those who had mixed age (47%) and non-mixed
age (53%) classes. To enable meaningful analysis of changes in grouping practices across age
groups it was necessary to analyse the data for these two groups separately.
Schools with same age classes
Streaming
The incidence of streaming in schools with same age classes was very small. One school
practised streaming in year 1, and two in years 2, 3 and 4. Four schools adopted streaming
practices in years 5 and 6, although in one this was not in all subject areas and might more
properly be described as partial streaming. There was one instance of streaming in a reception
class, across maths, English and science only. In total, less than 2% of schools adopted any form
of streaming.
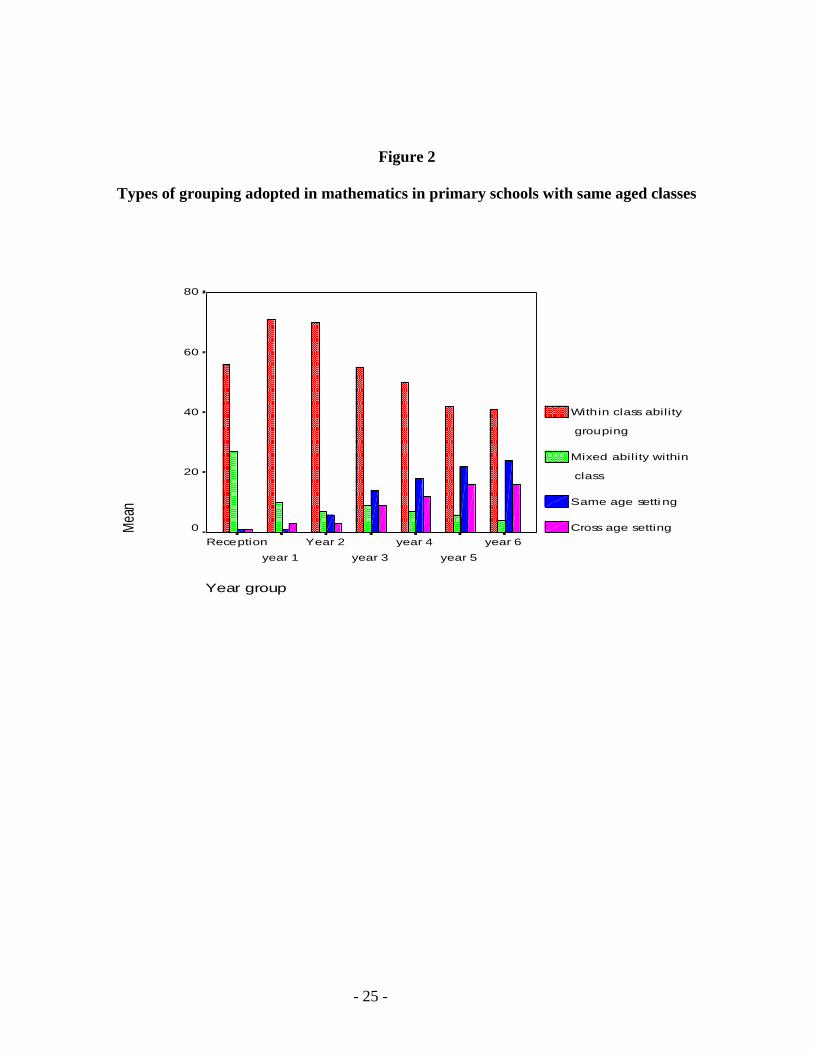
Mathematics
Ability grouping was most common in mathematics. Fifty six percent of reception classes were
taught in within class ability groups, rising to 71 % and 72% in years 1 and 2 respectively. In
year 3 the figure dropped to 48%, falling to 41% by year 6. The reduction occurred because 38%
of year 5 and 39% of year 6 Maths classes were setted. Setting in same age classes rose from 1%
in reception to 24% in Year 6. Cross age setting also increased. In reception classes, 0.8% of all
maths classes adopted cross-age setting, rising to 15% in year 6 with the greatest proportion
- 10 -
(16%) occurring in year 5. Taking the figures for setting, streaming and within class ability
grouping together, in year 6 only 4% of pupils were taught in mixed ability groups. Maths,
particularly in the higher year groups is perceived as best taught to homogeneous groups. Figure
2 outlines the percentage of each type of grouping adopted in each year group.
Figure 2 about here
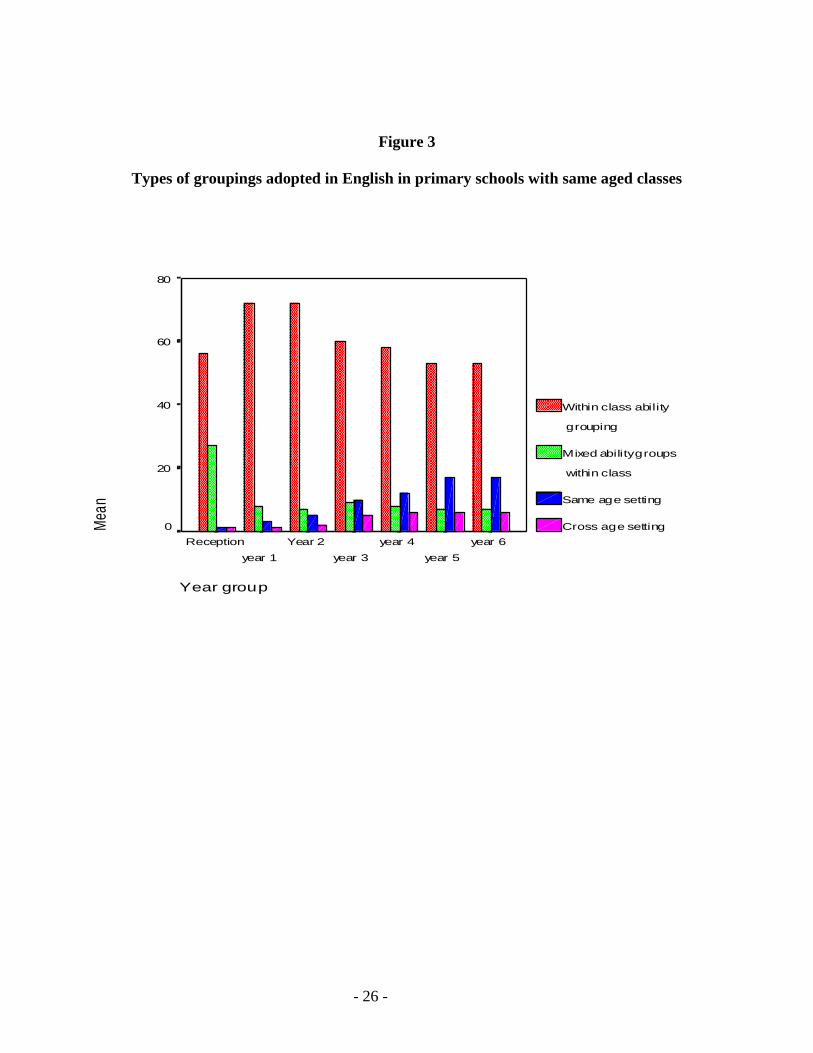
English
In English the pattern was similar to that in mathematics. Within class ability grouping was
highest at 72% in years 1 and 2, dropping to 53% in years 5 and 6 again because of the increase
in setting. Same-age setting rose from 1 % in reception to 17% in years 5 and 6. Under 1% of all
schools adopted cross-age setting in reception classes, rising to 6% in years 4, 5 and 6. There
was less cross age setting than in maths. Between 7% and 9% were taught in mixed ability groups
except in reception classes, where the figure was 27%. Overall, there was less ability grouping in
English than maths. Figure 3 shows the comparative adoption of the different types of grouping.
Figure 3 about here
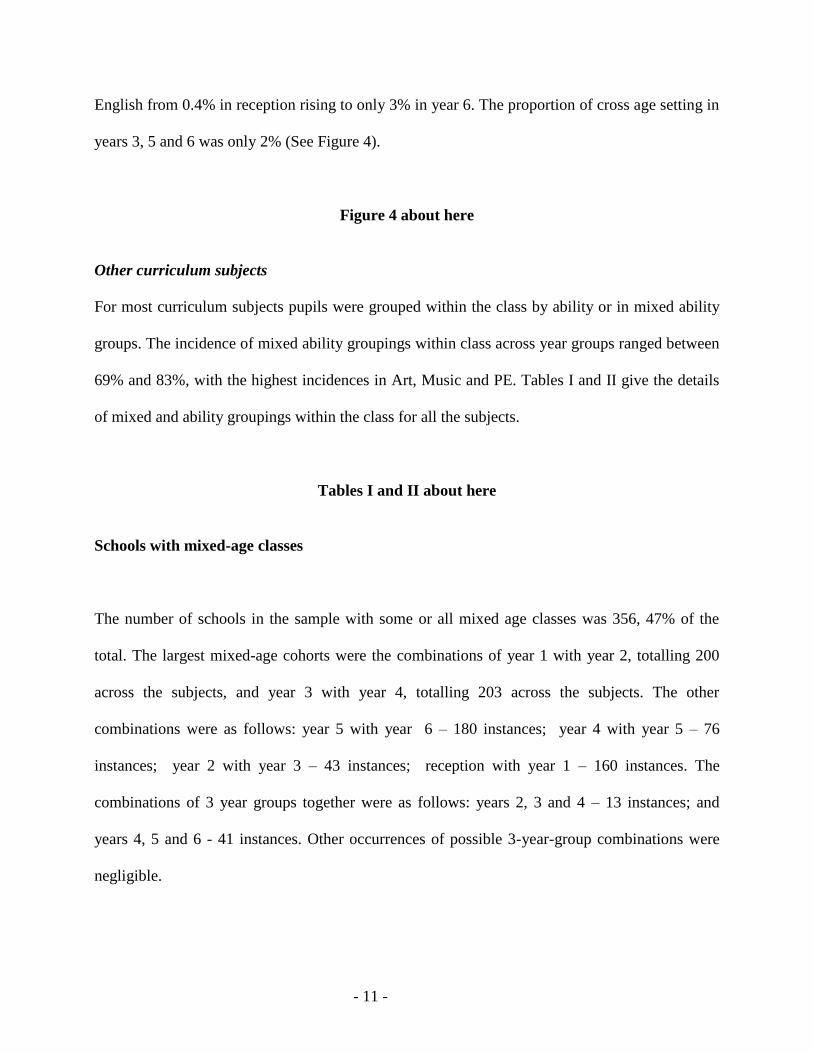
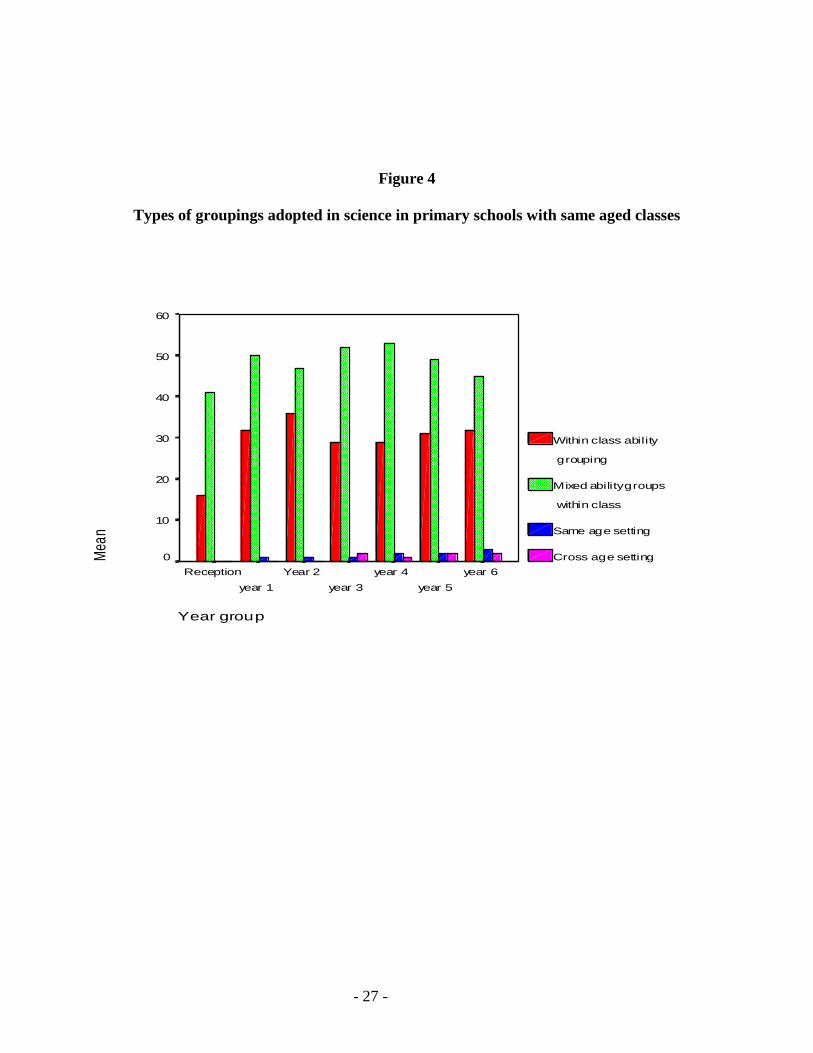
Science
There was very little setting in science, perhaps because the curriculum is perceived to lend itself
to group work. There was a high incidence of mixed ability groups, 45-50% in all years except
reception where the figure was 61%. Within class ability grouping followed a more consistent
pattern than mathematics and English across the year groups; 23% in reception, 32% in year 6,
peaking at 36% in year 3. The proportion of same age setting was less than mathematics and
- 11 -
English from 0.4% in reception rising to only 3% in year 6. The proportion of cross age setting in
years 3, 5 and 6 was only 2% (See Figure 4).
Figure 4 about here
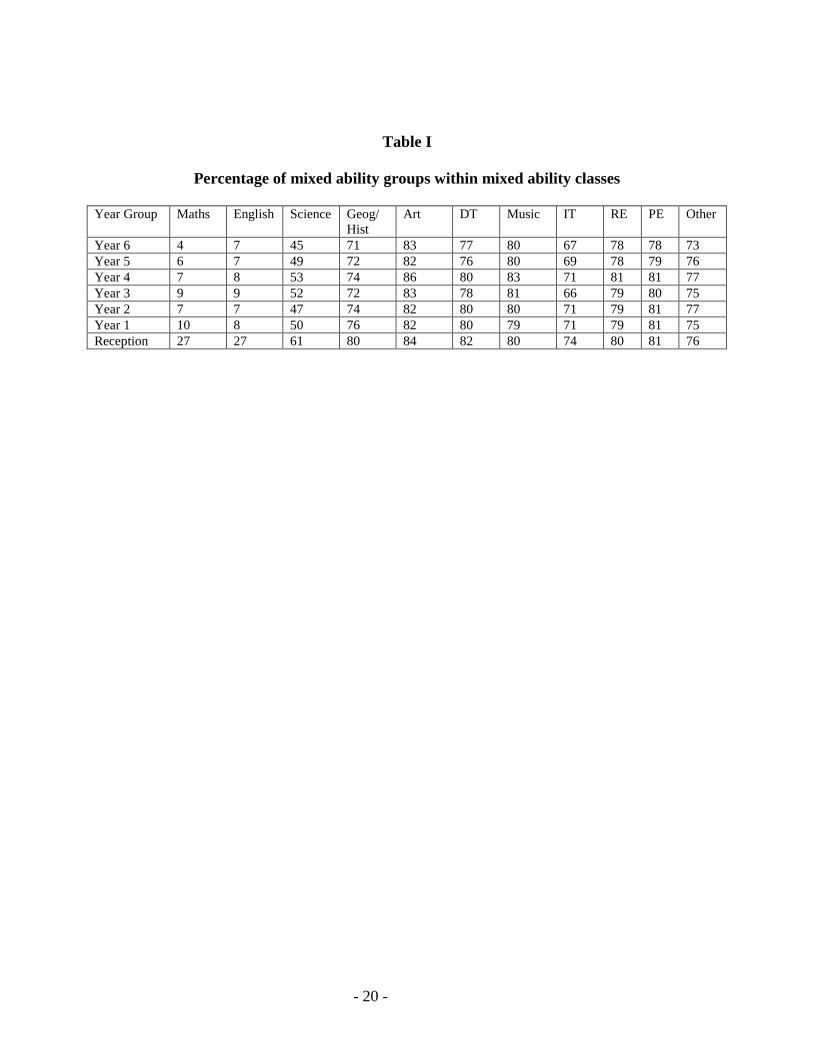
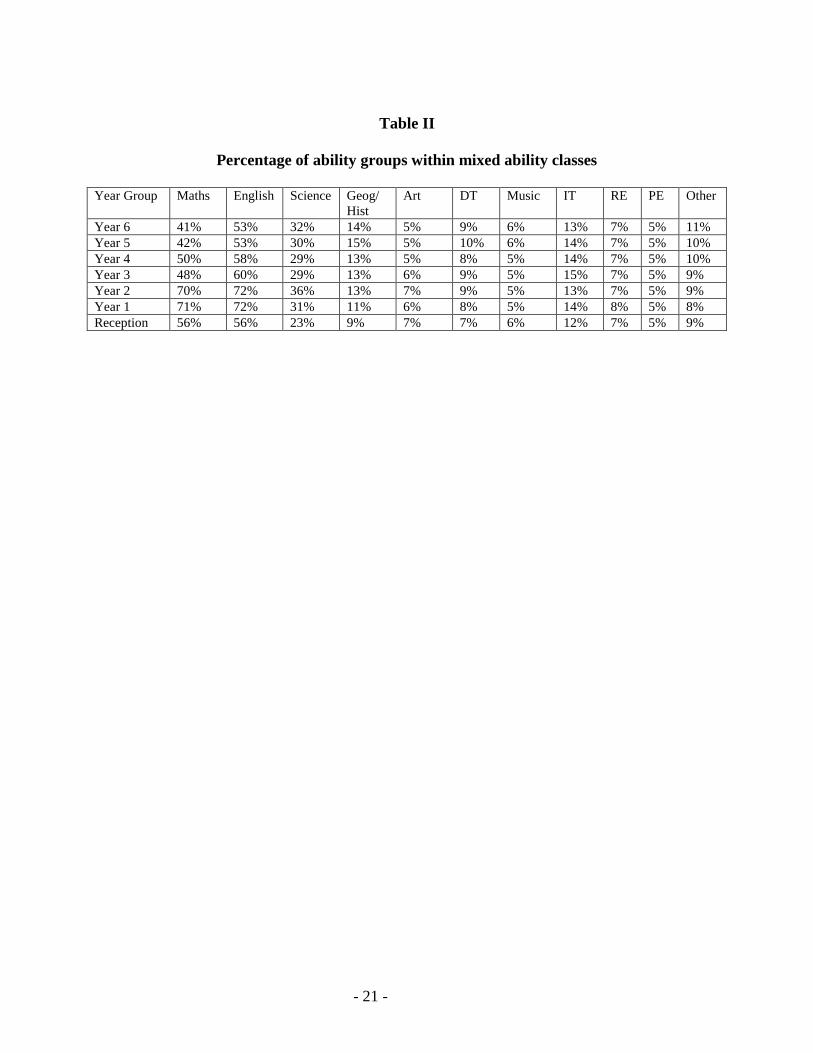
Other curriculum subjects
For most curriculum subjects pupils were grouped within the class by ability or in mixed ability
groups. The incidence of mixed ability groupings within class across year groups ranged between
69% and 83%, with the highest incidences in Art, Music and PE. Tables I and II give the details
of mixed and ability groupings within the class for all the subjects.
Tables I and II about here
Schools with mixed-age classes
The number of schools in the sample with some or all mixed age classes was 356, 47% of the
total. The largest mixed-age cohorts were the combinations of year 1 with year 2, totalling 200
across the subjects, and year 3 with year 4, totalling 203 across the subjects. The other
combinations were as follows: year 5 with year 6 – 180 instances; year 4 with year 5 – 76
instances; year 2 with year 3 – 43 instances; reception with year 1 – 160 instances. The
combinations of 3 year groups together were as follows: years 2, 3 and 4 – 13 instances; and
years 4, 5 and 6 - 41 instances. Other occurrences of possible 3-year-group combinations were
negligible.
- 12 -
Streaming
There were very few instances of streaming in schools with mixed age classes: one in
reception/year 1 and one in year l/year 2. There was one in year 3/year 4 which did not include
maths and two instances in year 5/year 6 which applied to Maths, English and Science only.
These totalled slightly above 1%.
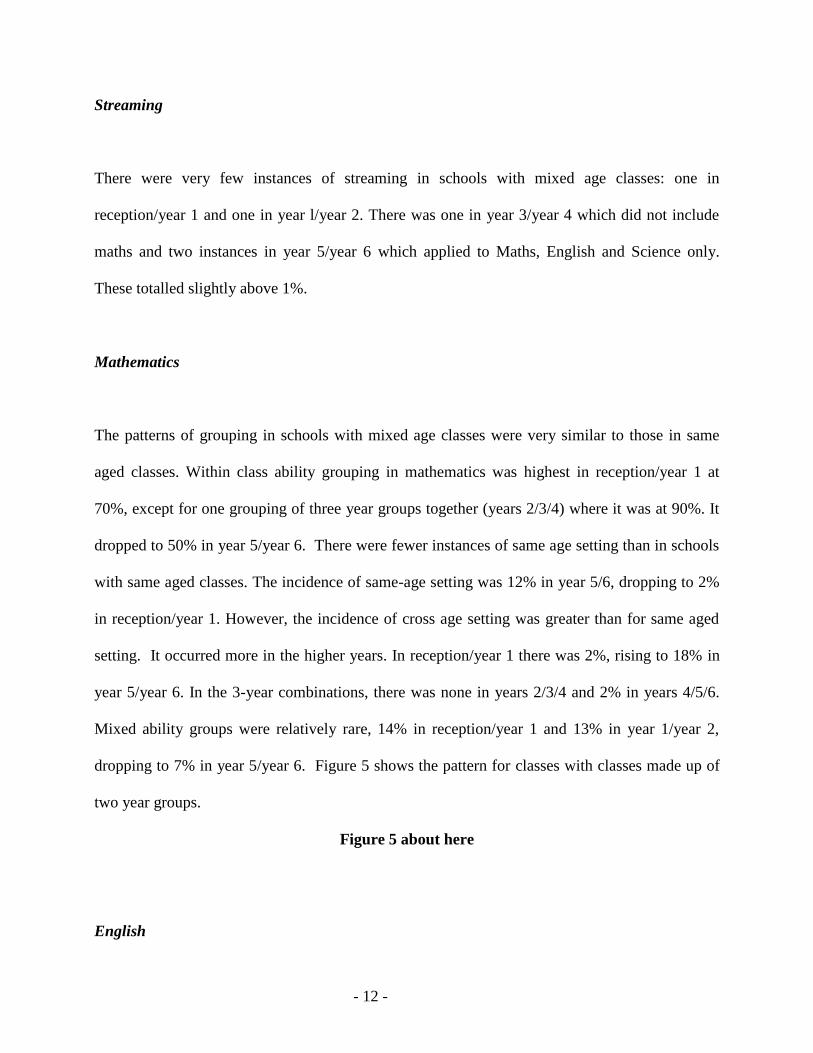
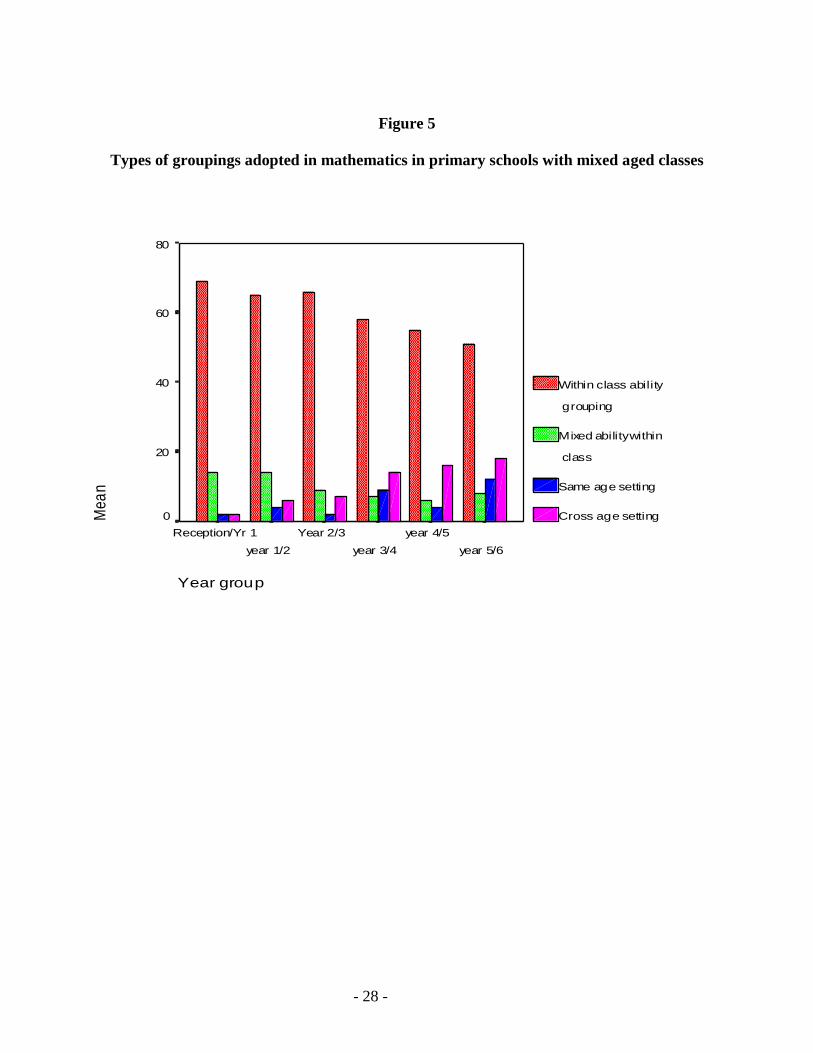
Mathematics
The patterns of grouping in schools with mixed age classes were very similar to those in same
aged classes. Within class ability grouping in mathematics was highest in reception/year 1 at
70%, except for one grouping of three year groups together (years 2/3/4) where it was at 90%. It
dropped to 50% in year 5/year 6. There were fewer instances of same age setting than in schools
with same aged classes. The incidence of same-age setting was 12% in year 5/6, dropping to 2%
in reception/year 1. However, the incidence of cross age setting was greater than for same aged
setting. It occurred more in the higher years. In reception/year 1 there was 2%, rising to 18% in
year 5/year 6. In the 3-year combinations, there was none in years 2/3/4 and 2% in years 4/5/6.
Mixed ability groups were relatively rare, 14% in reception/year 1 and 13% in year 1/year 2,
dropping to 7% in year 5/year 6. Figure 5 shows the pattern for classes with classes made up of
two year groups.
Figure 5 about here
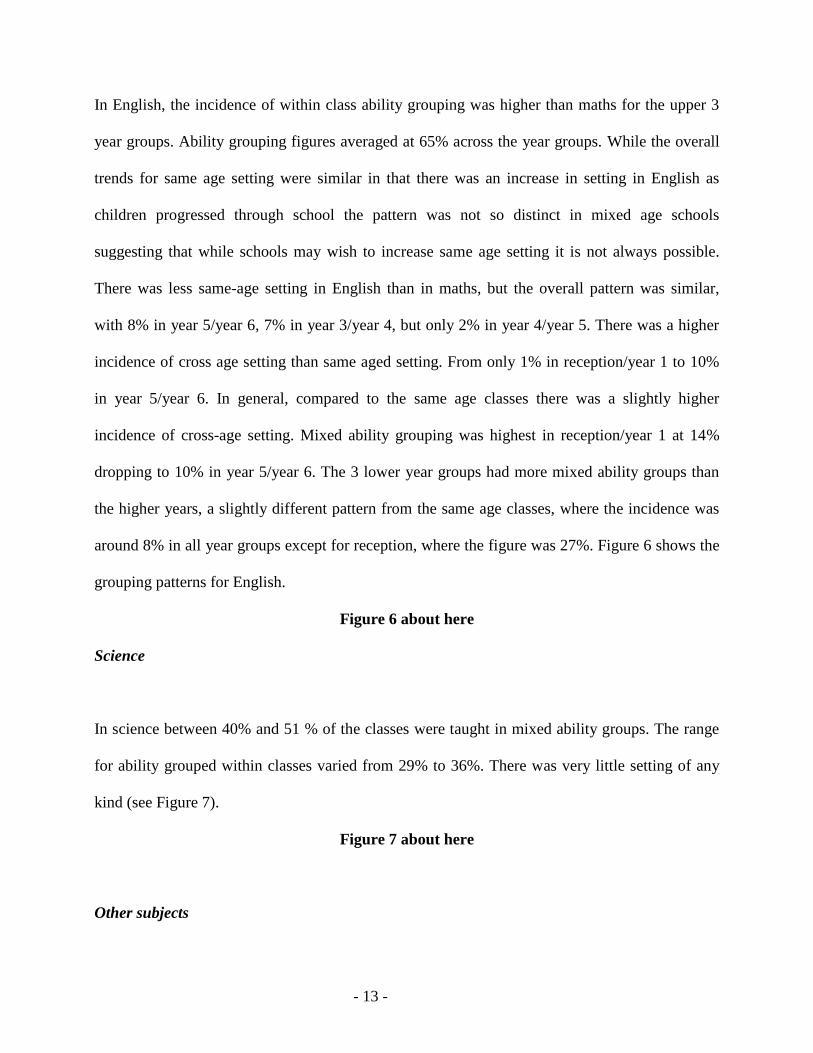
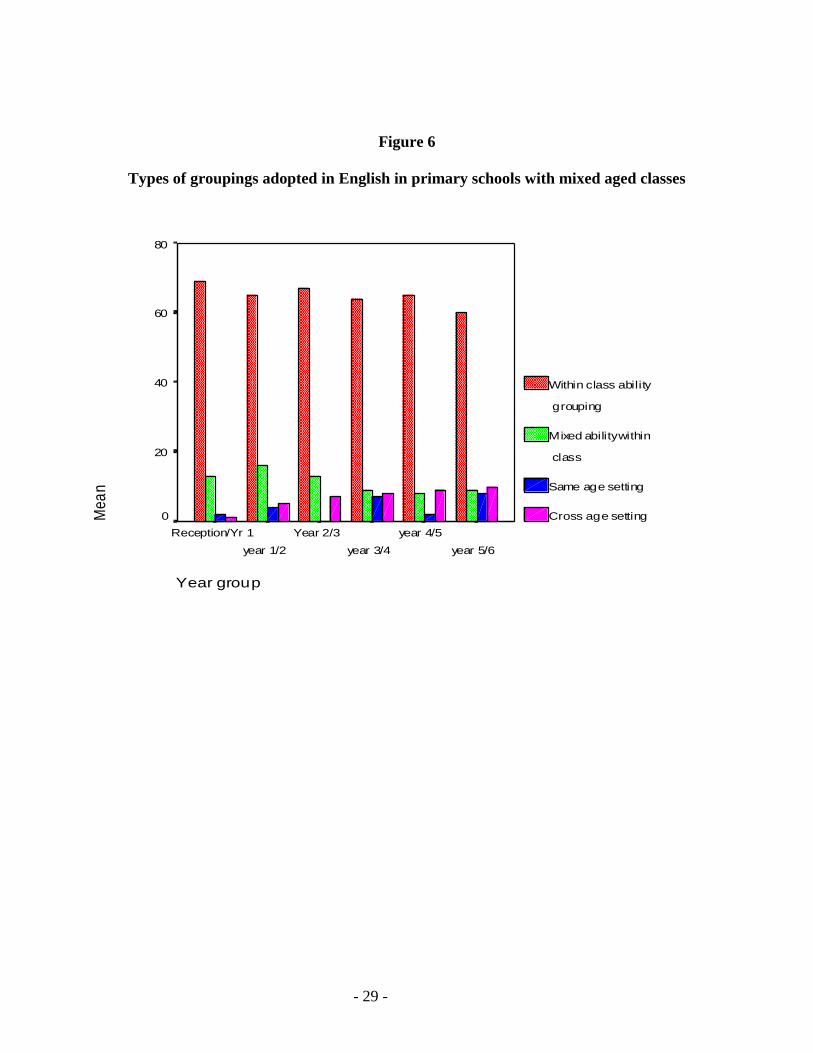
English
- 13 -
In English, the incidence of within class ability grouping was higher than maths for the upper 3
year groups. Ability grouping figures averaged at 65% across the year groups. While the overall
trends for same age setting were similar in that there was an increase in setting in English as
children progressed through school the pattern was not so distinct in mixed age schools
suggesting that while schools may wish to increase same age setting it is not always possible.
There was less same-age setting in English than in maths, but the overall pattern was similar,
with 8% in year 5/year 6, 7% in year 3/year 4, but only 2% in year 4/year 5. There was a higher
incidence of cross age setting than same aged setting. From only 1% in reception/year 1 to 10%
in year 5/year 6. In general, compared to the same age classes there was a slightly higher
incidence of cross-age setting. Mixed ability grouping was highest in reception/year 1 at 14%
dropping to 10% in year 5/year 6. The 3 lower year groups had more mixed ability groups than
the higher years, a slightly different pattern from the same age classes, where the incidence was
around 8% in all year groups except for reception, where the figure was 27%. Figure 6 shows the
grouping patterns for English.
Figure 6 about here
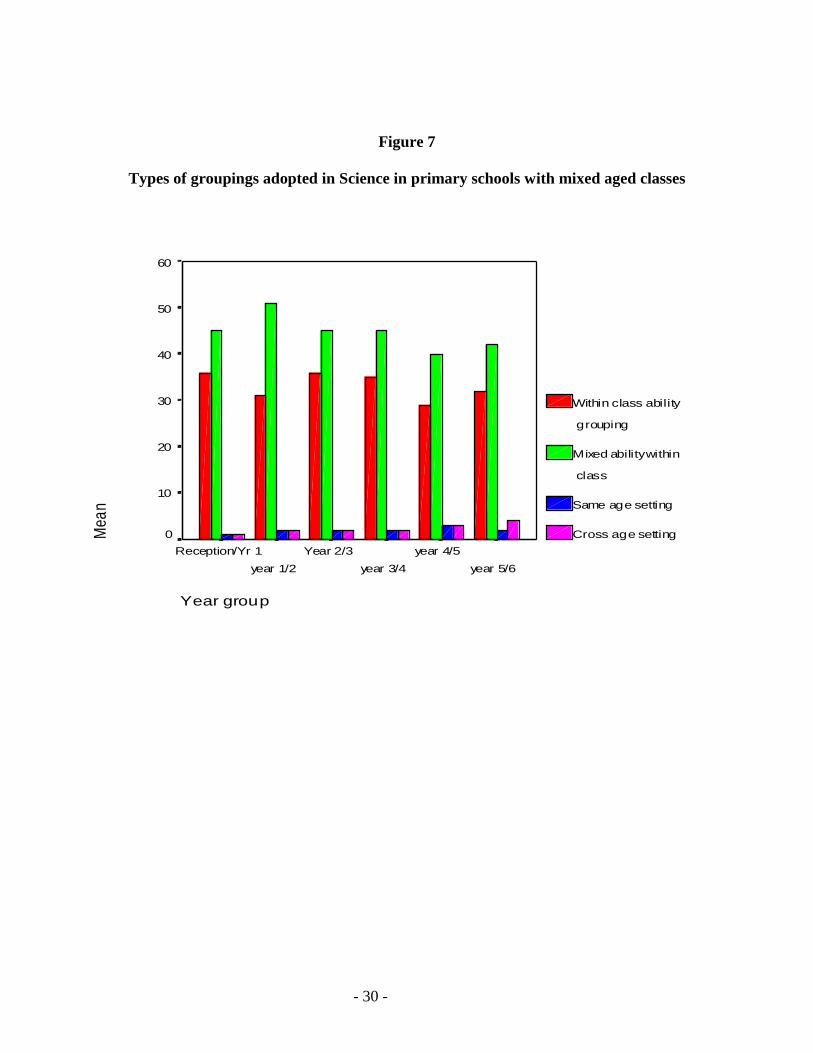
Science
In science between 40% and 51 % of the classes were taught in mixed ability groups. The range
for ability grouped within classes varied from 29% to 36%. There was very little setting of any
kind (see Figure 7).
Figure 7 about here
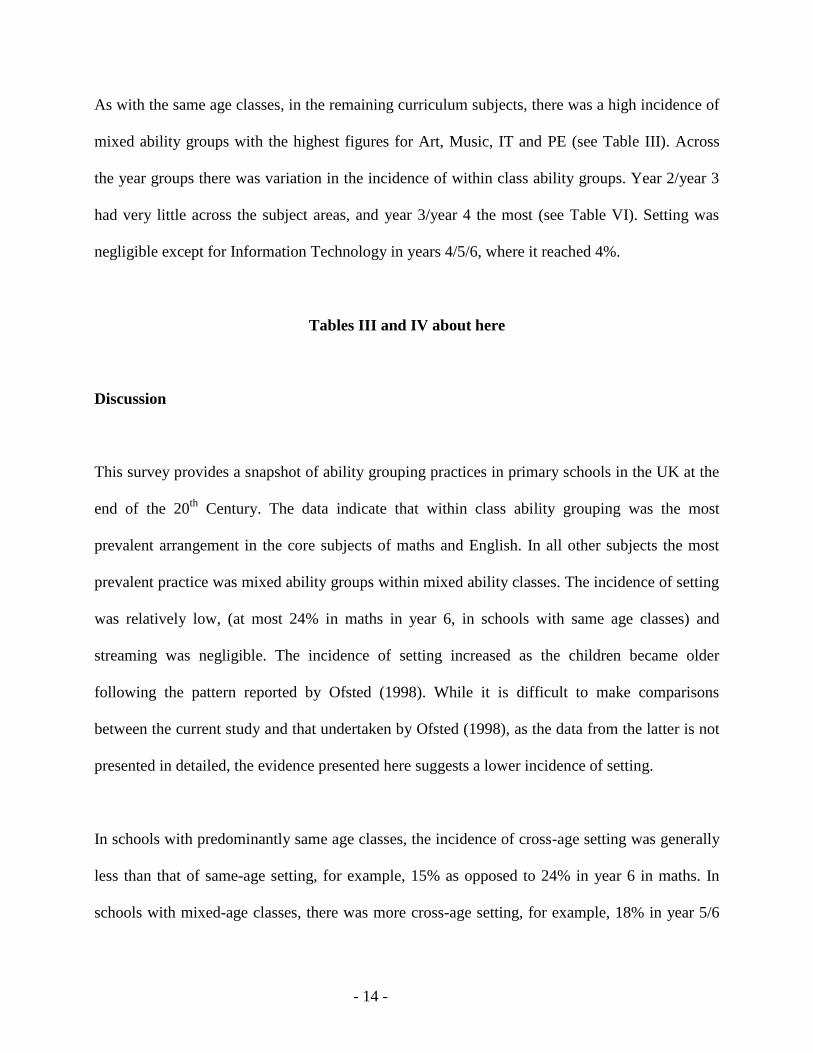
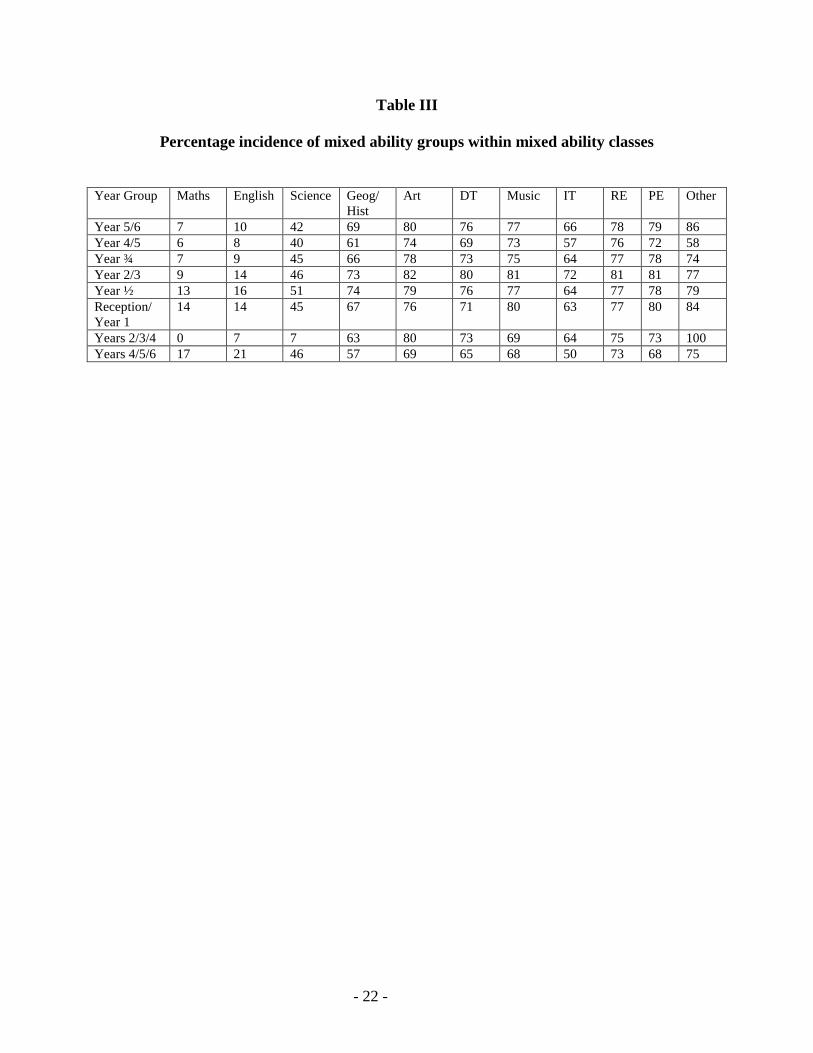
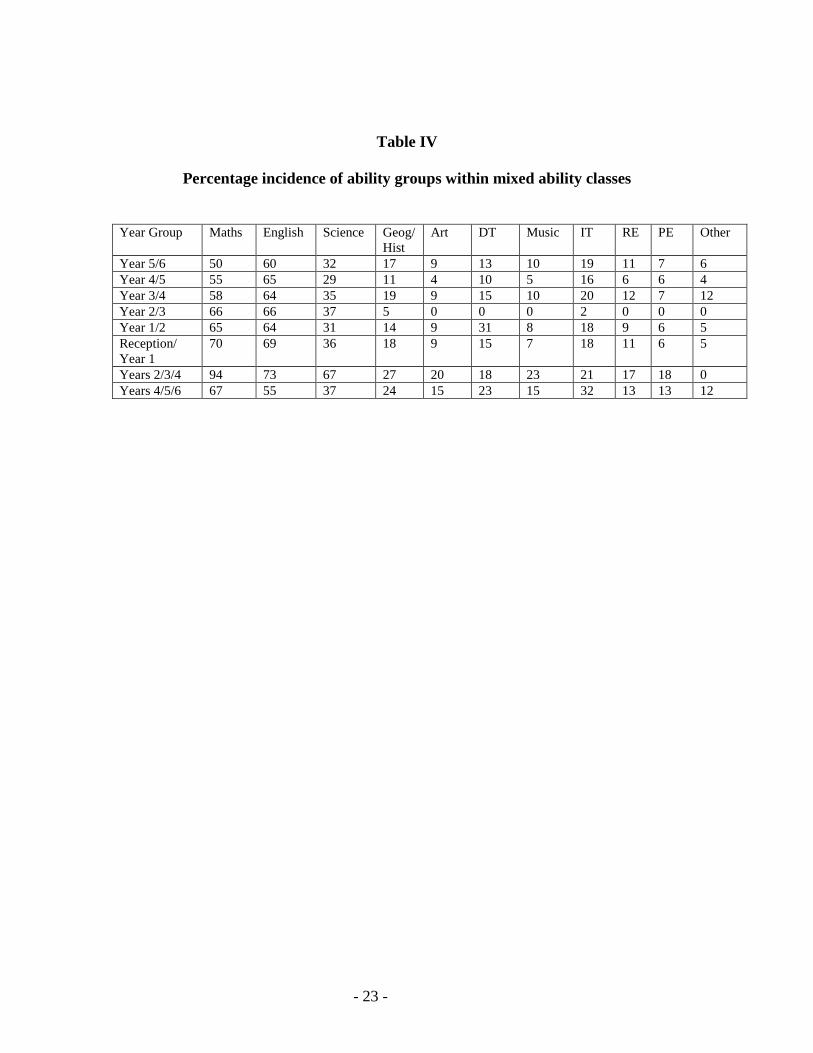
Other subjects
- 14 -
As with the same age classes, in the remaining curriculum subjects, there was a high incidence of
mixed ability groups with the highest figures for Art, Music, IT and PE (see Table III). Across
the year groups there was variation in the incidence of within class ability groups. Year 2/year 3
had very little across the subject areas, and year 3/year 4 the most (see Table VI). Setting was
negligible except for Information Technology in years 4/5/6, where it reached 4%.
Tables III and IV about here
Discussion
This survey provides a snapshot of ability grouping practices in primary schools in the UK at the
end of the 20th
Century. The data indicate that within class ability grouping was the most
prevalent arrangement in the core subjects of maths and English. In all other subjects the most
prevalent practice was mixed ability groups within mixed ability classes. The incidence of setting
was relatively low, (at most 24% in maths in year 6, in schools with same age classes) and
streaming was negligible. The incidence of setting increased as the children became older
following the pattern reported by Ofsted (1998). While it is difficult to make comparisons
between the current study and that undertaken by Ofsted (1998), as the data from the latter is not
presented in detailed, the evidence presented here suggests a lower incidence of setting.
In schools with predominantly same age classes, the incidence of cross-age setting was generally
less than that of same-age setting, for example, 15% as opposed to 24% in year 6 in maths. In
schools with mixed-age classes, there was more cross-age setting, for example, 18% in year 5/6
- 15 -
maths compared with 12% same age setting. Other subjects showed the same pattern. As same
aged setting in a mixed-age class would enable pupils to work within their age group and might
facilitate more focused preparation for national examinations it is perhaps surprising that this was
not more widely adopted in the mixed-age classes. One possible explanation for this might be a
lack of sufficient resources in schools.
More setting occurred in mathematics than in any other subject, steadily increasing towards the
end of Key Stage 2, although even here the most common form of organisation throughout both
primary Key Stages was ability grouping within the classroom. In English after reception, classes
were largely grouped according to ability within the class. There was much less setting than in
maths. In science, as in the other curriculum subjects, grouping was mainly mixed ability. These
differences in grouping strategies may reflect the perceived nature of each subject domain.
Mathematics and the basic skills acquired in English at primary level are viewed as building on
existing knowledge. Teachers, therefore, perceive that it is important to closely match the
teaching to the current levels of skill. In addition, in both cases, differentiation by outcome is
perceived as more difficult than in other subject areas (Reid et al, 1982; Ireson and Hallam,
2001).
In humanities and IT a small proportion of schools adopted within class ability grouping. The
proportion was similar across same and mixed age classes. In schools with predominantly same
aged classes within class ability grouping was reported for 11% of ‘other’ classes, predominantly
modern foreign languages, which are perceived by teachers to build on prior knowledge in much
the same way as mathematics (Reid et al., 1982; Ireson and Hallam, 2001). In the mixed age
- 16 -
classes, within class ability grouping was adopted more frequently than in the same age classes
for Design and Technology. Few schools with mixed age classes reported within class groupings
for the ‘other’ category.
There was a large number of mixed-age classes in the sample: 356 out of 765 schools had some
or all mixed age classes. Of those schools 91% had under 100 pupils and were classed as ‘small
primary schools’. The planning for mixed age classes particularly at Key stage 2 was complicated
for small schools. Some had classes across Key stages, although in the present sample there were
only 43 instances of year 2 with year 3 and 13 of years 2, 3 and 4 being taught together. For all
schools issues of resources constrained the possibilities for adopting different kinds of pupil
grouping. In small schools, working within tight financial constraints, there was little opportunity
to flexibly deploy resources to enable setting to take place (Hallam et al, in press).
The findings reported here indicate that in most primary schools pupils continue to be grouped
within their classes by ability or in mixed ability groups despite government guidance to increase
the use of setting. Lee and Croll (1995) demonstrated that teachers and head teachers were not
driven by dogma in developing their grouping policies and this research supports that view. A
range of factors determine decisions about the organisation of classes and the groupings within
them including evidence of results, both within the school and from larger research projects;
issues relating to classroom management and whether the school has the resources and facilities
to implement the desired groupings (Hallam et al., in press). If governments wish to change
practices in schools it seems that exhortation alone will not suffice. Schools need to be convinced
that what they are being asked to implement will work and also be given sufficient resources to
- 17 -
make the necessary changes. In relation to setting school’s caution seems to be justified. Recent
evidence, from primary and secondary schools, indicates that ability grouping, of itself, does not
raise standards, and in some cases can lower them (Whitburn, 2001, Ireson and Hallam, 2001;
Wiliam and Bartholomew, 2001). It can also have detrimental effects on pupils’ personal and
social development (Ireson and Hallam, 2001; Hallam et al., in press).
References
BARKER LUNN, J.C. (1970) Streaming in the primary school: a Longitudinal Study of
Children in Streamed and Non-streamed Junior Schools. (Slough, NFER)
BEALING, D. (1972) The organisation of junior school classrooms, Educational Research,
14(3), pp. 231-5.
DAVIES, J, HALLAM, S. & IRESON, J. (submitted to Cambridge Journal of Education) Ability
groupings in the primary school: how manageable are they in practice?
DEPARTMENT OF EDUCATION AND SCIENCE (1978) Primary Education in England: A
survey by HM Inspectors of Schools. (London, HMSO)
DEPARTMENT FOR EDUCATION (1993) Improving primary education – Patten (DfE News
16/93). (London, DfE)
- 18 -
DEPARTMENT FOR EDUCATION AND EMPLOYMENT (1997) Excellence in schools
(London, HMSO)
GREAT BRITAIN. STATUTES (1944) Education Act 1944. Chapter 31. (London, HMSO)
HADOW REPORT. GREAT BRITAIN. BOARD OF EDUCATION. CONSULTATIVE
COMMITTEE ON THE PRIMARY SCHOOL (1930) The primary school (London, HMSO)
HALLAM, S., IRESON, J., & DAVIES, J. (in press) Effective pupil grouping in the primary
school – a practical guide (London, Fulton)
IRESON, J. & HALLAM, S. (2001) Ability grouping in education (London, Sage Publications)
JACKSON, B. (1964) Streaming: an education system in miniature. London: Routledge and
Kegan Paul.
LEE J., & CROLL, P. (1995) Streaming and subject specialism at key stage 2: a survey in two
local authorities, Educational Studies, 21(2), pp. 155-65.
OFFICE FOR STANDARDS IN EDUCATION (1998) Setting in Primary Schools: A report
from the Office of Her Majesty’s Chief Inspector of Schools (London, HMSO)
- 19 -
PLOWDEN REPORT. GREAT BRITAIN. DEPARTMENT OF EDUCATION AND SCIENCE.
CENTRAL ADVISORY COUNCIL FOR EDUCATION (ENGLAND) (1967) Children and
their primary schools. (London, HMSO)
REID, M.E., CLUNIES-ROSS, L.R., GOACHER, B., & VILE, D. (1982) Mixed ability teaching:
Problems and possibilities (Windsor: NFER-Nelson).
WHITBURN, J. (2001) Effective classroom organisation in primary schools: mathematics, Oxford
Review of Education, 27 (3), 411-428.
WILIAM, D. & BARTHOLOMEW, H. (2001) The influence of ability grouping practices on
student achievement in mathematics, Paper presented at the Annual Conference of the British
Educational Research Association, 12th
to 15th
September, University of Leeds, Leeds, UK
- 20 -
Table I
Percentage of mixed ability groups within mixed ability classes Year Group Maths English Science Geog/
Hist
Art DT Music IT RE PE Other
Year 6 4 7 45 71 83 77 80 67 78 78 73
Year 5 6 7 49 72 82 76 80 69 78 79 76
Year 4 7 8 53 74 86 80 83 71 81 81 77
Year 3 9 9 52 72 83 78 81 66 79 80 75
Year 2 7 7 47 74 82 80 80 71 79 81 77
Year 1 10 8 50 76 82 80 79 71 79 81 75
Reception 27 27 61 80 84 82 80 74 80 81 76
- 21 -
Table II
Percentage of ability groups within mixed ability classes
Year Group Maths English Science Geog/
Hist
Art DT Music IT RE PE Other
Year 6 41% 53% 32% 14% 5% 9% 6% 13% 7% 5% 11%
Year 5 42% 53% 30% 15% 5% 10% 6% 14% 7% 5% 10%
Year 4 50% 58% 29% 13% 5% 8% 5% 14% 7% 5% 10%
Year 3 48% 60% 29% 13% 6% 9% 5% 15% 7% 5% 9%
Year 2 70% 72% 36% 13% 7% 9% 5% 13% 7% 5% 9%
Year 1 71% 72% 31% 11% 6% 8% 5% 14% 8% 5% 8%
Reception 56% 56% 23% 9% 7% 7% 6% 12% 7% 5% 9%
- 22 -
Table III
Percentage incidence of mixed ability groups within mixed ability classes
Year Group Maths English Science Geog/
Hist
Art DT Music IT RE PE Other
Year 5/6 7 10 42 69 80 76 77 66 78 79 86
Year 4/5 6 8 40 61 74 69 73 57 76 72 58
Year ¾ 7 9 45 66 78 73 75 64 77 78 74
Year 2/3 9 14 46 73 82 80 81 72 81 81 77
Year ½ 13 16 51 74 79 76 77 64 77 78 79
Reception/
Year 1
14 14 45 67 76 71 80 63 77 80 84
Years 2/3/4 0 7 7 63 80 73 69 64 75 73 100
Years 4/5/6 17 21 46 57 69 65 68 50 73 68 75
- 23 -
Table IV
Percentage incidence of ability groups within mixed ability classes
Year Group Maths English Science Geog/
Hist
Art DT Music IT RE PE Other
Year 5/6 50 60 32 17 9 13 10 19 11 7 6
Year 4/5 55 65 29 11 4 10 5 16 6 6 4
Year 3/4 58 64 35 19 9 15 10 20 12 7 12
Year 2/3 66 66 37 5 0 0 0 2 0 0 0
Year 1/2 65 64 31 14 9 31 8 18 9 6 5
Reception/
Year 1
70 69 36 18 9 15 7 18 11 6 5
Years 2/3/4 94 73 67 27 20 18 23 21 17 18 0
Years 4/5/6 67 55 37 24 15 23 15 32 13 13 12
- 24 -
Figure 1
Percentage of schools with mixed age classes
by number of pupils on roll
More than 500
Less than 500
Less than 400
Less than 300
Less than 200
Less than 100
Perce
ntag
e
100
80
60
40
20
0
- 25 -
Figure 2
Types of grouping adopted in mathematics in primary schools with same aged classes
Year group
year 6
year 5
year 4
year 3
Year 2
year 1
Reception
Mea
n
80
60
40
20
0
Within class ability
grouping
Mixed ability within
class
Same age setti ng
Cross age setting
- 26 -
Figure 3
Types of groupings adopted in English in primary schools with same aged classes
Year group
year 6
year 5
year 4
year 3
Year 2
year 1
Reception
Mea
n
80
60
40
20
0
Within class ability
grouping
Mixed ability groups
within class
Same age setting
Cross age setting
- 27 -
Figure 4
Types of groupings adopted in science in primary schools with same aged classes
Year group
year 6
year 5
year 4
year 3
Year 2
year 1
Reception
Mea
n
60
50
40
30
20
10
0
Within class ability
grouping
Mixed ability groups
within class
Same age setting
Cross age setting
- 28 -
Figure 5
Types of groupings adopted in mathematics in primary schools with mixed aged classes
Year group
year 5/6
year 4/5
year 3/4
Year 2/3
year 1/2
Reception/Yr 1
Mea
n
80
60
40
20
0
Within class ability
grouping
Mixed ability within
class
Same age setting
Cross age setting
- 29 -
Figure 6
Types of groupings adopted in English in primary schools with mixed aged classes
Year group
year 5/6
year 4/5
year 3/4
Year 2/3
year 1/2
Reception/Yr 1
Mea
n
80
60
40
20
0
Within class ability
grouping
Mixed ability within
class
Same age setting
Cross age setting
- 30 -
Figure 7
Types of groupings adopted in Science in primary schools with mixed aged classes
Year group
year 5/6
year 4/5
year 3/4
Year 2/3
year 1/2
Reception/Yr 1
Mea
n
60
50
40
30
20
10
0
Within class ability
grouping
Mixed ability within
class
Same age setting
Cross age setting