Embed Size (px)
Citation preview
Abiotic and biotic factors in the nutrient solution and filter skin
(Schmutzdecke) of slow filters integrated to closed hydroponic greenhouse systems:
Potential predictors for assessment of efficacy
B. Furtner Faculty of Landscape Planning, Horticulture and Agricultural Science
Department of Crop Science
Alnarp
Licentiat thesis
Swedish University of Agricultural Sciences
Alnarp 2006

Acta Universitatis Agriculturae Sueciae
ISSN 1652-6880
ISBN 91-576-7174-5
© 2006 Bernhard Furtner, Alnarp
Tryck: SLU Service/Repro, Alnarp 2006

Abstract
Furtner, B. 2006. Abiotic and biotic factors in the nutrient solution and filter skin
(Schmutzdecke) of slow filters integrated to closed hydroponic greenhouse
systems: Potential predictors for assessment of efficacy. Licentiate thesis. ISSN
1652-6880 , ISBN 91-576-7174-5.
Rapid pathogen dispersal by circulating nutrient solutions in closed hydroponic
systems poses a major threat to this production method. Slow filtration is very
effective against important fungal pathogens such as Phytophthora cryptogea and
Pythium aphanidermatum. Filter efficacy against pathogens can partly be predicted
by observation of autochthonous microbial communities in slow filters and filter
efficacy can be improved by manipulation of these communities. However, data
about factors influencing filter efficacy are scarce. Generally, slow filter efficacy is
the result of complex interactions between abiotic and biotic attributes of nutrient
solution and filter body.
Selected abiotic (electric conductivity, pH, oxygen content, chemical oxygen
demand, dissolved organic carbon) and biotic factors (general bacterial and fungal
microflora, fluorescent pseudomonads, filamentous actinomycetes, Fusarium
oxysporum, P. aphanidermatum, biochemical oxygen demand, enzyme activity)
were monitored in a two-year study of two distinct commercial hydroponic systems
(tomatoes and ornamentals) with integrated slow filters in supernatant, filter skin
and effluent. The same filter skin parameters were monitored in six small-scale
experimental systems with slow filters to establish possible correlations with filter
efficacy against F. oxysporum f.sp. cyclaminis. In half these systems, filter skins
were enriched with fungal cell wall preparation to enhance biological activity of
microfauna. Total polysaccharide and extracellular biofilm polysaccharide content
of the filter skin were determined and a method for extracellular biofilm polymer
extraction devised.
The hydroponic systems studied differed in terms of chemical oxygen demand,
dissolved organic carbon, oxygen consumption of slow filters by aerobic
autochthonous microorganisms and fungal densities before and after slow filtration.
A seasonal influence on xylanase enzyme activity in filter skins was also observed.
However, as filter efficacy and other parameters in the experimental systems
exhibited no significant differences, no firm conclusions could be drawn. Total
polysaccharide content within filter skins increased over time and was a good
parameter for demonstrating the effects of organic amendments on filter skin
formation. Extracellular biofilm polysaccharide content of filter skins was not
influenced by organic matter addition but more research is needed to reveal the
influence of this parameter on filter efficacy.
Keywords: abiotic factors, biotic factors, biofilm, filter efficacy, polysaccharides,
slow filter.
Author´s address: Bernhard Furtner, Department of Crop Science, P.O. Box 44,
SE-23053 Alnarp, Sweden. E-mail: bernhard.furtner@ vv.slu.se

Contents
Abstract
Contents
Appendix 3
Introduction 4
Hydroponic growing systems 5
Definition 5
Solid and liquid hydroponic systems 5
Open and closed systems 5
Pathogens in closed hydroponic systems 6
Disinfection methods 6
Slow filtration 8
Definition 8
Factors affecting the efficacy of slow filters 9
Abiotic factors 10
Biological and biochemical factors 11
Assessment of biological and biochemical factors 12
Objectives 14
Materials and Methods 14
Growing systems and sampling sites 14
Research greenhouse (Papers I and II) 14
Commercial sites (Paper I) 14
Sampling dates and sampling points within the systems 15
Preparation and addition of fungal cell wall preparation (FCWP) 15
Analysis 16
Abiotic factors (Paper I) 16
Chemical and biochemical factors (Papers I and II) 16
Microbiological factors (Paper I) 17
Determination of total polysaccharide content (tPS) of
filter skin and FCWP (Paper II) 17
Determination of biofilm extracellular polysaccharide
content (Paper II) 17
Efficacy tests against Fusarium oxysporum
f.sp. cyclaminis (Focy) 18
Statistics 18
Results and Discussion 19
Conclusions and Outlook 22
References 23
Acknowledgements 28
3
Appendix
Papers I and II
I. Furtner, B., Bergstrand, K.-J., Brand, T., Jung, V. & Alsanius, B.W. 2006.
Abiotic and biotic factors in slow filters integrated to closed hydroponic systems.
European Journal of Horticultural Sciences. (accepted)
II. Furtner, B., Brand, T., Jung, V. & Alsanius B.W. 2006. Polysaccharides in slow
filters integrated to closed hydroponic greenhouse systems. Journal of
Horticultural Science and Biotechnology. (in print)
Papers were published with the kind permission of the concerned editorial boards.

4
Introduction
Hydroponic growing systems play an important part in modern horticultural plant
production and are the subject of intensive research activities. Economic and
environmental factors in particular have led to the area of hydroponic production
increasing in recent decades (Nelson, 1998; Göhler & Molitor, 2002). In 1999,
95% of all fruit vegetable crops (e.g. tomato, cucumber and sweet pepper) were
produced in hydroponic systems in the Netherlands (Van Os, 1999). A higher
degree of automation, better control of environmental factors (e.g. fertilisation,
irrigation, root temperature) and higher yields make hydroponic systems attractive
economically for plant producers world-wide. Moreover, as these systems use less
water than comparable conventional soil-bound systems and are independent of
soil, they have been proposed as important tools to counteract the threat of future
food shortages (Lebedev, 1998) due to increasing global soil degradation (UNEP,
2000) and water scarcity (UNEP, 2000; Falkenmark & Rockström, 2005).
Discharge water from households and industry and leaching of nutrients and plant
protection agents from horticulture or agriculture can lead to eutrophication of
water bodies and can pose a hazard for human health (UNEP, 2000; Falkenmark &
Rockström, 2005). Growing public concern has led to restrictive legislative actions
such as the European Water Framework Directive (EWFD) which will be fully
implemented in the European Union by 2015 (EU, 2002). The goal of the Water
Framework Directive is to minimise anthropogenic influences on groundwater and
surface waters and require the member states to continuously monitor their water
bodies for pollutants (e.g. NO3-, pesticides) and to report on their status to the
European Commission. If the standards of the Directive are exceeded (see Table
1), high fines will have to be paid.
Table 1. Minimum requirements on water discharged from urban wastewater
treatment plants (EU, 1991)
Parameter Concentration (mg l-1)
Biochemical oxygen demand (BOD5) < 25
Chemical oxygen demand (COD) < 125
Total phosphorus < 2
Total nitrogen < 15
Nutrient solutions used in hydroponic plant production systems are regarded as
industrial discharge by the EWFD and have to be treated before release (EU,
2002). In this context, closed hydroponic systems with nearly complete control
over input and output of the production systems might be an important way to
reach the standards given by the EWFD, especially in regions that are highly
dependent on the economic returns from horticultural production.

5
Hydroponic growing systems
Definition
In the literature, several definitions for hydroponic growing systems are given
(Jensen & Collins, 1985; Nelson, 1998; Göhler & Molitor, 2002). In this thesis
hydroponics is defined according to Jensen & Collins (1985) as a technique to
grow plants in nutrient solution with or without a (typically inert) growing medium
for mechanical support. Following this definition, hydroponic systems may
likewise be referred to as soil-less systems (Göhler & Molitor, 2002) or
nutriculture systems (Nelson, 1998).
Solid and liquid hydroponic systems
Hydroponic growing systems can be divided into two groups, namely solid and
liquid systems. Technical aspects of solid hydroponic systems are dependent on
cultivation techniques, ways of application of nutrient solution and quality and
quantity of available substrates (e.g. sand, gravel, mineral wool, pumice, coconut
fibre). Due to this, many different systems are available (Göhler & Molitor, 2002).
Therefore, this thesis limits its description of hydroponic systems to those ones
used in the experiments described in Papers I and II. In the first of these systems,
ornamental plants were cultivated in pots using peat-based growing medium. The
pots were placed in gutters with capillary mats and plants were irrigated and
fertilised (fertigation) by the passing nutrient solution. Capillary forces transport
the nutrient solution into the pot and to the plant roots. To avoid oxygen deficiency
of the root zone due to water saturation, fertigation was provided at intervals. In
the second system, plants were cultivated in buckets filled inert growing medium.
Here drip irrigation was used for fertigation of the crop.
Liquid hydroponic systems can be divided on the basis of water volume, water
level and distribution of water: (i) techniques using large amounts or high levels of
water (e.g. deep flow technique, DFT), (ii) techniques using shallow or films of
nutrient solution (e.g. nutrient film technique, NFT), or (iii) techniques for
spraying nutrient solution into the rhizosphere (e.g. aeroponics). The NFT system
mainly consists of a watertight channel laid out on a 1-2% slope. Channels are
covered with a black/white plastic. The cover helps to prevent water losses due to
evaporation, to restrict algal growth and to control root temperature. A tank of
nutrient solution feeds the channels and nutrient solution floats with a thickness of
< 3 mm over the entire bottom surface of the channel. In small substrate units (e.g.
rockwool slabs) pre-cultivated plants are placed inside the channels and losses of
water (transpiration) and nutrients (plant growth) have to be replaced continuously
if the system is closed (Nelson, 1998; Göhler & Molitor, 2002).
Open and closed systems
In general, all hydroponic systems can be designed as open systems where the
nutrient solution is discharged into the environment after use or as closed systems
where the nutrient solution is reused (Jensen & Collins, 1985). The ability of
closed systems to reduce environmental pollution by fertilisers and pesticides
compared to soil-based or open systems is generally accepted (Krüger, 1990;
Nelson, 1998; Ehret et al., 2001; Göhler & Molitor, 2002). In a Dutch study (Van

6
Os, 1999), water and fertiliser use in soil-bound and closed hydroponic systems for
chrysanthemum, rose and cucumber were compared. Water savings of 29% (rose),
21% (cucumber) and 15% (chrysanthemum) and fertiliser savings of 48%, 34%
and 15% respectively were reported. Due to legislative pressure (National laws,
European Water Framework Directive) and commercial reasons, open hydroponic
systems are to be replaced by closed systems in future.
Pathogens in closed hydroponic systems
The risk of spreading root diseases in closed hydroponic systems is considered to
be high (Stanghellini & Rasmussen, 1994; Van Os et al., 2001) because of a
genetically uniform host, favourable physical parameters for pathogens such as
moisture, moderate temperatures and the possibility for a rapid and uniform
dispersal of root infecting agents throughout the cultivation system by the
circulating nutrient solution. Moreover, growing media for hydroponics are
assumed to be free from pathogens in the initial production phase and therefore
contain little (e.g. dark sphagnum peat) or no (e.g. mineral wool) indigenous
microflora (Giullino & Garibaldi, 1994). Consequently, these systems are
especially susceptible to pathogens well-adapted to aquatic systems (e.g. zoospore
forming fungi) and/or primary colonisers such as Pythium spp. or Phytophthora
spp., which take advantage of the lack of competing microorganisms like
(Stanghellini & Rasmussen, 1994; Paulitz & Bélanger, 2001). However, rapid
colonisation of the nutrient solution by microorganisms has been shown
(Berkelmann, Wohanka & Wolf, 1994) and a steady state was reached after
eighteen hours. Thus, the theory of a biological “vacuum” even in the initial phase
of hydroponic plant cultivation is controversial.
Examples of pathogens causing rapid disease development in closed hydroponic
systems are mottle mosaic virus, tomato mosaic virus, Olpidium (viral vectors),
Phytophtora cryptogea, Pythium spp., Fusarium oxysporum or Verticillium spp.
(Ehret et al., 2001). Early reports showed yield losses of up to 50% due to Pythium
dissotocum even in the absence of root symptoms (Stanghellini & Kronland, 1986),
while Wohanka (1991) reported 100% infection of Gerbera jamesonii plants
twelve weeks after inoculation of nutrient solution with Phytophthora cryptogea.
Minimising the risk of root diseases in hydroponic systems is therefore an
attractive economic goal for commercial growers and several disinfection
treatments for the recirculating nutrient solutions have been developed and are in
use today. Nevertheless, it must be stated that closed hydroponic systems have
operated successfully without treatment of the nutrient solution (Van Os et al.,
2004) when adequate hygienic standards were maintained.
Disinfection methods
There are different approaches to minimise the risk of root diseases in hydroponic
systems (Table 2).
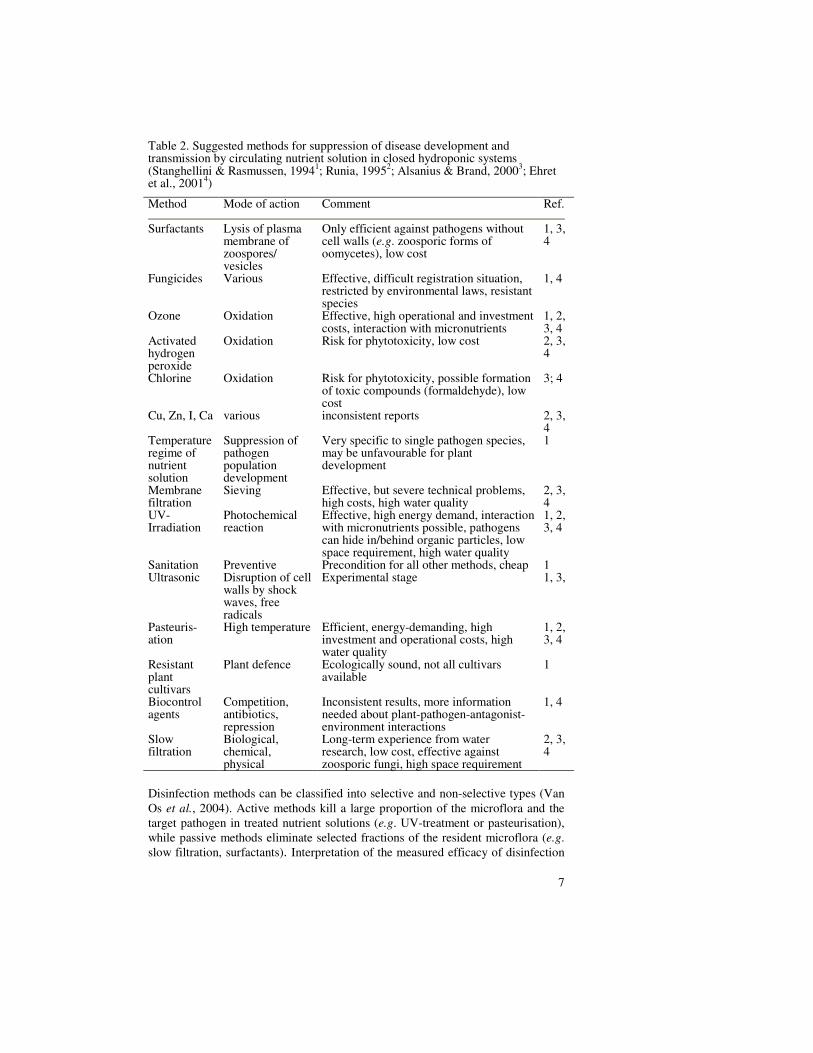
7
Table 2. Suggested methods for suppression of disease development and transmission by circulating nutrient solution in closed hydroponic systems (Stanghellini & Rasmussen, 1994
1; Runia, 1995
2; Alsanius & Brand, 2000
3; Ehret
et al., 20014)
Method Mode of action Comment Ref.
Surfactants Lysis of plasma membrane of zoospores/ vesicles
Only efficient against pathogens without cell walls (e.g. zoosporic forms of oomycetes), low cost
1, 3, 4
Fungicides Various Effective, difficult registration situation, restricted by environmental laws, resistant species
1, 4
Ozone Oxidation Effective, high operational and investment costs, interaction with micronutrients
1, 2, 3, 4
Activated hydrogen peroxide
Oxidation Risk for phytotoxicity, low cost 2, 3, 4
Chlorine Oxidation Risk for phytotoxicity, possible formation of toxic compounds (formaldehyde), low cost
3; 4
Cu, Zn, I, Ca various inconsistent reports 2, 3, 4
Temperature regime of nutrient solution
Suppression of pathogen population development
Very specific to single pathogen species, may be unfavourable for plant development
1
Membrane filtration
Sieving Effective, but severe technical problems, high costs, high water quality
2, 3, 4
UV-Irradiation
Photochemical reaction
Effective, high energy demand, interaction with micronutrients possible, pathogens can hide in/behind organic particles, low space requirement, high water quality
1, 2, 3, 4
Sanitation Preventive Precondition for all other methods, cheap 1 Ultrasonic Disruption of cell
walls by shock waves, free radicals
Experimental stage 1, 3,
Pasteuris-ation
High temperature Efficient, energy-demanding, high investment and operational costs, high water quality
1, 2, 3, 4
Resistant plant cultivars
Plant defence Ecologically sound, not all cultivars available
1
Biocontrol agents
Competition, antibiotics, repression
Inconsistent results, more information needed about plant-pathogen-antagonist-environment interactions
1, 4
Slow filtration
Biological, chemical, physical
Long-term experience from water research, low cost, effective against zoosporic fungi, high space requirement
2, 3, 4
Disinfection methods can be classified into selective and non-selective types (Van
Os et al., 2004). Active methods kill a large proportion of the microflora and the
target pathogen in treated nutrient solutions (e.g. UV-treatment or pasteurisation),
while passive methods eliminate selected fractions of the resident microflora (e.g.
slow filtration, surfactants). Interpretation of the measured efficacy of disinfection

8
methods against a pathogen is controversial. Little information is available about
the initial pathogen densities necessary to cause disease outbreaks in soil (Paulitz,
2000) or hydroponic systems. The importance to plant health of rhizosphere
colonisation by beneficial rhizobacteria is a commonly accepted fact (Kloepper &
Schroth, 1981; Leifert, Morris & Waites, 1994; Le Floch et al., 2003) and has been
explained by competition for nutrients or space, parasitism, antibiosis, production
of inhibitory substances (e.g. antibiotics) or induced plant resistance. Nutrient
solutions and rhizosphere are in intimate contact in hydroponic systems and
consequently it has been possible to demonstrate the suppressive potential of the
autochthonous microflora against plant pathogens in closed soil-less systems
(Berkelmann, Wohanka & Wolf, 1994; Tu et al., 1999; Zhang & Tu, 2000; Van Os
& Postma, 2000; Khalil & Alsanius, 2001; Postma et al., 2005). Active
disinfection methods are unable to preserve non-pathogenic microflora and
therefore reduce the suppressive potential of natural microflora against certain
pathogens (McPherson, Harriman & Pattison, 1995). Tu et al. (1999) showed a
significant reduction in temporal development of Pythium spp. in closed
hydroponic systems compared to an open system and attributed this beneficial
effect to the indigenous microflora. Ultraviolet (UV) irradiation treatments have
been demonstrated to reduce total bacterial flora and P. aphanidermatum densities
in closed hydroponic systems but with no detectable increase in crop yield or root
health compared to an untreated system (Zhang & Tu, 2000). Furthermore, in
contrast to autoclaved batches, the microflora inhabiting rockwool batches in an
ebb/flood system are able to reduce P. aphanidermatum by 52-100% (Postma,
Willemse-de Klein & van Elsas, 2000). It has been suggested that the relationship
of total or beneficial microorganisms to pathogens is more important for root
disease development than absolute plant pathogen densities (Berger et al., 1996;
Zhang & Tu, 2000).
Slow filtration is a passive disinfection method. Since its introduction into
horticulture by Wohanka in the late 1980s, slow filtration has been subjected to
ongoing scientific research (e.g. Brand & Alsanius, 2004a, Déniel et al., 2004) and
is used by commercial growers world-wide (Nelson, 1998; Göhler & Molitor,
2002).
Slow filtration
According to Baker (1948), knowledge of water disinfection methods can be traced
back approx. 3000 years (Sus´ruta Samhita, Indian medical textbook) and the first
known illustration of a sand filter was published by the Italian physician Lucas
Antonius Portius in 1685. Approximately 120 years later, in 1804, the first
municipal water treatment plant was installed at Paisley, Scotland. From that time,
slow filtration has been one of the most important methods for purification of
municipal and potable water (Weber-Shirk & Dick, 1997a). In the late 1980s, slow
filtration was adapted for horticulture (Wohanka, 1991; Runia, 1995).
Definition
Slow filtration is a passive water disinfection method involving the slow passage of
water or liquids through a porous medium. Sand or granulated mineral wool is
commonly used as a filter medium for horticultural purposes, but other materials
9
such as rice hulls or glass shards can also be used. In horticulture, filter operating
capacities between 100 and 300 l m-2
h-1
(Ehret et al., 2001) have been
recommended but commercial systems require an operating capacity of between
250 and 580 l m-2
h-1
(Wohanka, 1991) or 100-400 l m-2
h-1
(Alsanius et al., 2001).
Flow rate (m h-1
) is a more descriptive parameter because it reflects the velocity of
the water body passing through the filter medium. Operating capacity can be
converted to flow rate by following equation:
m h-1
= 0.001 m3 m
-2 h
-1 (1)
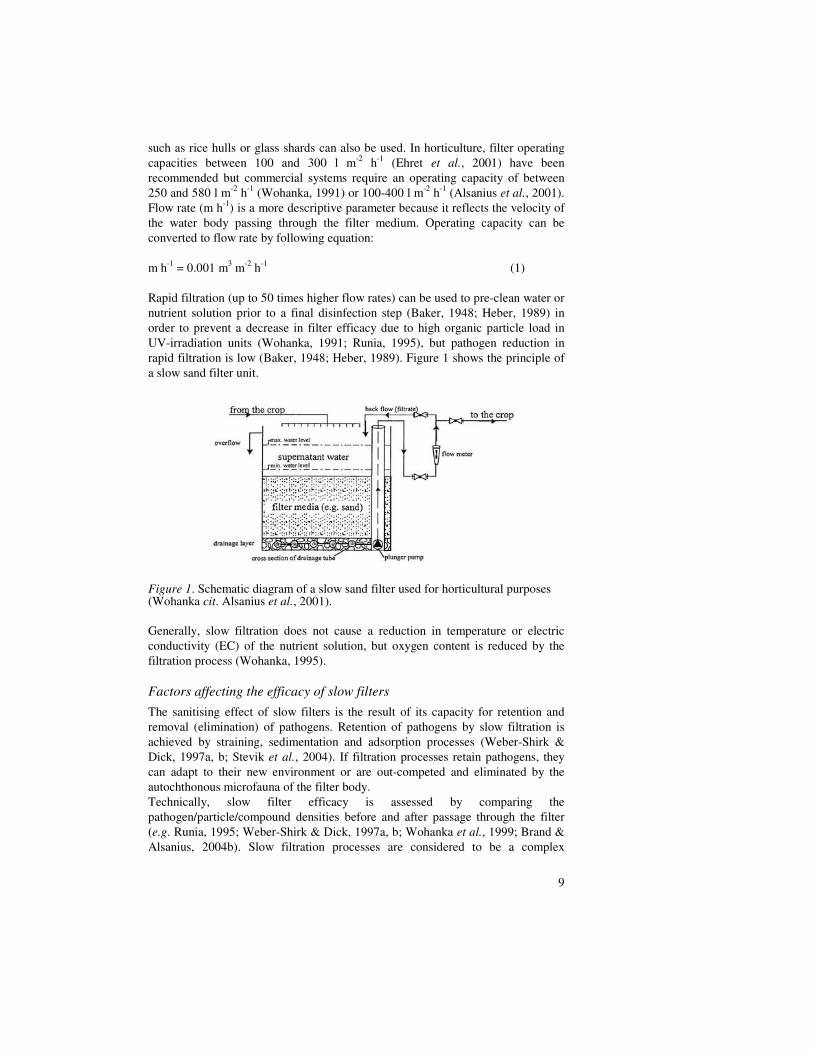
Rapid filtration (up to 50 times higher flow rates) can be used to pre-clean water or
nutrient solution prior to a final disinfection step (Baker, 1948; Heber, 1989) in
order to prevent a decrease in filter efficacy due to high organic particle load in
UV-irradiation units (Wohanka, 1991; Runia, 1995), but pathogen reduction in
rapid filtration is low (Baker, 1948; Heber, 1989). Figure 1 shows the principle of
a slow sand filter unit.
Figure 1. Schematic diagram of a slow sand filter used for horticultural purposes (Wohanka cit. Alsanius et al., 2001).
Generally, slow filtration does not cause a reduction in temperature or electric
conductivity (EC) of the nutrient solution, but oxygen content is reduced by the
filtration process (Wohanka, 1995).
Factors affecting the efficacy of slow filters
The sanitising effect of slow filters is the result of its capacity for retention and
removal (elimination) of pathogens. Retention of pathogens by slow filtration is
achieved by straining, sedimentation and adsorption processes (Weber-Shirk &
Dick, 1997a, b; Stevik et al., 2004). If filtration processes retain pathogens, they
can adapt to their new environment or are out-competed and eliminated by the
autochthonous microfauna of the filter body.
Technically, slow filter efficacy is assessed by comparing the
pathogen/particle/compound densities before and after passage through the filter
(e.g. Runia, 1995; Weber-Shirk & Dick, 1997a, b; Wohanka et al., 1999; Brand &
Alsanius, 2004b). Slow filtration processes are considered to be a complex

10
interaction between physical, biochemical and biological factors of filter body and
water/nutrient solution (Huisman & Wood, 1974; Yordanov, Lamb & Melvin,
1996; Brand & Wohanka, 2001), but the fundamental principles remain poorly
defined (Campos et al., 2002). Figure 2 illustrates the complex interactions
between intrinsic abiotic and biotic factors of nutrient solutions and slow filters.
Figure 2. General flow chart of abiotic and biotic factors and their relationship to slow filter efficacy in closed hydroponic systems.
Abiotic factors
Physical filter properties have been intensively researched. Filter thickness is
important and Wohanka et al. (1999) have demonstrated significantly lower filter
efficacy against the pathogen Xanthomonas campestris pv. pelargoni with shorter
filter columns ( 0.3 m < 0.6 m < 0.9 m).
High flow rates increase the water movement through macropores (Thomas &
Philips, 1979) and decrease the probability of particle adsorption. Experiments by
Wohanka et al. (1999) and Van Os et al. (1999) show that filter efficacy decreases
with increasing flow rate. A flow rate of 0.1 m h-1 resulted in significantly
enhanced efficacy than a rate of 0.3 m h-1 against F. oxysporum f.sp. lycopersici, P.
cinnamomi and tobacco mosaic virus in earlier trials (Runia et al., 1997). The
positive effects of reduced flow rates (0.1 m h-1 vs. 0.3 m h-1) were not observed by
Van Os et al. (2001). They concluded that other major factors (e.g. pathogen, grain
size, filter medium, specific surface area, temperature, microbial interactions)
could influence filter efficacy to a higher extent than flow rate.
In slow filtration using sand as the filter medium, smaller grain size resulted in
higher efficacy against various pathogens (Runia et al., 1997; Van Os et al., 1998;
Van Os et al., 1999) but a similar relationship between filter efficacy and total
filter surface of the medium was not confirmed when different media (sand with
two different grain sizes, glass wool, granulated rockwool media with two different
densities, polyurethane foam) were used (Van Os et al., 2001). The influence of
Filter efficacy
Abiotic factors
Biotic factors
e.g. light, temperature,
ionic composition and strength
of nutrient solution
e.g. production of organic
acids, metabolic activities of MOs
11
filter medium on biophysical features of the filter body has been demonstrated by
Brand & Wohanka (2001), who used cryo-scanning electron microscopy to reveal
that sand grains and mineral wool fibres showed different colonisation patterns. In
agreement with Ellis & Aydin (1995), sand grains were colonised with clusters of
bacterial colonies. However, microbial communities colonised the interstitial
spaces of mineral wool fibres by formation of cobweb-like structures (Brand &
Wohanka, 2001). Mesh-like mucilage structures have been observed on sand slow
filter surfaces by others (Law, Melvin, & Lamb, 2001). This contradiction may be
because of the different operational variables (e.g. observation period, flow rate) in
these trials, but shows that statements about biofilm formation in slow filters are
difficult to interpret.
A main mechanism for retention of particles is adsorption of microorganisms.
Reversible adsorption is caused by non-covalent intermolecular forces (e.g.
electrostatic forces, van der Waals forces, non-polar forces) and is therefore
dependent on chemical (e.g. pH) and physical (e.g. electric conductivity,
temperature) properties of the aqueous solution (Christensen, 1989; Stevik et al.,
2004). It has been estimated that the mechanical/physical components could
explain 70-80% of filter efficacy against pathogens in hydroponic systems (Brand,
2000).
Biological and biochemical factors
The existence of biological components in slow filtration was concluded on the
basis of correlations between filter efficacy and factors with a known effect on
biological activity, e.g. temperature or oxygen demand (Burman, 1978; Ellis,
1985). In eutrophic environments, heterotrophic biological activity mainly depends
on oxygen and organic carbon availability. It has been shown that particulate
organic carbon content rapidly decreases with increasing filter thickness (Ellis &
Aydin, 1995) and that oxygen content (Mermillod-Blondin, Mauclaire &
Montuelle, 2005) and ATP content (Calvo-Bado et al., 2003) are highest in the
upper filter layer. Hence, the highest biological activity is found in the surface
layer of slow filters, the so-called filter skin (dirt layer, filter cake, Schmutzdecke),
which consists of sediment and adjusted organic and inorganic particles, a biofilm
made of different microorganisms, protozoa and mesozoa (Ellis, 1985; Duncan,
1988; Brand & Wohanka, 2001). As microbial interactions are the main cause of
pathogen elimination (Stevik et al., 2004), the filter skin is considered to have a
significant influence on the sanitation effect of slow filtration (e.g. Weber-Shirk &
Dick, 1997a). Biofilms play an important role in filtration processes in both natural
and artificial systems (Lazarova & Manem, 1995; Wotton, 2002; Larsen &
Greenway, 2004). Biofilms are complex associations of cells, their extracellular
products and detritus from lysed cells or the environment (Christensen, 1989).
Structure, composition and amount of biofilms are governed by physical (e.g. flow
rate, temperature), chemical (e.g. N supply, ionic strength) and biochemical
factors, e.g. available organic carbon, growth factors (e.g. cyanocobalamin of
microbial origin) or organic matter content of the solution (Lazarova & Manem,
1995; Nam et al., 2000; Wimpenny, Manz & Szewzyk, 2000; Kemmling et al.,
2004). Polysaccharides are the main structural polymer of the extracellular matrix
in biofilms (Sutherland, 2001; Wotton, 2004) and are regarded as the main agent

12
for retention of particles (Costerton, 1984; Bellamy, Hendricks & Logsdon, 1985).
The reduced pore diameter in combination with an absorbing biofilm probably
enhances filter efficacy. Although it is generally assumed that the filter skin plays a
key role in retention and elimination of pathogens, reliable information on
interactions between filter skin properties and treatment efficacy is scarce (Weber-
Shirk & Dick, 1997a, b; Muhammad & Hooke, 2003).
Little information is available about biological and biochemical factors in
hydroponic systems and how they influence slow filtration efficacy. Filter efficacy
has been shown to decrease with decreasing pathogen size (Wohanka, 1991; Runia,
1995). Size relationships for plant pathogens are described as fungi > bacteria >>
virus (Wohanka, 1991). Biologically active filters display higher efficacy than
inactive types (Brand & Wohanka, 2001; Mine et al., 2003) and introduction of
antagonistic and/or plant growth-promoting bacteria (Bacillus cereus,
Pseudomonas putida) to slow filters can lead to decreased pathogen densities in
the filter effluent (Déniel et al., 2004) or to decreased disease incidence within the
cultivation system (Garibaldi et al., 2003). However, Van Os et al. (1999)
demonstrated that the ripening state of filters was negligible for retention of
Phytophthora cinnamomi. Cell wall-degrading enzyme activity in nutrient
solutions can be enhanced by addition of fungal cell wall preparation (FCWP) of
pathogens (Brand & Alsanius, 2004b). Addition of FCWP has been shown to
enhance extracellular biofilm enzyme activity of filter skin and filter efficacy
against Fusarium oxysporum f.sp. cyclaminis compared to untreated filters (Brand
& Alsanius, 2004a).
Assessment of biological and biochemical factors
Papers I and II in this thesis investigated organic carbon content of nutrient
solution, enzyme activity, carbohydrate content of the filter skin and selected parts
of the culturable microfauna in both nutrient solution and filter skin.
According to Bourgeois, Burgess & Stuetz (2001), global organic parameters of
nutrient solution can be assayed by biological oxygen demand (BOD5), total
chemical oxygen demand (COD), dissolved organic carbon (DOC) or total organic
carbon (TOC). The BOD5 is an empirical test indicator for biological activity and
is defined as the potential for removal of oxygen from water by aerobic
heterotrophic bacteria within five days. The TOC content of a solution is analysed
by conversion of organic carbon to carbon dioxide by wet chemical oxidation or
high temperature catalytic oxidation. The DOC represents total organic carbon
content smaller than 0.2 µm. The COD is assessed by oxidising organic
compounds with strong oxidising agents under acid conditions. Sometimes these
values are regarded as being equal to TOC. Compared to the TOC content, COD
measures more compounds of the nutrient solution because this method also
analyses the reducible inorganic compounds of the nutrient solution. A combined
assay to determine COD, DOC and BOD5 was used in the present study because in
soil-less systems, the structure of organic matter is complex and originates from
different sources such as irrigation water, plant root deposition, microorganisms or
organic growing medium. In these systems, COD represents total organic carbon
and reducible parts of the nutrient solution (e.g. mucilage, sloughed plant cells,
organic growth media, microfauna, NH4+), DOC represents soluble organic carbon
13
(e.g. carbohydrate monomers, amino acids and organic acids) from root leaching or
microorganisms and BOD5 represents bioavailabilty of these organic compounds
(Waechter-Kristensen et al., 1999; Bourgeois, Burgess & Stuetz, 2001). Other
methods of assaying organic matter in hydroponic systems, such as determination
of total volatile solids (Gray et al., 2000) or near-infrared spectroscopy (Malley,
1998), have not been considered in horticultural growing systems.
Lazarova & Manem (1995) reported that a biofilm can be assessed quantitatively
by its thickness, polysaccharide or protein content and qualitatively by its enzyme
activity, ATP content or microbial respiration. To achieve our goal of finding
factors influencing slow filtration processes in horticultural systems,
polysaccharide fractions of the filter skin seemed to be promising candidates and
were investigated in experimental slow filters in 2004 and 2005. Results from
water research indicated that increased protein content of the filter skin leads to
increased bacterial removal by slow filters (Muhammad & Hooke, 2003). We
investigated total polysaccharide content as a global parameter of filter skin
biomass properties (Le Bihan & Lessard, 2000) because polysaccharides are key
constituents of the cell walls of plants and many microorganisms (Madigan &
Martinko, 2005). Therefore, they might be more feasible for indirectly describing
particle dynamics in a plant production system than proteins.
Extracellular polymers of biofilms can be extracted for instance by regular
centrifugation, EDTA-extraction, ultracentrifugation, steam extraction or regular
centrifugation with formaldehyde. The amounts of extracellular matrix extracted
are dependent on the method used (Zhang, Bishop & Kinkle, 1999; Rhode, 2004).
Polysaccharide content may be analysed by enzymatic procedures, but colorimetric
methods based on the Molish test for carbohydrates are commonly used (Gerhardt
et al., 1994; Lazarova & Manem, 1995). In this thesis, the Dubois test (Dubois et
al., 1956) was used for carbohydrate analysis because it is a rapid and sensitive test
which is easy to conduct. Furthermore, it has been shown to have lower standard
deviations in biofilm analysis compared to the Anthrone test (Rhode, 2004).
Activities of microorganisms within the biofilm were determined by a colorimetric
enzymatic assay which showed good correlations to filter efficacy in a previous
study (Brand & Alsanius, 2004a) and by measuring oxygen consumption of slow
filtration processes (Mermillod-Blondin, Mauclaire & Montuelle, 2005).
Total viable counts (TVC) provide a good overall picture of the culturable fraction
of the microfauna in nutrient solutions and slow filters (Wellington et al., 1997).
Total viable plate counts have been used to investigate spatial and temporal
changes in microbial communities in hydroponic systems and to estimate the
suppressive potential (e.g. Berkelmann, Wohanka & Wolf, 1994; van Os &
Postma, 2000; Khalil & Alsanius, 2001). If more information is needed about
structural and functional properties of the microfauna, TVC might be combined
with methods such as polymerase chain reaction followed by denaturing gradient
gel electrophoresis (Calvo-Bado et al., 2003; Postma et al., 2005), microbial
biomarker assays (e.g. analysis of volatile fatty acids) or assessing the functional
potential of microbial communities by sole carbon source utilisation (Khalil &
Alsanius, 2001). In this thesis, Pseudomonas spp. and filamentous actinomycetes
were observed as representatives of beneficial microorganisms (Paulitz &
Bélanger, 2001; Postma et al., 2005). Fusarium oxysporum and Pythium
aphanidermatum densities were investigated as a representative group containing

14
fungal pathogens and as an important root disease, respectively. General fungal and
bacterial microfauna were assessed to give an overall picture and to demonstrate
how population densities are related to each other.
Objectives
The study had the following main objectives:
(i) To evaluate and compare abiotic and biotic parameters in the nutrient solution
and slow filters integrated to commercial and experimental greenhouse systems.
(ii) To study the influence of the state variables measured on filter efficacy against
the pathogen Fusarium oxysporum f.sp. cyclaminis.
This was a pre-study to develop an easily accessible tool for commercial growers
to monitor the filter efficacy of slow filters without inoculation of test pathogens
into the hydroponic system.
Materials and Methods
Data for Papers I and II were taken from the same sites in 2004 and 2005.
Growing systems and sampling sites
Research greenhouse (Papers I and II)
Small-scale experimental systems were designed as described by Brand & Alsanius
(2004a). Six independent nutrient film technique (NFT) systems were built and
each system was connected to two filter units. Tomato (Lycopersicon esculentum
cv. Aromata) was planted at a density of 4 plants m-2. Plants were cultivated for 24
weeks, starting in mid-January. Slow filters were connected to the NFT systems six
weeks before sampling started, to allow biological ripening of the filters. Fungal
cell wall preparation (FCWP) was added to six of the filters (treated) to enhance
enzyme activity, whereas the six other filters served as controls (untreated).
Electric conductivity (EC) was adjusted daily to 2.7 (± 0.1) mS cm-1 and the pH to
5.8 (± 0.2).
Commercial sites (Paper I)
Samples were taken in two commercial greenhouses with integrated slow filters
located in the southern part of Sweden. In Poppelgårdens Driverier (O),
ornamental pot plants (mainly Euphorbia pulcherima, Impatiens walleriana,
Primula sp., Celosia sp.) are produced in a peat-based growing medium, while
Ingelstorp Trägård (T) produces tomatoes. Table 3 gives an overview of general
differences between the commercial and experimental systems.

15
Table 3. General characteristics of the hydroponic systems, nutrient solutions (supernatant) and associated slow filters used in experiments (O = ornamentals nursery; T = tomato nursery; E = experimental systems).
Parameter O T E
Crop Pot plants (ornamentals)
Tomatoes Tomatoes
Production area (ha)
1.0 0.5 0.01
Type of production
Commercial Commercial Experimental
Growing medium Peat-based mixture
Pumice nutrient solution
Irrigation Interval Drip Continuous (NFT) Vol. of circulating nutrient solution (m
3)
approx. 18.0 approx. 12 approx. 0.2
Year 2004 2005 2004 2005 2004 2005 Electric conductivity (mS cm
-1)
1.1 ±0.4
1.0 ±0.3
3.4 ±0.8
3.3 ±0.3
2.7 ±0.1
2.7 ±0.1
pH 7.1 ±0.5
6.7 ±0.5
7.3 ±0.4
7.1 ±0.5
5.8 ±0.2
5.8 ±0.2
Temperature (°C) 20 ±2 - * 22 ±2 20 ±1 22 ±2 22 ±2 Slow filter Yes Yes Yes Filter medium Granulated
mineral wool Granulated mineral wool
Granulated mineral wool
Filter thickness (m)
1.0 1.0 0.6
Flow rate (m h-1) 0.1-0.2 0.1 0.3 Filter age (yr) 2 (2004); 3 (2005) 6 (2004); 7 (2005) < 0.5 (2004,
2005)
* 2005 data lost due to technical problems
Sampling dates and sampling points within the systems
The commercial systems were sampled nine times (every third week) from May to
October in 2004 and 2005. In the experimental systems, the sampling period was
twelve weeks, starting at the beginning of April and samples were taken every two
weeks for biological and biochemical analyses. Abiotic factors were monitored
continuously (temperature of nutrient solution) or at least weekly (oxygen content,
EC, pH). In the commercial systems, analyses were conducted at least once per
month.
To determine the effect of the filters on the systems, three different sampling sites
were chosen. Nutrient solution was sampled above the filter surface (supernatant),
and as filter effluent (effluent). For filter skin analysis, small mineral wool pieces
were pulled off the upper part of the filter surface (filter skin).
Preparation and addition of fungal cell wall preparation (FCWP)
Fungal cell wall preparation was produced according to Brand & Alsanius (2004a)
by incubating conidial suspension of Fusarium oxysporum f.sp. cyclaminis in

16
liquid yeast agar for 5 days. The mycelial pellets were repeatedly washed,
centrifuged and suspended in distilled water three times, including one
ultrasonication step. Finally, the pellets were autoclaved, frozen and lyophilised.
Each week aliquots of 1.75 g (dry weight) were added to the filters in E, starting at
the end of March and continuing for twelve weeks. The comparability of starting
conditions was checked before the first addition of FCWP (Week 0).
Analysis
Abiotic factors (Paper I)
Oxygen content, EC and pH were measured manually (in E seven days after
inoculation with FCWP) in supernatant and effluent of the filters to give a general
picture of the systems. In addition, oxygen content (% and mg l-1), pH and EC in
the supernatant were measured on each sampling occasion. Oxygen demand of
filters was calculated by subtracting values for effluent from values of supernatant
and adjusting to flow rate.
In the first year, samples for oxygen content were collected at the bottom of the
slow filters. In order to avoid interactions between higher pressure and oxygen
content, the procedure was changed in the second season, when effluent samples
were taken at the inlet of the gutter. The oxygen content was noted when the
display of the oxygen meter was stable for at least 15 s.
Temperature of the nutrient solution in the supernatant was measured continuously
by data loggers and TMC6-HA temperature sensors (Onset Computer Corporation,
U.S.A.) in all systems.
Chemical and biochemical factors (Papers I and II)
Values for BOD5, COD and dissolved organic carbon (DOC) were determined in
accordance with standard methods using commercially available test kits (Paper I) .
Chitinase, cellulase, glucanase, protease and xylanase activity in the biofilm within
the uppermost filter layer (filter skin, Schmutzdecke) were assessed (Papers I and
II) because of their possible influence on filter efficacy (Brand & Alsanius, 2004a).
Briefly, lyophilised mineral wool was incubated in enzyme substrate at 37.0 °C for
two hours. The enzyme reaction was then stopped by adding 2 m HCl and rapid
cooling at -20 °C. After a centrifugation step, colour change of the enzyme
substrate solution was spectrophotometrically determined and compared to a
control. The difference between incubated samples and the control was used to
determine enzyme activity in mU.
Two different kinds of samples were used. In 2004, during the first five weeks the
analysis was performed by processing 50 mg of wet mineral wool. In order to
counteract low activity levels, mineral wool was lyophilised (50 mg) prior to
analysis. In addition to the general sampling schedule, enzyme activity tests in E
were performed at each filter efficacy test.
Samples from commercial systems contained large amounts of muddy substances
which dissolved in the enzyme substrate during the incubation process. These
particles clogged the pipette tips and jeopardised the transfer of the enzyme
substrate solution. Therefore incubated samples were centrifuged for 5 min before
transferring 150 µl of the solution to microtitre plates and stopping the enzyme
reaction with 150 µl 2 M HCl.

17
Moreover, the influence of inoculation with FCWP and of different EC levels on
enzymatic activity was evaluated. Therefore, enzyme activity was studied in two
slow filters of two systems (EC 2, 3 and 5) over one week (Days 1, 4, 5 and 7) after
inoculation of the systems with FCWP in 2004. For each EC level, one system with
two integrated slow filters was analysed.
Microbiological factors (Paper I)
Total viable counts of general bacterial and fungal flora were assessed to give a
general picture of the indigenous microbial colonisation of nutrient solution and
filter skin. Table 4 shows the targeted microbial groups, cultivation media,
incubation time and temperature.
Table 4. Media used for cultivation of microbial communities and selected microorganisms, incubation duration and temperature.
Microorganism Cultivation medium Incubation duration and temperature
h °C
General bacterial flora R2A 72 23 General fungal flora Malt Agar (MA) 96 23 Fluorescent pseudomonads
King Agar B (King, Ward & Raney, 1954) + 100 mg l-1 cycloheximide
48 23
Filamentous actinomyces Chitin Oatmeal Agar 240 23 Fusarium oxysporum Komada (1975) 120 23 Pythium aphanidermatum Potato Dextrose Agar (PDA) 18 35
Determination of total polysaccharide content (tPS) of filter skin and
FCWP (Paper II)
Samples were collected from the filter skin five days after addition of FCWP to the
filters at a density of at least four replicates per filter. For tPS analysis, the method
of Dubois et al. (1956) was used. Aliquots of 0.8 ml of ultrapure water were added
to 20 mg of lyophilised mineral wool sample, mixed with 0.8 ml of phenol (5%)
and 4 ml of concentrated sulphuric acid (96.9%) were added rapidly. After colour
development at room temperature for 25 min, samples were centrifuged at 3000 g
for 5 min to avoid disturbance of spectrophotometer measurements by free-floating
mineral wool fibres. Absorption (ABS) was measured at 488 nm using glucose as
the standard.
The tPS content of FCWP was analysed using 3 mg of lyophilised material with
four replicates for three different mycelial pellets.
Determination of biofilm extracellular polysaccharide content (Paper II)
Biofilm was analysed (2005) to supplement the results of tPS measurements in
2004 and 2005. For biofilm extraction, a method described by Liu & Fang (2002)
was used. Wet mineral wool samples of 3.4 g were collected from filter skin on the
same occasion as when filter efficacy tests were performed. Samples were added to
centrifuge tubes and stored overnight at 4 °C. Aliquots of 12.5 ml of a mixture of

18
ultrapure water, 0.23% of formaldehyde and 0.85% of NaCl were added, blended
with the samples for 25 s and stored for one hour at 4 °C. Then 5 ml of NaOH (1N)
were added and the solution rested for 3 h at 4 °C. The mixture was shaken gently
and then centrifuged at 20.000 g for 20 min at 4 °C. Aliquots of 10 ml of the
supernatant were membrane-filtered (0.2 µm). Samples of 0.8 ml of this solution
were used for polysaccharide determination as described for tPS. Samples were
stored at -20 °C until DNA analysis.
DNA analysis was performed to ensure that cell lysis during the extraction steps
for determination of extracellular polysaccharide content (bePS) was low (Zhang,
Bishop & Kinkle, 1999). Frozen samples were defrosted at 4 °C. DNA content was
determined using the standard method for the DyNA Quant 200™ fluorometer. In
this assay, DNA is determined on the basis of the fluorescent Hoechst 33258
dye/double-stranded DNA assay.
Both bePS and DNA content were related to dry weight of remaining mineral wool
fibres after washing the remaining pellet of the centrifugation step with ultrapure
water and filtering through a pre-weight filter. Effluent water of the filtration step
was transparent and showed no visible turbidity. Filter discs and the remains of the
pellet were cooled at -78 °C for 15 min, freeze-dried for 72 h and re-weighed.
Efficacy tests against Fusarium oxysporum f.sp. cyclaminis (Focy)
To test filter efficacy against Focy, a method described by Brand & Alsanius
(2004a) was used. Briefly, Focy was cultured on potato dextrose agar for two
weeks. Conidia were harvested by adding 10 ml NaCl solution (0.85) and abrasion
of the PDA plates. Conidial suspension was filtered through cheesecloth and
divided into six equally restocked bottles. Conidial suspensions were then added to
the six NFT systems, resulting in approximately 104 colony forming units (cfu) ml-1
of the nutrient solution of each system. Plate counts were performed every 30 min
over five hours for the effluent and over three hours for the supernatant. Fusarium
oxysporum-selective medium (Komada, 1975) was used, with five replicates per
sample. Petri dishes containing 30 to 300 cfu were used for plate counts of the
supernatant. Filter efficacy was calculated by dividing the highest amount of cfu of
the effluent by the highest number of cfu in the supernatant (Brand & Alsanius,
2004a). Filter efficacy was expressed as a percentage.
In the experimental systems, filter efficacy tests were performed twice a year in
2004 and 2005.
Statistics
All experiments and analyses (except for extracellular polysaccharides) were
repeated over two growing seasons. Results from total viable counts were
expressed as mean ± standard deviation after log transformation (Angle et al.,
1996). For further information the reader is referred to the relevant paper.

19
Results and Discussion
This is the first long-term approach using combined observations of abiotic and
biotic factors in commercial and experimental greenhouse systems with integrated
slow filters and their influence on filter efficacy against Fusarium oxysporum f.sp.
cyclaminis (Paper I). Moreover, novel techniques to study different carbohydrate
fractions in the filter skin were successfully adapted from water research and their
possible impact on filtration processes was evaluated (Paper II).
It was possible to discriminate between ornamental, tomato and experimental
systems in terms of oxygen consumption of slow filters, COD and DOC levels of
the nutrient solutions, COD and DOC elimination by slow filtration and sole
microbial parameter (fungal densities of effluents). Aerobic heterotrophic
microbial activity was the main reason for the absolute oxygen consumption of
slow filters (e.g. Huisman & Wood, 1974; Mermillod-Blondin, Mauclaire &
Montuelle, 2005). Differences as regards oxygen consumption (ornamental >
tomato > experimental) indicated more microbial respiration within commercial
slow filters (Paper I). Aerobic activity is dependent on available oxygen and
carbon sources (Madigan & Martinko, 2005). The present study showed that
oxygen was not a limiting factor for plant growth or microbial communities in
these systems and similar general fungal and bacterial microflora of the filter skin
(cfu g-1
) and supernatants (cfu ml-1
) in all systems (Fig. 3 in Paper I). As available
carbon (measured as BOD5) was very low in all systems (< 2 mg O2 l-1
), similar
microbial proliferation within the systems seemed feasible. Therefore, the
increased oxygen consumption by commercial slow filters was more influenced by
the larger surfaces of the filter skins and thicker filter bodies of the commercial
systems (Table 3) and consequently due to quantitatively but not qualitatively
enhanced microbial activities.
Irrespective of absolute differences between the systems, the COD values of
nutrient solutions were always correlated with DOC contents (tomato >>
experimental > ornamental) (Fig. 2 in Paper I). Furthermore, only the slow filter of
the tomato system reduced COD and DOC content of the nutrient solution. This is
in agreement with Weber-Shirk & Dick (1997a), who demonstrated that the
particle load of a solution is positively correlated with particle removal rates of
slow filters. Consequently, low particle load of the nutrient solutions in ornamental
and experimental systems would explain the low COD and DOC reduction in these
systems. However, the lack of a significant reduction in COD and DOC in the
experimental and ornamental systems might also have been caused by the lower
amounts of COD and DOC in the supernatant and consequently less expressed
reduction processes.
Effluents of commercial slow filters contained lower general fungal densities than
the effluents of experimental systems (Fig. 3 in Paper I), while other microbial
parameters were similar. Pythium aphanidermatum was 100% retained by slow
filtration in all systems. In the effluents of experimental systems, F. oxysporum was
regularly detected while the commercial systems contained F. oxysporum only on
one sampling occasion. Here, mechanisms analogous to those discussed for the
oxygen, COD and DOC reduction by slow filtration processes could be responsible
for this effect (Paper I).

20
Moreover, the systems studied differed as regards pH (commercial > experimental)
and EC levels (tomato > experimental > ornamental) but no interactions with state
variables were visible or affected by slow filtration processes.
Composition and density of microbial communities did not differ between
commercial and untreated experimental systems on the basis of plate counts (Fig. 3
in Paper I). Similar structured microbial communities (general bacterial flora >
fluorescent pseudomonades > general fungal flora > F. oxysporum > P.
aphanidermatum > filamentous actinomyces) were reported by Koohakan et al.
(2004) in the rhizosphere and nutrient solutions of hydroponic systems. Data on
similar microbial densities in commercial and untreated experimental systems were
supported by analogous results of the enzymatic assay (Fig. 5 in Paper I).
Treatments with FCWP in the experimental systems led to significantly enhanced
enzyme activity and a trend towards enhanced microbial density was visible.
Microbial biomass is linked to enzyme activity (Le Bihan & Lessard, 1998; Hendel
et al., 2001; Butterfield et al., 2002). Consequently, as enzyme activity was
sensitive to FCWP addition but did not increase over time, the microbial
proliferation in our trials probably reached a steady state soon after the treatment
was started (Fig. 5 in Paper I).
The tPS assay revealed filter skin or Schmutzdecke formation in the experimental
systems. Here, a slow but highly significant linear increase over time was visible
(Fig. 1 in Paper II) and similar processes have been reported in slow filters for
municipal water treatment (Yordanov, Lamb & Melvin, 1996; Campos et al.,
2002). Addition of FCWP tripled the polysaccharide accumulation rate. Increasing
amounts of microbial biomass by proliferation of microbial communities non-
culturable on R2A and malt extract agar could not be excluded. However, if that
were the case enhanced enzyme activity could be expected. A combination of
enhanced microbial biomass, increased carbohydrate concentration within
microbial cells and the influence of midge (Chironomidae) spp. in that habitat were
suggested to cause enhanced polysaccharide increase in treated systems (Paper II).
Although the addition of FCWP stimulated microbial enzyme activity (Fig. 5 in
Paper I) and fauna (Fig. 3 in Paper I) to some extent, the bePS contents of the filter
skin of treated and untreated filters were similar (Fig. 2 in Paper II) and did not
increase during a four-week period in 2005. Biofilm formation is influenced by
several environmental factors (see Biological and biochemical factors). To our
knowledge, the only environmental difference in the experimental systems was the
treatment with FCWP and the presence of Chironomidae larvae in the filter skin of
treated filters. The influence of Chironomidae larvae on biofilm formation and
composition in slow filters is not yet known. However, we can state that addition of
small amounts of FCWP (1.75 g dry mass per filter and week) did not necessarily
improve the extracellular polysaccharide content of the biofilms in slow filters
when Chironomidae larvae were present, although other biological factors (e.g.
enzyme activity) were enhanced.
Xylanase activity showed a significant seasonal trend in commercial slow filters
and increased at the end of the growing season (Fig. 6 in Paper I). Enzyme
production by the microfauna is inducible by the presence of appreciable amounts
of substrate (sometimes structurally related compounds) or is a constituent part of
microorganisms (Alexander, 1999). Increasing xylanase activity may be caused by
temporal shifts in nutrient status of the habitat and/or by shifts within the microbial

21
communities caused by environmental factors or introduction of new species to the
system. Analysis of 16 rRNA genes by denaturing gradient gel electrophoresis in
slow sand filters (Calvo-Bado et al., 2003) has shown that time and filter thickness
influences microbial communities. According to this, increased xylanase activity in
our trials was caused by favourable environmental conditions for a certain group of
organisms that we did not assay.
The main objective of this study was to find new tools for determination of filter
efficacy in situ. Filter efficacy against conidia of Fusarium oxysporum f.sp.
cyclaminis was assessed in the experimental systems in 2004 and 2005. The higher
filter efficacy and smaller standard deviation for treated filters (treated: 98.3% ±
1.0; untreated: 97.9% ± 1.8) may indicate a beneficial effect of FCWP addition.
However, positive effects of FCWP on filter efficacy were not significant (Table 1
in Paper I).
In the experimental systems, only enzyme activity varied to a significant level, so
no conclusions can be drawn beyond a descriptive level for the other factors.
Furthermore, it was not possible in our experiments to establish similar correlations
between enzyme activity and filter efficacy to those reported by Brand & Alsanius
(2004a). Nevertheless, in the present study FCWP addition led to rapid and
massive colonisation of the filter skin by Chironomidae spp. larvae, while
untreated filters were not influenced (Papers I and II). Chironomidae larvae are
well-known in slow filters and have a great impact on the biological turnover of
organic matter in these habitats, e.g. by excrement pellets and bioturbation (Wotton
& Hirabayashi, 1999). Filter skins were thin in our trials (only six to eighteen
weeks old in the experimental systems) and tubes from mining activities in upper
filter layers could provide an opportunity for fungal conidia to bypass the filter
regions with the highest biological activity. However, beneficial effects on
bacterial communities have been reported (Wotton & Hirabayashi, 1999) and a
positive effect of larval activities on slow filtration efficacy is assumed (Wotton,
Chaloner & Armitage, 1996). Midge activities could also be the cause of the
inconsistent correlations between filter efficacy and enzyme activity of the filter
skin.
Untreated filters did not show any correlations between filter efficacy and enzyme
activity (Table 1 in Paper I). Hence, the possibility to partly estimate filter efficacy
by measuring enzyme activity is questionable, probably because there are too many
influencing environmental factors. The same might be true for total polysaccharide
assay and assessed microbial communities. Significantly higher contents of tPS and
a trend for enhanced population densities in treated filters did not result in
significantly enhanced filter efficacy. However, FCWP addition was low level and
only once a week. Higher organic loads of FCWP or other material may lead to
more pronounced differences concerning filter efficacy between untreated and
treated filters and to correlations between biochemical and microbial parameters or
carbohydrate content of the filter skin. Furthermore, evaluation of the changes in
enzyme activity after inoculation of the filter skins with FCWP (Figure 3) showed
that enzyme activity was probably dependent on the time interval between
inoculation and sampling date and on EC level. While cellulose and glucanase
activity had the highest values on Day 4, a reverse trend was apparent for chitinase
and protease activity. Moreover, enzyme activity was affected by EC of the
nutrient solution, with higher EC levels leading to reduced cellulase, glucanase and

22
protease activity. As differences between EC 2 and EC 3 were small, the
differences between EC levels in commercial and experimental systems (Table 3)
were probably negligible. However, chitinase activity was highest at EC 5. Thus
more research is needed to determine the influence of the time period between
sampling incident and inoculation with FCWP and the EC on slow filter efficacy in
closed hydroponic systems.
0
0.5
1
1.5
0 1 2 3 4 5 6 7 8
day
mU
gl EC2
gl EC 3
gl EC5
ce EC2
ce EC 3
ce EC5
0
0.5
1
1.5
2
2.5
3
3.5
4
0 1 2 3 4 5 6 7 8
day
ci EC2
ci EC 3
ci EC5
pr EC2
pr EC 3
pr EC5
Figure 3. Chitinase (ci), cellulase (ce), glucanase (gl) and protease (pr) activity (mU) in slow filters integrated into two hydroponic systems at three (2, 3 and 5) distinct EC levels on Days 1, 4, 5 and 7 after inoculation with 1.75 g (dry weight) FCWP (n = 4).
Conclusions and Outlook
Although no single parameter was found to determine filter efficacy, new and
interesting candidates for further research were identified during these studies. It
was possible to distinguish between ornamental, tomato and experimental systems
by abiotic and biotic parameters. Further research on these factors may reveal
whether slow filtration is more applicable for some hydroponic systems than
others. Enzyme activity was too strongly influenced by environmental factors to
serve as a safe predictor of filter efficacy. However, enzyme assays were capable
of revealing qualitative changes in the microbial communities (e.g. xylanase
activity in commercial filters) and remain a useful tool for observing intrinsic
factors of slow filters. In the experimental systems, filter skin analysis showed that
a global parameter (polysaccharide content) was positively correlated with filter
operating time and that addition of organic material led to enhanced polysaccharide
accumulation rates. As filters are known to achieve their highest efficacy after a
certain ripening time, this may be a tool for further research to estimate filter
efficacy and to evaluate the effects of addition of various organic materials to the
filter skin. Extracellular polysaccharides of the filter skin were successfully
studied. Investigations of the extracellular polymer contents of the filter skin open
up new possibilities for horticultural research.

23
References
Alexander, M. 1999. Biodegradation and Bioremediation. 2nd edition. Academic Press Inc.. San Diego, New York, Boston, London, Sydney, Tokyo, Toronto. 453 pp.
Alsanius, B.W. & Brand, T. 2000. Reningsalternativ för näringslösning i slutna odlingssystem. Repro SLU. Alnarp. Sweden. 35 pp.
Alsanius, B.W., Ehret, D., Ng, K. & Wohanka, W. 2001. Slow filtration for disease control. Greenhouse Canada 1, 20-26.
Angle, J.S., Gagliardi, J.V., McIntosh, M.S. & Levin, M.A. 1996. Enumeration and expression of bacterial counts in the rhizosphere. In: Soil Biochemistry. Eds. Stotzky, G. & Bollag J.-M.). Marcel Dekker. New York. pp. 233-251.
Baker, M.N. 1948. The Quest for Pure Water: The History of Water Purification from the Earliest Records to the Twentieth Century. American water works association. New York.
Bellamy, W.D., Hendricks, W.D., Logsdon, G.S. 1985. Slow sand filtration: Influences of selected process variables. Journal of the American water works association 12, 62-66.
Berger, F., Li, H., White, D., Frazer, R. & Leifert, C. 1996. Effect of pathogen inoculum, antagonist density, and plant species on biological control of Phytophthora and Pythium damping-off by Bacillus subtilis Cot1 in high humidity fogging glasshouses. Phytopathology 86, 428-433.
Berkelmann, B., Wohanka, W. & Wolf, G.A. 1994. Characterization of the bacterial flora in circulating nutrient solutions of a hydroponic system with rockwool. Acta horticulturae 361, 372-381.
Bourgeois, W., Burgess, J.E. & Stuetz, R.M. 2001. On-line monitoring of waste water quality: a review. Journal of chemical technology and biotechnology 76, 337-348.
Brand, T. 2000. Beurteilung der Bakterienflora von Langsamfiltern als biologische Filtrationskomponente in geschlossenen Bewässerungssystemen des Gartenbaus. Doctoral Thesis. Technische Universität München.
Brand, T. & Wohanka, W. 2001. Importance and characterization of the biological component in slow filters. Acta horticulturae 554, 313-319.
Brand, T. & Alsanius, B.W. 2004a. Cell wall degrading enzymes in slow filters of closed hydroponic systems. Journal of horticultural science & biotechnology 79, 228-233.
Brand, T. & Alsanius, B. 2004b. Induction and impact of cell wall degrading enzymes in nutrient solution of closed hydroponic systems. Journal of phytopathology 152, 313-319
Burman, N.P. 1978. Slow Sand Filtration. H2O 11, 348-350. Butterfield, P.W., Bargmeyer, A.M., Camper, A. & Biederman, J.A. 2002. Modified
enzyme activity assay to determine biofilm biomass. Journal of microbiological methods 50, 23-31.
Calvo-Bado, L.A., Pettitt, T.R., Parsons, N., Petch, G.M., Alun, J., Morgan, W. & Whipps, J.M. 2003: Spatial and temporal analysis of the microbial community in slow sand filters used for treating horticultural irrigation water. Applied environmental microbiology 69, 2116-2125.
Campos L.C., Su, M.F.J., Graham N.J.D. & Smith S.R. 2002. Biomass development in slow sand filters. Water research 36, 4534-4551.
Costerton, J.W. 1984. The etiology and persistence of cryptic bacterial infections: a hypothesis. Reviews of infectious diseases 6, 608-616.
Christensen, B.E. 1989. The role of extracellular polysaccharides in biofilms. Journal of biotechnology 10, 181-202.
Déniel, F., Cherif, M., Gouillou, A. & Tirilly, Y. 2004. Indigenous bacteria with antagonistic and plant growth-promoting activities improve slow filtration efficiency in soilless cultivation. Canadian journal of microbiology 50, 499-508.
Dubois, M., Gilles, K.A., Hamilton, J.K., Rebers, P.A. & Smith, F. 1956. Colorimetric method to determination of sugars and related substances. Analytical chemistry 28, 350-356.

24
Duncan, A. 1988. The ecology of slow sand filters. In Slow Sand Filtration – Recent Developments in Water Treatment Technology. Ed. Graham, N.J.D. & Ellis H. Chichester. pp. 163-180.
Ehret, D.L., Alsanius, B.W., Wohanka, W., Menzies, J.G. & Utkhede, R. 2001. Disinfestation of recirculating nutrient solutions in greenhouse horticulture. Agronomie 21, 323-339.
Ellis, K.V. 1985. Slow filtration. CRC Critical reviews in environmental control 15, 315-354.
Ellis, K.V. & Aydin, M.E. 1995. Penetration of solids and biological activity into slow sand filters. Water research 29, 1333-1341.
European Union (EU) 1991. Urban waste water treatment. Directive 91/271/EEC. www.europa.eu.int/comm/environment/water/water-urbanwaste/directiv.html. (accessed 12.01.2006).
European Union (EU) 2002. Directive 2000/60/EG of the European Parliament and of the Council of 23 October 2000 establishing a framework for Community action in the field of water policy. OJ EC. L327/1.
Falkenmark, M. & Rockström, J. 2005. Rain: The neglected resource. Ed. Stockholm International Water Institute. Swedish waterhouse policy brief 2.
Garibaldi, A., Minuto, A., Grasso, V. & Guillino, M.L. 2003. Application of selected antagonistic strains against Phytophtora cryptogea on gerbera in closed soilless systems with disinfection by slow sand filtration. Crop protection 22, 1053-1061.
Gerhardt, P., Murray, R.G.E., Wood, W.A. & Krieg, N.E. 1994. Methods for General and Molecular Bacteriology. Ed. Gerhardt, P. American Society for Microbiology. New York.
Göhler, F. & Molitor H.-D. 2002. Erdelose Kulturverfahren im Gartenbau. Eugen Ulmer, Stuttgart, Germany.
Gray, J.R., Glysson, G.D., Turcios, L.M. & Schwartz, G.E., 2000. Comparability of suspended-sediment concentration and total suspended solids. U.S. Department of the Interior and U.S. Geological Survey Information Services. Denver.
Giullino, M.L. & Garibaldi, A. (1994). Influence of soilless cultivation on soilborne disease. Acta horticulturae 361, 341-354.
Heber, G. 1989. Simple Methods for the Treatment of Drinking Water. Publication of Deutsches Zentrum für Entwicklungstechnologien-GATE. Deutsche Gesellschaft für Technische Zusammenarbeit (GTZ) GmbH. Germany.
Hendel, B., Marxen, J., Fiebig, D. & Preuß, G. 2001. Extracellular enzyme activities during slow sand filtration in a water recharge plant. Water research 35, 2484-2488.
Huisman, L. & Wood, W.E. 1974. Slow Sand Filtration. Ed. World Health Organization. Geneva. Switzerland. pp. 20-46.
Jensen, M.H. & Collins, W.L. 1985. Hydroponic vegetable production. Horticultural reviews 7, 483-558.
Kemmling, A., Kämper, M., Flies, C. Schieweck, O. & Hoppert, M. 2004. Biofilms and extracellular matrices on geomaterial. Environmental geology 46, 429-435.
Khalil, S. & B.W. Alsanius, B.W. 2001. Dynamics of the indigenous microflora inhabiting the root zone of the nutrient solution of tomato in a commercial closed greenhouse system. Gartenbauwissenschaften 66, 188-198.
King, E.O., Ward, M.K. & Raney, D.E. 1954. Two simple media for the demonstration of pyomacin and fluorescin. Journal of laboratory and clinical medicine 44, 301-307.
Kloepper, J.W. & Schroth, M.N. 1981. Relationship of in vitro antibiosis of plant-growth promoting rhizobacteria to plant growth and the displacement of root microflora. Phytopathology 71, 1020-1024.
Komada, H. 1975. Development of a selective medium for quantitative isolation of Fusarium oxysporum from natural soil. Review of plant protection research 8, 114-124.
Koohakan, P., Ikeda, H., Jeanaksorn, T., Tojo, M., Kusakari, S., Okada, K., & Sato, S. 2004. Evaluation of the indigenous microorganisms in soilless culture: Occurrence and quantitative characteristics in three different growing systems. Scientia horticulturae 101, 179-188.

25
Krüger, I. 1990. Belastung der Umwelt durch Düngerstoffe bei offenen Hydroponikverfahren. Gartenbau 37, 400-401.
Larsen, E. & Greenway M. 2004. Quantification of biofilms in a sub-surface flow wetland an their role in nutrient removal. Water science and technology 49, 115-122.
Law, S.P., Melvin, M.M.A.L. & Lamb, A.J. 2001. Visualisation of the establishment of a heteroptrophic biofilm within the schmutzdecke of a slow sand filter using scanning electron microscopy. Biofilm journal 6, 1-4.
Lazarova, V. & Manem, J. 1995. Biofilm characterization and activity analysis in water and waste water treatment. Water research 29, 2227-2245.
Lebedev, G.V. 1998. Cultivation of plants under water resource deficiency. Acta horticulturae 458, 29-32.
Le Bihan, Y. & Lessard, P. 1998. Influence of operational variables on enzymatic tests applied to monitor the microbial biomass activity of a biofilter. Water science & technology 37, 199-202.
Le Bihan, L. & Lessard, P. 2000. Monitoring biofilter clogging: biochemical characteristic of the biomass. Water research 34, 4284-4294.
Leifert, C. Morris, C. & Waites, W.M. 1994. Ecology of microbial saphrophytes and pathogens in field grown and tissue cultured plants. CRC Critical reviews plant science 13, 139-183.
Le Floch, G., Rey, P., Deniel, F. Benhamou, N., Picard, K. & Tirilly, Y. 2003. Enhancement of development and induction of resistance in tomato plants by the antagonist, Pythium oligandrum. Agronomie 23, 455-460.
Madigan, T.M. & Martinko, J.M. 2005. Brock Biology of Microorganisms. 11th edition. Pearson Education LTD. London. 1088 pp.
Malley, D.F. 1998. Near-infrared spectroscopy as a potential method for routine sediment analysis to improve rapidity and efficiency. Water science & technology 37, 181-188.
McPherson, G,M. Haarriman, M.R. & Pattison, D. 1995. The potential for spread of root diseases in recirculating hydroponic systems and their control with disinfection. Meddelingen Faculteit Landbouwuniversiteit Gent 60, 371-379.
Mermillod-Blondin, F., Mauclaire, L., & Montuelle, B. 2005. Use of slow filtration columns to assess oxygen respiration, consumption of dissolved organic carbon, nitrogen transformations and microbial parameters in hyporheic sediments. Water research 39, 1687-1698.
Mine, Y., Sakiyama, R., Yamaki, Y., Suematsu, M. & Saka, H. 2003. Influence of ripening state of filters on microbe removal efficiency of slow sand filtration used to disinfect a closed soilless culture system. Journal of the Japanese society of horticultural sciences 72, 190-196.
Muhammad, N. & Hooke, A.M. 2003. Biomass characterization of slow sand filtration schmutzdecke and its effects on filter performance. Environmental technology 24, 43-50.
Nam, T.K., Timmons, M.B., Montemagno, C.D. & Tsukuda, S.M. 2000. Biofilm characteristics as affected by sand size and location in fluidised bed vessels. Aquacultural engineering 22, 213-224.
Nelson, P.V. 1998. Greenhouse Operation and Management. 5th edition. Prentice Hall Inc., Upper Saddle River, U.S.A. pp. 355-374.
Paulitz, T.C. 2000. Population dynamics of biocontrol agents and pathogens in soils and rhizospheres. European journal of plant pathology 106, 401-413.
Paulitz, T.C. & Bélanger, R.R. 2001. Biological control in greenhouse systems. Annual reviews of phytopathology 39, 103-133.
Postma, J., Willemse-de Klein, M.J.E.I.M. & van Elsas, J.D. 2000. Effect of the indigenous microflora on the development of root and crown rot caused by Phytium aphanidermatum in cucumber grown on rockwool. Phytopathology 90, 125-133.
Postma, J., Geraats, B.P.J., Pastoor, R. & van Elsas, J.D. 2005. Characterization of the microbial community involved in the suppression of Pythium aphanidermatum in cucumber grown on rockwool. Phytopathology 7, 808-818.
Runia, 1995. A review of possibilities for disinfection of recirculation water from soilless cultures. Acta horticulturae 382, 221-229.

26
Runia, W. T., Michielsen, J. M. G. P., van Kuik, A. J. & van Os, E. 1997. Elimination of root infecting pathogens in recirculating water by slow sand filtration. ISOSC Proceedings 1996. 395-407.
Rhode, A. 2004. Isolierung und Charakterisierung von bakteriellen extrazellulären polymeren Substanzen aus Biofilmen. Doctoral Thesis. Fakultät der Naturwissenschaften der Universität Duisburg-Essen.
Stanghellini, M.E. & Kronland W.C. 1986. Yield loss in hydroponically grown lettuce attributed to subclinical infection of feeder rootlets by Pythium dissotocum. Plant disease 70, 1053-1056.
Stanghellini, M.E. & Rasmussen, S.L. 1994. Hydroponics: A solution for zoosporic pathogens. Plant disease 78, 1129-1137.
Stevik, T.K., Aa, K., Ausland G. & Hanssen, J.F. 2004. Retention and removal of pathogenic bacteria in wastewater percolating through porous media: A review. Water research 38, 1355-1367.
Sutherland, I.W. 2001. Biofilm exopolysaccharide: A strong and sticky framework. Microbiology 147, 3-9.
Thomas, G.W. & Phillips, R.E. 1979. Consequences of water movement in macropores. Journal of environmental quality 8, 149-152.
Tu, J.C., A.P. Papadopoulos, A.P., Hao X. & Zheng, J. 1999. The relationship of phytium root rot and rhizosphere microorganisms in closed circulating and an open system in rockwool culture of tomato. Acta horticulturae 481, 577-583
United Nations Environment Program (UNEP). 2000. Global environmental outlook. In Internet: http://www.unep.org/geo2000/ov-e/index.htm (accessed 20.11.2005)
Van Os, E.A. 1999. Closed soilless growing systems: A sustainable solution for Dutch greenhouse horticulture. Water science & technology 39, 105-112.
Van Os, E.A. & Postma J. 2000. Prevention of root diseases in closet soilless growing systems by microbial optimisation and slow sand filtration. Acta horticulturae 532, 97-102.
Van Os, E.A., van Kuik, F.J., Runia, W.T. & van Buuren, J. 1998. Prospects of slow sand
filtration to eliminate pathogens from recirculating nutrient solutions. Acta horticulturae
458, 377-382. Van Os, E.A., Amsing, J.J., van Kuik, A-J. & Willers, H. 1999. Slow sand filtration: A
potential method for the elimination of pathogens and nematodes in recirculating nutrient solutions from glasshouse-grown crops. Acta horticulturae 481, 519-526.
Van Os, E.A., Bruins, M., Wohanka W. & Seidl R. 2001. Slow filtration: A technique to minimise the risks of spreading root-infecting pathogens in closed hydroponic systems. Acta horticulturae 559, 495-502.
Van Os, E.A., Alsanius, B.W., Wohanka, W., Brand, T. & Jung, V. 2004. Workshop: Disinfestation of recirculated nutrient solution -towards new approaches? Acta
horticulturae 644, 605-606. Waechter-Kristensen, B., Caspersen, S., Adalsteinsson, S. Sundin, P. & Jensen, P. 1999.
Organic compounds and micro-organisms in closed, hydroponic culture: Occurrence and effects on plant growth and mineral nutrition. Acta horticulturae 481, 197-204.
Weber-Shirk, M.L. & Dick, R.I. 1997a. Physical-chemical mechanisms in slow sand filters. Journal of the American water works association 89, 87-100.
Weber-Shirk, M.L. & Dick, R.I. 1997b. Biological mechanisms in slow sand filters. Journal of the American water works association 89, 72-83.
Wellington, E.M.H., Marsh, P., Watts, J.E.M. & Burden, J. 1997. Indirect approaches for studying soil microorganisms based on cell extraction and culturing. In: Modern Soil Microbiology. Eds. van Elsas, J.D., Trevors, J.T. and Wellington, E.M.H. Marcel Dekker, Inc.. New York, Basel. pp. 311-327.
Wimpenny, J. Manz, W. & Szewzyk, U. 2000. Heterogeneity in biofilms. FEMS Microbiology reviews 24, 661-671.
Wohanka, W. 1991. Wasserentkeimung bei der Hydrokultur von Zierpflanzen. Gartenbau 38, 1-3.
Wohanka, W. 1995. Disinfection of recirculating nutrient solutions by slow sand filtration. Acta horticulturae 382, 246-251.

27
Wohanka, W., Luedtke, H., Ahlers, H. & Luebke, M. 1999. Optimization of slow filtration as a means for disinfecting nutrient solutions. Acta horticulturae 481, 539-544.
Wotton, R.S. 2002. Water purification using sand. Hydrobiologia 469,193-201. Wotton, R.S. 2004. The ubiquity and many roles of exopolymers (EPS) in aquatic systems.
Scientia marina 68, 13-21. Wotton, R.S., Chaloner, D.T. & Armitage, P.D. 1996. The colonisation, role in filtration
and potential nuisance value of midges in slow sand filters. In Advances in Slow Sand and Alternative Biological Filtration. Eds. Graham, N. & Collins, R. Chichester. John Wiley & Sons. New York, Brisbane, Toronto, Singapore. pp. 107-118.
Wotton, R.S. & Hirabayashi, K. 1999. Midge larvae (Diptera: Chironomidae) as engineers in slow sand filter beds. Water research 33, 1509-1515.
Yordanov, R.V., Lamb, A.J. & Melvin, M.A.L. 1996. Biomass characteristics of slow sand filters receiving ozonated water. In Advances in Slow Sand and Alternative Biological Filtration. Eds. Graham, N. & Collins, R. John Wiley & Sons. Chichester, New York, Brisbane, Toronto, Singapore. pp. 107-118.
Zhang, X., Bishop, P.L. & Kinkle, B.K. 1999. Comparison of extraction methods for quantifying extracellular polymers in biofilms. Water science and technology 39, 211-218.
Zhang, W. & Tu, J.C. 2000. Effect of ultraviolet disinfection of hydroponic solutions on Pythium root rot and non targeted bacteria. European journal of plant pathology 106, 415-421.

28
Acknowledgements
I want to thank the helping people during my stay in Sweden.
I want to thank my supervisors for helping me to cope with the immense struggle of
encrypting the secrets of slow filtration. Special thanks to Dr. Brand who supported
me from Germany and without his advices my work would not have been possible.
Thanks to Prof. Wohanka, who supplied me with strains of Fusarium oxysporum
sp. when I urgently needed them.
Thanks to all the people of the H-house. You helped me so much in organizing
vital items for my research. I hope I did not disturb you to much. Especially I want
to thank Eva Johansson for giving me support when I needed it.
Then I want to thank all the students who helped me so much in the greenhouse
and laboratory. Thanks to Karl-Johan, Micael, Torun, Johanna and Mats.
Thanks to the Austrian fraction, Margit and Andrea, in our department for
socializing me a little bit and for your introduction in Swedish society.
Special thanks to Nelia. You made me laughing a lot and I never forget your
Portuguese language lessons. And you helped me a lot. Thank you Andrea for
opening my eyes. I hope you will have success in the States. Thanks to Siju and all
the others from the ecological chemistry department who spent some time with me.
Then I want to thank all the Malmö people who joined me in pubs and parties. Au
revoir le French connection and Ulla. Have fun.
Finally, I want thank the family Edelmann for interesting discussions about the
absence of prospects in fully understanding filtration processes and my brother for
helping me in physical related questions.

I

1
Abiotic and biotic factors in slow filters
integrated to closed hydroponic systems
Abiotische und biotische Faktoren in Langsamfiltern in geschlossenen hydroponischen Systemen.
Bernhard Furtner1, Karl-Johan Bergstrand1, Thomas Brand2, Victoria Jung1, Beatrix W. Alsanius1
(accepted 2006)
1) Department of Crop Science, P.O. Box 44, SE-23053 Alnarp, Sweden. 2) Landwirtschaftskammer (Chamber of Agriculture) Niedersachsen, Sedanstr. 4,
DE-26121 Oldenburg, Germany.
Corresponding author: Beatrix Alsanius, Department of Crop Science, P.O. Box 44, SE-23053 Alnarp, Sweden. Telephone number: +46 (0)40 41 53 36; fax.: +46 (0)40 46 04 41; e-mail: [email protected]
Summary Selected abiotic (electric conductivity, pH, oxygen content, chemical oxygen demand, dissolved organic carbon) and biotic (general bacterial and fungal microflora, fluorescent pseudomonads, filamentous actinomycetes, Fusarium
oxysporum, Pythium aphanidermatum, biochemical oxygen demand, enzyme activities) factors have been monitored in two distinct commercial hydroponic systems with tomato and ornamental plants with integrated slow filters in supernatant, filter skin and effluent in two successive years. In six small scale experimental systems with two slow filters each (nutrient film technique, crop: tomato) the same parameters were followed to establish possible correlations with filter efficacy against Fusarium oxysporum f.sp. cyclaminis. In half of the systems, the filter skin was enriched with fungal cell wall preparation. Nutrient solutions of the systems showed biggest differences concerning the chemical oxygen demand (COD) (commercial tomato system >> experimental system > commercial ornamental system) and dissolved organic carbon content (DOC). Both factors were positively correlated in supernatant and effluent (e.g. supernatant: r2 = 0.813; p < 0.001). A significant reduction of COD and DOC due to filtration was visible only in the commercial tomato system. The biological oxygen demand of the nutrient solutions was always very low (< 2 mg O2 l
-1). Absolute oxygen content was always reduced by filtration processes. Electric conductivity and pH of nutrient solution remained unaffected by filtration processes. No significant differences between the growing systems concerning biotic factors have been
2
observed in supernatant and filter skin. Pythium aphanidermatum and Fusarium
oxysporum were regularly found in the supernatants and colonized the observed filter skins. All effluents of the systems were free of P. aphanidermatum. Fusarium
oxysporum was detected continuously in the effluents of the experimental system while effluents of commercial systems contained only F. oxysporum at one incident. Values for chitinase, cellulase, glucanase and protease enzyme activities of the filter skin were not influenced neither by growing systems nor time. Only xylanase activity showed seasonal influences and activities increased over time (mU = 0.088 (mU week-1)* t (week); r2 = 0.546; p < 0.001). Filter efficacies against Fusarium oxysporum f.sp. cyclaminis in the experimental systems varied between 98.3 % ± 1.0 (treated) and 97.9 % ± 1.8 (untreated) but no significant differences could be stated. Key words. Enzyme activities - filter efficacy – microfauna – nutrient solutions - organic matter – oxygen content. Introduction Closed hydroponic systems are commonly used for the in- and outdoor plant production (EHRET et al. 2001). They inhabit a risk for rapid dispersal of plant pathogens (STANGHELLINI and RASMUSSEN 1994) which is considered as a major problem for this production method (ZHANG and TU 2000; HONG et al. 2003; CALVO-BADO et al. 2003). Slow filtration (SF) is one of the oldest, most reliable and simplest water disinfestation technologies (BAKER 1948) and has been adopted successfully to horticulture in the early 1990s (WOHANKA 1991; RUNIA 1995; WOHANKA 1995; ALSANIUS et al. 2001). Suitability of disinfestation methods is generally expressed in terms of efficacy against a selected pathogen and is of great interest for commercial growers. Therefore a method to assess filter efficacy without pathogen inoculation was demanded (BRAND and ALSANIUS 2004). As filter efficacy in SF is considered to be a complex interaction between physical, biochemical and biological factors (YORDANOV et al. 1996; BRAND and WOHANKA 2001) and the fundamental principles remain poorly defined (CAMPOS et al. 2002), prediction of filter efficacies can probably expected to be expressed as a multifactor equation. A review by STEVIK et al. (2004) showed that straining and adsorption were considered as the main mechanisms of retention of bacterial pathogens in slow filtration and were affected by filter media, organic matter content of the filter, extent of biofilm, temperature, flow rate, ionic strength, pH of the filtered liquid and microbial qualities e.g. shape and size of the pathogen. Physical factors, such as the flow rate (m h-1) of the nutrient solution and the filter medium affected the filter efficacy against several fungal and bacterial plant diseases. In general, the filter efficacy was enhanced by low flow rates and large surface areas in combination with small filter pore diameter (WOHANKA et al. 1995; WOHANKA et al. 1999) but results were not consistent and other major influences were suggested (VAN OS et al. 2001). The importance of the biological factors in hydroponic systems with integrated SF were demonstrated by showing the lower filter efficacy of steam sterilized filters (BRAND and WOHANKA 2001) and biologically inactive (fresh) filters (MINE et al. 2003) compared to biologically ripened filters. Further research revealed that

3
amendment of fungal cell wall preparation (FCWP) to filter surfaces resulted in enhanced cell wall-degrading enzymes activities. A correlation between filter efficacy against Fusarium oxysporum f. sp. cyclaminis and enzyme activities was established but was not considered to be sufficiently strong (r2 = 0.495) to predict filter efficacy as a sole factor (BRAND and ALSANIUS 2004). The main goal of the present investigation was to determine state variables that might predict efficacy of slow filters in hydroponic systems in a future multifactor equation. As a first step, we conducted a survey to limit the number of potential state variables by screening a broad variety of abiotic and biotic factors in the nutrient solution and slow filters integrated into hydroponic greenhouse systems. We hypothesized that physical (e.g., temperature), chemical and biochemical (e.g., pH, Ec, DOC, COD, BOD, oxygen content and saturation, activity of selected hydrolytic enzymes), biological (e.g., general fungal and bacterial flora, selected groups of microorganisms involved biocontrol, selected pathogens) might be candidate state variables for a future multifactor equation. Materials and Methods
Sampling sites Samples were taken at two commercial as well as in experimental closed hydroponic growing greenhouse systems (E) with integrated slow filters. In Poppelgårdens Driverier (O) ornamental pot plants (mainly Euphorbia
pulcherrima, Impatiens walleriana, Primula sp., Celosia sp.; production area: 1 ha) were produced in a trough system using a peat-based growing medium. Ingelstorp Trädgård (T) grew tomatoes (production area: 0.5 ha) in a system with containers filled with pumice stones. In O and T, trough and drip irrigation were used, respectively. The systems differed with respect to the volume of used nutrient solution (ornamental: ca. 18 m3; tomato: 12 m3; experimental: 0.18 m3), the age of the slow filters (ornamental: 3 a; tomato: 5 a; experimental: 0 – 0.5 a), the flow rate (ornamental: 100 – 200 l m2 h-1; tomato: 100 l m2 h-1; experimental: 300 l m2 h-1) and the filter body height and surface area (ornamental: 1 m; Ø 5.9 m2; tomato: 1 m; Ø 5.85 m2; experimental: 0.5 m; Ø 0.2 m2). All systems were connected to slow filters with granulated mineral wool (granulaat, 001309, Grodan, The Netherlands). The two experimental NFT-systems (E) were designed as previously described (BRAND and ALSANIUS 2004). Briefly, six independent nutrient film technique (NFT) systems were set up and each system was connected to two filter units (packing density: ca 107 kg m-3). Tomato (Lycopersicon esculentum 'Aromata') was planted at a density of 4 plants m-2. Plants were cultivated for 24 weeks, starting middle of January. Temperature was set to 18 °C (night) and 19 °C (day) and artificial light was used (200 W m-2) during the first twelve weeks. The slow filters were start six weeks before the first sampling, to allow a biological ripening of the filters. Fungal cell wall preparation (FCWP) was added to six of the filters (treated) to enhance enzyme activity, whereas the six other filters served as control (untreated). Electric conductivity (EC) and pH were measured and adjusted daily. The EC was adjusted to 2.7 (± 0.1) mS cm-1 with stock solutions (SONNEVELD and STRAVER 1989). The pH was adjusted daily to 5.8 (± 0.2) using 2 M sulphuric acid or 2 M potassium hydroxide.

4
Sampling dates and sampling points within the systems All investigations were conducted 2004 and 2005. Samplings in the commercial systems were conducted nine times from May till October in 2004 and 2005. In the experimental systems, the sampling period lasted for twelve weeks, starting in the beginning of April. Briefly, samples were taken for the biological and biochemical analysis every two weeks in E. Abiotic factors were monitored permanently (temperature of nutrient solution) or at least weekly (oxygen content, EC, pH). In the commercial systems analysis were conducted ten times during the growing season. To describe the influence of the filters on the systems, three sampling points were chosen. Nutrient solution from the crop was collected above the filter surface (supernatant) and from the effluent of the filters (effluent). Mineral wool fibre were pulled off the upper part of the filter surface (filter skin). 2.3 Amendment of fungal cell wall preparation (FCWP) FCWP was produced according to BRAND and ALSANIUS (2004) and added weekly. Aliquots of 1.75 g (dry weight) were administered to the filters in E. The amendment started at the end of March and continued for twelve weeks. Comparability of starting conditions were checked before the first administrating of FCWP (week 0). Abiotic factors Oxygen content (Handy Mk 1, OxyGuard ®, Birkerød, Denmark), EC (TD Scan WP 4, Eutech Instruments Pte Ltd, Singapore) and pH (pH meter, Russell pH Ltd, Auchtermuchty, United Kingdom) were manually measured once a week (7 days after inoculation with FCWP) in the supernatant and the effluent of the filters to give an overall picture of the systems. In addition, oxygen content (% and mg l-1), pH and EC in the supernatant were measured every sampling day in the supernatant. Oxygen consumption of filters was calculated by subtracting the oxygen content values of the effluent from the ones of the supernatant. In the first year, samples for oxygen content were taken right after the effluent leaft the valve at the bottom of the slow filters. Measured reduction in oxygen content was low probably due to high pressure of the nutrient solution and therefore complicated sampling. Hence, all effluent samples were taken at the inlet of the gutter in the second year. The oxygen content was noted when the display of the oxygen meter was stable for at least 15 s. Values for BOD5, COD and dissolved organic carbon (DOC) were determined in accordance to standard methods using the test kits LCK 555, LCK 314 and LCK 385, respectively (Dr. Lange GmbH, Düsseldorf, Germany). Prior to DOC analysis, the solutions were membrane filtered (Filtropur S 0.2, Sarstedt, Nümbrecht, Germany; pore size: 0.2 µm) before testing. Temperature of the nutrient solutions in the supernatants were measured continuously by data loggers (HOBO® H08-002-02, Onset Computer Corporation, Pocasset, MA, U.S.A.) and TMC6-HA temperature sensors (Onset Computer Corporation, U.S.A.) in all systems. Microbiological assays Aliquots of 1 ml of supernatant and effluent from the filter were serially diluted in NaCl (0.85 %). For dilution of filter skin samples, 5 ml of 0.85 % NaCl solution
5
were added to 50 mg (wet weight) of mineral wool granules and vortexed vigorously for 5 s. Plate counts were conducted to estimate the populations of general bacterial and fungal flora, fluorescent pseudomonads and filamentous actinomycetes as described elsewhere (KHALIL and ALSANIUS 2001) using 100 µl aliquots of the nutrient solution. Fusarium oxysporum was quantified using selective medium (KOMADA 1975). Aliquots of 200 µl were spread and incubated for five days (25 °C). For estimation of Pythium aphanidermatum 200 µl aliquots were spread on potato dextrose agar media (PDA, Difco, 213400, Sparks, MD, U.S.A.) and incubated at 35 °C for 18 h. All investigations were performed two-fold using two sub samples per dilution step and sample. Enzyme activity Enzyme activity measurement of the filter skin (chitinase, cellulase, glucanase, protease and xylanase) was conducted by a method described by BRAND and ALSANIUS (2004). Two kinds of sample preparations were used: (i) during the first five weeks in 2004, aliquots of 50 mg of wet mineral wool were processed for the samples taken in E, (ii) aliquots of 50 mg of lyophilized mineral wool. The latter was considered for all following samples in order to obtain sufficiently high activity levels as the measured enzyme activities for (i) were low. Analysis was done with duplicate parallels and two subsamples. The samples from commercial systems contained large amounts of muddy substances which solved while incubating in the enzyme substrate and caused clogging of pipette tips and jeopardized the transfer of the enzyme substrate solution. Thereto incubated samples were centrifuged for 5 min using a desk centrifuge (Millipore, U.S.A) before transferring 150 µl of the solution to microtiter plates and stopping the enzyme reaction with 150 µl 2 M HCl. Efficacy test Filter efficacy against Fusarium oxysporum f.sp. cyclaminis (Focy) was determined eight weeks and twelve weeks (2004) after the first incubation with FCWP. In 2005, one efficacy test was performed twelve weeks after starting the treatment and the first efficacy test was repeated in September 2005. The efficacy test was described by BRAND and ALSANIUS (2004). All tests were performed six days after the last addition of FCWP. Viable counts were enumerated with five replicates per dilution step and sample. Statistical analyses The results from viable counts, expressed as mean ± SD after log transformation (Angle et al. 1996), were analysed by using one-way ANOVA combined with Tukey B test (p < 0.05). For detection of significant differences between treated and untreated systems in the experimental systems, ANOVA or the nonparametric Wald-Wolfowitz sequence test were used. For testing of correlations between factors the Pearson correlations coefficient (two-folded) was calculated and testing on differences between supernatant and effluent two-pair sample t-test was used. To describe differences between the systems concerning oxygen consumption of slow filters these data were expressed as ppm h-1 as suggested by MERMILLOD-BLONDIN et al. (2005). These values enable a better comparability because of different flow rates and filter heights of the systems. The level of significance in all

6
tests was α = 0.05. All calculations were done using SPSS 11.5 (SPSS Software GmbH, München, Germany). Results
Abiotic factors For the experimental systems, the temperature (°C) of the nutrient solutions (2004: 21.6 °C ± 1.6; min. 18.7; max. 27.5; 2005: 22.2 °C ± 1.9; min. 18.7, max. 28.7) did not differ between treated and untreated filters. Comparable values were found in the commercial system for tomato (2004: 21.6 °C ± 1.6; min.: 17.1 °C; max.: 25.6 °C; 2005: 20.0 °C ± 1.4; min.: 16.76 °C; max.: 25.6 °C) while lower temperatures were monitored in the ornamental system in 2004 (19.7 °C ± 2.3; min.: 13.7; max.: 29.9). In this system data were lost due to data logger failure in 2005. The pH of the nutrient solution was not affected by the passage through any of the filters. No significant differences in EC between experimental systems with or without treatment and similar values were found in both years. In the commercial ornamental system, considerable variations were found in the supernatant (1.1 ± 0.4 mS cm-1) and effluent (1.2 ± 0.8 mS cm-1) in 2004; during 2005 the EC displayed a more homogenous picture (supernatant: 1.0 mS cm-1 ± 0.3; effluent: 1.0 mS cm-1 ± 0.3). In the commercial tomato system EC-levels were higher (supernatant: 3.38 mS cm-1 ± 0.75; effluent: 3.17 mS cm-1 ± 0.65) in 2004 than in 2005 (supernatant: 3.3 mS cm-1 ± 0.3; effluent: 3.3 mS cm-1 ± 0.4). Oxygen contents (mg l-1) of the supernatant were 5.7 mg l-1 (± 0.7) and 6.7 mg l-1 (± 0.9) in the experimental systems in 2004 and 2005, respectively. Irrespective of the filter treatment, oxygen consumption (mg l-1) of filters was detectable and statistically significant (2004: 0.3 mg l-1 ± 0.1; 2005: 1.0 mg l-1 ± 0.3) in both years. In contrast to the experimental systems, the oxygen content in the supernatant of both commercial systems was significantly higher (ornamental: 2004: 8.6 mg l-1 ± 0.7; 2005: 9.1 mg l-1 ± 0.9; tomato: 8.0 mg l-1 ± 1.2; 2005: 8.2 mg l-1 ± 0.7) and oxygen consumption was significantly enhanced (ornamental: 2004: 3.4 mg l-1 ± 1.4; 2005: 2.8 mg l-1 ± 1.2; tomato: 2004: 2.3 mg l-1 ± 1.4; 2005: 2.7 mg l-1 ± 0.9) compared to the experimental systems. Absolute oxygen consumption was ornamental > tomato > experimental systems in both years. However, comparison of oxygen consumption per h of the filters demonstrated that filters in experimental station had highest oxygen consumptions per h (Figure 1) in 2005.
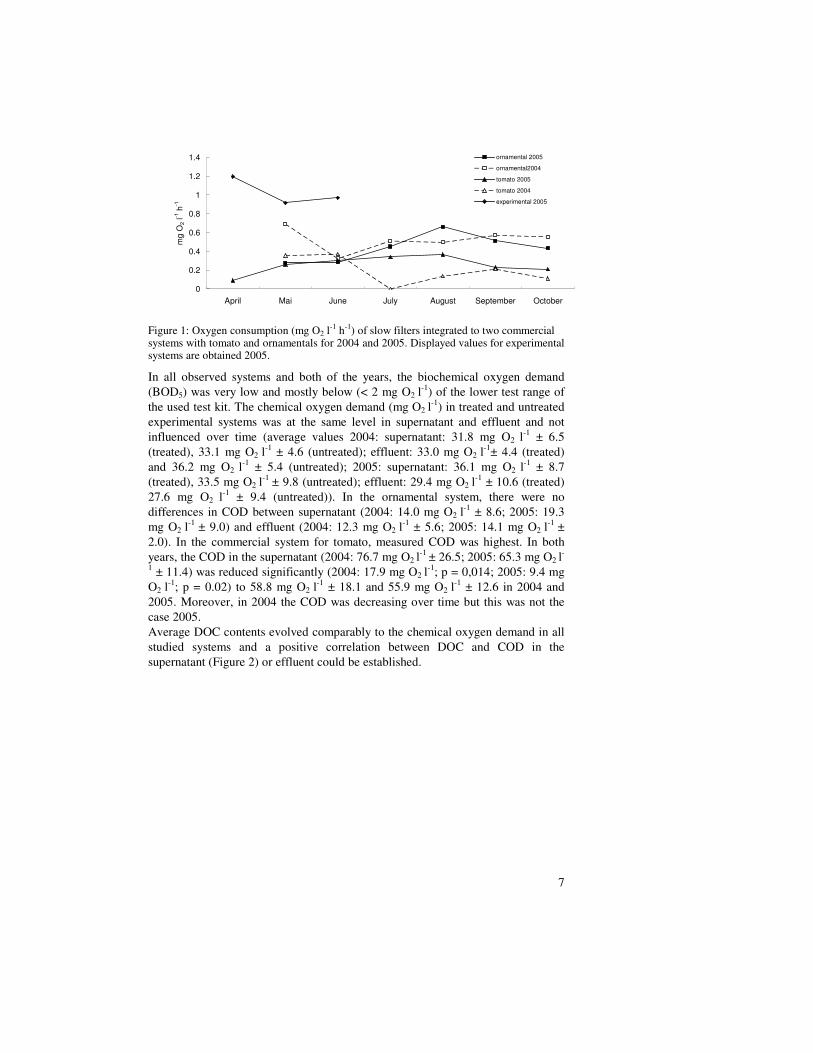
7
Figure 1: Oxygen consumption (mg O2 l-1 h-1) of slow filters integrated to two commercial
systems with tomato and ornamentals for 2004 and 2005. Displayed values for experimental systems are obtained 2005.
In all observed systems and both of the years, the biochemical oxygen demand (BOD5) was very low and mostly below (< 2 mg O2 l
-1) of the lower test range of the used test kit. The chemical oxygen demand (mg O2 l
-1) in treated and untreated experimental systems was at the same level in supernatant and effluent and not influenced over time (average values 2004: supernatant: 31.8 mg O2 l-1 ± 6.5 (treated), 33.1 mg O2 l
-1 ± 4.6 (untreated); effluent: 33.0 mg O2 l-1± 4.4 (treated)
and 36.2 mg O2 l-1 ± 5.4 (untreated); 2005: supernatant: 36.1 mg O2 l-1 ± 8.7 (treated), 33.5 mg O2 l
-1 ± 9.8 (untreated); effluent: 29.4 mg O2 l-1 ± 10.6 (treated)
27.6 mg O2 l-1 ± 9.4 (untreated)). In the ornamental system, there were no differences in COD between supernatant (2004: 14.0 mg O2 l
-1 ± 8.6; 2005: 19.3 mg O2 l
-1 ± 9.0) and effluent (2004: 12.3 mg O2 l-1 ± 5.6; 2005: 14.1 mg O2 l
-1 ± 2.0). In the commercial system for tomato, measured COD was highest. In both years, the COD in the supernatant (2004: 76.7 mg O2 l
-1 ± 26.5; 2005: 65.3 mg O2 l-
1 ± 11.4) was reduced significantly (2004: 17.9 mg O2 l-1; p = 0,014; 2005: 9.4 mg
O2 l-1; p = 0.02) to 58.8 mg O2 l
-1 ± 18.1 and 55.9 mg O2 l-1 ± 12.6 in 2004 and
2005. Moreover, in 2004 the COD was decreasing over time but this was not the case 2005. Average DOC contents evolved comparably to the chemical oxygen demand in all studied systems and a positive correlation between DOC and COD in the supernatant (Figure 2) or effluent could be established.
0
0.2
0.4
0.6
0.8
1
1.2
1.4
April Mai June July August September October
mg
O2 l
-1 h
-1
ornamental 2005
ornamental2004
tomato 2005
tomato 2004
experimental 2005

8
Figure 2: Mean values of DOC (mg l-1) and COD (mg O2 l-1) in the supernatant of all systems in 2004 and 2005. Microbial assessment The general bacterial flora counts were not influenced by the season or the year or by the different systems. The general fungal flora showed a similar pattern, but at a lower level. To maintain a concise picture mean values (± std) for all systems and all assessed microbial parameters are shown for 2005 only (Figure 3). The general bacterial flora exceeded the number of fluorescent pseudomonads in all systems and both years (Figure 3).
Figure 3: Characterization of the nutrient solution (cfu ml-1) before and after passage through horticultural slow filters and of the filter skin (cfu g-1) in experimental (A, C) and commercial (B, D) slow filters by the general heterotrophic bacterial (R2A) and fungal (MA) flora, fluorescent pseudomonads (KB), filamentous actinomycetes (COA) as well as Fusarium oxysporum (Komada) and Pythium aphanidermatum (PDA). Six experimental slow filters were treated with a fungal cell wall preparation (+) while six slow filters served as a control. Tomato was used as a crop in the experimental systems and in one of the commercial ones (T). In the second commercial system (O), ornamentals were grown. Bars display mean values ± SD as expressed as log cfu ml-1 (sup: supernatant; eff: effluent) and log cfu g-1 mineral wool (filter skin).
Poppelgorden
0
10
20
30
40
0 20 40 60 80 100 120 140
COD (mg O2 l-1
)
DO
C (
mg l -1
)
tomato 2004
tomato 2005
ornamental 2004
ornamental 2005
experimental 2004
experimental 2005
B D
0
2
4
6
8
10
12
sup (+) eff (+) filter skin (+) sup eff filter skin
log
cfu
R2A
KB
COA
0
2
4
6
8
10
12
sup (T) eff (T) filter skin (T) sup (O) eff (O) filterskin (0)
R2A
KB
COA
A B
B D
0
1
2
3
4
5
6
7
8
sup (+) eff (+) filter skin (+) sup eff filter skin
log c
fu
MA
Komada
PDA
0
1
2
3
4
5
6
7
8
sup (T) eff (T) filter skin (T) sup (O) eff (O) filterskin (0)
MA
Komada
PDAC D
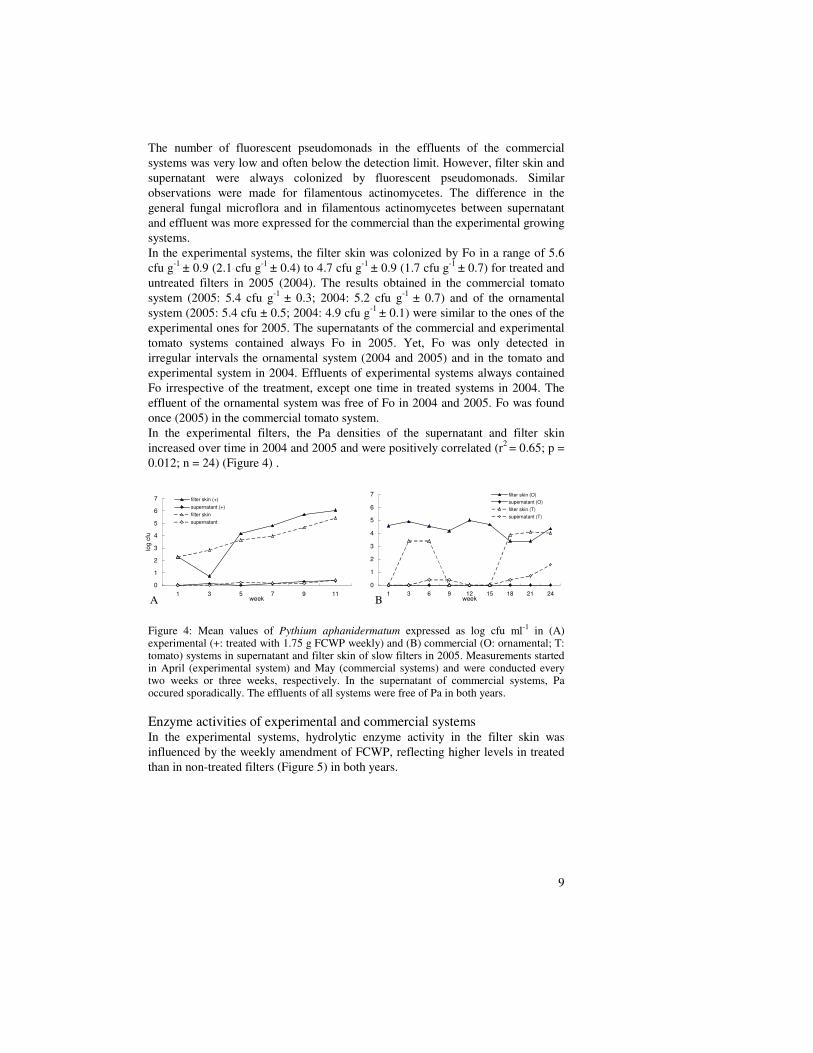
9
The number of fluorescent pseudomonads in the effluents of the commercial systems was very low and often below the detection limit. However, filter skin and supernatant were always colonized by fluorescent pseudomonads. Similar observations were made for filamentous actinomycetes. The difference in the general fungal microflora and in filamentous actinomycetes between supernatant and effluent was more expressed for the commercial than the experimental growing systems. In the experimental systems, the filter skin was colonized by Fo in a range of 5.6 cfu g-1 ± 0.9 (2.1 cfu g-1 ± 0.4) to 4.7 cfu g-1 ± 0.9 (1.7 cfu g-1 ± 0.7) for treated and untreated filters in 2005 (2004). The results obtained in the commercial tomato system (2005: 5.4 cfu g-1 ± 0.3; 2004: 5.2 cfu g-1 ± 0.7) and of the ornamental system (2005: 5.4 cfu ± 0.5; 2004: 4.9 cfu g-1 ± 0.1) were similar to the ones of the experimental ones for 2005. The supernatants of the commercial and experimental tomato systems contained always Fo in 2005. Yet, Fo was only detected in irregular intervals the ornamental system (2004 and 2005) and in the tomato and experimental system in 2004. Effluents of experimental systems always contained Fo irrespective of the treatment, except one time in treated systems in 2004. The effluent of the ornamental system was free of Fo in 2004 and 2005. Fo was found once (2005) in the commercial tomato system. In the experimental filters, the Pa densities of the supernatant and filter skin increased over time in 2004 and 2005 and were positively correlated (r2 = 0.65; p = 0.012; n = 24) (Figure 4) .
Figure 4: Mean values of Pythium aphanidermatum expressed as log cfu ml-1 in (A) experimental (+: treated with 1.75 g FCWP weekly) and (B) commercial (O: ornamental; T: tomato) systems in supernatant and filter skin of slow filters in 2005. Measurements started in April (experimental system) and May (commercial systems) and were conducted every two weeks or three weeks, respectively. In the supernatant of commercial systems, Pa occured sporadically. The effluents of all systems were free of Pa in both years. Enzyme activities of experimental and commercial systems In the experimental systems, hydrolytic enzyme activity in the filter skin was influenced by the weekly amendment of FCWP, reflecting higher levels in treated than in non-treated filters (Figure 5) in both years.
0
1
2
3
4
5
6
7
1 3 6 9 12 15 18 21 24week
filter skin (O)
supernatant (O)
filter skin (T)
supernatant (T)
0
1
2
3
4
5
6
7
1 3 5 7 9 11week
log
cfu
filter skin (+)
supernatant (+)
filter skin
supernatant
A B

10
Figure 5: Dynamics in (A): protease and glucanase as well as in (B): chitinase and cellulase activities (mU) observed in filter skins of slow filters with (+) or without administration of fungal cell wall preparation (1.75 g FCWP per week) in 2005. Treatment started early April (week 1) and was conducted till end of June. Week 0 served as a control (n=6).
In 2004, the chitinase activities of treated and untreated filters rose from 0.5 (± 0.7) mU and 0.1 (0.5) mU in week 0 to 1.6 (± 0.6) mU and 0.6 (± 0.3) mU, respectively, within twelve weeks. After twelve weeks of treatments a significant difference between untreated and treated filters was visible. Compared to 2004, the chitinase activities obtained in 2005 were more balanced and ranged between 1.8 mU (week 1; treated filters) and 0.6 mU (week eleven, untreated filters). Compared to week 1, the chitinase activities of untreated filters decreased significantly from 1.8 (± 0.2) mU to 1.2 (± 0.2) mU. Cellulase activities of treated filters increased from 0.0 to 0.7 mU during 2004. Untreated filters showed low activities between 0.0 and 0.2 mU. In 2005 the cellulase activities ranged from 0.3 (± 0.1) to 0.7 (± 0.3) mU in the treated filters and 0.1 (± 0.4) to 0.5 (±0.1) mU in the control. Glucanase activity in untreated filters was low in 2004 and increased from 0.0 (week 1: ± 0.1) to 0.2 (week 13: ± 0.0) mU. Treated filters showed higher and significant activity increase over time with 0.0 ± 0.1 mU (week 1) and 0.6 ± 0.2 mU (week 13). In 2005, the similar patterns were observed. However, the differences between untreated and treated filters were not as expressed as in 2004 and only in week five and eleven significant differences were found. In 2004, no significant differences for protease activity were found between the two treatments, except from week one and thirteen. In contrast to 2004, protease activities were enhanced in both treatments in 2005. Average protease activity in treated filters (2004: 0.7 ± 0.4 mU; 2005: 1.4: ± 0.4 mU) was significantly higher only 2005 (p = 0.07) compared to untreated filters (2004: 0.3 ± 0.2 mU; 2005: 0.8 ± 0.2 mU). Xylanase activity was detected only at one sampling date in 2004 in May. In 2005, activities were detectable at five sampling dates in at least one of the filter skins and no differences between treated and untreated filters were visible. It was only at one sampling date in April that all twelve filters showed xylanase activities ranging between 0.8 (± 0.3) mU and 0.6 (± 0.1) mU for treated and untreated filters respectively. In the commercial slow filters substantial standard deviations resulted from varying enzymes activities levels in the filter skin. Statistical comparisons between enzymatic activities of commercial and experimental systems were not calculated due to differences in number of observations and sampling periods. In general, enzyme activities in the filter skin of the ornamental and tomato growing systems
2.036943
0.378505
0.473264 0
0
0.5
1
1.5
2
2.5
0 1 3 5 7 9 11 13
week
mU
protease (+)
protease
glucanase (+)
glucanase
0
0.5
1
1.5
2
2.5
0 1 3 5 7 9 11 13week
chitinase (+)
chitinase
cellulase (+)
cellulase
A B
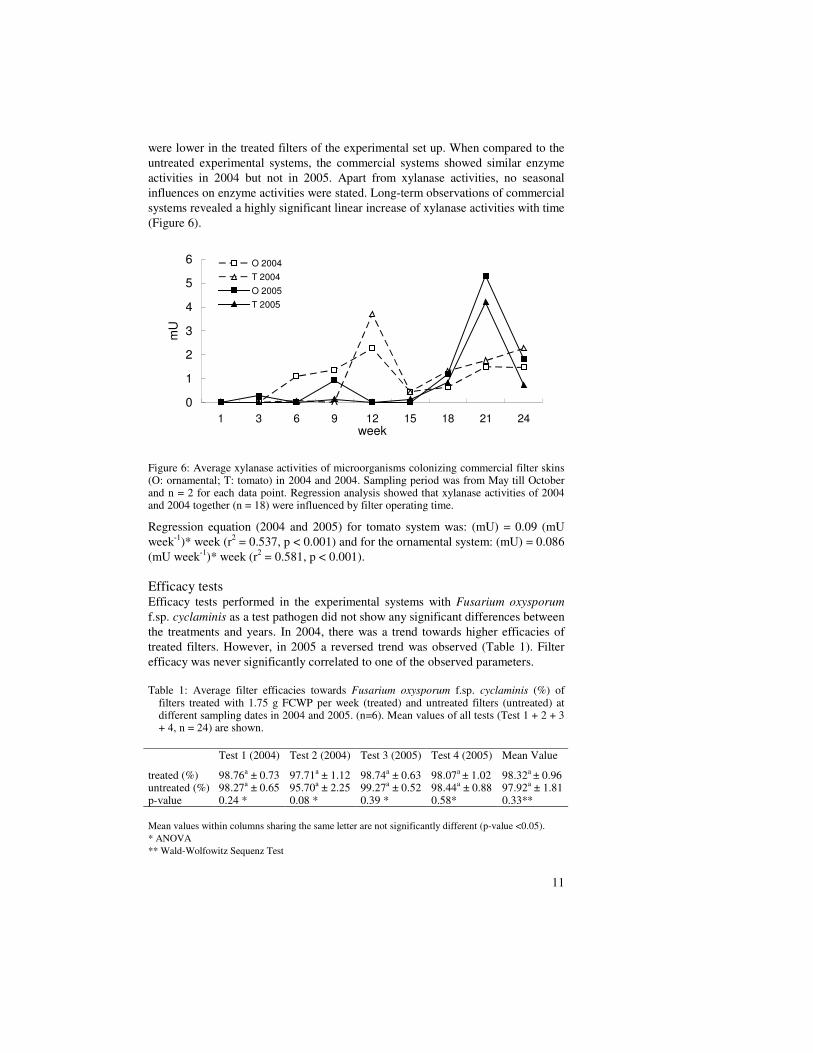
11
were lower in the treated filters of the experimental set up. When compared to the untreated experimental systems, the commercial systems showed similar enzyme activities in 2004 but not in 2005. Apart from xylanase activities, no seasonal influences on enzyme activities were stated. Long-term observations of commercial systems revealed a highly significant linear increase of xylanase activities with time (Figure 6).
Figure 6: Average xylanase activities of microorganisms colonizing commercial filter skins (O: ornamental; T: tomato) in 2004 and 2004. Sampling period was from May till October and n = 2 for each data point. Regression analysis showed that xylanase activities of 2004 and 2004 together (n = 18) were influenced by filter operating time.
Regression equation (2004 and 2005) for tomato system was: (mU) = 0.09 (mU week-1)* week (r2 = 0.537, p < 0.001) and for the ornamental system: (mU) = 0.086 (mU week-1)* week (r2 = 0.581, p < 0.001). Efficacy tests Efficacy tests performed in the experimental systems with Fusarium oxysporum f.sp. cyclaminis as a test pathogen did not show any significant differences between the treatments and years. In 2004, there was a trend towards higher efficacies of treated filters. However, in 2005 a reversed trend was observed (Table 1). Filter efficacy was never significantly correlated to one of the observed parameters. Table 1: Average filter efficacies towards Fusarium oxysporum f.sp. cyclaminis (%) of
filters treated with 1.75 g FCWP per week (treated) and untreated filters (untreated) at different sampling dates in 2004 and 2005. (n=6). Mean values of all tests (Test 1 + 2 + 3 + 4, n = 24) are shown.
Test 1 (2004) Test 2 (2004) Test 3 (2005) Test 4 (2005) Mean Value
treated (%) 98.76a ± 0.73 97.71a ± 1.12 98.74a ± 0.63 98.07a ± 1.02 98.32a ± 0.96 untreated (%) 98.27a ± 0.65 95.70a ± 2.25 99.27a ± 0.52 98.44a ± 0.88 97.92a ± 1.81 p-value 0.24 * 0.08 * 0.39 * 0.58* 0.33** Mean values within columns sharing the same letter are not significantly different (p-value <0.05). * ANOVA ** Wald-Wolfowitz Sequenz Test
0
1
2
3
4
5
6
1 3 6 9 12 15 18 21 24week
mU
O 2004
T 2004
O 2005
T 2005
12
Discussion Indirect methods for assessment of efficacy of slow filters for horticultural purposes are a novel approach. BRAND and ALSANIUS (2004) found that enzyme activities might be part of such tool. As enzyme activities only explained part of the filter efficacy, further state variables should be identified. For potable water purposes, WEBER-SHIRK and DICK (1997 a, b) pointed out biological as well as physical and chemical mechanisms for retention of particles and Escherichia coli. They pointed out particle size as a dominant factor. This finding was also supported by observations for other filter types for horticultural industries (ALSANIUS and BERGSTRAND 2004). CALVO-BADO et al. (2003) characterized the microbial communities active in slow sand filters, but do not display tools for efficacy assessment. The present paper characterized a broad spectrum of physical, chemical and biological state variables in the nutrient solution in closed growing systems and of the filter skin that might be of interest for slow filters in horticulture including both experimental and commercial slow filters. Despite the findings of BRAND and ALSANIUS (2004) the data in the present experiment do not fully support the interaction between filter efficacy and enzyme activity in the filter skin. This implies difficulties in drawing conclusions on the load of the different evaluated state variables on prediction of efficacy of slow filters. The decreased efficacy of slow filters supplemented with FCWP might depend on different facts. The most noticeable difference between the experiments carried out by Brand and Alsanius as compared to the here presented one is the occurrence of larvae of Chironomidae sp. Apart from microorganisms, prokaryotes, arthropods, larvae of Chironomidae sp. and nematodes are ubiquitous on the filter skin, feeding on particulate material and contributing to the self-regeneration process of the upper filter layer (RUMM 1999; RÖSKE and UHLMANN 2005). Larvae of Chironomidae sp. may be found to a depth of 5 cm in the filter. Irrespective the administration of FCWP, the filter skin in all of the experimental slow filters was thin. Larval activity may thereby lead to a continuous disturbance of the upper filter layer in the supplemented filters and subsequently counteracted filter head loss and clogging processes. As the filters operating in the experimental set up were suboptimal in height (58 cm of filter column) the combination of these factors might have reduced efficacy towards Fusarium
oxysporum f.sp. cyclaminis. This might also explain the occurrence of F.
oxysporum in the effluent of the experimental filters. However, the potential caused by the higher colonization and enzyme activity rate of supplemented filters as opposed to non-treated ones should be followed closer in future experiments. Quantitative (BRAND and WOHANKA 2001) and qualitative data (ALSANIUS et al. 2001; CALVO-BADO et al. 2003) on microbial communities in slow filters for horticultural purposes are scarce. The profile and number of microorganisms in the supernatant and on the filter skin were comparable to previous work (KHALIL and ALSANIUS 2001; KOOHAKAN et al. 2004). The dynamics of Pythium
aphanidermatum in the nutrient solution before filtration is supported by TU et al. (1999). Both quantitative and qualitative references are on a descriptive level. As previous data (VAN OS and POSTMA 2000), our results indicate a reduction of viable counts of both the general fungal and bacterial flora as well as of selected naturally inoculated fungal pathogens in either experimental or commercial slow

13
filters. The reduction in the treated experimental filters compared to the non-treated ones might appear confusing. However, the load of organic material was changed after the sampling point in the supernatant by the addition of FCWP. As the relationship between COD and DOC was affected by slow filtration, the differences in fungal and actinomycetal colonization increased in commercial filters and fungal pathogens in the effluent solutions from commercial filters were scarcely detected, these factors should be further considered as potential supportive state variables for assessment of filter efficacy. Oxygen availability is a key factor for aerobic turn-over of organic material (MADIGAN et al. 2003). In the present approach, oxygen in the nutrient solution and its fate affected by passage through the slow filters was determined both directly by measuring of oxygen saturation and content and indirectly by assessment of the biochemical and chemical oxygen demand. All variables are closely linked to occurrence of organic matter. Although dissolved organic carbon was detected in the nutrient solution both before and after passage through the slow filter the BOD was not substantially affected. Compared to norm values given for the values for the two different sampling sites in the growing systems would correspond to good quality river water (LESTER and BIRKETT 1999). As the content of dissolved oxygen always exceeded the BOD, there was no risk for intrinsic induction of anoxic conditions in the nutrient solution. In contrast to the BOD, the COD displays the total quantitative of oxygen demand required to oxidize organic compounds to carbon dioxide and water. As expected its value was substantially greater than for any of the BOD measurements. Found values lay in the range of the norm values for unpolluted surface water to effluent rich water (LESTER and BIRKETT 1999) and appear reasonable for closed hydroponic greenhouse systems (LOSCHENKOHL and PORTING 1995; BAR-YOUSEF et al. 2001; ALSANIUS and JUNG 2004). For neither BOD, COD nor for dissolved organic carbon content, no interactions with microorganisms have been displayed. Therefore it is difficult to draw any conclusion beyond a descriptive level. BOURGEOIS et al. (2001) studying waste water treatment suggested the COD/BOD ratio to estimate the biodegradability of solutions. A COD/BOD ratio close to 1 indicates high biodegradability. For all of the present sampling sites, this would mean that biodegradability was low. This is supported by the fact that the reduction in dissolved carbon content by slow filtration was about 10 %. However, in contrast to other waste water sources the load of inorganic compounds, especially of Cu2+ and Zn2+, in closed growing systems with vegetables is high. The compounds may have counteracted BOD evolution (WUERTZ and MERGEAY 1997). Before and after passage through the slow filter, COD and DOC in the nutrient solution were positively correlated. This means (i) that the DOC constituted a constant portion of the COD and (ii) that the four growing systems were comparable. However, the interaction was stronger before the filtration step. The weaker interaction after filtration might be an interesting fact to follow up for appointment of supporting state variables for prediction of filter efficacy of slow filters used for horticultural purposes. Oxygen consumption in commercial filters was up to three times higher than in the experimental system during the season of 2005. However, our results on the highest oxygen consumption as expressed as ppm h-1 in experimental slow filters
14
might partly be explained by the fact that microbial respiratory is decreasing with increasing filter depth (MERMILLOD-BLONDIN et al. 2005). The enhanced activity of the cell wall degrading enzymes (CWDE) by addition of FCWP to the filter skin of slow filters has previously been shown by BRAND and ALSANIUS (2004). However, as no difference in efficacy was found between treated and non-treated filter in the present study, reports that enzyme activity, especially chitinase and protease, might partly predict filter efficacy (BRAND and ALSANIUS 2004), could not be supported by our findings. This may be due to different environmental conditions or due to colonization of the filters by different microbial communities. This point is not clear to answer and would need further investigations. Despite slight variations in the protocol for enzyme analysis between the commercial and experimental systems, measured enzyme activities in commercial systems were comparable to untreated filters in experimental systems. Enzyme activities were successfully linked to microbial biomass (LE BIHAN et al. 1998; HENDEL et al. 2001; BUTTERFIELD et al. 2002) and results of our survey are similar. In treated systems of the experimental system the highest amounts of cfu of the general bacterial and fungal flora were found in the filter skin and enzyme activities were highest of all systems, too. Furthermore, results for xylanase activities in commercial filters demonstrated the usefulness of enzymatic tests to monitor changes of microbial enzymatic activities within the filter skin. As enzymes are inducible or constitutive (MADIGAN et al. 2003), this might display environmental shifts within the microbial communities. This is the first report of strongly and repeatedly enhanced xylanase activities in the filter skin of commercial filters. However, cause and influence on filter efficacies remain uncertain and demand further research. As the efficacy tests did not reveal substantial differences between treated and untreated filters in their ability to retain F. oxysporum f.sp. cyclaminis, it appears difficult to draw any conclusions on the value of the measured state variables with respect to their support for prediction of filter efficacy. For future experiments, factors adventuring filter efficacy, such as perturbation of the filter skin, should be avoided. Changes in the relationship between dissolved organic carbon and chemical oxygen demand before and after slow filtration should be further followed up. However, it appears doubtful, if other abiotic parameters in the nutrient solution are solid enough to act as variables supporting prediction of slow filters. Attention should be drawn to variables constitutive for the filter skin instead. Acknowledgments The authors want to thank Eva Olsson, Nelia Varelia, Michaela Klaisle, Torunn Jorde and Micael Wendell for helping hands in greenhouse and laboratory. We are grateful to Johnny Nilsson, Ingelstorp trädgård, Ystad, Joergen Jensen, Lundby, Magnus Hedström, Poppelgården, Ängelholm, for opening their greeneries for the present study. The study was supported by Swedish Research Council for Environment, Agricultural Sciences and Spatial Planning (FORMAS) and by the Swedish Farmers’ Foundation for Agricultural Research (SLF).

15
References
ALSANIUS, B.W. and V. JUNG 2004: Potential of utilization of selected organic
compounds by the microflora inhabiting the effluent nutrient solution of closed greenhouse irrigation systems. Europ. J. Hort. Sci. 69, 96-103.
ALSANIUS, B.W. and K.-J. BERGSTRAND 2004: Test av tryckfiltersystem för vattenrening för växthusodling. Etapp 1. Confidential contract report, SLU, Alnarp. (in Swedish).
ALSANIUS, B.W., L. NILSSON, P. JENSÉN and W. WOHANKA 2001: Microbial communities in slow filters. Acta Hort. 548, 591- 601.
ANGLE, J.S., J. V. GAGLIARDI, M. S. McINTOSH and M. A. LEVIN 1996: Enumeration and expression of bacterial counts in the rhizosphere. In: Stolzky G. and Bollag J.-M. (eds.): Soil Biochemistry. Marcel Dekker, Inc. N.Y., 233-251.
BAKER, M.N. 1948: The quest for pure water: the history of water purification from the earliest records to the twentieth century. 1st edition. American Water Works Association, New York.
BAR-YOUSEF, B., T. MARKOVICH and I. LEVKOVICH, I. 2001: Pepper response to leachate recycling in a greenhouse in Israel. Acta Hort. 548, 557-564.
BOURGEOIS, W., J.E. BURGESS and R.M. STUETZ 2001: On-line monitoring of waste water quality: a review. J. Chem. Technol. Biotechnol. 76, 337-348.
BRAND, T. and W. WOHANKA 2001: Importance and characterization of the biological component in slow filters. Acta Hort. 554, 313-319.
BRAND, T. and B.W. ALSANIUS 2004: Cell wall degrading enzymes in slow filters of closed hydroponic systems. J. Hortic. Sci. Biotech 79, 228-233.
BROOKMANN, S.K.E. 1997: Estimation of biochemical oxygen demand in slurry and effluent using ultra-violet spectrophotometry. Wat. Res. 31, 372-374.
BUTTERFIELD, P.W., A.M. BARGMEYER, A.K. CAMPER and J.A. BIEDERMAN 2002: Modified enzyme activity assay to determine biofilm mass. J. Microbiol. Methods 50, 21-31.
CALVO-BADO, L.A., T.R. PETITT, N. PARSONS, G.M. PETCH, J. ALUN, W. MORGAN, and J.M. WHIPPS 2003: Spatial and temporal analysis of the microbial community in slow sand filters used for treating horticultural irrigation water. Appl. Environ. Microb. 69, 2116-2125.
CAMPOS L.C., M.F.J. SU, N.J.D. GRAHAM and S.R. SMITH 2002: Biomass development in slow sand filters. Wat. Res. 36, 4534-4551.
EHRET, D.L., B.W. ALSANIUS, W. WOHANKA, J.G. MENZIES, and R. UTKHEDE 2001: Disinfestation of recirculating nutrient solutions in greenhouse horticulture. Agronomie 21, 323-339.
HENDEL, B., J. MARXEN, D. FIEBIG and G. PREUß 2001: Extracellular enzyme activities during slow sand filtration in a water recharge plant. Wat. Res. 35, 2484-2488.
HONG, C. X., P.A. RICHARDSON, P. KONG and E.A. BUSH 2003: Efficacy of chlorine on multiple species of Phytophthora in recycled nursery irrigation water. Plant Dis. 87, 1183-1189.
KHALIL, S. and B.W. ALSANIUS 2001: Dynamics of the indigenous microflora inhabiting the root zone of the nutrient solution of tomato in a commercial closed greenhouse system. Gartenbauwissenschaften 66, 188-198.
KOOHAKAN, P., H. IKEDA, T. JEANAKSORN, M. TOJO, S.-K. KUSAKARI, K. OKADA and S. SATO 2004: Evaluation of the indigenous microorganisms in soilless culture: occurrence and quantitative characteristics in three different growing systems. Sci. Hortic. 101, 179-188.
KOMADA, H. 1975: Development of a selective medium for quantitative isolation of Fusarium oxysporum from natural soil. Rev. Plant Protect Res. 8, 114-124.
LE BIHAN, Y. and P. LESSARD 1998: Influence of operational variables on enzymatic tests applied to monitor the microbial biomass activity of a biofilter. Water Sci. Technol. 37, 199-202.
LESTER, J.N. and J.W. BIRKETT 1999: Microbiology and chemistry for environmental scientists and engineers. 2nd edition. E & FN Spon. New York.

16
LOSCHENKOHL, B. and P. PORTING 1996: Concentration of oxygen and organic matter in a recirculating watering system. IOBC wprs Bulletin. 19, 158.
MADIGAN, T.M., J.M. MARTINKO and J. PARKER 2003: Brock Biology of Microorganisms. 10th edition. Pearson Education LTD. London. U.K..
MERMILLOD-BLONDIN, F., L. MAUCLAIRE and B. MONTUELLE 2005: Use of slow filtration columns to assess oxygen respiration, consumption of dissolved organic carbon, nitrogen transformations and microbial parameters in hyporheic sediments. Wat. Res. 39, 1687-1698.
MINE, Y., R. SAKIYAMA, Y. YAMAKI, M. SUEMATSU and H. SAKA 2003: Influence of ripening state of filters on microbe removal efficiency of slow sand filtration used to disinfect a closed soilless culture system. J. Japn. Soc. Hortic. Sci. 72, 190-196.
RÖSKE I. and D. Uhlmann 2005: Biologie der Wasser- und Abwasserbehandlung. Ulmer. Stuttgart. Germany.
RUMM P. 1997: Untersuchungen zum Abbau partikulärer organischer Substanzen in einem Langsamfilter durch Metazoen am Beispiel von Niphargus fontanus Bate 1859 (Amphipoda, Crustacea). Doctoral thesis, Univ. of Oldenburg, Germany.
RUNIA, W.T. 1995: A review of possibilities for disinfection of recirculating water from soilless cultures. Acta Hort. 382, 246-251.
SIMONI, S.F., H. HAUKE, T.N.P. BOSMA and A.J.B. ZEHNDER 1998: Population heterogeneity affects transport of bacteria through sand columns at low flow rates. Environ. Sci. Technol. 32, 2100-2105.
SONNEVELD, C. and N. STRAVER 1989: Nutrient solutions for vegetables and flowers grown in water substrates. Voedingsoplossingen Glastuinbow 8, Proefstation voor Tuinbouw onder Glas, Naaldwijk, The Netherlands.
STANGHELLINI, M.E. and S.L. RASMUSSEN 1994: Hydroponics: a solution for pathogens. Plant Dis. December 78, 1129-1137.
STEVIK, T.K., K. AA, G. AUSLAND and J.F. HANSSEN 2004: Retention and removal of pathogenic bacteria in wastewater percolating through porous media: a review. Wat. Res. 38, 1355-1367.
TU, J.C., A.P. PAPADOPOULOS, X. HAO, and. J. ZHENG 1999: The relationship of Pythium root rot and rhizosphere microorganisms in closed circulating and an open system in rockwool culture of tomato. Acta Hort. 481, 577-583.
VAN OS, E.A., F.J. VAN KUIK, W.T. RUNIA and J. VAN BUUREN 1999: Prospects of slow sand filtration to eliminate pathogens from recirculating nutrient solutions. Acta Hort. 458, 377-382.
VAN OS. E.A. and J. POSTMA 2000: Prevention of root diseases in closed soilless growing systems by microbial optimisation and slow sand filtration. Acta Hort. 532, 97-102.
VAN OS, E.A., M. BRUINS, W. WOHANKA and R. SEIDL 2001: Slow filtration: a technique to minimise the risks of spreading root-infecting pathogens in closed hydroponic systems. Acta Hort. 559, 495-502.
WEBER-SHIRK, M.L. and R.I. DICK 1997a: Physical-chemical mechanisms in slow sand filters. J. Am. Water Works Assoc. 89, 87-100.
WEBER-SHIRK, M.L. and R.I. DICK 1997b: Biological mechanisms in slow sand filters. J. Am. Water Works Assoc. 89, 72-83.
WOHANKA, W. 1991: Wasserentkeimung bei der Hydrokultur von Zierpflanzen. Gartenbau 38, 4-6.
WOHANKA, W. 1995: Disinfection of recirculating nutrient solutions by slow sand filtration. Acta Hort. 382, 246-251.
WOHANKA, W., M. HELLE. and M. LÜBKE 1995: Langsamfiltration mit Steinwolle-Granulat statt Sand. TASPO Gartenbaumagazin 4, 8-9.
WOHANKA, W., H. LUEDTKE, H. AHLERS and M. LUEBKE 1999: Optimization of slow filtration as a means for disinfecting nutrient solutions. Acta Hort. 481, 539-544.
WOTTON, R.S. 2002: Water purification using sand. Hydrobiologia 469, 193-2001. WÜRTZ, S. and M. MERGAY 1997: The impact of heavy metals on soil microbial
communities. In: VAN ELSAS, J.D., J.T. TREVORS and E.M.H. WELLINGTON: Modern Soil Microbiology. Marcel Dekker Inc.. New York. 607 - 637.

17
YORDANOV, R.V., A.J. LAMB and M.A.L. MELVIN 1996: Biomass characteristics of slow filters receiving ozonated water. In: GRAHAM, N. and R. COLLINS (eds): Advances in Slow Sand and Alternative Biological Filtration. John Wiley and Sons. New York, Brisbane, Toronto, Singapore. 107-118.
ZHANG, W. and J.C. TU 2000: Effect of ultraviolet disinfection of hydroponic solutions on Pythium root rot and non targeted bacteria. Eur. J. Plant Pathol. 106, 415-421.

II
1
Polysaccharides in Slow Filters Integrated into
Closed Hydroponic Greenhouse Systems
B. FURTNER1*, T. BRAND2, V. JUNG1 and B.W. ALSANIUS1 1) Department of Crop Science, P.O. Box 44, SE-23053 Alnarp, Sweden 2) Landwirtschaftskammer (Chamber of Agriculture) Niedersachsen, Sedanstr. 4,
DE-26121, Oldenburg, Germany Email: (email: [email protected]) (in print 2006) Running head: Polysaccharides in slow filters * Author for correspondence Summary Slow filtration is a widespread and environmentally sound method for disinfecting nutrient solutions in closed hydroponic systems. The efficacy of slow filters can be explained in part by straining and adsorption of pathogens onto filter material surfaces. Both mechanisms are influenced by choice of filter material, flow rate of the nutrient solution, biomass and extent of extracellular polymers on the filter skin. In a 2-year study, the total polysaccharide content, enzyme activity of the filter skin and filter efficacy were monitored. Closed hydroponic systems using the nutrient film technique connected to slow filters were run with or without weekly inoculation with fungal cell wall preparation (10.5 g m-2 of filter surface). The organic matter amendment increased the amount of total polysaccharides and enzyme activity within the filter skin. The fungal cell wall preparation did not accumulate but was degraded rapidly. The polysaccharide content of the filter skin increased linearly with time at mg g-1 = 34.50 + 0.26 * day (r2 = 0.556; p = 0.02) and for untreated filters and mg g-1 = 43.40 + 0.70 * day (r2 = 0.826; p = 0.000) for treated filters. The extracellular polysaccharide content in the filter skin determined after 16 and 20 weeks of slow filter operating time ranged from 87.9 - 109.7 mg g-1
mineral wool sample. The amount of extracellular polysaccharides was not influenced by the total polysaccharide content of the filter skin, by enzyme activity or by addition of fungal cell wall preparation. There was a trend towards higher filter efficacies when fungal cell wall preparations were added to the filter skin (treated: 98.3% ± 0.96; untreated: 97.9% ± 1.8); however, on the basis of the present data, no correlation between the assessed parameters and filter efficacies were stated.

2
Introduction Slow filtration (SF) is an environmentally sound method for disinfecting nutrient solutions in closed hydroponic systems (Ehret et al., 2001). The need for methods to determine the efficacy of slow filters against plant pathogens in commercial systems without using the pathogens themselves as test organisms was identified by Brand and Alsanius (2004). These authors showed a correlation (R2 = 0.495) between hydrolytic enzyme activity and filter efficacy in slow filters integrated into hydroponic systems. Microorganisms mainly use hydrolytic enzymes for biological degradation of polysaccharides (Alexander, 1999). Hence observations on the accumulation and degradation of polysaccharides might provide an important part of any model to predict filter efficacy. Filtration and absorption are the main modes of action responsible for the retention of pathogens and particles by slow filtration processes (Stevik et al., 2004). Straining is mainly determined by the pore size of filter medium. During SF, non-degraded biomass, extracellular polysaccharides, inorganic particles, organisms and filter material of the upper filter body accumulate on the upper surface of the filter and form the so-called filter skin (dirt layer) with a high biological activity and biodiversity (Weber-Shirk and Dick, 1997; Wotton, 2002). Clogging during SF causes an extreme reduction in pore size and is caused by long-term filter skin formation linked to total polysaccharide content (Yordanov et
al., 1996; Le Bihan and Lessard, 2000). Total polysaccharide content of the filter skin includes extracellular biofilm polymers, cell constituents of various organisms (e.g. bacteria, fungi, protozoa) and soluble and particulate polysaccharides from the plant culture system. Furthermore, biofilm polysaccharides form a strong and sticky framework to protect the cells inside the matrix (Sutherland, 2001) and are considered to cause retention of bacteria in slow filters by adsorption (Costerton, 1984; Bellamy et al., 1985). Biofilms are complex associations of cells, extracellular products and detritus from lysed cells or the environment (Christensen, 1989) and are common in aquatic environments (Wotton, 2004). In hydroponic growing systems, the positive effect of a reduction in pore size has been demonstrated by the higher efficacy of slow sand filters using small grain sizes compared to filters with larger grains (van Os et al., 1998). Furthermore, the filter efficacy of mineral wool filters has been shown to be dependent on the density of the material used (Wohanka et al., 1999). The aim of the present study was to evaluate hydrolytic enzyme activity, total polysaccharide content and polysaccharide content of the extracellular biofilm matrix of the filter skin and their relation to the efficacy of filters against Fusarium
oxysporum f.sp. cyclaminis. MATERIALS AND METHODS Experimental system In 2004 and 2005, hydroponic nutrient film technique (NFT) systems with integrated slow filters were set up as described elsewhere (Brand and Alsanius, 2004). Briefly, three growing systems (treated) for tomato (Lycopersicon
esculentum ‘Aromata’), each with two slow filters, were inoculated weekly with fungal cell wall preparation (FCWP) of Fusarium oxysporum f.sp. cyclaminis (Focy) (10.5 g m-2 of filter surface) to enhance hydrolytic enzyme activity and
3
biomass. Three additional systems (untreated) served as controls. Plants were cultivated for 24 weeks, starting in mid-January. Temperature was set to 18 °C (night) and 19 °C (day) and artificial light was used (200 W m-2) during the first twelve weeks. The electrical conductivity (EC) of the nutrient solution was kept at 2.7 (± 0.1) dS m-1 and the pH at 5.8 (± 0.2). Slow filters equipped with fresh mineral wool granulate were connected to the systems four weeks later. The filters operated 6 weeks before first samples for enzyme activity and total polysaccharide content analysis were collected to allow a biological ‘ripening’ of the filters. Fungal cell wall preparations For production of lyophilized preparations of Focy, a modified method described by Sivan and Chet (1989) was used. The fungus was grown in Petri dishes at room temperature in 15 ml liquid yeast extract glucose medium (containing yeast extract 5 g, proteose peptone 5 g, glucose 10 g in 1 l of distilled water). After 5 d of incubation, mycelia were harvested by coarse separation through filter paper (00R, Munktell 1003). Mycelia were thoroughly washed with demineralised water, transferred to tubes and homogenized with a blender (Bran PowerBlend MX 2050) for 3 min. Sebsequently, the suspension was centrifuged (4000 X g) for 25 min at 4 °C, the pellet was resuspended and ultrasonicated three times by centrifuging, intermittently resuspending and homogenizing in demineralised water. The remaining fungal material was autoclaved, lyophilized and stored in sealed containers at 2 °C. Determination of total polysaccharide content (tPS) of filter skin and FCWP Five days after addition of FCWP to the filters, samples were collected from the filter skin, with at least four replicates per filter. For the determination of tPS, mineral wool samples of the filter skin were placed into Petri dishes. Excess water was removed by rocking the Petri dish twice gently from one side to the other while holding the sample with the lid. Samples were frozen at -78 °C for 15 min, before lyophilisation for at least 24 h, and storage at -20 °C until tPS analysis. The method of Dubois et al. (1956) was used for tPS analysis. Pre-trial experiments revealed a linear correlation between the electric conductivity of the nutrient solution and the absorbance measured in the Dubois test. This was considered in the main trials and EC levels were kept at 2.7 ± 0.1 dS m-1. Aliquots (0.8 ml) of ultrapure water (Elgastat Maxima, Bucks, England) were added to each 20 mg of lyophilised mineral wool sample, mixed with 0.8 ml phenol (5%, v/v) and 4 ml concentrated sulphuric acid (96.9%, v/v) was added rapidly. After colour development at room temperature for 25 min, the samples were centrifuged at 3,000 X g for 5 min, in order to avoid disturbance of the spectrophotometric (UV-min-1240, Shimadzu, Kyoto, Japan) assay by free floating mineral wool fibres. Absorbance was measured at 488 nm (A488) using glucose as a standard. The tPS content of FCWP was analysed using 3 mg of lyophilised material with four replicates for three different mycelial pellets.

4
Dissolved polysaccharides (dPS) in the nutrient solution In order to investigate the influence of the nutrient solution on the test for extracellular polysaccharides, dPS content was determined in the supernatant nutrient solution of the slow filters. Membrane filtration (0.2 µm; Filtropur S. 0.2, Sarstedt; Newton, NC, USA) of 100 ml nutrient solution was followed by sugar analysis as described for tPS. Three replicates from each of the six different nutrient solutions were analysed on three sampling dates during May and June 2005. Determination of biofilm extracellular polysaccharide content (bePS) Biofilm extraction was performed according to Liu and Fang (2002). Pre-trials revealed a substantial influence of sample weight on absorbance measured (A488) by the Dubois method. Small samples contained a high bias due to the relatively high proportion of nutrient solution in these samples (Figure 1). In preliminary experiments, wet mineral wool samples (3.4 g) were added to centrifuge tubes and stored overnight at 4 °C. Aliquots (12.5 ml) of a mixture of ultrapure water, 0.23% (v/v) formaldehyde and 0.85% NaCl (w/w) were added, blended with the samples for 25 s and stored for one hour at 4 °C. Five ml of 1 M NaOH were then added and the solution left for 3 h at 4 °C. The mixture was shaken gently and then centrifuged at 20,000 X g for 20 min at 4 °C. Aliquots (10 ml) of the supernatant were filtered (0.2 µm, Filtropur S. 0.2 membrane, Sarstedt, Germany). Samples (0.8 ml) of this solution were used to determine polysaccharides as described for tPS. Samples were stored at -20 °C until DNA analysis. DNA analysis for determination of cell lysis DNA analysis was performed to ensure that the amount of cell lysis was low during the extraction to determine bePS (Zhang et al., 1999). Frozen samples were thawed at 4 °C and DNA content was determined using the DyNA Quant 200 ™ fluorometer method (Hoefer Pharmacia Biotech, USA). DNA was determined on the basis of a fluorescent Hoechst 33258 dye for double-stranded DNA. Determination of sample dry weight The dry weight (DW) of the remaining mineral wool was determined by washing the pellet after the centrifugation step with ultrapure water and filtering through a pre-weighed filter (5 µm pore size, filter papers 413; VWR International, Sweden). Effluent water from the filtration step was clear, with no visible turbidity. Filter discs and the remains of the pellet were cooled at -78 °C for 15 min, freeze-dried for 72 h and re-weighed. Enzyme activity tests Colorimetric enzyme activity assays for chitinase, cellulase, glucanase, protease and xylanase were performed according to Brand and Alsanius (2004). Samples were collected from the same samples used for tPS analysis. Briefly, lyophilised mineral wool was incubated in enzyme substrate (CM-Chitin-RBV, CM-Cellulase-RBB, CM-Curdlan-RBB, Gelatine-RBB, CM-Xylan-RBB; Blue Substrates, Germany) at 37.0 °C for 2 h. The change in absorbance of the enzyme substrate solution was determined spectrophotometrically and compared to a control. The

5
difference between incubated samples and the control was used to determine enzyme activity in mU. Samples were collected every 2 weeks during a twelve-week period (April - June) in 2004 and 2005. In addition, enzyme activity tests were performed at each filter efficacy test. Enzyme activity was calculated according to equation 1. milliUnit [mU] = ES – EC X 1000 X t-1 (1) with ES = Extinction of the sample; EC = Extinction of the control; t = incubation time [min]. Efficacy tests against Fusarium oxysporum f.sp. cyclaminis (FOCY) The method described by Brand and Alsanius (2004) was used for testing filter efficacy against FOCY. Briefly, FOCY was cultured on potato dextrose agar (Difco, 254920, USA) for 2 weeks. Conidia were harvested by adding 10 ml NaCl solution (0.85%) and abrasion of the PDA plates. Conidial suspension was filtered through cheese cloth and divided into six equally restocked bottles. Conidial suspension was then added to the six NFT systems, resulting in approximately 104 colony forming units (cfu) ml-1 of the nutrient solutions of each system. Total viable counts were performed every 30 min over five hours for the effluent and over three hours for the supernatant. Fusarium oxysporum-selective medium (Komada, 1975) was used, with five replicates per sample. Petri dishes containing 30 to 300 cfu were used for plate counts of the supernatant. Filter efficacy was calculated by the equation: feff(%)= (1-cfueff/cfusup)*100% where feff = filter efficacy, cfueff = highest number of cfu counted in effluent and cfusup = highest number of cfu counted in supernatant (Brand and Alsanius, 2004). Filter efficacy against Fusarium oxysporum f.sp. cyclaminis (Focy) was determined eight and twelve weeks (2004) after the first incubation with FCWP. In 2005, one efficacy test was performed twelve weeks after starting the treatment and the first efficacy test was repeated in September 2005 under comparable conditions. Statistical analysis The bePS, DNA and sample dry weight analyses were performed on five samples from each of six filters connected to six different NFT systems. Analyses of tPS, enzyme activity and filter efficacy were performed for twelve filters in the six different NFT systems, using the mean value of two filters connected to the same NFT system. Plate counts for filter efficacy tests were log-transformed when necessary. If preconditions regarding normal distribution and homogeneity of variance of the observations were given, the t-test, ANOVA or the Tukey-B test were used to describe significant differences (α = 0.05). Otherwise the nonparametric Mann-Whitney-U-test or the Wald-Wolfowitz sequence test was used. Data were processed using SPSS 11.5 (SPSS GmbH Software, Germany).
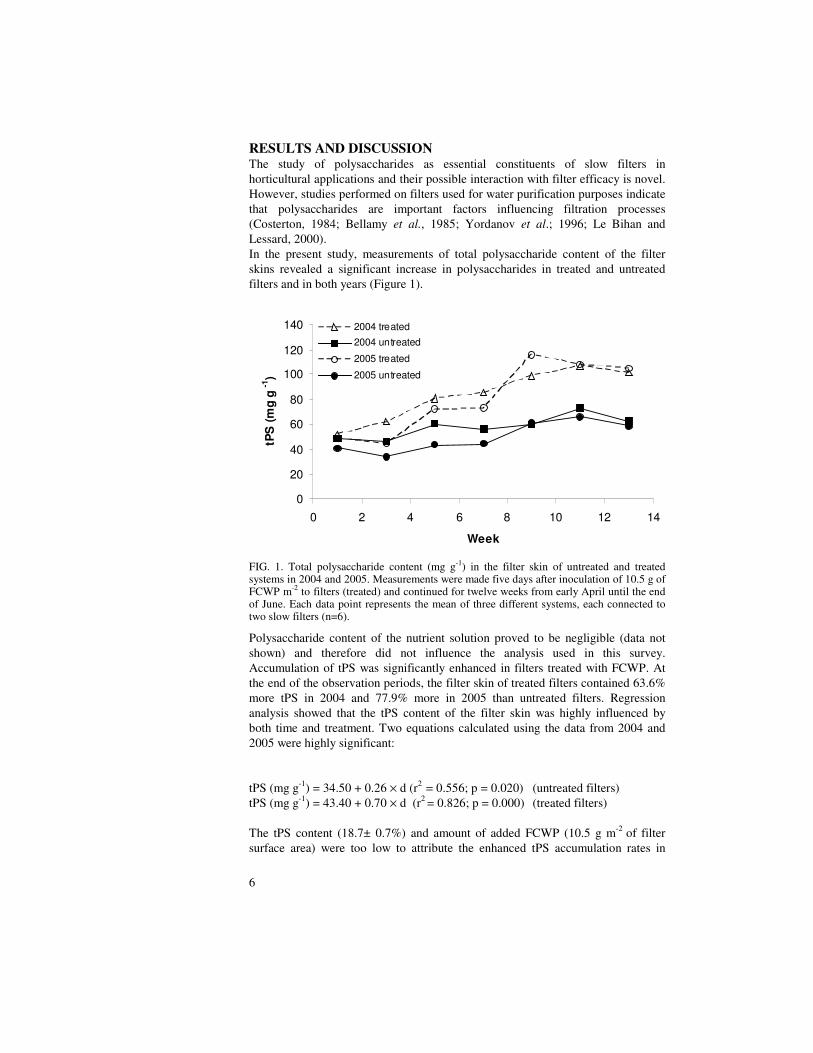
6
RESULTS AND DISCUSSION The study of polysaccharides as essential constituents of slow filters in horticultural applications and their possible interaction with filter efficacy is novel. However, studies performed on filters used for water purification purposes indicate that polysaccharides are important factors influencing filtration processes (Costerton, 1984; Bellamy et al., 1985; Yordanov et al.; 1996; Le Bihan and Lessard, 2000). In the present study, measurements of total polysaccharide content of the filter skins revealed a significant increase in polysaccharides in treated and untreated filters and in both years (Figure 1).
FIG. 1. Total polysaccharide content (mg g-1) in the filter skin of untreated and treated systems in 2004 and 2005. Measurements were made five days after inoculation of 10.5 g of FCWP m-2
to filters (treated) and continued for twelve weeks from early April until the end of June. Each data point represents the mean of three different systems, each connected to two slow filters (n=6).
Polysaccharide content of the nutrient solution proved to be negligible (data not shown) and therefore did not influence the analysis used in this survey. Accumulation of tPS was significantly enhanced in filters treated with FCWP. At the end of the observation periods, the filter skin of treated filters contained 63.6% more tPS in 2004 and 77.9% more in 2005 than untreated filters. Regression analysis showed that the tPS content of the filter skin was highly influenced by both time and treatment. Two equations calculated using the data from 2004 and 2005 were highly significant: tPS (mg g-1) = 34.50 + 0.26 × d (r2 = 0.556; p = 0.020) (untreated filters) tPS (mg g-1) = 43.40 + 0.70 × d (r2 = 0.826; p = 0.000) (treated filters) The tPS content (18.7± 0.7%) and amount of added FCWP (10.5 g m-2 of filter surface area) were too low to attribute the enhanced tPS accumulation rates in
0
20
40
60
80
100
120
140
0 2 4 6 8 10 12 14
Week
tPS
(m
g g
-1)
2004 treated
2004 untreated
2005 treated
2005 untreated

7
treated filters to incomplete degradation processes. Correlations of tPS in the filter skin of all filters with filter operating time can be explained by steadily increased biomass (Yordanov et al., 1996; Le Bihan and Lessard, 2000), incomplete degradation of the added FCWP or the organic load from the rhizosphere of the growing system. Enzyme activity was higher in treated filters (Table I) and has been correlated with microbial biomass in other trials (Le Bihan and Lessard, 1998; Hendel et al., 2001; Butterfield et al., 2002).
Table I. Average enzyme activity (mU) of filter skin samples for treated (10.5 g FCWP m-2 weekly) and untreated filters. Enzyme activity was analysed every two weeks during a twelve-week period (n = 6) in 2004 and 2005. Xylanase activity in 2004 was poor and inconsistent and is therefore not shown.
2004 2005 Treated Untreated Treated Untreated Chitinase 1.01 a1 0.47 a 1.40 b 1.16 b Cellulase 0.28 a 0.06 b 0.61 c 0.35 a Glucanase 0.33 a 0.15 b 0.49 c 0.23 a Protease 0.67 a 0.26 b 1.42 c 0.79 a Xylanase inconsistent 0.17 a 0.26 a 1 Values within the same row followed by different letters are significantly different at p <
0.05 (Tukey-B test).
Therefore, enhanced tPS content in treated filter skin might reflect an increased microbial biomass due to enhanced nutrient status of this habitat. However in contrast to the tPS value of the filter skin, enzyme activity did not increase linearly and was not correlated to filter operating time, so reasons other than incomplete degradation of FCWP must be considered for the linearly increasing tPS content. The chemical composition of microorganisms depends to a great extent on the microbial species, their nutritional status, their growth rate and the amount and quality of available carbon (Joergensen et al., 1996; Chao et al., 2001). It has been shown by Alsanius and Jung (2004) that the bioavailable organic load in comparable NFT systems is very low. Furthermore, Chapman and Gray (1981) have demonstrated that C limiting conditions are able to reduce the intracellular carbohydrate concentration to 16.7% compared to well-nourished bacteria. Therefore it is possible that the addition of FCWP led to improved C availability for microorganisms within the filter skin and consequently to higher intracellular carbohydrate concentration. Moreover, FCWP amendments led to rapid and massive colonisation of the filter skin by Chironomidae spp. larvae, which are well-known in slow filters and have a great impact on biological turnover of organic matter in these habitats (e.g. by excreting faecal pellets which are covered by extracellular polymers and stimulate bacterial growth) (Wotton and Hirabayashi, 1999). Therefore a large proportion of the steady increase in tPS in treated filters may be explained by a combination of enhanced microbial biomass, increased carbohydrate concentrations within microbial cells, and the influence of Chironomidae spp. Mining and bioturbation of larvae of Chironomidae spp. (Röske and Uhlmann, 2005) might also explain why the enhanced filter efficacy due to FCWD addition demonstrated by Brand and Alsanius (2004) in previous studies was not observed in the present study. Efficacy tests (2004 and 2005) showed that the different
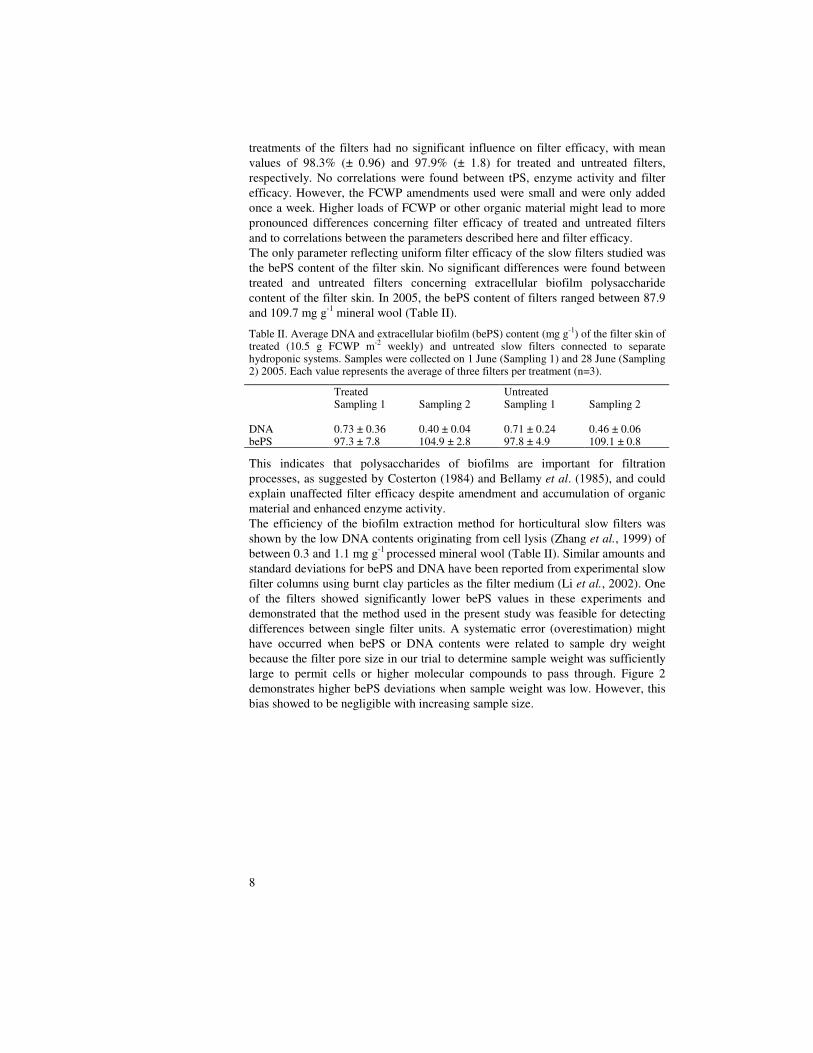
8
treatments of the filters had no significant influence on filter efficacy, with mean values of 98.3% (± 0.96) and 97.9% (± 1.8) for treated and untreated filters, respectively. No correlations were found between tPS, enzyme activity and filter efficacy. However, the FCWP amendments used were small and were only added once a week. Higher loads of FCWP or other organic material might lead to more pronounced differences concerning filter efficacy of treated and untreated filters and to correlations between the parameters described here and filter efficacy. The only parameter reflecting uniform filter efficacy of the slow filters studied was the bePS content of the filter skin. No significant differences were found between treated and untreated filters concerning extracellular biofilm polysaccharide content of the filter skin. In 2005, the bePS content of filters ranged between 87.9 and 109.7 mg g-1 mineral wool (Table II).
Table II. Average DNA and extracellular biofilm (bePS) content (mg g-1) of the filter skin of treated (10.5 g FCWP m-2 weekly) and untreated slow filters connected to separate hydroponic systems. Samples were collected on 1 June (Sampling 1) and 28 June (Sampling 2) 2005. Each value represents the average of three filters per treatment (n=3).
Treated Untreated Sampling 1 Sampling 2 Sampling 1 Sampling 2 DNA 0.73 ± 0.36 0.40 ± 0.04 0.71 ± 0.24 0.46 ± 0.06 bePS 97.3 ± 7.8 104.9 ± 2.8 97.8 ± 4.9 109.1 ± 0.8
This indicates that polysaccharides of biofilms are important for filtration processes, as suggested by Costerton (1984) and Bellamy et al. (1985), and could explain unaffected filter efficacy despite amendment and accumulation of organic material and enhanced enzyme activity. The efficiency of the biofilm extraction method for horticultural slow filters was shown by the low DNA contents originating from cell lysis (Zhang et al., 1999) of between 0.3 and 1.1 mg g-1 processed mineral wool (Table II). Similar amounts and standard deviations for bePS and DNA have been reported from experimental slow filter columns using burnt clay particles as the filter medium (Li et al., 2002). One of the filters showed significantly lower bePS values in these experiments and demonstrated that the method used in the present study was feasible for detecting differences between single filter units. A systematic error (overestimation) might have occurred when bePS or DNA contents were related to sample dry weight because the filter pore size in our trial to determine sample weight was sufficiently large to permit cells or higher molecular compounds to pass through. Figure 2 demonstrates higher bePS deviations when sample weight was low. However, this bias showed to be negligible with increasing sample size.

9
FIG. 2. Influence of sample dry weight on measured extracellular polysaccharide content (bePS) per g sample dry weight. Two samples with three different sample sizes each were collected from two different slow filters (n = 12).
The correlation between sample DW and bePS content of the filter skin was highly significant (r2 = 0.95, p < 0.001). To avoid comparability problems in further research, total suspended solids should be measured using standard methods as described by Gray et al. (2000). The effect of different fractions of polysaccharide within the filter skin of slow filters used for horticultural purposes on the efficacy of slow filtration remains unclear. However, it was shown that tPS accumulation was dependent on time and was significantly influenced by addition of organic material. Observation of tPS accumulation might therefore be a useful tool for monitoring the intended manipulation of ripening and biological development of slow filters by addition of organic material to the filter skin. Extracellular biofilm polysaccharides were shown to have the potential for filter efficacy prediction but further research is needed to clarify the interactions between extracellular biofilm compounds and filter efficacy. The authors wish to thank Karl-Johan Bergstrand for his outstanding support in greenhouse and laboratory and Annelie Ahlman for her support in work with the DyNA Quant 200™ fluorometer. This study was funded by the Swedish Research Council for Environment, Agricultural Sciences and Spatial Planning (FORMAS) and by the Swedish Farmers’ Foundation for Agricultural Research (SLF). References ALEXANDER, M. (1999). Biodegradation and Bioremediation. 2nd Edition. Academic Press, San Diego, New York, Boston, London, Sidney, Tokyo, Toronto. 453 pp. ALSANIUS, B.W. and JUNG, V. (2004). Potential of utilization of selected organic compounds by the microflora inhabiting the effluent nutrient solution of closed greenhouse irrigation systems. European Journal of Horticultural Science 69, 96-103. BELLAMY, W.D., HENDRICKS, D.W. and LOGSDON, G.S. (1985). Slow sand filtration: Influences of selected process variables. Journal of the American Water Works Association 12, 62-66. BRAND, T. and WOHANKA, W. (2001). Importance and characterization of the biological component in slow filters. Acta Horticulturae 554, 313-319.
0
20
40
60
80
100
120
140
160
180
0 100 200 300 400 500
Sample dry weight (mg)
beP
S (
mg
g-1)

10
BRAND, T. and ALSANIUS, B.W. (2004). Cell wall degrading enzymes in slow filters of closed hydroponic systems. Journal of Horticultural Science & Biotechnology 79, 228-233.
BUTTERFIELD, P.W., BARGMEYER, A.M., CAMPER, A. and BIEDERMAN, J.A. (2002). Modified enzyme activity assay to determine biofilm biomass. Journal of Microbiological Methods 50, 23-31. CHAO, Y., SUGANO, Y. and SHODA, M. (2001). Bacterial cellulose production under
oxygen enriched air at different fructose concentrations in a 50-liter, internal-loop airlift reactor. Applied Microbiology & Biotechnology 55, 673-679.
CHAPMAN, S.J. and GRAY, T.R.G. (1981). Endogenous metabolism and macromolecular composition of Arthrobacter globoformis. Soil Biology & Biochemistry 13, 11-18. CHRISTENSEN, B.E. (1989). The role of extracellular polysaccharides in biofilms.
Journal of Biotechnology 10, 181-202. COSTERTON, J.W. (1984). The etiology and persistence of cryptic bacterial infections: A hypothesis. Reviews of Infectious Diseases 6, 608-616. DUBOIS, M., GILLES, K.A., HAMILTON, J.K., REBERS, P.A. and SMITH, F. (1956). Colorimetric method to determination of sugars and related substances. Analytical Chemistry 28, 350-356. EHRET, D.L., ALSANIUS, B., WOHANKA, W., MENZIES, J.G. and UTKHEDE, R. (2001). Disinfestation of recirculating nutrient solutions in greenhouse horticulture. Agronomie 21, 323-339. GRAY, J.R., GLYSSON, G.D., TURCIOS, L.M. and SCHWARTZ, G.E. (2000). Comparability of suspended-sediment concentration and total suspended solids. U.S.
Department of the Interior and U.S. Geological Survey Information Services, Denver, U.S.A.. HENDEL, B., MARXEN, J., FIEBIG, D. and PREUß, G. (2001). Extracellular enzyme activities during slow sand filtration in a water recharge plant. Water Research 35, 2484-2488. JOERGENSEN, R.G., MUELLER, T. and WOLTERS, V. (1996). Total carbohydrates of the soil microbial biomass in 0.5 M K2SO4 extracts. Soil Biology & Biochemistry 28, 1147-1153. KOMADA, H. (1975). Development of a selective medium for quantitative isolation of Fusarium oxysporum from natural soil. Review of Plant Protection Research 8, 114- 124. LE BIHAN, Y. and LESSARD, P. (1998). Influence of operational variables on enzymatic
tests applied to monitor the microbial biomass activity of a biofilter. Water Science and Technology 37, 199-202.
LE BIHAN, Y. and LESSARD, P. (2000). Monitoring biofilter clogging: Biochemical characteristics of the biomass. Water Research 34, 4284-4294. LI, J., LUAN, Z., GONG, X. and DANGCONG, P. (2002). Effects of colloidal organic
matter on nitrification and composition of extracellular polymeric substances in biofilms. Journal of Chemical Technology and Biotechnology 77, 1333-1339.
LIU, H. and FANG, H.H.P. (2002). Extraction of extracellular polymeric substances (EPS) of sludges. Journal of Biotechnology 95, 249-256. RÖSKE I. and UHLMANN D. (2005). Biologie der Wasser- und Abwasserbehandlung. Ulmer. Stuttgart. Germany. SIVAN, A. and CHET, I. (1989). Degradation of fungal cell walls by lytic enzymes of
Trichoderma harzianum. Journal of General Microbiology 135, 675-82. STEVIK, T.K., AA, K., AUSLAND, G. and HANSSEN, J.F. (2004). Retention and
removal of pathogenic bacteria in wastewater percolating through porous media: A review. Water Research 38, 1355-1367.
SUTHERLAND, I.W. (2001). Biofilm exopolysaccharide: A strong and sticky framework. Microbiology-U.K. 147, 3-9. VAN OS, E.A., VAN KUIK, F.J., RUNIA, W.T. and VAN BUUREN, J. (1998). Prospects
of slow sand filtration to eliminate pathogens from recirculating nutrient solutions. Acta Horticulturae 458, 377-382.
WEBER-SHIRK, M.L. and DICK, R.I. (1997). Physical and chemical mechanisms in slow sand filters. Journal of the American Water Works Association 89, 87-100.

11
WOHANKA, W., LUEDTKE, H., AHLERS, H. and LUEBKE, M. (1999). Optimization of slow filtration as a means for disinfecting nutrient solutions. Acta Horticulturae 481, 539-544. WOTTON, R.S. (2002). Water purification using sand. Hydrobiologia 469, 193-201. WOTTON, R.S. (2004). The ubiquity and many roles of exopolymers (EPS) in aquatic systems. Scientia Marina 68, 13-21. WOTTON, R.S. and HIRABAYASHI, K. (1999). Midge larvae (Diptera: Chironomidae) as engineers in slow sand filter beds. Water Research 33, 1509-1515. YORDANOV, R.V., LAMB, A.J. and MELVIN, M.A.L. (1996). Biomass characteristics of slow sand filters receiving ozonated water. In: Slow Sand and Alternative Biological Filtration. (Graham, N. and Collins, R., Eds), John Wiley & Sons, Chichester, U.K., 233-243. ZHANG, X., BISHOP, P.L. and KINKLE, B.K. (1999). Comparison of extraction methods
for quantifying extracellular polymers in biofilms. Water Science & Technology 39, 211-218.
Selected abiotic and biotic parameters of nutrient solutions
and within the filter skin of slow filters were monitored in
commercial and experimental closed hydroponic systems
and possible interactions with filter efficacies against
Fusarium oxysporum f.sp. cyclaminis were displayed.
Methods for studying polysaccharides of the filter skin
were developed and showed to be promising approaches
for further horticultural studies.
Bernhard Furtner received his graduate education at the
Department of Crop Science, SLU, Alnarp. He graduated
as a Dipl.-Ing. in horticultural sciences at the Humboldt-
Universität zu Berlin, Germany.
ISSN 1652-6880
ISBN 91-576-7174-5