Embed Size (px)
Citation preview
Abortion Surveillance — United States, 2008
Surveillance Summaries / Vol. 60 / No. 15 November 25, 2011
Morbidity and Mortality Weekly Report
U.S. Department of Health and Human ServicesCenters for Disease Control and Prevention

Surveillance Summaries
CONTENTS
Introduction ............................................................................................................2
Methods ....................................................................................................................2
Results .......................................................................................................................4
Discussion ................................................................................................................8
Acknowledgments ............................................................................................. 12
References ............................................................................................................. 12
The MMWR series of publications is published by the Office of Surveillance, Epidemiology, and Laboratory Services, Centers for Disease Control and Prevention (CDC), U.S. Department of Health and Human Services, Atlanta, GA 30333.Suggested Citation: Centers for Disease Control and Prevention. [Title]. MMWR 2011;60(No. SS-#):[inclusive page numbers].
Centers for Disease Control and PreventionThomas R. Frieden, MD, MPH, Director
Harold W. Jaffe, MD, MA, Associate Director for ScienceJames W. Stephens, PhD, Director, Office of Science Quality
Stephen B. Thacker, MD, MSc, Deputy Director for Surveillance, Epidemiology, and Laboratory ServicesStephanie Zaza, MD, MPH, Director, Epidemiology and Analysis Program Office
MMWR Editorial and Production StaffRonald L. Moolenaar, MD, MPH, Editor, MMWR SeriesChristine G. Casey, MD, Deputy Editor, MMWR Series
Teresa F. Rutledge, Managing Editor, MMWR SeriesDavid C. Johnson, Lead Technical Writer-Editor
Catherine B. Lansdowne, MS
Martha F. Boyd, Lead Visual Information SpecialistMaureen A. Leahy, Julia C. Martinroe, Stephen R. Spriggs, Terraye M. Starr
Visual Information SpecialistsQuang M. Doan, MBA, Phyllis H. King
Information Technology SpecialistsMMWR Editorial Board
William L. Roper, MD, MPH, Chapel Hill, NC, ChairmanMatthew L. Boulton, MD, MPH Ann Arbor, MI
Virginia A. Caine, MD, Indianapolis, INJonathan E. Fielding, MD, MPH, MBA, Los Angeles, CA
David W. Fleming, MD, Seattle, WAWilliam E. Halperin, MD, DrPH, MPH, Newark, NJ
King K. Holmes, MD, PhD, Seattle, WADeborah Holtzman, PhD, Atlanta, GATimothy F. Jones, MD, Nashville, TNDennis G. Maki, MD, Madison, WI
Patricia Quinlisk, MD, MPH, Des Moines, IAPatrick L. Remington, MD, MPH, Madison, WI
Barbara K. Rimer, DrPH, Chapel Hill, NCJohn V. Rullan, MD, MPH, San Juan, PR
William Schaffner, MD, Nashville, TNAnne Schuchat, MD, Atlanta, GA
Dixie E. Snider, MD, MPH, Atlanta, GAJohn W. Ward, MD, Atlanta, GA
Surveillance Summaries
MMWR / November 25, 2011 / Vol. 60 / No. 15 1
Abortion Surveillance — United States, 2008Karen Pazol, PhD
Suzanne B. Zane, DVMWilda Y. Parker, MPHLaura R. Hall, MPHCynthia Berg, MD
Douglas A. Cook, MBISDivision of Reproductive Health, National Center for Chronic Disease Prevention and Health Promotion, CDC
Abstract
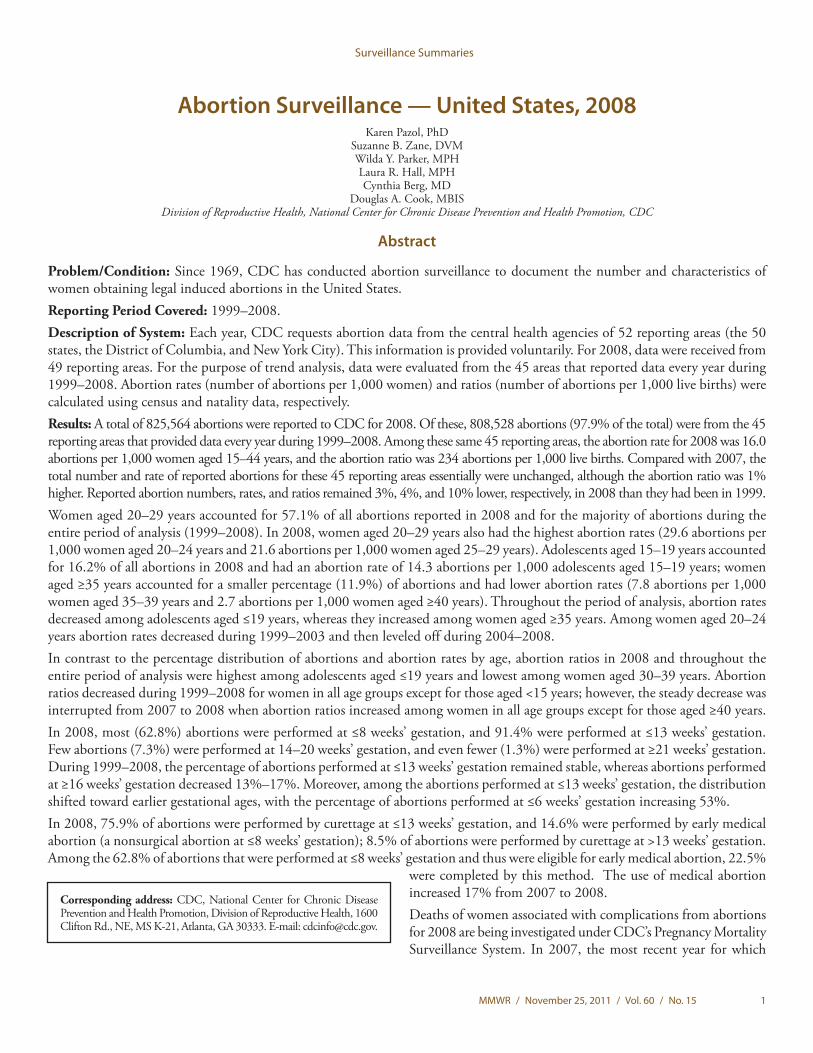
Problem/Condition: Since 1969, CDC has conducted abortion surveillance to document the number and characteristics of women obtaining legal induced abortions in the United States.Reporting Period Covered: 1999–2008.Description of System: Each year, CDC requests abortion data from the central health agencies of 52 reporting areas (the 50 states, the District of Columbia, and New York City). This information is provided voluntarily. For 2008, data were received from 49 reporting areas. For the purpose of trend analysis, data were evaluated from the 45 areas that reported data every year during 1999–2008. Abortion rates (number of abortions per 1,000 women) and ratios (number of abortions per 1,000 live births) were calculated using census and natality data, respectively.Results: A total of 825,564 abortions were reported to CDC for 2008. Of these, 808,528 abortions (97.9% of the total) were from the 45 reporting areas that provided data every year during 1999–2008. Among these same 45 reporting areas, the abortion rate for 2008 was 16.0 abortions per 1,000 women aged 15–44 years, and the abortion ratio was 234 abortions per 1,000 live births. Compared with 2007, the total number and rate of reported abortions for these 45 reporting areas essentially were unchanged, although the abortion ratio was 1% higher. Reported abortion numbers, rates, and ratios remained 3%, 4%, and 10% lower, respectively, in 2008 than they had been in 1999. Women aged 20–29 years accounted for 57.1% of all abortions reported in 2008 and for the majority of abortions during the entire period of analysis (1999–2008). In 2008, women aged 20–29 years also had the highest abortion rates (29.6 abortions per 1,000 women aged 20–24 years and 21.6 abortions per 1,000 women aged 25–29 years). Adolescents aged 15–19 years accounted for 16.2% of all abortions in 2008 and had an abortion rate of 14.3 abortions per 1,000 adolescents aged 15–19 years; women aged ≥35 years accounted for a smaller percentage (11.9%) of abortions and had lower abortion rates (7.8 abortions per 1,000 women aged 35–39 years and 2.7 abortions per 1,000 women aged ≥40 years). Throughout the period of analysis, abortion rates decreased among adolescents aged ≤19 years, whereas they increased among women aged ≥35 years. Among women aged 20–24 years abortion rates decreased during 1999–2003 and then leveled off during 2004–2008. In contrast to the percentage distribution of abortions and abortion rates by age, abortion ratios in 2008 and throughout the entire period of analysis were highest among adolescents aged ≤19 years and lowest among women aged 30–39 years. Abortion ratios decreased during 1999–2008 for women in all age groups except for those aged <15 years; however, the steady decrease was interrupted from 2007 to 2008 when abortion ratios increased among women in all age groups except for those aged ≥40 years. In 2008, most (62.8%) abortions were performed at ≤8 weeks’ gestation, and 91.4% were performed at ≤13 weeks’ gestation. Few abortions (7.3%) were performed at 14–20 weeks’ gestation, and even fewer (1.3%) were performed at ≥21 weeks’ gestation. During 1999–2008, the percentage of abortions performed at ≤13 weeks’ gestation remained stable, whereas abortions performed at ≥16 weeks’ gestation decreased 13%–17%. Moreover, among the abortions performed at ≤13 weeks’ gestation, the distribution shifted toward earlier gestational ages, with the percentage of abortions performed at ≤6 weeks’ gestation increasing 53%. In 2008, 75.9% of abortions were performed by curettage at ≤13 weeks’ gestation, and 14.6% were performed by early medical abortion (a nonsurgical abortion at ≤8 weeks’ gestation); 8.5% of abortions were performed by curettage at >13 weeks’ gestation. Among the 62.8% of abortions that were performed at ≤8 weeks’ gestation and thus were eligible for early medical abortion, 22.5%
were completed by this method. The use of medical abortion increased 17% from 2007 to 2008.Deaths of women associated with complications from abortions for 2008 are being investigated under CDC’s Pregnancy Mortality Surveillance System. In 2007, the most recent year for which
Corresponding address: CDC, National Center for Chronic Disease Prevention and Health Promotion, Division of Reproductive Health, 1600 Clifton Rd., NE, MS K-21, Atlanta, GA 30333. E-mail: [email protected].
Surveillance Summaries
2 MMWR / November 25, 2011 / Vol. 60 / No. 15
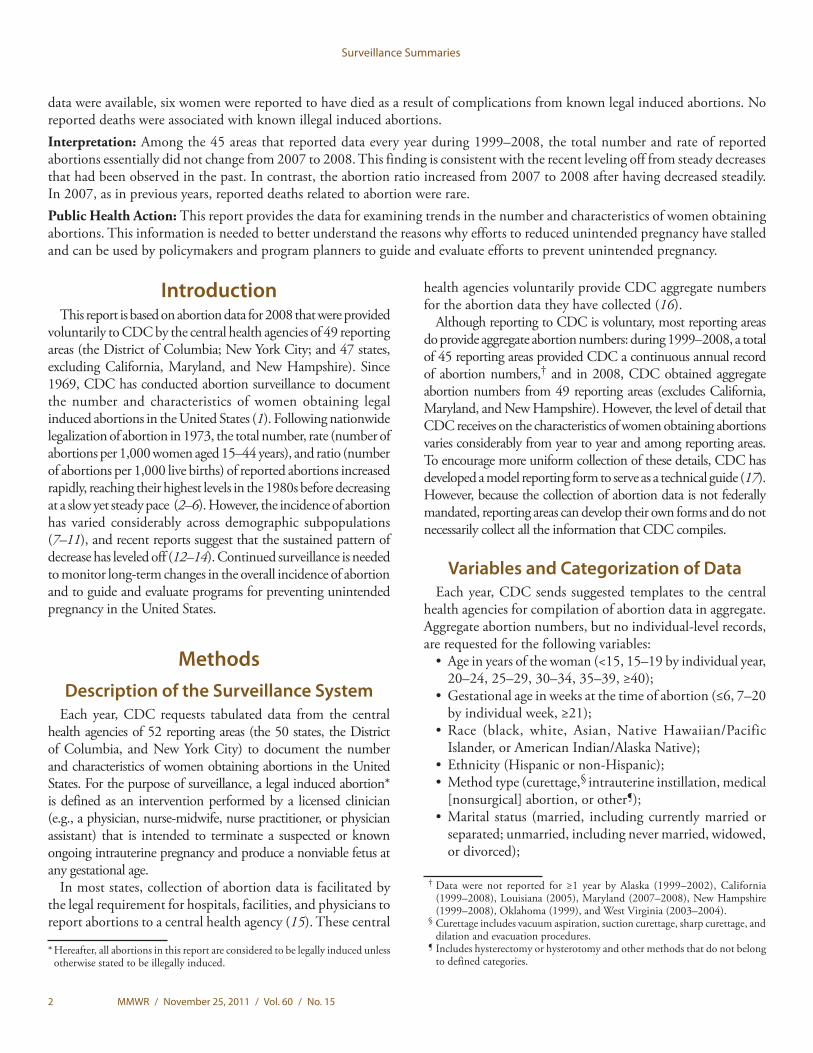
data were available, six women were reported to have died as a result of complications from known legal induced abortions. No reported deaths were associated with known illegal induced abortions.Interpretation: Among the 45 areas that reported data every year during 1999–2008, the total number and rate of reported abortions essentially did not change from 2007 to 2008. This finding is consistent with the recent leveling off from steady decreases that had been observed in the past. In contrast, the abortion ratio increased from 2007 to 2008 after having decreased steadily. In 2007, as in previous years, reported deaths related to abortion were rare.Public Health Action: This report provides the data for examining trends in the number and characteristics of women obtaining abortions. This information is needed to better understand the reasons why efforts to reduced unintended pregnancy have stalled and can be used by policymakers and program planners to guide and evaluate efforts to prevent unintended pregnancy.
IntroductionThis report is based on abortion data for 2008 that were provided
voluntarily to CDC by the central health agencies of 49 reporting areas (the District of Columbia; New York City; and 47 states, excluding California, Maryland, and New Hampshire). Since 1969, CDC has conducted abortion surveillance to document the number and characteristics of women obtaining legal induced abortions in the United States (1). Following nationwide legalization of abortion in 1973, the total number, rate (number of abortions per 1,000 women aged 15–44 years), and ratio (number of abortions per 1,000 live births) of reported abortions increased rapidly, reaching their highest levels in the 1980s before decreasing at a slow yet steady pace (2–6). However, the incidence of abortion has varied considerably across demographic subpopulations (7–11), and recent reports suggest that the sustained pattern of decrease has leveled off (12–14). Continued surveillance is needed to monitor long-term changes in the overall incidence of abortion and to guide and evaluate programs for preventing unintended pregnancy in the United States.
MethodsDescription of the Surveillance System
Each year, CDC requests tabulated data from the central health agencies of 52 reporting areas (the 50 states, the District of Columbia, and New York City) to document the number and characteristics of women obtaining abortions in the United States. For the purpose of surveillance, a legal induced abortion* is defined as an intervention performed by a licensed clinician (e.g., a physician, nurse-midwife, nurse practitioner, or physician assistant) that is intended to terminate a suspected or known ongoing intrauterine pregnancy and produce a nonviable fetus at any gestational age.
In most states, collection of abortion data is facilitated by the legal requirement for hospitals, facilities, and physicians to report abortions to a central health agency (15). These central
health agencies voluntarily provide CDC aggregate numbers for the abortion data they have collected (16).
Although reporting to CDC is voluntary, most reporting areas do provide aggregate abortion numbers: during 1999–2008, a total of 45 reporting areas provided CDC a continuous annual record of abortion numbers,† and in 2008, CDC obtained aggregate abortion numbers from 49 reporting areas (excludes California, Maryland, and New Hampshire). However, the level of detail that CDC receives on the characteristics of women obtaining abortions varies considerably from year to year and among reporting areas. To encourage more uniform collection of these details, CDC has developed a model reporting form to serve as a technical guide (17). However, because the collection of abortion data is not federally mandated, reporting areas can develop their own forms and do not necessarily collect all the information that CDC compiles.
Variables and Categorization of DataEach year, CDC sends suggested templates to the central
health agencies for compilation of abortion data in aggregate. Aggregate abortion numbers, but no individual-level records, are requested for the following variables:
• Ageinyearsofthewoman(<15,15–19byindividualyear,20–24, 25–29, 30–34, 35–39, ≥40);
• Gestationalageinweeksatthetimeofabortion(≤6,7–20by individual week, ≥21);
• Race (black, white, Asian,NativeHawaiian/PacificIslander,orAmericanIndian/AlaskaNative);
• Ethnicity(Hispanicornon-Hispanic);• Methodtype(curettage,§ intrauterine instillation, medical
[nonsurgical] abortion, or other¶); • Marital status (married, includingcurrentlymarriedor
separated; unmarried, including never married, widowed, or divorced);
* Hereafter, all abortions in this report are considered to be legally induced unless otherwise stated to be illegally induced.
† Data were not reported for ≥1 year by Alaska (1999–2002), California (1999–2008), Louisiana (2005), Maryland (2007–2008), New Hampshire (1999–2008), Oklahoma (1999), and West Virginia (2003–2004).
§ Curettage includes vacuum aspiration, suction curettage, sharp curettage, and dilation and evacuation procedures.
¶ Includes hysterectomy or hysterotomy and other methods that do not belong to defined categories.
Surveillance Summaries
MMWR / November 25, 2011 / Vol. 60 / No. 15 3
• Numberofpreviouslivebirths(0,1,2,3,or≥4);• Numberofpreviousabortions(0,1,2,or≥3);and• Maternal residence (the state, reporting area, or foreign
country in which the woman obtaining the abortion lived; if additional details are unavailable, in-reporting area or out-of-reporting area).
In addition to sending templates for compiling information on race and ethnicity as separate variables, CDC has provided alternative templates since 2001 for the tabulation of aggregate cross-classifiedrace/ethnicitydata.Becausefewreportingareasreturned these alternative templates in the past, 2008 is only the second year for which CDC has had sufficient data to report results bythesecross-classifiedrace/ethnicitycategories(non-Hispanicwhite, non-Hispanic black, non-Hispanic other, and Hispanic).
Finally, both the original and alternative templates that CDC provides request that aggregate numbers for certain individual variables be cross-tabulated by a second variable. These cross-tabulations include gestational age (by age, method type, race, ethnicity,andrace/ethnicity)andageandmaritalstatus(byrace,ethnicity,andrace/ethnicity).
In this report, medical abortions and abortions performed by curettage are further categorized by gestational age. For medical abortion, early medical abortion is defined as the administration of medication or medications (typically mifepristone followed by misoprostol) to induce an abortion at ≤8 weeks’ gestation**; medical abortion at >8 weeks’ gestation is defined as the administration of medication or medications (typically vaginal prostaglandins) to induce an abortion at >8 weeks’ gestation. For curettage, abortions are categorized as having been performed at ≤13 weeks’ gestation or at >13 weeks’ gestation because of differences in technique used before and after 13 weeks (19). Finally, because intrauterine instillations cannot be performed early in gestation, abortions reported to have been performed by intrauterine installation at ≤12 weeks’ gestation are excluded from calculation of the percentage of abortions by known method type.††
Measures of AbortionFour measures of abortion are presented in this report: 1)
the total number of abortions in a given population, 2) the percentage of abortions obtained within a given subpopulation, 3) the abortion rate (number of abortions per 1,000 women aged 15–44 years or other specific group within a given population), and 4) the abortion ratio (number of abortions per 1,000 live
births within a given population). Although total numbers and percentages are useful measures for determining how many women have obtained an abortion, abortion rates adjust for differences in subpopulation size and reflect how likely abortion is among women in particular groups. Abortion ratios reflect the relative number of pregnancies in a population that end in abortion compared with live birth; abortion ratios change both according to the proportion of pregnancies in a population that are unintended and the proportion of unintended pregnancies that are ended. Abortion ratios also are influenced by the proportion of intended pregnancies that end in abortion; however, according to the most recent estimates, intended pregnancies account for a very small percentage of abortions (<5%) (22).
U.S. Census Bureau estimates of the resident female population of the United States, compiled by CDC (23–32), were used as the denominator for calculating abortion rates. Overall abortion rates were calculated from the population of women aged 15–44 years. For adolescents aged <15 years, abortion rates were based on the number of adolescents aged 13–14 years; similarly, for women aged ≥40 years, abortion rates were based on the number of women aged 40–44 years. For the calculation of abortion ratios, live birth data were obtained from CDC natality files (33).
Data Presentation and AnalysisThis report provides state-specific and overall abortion
numbers, rates, and ratios for the 49 areas that reported to CDC for 2008 (excludes California, Maryland, and New Hampshire). In addition, this report describes the characteristics of women who obtained abortions in 2008. However, because the completeness of reporting on the characteristics of women varies by year and by variable, this report only describes the characteristics of women from areas that met reporting standards (i.e., reported at least 20 abortions, provided data categorized in accordance with surveillance variables, and had <15% unknown values for a given characteristic). Cell values from 1 to 4 have been suppressed to maintain confidentiality. In addition, abortion rates and ratios were not calculated for groups with <20 abortions because results are considered unstable.
Most of the data in this report are presented by the reporting area in which the abortions were performed. In addition, 48 reporting areas§§ provided the number of abortions by the reporting area in which women lived. However, two of these reporting areas (Illinois and Wisconsin) reported characteristics for in-state residents but not for out-of-state residents. Four other reporting areas (Arizona, Iowa, Louisiana, and Massachusetts) provided only the total number of abortions for out-of-state residents without specifying individual states or
** The cutoff of ≤8 weeks acknowledges the conventional use of completed weeks of gestation and thus includes up to 8 weeks and 6 days, thereby matching the gestational age limit of 63 days for the early medical abortion protocol endorsed by the American College of Obstetricians and Gynecologists (18).
†† The cutoff of ≤12 weeks has been selected on the basis of the implausibility of this procedure being performed at earlier gestational ages, and on the basis of early research assessing the safety of intrauterine instillations starting at 13 weeks’ gestation (20,21).
§§ Excludes four states that did not report or did not report by maternal residence status (California, Florida, Maryland, and New Hampshire).
Surveillance Summaries
4 MMWR / November 25, 2011 / Vol. 60 / No. 15
areas of residence. As a result, abortion statistics in this report by area of residence are minimum estimates. In particular, they might be disproportionately low for reporting areas from which many women travel to other states to obtain abortion services, if they go to states with incomplete residence reporting.
For the purpose of evaluating trends in the overall number, rate, and ratio of reported abortions in the United States, data are presented for every year during 1999–2008. Linear regression analysis was used to assess the overall rate of change during 1999–2008 and during the first and second half of the period of analysis (1999–2003 and 2004–2008). In addition, the percentage change from the first to the last year was calculated for these three periods and from 2007 to 2008. Only the 45 reporting areas that provided data every year during 1999–2008 were included in these analyses. Similarly, for the analysis of certain additional variables (abortions by maternal age, gestational age, race, and ethnicity), annual data are presented for areas that met reporting standards every year during 1999–2008, and the percentage change was calculated for the same time periods (1999–2008, 1999–2003, 2004–2008, and 2007–2008). However, for other variables (marital status, number of previous abortions, and number of previous live births), annual data are not presented, and areas were included as long as they provided data that meet reporting standards for the years needed for percentage change calculations. To evaluate trends in the use of different methods for performing an abortion, reporting areas were included only if they met reporting standards and if they specifically included medical abortion as a method on their reporting form. Because approval of mifepristone for medical abortion was granted by the Food and Drug Administration (FDA) in September 2000 (34), 2001 was the first complete year during which early medical abortion was available in the United States. Thus, comparisons have been made between 2001 and 2008 and between 2007 and 2008.
Because some of the 49 areas that reported in 2008 were not included in certain trend analyses, summary measures for comparisons over time might differ slightly from the point estimates presented for all areas that reported in 2008.
Abortion Mortality CDC has reported data on abortion-related deaths periodically
since information on abortion mortality first was included in the 1972 abortion surveillance report (14). An abortion-related death is defined as a death resulting from a direct complication of an abortion (legal or illegal), an indirect complication caused by a chain of events initiated by an abortion, or an aggravation of a preexisting condition by the physiologic or psychologic effects of abortion (35) or as a pregnancy-related death in which the pregnancy outcome was induced abortion, regardless of the causal relation between the abortion and the death. An abortion
is defined as legal if it is performed by a licensed clinician; an abortion is defined as illegal if it is performed by any other person. All deaths determined to be related causally to induced abortion have been classified as abortion related regardless of the time between the abortion and death.
Since 1987, CDC has monitored abortion-related deaths through its Pregnancy Mortality Surveillance System (36). Sources of data for abortion-related deaths have included state vital records, public health agencies, maternal mortality review committees, health-care providers and provider organizations, private citizens and citizen groups, and media reports, including computerized searches of full-text newspaper and other print media databases. For each death that possibly is related to abortion, CDC requests clinical records and autopsy reports. Two clinical epidemiologists review these reports to determine the cause of death and whether the death was abortion related. Each death is categorized by abortion type as legal induced, illegal induced, spontaneous, or unknown type. This report provides data on induced abortion-related deaths that occurred during 1972–2007; data for 2007 have not been published previously and are the most recent data available. Possible abortion-related deaths that occurred during 2008–2011 are under investigation. Although national case-fatality rates (the number of abortion-related deaths per 100,000 reported legal induced abortions) have been published for 1972–1997, this measure could not be calculated with CDC data for 1998–2007; because a substantial number of abortions have been documented in states that did not report to CDC during 1998–2007 (3,12), the total number of abortions was not available as the rate denominator.
ResultsU.S. Totals
Among the 49 reporting areas that provided data for 2008,¶¶ a total of 825,564 abortions were reported. Of these abortions, 808,528 (97.9% of the total) were from the 45 reporting areas that provided data every year during 1999–2008.*** These same 45 areas reported 3,451,951 births for 2008, had an abortion rate of 16.0 abortions per 1,000 women aged 15–44 years, and had an abortion ratio of 234 abortions per 1,000 live births (Table 1). Compared with the previous year (2007), the total number of abortions decreased 0.3%, the abortion rate was unchanged, and the abortion ratio increased 1%. During 1999–2008, the total number, rate, and ratio of reported abortions decreased 3%, 4%, and 10%, respectively. However, regression analysis indicated that most of the decrease in the total number and
¶¶ Excludes California, Maryland, and New Hampshire. *** Excludes Alaska, California, Louisiana, Maryland, New Hampshire,
Oklahoma, and West Virginia.
Surveillance Summaries
MMWR / November 25, 2011 / Vol. 60 / No. 15 5
rate of reported abortions occurred during the first half of the period of analysis. On average during 1999–2003, the number of reported abortions decreased by 3,956 abortions per year, and the abortion rate decreased by 0.1 abortions per 1,000 women per year. In contrast, during 2004–2008, average annual changes were slight. The number of reported abortions decreased by 1,004 abortions per year, and the abortion rate actually increased by 0.02 abortions per 1,000 women per year. The change in abortion ratios was more consistent. On average, abortion ratios decreased by 2.7 and 2.5 abortions per 1,000 live births per year, respectively, during 1999–2003 and 2004–2008 (Figure 1).
Occurrence and ResidenceTotal abortion numbers, rates, and ratios have been calculated
by individual reporting area of occurrence and the residence of the women who obtained the abortions (Table 2). By reporting area of occurrence, a considerable range existed in the total number of reported abortions, ranging from four or fewer (Wyoming) to 89,469 (New York City); in the abortion rate, ranging from 4.6 (Mississippi) to 47.6 (New York City) abortions per 1,000 women†††; and in the abortion ratio, ranging from 59 (Idaho) to 732 (New York City) abortions per 1,000 live births.§§§ Similarly, a considerable range existed by residence¶¶¶ in the total number of reported abortions, ranging from 769 (Wyoming) to 82,670 (New York City); in the abortion rate, ranging from 6.2 (Utah) to 44.0 (New York City) abortions per 1,000 women; and in the abortion ratio, ranging from 66 (Utah) to 676 (New York City) abortions per 1,000 live births. Because of the substantial variation that also occurred among reporting areas in the percentage of abortions obtained by out-of-state residents, ranging from none (Wyoming) to 54.3% (District of Columbia), abortion rates and ratios calculated by maternal residence might provide a more accurate reflection of population trends. However, these measures must be viewed with caution because of the variation across reporting areas in methods used to record maternal residence and the resulting 11.5% of abortions reported without a state, territory, reporting area, or country of maternal residence.
Age Among the 47 areas that reported by maternal age for 2008,
women aged 20–29 years accounted for the majority (57.1%) of abortions and had the highest abortion rates (29.6 and 21.6
abortions per 1,000 women aged 20–24 and 25–29 years, respectively) (Figure 2, Table 3). Women in the youngest and oldest age groups (aged <15 or ≥40 years) accounted for the smallest percentage of abortions (0.5% and 3.1%, respectively) and had the lowest abortion rates (1.2 and 2.7 abortions per 1,000 women aged <15 and ≥40 years, respectively). Among the 43 reporting areas that provided data every year during 1999–2008, this pattern across age groups was stable, with the majority of abortions and the highest abortion rates occurring among women in their 20s and the lowest percentages of abortions and abortion rates occurring among women in the youngest and oldest age groups (Table 4). However, during 1999–2008, the abortion rate and percentage of abortions accounted for by women in the youngest age groups decreased, whereas the abortion rate and percentage of abortions accounted for by older women increased. Both during 1999–2003 and 2004–2008, abortion rates increased among adolescents aged ≤19 years and decreased among women aged ≥30 years. However, among women aged 20–24 years, abortion rates decreased during 1999–2003 and then leveled off during 2004–2008.
In contrast to the percentage distribution of abortion numbers and abortion rates, abortion ratios in 2008 were highest among adolescents aged ≤19 years and lowest among women aged 30–39 years (Figure 2, Table 3). Among the 43 reporting areas that provided data for every year during 1999–2008, abortion ratios decreased among all women aged ≥15 years. For most women aged ≥20 years (all groups except women aged 35–39 years), abortion ratios decreased both during 1999–2003 and during 2004–2008. However, for women aged 20–34 years, this trend was reversed from 2007 to 2008 when abortion ratios increased (Table 4).
AdolescentsAmong the 45 areas that reported age by individual year
among adolescents for 2008, adolescents aged ≤19 years accounted for 112,614 abortions (Table 5). The adolescent abortion rate was 10.7 abortions per 1,000 adolescents aged ≤19 years. Adolescents aged 18–19 years accounted for the majority (63.3%) of adolescent abortions and had the highest adolescent abortion rates (20.5 and 25.9 abortions per 1,000 adolescents aged 18 and 19 years, respectively); adolescents aged <15 years accounted for the smallest percentage of adolescent abortions (3.0%) and had the lowest adolescent abortion rate (1.2 abortions per 1,000 adolescents). Among the 40 reporting areas that provided data every year during 1999–2008, this pattern across age groups was stable, with older adolescents accounting for the largest percentage of adolescent abortions and having the highest abortion rates (Table 6). However, during 1999–2008, the distribution of
††† Does not consider the abortion rate for Wyoming, which was based on four or fewer abortions and was judged to be unstable.
§§§ Does not consider the abortion ratio for Wyoming, which was based on four or fewer abortions and was judged to be unstable.
¶¶¶ Comparisons by residence status do not consider California, Florida, Maryland, or New Hampshire. Because these states either did not report or did not report abortions by maternal residence, numbers are available only from other states where their residents obtained abortions and as a consequence are artificially low.
Surveillance Summaries
6 MMWR / November 25, 2011 / Vol. 60 / No. 15
adolescent abortions shifted toward older adolescents, whereas abortion rates decreased among adolescents of all ages. Greater decreases in abortion rates occurred during 1999–2003 than during 2004–2008; however, decreases continued from 2007 to 2008 for all adolescents aged ≥15 years.
The adolescent abortion ratio for 2008 was 345 abortions per 1,000 live births. Adolescent abortion ratios decreased with increasing age and were lowest among adolescents aged 19 years (Table 5). Among the 40 reporting areas that provided data for every year during 1999–2008, the difference in abortion ratios between younger and older adolescents increased, with a comparatively large increase among adolescents aged <15 years and a comparatively large decrease among adolescents aged 18–19 years (Table 6). The increase in abortion ratios among younger adolescents took place primarily during 1999–2003, whereas the decrease in abortion ratios among older adolescents took place primarily during 2004–2008.
Gestational AgeAmong the 40 areas that reported gestational age at the
time of abortion for 2008 (Table 7), the majority (62.8%) of abortions were performed at ≤8 weeks’ gestation, and 91.4% were performed at ≤13 weeks’ gestation. A total of 7.3% of abortions were performed at 14–20 weeks’ gestation, and 1.3% were performed at ≥21 weeks’ gestation. Among the 32 reporting areas that provided data on gestational age every year during 1999–2008 (Table 8), the percentage of abortions performed at ≤13 weeks’ gestation was stable but shifted toward earlier gestational ages: abortions performed at ≤8 weeks’ gestation increased 12%, whereas abortions performed at 9–13 weeks’ gestation decreased 18%. The percentage increase in abortions performed at ≤8 weeks’ was greatest during 1999–2003 but continued during 2004–2008; similarly, the percentage decrease in abortions performed at 9–13 weeks’ was greatest during 1999–2003 but continued during 2004–2008. Throughout the period of analysis, the percentage of abortions performed at >13 weeks’ gestation remained low (<10%). Abortions performed at ≥16 weeks’ gestation decreased 13%–17% during 1999–2008, although this decrease only took place during 1999–2003 and did not continue during 2004–2008.
Among the 40 areas that reported the exact week of gestational age for abortions performed at ≤13 weeks’ gestation in 2008, 33.6% were performed at ≤6 weeks’ gestation, and 35.1% were performed at 7–8 weeks’ gestation (Table 9). Among the remaining abortions at ≤13 weeks’ gestation, the percentage contribution was progressively lower for each additional week of gestation: 10.5% of abortions at ≤13 weeks were performed at 9 weeks’ gestation, whereas 3.2% were performed at 13 weeks’
gestation. Among the 33 areas that reported by the exact week of gestational age for every year during 1999–2008, the percentage of abortions shifted over time toward earlier gestational ages: the percentage of abortions performed at ≤6 weeks’ gestation increased 53%, whereas the percentage performed at 8–13 weeks’ gestation decreased (Table 10); the percentage increase in abortions performed at ≤6 weeks’ was greatest during 1999–2003 but continued during 2004–2008.
Method Type Among the 40 areas that reported by method type for 2008
and included medical abortion on their reporting form for medical providers, 75.9% of abortions were performed by curettage at ≤13 weeks’ gestation;14.6% were performed by early medical (nonsurgical) abortion, 8.5% were performed by curettage at >13 weeks’ gestation, and all other methods were uncommon (Table 11). Among the 28 reporting areas that included medical abortion on their reporting form and provided this data for all 3 years of comparison (2001, the first full year following FDA approval of mifepristone for use in early medical abortion, as well as 2007 and 2008),**** the use of early medical abortion increased 17% from 2007 to 2008 and approximately 300% from 2001 to 2008 (from 3.4% of abortions in 2001 to 11.9% in 2007 and 13.9% in 2008). In contrast, use of curettage at ≤13 weeks’ gestation decreased 3% from 2007 to 2008 and 12% from 2001 to 2008 (from 87.3% of abortions in 2001 to 79.0% in 2007 and 76.7% in 2008). Use of curettage at >13 weeks’ gestation remained essentially unchanged (accounting for 8.6% of abortions in 2001, 8.3% in 2007, and 8.6% in 2008). All other methods consistently accounted for a small percentage of abortions (0.05%–0.7%).
Race Among the 35 areas that reported race for 2008, white women
(including Hispanic and non-Hispanic white women) accounted for the largest percentage (52.4%) of abortions; black women accounted for 40.2%, and women in the other races category accounted for 7.3% (Table 12). In contrast, black women had higher abortion rates and ratios than white women and women in the other races category (Table 12). Among the 26 reporting areas that provided data every year during 1999–2008, the percentage distribution of abortions by race changed little; although the percentage of abortions among women in the other races category increased, the percentage remained low (Table 13). Abortion rates decreased among women of all races
**** Excludes Alabama, Alaska, Arizona, California, Colorado, Connecticut, Florida, Georgia, Hawaii, Illinois, Indiana, Iowa, Kentucky, Louisiana, Maryland, Massachusetts, Nevada, New Hampshire, Oklahoma, Rhode Island, Tennessee, West Virginia, Wisconsin, and Wyoming.
Surveillance Summaries
MMWR / November 25, 2011 / Vol. 60 / No. 15 7
during 1999–2008. However, among white women, decreases in abortion rates were greater during 1999–2003 than during 2004–2008. Among black women, decreases during 1999–2003 did not continue during 2004–2008, and from 2007 to 2008, abortion rates increased. Abortion ratios decreased during 1999–2008 among women of all races, and these decreases occurred both during 1999–2003 and during 2004–2008. However, this trend reversed among black women from 2007 to 2008 when their abortion ratio increased (Table 13).
Race/EthnicityAmong the 28 areas that reported cross-classified race/
ethnicity data for 2008 (Table 14), non-Hispanic white women and non-Hispanic black women accounted for 37.2% and 35.5% of all abortions. Hispanic women accounted for 21.1% of all abortions, and non-Hispanic women in the other races category accounted for 6.3%. Non-Hispanic white women had the lowest abortion rates (8.7 abortions per 1,000 women aged 15–44 years) and ratios (140 abortions per 1,000 live births), whereas non-Hispanic black women had the highest abortion rates (33.5 abortions per 1,000 women aged 15–44 years) and ratios (472 abortions per 1,000 live births). Among the 24 areas††††thatreportedbyrace/ethnicitybothin2007and 2008, increases in abortion rates and ratios were somewhat greater for non-Hispanic black women than for non-Hispanic white women and Hispanic women. Abortion rates increased 10% for non-Hispanic black women (from 32.2 abortions per 1,000 women in 2007 to 35.4 in 2008), 5% for non-Hispanic white women (from 8.6 abortions per 1,000 women in 2007 to 9.0 in 2008), and 2% for Hispanic women (from 20.0 abortions per 1,000 women in 2007 to 20.4 in 2008). Similarly abortion ratios increased 4% among non-Hispanic black women (from 481 abortions per 1,000 live births in 2007 to 501 in 2008), whereas they were more stable for non-Hispanic white women (at 145 abortions per 1,000 live births in 2007 and 144 in 2008) and for Hispanic women (at 201 abortions per 1,000 live births in 2007 to 196 in 2008). Because 2007 was the first year for whichcross-classifiedrace/ethnicitydatawerecompiled,longerterm trends could not be evaluated.
EthnicityAmong the 32 areas that reported ethnicity for 2008,
Hispanic women accounted for 19.5% of all abortions,
with an abortion rate of 20.3 abortions per 1,000 women and an abortion ratio of 192 abortions per 1,000 live births (Table 15). These results are similar, albeit slightly lower, to those for Hispanic women who obtained abortions in the 27 reporting areas that provided cross-classified race/ethnicitydata (Table 14). Among the 19 reporting areas that provided ethnicity data every year during 1999–2008, the percentage of abortions accounted for by Hispanic women increased 15% (Table 16). Abortion rates and ratios decreased among Hispanic women during 1999–2008. However, these decreases were greater during 1999–2003 than during 2004–2008 and did not continue from 2007 to 2008 (Table 16).
Marital StatusAmong the 40 areas that reported marital status for 2008,
15.7% of all women were married, and 84.3% were unmarried (Table 17). For the 30 reporting areas§§§§ that provided these data for the relevant years of comparison, the percentage of abortions accounted for by unmarried women increased 4% during 1999–2008 (from 81.2% in 1999 to 84.4% in 2008); an increase occurred both during 1999–2003 and during 2004–2008.
Previous Live Births and AbortionsAmong the 41 areas that reported by the number of previous
live births for 2008, 40.6%, 46.1%, and 13.3% of all women who obtained abortions had previously had zero, one to two, or three or more live births, respectively (Table 18). Among the 35 reporting areas¶¶¶¶ that provided these data for the relevant years of comparison, the percentage of women who had no previous live births was stable during 1999–2008 (at 40.6% in 1999 and 40.7% in 2008). In contrast, during 1999–2008, the percentage of women who had one to two previous live births decreased 3% (from 47.6% in 1999 to 46.0% in 2008), and the percentage who previously had three or more live births increased 13% (from 11.8% in 1999 to 13.3% in 2008); for both groups the direction of change (increase or decrease) was consistent during 1999–2003 and 2004–2008.
Among the 42 areas that reported the number of previous abortions for 2008, the majority of women (55.6%) had not previously had an abortion; 36.4% and 8.0%, respectively, had previously had either one to two abortions, or three or
†††† Excludes California, Connecticut, Delaware, District of Columbia, Florida, Hawaii, Illinois, Iowa, Kentucky, Louisiana, Maine, Maryland, Massachusetts, Michigan, Nebraska, Nevada, New Hampshire, New Mexico, New York State, North Carolina, Oklahoma, Pennsylvania, Rhode Island, South Carolina, Vermont, Washington, Wisconsin, and Wyoming.
§§§§ Excludes Alaska, Arizona, Arkansas, California, Connecticut, District of Columbia, Florida, Iowa, Louisiana, Maine, Maryland, Massachusetts, Montana, Nebraska, New Hampshire, New York State, Oklahoma, Rhode Island, South Dakota, Washington, West Virginia, and Wyoming.
¶¶¶¶ Excludes Alaska, Arkansas, California, Connecticut, District of Columbia, Florida, Illinois, Kentucky, Maryland, Massachusetts, New Hampshire, New Mexico, Oklahoma, Rhode Island, West Virginia, Wisconsin, and Wyoming.
Surveillance Summaries
8 MMWR / November 25, 2011 / Vol. 60 / No. 15
more abortions (Table 19). Among the 33 reporting areas***** that provided data for the relevant years of comparison, the percentage of women who had not previously had an abortion increased 2% (from 54.1% in 1999 to 55.1% in 2008). The percentage of women who had one to two previous abortions decreased 4% (from 38.1% in 1999 to 36.5% in 2008), whereas the percentage of women who had obtained three or more previous abortions increased 8% (from 7.8% in 1999 to 8.4% in 2008). For women who had obtained zero or one to two previous abortions, the direction of change (increase or decrease) was consistent during 1999–2003 and 2004–2008; however, for women who had previously obtained three or more abortions, the increase occurred exclusively during 2004–2008.
Age and Marital Status by Race and Race/Ethnicity
Insomereportingareas,womenofeachracialandracial/ethnicgroup were classified by age and marital status (Tables 20 and 21). Byage,aconsistentpatternexistedacrossallracialandracial/ethnicgroups, with the smallest percentage of abortions occurring among adolescents aged <15 years (0.3%–0.7%) and the largest percentage occurring among women aged 20–24 years (26.1%–33.6%). By marital status, a consistent pattern also existed across all racial and racial/ethnicgroups,withahigherpercentageofabortionsoccurringamong women who were unmarried (65.3%–90.2%) than among those who were married (9.8%–34.7%).
Weeks of Gestation by Age, Race, Race/Ethnicity, and Method Type
In some reporting areas, women who obtained abortions at different gestational ages were categorized by age, race, and race/ethnicity(Tables22and23).Ineverysubgroupforthesethree variables, the largest percentage of abortions was obtained by ≤8 weeks’ gestation. However, whereas 44.0% of adolescents aged <15 years and 53.2% of adolescents aged 15–19 years obtained an abortion by ≤8 weeks’ gestation, 61.2%–70.0% of women aged ≥20 years obtained an abortion by this point in gestation (Figure 3; Table 22). Conversely, 19.0% of adolescents aged <15 years and 12.3% of adolescents 15–19 years obtained an abortion after 13 weeks’ gestation, whereas this percentage ranged from 6.8%–8.9% for adult women. By race/ethnicity,58.9%ofnon-Hispanicblackwomenobtainedan abortion at ≤8 weeks’ gestation, whereas 66.9%–70.5% of womenfromotherracial/ethnicgroupsobtainedanabortion
by this point in gestation. Non-Hispanic black women also obtained the highest percentage of abortions after 13 weeks’ gestation;however,differencesacrossracial/ethnicgroupswereless apparent than differences across age groups (Table 22).
Among women obtaining abortions in reporting areas that further categorized method type by gestational age, curettage accounted for the largest percentage of abortions within every gestational age category (Table 24). At ≤8 weeks’ gestation, curettage accounted for a smaller percentage of abortions (76.9%) than at any other stage of gestation, and early medical abortion accounted for a comparatively high percentage of abortions (22.5%). At 9–20 weeks’ gestation, curettage accounted for 96.0%–98.4% of all abortions and then decreased to 90.6% of abortions at ≥21 weeks’ gestation. After 8 weeks’ gestation, medical abortion accounted for 0.6%–1.7% of abortions until 18 weeks’ gestation, when its use increased to 2.2% at 18–20 weeks and 7.7% at ≥21 weeks’ gestation. Throughout gestation, intrauterine instillations and other methods accounted for a small percentage (0%–1.7%) of abortions.
Abortion Mortality Using national data from the Pregnancy Mortality Surveillance
System (36), CDC identified nine deaths for 2007 that were potentially related to abortion. These deaths were identified either by some indication of abortion on the death certificate, by reports from a health-care provider or public health agency, or from a media report. Investigation of these cases indicated that six of the nine deaths were related to legal abortion and none to illegal abortion (Table 25). One of the six deaths related to a legal induced abortion occurred after a medical (nonsurgical) abortion; this case has been described previously (37). Of the three deaths that were determined not to be related to a legal induced abortion, two were determined to be causally unrelated to the pregnancy or the abortion, and one was associated with a pregnancy outcome other than induced abortion. Possible abortion-related deaths that occurred during 2008–2011 are under investigation.
DiscussionFor 2008, a total of 825,564 abortions were reported in the
United States. Of these abortions, 808,528 (97.9% of the total) were from the 45 reporting areas that submitted data every year during 1999–2008, thus providing the information necessary for evaluating trends. These 45 areas reported 3,451,951 births for 2008, and had an abortion rate of 16.0 abortions per 1,000 women aged 15–44 years and an abortion ratio of 234 abortions per 1,000 live births. This represents essentially no change from 2007 in the total number (810,582) and rate (16.0 abortions per 1,000 women aged 15–44 years) of reported abortions and is consistent with the leveling off from decreases
***** Excludes Alaska, Arizona, Arkansas, California, Colorado, Connecticut, District of Columbia, Florida, Illinois, Louisiana, Maryland, New Hampshire, New Mexico, Ohio, Oklahoma, Rhode Island, West Virginia, Wisconsin, and Wyoming.
Surveillance Summaries
MMWR / November 25, 2011 / Vol. 60 / No. 15 9
observed in the past. Indeed, previously reported average annual decreases in the total number and rate of abortions during 1996-2000 (13) were five times the average annual decreases for the same 45 reporting areas during 1999–2003; the rate of decrease leveled off even more during 2004–2008, when essentially no decrease occurred. Moreover, the last 1-year increase (from 2005 to 2006) in the total number and rate of reported abortions was accompanied by an equivalent increase in the total number of births in the United States and the fertility rate (live births per 1,000 women aged 15–44 years) (13,38); in contrast, the leveling off of abortion numbers and rates from 2007 to 2008 was accompanied by a decrease in births and fertility (39). This leveling off of abortion numbers in conjunction with a decrease in number of births is reflected by the increase in the abortion ratio from 2007 to 2008, which previously had been decreasing steadily.
In addition to overall population changes, this report highlights important age differences in abortion trends. Throughout the period covered by this report, women aged 20–29 years obtained the majority of abortions (55%–57%) and therefore accounted for most of the overall changes in abortion rates. In particular, women aged 20–24 years consistently accounted for approximately one third of all abortions, and although the abortion rates in this age group decreased during 1999–2003, they increased during 2004–2008. Hence women in this age group largely account for the recent leveling off of the decrease in abortion rates for the overall population.
In contrast to the abortion patterns among women aged 20–29 years, trends in abortion rates during 1999–2008 were more consistent for older women (for whom there was a steady increase) and adolescents (for whom there was a steady decrease). Because women aged ≥35 years consistently accounted for a small percentage of abortions (<11% during 1999–2008), they had a much smaller impact on overall abortion trends. Nonetheless, the persistent increase in abortion rates among women in this age group suggests that unintended pregnancy is a problem that women face throughout their reproductive years and that women in older age groups are increasingly affected.
The trends on adolescent abortions described in this report are important for monitoring progress toward reducing adolescent pregnancies in the United States. During 1991–2009, the adolescent birth rate in the United States decreased by 37% to its lowest level in the nearly 70 years these data have been collected (40,41). Although reporting of abortions lags behind reporting of births, data through 2005 indicate that the adolescent abortion rate decreased even more than the adolescent birth rate (5). Therefore, the historic decrease in the adolescent birth rate through 2005 can be attributed to a decrease in the adolescent pregnancy rate rather than to a
decrease in the proportion of adolescents who continued their pregnancies through live birth. However, the long-term decrease in the adolescent birth rate was interrupted by a 5% increase from 2005 to 2007 (42). Because the adolescent abortion rate did not change substantially during this period, decreasing only 1% (14), most of the increase in adolescent births can be attributed to an increase in adolescent pregnancies rather than to an increasing tendency for adolescents to continue their pregnancies. In 2008, a 2% decrease in the adolescent birth rate occurred, consistent with the previous downward trend (39). Because the abortion rate in 2008 for adolescents aged 15–19 years also decreased 2%, the decrease in births once again might be attributed to a decrease in pregnancies rather than a decrease in the tendency for adolescents to continue their pregnancies. Given that the adolescent birth rate decreased 6% from 2008 to 2009 (43), 2009 abortion data, when available, will be important for determining the extent to which this large decrease can be attributed to a decrease in adolescent pregnancies.
The findings in this report on race and ethnicity reflect differences in patterns of obtaining abortions that have been well-documented and observed for many years (2–11). Comparatively high abortion rates and ratios among black women can be attributed to higher unintended pregnancy rates and a higher percentage of unintended pregnancies ending in abortion (44,45). Although data from some recent reports suggest that differences in measures of abortion between black women and women of other races have narrowed (10,11), the increase in abortion rates and ratios observed for black women in the 2008 CDC data reverses the suggestion of a downward trend from previous years (14). High abortion rates among Hispanic compared with non-Hispanic white women have been attributed to high pregnancy rates among Hispanic women (44,45). However, abortion ratios in these two groups have been more comparable: Hispanic women have tended to have a slightly higher percentage of pregnancies that are unintended but are no more likely than non-Hispanic white women to terminate unintended pregnancies (44). Changes from 2007 to 2008 in abortion rates and ratios for Hispanic women were slight. However, longer term changes are difficult to interpret from this report because records before 2007 for non-Hispanic women combined women from white, black, and other racial populations.
The findings presented in this report indicate that more women are obtaining abortions earlier in gestation, when the risks for complications are lowest (46–49). Among the areas that reported data every year during 1999–2008, the percentage of abortions performed at ≤8 weeks’ gestation increased 12%. Moreover, among the areas that reported abortions at ≤13 weeks’ gestation by individual week, a clear shift in the distribution toward earlier weeks of gestation was observed: during 1999–2008 the
Surveillance Summaries
10 MMWR / November 25, 2011 / Vol. 60 / No. 15
percentage performed at ≤6 weeks’ gestation increased 53%, whereas the percentage performed at ≥8 weeks’ gestation decreased. However, these changes were greater during 1999–2003 than during 2004–2008, suggesting that the increase in the percentage of abortions performed during the earliest stages of gestation has slowed in recent years. Moreover, the overall percentage of abortions performed at ≤13 weeks’ gestation has changed little, and no additional decreases in the small proportion of abortions performed at ≥16 weeks’ gestation have occurred since 2004.
Because the risks for abortion complications are the lowest early in gestation, it is important to understand the factors that cause women to delay their requests for pregnancy termination (50–52). This report suggests these factors might be especially pronounced for adolescents and black women. In these groups of women, a smaller percentage of abortions was obtained at ≤8 weeks’ gestation, and among adolescents, in particular, a greater percentage of abortions was obtained at >13 weeks’ gestation. Because women with low incomes frequently need additional time to raise the necessary funds and make arrangements for an abortion (50,53), some delays among black women might be related to their higher poverty rates (54). Delays among adolescents might reflect the fact that they often take longer to suspect and then confirm they are pregnant (50,52) and might take longer to arrange an abortion because of parental involvement laws (55). In addition, some pregnant adolescents approaching age 18 years wait until they are old enough to obtain an abortion without parental involvement (56,57), thereby delaying the timing of their abortion.
The trend among women to obtain abortions earlier in pregnancy, although not observed equally among all subgroups of women, has been facilitated by changes in abortion practices. Curettage has remained the most common method for performing abortions. Although for many years this type of abortion was performed only after the initial weeks of gestation, the development of highly sensitive pregnancy tests and transvaginal ultrasonography increasingly have allowed clinicians to diagnose pregnancy and confirm its termination at ≤6 weeks’ gestation (58–63). In addition, the use of medical abortion might have contributed to the increasing percentage of abortions performed early in gestation. In September 2000, FDA approved mifepristone for use in early medical abortion (34), and in 2005, the American College of Obstetricians and Gynecologists endorsed an evidence-based protocol that can be used up to 63 days of gestation (18). In 2008, 62.8% of abortions were performed at ≤8 weeks’ gestation and thus were eligible for early medical abortion; 22.5% of these eligible abortions and 14.6% of all abortions were reported as early medical abortions. The use of early medical abortion has increased substantially since FDA approved the use of mifepristone: during 2001–2008, the percentage
of all reported abortions accounted for by this method increased approximately 300%. Moreover, whereas the rate of increase leveled off after the initial years of approval (64), the proportional use of this method has continued to increase, with the percentage of all abortions reported as early medical abortion increasing 17% from 2007 to 2008.
The average annual number of deaths associated with known legal induced abortions during the latest decade (1998–2007) was 57% lower than during the first decade following legalization of abortion (1972–1981) and 22% lower than that during 1982–1997. In 2007, six women died from causes known to be associated with legal abortion, and none died as a result of known illegal abortions. CDC data cannot be used to calculate national case-fatality rates for 1998–2007 because some states (four during 1998–1999, three during 2000–2005 and 2007, and two during 2006), including California, did not report abortion surveillance data. Because a substantial number of abortions have been documented in California (3,12), CDC data cannot be used to approximate the total number of abortions as the rate denominator.
LimitationsThe findings in this report are subject to at least four
limitations. First, because reporting requirements are established by the individual reporting areas (16), the collection of data varies, and CDC is unable to obtain the total number of abortions performed in the United States. During 1999–2008, the total annual number of abortions recorded by CDC was 65%–69% of the number recorded by the Guttmacher Institute (12), which uses numerous active follow-up techniques to increase the completeness of the data obtained through its periodic national survey of abortion providers (12). Although most reporting areas collect and send abortion data to CDC, this information is given to CDC voluntarily. Consequently, during 1999–2008, seven of the 52 reporting areas did not provide CDC data on a consistent annual basis, and for 2008, CDC did not obtain any information from California, Maryland, or New Hampshire.††††† In addition, whereas most of the reporting areas that send abortion data to CDC have laws requiring medical providers to submit a report for every abortion they perform to a central health agency, in New Jersey and the District of Columbia, medical providers submit this information voluntarily (15). As a result, the abortion numbers these areas report to CDC tend to be incomplete.§§§§§ Moreover, even in
††††† In 2008, abortions performed in California, Maryland, and New Hampshire accounted for 21% of all abortions counted through the Guttmacher Institute’s national survey of abortion providers (65).
§§§§§ In 2008, the abortion counts that CDC obtained from New Jersey and the District of Columbia were 53% and 57%, respectively, of the abortion counts that the Guttmacher Institute obtained for these areas in their national survey of abortion providers (65).
Surveillance Summaries
MMWR / November 25, 2011 / Vol. 60 / No. 15 11
states that legally require medical providers to submit a report for all the abortions they perform, enforcement of this requirement varies (66). Consequently, several other reporting areas provide CDC with incomplete numbers.¶¶¶¶¶
Second, because reporting requirements are established by the individual reporting areas, many states have developed reporting forms that do not resemble the template CDC created for technical guidance (17). Consequently, many reporting areas do not collect all the information CDC compiles on the characteristics of women obtaining abortions (e.g., age, race, and ethnicity) (66). Similarly, some reporting areas do not specifically include medical abortion as one of the potential methods for terminating a pregnancy (15). Although missing demographic information can reduce the extent to which the statistics in this report represent all women in the United States, four nationally representative surveys of women obtaining abortions in 1987, 1994–1995, 2001–2002, and 2008 (7–10) have produced distributions, for most characteristics, that are nearly identical to the distributions reported by CDC. Theone exception is thedistributionof abortions by race/ethnicity. In particular, the percentage of abortions accounted for by black women is higher in this report than the percentage in reports based on nationally representative survey results (10). In addition, the greater decrease in abortion rates for black women comparedwithwomenofotherracial/ethnicgroupsbasedonnationally representative survey results (11) is not supported by the data in this report. These differences likely are attributable both to the comparatively high degree of measurement error for this variable that reduces the reliability of national survey results (10,11) and to the fact that the number of states that report to CDCbyrace/ethnicitycontinuestobesomewhatlowerthanforother demographic variables. Importantly, some of the reporting areasthathavenotreportedcross-classifiedrace/ethnicitydatatoCDC (e.g., California, Florida, and Illinois) have large enough populations of minority women that the absence of data from these areas reduces the representativeness of CDC data. Similarly, for the measurement of medical abortion, CDC’s early estimates might not as accurately represent the proportional contribution of this method because of the comparatively small number of reporting areas that provided this information. However, since
2001, the first full year after FDA approval of mifepristone for early medical abortion, more reporting areas have begun to specifically request information from abortion providers on the use of this method. As more states add medical abortion to their reporting forms, CDC estimates of the proportional contribution of this method should improve; however, trend analyses will continue to be affected by the incompleteness of early data.
Third, abortion data are compiled and reported to CDC by the central health agency of the reporting area in which the abortion was performed rather than the reporting area in which the woman lived. This inflates abortion statistics for reporting areas in which a high percentage of abortions are obtained by out-of-state residents and undercounts abortions for states with limited abortion services, more stringent legal requirements for obtaining an abortion, or geographic proximity to services in another state. To adjust for these biases, CDC attempts to categorize abortions by residence in addition to occurrence. However, CDC was unable to identify the reporting area, territory, or country of residence for 11.5% of reported abortions.
Finally, adjustments for socioeconomic status cannot be made without data on education or income, and joint analysis of many variables of interest (e.g., age, race, and ethnicity) is precluded because reporting areas provide CDC with aggregate numbers rather than individual-level records.
Public Health ImplicationsOngoing abortion surveillance is important for several
reasons. First, abortion surveillance is needed to guide and evaluate programs aimed at preventing unintended pregnancies. Because pregnancy intentions are complex and difficult to assess (67–75), abortion provides an important measure of pregnancies that are unwanted. Second, routine abortion surveillance is needed to assess changes in clinical practice patterns over time. Information in this report on the prevalence of abortions performed through different methods (e.g., medical or curettage) and at different gestational ages provides the denominator data that are necessary for analyses of the relative safety of abortion practices. Finally, statistics on the number of pregnancies ending in abortion are needed in conjunction with data on births and fetal losses to more accurately estimate the number of pregnancies in the United States and determine rates for various outcomes (e.g., adolescent pregnancy rates) (76).
According to the most recent national estimates, nearly one fifth of all pregnancies in the United States end in abortion (5). Multiple social, cultural, economic, and political factors are known to influence the incidence of abortion: the availability of abortion providers (12,77–79); the adoption of state regulations,
¶¶¶¶¶ In 2008, the abortion counts CDC obtained for Wyoming were <5% of the counts obtained for this state by the Guttmacher Institute in their national survey of abortion providers. The counts CDC obtained for Louisiana were 46% of the Guttmacher Institutes counts; for Arizona, CDC counts were 55% of the Guttmacher Institute counts; for Hawaii, CDC counts were 58% of the Guttmacher Institute counts; for Delaware, CDC counts were 65% of the Guttmacher Institute counts; for Michigan, CDC counts were 71% of the Guttmacher Institute counts; for Colorado, CDC counts were 73% of the Guttmacher Institute counts; for Connecticut, Idaho, Illinois, Nevada, New Mexico, New York, Ohio, Oregon, and West Virginia, CDC counts were 80% to <90% of the Guttmacher Institute counts. All other areas with legal reporting requirements that provided data to CDC for this report obtained counts that were at least 90% of the Guttmacher Institute counts (65).
Surveillance Summaries
12 MMWR / November 25, 2011 / Vol. 60 / No. 15
such as mandatory waiting periods and parental involvement laws (55,80); increasing acceptance of nonmarital childbearing (81,82); shifts in the racial/ethnic compositionof theU.S.population (83,84); and changes in the economy and the resulting impact on fertility preferences and access to health-care services, including contraception (85,86). However, in spite of these multiple influences, efforts to reduce the incidence of abortion need to focus on preventing unintended pregnancy. Indeed, nearly all abortions are preceded by an unintended pregnancy, with most recent estimates suggesting that intended pregnancies account for <5% of all abortions (22), including those which presumably are performed for maternal medical indications and fetal abnormalities. Providing women with the knowledge and resources necessary to make decisions about their sexual behavior and use of contraception can help them avoid unintended pregnancies. However, efforts to reduce unintended pregnancy in the United States have been challenging. Findings from the National Survey of Family Growth (NSFG), the primary national source of data on unintended pregnancy in the United States, suggest that unintended pregnancy decreased during 1982–1995 in conjunction with an increase in contraceptive use among women at risk for unintended pregnancy****** (87–89). However, data from the 2002 and 2006–2008 NSFGs suggest that no additional improvements have occurred: contraceptive use among women at risk for unintended pregnancy has decreased; only small gains have been made in the use of the most effective forms of reversible contraception, such as intrauterine devices and hormonal implants (90); and no additional progress has been made toward reducing unintended pregnancy (44,45). As part of the Patient Protection and Affordable Care Act, the U.S. Department Health and Human Services charged the Institute of Medicine with identifying which preventive services are important to women’s health and should be covered at no cost to patients. Following the Institute of Medicine’s recommendation (91), the full range of FDA-approved contraception methods, sterilization procedures, and patient education and counseling for women with reproductive capacity will be covered without cost sharing in new health plans beginning in August 2012. The removal of cost as one barrier to correct and consistent contraceptive use might contribute to a reduction in the number of unintended pregnancies and consequently the number of abortions that are performed in the United States.
Acknowledgments
This report is based, in part, on contributions by Sonya B. Gamble, Division of Reproductive Health, National Center for Chronic Disease Prevention and Health Promotion, CDC; Jessica Reno, Rollins School of Public Health, Emory University, Atlanta, Georgia; and Kristi Seed, Science Applications International Corporation, Atlanta, Georgia.
References 1. Smith JC. Abortion surveillance report, hospital abortions, annual
summary 1969. Atlanta, GA: US Department of Health, Education, and Welfare, Public Health Service, Health Services and Mental Health Administration, National Communicable Disease Center; 1970.
2. CDC. Abortion surveillance—United States, 2005. MMWR 2008;57(No. SS-13).
3. Henshaw SK, Kost K. Trends in the characteristics of women obtaining abortions, 1974 to 2004. New York, NY: Guttmacher Institute; 2008. Available at http://www.guttmacher.org/pubs/2008/09/23/TrendsWomenAbortions-wTables.pdf. Accessed September 20, 2011.
4. Jones RK, Kost K, Singh S, Henshaw SK, Finer LB. Trends in abortion in the United States. Clin Obstet Gynecol 2009;52:119–29.
5. Ventura SJ, Abma JC, Mosher WD, Henshaw SK. Estimated pregnancy rates by outcome for the United States, 1990–2005: an update. Natl Vital Stat Rep 2009;58(4).
6. Ventura SJ, Mosher WD, Curtin SC, Abma JC, Henshaw S. Trends in pregnancies and pregnancy rates by outcome: estimates for the United States, 1976–1996. Vital Health Stat 2000;21(56).
7. Henshaw SK, Kost K. Abortion patients in 1994–1995: characteristics and contraceptive use. Fam Plann Perspect 1996;28:140–7,58.
8. Henshaw SK, Silverman J. The characteristics and prior contraceptive use of U.S. abortion patients. Fam Plann Perspect 1988;20:158–68.
9. Jones RK, Darroch JE, Henshaw SK. Patterns in the socioeconomic characteristics of women obtaining abortions in 2000–2001.Perspect Sex Reprod Health 2002;34:226–35.
10. Jones RK, Finer LB, Singh S. Characteristics of U.S. abortion patients, 2008.NewYork,NY:GuttmacherInstitute;2010.Availableathttp://www.guttmacher.org/pubs/US-Abortion-Patients.pdf. AccessedSeptember 20, 2011.
11. Jones RK, Kavanaugh ML. Changes in abortion rates between 2000 and 2008 and lifetime incidence of abortion. Obstet Gynecol 2011;117:1358–66.
12. Jones RK, Kooistra K. Abortion incidence and access to services in the United States, 2008. Perspect Sexual Reprod Health 2011;43:41–50.
13. CDC. Abortion surveillance—United States, 2006. MMWR 2009;58(No. SS-8).
14. CDC. Abortion surveillance—United States, 2007. MMWR 2011;60(No. SS-1).
15. Guttmacher Institute. State policies in brief: abortion reporting requirements. NewYork,NY:GuttmacherInstitute.Availableathttp://www.guttmacher.org/statecenter/spibs/spib_ARR.pdf.September20,2011.
16. Saul R. Abortion reporting in the United States: an examination of the federal-state partnership. Fam Plann Perspect 1998;30:244–7.
17. CDC. Handbook on the reporting of induced termination of pregnancy. Hyattsville, MD: US Department of Health and Human Services, CDC, National Center for Health Statistics; 1998; DHHS publication no. (PHS)98 1117:1–18.
18. ACOG Committee. ACOG practice bulletin: clinical management guidelines for obstetrician-gynecologists. Obstet Gynecol 2005;106:871–82
19. Paul M, Lichtenberg ES, Borgatta L, Grimes DA, Stubblefield PG, Creinin MD. Management of unintended and abnormal pregnancy: comprehensive abortion care. Oxford, England: Blackwell; 2009.
****** Women are considered to be at risk for unintended pregnancy if they are fertile, have had intercourse during the preceding 3 months, and are not intentionally pregnant or seeking pregnancy (90).
Surveillance Summaries
MMWR / November 25, 2011 / Vol. 60 / No. 15 13
20. Grimes DA, Schultz KF, Cates W, Jr., Tyler CW. The Joint Program for the Study ofAbortion/CDC: a preliminary report. In:HernWM,Andrikopoulos B, eds. Abortion in the seventies: proceedings of the Western Regional Conference on Abortion. New York, NY: National Abortion Federation; 1977:41–54.
21. Grimes DA, Schulz KF, Cates W, Jr., Tyler CW, Jr. Mid-trimester abortion by dilatation and evacuation: a safe and practical alternative. N Engl J Med 1977;296:1141–5.
22. Finer LB, Kost K. Unintended pregnancy rates at the state level. Perspect Sex Reprod Health 2011;43:78–87.
23. CDC. Postcensal estimates of the resident population of the United States as of July 1, 2007, by year, state and county, age, bridged race, sex,andHispanicorigin(Vintage2007)[Filepcen_v2007_y07.sasbdat].Hyattsville, MD: CDC, National Center for Health Statistics; 2008. Available at http://www.cdc.gov/nchs/nvss/bridged_race/data_documentation.htm#vintage2007. Accessed August 25, 2010.
24. CDC. Postcensal estimates of the resident population of the United States as of July 1, 2006, by year, state and county, age, bridged race, sex,andHispanicorigin(Vintage2006)[Filepcen_v2006_y06.sasbdat].Hyattsville, MD: CDC, National Center for Health Statistics; 2007. Available at http://www.cdc.gov/nchs/nvss/bridged_race/data_documentation.htm#vintage2006. Accessed September 20, 2011.
25. CDC. Postcensal estimates of the resident population of the United States as of July 1, 2005, by year, state and county, age, bridged race, sex,andHispanicorigin(Vintage2005)[Filepcen_v2005_y05.sasbdat].Hyattsville, MD: CDC, National Center for Health Statistics; 2006. Available at http://www.cdc.gov/nchs/nvss/bridged_race/data_documentation.htm#vintage2005. Accessed September 20, 2011.
26. CDC. Postcensal estimates of the resident population of the United States as of July 1, 2004, by year, state and county, age, bridged race, sex,andHispanicorigin(Vintage2004)[Filepcen_v2004_y04.sasbdat].Hyattsville, MD: CDC, National Center for Health Statistics; 2005. Available at http://www.cdc.gov/nchs/nvss/bridged_race/data_documentation.htm#vintage2004. Accessed November 10, 2010.
27. CDC. Postcensal estimates of the resident population of the United States as of July 1, 2003, by year, state and county, age, bridged race, sex,andHispanicorigin (Vintage2003) [Filepcen_v2003_y03.zip].Hyattsville, MD: CDC, National Center for Health Statistics; 2004. Available at http://www.cdc.gov/nchs/nvss/bridged_race/data_documentation.htm#vintage2003. Accessed November 10, 2010.
28. CDC. Postcensal estimates of the resident population of the United States as of July 1, 2002, by year, state and county, age, bridged race, sex,andHispanicorigin (Vintage2002) [Filepcen_v2002_y02.zip];2003.Available at http://www.cdc.gov/nchs/nvss/bridged_race/data_documentation.htm#vintage2002. Accessed November 10, 2010.
29. CDC. Bridged-race population estimates of the resident population of the United States as of April 1, 2000, by state and county, single year of age, bridged race, sex, and Hispanic origin [File br040100.zip]. Hyattsville, MD: CDC, National Center for Health Statistics; 2003. Available at http://www.cdc.gov/nchs/nvss/bridged_race/data_documentation.htm#april2000. Accessed November 10, 2010..
30. CDC. Bridged-race intercensal estimates of the July 1, 1990–July 1, 1999, resident population of the United States by state, single year of age, bridged race,sex,andHispanicorigin[Fileicen_stA1.zip].Hyattsville,MD:CDC,National Center for Health Statistics, National Center for Health Statistics; 2004.Available at http://www.cdc.gov/nchs/nvss/bridged_race/data_documentation.htm#april2000. Accessed November 10, 2010.
31. CDC. Bridged-race intercensal estimates of the July 1, 1990–July 1, 1999, resident population of the United States by state and county, single yearofage,bridgedrace,sex,andHispanicorigin[Fileicen_A1_3.zip].Hyattsville, MD: CDC, National Center for Health Statistics; 2004. Available at http://www.cdc.gov/nchs/nvss/bridged_race/data_documentation.htm#april2000. Accessed November 10, 2010.
32. CDC. Postcensal estimates of the resident population of the United States as of July 1, 2008, by year, state and county, age, bridged race, sex,andHispanicorigin(Vintage2008).[Filepcen_v2008_y08.sasbdat].Hyattsville, MD: CDC, National Center for Health Statistics; 2009. Available at http://www.cdc.gov/nchs/nvss/bridged_race/data_documentation.htm#vintage2008. Accessed May 26, 2011.
33. CDC. VitalStats—births, birth data files. Hyattsville, MD: CDC, National Center forHealth Statistics.Available at http://www.cdc.gov/nchs/data_access/vitalstats/VitalStats_Births.htm.AccessedMay26,2011.
34. US Food and Drug Administration. Orange book: approved drug products with therapeutic equivalence evaluations [Mifepristone]. Available at http://www.accessdata.fda.gov/scripts/cder/ob/docs/obdetail.cfm?Appl_No=020687&TABLE1=OB_Rx. AccessedSeptember 20, 2010.
35. CDC. Abortion surveillance, 1977. Atlanta, GA: US Department of Health, Education, and Welfare, Public Health Service, CDC; 1979.
36. Berg CJ, Callaghan WM, Syverson C, Henderson Z. Pregnancy-related mortality in the United States, 1998 to 2005. Obstet Gynecol;116:1302–9.
37. Cohen AL, Bhatnagar J, Reagan S, et al. Toxic shock associated with Clostridium sordellii and Clostridium perfringens after medical and spontaneous abortion. Obstet Gynecol 2007;110:1027–33.
38. Martin JA, Hamilton BE, Sutton PD, et al. Births: final data for 2006. Natl Vital Stat Rep 2009;57(7).
39. Martin JA, Hamilton BE, Sutton PD, et al. Births: final data for 2008. Natl Vital Stat Rep 2010;59(1).
40. CDC. Vital signs: teen pregnancy—United States, 1991–2009. MMWR 2011;60:414–20.
41. Ventura SJ, Hamilton BE. U.S. teenage birth rate resumes decline. Hyattsville, MD: US Department of Health and Human Services, CDC, National Center for Health Statistics; 2011. (NCHS data brief, no. 58).
42. Martin JA, Hamilton BE, Sutton PD, et al. Births: final data for 2007. Natl Vital Stat Rep 2010;58(24).
43. Martin JA, Hamilton BE, Ventura SJ, et al. Births: final data for 2009. Natl Vital Stat Rep 2011;60(1).
44. Finer LB, Henshaw SK. Disparities in rates of unintended pregnancy in the United States, 1994 and 2001. Perspect Sex Reprod Health 2006;38:90–6.
45. Finer LB, Zolna MR. Unintended pregnancy in the United States: incidence and disparities, 2006. Contraception 2011;84:478–85.
46. Bartlett LA, Berg CJ, Shulman HB, et al. Risk factors for legal induced abortion-related mortality in the United States. Obstet Gynecol 2004;103:729–37.
47. Buehler JW, Schulz KF, Grimes DA, Hogue CJ. The risk of serious complications from induced abortion: do personal characteristics make a difference? Am J Obstet Gynecol 1985;153:14–20.
48. Ferris LE, McMain-Klein M, Colodny N, Fellows GF, Lamont J. Factors associated with immediate abortion complications. CMAJ 1996;154:1677–85.
49. Drey EA, Foster DG, Jackson RA, Lee SJ, Cardenas LH, Darney PD. Risk factors associated with presenting for abortion in the second trimester. Obstet Gynecol 2006;107:128–35.
50. Finer LB, Frohwirth LF, Dauphinee LA, Singh S, Moore AM. Timing of steps and reasons for delays in obtaining abortions in the United States. Contraception 2006;74:334–44.
51. Foster DG, Jackson RA, Cosby K, Weitz TA, Darney PD, Drey EA. Predictors of delay in each step leading to an abortion. Contraception 2008;77:289–93.
52. Kiley JW, Yee LM, Niemi CM, Feinglass JM, Simon MA. Delays in request for pregnancy termination: comparison of patients in the first and second trimesters. Contraception 2010;81:446–51.
53. Boonstra HD. The heart of the matter: public funding of abortion for poor women in the United States. Guttmacher Policy Review 2007;10:12–6.
Surveillance Summaries
14 MMWR / November 25, 2011 / Vol. 60 / No. 15
54. US Census Bureau. Table POV01. Age and sex of all people, family members and unrelated individuals iterated by income-to-poverty ratio andrace,subtablesforallracesandblackalone;2008.Availableathttp://www.census.gov/hhes/www/cpstables/032009/pov/toc.htm. AccessedSeptember 21, 2011.
55. Dennis A, Henshaw SK, Joyce TJ, Finer LB, Blanchard K. The impact of laws requiring parental involvement for abortion: a literature review. New York,NY:GuttmacherInstitute;2009.Availableathttp://www.guttmacher.org/pubs/ParentalInvolvementLaws.pdf.AccessedSeptember20,2011.
56. Colman S, Joyce T. Minors’ behavioral responses to parental involvement laws: delaying abortion until age 18. Perspect Sex Reprod Health 2009;41:119–26.
57. Joyce T, Kaestner R, Colman S. Changes in abortions and births and the Texas parental notification law. N Engl J Med 2006;354:1031–8.
58. Creinin MD, Edwards J. Early abortion: surgical and medical options. Curr Probl Obstet Gynecol Fertil 1997;20:1–32.
59. Edwards J, Carson SA. New technologies permit safe abortion at less than six weeks’ gestation and provide timely detection of ectopic gestation. Am J Obstet Gynecol 1997;176:1101–6.
60. Fjerstad M, Stewart F. Pregnancy testing and management of early pregnancy. In: Hatcher RA, Trussell J, Nelson AL, Cates Jr. W, Stewart F, Kowal D, eds. Contraceptive technology. 19th ed, rev. New York, NY: Ardent Media; 2008:591–635.
61. Goldstein SR, Reeves MF. Clinical assessment and ultrasound in early pregnancy. In: Paul M, Lichtenberg ES, Borgatta L, Grimes DA, Stubblefield PG, Creinin MD, eds. Management of unintended and abnormal pregnancy: comprehensive abortion care. West Sussex, England: Blackwell; 2009:63–77.
62. Grimes DA. Management of abortion. In: Rock JA, Thompson JD, eds. Te Linde’s operative gynecology. Philadelphia, PA: Lippincott-Raven Publishers; 1997:477–99.
63. Mechstroth K, Paul M. First-trimester aspiration abortion. In: Paul M, Lichtenberg ES, Borgatta L, Grimes DA, Stubblefield PG, Creinin MD, eds. Management of unintended and abnormal pregnancy: comprehensive abortion care. West Sussex: Blackwell Publishing; 2009:135–56.
64. Finer LB, Wei J. Effect of mifepristone on abortion access in the United States. Obstet Gynecol 2009;114:623–30.
65. Guttmacher Institute. State data center, trend data, abortions by state of occurrence. NewYork,NY:GuttmacherInstitute;Availableathttp://www.guttmacher.org/datacenter/trend.jsp#.AccessedJune1,2011.
66. Pazol K. Abortion surveillance in the United States: future directions and challenges. Paper presented at the annual meeting of the National Association for Public Health Statistics and Information Systems. St. Louis,MO;2010.Available at http://www.naphsis.org/naphsis/files/ccLibraryFiles/Filename/000000001291/Pazol_Abortion%20Surveillance%206-9-10_03.ppt.AccessedSeptember20,2011.
67. Bachrach CA, Newcomer S. Intended pregnancies and unintended pregnancies: distinct categories or opposite ends of a continuum? Fam Plann Perspect 1999;31:251–2.
68. Bruckner H, Martin A, Bearman PS. Ambivalence and pregnancy: adolescents’ attitudes, contraceptive use and pregnancy. Perspect Sex Reprod Health 2004;36:248–57.
69. Dott M, Rasmussen SA, Hogue CJ, Reefhuis J. Association between pregnancy intention and reproductive-health related behaviors before and after pregnancy recognition, National Birth Defects Prevention Study, 1997–2002. Matern Child Health J 2010;14:373–81.
70. Klerman LV. The intendedness of pregnancy: a concept in transition. Matern Child Health J 2000;4:155–62.
71. Lifflander A, Gaydos LM, Hogue CJ. Circumstances of pregnancy: low income women in Georgia describe the difference between planned and unplanned pregnancies. Matern Child Health J 2007;11:81–9.
72. Sable MR, Wilkinson DS. Pregnancy intentions, pregnancy attitudes, and the use of prenatal care in Missouri. Matern Child Health J 1998;2:155–65.
73. Santelli J, Rochat R, Hatfield-Timajchy K, et al. The measurement and meaning of unintended pregnancy. Perspect Sex Reprod Health 2003;35:94–101.
74. Santelli JS, Lindberg LD, Orr MG, Finer LB, Speizer I. Toward a multidimensional measure of pregnancy intentions: evidence from the United States. Stud Fam Plann 2009;40:87–100.
75. Trussell J, Vaughan B, Stanford J. Are all contraceptive failures unintended pregnancies? Evidence from the 1995 National Survey of Family Growth. Fam Plann Perspect 1999;31:246–7, 60.
76. Ventura SJ, Abma JC, Mosher WD, Henshaw SK. Estimated pregnancy rates by outcome for the United States, 1990–2004. Natl Vital Stat Rep 2008 56(15).
77. Finer LB, Henshaw SK. Abortion incidence and services in the United States in 2000. Perspect Sex Reprod Health 2003;35:6–15.
78. Henshaw SK. Abortion incidence and services in the United States, 1995–1996. Fam Plann Perspect 1998;30:263–70, 87.
79. Jones RK, Zolna MR, Henshaw SK, Finer LB. Abortion in the United States: incidence and access to services, 2005. Perspect Sex Reprod Health 2008;40:6–16.
80. Joyce TJ, Henshaw SK, Dennis A, Finer LB, Blanchard K. The impact of state mandatory counseling and waiting period laws on abortion: a literature review. New York, NY: Guttmacher Institute; 2009. Available at http://www.guttmacher.org/pubs/MandatoryCounseling.pdf.Accessed September 20, 2011.
81. Martinez GM, Chandra A, Abma JC, Jones J, Mosher WD. Fertility, contraception, and fatherhood: data on men and women from Cycle 6 (2002) of the National Survey of Family Growth. Vital Health Stat 2006;23(26).
82. Ventura SJ. Changing patterns of nonmarital childbearing in the United States. Hyattsville, MD: US Department of Health and Human Services, CDC, National Center for Health Statistics; 2009. (NCHS data brief, no. 18).
83. Yang Z, Gaydos LM. Reasons for and challenges of recent increases in teen birth rates: a study of family planning service policies and demographic changes at the state level. J Adolesc Health 2010;46:517–24.
84. Moore KA. Teen births: examining the recent increase. Washington DC: The National Campaign to Prevent Teen and Unplanned Pregnancy; 2008.Availableathttp://www.thenationalcampaign.org/resources/pdf/teenbirths_examincrease.pdf.AccessedSeptember20,2011.
85. American College of Obstetricians and Gynecologists. Bad economy blamed for women delaying pregnancy and annual check-up. Washington, DC: American College of Obstetricians and Gynecologists; 2009. Available at http://www.acog.org/from_home/publications/press_releases/nr05-05-09-1.cfm;2009.AccessedSeptember20,2011.
86. Guttmacher Institute. A real-time look at the impact of the recession on women’s family planning and pregnancy decisions. New York, NY: GuttmacherInstitute;2009.Availableathttp://www.guttmacher.org/pubs/RecessionFP.pdf2009.AccessedSeptember20,2011.
87. Henshaw SK. Unintended pregnancy in the United States. Fam Plann Perspect 1998;30:24–9, 46.
88. Mosher WD, Martinez GM, Chandra A, Abma JC, Willson SJ. Use of contraception and use of family planning services in the United States: 1982–2002. Adv Data 2004;350:1–36.
89. Piccinino LJ, Mosher WD. Trends in contraceptive use in the United States: 1982–1995. Fam Plann Perspect 1998;30:4–10, 46.
90. Mosher WD, Jones J. Use of contraception in the United States: 1982–2008. Vital Health Stats 2010; 3(29).
91. Institute of Medicine. Clinical preventive services for women: closing the gaps. Washington, DC: The National Academies Press; 2011.
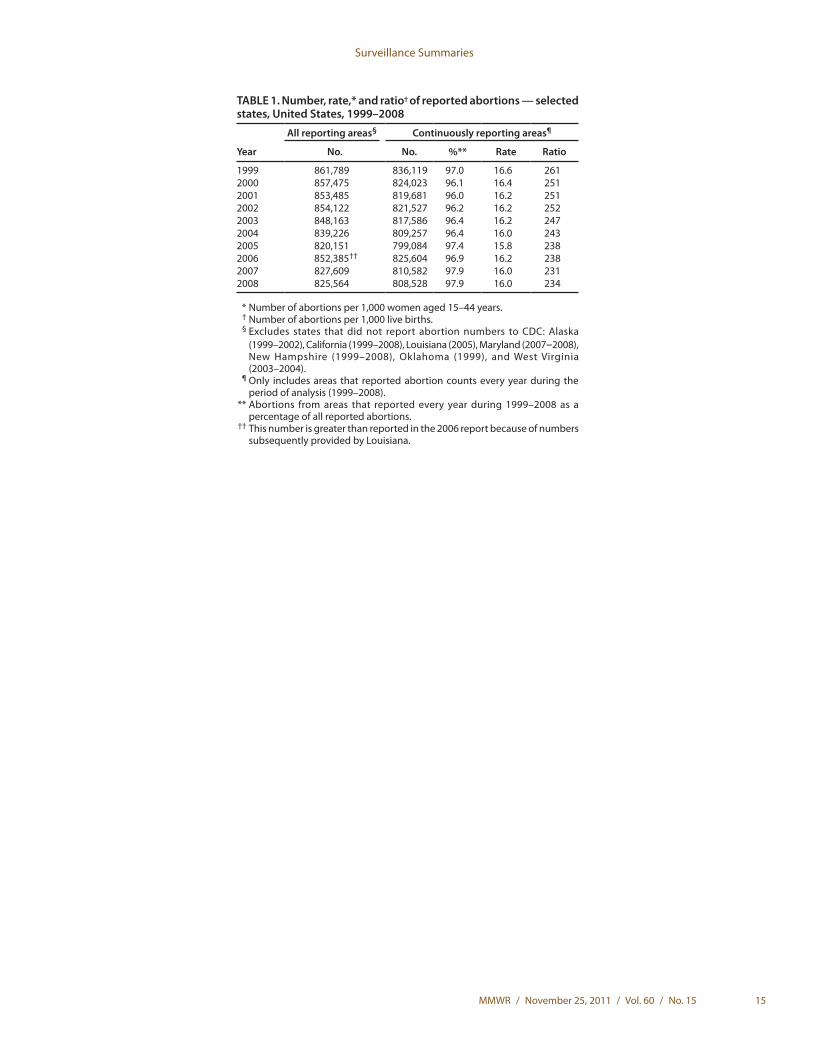
Surveillance Summaries
MMWR / November 25, 2011 / Vol. 60 / No. 15 15
TABLE 1. Number, rate,* and ratio† of reported abortions — selected states, United States, 1999–2008
Year
All reporting areas§ Continuously reporting areas¶
No. No. %** Rate Ratio
1999 861,789 836,119 97.0 16.6 2612000 857,475 824,023 96.1 16.4 2512001 853,485 819,681 96.0 16.2 2512002 854,122 821,527 96.2 16.2 2522003 848,163 817,586 96.4 16.2 2472004 839,226 809,257 96.4 16.0 2432005 820,151 799,084 97.4 15.8 2382006 852,385†† 825,604 96.9 16.2 2382007 827,609 810,582 97.9 16.0 2312008 825,564 808,528 97.9 16.0 234
* Number of abortions per 1,000 women aged 15–44 years. † Number of abortions per 1,000 live births. § Excludes states that did not report abortion numbers to CDC: Alaska
(1999–2002), California (1999–2008), Louisiana (2005), Maryland (2007–2008), New Hampshire (1999–2008), Oklahoma (1999), and West Virginia (2003–2004).
¶ Only includes areas that reported abortion counts every year during the period of analysis (1999–2008).
** Abortions from areas that reported every year during 1999–2008 as a percentage of all reported abortions.
†† This number is greater than reported in the 2006 report because of numbers subsequently provided by Louisiana.
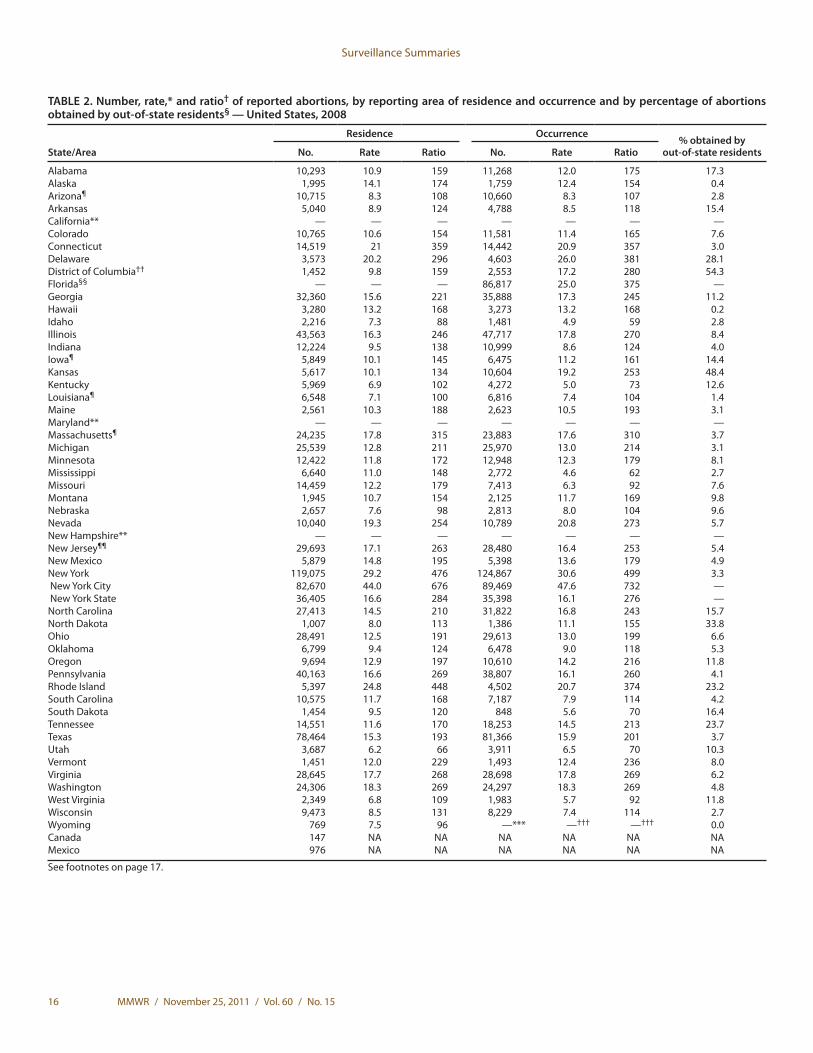
Surveillance Summaries
16 MMWR / November 25, 2011 / Vol. 60 / No. 15
See footnotes on page 17.
TABLE 2. Number, rate,* and ratio† of reported abortions, by reporting area of residence and occurrence and by percentage of abortions obtained by out-of-state residents§ — United States, 2008
State/Area
Residence Occurrence% obtained by
out-of-state residentsNo. Rate Ratio No. Rate Ratio
Alabama 10,293 10.9 159 11,268 12.0 175 17.3Alaska 1,995 14.1 174 1,759 12.4 154 0.4Arizona¶ 10,715 8.3 108 10,660 8.3 107 2.8Arkansas 5,040 8.9 124 4,788 8.5 118 15.4California** — — — — — — —Colorado 10,765 10.6 154 11,581 11.4 165 7.6Connecticut 14,519 21 359 14,442 20.9 357 3.0Delaware 3,573 20.2 296 4,603 26.0 381 28.1District of Columbia†† 1,452 9.8 159 2,553 17.2 280 54.3Florida§§ — — — 86,817 25.0 375 —Georgia 32,360 15.6 221 35,888 17.3 245 11.2Hawaii 3,280 13.2 168 3,273 13.2 168 0.2Idaho 2,216 7.3 88 1,481 4.9 59 2.8Illinois 43,563 16.3 246 47,717 17.8 270 8.4Indiana 12,224 9.5 138 10,999 8.6 124 4.0Iowa¶ 5,849 10.1 145 6,475 11.2 161 14.4Kansas 5,617 10.1 134 10,604 19.2 253 48.4Kentucky 5,969 6.9 102 4,272 5.0 73 12.6Louisiana¶ 6,548 7.1 100 6,816 7.4 104 1.4Maine 2,561 10.3 188 2,623 10.5 193 3.1Maryland** — — — — — — —Massachusetts¶ 24,235 17.8 315 23,883 17.6 310 3.7Michigan 25,539 12.8 211 25,970 13.0 214 3.1Minnesota 12,422 11.8 172 12,948 12.3 179 8.1Mississippi 6,640 11.0 148 2,772 4.6 62 2.7Missouri 14,459 12.2 179 7,413 6.3 92 7.6Montana 1,945 10.7 154 2,125 11.7 169 9.8Nebraska 2,657 7.6 98 2,813 8.0 104 9.6Nevada 10,040 19.3 254 10,789 20.8 273 5.7New Hampshire** — — — — — — —New Jersey¶¶ 29,693 17.1 263 28,480 16.4 253 5.4New Mexico 5,879 14.8 195 5,398 13.6 179 4.9New York 119,075 29.2 476 124,867 30.6 499 3.3 New York City 82,670 44.0 676 89,469 47.6 732 — New York State 36,405 16.6 284 35,398 16.1 276 —North Carolina 27,413 14.5 210 31,822 16.8 243 15.7North Dakota 1,007 8.0 113 1,386 11.1 155 33.8Ohio 28,491 12.5 191 29,613 13.0 199 6.6Oklahoma 6,799 9.4 124 6,478 9.0 118 5.3Oregon 9,694 12.9 197 10,610 14.2 216 11.8Pennsylvania 40,163 16.6 269 38,807 16.1 260 4.1Rhode Island 5,397 24.8 448 4,502 20.7 374 23.2South Carolina 10,575 11.7 168 7,187 7.9 114 4.2South Dakota 1,454 9.5 120 848 5.6 70 16.4Tennessee 14,551 11.6 170 18,253 14.5 213 23.7Texas 78,464 15.3 193 81,366 15.9 201 3.7Utah 3,687 6.2 66 3,911 6.5 70 10.3Vermont 1,451 12.0 229 1,493 12.4 236 8.0Virginia 28,645 17.7 268 28,698 17.8 269 6.2Washington 24,306 18.3 269 24,297 18.3 269 4.8West Virginia 2,349 6.8 109 1,983 5.7 92 11.8Wisconsin 9,473 8.5 131 8,229 7.4 114 2.7Wyoming 769 7.5 96 —*** —††† —††† 0.0Canada 147 NA NA NA NA NA NAMexico 976 NA NA NA NA NA NA
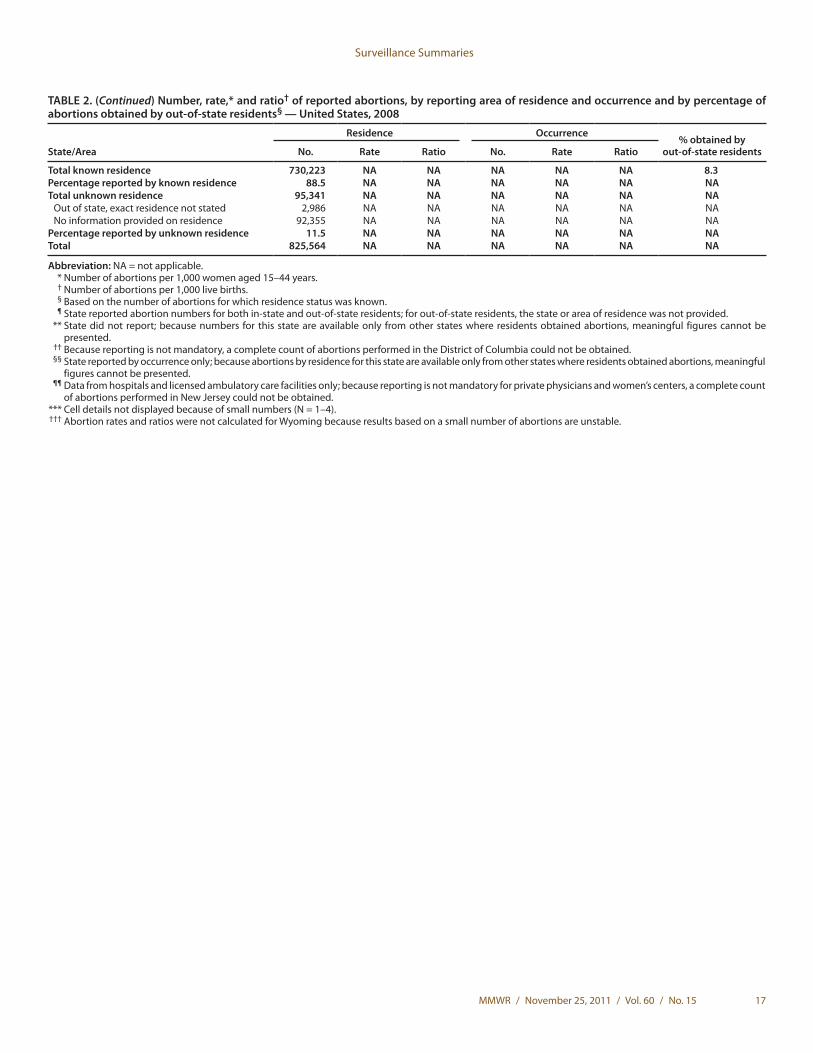
Surveillance Summaries
MMWR / November 25, 2011 / Vol. 60 / No. 15 17
TABLE 2. (Continued) Number, rate,* and ratio† of reported abortions, by reporting area of residence and occurrence and by percentage of abortions obtained by out-of-state residents§ — United States, 2008
State/Area
Residence Occurrence% obtained by
out-of-state residentsNo. Rate Ratio No. Rate Ratio
Total known residence 730,223 NA NA NA NA NA 8.3Percentage reported by known residence 88.5 NA NA NA NA NA NATotal unknown residence 95,341 NA NA NA NA NA NA
Out of state, exact residence not stated 2,986 NA NA NA NA NA NANo information provided on residence 92,355 NA NA NA NA NA NA
Percentage reported by unknown residence 11.5 NA NA NA NA NA NATotal 825,564 NA NA NA NA NA NA
Abbreviation: NA = not applicable. * Number of abortions per 1,000 women aged 15–44 years. † Number of abortions per 1,000 live births. § Based on the number of abortions for which residence status was known. ¶ State reported abortion numbers for both in-state and out-of-state residents; for out-of-state residents, the state or area of residence was not provided. ** State did not report; because numbers for this state are available only from other states where residents obtained abortions, meaningful figures cannot be
presented. †† Because reporting is not mandatory, a complete count of abortions performed in the District of Columbia could not be obtained. §§ State reported by occurrence only; because abortions by residence for this state are available only from other states where residents obtained abortions, meaningful
figures cannot be presented. ¶¶ Data from hospitals and licensed ambulatory care facilities only; because reporting is not mandatory for private physicians and women’s centers, a complete count
of abortions performed in New Jersey could not be obtained. *** Cell details not displayed because of small numbers (N = 1–4). ††† Abortion rates and ratios were not calculated for Wyoming because results based on a small number of abortions are unstable.
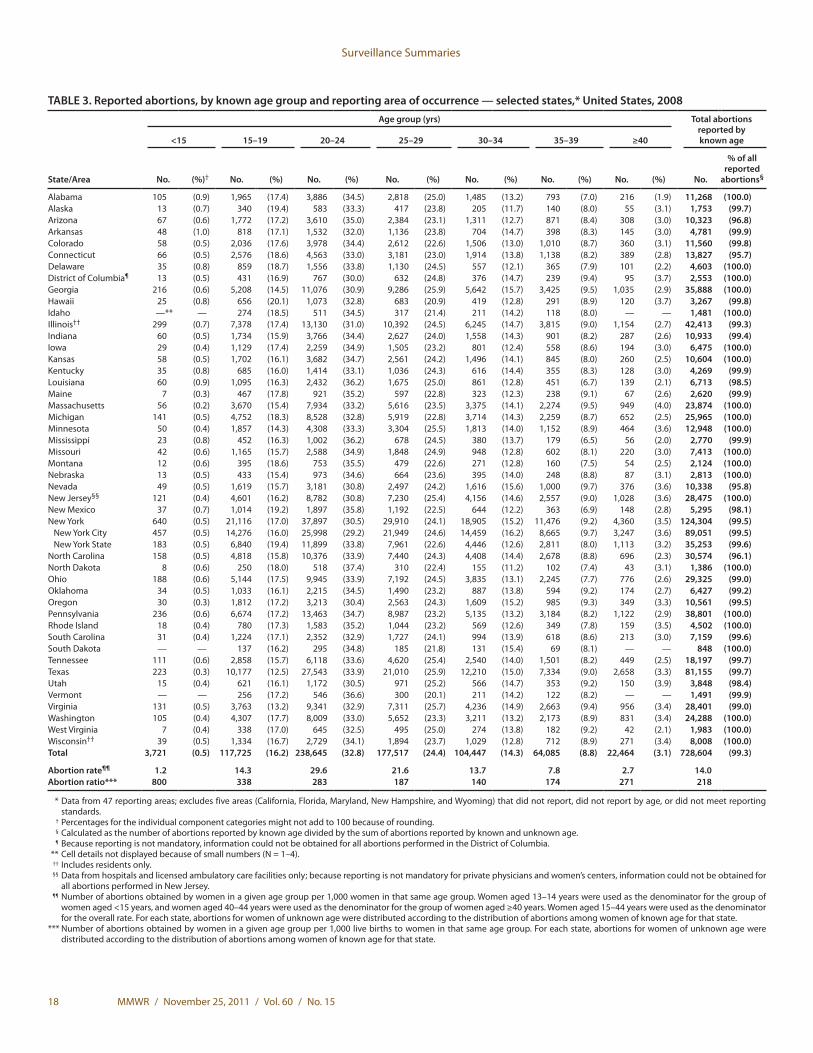
Surveillance Summaries
18 MMWR / November 25, 2011 / Vol. 60 / No. 15
TABLE 3. Reported abortions, by known age group and reporting area of occurrence — selected states,* United States, 2008
State/Area
Age group (yrs) Total abortions reported by known age<15 15–19 20–24 25–29 30–34 35–39 ≥40
No. (%)† No. (%) No. (%) No. (%) No. (%) No. (%) No. (%) No.
% of all reported
abortions§
Alabama 105 (0.9) 1,965 (17.4) 3,886 (34.5) 2,818 (25.0) 1,485 (13.2) 793 (7.0) 216 (1.9) 11,268 (100.0)Alaska 13 (0.7) 340 (19.4) 583 (33.3) 417 (23.8) 205 (11.7) 140 (8.0) 55 (3.1) 1,753 (99.7)Arizona 67 (0.6) 1,772 (17.2) 3,610 (35.0) 2,384 (23.1) 1,311 (12.7) 871 (8.4) 308 (3.0) 10,323 (96.8)Arkansas 48 (1.0) 818 (17.1) 1,532 (32.0) 1,136 (23.8) 704 (14.7) 398 (8.3) 145 (3.0) 4,781 (99.9)Colorado 58 (0.5) 2,036 (17.6) 3,978 (34.4) 2,612 (22.6) 1,506 (13.0) 1,010 (8.7) 360 (3.1) 11,560 (99.8)Connecticut 66 (0.5) 2,576 (18.6) 4,563 (33.0) 3,181 (23.0) 1,914 (13.8) 1,138 (8.2) 389 (2.8) 13,827 (95.7)Delaware 35 (0.8) 859 (18.7) 1,556 (33.8) 1,130 (24.5) 557 (12.1) 365 (7.9) 101 (2.2) 4,603 (100.0)District of Columbia¶ 13 (0.5) 431 (16.9) 767 (30.0) 632 (24.8) 376 (14.7) 239 (9.4) 95 (3.7) 2,553 (100.0)Georgia 216 (0.6) 5,208 (14.5) 11,076 (30.9) 9,286 (25.9) 5,642 (15.7) 3,425 (9.5) 1,035 (2.9) 35,888 (100.0)Hawaii 25 (0.8) 656 (20.1) 1,073 (32.8) 683 (20.9) 419 (12.8) 291 (8.9) 120 (3.7) 3,267 (99.8)Idaho —** — 274 (18.5) 511 (34.5) 317 (21.4) 211 (14.2) 118 (8.0) — — 1,481 (100.0)Illinois†† 299 (0.7) 7,378 (17.4) 13,130 (31.0) 10,392 (24.5) 6,245 (14.7) 3,815 (9.0) 1,154 (2.7) 42,413 (99.3)Indiana 60 (0.5) 1,734 (15.9) 3,766 (34.4) 2,627 (24.0) 1,558 (14.3) 901 (8.2) 287 (2.6) 10,933 (99.4)Iowa 29 (0.4) 1,129 (17.4) 2,259 (34.9) 1,505 (23.2) 801 (12.4) 558 (8.6) 194 (3.0) 6,475 (100.0)Kansas 58 (0.5) 1,702 (16.1) 3,682 (34.7) 2,561 (24.2) 1,496 (14.1) 845 (8.0) 260 (2.5) 10,604 (100.0)Kentucky 35 (0.8) 685 (16.0) 1,414 (33.1) 1,036 (24.3) 616 (14.4) 355 (8.3) 128 (3.0) 4,269 (99.9)Louisiana 60 (0.9) 1,095 (16.3) 2,432 (36.2) 1,675 (25.0) 861 (12.8) 451 (6.7) 139 (2.1) 6,713 (98.5)Maine 7 (0.3) 467 (17.8) 921 (35.2) 597 (22.8) 323 (12.3) 238 (9.1) 67 (2.6) 2,620 (99.9)Massachusetts 56 (0.2) 3,670 (15.4) 7,934 (33.2) 5,616 (23.5) 3,375 (14.1) 2,274 (9.5) 949 (4.0) 23,874 (100.0)Michigan 141 (0.5) 4,752 (18.3) 8,528 (32.8) 5,919 (22.8) 3,714 (14.3) 2,259 (8.7) 652 (2.5) 25,965 (100.0)Minnesota 50 (0.4) 1,857 (14.3) 4,308 (33.3) 3,304 (25.5) 1,813 (14.0) 1,152 (8.9) 464 (3.6) 12,948 (100.0)Mississippi 23 (0.8) 452 (16.3) 1,002 (36.2) 678 (24.5) 380 (13.7) 179 (6.5) 56 (2.0) 2,770 (99.9)Missouri 42 (0.6) 1,165 (15.7) 2,588 (34.9) 1,848 (24.9) 948 (12.8) 602 (8.1) 220 (3.0) 7,413 (100.0)Montana 12 (0.6) 395 (18.6) 753 (35.5) 479 (22.6) 271 (12.8) 160 (7.5) 54 (2.5) 2,124 (100.0)Nebraska 13 (0.5) 433 (15.4) 973 (34.6) 664 (23.6) 395 (14.0) 248 (8.8) 87 (3.1) 2,813 (100.0)Nevada 49 (0.5) 1,619 (15.7) 3,181 (30.8) 2,497 (24.2) 1,616 (15.6) 1,000 (9.7) 376 (3.6) 10,338 (95.8)New Jersey§§ 121 (0.4) 4,601 (16.2) 8,782 (30.8) 7,230 (25.4) 4,156 (14.6) 2,557 (9.0) 1,028 (3.6) 28,475 (100.0)New Mexico 37 (0.7) 1,014 (19.2) 1,897 (35.8) 1,192 (22.5) 644 (12.2) 363 (6.9) 148 (2.8) 5,295 (98.1)New York 640 (0.5) 21,116 (17.0) 37,897 (30.5) 29,910 (24.1) 18,905 (15.2) 11,476 (9.2) 4,360 (3.5) 124,304 (99.5)
New York City 457 (0.5) 14,276 (16.0) 25,998 (29.2) 21,949 (24.6) 14,459 (16.2) 8,665 (9.7) 3,247 (3.6) 89,051 (99.5)New York State 183 (0.5) 6,840 (19.4) 11,899 (33.8) 7,961 (22.6) 4,446 (12.6) 2,811 (8.0) 1,113 (3.2) 35,253 (99.6)
North Carolina 158 (0.5) 4,818 (15.8) 10,376 (33.9) 7,440 (24.3) 4,408 (14.4) 2,678 (8.8) 696 (2.3) 30,574 (96.1)North Dakota 8 (0.6) 250 (18.0) 518 (37.4) 310 (22.4) 155 (11.2) 102 (7.4) 43 (3.1) 1,386 (100.0)Ohio 188 (0.6) 5,144 (17.5) 9,945 (33.9) 7,192 (24.5) 3,835 (13.1) 2,245 (7.7) 776 (2.6) 29,325 (99.0)Oklahoma 34 (0.5) 1,033 (16.1) 2,215 (34.5) 1,490 (23.2) 887 (13.8) 594 (9.2) 174 (2.7) 6,427 (99.2)Oregon 30 (0.3) 1,812 (17.2) 3,213 (30.4) 2,563 (24.3) 1,609 (15.2) 985 (9.3) 349 (3.3) 10,561 (99.5)Pennsylvania 236 (0.6) 6,674 (17.2) 13,463 (34.7) 8,987 (23.2) 5,135 (13.2) 3,184 (8.2) 1,122 (2.9) 38,801 (100.0)Rhode Island 18 (0.4) 780 (17.3) 1,583 (35.2) 1,044 (23.2) 569 (12.6) 349 (7.8) 159 (3.5) 4,502 (100.0)South Carolina 31 (0.4) 1,224 (17.1) 2,352 (32.9) 1,727 (24.1) 994 (13.9) 618 (8.6) 213 (3.0) 7,159 (99.6)South Dakota — — 137 (16.2) 295 (34.8) 185 (21.8) 131 (15.4) 69 (8.1) — — 848 (100.0)Tennessee 111 (0.6) 2,858 (15.7) 6,118 (33.6) 4,620 (25.4) 2,540 (14.0) 1,501 (8.2) 449 (2.5) 18,197 (99.7)Texas 223 (0.3) 10,177 (12.5) 27,543 (33.9) 21,010 (25.9) 12,210 (15.0) 7,334 (9.0) 2,658 (3.3) 81,155 (99.7)Utah 15 (0.4) 621 (16.1) 1,172 (30.5) 971 (25.2) 566 (14.7) 353 (9.2) 150 (3.9) 3,848 (98.4)Vermont — — 256 (17.2) 546 (36.6) 300 (20.1) 211 (14.2) 122 (8.2) — — 1,491 (99.9)Virginia 131 (0.5) 3,763 (13.2) 9,341 (32.9) 7,311 (25.7) 4,236 (14.9) 2,663 (9.4) 956 (3.4) 28,401 (99.0)Washington 105 (0.4) 4,307 (17.7) 8,009 (33.0) 5,652 (23.3) 3,211 (13.2) 2,173 (8.9) 831 (3.4) 24,288 (100.0)West Virginia 7 (0.4) 338 (17.0) 645 (32.5) 495 (25.0) 274 (13.8) 182 (9.2) 42 (2.1) 1,983 (100.0)Wisconsin†† 39 (0.5) 1,334 (16.7) 2,729 (34.1) 1,894 (23.7) 1,029 (12.8) 712 (8.9) 271 (3.4) 8,008 (100.0)Total 3,721 (0.5) 117,725 (16.2) 238,645 (32.8) 177,517 (24.4) 104,447 (14.3) 64,085 (8.8) 22,464 (3.1) 728,604 (99.3)
Abortion rate¶¶ 1.2 14.3 29.6 21.6 13.7 7.8 2.7 14.0Abortion ratio*** 800 338 283 187 140 174 271 218
* Data from 47 reporting areas; excludes five areas (California, Florida, Maryland, New Hampshire, and Wyoming) that did not report, did not report by age, or did not meet reporting standards.
† Percentages for the individual component categories might not add to 100 because of rounding. § Calculated as the number of abortions reported by known age divided by the sum of abortions reported by known and unknown age. ¶ Because reporting is not mandatory, information could not be obtained for all abortions performed in the District of Columbia. ** Cell details not displayed because of small numbers (N = 1–4). †† Includes residents only. §§ Data from hospitals and licensed ambulatory care facilities only; because reporting is not mandatory for private physicians and women’s centers, information could not be obtained for
all abortions performed in New Jersey. ¶¶ Number of abortions obtained by women in a given age group per 1,000 women in that same age group. Women aged 13–14 years were used as the denominator for the group of
women aged <15 years, and women aged 40–44 years were used as the denominator for the group of women aged ≥40 years. Women aged 15–44 years were used as the denominator for the overall rate. For each state, abortions for women of unknown age were distributed according to the distribution of abortions among women of known age for that state.
*** Number of abortions obtained by women in a given age group per 1,000 live births to women in that same age group. For each state, abortions for women of unknown age were distributed according to the distribution of abortions among women of known age for that state.
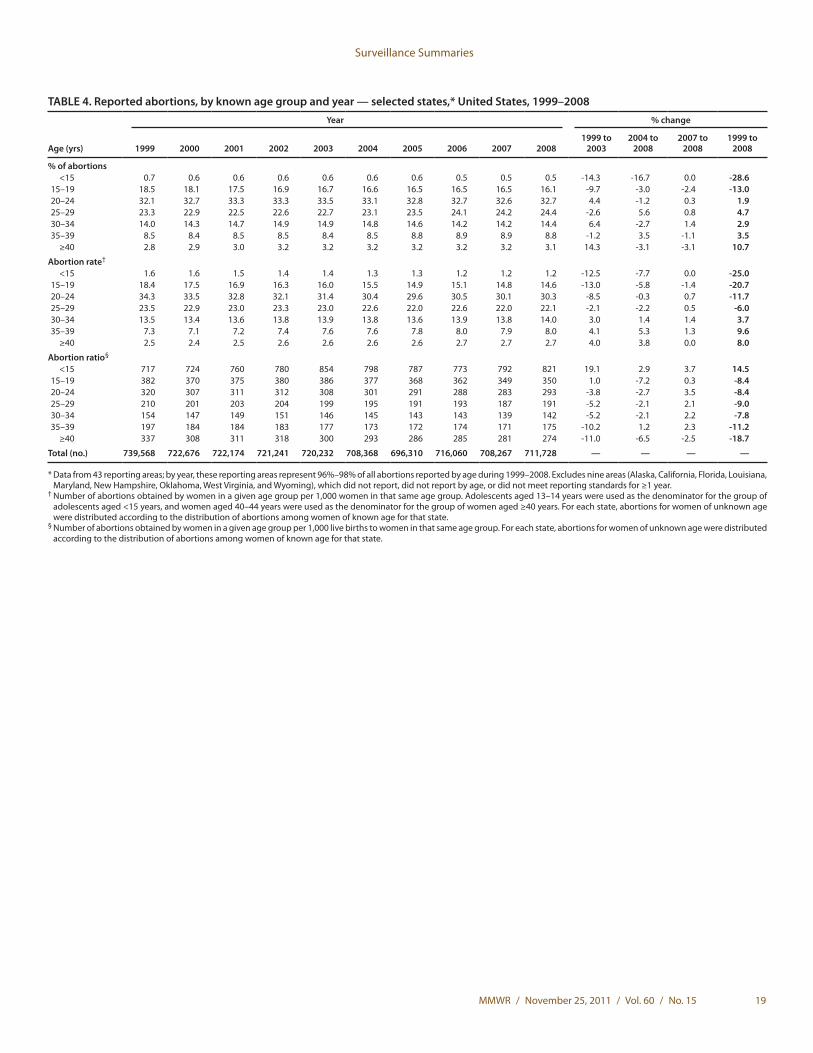
Surveillance Summaries
MMWR / November 25, 2011 / Vol. 60 / No. 15 19
TABLE 4. Reported abortions, by known age group and year — selected states,* United States, 1999–2008Year % change
Age (yrs) 1999 2000 2001 2002 2003 2004 2005 2006 2007 20081999 to
20032004 to
20082007 to
20081999 to
2008
% of abortions <15 0.7 0.6 0.6 0.6 0.6 0.6 0.6 0.5 0.5 0.5 -14.3 -16.7 0.0 -28.6 15–19 18.5 18.1 17.5 16.9 16.7 16.6 16.5 16.5 16.5 16.1 -9.7 -3.0 -2.4 -13.0 20–24 32.1 32.7 33.3 33.3 33.5 33.1 32.8 32.7 32.6 32.7 4.4 -1.2 0.3 1.9 25–29 23.3 22.9 22.5 22.6 22.7 23.1 23.5 24.1 24.2 24.4 -2.6 5.6 0.8 4.7 30–34 14.0 14.3 14.7 14.9 14.9 14.8 14.6 14.2 14.2 14.4 6.4 -2.7 1.4 2.9 35–39 8.5 8.4 8.5 8.5 8.4 8.5 8.8 8.9 8.9 8.8 -1.2 3.5 -1.1 3.5 ≥40 2.8 2.9 3.0 3.2 3.2 3.2 3.2 3.2 3.2 3.1 14.3 -3.1 -3.1 10.7
Abortion rate†
<15 1.6 1.6 1.5 1.4 1.4 1.3 1.3 1.2 1.2 1.2 -12.5 -7.7 0.0 -25.0 15–19 18.4 17.5 16.9 16.3 16.0 15.5 14.9 15.1 14.8 14.6 -13.0 -5.8 -1.4 -20.7 20–24 34.3 33.5 32.8 32.1 31.4 30.4 29.6 30.5 30.1 30.3 -8.5 -0.3 0.7 -11.7 25–29 23.5 22.9 23.0 23.3 23.0 22.6 22.0 22.6 22.0 22.1 -2.1 -2.2 0.5 -6.0 30–34 13.5 13.4 13.6 13.8 13.9 13.8 13.6 13.9 13.8 14.0 3.0 1.4 1.4 3.7 35–39 7.3 7.1 7.2 7.4 7.6 7.6 7.8 8.0 7.9 8.0 4.1 5.3 1.3 9.6 ≥40 2.5 2.4 2.5 2.6 2.6 2.6 2.6 2.7 2.7 2.7 4.0 3.8 0.0 8.0
Abortion ratio§
<15 717 724 760 780 854 798 787 773 792 821 19.1 2.9 3.7 14.5 15–19 382 370 375 380 386 377 368 362 349 350 1.0 -7.2 0.3 -8.4 20–24 320 307 311 312 308 301 291 288 283 293 -3.8 -2.7 3.5 -8.4 25–29 210 201 203 204 199 195 191 193 187 191 -5.2 -2.1 2.1 -9.0 30–34 154 147 149 151 146 145 143 143 139 142 -5.2 -2.1 2.2 -7.8 35–39 197 184 184 183 177 173 172 174 171 175 -10.2 1.2 2.3 -11.2 ≥40 337 308 311 318 300 293 286 285 281 274 -11.0 -6.5 -2.5 -18.7
Total (no.) 739,568 722,676 722,174 721,241 720,232 708,368 696,310 716,060 708,267 711,728 — — — —
* Data from 43 reporting areas; by year, these reporting areas represent 96%–98% of all abortions reported by age during 1999–2008. Excludes nine areas (Alaska, California, Florida, Louisiana, Maryland, New Hampshire, Oklahoma, West Virginia, and Wyoming), which did not report, did not report by age, or did not meet reporting standards for ≥1 year.
† Number of abortions obtained by women in a given age group per 1,000 women in that same age group. Adolescents aged 13–14 years were used as the denominator for the group of adolescents aged <15 years, and women aged 40–44 years were used as the denominator for the group of women aged ≥40 years. For each state, abortions for women of unknown age were distributed according to the distribution of abortions among women of known age for that state.
§ Number of abortions obtained by women in a given age group per 1,000 live births to women in that same age group. For each state, abortions for women of unknown age were distributed according to the distribution of abortions among women of known age for that state.
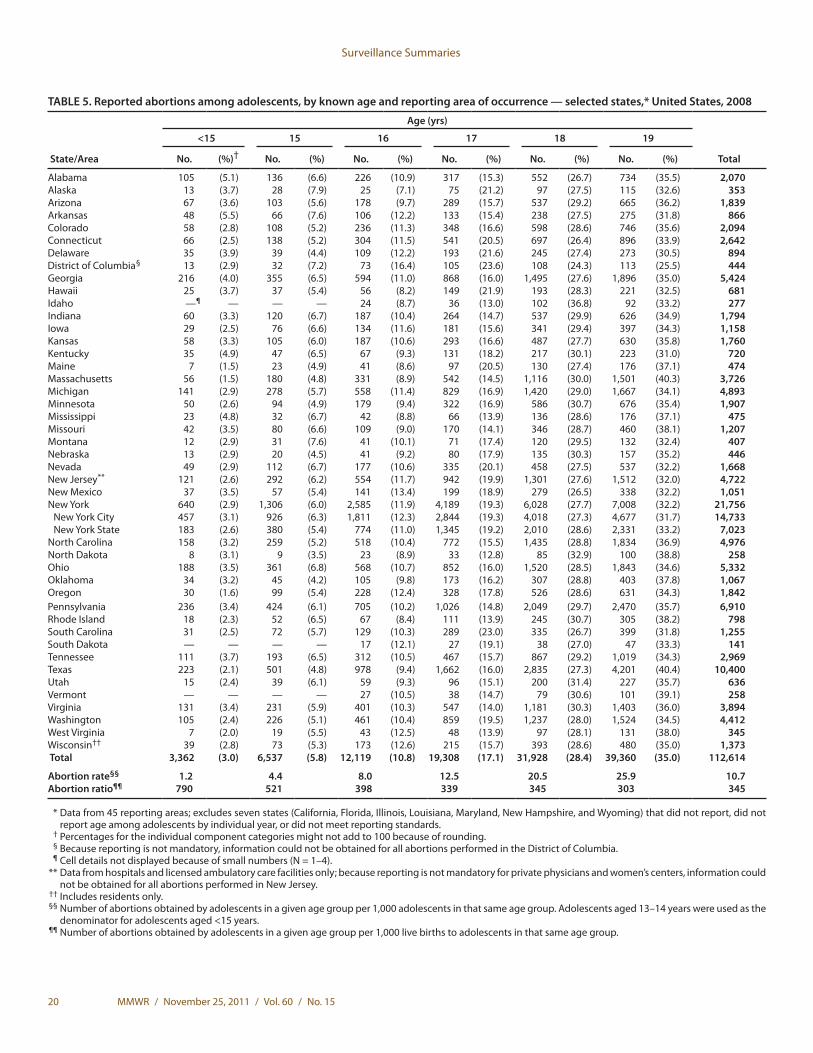
Surveillance Summaries
20 MMWR / November 25, 2011 / Vol. 60 / No. 15
TABLE 5. Reported abortions among adolescents, by known age and reporting area of occurrence — selected states,* United States, 2008
State/Area
Age (yrs)
Total
<15 15 16 17 18 19
No. (%)† No. (%) No. (%) No. (%) No. (%) No. (%)
Alabama 105 (5.1) 136 (6.6) 226 (10.9) 317 (15.3) 552 (26.7) 734 (35.5) 2,070 Alaska 13 (3.7) 28 (7.9) 25 (7.1) 75 (21.2) 97 (27.5) 115 (32.6) 353 Arizona 67 (3.6) 103 (5.6) 178 (9.7) 289 (15.7) 537 (29.2) 665 (36.2) 1,839 Arkansas 48 (5.5) 66 (7.6) 106 (12.2) 133 (15.4) 238 (27.5) 275 (31.8) 866 Colorado 58 (2.8) 108 (5.2) 236 (11.3) 348 (16.6) 598 (28.6) 746 (35.6) 2,094 Connecticut 66 (2.5) 138 (5.2) 304 (11.5) 541 (20.5) 697 (26.4) 896 (33.9) 2,642 Delaware 35 (3.9) 39 (4.4) 109 (12.2) 193 (21.6) 245 (27.4) 273 (30.5) 894 District of Columbia§ 13 (2.9) 32 (7.2) 73 (16.4) 105 (23.6) 108 (24.3) 113 (25.5) 444 Georgia 216 (4.0) 355 (6.5) 594 (11.0) 868 (16.0) 1,495 (27.6) 1,896 (35.0) 5,424 Hawaii 25 (3.7) 37 (5.4) 56 (8.2) 149 (21.9) 193 (28.3) 221 (32.5) 681 Idaho —¶ — — — 24 (8.7) 36 (13.0) 102 (36.8) 92 (33.2) 277 Indiana 60 (3.3) 120 (6.7) 187 (10.4) 264 (14.7) 537 (29.9) 626 (34.9) 1,794 Iowa 29 (2.5) 76 (6.6) 134 (11.6) 181 (15.6) 341 (29.4) 397 (34.3) 1,158 Kansas 58 (3.3) 105 (6.0) 187 (10.6) 293 (16.6) 487 (27.7) 630 (35.8) 1,760 Kentucky 35 (4.9) 47 (6.5) 67 (9.3) 131 (18.2) 217 (30.1) 223 (31.0) 720 Maine 7 (1.5) 23 (4.9) 41 (8.6) 97 (20.5) 130 (27.4) 176 (37.1) 474 Massachusetts 56 (1.5) 180 (4.8) 331 (8.9) 542 (14.5) 1,116 (30.0) 1,501 (40.3) 3,726 Michigan 141 (2.9) 278 (5.7) 558 (11.4) 829 (16.9) 1,420 (29.0) 1,667 (34.1) 4,893 Minnesota 50 (2.6) 94 (4.9) 179 (9.4) 322 (16.9) 586 (30.7) 676 (35.4) 1,907 Mississippi 23 (4.8) 32 (6.7) 42 (8.8) 66 (13.9) 136 (28.6) 176 (37.1) 475 Missouri 42 (3.5) 80 (6.6) 109 (9.0) 170 (14.1) 346 (28.7) 460 (38.1) 1,207 Montana 12 (2.9) 31 (7.6) 41 (10.1) 71 (17.4) 120 (29.5) 132 (32.4) 407 Nebraska 13 (2.9) 20 (4.5) 41 (9.2) 80 (17.9) 135 (30.3) 157 (35.2) 446 Nevada 49 (2.9) 112 (6.7) 177 (10.6) 335 (20.1) 458 (27.5) 537 (32.2) 1,668 New Jersey** 121 (2.6) 292 (6.2) 554 (11.7) 942 (19.9) 1,301 (27.6) 1,512 (32.0) 4,722 New Mexico 37 (3.5) 57 (5.4) 141 (13.4) 199 (18.9) 279 (26.5) 338 (32.2) 1,051 New York 640 (2.9) 1,306 (6.0) 2,585 (11.9) 4,189 (19.3) 6,028 (27.7) 7,008 (32.2) 21,756
New York City 457 (3.1) 926 (6.3) 1,811 (12.3) 2,844 (19.3) 4,018 (27.3) 4,677 (31.7) 14,733 New York State 183 (2.6) 380 (5.4) 774 (11.0) 1,345 (19.2) 2,010 (28.6) 2,331 (33.2) 7,023
North Carolina 158 (3.2) 259 (5.2) 518 (10.4) 772 (15.5) 1,435 (28.8) 1,834 (36.9) 4,976 North Dakota 8 (3.1) 9 (3.5) 23 (8.9) 33 (12.8) 85 (32.9) 100 (38.8) 258 Ohio 188 (3.5) 361 (6.8) 568 (10.7) 852 (16.0) 1,520 (28.5) 1,843 (34.6) 5,332 Oklahoma 34 (3.2) 45 (4.2) 105 (9.8) 173 (16.2) 307 (28.8) 403 (37.8) 1,067 Oregon 30 (1.6) 99 (5.4) 228 (12.4) 328 (17.8) 526 (28.6) 631 (34.3) 1,842 Pennsylvania 236 (3.4) 424 (6.1) 705 (10.2) 1,026 (14.8) 2,049 (29.7) 2,470 (35.7) 6,910 Rhode Island 18 (2.3) 52 (6.5) 67 (8.4) 111 (13.9) 245 (30.7) 305 (38.2) 798 South Carolina 31 (2.5) 72 (5.7) 129 (10.3) 289 (23.0) 335 (26.7) 399 (31.8) 1,255 South Dakota — — — — 17 (12.1) 27 (19.1) 38 (27.0) 47 (33.3) 141 Tennessee 111 (3.7) 193 (6.5) 312 (10.5) 467 (15.7) 867 (29.2) 1,019 (34.3) 2,969 Texas 223 (2.1) 501 (4.8) 978 (9.4) 1,662 (16.0) 2,835 (27.3) 4,201 (40.4) 10,400 Utah 15 (2.4) 39 (6.1) 59 (9.3) 96 (15.1) 200 (31.4) 227 (35.7) 636 Vermont — — — — 27 (10.5) 38 (14.7) 79 (30.6) 101 (39.1) 258 Virginia 131 (3.4) 231 (5.9) 401 (10.3) 547 (14.0) 1,181 (30.3) 1,403 (36.0) 3,894 Washington 105 (2.4) 226 (5.1) 461 (10.4) 859 (19.5) 1,237 (28.0) 1,524 (34.5) 4,412 West Virginia 7 (2.0) 19 (5.5) 43 (12.5) 48 (13.9) 97 (28.1) 131 (38.0) 345 Wisconsin†† 39 (2.8) 73 (5.3) 173 (12.6) 215 (15.7) 393 (28.6) 480 (35.0) 1,373 Total 3,362 (3.0) 6,537 (5.8) 12,119 (10.8) 19,308 (17.1) 31,928 (28.4) 39,360 (35.0) 112,614
Abortion rate§§ 1.2 4.4 8.0 12.5 20.5 25.9 10.7 Abortion ratio¶¶ 790 521 398 339 345 303 345
* Data from 45 reporting areas; excludes seven states (California, Florida, Illinois, Louisiana, Maryland, New Hampshire, and Wyoming) that did not report, did not report age among adolescents by individual year, or did not meet reporting standards.
† Percentages for the individual component categories might not add to 100 because of rounding. § Because reporting is not mandatory, information could not be obtained for all abortions performed in the District of Columbia. ¶ Cell details not displayed because of small numbers (N = 1–4). ** Data from hospitals and licensed ambulatory care facilities only; because reporting is not mandatory for private physicians and women’s centers, information could
not be obtained for all abortions performed in New Jersey. †† Includes residents only. §§ Number of abortions obtained by adolescents in a given age group per 1,000 adolescents in that same age group. Adolescents aged 13–14 years were used as the
denominator for adolescents aged <15 years. ¶¶ Number of abortions obtained by adolescents in a given age group per 1,000 live births to adolescents in that same age group.
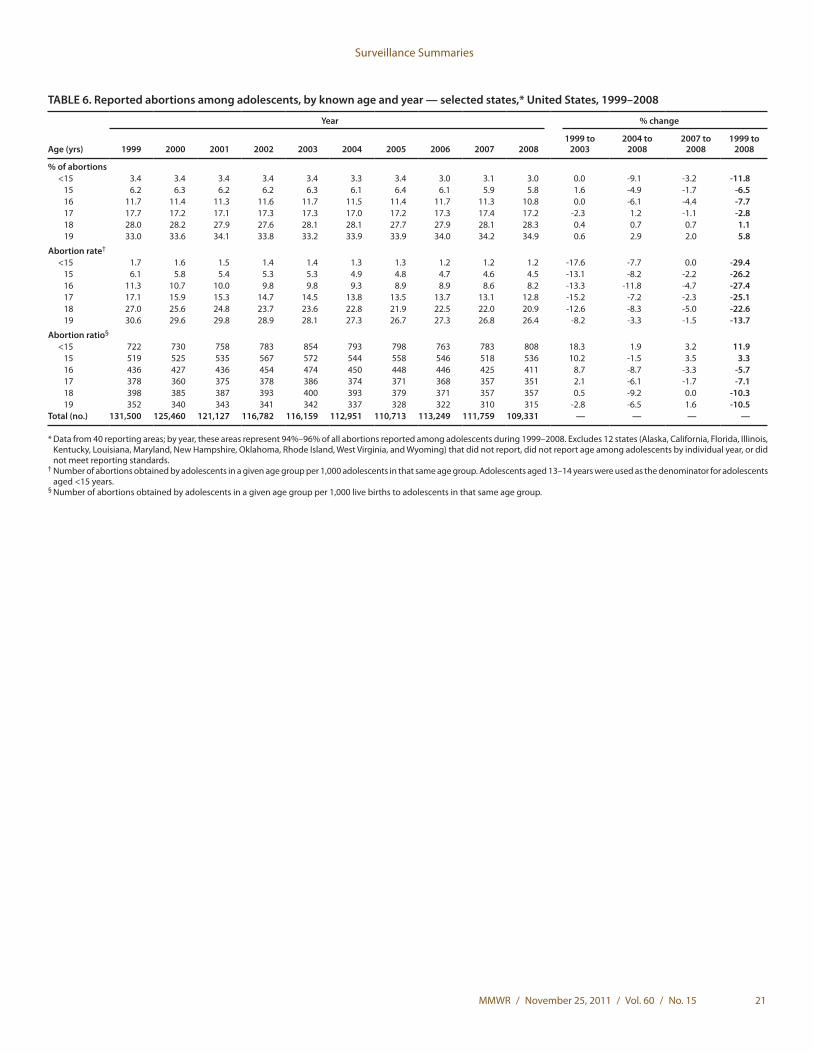
Surveillance Summaries
MMWR / November 25, 2011 / Vol. 60 / No. 15 21
TABLE 6. Reported abortions among adolescents, by known age and year — selected states,* United States, 1999–2008
Age (yrs)
Year % change
1999 2000 2001 2002 2003 2004 2005 2006 2007 20081999 to
20032004 to
20082007 to
20081999 to
2008
% of abortions<15 3.4 3.4 3.4 3.4 3.4 3.3 3.4 3.0 3.1 3.0 0.0 -9.1 -3.2 -11.8
15 6.2 6.3 6.2 6.2 6.3 6.1 6.4 6.1 5.9 5.8 1.6 -4.9 -1.7 -6.516 11.7 11.4 11.3 11.6 11.7 11.5 11.4 11.7 11.3 10.8 0.0 -6.1 -4.4 -7.717 17.7 17.2 17.1 17.3 17.3 17.0 17.2 17.3 17.4 17.2 -2.3 1.2 -1.1 -2.818 28.0 28.2 27.9 27.6 28.1 28.1 27.7 27.9 28.1 28.3 0.4 0.7 0.7 1.119 33.0 33.6 34.1 33.8 33.2 33.9 33.9 34.0 34.2 34.9 0.6 2.9 2.0 5.8
Abortion rate†
<15 1.7 1.6 1.5 1.4 1.4 1.3 1.3 1.2 1.2 1.2 -17.6 -7.7 0.0 -29.415 6.1 5.8 5.4 5.3 5.3 4.9 4.8 4.7 4.6 4.5 -13.1 -8.2 -2.2 -26.216 11.3 10.7 10.0 9.8 9.8 9.3 8.9 8.9 8.6 8.2 -13.3 -11.8 -4.7 -27.417 17.1 15.9 15.3 14.7 14.5 13.8 13.5 13.7 13.1 12.8 -15.2 -7.2 -2.3 -25.118 27.0 25.6 24.8 23.7 23.6 22.8 21.9 22.5 22.0 20.9 -12.6 -8.3 -5.0 -22.619 30.6 29.6 29.8 28.9 28.1 27.3 26.7 27.3 26.8 26.4 -8.2 -3.3 -1.5 -13.7
Abortion ratio§
<15 722 730 758 783 854 793 798 763 783 808 18.3 1.9 3.2 11.915 519 525 535 567 572 544 558 546 518 536 10.2 -1.5 3.5 3.316 436 427 436 454 474 450 448 446 425 411 8.7 -8.7 -3.3 -5.717 378 360 375 378 386 374 371 368 357 351 2.1 -6.1 -1.7 -7.118 398 385 387 393 400 393 379 371 357 357 0.5 -9.2 0.0 -10.319 352 340 343 341 342 337 328 322 310 315 -2.8 -6.5 1.6 -10.5
Total (no.) 131,500 125,460 121,127 116,782 116,159 112,951 110,713 113,249 111,759 109,331 — — — —
* Data from 40 reporting areas; by year, these areas represent 94%–96% of all abortions reported among adolescents during 1999–2008. Excludes 12 states (Alaska, California, Florida, Illinois, Kentucky, Louisiana, Maryland, New Hampshire, Oklahoma, Rhode Island, West Virginia, and Wyoming) that did not report, did not report age among adolescents by individual year, or did not meet reporting standards.
† Number of abortions obtained by adolescents in a given age group per 1,000 adolescents in that same age group. Adolescents aged 13–14 years were used as the denominator for adolescents aged <15 years.
§ Number of abortions obtained by adolescents in a given age group per 1,000 live births to adolescents in that same age group.
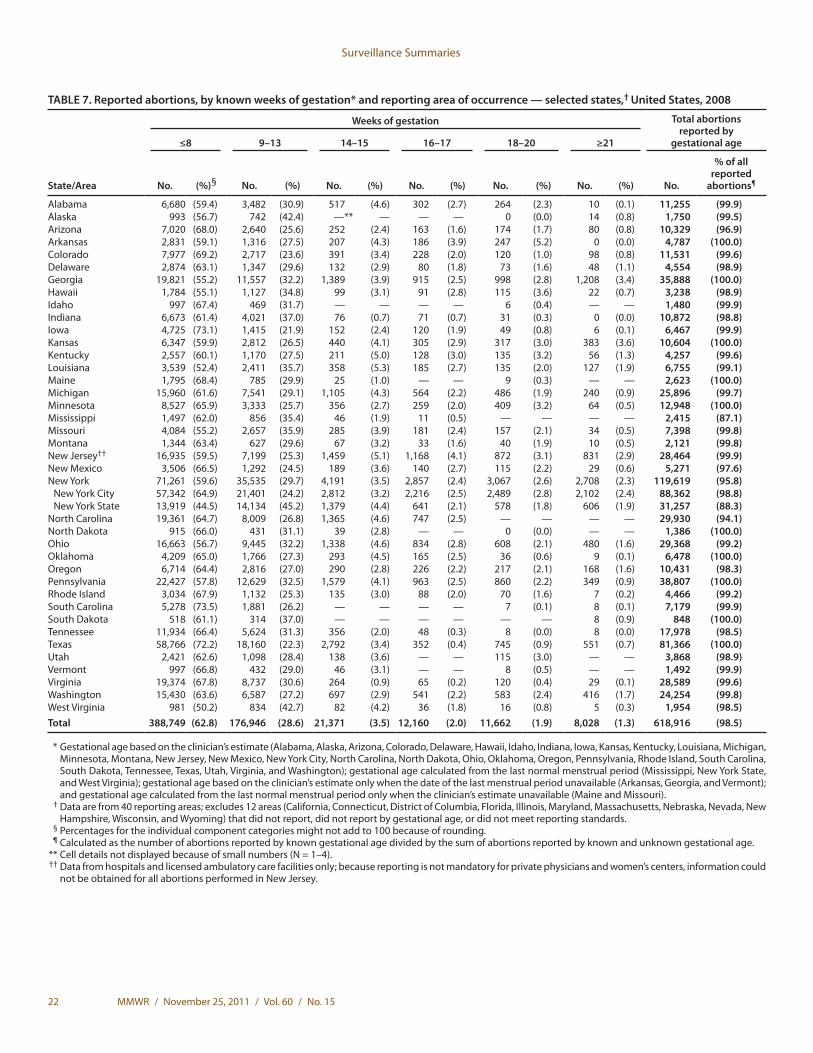
Surveillance Summaries
22 MMWR / November 25, 2011 / Vol. 60 / No. 15
TABLE 7. Reported abortions, by known weeks of gestation* and reporting area of occurrence — selected states,† United States, 2008
State/Area
Weeks of gestation Total abortions reported by
gestational age≤8 9–13 14–15 16–17 18–20 ≥21
No. (%)§ No. (%) No. (%) No. (%) No. (%) No. (%) No.
% of all reported
abortions¶
Alabama 6,680 (59.4) 3,482 (30.9) 517 (4.6) 302 (2.7) 264 (2.3) 10 (0.1) 11,255 (99.9)Alaska 993 (56.7) 742 (42.4) —** — — — 0 (0.0) 14 (0.8) 1,750 (99.5)Arizona 7,020 (68.0) 2,640 (25.6) 252 (2.4) 163 (1.6) 174 (1.7) 80 (0.8) 10,329 (96.9)Arkansas 2,831 (59.1) 1,316 (27.5) 207 (4.3) 186 (3.9) 247 (5.2) 0 (0.0) 4,787 (100.0)Colorado 7,977 (69.2) 2,717 (23.6) 391 (3.4) 228 (2.0) 120 (1.0) 98 (0.8) 11,531 (99.6)Delaware 2,874 (63.1) 1,347 (29.6) 132 (2.9) 80 (1.8) 73 (1.6) 48 (1.1) 4,554 (98.9)Georgia 19,821 (55.2) 11,557 (32.2) 1,389 (3.9) 915 (2.5) 998 (2.8) 1,208 (3.4) 35,888 (100.0)Hawaii 1,784 (55.1) 1,127 (34.8) 99 (3.1) 91 (2.8) 115 (3.6) 22 (0.7) 3,238 (98.9)Idaho 997 (67.4) 469 (31.7) — — — — 6 (0.4) — — 1,480 (99.9)Indiana 6,673 (61.4) 4,021 (37.0) 76 (0.7) 71 (0.7) 31 (0.3) 0 (0.0) 10,872 (98.8)Iowa 4,725 (73.1) 1,415 (21.9) 152 (2.4) 120 (1.9) 49 (0.8) 6 (0.1) 6,467 (99.9)Kansas 6,347 (59.9) 2,812 (26.5) 440 (4.1) 305 (2.9) 317 (3.0) 383 (3.6) 10,604 (100.0)Kentucky 2,557 (60.1) 1,170 (27.5) 211 (5.0) 128 (3.0) 135 (3.2) 56 (1.3) 4,257 (99.6)Louisiana 3,539 (52.4) 2,411 (35.7) 358 (5.3) 185 (2.7) 135 (2.0) 127 (1.9) 6,755 (99.1)Maine 1,795 (68.4) 785 (29.9) 25 (1.0) — — 9 (0.3) — — 2,623 (100.0)Michigan 15,960 (61.6) 7,541 (29.1) 1,105 (4.3) 564 (2.2) 486 (1.9) 240 (0.9) 25,896 (99.7)Minnesota 8,527 (65.9) 3,333 (25.7) 356 (2.7) 259 (2.0) 409 (3.2) 64 (0.5) 12,948 (100.0)Mississippi 1,497 (62.0) 856 (35.4) 46 (1.9) 11 (0.5) — — — — 2,415 (87.1)Missouri 4,084 (55.2) 2,657 (35.9) 285 (3.9) 181 (2.4) 157 (2.1) 34 (0.5) 7,398 (99.8)Montana 1,344 (63.4) 627 (29.6) 67 (3.2) 33 (1.6) 40 (1.9) 10 (0.5) 2,121 (99.8)New Jersey†† 16,935 (59.5) 7,199 (25.3) 1,459 (5.1) 1,168 (4.1) 872 (3.1) 831 (2.9) 28,464 (99.9)New Mexico 3,506 (66.5) 1,292 (24.5) 189 (3.6) 140 (2.7) 115 (2.2) 29 (0.6) 5,271 (97.6)New York 71,261 (59.6) 35,535 (29.7) 4,191 (3.5) 2,857 (2.4) 3,067 (2.6) 2,708 (2.3) 119,619 (95.8)
New York City 57,342 (64.9) 21,401 (24.2) 2,812 (3.2) 2,216 (2.5) 2,489 (2.8) 2,102 (2.4) 88,362 (98.8)New York State 13,919 (44.5) 14,134 (45.2) 1,379 (4.4) 641 (2.1) 578 (1.8) 606 (1.9) 31,257 (88.3)
North Carolina 19,361 (64.7) 8,009 (26.8) 1,365 (4.6) 747 (2.5) — — — — 29,930 (94.1)North Dakota 915 (66.0) 431 (31.1) 39 (2.8) — — 0 (0.0) — — 1,386 (100.0)Ohio 16,663 (56.7) 9,445 (32.2) 1,338 (4.6) 834 (2.8) 608 (2.1) 480 (1.6) 29,368 (99.2)Oklahoma 4,209 (65.0) 1,766 (27.3) 293 (4.5) 165 (2.5) 36 (0.6) 9 (0.1) 6,478 (100.0)Oregon 6,714 (64.4) 2,816 (27.0) 290 (2.8) 226 (2.2) 217 (2.1) 168 (1.6) 10,431 (98.3)Pennsylvania 22,427 (57.8) 12,629 (32.5) 1,579 (4.1) 963 (2.5) 860 (2.2) 349 (0.9) 38,807 (100.0)Rhode Island 3,034 (67.9) 1,132 (25.3) 135 (3.0) 88 (2.0) 70 (1.6) 7 (0.2) 4,466 (99.2)South Carolina 5,278 (73.5) 1,881 (26.2) — — — — 7 (0.1) 8 (0.1) 7,179 (99.9)South Dakota 518 (61.1) 314 (37.0) — — — — — — 8 (0.9) 848 (100.0)Tennessee 11,934 (66.4) 5,624 (31.3) 356 (2.0) 48 (0.3) 8 (0.0) 8 (0.0) 17,978 (98.5)Texas 58,766 (72.2) 18,160 (22.3) 2,792 (3.4) 352 (0.4) 745 (0.9) 551 (0.7) 81,366 (100.0)Utah 2,421 (62.6) 1,098 (28.4) 138 (3.6) — — 115 (3.0) — — 3,868 (98.9)Vermont 997 (66.8) 432 (29.0) 46 (3.1) — — 8 (0.5) — — 1,492 (99.9)Virginia 19,374 (67.8) 8,737 (30.6) 264 (0.9) 65 (0.2) 120 (0.4) 29 (0.1) 28,589 (99.6)Washington 15,430 (63.6) 6,587 (27.2) 697 (2.9) 541 (2.2) 583 (2.4) 416 (1.7) 24,254 (99.8)West Virginia 981 (50.2) 834 (42.7) 82 (4.2) 36 (1.8) 16 (0.8) 5 (0.3) 1,954 (98.5)Total 388,749 (62.8) 176,946 (28.6) 21,371 (3.5) 12,160 (2.0) 11,662 (1.9) 8,028 (1.3) 618,916 (98.5)
* Gestational age based on the clinician’s estimate (Alabama, Alaska, Arizona, Colorado, Delaware, Hawaii, Idaho, Indiana, Iowa, Kansas, Kentucky, Louisiana, Michigan, Minnesota, Montana, New Jersey, New Mexico, New York City, North Carolina, North Dakota, Ohio, Oklahoma, Oregon, Pennsylvania, Rhode Island, South Carolina, South Dakota, Tennessee, Texas, Utah, Virginia, and Washington); gestational age calculated from the last normal menstrual period (Mississippi, New York State, and West Virginia); gestational age based on the clinician’s estimate only when the date of the last menstrual period unavailable (Arkansas, Georgia, and Vermont); and gestational age calculated from the last normal menstrual period only when the clinician’s estimate unavailable (Maine and Missouri).
† Data are from 40 reporting areas; excludes 12 areas (California, Connecticut, District of Columbia, Florida, Illinois, Maryland, Massachusetts, Nebraska, Nevada, New Hampshire, Wisconsin, and Wyoming) that did not report, did not report by gestational age, or did not meet reporting standards.
§ Percentages for the individual component categories might not add to 100 because of rounding. ¶ Calculated as the number of abortions reported by known gestational age divided by the sum of abortions reported by known and unknown gestational age. ** Cell details not displayed because of small numbers (N = 1–4). †† Data from hospitals and licensed ambulatory care facilities only; because reporting is not mandatory for private physicians and women’s centers, information could
not be obtained for all abortions performed in New Jersey.
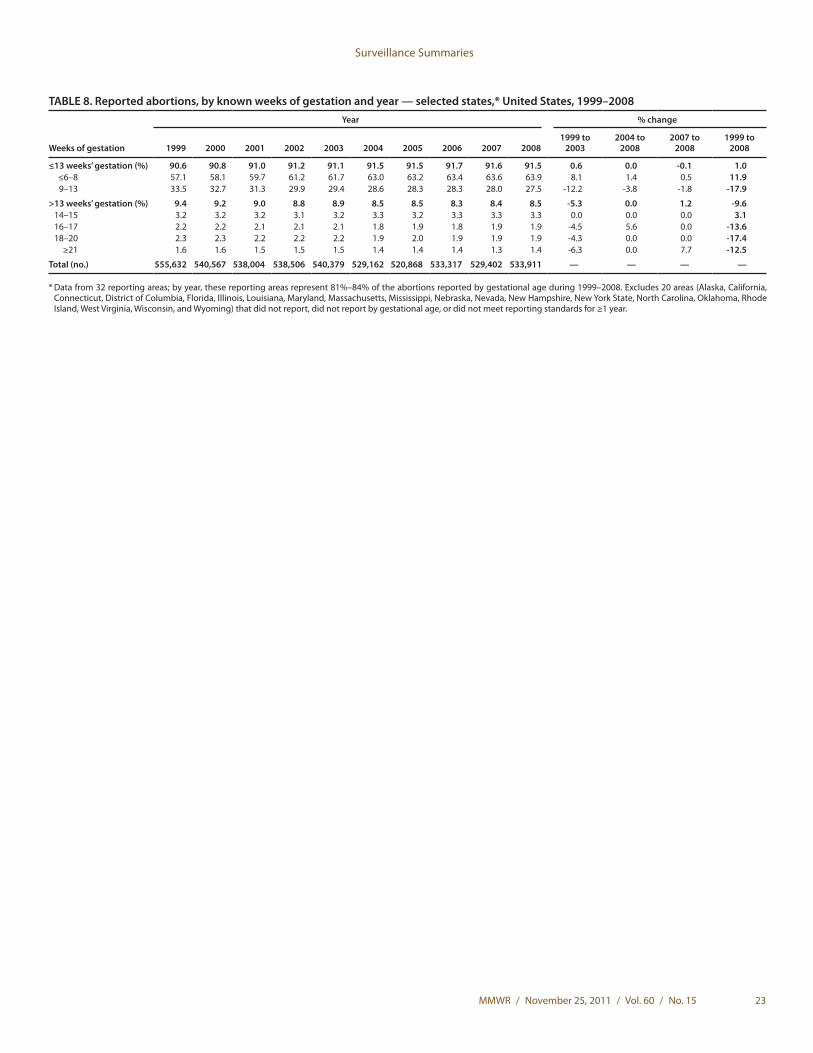
Surveillance Summaries
MMWR / November 25, 2011 / Vol. 60 / No. 15 23
TABLE 8. Reported abortions, by known weeks of gestation and year — selected states,* United States, 1999–2008
Weeks of gestation
Year % change
1999 2000 2001 2002 2003 2004 2005 2006 2007 20081999 to
20032004 to
20082007 to
20081999 to
2008
≤13 weeks’ gestation (%) 90.6 90.8 91.0 91.2 91.1 91.5 91.5 91.7 91.6 91.5 0.6 0.0 -0.1 1.0 ≤6–8 57.1 58.1 59.7 61.2 61.7 63.0 63.2 63.4 63.6 63.9 8.1 1.4 0.5 11.9 9–13 33.5 32.7 31.3 29.9 29.4 28.6 28.3 28.3 28.0 27.5 -12.2 -3.8 -1.8 -17.9
>13 weeks’ gestation (%) 9.4 9.2 9.0 8.8 8.9 8.5 8.5 8.3 8.4 8.5 -5.3 0.0 1.2 -9.6 14–15 3.2 3.2 3.2 3.1 3.2 3.3 3.2 3.3 3.3 3.3 0.0 0.0 0.0 3.1 16–17 2.2 2.2 2.1 2.1 2.1 1.8 1.9 1.8 1.9 1.9 -4.5 5.6 0.0 -13.6 18–20 2.3 2.3 2.2 2.2 2.2 1.9 2.0 1.9 1.9 1.9 -4.3 0.0 0.0 -17.4 ≥21 1.6 1.6 1.5 1.5 1.5 1.4 1.4 1.4 1.3 1.4 -6.3 0.0 7.7 -12.5
Total (no.) 555,632 540,567 538,004 538,506 540,379 529,162 520,868 533,317 529,402 533,911 — — — —
* Data from 32 reporting areas; by year, these reporting areas represent 81%–84% of the abortions reported by gestational age during 1999–2008. Excludes 20 areas (Alaska, California, Connecticut, District of Columbia, Florida, Illinois, Louisiana, Maryland, Massachusetts, Mississippi, Nebraska, Nevada, New Hampshire, New York State, North Carolina, Oklahoma, Rhode Island, West Virginia, Wisconsin, and Wyoming) that did not report, did not report by gestational age, or did not meet reporting standards for ≥1 year.
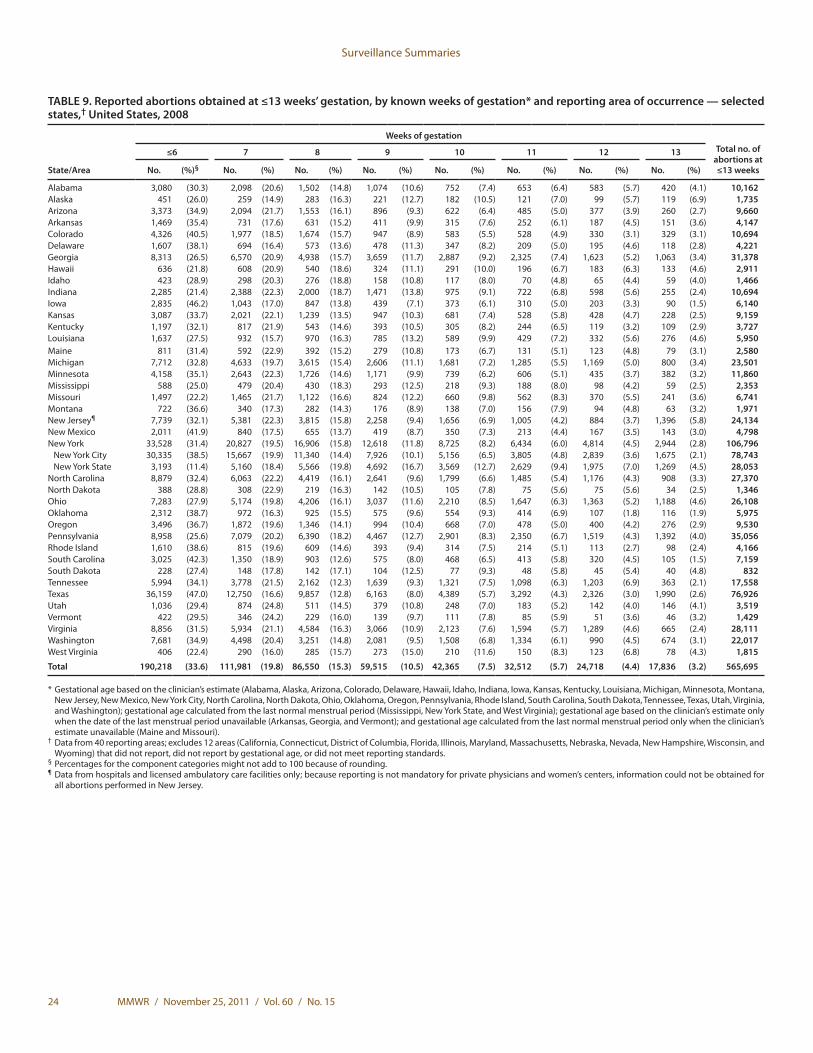
Surveillance Summaries
24 MMWR / November 25, 2011 / Vol. 60 / No. 15
TABLE 9. Reported abortions obtained at ≤13 weeks’ gestation, by known weeks of gestation* and reporting area of occurrence — selected states,† United States, 2008
State/Area
Weeks of gestationTotal no. of
abortions at ≤13 weeks
≤6 7 8 9 10 11 12 13
No. (%)§ No. (%) No. (%) No. (%) No. (%) No. (%) No. (%) No. (%)
Alabama 3,080 (30.3) 2,098 (20.6) 1,502 (14.8) 1,074 (10.6) 752 (7.4) 653 (6.4) 583 (5.7) 420 (4.1) 10,162Alaska 451 (26.0) 259 (14.9) 283 (16.3) 221 (12.7) 182 (10.5) 121 (7.0) 99 (5.7) 119 (6.9) 1,735Arizona 3,373 (34.9) 2,094 (21.7) 1,553 (16.1) 896 (9.3) 622 (6.4) 485 (5.0) 377 (3.9) 260 (2.7) 9,660Arkansas 1,469 (35.4) 731 (17.6) 631 (15.2) 411 (9.9) 315 (7.6) 252 (6.1) 187 (4.5) 151 (3.6) 4,147Colorado 4,326 (40.5) 1,977 (18.5) 1,674 (15.7) 947 (8.9) 583 (5.5) 528 (4.9) 330 (3.1) 329 (3.1) 10,694Delaware 1,607 (38.1) 694 (16.4) 573 (13.6) 478 (11.3) 347 (8.2) 209 (5.0) 195 (4.6) 118 (2.8) 4,221Georgia 8,313 (26.5) 6,570 (20.9) 4,938 (15.7) 3,659 (11.7) 2,887 (9.2) 2,325 (7.4) 1,623 (5.2) 1,063 (3.4) 31,378Hawaii 636 (21.8) 608 (20.9) 540 (18.6) 324 (11.1) 291 (10.0) 196 (6.7) 183 (6.3) 133 (4.6) 2,911Idaho 423 (28.9) 298 (20.3) 276 (18.8) 158 (10.8) 117 (8.0) 70 (4.8) 65 (4.4) 59 (4.0) 1,466Indiana 2,285 (21.4) 2,388 (22.3) 2,000 (18.7) 1,471 (13.8) 975 (9.1) 722 (6.8) 598 (5.6) 255 (2.4) 10,694Iowa 2,835 (46.2) 1,043 (17.0) 847 (13.8) 439 (7.1) 373 (6.1) 310 (5.0) 203 (3.3) 90 (1.5) 6,140Kansas 3,087 (33.7) 2,021 (22.1) 1,239 (13.5) 947 (10.3) 681 (7.4) 528 (5.8) 428 (4.7) 228 (2.5) 9,159Kentucky 1,197 (32.1) 817 (21.9) 543 (14.6) 393 (10.5) 305 (8.2) 244 (6.5) 119 (3.2) 109 (2.9) 3,727Louisiana 1,637 (27.5) 932 (15.7) 970 (16.3) 785 (13.2) 589 (9.9) 429 (7.2) 332 (5.6) 276 (4.6) 5,950Maine 811 (31.4) 592 (22.9) 392 (15.2) 279 (10.8) 173 (6.7) 131 (5.1) 123 (4.8) 79 (3.1) 2,580Michigan 7,712 (32.8) 4,633 (19.7) 3,615 (15.4) 2,606 (11.1) 1,681 (7.2) 1,285 (5.5) 1,169 (5.0) 800 (3.4) 23,501Minnesota 4,158 (35.1) 2,643 (22.3) 1,726 (14.6) 1,171 (9.9) 739 (6.2) 606 (5.1) 435 (3.7) 382 (3.2) 11,860Mississippi 588 (25.0) 479 (20.4) 430 (18.3) 293 (12.5) 218 (9.3) 188 (8.0) 98 (4.2) 59 (2.5) 2,353Missouri 1,497 (22.2) 1,465 (21.7) 1,122 (16.6) 824 (12.2) 660 (9.8) 562 (8.3) 370 (5.5) 241 (3.6) 6,741Montana 722 (36.6) 340 (17.3) 282 (14.3) 176 (8.9) 138 (7.0) 156 (7.9) 94 (4.8) 63 (3.2) 1,971New Jersey¶ 7,739 (32.1) 5,381 (22.3) 3,815 (15.8) 2,258 (9.4) 1,656 (6.9) 1,005 (4.2) 884 (3.7) 1,396 (5.8) 24,134New Mexico 2,011 (41.9) 840 (17.5) 655 (13.7) 419 (8.7) 350 (7.3) 213 (4.4) 167 (3.5) 143 (3.0) 4,798New York 33,528 (31.4) 20,827 (19.5) 16,906 (15.8) 12,618 (11.8) 8,725 (8.2) 6,434 (6.0) 4,814 (4.5) 2,944 (2.8) 106,796
New York City 30,335 (38.5) 15,667 (19.9) 11,340 (14.4) 7,926 (10.1) 5,156 (6.5) 3,805 (4.8) 2,839 (3.6) 1,675 (2.1) 78,743New York State 3,193 (11.4) 5,160 (18.4) 5,566 (19.8) 4,692 (16.7) 3,569 (12.7) 2,629 (9.4) 1,975 (7.0) 1,269 (4.5) 28,053
North Carolina 8,879 (32.4) 6,063 (22.2) 4,419 (16.1) 2,641 (9.6) 1,799 (6.6) 1,485 (5.4) 1,176 (4.3) 908 (3.3) 27,370North Dakota 388 (28.8) 308 (22.9) 219 (16.3) 142 (10.5) 105 (7.8) 75 (5.6) 75 (5.6) 34 (2.5) 1,346Ohio 7,283 (27.9) 5,174 (19.8) 4,206 (16.1) 3,037 (11.6) 2,210 (8.5) 1,647 (6.3) 1,363 (5.2) 1,188 (4.6) 26,108Oklahoma 2,312 (38.7) 972 (16.3) 925 (15.5) 575 (9.6) 554 (9.3) 414 (6.9) 107 (1.8) 116 (1.9) 5,975Oregon 3,496 (36.7) 1,872 (19.6) 1,346 (14.1) 994 (10.4) 668 (7.0) 478 (5.0) 400 (4.2) 276 (2.9) 9,530Pennsylvania 8,958 (25.6) 7,079 (20.2) 6,390 (18.2) 4,467 (12.7) 2,901 (8.3) 2,350 (6.7) 1,519 (4.3) 1,392 (4.0) 35,056Rhode Island 1,610 (38.6) 815 (19.6) 609 (14.6) 393 (9.4) 314 (7.5) 214 (5.1) 113 (2.7) 98 (2.4) 4,166South Carolina 3,025 (42.3) 1,350 (18.9) 903 (12.6) 575 (8.0) 468 (6.5) 413 (5.8) 320 (4.5) 105 (1.5) 7,159South Dakota 228 (27.4) 148 (17.8) 142 (17.1) 104 (12.5) 77 (9.3) 48 (5.8) 45 (5.4) 40 (4.8) 832Tennessee 5,994 (34.1) 3,778 (21.5) 2,162 (12.3) 1,639 (9.3) 1,321 (7.5) 1,098 (6.3) 1,203 (6.9) 363 (2.1) 17,558Texas 36,159 (47.0) 12,750 (16.6) 9,857 (12.8) 6,163 (8.0) 4,389 (5.7) 3,292 (4.3) 2,326 (3.0) 1,990 (2.6) 76,926Utah 1,036 (29.4) 874 (24.8) 511 (14.5) 379 (10.8) 248 (7.0) 183 (5.2) 142 (4.0) 146 (4.1) 3,519Vermont 422 (29.5) 346 (24.2) 229 (16.0) 139 (9.7) 111 (7.8) 85 (5.9) 51 (3.6) 46 (3.2) 1,429Virginia 8,856 (31.5) 5,934 (21.1) 4,584 (16.3) 3,066 (10.9) 2,123 (7.6) 1,594 (5.7) 1,289 (4.6) 665 (2.4) 28,111Washington 7,681 (34.9) 4,498 (20.4) 3,251 (14.8) 2,081 (9.5) 1,508 (6.8) 1,334 (6.1) 990 (4.5) 674 (3.1) 22,017West Virginia 406 (22.4) 290 (16.0) 285 (15.7) 273 (15.0) 210 (11.6) 150 (8.3) 123 (6.8) 78 (4.3) 1,815
Total 190,218 (33.6) 111,981 (19.8) 86,550 (15.3) 59,515 (10.5) 42,365 (7.5) 32,512 (5.7) 24,718 (4.4) 17,836 (3.2) 565,695
* Gestational age based on the clinician’s estimate (Alabama, Alaska, Arizona, Colorado, Delaware, Hawaii, Idaho, Indiana, Iowa, Kansas, Kentucky, Louisiana, Michigan, Minnesota, Montana, New Jersey, New Mexico, New York City, North Carolina, North Dakota, Ohio, Oklahoma, Oregon, Pennsylvania, Rhode Island, South Carolina, South Dakota, Tennessee, Texas, Utah, Virginia, and Washington); gestational age calculated from the last normal menstrual period (Mississippi, New York State, and West Virginia); gestational age based on the clinician’s estimate only when the date of the last menstrual period unavailable (Arkansas, Georgia, and Vermont); and gestational age calculated from the last normal menstrual period only when the clinician’s estimate unavailable (Maine and Missouri).
† Data from 40 reporting areas; excludes 12 areas (California, Connecticut, District of Columbia, Florida, Illinois, Maryland, Massachusetts, Nebraska, Nevada, New Hampshire, Wisconsin, and Wyoming) that did not report, did not report by gestational age, or did not meet reporting standards.
§ Percentages for the component categories might not add to 100 because of rounding. ¶ Data from hospitals and licensed ambulatory care facilities only; because reporting is not mandatory for private physicians and women’s centers, information could not be obtained for
all abortions performed in New Jersey.
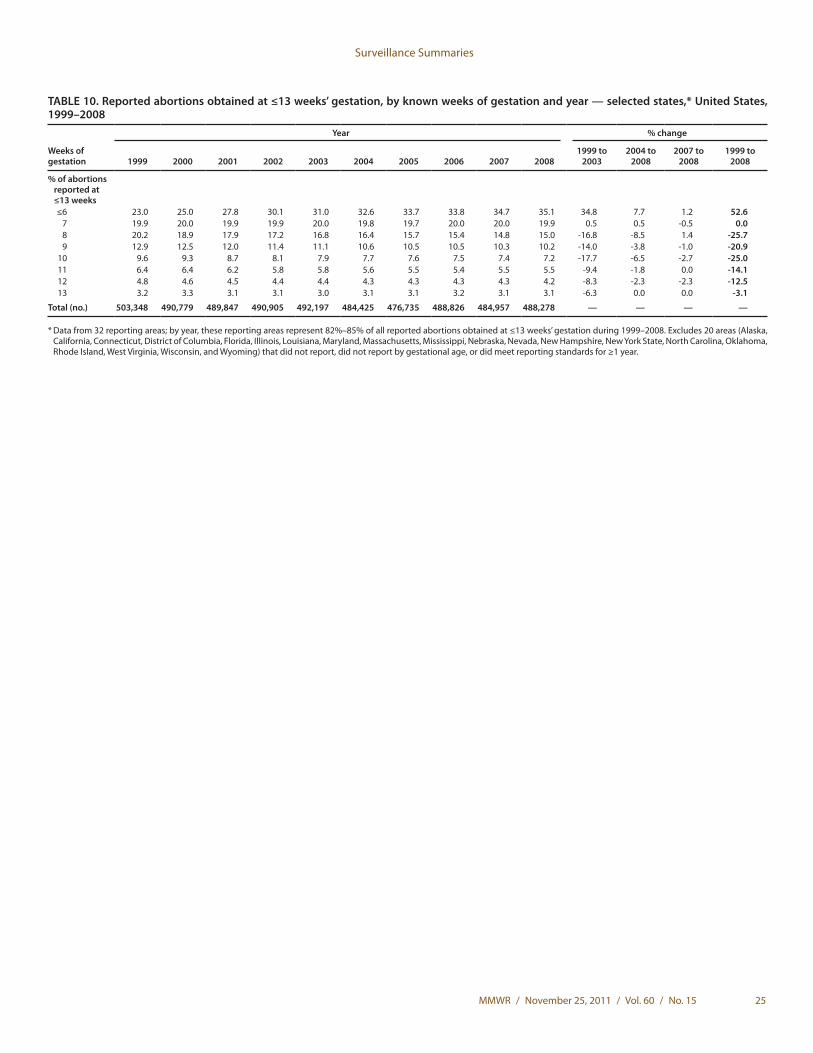
Surveillance Summaries
MMWR / November 25, 2011 / Vol. 60 / No. 15 25
TABLE 10. Reported abortions obtained at ≤13 weeks’ gestation, by known weeks of gestation and year — selected states,* United States, 1999–2008
Weeks of gestation
Year % change
1999 2000 2001 2002 2003 2004 2005 2006 2007 20081999 to
20032004 to
20082007 to
20081999 to
2008
% of abortions reported at ≤13 weeks≤6 23.0 25.0 27.8 30.1 31.0 32.6 33.7 33.8 34.7 35.1 34.8 7.7 1.2 52.6
7 19.9 20.0 19.9 19.9 20.0 19.8 19.7 20.0 20.0 19.9 0.5 0.5 -0.5 0.08 20.2 18.9 17.9 17.2 16.8 16.4 15.7 15.4 14.8 15.0 -16.8 -8.5 1.4 -25.79 12.9 12.5 12.0 11.4 11.1 10.6 10.5 10.5 10.3 10.2 -14.0 -3.8 -1.0 -20.9
10 9.6 9.3 8.7 8.1 7.9 7.7 7.6 7.5 7.4 7.2 -17.7 -6.5 -2.7 -25.011 6.4 6.4 6.2 5.8 5.8 5.6 5.5 5.4 5.5 5.5 -9.4 -1.8 0.0 -14.112 4.8 4.6 4.5 4.4 4.4 4.3 4.3 4.3 4.3 4.2 -8.3 -2.3 -2.3 -12.513 3.2 3.3 3.1 3.1 3.0 3.1 3.1 3.2 3.1 3.1 -6.3 0.0 0.0 -3.1
Total (no.) 503,348 490,779 489,847 490,905 492,197 484,425 476,735 488,826 484,957 488,278 — — — —
* Data from 32 reporting areas; by year, these reporting areas represent 82%–85% of all reported abortions obtained at ≤13 weeks’ gestation during 1999–2008. Excludes 20 areas (Alaska, California, Connecticut, District of Columbia, Florida, Illinois, Louisiana, Maryland, Massachusetts, Mississippi, Nebraska, Nevada, New Hampshire, New York State, North Carolina, Oklahoma, Rhode Island, West Virginia, Wisconsin, and Wyoming) that did not report, did not report by gestational age, or did meet reporting standards for ≥1 year.
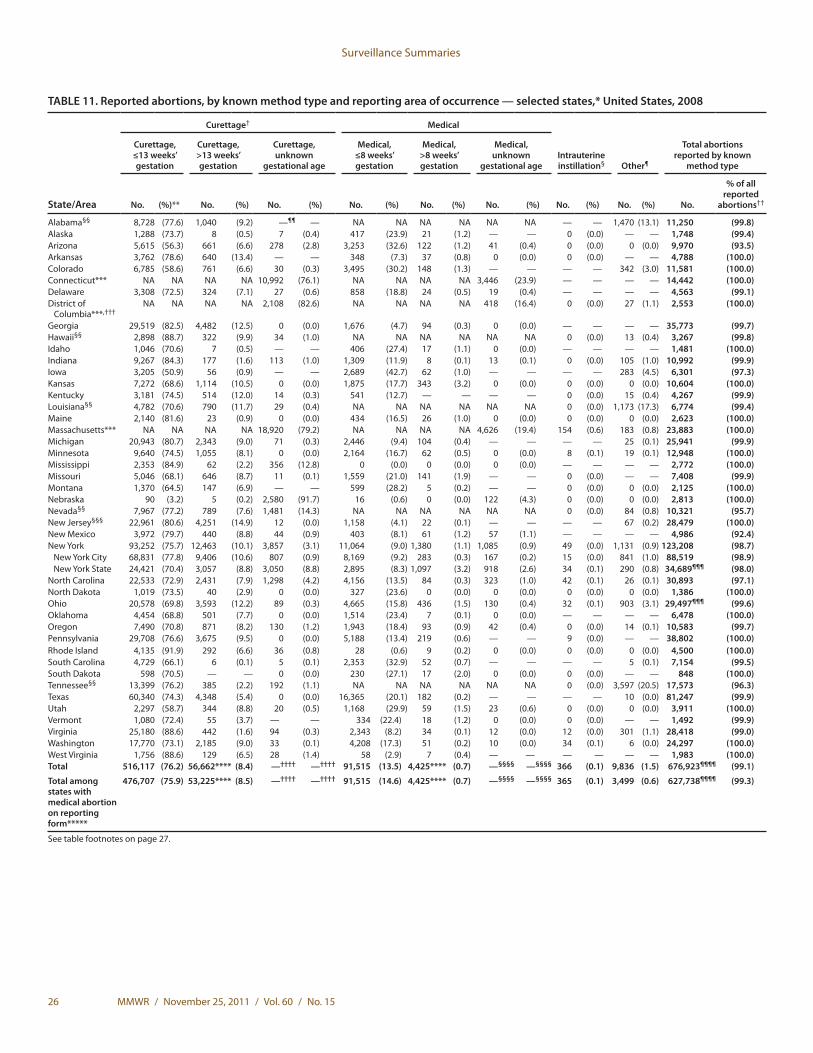
Surveillance Summaries
26 MMWR / November 25, 2011 / Vol. 60 / No. 15
See table footnotes on page 27.
TABLE 11. Reported abortions, by known method type and reporting area of occurrence — selected states,* United States, 2008
State/Area
Curettage† Medical
Intrauterine instillation§ Other¶
Total abortions reported by known
method type
Curettage, ≤13 weeks’ gestation
Curettage, >13 weeks’ gestation
Curettage, unknown
gestational age
Medical, ≤8 weeks’ gestation
Medical, >8 weeks’ gestation
Medical, unknown
gestational age
No. (%)** No. (%) No. (%) No. (%) No. (%) No. (%) No. (%) No. (%) No.
% of all reported
abortions††
Alabama§§ 8,728 (77.6) 1,040 (9.2) —¶¶ — NA NA NA NA NA NA — — 1,470 (13.1) 11,250 (99.8)Alaska 1,288 (73.7) 8 (0.5) 7 (0.4) 417 (23.9) 21 (1.2) — — 0 (0.0) — — 1,748 (99.4)Arizona 5,615 (56.3) 661 (6.6) 278 (2.8) 3,253 (32.6) 122 (1.2) 41 (0.4) 0 (0.0) 0 (0.0) 9,970 (93.5)Arkansas 3,762 (78.6) 640 (13.4) — — 348 (7.3) 37 (0.8) 0 (0.0) 0 (0.0) — — 4,788 (100.0)Colorado 6,785 (58.6) 761 (6.6) 30 (0.3) 3,495 (30.2) 148 (1.3) — — — — 342 (3.0) 11,581 (100.0)Connecticut*** NA NA NA NA 10,992 (76.1) NA NA NA NA 3,446 (23.9) — — — — 14,442 (100.0)Delaware 3,308 (72.5) 324 (7.1) 27 (0.6) 858 (18.8) 24 (0.5) 19 (0.4) — — — — 4,563 (99.1)District of
Columbia***,†††NA NA NA NA 2,108 (82.6) NA NA NA NA 418 (16.4) 0 (0.0) 27 (1.1) 2,553 (100.0)
Georgia 29,519 (82.5) 4,482 (12.5) 0 (0.0) 1,676 (4.7) 94 (0.3) 0 (0.0) — — — — 35,773 (99.7)Hawaii§§ 2,898 (88.7) 322 (9.9) 34 (1.0) NA NA NA NA NA NA 0 (0.0) 13 (0.4) 3,267 (99.8)Idaho 1,046 (70.6) 7 (0.5) — — 406 (27.4) 17 (1.1) 0 (0.0) — — — — 1,481 (100.0)Indiana 9,267 (84.3) 177 (1.6) 113 (1.0) 1,309 (11.9) 8 (0.1) 13 (0.1) 0 (0.0) 105 (1.0) 10,992 (99.9)Iowa 3,205 (50.9) 56 (0.9) — — 2,689 (42.7) 62 (1.0) — — — — 283 (4.5) 6,301 (97.3)Kansas 7,272 (68.6) 1,114 (10.5) 0 (0.0) 1,875 (17.7) 343 (3.2) 0 (0.0) 0 (0.0) 0 (0.0) 10,604 (100.0)Kentucky 3,181 (74.5) 514 (12.0) 14 (0.3) 541 (12.7) — — — — 0 (0.0) 15 (0.4) 4,267 (99.9)Louisiana§§ 4,782 (70.6) 790 (11.7) 29 (0.4) NA NA NA NA NA NA 0 (0.0) 1,173 (17.3) 6,774 (99.4)Maine 2,140 (81.6) 23 (0.9) 0 (0.0) 434 (16.5) 26 (1.0) 0 (0.0) 0 (0.0) 0 (0.0) 2,623 (100.0)Massachusetts*** NA NA NA NA 18,920 (79.2) NA NA NA NA 4,626 (19.4) 154 (0.6) 183 (0.8) 23,883 (100.0)Michigan 20,943 (80.7) 2,343 (9.0) 71 (0.3) 2,446 (9.4) 104 (0.4) — — — — 25 (0.1) 25,941 (99.9)Minnesota 9,640 (74.5) 1,055 (8.1) 0 (0.0) 2,164 (16.7) 62 (0.5) 0 (0.0) 8 (0.1) 19 (0.1) 12,948 (100.0)Mississippi 2,353 (84.9) 62 (2.2) 356 (12.8) 0 (0.0) 0 (0.0) 0 (0.0) — — — — 2,772 (100.0)Missouri 5,046 (68.1) 646 (8.7) 11 (0.1) 1,559 (21.0) 141 (1.9) — — 0 (0.0) — — 7,408 (99.9)Montana 1,370 (64.5) 147 (6.9) — — 599 (28.2) 5 (0.2) — — 0 (0.0) 0 (0.0) 2,125 (100.0)Nebraska 90 (3.2) 5 (0.2) 2,580 (91.7) 16 (0.6) 0 (0.0) 122 (4.3) 0 (0.0) 0 (0.0) 2,813 (100.0)Nevada§§ 7,967 (77.2) 789 (7.6) 1,481 (14.3) NA NA NA NA NA NA 0 (0.0) 84 (0.8) 10,321 (95.7)New Jersey§§§ 22,961 (80.6) 4,251 (14.9) 12 (0.0) 1,158 (4.1) 22 (0.1) — — — — 67 (0.2) 28,479 (100.0)New Mexico 3,972 (79.7) 440 (8.8) 44 (0.9) 403 (8.1) 61 (1.2) 57 (1.1) — — — — 4,986 (92.4)New York 93,252 (75.7) 12,463 (10.1) 3,857 (3.1) 11,064 (9.0) 1,380 (1.1) 1,085 (0.9) 49 (0.0) 1,131 (0.9) 123,208 (98.7)
New York City 68,831 (77.8) 9,406 (10.6) 807 (0.9) 8,169 (9.2) 283 (0.3) 167 (0.2) 15 (0.0) 841 (1.0) 88,519 (98.9)New York State 24,421 (70.4) 3,057 (8.8) 3,050 (8.8) 2,895 (8.3) 1,097 (3.2) 918 (2.6) 34 (0.1) 290 (0.8) 34,689¶¶¶ (98.0)
North Carolina 22,533 (72.9) 2,431 (7.9) 1,298 (4.2) 4,156 (13.5) 84 (0.3) 323 (1.0) 42 (0.1) 26 (0.1) 30,893 (97.1)North Dakota 1,019 (73.5) 40 (2.9) 0 (0.0) 327 (23.6) 0 (0.0) 0 (0.0) 0 (0.0) 0 (0.0) 1,386 (100.0)Ohio 20,578 (69.8) 3,593 (12.2) 89 (0.3) 4,665 (15.8) 436 (1.5) 130 (0.4) 32 (0.1) 903 (3.1) 29,497¶¶¶ (99.6)Oklahoma 4,454 (68.8) 501 (7.7) 0 (0.0) 1,514 (23.4) 7 (0.1) 0 (0.0) — — — — 6,478 (100.0)Oregon 7,490 (70.8) 871 (8.2) 130 (1.2) 1,943 (18.4) 93 (0.9) 42 (0.4) 0 (0.0) 14 (0.1) 10,583 (99.7)Pennsylvania 29,708 (76.6) 3,675 (9.5) 0 (0.0) 5,188 (13.4) 219 (0.6) — — 9 (0.0) — — 38,802 (100.0)Rhode Island 4,135 (91.9) 292 (6.6) 36 (0.8) 28 (0.6) 9 (0.2) 0 (0.0) 0 (0.0) 0 (0.0) 4,500 (100.0)South Carolina 4,729 (66.1) 6 (0.1) 5 (0.1) 2,353 (32.9) 52 (0.7) — — — — 5 (0.1) 7,154 (99.5)South Dakota 598 (70.5) — — 0 (0.0) 230 (27.1) 17 (2.0) 0 (0.0) 0 (0.0) — — 848 (100.0)Tennessee§§ 13,399 (76.2) 385 (2.2) 192 (1.1) NA NA NA NA NA NA 0 (0.0) 3,597 (20.5) 17,573 (96.3)Texas 60,340 (74.3) 4,348 (5.4) 0 (0.0) 16,365 (20.1) 182 (0.2) — — — — 10 (0.0) 81,247 (99.9)Utah 2,297 (58.7) 344 (8.8) 20 (0.5) 1,168 (29.9) 59 (1.5) 23 (0.6) 0 (0.0) 0 (0.0) 3,911 (100.0)Vermont 1,080 (72.4) 55 (3.7) — — 334 (22.4) 18 (1.2) 0 (0.0) 0 (0.0) — — 1,492 (99.9)Virginia 25,180 (88.6) 442 (1.6) 94 (0.3) 2,343 (8.2) 34 (0.1) 12 (0.0) 12 (0.0) 301 (1.1) 28,418 (99.0)Washington 17,770 (73.1) 2,185 (9.0) 33 (0.1) 4,208 (17.3) 51 (0.2) 10 (0.0) 34 (0.1) 6 (0.0) 24,297 (100.0)West Virginia 1,756 (88.6) 129 (6.5) 28 (1.4) 58 (2.9) 7 (0.4) — — — — — — 1,983 (100.0)Total 516,117 (76.2) 56,662**** (8.4) —†††† —†††† 91,515 (13.5) 4,425**** (0.7) —§§§§ —§§§§ 366 (0.1) 9,836 (1.5) 676,923¶¶¶¶ (99.1)
Total among states with medical abortion on reporting form*****
476,707 (75.9) 53,225**** (8.5) —†††† —†††† 91,515 (14.6) 4,425**** (0.7) —§§§§ —§§§§ 365 (0.1) 3,499 (0.6) 627,738¶¶¶¶ (99.3)
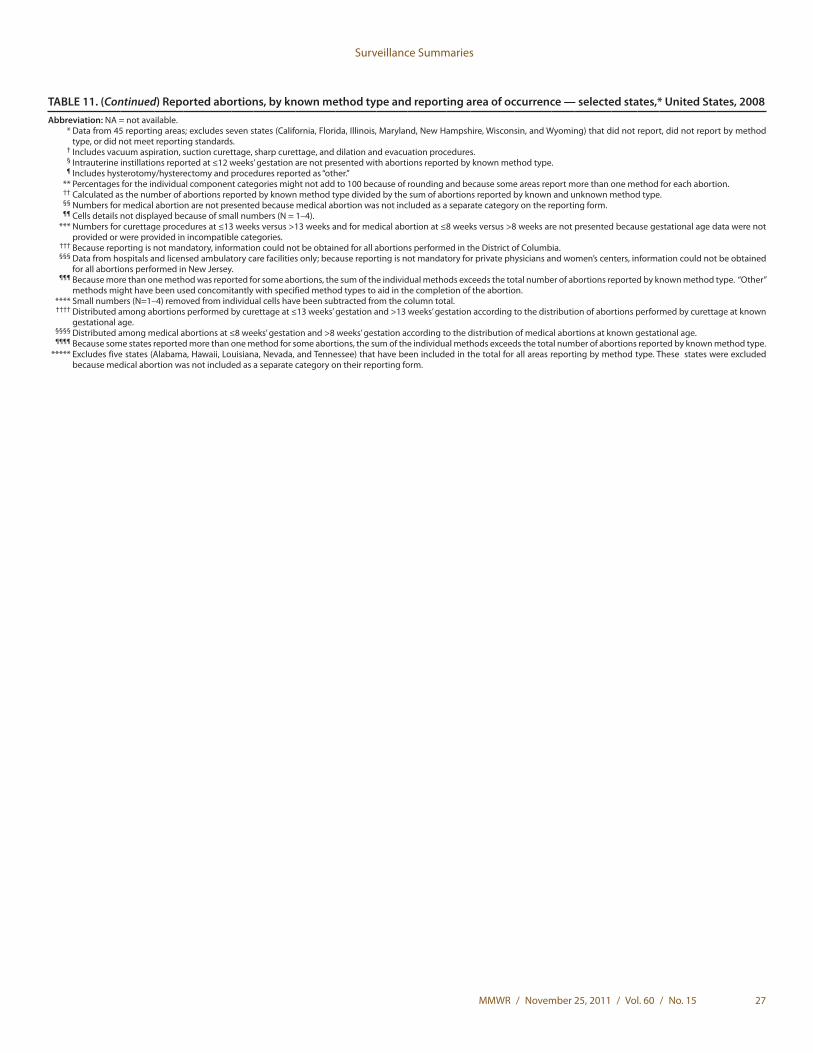
Surveillance Summaries
MMWR / November 25, 2011 / Vol. 60 / No. 15 27
TABLE 11. (Continued) Reported abortions, by known method type and reporting area of occurrence — selected states,* United States, 2008Abbreviation: NA = not available. * Data from 45 reporting areas; excludes seven states (California, Florida, Illinois, Maryland, New Hampshire, Wisconsin, and Wyoming) that did not report, did not report by method
type, or did not meet reporting standards. † Includes vacuum aspiration, suction curettage, sharp curettage, and dilation and evacuation procedures. § Intrauterine instillations reported at ≤12 weeks’ gestation are not presented with abortions reported by known method type. ¶ Includes hysterotomy/hysterectomy and procedures reported as “other.” ** Percentages for the individual component categories might not add to 100 because of rounding and because some areas report more than one method for each abortion. †† Calculated as the number of abortions reported by known method type divided by the sum of abortions reported by known and unknown method type. §§ Numbers for medical abortion are not presented because medical abortion was not included as a separate category on the reporting form. ¶¶ Cells details not displayed because of small numbers (N = 1–4). *** Numbers for curettage procedures at ≤13 weeks versus >13 weeks and for medical abortion at ≤8 weeks versus >8 weeks are not presented because gestational age data were not
provided or were provided in incompatible categories. ††† Because reporting is not mandatory, information could not be obtained for all abortions performed in the District of Columbia. §§§ Data from hospitals and licensed ambulatory care facilities only; because reporting is not mandatory for private physicians and women’s centers, information could not be obtained
for all abortions performed in New Jersey. ¶¶¶ Because more than one method was reported for some abortions, the sum of the individual methods exceeds the total number of abortions reported by known method type. “Other”
methods might have been used concomitantly with specified method types to aid in the completion of the abortion. **** Small numbers (N=1–4) removed from individual cells have been subtracted from the column total. †††† Distributed among abortions performed by curettage at ≤13 weeks’ gestation and >13 weeks’ gestation according to the distribution of abortions performed by curettage at known
gestational age. §§§§ Distributed among medical abortions at ≤8 weeks’ gestation and >8 weeks’ gestation according to the distribution of medical abortions at known gestational age. ¶¶¶¶ Because some states reported more than one method for some abortions, the sum of the individual methods exceeds the total number of abortions reported by known method type. ***** Excludes five states (Alabama, Hawaii, Louisiana, Nevada, and Tennessee) that have been included in the total for all areas reporting by method type. These states were excluded
because medical abortion was not included as a separate category on their reporting form.
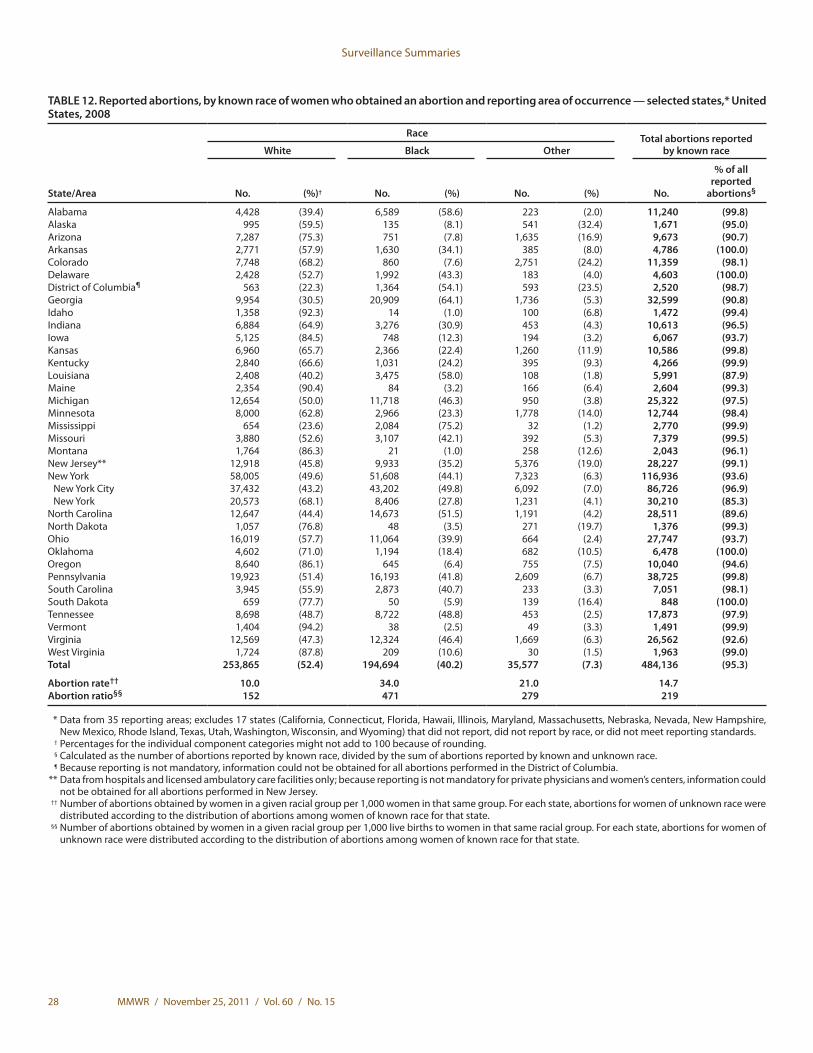
Surveillance Summaries
28 MMWR / November 25, 2011 / Vol. 60 / No. 15
TABLE 12. Reported abortions, by known race of women who obtained an abortion and reporting area of occurrence — selected states,* United States, 2008
State/Area
Race Total abortions reported by known raceWhite Black Other
No. (%)† No. (%) No. (%) No.
% of all reported
abortions§
Alabama 4,428 (39.4) 6,589 (58.6) 223 (2.0) 11,240 (99.8)Alaska 995 (59.5) 135 (8.1) 541 (32.4) 1,671 (95.0)Arizona 7,287 (75.3) 751 (7.8) 1,635 (16.9) 9,673 (90.7)Arkansas 2,771 (57.9) 1,630 (34.1) 385 (8.0) 4,786 (100.0)Colorado 7,748 (68.2) 860 (7.6) 2,751 (24.2) 11,359 (98.1)Delaware 2,428 (52.7) 1,992 (43.3) 183 (4.0) 4,603 (100.0)District of Columbia¶ 563 (22.3) 1,364 (54.1) 593 (23.5) 2,520 (98.7)Georgia 9,954 (30.5) 20,909 (64.1) 1,736 (5.3) 32,599 (90.8)Idaho 1,358 (92.3) 14 (1.0) 100 (6.8) 1,472 (99.4)Indiana 6,884 (64.9) 3,276 (30.9) 453 (4.3) 10,613 (96.5)Iowa 5,125 (84.5) 748 (12.3) 194 (3.2) 6,067 (93.7)Kansas 6,960 (65.7) 2,366 (22.4) 1,260 (11.9) 10,586 (99.8)Kentucky 2,840 (66.6) 1,031 (24.2) 395 (9.3) 4,266 (99.9)Louisiana 2,408 (40.2) 3,475 (58.0) 108 (1.8) 5,991 (87.9)Maine 2,354 (90.4) 84 (3.2) 166 (6.4) 2,604 (99.3)Michigan 12,654 (50.0) 11,718 (46.3) 950 (3.8) 25,322 (97.5)Minnesota 8,000 (62.8) 2,966 (23.3) 1,778 (14.0) 12,744 (98.4)Mississippi 654 (23.6) 2,084 (75.2) 32 (1.2) 2,770 (99.9)Missouri 3,880 (52.6) 3,107 (42.1) 392 (5.3) 7,379 (99.5)Montana 1,764 (86.3) 21 (1.0) 258 (12.6) 2,043 (96.1)New Jersey** 12,918 (45.8) 9,933 (35.2) 5,376 (19.0) 28,227 (99.1)New York 58,005 (49.6) 51,608 (44.1) 7,323 (6.3) 116,936 (93.6)
New York City 37,432 (43.2) 43,202 (49.8) 6,092 (7.0) 86,726 (96.9)New York 20,573 (68.1) 8,406 (27.8) 1,231 (4.1) 30,210 (85.3)
North Carolina 12,647 (44.4) 14,673 (51.5) 1,191 (4.2) 28,511 (89.6)North Dakota 1,057 (76.8) 48 (3.5) 271 (19.7) 1,376 (99.3)Ohio 16,019 (57.7) 11,064 (39.9) 664 (2.4) 27,747 (93.7)Oklahoma 4,602 (71.0) 1,194 (18.4) 682 (10.5) 6,478 (100.0)Oregon 8,640 (86.1) 645 (6.4) 755 (7.5) 10,040 (94.6)Pennsylvania 19,923 (51.4) 16,193 (41.8) 2,609 (6.7) 38,725 (99.8)South Carolina 3,945 (55.9) 2,873 (40.7) 233 (3.3) 7,051 (98.1)South Dakota 659 (77.7) 50 (5.9) 139 (16.4) 848 (100.0)Tennessee 8,698 (48.7) 8,722 (48.8) 453 (2.5) 17,873 (97.9)Vermont 1,404 (94.2) 38 (2.5) 49 (3.3) 1,491 (99.9)Virginia 12,569 (47.3) 12,324 (46.4) 1,669 (6.3) 26,562 (92.6)West Virginia 1,724 (87.8) 209 (10.6) 30 (1.5) 1,963 (99.0)Total 253,865 (52.4) 194,694 (40.2) 35,577 (7.3) 484,136 (95.3)
Abortion rate†† 10.0 34.0 21.0 14.7Abortion ratio§§ 152 471 279 219
* Data from 35 reporting areas; excludes 17 states (California, Connecticut, Florida, Hawaii, Illinois, Maryland, Massachusetts, Nebraska, Nevada, New Hampshire, New Mexico, Rhode Island, Texas, Utah, Washington, Wisconsin, and Wyoming) that did not report, did not report by race, or did not meet reporting standards.
† Percentages for the individual component categories might not add to 100 because of rounding. § Calculated as the number of abortions reported by known race, divided by the sum of abortions reported by known and unknown race. ¶ Because reporting is not mandatory, information could not be obtained for all abortions performed in the District of Columbia. ** Data from hospitals and licensed ambulatory care facilities only; because reporting is not mandatory for private physicians and women’s centers, information could
not be obtained for all abortions performed in New Jersey. †† Number of abortions obtained by women in a given racial group per 1,000 women in that same group. For each state, abortions for women of unknown race were
distributed according to the distribution of abortions among women of known race for that state. §§ Number of abortions obtained by women in a given racial group per 1,000 live births to women in that same racial group. For each state, abortions for women of
unknown race were distributed according to the distribution of abortions among women of known race for that state.
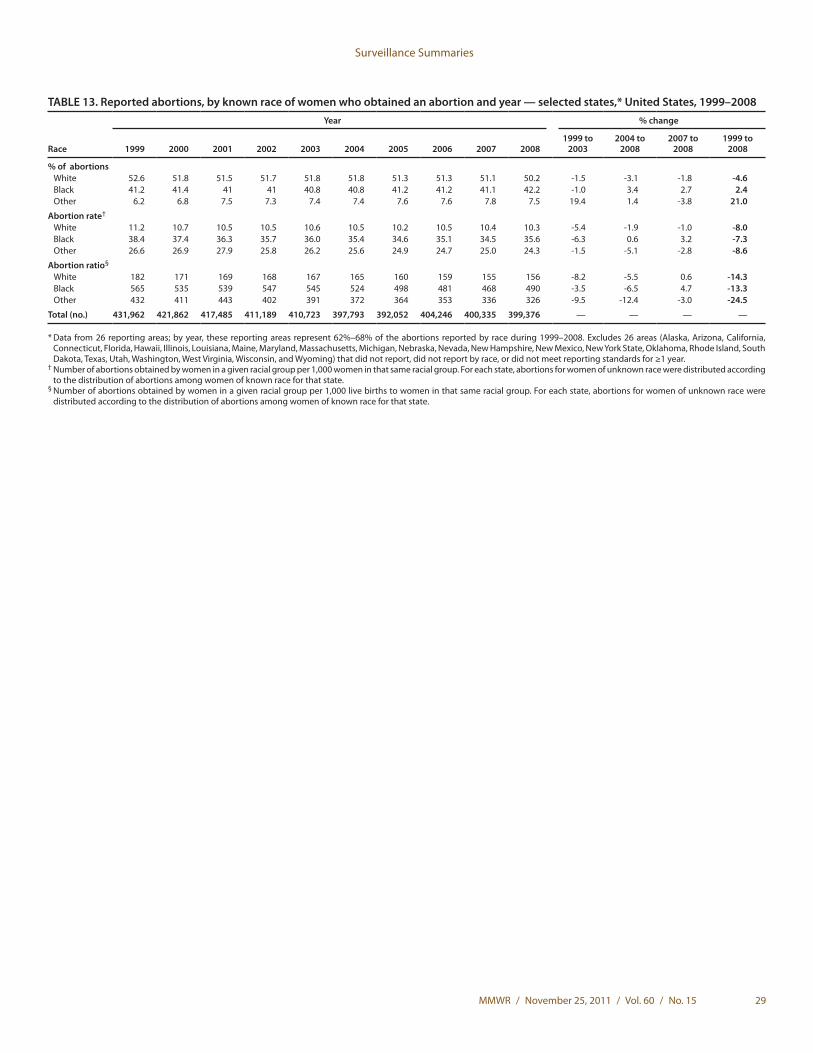
Surveillance Summaries
MMWR / November 25, 2011 / Vol. 60 / No. 15 29
TABLE 13. Reported abortions, by known race of women who obtained an abortion and year — selected states,* United States, 1999–2008
Race
Year % change
1999 2000 2001 2002 2003 2004 2005 2006 2007 20081999 to
20032004 to
20082007 to
20081999 to
2008
% of abortionsWhite 52.6 51.8 51.5 51.7 51.8 51.8 51.3 51.3 51.1 50.2 -1.5 -3.1 -1.8 -4.6Black 41.2 41.4 41 41 40.8 40.8 41.2 41.2 41.1 42.2 -1.0 3.4 2.7 2.4Other 6.2 6.8 7.5 7.3 7.4 7.4 7.6 7.6 7.8 7.5 19.4 1.4 -3.8 21.0
Abortion rate†
White 11.2 10.7 10.5 10.5 10.6 10.5 10.2 10.5 10.4 10.3 -5.4 -1.9 -1.0 -8.0Black 38.4 37.4 36.3 35.7 36.0 35.4 34.6 35.1 34.5 35.6 -6.3 0.6 3.2 -7.3Other 26.6 26.9 27.9 25.8 26.2 25.6 24.9 24.7 25.0 24.3 -1.5 -5.1 -2.8 -8.6
Abortion ratio§
White 182 171 169 168 167 165 160 159 155 156 -8.2 -5.5 0.6 -14.3Black 565 535 539 547 545 524 498 481 468 490 -3.5 -6.5 4.7 -13.3Other 432 411 443 402 391 372 364 353 336 326 -9.5 -12.4 -3.0 -24.5
Total (no.) 431,962 421,862 417,485 411,189 410,723 397,793 392,052 404,246 400,335 399,376 — — — —
* Data from 26 reporting areas; by year, these reporting areas represent 62%–68% of the abortions reported by race during 1999–2008. Excludes 26 areas (Alaska, Arizona, California, Connecticut, Florida, Hawaii, Illinois, Louisiana, Maine, Maryland, Massachusetts, Michigan, Nebraska, Nevada, New Hampshire, New Mexico, New York State, Oklahoma, Rhode Island, South Dakota, Texas, Utah, Washington, West Virginia, Wisconsin, and Wyoming) that did not report, did not report by race, or did not meet reporting standards for ≥1 year.
† Number of abortions obtained by women in a given racial group per 1,000 women in that same racial group. For each state, abortions for women of unknown race were distributed according to the distribution of abortions among women of known race for that state.
§ Number of abortions obtained by women in a given racial group per 1,000 live births to women in that same racial group. For each state, abortions for women of unknown race were distributed according to the distribution of abortions among women of known race for that state.
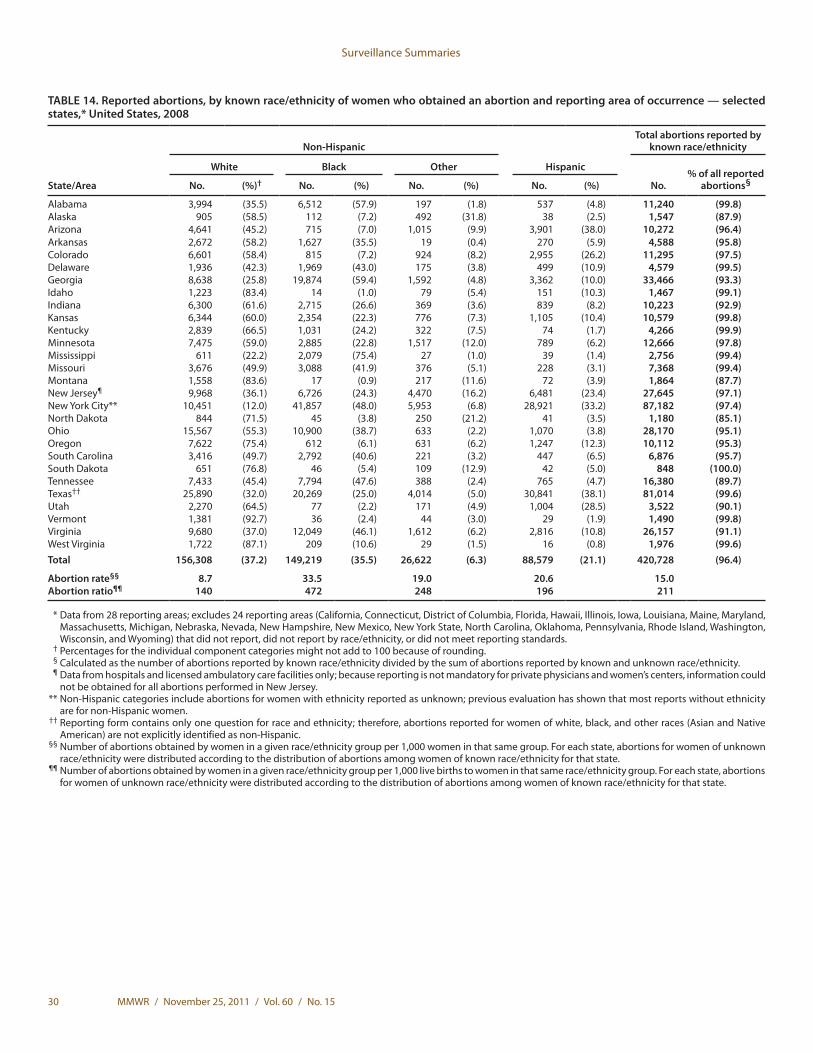
Surveillance Summaries
30 MMWR / November 25, 2011 / Vol. 60 / No. 15
TABLE 14. Reported abortions, by known race/ethnicity of women who obtained an abortion and reporting area of occurrence — selected states,* United States, 2008
State/Area
Non-Hispanic
Hispanic
Total abortions reported by known race/ethnicity
White Black Other
No.% of all reported
abortions§No. (%)† No. (%) No. (%) No. (%)
Alabama 3,994 (35.5) 6,512 (57.9) 197 (1.8) 537 (4.8) 11,240 (99.8)Alaska 905 (58.5) 112 (7.2) 492 (31.8) 38 (2.5) 1,547 (87.9)Arizona 4,641 (45.2) 715 (7.0) 1,015 (9.9) 3,901 (38.0) 10,272 (96.4)Arkansas 2,672 (58.2) 1,627 (35.5) 19 (0.4) 270 (5.9) 4,588 (95.8)Colorado 6,601 (58.4) 815 (7.2) 924 (8.2) 2,955 (26.2) 11,295 (97.5)Delaware 1,936 (42.3) 1,969 (43.0) 175 (3.8) 499 (10.9) 4,579 (99.5)Georgia 8,638 (25.8) 19,874 (59.4) 1,592 (4.8) 3,362 (10.0) 33,466 (93.3)Idaho 1,223 (83.4) 14 (1.0) 79 (5.4) 151 (10.3) 1,467 (99.1)Indiana 6,300 (61.6) 2,715 (26.6) 369 (3.6) 839 (8.2) 10,223 (92.9)Kansas 6,344 (60.0) 2,354 (22.3) 776 (7.3) 1,105 (10.4) 10,579 (99.8)Kentucky 2,839 (66.5) 1,031 (24.2) 322 (7.5) 74 (1.7) 4,266 (99.9)Minnesota 7,475 (59.0) 2,885 (22.8) 1,517 (12.0) 789 (6.2) 12,666 (97.8)Mississippi 611 (22.2) 2,079 (75.4) 27 (1.0) 39 (1.4) 2,756 (99.4)Missouri 3,676 (49.9) 3,088 (41.9) 376 (5.1) 228 (3.1) 7,368 (99.4)Montana 1,558 (83.6) 17 (0.9) 217 (11.6) 72 (3.9) 1,864 (87.7)New Jersey¶ 9,968 (36.1) 6,726 (24.3) 4,470 (16.2) 6,481 (23.4) 27,645 (97.1)New York City** 10,451 (12.0) 41,857 (48.0) 5,953 (6.8) 28,921 (33.2) 87,182 (97.4)North Dakota 844 (71.5) 45 (3.8) 250 (21.2) 41 (3.5) 1,180 (85.1)Ohio 15,567 (55.3) 10,900 (38.7) 633 (2.2) 1,070 (3.8) 28,170 (95.1)Oregon 7,622 (75.4) 612 (6.1) 631 (6.2) 1,247 (12.3) 10,112 (95.3)South Carolina 3,416 (49.7) 2,792 (40.6) 221 (3.2) 447 (6.5) 6,876 (95.7)South Dakota 651 (76.8) 46 (5.4) 109 (12.9) 42 (5.0) 848 (100.0)Tennessee 7,433 (45.4) 7,794 (47.6) 388 (2.4) 765 (4.7) 16,380 (89.7)Texas†† 25,890 (32.0) 20,269 (25.0) 4,014 (5.0) 30,841 (38.1) 81,014 (99.6)Utah 2,270 (64.5) 77 (2.2) 171 (4.9) 1,004 (28.5) 3,522 (90.1)Vermont 1,381 (92.7) 36 (2.4) 44 (3.0) 29 (1.9) 1,490 (99.8)Virginia 9,680 (37.0) 12,049 (46.1) 1,612 (6.2) 2,816 (10.8) 26,157 (91.1)West Virginia 1,722 (87.1) 209 (10.6) 29 (1.5) 16 (0.8) 1,976 (99.6)Total 156,308 (37.2) 149,219 (35.5) 26,622 (6.3) 88,579 (21.1) 420,728 (96.4)
Abortion rate§§ 8.7 33.5 19.0 20.6 15.0Abortion ratio¶¶ 140 472 248 196 211
* Data from 28 reporting areas; excludes 24 reporting areas (California, Connecticut, District of Columbia, Florida, Hawaii, Illinois, Iowa, Louisiana, Maine, Maryland, Massachusetts, Michigan, Nebraska, Nevada, New Hampshire, New Mexico, New York State, North Carolina, Oklahoma, Pennsylvania, Rhode Island, Washington, Wisconsin, and Wyoming) that did not report, did not report by race/ethnicity, or did not meet reporting standards.
† Percentages for the individual component categories might not add to 100 because of rounding. § Calculated as the number of abortions reported by known race/ethnicity divided by the sum of abortions reported by known and unknown race/ethnicity. ¶ Data from hospitals and licensed ambulatory care facilities only; because reporting is not mandatory for private physicians and women’s centers, information could
not be obtained for all abortions performed in New Jersey. ** Non-Hispanic categories include abortions for women with ethnicity reported as unknown; previous evaluation has shown that most reports without ethnicity
are for non-Hispanic women. †† Reporting form contains only one question for race and ethnicity; therefore, abortions reported for women of white, black, and other races (Asian and Native
American) are not explicitly identified as non-Hispanic. §§ Number of abortions obtained by women in a given race/ethnicity group per 1,000 women in that same group. For each state, abortions for women of unknown
race/ethnicity were distributed according to the distribution of abortions among women of known race/ethnicity for that state. ¶¶ Number of abortions obtained by women in a given race/ethnicity group per 1,000 live births to women in that same race/ethnicity group. For each state, abortions
for women of unknown race/ethnicity were distributed according to the distribution of abortions among women of known race/ethnicity for that state.
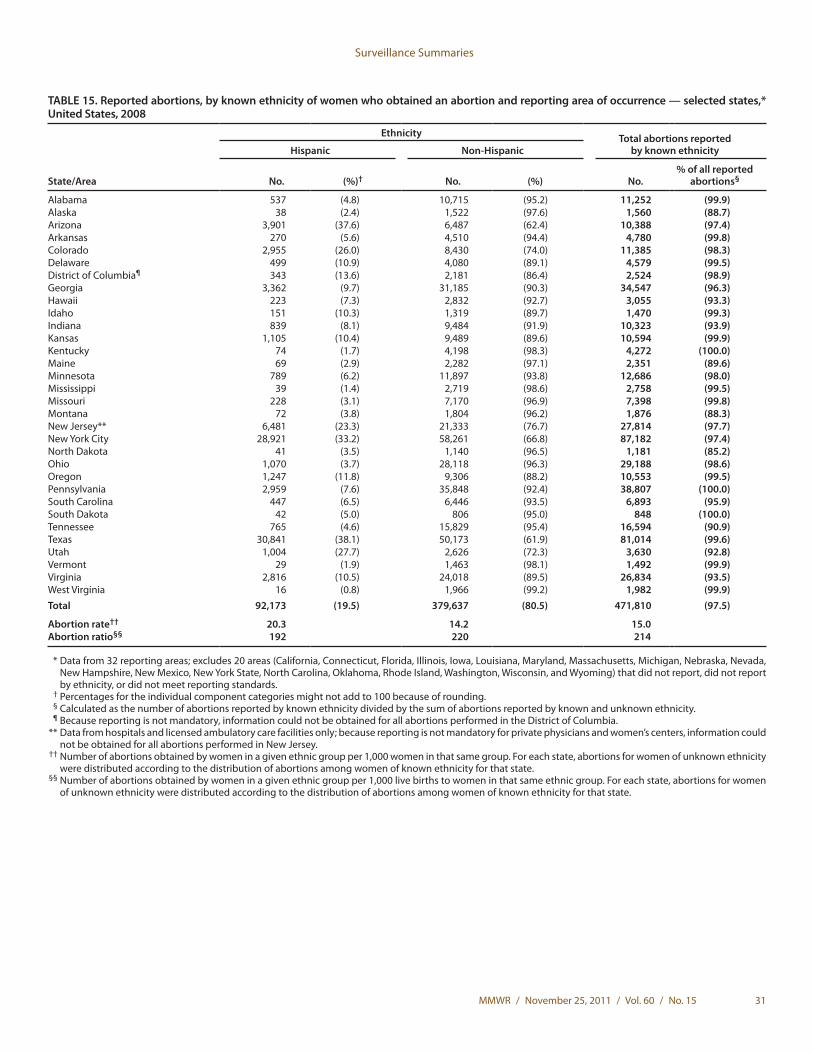
Surveillance Summaries
MMWR / November 25, 2011 / Vol. 60 / No. 15 31
TABLE 15. Reported abortions, by known ethnicity of women who obtained an abortion and reporting area of occurrence — selected states,* United States, 2008
State/Area
Ethnicity Total abortions reported by known ethnicityHispanic Non-Hispanic
No. (%)† No. (%) No.% of all reported
abortions§
Alabama 537 (4.8) 10,715 (95.2) 11,252 (99.9)Alaska 38 (2.4) 1,522 (97.6) 1,560 (88.7)Arizona 3,901 (37.6) 6,487 (62.4) 10,388 (97.4)Arkansas 270 (5.6) 4,510 (94.4) 4,780 (99.8)Colorado 2,955 (26.0) 8,430 (74.0) 11,385 (98.3)Delaware 499 (10.9) 4,080 (89.1) 4,579 (99.5)District of Columbia¶ 343 (13.6) 2,181 (86.4) 2,524 (98.9)Georgia 3,362 (9.7) 31,185 (90.3) 34,547 (96.3)Hawaii 223 (7.3) 2,832 (92.7) 3,055 (93.3)Idaho 151 (10.3) 1,319 (89.7) 1,470 (99.3)Indiana 839 (8.1) 9,484 (91.9) 10,323 (93.9)Kansas 1,105 (10.4) 9,489 (89.6) 10,594 (99.9)Kentucky 74 (1.7) 4,198 (98.3) 4,272 (100.0)Maine 69 (2.9) 2,282 (97.1) 2,351 (89.6)Minnesota 789 (6.2) 11,897 (93.8) 12,686 (98.0)Mississippi 39 (1.4) 2,719 (98.6) 2,758 (99.5)Missouri 228 (3.1) 7,170 (96.9) 7,398 (99.8)Montana 72 (3.8) 1,804 (96.2) 1,876 (88.3)New Jersey** 6,481 (23.3) 21,333 (76.7) 27,814 (97.7)New York City 28,921 (33.2) 58,261 (66.8) 87,182 (97.4)North Dakota 41 (3.5) 1,140 (96.5) 1,181 (85.2)Ohio 1,070 (3.7) 28,118 (96.3) 29,188 (98.6)Oregon 1,247 (11.8) 9,306 (88.2) 10,553 (99.5)Pennsylvania 2,959 (7.6) 35,848 (92.4) 38,807 (100.0)South Carolina 447 (6.5) 6,446 (93.5) 6,893 (95.9)South Dakota 42 (5.0) 806 (95.0) 848 (100.0)Tennessee 765 (4.6) 15,829 (95.4) 16,594 (90.9)Texas 30,841 (38.1) 50,173 (61.9) 81,014 (99.6)Utah 1,004 (27.7) 2,626 (72.3) 3,630 (92.8)Vermont 29 (1.9) 1,463 (98.1) 1,492 (99.9)Virginia 2,816 (10.5) 24,018 (89.5) 26,834 (93.5)West Virginia 16 (0.8) 1,966 (99.2) 1,982 (99.9)Total 92,173 (19.5) 379,637 (80.5) 471,810 (97.5)
Abortion rate†† 20.3 14.2 15.0Abortion ratio§§ 192 220 214
* Data from 32 reporting areas; excludes 20 areas (California, Connecticut, Florida, Illinois, Iowa, Louisiana, Maryland, Massachusetts, Michigan, Nebraska, Nevada, New Hampshire, New Mexico, New York State, North Carolina, Oklahoma, Rhode Island, Washington, Wisconsin, and Wyoming) that did not report, did not report by ethnicity, or did not meet reporting standards.
† Percentages for the individual component categories might not add to 100 because of rounding. § Calculated as the number of abortions reported by known ethnicity divided by the sum of abortions reported by known and unknown ethnicity. ¶ Because reporting is not mandatory, information could not be obtained for all abortions performed in the District of Columbia. ** Data from hospitals and licensed ambulatory care facilities only; because reporting is not mandatory for private physicians and women’s centers, information could
not be obtained for all abortions performed in New Jersey. †† Number of abortions obtained by women in a given ethnic group per 1,000 women in that same group. For each state, abortions for women of unknown ethnicity
were distributed according to the distribution of abortions among women of known ethnicity for that state. §§ Number of abortions obtained by women in a given ethnic group per 1,000 live births to women in that same ethnic group. For each state, abortions for women
of unknown ethnicity were distributed according to the distribution of abortions among women of known ethnicity for that state.
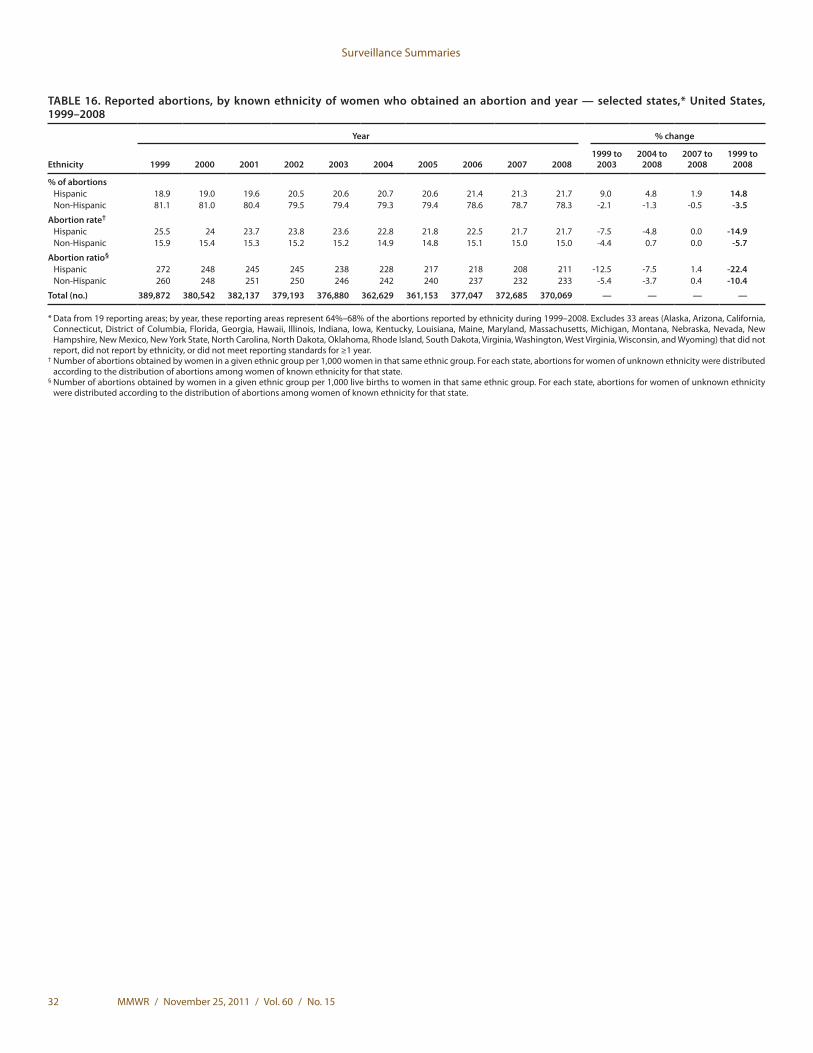
Surveillance Summaries
32 MMWR / November 25, 2011 / Vol. 60 / No. 15
TABLE 16. Reported abortions, by known ethnicity of women who obtained an abortion and year — selected states,* United States, 1999–2008
Ethnicity
Year % change
1999 2000 2001 2002 2003 2004 2005 2006 2007 20081999 to
20032004 to
20082007 to
20081999 to
2008
% of abortionsHispanic 18.9 19.0 19.6 20.5 20.6 20.7 20.6 21.4 21.3 21.7 9.0 4.8 1.9 14.8Non-Hispanic 81.1 81.0 80.4 79.5 79.4 79.3 79.4 78.6 78.7 78.3 -2.1 -1.3 -0.5 -3.5
Abortion rate†
Hispanic 25.5 24 23.7 23.8 23.6 22.8 21.8 22.5 21.7 21.7 -7.5 -4.8 0.0 -14.9Non-Hispanic 15.9 15.4 15.3 15.2 15.2 14.9 14.8 15.1 15.0 15.0 -4.4 0.7 0.0 -5.7
Abortion ratio§
Hispanic 272 248 245 245 238 228 217 218 208 211 -12.5 -7.5 1.4 -22.4Non-Hispanic 260 248 251 250 246 242 240 237 232 233 -5.4 -3.7 0.4 -10.4
Total (no.) 389,872 380,542 382,137 379,193 376,880 362,629 361,153 377,047 372,685 370,069 — — — —
* Data from 19 reporting areas; by year, these reporting areas represent 64%–68% of the abortions reported by ethnicity during 1999–2008. Excludes 33 areas (Alaska, Arizona, California, Connecticut, District of Columbia, Florida, Georgia, Hawaii, Illinois, Indiana, Iowa, Kentucky, Louisiana, Maine, Maryland, Massachusetts, Michigan, Montana, Nebraska, Nevada, New Hampshire, New Mexico, New York State, North Carolina, North Dakota, Oklahoma, Rhode Island, South Dakota, Virginia, Washington, West Virginia, Wisconsin, and Wyoming) that did not report, did not report by ethnicity, or did not meet reporting standards for ≥1 year.
† Number of abortions obtained by women in a given ethnic group per 1,000 women in that same ethnic group. For each state, abortions for women of unknown ethnicity were distributed according to the distribution of abortions among women of known ethnicity for that state.
§ Number of abortions obtained by women in a given ethnic group per 1,000 live births to women in that same ethnic group. For each state, abortions for women of unknown ethnicity were distributed according to the distribution of abortions among women of known ethnicity for that state.
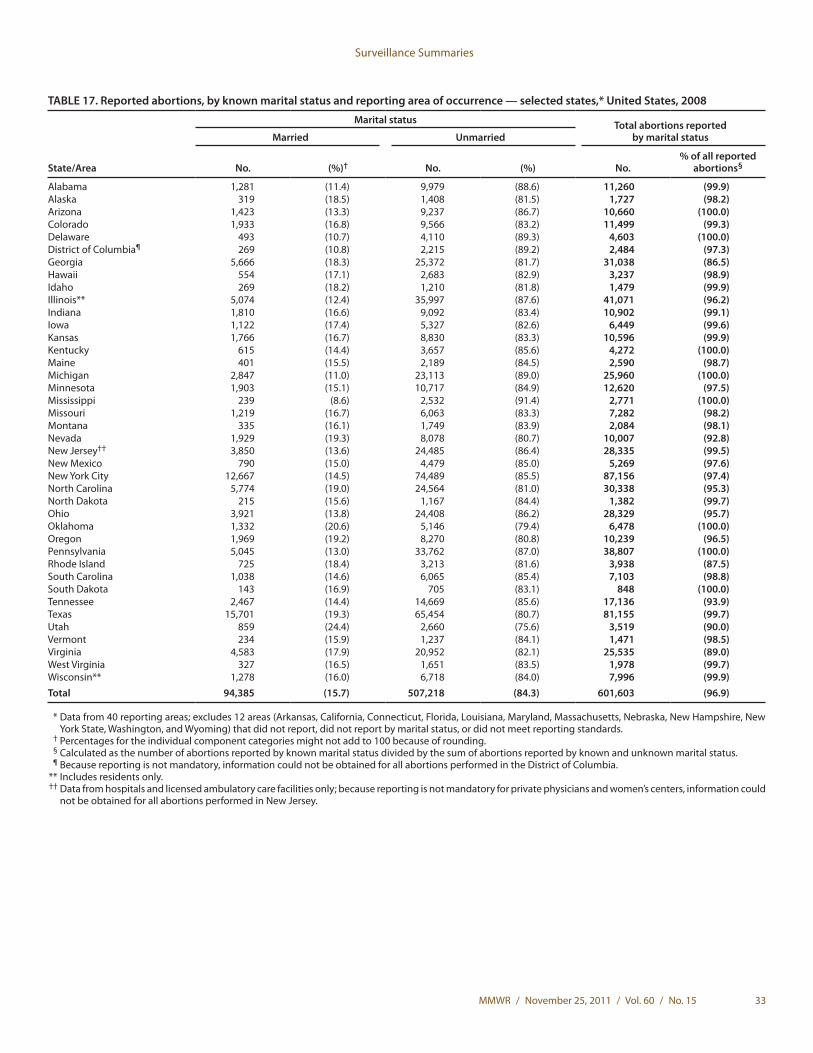
Surveillance Summaries
MMWR / November 25, 2011 / Vol. 60 / No. 15 33
TABLE 17. Reported abortions, by known marital status and reporting area of occurrence — selected states,* United States, 2008
State/Area
Marital status Total abortions reported by marital statusMarried Unmarried
No. (%)† No. (%) No.% of all reported
abortions§
Alabama 1,281 (11.4) 9,979 (88.6) 11,260 (99.9)Alaska 319 (18.5) 1,408 (81.5) 1,727 (98.2)Arizona 1,423 (13.3) 9,237 (86.7) 10,660 (100.0)Colorado 1,933 (16.8) 9,566 (83.2) 11,499 (99.3)Delaware 493 (10.7) 4,110 (89.3) 4,603 (100.0)District of Columbia¶ 269 (10.8) 2,215 (89.2) 2,484 (97.3)Georgia 5,666 (18.3) 25,372 (81.7) 31,038 (86.5)Hawaii 554 (17.1) 2,683 (82.9) 3,237 (98.9)Idaho 269 (18.2) 1,210 (81.8) 1,479 (99.9)Illinois** 5,074 (12.4) 35,997 (87.6) 41,071 (96.2)Indiana 1,810 (16.6) 9,092 (83.4) 10,902 (99.1)Iowa 1,122 (17.4) 5,327 (82.6) 6,449 (99.6)Kansas 1,766 (16.7) 8,830 (83.3) 10,596 (99.9)Kentucky 615 (14.4) 3,657 (85.6) 4,272 (100.0)Maine 401 (15.5) 2,189 (84.5) 2,590 (98.7)Michigan 2,847 (11.0) 23,113 (89.0) 25,960 (100.0)Minnesota 1,903 (15.1) 10,717 (84.9) 12,620 (97.5)Mississippi 239 (8.6) 2,532 (91.4) 2,771 (100.0)Missouri 1,219 (16.7) 6,063 (83.3) 7,282 (98.2)Montana 335 (16.1) 1,749 (83.9) 2,084 (98.1)Nevada 1,929 (19.3) 8,078 (80.7) 10,007 (92.8)New Jersey†† 3,850 (13.6) 24,485 (86.4) 28,335 (99.5)New Mexico 790 (15.0) 4,479 (85.0) 5,269 (97.6)New York City 12,667 (14.5) 74,489 (85.5) 87,156 (97.4)North Carolina 5,774 (19.0) 24,564 (81.0) 30,338 (95.3)North Dakota 215 (15.6) 1,167 (84.4) 1,382 (99.7)Ohio 3,921 (13.8) 24,408 (86.2) 28,329 (95.7)Oklahoma 1,332 (20.6) 5,146 (79.4) 6,478 (100.0)Oregon 1,969 (19.2) 8,270 (80.8) 10,239 (96.5)Pennsylvania 5,045 (13.0) 33,762 (87.0) 38,807 (100.0)Rhode Island 725 (18.4) 3,213 (81.6) 3,938 (87.5)South Carolina 1,038 (14.6) 6,065 (85.4) 7,103 (98.8)South Dakota 143 (16.9) 705 (83.1) 848 (100.0)Tennessee 2,467 (14.4) 14,669 (85.6) 17,136 (93.9)Texas 15,701 (19.3) 65,454 (80.7) 81,155 (99.7)Utah 859 (24.4) 2,660 (75.6) 3,519 (90.0)Vermont 234 (15.9) 1,237 (84.1) 1,471 (98.5)Virginia 4,583 (17.9) 20,952 (82.1) 25,535 (89.0)West Virginia 327 (16.5) 1,651 (83.5) 1,978 (99.7)Wisconsin** 1,278 (16.0) 6,718 (84.0) 7,996 (99.9)Total 94,385 (15.7) 507,218 (84.3) 601,603 (96.9)
* Data from 40 reporting areas; excludes 12 areas (Arkansas, California, Connecticut, Florida, Louisiana, Maryland, Massachusetts, Nebraska, New Hampshire, New York State, Washington, and Wyoming) that did not report, did not report by marital status, or did not meet reporting standards.
† Percentages for the individual component categories might not add to 100 because of rounding. § Calculated as the number of abortions reported by known marital status divided by the sum of abortions reported by known and unknown marital status. ¶ Because reporting is not mandatory, information could not be obtained for all abortions performed in the District of Columbia. ** Includes residents only. †† Data from hospitals and licensed ambulatory care facilities only; because reporting is not mandatory for private physicians and women’s centers, information could
not be obtained for all abortions performed in New Jersey.
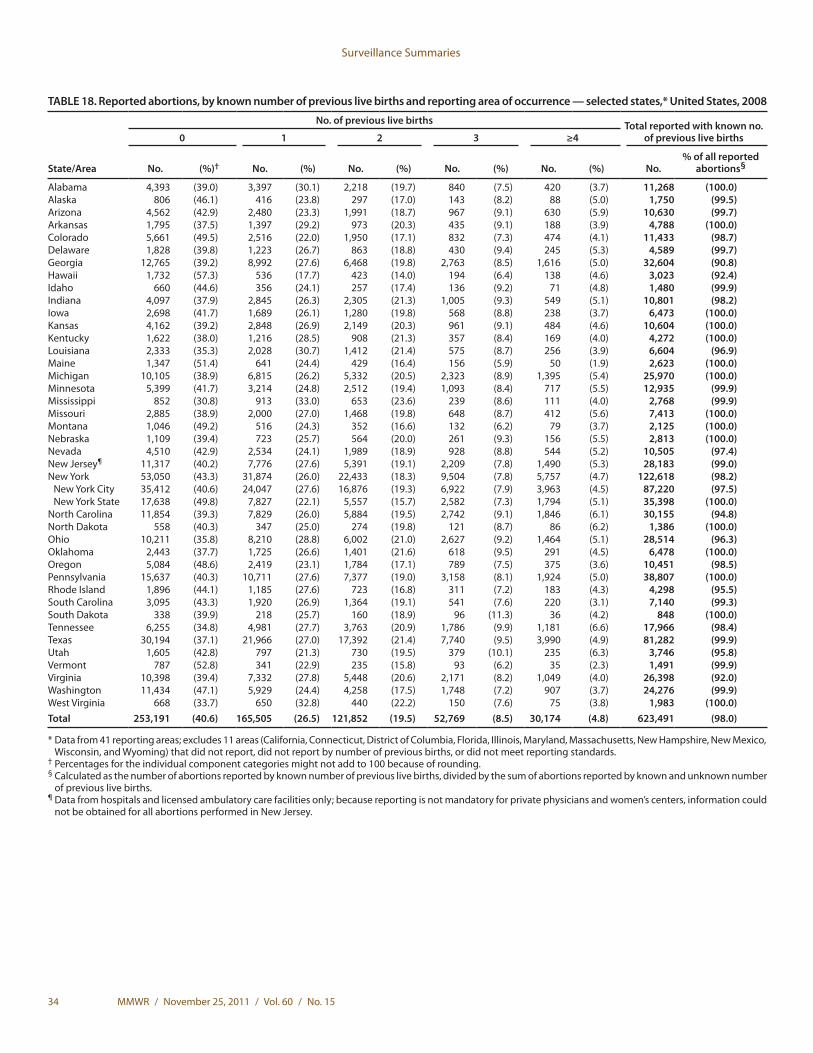
Surveillance Summaries
34 MMWR / November 25, 2011 / Vol. 60 / No. 15
TABLE 18. Reported abortions, by known number of previous live births and reporting area of occurrence — selected states,* United States, 2008
State/Area
No. of previous live births Total reported with known no. of previous live births0 1 2 3 ≥4
No. (%)† No. (%) No. (%) No. (%) No. (%) No.% of all reported
abortions§
Alabama 4,393 (39.0) 3,397 (30.1) 2,218 (19.7) 840 (7.5) 420 (3.7) 11,268 (100.0)Alaska 806 (46.1) 416 (23.8) 297 (17.0) 143 (8.2) 88 (5.0) 1,750 (99.5)Arizona 4,562 (42.9) 2,480 (23.3) 1,991 (18.7) 967 (9.1) 630 (5.9) 10,630 (99.7)Arkansas 1,795 (37.5) 1,397 (29.2) 973 (20.3) 435 (9.1) 188 (3.9) 4,788 (100.0)Colorado 5,661 (49.5) 2,516 (22.0) 1,950 (17.1) 832 (7.3) 474 (4.1) 11,433 (98.7)Delaware 1,828 (39.8) 1,223 (26.7) 863 (18.8) 430 (9.4) 245 (5.3) 4,589 (99.7)Georgia 12,765 (39.2) 8,992 (27.6) 6,468 (19.8) 2,763 (8.5) 1,616 (5.0) 32,604 (90.8)Hawaii 1,732 (57.3) 536 (17.7) 423 (14.0) 194 (6.4) 138 (4.6) 3,023 (92.4)Idaho 660 (44.6) 356 (24.1) 257 (17.4) 136 (9.2) 71 (4.8) 1,480 (99.9)Indiana 4,097 (37.9) 2,845 (26.3) 2,305 (21.3) 1,005 (9.3) 549 (5.1) 10,801 (98.2)Iowa 2,698 (41.7) 1,689 (26.1) 1,280 (19.8) 568 (8.8) 238 (3.7) 6,473 (100.0)Kansas 4,162 (39.2) 2,848 (26.9) 2,149 (20.3) 961 (9.1) 484 (4.6) 10,604 (100.0)Kentucky 1,622 (38.0) 1,216 (28.5) 908 (21.3) 357 (8.4) 169 (4.0) 4,272 (100.0)Louisiana 2,333 (35.3) 2,028 (30.7) 1,412 (21.4) 575 (8.7) 256 (3.9) 6,604 (96.9)Maine 1,347 (51.4) 641 (24.4) 429 (16.4) 156 (5.9) 50 (1.9) 2,623 (100.0)Michigan 10,105 (38.9) 6,815 (26.2) 5,332 (20.5) 2,323 (8.9) 1,395 (5.4) 25,970 (100.0)Minnesota 5,399 (41.7) 3,214 (24.8) 2,512 (19.4) 1,093 (8.4) 717 (5.5) 12,935 (99.9)Mississippi 852 (30.8) 913 (33.0) 653 (23.6) 239 (8.6) 111 (4.0) 2,768 (99.9)Missouri 2,885 (38.9) 2,000 (27.0) 1,468 (19.8) 648 (8.7) 412 (5.6) 7,413 (100.0)Montana 1,046 (49.2) 516 (24.3) 352 (16.6) 132 (6.2) 79 (3.7) 2,125 (100.0)Nebraska 1,109 (39.4) 723 (25.7) 564 (20.0) 261 (9.3) 156 (5.5) 2,813 (100.0)Nevada 4,510 (42.9) 2,534 (24.1) 1,989 (18.9) 928 (8.8) 544 (5.2) 10,505 (97.4)New Jersey¶ 11,317 (40.2) 7,776 (27.6) 5,391 (19.1) 2,209 (7.8) 1,490 (5.3) 28,183 (99.0)New York 53,050 (43.3) 31,874 (26.0) 22,433 (18.3) 9,504 (7.8) 5,757 (4.7) 122,618 (98.2)
New York City 35,412 (40.6) 24,047 (27.6) 16,876 (19.3) 6,922 (7.9) 3,963 (4.5) 87,220 (97.5)New York State 17,638 (49.8) 7,827 (22.1) 5,557 (15.7) 2,582 (7.3) 1,794 (5.1) 35,398 (100.0)
North Carolina 11,854 (39.3) 7,829 (26.0) 5,884 (19.5) 2,742 (9.1) 1,846 (6.1) 30,155 (94.8)North Dakota 558 (40.3) 347 (25.0) 274 (19.8) 121 (8.7) 86 (6.2) 1,386 (100.0)Ohio 10,211 (35.8) 8,210 (28.8) 6,002 (21.0) 2,627 (9.2) 1,464 (5.1) 28,514 (96.3)Oklahoma 2,443 (37.7) 1,725 (26.6) 1,401 (21.6) 618 (9.5) 291 (4.5) 6,478 (100.0)Oregon 5,084 (48.6) 2,419 (23.1) 1,784 (17.1) 789 (7.5) 375 (3.6) 10,451 (98.5)Pennsylvania 15,637 (40.3) 10,711 (27.6) 7,377 (19.0) 3,158 (8.1) 1,924 (5.0) 38,807 (100.0)Rhode Island 1,896 (44.1) 1,185 (27.6) 723 (16.8) 311 (7.2) 183 (4.3) 4,298 (95.5)South Carolina 3,095 (43.3) 1,920 (26.9) 1,364 (19.1) 541 (7.6) 220 (3.1) 7,140 (99.3)South Dakota 338 (39.9) 218 (25.7) 160 (18.9) 96 (11.3) 36 (4.2) 848 (100.0)Tennessee 6,255 (34.8) 4,981 (27.7) 3,763 (20.9) 1,786 (9.9) 1,181 (6.6) 17,966 (98.4)Texas 30,194 (37.1) 21,966 (27.0) 17,392 (21.4) 7,740 (9.5) 3,990 (4.9) 81,282 (99.9)Utah 1,605 (42.8) 797 (21.3) 730 (19.5) 379 (10.1) 235 (6.3) 3,746 (95.8)Vermont 787 (52.8) 341 (22.9) 235 (15.8) 93 (6.2) 35 (2.3) 1,491 (99.9)Virginia 10,398 (39.4) 7,332 (27.8) 5,448 (20.6) 2,171 (8.2) 1,049 (4.0) 26,398 (92.0)Washington 11,434 (47.1) 5,929 (24.4) 4,258 (17.5) 1,748 (7.2) 907 (3.7) 24,276 (99.9)West Virginia 668 (33.7) 650 (32.8) 440 (22.2) 150 (7.6) 75 (3.8) 1,983 (100.0)Total 253,191 (40.6) 165,505 (26.5) 121,852 (19.5) 52,769 (8.5) 30,174 (4.8) 623,491 (98.0)
* Data from 41 reporting areas; excludes 11 areas (California, Connecticut, District of Columbia, Florida, Illinois, Maryland, Massachusetts, New Hampshire, New Mexico, Wisconsin, and Wyoming) that did not report, did not report by number of previous births, or did not meet reporting standards.
† Percentages for the individual component categories might not add to 100 because of rounding. § Calculated as the number of abortions reported by known number of previous live births, divided by the sum of abortions reported by known and unknown number
of previous live births. ¶ Data from hospitals and licensed ambulatory care facilities only; because reporting is not mandatory for private physicians and women’s centers, information could
not be obtained for all abortions performed in New Jersey.
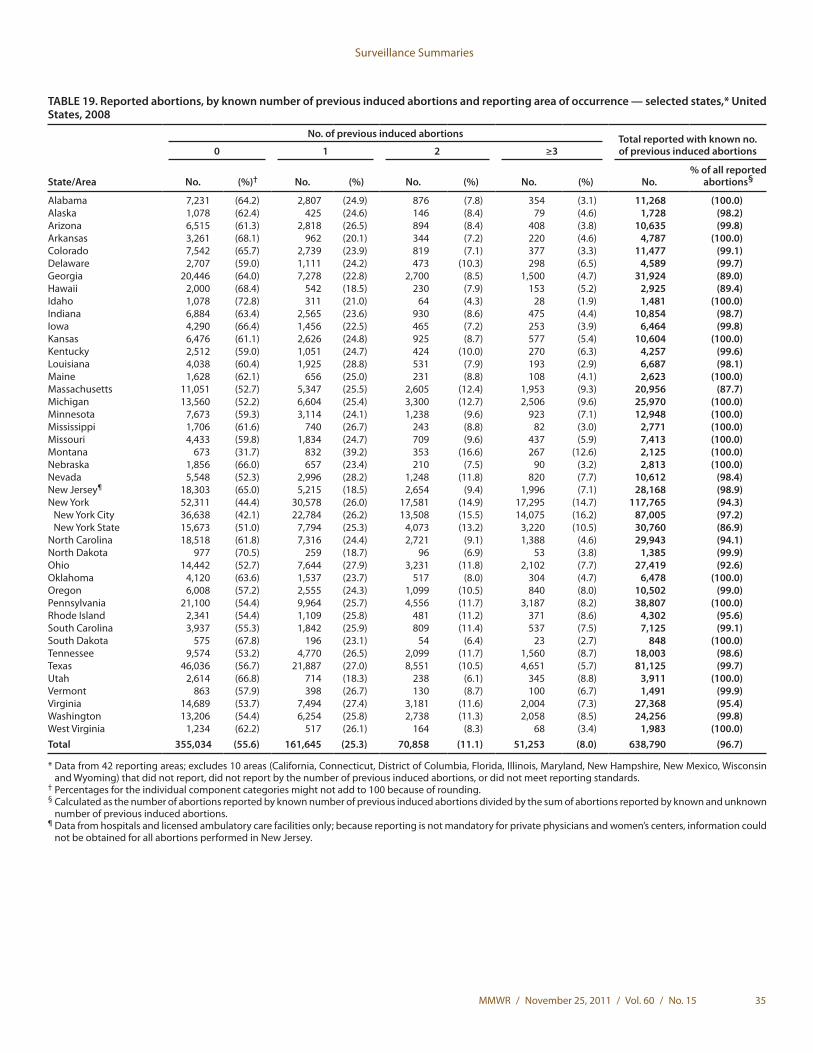
Surveillance Summaries
MMWR / November 25, 2011 / Vol. 60 / No. 15 35
TABLE 19. Reported abortions, by known number of previous induced abortions and reporting area of occurrence — selected states,* United States, 2008
State/Area
No. of previous induced abortions Total reported with known no. of previous induced abortions0 1 2 ≥3
No. (%)† No. (%) No. (%) No. (%) No.% of all reported
abortions§
Alabama 7,231 (64.2) 2,807 (24.9) 876 (7.8) 354 (3.1) 11,268 (100.0)Alaska 1,078 (62.4) 425 (24.6) 146 (8.4) 79 (4.6) 1,728 (98.2)Arizona 6,515 (61.3) 2,818 (26.5) 894 (8.4) 408 (3.8) 10,635 (99.8)Arkansas 3,261 (68.1) 962 (20.1) 344 (7.2) 220 (4.6) 4,787 (100.0)Colorado 7,542 (65.7) 2,739 (23.9) 819 (7.1) 377 (3.3) 11,477 (99.1)Delaware 2,707 (59.0) 1,111 (24.2) 473 (10.3) 298 (6.5) 4,589 (99.7)Georgia 20,446 (64.0) 7,278 (22.8) 2,700 (8.5) 1,500 (4.7) 31,924 (89.0)Hawaii 2,000 (68.4) 542 (18.5) 230 (7.9) 153 (5.2) 2,925 (89.4)Idaho 1,078 (72.8) 311 (21.0) 64 (4.3) 28 (1.9) 1,481 (100.0)Indiana 6,884 (63.4) 2,565 (23.6) 930 (8.6) 475 (4.4) 10,854 (98.7)Iowa 4,290 (66.4) 1,456 (22.5) 465 (7.2) 253 (3.9) 6,464 (99.8)Kansas 6,476 (61.1) 2,626 (24.8) 925 (8.7) 577 (5.4) 10,604 (100.0)Kentucky 2,512 (59.0) 1,051 (24.7) 424 (10.0) 270 (6.3) 4,257 (99.6)Louisiana 4,038 (60.4) 1,925 (28.8) 531 (7.9) 193 (2.9) 6,687 (98.1)Maine 1,628 (62.1) 656 (25.0) 231 (8.8) 108 (4.1) 2,623 (100.0)Massachusetts 11,051 (52.7) 5,347 (25.5) 2,605 (12.4) 1,953 (9.3) 20,956 (87.7)Michigan 13,560 (52.2) 6,604 (25.4) 3,300 (12.7) 2,506 (9.6) 25,970 (100.0)Minnesota 7,673 (59.3) 3,114 (24.1) 1,238 (9.6) 923 (7.1) 12,948 (100.0)Mississippi 1,706 (61.6) 740 (26.7) 243 (8.8) 82 (3.0) 2,771 (100.0)Missouri 4,433 (59.8) 1,834 (24.7) 709 (9.6) 437 (5.9) 7,413 (100.0)Montana 673 (31.7) 832 (39.2) 353 (16.6) 267 (12.6) 2,125 (100.0)Nebraska 1,856 (66.0) 657 (23.4) 210 (7.5) 90 (3.2) 2,813 (100.0)Nevada 5,548 (52.3) 2,996 (28.2) 1,248 (11.8) 820 (7.7) 10,612 (98.4)New Jersey¶ 18,303 (65.0) 5,215 (18.5) 2,654 (9.4) 1,996 (7.1) 28,168 (98.9)New York 52,311 (44.4) 30,578 (26.0) 17,581 (14.9) 17,295 (14.7) 117,765 (94.3)
New York City 36,638 (42.1) 22,784 (26.2) 13,508 (15.5) 14,075 (16.2) 87,005 (97.2)New York State 15,673 (51.0) 7,794 (25.3) 4,073 (13.2) 3,220 (10.5) 30,760 (86.9)
North Carolina 18,518 (61.8) 7,316 (24.4) 2,721 (9.1) 1,388 (4.6) 29,943 (94.1)North Dakota 977 (70.5) 259 (18.7) 96 (6.9) 53 (3.8) 1,385 (99.9)Ohio 14,442 (52.7) 7,644 (27.9) 3,231 (11.8) 2,102 (7.7) 27,419 (92.6)Oklahoma 4,120 (63.6) 1,537 (23.7) 517 (8.0) 304 (4.7) 6,478 (100.0)Oregon 6,008 (57.2) 2,555 (24.3) 1,099 (10.5) 840 (8.0) 10,502 (99.0)Pennsylvania 21,100 (54.4) 9,964 (25.7) 4,556 (11.7) 3,187 (8.2) 38,807 (100.0)Rhode Island 2,341 (54.4) 1,109 (25.8) 481 (11.2) 371 (8.6) 4,302 (95.6)South Carolina 3,937 (55.3) 1,842 (25.9) 809 (11.4) 537 (7.5) 7,125 (99.1)South Dakota 575 (67.8) 196 (23.1) 54 (6.4) 23 (2.7) 848 (100.0)Tennessee 9,574 (53.2) 4,770 (26.5) 2,099 (11.7) 1,560 (8.7) 18,003 (98.6)Texas 46,036 (56.7) 21,887 (27.0) 8,551 (10.5) 4,651 (5.7) 81,125 (99.7)Utah 2,614 (66.8) 714 (18.3) 238 (6.1) 345 (8.8) 3,911 (100.0)Vermont 863 (57.9) 398 (26.7) 130 (8.7) 100 (6.7) 1,491 (99.9)Virginia 14,689 (53.7) 7,494 (27.4) 3,181 (11.6) 2,004 (7.3) 27,368 (95.4)Washington 13,206 (54.4) 6,254 (25.8) 2,738 (11.3) 2,058 (8.5) 24,256 (99.8)West Virginia 1,234 (62.2) 517 (26.1) 164 (8.3) 68 (3.4) 1,983 (100.0)Total 355,034 (55.6) 161,645 (25.3) 70,858 (11.1) 51,253 (8.0) 638,790 (96.7)
* Data from 42 reporting areas; excludes 10 areas (California, Connecticut, District of Columbia, Florida, Illinois, Maryland, New Hampshire, New Mexico, Wisconsin and Wyoming) that did not report, did not report by the number of previous induced abortions, or did not meet reporting standards.
† Percentages for the individual component categories might not add to 100 because of rounding. § Calculated as the number of abortions reported by known number of previous induced abortions divided by the sum of abortions reported by known and unknown
number of previous induced abortions. ¶ Data from hospitals and licensed ambulatory care facilities only; because reporting is not mandatory for private physicians and women’s centers, information could
not be obtained for all abortions performed in New Jersey.
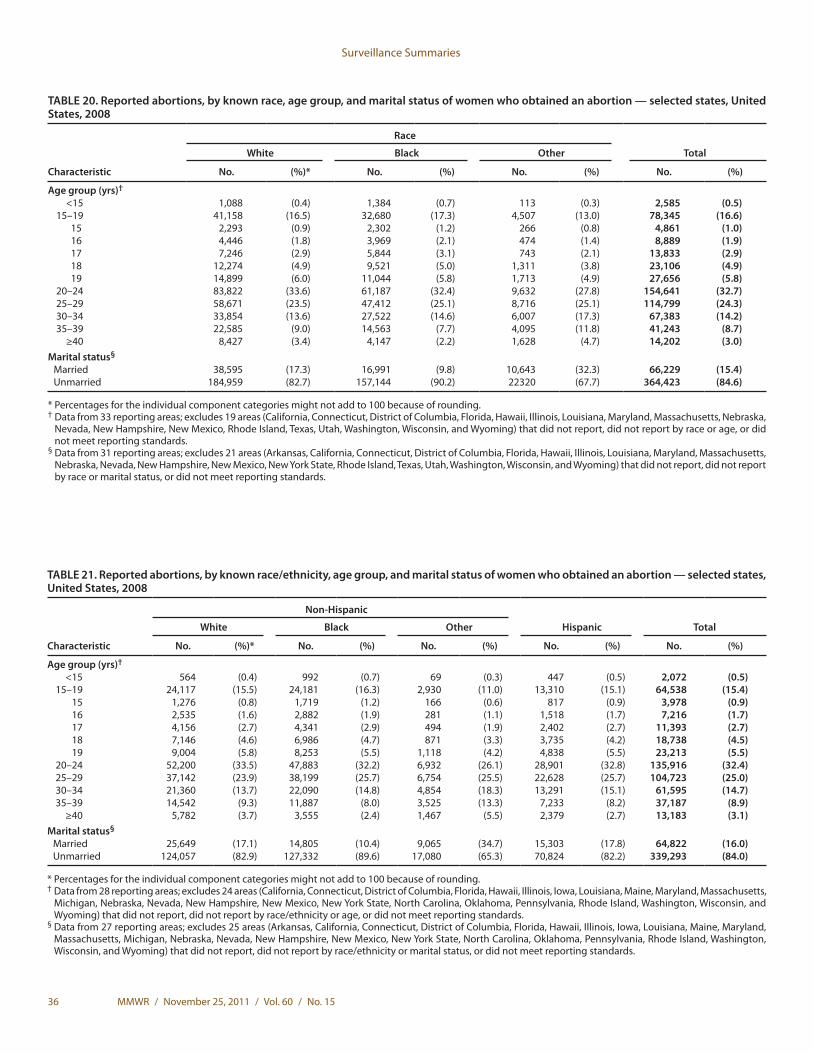
Surveillance Summaries
36 MMWR / November 25, 2011 / Vol. 60 / No. 15
TABLE 20. Reported abortions, by known race, age group, and marital status of women who obtained an abortion — selected states, United States, 2008
Characteristic
Race
TotalWhite Black Other
No. (%)* No. (%) No. (%) No. (%)
Age group (yrs)†
<15 1,088 (0.4) 1,384 (0.7) 113 (0.3) 2,585 (0.5) 15–19 41,158 (16.5) 32,680 (17.3) 4,507 (13.0) 78,345 (16.6)
15 2,293 (0.9) 2,302 (1.2) 266 (0.8) 4,861 (1.0) 16 4,446 (1.8) 3,969 (2.1) 474 (1.4) 8,889 (1.9) 17 7,246 (2.9) 5,844 (3.1) 743 (2.1) 13,833 (2.9) 18 12,274 (4.9) 9,521 (5.0) 1,311 (3.8) 23,106 (4.9) 19 14,899 (6.0) 11,044 (5.8) 1,713 (4.9) 27,656 (5.8)
20–24 83,822 (33.6) 61,187 (32.4) 9,632 (27.8) 154,641 (32.7) 25–29 58,671 (23.5) 47,412 (25.1) 8,716 (25.1) 114,799 (24.3) 30–34 33,854 (13.6) 27,522 (14.6) 6,007 (17.3) 67,383 (14.2) 35–39 22,585 (9.0) 14,563 (7.7) 4,095 (11.8) 41,243 (8.7) ≥40 8,427 (3.4) 4,147 (2.2) 1,628 (4.7) 14,202 (3.0)Marital status§
Married 38,595 (17.3) 16,991 (9.8) 10,643 (32.3) 66,229 (15.4)Unmarried 184,959 (82.7) 157,144 (90.2) 22320 (67.7) 364,423 (84.6)
* Percentages for the individual component categories might not add to 100 because of rounding.† Data from 33 reporting areas; excludes 19 areas (California, Connecticut, District of Columbia, Florida, Hawaii, Illinois, Louisiana, Maryland, Massachusetts, Nebraska,
Nevada, New Hampshire, New Mexico, Rhode Island, Texas, Utah, Washington, Wisconsin, and Wyoming) that did not report, did not report by race or age, or did not meet reporting standards.
§ Data from 31 reporting areas; excludes 21 areas (Arkansas, California, Connecticut, District of Columbia, Florida, Hawaii, Illinois, Louisiana, Maryland, Massachusetts, Nebraska, Nevada, New Hampshire, New Mexico, New York State, Rhode Island, Texas, Utah, Washington, Wisconsin, and Wyoming) that did not report, did not report by race or marital status, or did not meet reporting standards.
TABLE 21. Reported abortions, by known race/ethnicity, age group, and marital status of women who obtained an abortion — selected states, United States, 2008
Characteristic
Non-Hispanic
Hispanic TotalWhite Black Other
No. (%)* No. (%) No. (%) No. (%) No. (%)
Age group (yrs)†
<15 564 (0.4) 992 (0.7) 69 (0.3) 447 (0.5) 2,072 (0.5) 15–19 24,117 (15.5) 24,181 (16.3) 2,930 (11.0) 13,310 (15.1) 64,538 (15.4) 15 1,276 (0.8) 1,719 (1.2) 166 (0.6) 817 (0.9) 3,978 (0.9) 16 2,535 (1.6) 2,882 (1.9) 281 (1.1) 1,518 (1.7) 7,216 (1.7) 17 4,156 (2.7) 4,341 (2.9) 494 (1.9) 2,402 (2.7) 11,393 (2.7) 18 7,146 (4.6) 6,986 (4.7) 871 (3.3) 3,735 (4.2) 18,738 (4.5) 19 9,004 (5.8) 8,253 (5.5) 1,118 (4.2) 4,838 (5.5) 23,213 (5.5) 20–24 52,200 (33.5) 47,883 (32.2) 6,932 (26.1) 28,901 (32.8) 135,916 (32.4) 25–29 37,142 (23.9) 38,199 (25.7) 6,754 (25.5) 22,628 (25.7) 104,723 (25.0) 30–34 21,360 (13.7) 22,090 (14.8) 4,854 (18.3) 13,291 (15.1) 61,595 (14.7) 35–39 14,542 (9.3) 11,887 (8.0) 3,525 (13.3) 7,233 (8.2) 37,187 (8.9) ≥40 5,782 (3.7) 3,555 (2.4) 1,467 (5.5) 2,379 (2.7) 13,183 (3.1)Marital status§
Married 25,649 (17.1) 14,805 (10.4) 9,065 (34.7) 15,303 (17.8) 64,822 (16.0)Unmarried 124,057 (82.9) 127,332 (89.6) 17,080 (65.3) 70,824 (82.2) 339,293 (84.0)
* Percentages for the individual component categories might not add to 100 because of rounding.† Data from 28 reporting areas; excludes 24 areas (California, Connecticut, District of Columbia, Florida, Hawaii, Illinois, Iowa, Louisiana, Maine, Maryland, Massachusetts,
Michigan, Nebraska, Nevada, New Hampshire, New Mexico, New York State, North Carolina, Oklahoma, Pennsylvania, Rhode Island, Washington, Wisconsin, and Wyoming) that did not report, did not report by race/ethnicity or age, or did not meet reporting standards.
§ Data from 27 reporting areas; excludes 25 areas (Arkansas, California, Connecticut, District of Columbia, Florida, Hawaii, Illinois, Iowa, Louisiana, Maine, Maryland, Massachusetts, Michigan, Nebraska, Nevada, New Hampshire, New Mexico, New York State, North Carolina, Oklahoma, Pennsylvania, Rhode Island, Washington, Wisconsin, and Wyoming) that did not report, did not report by race/ethnicity or marital status, or did not meet reporting standards.
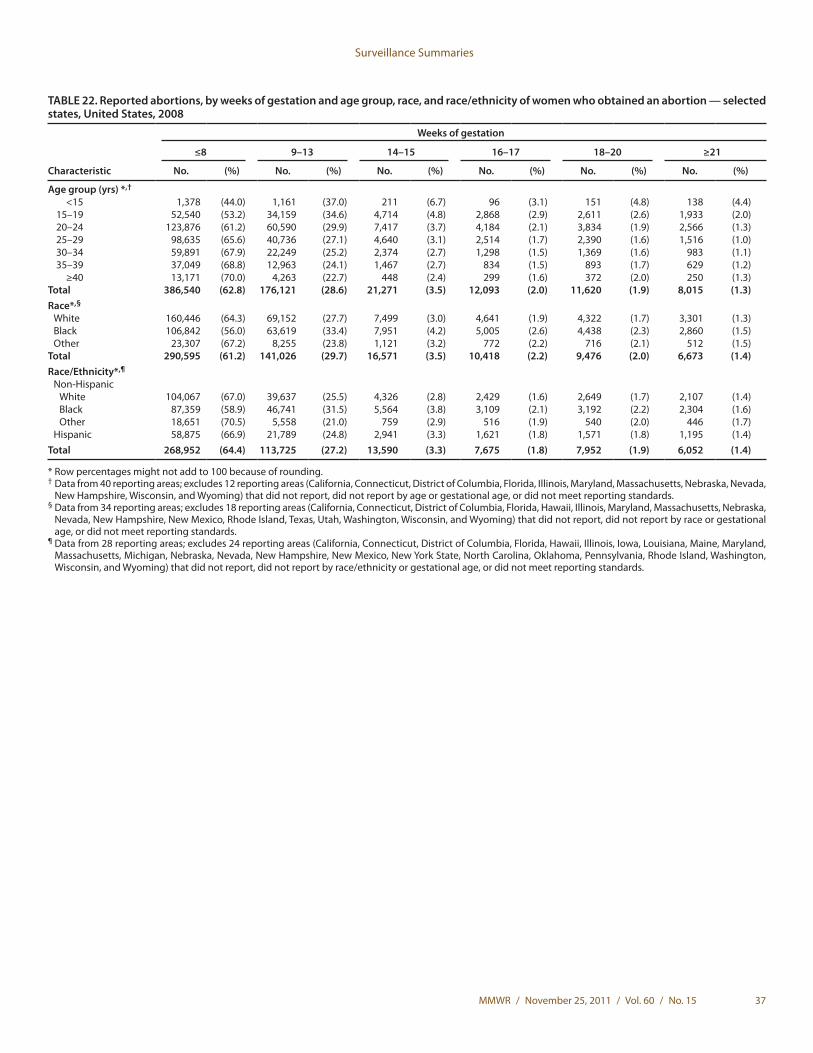
Surveillance Summaries
MMWR / November 25, 2011 / Vol. 60 / No. 15 37
TABLE 22. Reported abortions, by weeks of gestation and age group, race, and race/ethnicity of women who obtained an abortion — selected states, United States, 2008
Characteristic
Weeks of gestation
≤8 9–13 14–15 16–17 18–20 ≥21
No. (%) No. (%) No. (%) No. (%) No. (%) No. (%)
Age group (yrs) *,†
<15 1,378 (44.0) 1,161 (37.0) 211 (6.7) 96 (3.1) 151 (4.8) 138 (4.4) 15–19 52,540 (53.2) 34,159 (34.6) 4,714 (4.8) 2,868 (2.9) 2,611 (2.6) 1,933 (2.0) 20–24 123,876 (61.2) 60,590 (29.9) 7,417 (3.7) 4,184 (2.1) 3,834 (1.9) 2,566 (1.3) 25–29 98,635 (65.6) 40,736 (27.1) 4,640 (3.1) 2,514 (1.7) 2,390 (1.6) 1,516 (1.0) 30–34 59,891 (67.9) 22,249 (25.2) 2,374 (2.7) 1,298 (1.5) 1,369 (1.6) 983 (1.1) 35–39 37,049 (68.8) 12,963 (24.1) 1,467 (2.7) 834 (1.5) 893 (1.7) 629 (1.2) ≥40 13,171 (70.0) 4,263 (22.7) 448 (2.4) 299 (1.6) 372 (2.0) 250 (1.3)Total 386,540 (62.8) 176,121 (28.6) 21,271 (3.5) 12,093 (2.0) 11,620 (1.9) 8,015 (1.3)Race*,§
White 160,446 (64.3) 69,152 (27.7) 7,499 (3.0) 4,641 (1.9) 4,322 (1.7) 3,301 (1.3)Black 106,842 (56.0) 63,619 (33.4) 7,951 (4.2) 5,005 (2.6) 4,438 (2.3) 2,860 (1.5)Other 23,307 (67.2) 8,255 (23.8) 1,121 (3.2) 772 (2.2) 716 (2.1) 512 (1.5)
Total 290,595 (61.2) 141,026 (29.7) 16,571 (3.5) 10,418 (2.2) 9,476 (2.0) 6,673 (1.4)Race/Ethnicity*,¶
Non-HispanicWhite 104,067 (67.0) 39,637 (25.5) 4,326 (2.8) 2,429 (1.6) 2,649 (1.7) 2,107 (1.4)Black 87,359 (58.9) 46,741 (31.5) 5,564 (3.8) 3,109 (2.1) 3,192 (2.2) 2,304 (1.6)Other 18,651 (70.5) 5,558 (21.0) 759 (2.9) 516 (1.9) 540 (2.0) 446 (1.7)
Hispanic 58,875 (66.9) 21,789 (24.8) 2,941 (3.3) 1,621 (1.8) 1,571 (1.8) 1,195 (1.4)Total 268,952 (64.4) 113,725 (27.2) 13,590 (3.3) 7,675 (1.8) 7,952 (1.9) 6,052 (1.4)
* Row percentages might not add to 100 because of rounding.† Data from 40 reporting areas; excludes 12 reporting areas (California, Connecticut, District of Columbia, Florida, Illinois, Maryland, Massachusetts, Nebraska, Nevada,
New Hampshire, Wisconsin, and Wyoming) that did not report, did not report by age or gestational age, or did not meet reporting standards.§ Data from 34 reporting areas; excludes 18 reporting areas (California, Connecticut, District of Columbia, Florida, Hawaii, Illinois, Maryland, Massachusetts, Nebraska,
Nevada, New Hampshire, New Mexico, Rhode Island, Texas, Utah, Washington, Wisconsin, and Wyoming) that did not report, did not report by race or gestational age, or did not meet reporting standards.
¶ Data from 28 reporting areas; excludes 24 reporting areas (California, Connecticut, District of Columbia, Florida, Hawaii, Illinois, Iowa, Louisiana, Maine, Maryland, Massachusetts, Michigan, Nebraska, Nevada, New Hampshire, New Mexico, New York State, North Carolina, Oklahoma, Pennsylvania, Rhode Island, Washington, Wisconsin, and Wyoming) that did not report, did not report by race/ethnicity or gestational age, or did not meet reporting standards.
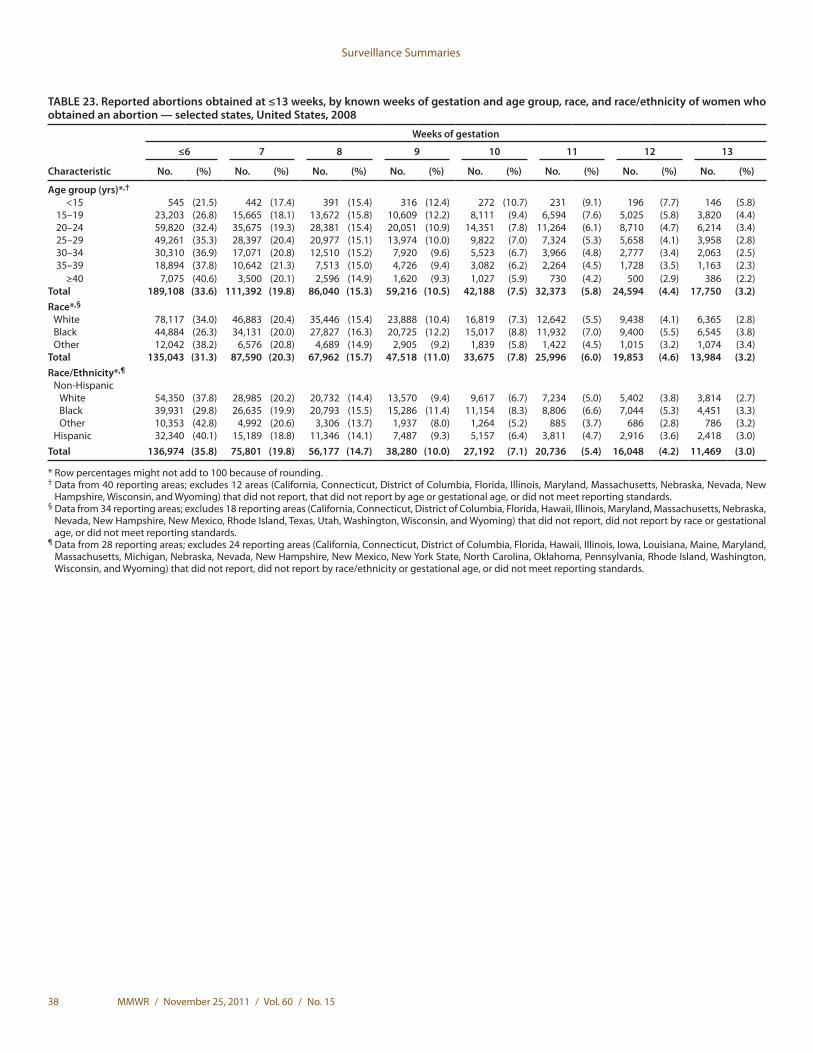
Surveillance Summaries
38 MMWR / November 25, 2011 / Vol. 60 / No. 15
TABLE 23. Reported abortions obtained at ≤13 weeks, by known weeks of gestation and age group, race, and race/ethnicity of women who obtained an abortion — selected states, United States, 2008
Characteristic
Weeks of gestation
≤6 7 8 9 10 11 12 13
No. (%) No. (%) No. (%) No. (%) No. (%) No. (%) No. (%) No. (%)
Age group (yrs)*,†
<15 545 (21.5) 442 (17.4) 391 (15.4) 316 (12.4) 272 (10.7) 231 (9.1) 196 (7.7) 146 (5.8) 15–19 23,203 (26.8) 15,665 (18.1) 13,672 (15.8) 10,609 (12.2) 8,111 (9.4) 6,594 (7.6) 5,025 (5.8) 3,820 (4.4) 20–24 59,820 (32.4) 35,675 (19.3) 28,381 (15.4) 20,051 (10.9) 14,351 (7.8) 11,264 (6.1) 8,710 (4.7) 6,214 (3.4) 25–29 49,261 (35.3) 28,397 (20.4) 20,977 (15.1) 13,974 (10.0) 9,822 (7.0) 7,324 (5.3) 5,658 (4.1) 3,958 (2.8) 30–34 30,310 (36.9) 17,071 (20.8) 12,510 (15.2) 7,920 (9.6) 5,523 (6.7) 3,966 (4.8) 2,777 (3.4) 2,063 (2.5) 35–39 18,894 (37.8) 10,642 (21.3) 7,513 (15.0) 4,726 (9.4) 3,082 (6.2) 2,264 (4.5) 1,728 (3.5) 1,163 (2.3) ≥40 7,075 (40.6) 3,500 (20.1) 2,596 (14.9) 1,620 (9.3) 1,027 (5.9) 730 (4.2) 500 (2.9) 386 (2.2)Total 189,108 (33.6) 111,392 (19.8) 86,040 (15.3) 59,216 (10.5) 42,188 (7.5) 32,373 (5.8) 24,594 (4.4) 17,750 (3.2)Race*,§
White 78,117 (34.0) 46,883 (20.4) 35,446 (15.4) 23,888 (10.4) 16,819 (7.3) 12,642 (5.5) 9,438 (4.1) 6,365 (2.8)Black 44,884 (26.3) 34,131 (20.0) 27,827 (16.3) 20,725 (12.2) 15,017 (8.8) 11,932 (7.0) 9,400 (5.5) 6,545 (3.8)Other 12,042 (38.2) 6,576 (20.8) 4,689 (14.9) 2,905 (9.2) 1,839 (5.8) 1,422 (4.5) 1,015 (3.2) 1,074 (3.4)
Total 135,043 (31.3) 87,590 (20.3) 67,962 (15.7) 47,518 (11.0) 33,675 (7.8) 25,996 (6.0) 19,853 (4.6) 13,984 (3.2)Race/Ethnicity*,¶
Non-HispanicWhite 54,350 (37.8) 28,985 (20.2) 20,732 (14.4) 13,570 (9.4) 9,617 (6.7) 7,234 (5.0) 5,402 (3.8) 3,814 (2.7)Black 39,931 (29.8) 26,635 (19.9) 20,793 (15.5) 15,286 (11.4) 11,154 (8.3) 8,806 (6.6) 7,044 (5.3) 4,451 (3.3)Other 10,353 (42.8) 4,992 (20.6) 3,306 (13.7) 1,937 (8.0) 1,264 (5.2) 885 (3.7) 686 (2.8) 786 (3.2)
Hispanic 32,340 (40.1) 15,189 (18.8) 11,346 (14.1) 7,487 (9.3) 5,157 (6.4) 3,811 (4.7) 2,916 (3.6) 2,418 (3.0)Total 136,974 (35.8) 75,801 (19.8) 56,177 (14.7) 38,280 (10.0) 27,192 (7.1) 20,736 (5.4) 16,048 (4.2) 11,469 (3.0)
* Row percentages might not add to 100 because of rounding.† Data from 40 reporting areas; excludes 12 areas (California, Connecticut, District of Columbia, Florida, Illinois, Maryland, Massachusetts, Nebraska, Nevada, New
Hampshire, Wisconsin, and Wyoming) that did not report, that did not report by age or gestational age, or did not meet reporting standards.§ Data from 34 reporting areas; excludes 18 reporting areas (California, Connecticut, District of Columbia, Florida, Hawaii, Illinois, Maryland, Massachusetts, Nebraska,
Nevada, New Hampshire, New Mexico, Rhode Island, Texas, Utah, Washington, Wisconsin, and Wyoming) that did not report, did not report by race or gestational age, or did not meet reporting standards.
¶ Data from 28 reporting areas; excludes 24 reporting areas (California, Connecticut, District of Columbia, Florida, Hawaii, Illinois, Iowa, Louisiana, Maine, Maryland, Massachusetts, Michigan, Nebraska, Nevada, New Hampshire, New Mexico, New York State, North Carolina, Oklahoma, Pennsylvania, Rhode Island, Washington, Wisconsin, and Wyoming) that did not report, did not report by race/ethnicity or gestational age, or did not meet reporting standards.
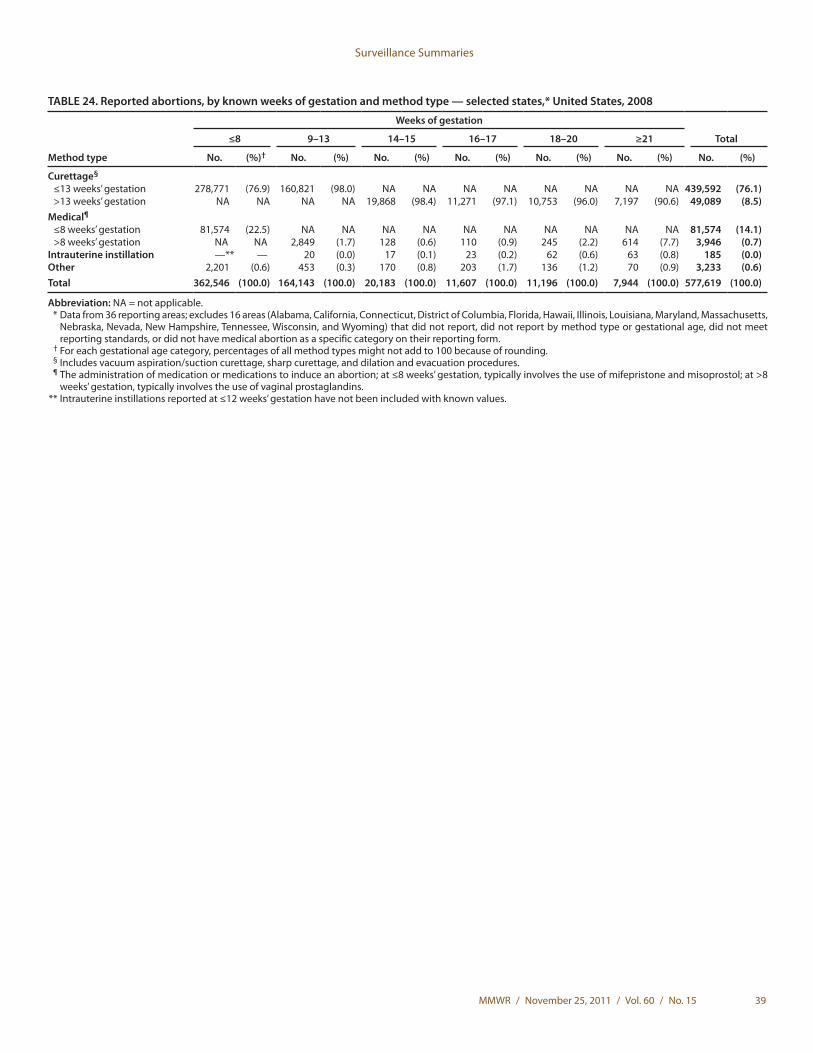
Surveillance Summaries
MMWR / November 25, 2011 / Vol. 60 / No. 15 39
TABLE 24. Reported abortions, by known weeks of gestation and method type — selected states,* United States, 2008
Method type
Weeks of gestation
Total≤8 9–13 14–15 16–17 18–20 ≥21
No. (%)† No. (%) No. (%) No. (%) No. (%) No. (%) No. (%)
Curettage§
≤13 weeks’ gestation 278,771 (76.9) 160,821 (98.0) NA NA NA NA NA NA NA NA 439,592 (76.1)>13 weeks’ gestation NA NA NA NA 19,868 (98.4) 11,271 (97.1) 10,753 (96.0) 7,197 (90.6) 49,089 (8.5)
Medical¶≤8 weeks’ gestation 81,574 (22.5) NA NA NA NA NA NA NA NA NA NA 81,574 (14.1)>8 weeks’ gestation NA NA 2,849 (1.7) 128 (0.6) 110 (0.9) 245 (2.2) 614 (7.7) 3,946 (0.7)
Intrauterine instillation —** — 20 (0.0) 17 (0.1) 23 (0.2) 62 (0.6) 63 (0.8) 185 (0.0)Other 2,201 (0.6) 453 (0.3) 170 (0.8) 203 (1.7) 136 (1.2) 70 (0.9) 3,233 (0.6)Total 362,546 (100.0) 164,143 (100.0) 20,183 (100.0) 11,607 (100.0) 11,196 (100.0) 7,944 (100.0) 577,619 (100.0)
Abbreviation: NA = not applicable. * Data from 36 reporting areas; excludes 16 areas (Alabama, California, Connecticut, District of Columbia, Florida, Hawaii, Illinois, Louisiana, Maryland, Massachusetts,
Nebraska, Nevada, New Hampshire, Tennessee, Wisconsin, and Wyoming) that did not report, did not report by method type or gestational age, did not meet reporting standards, or did not have medical abortion as a specific category on their reporting form.
† For each gestational age category, percentages of all method types might not add to 100 because of rounding. § Includes vacuum aspiration/suction curettage, sharp curettage, and dilation and evacuation procedures. ¶ The administration of medication or medications to induce an abortion; at ≤8 weeks’ gestation, typically involves the use of mifepristone and misoprostol; at >8
weeks’ gestation, typically involves the use of vaginal prostaglandins. ** Intrauterine instillations reported at ≤12 weeks’ gestation have not been included with known values.
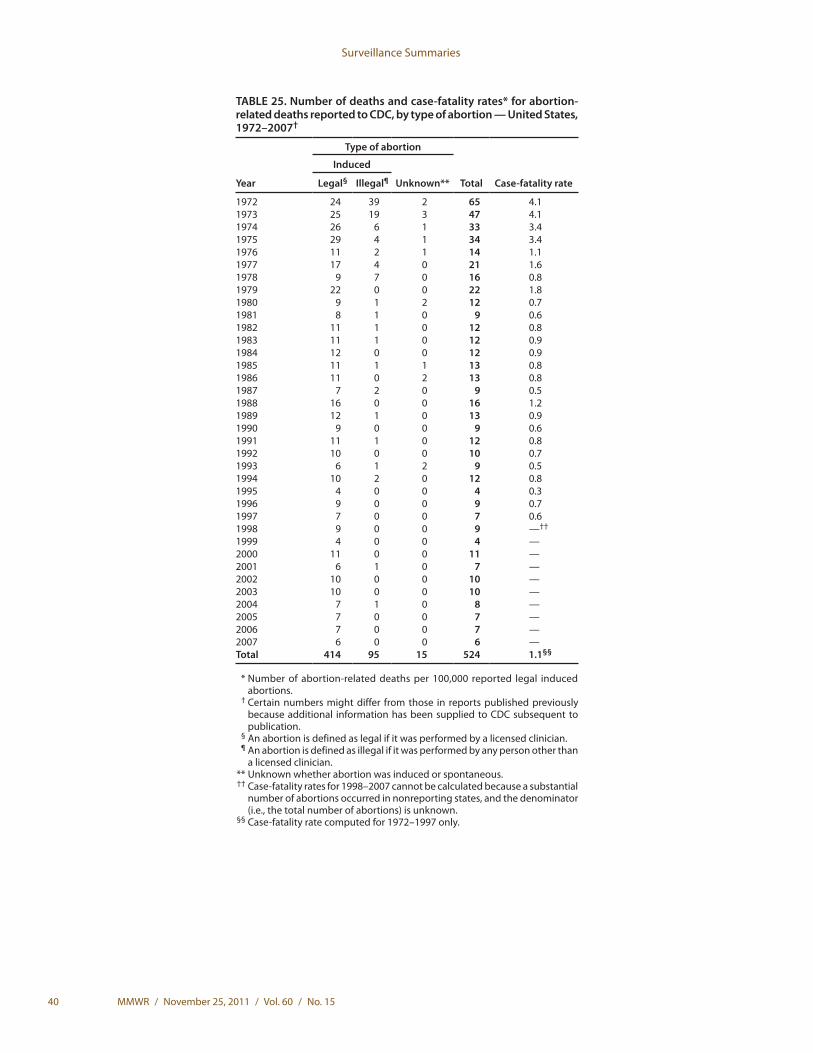
Surveillance Summaries
40 MMWR / November 25, 2011 / Vol. 60 / No. 15
TABLE 25. Number of deaths and case-fatality rates* for abortion-related deaths reported to CDC, by type of abortion — United States, 1972–2007†
Year
Type of abortion
Total Case-fatality rate
Induced
Unknown**Legal§ Illegal¶
1972 24 39 2 65 4.11973 25 19 3 47 4.11974 26 6 1 33 3.41975 29 4 1 34 3.41976 11 2 1 14 1.11977 17 4 0 21 1.61978 9 7 0 16 0.81979 22 0 0 22 1.81980 9 1 2 12 0.71981 8 1 0 9 0.61982 11 1 0 12 0.81983 11 1 0 12 0.91984 12 0 0 12 0.91985 11 1 1 13 0.81986 11 0 2 13 0.81987 7 2 0 9 0.51988 16 0 0 16 1.21989 12 1 0 13 0.91990 9 0 0 9 0.61991 11 1 0 12 0.81992 10 0 0 10 0.71993 6 1 2 9 0.51994 10 2 0 12 0.81995 4 0 0 4 0.31996 9 0 0 9 0.71997 7 0 0 7 0.61998 9 0 0 9 —††
1999 4 0 0 4 —2000 11 0 0 11 —2001 6 1 0 7 —2002 10 0 0 10 —2003 10 0 0 10 —2004 7 1 0 8 —2005 7 0 0 7 —2006 7 0 0 7 —2007 6 0 0 6 —Total 414 95 15 524 1.1§§
* Number of abortion-related deaths per 100,000 reported legal induced abortions.
† Certain numbers might differ from those in reports published previously because additional information has been supplied to CDC subsequent to publication.
§ An abortion is defined as legal if it was performed by a licensed clinician. ¶ An abortion is defined as illegal if it was performed by any person other than
a licensed clinician. ** Unknown whether abortion was induced or spontaneous. †† Case-fatality rates for 1998–2007 cannot be calculated because a substantial
number of abortions occurred in nonreporting states, and the denominator (i.e., the total number of abortions) is unknown.
§§ Case-fatality rate computed for 1972–1997 only.
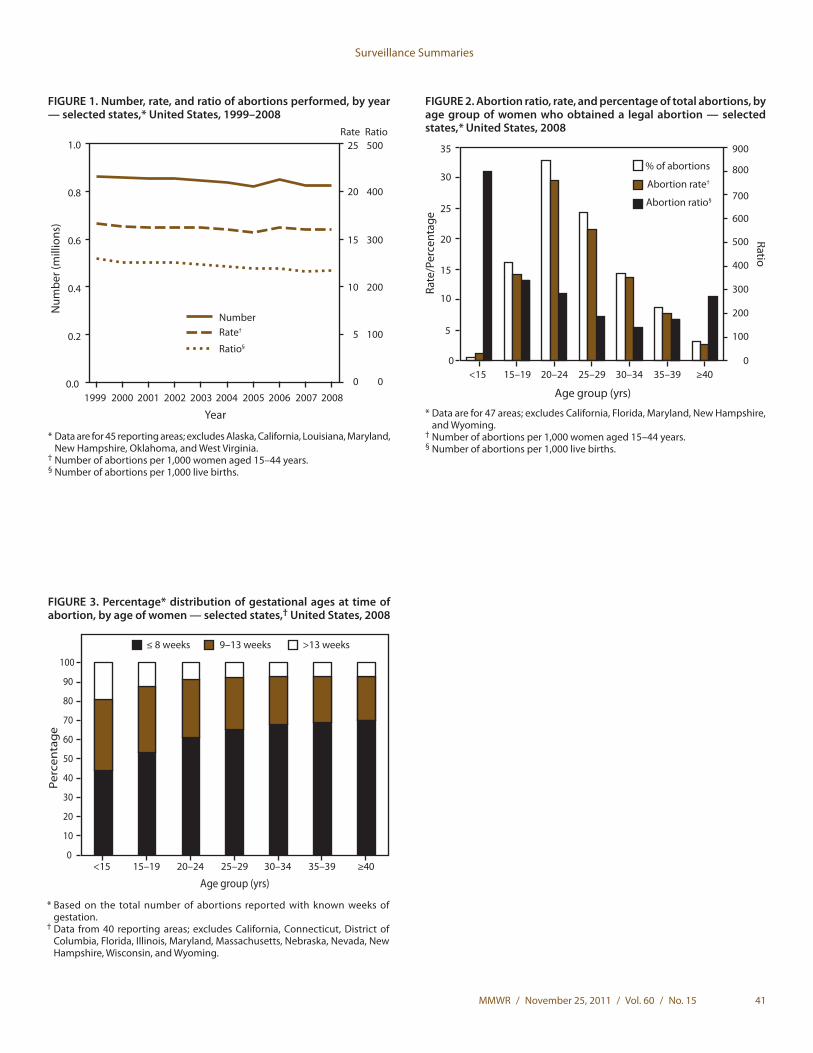
Surveillance Summaries
MMWR / November 25, 2011 / Vol. 60 / No. 15 41
FIGURE 1. Number, rate, and ratio of abortions performed, by year — selected states,* United States, 1999–2008
* Data are for 45 reporting areas; excludes Alaska, California, Louisiana, Maryland, New Hampshire, Oklahoma, and West Virginia.
† Number of abortions per 1,000 women aged 15–44 years.§ Number of abortions per 1,000 live births.
NumberRate†
Ratio§0.2
0.4
0.6
0.8
1.0
Num
ber (
mill
ions
)
0.0 0
5
10
15
20
25
0
100
200
300
400
500Rate Ratio
1999 2000 2001 2002 2003 2004 2005 2006 2007 2008
Year
FIGURE 2. Abortion ratio, rate, and percentage of total abortions, by age group of women who obtained a legal abortion — selected states,* United States, 2008
* Data are for 47 areas; excludes California, Florida, Maryland, New Hampshire, and Wyoming.
† Number of abortions per 1,000 women aged 15–44 years.§ Number of abortions per 1,000 live births.
0
5
10
15
20
25
30
35
Rate
/Per
cent
age
0
100
200
300
400
500
600
700
800
900
Ratio
Age group (yrs)
<15 15–19 20–24 25–29 30–34 35–39 ≥40
% of abortions
Abortion rate†
Abortion ratio§
FIGURE 3. Percentage* distribution of gestational ages at time of abortion, by age of women — selected states,† United States, 2008
0
10
20
30
40
50
60
70
80
90
100
Perc
enta
ge
Age group (yrs)<15 15–19 20–24 25–29 30–34 35–39 ≥40
≤ 8 weeks 9–13 weeks >13 weeks
* Based on the total number of abortions reported with known weeks of gestation.
† Data from 40 reporting areas; excludes California, Connecticut, District of Columbia, Florida, Illinois, Maryland, Massachusetts, Nebraska, Nevada, New Hampshire, Wisconsin, and Wyoming.
U.S.GovernmentPrintingOffice:2012-523-043/72752RegionIV ISSN:1546-0738
The Morbidity and Mortality Weekly Report (MMWR) Series is prepared by the Centers for Disease Control and Prevention (CDC) and is available free of charge in electronic format. To receive an electronic copy each week, visit MMWR’s free subscription page at http://www.cdc.gov/mmwr/mmwrsubscribe.html. Paper copy subscriptions are available through the Superintendent of Documents, U.S. Government Printing Office, Washington, DC 20402; telephone 202-512-1800.
Address all inquiries about the MMWR Series, including material to be considered for publication, to Editor, MMWR Series, Mailstop E-90, CDC, 1600 Clifton Rd., N.E., Atlanta, GA 30333 or to [email protected].
All material in the MMWR Series is in the public domain and may be used and reprinted without permission; citation as to source, however, is appreciated.
Use of trade names and commercial sources is for identification only and does not imply endorsement by the U.S. Department of Health and Human Services.
References to non-CDC sites on the Internet are provided as a service to MMWR readers and do not constitute or imply endorsement of these organizations or their programs by CDC or the U.S. Department of Health and Human Services. CDC is not responsible for the content of these sites. URL addresses listed in MMWR were current as of the date of publication.
Surveillance Summaries