Embed Size (px)
Citation preview

1

1
About the authors
Jon Andrews, Director for Education Data and Statistics. Jon recently co-authored the reports ‘Faith
schools, pupil performance and social selection’ and ‘Grammar schools and social mobility’. Prior to
joining the Education Policy Institute, Jon worked in the Department for Education from 2003 to
2016; most recently leading analysis for the National Funding Formula for schools, the 2015
Spending Review and the education White Paper, ‘Educational Excellence Everywhere’.
Jo Hutchinson is Associate Director for Education Data and Statistics. Jo recently authored ‘School
inspection in England: Is there room to improve?’ and co-authored ‘Grammar schools and social
mobility’. Prior to this, Jo spent ten years as a statistician at the Department for Education, leading
on evidence for the London Education Inquiry, the National Curriculum Review, behaviour and
attendance, floor standards reform, and character education.
Acknowledgements
Natalie Perera, Executive Director and Head of Research. Natalie is principal author of our
‘Education in England: Annual Report 2016’ and oversees all EPI research reports and
communications. Natalie worked in the Department for Education from 2002 to 2014 where she led
on a number of reforms, including the design of a new national funding formula.
About the Education Policy Institute
The Education Policy Institute is an independent, impartial and evidence-based research institute
that aims to promote high quality education outcomes, regardless of social background.
Education can have a transformational effect on the lives of young people. Through our research, we
provide insights, commentary and critiques about education policy in England - shedding light on
what is working and where further progress needs to be made. Our research and analysis spans a
young person's journey from the early years through to higher education and entry to the labour
market. Because good mental health is vital to learning, we also have a dedicated mental health
team which will consider the challenges, interventions and opportunities for supporting young
people's wellbeing.
Our core research areas include:
Accountability and Inspection
Benchmarking English Education
Curriculum and Qualifications
Disadvantaged, SEND, and Vulnerable Children
Early Years Development
School Funding
School Performance and Leadership
Teacher Supply and Quality
Children and Young People's Mental Health
Education for Offenders
Our experienced and dedicated team works closely with academics, think tanks, and other research
foundations and charities to shape the policy agenda.

2
This publication includes analysis of the National Pupil Database (NPD):
https://www.gov.uk/government/collections/national-pupil-database
The Department for Education is responsible for the collation and management of the NPD and is
the Data Controller of NPD data. Any inferences or conclusions derived from the NPD in this
publication are the responsibility of the Education Policy Institute and not the Department for
Education.
ISBN: 978-1-909274-39-6
Published December 2016 Education Policy Institute.
This work is licensed under a Creative Commons Attribution-NonCommercial-ShareAlike 4.0
International License. For more information visit creativecommons.org

3
Contents
Foreword .............................................................................................................................................. 4
Executive summary ............................................................................................................................... 5
Geographical considerations............................................................................................................. 6
Possible use of quotas ...................................................................................................................... 7
Part 1: Our previous research ............................................................................................................... 9
Part 2: Modelling a quota system ....................................................................................................... 12
What would quotas mean for the nature of grammar school intakes? .......................................... 12
Quota model assumptions .............................................................................................................. 15
Grammar school effects in the current system ............................................................................... 16
Applying quotas to existing grammar schools and the areas their pupils are drawn from ............. 19
Opening new grammar schools in low-performing non-selective areas ......................................... 25
Concluding comments on quotas.................................................................................................... 30
Part 3: Location of expanded grammar school provision .................................................................... 31
Overview ......................................................................................................................................... 31
Principles......................................................................................................................................... 31
Analysis ........................................................................................................................................... 33
Conclusion ...................................................................................................................................... 39
Annex 1: Data sources ........................................................................................................................ 41
Annex 2: Additional data .................................................................................................................... 42

4
Foreword
The Education Policy Institute is an independent, impartial, and evidence-based research institute
that aims to promote high quality education outcomes for all, regardless of social background.
In September 2016, the current UK Government published a consultation paper ‘Schools that Work
for Everyone’, which proposed expanding the number of grammar schools in England, with the aim
of providing more good school places. This has revived a debate about what the impact of more
selective school places would be on attainment and on social mobility.
The Education Policy Institute has contributed to this debate by publishing ‘Grammar schools and
social mobility’, in September 2016. In this report the authors - Jon Andrews, Jo Hutchinson and
Rebecca Johnes - used the National Pupil Database to look at the characteristics of pupils in existing
grammar schools and to assess the impact of grammar schools both on pupils who are admitted to
them and those who are not. A summary of the conclusions of this report is provided in Part 1 of this
paper, for ease of reference.
In this latest report, Jon Andrews and Jo Hutchinson seek to build on their earlier analysis by
shedding light on two key policy issues which have arisen in the debate over additional selective
schools. Firstly, might it be possible to address the criticism that grammar schools admit very few
pupils from disadvantaged backgrounds, by introducing some sort of quota of children from poorer
families? What would be the consequences of introducing such a quota, looking at varying options
for defining this?
Secondly, what would be the impacts of creating additional grammar school places in different parts
of the country? The Government has now announced, in the 2016 Autumn Statement, £200 million
of additional capital expenditure to support the expansion of existing grammar schools. But the
September 2016 Education Policy Institute report on grammar schools judged that "an expansion of
grammar schools in areas which already have a large representation of selective schools is likely to
be associated with lower gains for grammar school pupils, and small but growing attainment losses
for those not attending selective schools - losses which will be greatest amongst poor children." This
paper therefore looks at the implications of expanding selective places in different parts of England.
We hope that this research will help further inform the debate over selective schools, and assist
policy-makers in reaching evidence-based conclusions. As ever, we welcome comment on the
analysis and conclusions of this report.
Rt. Hon. David Laws
Executive Chairman, Education Policy Institute.

5
Executive summary
Our first report on grammar schools and social mobility concluded that:
At a national level, and adjusting for pupil characteristics, there appears to be no overall
impact of selective schooling, either positive or negative.
Pupils who attend a grammar school score highly in raw attainment terms, but this is largely
driven by the very high prior attainment and demographic features of these pupils.
When we control for pupil characteristics, we still find positive attainment effects for pupils
attending grammar schools – they achieve, on average, an estimated one-third of a GCSE
grade higher in each of eight GCSE subjects, compared with similar pupils in non-selective
schools in comprehensive areas.
Pupils eligible for free school meals are notably under-represented in grammar schools; only
2.5 per cent of grammar school pupils are eligible for free meals, compared with 13.2 per
cent in all state funded secondary schools.1 This under-representation is unsurprising given
that 40 per cent of the gap in attainment between disadvantaged and other pupils emerges
before children start attending school, and by the time the 11-Plus or equivalent is taken, 60
per cent of the disadvantaged attainment gap has emerged.
While the disadvantaged attainment gap is narrower in grammar schools than in non-
selective schools, this is almost entirely explained by grammar schools only selecting pupils
with high prior attainment.
Positive grammar school attainment effects decline as the proportion of pupils attending
grammar school rises, and in the most selective areas there is a small negative effect of not
attending grammar schools – of just under 0.1 grade in each of eight subjects on average,
rising to just below 0.2 grades less per subject for pupils eligible for free school meals.
For pupils who live in the most selective areas but do not attend a grammar school, negative
effects emerge at around the point where selective places are available for around 70 per
cent of high attaining pupils.
There are five times as many high quality non-selective secondary schools in England as
there are grammar schools, measured by schools that are in the top 25 per cent based on
value added progress measures. These schools are far more socially representative than
grammar schools. Compared with these high-performing non-selective schools, we estimate
that there is no benefit to attending a grammar school for high attaining pupils.
Overall, our analysis supports the conclusions reached by the OECD for school systems
across the world – there is no evidence that an increase in selection would have any positive
impact on social mobility.
1 These percentages are for all secondary-aged pupils.

6
This report provides new analysis which looks, in greater detail, at the implications of expanding
selective schooling in different parts of the country, and introducing varying quotas which aim to
improve access for children from poor backgrounds.
Geographical considerations
The Government has announced £200m of capital over the next four years, specifically to expand
existing grammar schools.2 We have looked at the implications of this and of expanding grammar
schools more widely, by assessing the impacts in the 32,844 “lower layer super output areas”
(LSOAs) in England.
We find that the proposal to expand existing grammar schools is likely to add more selective places
in areas where there are grammar school places for at least 70 per cent of high attaining pupils. This,
in turn, is likely to result in reduced attainment benefits to children who attend a grammar school,
and emerging penalties for those who do not.
Expanding grammar schools in areas such as Kent, Medway, Thurrock and a significant proportion of
Buckinghamshire and Lincolnshire would come with a significant risk of reducing attainment in other
non-selective schools, particularly for more disadvantaged children.
The Government has also stated that it plans to focus new grammar school expansion in areas
where there is “local demand and [it is] what parents want”.3 YouGov polling suggests that of the
148 local authorities with published data, there is clear and strong support in 37 of these areas.4
However, these areas are disproportionately areas which already have grammar school places, and
in which expansion could lead to negative attainment impacts for pupils in non-selective schools.
Indeed, in 25 of these strongly supportive 37 local authorities, we estimate there would be
negative attainment effects for pupils not attending grammar schools.
Support for additional grammar schools is also much stronger in areas where there are relatively
fewer disadvantaged pupils, and it is weaker in areas where there are larger proportions of
disadvantaged pupils. In the “strongly in favour areas” only 9.9 per cent of pupils are entitled to free
school meals, below the national average of 13.2 per cent. In the areas opposed to more grammar
schools, the average free school meals entitlement is 17.9 per cent.
We have developed a methodology to identify the areas of the country where new grammar schools
would have the least negative impact on attainment in other schools, and where expansion would
be most in keeping with the principles set out in the Government’s consultation paper. We look at
areas where:
Extra grammar places would not be to the detriment of pupils who do not access them.
There are sufficient pupil numbers to access and sustain the school without requiring long
travel distances.
2 https://www.gov.uk/government/publications/autumn-statement-2016-documents 3 Nick Gibb MP, Schools Minister, 8th November 2016. 4 YouGov, 2016 ‘New map shows where grammar schools would be most welcome’ https://yougov.co.uk/news/2016/09/09/new-map-shows-where-new-grammar-schools-would-be-m/

7
New grammar schools would not undermine existing high quality non-selective schools.
There is clear parental demand.
Around 30 per cent of areas are ruled out by the “no detriment” principle, and about 1 per cent by
the “sufficient pupils” principle. Just over 80 per cent of LSOAs would be excluded after also avoiding
areas where there are already high-performing non-selective schools. This would leave around 20
per cent of LSOAs meeting those first three principles.
There are only six local authorities in England where at least 10 per cent of LSOAs meet the
location principles for new grammar schools, and where there appears to be clear public support
for expansion. These are: Solihull, Essex, North Yorkshire, Dorset, Northamptonshire and North
Somerset. The expansion principles would only be met in parts of each local authority area. All six of
these local authority areas have levels of disadvantage which are below the national average.
We therefore conclude that it will be difficult for the government to identify areas for grammar
school expansion that will:
avoid damage to pupils who do not access the new selective places; and
have public demand for new selective places.
Those locations that do remain are unlikely to be areas of high disadvantage.
A more promising approach in the most disadvantaged and low attaining areas may therefore be to
focus more effort on increasing the quality of existing non-selective school places, as has been
successfully achieved in areas such as London over the last 20 years.
Possible use of quotas
The Government has suggested that it might want to use quotas to increase access to grammar
schools for disadvantaged children. We have considered possible quotas for disadvantaged pupils,
set at different levels.
The most modest proposal might be to set a quota at the level of high attaining poor pupils in the
catchment area. This might raise the proportion of FSM pupils entering grammar schools from 2.4
per cent to 6.8 per cent.5 This would mean an increase in FSM pupils accessing existing grammar
schools from 500 pupils per year to 1,500 pupils per year. Such a quota would result in a very slightly
reduced negative impact from grammar schools for all FSM pupils in areas with higher numbers of
grammar places. The benefits of grammar schools would still be significantly in favour of non-FSM
pupils.
We have also looked at the impact of setting a quota which would mirror the national FSM rate of
13.3 per cent, and the local FSM rate in areas within reach of grammar schools (14.6 per cent).5 Even
with these larger quotas, the overall GCSE attainment position for FSM pupils living within reach of
grammar schools would remain negative compared with similar pupils in non-selective parts of the
country. It is worth highlighting that such quotas would imply markedly different entry test criteria
5 These percentages are based on year 11 pupils, and differ slightly from the previous figures for all secondary-aged pupils.

8
for FSM and non-FSM pupils, which might prove controversial. It is also unclear whether the
government would want to set a separate entry bar for “Just About Managing” families.
Under both scenarios (quotas which reflect either the national or local FSM rates), grammar schools
would need to admit FSM pupils who are markedly further down the distribution of attainment at
Key Stage 2. These children would not normally be in grammar schools, and it is not clear if their
attainment gains would be as great as those for higher attaining pupils. There would also be a risk
that many admitted FSM pupils would be grouped together in the lowest performing classes.
In conclusion, setting a modest quota of 6.8 per cent FSM (reflecting those in the top 25 per cent of
attainment at the end of Key Stage 2) would be unlikely to have a negative effect at a local level and
would potentially benefit 1000 additional disadvantaged children per year. However, because these
pupils make up such a small proportion of the 76,000 FSM pupils nationally, this would not translate
to a national closing of the gap between disadvantaged children and the rest, and so could not be
considered to improve social mobility at system level in any meaningful way.
A larger quota for disadvantaged pupils would potentially result in: a more comprehensive-looking
intake in grammar schools (we do not know whether this would result in the same average positive
gains we currently find in grammar schools); a risk that FSM pupils would be grouped together into
lower ability classes; and a risk that parents of non-FSM pupils who scored higher than FSM pupils
on the entry test would feel that their children have been unfairly treated.
We have also estimated the GCSE attainment effects for FSM pupils if new grammar schools were
opened in the fifteen lowest-performing non-selective local authorities, and if FSM quotas were
applied in these new grammar schools.
Under optimistic assumptions and large quotas, our modelling suggests that any benefit to FSM
pupils would be very small (+0.1 GCSE grades per subject), would still reach only a small fraction of
FSM pupils, and would quickly become negative if the number of grammar school places exceeded
70 per cent of high attainers. Under less optimistic assumptions, there would not be any benefit to
FSM pupils at any level of grammar school place provision.

9
Part 1: Our previous research
In September 2016 the Education Policy Institute published ‘Grammar schools and social mobility’ –
a comprehensive analysis of the impact of academic selection in grammar schools on attainment and
social mobility in England, using data from the School Performance Tables, the School Census and
the Department for Education’s National Pupil Database.
When considering the intakes of grammar schools our analysis showed that:
The characteristics of pupils who attend selective schools do not reflect either national
patterns or the areas in which they are situated. Some ethnic groups such as Indian and
Chinese pupils are over-represented in grammar schools. Pupils who are eligible for free
school meals are notably under-represented in grammar schools, with only 2.5 per cent of
grammar school pupils entitled to these free meals, compared with 13.2 per cent in all state-
funded secondary schools, and 8.9 per cent in the areas that they are situated in.
This result was not surprising as around 40 per cent of the gap in attainment between
advantaged and disadvantaged pupils emerges before children start attending school, and
by the time the ’11-Plus’ entry exam (or equivalent) is taken, 60 per cent of the large
disadvantaged attainment gap – equivalent to almost 10 months of learning by this stage –
has emerged. Therefore, it is simply less likely that poorer children will attain highly in tests
taken at age 11, compared with pupils from more affluent family backgrounds.
We found positive attainment effects for pupils attending grammar schools (adjusting for
pupil characteristics). Pupils attending grammar schools achieve, on average, an estimated
one-third of a GCSE grade higher in each of eight GCSE subjects, compared with similar
pupils in non-selective schools in comprehensive areas.
This positive attainment effect varies by socio-economic background. For children entitled to
free school meals and attending grammar schools the estimated effect is larger than for non-
FSM children – at around half a grade higher in each of eight GCSEs. However, it is important
to note that this is based on just 500 grammar school pupils out of almost 90,000 FSM pupils
in any single year group.6 And the characteristics of typical FSM pupils who gain admittance
to grammar schools are extremely different from FSM children who do not gain admittance
to grammar schools. It is therefore probable that this positive effect is an over-estimate and
that the real effect of grammar schools on FSM pupils is smaller.
We find that positive grammar school effects on attainment decline as the proportion of
pupils attending grammar schools rises. In the most selective areas, pupils attending
grammar schools achieve an average of 2.3 grades (or a third of a grade in each of eight
GCSE subjects) higher than similar pupils in non-selective schools elsewhere. But, for those
in extremely selective areas, the positive impact of attending a grammar school reduces
6 The total number of FSM pupils here is based on those pupils at the end of Key Stage 2 in 2015. i.e. pupils who would generally be moving to a secondary school at this stage.

10
significantly as the proportion of grammar school places increases, falling to 0.8 of a grade
(or 0.1 of a grade in each of eight GCSE subjects) in areas where the grammar school places
outnumber the proportion of high-attaining pupils.
Importantly, in the most selective areas we find a small negative effect of not attending
grammar schools - an average of 0.6 grades lower per pupil across all GCSE subjects (or just
below 0.1 grade per subject). Furthermore, in areas with a high level of selection, pupils
eligible for free school meals who did not attend grammar schools achieved 1.2 grades
lower on average across all GCSE subjects (just below 0.2 grades lower per subject).
For pupils who live in the most selective areas but do not attend a grammar school,
negative effects are estimated to emerge at around the point where selective places are
available for 70 per cent of high-attaining pupils.
So, an expansion of grammar schools in areas which already have a large representation of
selective schools is likely to be associated with lower gains for grammar school pupils, and
small but growing attainment losses for those not attending selective schools - losses
which will be greatest amongst poor children.
In areas with large numbers of pupils attending grammar schools, poorer children are likely
to be net losers from additional grammar school places - there are around 7,000 FSM pupils
in the areas of highest grammar school coverage. Based on our estimates, 300 of these
pupils could be expected to gain an average of 3 grades in total each, summing to a gain of
almost 1,000 grades. But the remaining 6,700 FSM pupils would lose just over 1 grade each
on average - summing to 8,000 lost grades. So this would amount to a net loss of around
7,000 grades for FSM pupils in areas of concentrated selection.
The Government has indicated that it intends to implement some type of quota system for
increasing the proportion of poorer students in any new grammar schools. But our analysis
suggests that in the most selective areas, government would need to expand the number
of selective school places by a fifth and move 1,600 additional FSM pupils into grammar
schools to try and offset the negative effect experienced by these pupils. In doing so, this
expansion of selective places would result in a diminished ‘bonus’ for those who attend
grammar schools and a net loss would persist.
We have compared high prior attaining pupils in grammar schools with similar pupils who
attend high quality non-selective schools. These are schools which are in the top 25 per cent
based on value-added progress measures, and represent good quality schools operating at
large scale. There are five times as many high quality non-selective schools as there are
grammar schools, based on this measure.
These schools are much more socially representative than grammar schools, admitting
close to the national rate of FSM pupils (12.6 per cent versus 13.2 per cent nationally, and
just 2.5 per cent in grammar schools). They also admit close to the national share of children
with special educational needs.
Compared with these high-performing non-selective schools, we estimate that there is no
benefit to attending a grammar school for high-attaining pupils, measured by "best 8"
GCSE grades. There could be some gains in post-16 outcomes such as A-level grades and

11
university entry, or relating to the difficulty of GCSE subjects studied, but these were not
assessed in this report.
We found no evidence to suggest that overall educational standards in England would be improved
by creating additional grammar schools. At a national level, more grammar schools would likely lead
to small gains in attainment for the minority of children attending such schools, including the small
number of children from low income backgrounds. But, additional grammar schools would be likely
to lead to increases in the aggregate attainment gaps between rich and poor children. It would be
very challenging to significantly improve grammar school access for poor children given that 60 per
cent of the attainment gap arises by the time grammar school entry takes place.
In areas of the country where there is already a high proportion of selection, extra grammar school
places are likely to lead to small but increasing attainment losses for all pupils who do not attend
grammar schools - and net negative attainment effects for the poorest children.

12
Part 2: Modelling a quota system
In this section, we build on the model estimates for the effect of grammar schools, reported in
‘Grammar schools and social mobility’, and use them to estimate the likely impact of introducing
FSM quotas to existing grammar schools, or of opening new grammar schools in low-performing
non-selective areas with FSM quotas. We focus in particular on what this would mean for the GCSE
results of FSM pupils, to assess the social mobility potential of proposals of this kind.
In our first report on grammar schools and social mobility, we found that:
The positive effects of attending a grammar school on GCSE attainment decline as the
proportion of pupils attending grammar schools rises.
In the most selective areas, pupils who do not get into a grammar school suffer a GCSE
attainment penalty compared with similar pupils in completely non-selective areas.
The GCSE penalty for pupils who do not attend grammar schools emerges at around the
point where selective school places are available for 70 per cent of high-attaining pupils.
An expansion of grammar schools in selective areas is likely to be associated with decreased
benefits for grammar school pupils and small but growing attainment losses for pupils who
do not get into a grammar school – losses which will be greatest amongst poor children.
Before turning to the potential impact on GCSE attainment of introducing FSM quotas for grammar
schools, we consider the characteristics of pupils grammar schools would have in their intakes under
quota systems. We then present estimates for the effects of various quotas on GCSE attainment for
FSM pupils, beginning with quotas for existing grammar schools, and finally looking at new grammar
schools in low-performing non-selective areas with quotas for FSM pupils. Our model assumptions
are set out ahead of the quota effect estimates.
What would quotas mean for the nature of grammar school intakes?
To assess the implications of FSM quotas for grammar school intakes we look at the changing prior
attainment of FSM pupils who might be included in various quotas, and compare this with the prior
attainment of non-FSM pupils.
The analysis is based on pupils who sat their GCSEs in 2015, and completed Key Stage 2 in 2010, and
hence uses the old Key Stage 2 attainment levels; this is to make it comparable with analysis later in
this section considering the GCSE effects of quotas.
Firstly, we consider this across all areas where children are living within reach of an existing grammar
school that accepts pupils of their gender. Figure 2.1 shows the lowest Key Stage 2 prior attainment
for areas where grammar schools educate different proportions of pupils.
In areas where grammar schools provide places for 12.5 per cent of all pupils (equivalent to
50 per cent of all high-attainers), the lowest-attaining pupil to get a grammar school place
should have Key Stage 2 attainment at level 5B. If FSM pupils were equally represented in
grammar schools, the lowest-attaining FSM pupil would be at level 5C.
In areas where 25 per cent of pupils attend grammar schools (100 per cent of high
attainers), the lowest-attaining pupil to get a place should have achieved level 5C at Key

13
Stage 2. If FSM pupils were equally represented, the lowest-attaining FSM pupil to get a
place at a grammar school would have achieved level 4A.
In areas where 37.5 per cent of pupils attend grammar schools (150 per cent of high
attainers), the lowest-attaining pupil to get a grammar school place should have attainment
of a high level 4A at Key Stage 2. If FSM pupils were equally represented in grammar schools,
the lowest-attaining FSM pupil would be at level 4B.
Some parts of East Lindsey in Lincolnshire and Shepway in Kent already have grammar school places
for over 195 per cent of high-attaining children; at these levels if applied across all areas with access
to selective schools, there would be grammar school places for some pupils with achievement at the
top of level 4B. The new expected level of attainment for all pupils nationally, from 2016, was
designed to be roughly equivalent to level 4B.
The use of locally representative quotas for FSM pupils would, of course, mean turning away non-
FSM pupils with higher attainment than the lowest-attaining FSM pupils to get a place. If 14.6 per
cent of grammar school places went to FSM pupils, matching the rate of FSM in areas within reach
of a grammar school, then approximately one-fifth of all non-FSM pupils would fail to secure a
place despite having higher attainment than the lowest-attaining FSM pupil to get a place.
Figure 2.1: Minimum KS2 prior attainment in areas with access to existing grammar schools
Secondly, we consider the prior attainment implications for new grammar schools if opened in the
fifteen lowest-performing non-selective local authority areas. Figure 2.2 shows the lowest Key Stage
2 prior attainment in these areas for different hypothetical levels of grammar school provision.
If new grammar schools catered for 12.5 per cent of all pupils in these areas (50 per cent of
high-attainers), the lowest-attaining pupil to get a grammar school place should have Key
Stage 2 attainment on the borderline of levels 5B and 5C. If FSM pupils were equally
represented in grammar schools, the lowest-attaining FSM pupil would be on the level
5C/4A borderline.

14
If new grammar schools educated 25 per cent of pupils in these areas (100 per cent of high
attainers), the lowest-attaining pupil to get a place should have attainment on the level
5C/4A borderline. If FSM pupils were equally represented, the lowest-attaining FSM pupil to
get a place at a grammar school would be on the level 4A/4B borderline.
If new grammar schools provided places for 37.5 per cent of pupils in these areas (150 per
cent of high attainers), the lowest-attaining pupil to get a grammar school place should have
Key Stage 2 attainment at level 4A. If FSM pupils were equally represented in grammar
schools, the lowest-attaining FSM pupil would be at level 4B.
So we see that providing a grammar school education in low-performing areas is a different task
from that taken on by existing grammar schools, involving teaching children with lower prior
attainment, particularly in the case where FSM pupils are represented proportionally to their
presence in the local population, and when comparing new and existing areas with lower levels of
selection.
Around one in seven non-FSM pupils would miss out on a place despite having attainment higher
than the lowest FSM pupil to get a place if a quota for equal representation were applied to new
grammar schools in these local authorities.
Figure 2.2: Minimum KS2 prior attainment in 15 non-selective LAs with lowest KS4 attainment

15
Quota model assumptions
In the following analyses, we have made the following assumptions to model estimates of the
grammar school effect in the presence of FSM quotas:
No improvements to the quality of neighbouring non-selective schools are assumed as we
do not find any evidence to support this in the current system. There are no improvements
assumed to flow from other consultation document proposals, such as the sponsorship of
comprehensive schools by grammar schools or independent schools. There is a paucity of
evidence to support any such benefits to the wider system.
We use favourable estimates of the size of the grammar school bonus for disadvantaged
pupils, which are likely to be overstated due to unobserved selection effects. Despite
reservations as to the real size of these benefits, we assume their size to be 1.5 times as
large as the bonus for all pupils, in line with our earlier model estimates.
We use conservative estimates of the size and point of emergence of the penalty to pupils
who attend non-selective schools but live in reach of at least one grammar school. We have
used our original estimates of the penalty emerging when there are enough grammar school
places for 70 per cent of high-attaining pupils, although further analysis suggests that the
penalty emerges sooner and is larger in the majority of selective authorities (see Figure 2.3
and discussion below).
Our original estimates found a positive effect estimate for attending a non-selective school
in the vicinity of grammar schools from our original models for grammar school place
availability in the range of 45 to 60 per cent of high attainers. We have retained this in our
new models for the effect of FSM quotas for existing grammar schools.
However, we have assumed a zero effect for the range below 70 per cent in our models for
new grammar schools in the lowest-performing non-selective authorities. The positive effect
modelled in existing selective areas is heavily dependent on the inclusion of four local
authorities with very high average Key Stage 4 attainment (Buckinghamshire, Southend-on-
Sea, Hertfordshire and Bournemouth). The estimate is heavily influenced by the peculiarities
of these areas rather than the presence of a particular level of selection. We have been
conservative in not applying a penalty here, as would be suggested by Figure 2.3 below.
The grammar school bonus is assumed to decline gradually as non-FSM pupils are replaced
by FSM pupils, applying a 0.95 ratio (based on FSM pupils’ relative prior attainment levels) to
the bonus estimated for ‘new’ FSM pupils brought into grammar schools by the quotas.
The optimistic estimates for the FSM grammar schools bonus, and the conservative estimates of
penalties for pupils missing out on a place at a grammar school, combine to give a best case
scenario for the effects of quotas and additional grammar schools.
Figure 2.3 investigates the sensitivity of our original estimates of the non-grammar penalty to the
inclusion of particular local authority areas in the analysis. The original estimate is plotted in dark
green, alongside an alternative estimate (light green) which excludes four local authorities with very
high average Key Stage 4 attainment, that send some pupils to grammar schools (Buckinghamshire,
Southend-on-Sea, Hertfordshire and Bournemouth).
Under the alternative estimate, the non-grammar penalty has emerged by the time there are
enough grammars for 50 per cent of high attainers (contrasted with emergence at 70 per cent of
16
high attainers in the original estimate). The alternative penalty estimates are around twice as large
as the original estimates. This is based on the majority of authorities in which pupils live within
reach of grammar schools.
It is fair to include the four high-performing local authority areas within our models for FSM quotas
for existing grammar schools. However, it would not make sense to assume that attainment levels
in the 15 lowest-performing non-selective local authority areas would suddenly match those of
the highest-performing 20 local authority areas in the country, for pupils not attending the new
grammar schools, simply because a minority of other local pupils did attend them.
Figure 2.3: Where the penalty emerges - is the effect positive below 70 per cent selection?
Grammar school effects in the current system
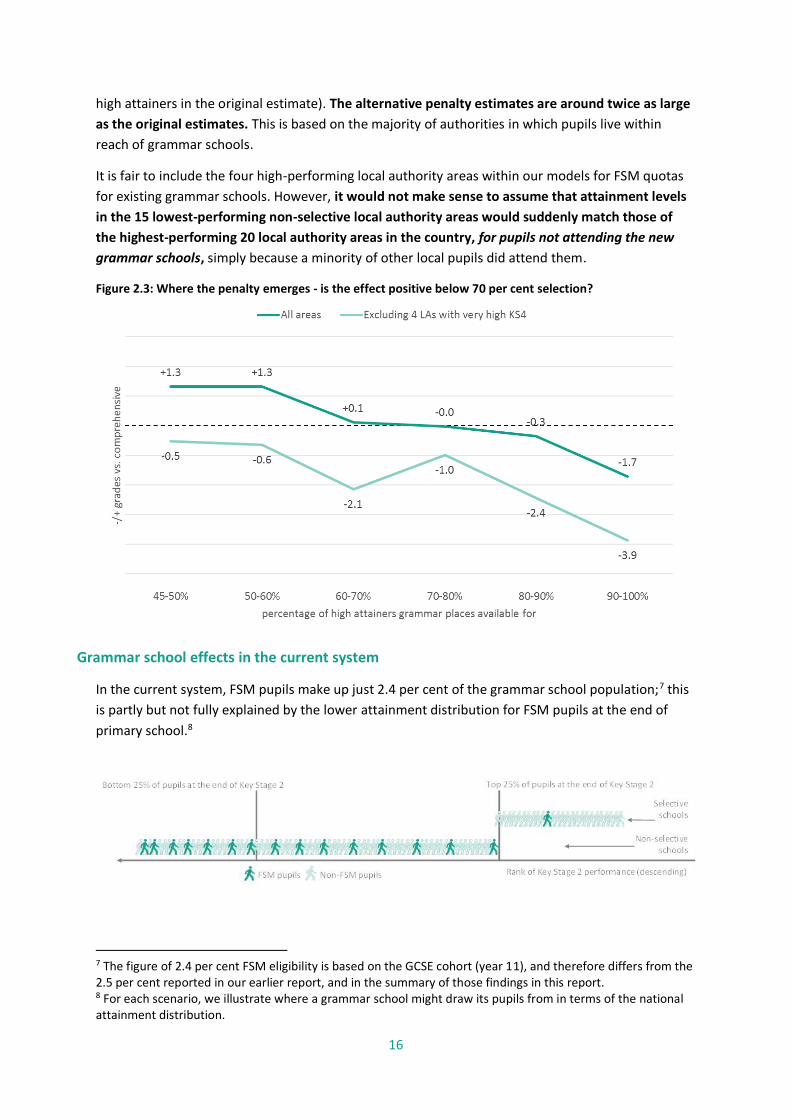
In the current system, FSM pupils make up just 2.4 per cent of the grammar school population;7 this
is partly but not fully explained by the lower attainment distribution for FSM pupils at the end of
primary school.8
7 The figure of 2.4 per cent FSM eligibility is based on the GCSE cohort (year 11), and therefore differs from the 2.5 per cent reported in our earlier report, and in the summary of those findings in this report. 8 For each scenario, we illustrate where a grammar school might draw its pupils from in terms of the national attainment distribution.
17
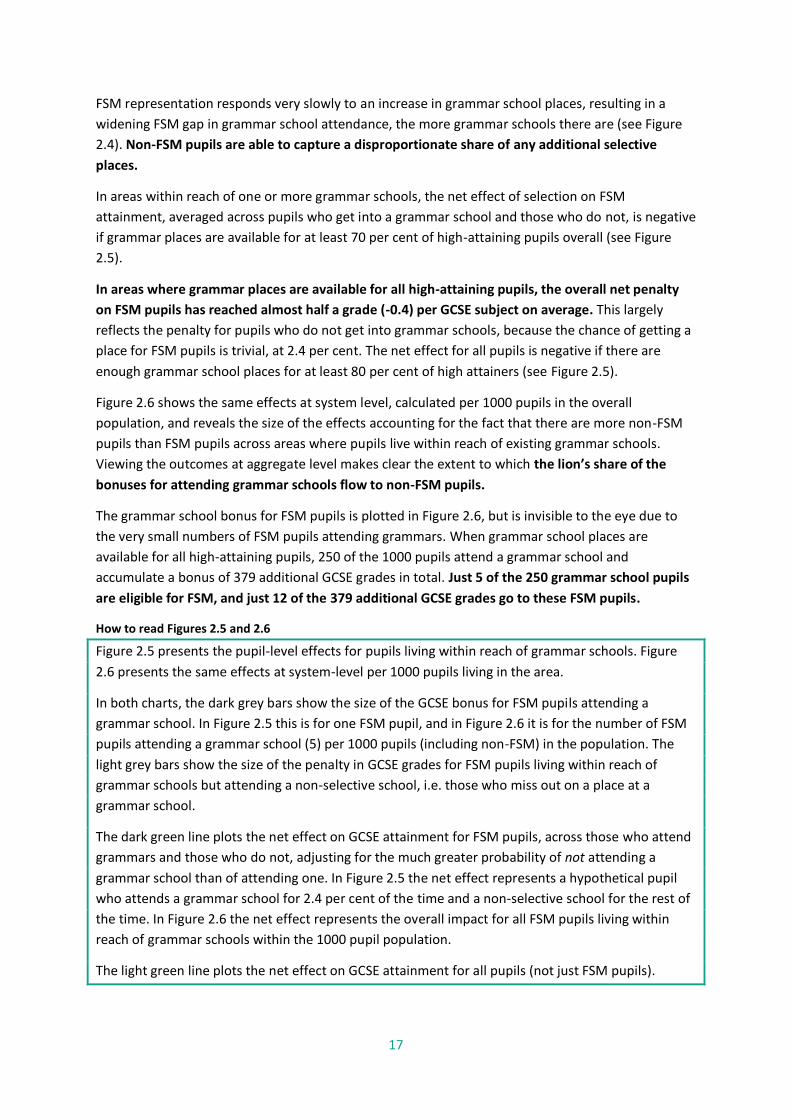
FSM representation responds very slowly to an increase in grammar school places, resulting in a
widening FSM gap in grammar school attendance, the more grammar schools there are (see Figure
2.4). Non-FSM pupils are able to capture a disproportionate share of any additional selective
places.
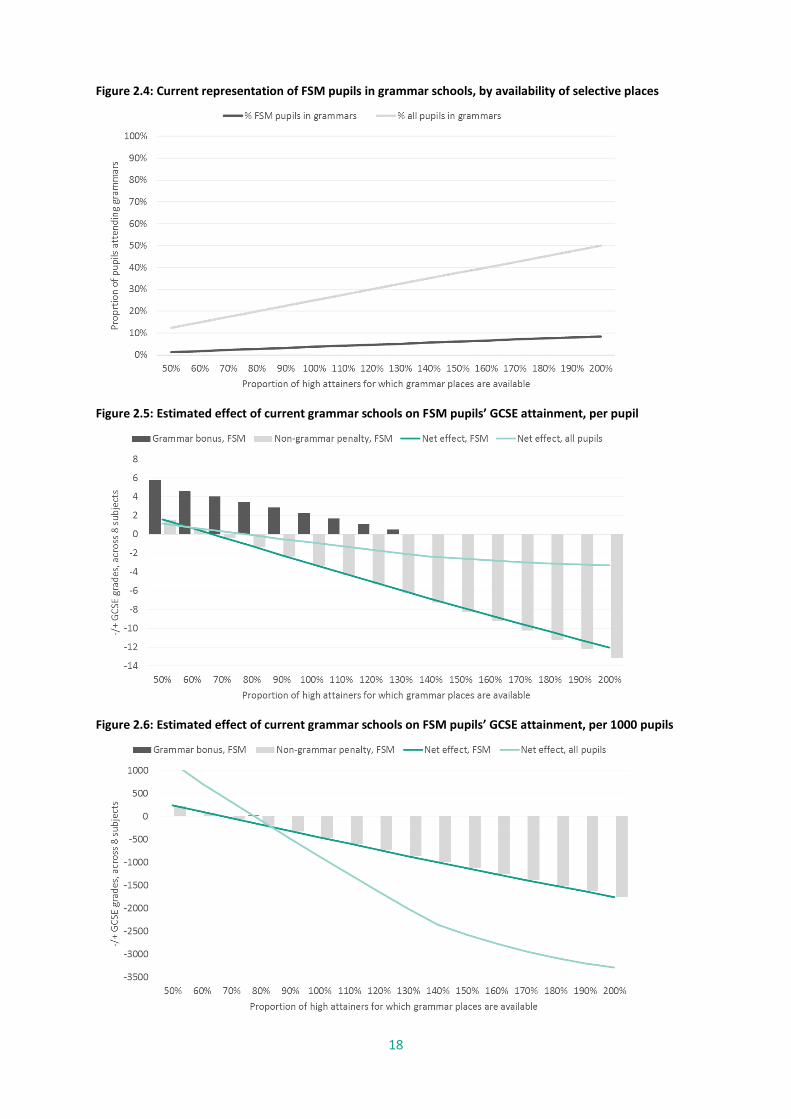
In areas within reach of one or more grammar schools, the net effect of selection on FSM
attainment, averaged across pupils who get into a grammar school and those who do not, is negative
if grammar places are available for at least 70 per cent of high-attaining pupils overall (see Figure
2.5).
In areas where grammar places are available for all high-attaining pupils, the overall net penalty
on FSM pupils has reached almost half a grade (-0.4) per GCSE subject on average. This largely
reflects the penalty for pupils who do not get into grammar schools, because the chance of getting a
place for FSM pupils is trivial, at 2.4 per cent. The net effect for all pupils is negative if there are
enough grammar school places for at least 80 per cent of high attainers (see Figure 2.5).
Figure 2.6 shows the same effects at system level, calculated per 1000 pupils in the overall
population, and reveals the size of the effects accounting for the fact that there are more non-FSM
pupils than FSM pupils across areas where pupils live within reach of existing grammar schools.
Viewing the outcomes at aggregate level makes clear the extent to which the lion’s share of the
bonuses for attending grammar schools flow to non-FSM pupils.
The grammar school bonus for FSM pupils is plotted in Figure 2.6, but is invisible to the eye due to
the very small numbers of FSM pupils attending grammars. When grammar school places are
available for all high-attaining pupils, 250 of the 1000 pupils attend a grammar school and
accumulate a bonus of 379 additional GCSE grades in total. Just 5 of the 250 grammar school pupils
are eligible for FSM, and just 12 of the 379 additional GCSE grades go to these FSM pupils.
How to read Figures 2.5 and 2.6
Figure 2.5 presents the pupil-level effects for pupils living within reach of grammar schools. Figure
2.6 presents the same effects at system-level per 1000 pupils living in the area.
In both charts, the dark grey bars show the size of the GCSE bonus for FSM pupils attending a
grammar school. In Figure 2.5 this is for one FSM pupil, and in Figure 2.6 it is for the number of FSM
pupils attending a grammar school (5) per 1000 pupils (including non-FSM) in the population. The
light grey bars show the size of the penalty in GCSE grades for FSM pupils living within reach of
grammar schools but attending a non-selective school, i.e. those who miss out on a place at a
grammar school.
The dark green line plots the net effect on GCSE attainment for FSM pupils, across those who attend
grammars and those who do not, adjusting for the much greater probability of not attending a
grammar school than of attending one. In Figure 2.5 the net effect represents a hypothetical pupil
who attends a grammar school for 2.4 per cent of the time and a non-selective school for the rest of
the time. In Figure 2.6 the net effect represents the overall impact for all FSM pupils living within
reach of grammar schools within the 1000 pupil population.
The light green line plots the net effect on GCSE attainment for all pupils (not just FSM pupils).
18
Figure 2.4: Current representation of FSM pupils in grammar schools, by availability of selective places
Figure 2.5: Estimated effect of current grammar schools on FSM pupils’ GCSE attainment, per pupil
Figure 2.6: Estimated effect of current grammar schools on FSM pupils’ GCSE attainment, per 1000 pupils
19
Applying quotas to existing grammar schools and the areas their pupils are drawn from
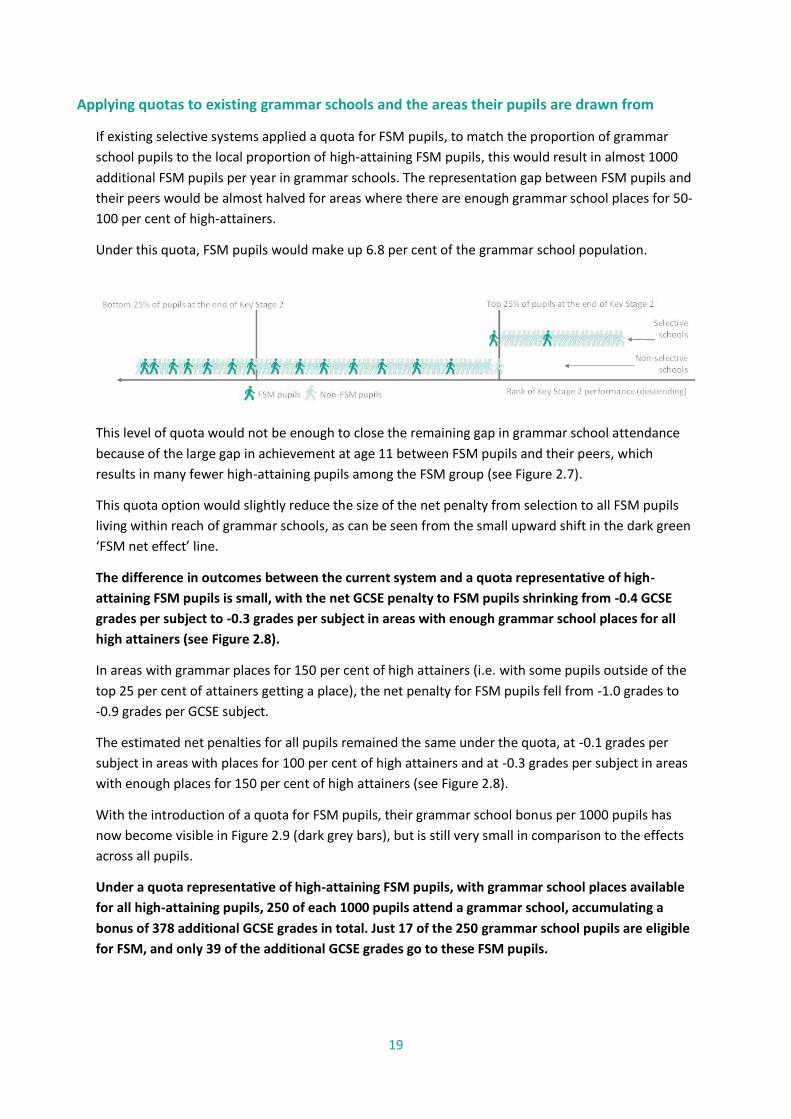
If existing selective systems applied a quota for FSM pupils, to match the proportion of grammar
school pupils to the local proportion of high-attaining FSM pupils, this would result in almost 1000
additional FSM pupils per year in grammar schools. The representation gap between FSM pupils and
their peers would be almost halved for areas where there are enough grammar school places for 50-
100 per cent of high-attainers.
Under this quota, FSM pupils would make up 6.8 per cent of the grammar school population.
This level of quota would not be enough to close the remaining gap in grammar school attendance
because of the large gap in achievement at age 11 between FSM pupils and their peers, which
results in many fewer high-attaining pupils among the FSM group (see Figure 2.7).
This quota option would slightly reduce the size of the net penalty from selection to all FSM pupils
living within reach of grammar schools, as can be seen from the small upward shift in the dark green
‘FSM net effect’ line.
The difference in outcomes between the current system and a quota representative of high-
attaining FSM pupils is small, with the net GCSE penalty to FSM pupils shrinking from -0.4 GCSE
grades per subject to -0.3 grades per subject in areas with enough grammar school places for all
high attainers (see Figure 2.8).
In areas with grammar places for 150 per cent of high attainers (i.e. with some pupils outside of the
top 25 per cent of attainers getting a place), the net penalty for FSM pupils fell from -1.0 grades to
-0.9 grades per GCSE subject.
The estimated net penalties for all pupils remained the same under the quota, at -0.1 grades per
subject in areas with places for 100 per cent of high attainers and at -0.3 grades per subject in areas
with enough places for 150 per cent of high attainers (see Figure 2.8).
With the introduction of a quota for FSM pupils, their grammar school bonus per 1000 pupils has
now become visible in Figure 2.9 (dark grey bars), but is still very small in comparison to the effects
across all pupils.
Under a quota representative of high-attaining FSM pupils, with grammar school places available
for all high-attaining pupils, 250 of each 1000 pupils attend a grammar school, accumulating a
bonus of 378 additional GCSE grades in total. Just 17 of the 250 grammar school pupils are eligible
for FSM, and only 39 of the additional GCSE grades go to these FSM pupils.

20
Figure 2.7: Representation of FSM pupils in grammar schools under 6.8 per cent quota (local high attainers)
Figure 2.8: Estimated effect with 6.8 per cent quota (local high attainers) on FSM GCSE attainment, per pupil
Figure 2.9: Estimated effect with 6.8 per cent quota (high attainers) on FSM attainment, per 1000 pupils
21
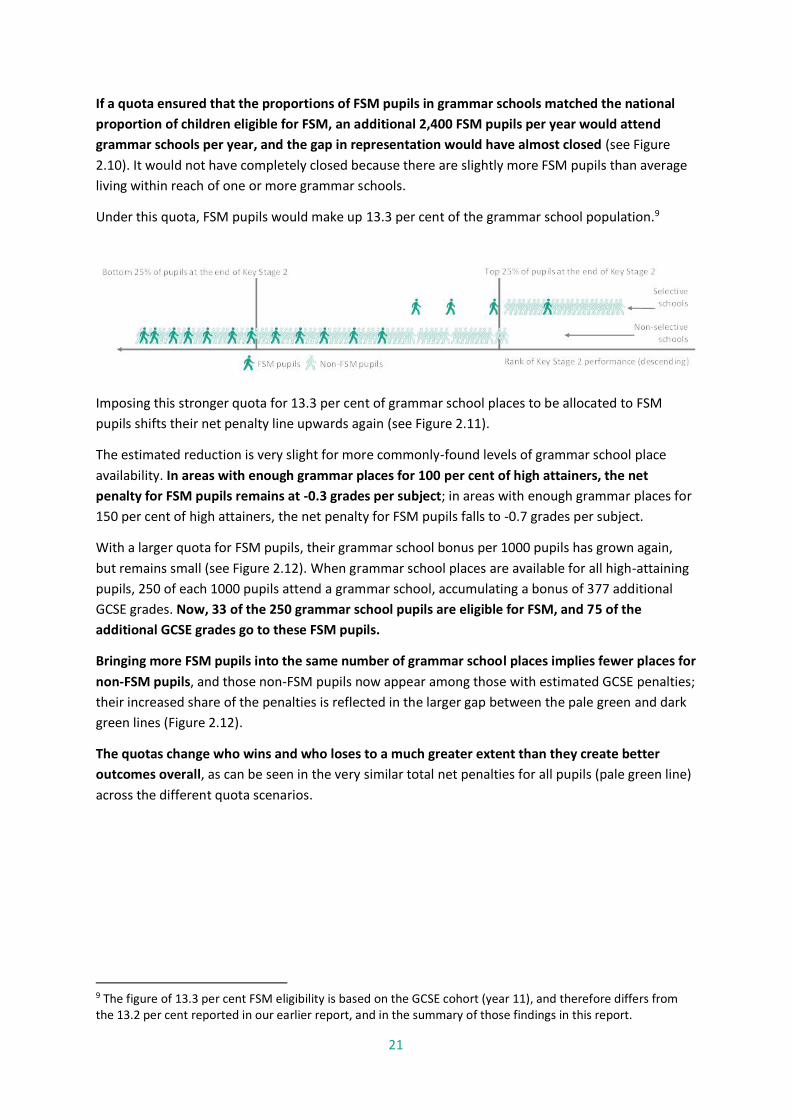
If a quota ensured that the proportions of FSM pupils in grammar schools matched the national
proportion of children eligible for FSM, an additional 2,400 FSM pupils per year would attend
grammar schools per year, and the gap in representation would have almost closed (see Figure
2.10). It would not have completely closed because there are slightly more FSM pupils than average
living within reach of one or more grammar schools.
Under this quota, FSM pupils would make up 13.3 per cent of the grammar school population.9
Imposing this stronger quota for 13.3 per cent of grammar school places to be allocated to FSM
pupils shifts their net penalty line upwards again (see Figure 2.11).
The estimated reduction is very slight for more commonly-found levels of grammar school place
availability. In areas with enough grammar places for 100 per cent of high attainers, the net
penalty for FSM pupils remains at -0.3 grades per subject; in areas with enough grammar places for
150 per cent of high attainers, the net penalty for FSM pupils falls to -0.7 grades per subject.
With a larger quota for FSM pupils, their grammar school bonus per 1000 pupils has grown again,
but remains small (see Figure 2.12). When grammar school places are available for all high-attaining
pupils, 250 of each 1000 pupils attend a grammar school, accumulating a bonus of 377 additional
GCSE grades. Now, 33 of the 250 grammar school pupils are eligible for FSM, and 75 of the
additional GCSE grades go to these FSM pupils.
Bringing more FSM pupils into the same number of grammar school places implies fewer places for
non-FSM pupils, and those non-FSM pupils now appear among those with estimated GCSE penalties;
their increased share of the penalties is reflected in the larger gap between the pale green and dark
green lines (Figure 2.12).
The quotas change who wins and who loses to a much greater extent than they create better
outcomes overall, as can be seen in the very similar total net penalties for all pupils (pale green line)
across the different quota scenarios.
9 The figure of 13.3 per cent FSM eligibility is based on the GCSE cohort (year 11), and therefore differs from the 13.2 per cent reported in our earlier report, and in the summary of those findings in this report.

22
Figure 2.10: Representation of FSM pupils in grammar schools under 13.3 per cent quota (national FSM rate)
Figure 2.11: Estimated effect with 13.3 per cent quota (national rate) on FSM GCSE attainment, per pupil
Figure 2.12: Estimated effect with 13.3 per cent quota (national rate) on FSM attainment, per 1000 pupils

23
A quota set to close the gap in grammar school attendance between FSM pupils and their peers
would require 14.6 per cent of grammar school places to go to FSM pupils, matching the
prevalence of FSM pupils living within reach of one or more grammars. This fully representative
quota would result in an extra 2,700 FSM pupils per year in grammar schools, and is depicted in
Figure 2.13.
This quota for 14.6 per cent of grammar school places to be allocated to FSM pupils results in a
further small shift upwards in the net penalty line. In areas with enough grammar places for 100 per
cent of high attainers, the net GCSE penalty for FSM pupils drops to -0.2 grades per subject, and in
areas with enough grammar places for 150 per cent of high attainers, it reduces to -0.6 grades per
subject (see Figure 2.14).
While an increased quota is estimated to reduce the educational penalties for FSM pupils, these
persist even with a quota representative of the local area, which would represent a six-fold
increase in the number of FSM pupils attending grammar schools. The estimated penalties still
increase, the more grammar school places are made available, for both FSM pupils and other pupils.
At a system level, the grammar school bonus (dark grey bars) now reaches 37 FSM pupils per 1000
pupils in areas where grammar school places are available for all high-attaining pupils (see Figure
2.15). The 250 grammar school pupils accumulate a bonus of 376 additional GCSE grades in total,
of which 82 are now estimated to go to the 37 FSM pupils.
Around two-thirds of the net penalty in GCSE grades is now felt by non-FSM pupils, compared with
half of the net penalty to FSM pupils and half to non-FSM pupils under the current low rates of FSM
attendance at grammar schools.
FSM pupils are still disproportionately penalised, accumulating twice their share of the penalties
even under a fully representative quota, because their attainment suffers more than that of other
pupils in the same position of missing out on a place at a grammar school.

24
Figure 2.13: Representation of FSM pupils in grammar schools under 14.6 per cent quota (local FSM rate)
Figure 2.14: Estimated effect with 14.6 per cent quota (local FSM rate) on FSM GCSE attainment, per pupil
Figure 2.15: Estimated effect with 14.6 per cent quota (local FSM rate) on FSM attainment, per 1000 pupils

25
Opening new grammar schools in low-performing non-selective areas
An alternative option for increasing the representation of FSM pupils in grammar schools would be
to open entirely new grammar schools in areas of the country where they do not currently exist,
focusing on areas where GCSE performance is low and there are higher than average rates of
eligibility for FSM. We have modelled the effects of opening new grammar schools in the fifteen
lowest-performing non-selective LA areas, and of applying FSM quotas to the admissions for these
new schools. The FSM rate for these areas is 17.4 per cent, higher than the national rate of 13.3 per
cent at the end of KS4.
In these analyses, we shift the horizontal axis (measuring the availability of grammar school places
for high-attaining pupils) to the right, and focus on lower levels of grammar school provision, as it
would take time to build up stocks of selective school places in new areas. A very large programme
of building or conversion would be needed to match the levels of selective provision in the most
selective areas, on new turf.
We do not assume that there would be a positive effect on pupils who miss out on a grammar school
place in newly selective areas, having shown that to be a feature of a small number of high-
performing selective local authority areas (see Figure 2.3).
Although we found there to be a penalty for those within reach of a grammar school but attending a
non-selective school, after excluding these LA areas, we apply an assumption of zero impact on the
attainment of non-grammar pupils to the ‘newly selective’ currently low-performing areas.
Therefore, we see only the impact of attainment bonuses for pupils attending grammar schools in
areas with grammar places for up to 70 per cent of high attainers.
Nevertheless, at rates of FSM grammar school attendance matching those for pupils living within
reach of existing grammar schools, positive net effects from new grammar schools are estimated to
be extremely small because grammar schools only educate a minority of pupils, and because no
effect is assumed for pupils not attending one of the new grammar schools, but living nearby.
Without quotas, the estimated net effect for FSM pupils is smaller than +0.1 GCSE grades per
subject for areas with new grammar school places sufficient for 50 per cent of high attainers, and
between zero and -0.1 GCSE grades for areas with new grammar school places for 70 per cent of
high attainers (see Figure 2.16).
In fact, the net effect on all FSM pupils is not statistically significantly different from zero at any level
of grammar school provision with places for up to 70 per cent of high attainers, and negative
thereafter.

26
Figure 2.16: Estimated effect of new grammars with 2.4 per cent FSM places on FSM attainment, per pupil
Figure 2.17: Estimated effect of new grammars with 2.4 per cent FSM on FSM attainment, per 1000 pupils
We have modelled the use of quotas for proportions of the new grammar school places reserved for
FSM pupils to match the proportion of high attainers on FSM within the low-performing authorities
(8.2 per cent), the proportion of FSM pupils nationally (13.3 per cent), and the proportion of all
pupils in the low-performing authorities (17.4 per cent). These models appear in Figures 2.18 to
2.23.
Under the largest of these quotas, FSM pupils would make up 17.4 per cent of the grammar school
population, and only around one in five of these FSM pupils would be drawn from the top 25 per
cent of attainers at Key Stage 2.

27
At best, the models estimate that using a 17.4 per cent quota (representative of FSM pupils in the
area), and providing grammar school places for 50 per cent of high attainers, a bonus of +0.1
additional grades per GCSE subject accrues to tiny numbers of FSM pupils. In a pupil population of
1000, there would be 125 grammar school places, and just 22 out of 174 FSM pupils would gain a
place enabling them to benefit from the GCSE bonus.
Under all the quotas, there remained negative net effects on FSM pupils if grammar school places
were provided for more than 70 per cent of high attainers. Given the sensitivity of the model to
removing a handful of very high-performing selective local authority areas (see Figure 2.3), there
could plausibly be no net benefits of opening new grammar schools in low-performing non-
selective areas at any level of grammar school place provision, even with large FSM quotas.

28
Figure 2.18: Estimated effect of new grammars with 8.2 per cent FSM places on FSM attainment, per pupil
Figure 2.19: Estimated effect of new grammars with 8.2 per cent FSM on FSM attainment, per 1000 pupils
Figure 2.20: Estimated effect of new grammars with 13.3 per cent FSM places on FSM attainment, per pupil

29
Figure 2.21: Estimated effect of new grammars with 13.3 per cent FSM on FSM attainment, per 1000 pupils
Figure 2.22: Estimated effect of new grammars with 17.4 per cent FSM places on FSM attainment, per pupil
Figure 2.23: Estimated effect of new grammars with 17.4 per cent FSM on FSM attainment, per 1000 pupils

30
Concluding comments on quotas
Overall, the models presented above suggest that it would be possible to reduce or eliminate the
under-representation of FSM pupils within existing grammar schools by applying quotas. These
would result in fewer places for non-FSM pupils and more places for FSM pupils.
Using a quota reserving 14.6 per cent of grammar school places for FSM pupils, the estimated net
GCSE penalties paid by FSM pupils living near selective schools could be reduced to -0.2 grades per
subject in areas with selective school places for 25 per cent of pupils (100 per cent of high attainers),
but would remain as large as -0.6 grades per subject in areas with more grammar school places than
high-attaining pupils (150 per cent of high attainers).
The quotas change who wins and who loses from selective schooling to a much greater extent than
they actually improve the overall outcomes from selective schooling, and the net impact remains
negative for areas with concentrations of grammar schools.
However, FSM pupils overall are still disproportionately penalised, accumulating twice their share of
the GCSE penalties even when they secure a representative share of grammar school places. This is
because the GCSE attainment of FSM pupils suffers more than that of other pupils when they find
themselves in the position of missing out on a grammar school place and attending nearby non-
selective schools.
Turning to quotas in new grammar schools, opened in low-performing non-selective local
authorities, the estimated benefits for FSM pupils are very small and rather uncertain to materialise.
Using a quota reserving 17.4 per cent of grammar school places for FSM pupils, and opening new
grammar schools to provide places for approximately 50 per cent of high attainers, a GCSE bonus of
+0.1 grades per subject is estimated. However, based on a population of 1000 pupils, this bonus
would only reach 22 FSM pupils, and if the number of grammar school places were increased to
address this, the net effect on FSM pupils would quickly become negative.

31
Part 3: Location of expanded grammar school provision
Overview
Our analysis to date has focused on the location and performance of existing grammar school
provision and, based on these findings, whether there should be an expansion in the number of
grammar school places. The conclusion from that analysis is that the introduction of new grammar
schools is unlikely to lead to an overall increase in performance and could be to the detriment of
pupils from disadvantaged backgrounds in particular.
We extend that analysis in this section, to explore whether there are areas in the country in which a
new grammar school could open, taking into account the existing evidence on wider effects and
parental demand. From a national policy perspective there are some general principles that must be
considered based on the objective of Schools that work for everyone to increase the number of, and
access to, good school places. The introduction of new grammar school places:
should not be to the detriment of pupils that miss out;
should be in areas where there are sufficient numbers of pupils within a reasonable travel
distance so that the school is not inefficient or reliant on pupils travelling exceptionally long
distances;
should not undermine existing high-performing non-selective schools; and
will only be in areas where there is parental demand for them.
In this analysis we apply these conditions to local areas across England to establish the locations that
satisfy these broad principles. This does not imply endorsement of these areas as locations for
grammar schools nor the endorsement of additional selective provision in general but the analysis
serves to build understanding of what a government policy of increased selection might look like at a
local level. In practice there are likely to be a number of local factors that will affect the impact that
a new grammar school would have on the local area such as the actual catchment areas of schools,
transport links and changes in pupil numbers.
Principles
We begin by constructing a set of rules by which the broad principles might be applied to potential
locations of new grammar schools. In this analysis we consider a ‘location’ to be one of the 32,844
lower layer super output areas (LSOAs) in England.10
(1) Grammar schools should not be to the detriment of those that miss out on entry
Our previous research showed that there are benefits to those that attend grammar schools but, in
the most selective areas, there is a penalty for those that miss out. We found that this penalty
emerges once there are enough selective school places for 70 per cent of pupils with high
attainment at the end of primary school (we define these areas as having a ‘selection score’ of 0.7).
In areas at this level or above, the premium associated with attending a grammar school is about a
10 These are geographical units comprising between 400 and 1,200 households.

32
third of a grade in each of eight GCSE subjects, and the penalty for those that miss out is about a
tenth of a grade in each subject.
The new analysis in this report suggests that in some areas this penalty will appear much earlier; this
is because there is insufficient high quality provision for pupils to attend in place of a grammar
school. However, we maintain the more conservative approach of applying the 70 per cent rule and
therefore maximise the number of potential locations for new grammar schools. We therefore:
exclude any LSOA that itself has a selection score of 0.7 or above or has another LSOA within
a reasonable travel distance that has a score of 0.7 or above.11
As well as the 70 per cent rule, we must consider that the addition of a grammar school will, by
definition, increase the selection score of those neighbouring LSOAs. In addition, we therefore:
exclude any LSOA that itself has a selection score of 0.5 or above or has another LSOA within
a reasonable travel distance that has a score of 0.5 or above.
Of course, the first rule here becomes redundant once the second has been applied but we have
presented in two steps to illustrate the effect of setting the threshold at different levels.
(2) Grammar schools should be in areas with sufficient numbers of pupils with high prior
attainment living nearby
Opening a new school in an area with few pupils from which it could draw on could result in one of
two things. Firstly, that it fails to attract a sufficient number of pupils and operates under-capacity,
making it inefficient, or secondly, as is more likely with a grammar school, that it relies on pupils
travelling long distances to attend. This would seem at odds with the Government’s aim to have
more good school places that are within reach of more pupils. We therefore:
exclude any LSOA that does not have at least 150 Key Stage 4 pupils with high prior
attainment living within a reasonable travel distance.
Again, this is a conservative rule that aims to maximise the number of potential locations for new
grammar schools. In 2015 the number of pupils in the Key Stage 4 cohort of grammar schools ranged
from 56 to 206 with an average of around 140 per school.12 A rule needing 150 pupils within a
reasonable travel distance is likely to result in a school at the lower end of this scale (since it is
unlikely that all pupils will choose to attend that school especially if other high-performing schools
are available). This rule avoids opening selective schools in isolated areas – it does not prevent
schools in low-attaining urban areas where there are still likely to be sufficient high-attaining pupils.
(3) Grammar schools should not undermine existing high-performing non-selective schools
If the intention is to create additional good school places then the introduction of more grammar
school places should not be to the detriment of existing high-performing schools, particularly those
with disadvantaged pupils. The introduction of a grammar school should not risk undermining an
existing school through the movement of pupils, staff or other resources. There are issues that are
specific to the introduction of grammar schools that do not apply to new schools in general. New
11 A ‘reasonable travel distance’ is defined as the distance travelled by up to 90 per cent of pupils to a selective school in that area type. A table giving this distances is in Annex 2. 12 Secondary school performance tables 2015

33
grammar schools are likely to cream off the most-able pupils, drawing pupils with high prior
attainment away from other schools. Grammar schools also attract more experienced teachers and
are more likely to have a more stable staffing structure than other schools.13
Whilst it is difficult to model the exact effects of a new school using nationally available data, we
apply two different rules to illustrate the extent to which the precise rule matters. We therefore:
exclude any LSOA that is within a short distance of a non-selective school in the top quarter
of ‘value added’ at Key Stage 4;14 and subsequently
exclude any LSOA that is within a reasonable travel distance of a non-selective school in the
top quarter of ‘value added’ at Key Stage 4.
(4) Grammar schools will only be in areas where there is parental demand for them
In oral evidence to the Education Select Committee on 8 November 2016 the Schools Minister, Nick
Gibb, was asked how many grammar schools he thought would be open by 2020. In response he
said:
‘We do not have such an assessment. This is about allowing flexibility in the system. We are
consulting on that. It will ultimately be driven by local demand and what parents want.’15
Our final consideration is therefore those areas which are supportive of the expansion in the number
of grammar school places. There is no routinely collected data on such attitudes, however in
September 2016 the polling organisation YouGov published an analysis of the level of support for
grammar schools at a local authority level based on the profiles data of 80,000 members of their
YouGov panel.16 They classified each local authority area as either strongly in favour, slightly in
favour, slightly against, or strongly against.17 Of the 148 local authorities with data published,
YouGov identified 37 as strongly in favour, and it is these areas that we consider meet the principle
of having parental demand.18
Analysis
Figure 3.1 below shows the number of LSOAs that are excluded as each of the first three principles is
applied and how many Key Stage 4 pupils in 2015 were resident in those areas. Note that these
13 R. Allen 2016, ‘Inequalities in access to teachers in selective areas’ http://educationdatalab.org.uk/2016/06/inequalities-in-access-to-teachers-in-selective-schooling-areas/ 14 A ‘short distance’ is defined as the distance travelled by up to 50 per cent of pupils to a non-selective school in that area type. A ‘reasonable travel distance’ is defined as the distance travelled by up to 90 per cent of pupils to a non-selective school in that area type. A table giving this distances is in Annex 2. 15 http://data.parliament.uk/writtenevidence/committeeevidence.svc/evidencedocument/education-committee/selective-education/oral/42974.html 16 YouGov, 2016 ‘New map shows where grammar schools would be most welcome’ https://yougov.co.uk/news/2016/09/09/new-map-shows-where-new-grammar-schools-would-be-m/ 17 Data were published for 148 local authorities, with four authorities having an insufficient sample size. 18 This interpretation is that of the authors and does not necessarily reflect those of YouGov. There were 69 authorities labelled as ‘slightly in favour’; whilst it is impossible to accurately predict behaviours based on this analysis, we have interpreted this as meaning they are not opposed in principle to new grammars but would not actively demand them. We do however include analysis of those areas that are ‘slightly in favour’ for completeness.

34
effects are cumulative; they are the number of areas excluded in addition to each of the previous
steps. The number captured by each step in isolation is given in Annex 2.
Excluding areas in which the level of selection is already high (the 0.7 rule), or where selection in
neighbouring LSOAs is high, would remove over one-seventh of all areas (Step 1). It would prohibit
further grammar expansion across Kent, Medway and Thurrock and a significant proportion of
Buckinghamshire and Lincolnshire. In these areas, national modelling suggests that the addition of
further grammar school places would mean an increased penalty for those that do not attend (and
a reduced benefit for those that do).
Expanding this restriction to areas where there are currently grammar school places for half of all
high-performing pupils removes a further seventh of all LSOAs (Step 2). This includes Poole, the vast
majority of Gloucestershire and significant parts of Dorset. In these areas, national modelling
suggests that the addition of further grammar school places would risk creating areas where pupils
who miss out on a grammar school place see a penalty in terms of GCSE outcomes. In the absence
of high quality non-selective schools, these areas may already be seeing a penalty even without
further grammar school places.
An additional restriction based on the number of high-attaining pupils that are available to a new
selective school (Step 3) reduces the number of areas slightly (273 LSOAs or less than 1 per cent),
and coupled with earlier criteria, means that the majority of Devon, Lancashire and Cumbria would
be excluded as an option for further grammar expansion. In these areas an expansion in the
number of grammar school places would either risk a penalty for those that miss out or lead to
schools that are either inefficient (due to small numbers) or require pupils to travel exceptionally
long distances to school.
Placing a further restriction based on the location of high-performing non-selective schools would
have a significant impact. Basing such a restriction on the median travel distance currently seen in
non-selective schools would see an excluded radius of 1.1 miles in urban areas and 2.7 miles in rural
areas (Step 4). It would mean excluding over a fifth of all LSOAs (or a third of those remaining after
the previous restrictions.)
A wider radius – the distance travelled by up to 90 per cent of pupils19 – would remove a further
third of LSOAs (or two-thirds of those that remain). In these areas an expansion in the number of
grammar school places may risk the performance of existing high-performing non-selective
schools.
After applying this first set of principles, only a fifth of LSOAs remain, with very few areas of London,
Manchester, Bradford or Sheffield remaining. In fact, of the 152 local authorities in England:
71 have no LSOAs that meet all of the location principles;
29 have some LSOAs that meet all of the location principles but these capture less than 10
per cent of pupils in the local authority area;
37 have LSOAs that meet all of the location principles and capture at least 10 per cent but
less than half of all pupils in the local authority area;
19 A radius of 3.1 miles in urban-conurbation areas, 4.3 miles in urban-town/city areas and 7.3 miles in rural areas. A full table of these distances is available in Annex 2.

35
15 have LSOAs that meet all of the location principles and these capture at least half of all
pupils in the local authority area.

36
Figure 3.1: The number of LSOAs that capture the principles for location of new selective schools20 LSOA included LSOA Excluded
All LSOAs in England
Number of LSOAs
(number excluded by this step)
32,844
(0)
Percentage of pupils
(percentage excluded by this step)
100%
(0%)
Step 1: Exclude any LSOA that itself has a selection score of 0.7 or above or
has another LSOA within a reasonable travel distance that has a score of
0.7 or above
Number of LSOAs
(number excluded by this step)
27,953
(4,891)
Percentage of pupils
(percentage excluded by this step)
84%
(16%)
Step 2: Exclude any LSOA that itself has a selection score of 0.5 or above or
has another LSOA within a reasonable travel distance that has a score of
0.5 or above
Number of LSOAs
(number excluded by this step)
23,469
(4,484)
Percentage of pupils
(percentage excluded by this step)
71%
(14%)
Step 3: Exclude any LSOA that does not have at least 150 Key Stage 4 pupils
with high prior attainment living within a reasonable travel distance
Number of LSOAs
(number excluded by this step)
23,196
(273)
Percentage of pupils
(percentage excluded by this step)
70%
(1%)
Step 4: Exclude any LSOA that is within a short distance of a non-selective
school in the top quarter of ‘value added’ at Key Stage 4
Number of LSOAs
(number excluded by this step)
15,724
(7,472)
Percentage of pupils
(percentage excluded by this step)
48%
(22%)
Step 5: Exclude any LSOA that is within a reasonable travel distance of a
non-selective school in the top quarter of ‘value added’ at Key Stage 4
Number of LSOAs
(number excluded by this step)
5,864
(9,860)
Percentage of pupils
(percentage excluded by this step)
18%
(30%)
20 National Pupil Database, Key Stage 4 2015. Contains National Statistics data © Crown copyright and database right 2016. Contains OS data © Crown copyright and database right 2016
37
We now consider the extent to which these areas coincide with areas where we might see parental
demand for new grammar school places. In Figure 3.2 we highlight those LSOAs that meet all of the
location criteria and then overlay onto that the 37 local authorities identified by YouGov as being
strongly in favour of more grammar schools and those 42 local authorities identified as being
against. We then show the number of local authorities by proportion of pupils in areas that meet the
location principles and local attitudes towards new grammar schools.
Of the 37 local authorities reported as being strongly in favour of new grammar school places, 25
have no areas which meet the location principles set out above. That is, based on national data,
new grammar schools could not be established in 25 of the local authority areas where there is a
clear demand without introducing a penalty for those pupils that miss out or risking the
performance of existing high-performing non-selective schools.
Of the 37 local authorities reported as being strongly in favour of new grammar school places, six
have an extremely limited number of areas which meet the location principles set out above (i.e.
areas capturing less than 10 per cent of their pupils.) These are Surrey, North Lincolnshire,
Lincolnshire, Havering, Central Bedfordshire and Buckinghamshire. Introducing new grammar
schools in these local authorities retains the risk of having a negative impact on those who do not
attend the grammar school or on neighbouring high-performing schools. This is because the small
numbers involved mean that the precise locations that meet the principles are highly unlikely to
be stable over time.
We now consider those local authority areas in which at least 10 per cent of pupils are resident in
LSOAs that meet the location principles. We will call these local authority areas ‘potentially
qualifying areas’.
There are just six local authority areas that are strongly in favour of new grammar school places that
are also ‘potentially qualifying areas’. These are Solihull (17 per cent of pupils), Essex (18 per cent),
North Yorkshire (27 per cent), Dorset (30 per cent), Northamptonshire (66 per cent) and North
Somerset (69 per cent). As the analysis in Figure 4.2 shows, the location would be restricted to
particular areas within those authorities.
There are 29 authorities that are slightly in favour of new grammar school places that are also
‘potentially qualifying areas’. Of these there are eight authorities in which more than half of pupils
are resident in LSOAS that meet the location principles. These are Bath and North-East Somerset,
Brighton and Hove, Derbyshire, Dudley, Isle of Wight, Middlesbrough, Stockton-on-Tees and Walsall.
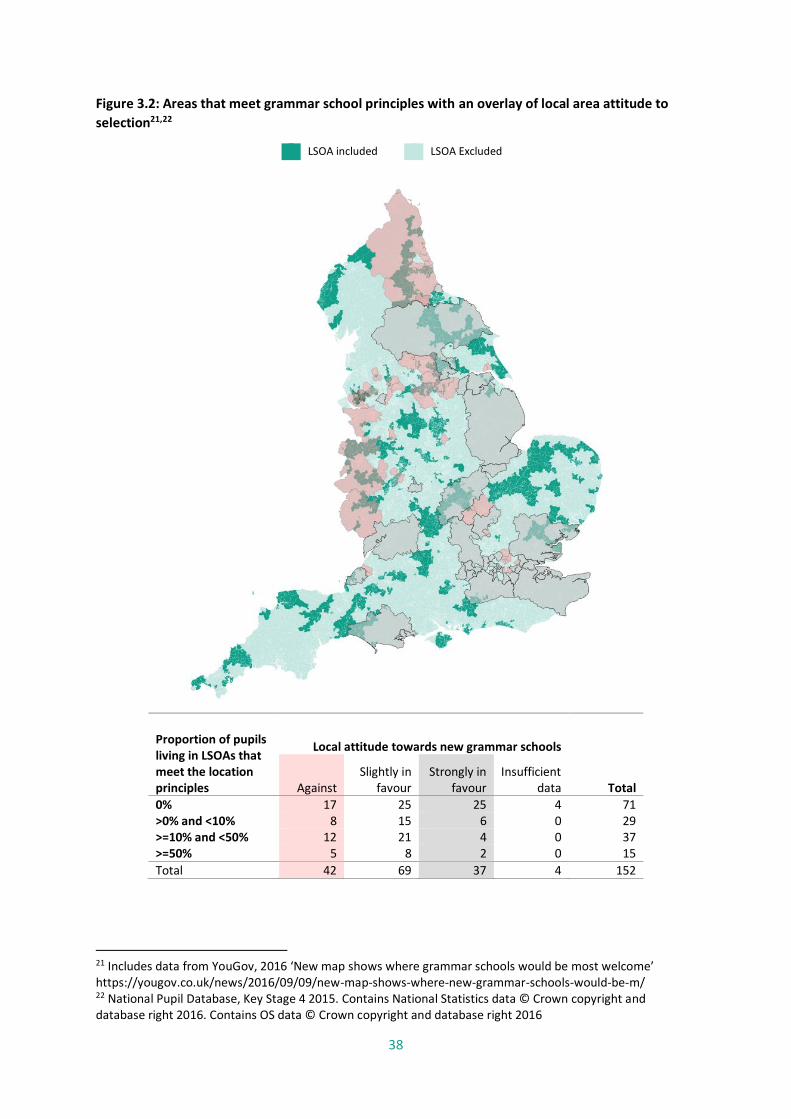
38
Figure 3.2: Areas that meet grammar school principles with an overlay of local area attitude to
selection21,22
LSOA included LSOA Excluded
Proportion of pupils living in LSOAs that meet the location principles
Local attitude towards new grammar schools
Total Against Slightly in
favour Strongly in
favour Insufficient
data
0% 17 25 25 4 71 >0% and <10% 8 15 6 0 29 >=10% and <50% 12 21 4 0 37 >=50% 5 8 2 0 15
Total 42 69 37 4 152
21 Includes data from YouGov, 2016 ‘New map shows where grammar schools would be most welcome’ https://yougov.co.uk/news/2016/09/09/new-map-shows-where-new-grammar-schools-would-be-m/ 22 National Pupil Database, Key Stage 4 2015. Contains National Statistics data © Crown copyright and database right 2016. Contains OS data © Crown copyright and database right 2016

39
What this analysis does not show is any other characteristics of those areas that would be relevant
in any decision to expand the number of grammar school places. In Figure 3.3 we examine one
characteristic, the proportion of pupils eligible for free school meals, which we use as a measure of
disadvantage. This is plotted for all local authorities.
Figure 3.3: Local authorities by attitude to increase in grammar schools, proportion of pupils in areas
meeting location principles and level of free school meal eligibility23
Local authority areas that are strongly in favour of an increase in grammar school places tend to
have lower levels of disadvantage. In areas that are strongly in favour of an increase in the number
of grammar school places 9.9 per cent of secondary aged pupils are eligible for free school meals,
this increases to 12.9 per cent in areas that are slightly in favour and 17.9 per cent in those areas
that are against. Over three-quarters of local authority areas reported as being strongly in favour
of more grammar school places have a below average rate of disadvantage. Conversely, over
three- quarters of local authority areas reported as being against more grammar school places
have a rate of disadvantage that is above average.
All six of the local authority areas that are strongly in favour of new grammar school places and
identified as ‘potentially qualifying areas’, have levels of disadvantage that are below the national
average.
Conclusion
This analysis is not intended as a prescriptive approach relating to where the government may set up
new grammar schools should they decide to do so, or the rules that govern such decisions. What it
does do is illustrate the challenges that the government may face in creating additional grammar
23Includes data from YouGov, 2016 ‘New map shows where grammar schools would be most welcome’ National Pupil Database, Key Stage 4 2015 Department for Education 2016, ‘Schools Pupils and their Characteristics 2016’
0 5 10 15 20 25 30 35 40 45
Percentage of secondary pupils eligible for free school meals 2015
At least 10%of pupils
Less than10% of pupils
Strongly in favour
Slightly in favour
Against
National average FSM = 13.2%

40
school places if it maintains a broad set of principles, which are consistent with those in the
consultation document, namely that the addition of new grammar school places:
should not be to the detriment of pupils that miss out;
should be in areas where there are sufficient numbers of pupils within a reasonable travel
distance so that the school is not inefficient or reliant on pupils travelling exceptionally long
distances;
should not undermine existing high-performing non-selective schools; and
will only be in areas where there is parental demand for them.
By applying what we believe to be rational principles to the creation of any new school places, the
areas that are in scope for expansion are limited. Based on current data we find that there are just
six local authority areas in England that have a significant number of areas that meet these principles
and where there is strong demand for new grammar school places. All six of these areas have levels
of disadvantage that are below the national average.

41
Annex 1: Data sources
A range of data sources have been used throughout this publication. Any inferences or conclusions
derived from these data sources are the responsibility of the Education Policy Institute and not the
data owner.
Edubase
Edubase is the Department for Education’s register of educational establishments in England and Wales.
http://www.education.gov.uk/edubase/home.xhtml
National Pupil Database
The National Pupil Database (NPD) is the Department for Education’s database of attainment and
characteristics for pupils at state-funded schools in England.
https://www.gov.uk/government/collections/national-pupil-database
Primary and Secondary School Performance Tables
The Department for Education’s Performance Tables provide attainment and progress data for all
schools in England.
https://www.compare-school-performance.service.gov.uk/
Maps
Local areas within maps in this report are identified using boundary files obtained from the Office for
National Statistics (ONS) and are subject to Open Government License.
Contains National Statistics data © Crown copyright and database right 2016
Contains OS data © Crown copyright and database right 2016
YouGov
Local attitudes towards grammar schools are taken from YouGov, 2016 ‘New map shows where
grammar schools would be most welcome’
https://yougov.co.uk/news/2016/09/09/new-map-shows-where-new-grammar-schools-would-be-
m/
Official Statistics
Statistics have also been drawn from a range of Official Statistics published by the Department for
Education. These are available from https://www.gov.uk/government/organisations/department-
for-education/about/statistics

42
Annex 2: Additional data
Figure A2.1: The distance (miles) travelled by pupils to non-selective and selective schools by area type24
Percentage of pupils travelling this distance or less
Non-selective Selective
50% 75% 90% 50% 75% 90%
Urban - Conurbation 1.1 1.9 3.1 2.7 4.6 6.6
Urban - Town / City 1.1 2.1 4.3 3.1 6.8 11.0
Rural - Hamlet / Village / Town 2.7 4.8 7.3 4.7 7.9 12.5
Figure A2.2: The number of LSOAs ruled out by each of the principles for the location of a new grammar
school25
Number of LSOAs ruled out
by this criteria
Percentage of all pupils that
are resident in these LSOAs
LSOA has a selection score of 0.7+
1,563 5%
LSOA with a score of 0.7+ within reasonable travel distance
4,891 16%
LSOA has a selection score of 0.5+
3,159 10%
LSOA with a score of 0.5+ within reasonable travel distance
9,375 29%
Low numbers of high-performing pupils within reasonable travel distance
808 2%
High-performing non-selective school within short travel distance
9,380 29%
High-performing non-selective school within reasonable travel distance
23,401 71%
24 National Pupil Database, Key Stage 4 2015. 25 See Part 3 for full details of principles. A ‘short distance’ is defined as the distance travelled by up to 50 per cent of pupils to a non-selective school in that area type. A ‘reasonable travel distance’ is defined as the distance travelled by up to 90 per cent of pupils to a non-selective school in that area type. These are given in in Figure A2.1