Embed Size (px)
Citation preview
Pupils not
claiming free
school meals
Samaira Iniesta-Martinez & Helen
Evans
Department for Education

The views expressed in this report are the authors’ and do not necessarily reflect those of the Department for Education.
The aim of this paper is to present estimates of the numbers and proportions of pupils who are entitled to receive free school meals (FSM) but are not currently claiming.
Key findings
Benefits data from Her Majesty's Revenue and Customs (HMRC) suggests that around 1.4 million (21%) of children aged 4-15 in England are entitled to receive FSM.
School Census data shows that around 1.2 million (18%) of 4-15 year old pupils in maintained schools are registered to claim FSM.
Therefore around 200,000 pupils (3% of all pupils aged 4-15) appear to be entitled but are not claiming FSM.
This means 14% of pupils entitled to FSM are not claiming them.
In the South East and East of England nearly one quarter of entitled pupils are not claiming FSM, which contrasts sharply with the North East where the equivalent figure is 2%.
At local authority (LA) level under-registration rates range between 0% and 33%. LAs with the highest under-registration rates are Buckinghamshire and Richmond (both 33%), and Suffolk and Surrey (32%).
The proportion of pupils entitled to FSM decreases with age: 24 % of 5 year olds are entitled compared to 18% of 15 year olds.
Of those pupils entitled to FSM, the proportion not claiming FSM is the same for both primary school and secondary school aged pupils.
Analysis using survey data suggests that pupils with the following characteristics, which are not directly linked to the FSM criteria, have lower likelihoods of claiming FSM. This is after other characteristics have been taken into account: - pupils living in a less deprived area; - pupils attending schools with a lower school FSM rate; - pupils from families with higher status occupations (i.e. professional rather than routine
occupations); - pupils living in a family with higher parental qualifications; and - pupils of Chinese ethnic origin.
There is some evidence to suggest that families entitled to FSM while in some part-time work are less likely to claim FSM than those on out-of-work benefits.
Terminology - see section 1 for full details
Entitled to FSM – Pupils are entitled to receive FSM if they live in households claiming qualifying benefits
Registered and claiming FSM – This relates to those who meet the entitlement criteria and register at the school to claim FSM. This is what is reported by the School Census and described in DfE publications as “known to be eligible for and claiming FSM”
Taking FSM – This relates to how many of the pupils registered to claim FSM actually take the meal on any given day
1
Contents
Key findings .............................................................................................................1 Terminology - see section 1 for full details...............................................................1 1. Overview .............................................................................................................3
1.1 FSM criteria ................................................................................................................................. 3 2. Patterns of FSM claiming rates.............................................................................4
2.1 Latest FSM claiming rates at England level................................................................................. 5 2.2 Time series of FSM claiming rates............................................................................................... 5 2.3 FSM claiming rates by age........................................................................................................... 6 2.4 FSM claiming rates by cohort...................................................................................................... 7 2.5 What do we know about pupils coming on and off FSM?.......................................................... 8 2.6 Early years and post-16 pupils .................................................................................................... 8 2.7 FSM taken by those claiming .................................................................................................... 10
3. How many entitled pupils are not claiming FSM?...............................................10 3.1 Overall FSM registration rates at England level........................................................................ 11 3.2 Pupils entitled to FSM, and under-registration rates, by age................................................... 11 3.3 Under-registration rates at regional level................................................................................. 12 3.4 Under-registration rates at local authority level ...................................................................... 13
4. Factors associated with pupils not claiming FSM................................................17 4.1 Modelling the impact of pupil characteristics on the odds of claiming FSM ........................... 17 4.2 The impact of being on out-of-work rather than other benefits.............................................. 21
5. Note outlining the differences between the estimates in this paper and earlier
estimates...............................................................................................................23 6. References .........................................................................................................23 Annex ....................................................................................................................24
2
1. Overview
The main objective of this research report is to present estimates of the numbers and proportions of pupils who are entitled to receive free school meals (FSM) but are not claiming. This is new analysis carried out using Her Majesty's Revenue and Customs (HMRC) Tax Credits and Benefits data alongside information from the Department for Education’s School Census. In order to put these new figures in context, the report begins by drawing together relevant existing statistics from the School Census on patterns of pupils claiming FSM. This is followed by the new analysis looking at the proportion of entitled pupils who are claiming FSM (the registration rate), how this varies by age, and highlighting regions and local authorities (LAs) where under-registration rates are high. The paper ends with a look at some of the pupil characteristics of those not claiming FSM.
1.1 FSM criteria
In England, pupils in state-funded schools are entitled to receive FSM if their parents are in receipt of any of the following benefits:
Income Support
Income-based Job Seekers' Allowance
Income-related Employment and Support Allowance
Support under Part VI of the Immigration and Asylum Act 1999
the Guaranteed element of State Pension Credit
Child Tax Credit, provided they are not also entitled to Working Tax Credit and have an annual gross income of no more than £16,190, as assessed by HMRC 1
Children who receive a qualifying benefit in their own right are also entitled to receive FSM.
In order to claim FSM, families who meet the entitlement criteria outlined above have to register for FSM via schools or LAs. Some LAs have online forms which allow parents to apply quickly through their website. Other LAs will ask parents to complete a hand written form, or ask them to contact their child’s school directly. Pupils at Academies apply for free school meals via the Academy. This could be online or by completing an application form.
1 Where a parent is entitled to Working Tax Credit run on – the payment someone receives for a further four weeks after
they stop qualifying for Working Tax Credit - their children are entitled to free school meals.
3
FSM taken on any
Claiming FSM
Entitled to FSM
given day
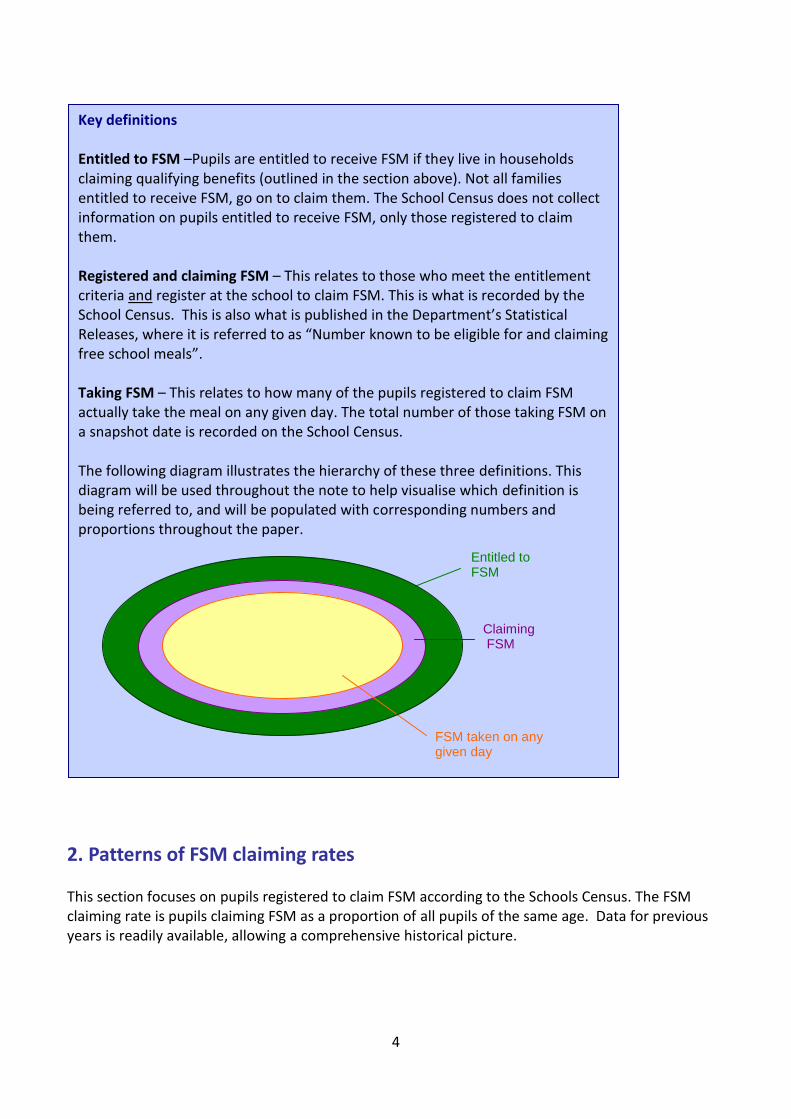
Key definitions
Entitled to FSM –Pupils are entitled to receive FSM if they live in households claiming qualifying benefits (outlined in the section above). Not all families entitled to receive FSM, go on to claim them. The School Census does not collect information on pupils entitled to receive FSM, only those registered to claim them.
Registered and claiming FSM – This relates to those who meet the entitlement criteria and register at the school to claim FSM. This is what is recorded by the School Census. This is also what is published in the Department’s Statistical Releases, where it is referred to as “Number known to be eligible for and claiming free school meals”.
Taking FSM – This relates to how many of the pupils registered to claim FSM actually take the meal on any given day. The total number of those taking FSM on a snapshot date is recorded on the School Census.
The following diagram illustrates the hierarchy of these three definitions. This diagram will be used throughout the note to help visualise which definition is being referred to, and will be populated with corresponding numbers and proportions throughout the paper.
2. Patterns of FSM claiming rates
This section focuses on pupils registered to claim FSM according to the Schools Census. The FSM claiming rate is pupils claiming FSM as a proportion of all pupils of the same age. Data for previous years is readily available, allowing a comprehensive historical picture.
4
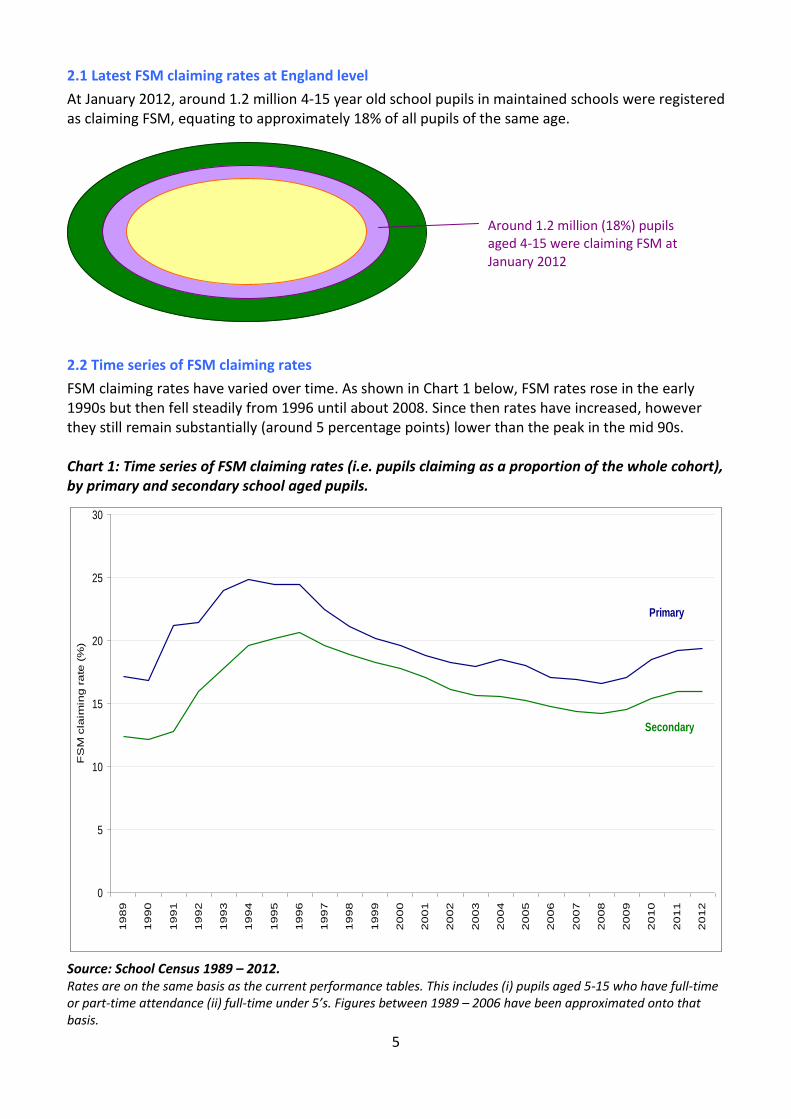
Around 1.2 million (18%) pupils aged 4-15 were claiming FSM at January 2012
2.1 Latest FSM claiming rates at England level
At January 2012, around 1.2 million 4-15 year old school pupils in maintained schools were registered as claiming FSM, equating to approximately 18% of all pupils of the same age.
0
5
10
15
20
25
30
19
89
19
90
19
91
19
92
19
93
19
94
19
95
19
96
19
97
19
98
19
99
20
00
20
01
20
02
20
03
20
04
20
05
20
06
20
07
20
08
20
09
20
10
20
11
20
12
FS
M c
laim
ing
ra
te (
%)
Secondary
Primary
2.2 Time series of FSM claiming rates
FSM claiming rates have varied over time. As shown in Chart 1 below, FSM rates rose in the early 1990s but then fell steadily from 1996 until about 2008. Since then rates have increased, however they still remain substantially (around 5 percentage points) lower than the peak in the mid 90s.
Chart 1: Time series of FSM claiming rates (i.e. pupils claiming as a proportion of the whole cohort), by primary and secondary school aged pupils.
Source: School Census 1989 – 2012. Rates are on the same basis as the current performance tables. This includes (i) pupils aged 5-15 who have full-time or part-time attendance (ii) full-time under 5’s. Figures between 1989 – 2006 have been approximated onto that basis.
5
0
5
10
15
20
25
5 6 7 8 9 10 11 12 13 14 15
Pupil age
FS
M c
laim
ing
ra
te (
%)
The changing FSM claiming rate is partly linked to the economy. As outlined in section 1, FSM entitlement is based on families being in receipt of certain benefits, some of which are out-of- work benefits. For those families qualifying for FSM through being in receipt of benefits linked to being currently unemployed but seeking employment, the economic climate is an important factor in their chances of finding work. So as would be expected, FSM rates began rising during the early 90s recession, and had been falling through to 2008 but have risen over the last few years in line with the economic climate.
However, there are other pupils who qualify through their families being in receipt of other benefits such as Income Support (e.g. paid to lone parents who have a child aged under 5), Pension Credit or sickness/disability benefits. These families are less likely to be seeking employment and therefore are less affected by the economic climate.
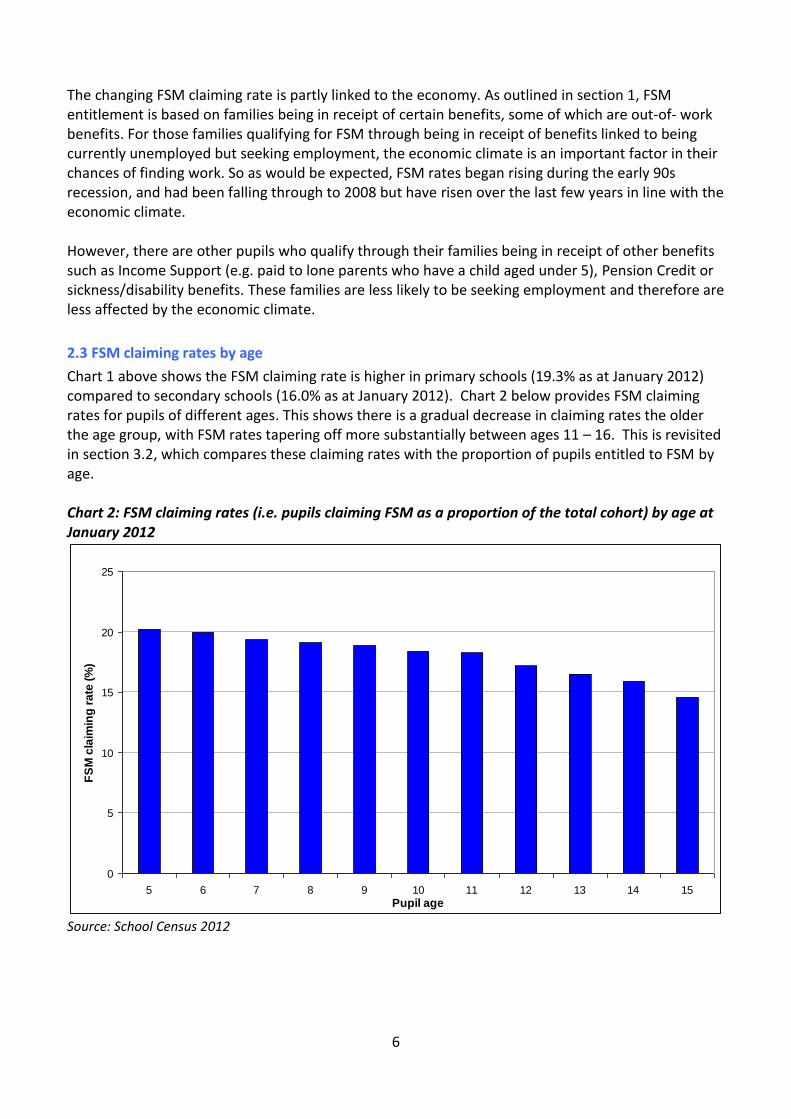
2.3 FSM claiming rates by age
Chart 1 above shows the FSM claiming rate is higher in primary schools (19.3% as at January 2012) compared to secondary schools (16.0% as at January 2012). Chart 2 below provides FSM claiming rates for pupils of different ages. This shows there is a gradual decrease in claiming rates the older the age group, with FSM rates tapering off more substantially between ages 11 – 16. This is revisited in section 3.2, which compares these claiming rates with the proportion of pupils entitled to FSM by age.
Chart 2: FSM claiming rates (i.e. pupils claiming FSM as a proportion of the total cohort) by age at January 2012
Source: School Census 2012
6
0
5
10
15
20
25
5 6 7 8 9 10 11 12 13 14 15
Pupil age
FS
M c
laim
ing
ra
te (
%)
Age 5 in 2008
Age 5 in 2002
Age 15
in 2008
Age 15 in
2012
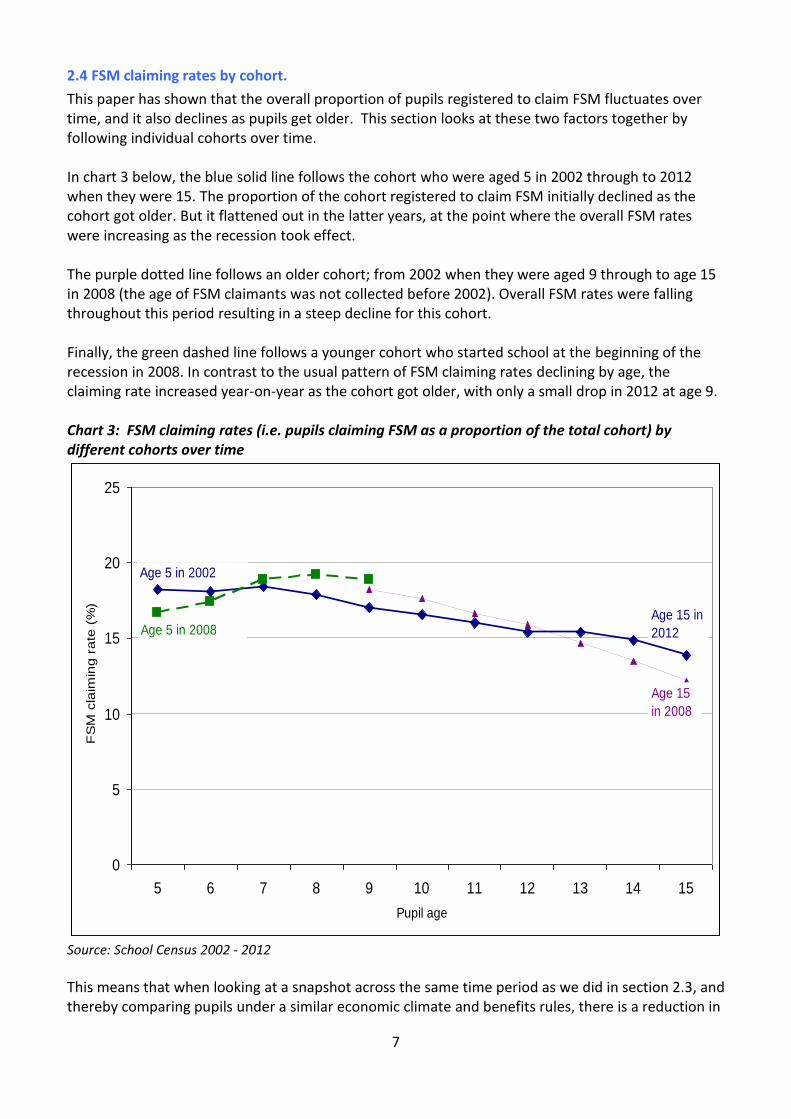
2.4 FSM claiming rates by cohort.
This paper has shown that the overall proportion of pupils registered to claim FSM fluctuates over time, and it also declines as pupils get older. This section looks at these two factors together by following individual cohorts over time.
In chart 3 below, the blue solid line follows the cohort who were aged 5 in 2002 through to 2012 when they were 15. The proportion of the cohort registered to claim FSM initially declined as the cohort got older. But it flattened out in the latter years, at the point where the overall FSM rates were increasing as the recession took effect.
The purple dotted line follows an older cohort; from 2002 when they were aged 9 through to age 15 in 2008 (the age of FSM claimants was not collected before 2002). Overall FSM rates were falling throughout this period resulting in a steep decline for this cohort.
Finally, the green dashed line follows a younger cohort who started school at the beginning of the recession in 2008. In contrast to the usual pattern of FSM claiming rates declining by age, the claiming rate increased year-on-year as the cohort got older, with only a small drop in 2012 at age 9.
Chart 3: FSM claiming rates (i.e. pupils claiming FSM as a proportion of the total cohort) by different cohorts over time
Source: School Census 2002 - 2012
This means that when looking at a snapshot across the same time period as we did in section 2.3, and thereby comparing pupils under a similar economic climate and benefits rules, there is a reduction in
7
FSM claiming rates by age. However, this section shows that we cannot assume that the FSM rate will drop for each cohort as they get older, as the actual FSM rate for each age is affected by the specific time period.
2.5 What do we know about pupils coming on and off FSM?
The cohort analysis in the section above shows how the proportion of pupils who are claiming FSM changes over time. As the analysis is based on snapshot data at January of each year it does not provide any indication of how frequently pupils come on or off FSM. It is possible to follow the registration status of the exact same pupils by linking termly school census records. Estimates derived by doing this linking show that on average from one term to the next, 8% of pupils registered to claim FSM come off FSM, a further 6% come off by the next term, followed by a further 5% the term after. This gives a yearly churn rate of around 20%, meaning 1 in 5 pupils who were claiming FSM at the beginning of the year were no longer claiming FSM by the end of the year. These pupils are replaced by a similar number of new pupils claiming FSM.
2.6 Early years and post-16 pupils
The figures presented so far have focussed on pupils aged 4-15 (i.e. those in reception to year 11). For pupils outside the 4-15 age range, the number of pupils claiming FSM is collected via the School Census, however it is not possible to estimate the numbers entitled to receive FSM. This is because entitlement depends not only on household benefits status but also on whether individuals are in full-time schooling and the type of institution they attend, explained further below. It is therefore not possible to estimate the under-registration rate (i.e. the number of pupils not claiming FSM as a proportion of those entitled) for pupils outside the 4-15 age range.
Early years Nursery aged children can receive FSM if they attend a maintained nursery school or nursery class and they attend before and after lunch sessions. Around 19,600 under fours were recorded as claiming FSM at January 2012, this equates to 6% of the under-four school population.
Post-16 pupils FSM is available to pupils who attend sixth forms attached to a maintained school, as long as the course of study began before the pupil reached age 18. Pupils who study in sixth form colleges, Further Education colleges or other providers are not entitled to FSM.
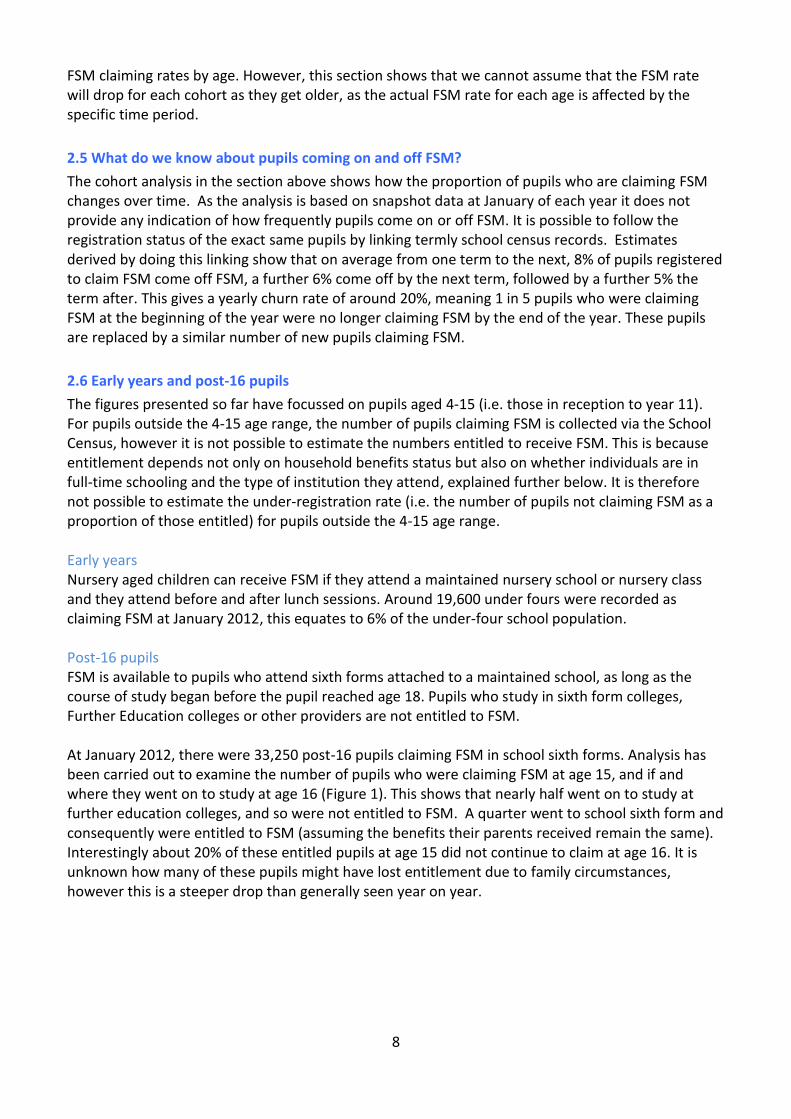
At January 2012, there were 33,250 post-16 pupils claiming FSM in school sixth forms. Analysis has been carried out to examine the number of pupils who were claiming FSM at age 15, and if and where they went on to study at age 16 (Figure 1). This shows that nearly half went on to study at further education colleges, and so were not entitled to FSM. A quarter went to school sixth form and consequently were entitled to FSM (assuming the benefits their parents received remain the same). Interestingly about 20% of these entitled pupils at age 15 did not continue to claim at age 16. It is unknown how many of these pupils might have lost entitlement due to family circumstances, however this is a steeper drop than generally seen year on year.
8
9
Figure 1: Education at age 16 for pupils who were claiming FSM at age 151,2
Key
= Pupils claiming FSM at age 15 in 2009/10, using matched spring 2010 census
= Education at age 16 in 2010/11 based on DfE matched administrative data
77,800 pupils were claiming FSM at age 15 in 2009/10
34,900 went onto Further
Education colleges
7,800 went onto sixth form
colleges
19,300 stayed in School Sixth
Forms
10,000 went onto Other
Education and Training4
Approximately 80% of these continue to claim FSM
3 at age 16
5,800 were recorded as not in
education or training5
45%
25%
13%
10%
7%
Notes to accompany the post-16 figures 1 These data are not the source of the official 16-18 participation estimates, but have been used in this instance because the DfE Matched Administrative Data has information on Free School Meal (FSM) status and allows tracking across academic years. The matched administrative data links several sources that cover learner attainment and participation, and tracks pupils aged 16 in 2011 back to their secondary school to determine their FSM status. This is only available for pupils in state schools.
2 There are some pupils for whom FSM status at age 15 could not be established. In many instances this will be because they were in an independent school at age 15 and no FSM status is available for these pupils. The rest will include, amongst others, those who had been in Pupil Referral Units at 15 (whose FSM status has only recently been collected and is not in the data used for this analysis), incoming migrants, or home-educated pupils. It might also reflect a matching issue - young people in school sixth forms generally stayed within the same institution so their administrative data is more likely to be successfully matched.
3Estimated by looking the number of 16 years olds in maintained mainstream schools who had claimed FSM at age 15, compared to how many claimed at age 16, using the school census. It is not known if the 20% drop off is because these pupils have decided not to continue claiming FSM, or because their parents’ circumstances have changed so that they are no longer entitled to FSM. In addition there will be some pupils entering and leaving sixth forms, as the two censuses provide snapshot information, rather than tracking individual pupils.
4 Mainly consists of Apprenticeships, Independent Training Providers and Special Schools.
5 Assumed not to be in education or training as they could not be found in the matched administrative data.
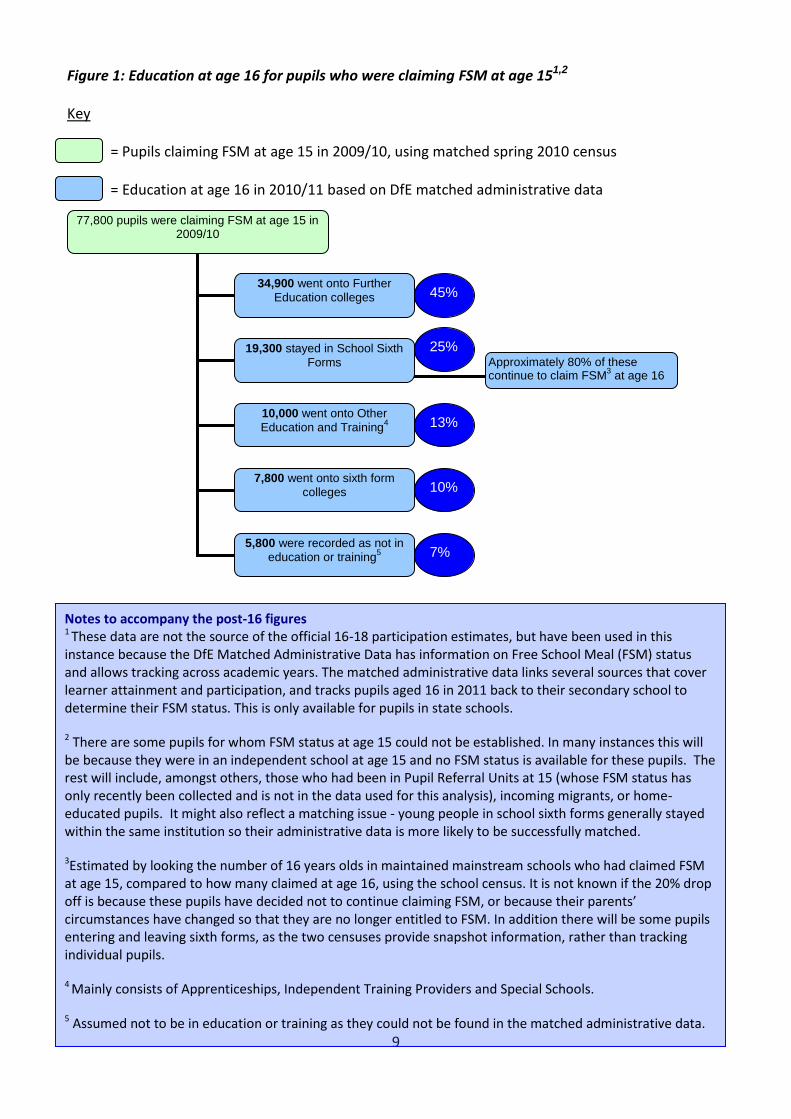
Around 1.3 million (17%) of all aged pupils were claiming FSM at January 2012
Approximately 1.1 million (14%) of all aged pupils take FSM on any given day
2.7 FSM taken by those claiming
Not everyone who claims FSM takes the meal on any given day. This could be because of pupils being absent from the school on the census date, as well as other reasons.
At January 2012, of those who were registered to claim FSM, 83% took up the meal on any given day. This rose from 82% in 2009 to 83% in 2010 and then stayed static in 2011 and 2012.
The meal taken rate is higher for primary aged pupils with 85% of claiming pupils taking the meal, compared to 80% of secondary aged pupils at January 2012.
3. How many entitled pupils are not claiming FSM?
Up to this point the figures presented are from the School Census detailing how many pupils are claiming FSM and taking up the free meal. What this does not show is how many pupils meet the FSM entitlement criteria. This is important if we want to know how many more children could be claiming FSM. This is addressed in this section.
We have used HMRC tax credit and benefit data to estimate the number of pupils who are entitled to receive FSM. Combining this with the number of pupils actually claiming FSM from the School Census allows us to estimate the FSM registration rate.
Number of pupils registered to claim FSM (using School Census) FSM registration rate =
Number of pupils entitled to FSM (using HMRC benefits data)
10
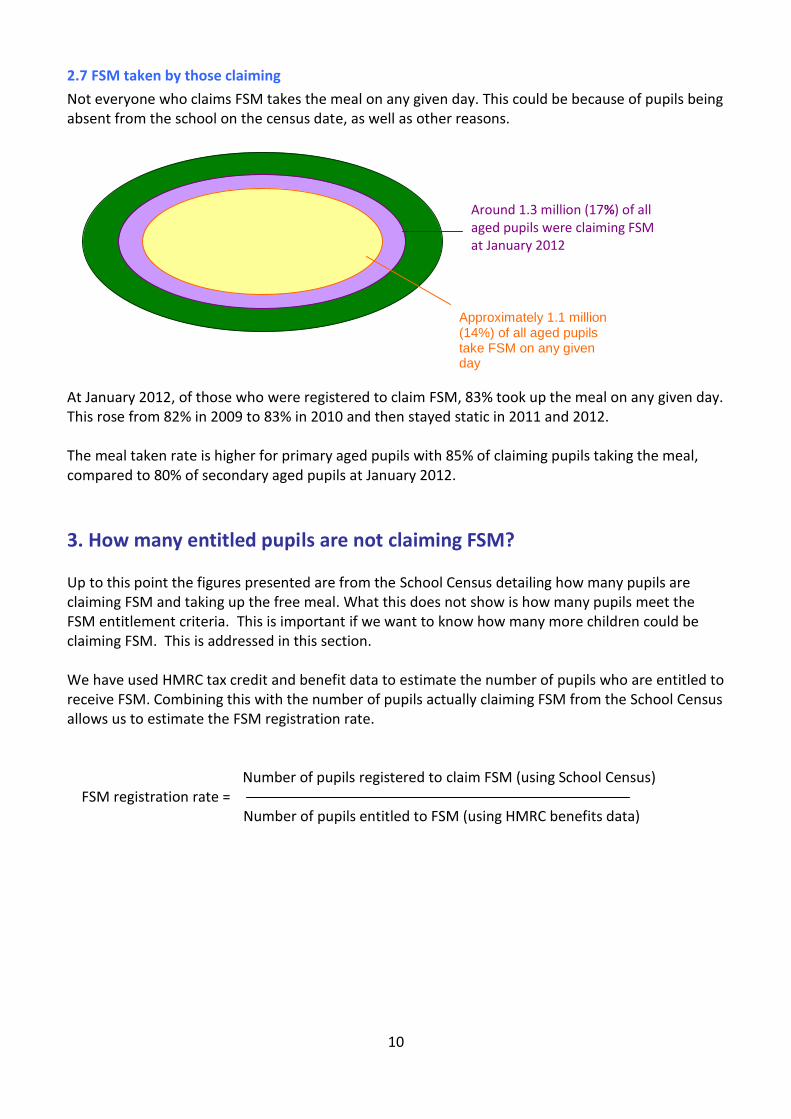
Around 1.2 million (18%) of pupils aged 4-15 were claiming FSM at January 2012
Around 1.4 million (21%) of 4-15 year olds were entitled to receive FSM at December 2011
Around 1.1 million (14%) of all aged pupils take the meal on any given day
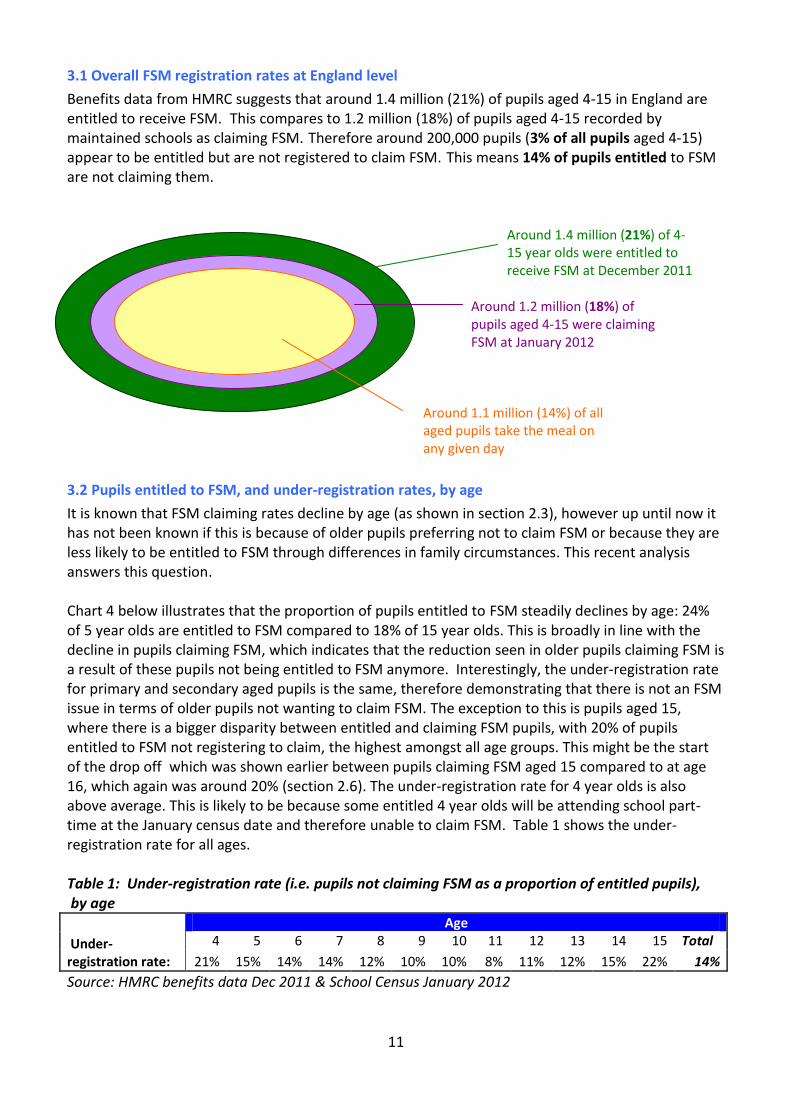
Age
Under-registration rate:
4 5 6 7 8 9 10 11 12 13 14 15 Total
21% 15% 14% 14% 12% 10% 10% 8% 11% 12% 15% 22% 14%
3.1 Overall FSM registration rates at England level
Benefits data from HMRC suggests that around 1.4 million (21%) of pupils aged 4-15 in England are entitled to receive FSM. This compares to 1.2 million (18%) of pupils aged 4-15 recorded by maintained schools as claiming FSM. Therefore around 200,000 pupils (3% of all pupils aged 4-15) appear to be entitled but are not registered to claim FSM. This means 14% of pupils entitled to FSM are not claiming them.
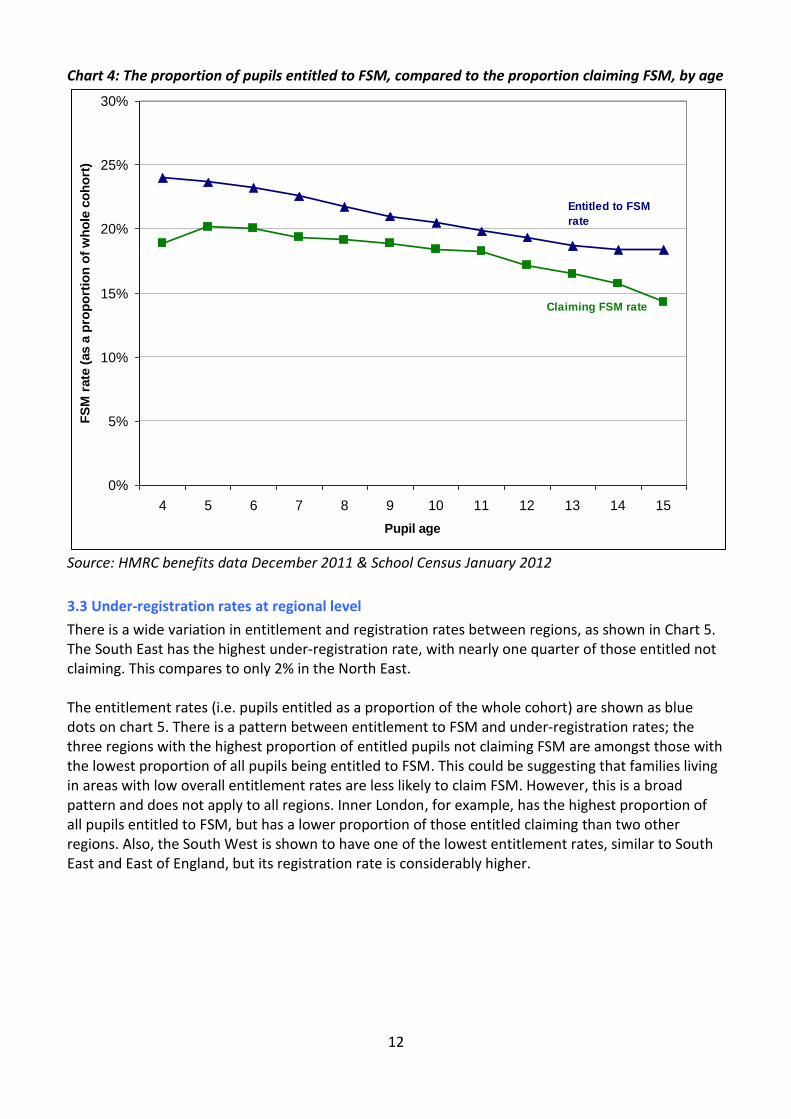
3.2 Pupils entitled to FSM, and under-registration rates, by age
It is known that FSM claiming rates decline by age (as shown in section 2.3), however up until now it has not been known if this is because of older pupils preferring not to claim FSM or because they are less likely to be entitled to FSM through differences in family circumstances. This recent analysis answers this question.
Chart 4 below illustrates that the proportion of pupils entitled to FSM steadily declines by age: 24% of 5 year olds are entitled to FSM compared to 18% of 15 year olds. This is broadly in line with the decline in pupils claiming FSM, which indicates that the reduction seen in older pupils claiming FSM is a result of these pupils not being entitled to FSM anymore. Interestingly, the under-registration rate for primary and secondary aged pupils is the same, therefore demonstrating that there is not an FSM issue in terms of older pupils not wanting to claim FSM. The exception to this is pupils aged 15, where there is a bigger disparity between entitled and claiming FSM pupils, with 20% of pupils entitled to FSM not registering to claim, the highest amongst all age groups. This might be the start of the drop off which was shown earlier between pupils claiming FSM aged 15 compared to at age 16, which again was around 20% (section 2.6). The under-registration rate for 4 year olds is also above average. This is likely to be because some entitled 4 year olds will be attending school part-time at the January census date and therefore unable to claim FSM. Table 1 shows the under-registration rate for all ages.
Table 1: Under-registration rate (i.e. pupils not claiming FSM as a proportion of entitled pupils), by age
Source: HMRC benefits data Dec 2011 & School Census January 2012
11
0%
5%
10%
15%
20%
25%
30%
4 5 6 7 8 9 10 11 12 13 14 15
Pupil age
FS
M r
ate
(as a
pro
po
rtio
n o
f w
ho
le c
oh
ort
)
Claiming FSM rate
Entitled to FSM
rate
Chart 4: The proportion of pupils entitled to FSM, compared to the proportion claiming FSM, by age
Source: HMRC benefits data December 2011 & School Census January 2012
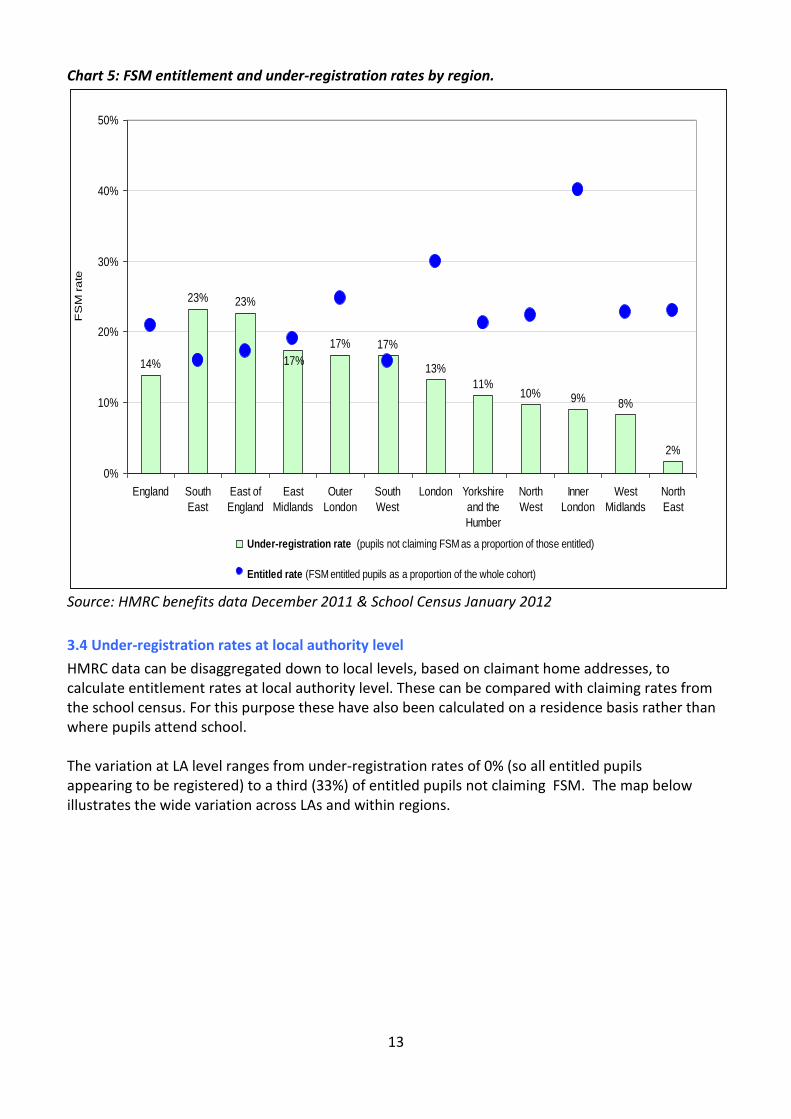
3.3 Under-registration rates at regional level
There is a wide variation in entitlement and registration rates between regions, as shown in Chart 5. The South East has the highest under-registration rate, with nearly one quarter of those entitled not claiming. This compares to only 2% in the North East.
The entitlement rates (i.e. pupils entitled as a proportion of the whole cohort) are shown as blue dots on chart 5. There is a pattern between entitlement to FSM and under-registration rates; the three regions with the highest proportion of entitled pupils not claiming FSM are amongst those with the lowest proportion of all pupils being entitled to FSM. This could be suggesting that families living in areas with low overall entitlement rates are less likely to claim FSM. However, this is a broad pattern and does not apply to all regions. Inner London, for example, has the highest proportion of all pupils entitled to FSM, but has a lower proportion of those entitled claiming than two other regions. Also, the South West is shown to have one of the lowest entitlement rates, similar to South East and East of England, but its registration rate is considerably higher.
12
14%
23% 23%
17% 17%
13%
11%10% 9% 8%
2%
17%
0%
10%
20%
30%
40%
50%
England South
East
East of
England
East
Midlands
Outer
London
South
West
London Yorkshire
and the
Humber
North
West
Inner
London
West
Midlands
North
East
FS
M r
ate
Under-registration rate (pupils not claiming FSM as a proportion of those entitled)
Entitled rate (FSM entitled pupils as a proportion of the whole cohort)
Under-registration rate (pupils not claiming FSM as a proportion of those entitled)
Entitled rate (FSM entitled pupils as a proportion of the whole cohort)
Chart 5: FSM entitlement and under-registration rates by region.
Source: HMRC benefits data December 2011 & School Census January 2012
3.4 Under-registration rates at local authority level
HMRC data can be disaggregated down to local levels, based on claimant home addresses, to calculate entitlement rates at local authority level. These can be compared with claiming rates from the school census. For this purpose these have also been calculated on a residence basis rather than where pupils attend school.
The variation at LA level ranges from under-registration rates of 0% (so all entitled pupils appearing to be registered) to a third (33%) of entitled pupils not claiming FSM. The map below illustrates the wide variation across LAs and within regions.
13
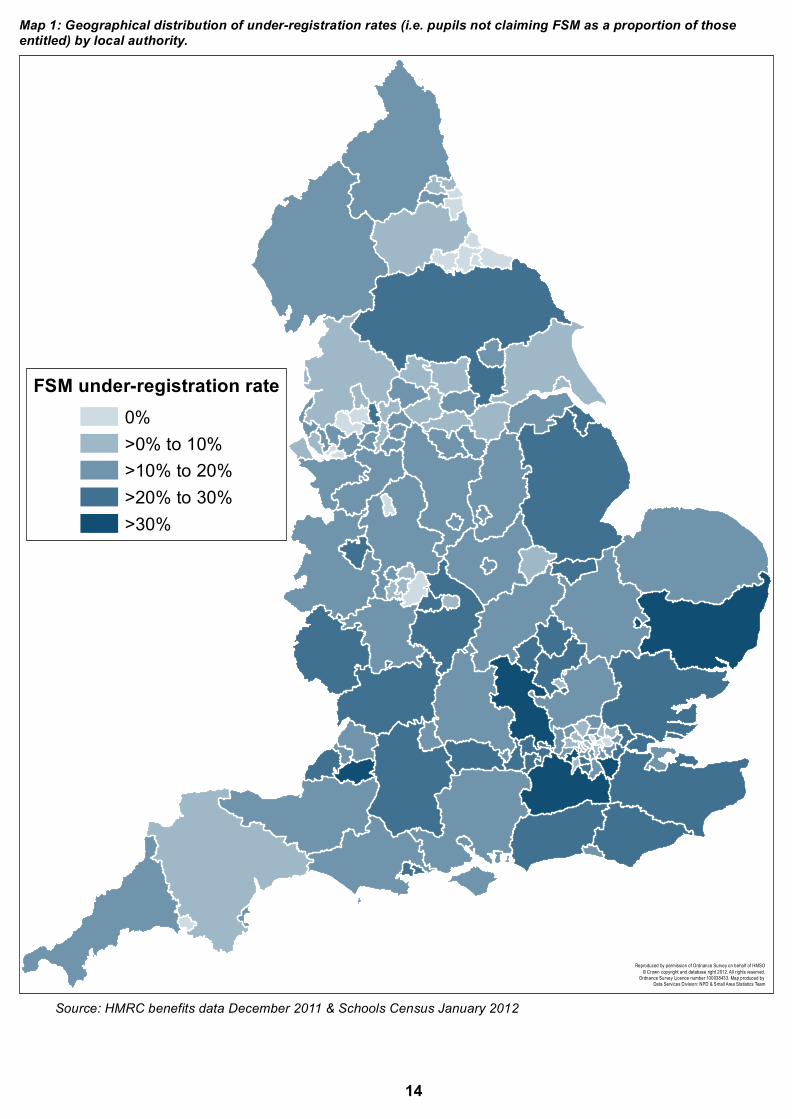
Map 1: Geographical distribution of under-registration rates (i.e. pupils not claiming FSM as a proportion of those entitled) by local authority.
FSM under-registration rate 0%>0% to 10% >10% to 20% >20% to 30% >30%
Reproduced by permission of Ordnance Survey on behalf of HMSO © Crown copyright and database right 2012. All rights reserved.
Ordnance Survey Licence number 100038433. Map produced by Data Services Division: NPD & Small Area Statistics Team
Source: HMRC benefits data December 2011 & Schools Census January 2012
14
-
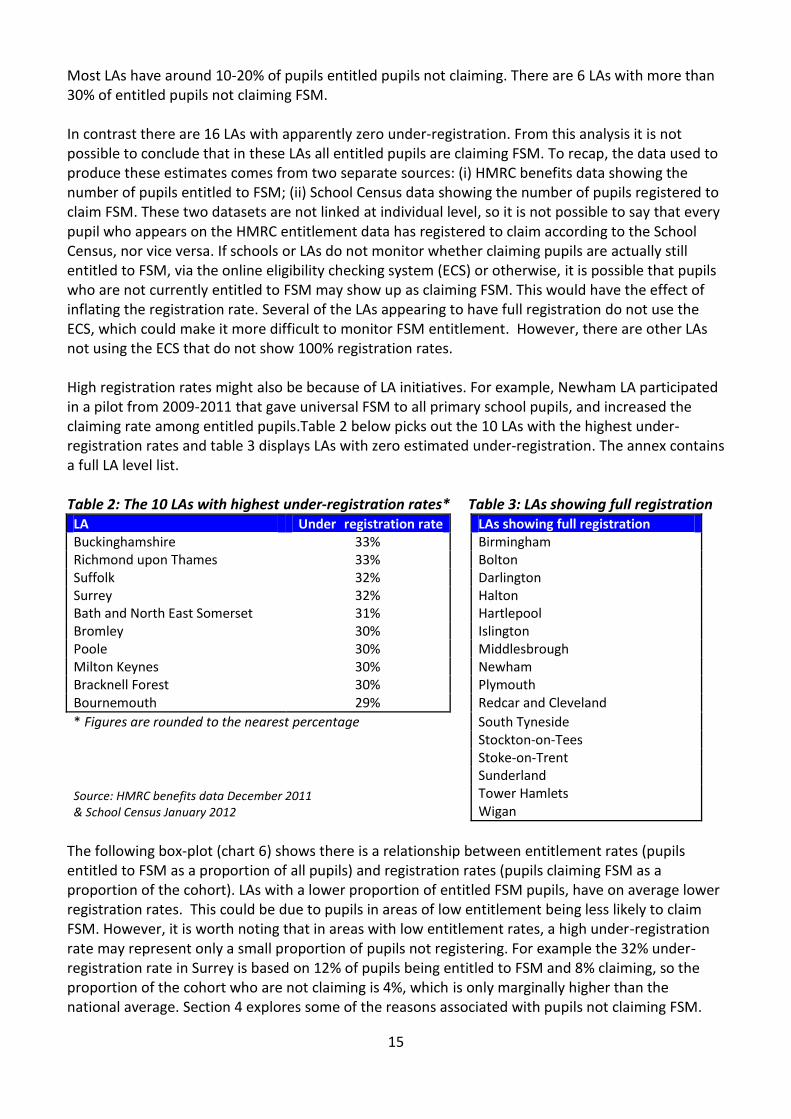
Most LAs have around 10-20% of pupils entitled pupils not claiming. There are 6 LAs with more than 30% of entitled pupils not claiming FSM.
In contrast there are 16 LAs with apparently zero under-registration. From this analysis it is not possible to conclude that in these LAs all entitled pupils are claiming FSM. To recap, the data used to produce these estimates comes from two separate sources: (i) HMRC benefits data showing the number of pupils entitled to FSM; (ii) School Census data showing the number of pupils registered to claim FSM. These two datasets are not linked at individual level, so it is not possible to say that every pupil who appears on the HMRC entitlement data has registered to claim according to the School Census, nor vice versa. If schools or LAs do not monitor whether claiming pupils are actually still entitled to FSM, via the online eligibility checking system (ECS) or otherwise, it is possible that pupils who are not currently entitled to FSM may show up as claiming FSM. This would have the effect of inflating the registration rate. Several of the LAs appearing to have full registration do not use the ECS, which could make it more difficult to monitor FSM entitlement. However, there are other LAs not using the ECS that do not show 100% registration rates.
High registration rates might also be because of LA initiatives. For example, Newham LA participated in a pilot from 2009-2011 that gave universal FSM to all primary school pupils, and increased the claiming rate among entitled pupils.Table 2 below picks out the 10 LAs with the highest under-registration rates and table 3 displays LAs with zero estimated under-registration. The annex contains a full LA level list.
Table 2: The 10 LAs with highest under-registration rates* Table 3: LAs showing full registration LA Under registration rate LAs showing full registration Buckinghamshire 33% Birmingham Richmond upon Thames 33% Bolton Suffolk 32% Darlington Surrey 32% Halton Bath and North East Somerset 31% Bromley 30% Poole 30%
Hartlepool Islington Middlesbrough Newham Plymouth Redcar and Cleveland
South Tyneside Stockton-on-Tees Stoke-on-Trent Sunderland Tower Hamlets Wigan
Milton Keynes 30% Bracknell Forest 30% Bournemouth 29%
* Figures are rounded to the nearest percentage
Source: HMRC benefits data December 2011 & School Census January 2012
The following box-plot (chart 6) shows there is a relationship between entitlement rates (pupils entitled to FSM as a proportion of all pupils) and registration rates (pupils claiming FSM as a proportion of the cohort). LAs with a lower proportion of entitled FSM pupils, have on average lower registration rates. This could be due to pupils in areas of low entitlement being less likely to claim FSM. However, it is worth noting that in areas with low entitlement rates, a high under-registration rate may represent only a small proportion of pupils not registering. For example the 32% under-registration rate in Surrey is based on 12% of pupils being entitled to FSM and 8% claiming, so the proportion of the cohort who are not claiming is 4%, which is only marginally higher than the national average. Section 4 explores some of the reasons associated with pupils not claiming FSM.
15
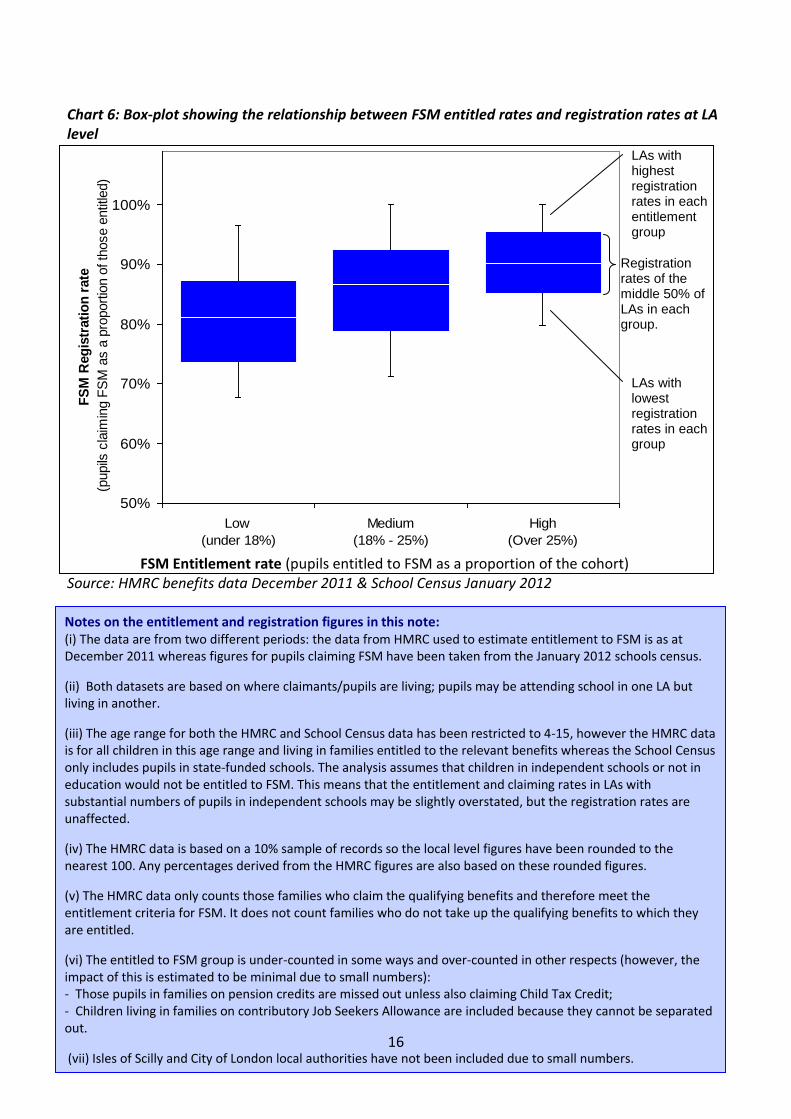
Chart 6: Box-plot showing the relationship between FSM entitled rates and registration rates at LA level
50%
60%
70%
80%
90%
100%
Low
(under 18%)
Medium
(18% - 25%)
High
(Over 25%)
FSM Entitlement rate
(pupils entitled to FSM as a proportion of cohort)
FS
M R
eg
istr
ati
on
rate
(pupils
cla
imin
g F
SM
as a
pro
port
ion o
f th
ose e
ntit
led)
LAs with highest registration rates in each entitlement group
Registration rates of the middle 50% of LAs in each group.
LAs with lowest registration rates in each group
FSM Entitlement rate (pupils entitled to FSM as a proportion of the cohort) Source: HMRC benefits data December 2011 & School Census January 2012
Notes on the entitlement and registration figures in this note: (i) The data are from two different periods: the data from HMRC used to estimate entitlement to FSM is as at December 2011 whereas figures for pupils claiming FSM have been taken from the January 2012 schools census.
(ii) Both datasets are based on where claimants/pupils are living; pupils may be attending school in one LA but living in another.
(iii) The age range for both the HMRC and School Census data has been restricted to 4-15, however the HMRC data is for all children in this age range and living in families entitled to the relevant benefits whereas the School Census only includes pupils in state-funded schools. The analysis assumes that children in independent schools or not in education would not be entitled to FSM. This means that the entitlement and claiming rates in LAs with substantial numbers of pupils in independent schools may be slightly overstated, but the registration rates are unaffected.
(iv) The HMRC data is based on a 10% sample of records so the local level figures have been rounded to the nearest 100. Any percentages derived from the HMRC figures are also based on these rounded figures.
(v) The HMRC data only counts those families who claim the qualifying benefits and therefore meet the entitlement criteria for FSM. It does not count families who do not take up the qualifying benefits to which they are entitled.
(vi) The entitled to FSM group is under-counted in some ways and over-counted in other respects (however, the impact of this is estimated to be minimal due to small numbers): - Those pupils in families on pension credits are missed out unless also claiming Child Tax Credit; - Children living in families on contributory Job Seekers Allowance are included because they cannot be separated out.
16 (vii) Isles of Scilly and City of London local authorities have not been included due to small numbers.
4. Factors associated with pupils not claiming FSM
4.1 Modelling the impact of pupil characteristics on the odds of claiming FSM
As the HMRC entitlement data can only be matched to School Census information at area level, it is not possible to identify which specific pupils are entitled to FSM but not registered to claim. However in-depth survey datasets can be used to provide an understanding of the characteristics of pupils who are more or less likely to claim. This section reports an analysis of the Longitudinal Study of Young People (LSYPE), which interviewed a cohort of secondary school pupils and their parents in 2004 when they were in Year 9. It is worth highlighting that the patterns shown here may not apply at other ages such as primary school aged pupils.
This analysis is also based on 2004 data and therefore is prior to the introduction of the Pupil Premium, which provides schools with additional funding for any children claiming FSM now or within the past 6 years, which might affect the composition of pupils who claim FSM.
Outline of the analysis Using the Longitudinal Survey of Young People in England (LSYPE), analysis was carried out to assess the relative importance of different characteristics in predicting whether a pupil claims FSM.
The analysis modelled the characteristics most associated with claiming FSM using logistic regression. This is a statistical method which can look at the separate impact of each characteristic, after holding other characteristics constant and equal. Income and employment status are clearly related to claiming FSM, as entitlement is based on being in receipt of income-related or out of work benefits. However, this model allows the assessment of whether there are characteristics which are not directly related to the entitlement criteria that make a pupil more or less likely claiming FSM when compared to a pupil who is identical in all of the other characteristics.
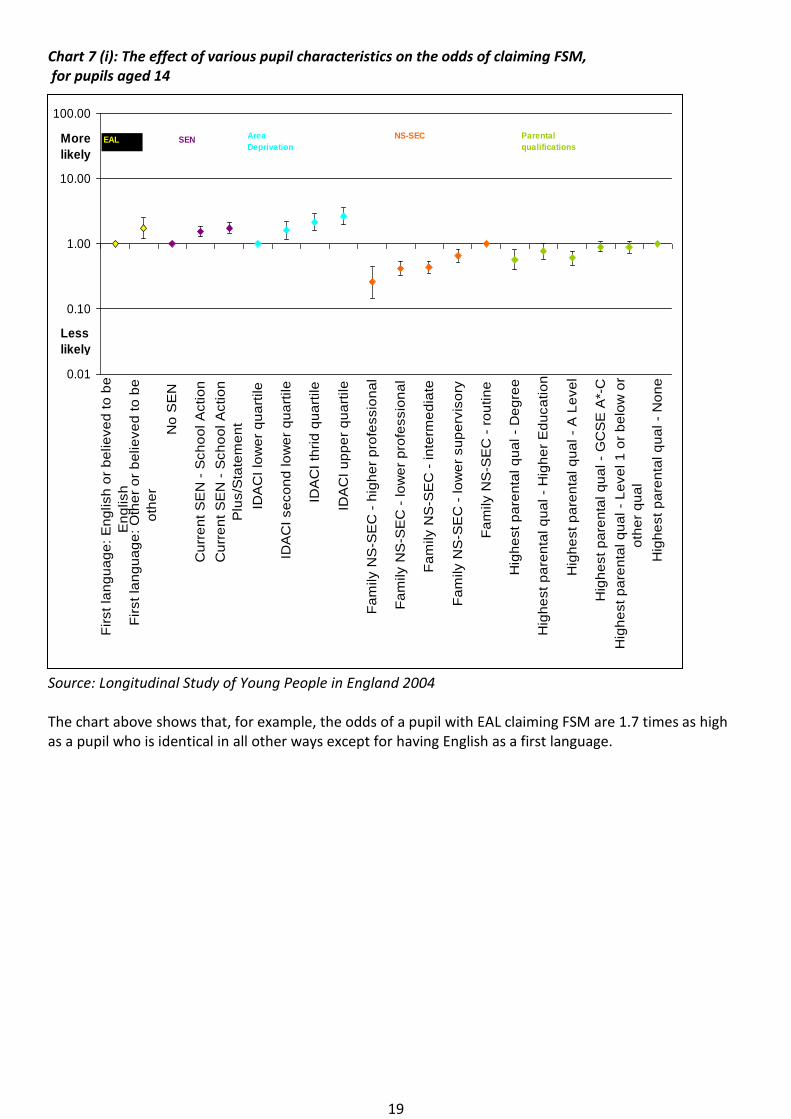
The three following charts show the effect of each characteristic on the odds of claiming FSM, once all of the other factors in the model have been taken into account. The odds ratio is a measure of effect size, describing the strength of association between the characteristics and, in this case, the chance of claiming FSM. The effects shown are all relative to a pupil with the following characteristics (these are shown on the charts with the effect on the odds equal to one):
- English as a first language (non-EAL); - No identified special education need (SEN); - The least deprived quartile using the Income Deprivation Affecting Children Index (IDACI); - Family occupation status is routine, based on the National Statistics Socio-Economic Classification
(NS-SEC); - Neither parent has any qualifications; - Lives with a married couple; - At least one parent in the household works; - Household income is above £36,000; - An only child; - Attends school with FSM rate of 1-5%; - White British;
17
Results from the model The strongest positive relationships are seen with parental employment, which is not surprising given the link between the rules for FSM entitlement and out-of-work benefits. A pupil who lives with a lone parent, who does not work, has 10 times the odds of claiming FSM compared to a pupil who is identical except for the fact that at least one parent works in their household. However, a pupil who lives with two parents but neither works has 25 times the odds claiming FSM as a pupil with at least one employed parent in their household.
Household income also has a strong relationship with claiming FSM: the odds of claiming FSM fall with rising income, although the lowest income band shows an anomalous pattern. Again the overall finding that income is a strong indicator of claiming FSM is not unexpected given the FSM entitlement criteria.
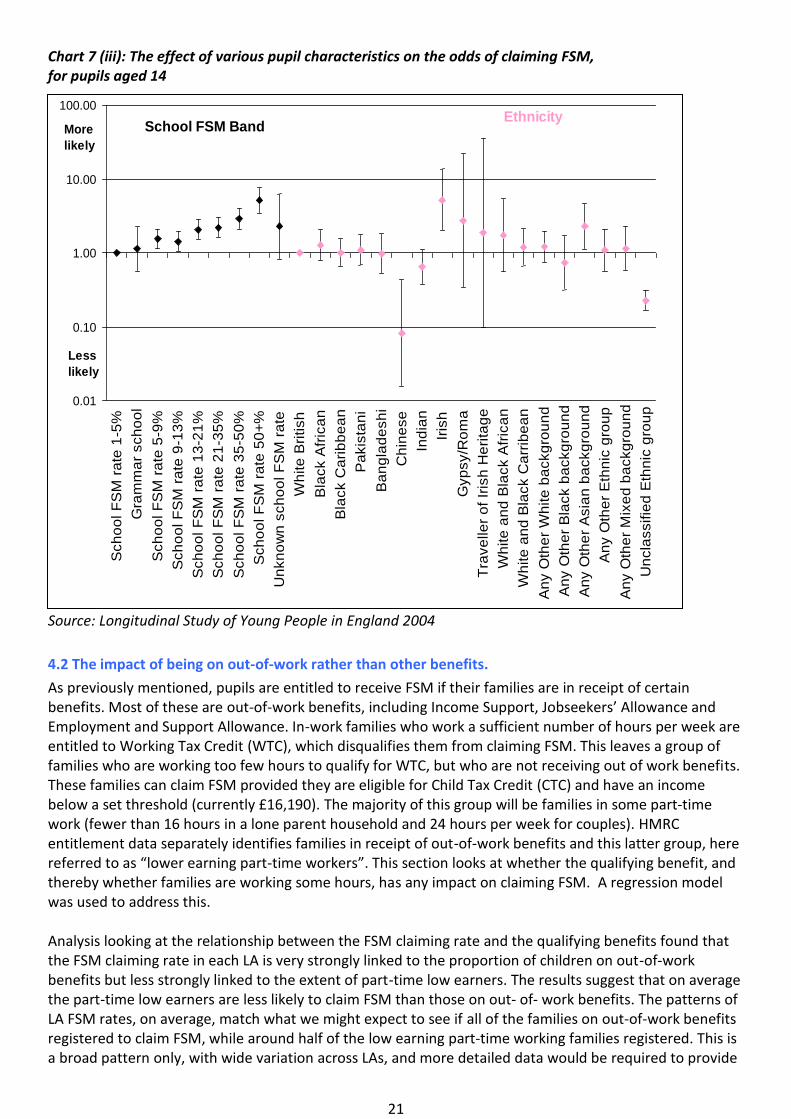
Of more interest are the following factors, which are not directly related to the FSM criteria, but which are linked to lower likelihoods of claiming FSM:
- the least deprived IDACI quartile (i.e. the least deprived 25% of local areas); - lower school FSM rate; - being from families with higher NS-SECs (i.e. professional rather than routine occupations); - living in a family with higher parental qualifications; and - Chinese pupils.
Conversely: - Pupils with EAL and/or SEN are more likely to claim FSM than other pupils; - Pupils in larger families with younger siblings are also more likely to claim FSM.
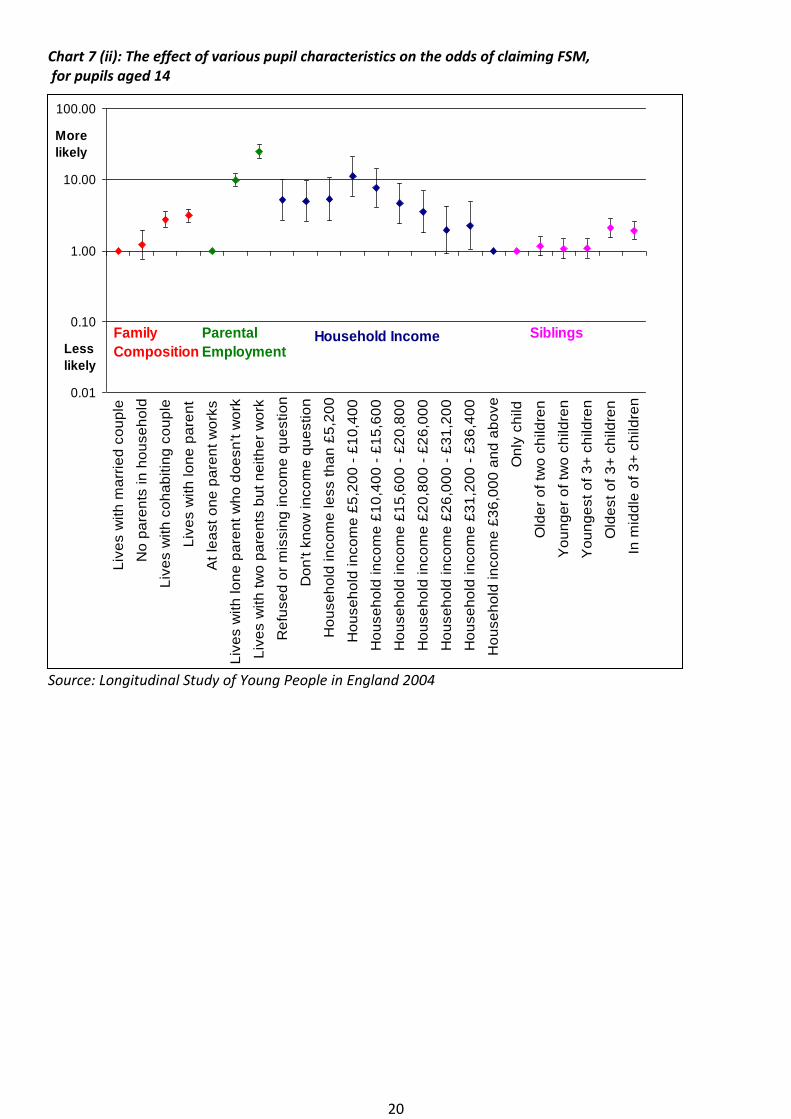
Chart 7 shows the effect of various pupil characteristics on the odds of claiming FSM, for pupils aged 14. When interpreting the chart, an odds effect of greater than one implies an increased likelihood of a pupil with that particular characteristic claiming FSM, all other characteristics being equal. A value of less than one implies a reduced likelihood of the pupil claiming FSM.
In addition, small sample numbers mean that some of estimated effects of characteristics have quite high degrees of uncertainty, represented by error bars in chart 7: this is particularly the case for the minority ethnicities. In some of these cases the effects of the characteristics are not statistically significant, shown where the error bar crosses 1, even though the odds effects produced in the model may be quite large. See the results for pupils of Gypsy/Roma background (chart 7iii) for an example of this.
18
0.01
0.10
1.00
10.00
100.00F
irst
lan
gu
ag
e:
En
glish
or
be
lie
ve
d t
o b
e
En
glish
Fir
st
lan
gu
ag
e:
Oth
er
or
be
lie
ve
d t
o b
e
oth
er
No
SE
N
Cu
rre
nt
SE
N -
Sch
oo
l A
ctio
n
Cu
rre
nt
SE
N -
Sch
oo
l A
ctio
n
Plu
s/S
tate
me
nt
IDA
CI
low
er
qu
art
ile
IDA
CI
se
co
nd
lo
we
r q
ua
rtile
IDA
CI
thri
d q
ua
rtile
IDA
CI
up
pe
r q
ua
rtile
Fa
mily N
S-S
EC
- h
igh
er
pro
fessio
na
l
Fa
mily N
S-S
EC
- lo
we
r p
rofe
ssio
na
l
Fa
mily N
S-S
EC
- in
term
ed
iate
Fa
mily N
S-S
EC
- lo
we
r su
pe
rvis
ory
Fa
mily N
S-S
EC
- r
ou
tin
e
Hig
he
st
pa
ren
tal q
ua
l -
De
gre
e
Hig
he
st
pa
ren
tal q
ua
l -
Hig
he
r E
du
ca
tio
n
Hig
he
st
pa
ren
tal q
ua
l -
A L
eve
l
Hig
he
st
pa
ren
tal q
ua
l -
GC
SE
A*-
C
Hig
he
st
pa
ren
tal q
ua
l -
Le
ve
l 1
or
be
low
or
oth
er
qu
al
Hig
he
st
pa
ren
tal q
ua
l -
No
ne
EAL SEN Area
Deprivation
NS-SEC Parental
qualificationsMore
likely
Less
likely
Chart 7 (i): The effect of various pupil characteristics on the odds of claiming FSM, for pupils aged 14
Source: Longitudinal Study of Young People in England 2004
The chart above shows that, for example, the odds of a pupil with EAL claiming FSM are 1.7 times as high as a pupil who is identical in all other ways except for having English as a first language.
19
0.01
0.10
1.00
10.00
100.00L
ive
s w
ith
ma
rrie
d c
ou
ple
No
pa
ren
ts in
ho
use
ho
ld
Liv
es w
ith
co
ha
bitin
g c
ou
ple
Liv
es w
ith
lo
ne
pa
ren
t
At
lea
st
on
e p
are
nt
wo
rks
Liv
es w
ith
lo
ne
pa
ren
t w
ho
do
esn
't w
ork
Liv
es w
ith
tw
o p
are
nts
bu
t n
eith
er
wo
rk
Re
fuse
d o
r m
issin
g in
co
me
qu
estio
n
Do
n't k
no
w in
co
me
qu
estio
n
Ho
use
ho
ld in
co
me
le
ss t
ha
n £
5,2
00
Ho
use
ho
ld in
co
me
£5
,20
0 -
£1
0,4
00
Ho
use
ho
ld in
co
me
£1
0,4
00
- £
15
,60
0
Ho
use
ho
ld in
co
me
£1
5,6
00
- £
20
,80
0
Ho
use
ho
ld in
co
me
£2
0,8
00
- £
26
,00
0
Ho
use
ho
ld in
co
me
£2
6,0
00
- £
31
,20
0
Ho
use
ho
ld in
co
me
£3
1,2
00
- £
36
,40
0
Ho
use
ho
ld in
co
me
£3
6,0
00
an
d a
bo
ve
On
ly c
hild
Old
er
of
two
ch
ild
ren
Yo
un
ge
r o
f tw
o c
hild
ren
Yo
un
ge
st
of
3+
ch
ild
ren
Old
est
of
3+
ch
ild
ren
In m
idd
le o
f 3
+ c
hild
ren
Effect on odds of
being known to be
eligible for FSM
Parental
Employment
Family
Composition Household Income Siblings
More
likely
Less
likely
Chart 7 (ii): The effect of various pupil characteristics on the odds of claiming FSM, for pupils aged 14
Source: Longitudinal Study of Young People in England 2004
20
0.01
0.10
1.00
10.00
100.00S
ch
oo
l F
SM
ra
te 1
-5%
Gra
mm
ar
sch
oo
l
Sch
oo
l F
SM
ra
te 5
-9%
Sch
oo
l F
SM
ra
te 9
-13
%
Sch
oo
l F
SM
ra
te 1
3-2
1%
Sch
oo
l F
SM
ra
te 2
1-3
5%
Sch
oo
l F
SM
ra
te 3
5-5
0%
Sch
oo
l F
SM
ra
te 5
0+
%
Un
kn
ow
n s
ch
oo
l F
SM
ra
te
Wh
ite
Bri
tish
Bla
ck A
fric
an
Bla
ck C
ari
bb
ea
n
Pa
kis
tan
i
Ba
ng
lad
esh
i
Ch
ine
se
Ind
ian
Iris
h
Gyp
sy/R
om
a
Tra
ve
lle
r o
f Ir
ish
He
rita
ge
Wh
ite
an
d B
lack A
fric
an
Wh
ite
an
d B
lack C
arr
ibe
an
An
y O
the
r W
hite
ba
ckg
rou
nd
An
y O
the
r B
lack b
ackg
rou
nd
An
y O
the
r A
sia
n b
ackg
rou
nd
An
y O
the
r E
thn
ic g
rou
p
An
y O
the
r M
ixe
d b
ackg
rou
nd
Un
cla
ssifie
d E
thn
ic g
rou
p
Effect on odds of
being known to be
eligible for FSM
School FSM BandEthnicity
More
likely
Less
likely
Chart 7 (iii): The effect of various pupil characteristics on the odds of claiming FSM, for pupils aged 14
Source: Longitudinal Study of Young People in England 2004
4.2 The impact of being on out-of-work rather than other benefits.
As previously mentioned, pupils are entitled to receive FSM if their families are in receipt of certain benefits. Most of these are out-of-work benefits, including Income Support, Jobseekers’ !llowance and Employment and Support Allowance. In-work families who work a sufficient number of hours per week are entitled to Working Tax Credit (WTC), which disqualifies them from claiming FSM. This leaves a group of families who are working too few hours to qualify for WTC, but who are not receiving out of work benefits. These families can claim FSM provided they are eligible for Child Tax Credit (CTC) and have an income below a set threshold (currently £16,190). The majority of this group will be families in some part-time work (fewer than 16 hours in a lone parent household and 24 hours per week for couples). HMRC entitlement data separately identifies families in receipt of out-of-work benefits and this latter group, here referred to as “lower earning part-time workers”. This section looks at whether the qualifying benefit, and thereby whether families are working some hours, has any impact on claiming FSM. A regression model was used to address this.
Analysis looking at the relationship between the FSM claiming rate and the qualifying benefits found that the FSM claiming rate in each LA is very strongly linked to the proportion of children on out-of-work benefits but less strongly linked to the extent of part-time low earners. The results suggest that on average the part-time low earners are less likely to claim FSM than those on out- of- work benefits. The patterns of LA FSM rates, on average, match what we might expect to see if all of the families on out-of-work benefits registered to claim FSM, while around half of the low earning part-time working families registered. This is a broad pattern only, with wide variation across LAs, and more detailed data would be required to provide
21
50%
60%
70%
80%
90%
100%
0% 5% 10% 15% 20% 25% 30% 35% 40% 45%
% of FSM entitled via CTC only
FS
M r
eg
istr
atio
n r
ate
(%
)
accurate estimates. However this gives an initial indication that there is some relationship between benefit status and claiming FSM, where families working some hours may be less inclined to register for FSM than those out-of- work.
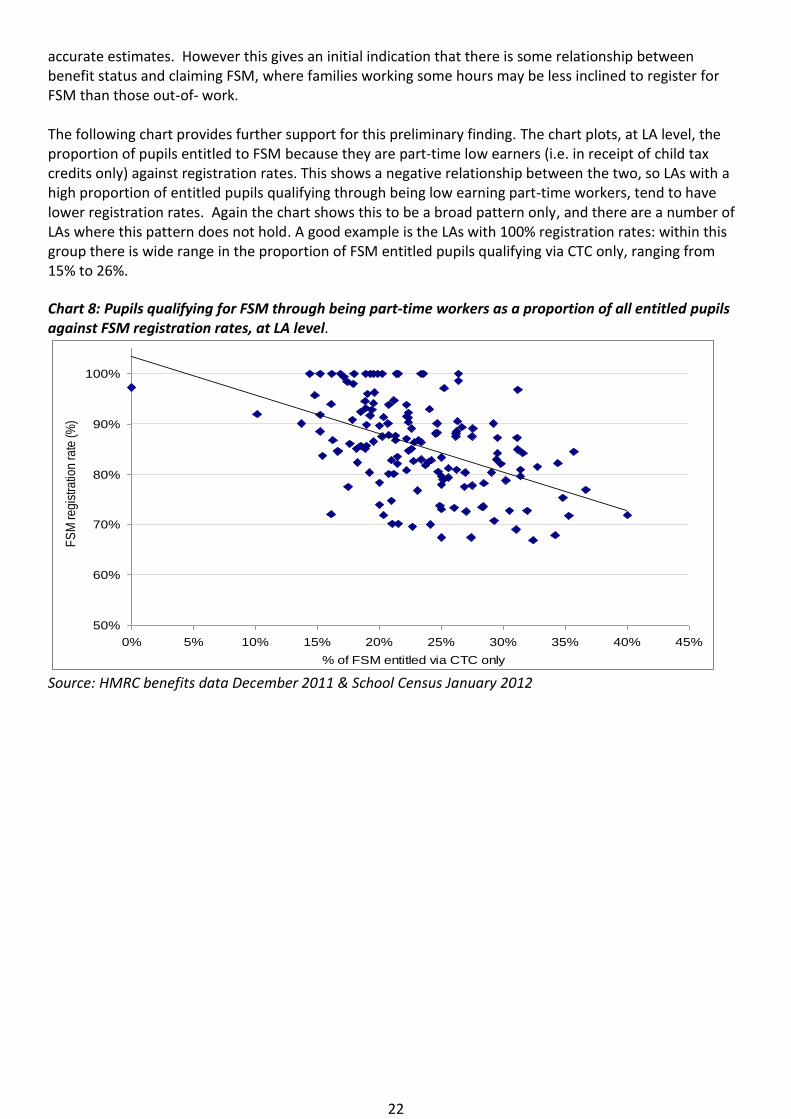
The following chart provides further support for this preliminary finding. The chart plots, at LA level, the proportion of pupils entitled to FSM because they are part-time low earners (i.e. in receipt of child tax credits only) against registration rates. This shows a negative relationship between the two, so LAs with a high proportion of entitled pupils qualifying through being low earning part-time workers, tend to have lower registration rates. Again the chart shows this to be a broad pattern only, and there are a number of LAs where this pattern does not hold. A good example is the LAs with 100% registration rates: within this group there is wide range in the proportion of FSM entitled pupils qualifying via CTC only, ranging from 15% to 26%.
Chart 8: Pupils qualifying for FSM through being part-time workers as a proportion of all entitled pupils against FSM registration rates, at LA level.
Source: HMRC benefits data December 2011 & School Census January 2012
22
5. Note outlining the differences between the estimates in this paper and
earlier estimates.
The last report on FSM under-registration was carried out by London Economics in 2008 for the School Food Trust. This used the Labour Force Survey (LFS) to estimate that approximately 24% of entitled pupils did not register to claim. Being derived from a sample survey, this figure was subject to a margin of error. It was also potentially inaccurate because the questions in the survey could not exactly replicate benefits entitlement rules, particularly as these changed over time. These caveats were spelled out in section 2.4 of the London Economics report. The report also could not make any allowance for families who may have appeared to meet the entitlement criteria for FSM through their income and working patterns, but who had not claimed the qualifying benefit and whose children were not therefore entitled to FSM.
In this current paper we have used administrative data from HMRC benefit records to show that 14% of entitled pupils have not registered to claim FSM. The HMRC administrative data provides very much more accurate estimates because it is based on a much larger sample, and because it also relates directly to the benefits which confer FSM entitlement.
It is therefore not possible to deduce any trend in FSM registration rates over time by comparing these two figures – the apparent reduction in the numbers not registering may simply reflect the improved quality of the most recent estimate.
The move to use of administrative data has the further benefit of allowing a more detailed breakdown of figures. Consequently, this report provides information down to LA level, whereas previous figures could only be quoted at regional level.
6. References
Department for Education (2012). Schools, Pupils and their Characteristics, January 2012 (Statistical Release ID 10/2012). http://www.education.gov.uk/rsgateway/DB/SFR/s001071/sfr10-2012.pdf
London Economics (2008). Assessing Current and Potential Provision of Free School Meals, June 2008 (Research report prepared for School Food Trust by London Economics). http://www.schoolfoodtrust.org.uk/download/documents/pdf/sft_fsm_report_june08.pdf
23
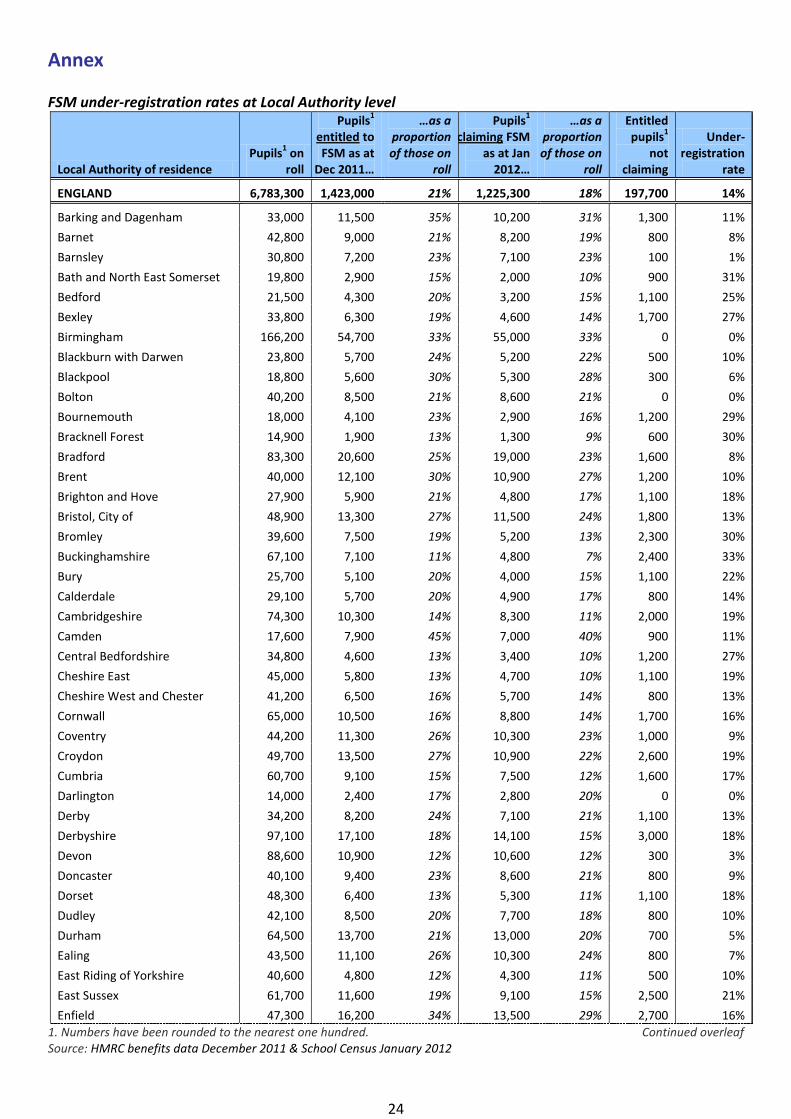
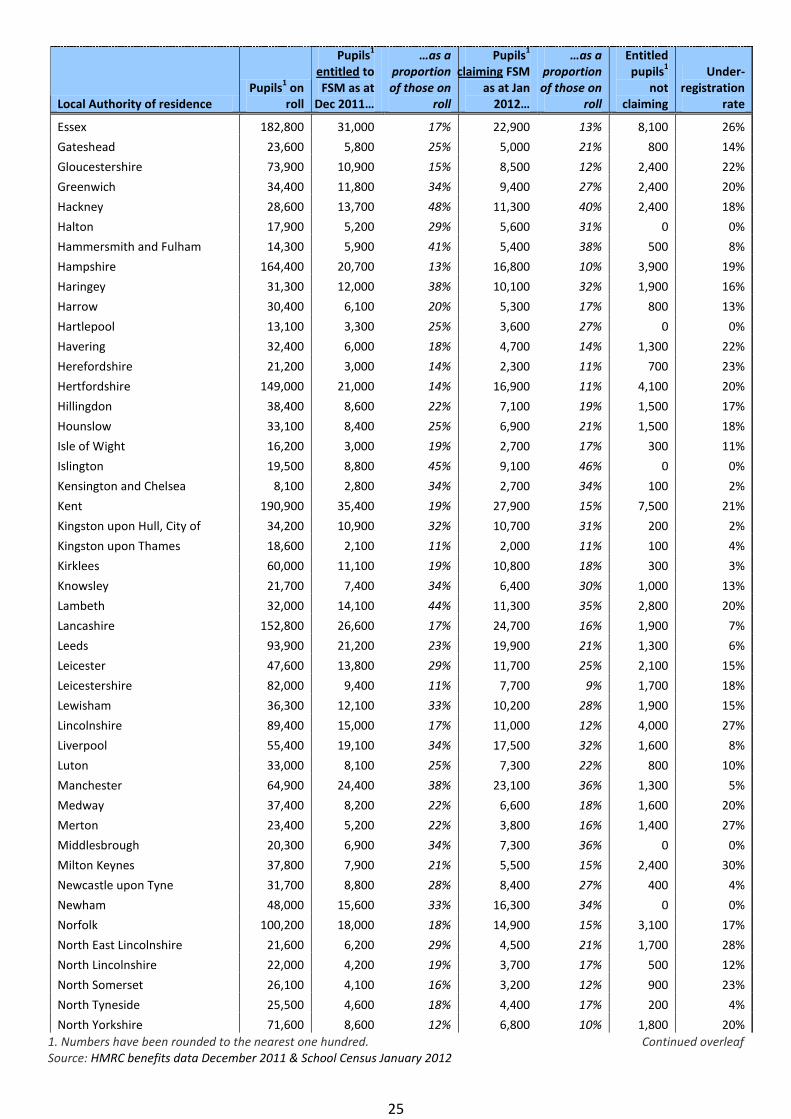
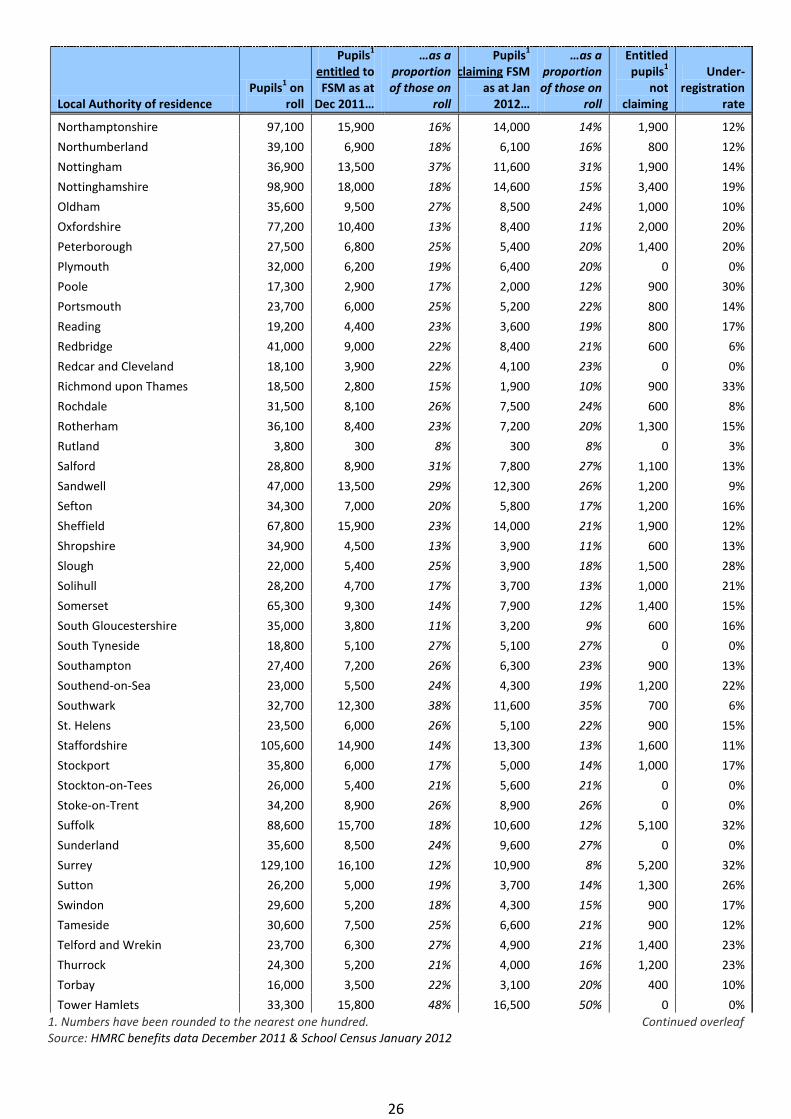
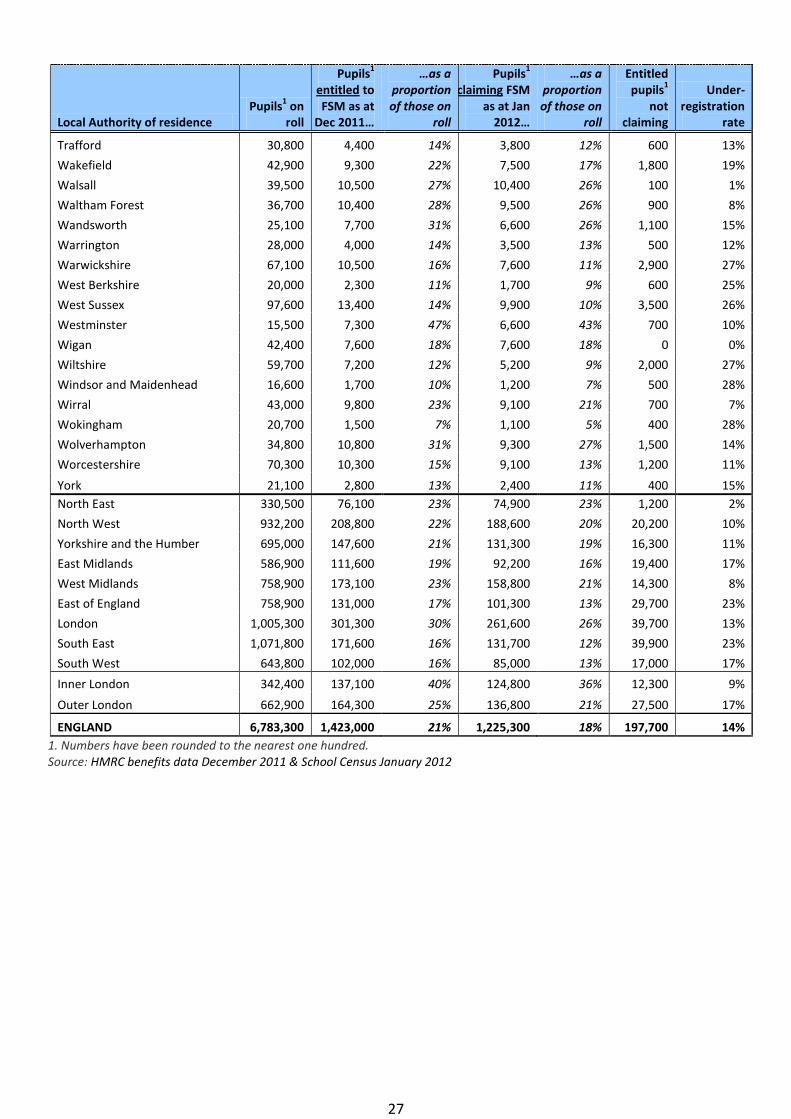
Annex
FSM under-registration rates at Local Authority level
Local Authority of residence Pupils
1 on
roll
Pupils1
entitled to FSM as at Dec 2011…
…as a proportion of those on
roll
Pupils1
claiming FSM as at Jan 2012…
…as a proportion of those on
roll
Entitled pupils
1
not claiming
Under-registration
rate
ENGLAND 6,783,300 1,423,000 21% 1,225,300 18% 197,700 14%
Barking and Dagenham 33,000 11,500 35% 10,200 31% 1,300 11%
Barnet 42,800 9,000 21% 8,200 19% 800 8%
Barnsley 30,800 7,200 23% 7,100 23% 100 1%
Bath and North East Somerset 19,800 2,900 15% 2,000 10% 900 31%
Bedford 21,500 4,300 20% 3,200 15% 1,100 25%
Bexley 33,800 6,300 19% 4,600 14% 1,700 27%
Birmingham 166,200 54,700 33% 55,000 33% 0 0%
Blackburn with Darwen 23,800 5,700 24% 5,200 22% 500 10%
Blackpool 18,800 5,600 30% 5,300 28% 300 6%
Bolton 40,200 8,500 21% 8,600 21% 0 0%
Bournemouth 18,000 4,100 23% 2,900 16% 1,200 29%
Bracknell Forest 14,900 1,900 13% 1,300 9% 600 30%
Bradford 83,300 20,600 25% 19,000 23% 1,600 8%
Brent 40,000 12,100 30% 10,900 27% 1,200 10%
Brighton and Hove 27,900 5,900 21% 4,800 17% 1,100 18%
Bristol, City of 48,900 13,300 27% 11,500 24% 1,800 13%
Bromley 39,600 7,500 19% 5,200 13% 2,300 30%
Buckinghamshire 67,100 7,100 11% 4,800 7% 2,400 33%
Bury 25,700 5,100 20% 4,000 15% 1,100 22%
Calderdale 29,100 5,700 20% 4,900 17% 800 14%
Cambridgeshire 74,300 10,300 14% 8,300 11% 2,000 19%
Camden 17,600 7,900 45% 7,000 40% 900 11%
Central Bedfordshire 34,800 4,600 13% 3,400 10% 1,200 27%
Cheshire East 45,000 5,800 13% 4,700 10% 1,100 19%
Cheshire West and Chester 41,200 6,500 16% 5,700 14% 800 13%
Cornwall 65,000 10,500 16% 8,800 14% 1,700 16%
Coventry 44,200 11,300 26% 10,300 23% 1,000 9%
Croydon 49,700 13,500 27% 10,900 22% 2,600 19%
Cumbria 60,700 9,100 15% 7,500 12% 1,600 17%
Darlington 14,000 2,400 17% 2,800 20% 0 0%
Derby 34,200 8,200 24% 7,100 21% 1,100 13%
Derbyshire 97,100 17,100 18% 14,100 15% 3,000 18%
Devon 88,600 10,900 12% 10,600 12% 300 3%
Doncaster 40,100 9,400 23% 8,600 21% 800 9%
Dorset 48,300 6,400 13% 5,300 11% 1,100 18%
Dudley 42,100 8,500 20% 7,700 18% 800 10%
Durham 64,500 13,700 21% 13,000 20% 700 5%
Ealing 43,500 11,100 26% 10,300 24% 800 7%
East Riding of Yorkshire 40,600 4,800 12% 4,300 11% 500 10%
East Sussex 61,700 11,600 19% 9,100 15% 2,500 21%
Enfield 47,300 16,200 34% 13,500 29% 2,700 16%
1. Numbers have been rounded to the nearest one hundred. Continued overleaf Source: HMRC benefits data December 2011 & School Census January 2012
24
Local Authority of residence Pupils
1 on
roll
Pupils1
entitled to FSM as at Dec 2011…
…as a proportion of those on
roll
Pupils1
claiming FSM as at Jan 2012…
…as a proportion of those on
roll
Entitled pupils
1
not claiming
Under-registration
rate
Essex
Gateshead
Gloucestershire
Greenwich
Hackney
Halton
Hammersmith and Fulham
Hampshire
Haringey
Harrow
Hartlepool
Havering
Herefordshire
Hertfordshire
Hillingdon
Hounslow
Isle of Wight
Islington
Kensington and Chelsea
Kent
Kingston upon Hull, City of
Kingston upon Thames
Kirklees
Knowsley
Lambeth
Lancashire
Leeds
Leicester
Leicestershire
Lewisham
Lincolnshire
Liverpool
Luton
Manchester
Medway
Merton
Middlesbrough
Milton Keynes
Newcastle upon Tyne
Newham
Norfolk
North East Lincolnshire
North Lincolnshire
North Somerset
North Tyneside
North Yorkshire
182,800
23,600
73,900
34,400
28,600
17,900
14,300
164,400
31,300
30,400
13,100
32,400
21,200
149,000
38,400
33,100
16,200
19,500
8,100
190,900
34,200
18,600
60,000
21,700
32,000
152,800
93,900
47,600
82,000
36,300
89,400
55,400
33,000
64,900
37,400
23,400
20,300
37,800
31,700
48,000
100,200
21,600
22,000
26,100
25,500
71,600
31,000 17%
5,800 25%
10,900 15%
11,800 34%
13,700 48%
5,200 29%
5,900 41%
20,700 13%
12,000 38%
6,100 20%
3,300 25%
6,000 18%
3,000 14%
21,000 14%
8,600 22%
8,400 25%
3,000 19%
8,800 45%
2,800 34%
35,400 19%
10,900 32%
2,100 11%
11,100 19%
7,400 34%
14,100 44%
26,600 17%
21,200 23%
13,800 29%
9,400 11%
12,100 33%
15,000 17%
19,100 34%
8,100 25%
24,400 38%
8,200 22%
5,200 22%
6,900 34%
7,900 21%
8,800 28%
15,600 33%
18,000 18%
6,200 29%
4,200 19%
4,100 16%
4,600 18%
8,600 12%
22,900 13% 8,100 26%
5,000 21% 800 14%
8,500 12% 2,400 22%
9,400 27% 2,400 20%
11,300 40% 2,400 18%
5,600 31% 0 0%
5,400 38% 500 8%
16,800 10% 3,900 19%
10,100 32% 1,900 16%
5,300 17% 800 13%
3,600 27% 0 0%
4,700 14% 1,300 22%
2,300 11% 700 23%
16,900 11% 4,100 20%
7,100 19% 1,500 17%
6,900 21% 1,500 18%
2,700 17% 300 11%
9,100 46% 0 0%
2,700 34% 100 2%
27,900 15% 7,500 21%
10,700 31% 200 2%
2,000 11% 100 4%
10,800 18% 300 3%
6,400 30% 1,000 13%
11,300 35% 2,800 20%
24,700 16% 1,900 7%
19,900 21% 1,300 6%
11,700 25% 2,100 15%
7,700 9% 1,700 18%
10,200 28% 1,900 15%
11,000 12% 4,000 27%
17,500 32% 1,600 8%
7,300 22% 800 10%
23,100 36% 1,300 5%
6,600 18% 1,600 20%
3,800 16% 1,400 27%
7,300 36% 0 0%
5,500 15% 2,400 30%
8,400 27% 400 4%
16,300 34% 0 0%
14,900 15% 3,100 17%
4,500 21% 1,700 28%
3,700 17% 500 12%
3,200 12% 900 23%
4,400 17% 200 4%
6,800 10% 1,800 20%
1. Numbers have been rounded to the nearest one hundred. Source: HMRC benefits data December 2011 & School Census January 2012
Continued overleaf
25
Local Authority of residence Pupils
1 on
roll
Pupils1
entitled to FSM as at Dec 2011…
…as a proportion of those on
roll
Pupils1
claiming FSM as at Jan 2012…
…as a proportion of those on
roll
Entitled pupils
1
not claiming
Under-registration
rate
Northamptonshire 97,100 15,900 16% 14,000 14% 1,900 12%
Northumberland 39,100 6,900 18% 6,100 16% 800 12%
Nottingham 36,900 13,500 37% 11,600 31% 1,900 14%
Nottinghamshire 98,900 18,000 18% 14,600 15% 3,400 19%
Oldham 35,600 9,500 27% 8,500 24% 1,000 10%
Oxfordshire 77,200 10,400 13% 8,400 11% 2,000 20%
Peterborough 27,500 6,800 25% 5,400 20% 1,400 20%
Plymouth 32,000 6,200 19% 6,400 20% 0 0%
Poole 17,300 2,900 17% 2,000 12% 900 30%
Portsmouth 23,700 6,000 25% 5,200 22% 800 14%
Reading 19,200 4,400 23% 3,600 19% 800 17%
Redbridge 41,000 9,000 22% 8,400 21% 600 6%
Redcar and Cleveland 18,100 3,900 22% 4,100 23% 0 0%
Richmond upon Thames 18,500 2,800 15% 1,900 10% 900 33%
Rochdale 31,500 8,100 26% 7,500 24% 600 8%
Rotherham 36,100 8,400 23% 7,200 20% 1,300 15%
Rutland 3,800 300 8% 300 8% 0 3%
Salford 28,800 8,900 31% 7,800 27% 1,100 13%
Sandwell 47,000 13,500 29% 12,300 26% 1,200 9%
Sefton 34,300 7,000 20% 5,800 17% 1,200 16%
Sheffield 67,800 15,900 23% 14,000 21% 1,900 12%
Shropshire 34,900 4,500 13% 3,900 11% 600 13%
Slough 22,000 5,400 25% 3,900 18% 1,500 28%
Solihull 28,200 4,700 17% 3,700 13% 1,000 21%
Somerset 65,300 9,300 14% 7,900 12% 1,400 15%
South Gloucestershire 35,000 3,800 11% 3,200 9% 600 16%
South Tyneside 18,800 5,100 27% 5,100 27% 0 0%
Southampton 27,400 7,200 26% 6,300 23% 900 13%
Southend-on-Sea 23,000 5,500 24% 4,300 19% 1,200 22%
Southwark 32,700 12,300 38% 11,600 35% 700 6%
St. Helens 23,500 6,000 26% 5,100 22% 900 15%
Staffordshire 105,600 14,900 14% 13,300 13% 1,600 11%
Stockport 35,800 6,000 17% 5,000 14% 1,000 17%
Stockton-on-Tees 26,000 5,400 21% 5,600 21% 0 0%
Stoke-on-Trent 34,200 8,900 26% 8,900 26% 0 0%
Suffolk 88,600 15,700 18% 10,600 12% 5,100 32%
Sunderland 35,600 8,500 24% 9,600 27% 0 0%
Surrey 129,100 16,100 12% 10,900 8% 5,200 32%
Sutton 26,200 5,000 19% 3,700 14% 1,300 26%
Swindon 29,600 5,200 18% 4,300 15% 900 17%
Tameside 30,600 7,500 25% 6,600 21% 900 12%
Telford and Wrekin 23,700 6,300 27% 4,900 21% 1,400 23%
Thurrock 24,300 5,200 21% 4,000 16% 1,200 23%
Torbay 16,000 3,500 22% 3,100 20% 400 10%
Tower Hamlets 33,300 15,800 48% 16,500 50% 0 0%
1. Numbers have been rounded to the nearest one hundred. Continued overleaf Source: HMRC benefits data December 2011 & School Census January 2012
26
Local Authority of residence Pupils
1 on
roll
Pupils1
entitled to FSM as at Dec 2011…
…as a proportion of those on
roll
Pupils1
claiming FSM as at Jan 2012…
…as a proportion of those on
roll
Entitled pupils
1
not claiming
Under-registration
rate
Trafford 30,800 4,400 14% 3,800 12% 600 13%
Wakefield 42,900 9,300 22% 7,500 17% 1,800 19%
Walsall 39,500 10,500 27% 10,400 26% 100 1%
Waltham Forest 36,700 10,400 28% 9,500 26% 900 8%
Wandsworth 25,100 7,700 31% 6,600 26% 1,100 15%
Warrington 28,000 4,000 14% 3,500 13% 500 12%
Warwickshire 67,100 10,500 16% 7,600 11% 2,900 27%
West Berkshire 20,000 2,300 11% 1,700 9% 600 25%
West Sussex 97,600 13,400 14% 9,900 10% 3,500 26%
Westminster 15,500 7,300 47% 6,600 43% 700 10%
Wigan 42,400 7,600 18% 7,600 18% 0 0%
Wiltshire 59,700 7,200 12% 5,200 9% 2,000 27%
Windsor and Maidenhead 16,600 1,700 10% 1,200 7% 500 28%
Wirral 43,000 9,800 23% 9,100 21% 700 7%
Wokingham 20,700 1,500 7% 1,100 5% 400 28%
Wolverhampton 34,800 10,800 31% 9,300 27% 1,500 14%
Worcestershire 70,300 10,300 15% 9,100 13% 1,200 11%
York 21,100 2,800 13% 2,400 11% 400 15%
North East 330,500 76,100 23% 74,900 23% 1,200 2%
North West 932,200 208,800 22% 188,600 20% 20,200 10%
Yorkshire and the Humber 695,000 147,600 21% 131,300 19% 16,300 11%
East Midlands 586,900 111,600 19% 92,200 16% 19,400 17%
West Midlands 758,900 173,100 23% 158,800 21% 14,300 8%
East of England 758,900 131,000 17% 101,300 13% 29,700 23%
London 1,005,300 301,300 30% 261,600 26% 39,700 13%
South East 1,071,800 171,600 16% 131,700 12% 39,900 23%
South West 643,800 102,000 16% 85,000 13% 17,000 17%
Inner London 342,400 137,100 40% 124,800 36% 12,300 9%
Outer London 662,900 164,300 25% 136,800 21% 27,500 17%
ENGLAND 6,783,300 1,423,000 21% 1,225,300 18% 197,700 14%
1. Numbers have been rounded to the nearest one hundred. Source: HMRC benefits data December 2011 & School Census January 2012
27

Ref: DFE-RR
ISBN:
©
2012