Embed Size (px)
Citation preview
ABSTRACT
Title of Document: ROLE OF VOLATILE FATTY ACIDS IN
REGULATING NITROGEN UTILIZATION AND UREA
NITROGEN RECYCLING IN RUMINANTS.
Umang Agarwal, Doctor of Philosophy, 2013
Directed By: Associate Professor, Brian J. Bequette,
Department of Animal and Avian Sciences
Mechanistic knowledge of urea-N partitioning has the potential to reveal targets
that can be manipulated to improve protein efficiency of ruminants, and hence, reduce N
excretion to the environment. The objective of this research was to establish the role of
rumen volatile fatty acids (VFA), particularly propionate and butyrate, in regulation of N
utilization, urea-N recycling and gluconeogenesis in growing lambs. For these studies,
sheep were fitted with a rumen cannula and fed a pelleted ration to ≥ 1.5 × maintenance
energy intake. Total urine and feces were collected for determination of N balances. In
addition, [15
N2]urea was infused to determine urea-N kinetics, [13
C6]glucose was infused
to estimate gluconeogenesis and [ring-D5]phenylalanine was infused to estimate protein
fractional synthesis rate (FSR) of rumen tissue.
The first study was conducted to evaluate the perturbations in rumen VFA profiles
as a result of rumen starch infusion and the association of these perturbations to changes
in urea-N kinetics and gluconeogenesis. Sheep (n=4) were infused into the rumen with
either water (control) or gelatinized starch (100 g/d) for 9-d periods in a balanced
crossover design. The rumen VFA profile was not affected by starch infusion. Fecal N
output tended to increase with starch infusion; however, there were no effects on N
retention and urinary N excretion. In addition, starch infusion did not alter urea-N entry
rate (UER, i.e. synthesis) nor urea-N recycled to the gut (GER); however, starch infusion
increased urea-N excreted in feces (UFE). Glucose entry, gluconeogenesis and Cori
cycling were increased by starch infusion. The results suggest that under the feeding
conditions of this study, starch infusion shifted the elimination of urea-N from urine to
feces but this did not lead to an increase in N retention.
Two companion studies were conducted to determine the role of rumen butyrate
in urea-N recycling and rumen FSR. In Exp 1, sheep (n=4) were given intra-ruminal
infusions of either an electrolyte buffer solution (Con-Buf; control) or butyrate dissolved
in the buffer solution (But-Buf). In Exp 2, sheep (n=4) were infused into the rumen with
iso-energetic (1 MJ/d) solutions of either sodium acetate (Na-Ac; control) or sodium
butyrate (Na-But). Butyrate infusion treatments increased the proportion of rumen
butyrate whereas acetate infusion increased rumen acetate. No difference in N retention
was observed between treatments in either experiment. In Exp 2, UER was reduced by
Na-But compared to the Na-Ac control, thus, a higher proportion of urea-N entering the
rumen was utilized for microbial protein synthesis. In Exp 1, although But-Buf infusion
increased the FSR of rumen papillae, urea kinetics were not altered. This study is the first
to directly assess the role of butyrate in urea-N recycling and effects on rumen papillae
protein turnover in growing lambs. Under the conditions in the present studies, butyrate
did not affect overall N retention in growing sheep; however, butyrate reduced urea
synthesis and altered the distribution of urea-N fluxes.
Lastly, two companion studies were conducted to determine the role of rumen
propionate in urea-N recycling and gluconeogenesis. In Exp 1, sheep (n=6) were
continuously infused into the rumen with iso-energetic (1 MJ/d) solutions of either Na-
Acetate (control) or Na-Propionate for 9-d periods in a balanced crossover design. In Exp
2, a different group of wether sheep (n=5) were fed on an equivalent protein intake basis
either a control or Na-propionate supplemented ration. Propionate treatments increased
the proportion of rumen propionate in both experiments. In Exp 1, urea kinetics and N
retention were not affected by propionate infusion compared to iso-energetic acetate
infusion. However, in Exp 2, the propionate diet increased N retention by ~50%, which
resulted from reductions in UER (−2.1 g urea-N/d) and UUE (−0.8 g urea-N/d). Glucose
entry and gluconeogenesis were increased by propionate treatments. Under the conditions
of these studies, higher ruminal propionate did not affect urea-N fluxes to the rumen. The
results from this research provide an understanding of the role of individual rumen VFA
in N retention and urea-N recycling in ruminants.
ROLE OF VOLATILE FATTY ACIDS IN REGULATING NITROGEN UTILIZATION
AND UREA NITROGEN RECYCLING IN RUMINANTS
By
Umang Agarwal
Dissertation submitted to the Faculty of the Graduate School of the
University of Maryland, College Park, in partial fulfillment
of the requirements for the degree of
Doctor of Philosophy
2013
Advisory Committee:
Associate Professor Brian J. Bequette, Chair
Professor Richard A. Kohn
Dr. Ransom L. Baldwin, VI
Dr. Erin E. Connor
Assistant Professor Ganesh Sriram
Associate Professor Douglas Julin, Dean’s representative
© Copyright by
Umang Agarwal
2013
ii
DEDICATION
To
Narendra Modi

iii
ACKNOWLEDGEMENTS
I express my gratitude and regards to my advisor Dr. Brian J. Bequette for
mentoring and encouraging me throughout my research and studies. Along with critical
thinking, he trained me in conducting animal experiments and paying attention to details.
This dissertation would not have been possible without his help and support.
I would like to thank my committee members, Drs. Rick Kohn, Ransom (Randy)
Baldwin, Erin Connor, Ganesh Sriram and Douglas Julin (Dean’s representative), for
challenging me throughout the progress of my research. Their inputs and suggestions
have helped me better understand my field of study and myself. I want to especially thank
Mr. Dennis Hucht (USDA) for his willingness beyond retirement age to help with sample
analysis at USDA.
For assistance in conducting experiment and providing good company throughout
the years, I thank members of our group, Team Sequoia: Dr. Qiong Hu, Leslie, Jennifer,
Katelyn, Amanda, Kelly, George, Danielle, Hanum, Olivia, Mallan, Anna and Morgan. I
also appreciate the support of Dr. Angela Black and the staff at ANSC animal facilities.
Finally, I would like to thank the ANSC faculty and staff, friends in ASGSA and
DESI, and my family and friends back home for their constant motivation and support.
iv
TABLE OF CONTENTS
Acknowledgements ................................................................................................................................... iii
Table of Contents ...................................................................................................................................... iv
List of tables .............................................................................................................................................. vii
List of figures ........................................................................................................................................... viii
List of Abbreviations ................................................................................................................................ ix
Introduction ................................................................................................................................................. 1
Overall aim of research .............................................................................................................. 2
Research Hypothesis .................................................................................................................. 2
Experimental Objectives ............................................................................................................ 2
Chapter 1: Literature review ..................................................................................................................... 4
Importance of animal agriculture in global food production ..................................................... 4
Efficiency of nitrogen utilization in ruminants .......................................................................... 6
Urea synthesis and metabolic flexibity in the liver .................................................................... 8
Urea-N recycling in ruminants ................................................................................................. 10
Factors affecting urea-N recycling to the GIT ......................................................................... 12
Rumen ammonia and plasma urea concentration ..................................................................... 12
Urea transporters ........................................................................................................................... 13
Dietary protein............................................................................................................................... 15
Rumen fermentation ..................................................................................................................... 16
Production of rumen VFA ........................................................................................................ 17
Metabolic fates of VFA ............................................................................................................ 18
Techniques for measuring urea kinetics ................................................................................... 21
Summary .................................................................................................................................. 23
Chapter 2: Effect of ruminal starch infusion on perturbation of rumen volatile fatty acids,
urea nitrogen kinetics and gluconeogenesis in growing sheep .......................................................... 25
Abstract .................................................................................................................................... 25
Introduction .............................................................................................................................. 26
Materials and Methods ............................................................................................................. 27
v
Animals, diet and treatments ....................................................................................................... 27
Tracer infusion .............................................................................................................................. 28
Sampling ........................................................................................................................................ 28
Urea concentration and enrichment ............................................................................................ 31
Total urinary and fecal N, and fecal 15
N .................................................................................... 32
Rumen fluid VFA concentration ................................................................................................. 32
Glucose concentration and enrichment ...................................................................................... 33
Calculations ................................................................................................................................... 34
Statistical Analysis........................................................................................................................ 35
Results ...................................................................................................................................... 36
Discussion ................................................................................................................................ 41
Chapter 3: Role of rumen butyrate in regulation of nitrogen utilization and urea nitrogen
kinetics in growing sheep ........................................................................................................................ 44
Abstract .................................................................................................................................... 44
Introduction .............................................................................................................................. 45
Materials and methods .............................................................................................................. 47
Animals, diets and treatment periods ......................................................................................... 47
Isotope infusion ............................................................................................................................. 51
Sampling ........................................................................................................................................ 51
Urea concentration and enrichment ............................................................................................ 52
Total urinary and fecal N and fecal 15
N ..................................................................................... 53
Rumen fluid VFA concentration ................................................................................................. 54
Phenylalanine enrichment in plasma and rumen papillae ....................................................... 54
Calculations ................................................................................................................................... 55
Statistical Analysis........................................................................................................................ 57
Results ...................................................................................................................................... 58
Experiment 1: Butyrate vs Buffer (control) .............................................................................. 58
Experiment 2: Butyrate vs Acetate (control)............................................................................. 59
Discussion ................................................................................................................................ 65
Chapter 4: Role of rumen propionate in regulation of urea nitrogen kinetics and
gluconeogenesis in growing sheep ......................................................................................................... 70
Abstract .................................................................................................................................... 70
Introduction .............................................................................................................................. 71
Materials and methods .............................................................................................................. 73
Animals, diets and treatment periods ......................................................................................... 73
Tracer infusion .............................................................................................................................. 75
Sampling ........................................................................................................................................ 77
vi
Urea concentration and enrichment ............................................................................................ 78
Total urinary and fecal N, and fecal 15
N .................................................................................... 79
Rumen fluid VFA concentration ................................................................................................. 79
Glucose concentration and enrichment ...................................................................................... 80
Calculations ................................................................................................................................... 81
Statistical Analysis........................................................................................................................ 82
Results ...................................................................................................................................... 83
Experiment 1: Na-Propionate vs Na-Acetate (control) ............................................................ 83
Experiment 2: Control diet vs Dietary Propionate ................................................................... 91
Discussion ................................................................................................................................ 93
Summary and Conclusions...................................................................................................................... 99
Appendices .............................................................................................................................................. 101
1. Surgery protocol for rumen cannulation .......................................................................... 101
2. Rumen biopsy procedure .................................................................................................. 107
3. Urea-N kinetic calculations .............................................................................................. 109
Bibliography ........................................................................................................................................... 111
vii
LIST OF TABLES
Table 1.1: Urea-N kinetics in various species. ................................................................. 11
Table 1.2: Production rates, concentrations and molar proportion of VFA in the rumen of
various species. ................................................................................................................. 20
Table 2.1: Composition of diet. ........................................................................................ 30
Table 2.2: Nitrogen balance in growing sheep (n=4) infused with starch or water
(control)............................................................................................................................. 37
Table 2.3: Rumen volatile fatty acid profiles in growing sheep (n=4) infused with starch
or water (control). ............................................................................................................. 38
Table 2.4: Urea-N fluxes in growing sheep (n=4) infused with starch or water (control).
........................................................................................................................................... 40
Table 2.5: Glucose kinetics in growing sheep (n=4) infused with starch or water (control).
........................................................................................................................................... 41
Table 3.1: Composition of diet for Exp 1 and Exp 2. ....................................................... 49
Table 3.2: Composition of treatment infusion solutions for Exp 1 and Exp 2. ................ 50
Table 3.3: Nitrogen balance in growing sheep (n=4) in Exp 1 and Exp 2. ....................... 60
Table 3.4: Rumen volatile fatty acid profiles in growing sheep (n=4) in Exp 1 and Exp 2.
........................................................................................................................................... 61
Table 3.5: Urea-N fluxes in growing sheep (n=4) in Exp 1 and Exp 2. ........................... 62
Table 4.1: Composition of diet for Exp 1. ........................................................................ 74
Table 4.2: Composition of diets for Exp 2. ....................................................................... 76
Table 4.3: Nitrogen balance in growing sheep in Exp 1 (n=6) and Exp 2 (n=5). ............. 84
Table 4.4: Rumen volatile fatty acid profiles in growing sheep in Exp 1 (n=6) and Exp 2
(n=5). ................................................................................................................................. 86
Table 4.5: Urea-N fluxes in growing sheep in Exp 1 (n=6) and Exp 2 (n=5). ................. 87
Table 4.6: Glucose kinetics in growing sheep in Exp 1 (n=6) and Exp 2 (n=5). .............. 88
viii
LIST OF FIGURES
Figure 1.1: Urea-N kinetics model .................................................................................... 22
Figure 2.1: The time-course of urinary [15
N2]urea enrichments. ...................................... 39
Figure 2.2: The time-course of urinary [15
N14
N]urea enrichments. .................................. 39
Figure 3.1: The time-course of urinary [15
N15
N]urea enrichments in Exp 1 (A, 4 day
[15
N2]urea infusion) and Exp 2 (B, 5 day [15
N2]urea infusion). ........................................ 63
Figure 3.2: The time-course of urinary [15
N14
N]urea enrichments in Exp 1 (A, 4 day
[15
N2]urea infusion) and Exp 2 (B, 5 day [15
N2]urea infusion). ........................................ 64
Figure 4.1: The time-course of urinary [15
N15
N]urea enrichments in Exp 1 (A, 5 day
[15
N2]urea infusion) and Exp 2 (B, 4 day [15
N2]urea infusion). ........................................ 89
Figure 4.2: The time-course of urinary [15
N14
N]urea enrichments in Exp 1 (A, 5 day
[15
N2]urea infusion) and Exp 2 (B, 4 day [15
N2]urea infusion). ........................................ 90
Figure 4.3: Time-course of total 15
N enrichment in fecal samples in Exp 1 (5 day
[15
N2]urea infusion) and Exp 2 (4 day [15
N2]urea infusion). ............................................ 91
Figure 4.4: Relationship between rumen propionate (mM) and gluconeogenesis (g/d). .. 93
ix
LIST OF ABBREVIATIONS
AA amino acid
BCAA branched-chain amino acids
BW body weight
CP crude protein
DM dry matter
EAA essential amino acids
FSR protein fractional synthesis rate
GC-MS gas chromatography-mass spectrometry
GER gut entry rate
GIT gastro-intestinal tract
MDV mesenteric-drained viscera
ME maintenance energy
N nitrogen
OUC ornithine-urea cycle
PDV portal-drained viscera
RDP rumen degradable protein
ROC return to the ornithine-cycle
RUP rumen undegradable protein
UER urea entry rate
UFE urea-N excreted in feces
UT urea transporters
UUA urea used for anabolism
UUE urinary urea excretion
VFA volatile fatty acids
1
INTRODUCTION
In ruminants, a large portion of valuable protein nitrogen from feed is lost as urea
in urine, resulting in low nitrogen (N) efficiency. Conserving this N by redirecting urea
towards rumen microbial protein synthesis will help reduce animal manure wastes and
increase income over feed costs.
A large but often variable (20-80%) proportion of urea synthesized by the
ruminant liver is excreted into the urine as waste, whereas the remainder has the potential
to be partitioned to the rumen. Endogenous urea entering the rumen is hydrolyzed to
ammonia and utilized by microbes for protein synthesis, or it is reabsorbed across the
rumen wall and converted to urea by the liver. Several studies have suggested that higher
rumen concentrations of certain volatile fatty acids (VFA), especially propionate and
butyrate, increase the ruminal influx of urea (Simmons et al., 2009; Kim et al., 1999).
Feeding and post-ruminal infusion of propionate have been shown to increase N retention
by growing ruminants, possibly through increasing urea-N recycling and(or)
gluconeogenesis (Kim et al., 1999; Baldwin et al., 2012). Moreover, in steers fed a
concentrate diet, higher ruminal urea transporter (UT-B) expression was found to be
associated with higher rumen butyrate levels (Simmons et al., 2009). Increased
expression of UT-B by the rumen epithelia may directly affect the entry of plasma urea
into the rumen, thus facilitating its conversion into microbial protein. However, there
remains a lack of direct evidence of the influence of rumen VFA on urea-N recycling,
and the mechanism(s) by which VFA regulate this recycling process remains unclear. If
properly understood, it should be possible to efficiently manipulate feed ingredient inputs
2
to optimize outputs in terms of amino acid (AA) and energy utilization for meat and milk
production by ruminants.
Overall aim of research
The aim of this research was to determine the role of rumen VFA in regulation of
N utilization and urea-N recycling to the rumen of growing sheep. The overall goal of
this project was to improve AA and protein retention in ruminants through a better
understanding of the mechanisms that regulate hepatic urea synthesis and recycling of
urea-N in ruminants.
Research Hypothesis
The research conducted in this thesis was designed to address two hypotheses:
1. Higher rumen propionate concentration improves N retention by increasing the
amount of urea-N recycled to the rumen, and by sparing AA from
gluconeogenesis.
2. Higher rumen butyrate concentration improves N retention by promoting urea-N
recycling to and capture in the rumen.
Experimental Objectives
A total of five experiments were conducted to investigate the above hypotheses.
The first experiment was conducted to determine, by infusion of starch into the rumen of
growing sheep, the profile of rumen VFA that is associated with alterations in urea-N
3
transfer and capture in the rumen, as well as associations with changes in
gluconeogenesis (Chapter 2).
Two companion experiments were conducted to investigate the role of rumen
butyrate in N utilization, urea-N kinetics and rumen tissue growth (Chapter 3). In the first
experiment, rumen butyrate was artificially elevated by constant infusion into the rumen
compared to infusion of buffer (control). In the second experiment, iso-energetic
infusions of acetate compared to butyrate were used to simulate forage compared to high
concentrate fed rumen fermentation profiles, feeding conditions where urea-N recycling
differences have been observed.
Lastly, two companion experiments were conducted to determine the role of
rumen propionate (Chapter 4). In the first experiment, iso-energetic infusions of acetate
and propionate were used to simulate comparisons of high forage and a high concentrate
diet in terms of rumen fermentation profiles. In the second experiment, a forage-type diet
with or without added propionate was fed to directly determine the role of propionate in
regulation of urea-N kinetics under typical feeding conditions where rumen VFA
concentration fluctuates.
4
CHAPTER 1: LITERATURE REVIEW
Importance of animal agriculture in global food production
Animal agriculture is essential for meeting the global food demand of the
increasing population. With the global population already having exceeded 7 billion in
2012, and estimated to exceed 9 billion by 2050 (UN, 2012), this demand is expected to
grow even further. Compared to food of plant origin, food of animal origin (meat, milk
and eggs) is of high quality and more bio-available to humans in terms of meeting the
requirements of essential amino acids (AA), minerals and vitamins. Meat, milk and eggs
together account for approximately 17% of global human dietary energy and 35% of
human dietary protein consumption (Bradford et al., 1999). Hence, it is important to view
animal agriculture as an integral part of a food-producing system rather than an isolated
system competing with humans for food demand. Nonetheless, the issue of resource
allocation, which involves dynamics of food-feed competition, for food production needs
to be scientifically determined keeping in mind the efficiency and nutritional value of
various plant and animal products.
Production of plant based human food generates about 27% by-products that are
unsuitable for human consumption (Bradford et al., 1999). Given the ability of ruminants
to consume human inedible crop residue, and convert it into high quality food for
humans, they have been major companions of humans since early civilization. Ruminants
not only provide high quality milk and meat, but also provide draught energy and manure
for fertilization of fields.
5
Although ruminant animals require much less human edible feed material as
compared to non-ruminant species, the diets of high producing dairy cows may be
comprised of 10-30% cereal grains, which seem to place them in competition with human
use. Of course, animal diets vary with region and species. The diet of monogastric
animals, mainly pigs and poultry, contains 50-70% human-edible grains. In fact, more
than one-third of the global consumption of cereal grains is directed towards use as
animal feed (Speedy, 2003). Resource use for production of animal products has been
questioned on the basis of low efficiency of conversion and environmental concerns of
animal agriculture. Most of the criticism has arisen from allocation of human edible food
crops towards use as animal feed. However, most often the reported values fail to
consider the human inedible nature of feed stuffs.
On the basis of total human-edible food produced per unit human edible food
consumed, the returns from ruminants are much higher and the efficiencies are above
100%. For developed countries, the average conversion efficiency of feed grain to high
quality human edible food (kg product/ kg grain consumed) for pork, poultry, sheep or
goat meat, and milk is 27%, 45.5%, 125% and 333.3% respectively (Bradford et al.,
1999). The food production system efficiency calculations must take into account the
crop yields in a given land mass, conversion efficiency of the animal and the food
processing losses. For example, in the California central valley a comparison was made
between alfalfa, the primary animal feed, and wheat, the most suitable grain for human
consumption. The yield of alfalfa was shown to be almost four-fold higher than the yield
of wheat. The human edible value of total milk produced from alfalfa fed cows and that
of wheat fed cows was compared. The total human edible digestible energy (DE) was
6
20% higher and the dietary protein was twice as high in milk as compared to that in
wheat. Thus, the food production systems must be designed based on the regional crop
yields and dietary preferences of the population.
Efficiency of nitrogen utilization in ruminants
Although ruminants are unmatched in their ability to convert human inedible
material into high quality human edible products, their gross efficiency of converting
dietary N into saleable products (milk and meat) is only about 5-35% (Bequette and
Sunny, 2005). The remaining 60-80% of the nitrogen (N) is eliminated into the
environment, mainly as urea in urine. This results in low N efficiency and has a
considerable impact on the environment. There are environmental concerns over
inefficient use of N by ruminants since most of the excreted N contributes to ammonia
(NH3) and nitrous oxide in the atmosphere (Federal Register, 2001). And, N loss from
manure to water bodies (runoff) contributes to eutrophication. Therefore, a better
understanding of N metabolism in the rumen, particularly with respect to NH3capture by
microbes, is needed.
Digestion in ruminants is initiated in the rumen via microbial activity. Microbial
activity largely results in degradation of dietary protein and non-protein N sources to NH3
and carbon skeletons which are re-incorporated into protein by rumen microbes.
Depending upon microbial activity and dietary interactions, the intestinal supply of
protein and AA may be lower or higher than the true protein intake. However, microbial
protein synthesis is not always able to provide adequate protein to meet the demands of
high producing animals. Moreover, protein flow through the rumen may result in
7
degradation of high quality protein. The use of protein supplementation and rumen
undegradable protein are some nutritional strategies employed to overcome these
limitations (Santos et al., 1998). Further, excessive protein degradation in the rumen
results in generation of NH3 that is absorbed and converted by the liver to urea.
Inefficiency of use of dietary N by ruminants is mainly due to two factors. First,
the microbial activity in the rumen leads to the production and absorption of large
amounts of NH3 across the rumen. The second is the absorptive and post-absorptive use
of AA. The net flux of essential amino acids (EAA) across portal-drained viscera (PDV,
which represents total gut flux) accounts for about 61% that of mesenteric-drained
viscera (MDV, which represents net small intestinal metabolism) fluxes (MacRae et al.,
1997), suggesting a net extraction of EAA by the non-mesentric gut. El-Kadi et al. (2006)
demonstrated in sheep that increasing levels of casein infused into the small intestines
aided marginal recovery of EAA in PDV other than branched-chain amino acids
(BCAA). Thus, there is a high cost of gut metabolism, particularly non-mesenteric
foregut and hindgut tissues, on EAA absorption which contributes to post-absorptive
inefficiency of AA use. MacRae et al. (1995) studied the post-absorptive efficiency of
AA use in growing lambs fed either forage or forage:barley pellets. Efficiency of
utilization of total AA was 50% and 59% with forage and forage:barley respectively.
Urea, the end product of N metabolism, is an important N-dense currency in the
overall N economy. At the beginning of the twentieth century, it was found that urea
could replace a portion of protein in ruminant rations and by the mid-1950s urea became
a well accepted replacement for dietary protein in regions where plant-based protein was
limited (Loosli and McDonald, 1968), or simply because urea is cheaper. Since then,
8
there has been a continuous effort to understand the mechanisms by which urea is
manufactured, utilized for anabolic use, or excreted from the body. Conserving N by
redirecting urea towards rumen microbial protein synthesis will help reduce animal
manure wastes and increase income over feed costs. The cost of ration is the most
significant contributor to overall costs of animal agriculture and proteins are an important
component of this ration (Beever and Doyle, 2007). Improving the ruminant animal
efficiency in terms of N utilization, therefore, will be highly profitable to farmers.
Urea synthesis and metabolic flexibity in the liver
Catabolism of nitrogenous compounds generates NH3. NH3 produced in the
gastro-intestinal tract (GIT) and peripheral tissue is transferred to the liver to be
detoxified to urea by the ornithine-urea cycle (OUC) which comprises five enzymatic
steps. The liver is very efficient in extracting NH3, with efficiency ranging from 75-85%
(Lobley and Milano, 1997). However, NH3 escaping the liver may lead to higher levels of
NH3 in the blood and can lead to toxicity.
Aspartate and glutamate formed by transamination reactions contribute amino
acid-N to urea synthesis (Reynolds, 1992). Inputs of cytosolic aspartate and
mitochondrial NH3 are required to “balance” N inputs into the OUC. Lobley et al. (1995)
observed that NH3 removal by the liver in cattle accounted for only 50-60% of urea-N
output by the liver. Thus, the remainder most likely derived from catabolism of AA, thus
perhaps incurring a penalty on AA supply for tissue protein synthesis in order to balance
N inputs to the OUC. Haüssinger (1990) reviewed the 'metabolic zonation' and
'hepatocyte heterogeneity' in the liver cells. As the blood flows from periportal to
9
perivenous hepatic cells, blood NH3 is preferentially removed and detoxified to urea.
Periportal hepatocytes have a low affinity and high capacity for urea synthesis and the
high activity of glutaminase serves as an 'NH3 amplification system'. On the other hand,
the perivenous hepatocytes have a high capacity for glutamine synthesis which serves as
a scavenging mechanism to limit NH3 entry into the peripheral blood. In the liver, NH3
may also yield aspartate by the coupled reaction of glutamate dehydrogenase and 2-
oxoglutarate transaminase (Cohen and Kuda, 1996). These systems provide metabolic
flexibility for the N supply to OUC when N inputs are imbalanced. Luo et al. (1995)
incubated sheep hepatocytes in 15
NH3 in the absence of AA and found that [15
N2]urea was
the major product, thus confirming that both N atoms in urea can derive from NH3.
Analyzing a range of studies in sheep where NH3 overload was compared to urea-N
output, Lobley and Milano (1997) concluded that NH3 alone contributes approximately
90% of the additional urea-N produced. Thus, enhanced ureagenesis with higher NH3
absorption incurs a small cost in terms of AA catabolism.
The direct regulation of the urea cycle occurs in the very first step catalyzed by
carbamoyl phosphate synthetase I, which in turn is allosterically regulated by N-acetyl
glutamate (NAG). NAG synthesis is catalyzed by NAG synthetase and occurs in the
mitochondria. Regulation of NAG synthetase occurs by hormones and metabolites. Of
particular interest among various regulators is propionate which inhibits NAG synthesis
(Stewart and Walser, 1980). However, in vivo evidence of inhibition of OUC by
propionate in the ruminant liver is lacking. OUC activity has also been shown to be
present in gut tissues (Wu, 1995; Oba et al., 2004).
10
Urea-N recycling in ruminants
Urea synthesized by the liver is released into the blood circulation. Blood urea is
either excreted into urine or it is transferred to the GIT compartments primarily by
diffusion from blood and saliva (Kennedy and Milligan, 1980). Almost all mammalian
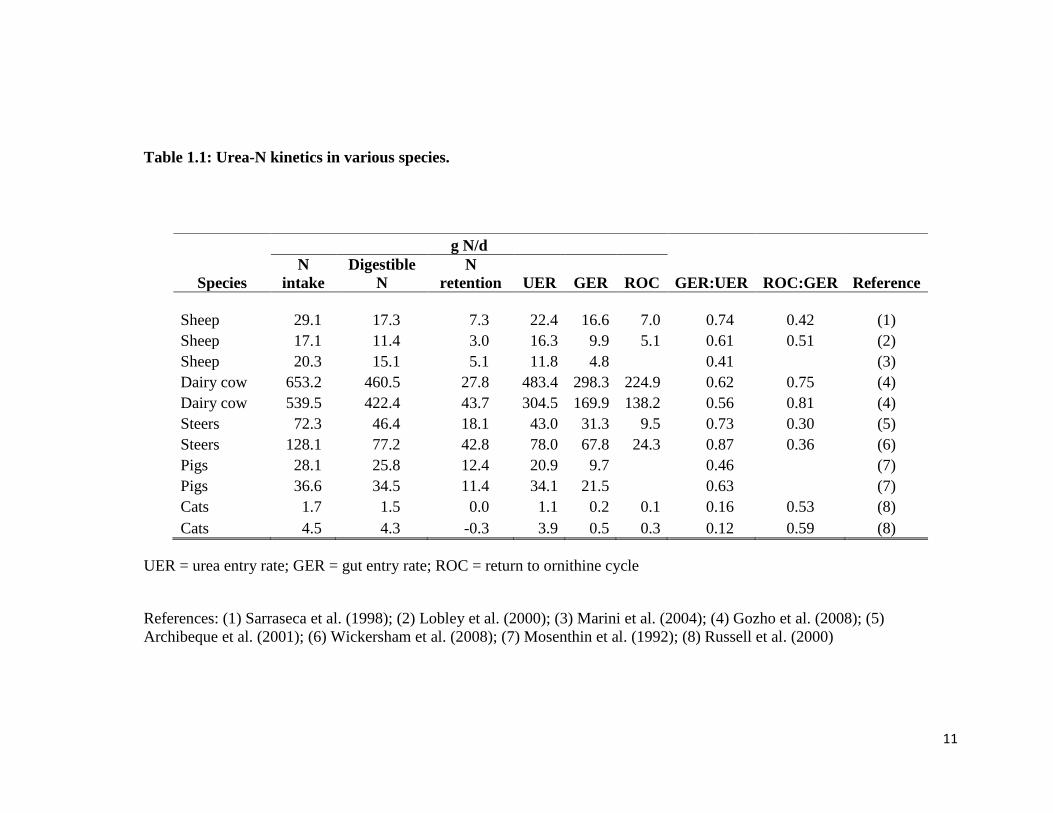
systems are capable of recycling urea to the gut. Table 1.1 summarizes urea-N kinetics in
several mammalian species. It is evident that ruminants have an astounding ability to
recycle urea synthesized by the liver (urea entry rate; UER) towards the gut (gut entry
rate; GER), primarily to the rumen. As urea enters the rumen, it is hydrolyzed to
NH3/NH4+ by the microbial ureases (Rémond et al., 1996). The NH3 generated is either
utilized by gut bacteria for synthesis of protein, or it is re-absorbed into the PDV and
returned to the ornithine-cycle (ROC) (Lapierre and Lobley, 2001). It is clear from the
data in Table 1.1 that UER can exceed digestible N intake. Thus, under these conditions,
urea-N recycling to the rumen for microbial protein synthesis is essential to ensure net N
gain by ruminants. It can also be seen that 16 to 81% of the urea-N entering the gut may
return to the liver, uncaptured by rumen microbes. Compared to monogastric species, the
ability of ruminants to partition a high proportion of urea to the GIT (GER:UER = 30 to
99%) is an evolutionary advantage that allows them to conserve urea in times of N
deficiency in the wild (Reynolds and Kristensen, 2008). This wide range of urea-N
recycling in ruminants suggests opportunities for improvement of N capture in the rumen.
11
Table 1.1: Urea-N kinetics in various species.
UER = urea entry rate; GER = gut entry rate; ROC = return to ornithine cycle
References: (1) Sarraseca et al. (1998); (2) Lobley et al. (2000); (3) Marini et al. (2004); (4) Gozho et al. (2008); (5)
Archibeque et al. (2001); (6) Wickersham et al. (2008); (7) Mosenthin et al. (1992); (8) Russell et al. (2000)
g N/d
Species
N
intake
Digestible
N
N
retention UER GER ROC GER:UER ROC:GER Reference
Sheep 29.1 17.3 7.3 22.4 16.6 7.0 0.74 0.42 (1)
Sheep 17.1 11.4 3.0 16.3 9.9 5.1 0.61 0.51 (2)
Sheep 20.3 15.1 5.1 11.8 4.8 0.41 (3)
Dairy cow 653.2 460.5 27.8 483.4 298.3 224.9 0.62 0.75 (4)
Dairy cow 539.5 422.4 43.7 304.5 169.9 138.2 0.56 0.81 (4)
Steers 72.3 46.4 18.1 43.0 31.3 9.5 0.73 0.30 (5)
Steers 128.1 77.2 42.8 78.0 67.8 24.3 0.87 0.36 (6)
Pigs 28.1 25.8 12.4 20.9 9.7 0.46 (7)
Pigs 36.6 34.5 11.4 34.1 21.5 0.63 (7)
Cats 1.7 1.5 0.0 1.1 0.2 0.1 0.16 0.53 (8)
Cats 4.5 4.3 -0.3 3.9 0.5 0.3 0.12 0.59 (8)
12
Factors affecting urea-N recycling to GIT
Rumen ammonia and plasma urea concentration
Absorption of NH3 across the rumen wall results in a potential loss of N, whereas
urea transfer from plasma to GIT has the potential to be fixed by rumen microbes into
protein. The two main processes across the rumen wall which determine the extent of
urea-N recycling are discussed below.
Rumen NH3 concentration: Rumen NH3 is primarily generated by the metabolism
of nitrogenous compounds (AA, urea, nucleic acids, etc.) by the rumen microorganisms.
Up to 50% of digested N appears as NH3 in the hepatic portal vein which the liver
detoxifies to urea (Huntington and Archibeque, 1999). Ammonia is lipid soluble and thus
is absorbed directly across the rumen wall, whereas hydrophilic NH4+
ions require
channels or carriers. The pka of NH3 is 9, and according to the Henderson-Hasselbach
equation, at pH below 7 (i.e. typical rumen pH) ≥99% of rumen NH3 will be in the
ionized (NH4+) form. Therefore, rumen pH is the primary determinant of N exchanges
from the rumen to plasma (Abdoun et al., 2010). Absorption of NH3 across the rumen is
linearly related to rumen NH3 concentration (Abdoun et al., 2005). Dietary protein
characteristics, in particular rumen degradable (RDP) or undegradable (RUP) protein,
also influences the rate of NH3 generation in and absorption from the rumen. Rémond et
al. (2009) fed a raw pea (high RDP) and extruded pea (low RDP) diet to sheep and
observed that the low RDP diet led to a 23% reduction in net absorption of NH3 by the
PDV. Other than level and quality of CP intake, availability of energy substrates in the
rumen influence rumen NH3 concentration. Chamberlain et al. (1985) found that
13
carbohydrate (glucose, starch and barley) supplementation of a grass-silage diet fed to
sheep reduced rumen NH3 concentration and this was also associated with decrease in
rumen pH.
Plasma urea concentration: Transfer of urea from plasma to the rumen is highly
dependent upon plasma urea-N concentration. Sunny et al. (2007) demonstrated by intra-
venous infusion of urea in sheep fed a low protein diet that urea transfer to the GIT
increased in relationship with increases in plasma urea. However, 44-67% of the urea-N
entering the rumen returned to the liver as absorbed NH3 across the levels of urea infused.
These results were consistent with Lapierre and Lobley (2001), who suggested that the
positive correlation between plasma urea-N and GER is valid for concentrations below 6
mM for sheep and 4 mM for cattle.
Urea transporters
Several studies have reported the presence of facilitative urea transporters (UT) in
ruminants but their role in regulating urea transfer to the GIT is not completely
understood. The UT derive from two major gene variants, i.e. UT-A and UT-B (Stewart
et al., 2005). The presence of UT in the sheep rumen epithelia was first reported by
Ritzhaupt et al. (1998). Stewart et al. (2005) characterized the UT-B gene in the bovine
rumen tissues and showed that it was expressed in the stratum basale, spinosum and
granulosum (inner cell layers) but was absent in the stratum corneum (outer cell layer).
Despite the known existence of UT in rumen epithelia, there still remains insufficient
evidence of the role of these UT and the nutritional factors that regulate their expression
and function. For example, Marini et al. (2004) and Røjen et al. (2011) found no change
14
in UT protein abundance in rumen tissues of lambs fed increasing levels of dietary
protein. Similarly, UT-B mRNA expression was not responsive to changes in dietary
RDP (Ludden et al., 2009). Doranalli et al. (2011) observed higher N retention in lambs
fed oscillating dietary crude protein (CP) as compared to a medium CP diet. However,
there were no differences in phloretin (UT-B inhibitor) sensitive urea flux across rumen
tissues employing Ussing chambers. By contrast, Simmons et al. (2009) observed higher
UT-B mRNA expression in rumen tissues of steers fed a high concentrate diet compared
to steers fed a silage-based diet. However, urea kinetics were not performed and so it
remains unclear whether these perturbations in UT-B mRNA expression resulted in
greater transfer of plasma urea into the rumen.
Abdoun et al. (2010) conducted an in vitro study with sheep rumen epithelium
using Ussing chambers. Compared to control tissue, phloretin treatment inhibited urea
flux by 50%, demonstrating that urea transport occurs by both diffusion as well as
transcellular (UT mediated) mechanisms. Urea transport was found to be pH dependent,
with maximum effect at pH 6.2 (bell-shaped curve). Moreover, the effect of pH was only
found in the presence of VFA or CO2. These authors suggested that higher urea transport
observed postprandially may be due to acute pH changes in the presence of VFA and
CO2. This may also explain the results obtained by Simmons et al. (2009) where the
rumen pH of concentrate-fed steers was 6.15 compared to 6.99 in silage fed steers.
Recently, the role of aquaporins in facilitating urea flux across the ruminal wall
has come to light. In Ussing’s chamber studies, Walpole et. al. (2013) found that,
phloretin-insensitive urea flux (i.e. urea flux on inhibiting UT) across rumen epithelia
from calves fed a higher grain diet was elevated compared to a hay based diet. This was
15
accompanied by higher gene expression of aquaporin. Thus, the role of rumen UT and
aquaporins in facilitating urea transport still remains unresolved.
Dietary protein
In general, urea transfer to the GIT increases in parallel with dietary N level,
whereas the proportion of urea synthesis transferred to the GIT (GER:UER) decreases. In
steers fed increasing dietary N, Archibeque et al. (2001) found that the proportion of N
flux absorbed across the rumen was similar, although the efficiency of utilization was
greater for lower N intake. The authors found an 11.4% decrease in GER:UER and no
change in ROC:GER in steers with high levels of N intake. Marini et al. (2004) observed
a quadratic increase in N retention in response to increasing dietary protein intake in
lambs, whereas UER and UUE increased linearly.
Fecal N derived from urea transfer to the GIT is fairly constant and thus the main
differences occur in urinary N excretion and transfer of urea-N into the rumen. For
example, in heifers, the proportion of urea excreted in the urine (UUE:UER) increased
from 15 to 71% as dietary CP level increased from 9.7 to 27.2% (Marini and Van
Amburgh, 2003).
Dietary protein feeding regime has also been shown to influence N retention in
ruminants. It has been demonstrated that feeding oscillating CP diets (i.e. alternating
between low and high CP every two days) increased N retention in sheep (Doranalli et
al., 2011). The form of protein in the feed (RDP or RUP) also determines N utilization as
a result of rates of NH3 production in the rumen (Kennedy and Milligan, 1980; Lapierre
and Lobley, 2001). Rémond et al. (2009) showed that feeding a raw pea (high RDP) diet
16
to sheep led to greater losses of NH3 from the rumen compared to feeding an extruded
pea (lower RDP) diet. Thus, the amount, frequency and form of dietary CP influences N
utilization in ruminants.
Rumen fermentation
About 50 to 80% of the protein flow to the small intestines is derived from
microbial protein synthesis in the rumen (Storm and Orskov, 1983). The primary factor
which affects rumen fermentation is the fermentability of the diet. Highly fermentable
diets increase the amount of urea-N recycled to the rumen (Kennedy and Milligan, 1980;
Huntington, 1989) and increase the capture of rumen NH3 by microbes (Stern and
Hoover, 1979), thus leading to lower urinary N losses and hence, greater N retention
(Fluharty et al., 1999). Urea synthesis and urinary urea excretion was lower in steers fed
starch supplemented gamagrass or orchardgrass based diets (Huntington et al., 2009). In
steers, dietary sucrose supplementation has also been shown to enhance the rate of urea
transfer to the rumen (Kennedy, 1980). Gozho et al. (2008) studied the effect of barley
grain processing on urea kinetics in dairy cows. Rolled barley (highly fermentable)
increased GER as compared to pelleted barley (less fermentable), however, the increase
in urea-N recycling did not result in greater capture of N in the rumen.
The effect of highly fermentable carbohydrates on urea-N recycling may be due to
the changes in rumen VFA profiles. Higher rumen propionate resulting from feeding
highly fermentable diets is associated with greater N retention (Abdul–Razzaq and
Bickerstaffe, 1989; Obara and Dellow, 1994). On infusion of propionate into the
abomasum (i.e. post-rumen) of sheep, Kim et al. (1999) observed an increase in urea
17
transfer to the rumen. Even when propionate is supplemented to the diet of steers, N
retention is increased due to a combination of a reduction in urinary urea excretion and
improved dietary N digestibility (Baldwin et al., 2012).
Moloney (1998) observed an interaction between propionate supplementation and
feed composition (starch vs. fiber) on N retention in sheep. These authors found that,
although higher N retention was observed when feeding a starch-based ration
supplemented with propionate, there was no improvement in N retention when a fiber-
based ration was supplemented with propionate. In terms of responses to butyrate, Norton
et al. (1982) observed an increase in urea recycled to the rumen when sodium butyrate
was infused into the rumen, however, N retention was not improved. Thus, whether
individual rumen VFA regulate N utilization and urea-N recycling or other factors are
more influential remains to be determined.
Production of rumen VFA
In the rumen, VFA are produced by microbial fermentation of energy substrates
such as complex carbohydrates (cellulose and hemicelluloses) and starches and pectin
derived from plant sources. Although VFA are byproducts of anaerobic microbial
fermentation in the rumen, they serve as major energy sources for tissue metabolism.
Thus, rumen VFA concentrations depend not only on the macronutrient composition of
the feed, but relatedly on the microbial populations and feed retention time in the rumen.
Microbial growth is promoted by starch and sugars that are readily fermentable,
compared to complex carbohydrates (Stern and Hoover, 1979).
18
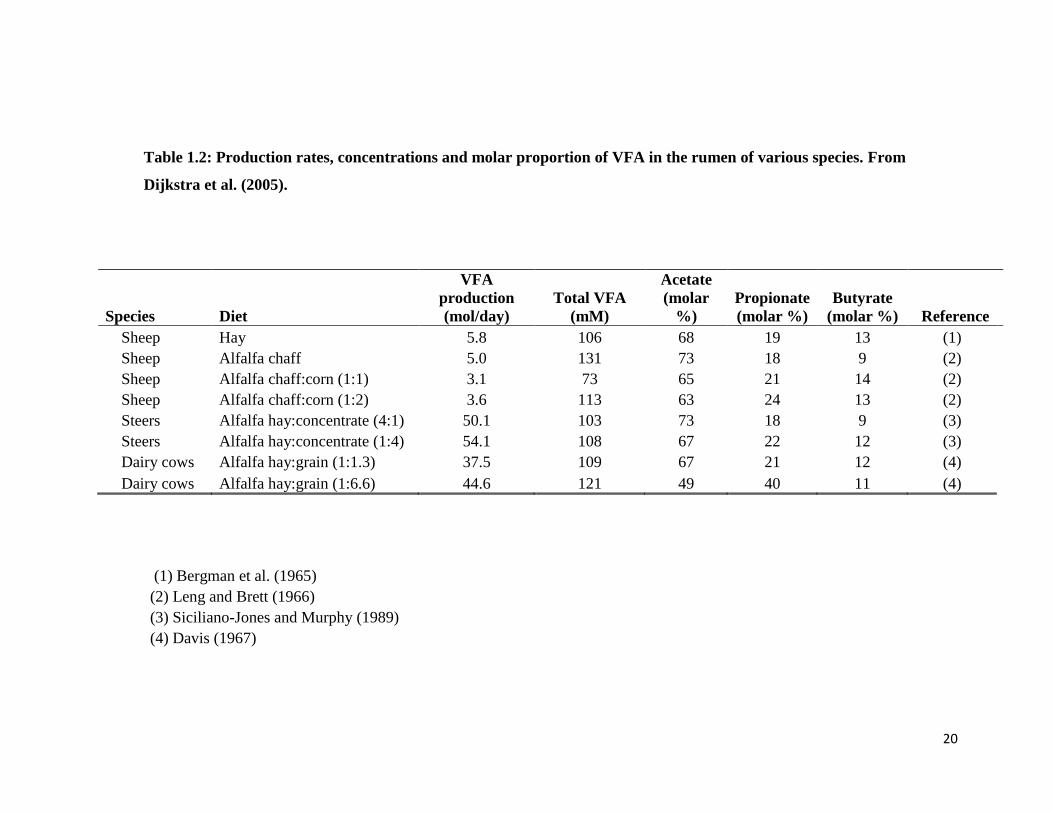
Typical rumen concentrations of VFA vary between 60-150 mM (Bergman,
1990). The molar proportions (mol / 100 mol total VFA) of acetate, propionate and
butyrate are typically in the range of 75:15:10 to 40:40:20, depending on the type of diet.
Concentrate feeds (cereal grains), which have a high starch content, are rapidly fermented
and favor the synthesis of propionate. By contrast, fibrous feeds (forages) lead to greater
rumen acetate concentrations. Table 1.2 compares the effect of various diets containing
different concentrate to forage ratios on total rumen VFA concentrations and the molar
proportions of acetate, propionate and butyrate. Clearly, including more concentrates in
the diet increases the production of total VFA. Moreover, the proportion of rumen
propionate and butyrate increase with concentrate diets, leading to changes in rumen
VFA profiles.
Metabolic fates of VFA
The VFA produced in the rumen are rapidly absorbed into the blood across the
rumen epithelium. Bergman et al. (1965) found that acetate and butyrate are inter-
convertible in the rumen by bacteria. Using isotope dilution studies and infusion of radio
isotopes of acetate, propionate and butyrate, up to 61% of butyrate carbon and 20% of
acetate carbon was shown to arise from acetate and butyrate respectively. Nonetheless,
inter-conversion of propionate to acetate or butyrate was found to be negligible. Different
VFA, however, have different metabolic fates.
Acetate accounts for 40 to 75% of the total VFA produced in the rumen (Table
1.2), and serves as the primary precursor for lipogenesis and energy generation in the
body. In lactating ruminants, as much as 25% of fatty acid synthesis in the mammary
19
glands can be attributed to acetate (King et al., 1985). Annison et al. (1963) studied the
metabolism of VFA by infusing radio-isotopes of acetate, propionate and butyrate in the
portal vein of sheep. By measuring various blood metabolites they showed that
propionate carbons were readily incorporated into glucose, whereas acetate and butyrate
did not contribute to net glucose synthesis. Rather, butyrate is mostly converted to β-
hydroxybutyrate by the rumen epithelium (Emmanuel, 1980) with butyrate primarily
used for energy generation and as a precursor for fatty acid synthesis. Upto ~90% of
propionate absorbed across the rumen reaches the liver (Kristensen and Harmon, 2004).
The remainder is metabolized by the rumen epithelia, primarily to lactate and CO2. Since
negligible amounts of glucose are absorbed from the small intestines, propionate serves
as the most important gluconeogenic precursor in ruminants. The liver metabolizes 80 to
100% of propionate and butyrate absorbed into the PDV, while acetate is largely utilized
by peripheral (adipose and muscle) tissues (Bergman and Wolff, 1971).
20
Table 1.2: Production rates, concentrations and molar proportion of VFA in the rumen of various species. From
Dijkstra et al. (2005).
(1) Bergman et al. (1965)
(2) Leng and Brett (1966)
(3) Siciliano-Jones and Murphy (1989)
(4) Davis (1967)
Species Diet
VFA
production
(mol/day)
Total VFA
(mM)
Acetate
(molar
%)
Propionate
(molar %)
Butyrate
(molar %) Reference
Sheep Hay 5.8 106 68 19 13 (1)
Sheep Alfalfa chaff 5.0 131 73 18 9 (2)
Sheep Alfalfa chaff:corn (1:1) 3.1 73 65 21 14 (2)
Sheep Alfalfa chaff:corn (1:2) 3.6 113 63 24 13 (2)
Steers Alfalfa hay:concentrate (4:1) 50.1 103 73 18 9 (3)
Steers Alfalfa hay:concentrate (1:4) 54.1 108 67 22 12 (3)
Dairy cows Alfalfa hay:grain (1:1.3) 37.5 109 67 21 12 (4)
Dairy cows Alfalfa hay:grain (1:6.6) 44.6 121 49 40 11 (4)
21
Techniques for measuring urea kinetics
The two techniques that are most often used to measure urea kinetics (i.e. rate of
urea-N movement across various organs) are the arterio-venous (AV) difference and the
labeled urea methods. Using the AV method, net mass transfer of urea across the
intestines (MDV), whole gut (PDV) and liver (splanchnic) are directly measured
(Huntington, 1989; Rémond et al., 1993; Seal and Parker, 1996). Although there are
reports where urea fluxes have been measured under steady-state and non-steady state
feeding conditions, the potential errors can be large due to the challenges of accurately
measuring AV differencs of urea and matching the AV differences with accurate
determination of blood flow. Moreover, this procedure is highly invasive and requires
major surgical procedures to introduce catheters, not to mention the challenges of
maintaining catheter patency.
In the past two decades, the doubly labeled [15
N2]urea method developed by
Jackson et al. (1984) has gained much popularity. To date, this is the least invasive
method to determine urea kinetics, requiring only an intravenous dose or continuous
infusion of labeled urea. This approach allows for measurements of urea production (i.e.
synthesis, UER) employing standard isotope dilution principles. Urea-N transfer to the
gut (GER) and return of urea-N from gut to the ornithine cycle (ROC) can be estimated
from the relative enrichment of urea isotopomers (M1 vs M2) in the urine. This model
was adapted for use in ruminants by Sarraseca et al. (1998) and has been previously
employed in our lab (Sunny et al., 2007). Figure 1.1 illustrates the [15
N2]urea model.
22
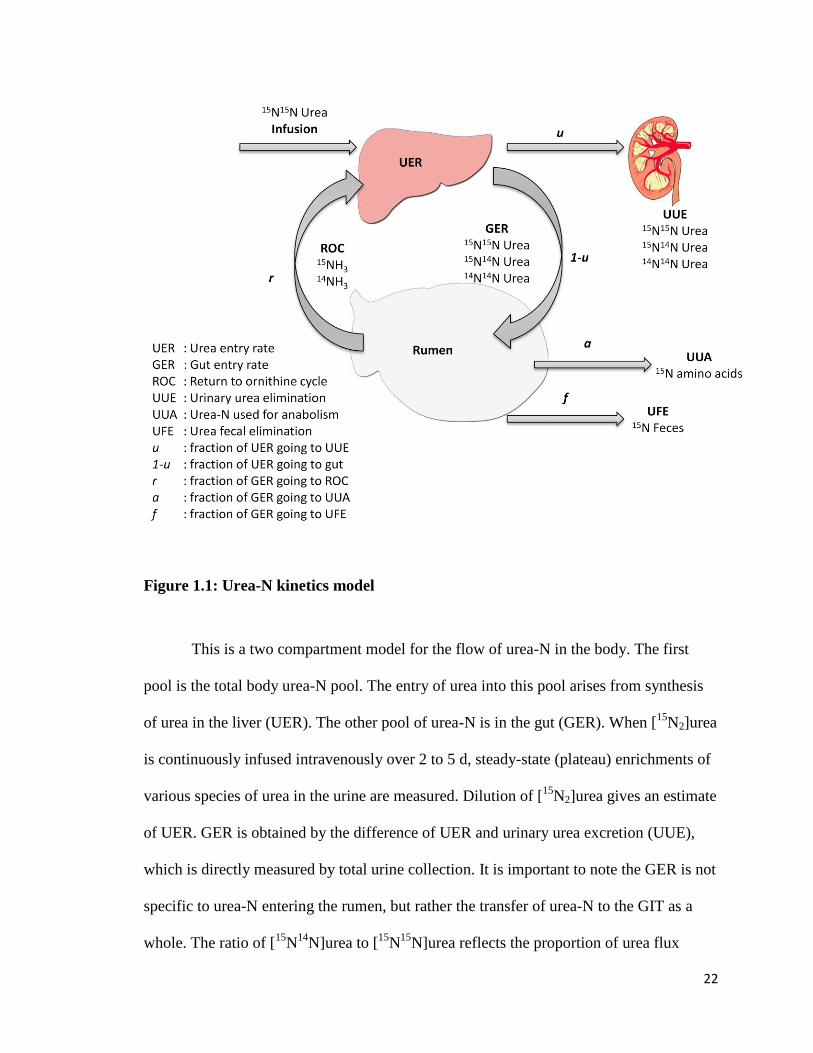
Figure 1.1: Urea-N kinetics model
This is a two compartment model for the flow of urea-N in the body. The first
pool is the total body urea-N pool. The entry of urea into this pool arises from synthesis
of urea in the liver (UER). The other pool of urea-N is in the gut (GER). When [15
N2]urea
is continuously infused intravenously over 2 to 5 d, steady-state (plateau) enrichments of
various species of urea in the urine are measured. Dilution of [15
N2]urea gives an estimate
of UER. GER is obtained by the difference of UER and urinary urea excretion (UUE),
which is directly measured by total urine collection. It is important to note the GER is not
specific to urea-N entering the rumen, but rather the transfer of urea-N to the GIT as a
whole. The ratio of [15
N14
N]urea to [15
N15
N]urea reflects the proportion of urea flux
23
returned to the ornithine cycle (ROC) following bacterial hydrolysis to 15
NH3.The basic
assumption in this model is that the probability of forming [15
N2]urea in the liver, i.e.
simultaneous incorporation of two molecules of 15
NH3 into urea, is negligible provided
the infusion of [15
N2]urea does not exceed 5% of UER. This model avoids overestimation
of ROC using a correction factor for multiple entries of [15
N14
N]urea from blood into the
gut, based on a geometric decline in return of the recycled 15
N label. Utilization of 15
NH3
for microbial protein synthesis, and subsequent catabolism of the labeled AA, also
contributes to the appearance of [15
N14
N]urea, however, this contribution is very small
and is assumed to be negligible. Urea-N excreted in feces (UFE) is directly measured
from fecal 15
N output and, thus, anabolic use (UUA, i.e. microbial use) is calculated by
difference. Because UUA is estimated by differences, it’s accuracy is subject to
cumulative errors. Moreover, steady-state conditions are required and this requires the
constant infusion of [15
N2]urea for at least 2 d to attain plateau enrichments of the
[15
N]urea isotopomers and of fecal 15
N.. However, the major advantage of employing the
[15
N2]urea method lies in its ability to estimate urea-N returning from the gut, and thus
allow for the estimation of urea-N utilized by gut microbes.
Summary
It is clear from the literature that urea-N recycling and N utilization in ruminants
is a complex process. Among the dietary factors, CP and energy supply are most
prominent in regulating N utilization. The efficiency of N utilization and recycling of
urea to the gut is conversely variable with higher N intake, and there is also a huge
variation seen with the quality (rumen degradability) of CP. Other than level and quality
of CP intake, energy supply and fermentability of the diet also play a role in N utilization.
24
There are several reports that suggest that the higher concentration of rumen propionate
and (or) butyrate, resulting from highly fermentable diets, influence the regulation of
urea-N recycling. However, the role of individual VFA in regulating urea-N kinetics and
increased N utilization is not well understood. Thus, based on available literature and
results from previous experiments in steers (Baldwin et al., 2012), we hypothesized that
higher rumen propionate and(or) butyrate would improve N retention by increasing the
amount of urea-N recycled to the rumen.
25
CHAPTER 2: EFFECT OF RUMINAL STARCH INFUSION ON
PERTURBATION OF RUMEN VOLATILE FATTY ACIDS,
UREA NITROGEN KINETICS AND GLUCONEOGENESIS IN
GROWING SHEEP
Abstract
Starch supplementation is known to increase N retention in growing ruminants,
possibly through increasing urea-N recycling to the rumen. This study was conducted to
evaluate the perturbations in rumen volatile fatty acid (VFA) profiles as a result of rumen
starch infusion and the association of these perturbations to changes in urea-N kinetics
and gluconeogenesis in growing sheep. Wether sheep (n=4, 36.9 ± 3.45 kg BW), fitted
with a rumen cannula, were fed to 1.5 × maintenance energy intake a pelleted
concentrate-type ration (165 g CP/kg, 9.3 MJ ME/kg) and infused into the rumen with
either water (control) or starch (gelatinized; 100 g/d) for 9-d periods in a balanced
crossover design. [15
N2]Urea was continuously infused i.v. for the last 5 d of each period,
and total urine collected by vacuum and feces by a harness bag. Over the last 12 h,
[13
C6]glucose was continuously infused i.v. and hourly blood samples collected during
the last 5 h. All animals were in positive N balance (~4.2 g N/d). Rumen VFA
concentrations were not affected by starch infusion. Starch infusion reduced (P < 0.05) N
digestibility (~5%) and tended (P < 0.1) to increase fecal N output (5.6 vs 6.4 g N/d),
however, there was no effect on N retention or urinary N excretion. In addition, starch
infusion did not alter urea-N entry rate (synthesis) or urea-N recycling, however starch
infusion did increase (P < 0.05) urea-N excreted in feces (+0.9 g urea-N/d) and tended (P
26
= 0.1) to reduce urinary urea-N excretion (6.6 vs 5.2 g urea-N/d). Glucose entry (128 vs
177 g/d), gluconeogenesis (98 vs 132 g/d), and Cori cycling (30 vs 45 g/d) were
increased (P < 0.05) by starch infusion. The results suggest that under the feeding
conditions of this study, starch infusion shifted the elimination of urea-N from urine to
feces but this did not lead to an increase in N retention.
Introduction
Highly fermentable (high starch) diets increase the amount of urea-N recycled to
the rumen (Kennedy and Milligan, 1980; Huntington, 1989) and increase the capture of
rumen ammonia (NH3) by microbes (Stern and Hoover, 1979), thus leading to lower
urinary N losses and hence, greater N retention (Fluharty et al., 1999). Increasing the
level of rumen degradable starch results in higher production of rumen volatile fatty acids
(VFA), which are responsible for meeting ~70-80% of the animal’s energy needs
(Bergman and Wolff, 1971). Starch supplementation of forage-type diets has also been
shown to promote microbial growth (Stern and Hoover, 1979). Huntington et al. (2009)
found urea synthesis and urinary urea excretion to be reduced in steers fed gamagrass or
orchardgrass diets that had been supplemented with starch. And, dietary sucrose
supplementation has been shown to enhance the rate of urea transfer to the rumen of
steers (Kennedy, 1980).
There are several reports that suggest that the higher concentration of rumen
propionate and (or) butyrate, resulting from highly fermentable diets, influence the
regulation of urea-N kinetics (Kim et al., 1999; Simmons et al., 2009). For example,
Simmons et al. (2009) reported greater rumen epithelial expression of the urea
27
transporter, UT-B, in steers fed a concentrate compared to a mostly forage-based diet.
The higher rumen butyrate concentrations in steers fed the high concentrate diet led these
authors to propose that butyrate might be involved in regulation of UT-B expression, and
thus urea-N recycling to the rumen. By contrast, Kim et al. (1999) had observed that post-
ruminal (abomasal) infusion of propionate in growing sheep increased urea synthesis, and
transfer and capture of urea-N in the rumen, thus leading to increased N retention. To that
end, it is clear that the role of individual VFA in regulating urea-N kinetics and increased
N retention is not well understood.
The aim of this study was to determine, by infusion of starch into the rumen of
growing sheep, the profile of rumen VFA that is associated with alterations in urea-N
transfer and capture in the rumen, as well as associations with changes in
gluconeogenesis.
Materials and Methods
All animal procedures were approved by the Institutional Animal Care and Use
Committee at the University of Maryland (protocol number R-11-33).
Animals, diet and treatments
Four Polypay × Dorsett wether lambs (36.9 ± 3.45 kg BW), fitted with a rumen
cannula, were fed a standard pelleted diet (Table 2.1) to 1.5× maintenance energy (ME)
requirements every 2 h via automatic feeder. Sheep were placed into individual metabolic
crates and assigned to receive rumen infusions of either starch (100 g/d) or water
(control) in a balanced cross-over design with each infusion period lasting 9 d. Starch
28
infusion rate was calculated to supply 15% additional ME intake (based on gross energy
of starch). The starch infusate was prepared by dissolving 100 g of starch in 1 L water,
followed by autoclaving to gelatinize the starch. Each infusion period was separated by 5
d during which sheep were placed into individual floor pens for exercise and to allow a
period of treatment washout.
Tracer infusion
Temporary jugular vein catheters were inserted at least 2 d prior to initiating
isotope infusions. Over the last 4 days of each treatment period a sterile solution
containing [15
N2]urea (99 atom percent 15
N, Cambridge Isotope Laboratories Inc.,
Andover, MA) was continuously infused (0.6 g/d) through a jugular vein catheter. It has
been shown that this length of [15
N2]urea infusion results in the attainment of isotopic
plateau in urinary [15
N14
N] and [15
N15
N]urea enrichment and that this infusion rate
increases the urinary [15
N15
N]urea enrichment to 1.5-2.5 atoms percent excess (APE)
(Sunny et al., 2007). Glucose kinetics were measured by infusion of [13
C6]glucose. On
the last day of each experimental period, an i.v. bolus (priming) dose (0.45 g) of
[13
C6]glucose was administered followed by continuous infusion (0.15 g/h) for 9 h.
Sampling
During the last 5 d of each treatment period, sheep were fitted with a harness for
total collection of feces (by bag) and urine (by suction), which were weighed and
recorded. A slight vacuum was used to collect urine directly into a sealed container
placed on a stir plate and containing sufficient HCl to reduce urine pH to < 3 to prevent
bacterial hydrolysis of urea and ammonia volatilization. Well-mixed sub-samples from
29
each collection (100 g feces and 40 g urine) were stored at -20oC for later analysis. Over
the last 6 h of tracer infusion, urine samples were also collected at 2 h intervals and later
analyzed to verify that plateau of [15
N2]urea enrichment in urine had been attained.
Hourly blood samples were collected during the last 5 h. Plasma was separated by
centrifugation (1,000 × g for 15 min at 4oC) and stored at -20
oC for later analysis. At the
end of each experimental period, following collection of the last sample, sheep were
removed from crates and within 10 mins the rumen was completely evacuated by
vacuum. The rumen fluid was mixed well and a representative sample (50 mL) strained
through two layers of cheese cloth. The strained rumen fluid was immediately
centrifuged (1,000 × g for 10 min at 4oC) and the pH of the supernatant recorded using a
pH indicator strip (VWR International, West Chester, PA). For determination of VFA
concentration, to a known amount (1 g) of rumen fluid was added a known weight (0.25
g) of an internal standard mixture (260 mM [1-13
C]acetate, 80 mM [methyl-
D3]propionate and 40 mM [1-13
C]butyrate), and the samples stored at -20o C for later
analysis.
30
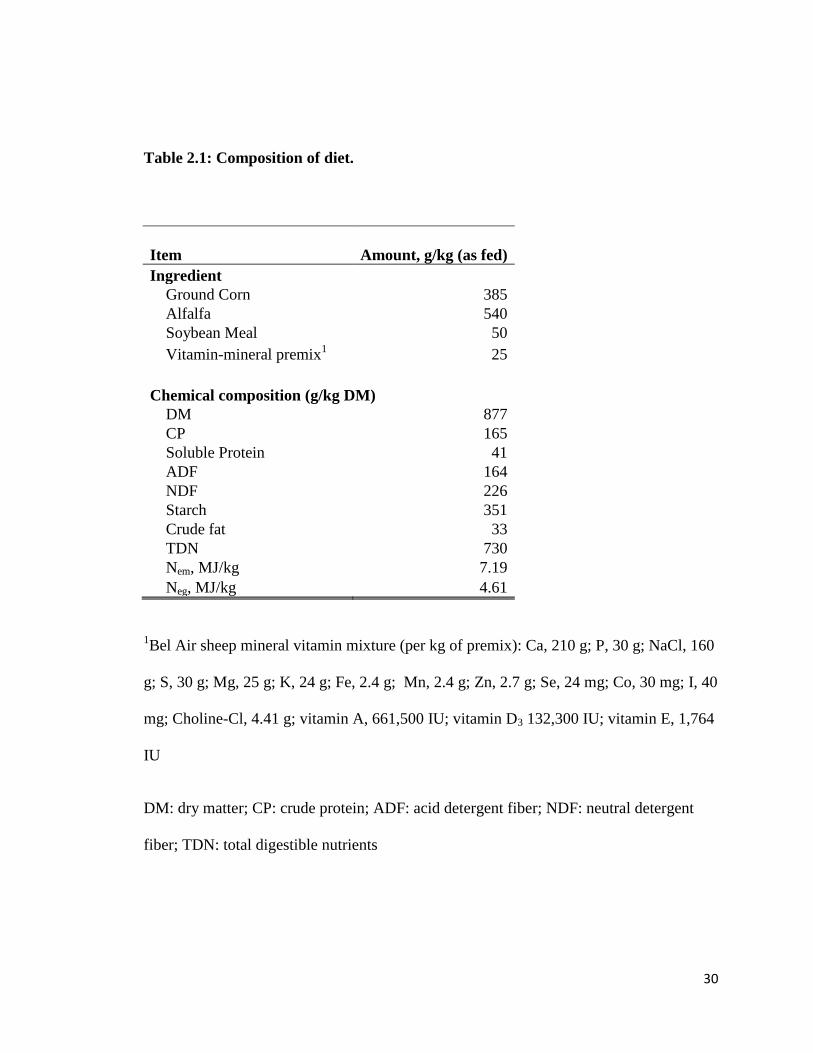
Table 2.1: Composition of diet.
Item Amount, g/kg (as fed)
Ingredient
Ground Corn 385
Alfalfa 540
Soybean Meal 50
Vitamin-mineral premix1 25
Chemical composition (g/kg DM)
DM 877
CP 165
Soluble Protein 41
ADF 164
NDF 226
Starch 351
Crude fat 33
TDN 730
Nem, MJ/kg 7.19
Neg, MJ/kg 4.61
1Bel Air sheep mineral vitamin mixture (per kg of premix): Ca, 210 g; P, 30 g; NaCl, 160
g; S, 30 g; Mg, 25 g; K, 24 g; Fe, 2.4 g; Mn, 2.4 g; Zn, 2.7 g; Se, 24 mg; Co, 30 mg; I, 40
mg; Choline-Cl, 4.41 g; vitamin A, 661,500 IU; vitamin D3 132,300 IU; vitamin E, 1,764
IU
DM: dry matter; CP: crude protein; ADF: acid detergent fiber; NDF: neutral detergent
fiber; TDN: total digestible nutrients
31
Urea concentration and enrichment
The concentration and enrichment of plasma and urinary urea were determined by
gas chromatography-mass spectrometry (GC-MS, Agilent 6890 series gas
chromatography system coupled to an Agilent 5973N mass selective detector; Agilent;
Palo Alto, CA) under electron ionization (EI) mode. For determination of urinary urea
concentration, to a known weight (0.25 g) of an internal standard solution containing
[13
C, 15
N2]urea (5 mg/g) was added an equal known weight of urine. For plasma urea
concentration, a known amount (0.5 g) of internal standard containing [13
C, 15
N2]urea
(0.26 mg/g) was added to an equal known weight of plasma. Plasma and urine samples
were acidified by adding an equal volume of 15% sulfosalicylic acid or 10%
trichloroacetic acid (w/v), respectively, and centrifuged for 10 min at 10,000 × g to
precipitate proteins and other debris. Urea was isolated from acidified samples by
application to 0.5 g of cation exchange resin (AG 50W-X8 resin, 100-200 mesh, Bio-Rad
Laboratories, Hercules, CA). The resin was washed with 2 × 2 mL of water and urea
eluted with 2 mL of ammonium hydroxide plus 1 mL of double distilled water. An
aliquot (100 to 200 μl) of the elute was dried under N2 gas and the tertiary-
butyldimethylsilyl derivative of urea was prepared by adding 50 μl each of acetonitrile
(Pierce chemicals , Rockford, IL) and N-methyl-N-t-butyl-dimethylsilyl-
trifluroacetamide (MTBSTFA, Pierce chemicals , Rockford, IL) followed by heating at
90oC for 20 minutes (El-Kadi et al., 2006). Derivatized urea samples were separated on a
fused silica capillary column (HP-50; 30 m × 0.25 mm × 1 µm Hewlett-Packard, Palo
Alto, CA) prior to MS under EI conditions. Ions of mass-to-charge (m/z) 231.2
(unlabeled; M0), 232.2 (singly labeled; [M+1]), 233.2 (doubly labeled; [M+2]), and
32
234.2 (internal standard; [M+3]) were monitored. The GC inlet was set at 250 o
C and the
GC conditions were: initial temperature of 150oC followed by 15
oC/min to 250
oC. Urea
concentration in the samples was calculated by isotope dilution (Calder et al., 1999)
based on the ratios of [M+3]:[M0]urea after correction for background (natural
abundance) and spillover effects of the enriched [M+2]urea.
Total urinary and fecal N, and fecal 15
N
Total urinary and fecal N were measured using an automated N analyzer (CN-
2000, Leco, St. Joseph, MI). Fecal samples were dried in a forced-air drying oven at 60oC
for 5 d. Dried samples were pulverized in a liquid nitrogen freezer mill (Freezer-Mill
6850, Spex CertiPrep Inc., Metuchen, NJ) and samples submitted to the stable isotope
facility at the University of California-Davis (CA) for 15
N analysis by isotope-ratio mass
spectrometry.
Rumen fluid VFA concentration
Samples were thawed and acidified by adding 250 µL of 2 M HCl, and
centrifuged for 15 min at 13,000 × g to precipitate solids. The supernatant was filtered
through a 0.2 µm filter (Nalgene, Rochester, NY), and anhydrous ether (0.5 mL) added to
extract VFA. An aliquot (200 μl) of extracted VFA was converted to the tert-
butyldimethylsilyl derivative by adding 50 µL MTBSTFA followed by heating at 80oC
for 20 min (Duncan et al., 2004). After samples had cooled, 50 µL of methanol was
added to react with the surplus MTBSTFA. Derivatized samples were injected onto the
GC column (fused silica capillary column, HP-5; 30 m × 0.25 mm × 1 µm Hewlett-
Packard) with the GC inlet set at 250C and the following columns conditions: initial
33
temperature of 60oC held for 3 min followed by 10
oC/min to 210
oC for 4 min. Ions of m/z
117 and 118 for acetate, 131 and 134 for propionate and 145 and 146 for butyrate were
monitored. VFA concentrations were calculated by isotope dilution (Calder et al., 1999).
Glucose concentration and enrichment
For determination of plasma glucose concentration, a known amount (0.5 g) of an
internal standard containing [13
C6; 1, 2, 3, 4, 5, 6, 6-2H7]glucose (4 mM in 0.1 M HCl)
was added to an equal known weight of plasma. The samples were acidified with an
equal volume of 15% sulfosalicylic acid (w/v) and centrifuged for 10 min at 10,000 × g
to precipitate proteins. The supernatant was applied to 0.5 g cation-exchange resin (AG
50W-X8 resin, 100-200 mesh) and the glucose containing fraction eluted with 2 mL
distilled water, frozen and lyophilized to dryness. Glucose was converted to the di-O-
isopropylidene derivative for GC-MS analysis (Hachey et al., 1999). Briefly, to the freeze
dried sample was added 1 mL of freshly prepared 0.38 M sulfuric acid in acetone. The
solution was incubated for 1 h at room temperature after which it was neutralized by the
addition of 3 mL of 0.44 M sodium carbonate. After the addition of 3 mL of saturated
NaCl, the glucose derivative was back extracted with 3 mL ethyl acetate. The upper ethyl
acetate phase was dried under N2 gas. Next, the di-O-isopropylidene derivative was
acetylated by the addition of 50 µL each of ethyl acetate and acetic anhydride followed
by heating for 30 min at 60oC. The glucose derivative was separated on a fused silica
capillary column (HP-5; 30 m × 0.25 mm × 1 µm, Hewlett-Packard) prior to MS under EI
conditions. The GC inlet was set at 250C and the following columns conditions: initial
temperature of 80oC followed by 10
oC/min to 260
oC. Ions of m/z 287 to 293 (glucose
isotopomers [M0] to [M+6]) and 300 (internal standard; [M+13]) were monitored.
34
Glucose concentration in samples was calculated by isotope dilution (Calder et al., 1999)
based on the ratio of [M+13]:[M0]glucose after correction for background (natural
abundance), and corrected for the concentration of [M+1]-[M+6]glucose isotopomers.
The enrichments of plasma glucose were corrected for natural abundance using a matrix
approach (Fernandez et al., 1996).
Calculations
Urea-N kinetics: Urea-N kinetic calculations were based on Lobley et al. (2000).
Whole body urea synthesis (urea entry rate; UER) was estimated from the dilution of the
infused [15
N2]urea tracer. A portion of UER is excreted into urine (UUE), whereas the
remainder enters the gut tissues (GER). Urea entering the gut has three different fates: 1)
excretion in feces (UFE), 2) hydrolysis by rumen microbes with absorption of NH3 and
return to the ornithine-urea cycle (ROC), and 3) utilization by gut microbes for protein
synthesis (anabolic use, UUA). UFE and ROC are estimated directly from excretion of
fecal 15
N and based on the appearance of urinary [15
N14
N]urea, respectively. UUA is
estimated by the difference between GER and UFE+ROC. An important assumption in
this model is that all the doubly labeled urea in urine is derived from the infused tracer.
Calculations for urea N kinetics are shown in Appendix 3.
Gluconeogenesis:Gluconeogenesis and glucose recycling (Cori cycling) were
estimated using corrected mass isotopomer distribution (MID) enrichments according to a
method described by Tayek and Katz (1997), where:
Glucose entry (g/d) = (([13
C6]glucose tracer purity (%) / [M+6]glucose) – 1) ×
[13
C6]glucose infusion rate (g/d), and
35
Cori cycling (g/d) = ([M+1] + [M+2] + [M+3]) / ([M+1] + [M+2] + [M+3] +
[M+6]) × glucose entry (g/d)
Gluconeogenesis, i.e. gluconeogenesis from non-glucose sources, was calculated by
difference as,
Gluconeogenesis (g/d) = Glucose entry - Cori cycling
Glucose entry represents the appearance in blood of glucose derived from
absorption and from synthesis in the body. However, because dietary starch is extensively
fermented by rumen microbes and the fact that nearly all glucose absorbed across the
intestines is metabolized, it is safe to assume that net glucose absorption across the gut is
negligible (El-Kadi et al., 2006). Thus, glucose entry largely reflects Cori cycling and
gluconeogenesis.
Statistical Analysis
Animals were nested within groups. Treatment and period were considered to be
fixed effects and animals within group were considered to be random effects. Data were
analyzed using the PROC MIXED procedure of SAS 9.2 (SAS Institute Inc., Cary, NC).
The following linear model was used to analyze the data:
Yijk = µ + groupi + animalij + periodk + treatmenth + errorijk
where,
Yijk = response variable (UER, UUE etc.) in the kth
period of the jth
animal in the ith
group (i = 1, 2; j = 1 to n; k = 1, 2)
36
µ = the overall mean effect
groupi = the effect of the ith
group (i = 1,2)
animalij = the effect of the jth
animal on the ith
group (j = 1, 2, .. , ni)
periodk = the effect of the kth
period (k = 1,2)
treatmenth = the effect of the hth
treatment (h = 1,2; being a function of i & k)
errorijk = the residual error
Statistical significance was set at P ≤ 0.05 and a trend at P ≤ 0.10.
Results
Feed intake, digestibility and N-retention: All animals gained weight during the
experiment. Dietary DM digestibility (69 to 75%) was not different between treatments,
however, starch infusion reduced (P < 0.05) N digestibility (Table 2.2). Fecal N tended
(P < 0.1) to increase with starch infusion, however, there was no effect on N retention or
urinary N excretion.
Rumen pH and VFA profiles: Despite predictions that starch infusion would
increase rumen propionate and(or) butyrate concentrations and molar ratios, the rumen
VFA profile and pH were similar between treatments (Table 2.3).
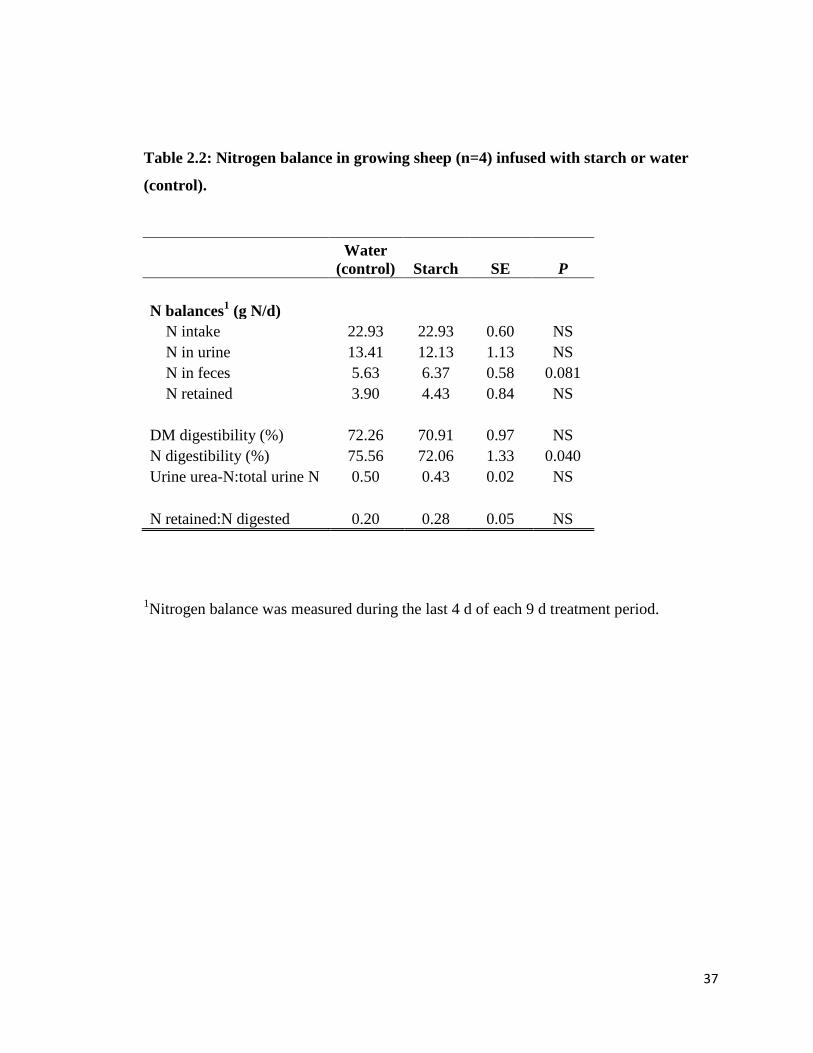
37
Table 2.2: Nitrogen balance in growing sheep (n=4) infused with starch or water
(control).
Water
(control) Starch SE P
N balances1 (g N/d)
N intake 22.93 22.93 0.60 NS
N in urine 13.41 12.13 1.13 NS
N in feces 5.63 6.37 0.58 0.081
N retained 3.90 4.43 0.84 NS
DM digestibility (%) 72.26 70.91 0.97 NS
N digestibility (%) 75.56 72.06 1.33 0.040
Urine urea-N:total urine N 0.50 0.43 0.02 NS
N retained:N digested 0.20 0.28 0.05 NS
1Nitrogen balance was measured during the last 4 d of each 9 d treatment period.
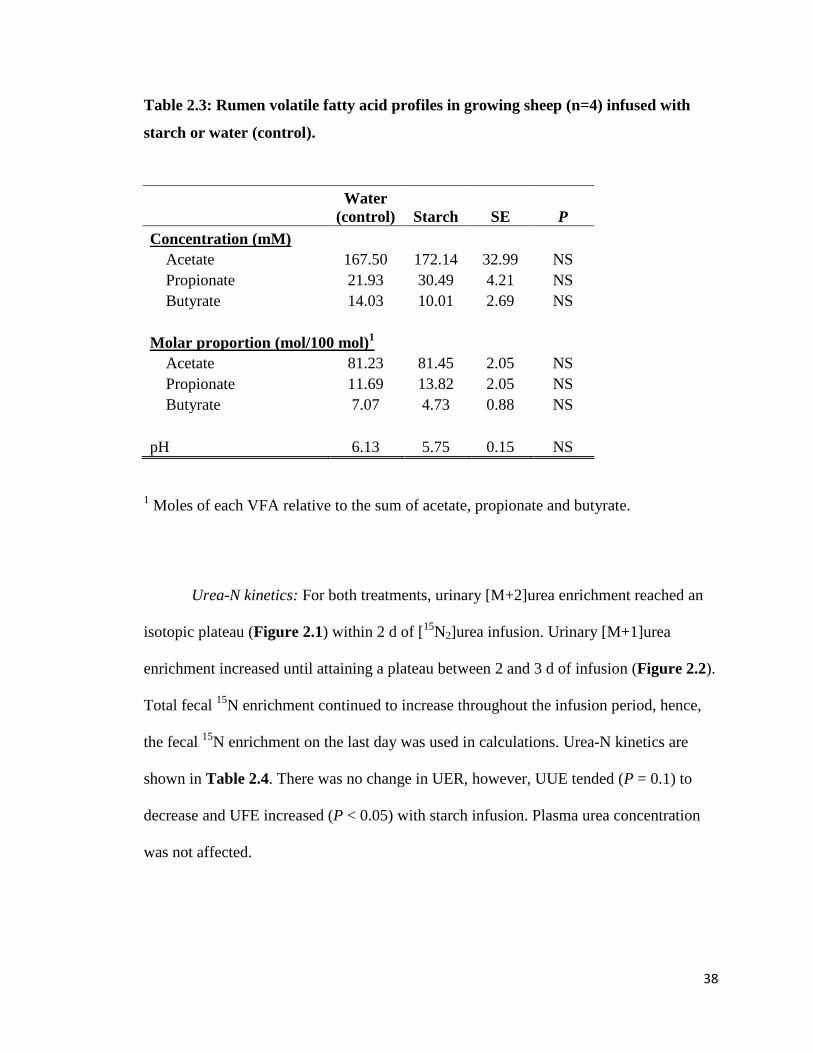
38
Table 2.3: Rumen volatile fatty acid profiles in growing sheep (n=4) infused with
starch or water (control).
Water
(control) Starch SE P
Concentration (mM)
Acetate 167.50 172.14 32.99 NS
Propionate 21.93 30.49 4.21 NS
Butyrate 14.03 10.01 2.69 NS
Molar proportion (mol/100 mol)1
Acetate 81.23 81.45 2.05 NS
Propionate 11.69 13.82 2.05 NS
Butyrate 7.07 4.73 0.88 NS
pH 6.13 5.75 0.15 NS
1 Moles of each VFA relative to the sum of acetate, propionate and butyrate.
Urea-N kinetics: For both treatments, urinary [M+2]urea enrichment reached an
isotopic plateau (Figure 2.1) within 2 d of [15
N2]urea infusion. Urinary [M+1]urea
enrichment increased until attaining a plateau between 2 and 3 d of infusion (Figure 2.2).
Total fecal 15
N enrichment continued to increase throughout the infusion period, hence,
the fecal 15
N enrichment on the last day was used in calculations. Urea-N kinetics are
shown in Table 2.4. There was no change in UER, however, UUE tended (P = 0.1) to
decrease and UFE increased (P < 0.05) with starch infusion. Plasma urea concentration
was not affected.
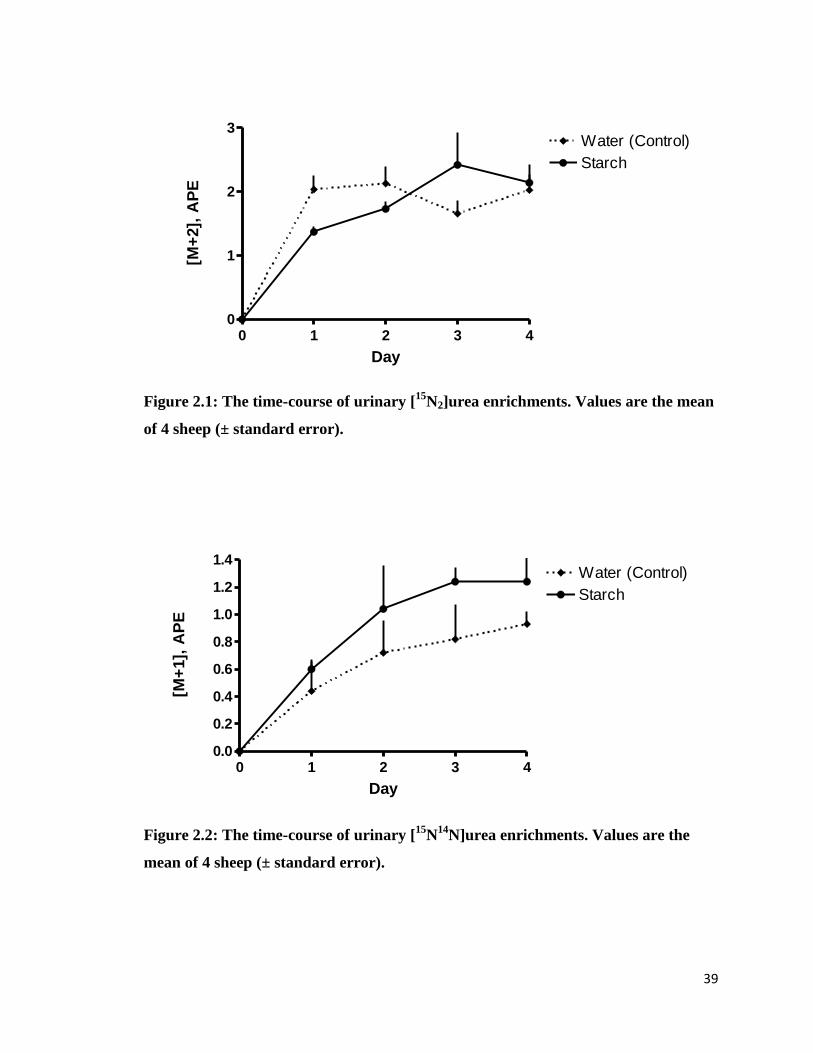
39
Figure 2.1: The time-course of urinary [15
N2]urea enrichments. Values are the mean
of 4 sheep (± standard error).
Figure 2.2: The time-course of urinary [15
N14
N]urea enrichments. Values are the
mean of 4 sheep (± standard error).
0 1 2 3 40
1
2
3
Starch
Water (Control)
Day
[M+
2],
AP
E
0 1 2 3 40.0
0.2
0.4
0.6
0.8
1.0
1.2
1.4
Starch
Water (Control)
Day
[M+
1],
AP
E
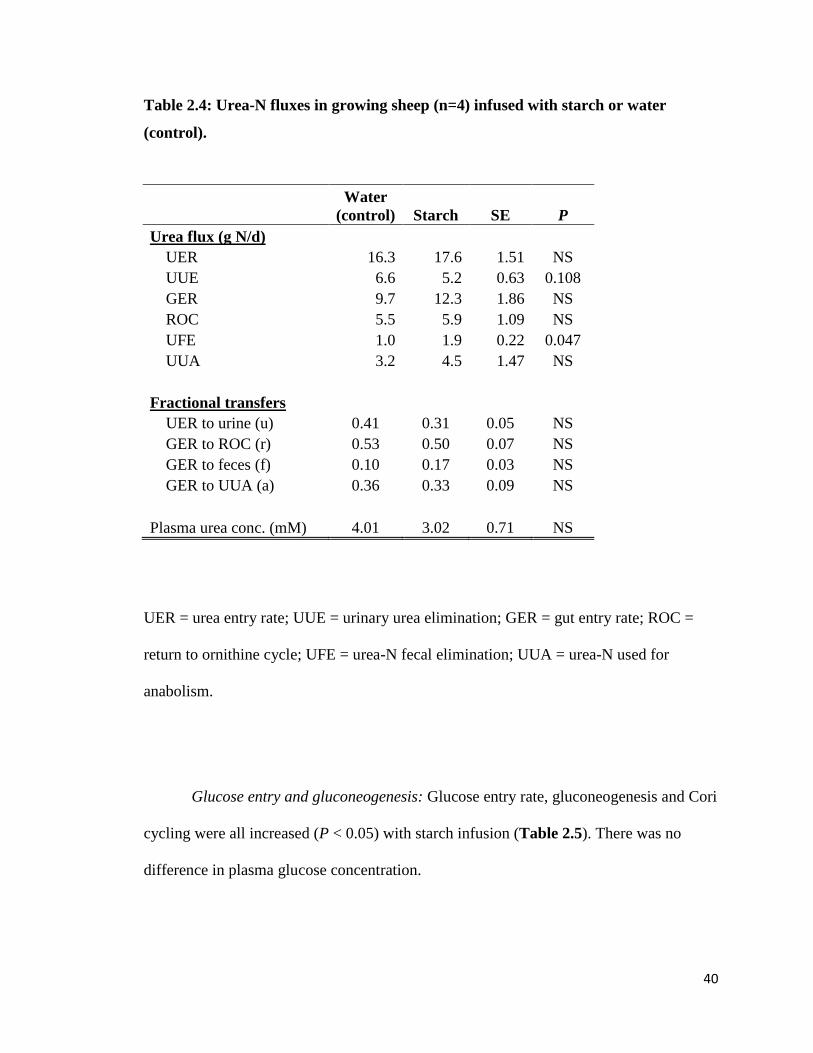
40
Table 2.4: Urea-N fluxes in growing sheep (n=4) infused with starch or water
(control).
Water
(control) Starch SE P
Urea flux (g N/d)
UER 16.3 17.6 1.51 NS
UUE 6.6 5.2 0.63 0.108
GER 9.7 12.3 1.86 NS
ROC 5.5 5.9 1.09 NS
UFE 1.0 1.9 0.22 0.047
UUA 3.2 4.5 1.47 NS
Fractional transfers
UER to urine (u) 0.41 0.31 0.05 NS
GER to ROC (r) 0.53 0.50 0.07 NS
GER to feces (f) 0.10 0.17 0.03 NS
GER to UUA (a) 0.36 0.33 0.09 NS
Plasma urea conc. (mM) 4.01 3.02 0.71 NS
UER = urea entry rate; UUE = urinary urea elimination; GER = gut entry rate; ROC =
return to ornithine cycle; UFE = urea-N fecal elimination; UUA = urea-N used for
anabolism.
Glucose entry and gluconeogenesis: Glucose entry rate, gluconeogenesis and Cori
cycling were all increased (P < 0.05) with starch infusion (Table 2.5). There was no
difference in plasma glucose concentration.
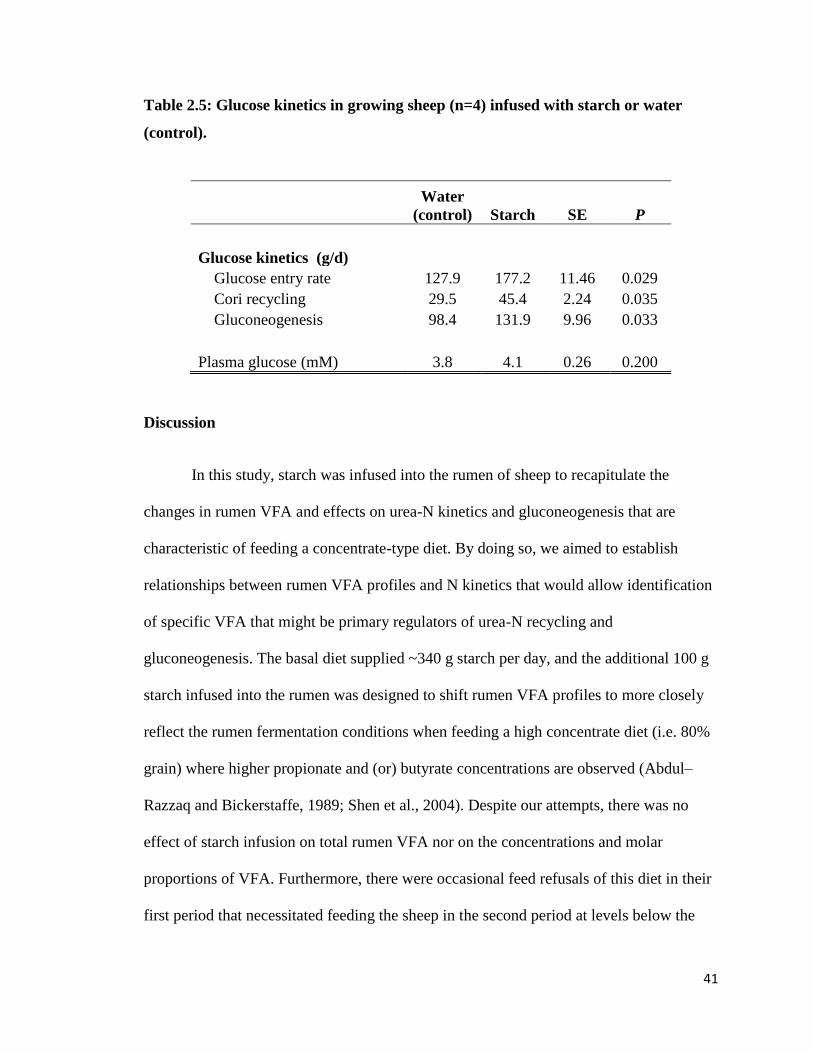
41
Table 2.5: Glucose kinetics in growing sheep (n=4) infused with starch or water
(control).
Discussion
In this study, starch was infused into the rumen of sheep to recapitulate the
changes in rumen VFA and effects on urea-N kinetics and gluconeogenesis that are
characteristic of feeding a concentrate-type diet. By doing so, we aimed to establish
relationships between rumen VFA profiles and N kinetics that would allow identification
of specific VFA that might be primary regulators of urea-N recycling and
gluconeogenesis. The basal diet supplied ~340 g starch per day, and the additional 100 g
starch infused into the rumen was designed to shift rumen VFA profiles to more closely
reflect the rumen fermentation conditions when feeding a high concentrate diet (i.e. 80%
grain) where higher propionate and (or) butyrate concentrations are observed (Abdul–
Razzaq and Bickerstaffe, 1989; Shen et al., 2004). Despite our attempts, there was no
effect of starch infusion on total rumen VFA nor on the concentrations and molar
proportions of VFA. Furthermore, there were occasional feed refusals of this diet in their
first period that necessitated feeding the sheep in the second period at levels below the
Water
(control) Starch SE P
Glucose kinetics (g/d)
Glucose entry rate 127.9 177.2 11.46 0.029
Cori recycling 29.5 45.4 2.24 0.035
Gluconeogenesis 98.4 131.9 9.96 0.033
Plasma glucose (mM) 3.8 4.1 0.26 0.200
42
target of 1.5× maintenance energy requirements in order to keep feed intakes equal in the
two periods. In consequence, the sheep were not gaining weight at a rate close to their
genetic potential, and this may have limited their responses to starch infusion.
Nonetheless, there were several observations in this study that are noteworthy.
It has often been observed that feeding high-starch diets results in lower apparent
N-digestibility (Orskov, 1986). In the present study, apparent N-digestibility was reduced
(~5%) with ruminal starch infusion and there was an increase in fecal-N excretion that
was largely due to the increase in urea-N excretion in feces. This equivalent magnitude of
increase in UFE and fecal-N output with starch infusion suggests that a portion of the
infused starch escaped the rumen to the cecum and large intestines where it was
fermented by hindgut bacteria leading to an increase in urea-N partition to the hindgut.
The greater UFE with starch infusion was offset by a reduction in UUE, thus there was
no difference in N retention between treatments. Overall, with no change in urea entry,
starch infusion shifted the elimination of urea-N from urine to feces. Furthermore, it is
possible that the level of starch in the basal diet (35%) had maximized rumen microbial
fermentation (or metabolism), and thus the infused starch was unable to further enhance
fermentation and promote increased capture of N for microbial protein synthesis.
Despite no change in rumen VFA concentrations, the starch infusion did lead to
an increased rumen synthesis and absorption of glucogenic substrates that resulted in
increased glucose entry rate and gluconeogenesis. On an energetic basis, the increase in
glucose entry (~50 g) accounted for ~50% of the starch energy (1.67 MJ) infused. Two-
thirds of the increase in glucose entry could be accounted for by the increase in
43
gluconeogenesis (~34 g), suggesting that the majority of the infused starch was fermented
in the rumen, most likely to propionate.
In summary, under the feeding conditions of this study, starch infusion into the
rumen failed to achieve significant changes in rumen butyrate and propionate
concentration. In consequence, there were no effects of rumen starch fermentation on
urea-N recycling and N retention, despite enhanced gluconeogenesis. As a result, the
study was unable to provide potential links between rumen VFA profiles and effects on
urea-N recycling. It is probable that the effect of starch infusion was masked by the high
level of starch in the basal diet, as there are studies which show a response to starch when
a forage type diet is used (eg. Huntington et al., 2009). In conclusion, further experiments
will be conducted to investigate the direct role of individual VFA by infusion into the
rumen of propionate and butyrate and measurements of urea-N kinetics and N utilization
in growing sheep.
44
CHAPTER 3: ROLE OF RUMEN BUTYRATE IN REGULATION
OF NITROGEN UTILIZATION AND UREA NITROGEN
KINETICS IN GROWING SHEEP
Abstract
Urea-N recycling is a key process that has the potential to improve protein and
amino acid efficiency in ruminants. Butyrate, a major rumen volatile fatty acid (VFA),
has been indirectly linked to enhancement of urea recycling based on higher expression
of urea transporter (UT-B) in the rumen epithelia of steers fed a rumen butyrate-
enhancing diet. The aim of these studies was to determine the possible role of rumen
butyrate on urea-N recycling by direct infusion of butyrate into the rumen of growing
sheep. Two studies were conducted to quantify the effect of enhanced rumen butyrate
concentrations on N balance, urea kinetics and rumen epithelial proliferation. Wether
sheep (n=4), fitted with a rumen cannula, were fed to 1.8 × maintenance energy intake a
pelleted ration (130 g CP/kg, 9.3 MJ ME/kg) and infused into the rumen with either a
control solution or butyrate (mimicking a concentrate diet) for 9-d periods in a balanced
crossover design. In Exp 1, sheep were given intra-ruminal infusions of either a
electrolyte buffer solution (Con-Buf) or butyrate dissolved in the buffer solution (But-
Buf). In Exp 2, sheep were given intra-rumianl infusions of either sodium-acetate (Na-
Ac) to simulate rumen conditions of a forage-based diet or infusion of sodium butyrate
(Na-But). All solutions were pH adjusted and VFA were infused at 10% of ME intake.
[15
N2]urea was continuously infused i.v. for the last 5 d of each period, and total urine
45
collected by vacuum and feces by a harness bag. In Exp 1, [ring-D5]phenylalanine was
continuously infused i.v. over the last 12 h, after which a biopsy from the rumen papillae
was taken for measurement of fractional protien synthesis rate (FSR). Butyrate infusion
treatments increased (P = 0.1 in Exp 1; P < 0.05 in Exp 2) the proportion of rumen
butyrate, and acetate infusion increased (P < 0.05) rumen acetate. All animals were in
positive N balance (4.2 g N/d in Exp 1; 7.0 g N/d in Exp 2), but no difference in N
retention was observed between treatments. In Exp 2, urea entry (synthesis) rate was
reduced (P < 0.05) by Na-But compared to the Na-Ac control. As a result, a higher
proportion of urea-N entering the rumen was utilized for microbial protein synthesis in
Exp 2 with Na-But infusion. In Exp 1, although But-Buf infusion increased the FSR of
rumen papillae (35.3 ± 1.08 %/d vs 28.7 ± 1.08 %/d, P < 0.05), urea kinetics were not
altered by But-Buf compared to Con-Buf. This study is the first to directly assess the role
of butyrate in urea recycling and its effects on rumen papillae protein turnover in growing
lambs. Under the feeding conditions and the continuous rate of butyrate infusion into the
rumen in the present studies, butyrate does not affect overall N retention in growing
sheep. However, butyrate may play a role in regulating urea synthesis and thus affect the
redistribution of urea-N fluxes in the overall scheme of N metabolism.
Introduction
Nitrogen (N) metabolism and use in ruminants is a complex process. Almost 50-
100% of the N digested by ruminant animals passes through the urea-N pool (Lapierre
and Lobley, 2001), and hence is subject to the fates of urea including excretion in urine or
transfer and subsequent utilization in the gastro-intestinal tract (GIT) by bacteria. It has
long been established that rumen fermentation, affected by the diet, can influence the
46
partitioning and use of urea-N in ruminants. For example, feeding a highly fermentable
concentrate diet increases the amount of urea-N recycled to the rumen (Kennedy and
Milligan, 1980; Huntington, 1989) and increases the capture of rumen ammonia (NH3) by
microbes (Stern and Hoover, 1979) leading to lower urinary N losses and hence, greater
N retention (Fluharty et al., 1999). However, the mechanisms that dictate urea-N kinetics
are still not well understood. Rumen volatile fatty acids (VFA) are a primary product of
rumen fermentation, and are responsible for meeting ~70-80% of the animals energy
needs (Bergman and Wolff, 1971). Among the VFA, butyrate, which makes up about 10-
20% of the total rumen VFA (Bergman, 1990), may play a key role in regulation of urea-
N kinetics and use as suggested by recent studies. Higher rumen butyrate which results
from feeding of highly fermentable diets (Shen et al., 2004), may affect urea-N kinetics
through a wide range of mechanisms either directly by rumen proliferation (Sakata and
Tamate, 1978) or indirectly by enhancing rumen tissue blood flow, permeability and
absorptive capacity of the rumen (Storm et al., 2011). In steers fed a concentrate diet,
higher ruminal urea transporter (UT-B) expression was associated with higher rumen
butyrate levels (Simmons et al., 2009). Increased expression of UT-B by the rumen
epithelia might directly affect the entry of plasma urea into the rumen. On the other hand,
butyrate may indirectly enhance gut entry of plasma urea by increasing the blood flow to
rumen epithelia (Storm et al., 2011) or by promoting keratinization of rumen epithelia,
hence increasing its permeability (Norton et al., 1982). There is mounting evidence
demonstrating that butyrate promotes rumen epithelial development, however, most of
the measurements are morphological (increased papillae length and surface area) or
histological (mitotic indices) in nature (Sakata and Tamate, 1978; Simmons et al., 2009).
47
Lastly, higher rumen butyrate may inhibit the use of propionate by the liver (Krehbiel et
al., 1992) and substitute the use of glucose by rumen epithelia (Baldwin and Jesse, 1992).
These glucose and propionate sparing effects may avoid additional amino acid (AA)
catabolism for energy production. Therefore, it also remains unclear whether the effect of
butyrate is driven by energy or if it is an effect unique and directly attributable to
butyrate.
To answer these questions about the role of rumen butyrate in N utilization and
urea-N kinetics, we conducted two experiments. In the first experiment, rumen butyrate
was artificially elevated by constant infusion into the rumen compared with buffer as
control. In the second experiment, iso-energetic infusions of acetate compared to butyrate
were used to simulate high forage compared to high concentrate fed rumen fermentation
profiles, feeding conditions where urea-N recycling differences have been observed.
Materials and methods
All protocols were approved by the Institutional Animal Care and Use Committee
at the University of Maryland (protocol number R-10-45).
Animals, diets and treatment periods
Experiment 1: Upon arrival in the ANSC animal facilities, Polypay × Dorsett wether
lambs (28.5 ± 3.49 kg BW) were transitioned to a standard pelleted diet (Table 3.1) and
fed to 1.8 × maintenance energy requirements. After acclimation and a 30-d quarantine
period, sheep were surgically fitted with a rumen cannula (Appendix 1). Following
recovery from surgery, sheep were placed into individual metabolic crates and fed an
48
equal amount of the basal diet every 2 h via an automatic feeder. Four cannulated sheep
were assigned to receive continuous (1 L/d) rumen infusions of a buffer (Con-Buf) and
buffered butyrate (But-Buf) in a balanced cross-over design with each infusion period
lasting 8 d (Table 3.2). The butyrate infusion rate was calculated to supply 10% of ME (1
MJ/d; based on gross energy of butyrate) and to increase rumen butyrate concentration by
~40% as was observed by Simmons et al. (2009). The infusates was adjusted to pH 6.8
and electrolyte load was equal in both solutions. Each infusion period was separated by 3
wk during which sheep were placed into individual floor pens for exercise and to allow a
period of treatment washout.
Experiment 2: The same Polypay × Dorsett wether sheep (42 ± 6.6 kg BW) from Exp 1
were used in this experiment. In this experiment, four sheep received iso-energetic (1
MJ/d, 10% of ME intake based on gross energy of acetate and butyrate) and isonatremic
intra-ruminal infusions of sodium acetate (control, Na-Ac) and sodium butyrate (Na-But)
in a balanced cross-over design with each infusion period lasting 9 d (Table 3.2). The
levels of VFA infused were designed to simulate high forage (Na-Ac) compared to high
concentrate (Na-But) fed rumen fermentation profiles, feeding conditions where urea-N
recycling differences have been observed. The solutions were adjusted to pH 8 and
NaOH and Na-formate were used to balance the Na-But treatment to the same level of
sodium as in the Na-Ac treatment. Each period was separated by 5 d during which sheep
were placed in individual floor pens for exercise and washout.
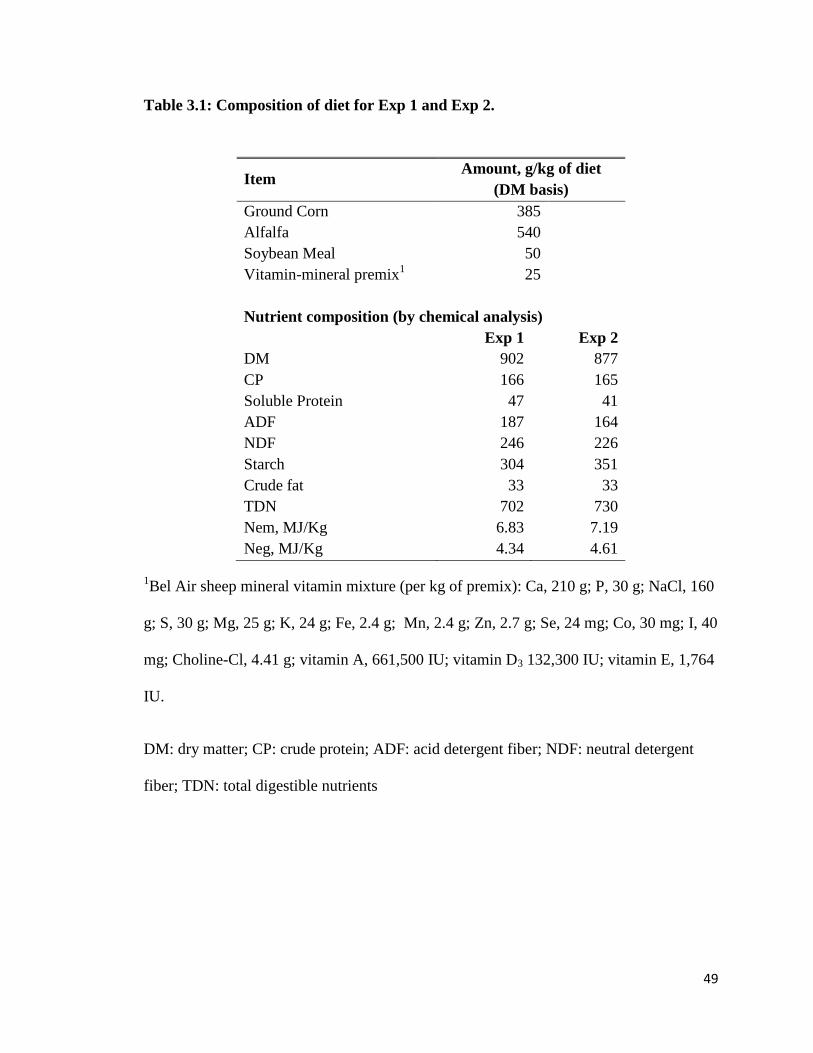
49
Table 3.1: Composition of diet for Exp 1 and Exp 2.
Item Amount, g/kg of diet
(DM basis)
Ground Corn 385
Alfalfa 540
Soybean Meal 50
Vitamin-mineral premix1 25
Nutrient composition (by chemical analysis)
Exp 1 Exp 2
DM 902 877
CP 166 165
Soluble Protein 47 41
ADF 187 164
NDF 246 226
Starch 304 351
Crude fat 33 33
TDN 702 730
Nem, MJ/Kg 6.83 7.19
Neg, MJ/Kg 4.34 4.61
1Bel Air sheep mineral vitamin mixture (per kg of premix): Ca, 210 g; P, 30 g; NaCl, 160
g; S, 30 g; Mg, 25 g; K, 24 g; Fe, 2.4 g; Mn, 2.4 g; Zn, 2.7 g; Se, 24 mg; Co, 30 mg; I, 40
mg; Choline-Cl, 4.41 g; vitamin A, 661,500 IU; vitamin D3 132,300 IU; vitamin E, 1,764
IU.
DM: dry matter; CP: crude protein; ADF: acid detergent fiber; NDF: neutral detergent
fiber; TDN: total digestible nutrients
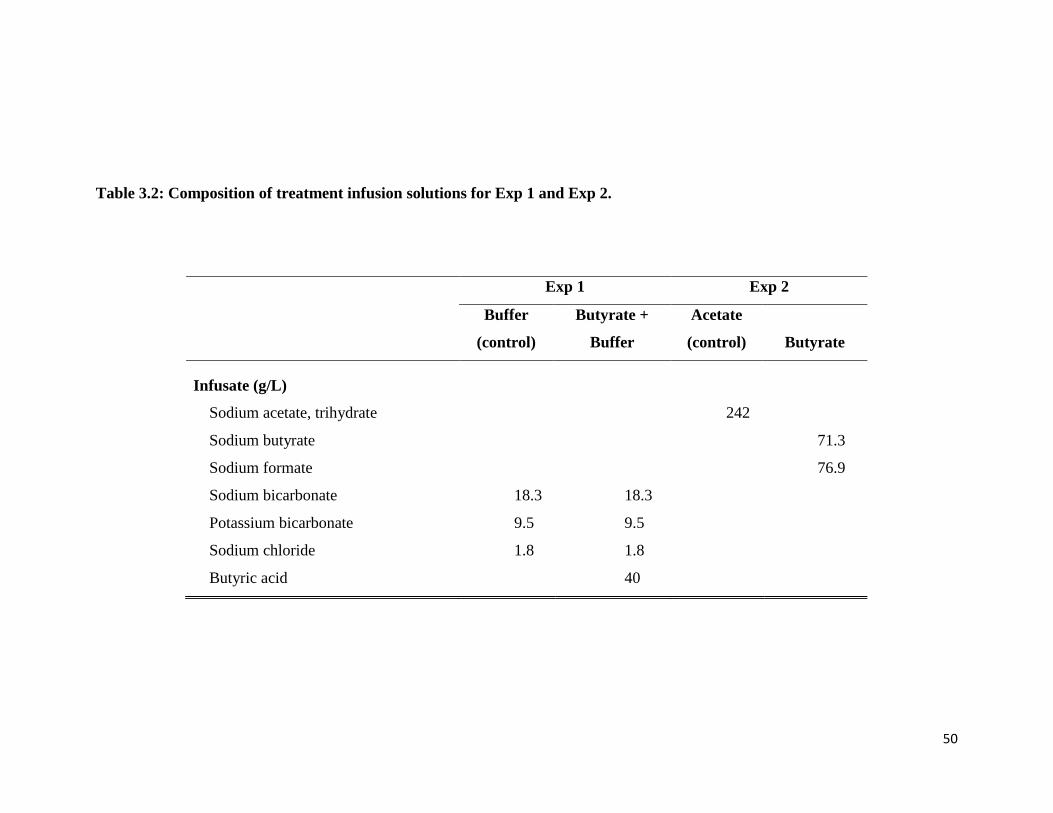
50
Table 3.2: Composition of treatment infusion solutions for Exp 1 and Exp 2.
Exp 1 Exp 2
Buffer
(control)
Butyrate +
Buffer
Acetate
(control) Butyrate
Infusate (g/L)
Sodium acetate, trihydrate 242
Sodium butyrate 71.3
Sodium formate 76.9
Sodium bicarbonate 18.3 18.3
Potassium bicarbonate 9.5 9.5
Sodium chloride 1.8 1.8
Butyric acid 40
51
Isotope infusion
Temporary jugular vein catheters were inserted at least 2 d prior to initiating
isotope infusions. Over the last 4 (Exp 1) or 5 (Exp 2) days of each treatment period a
sterile solution containing [15
N2] urea (99 atom percent 15
N, Cambridge Isotope
Laboratories Inc., Andover, MA) was continuously infused (0.6 g/d) through a jugular
vein catheter. It has been shown that this length of [15
N2]urea infusion results in the
attainment of isotopic plateau in urinary [15
N14
N] and [15
N15
N]urea enrichment and that
this infusion rate increases the urinary [15
N15
N]urea enrichment to 1.5-2.5 atoms percent
excess (APE) (Sunny et al., 2007).
The fractional rate of rumen epithelial protein synthesis (FSR) was determined in
Exp 1. During the last 8 h, D5 phenylalanine tracer (170 mg D5-phenylalanine in 125 g
saline) was continuously infused i.v. along with urea tracer through jugular catheter after
priming with a bolus dose (42.5mg D5-phenylalanine in 3 g saline). This amount of tracer
was calculated and tested in a pilot trial in order to achieve a 4% enrichment of rumen
epithelia. Exact starting and ending infusion times were carefully recorded.
Sampling
During the last 5 d of each treatment period, sheep were fitted with a harness for
total collection of feces (by bag) and urine (by suction), which were weighed and
recorded. A slight vacuum was used to collect urine directly into a sealed container
placed on a stir plate and containing sufficient HCl to reduce urine pH to < 3 to prevent
bacterial hydrolysis of urea and ammonia volatilization. Well-mixed sub-samples from
each collection (100 g feces and 40 g urine) were stored at -20oC for later analysis. Over
52
the last 6 h of tracer infusion, urine samples were also collected at 2 h intervals and later
analyzed to verify that plateau of [15
N2] urea enrichment in urine had been attained.
Hourly blood samples were collected during the last 5 h. Plasma was separated by
centrifugation (8,000 × g for 15 min at 4oC) and stored at -20
oC for later analysis. At the
end of each infusion period, following collection of the last sample, sheep were removed
from crates and within 10 mins the rumen was completely evacuated by vacuum. A
rumen papillae biopsy sample was obtained after the rumen was locally rinsed with saline
(Apendix 2). The biopsy samples were stored at -20oC. The rumen fluid was well mixed
and a representative sample (50 mL) strained through two layers of cheese cloth. The
strained rumen fluid was immediately centrifuged (8,000 × g for 10 min at 4oC) and the
pH of the supernatant recorded using a pH indicator strip (VWR International, West
Chester, PA). For determination of VFA concentration, to a known amount (1 g) of
rumen fluid was added 0.25 g of an internal standard (260 mM 1-13
C-Na-acetate, 80 mM
methyl-D3-propionic acid and 40 mM 1-13
C-Na-butyrate), and the samples stored at -20o
C for later analysis.
Urea concentration and enrichment
The concentration and enrichment of plasma and urinary urea were determined by
Gas Chromatography-Mass Spectrometry (GC-MS, Agilent 6890 series gas
chromatography system coupled to an Agilent 5973N mass selective detector; Agilent;
Palo Alto, CA) under electron ionization (EI) mode. For determination of urinary urea
concentration, to a known weight (0.25 g) of an internal standard solution containing
[13
C, 15
N2] urea (5 mg/g) was added to an equal amount of urine. For plasma urea
concentration, a known amount (500 mg) of internal standard containing [13
C, 15
N2] urea
53
(0.26 mg/g) was added to an equal amount of plasma. Plasma and urine samples were
acidified by adding an equal volume of 15% sulfosalicylic acid and 10% trichloroacetic
acid (w/v) respectively and centrifuged for 10 min at 10,000 × g (room temperature) to
precipitate proteins and debris. Urea was isolated from acidified samples by application
to 0.5 g of cation exchange resin (AG 50W-X8 resin, 100-200 mesh, Bio-Rad
Laboratories, Hercules, CA). The resin was washed with 2 x 2 mL of water and urea
eluted with 2 mL of ammonium hydroxide plus 1 mL of double distilled water. An
aliquot (100 to 200 μl) of the eluate was dried under N2 gas and tertiary-
butyldimethylsilyl derivatives of urea were prepared by adding 50 μl each of acetonitrile
(Pierce chemicals , Rockford, IL) and N-methyl-N-t-butyl-dimethylsilyl-
trifluroacetamide (Pierce chemicals , Rockford, IL) followed by heating at 90oC for 20
minutes (El-Kadi et al., 2006). Derivatized urea samples were separated on a fused silica
capillary column (HP-50; 30 m × 0.25 mm × 1 µm Hewlett-Packard, Palo Alto, CA) prior
to MS under EI conditions. Ions (mass-to-charge; m/z) 231.2 (unlabeled; M), 232.2
(singly labeled; M+1), 233.2 (doubly labeled; M+2), and 234.2 (internal standard; M+3)
were monitored using selected ion monitoring (SIM), with conditions of: an initial
temperature of 150oC followed by 15
oC/min to 250
oC. Urea concentration in the samples
was calculated by isotope dilution (Calder et al., 1999) based on the ratios of M+3/ M
after correction for background (natural abundance) and spillover effects of M+2 urea.
Total urinary and fecal N and fecal 15
N
Total urinary and fecal N was measured using an automated N analyzer (CN-
2000, Leco, St. Joseph, MI). Fecal samples were dried in a forced air drying oven at 60oC
for 5 d. Dried samples were pulverized in a liquid nitrogen freezer mill (Freezer-Mill
54
6850, Spex CertiPrep Inc., Metuchen, NJ) and samples submitted to the stable isotope
facility at the University of California-Davis (CA) for 15
N analysis by isotope-ratio mass
spectrometry.
Rumen fluid VFA concentration
Samples were thawed and acidified by adding 250 µL of 2 M HCl, and
centrifuged for 15 min at 13,000 × g at room temperature to precipitate solids. The
supernatant was filtered through a 0.2 µm filter (Nalgene, Rochester, NY), and anhydrous
ether (0.5 mL) added to extract VFA. An aliquot (200 μl) of extracted VFA was
converted to the tert-butyldimethylsilyl derivative by adding 50 µL MTBSTFA followed
by heating at 80oC for 20 min (Duncan et al., 2004). After samples had cooled, 50 µL of
methanol was added to react with the surplus MTBSTFA. Derivatized samples were
injected onto the GC column (fused silica capillary column, HP-5; 30 m × 0.25 mm × 1
µm Hewlett-Packard) with the GC inlet set at 250C and the following column
conditions: initial temperature of 60oC held for 3 min followed by 10
oC/min to 210
oC for
4 min. Ions of m/z 117 and 118 for acetate, 131 and 134 for propionate and 145 and 146
for butyrate were monitored. VFA concentrations were calculated by isotope dilution
(Calder et al., 1999).
Phenylalanine enrichment in plasma and rumen papillae
Plasma samples were acidified using 15% sulfosalicylic acid and centrifuged for
10 min at 10,000 × g at room temperature to precipitate proteins. The supernatant was
desalted by ion-exchange by application to 0.5 g of cation exchange resin (AG 50W-X8
resin, 100-200 mesh, Bio-Rad Laboratories, Hercules, CA). The resin was washed with 2
55
x 2 mL of water and AA fraction eluted with 2 mL of ammonium hydroxide plus 1 mL of
double distilled water. The eluate was lyophilized to dryness. AA were converted to
tertiary-butyldimethylsilyl derivatives by adding 50 μl each of acetonitrile (Pierce
chemicals , Rockford, IL) and MTBSTFA followed by heating at 90oC for 20 minutes
(El-Kadi et al., 2006). For determination of rumen protein-bound phenylalanine
enrichments, approximately 15 mg of wet tissue was deproteinized and homogenized by
washing with 15% ice-cold sulfosalicylic acid. Homogenized tissue samples were
hydrolyzed by adding 4 mL of 2 M HCl and heating at 110oC for 18 h. The acid
hydrolysate was desalted by ion-exchange and derivatized to obtain tertiary-
butyldimethylsilyl derivatives similar to plasma samples. Derivatized AA samples were
separated on a fused silica capillary column (HP-50; 30 m × 0.25 mm × 1 µm Hewlett-
Packard, Palo Alto, CA) prior to MS under EI conditions. Ions (mass-to-charge; m/z) 336
(unlabeled; M) and 341 ([D5]phenylalanine; M+3) were monitored using SIM, with
conditions of: an initial temperature of 150oC followed by 15
oC/min to 250
oC.
Phenylalanine enrichments were expressed as APE relative to background natural
abundance. The obtained data was corrected for deuterium-exchange using a calibration
curve.
Calculations
Urea-N Kinetics: Urea-N kinetic calculations were based on Lobley et al. (2000).
Whole body urea synthesis (urea entry rate; UER) was estimated from the dilution of the
infused [15
N2]urea tracer. A portion of UER is excreted into urine (UUE), whereas the
remainder enters the gut tissues (GER). Urea entering the gut has three different fates: 1)
excretion in feces (UFE), 2) hydrolysis by rumen microbes with absorption of NH3 and
56
return to the ornithine-urea cycle (ROC), and 3) utilization by gut microbes for protein
synthesis (anabolic use, UUA). UFE and ROC are estimated directly from excretion of
fecal 15
N and based on the appearance of urinary [15
N14
N]urea, respectively. UUA is
estimated by the difference between GER and UFE+ROC. An important assumption in
this model is that all the doubly labeled urea in urine is derived from the infused tracer.
Calculations for urea-N kinetics are shown in Appendix 3.
FSR and whole body protein flux: Due to lack of sufficient free pool
phenylalanine in rumen papillae biopsies, plasma enrichments were used in the
calculation. FSR was calculated from the average enrichment of plasma and rumen
protein-bound D5 phenylalanine using the following formula (Connell et al., 1997):
Whole body protein flux was calculated from the irreversible-loss rate (ILR, flux)
of phenylalanine using following calculations (Savary-Auzeloux et al., 2003).
and,
The factor 29.33 is obtained based on phenylalanine content of total body protein in
sheep (Savary-Auzeloux et al., 2003).
57
Statistical Analysis
Animals were nested within groups. Treatment and period were considered to be
fixed effects and animal within group were considered to be random effects. Data were
analyzed using the PROC MIXED procedure of SAS 9.2 (SAS Institute Inc., Cary, NC).
The following linear model was used to analyze the data:
Yijk = µ + groupi + animalij + periodk + treatmenth + errorijk
where,
Yijk = response variable (UER, UUE etc.) in the kth
period of the jth
animal in the ith
group (i = 1, 2; j = 1 to n; k = 1, 2)
µ = the overall mean effect
groupi = the effect of the ith
group (i = 1,2)
animalij = the effect of the jth
animal on the ith
group (j = 1, 2, .. , ni)
periodk = the effect of the kth
period (k = 1,2)
treatmenth = the effect of the hth
treatment (h = 1,2; being a function of i & k)
errorijk = the residual error
For FSR measurements, data for only 3 animals was used as one of the animals had a
longer washout period. Statistical significance was set at P ≤ 0.05 and a trend at P ≤ 0.10.
58
Results
Experiment 1: Butyrate vs Buffer (control)
Feed intake, digestibility and N-retention: All sheep gained weight during the
experiment. Dietary DM (67 to 73%) and N digestibility (70 to 76%) did not differ
between treatments. (Table 3.3). There was no effect of But-Buf on N retention,
however, urinary N excretion tended (P = 0.104) to increase (~1 g urea-N/d) by But-Buf,
which accounted for most the difference in urinary urea output. No difference was
observed in fecal N output.
Rumen pH and VFA profiles: The rumen pH was not altered by treatments (Table
3.4). The molar proportion (mol/100 mol VFA) of rumen butyrate numerically increased
(P = 0.107) with But-Buf infusion, although the absolute concentration of butyrate did
not change (Table 3.4). Rumen acetate proportion tended (P = 0.065) to decrease with
infusion of But-Buf, but its concentration was not different between treatments.
Surprisingly, the concentration of rumen propionate was elevated (P < 0.05) with But-
Buf infusion, but there was no difference in the proportion of propionate between
treatments.
Urea-N kinetics: For both treatments, urinary [M+2] urea enrichment reached an
isotopic plateau (Figure 3.1) within 2 d of [15
N2] urea infusion. Urinary [M+1] urea
enrichment increased until attaining a plateau between 2 and 3 d of infusion (Figure
3.2). Total fecal 15
N enrichment continued to increase throughout the infusion period,
attaining a final value approximately 80% of predicted plateau. Hence, the fecal 15
N
enrichment on the last day was used in calculations. Urea-N kinetics are shown in Table
59
3.5. Infusion of But-Buf tended (P = 0.082) to increase UER. When considered on a
digestible N basis, UER was significantly increased (P < 0.05) by ~8% with But-Buf.
The absolute amounts of GER and ROC tended (P ≤ 0.1) to increase by the same amount
of ~1 g urea-N/d. Fractional transfers to urine and feces were not affected by But-Buf
infusion, whereas the proportion of urea-N returned from GIT (ROC:GER) increased (P
< 0.05).
FSR of rumen epithelia and whole body protein flux: Fractional protein synthesis
of rumen epithelia was increased (P = 0.05) by But-Buf (35.3 ± 1.08%/d) compared to
Con-Buf (28.7 ± 1.08%/d). These results, however, were obtained from the data of only
three sheep, i.e. one sheep was dropped from this analysis because of a large gap between
experimental periods. Whole body protein flux did not differ between But-Buf (185 ± 9.2
g/d) and Con-Buf (196 ± 9.2 g/d).
Experiment 2: Butyrate vs Acetate (control)
Feed intake, digestibility and N balances: All animals gained weight during the
experiment. Dietary DM (60 to 72%) and N (60 to 70%) digestibility did not differ
between treatments (Table 3.3). Total urinary N excretion tended (P = 0.091) to be lower
with Na-But compared to Na-Ac, whereas there were no differences in fecal N output and
N retention. Similar to Exp 1, the difference in total urinary N output was largely
accounted for by the difference in urinary urea-N.
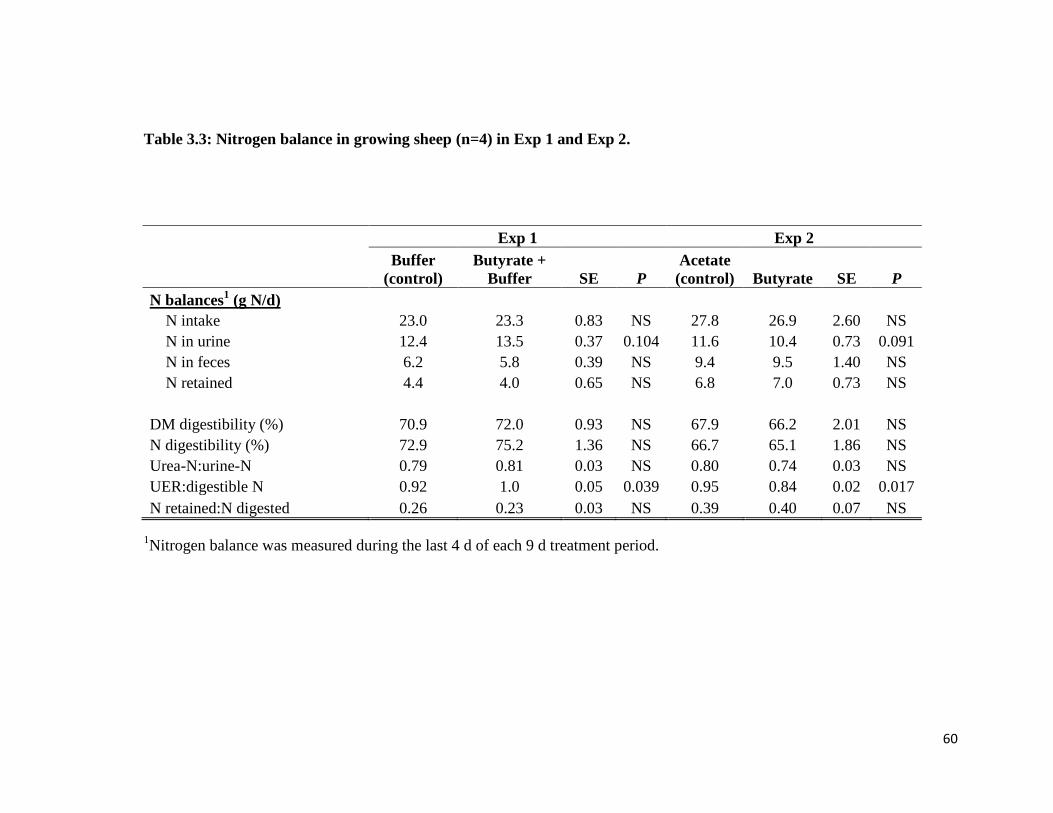
60
Table 3.3: Nitrogen balance in growing sheep (n=4) in Exp 1 and Exp 2.
Exp 1 Exp 2
Buffer
(control)
Butyrate +
Buffer SE P
Acetate
(control) Butyrate SE P
N balances1 (g N/d)
N intake 23.0 23.3 0.83 NS 27.8 26.9 2.60 NS
N in urine 12.4 13.5 0.37 0.104 11.6 10.4 0.73 0.091
N in feces 6.2 5.8 0.39 NS 9.4 9.5 1.40 NS
N retained 4.4 4.0 0.65 NS 6.8 7.0 0.73 NS
DM digestibility (%) 70.9 72.0 0.93 NS 67.9 66.2 2.01 NS
N digestibility (%) 72.9 75.2 1.36 NS 66.7 65.1 1.86 NS
Urea-N:urine-N 0.79 0.81 0.03 NS 0.80 0.74 0.03 NS
UER:digestible N 0.92 1.0 0.05 0.039 0.95 0.84 0.02 0.017
N retained:N digested 0.26 0.23 0.03 NS 0.39 0.40 0.07 NS
1Nitrogen balance was measured during the last 4 d of each 9 d treatment period.
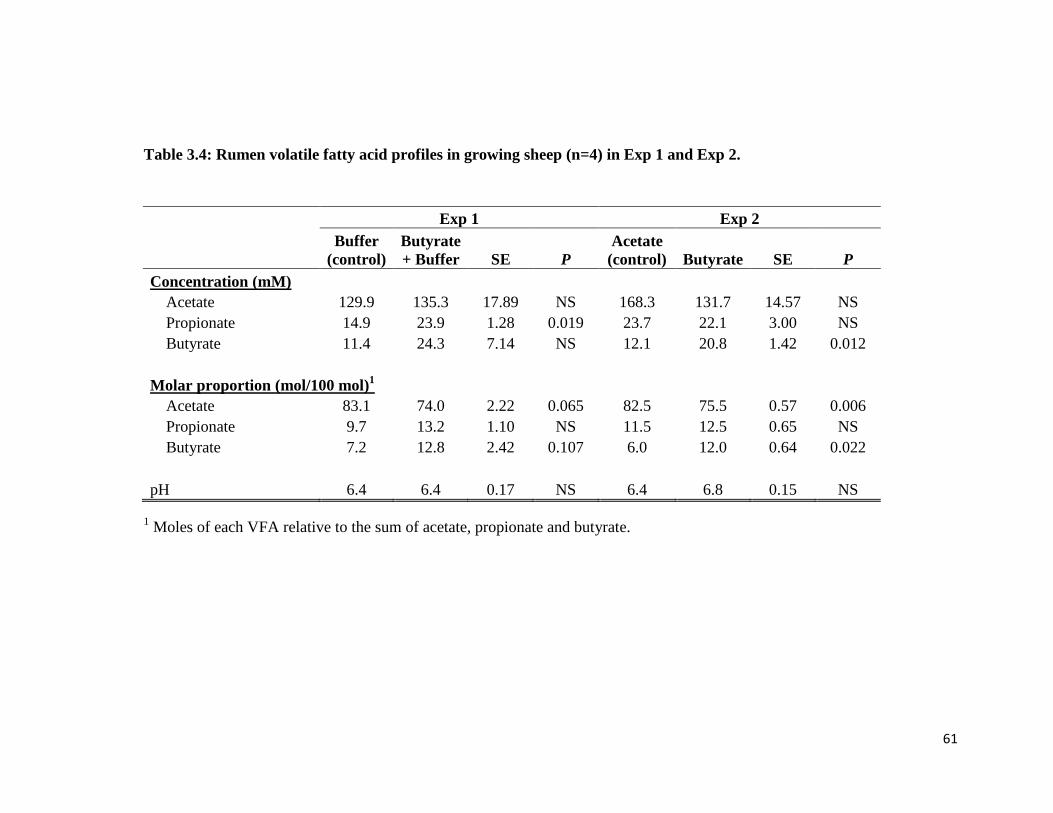
61
Table 3.4: Rumen volatile fatty acid profiles in growing sheep (n=4) in Exp 1 and Exp 2.
Exp 1 Exp 2
Buffer
(control)
Butyrate
+ Buffer SE P
Acetate
(control) Butyrate SE P
Concentration (mM)
Acetate 129.9 135.3 17.89 NS 168.3 131.7 14.57 NS
Propionate 14.9 23.9 1.28 0.019 23.7 22.1 3.00 NS
Butyrate 11.4 24.3 7.14 NS 12.1 20.8 1.42 0.012
Molar proportion (mol/100 mol)1
Acetate 83.1 74.0 2.22 0.065 82.5 75.5 0.57 0.006
Propionate 9.7 13.2 1.10 NS 11.5 12.5 0.65 NS
Butyrate 7.2 12.8 2.42 0.107 6.0 12.0 0.64 0.022
pH 6.4 6.4 0.17 NS 6.4 6.8 0.15 NS
1 Moles of each VFA relative to the sum of acetate, propionate and butyrate.
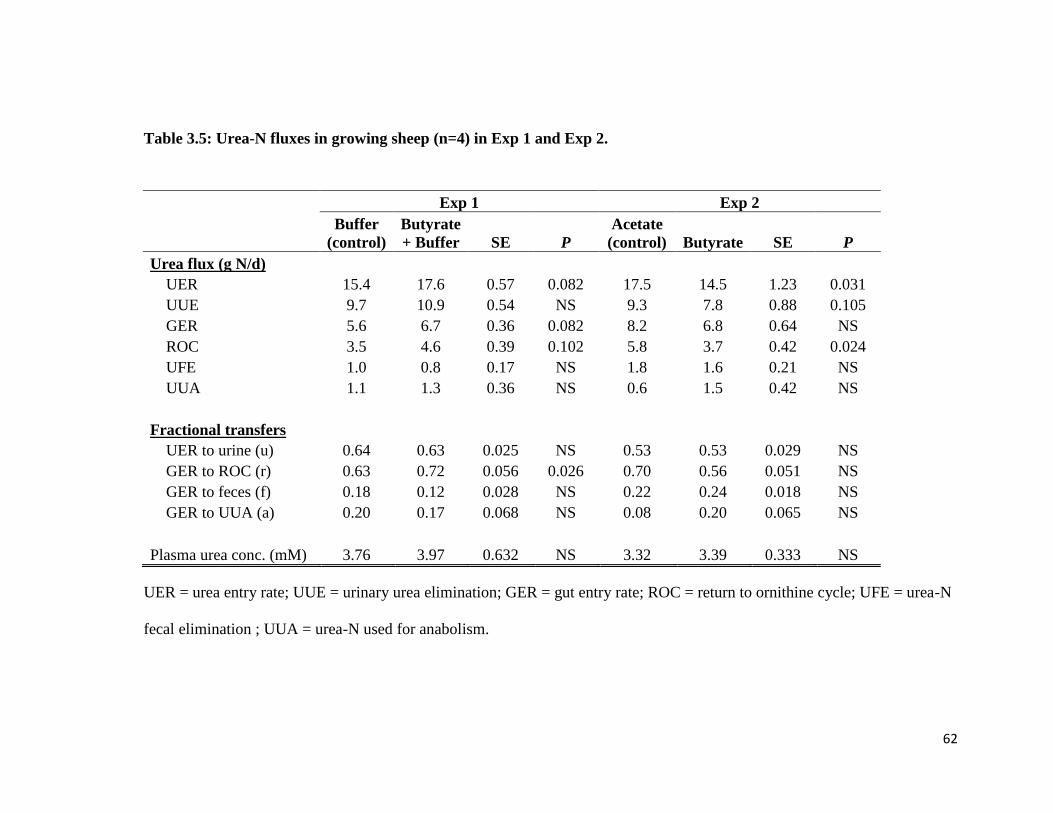
62
Table 3.5: Urea-N fluxes in growing sheep (n=4) in Exp 1 and Exp 2.
Exp 1 Exp 2
Buffer
(control)
Butyrate
+ Buffer SE P
Acetate
(control) Butyrate SE P
Urea flux (g N/d)
UER 15.4 17.6 0.57 0.082 17.5 14.5 1.23 0.031
UUE 9.7 10.9 0.54 NS 9.3 7.8 0.88 0.105
GER 5.6 6.7 0.36 0.082 8.2 6.8 0.64 NS
ROC 3.5 4.6 0.39 0.102 5.8 3.7 0.42 0.024
UFE 1.0 0.8 0.17 NS 1.8 1.6 0.21 NS
UUA 1.1 1.3 0.36 NS 0.6 1.5 0.42 NS
Fractional transfers
UER to urine (u) 0.64 0.63 0.025 NS 0.53 0.53 0.029 NS
GER to ROC (r) 0.63 0.72 0.056 0.026 0.70 0.56 0.051 NS
GER to feces (f) 0.18 0.12 0.028 NS 0.22 0.24 0.018 NS
GER to UUA (a) 0.20 0.17 0.068 NS 0.08 0.20 0.065 NS
Plasma urea conc. (mM) 3.76 3.97 0.632 NS 3.32 3.39 0.333 NS
UER = urea entry rate; UUE = urinary urea elimination; GER = gut entry rate; ROC = return to ornithine cycle; UFE = urea-N
fecal elimination ; UUA = urea-N used for anabolism.
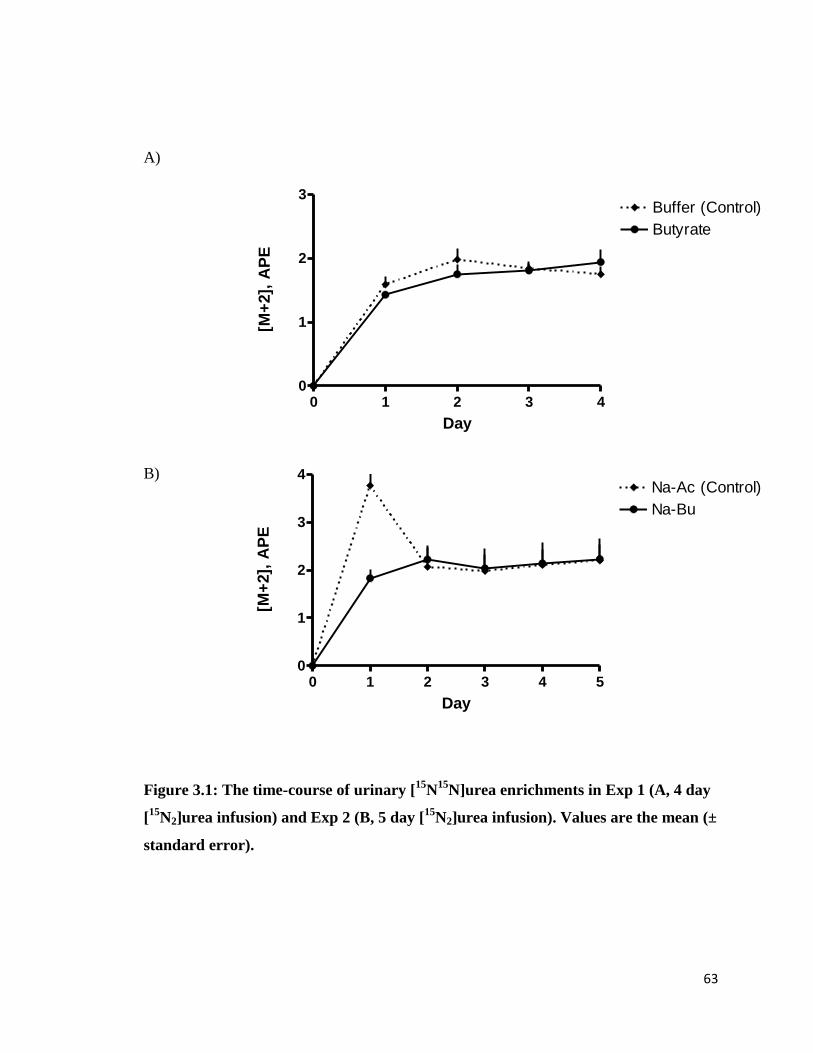
63
A)
B)
Figure 3.1: The time-course of urinary [15
N15
N]urea enrichments in Exp 1 (A, 4 day
[15
N2]urea infusion) and Exp 2 (B, 5 day [15
N2]urea infusion). Values are the mean (±
standard error).
0 1 2 3 40
1
2
3
Butyrate
Buffer (Control)
Day
[M+
2],
AP
E
0 1 2 3 4 50
1
2
3
4Na-Ac (Control)
Na-Bu
Day
[M+
2],
AP
E
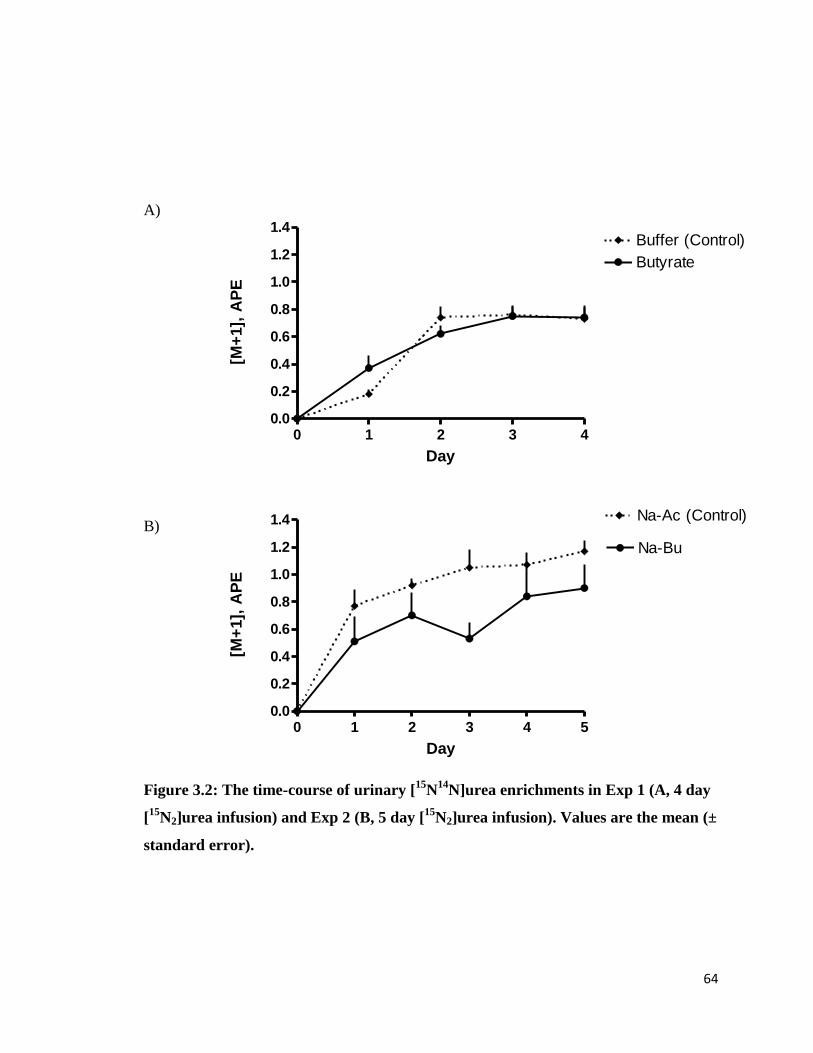
64
A)
B)
Figure 3.2: The time-course of urinary [15
N14
N]urea enrichments in Exp 1 (A, 4 day
[15
N2]urea infusion) and Exp 2 (B, 5 day [15
N2]urea infusion). Values are the mean (±
standard error).
0 1 2 3 40.0
0.2
0.4
0.6
0.8
1.0
1.2
1.4
Butyrate
Buffer (Control)
Day
[M+
1],
AP
E
0 1 2 3 4 50.0
0.2
0.4
0.6
0.8
1.0
1.2
1.4
Na-Bu
Na-Ac (Control)
Day
[M+
1],
AP
E
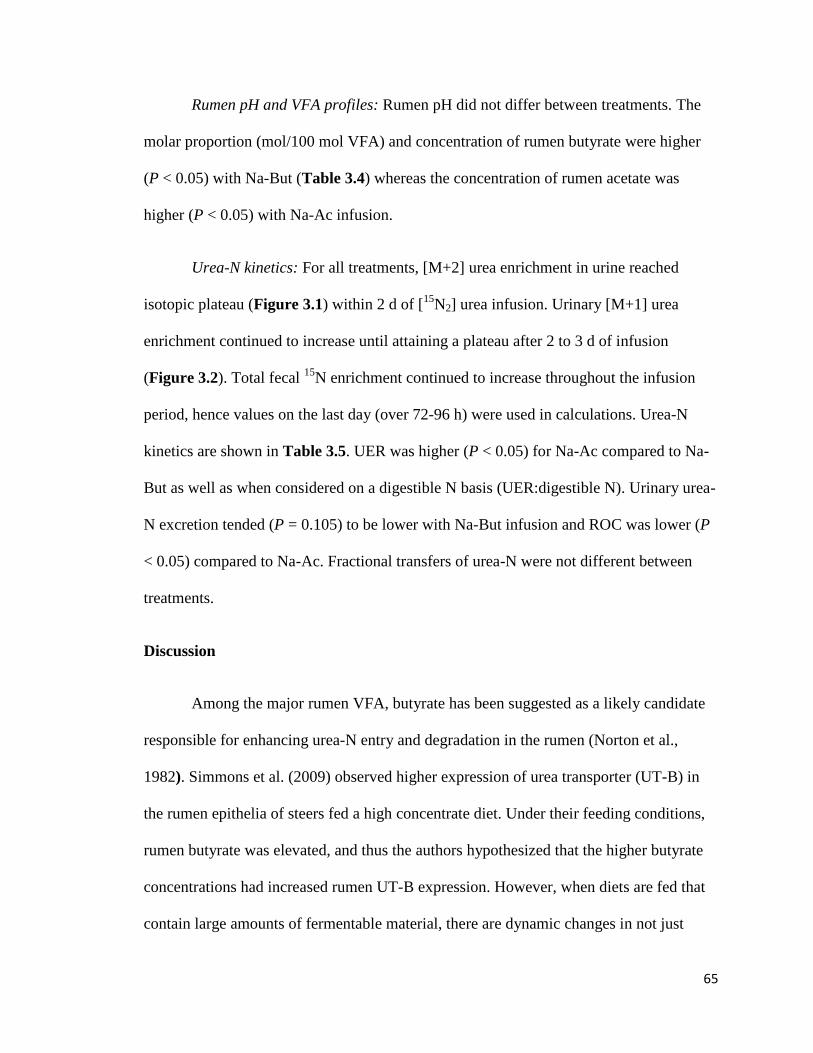
65
Rumen pH and VFA profiles: Rumen pH did not differ between treatments. The
molar proportion (mol/100 mol VFA) and concentration of rumen butyrate were higher
(P < 0.05) with Na-But (Table 3.4) whereas the concentration of rumen acetate was
higher (P < 0.05) with Na-Ac infusion.
Urea-N kinetics: For all treatments, [M+2] urea enrichment in urine reached
isotopic plateau (Figure 3.1) within 2 d of [15
N2] urea infusion. Urinary [M+1] urea
enrichment continued to increase until attaining a plateau after 2 to 3 d of infusion
(Figure 3.2). Total fecal 15
N enrichment continued to increase throughout the infusion
period, hence values on the last day (over 72-96 h) were used in calculations. Urea-N
kinetics are shown in Table 3.5. UER was higher (P < 0.05) for Na-Ac compared to Na-
But as well as when considered on a digestible N basis (UER:digestible N). Urinary urea-
N excretion tended (P = 0.105) to be lower with Na-But infusion and ROC was lower (P
< 0.05) compared to Na-Ac. Fractional transfers of urea-N were not different between
treatments.
Discussion
Among the major rumen VFA, butyrate has been suggested as a likely candidate
responsible for enhancing urea-N entry and degradation in the rumen (Norton et al.,
1982). Simmons et al. (2009) observed higher expression of urea transporter (UT-B) in
the rumen epithelia of steers fed a high concentrate diet. Under their feeding conditions,
rumen butyrate was elevated, and thus the authors hypothesized that the higher butyrate
concentrations had increased rumen UT-B expression. However, when diets are fed that
contain large amounts of fermentable material, there are dynamic changes in not just
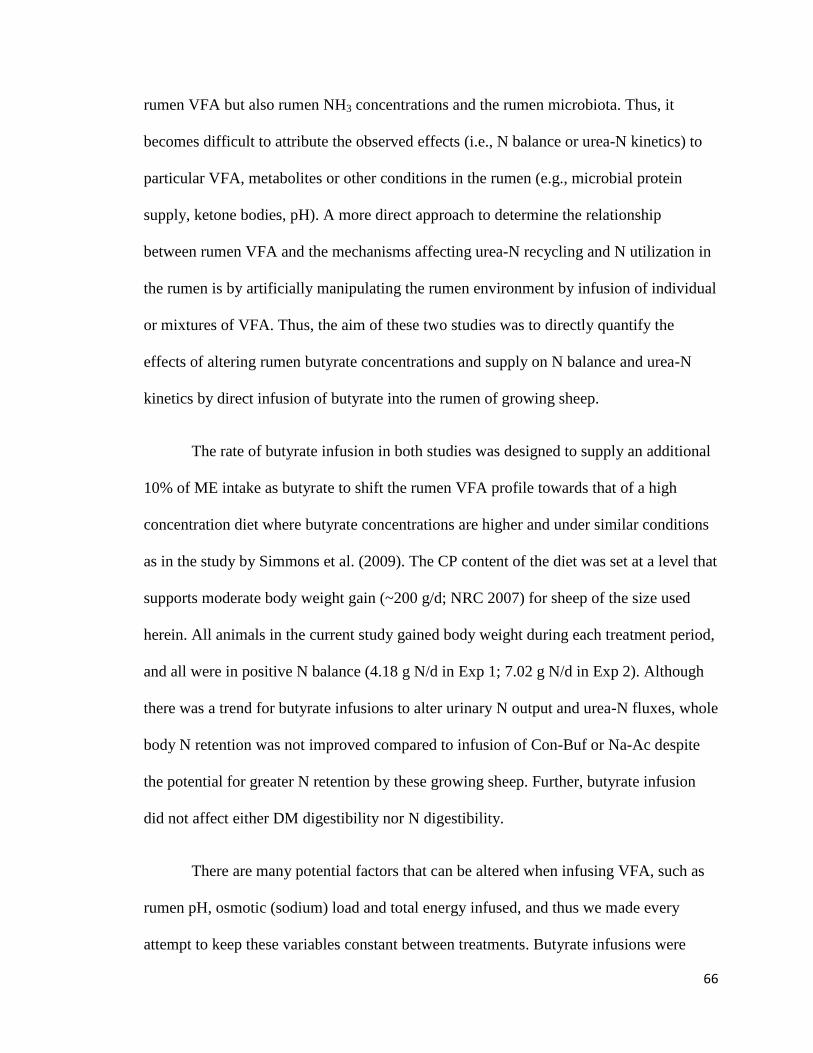
66
rumen VFA but also rumen NH3 concentrations and the rumen microbiota. Thus, it
becomes difficult to attribute the observed effects (i.e., N balance or urea-N kinetics) to
particular VFA, metabolites or other conditions in the rumen (e.g., microbial protein
supply, ketone bodies, pH). A more direct approach to determine the relationship
between rumen VFA and the mechanisms affecting urea-N recycling and N utilization in
the rumen is by artificially manipulating the rumen environment by infusion of individual
or mixtures of VFA. Thus, the aim of these two studies was to directly quantify the
effects of altering rumen butyrate concentrations and supply on N balance and urea-N
kinetics by direct infusion of butyrate into the rumen of growing sheep.
The rate of butyrate infusion in both studies was designed to supply an additional
10% of ME intake as butyrate to shift the rumen VFA profile towards that of a high
concentration diet where butyrate concentrations are higher and under similar conditions
as in the study by Simmons et al. (2009). The CP content of the diet was set at a level that
supports moderate body weight gain (~200 g/d; NRC 2007) for sheep of the size used
herein. All animals in the current study gained body weight during each treatment period,
and all were in positive N balance (4.18 g N/d in Exp 1; 7.02 g N/d in Exp 2). Although
there was a trend for butyrate infusions to alter urinary N output and urea-N fluxes, whole
body N retention was not improved compared to infusion of Con-Buf or Na-Ac despite
the potential for greater N retention by these growing sheep. Further, butyrate infusion
did not affect either DM digestibility nor N digestibility.
There are many potential factors that can be altered when infusing VFA, such as
rumen pH, osmotic (sodium) load and total energy infused, and thus we made every
attempt to keep these variables constant between treatments. Butyrate infusions were
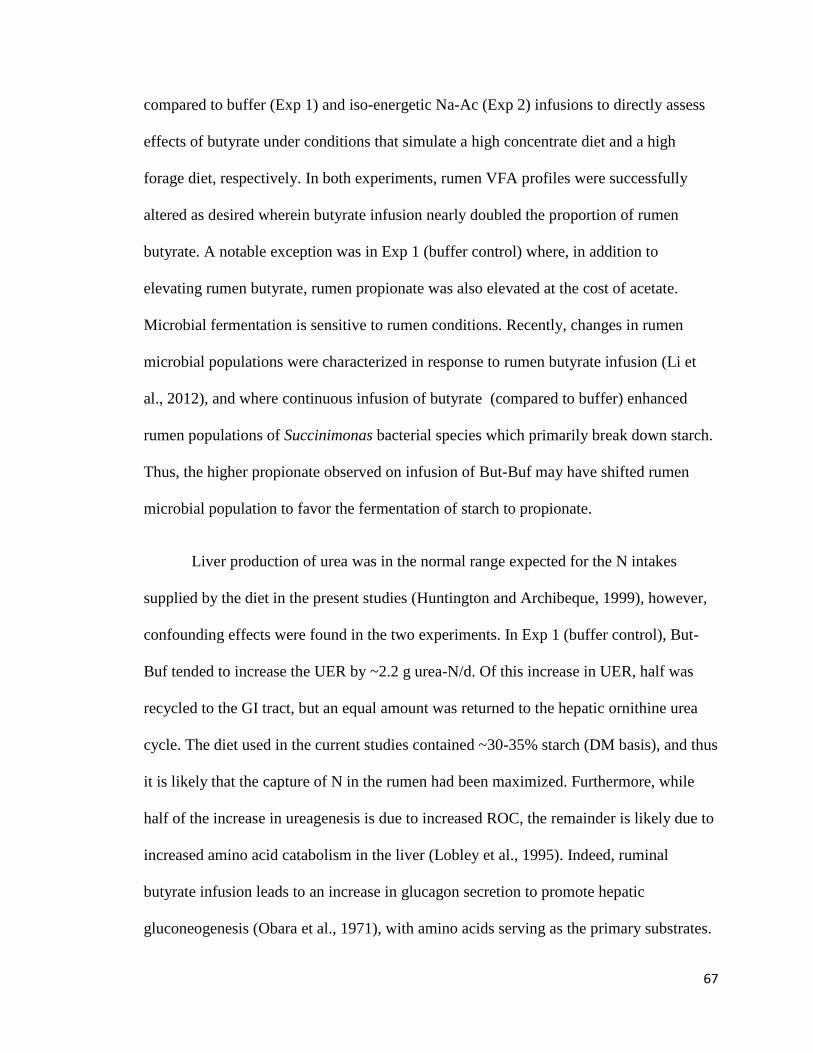
67
compared to buffer (Exp 1) and iso-energetic Na-Ac (Exp 2) infusions to directly assess
effects of butyrate under conditions that simulate a high concentrate diet and a high
forage diet, respectively. In both experiments, rumen VFA profiles were successfully
altered as desired wherein butyrate infusion nearly doubled the proportion of rumen
butyrate. A notable exception was in Exp 1 (buffer control) where, in addition to
elevating rumen butyrate, rumen propionate was also elevated at the cost of acetate.
Microbial fermentation is sensitive to rumen conditions. Recently, changes in rumen
microbial populations were characterized in response to rumen butyrate infusion (Li et
al., 2012), and where continuous infusion of butyrate (compared to buffer) enhanced
rumen populations of Succinimonas bacterial species which primarily break down starch.
Thus, the higher propionate observed on infusion of But-Buf may have shifted rumen
microbial population to favor the fermentation of starch to propionate.
Liver production of urea was in the normal range expected for the N intakes
supplied by the diet in the present studies (Huntington and Archibeque, 1999), however,
confounding effects were found in the two experiments. In Exp 1 (buffer control), But-
Buf tended to increase the UER by ~2.2 g urea-N/d. Of this increase in UER, half was
recycled to the GI tract, but an equal amount was returned to the hepatic ornithine urea
cycle. The diet used in the current studies contained ~30-35% starch (DM basis), and thus
it is likely that the capture of N in the rumen had been maximized. Furthermore, while
half of the increase in ureagenesis is due to increased ROC, the remainder is likely due to
increased amino acid catabolism in the liver (Lobley et al., 1995). Indeed, ruminal
butyrate infusion leads to an increase in glucagon secretion to promote hepatic
gluconeogenesis (Obara et al., 1971), with amino acids serving as the primary substrates.
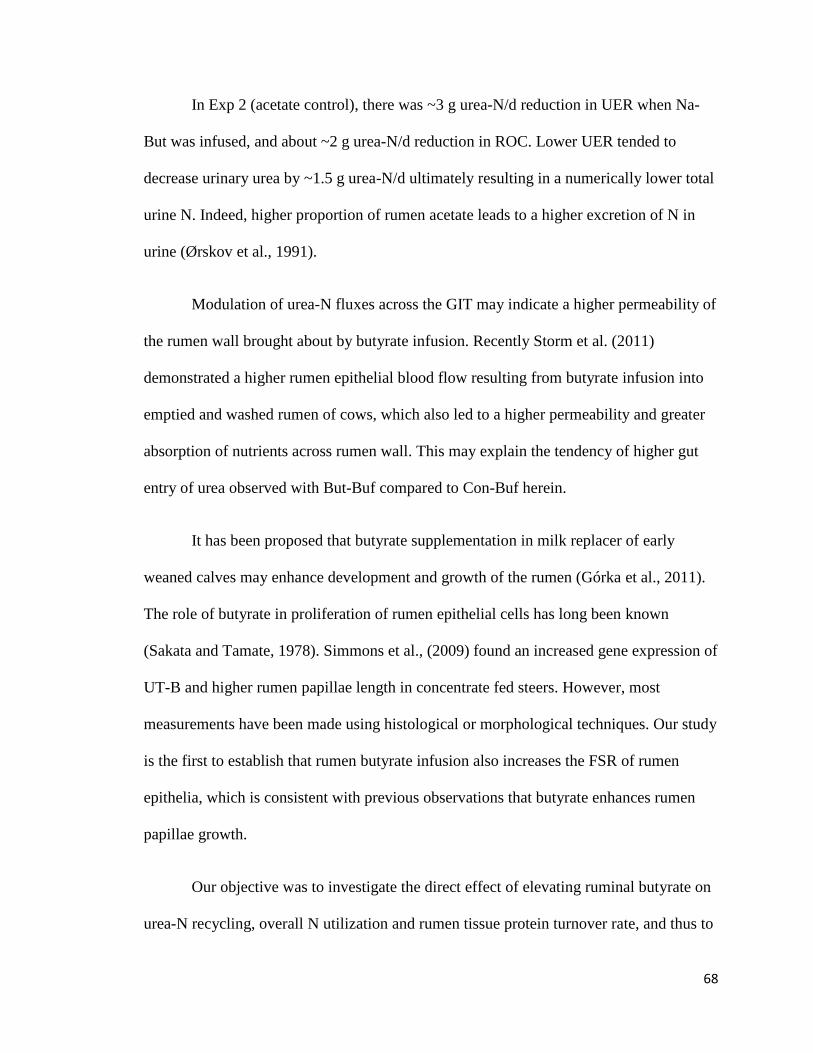
68
In Exp 2 (acetate control), there was ~3 g urea-N/d reduction in UER when Na-
But was infused, and about ~2 g urea-N/d reduction in ROC. Lower UER tended to
decrease urinary urea by ~1.5 g urea-N/d ultimately resulting in a numerically lower total
urine N. Indeed, higher proportion of rumen acetate leads to a higher excretion of N in
urine (Ørskov et al., 1991).
Modulation of urea-N fluxes across the GIT may indicate a higher permeability of
the rumen wall brought about by butyrate infusion. Recently Storm et al. (2011)
demonstrated a higher rumen epithelial blood flow resulting from butyrate infusion into
emptied and washed rumen of cows, which also led to a higher permeability and greater
absorption of nutrients across rumen wall. This may explain the tendency of higher gut
entry of urea observed with But-Buf compared to Con-Buf herein.
It has been proposed that butyrate supplementation in milk replacer of early
weaned calves may enhance development and growth of the rumen (Górka et al., 2011).
The role of butyrate in proliferation of rumen epithelial cells has long been known
(Sakata and Tamate, 1978). Simmons et al., (2009) found an increased gene expression of
UT-B and higher rumen papillae length in concentrate fed steers. However, most
measurements have been made using histological or morphological techniques. Our study
is the first to establish that rumen butyrate infusion also increases the FSR of rumen
epithelia, which is consistent with previous observations that butyrate enhances rumen
papillae growth.
Our objective was to investigate the direct effect of elevating ruminal butyrate on
urea-N recycling, overall N utilization and rumen tissue protein turnover rate, and thus to
69
provide direct evidence of a role for butyrate in upregulation of urea-N transfer to the
rumen. Based on the results of these experiments, butyrate was not found to improve
overall N retention in sheep, even though butyrate did alter urea synthesis and the
redistribution of urea-N fluxes. The results are in agreement with Norton et al. (1982),
who also found that ruminal butyrate does not affect the efficiency of N utilization in
sheep. When compared to Na-Ac infusion, the proportion of urea-N partitioned to the
GIT that was captured for microbial protein synthesis (i.e., GER to UUA) was increased
by butyrate infusion. Thus, butyrate may be acting via other mechanisms (e.g., microbial
dynamics, rumen NH3 fluxes) to enhance capture of recycled urea-N in the rumen.
Obviously, the mechanisms regulating movements of N into and out of the rumen are
complex, and that multiple factors determine the net capture of recycled urea-N. It is also
probable that acetate leads to inefficient use of N. More AA would need to be catabolized
to feed into the Krebs’s cycle (anaplerotic reactions) to metabolize acetate. An interesting
approach to further investigate these N dynamics would be to combine butyrate infusion
with addition of more fermentable carbohydrates to both enhance microbial protein
synthesis and improve overall capture of recycled urea-N. Furthermore, butyrate was
infused constantly in the current studies, which deviates from the more natural patterns of
eating and fermentation. Intermittent feeding may result in a larger response in protein
accretion (El-Kadi et al., 2012), and incorporation of butyrate in the feed might provide a
more synchronous delivery with the needs of energy for digestion.
70
CHAPTER 4: ROLE OF RUMEN PROPIONATE IN
REGULATION OF UREA NITROGEN KINETICS AND
GLUCONEOGENESIS IN GROWING SHEEP
Abstract
Feeding and post-ruminal infusion of propionate is known to increase N retention
in growing ruminants. The aim of this study was to determine the role of rumen
propionate in regulation of urea-N recycling and gluconeogenesis in growing sheep. In
Exp 1, wether sheep (n=6, 32.5 ± 3.57 kg BW), fitted with a rumen cannula, were fed to
1.8 × maintenance energy intake a pelleted concentrate-type ration (170 g CP/kg, 9.3 MJ
ME/kg) and continuously infused into the rumen with iso-energetic (1 MJ/d) solutions of
either Na-Acetate (control) or Na-Propionate for 9-d periods in a balanced crossover
design. In Exp 2, a different group of wether sheep (n=5, 33.6 ± 3.70 kg BW), also fitted
with a rumen cannula, were fed to >1.4 × maintenance energy intake and on an
equivalent protein intake basis either a control (104 g CP/kg, 7.34 MJ ME/kg) or sodium
propionate supplemented (100 g CP/kg, 7.75 MJ ME/kg) ration at 2-h intervals via an
automatic feeder. [15
N2]Urea was continuously infused i.v. for the last 5 d of each period,
and total urine collected by vacuum and feces by a harness bag. Over the last 12 h,
[13
C6]glucose was continuously infused i.v. and hourly blood samples collected during
the last 5 h. Propionate treatments increased (P < 0.001) the proportion of rumen
propionate in both experiments. All animals were in positive N balance (4.34 g N/d in
Exp 1; 2.0 g N/d in Exp 2). In Exp 1, N retention was not affected by propionate infusion
as compared to iso-energetic acetate. There was no effect on urea entry (synthesis) rate
71
(UER) or urea-N recycling in Exp 1, however, Na-Propionate infusion tended (P < 0.1) to
increase urinary urea-N excretion (UUE). In Exp 2, feeding propionate increased (P <
0.01) N retention by ~50%. In addition, UER was reduced by ~2 g urea-N/d, leading to a
reduction (P < 0.05) in UUE (7.0 vs 6.2 g urea-N/d). Between the two experiments, the
proportion of urea-N recycled to the gut was higher with the forage-type diet in Exp 2
(~60%) compared to the concentrate-type diet in Exp 1 (~40%), although urea-N fluxes
across the rumen remained unchanged. Glucose entry and gluconeogenesis were higher
(P < 0.05) and plasma glucose tended (P < 0.1) to be higher in Exp 1 with Na-Propionate
infusion, but there was no change in Cori cycling. In Exp 2, glucose entry,
gluconeogenesis, Cori cycling and plasma glucose increased (P < 0.05) with dietary
propionate. Under the feeding and propionate supplementation conditions of these
studies, higher ruminal propionate does not affect urea-N fluxes across the rumen.
Introduction
Feeding highly rumen fermentable diets increases urea-N recycled to the rumen
(Kennedy and Milligan, 1980; Huntington, 1989) and increases the capture of rumen NH3
by microbes (Stern and Hoover, 1979) leading to lower urinary N losses and hence,
greater N retention (Fluharty et al., 1999). However, the mechanisms which dictate urea-
N kinetics are not well elucidated. Rumen volatile fatty acids (VFA) are a primary
product of rumen fermentation, and are responsible for meeting ~70-80% of the animal’s
energy needs (Bergman and Wolff, 1971). Among the VFA, propionate, which makes up
about 15-40% of the total rumen VFA (Bergman, 1990), may play a key role in
regulation of urea-N kinetics and utilization, as suggested by several studies. Higher
rumen propionate resulting from feeding highly fermentable diets is associated with
72
greater N retention (Abdul–Razzaq and Bickerstaffe, 1989; Obara and Dellow, 1994).
Feeding and post-ruminal infusion of propionate are also known to increase N retention
in growing ruminants, possibly through increasing urea-N recycling and/or
gluconeogenesis (Kim et al., 1999; Baldwin et al., 2012). However, there appears to be an
interaction between feed composition (starch vs fiber) and propionate supplementation on
N retention (Moloney, 1998).
Addition of propionate to the ruminant ration may improve protein efficiency by
several plausible mechanisms. Ruminal propionate enhances epithelial proliferation
(Sakata and Tamate, 1979), and is the main substrate for gluconeogenesis (Bergman,
1990). Thus, propionate may spare amino acids (AA) for energy and gluconeogenesis,
hence reducing AA catabolism, and urea synthesis in the liver. Propionate has also been
shown to inhibit synthesis of N-acetyl glutamate (Stewart and Walser, 1980), the
allosteric regulator of hepatic carbamoyl-phosphate synthetase-I, resulting in a decrease
in urea cycle activity and AA catabolism in the liver. Abdul-Razzak (1989) showed that
diets resulting in a higher propionate-type fermentation stimulates release of insulin and
increased muscle protein synthesis. However, when propionate was delivered intra-
ruminally, no effect was found on hind limb AA balance (Ortigues-Marty, 2003). In this
respect, despite indirect and direct evidence of the role of propionate on N utilization in
ruminants, the underlying mechanisms remain unresolved.
To answer these questions., we conducted two experiments in growing sheep. In
Exp 1, iso-energetic infusions of acetate and propionate were used to simulate
comparisons of a high forage and a high concentrate diet in terms of rumen fermentation
profiles. In Exp 2, forage-type diets with or without added propionate were compared to
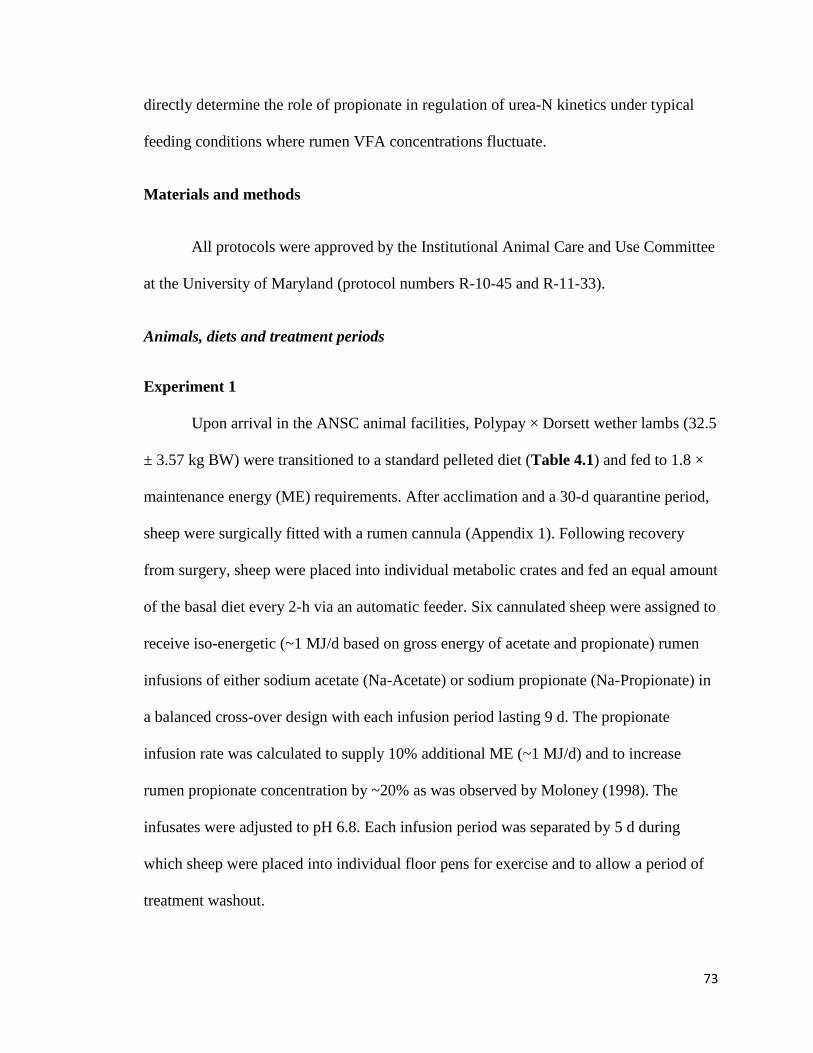
73
directly determine the role of propionate in regulation of urea-N kinetics under typical
feeding conditions where rumen VFA concentrations fluctuate.
Materials and methods
All protocols were approved by the Institutional Animal Care and Use Committee
at the University of Maryland (protocol numbers R-10-45 and R-11-33).
Animals, diets and treatment periods
Experiment 1
Upon arrival in the ANSC animal facilities, Polypay × Dorsett wether lambs (32.5
± 3.57 kg BW) were transitioned to a standard pelleted diet (Table 4.1) and fed to 1.8 ×
maintenance energy (ME) requirements. After acclimation and a 30-d quarantine period,
sheep were surgically fitted with a rumen cannula (Appendix 1). Following recovery
from surgery, sheep were placed into individual metabolic crates and fed an equal amount
of the basal diet every 2-h via an automatic feeder. Six cannulated sheep were assigned to
receive iso-energetic (~1 MJ/d based on gross energy of acetate and propionate) rumen
infusions of either sodium acetate (Na-Acetate) or sodium propionate (Na-Propionate) in
a balanced cross-over design with each infusion period lasting 9 d. The propionate
infusion rate was calculated to supply 10% additional ME (~1 MJ/d) and to increase
rumen propionate concentration by ~20% as was observed by Moloney (1998). The
infusates were adjusted to pH 6.8. Each infusion period was separated by 5 d during
which sheep were placed into individual floor pens for exercise and to allow a period of
treatment washout.
74
Table 4.1: Composition of diet for Exp 1.
Item Amount, g/kg (as fed)
Ingredient
Ground Corn 385
Alfalfa 540
Soybean Meal 50
Vitamin-mineral premix1 25
Chemical composition (g/kg DM)
DM 886
CP 172
Soluble Protein 49
ADF 192
NDF 298
Starch 294
Crude fat 33
TDN 689
Nem, MJ/kg 6.64
Neg, MJ/kg 4.15
1Bel Air sheep mineral vitamin mixture (per kg of premix): Ca, 210 g; P, 30 g; NaCl, 160
g; S, 30 g; Mg, 25 g; K, 24 g; Fe, 2.4 g; Mn, 2.4 g; Zn, 2.7 g; Se, 24 mg; Co, 30 mg; I, 40
mg; Choline-Cl, 4.41 g; vitamin A, 661,500 IU; vitamin D3 132,300 IU; vitamin E, 1,764
IU.
DM: dry matter; CP: crude protein; ADF: acid detergent fiber; NDF: neutral detergent
fiber; TDN: total digestible nutrients
75
Experiment 2
Five Polypay × Dorsett wether lambs (33.6 ± 3.70 kg BW) were transitioned to a
forage-type diet (Table 4.2) and fed to 1.4 × ME requirements. The sheep were similarly
fed and prepared with rumen cannulas as in Exp 1. Following recovery from surgery,
sheep were assigned to receive either the control diet or the control diet supplemented
with sodium propionate (Table 4.2) in a balanced cross-over design with each period
lasting 9 d. During the last 5 d, sheep were placed into individual metabolic crates for N
balances, urea-N kinetics and gluconeogenic measurements (see below). Each period was
separated by 5 d for washout.
Tracer infusion
Temporary jugular vein catheters were inserted at least 2 d prior to initiating
isotope infusions. Over the last 5 (Exp 1) or 4 (Exp 2) days of each treatment period a
sterile solution containing [15
N2]urea (99 atom percent 15
N, Cambridge Isotope
Laboratories Inc., Andover, MA) was continuously infused (0.6 g/d) through a jugular
vein catheter. It has been shown that this length of [15
N2]urea infusion results in the
attainment of isotopic plateau in urinary [15
N14
N] and [15
N15
N]urea enrichment and that
this infusion rate increases the urinary [15
N15
N]urea enrichment to 1.5-2.5 atoms percent
excess (APE) (Sunny et al., 2007). Glucose kinetics were measured by infusion of
[13
C6]glucose. On the last day of each experimental period, an i.v. bolus (priming) dose
(0.45 g) of [13
C6]glucose was administered followed by continuous infusion (0.15 g/h) for
9 h.
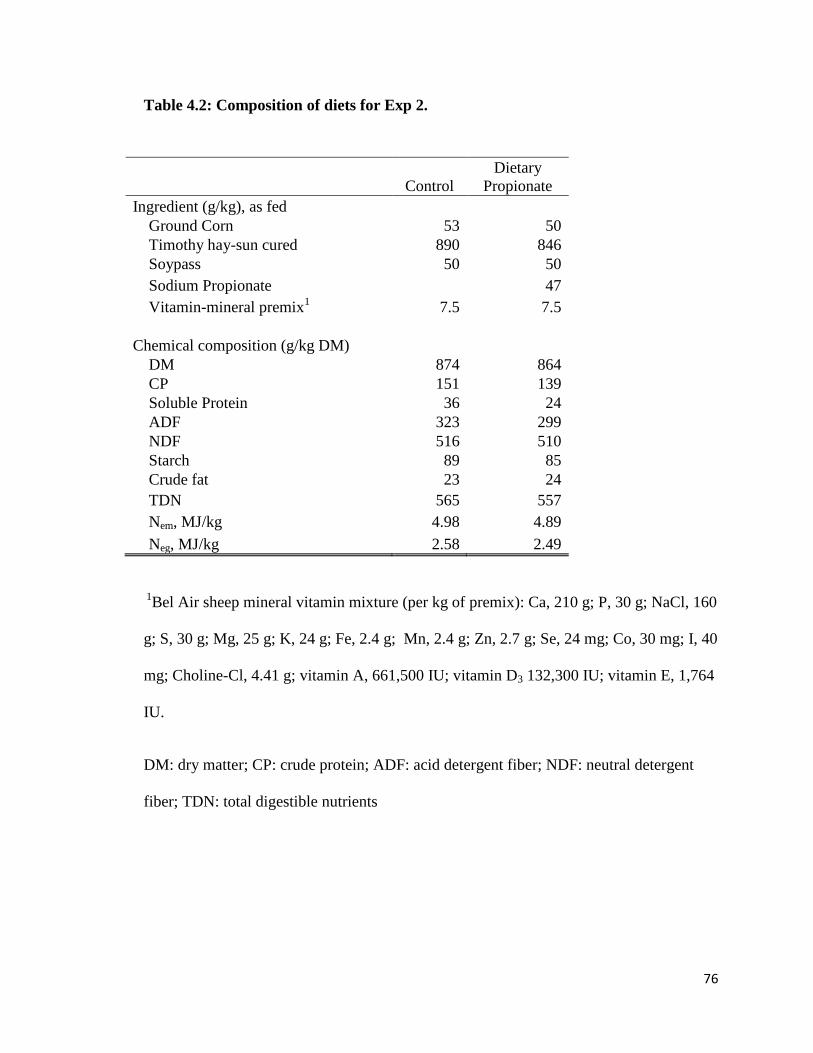
76
Table 4.2: Composition of diets for Exp 2.
Control
Dietary
Propionate
Ingredient (g/kg), as fed
Ground Corn 53 50
Timothy hay-sun cured 890 846
Soypass 50 50
Sodium Propionate 47
Vitamin-mineral premix1 7.5 7.5
Chemical composition (g/kg DM)
DM 874 864
CP 151 139
Soluble Protein 36 24
ADF 323 299
NDF 516 510
Starch 89 85
Crude fat 23 24
TDN 565 557
Nem, MJ/kg 4.98 4.89
Neg, MJ/kg 2.58 2.49
1Bel Air sheep mineral vitamin mixture (per kg of premix): Ca, 210 g; P, 30 g; NaCl, 160
g; S, 30 g; Mg, 25 g; K, 24 g; Fe, 2.4 g; Mn, 2.4 g; Zn, 2.7 g; Se, 24 mg; Co, 30 mg; I, 40
mg; Choline-Cl, 4.41 g; vitamin A, 661,500 IU; vitamin D3 132,300 IU; vitamin E, 1,764
IU.
DM: dry matter; CP: crude protein; ADF: acid detergent fiber; NDF: neutral detergent
fiber; TDN: total digestible nutrients
77
Sampling
During the last 5 d of each treatment period, sheep were fitted with a harness for
total collection of feces (by bag) and urine (by suction), which were weighed and
recorded. A slight vacuum was used to collect urine directly into a sealed container
placed on a stir plate and containing sufficient HCl to reduce urine pH to < 3 to prevent
bacterial hydrolysis of urea and ammonia volatilization. Well-mixed sub-samples from
each collection (100 g feces and 40 g urine) were stored at -20oC for later analysis. Over
the last 6 h of tracer infusion, urine samples were also collected at 2 h intervals and later
analyzed to verify that plateau of [15
N2]urea enrichment in urine had been attained.
Hourly blood samples were collected during the last 5 h. Plasma was separated by
centrifugation (1,000 × g for 15 min at 4oC) and stored at -20
oC for later analysis. At the
end of each experimental period, following collection of the last sample, sheep were
removed from crates and within 10 min the rumen was completely evacuated by vacuum.
The rumen fluid was mixed well and a representative sample (50 mL) strained through
two layers of cheese cloth. The strained rumen fluid was immediately centrifuged (1,000
× g for 10 min at 4oC) and the pH of the supernatant recorded using a pH indicator strip
(VWR International, West Chester, PA). For determination of VFA concentration, to a
known amount (1 g) of rumen fluid was added a known weight (0.25 g) of an internal
standard mixture (260 mM [1-13
C]acetate, 80 mM [methyl-D3]propionate and 40 mM [1-
13C]butyrate), and the samples stored at -20
o C for later analysis.
78
Urea concentration and enrichment
The concentration and enrichment of plasma and urinary urea were determined by
gas chromatography-mass spectrometry (GC-MS, Agilent 6890 series gas
chromatography system coupled to an Agilent 5973N mass selective detector; Agilent;
Palo Alto, CA) under electron ionization (EI) mode. For determination of urinary urea
concentration, to a known weight (0.25 g) of an internal standard solution containing
[13
C, 15
N2]urea (5 mg/g) was added an equal known weight of urine. For plasma urea
concentration, a known amount (0.5 g) of internal standard containing [13
C, 15
N2]urea
(0.26 mg/g) was added to an equal known weight of plasma. Plasma and urine samples
were acidified by adding an equal volume of 15% sulfosalicylic acid or 10%
trichloroacetic acid (w/v), respectively, and centrifuged for 10 min at 10,000 × g at room
temperature to precipitate proteins and other debris. Urea was isolated from acidified
samples by application to 0.5 g of cation exchange resin (AG 50W-X8 resin, 100-200
mesh, Bio-Rad Laboratories, Hercules, CA). The resin was washed with 2 × 2 mL of
water and urea eluted with 2 mL of ammonium hydroxide plus 1 mL of double distilled
water. An aliquot (100 to 200 μl) of the elute was dried under N2 gas and the tertiary-
butyldimethylsilyl derivative of urea was prepared by adding 50 μl each of acetonitrile
(Pierce chemicals , Rockford, IL) and N-methyl-N-t-butyl-dimethylsilyl-
trifluroacetamide (MTBSTFA, Pierce chemicals , Rockford, IL) followed by heating at
90oC for 20 min (El-Kadi et al., 2006). Derivatized urea samples were separated on a
fused silica capillary column (HP-50; 30 m × 0.25 mm × 1 µm Hewlett-Packard, Palo
Alto, CA) prior to MS under EI conditions. Ions of mass-to-charge (m/z) 231.2
(unlabeled; M0), 232.2 (singly labeled; [M+1]), 233.2 (doubly labeled; [M+2]), and
79
234.2 (internal standard; [M+3]) were monitored. The GC inlet was set at 250 o
C and the
GC conditions were: initial temperature of 150oC followed by 15
oC/min to 250
oC. Urea
concentration in the samples was calculated by isotope dilution (Calder et al., 1999)
based on the ratios of [M+3]:[M0]urea after correction for background (natural
abundance) and spillover effects of the enriched [M+2]urea.
Total urinary and fecal N, and fecal 15
N
Total urinary and fecal N were measured using an automated N analyzer (CN-
2000, Leco, St. Joseph, MI). Fecal samples were dried in a forced-air drying oven at 60oC
for 5 d. Dried samples were pulverized in a liquid nitrogen freezer mill (Freezer-Mill
6850, Spex CertiPrep Inc., Metuchen, NJ) and samples submitted to the stable isotope
facility at the University of California-Davis (CA) for 15
N analysis by isotope-ratio mass
spectrometry.
Rumen fluid VFA concentration
Samples were thawed and acidified by adding 250 µL of 2 M HCl, and
centrifuged for 15 min at 13,000 × g at room temperature to precipitate solids. The
supernatant was filtered through a 0.2 µm filter (Nalgene, Rochester, NY), and anhydrous
ether (0.5 mL) added to extract VFA. An aliquot (200 μl) of extracted VFA was
converted to the tert-butyldimethylsilyl derivative by adding 50 µL MTBSTFA followed
by heating at 80oC for 20 min (Duncan et al., 2004). After samples had cooled, 50 µL of
methanol was added to react with the surplus MTBSTFA. Derivatized samples were
injected onto the GC column (fused silica capillary column, HP-5; 30 m × 0.25 mm × 1
µm Hewlett-Packard) with the GC inlet set at 250C and the following columns
80
conditions: initial temperature of 60oC held for 3 min followed by 10
oC/min to 210
oC for
4 min. Ions of m/z 117 and 118 for acetate, 131 and 134 for propionate and 145 and 146
for butyrate were monitored. VFA concentrations were calculated by isotope dilution
(Calder et al., 1999).
Glucose concentration and enrichment
For determination of plasma glucose concentration, a known amount (0.5 g) of an
internal standard containing [13
C6; 1, 2, 3, 4, 5, 6, 6-2H7]glucose (4 mM in 0.1 M HCl)
was added to an equal known weight of plasma. The samples were acidified with an
equal volume of 15% sulfosalicylic acid (w/v) and centrifuged for 10 min at 10,000 × g at
room temperature to precipitate proteins. The supernatant was applied to 0.5 g cation-
exchange resin (AG 50W-X8 resin, 100-200 mesh) and the glucose containing fraction
eluted with 2 mL distilled water, frozen and lyophilized to dryness. Glucose was
converted to the di-O-isopropylidene derivative for GC-MS analysis (Hachey et al.,
1999). Briefly, to the freeze dried sample was added 1 mL of freshly prepared 0.38 M
sulfuric acid in acetone. The solution was incubated for 1 h at room temperature after
which it was neutralized by the addition of 3 mL of 0.44 M sodium carbonate. After the
addition of 3 mL of saturated NaCl, the glucose derivative was back extracted with 3 mL
of ethyl acetate. The upper ethyl acetate phase was dried under N2 gas. Next, the di-O-
isopropylidene derivative was acetylated by the addition of 50 µL each of ethyl acetate
and acetic anhydride followed by heating for 30 min at 60oC. The glucose derivative was
separated on a fused silica capillary column (HP-5; 30 m × 0.25 mm × 1 µm, Hewlett-
Packard) prior to MS under EI conditions. The GC inlet was set at 250C and the
following columns conditions: initial temperature of 80oC followed by 10
oC/min to
81
260oC. Ions of m/z 287 to 293 (glucose isotopomers [M0] to [M+6]) and 300 (internal
standard; [M+13]) were monitored. Glucose concentration in samples was calculated by
isotope dilution (Calder et al., 1999) based on the ratio of [M+13]:[M0]glucose after
correction for background (natural abundance), and corrected for the concentration of
[M+1]-[M+6]glucose isotopomers. The enrichments of plasma glucose were corrected
for natural abundance using a matrix approach (Fernandez et al., 1996).
Calculations
Urea N kinetics: Urea-N kinetic calculations were based on Lobley et al. (2000).
Whole body urea synthesis (urea entry rate; UER) was estimated from the dilution of the
infused [15
N2]urea tracer. A portion of UER is excreted into urine (UUE), whereas the
remainder enters the gut tissues (GER). Urea entering the gut has three different fates: 1)
excretion in feces (UFE), 2) hydrolysis by rumen microbes with absorption of NH3 and
return to the ornithine-urea cycle (ROC), and 3) utilization by gut microbes for protein
synthesis (anabolic use, UUA). UFE and ROC are estimated directly from excretion of
fecal 15
N and based on the appearance of urinary [15
N14
N]urea, respectively. UUA is
estimated by the difference between GER and UFE+ROC. An important assumption in
this model is that all the doubly labeled urea in urine is derived from the infused tracer.
Calculations for urea-N kinetics are shown in Appendix 3.
Gluconeogenesis: Gluconeogenesis and glucose recycling (Cori cycling) were
estimated using corrected mass isotopomer distribution (MID) enrichments according to a
method described by Tayek and Katz (1997), where:
82
Glucose entry (g/d) = (([13
C6]glucose tracer purity (%) / [M+6]glucose) – 1) ×
[13
C6]glucose infusion rate (g/d)
Cori cycling (g/d) = ([M+1] + [M+2] + [M+3]) / ([M+1] + [M+2] + [M+3] +
[M+6]) × glucose entry (g/d)
Gluconeogenesis, i.e. gluconeogenesis from non-glucose sources, was calculated by
difference as,
Gluconeogenesis (g/d) = Glucose entry - Cori cycling
Glucose entry represents the appearance in blood of glucose derived from
absorption and from synthesis in the body. However, because dietary starch is extensively
fermented by rumen microbes and the fact that nearly all glucose absorbed across the
intestines is metabolized, it is safe to assume that net glucose absorption across the gut is
negligible (El-Kadi et al., 2006). Thus, glucose entry largely reflects Cori cycling and
gluconeogenesis.
Statistical Analysis
Animals were nested within groups. Treatment and period were considered to be
fixed effects and animals within group were considered to be random effects. Data were
analyzed using the PROC MIXED procedure of SAS 9.2 (SAS Institute Inc., Cary, NC).
83
The following linear model was used to analyze the data:
Yijk = µ + groupi + animalij + periodk + treatmenth + errorijk
where,
Yijk = response variable (UER, UUE etc.) in the kth
period of the jth
animal in the ith
group (i = 1, 2; j = 1 to n; k = 1, 2)
µ = the overall mean effect
groupi = the effect of the ith
group (i = 1,2)
animalij = the effect of the jth
animal on the ith
group (j = 1, 2, .. , ni)
periodk = the effect of the kth
period (k = 1,2)
treatmenth = the effect of the hth
treatment (h = 1,2; being a function of i & k)
errorijk = the residual error
Statistical significance was set at P ≤ 0.05 and a trend at P ≤ 0.10.
Results
Experiment 1: Na-Propionate vs Na-Acetate (control)
Feed intake, digestibility and N-retention: There were no feed refusals and all
animals gained weight during the experiment. Dietary DM (66 to 72%) and N (62 to
72%) digestibility did not differ between treatments (Table 4.3). There was no effect of
Na-Propionate infusion on N retention, and urinary and fecal N outputs compared to Na-
Acetate.
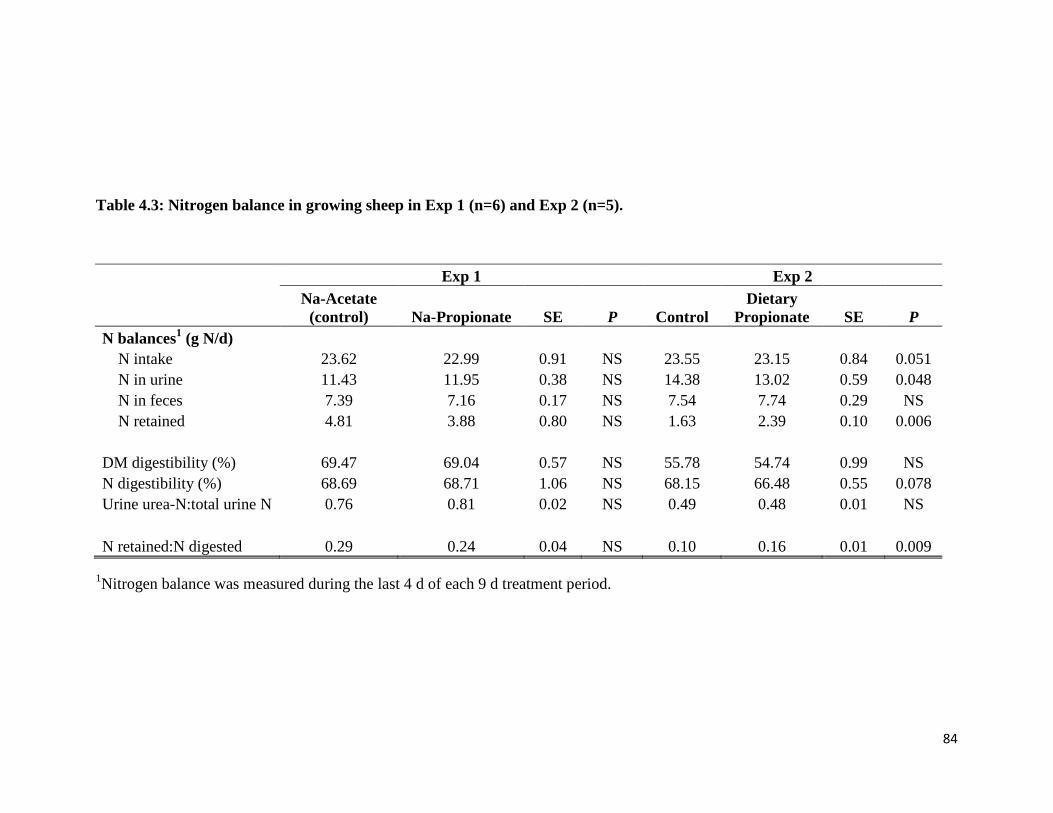
84
Table 4.3: Nitrogen balance in growing sheep in Exp 1 (n=6) and Exp 2 (n=5).
Exp 1 Exp 2
Na-Acetate
(control) Na-Propionate SE P Control
Dietary
Propionate SE P
N balances1 (g N/d)
N intake 23.62 22.99 0.91 NS 23.55 23.15 0.84 0.051
N in urine 11.43 11.95 0.38 NS 14.38 13.02 0.59 0.048
N in feces 7.39 7.16 0.17 NS 7.54 7.74 0.29 NS
N retained 4.81 3.88 0.80 NS 1.63 2.39 0.10 0.006
DM digestibility (%) 69.47 69.04 0.57 NS 55.78 54.74 0.99 NS
N digestibility (%) 68.69 68.71 1.06 NS 68.15 66.48 0.55 0.078
Urine urea-N:total urine N 0.76 0.81 0.02 NS 0.49 0.48 0.01 NS
N retained:N digested 0.29 0.24 0.04 NS 0.10 0.16 0.01 0.009
1Nitrogen balance was measured during the last 4 d of each 9 d treatment period.
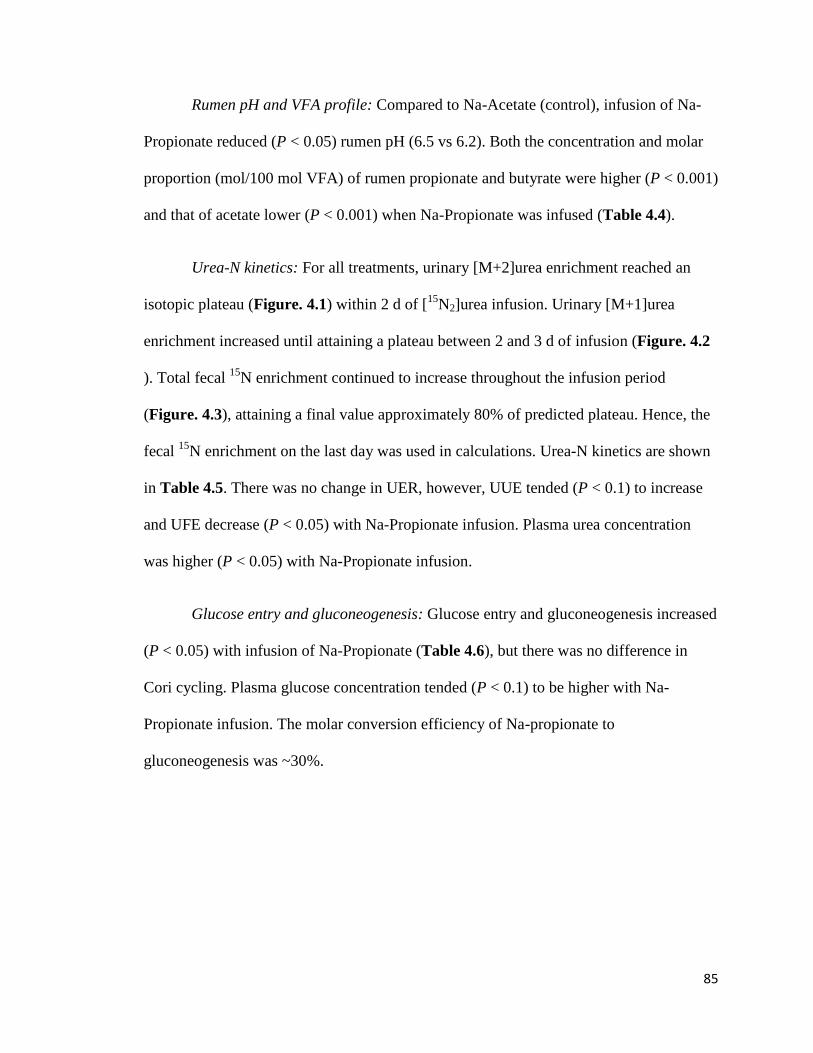
85
Rumen pH and VFA profile: Compared to Na-Acetate (control), infusion of Na-
Propionate reduced (P < 0.05) rumen pH (6.5 vs 6.2). Both the concentration and molar
proportion (mol/100 mol VFA) of rumen propionate and butyrate were higher (P < 0.001)
and that of acetate lower (P < 0.001) when Na-Propionate was infused (Table 4.4).
Urea-N kinetics: For all treatments, urinary [M+2]urea enrichment reached an
isotopic plateau (Figure. 4.1) within 2 d of [15
N2]urea infusion. Urinary [M+1]urea
enrichment increased until attaining a plateau between 2 and 3 d of infusion (Figure. 4.2
). Total fecal 15
N enrichment continued to increase throughout the infusion period
(Figure. 4.3), attaining a final value approximately 80% of predicted plateau. Hence, the
fecal 15
N enrichment on the last day was used in calculations. Urea-N kinetics are shown
in Table 4.5. There was no change in UER, however, UUE tended (P < 0.1) to increase
and UFE decrease (P < 0.05) with Na-Propionate infusion. Plasma urea concentration
was higher (P < 0.05) with Na-Propionate infusion.
Glucose entry and gluconeogenesis: Glucose entry and gluconeogenesis increased
(P < 0.05) with infusion of Na-Propionate (Table 4.6), but there was no difference in
Cori cycling. Plasma glucose concentration tended (P < 0.1) to be higher with Na-
Propionate infusion. The molar conversion efficiency of Na-propionate to
gluconeogenesis was ~30%.
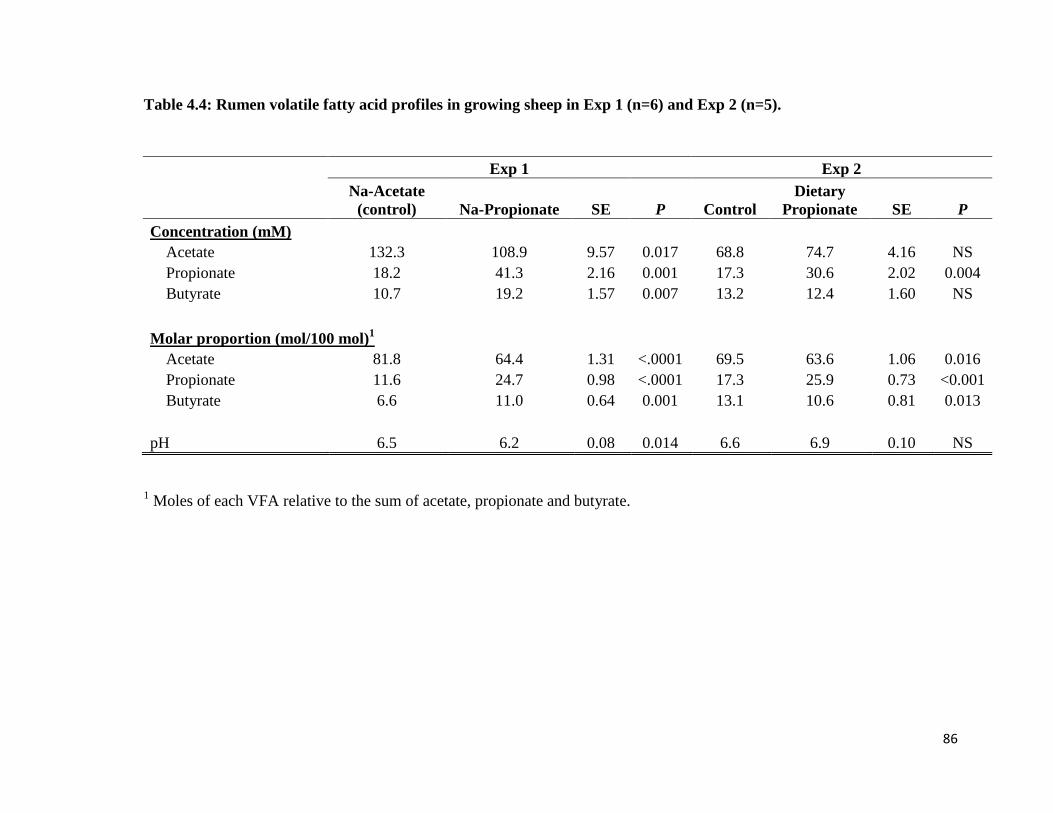
86
Table 4.4: Rumen volatile fatty acid profiles in growing sheep in Exp 1 (n=6) and Exp 2 (n=5).
Exp 1 Exp 2
Na-Acetate
(control) Na-Propionate SE P Control
Dietary
Propionate SE P
Concentration (mM)
Acetate 132.3 108.9 9.57 0.017 68.8 74.7 4.16 NS
Propionate 18.2 41.3 2.16 0.001 17.3 30.6 2.02 0.004
Butyrate 10.7 19.2 1.57 0.007 13.2 12.4 1.60 NS
Molar proportion (mol/100 mol)1
Acetate 81.8 64.4 1.31 <.0001 69.5 63.6 1.06 0.016
Propionate 11.6 24.7 0.98 <.0001 17.3 25.9 0.73 <0.001
Butyrate 6.6 11.0 0.64 0.001 13.1 10.6 0.81 0.013
pH 6.5 6.2 0.08 0.014 6.6 6.9 0.10 NS
1 Moles of each VFA relative to the sum of acetate, propionate and butyrate.
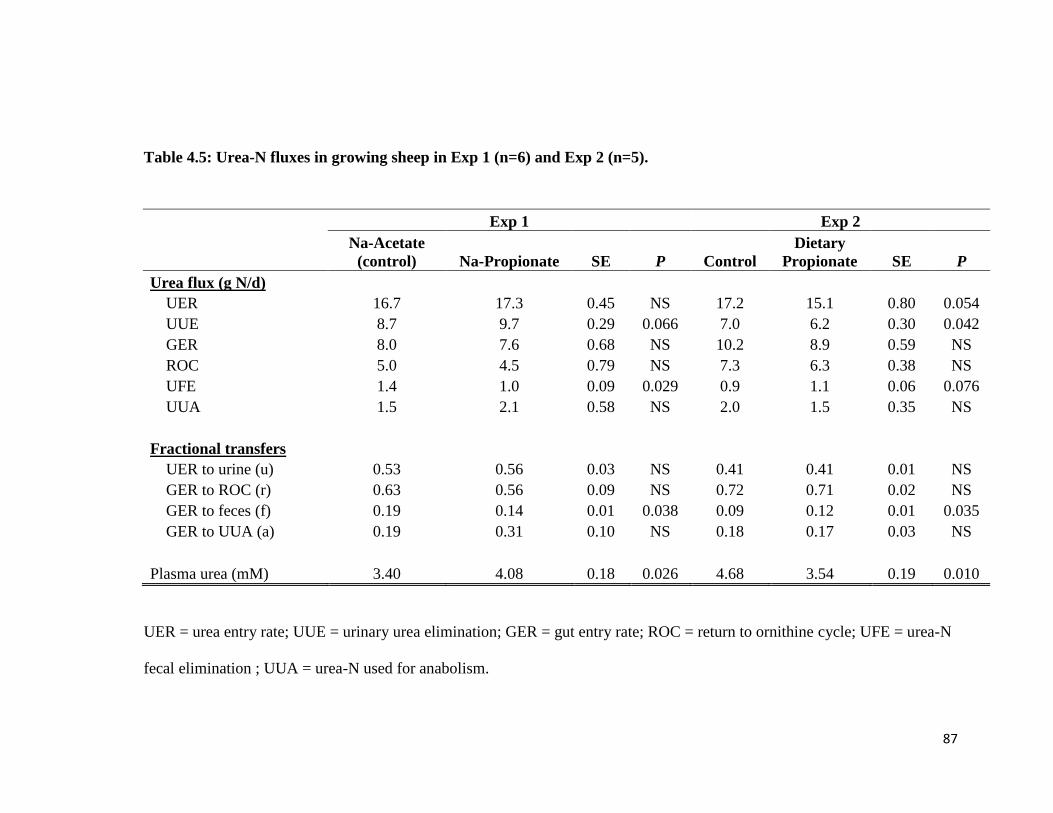
87
Table 4.5: Urea-N fluxes in growing sheep in Exp 1 (n=6) and Exp 2 (n=5).
Exp 1 Exp 2
Na-Acetate
(control) Na-Propionate SE P Control
Dietary
Propionate SE P
Urea flux (g N/d)
UER 16.7 17.3 0.45 NS 17.2 15.1 0.80 0.054
UUE 8.7 9.7 0.29 0.066 7.0 6.2 0.30 0.042
GER 8.0 7.6 0.68 NS 10.2 8.9 0.59 NS
ROC 5.0 4.5 0.79 NS 7.3 6.3 0.38 NS
UFE 1.4 1.0 0.09 0.029 0.9 1.1 0.06 0.076
UUA 1.5 2.1 0.58 NS 2.0 1.5 0.35 NS
Fractional transfers
UER to urine (u) 0.53 0.56 0.03 NS 0.41 0.41 0.01 NS
GER to ROC (r) 0.63 0.56 0.09 NS 0.72 0.71 0.02 NS
GER to feces (f) 0.19 0.14 0.01 0.038 0.09 0.12 0.01 0.035
GER to UUA (a) 0.19 0.31 0.10 NS 0.18 0.17 0.03 NS
Plasma urea (mM) 3.40 4.08 0.18 0.026 4.68 3.54 0.19 0.010
UER = urea entry rate; UUE = urinary urea elimination; GER = gut entry rate; ROC = return to ornithine cycle; UFE = urea-N
fecal elimination ; UUA = urea-N used for anabolism.
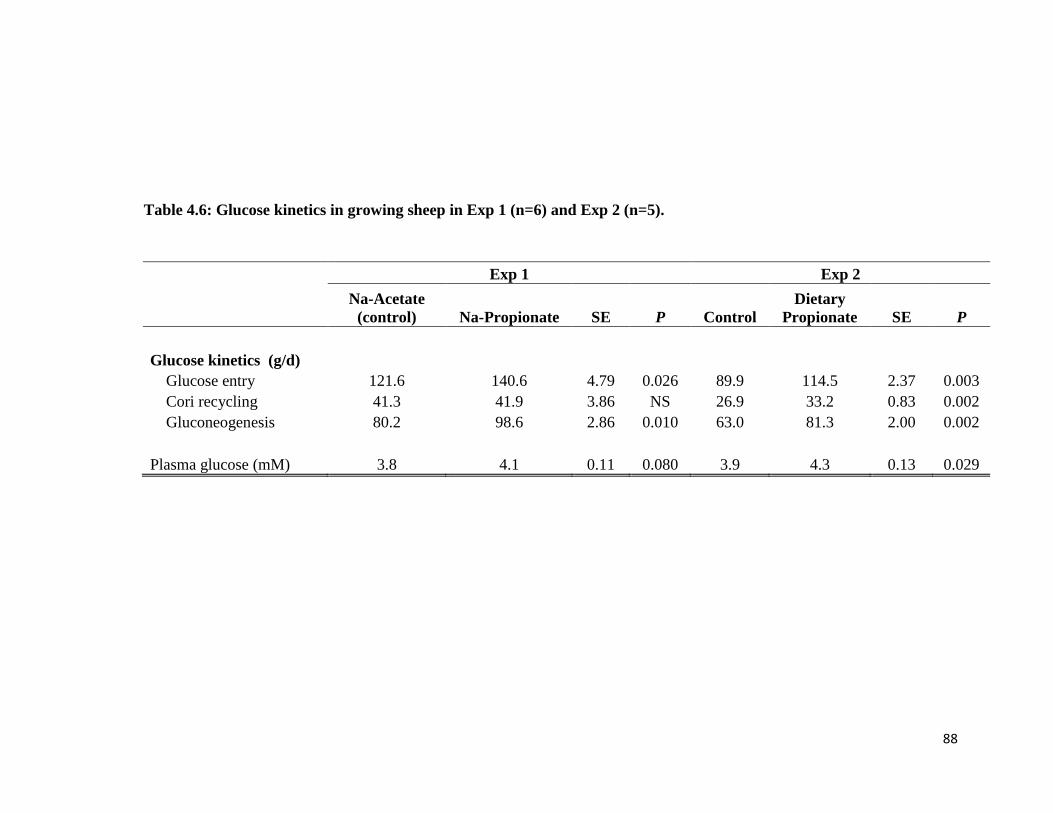
88
Table 4.6: Glucose kinetics in growing sheep in Exp 1 (n=6) and Exp 2 (n=5).
Exp 1 Exp 2
Na-Acetate
(control) Na-Propionate SE P Control
Dietary
Propionate SE P
Glucose kinetics (g/d)
Glucose entry 121.6 140.6 4.79 0.026 89.9 114.5 2.37 0.003
Cori recycling 41.3 41.9 3.86 NS 26.9 33.2 0.83 0.002
Gluconeogenesis 80.2 98.6 2.86 0.010 63.0 81.3 2.00 0.002
Plasma glucose (mM) 3.8 4.1 0.11 0.080 3.9 4.3 0.13 0.029
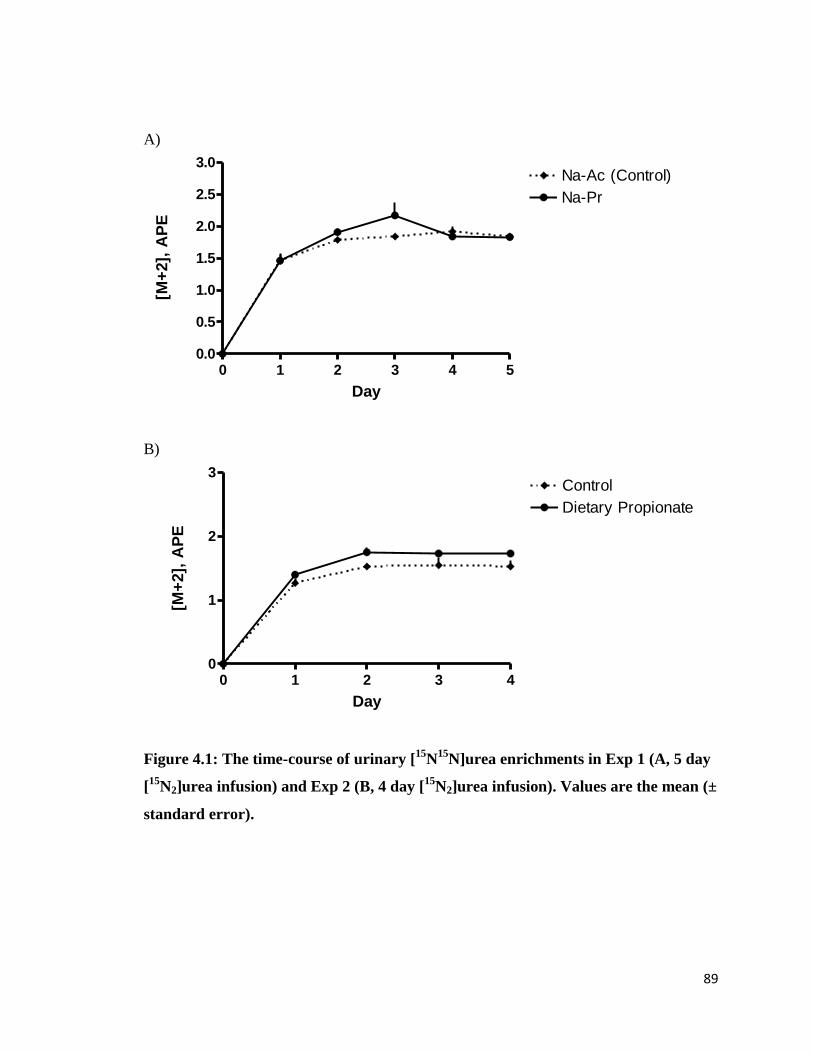
89
A)
B)
Figure 4.1: The time-course of urinary [15
N15
N]urea enrichments in Exp 1 (A, 5 day
[15
N2]urea infusion) and Exp 2 (B, 4 day [15
N2]urea infusion). Values are the mean (±
standard error).
0 1 2 3 4 50.0
0.5
1.0
1.5
2.0
2.5
3.0
Na-Pr
Na-Ac (Control)
Day
[M+
2],
AP
E
0 1 2 3 40
1
2
3
Dietary Propionate
Control
Day
[M+
2],
AP
E
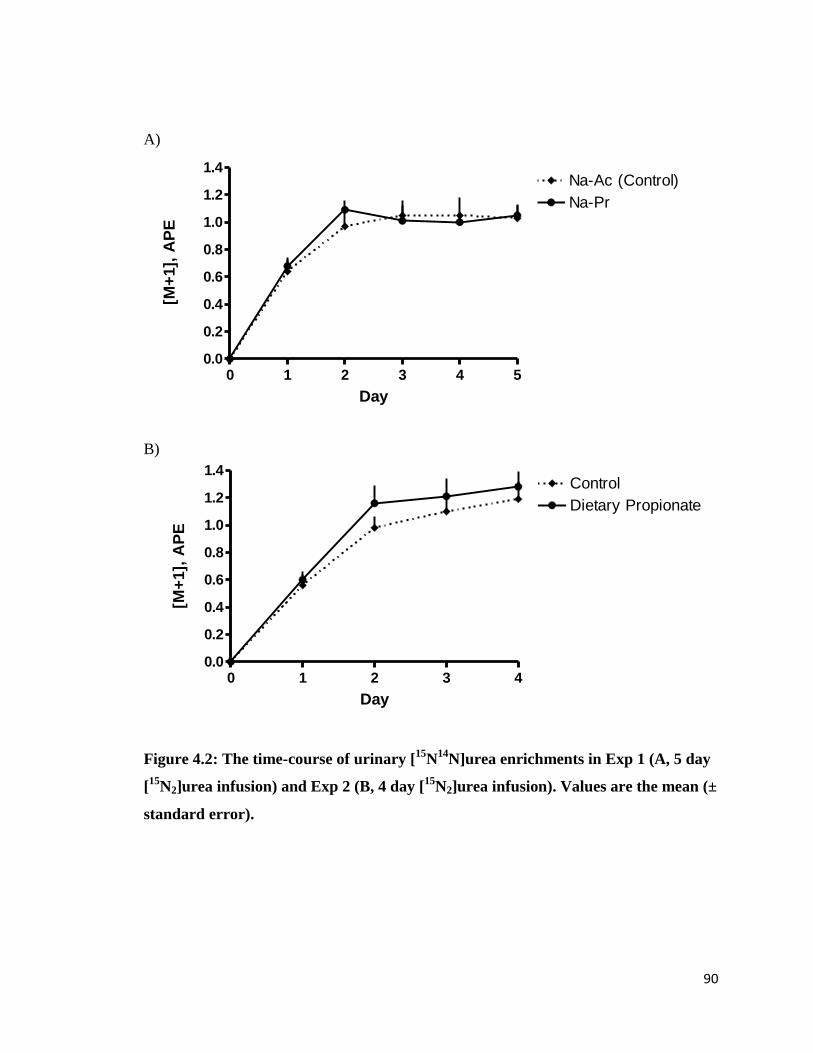
90
A)
B)
Figure 4.2: The time-course of urinary [15
N14
N]urea enrichments in Exp 1 (A, 5 day
[15
N2]urea infusion) and Exp 2 (B, 4 day [15
N2]urea infusion). Values are the mean (±
standard error).
0 1 2 3 4 50.0
0.2
0.4
0.6
0.8
1.0
1.2
1.4
Na-Pr
Na-Ac (Control)
Day
[M+
1],
AP
E
0 1 2 3 40.0
0.2
0.4
0.6
0.8
1.0
1.2
1.4
Dietary Propionate
Control
Day
[M+
1],
AP
E
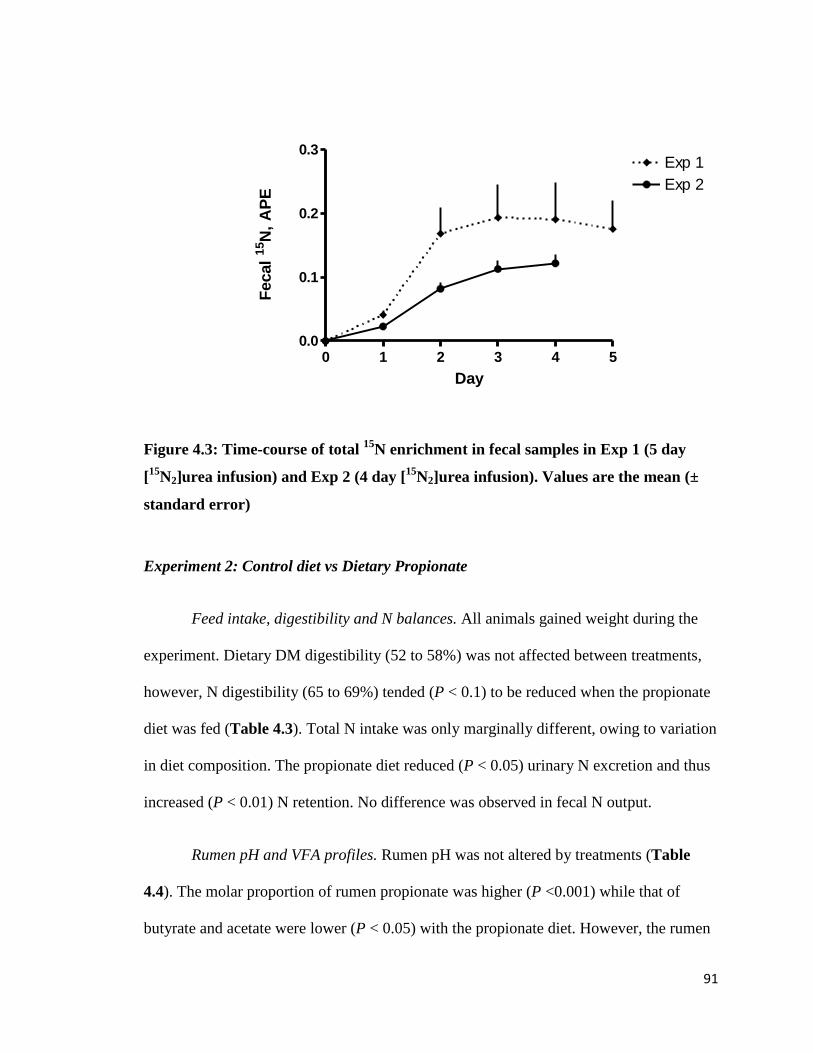
91
Figure 4.3: Time-course of total 15
N enrichment in fecal samples in Exp 1 (5 day
[15
N2]urea infusion) and Exp 2 (4 day [15
N2]urea infusion). Values are the mean (±
standard error)
Experiment 2: Control diet vs Dietary Propionate
Feed intake, digestibility and N balances. All animals gained weight during the
experiment. Dietary DM digestibility (52 to 58%) was not affected between treatments,
however, N digestibility (65 to 69%) tended (P < 0.1) to be reduced when the propionate
diet was fed (Table 4.3). Total N intake was only marginally different, owing to variation
in diet composition. The propionate diet reduced (P < 0.05) urinary N excretion and thus
increased (P < 0.01) N retention. No difference was observed in fecal N output.
Rumen pH and VFA profiles. Rumen pH was not altered by treatments (Table
4.4). The molar proportion of rumen propionate was higher (P <0.001) while that of
butyrate and acetate were lower (P < 0.05) with the propionate diet. However, the rumen
0 1 2 3 4 50.0
0.1
0.2
0.3Exp 1
Exp 2
Day
Fecal
15N
, A
PE
92
concentrations of propionate were increased (P < 0.01) with the propionate diet with no
changes in acetate or butyrate (Table 4.4).
Urea-N kinetics. For all treatments, urinary [M+2]urea enrichment reached an
isotopic plateau (Figure 4.1) within 2 d of [15
N2]urea infusion. Urinary [M+1]urea
enrichment increased until attaining a plateau between 2 and 3 d of infusion (Figure 4.2).
Total fecal 15
N enrichment continued to increase throughout the infusion period (Figure.
4.3), attaining a final value approximately 80% of predicted plateau. Hence, the fecal 15
N
enrichment on the last day was used in calculations. Urea-N kinetics are shown in Table
4.5. The propionate diet reduced (P ≤ 0.05) UER and UUE. There was no difference in
GER, ROC, and UUA; however, UFE tended (P < 0.1) to be increased with propionate
diet. Plasma urea concentration was lower (P < 0.05) with propionate diet.
Glucose entry and gluconeogenesis. Glucose entry, Cori cycling and
gluconeogenesis were greater (P < 0.01) with the propionate diet (Table 4.6). Plasma
glucose also increased (P < 0.05) with propionate diet. The molar conversion efficiency
of Na-Propionate in the diet to gluconeogenesis ~30%.
Using combined data from both experiments, there was a significant correlation
observed between rumen propionate concentration (x, mM) and gluconeogenesis (y, g/d):
y = 0.9322x + 55.413, R² = 0.42, P < 0.001 (Figure 4.4).
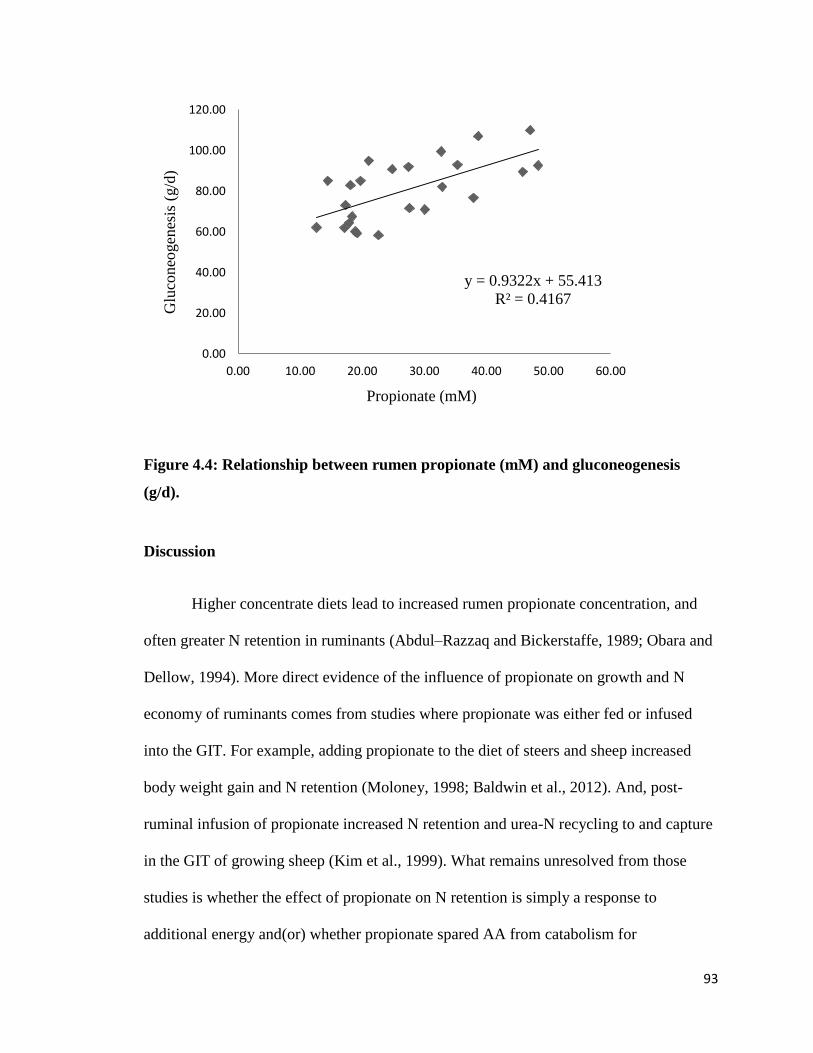
93
Figure 4.4: Relationship between rumen propionate (mM) and gluconeogenesis
(g/d).
Discussion
Higher concentrate diets lead to increased rumen propionate concentration, and
often greater N retention in ruminants (Abdul–Razzaq and Bickerstaffe, 1989; Obara and
Dellow, 1994). More direct evidence of the influence of propionate on growth and N
economy of ruminants comes from studies where propionate was either fed or infused
into the GIT. For example, adding propionate to the diet of steers and sheep increased
body weight gain and N retention (Moloney, 1998; Baldwin et al., 2012). And, post-
ruminal infusion of propionate increased N retention and urea-N recycling to and capture
in the GIT of growing sheep (Kim et al., 1999). What remains unresolved from those
studies is whether the effect of propionate on N retention is simply a response to
additional energy and(or) whether propionate spared AA from catabolism for
y = 0.9322x + 55.413
R² = 0.4167
0.00
20.00
40.00
60.00
80.00
100.00
120.00
0.00 10.00 20.00 30.00 40.00 50.00 60.00
Propionate (mM)
Glu
coneo
gen
esis
(g/d
)
94
gluconeogenesis with greater partition of AA into protein. Thus, the aim of the current
studies was to directly establish the role of rumen propionate on N utilization, urea-N
kinetics, and gluconeogenesis in growing sheep.
In Exp 1, rumen propionate was elevated by infusion of Na-Propionate into the
rumen of growing sheep fed a concentrate-type diet (294 g starch/kg DM feed), and using
Na-Acetate as an iso-energetic control. Thus, under these dietary conditions (high starch),
we aimed to simulate a forage-fed (Na-Acetate) compared to a typical concentrate-fed
(Na-Propionate) rumen VFA profile. Infusion of Na-Propionate, compared to Na-Acetate,
led to changes in the rumen VFA profile reflective of feeding a high concentrate diet
wherein propionate was elevated and acetate was reduced. Yet, despite a tendency for
propionate to shift urea-N output from feces to urine, there was no difference in total
urinary or fecal-N output. Thus, under these dietary conditions and with continuous
ruminal infusion of Na-Acetate and Na-Propionate, there were no differences in N
retention. It is noteworthy that rumen butyrate concentration was increased with infusion
of Na-Propionate, which reflects the complex nature of rumen fermentation and the
likelihood that rumen microbial populations may have been altered. We observed a
similar effect in the previous studies (Chapter 3) where butyrate infusion into the rumen
also elevated propionate concentration.
After failing to observe a response in a concentrate-type diet and using an iso-
energetic control, a second experiment was conducted with a forage-type diet (85 to 89 g
starch/kg DM). Using a nearly identical diet as herein and feeding at 1.6 × ME intake
requirement, it was previously shown that addition of propionate to the diet increased N-
retention by 38% in growing steers (Baldwin et al., 2012). In Exp 2, propionate was
95
included in the diet at the same level as infused in Exp 1, i.e. propionate supplied 10%
additional energy compared to the control diet. Feeding the propionate diet at 2-h
intervals increased N-retention (~0.8 g N/d), and this was mostly due to a reduction in
urinary-N excretion (~1.4 g urea-N/d). Furthermore, the efficiency of N utilization (i.e.,
N-retained:digestible-N) was increased by ~60% with the propionate diet.
N retention and urea-N kinetics
Kim et al. (1999) infused propionate into the abomasum (post-rumen) of sheep
fed a forage-type diet and observed higher N-retention as a result of greater urea-N
recycling to and capture in the GIT. By contrast, Seal and Parker (1996) did not observe
an increase in net portal-drained viscera removal of urea when propionate was infused
into the rumen of growing steers that had been fed a forage diet. Moreover, there may be
an interaction between diet type (starch or forage) and propionate supplementation
(Moloney, 1998). In our studies, Exp 1 was on a concentrate-type diet with high starch
content, and no effect of Na-Propionate infusion on N-retention was observed. By
contrast, in Exp 2, propionate addition to a forage-type diet resulted in ~60% increase in
N retention on an apparent digested-N basis. Although N retention increased when
feeding propionate, the level of N retention achieved in Exp 2 (1.6 to 2.4 g N/d) was
lower than in Exp 1 (4.3 to 4.8 g·N/d). Nonetheless, assuming protein comprises 66% of
tissue dry matter, the 1 g N/d (6.25 g protein) increase in N retention translates into an
additional 9.5 g/d tissue weight gain. Furthermore, assuming that carcass tissue contains
25% DM, the increase in body weight gain in response to feeding propionate equates to
38 g/d. Greater N-retention by the sheep in Exp 1 was expected given the higher starch
content of the diet and the resulting higher rumen VFA concentrations (169 to 171 mM)
96
compared the diet fed in Exp 2 that resulted in lower VFA concentrations (99 to 118
mM). A positive correlation between VFA supply and N retention has been demonstrated
in sheep (Sun and Zhao, 2009), and it is well established that larger amounts of
fermentable carbohydrates lead to higher N-retention (Obara and Dellow, 1994; Fujita et
al., 2006).
In vitro studies have produced confounding results on the role of propionate in
regulation of hepatic urea synthesis. Using slices of sheep liver, propionate was found to
inhibit urea synthesis (Rattenbury, 1983). In rats, propionate was shown to inhibit the
synthesis of N-acetyl glutamate (Stewart and Walser, 1980), the essential allosteric
activator of the urea cycle enzyme carbamoyl phosphate synthetase I. However, with
isolated sheep hepatocytes, propionate was found to promote urea production (Demigné
et al., 1991), whereas in isolated rumen epithelial and duodenal mucosal cells there was
no effect of propionate on urea synthesis compared to acetate (Oba et al., 2004). In Exp 1,
Na-Propionate infusion had no effect on UER nor on urea-N recycling kinetics compared
to iso-energetic infusion of Na-Acetate as control. However, in Exp 2, feeding propionate
reduced UER by ~2 g urea-N/d, leading to a reduction in urinary urea-N excretion. The
proportion of urea-N recycled to the gut (GER:UER) was greater with the forage-type
diet (~60%, Exp 2) compared to the concentrate-type diet (~40%, Exp 1), although urea-
N fluxes across the rumen in these two experiments remained unaltered. These results
suggest that the mechanism(s) that propionate influences N retention may be
energetically driven, i.e. by sparing of AA. However, modulation of urea-N recycling by
propionate cannot be ruled out given the changes we observed in UUE and UFE in Exp 1.
97
Gluconeogenesis
The role of propionate as a precursor for glucose synthesis in ruminants is well
established (Bergman and Wolff, 1971; Danfær et al., 1995). In both of the present
experiments, gluconeogenesis was increased by ~18 g/d with the propionate treatments. It
is noteworthy that a similar response in gluconeogenesis to propionate supplementation
was observed in both of the current experiments despite differences in the basal diets
(forage-type vs concentrate-type) and the mode of propionate delivery (continuous
infusion vs inclusion in diet). On a molar basis, the apparent conversion efficiency of
supplementary propionate to glucose was ~30%. This is much lower than what would be
expected (i.e. >90%), given that little propionate is metabolized by rumen tissues
(Kristensen and Harmon, 2004) and the liver removes +80% of the portal vein supply of
propionate (Berthelot et al., 2002) Thus, propionate most likely replaced AA catabolised
for gluconeogenesis, resulting in the lower apparent efficiency of propionate conversion
to glucose. The sparing of AA from gluconeogenesis likely accounted for the reduction in
UER and thus the increase in N retention in Exp 2. By contrast, the lack of response in
UER and N retention to infusion of Na-Propionate versus Na-Acetate in Exp 1 may be
due to the constant infusion of treatments. Thus, unlike feeding propionate where the 2-h
feeding interval is likely to initiate spikes in plasma insulin that promote anabolic
responses (Sano et al., 1993), the constant infusion mode of treatments in Exp 1 would
fail to elicit spikes in plasma insulin. In Exp 2, the higher plasma glucose concentration
may also reflect the 2-h feeding mode, resulting in glucose stimulation of anabolism in
peripheral tissues.
98
The role of higher ruminal propionate concentration, resulting from highly
fermentable diets, on increased N retention is not clear. Our studies were designed to
investigate the potential effects of ruminal propionate on urea-N kinetics and N
utilization. Under the conditions of these studies, higher ruminal propionate did not affect
urea-N fluxes across the rumen. However, it is difficult to attribute a particular
mechanism of propionate action on N utilization in ruminants given the potential
interactions that likely exist between type of feed (forage vs concentrate), mode
(continuous infusion or incorporation into feed) and the site (ruminally or postruminally)
of delivery of propionate. The pulsatile effect when feeding propionate may also have
provided a synchronous delivery of propionate along with the needs of energy for
digestion which likely stimulated higher spikes in plasma insulin to enhance protein
accretion.
99
SUMMARY AND CONCLUSIONS
There have been few studies that have evaluated the role of various types of diets
in promoting urea-N recycling and improving N utilization. However, when diets are fed
that contain large amounts of fermentable material, there are dynamic changes in not only
rumen VFA, but also rumen NH3 concentration and the rumen microbiota. Thus, it
becomes difficult to attribute the observed effects (i.e., N balance or urea-N kinetics) to
particular VFA, metabolites, or other conditions in the rumen (e.g., microbial protein
supply and pH). A more direct approach to determine the relationship between rumen
VFA and the mechanisms affecting urea-N recycling and N utilization in the rumen is by
artificially manipulating the rumen environment by infusion of individual or mixtures of
VFA. In the design of experiments in this thesis, every effort was made to maintain
balanced conditions (energetic, osmotic, natraemic and nitrogenous) between control and
treatment groups.
The process of urea-N recycling in ruminants has been the subject of investigation
for more than half a century. Although a wide range of factors are known to be associated
with changes in urea-N recycling, the underlying mechanisms of action are still not well
defined. In recent decades, use of stable isotope tracers has made it possible to measure
and estimate urea-N kinetics. With the generation of experimental data with different
feeding and ruminal conditions, it may be possible to accurately model and predict urea-
N partitioning. Mechanistic knowledge of urea-N partitioning has the potential to reveal
targets that can be manipulated to improve protein efficiency of ruminants, and hence,
reduce N excretion to the environment.
100
The research in this thesis addressed two hypotheses with regard to the roles of
rumen propionate and butyrate in improving N retention by enhancing urea-N recycled to
the rumen for microbial protein synthesis. The results from these studies suggest that
infusion of starch shifts urea-N excretion from urine to feces, with no effect on N
retention. Continuous infusion of butyrate into the rumen redistributes urea-N fluxes,
possibly by enhancing rumen epithelial growth, but N retention remained unchanged.
And lastly, continuous infusion of propionate did not affect N retention nor urea-N
kinetics; however, feeding propionate resulted in greater N retention as a result of
reduced urea synthesis and excretion, possibly by propionate sparing AA from catabolism
for gluconeogenesis.
101
APPENDICES
1. Surgery protocol for rumen cannulation
(from IACUC protocol # R-11-33)
Procedure: Surgical placement of a permanent barrel cannula into the rumen of sheep.
1. Sheep
a. Wether sheep of uniform body weight (20 to 25 kg) will be selected from
a certified local vendor with appropriate health and vaccination records.
On arrival, sheep will be fed a standard pelleted diet in 2 equal portions
per day to achieve normal rates of growth.
b. Sheep will be brought into the facilities, placed in individual floor pens
(1.5 m x 2.5 m) and acclimated to personnel and facilities prior to surgery.
Previous experience indicates that handling (holding, stroking) of the
animals prior to surgery makes them calmer and easier to handle for
surgery and during experimentation.
c. Sheep will be fitted with a permanent barrel cannula into the rumen
2. Preparation for surgery
a. The barrel cannula and associated flanges are gas sterilized and surgical
instruments and supplies (drapes, gowns, towels, gauze) are heat
sterilized.
b. Preparation of animal for surgery:
i. Feed is withheld for three meals (i.e. morning of surgery, and the
two meals the day before surgery) and water withheld from the
102
mid‐afternoon the day prior to surgery. This will minimize bloating
and regurgitation of digesta during surgery, and help reduce gut
volume and space taken up in the abdominal cavity.
ii. Animal is transported from holding pen to the preparation room
(0307).
iii. Wool is clipped (no 40 clipper blades) in the surgical field (most
course wool will be clipped the day prior to surgery to minimize
time spent in the surgery).
iv. The area over the jugular veins is clipped (no. 40 clipper blades),
scrubbed with antiseptic soap and iodine, and the area flushed with
70% alcohol (ethanol).
v. A temporary catheter (Abbo‐cath, 14 g, 5.5 in) is inserted into a
jugular vein and secured with skin sutures.
vi. The pre‐anaesthetics xylazine (0.2 mg/kg) and Butorphanol
(Torbugesic, 0.1 mg/kg) are given i.v., and the catheter flushed
with sterile saline.
vii. Immediately, the sheep is moved to the surgery suite and placed on
the table in sternal recumbency.
viii. A gas mask is placed over the sheep's mouth, and isoflurane
inhalation initiated (initially 4‐5% isoflurane).
ix. The sheep is induced with Ketamine (5 mg/kg) and Diazepam (0.4
mg/kg).
103
x. Once adequately sedated, the head is extended forwards and gauze
placed around the lower and upper jaws to hold mouth open for
intubation.
xi. Lidocaine is lightly applied to the epiglottis to initiate opening of
the airway. An endotracheal tube (7‐9 mm i.d.) is then placed into
the trachea, the cuff inflated, and the endotracheal tube secured in
the mouth with gauze.
xii. The sheep is then maintained on isoflurane (1‐2% isoflurane) and a
fitted with a monitoring cuff around a front leg to allow for
monitoring of heart rate and oxygen status, and breathing rate
monitored. All parameters will be recorded at 5 min intervals
throughout surgery.
xiii. The surgical field (left paracostal region) is scrubbed with
antiseptic soap and iodine, and flushed with 70% alcohol (ethanol).
xiv. Peri‐operatively, sheep are given the analgesic banamine (1.1‐2.2
mg/kg, i.v.) and the antibiotic ceftiofur HCl (1‐2 mg/kg, i.v.).
3. Surgery
i. The surgical field (approx. 2” posterior to the last rib and approx.
6” from the dorsal line) is sterilized as previously described. A left
paracostal incision (7‐8 cm) is made through the skin and
panniculus, just behind the last rib. The next three intersecting
layers of musculature and peritoneum are blunt dissected to create
an opening adequate to access the dorsal portion of the rumen.
104
Bleeding vessels will be clamped and if necessary tied off with
absorbable suture.
ii. The rumen will be withdrawn through the incision and packed with
sterile cotton cloths to avoid spillage of rumen liquor into the
abdominal cavity once the rumen wall is incised.
iii. A double purse‐string suture pattern (2/0 non‐absorbable suture)
will be made on the surface of the exposed rumen wall. A 2 cm
incision will be made in the center of the purse‐string and the
flange of the barrel cannula (3” long, barrel diameter 1”, flange
diameter 2.5”) fitted through the opening. The purse‐string suture
will be delicately drawn snug and lightly knotted to avoid cutting
through the rumen tissues. A nylon bullet (3” long) will be
attached onto the barrel cannula, a small incision (1 cm) made 2”
dorsal to the abdominal incision, and the bullet and cannula pulled
through the skin. A cap will replace the bullet and a collar secured
around the barrel of the cannula with a stainless steel screw band.
iv. For initial closure, the peritoneum and two innermost layers of
abdominal musculature are closed together (continuous pattern)
using absorbable suture (2/0 coated vicryl with ½ inch
curved‐tapered needle). The outermost muscles are then closed
separately, again using the above suture. The panniculus (‘twitch’)
muscle is closed separately with absorbable suture (2/0 coated
vicryl with ½ inch curved‐reverse cutting needle) employing a
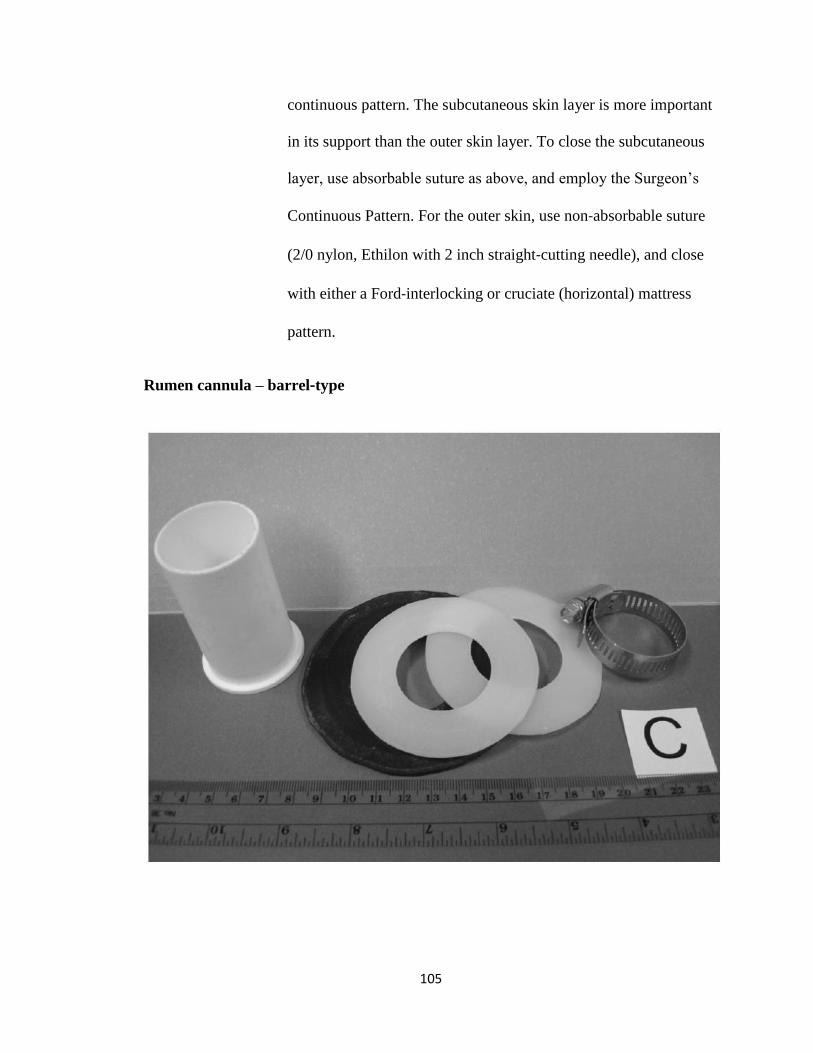
105
continuous pattern. The subcutaneous skin layer is more important
in its support than the outer skin layer. To close the subcutaneous
layer, use absorbable suture as above, and employ the Surgeon’s
Continuous Pattern. For the outer skin, use non‐absorbable suture
(2/0 nylon, Ethilon with 2 inch straight‐cutting needle), and close
with either a Ford‐interlocking or cruciate (horizontal) mattress
pattern.
Rumen cannula – barrel type
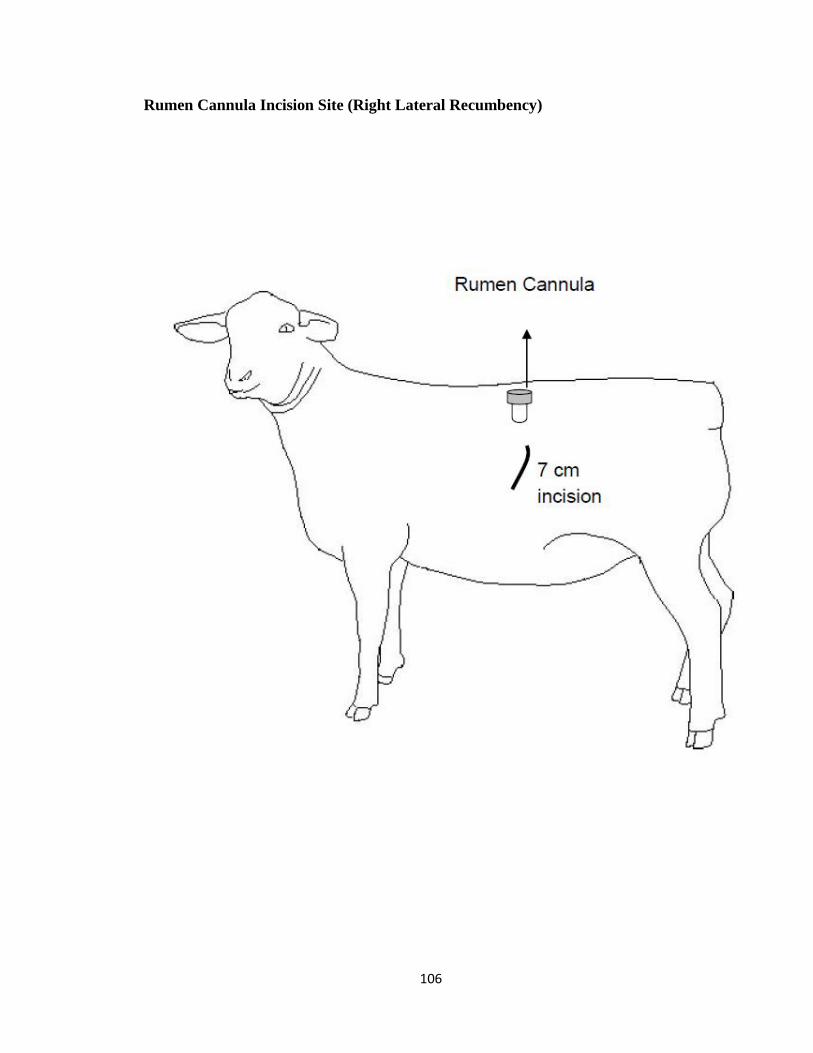
106
Rumen Cannula Incision Site (Right Lateral Recumbency)
107
2. Rumen biopsy procedure
(IACUC protocol # R-11-33)
1. Sheep will be removed from the metabolic crate during the procedure, and the
sheep will be held by personnel to prevent excessive movement. In our
experience, after a month of handling and constant contact, the sheep essentially
act like pets.
2. The rumen cannula plug will be removed and rumen contents removed by
vacuum. The site of biopsy (lateral aspect) will be rinsed of debris with warm
saline, and a fiber optic endoscope (Olympus CF, type CF‐1T20L and OCV‐100)
used to visualize the rumen wall.
3. Using a sterilized (70% ethanol) sharpened Allis forceps, rumen epithelial
samples (3‐5, 10 mg each) will be obtained from the lateral aspect of the rumen.
This quantity of tissue is necessary to obtain sufficient RNA and protein for gene
and protein expression analysis. On each biopsy occasion, the biopsy sites will be
separated by at least 1 inch.
4. Samples will be rinsed and prepared accordingly.
5. The rumen contents will be returned to the rumen, followed by 1 L of warmed
rumen buffer solution. The sheep will be returned to the floor pen.
6. Impact of sampling on animal health will be monitored everyday following
biopsy for indications of infection (i.e., inflammation, lethargy, anorexia, elevated
temperature and food intake).
108
7. Each biopsy procedure will be separated by at least 3 weeks in any one
experiment. Given the high rate of protein turnover of the rumen epithelium
(25%/day), the site should heal by at least 6 days.
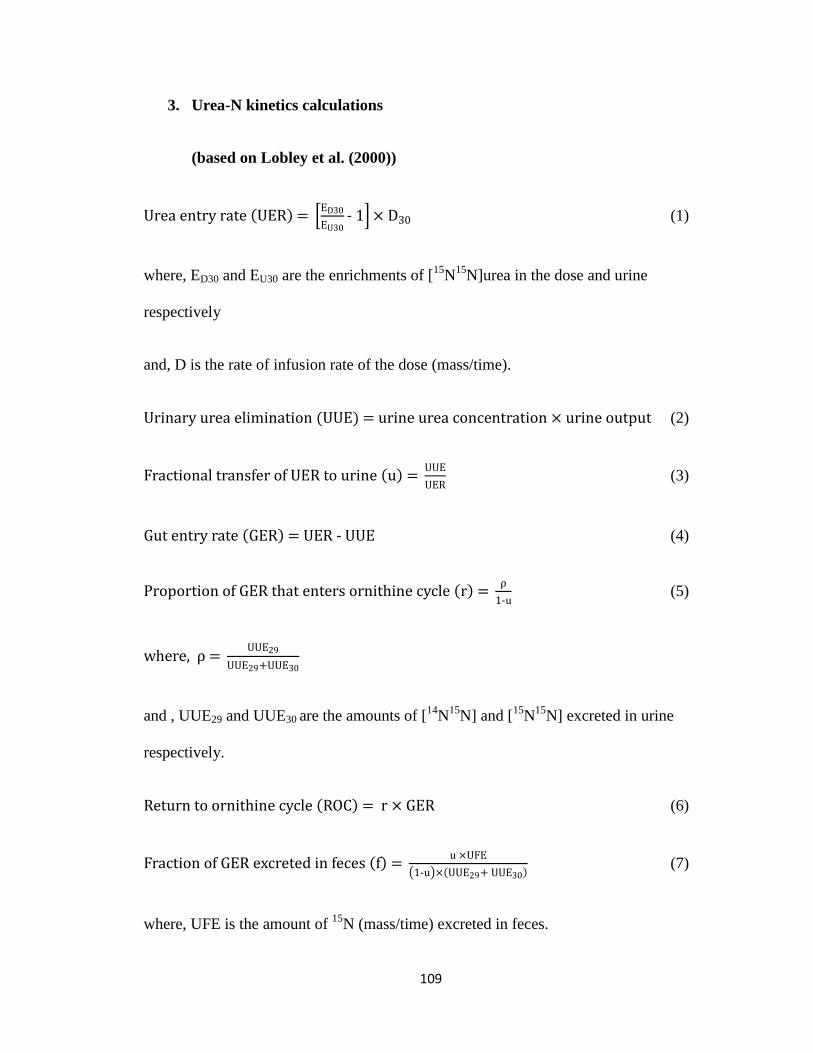
109
3. Urea-N kinetics calculations
(based on Lobley et al. (2000))
- (1)
where, ED30 and EU30 are the enrichments of [15
N15
N]urea in the dose and urine
respectively
and, D is the rate of infusion rate of the dose (mass/time).
(2)
(3)
- (4)
- (5)
and , UUE29 and UUE30 are the amounts of [14
N15
N] and [15
N15
N] excreted in urine
respectively.
(6)
- (7)
where, UFE is the amount of 15
N (mass/time) excreted in feces.
110
Urea-N utilized as absorbed amino acids (a) is calculated indirectly by difference as,
(8)
Thus the product of fractional transfers and GER yields the absolute amounts partitioned
towards the respective metabolic fates (anabolism, ROC, feces).
111
BIBLIOGRAPHY
Abdoun, K., F. Stumpff, I. Rabbani, and H. Martens. 2010. Modulation of urea transport
across sheep rumen epithelium in vitro by SCFA and CO2. Am. J. Physiol.
Gastrointest. Liver Physiol. 298:G190.
Abdoun K., F. Stumpff, K. Wolf, and H. Martens. 2005. Modulation of electroneutral Na
transport in sheep rumen epithelium by luminal ammonia. Am. J. Physiol.
Gastrointest. Liver Physiol. 289:G508.
Abdul-Razzaq, H. A., and R. Bickerstaffe. 1989. The influence of rumen volatile fatty
acids on protein metabolism in growing lambs. Br. J. Nutr. 62:297.
Annison, E., R. Leng, D. Lindsay, and R. White. 1963. The metabolism of acetic acid,
propionic acid and butyric acid in sheep. Biochem. J. 88:248.
Archibeque, S., J. Burns, and G. Huntington. 2001. Urea flux in beef steers: Effects of
forage species and nitrogen fertilization. J.Anim. Sci. 79:1937.
Baldwin, R. L., and B. Jesse. 1992. Developmental changes in glucose and butyrate
metabolism by isolated sheep ruminal cells. J. Nutr. 122:1149.
Baldwin, R. L., R. W. Li, C. Li, J. M. Thomson, and B. J. Bequette. 2012.
Characterization of the longissimus lumborum transcriptome response to adding
propionate to the diet of growing Angus beef steers. Physiol. Genomics. 44:543.
Beever, D. E., and P. T. Doyle. 2007. Feed conversion efficiency as a key determinant of
dairy herd performance: A review. Aust. J. Exp. Agric. 47:645.
Bequette, B. J., and N. E. Sunny. 2005. Reducing nitrogen excretion in ruminants: the
potential to increase urea recycling. Proceedings of the 3rd Mid-Atlantic Nutrition
Conference.
Bergman, E. N., and J. E. Wolff. 1971. Metabolism of volatile fatty acids by liver and
portal-drained viscera in sheep. Am. J. Physiol. 221:586.
Bergman, E. N. 1990. Energy contributions of volatile fatty acids from the
gastrointestinal tract in various species. Physiol. Rev. 70:567.
Bergman, E. N., R. Reid, M. G. Murray, J. Brockway, and F. Whitelaw. 1965.
Interconversions and production of volatile fatty acids in the sheep rumen.
Biochem. J. 97:53.
112
Berthelot, V., S. G. Pierzynowski, D. Sauvant, and N. B. Kristensen. 2002. Hepatic
metabolism of propionate and methylmalonate in growing lambs. Livest. Prod.
Sci. 74:33.
Bradford, E., R. L. Baldwin, H. Blackburn, K. Cassman, P. Crosson, C. Delgado, J.
Fadel, H. Fitzhugh, M. Gill, and J. Oltjen. 1999. Animal agriculture and global
food supply. Task Force Rep. 135.
Chamberlain, D. G., P. C. Thomas, W. Wilson, C. J. Newbold, and J. C. Macdonald.
1985. The effects of carbohydrate supplements on ruminal concentrations of
ammonia in animals given diets of grass silage. J. Agric. Sci. 104:331.
Cohen, N. S., and A. Kuda. 1996. Arginosuccinate synthetase and arginosuccinate lyase
are localized around mitochondria: an immunocytochemical study. J. Cell.
Biochem. 60:334.
Connell, A., A. Calder, and S. Anderson. 1997. Hepatic protein synthesis in the sheep:
effect of intake as by use of stable-isotope-labelled glycine, leucine and
phenylalanine. Br. J. Nutr. 77:255.
Danfær, A., V. Tetens, and N. Agergaard. 1995. Review and an experimental study on
the physiological and quantitative aspects of gluconeogenesis in lactating
ruminants. Comp. Biochem. Physiol. Part B. Biochem. Mol. Biol. 111:201.
Demigné, C., C. Yacoub, C. Morand, and C. Rémésy. 1991. Interactions between
propionate and amino acid metabolism in isolated sheep hepatocytes. Br. J. Nutr.
65:301.
Dijkstra, J., J. M. Forbes, and J. France. 2005. Quantitative aspects of ruminant digestion
and metabolism. 2nd ed. CABI, Willingford, UK.
Doranalli, K., G. B. Penner, and T. Mutsvangwa. 2011. Feeding oscillating dietary crude
protein concentrations increases nitrogen utilization in growing lambs and this
response is partly attributable to increased urea transfer to the rumen. J. Nutr.
141:560.
El-Kadi, S. W., R. L. Baldwin, N. E. Sunny, S. L. Owens, and B. J. Bequette. 2006.
Intestinal protein supply alters amino acid, but not glucose, metabolism by the
sheep gastrointestinal tract. J. Nutr. 136:1261.
El-Kadi, S. W., A. Suryawan, M.C. Gazzaneo, N. Srivastava, R. A. Orellana, H. V.
Nguyen, G. E. Lobley, and T. A. Davis. 2012. Anabolic signaling and protein
deposition are enhanced by intermittent compared with continuous feeding in
skeletal muscle of neonates. Am. J. Physiol. Endocrinol. Metab. 302:E674.
113
Emmanuel, B. 1980. Oxidation of butyrate to ketone bodies and CO2 in the rumen
epithelium, liver, kidney, heart and lung of camel (Camelus dromedarius), sheep
(Ovis aries) and goat (Carpa hircus). Comp. Biochem. Physiol. 65 B:699.
Federal Register. 2001. Clean Water Act 33 U.S.C. 1311, 1314, 1316, 1317, 1318, 1342
and 1361: Proposed Rules. 66:9.
Fernandez, C. A., C. Des Rosiers, S. F. Previs, F. David, and H. Brunengraber. 1996.
Correction of 13
C mass isotopomer distributions for natural stable isotope
abundance. J. Mass Spectrom. 31:255.
Fluharty, F., K. McClure, M. Solomon, D. Clevenger, and G. Lowe. 1999. Energy source
and ionophore supplementation effects on lamb growth, carcass characteristics,
visceral organ mass, diet digestibility, and nitrogen metabolism. J. Anim. Sci.
77:816.
Fujita, T., M. Kajita, and H. Sano. 2006. Responses of whole body protein synthesis,
nitrogen retention and glucose kinetics to supplemental starch in goats. Comp.
Biochem. Physiol. B Biochem. Mol. Biol., 144:180.
Górka P., Z. M. Kowalski, P. Pietrzak, A. Kotunia, W. Jagusiak, J. J. Horst, P.
Guilloteau, and R. Zabielski. 2011. Effect of method of delivery of sodium
butyrate on rumen development in newborn calves. J. Dairy Sci. 94:5578.
Gozho, G., M. Hobin, and T. Mutsvangwa. 2008. Interactions between barley grain
processing and source of supplemental dietary fat on nitrogen metabolism and
urea-nitrogen recycling in dairy cows. J. Dairy Sci. 91:247.
Hachey, D. L., W. R. Parsons, S. McKay, and M. W. Haymond. 1999. Quantitation of
monosaccharide isotopic enrichment in physiologic fluids by electron ionization
or negative chemical ionization GC/MS using di-O-isopropylidene derivatives.
Anal. Chem. 71:4734.
Haüssinger, D. 1990. Nitrogen metabolism in liver: structural and functional organization
and physiological relevance. Biochem. J. 267:281.
Huntington, G. B., and S. Archibeque. 1999. Practical aspects of urea and ammonia
metabolism in ruminants. Proc. Am. Soc. Anim. Sci.
Huntington, G. B. 1989. Hepatic urea synthesis and site and rate of urea removal from
blood of beef steers fed alfalfa hay or a high concentrate diet. Can. J. Anim. Sci.
69:215.
114
Huntington, G. B., K. Magee, A. Matthews, M. Poore, and J. Burns. 2009. Urea
metabolism in beef steers fed tall fescue, orchardgrass, or gamagrass hays. J.
Anim. Sci. 87:1346.
Jackson, A. A., D. Picou, and J. Landman. 1984. The non-invasive measurement of urea
kinetics in normal man by a constant infusion of 15
N15
N-urea. Human Nutr. Clin.
Nutr. 38C:339.
Kennedy, P. M., and L. P. Milligan. 1980. The degradation and utilization of endogenous
urea in the gastrointestinal tract of ruminants: A review. Can. J. Anim. Sci.
60:205.
Kennedy, P. M. 1980. The effects of dietary sucrose and the concentrations of plasma
urea and rumen ammonia on the degradation of urea in the gastrointestinal tract of
cattle. Br. J. Nutr. 43:125.
Kim, H., J. Choung, D. Chamberlain, and G. E. Lobley. 1999. Effect of propionate on
ovine urea kinetics. Page 57 in Protein Metabolism and Nutrition. G. E. Lobley,
A. White, and J. C. McCrae, ed. Eur. Assoc. Anim. Prod., Wageningen Press,
Wageningen, UK.
King, K. R., J. M. Gooden, and E. F. Annison. 1985. Acetate metabolism in the
mammary gland of the lactating ewe. Aust. J. Biol. Sci. 38:23.
Krehbiel, C., D. Harmon, and J. Schneider. 1992. Effect of increasing ruminal butyrate
on portal and hepatic nutrient flux in steers. J. Anim. Sci. 70:904.
Kristensen, N. B., and D. L. Harmon. 2004.Splanchnic metabolism of volatile fatty acids
absorbed from the washed reticulorumen of steers. J. Anim. Sci. 82:2033.
Lapierre, H. and G. E. Lobley. 2001. Nitrogen recycling in the ruminant: a review. J.
Dairy Sci. 84:E223.
Li, R. W., S. Wu, W. Li, and C. Li. 2012. Perturbation dynamics of the rumen microbiota
in response to exogenous butyrate. PloS one. 7:e29392.
Lobley, G. E. and G. Milano. 1997. Regulation of hepatic nitrogen metabolism in
ruminants. Proc. Nutr. Soc. 46:547.
Lobley, G. E., D. M. Bremmer, and G. Zuur. 2000. Effects of diet quality on urea fates in
sheep as assessed by refined, non-invasive [15
N-15
N] urea kinetics. Br. J. Nutr.
84:459.
Loosli, J. K., and I. W. McDonald. 1968. Nonprotein nitrogen in nutrition of ruminants.
FAO Agricultural Studies No. 73.
115
Ludden, P. A, R. M. Stohrer, K. J. Austin, R. L. Atkinson, E. L. Belden, and H. J.
Harlow. 2009. Effect of protein supplementation on expression and distribution of
urea transporter-B in lambs fed low-quality forage. J. Anim. Sci. 87:1354.
Luo, Q. J., S. A. Maltby, G. E. Lobley, A. G. Calder, and M. A. Lomax. 1995. The effect
of amino acids on the metabolic fate of 15
NH4Cl in isolated sheep hepatocytes.
Eur. J. Biochem. 228:912.
MacRae, J. C., L. A. Bruce, D. S. Brown, D. Farningham, and M. Franklin. 1997.
Absorption of amino acids from the intestine and their net flux across the
mesenteric-and portal-drained viscera of lambs. J. Anim. Sci., 75:3307.
MacRae, J. C., L. A. Bruce, and D. S. Brown. 1995. Efficiency of utilization of absorbed
amino acids in growing lambs given forage and forage: barley diets. Anim. Sci.
61:277.
Marini, J., and M. Van Amburgh. 2003. Nitrogen metabolism and recycling in Holstein
heifers. J. Anim. Sci. 81:545.
Marini, J., J. Klein, J. Sands, and. M. Van Amburgh. 2004. Effect of nitrogen intake on
nitrogen recycling and urea transporter abundance in lambs. J. Anim. Sci.
82:1157.
Moloney, A. 1998. Growth and carcass composition in sheep offered iso-energetic rations
which resulted in different concentrations of ruminal metabolites. Livest. Prod.
Sci. 56:157.
Mosenthin, R., W. Sauer, and C. de Lange. 1992. Tracer studies of urea kinetics in
growing pigs: I. The effect of intravenous infusion of urea on urea recycling and
the site of urea secretion into the gastrointestinal tract. J. Anim. Sci. 70:3458.
Norton, B., A. Janes, and D. Armstrong. 1982. The effects of intraruminal infusions of
sodium bicarbonate, ammonium chloride and sodium butyrate on urea metabolism
in sheep. Br. J. Nutr. 48:265.
NRC. 2007. Nutrient requirements of small ruminants: Sheep, Goats, Cervids, and new
world Camelids. National Academy Press, Washington, DC.
Oba, M., R. L. Baldwin, S. L. Owens, and B. J. Bequette. 2004. Urea synthesis by
ruminal epithelial and duodenal mucosal cells from growing sheep. J. Dairy Sci.
87:1803.
Obara, Y., and D. W. Dellow. 1994. Influence of energy supplementation on nitrogen
kinetics in the rumen and urea metabolism. Japan Agric. Res. Q. 28:143.
116
Obara, Y., Y. Sasaki, S. Watanabe, and T. Tsuda. 1971. The effects of vagatomy on
hyperglycemia by ruminal administration of butyric acid in sheep. Tohoku J.
Agric. Res. 22:156.
Ørskov, E. R. 1986. Starch digestion and utilization in ruminants. J. Anim. Sci. 63:1624.
Ørskov, E. R., N. A. MacLeod, and Y. Nakashima. 1991. Effect of different volatile fatty
acids mixtures on energy metabolism in cattle. J. Anim. Sci. 69:3389.
Ortigues-Marty, I. 2003. Effects of intraruminal propionate supplementation on nitrogen
utilisation by the portal-drained viscera, the liver and the hindlimb in lambs fed
frozen rye grass. Br. J. Nutr. 90:939.
Rémond D., J. P. Chaise, E. Delval, C. Poncet. 1993. Net transfer of urea and ammonia
across the ruminal wall of sheep. J. Anim. Sci. 71:2785.
Rémond, D., L. Bernard, I. Savary-Auzeloux, and P. Nozière. 2009. Partitioning of
nutrient net fluxes across the portal-drained viscera in sheep fed twice daily:
effect of dietary protein degradability. Br. J. Nutr. 102:370.
Rémond, D., F. Meschy, and R. Boivin. 1996. Metabolites, water and mineral exchanges
across the rumen wall: mechanisms and regulation. Ann. Zootech. 45:97.
Reynolds, C. K., and N. B. Kristensen. 2008. Nitrogen recycling through the gut and the
nitrogen economy of ruminants: An asynchronous symbiosis. J. Anim. Sci.
86:E293.
Reynolds, C. K. 1992. Metabolism of nitrogenous compounds by ruminant liver. J. Nutr.
122:850.
Ritzhaupt, A., I. Wood, A. Jackson, B. Moran, and S. Shirazi-Beechey. 1998. Isolation of
a RT-PCR fragment from human colon and sheep rumen RNA with nucleotide
sequence similarity to human and rat urea transporter isoforms. Biochem. Soc.
Trans. 26:S122.
Røjen, B. A., S. B. Poulsen, P. K. Theil, R. A. Fenton, and N. B. Kristensen. 2011. Short
communication: Effects of dietary nitrogen concentration on messenger RNA
expression and protein abundance of urea transporter-B and aquaporins in ruminal
papillae from lactating Holstein cows. J. Dairy Sci. 94:2587.
Russell, K., G. E. Lobley, J. Rawlings, D. J. Millward and E. J. Harper. 2000. Urea
kinetics of a carnivore, Felis silvestris catus. Br. J. Nutr. 84:597.
Sakata, T., and H. Tamate. 1978. Rumen epithelial cell proliferation accelerated by rapid
increase in intraruminal butyrate. J. Dairy Sci. 61:1109.
117
Sakata, T., and H. Tamate. 1979. Rumen epithelium cell proliferation accelerated by
propionate and acetate. J. Dairy Sci. 62:49.
Sano, H., N. Hattori, Y. Todome, J. Tsuroka, H. Tukashashi, and Y. Terashima. 1993.
Plasma insulin and glucagon responses to intravenous infusion of propionate and
their autonomic control in sheep. J. Anim. Sci. 71:3414.
Santos, F. A. P., J. E. P. Santos, C. B. Theurer, and J. T. Huber. 1998. Effects of rumen-
undegradable protein on dairy cow performance: A 12-year literature review. J.
Dairy Sci. 81:3182.
Sarraseca, A., E. Milne, M. Metcalf, and G. E. Lobley. 1998. Urea recycling in sheep:
effects of intake. Br. J. Nutr. 79:79.
Seal, C., and D. Parker. 1996. Effect of intraruminal propionic acid infusion on
metabolism of mesenteric-and portal-drained viscera in growing steers fed a
forage diet: II. Ammonia, urea, amino acids, and peptides. J. Anim. Sci. 74:245.
Shen, Z., H. M. Seyfert, B. Löhrke, F. Schneider, R. Zitnan, A. Chudy, S. Kuhla, H. M.
Hammon, J. W. Blum, and H. Martens. 2004. An energy-rich diet causes rumen
papillae proliferation associated with more IGF type 1 receptors and increased
plasma IGF-1 concentrations in young goats. J. Nutr. 134:11.
Simmons, N., A. Chaudhry, C. Graham, E. Scriven, A. Thistlethwaite, C. Smith, and G.
Stewart. 2009. Dietary regulation of ruminal bovine UT-B urea transporter
expression and localization. J. Anim. Sci. 87:3288.
Speedy, A. W. Global production and consumption of animal source foods. 2003. J. Nutr.
133:4048S.
Stern, M. D., and W. H. Hoover. 1979. Methods for determining and factors affecting
rumen microbial protein synthesis: a review. J. Anim. Sci. 49:1590.
Stewart, G. S., C. Graham, S. Cattell, T. P. L. Smith, N. L. Simmons, and C. P. Smith.
2005. UT-B is expressed in bovine rumen: potential role in ruminal urea transport.
Am. J. Physiol. Regul. Integr. Comp. Physiol. 289:R605.
Stewart, P. M., and M. Walser. 1980. Failure of the normal ureagenic response to amino
acids in organic acid-loaded rats: proposed mechanism for the hyperammonemia
of propionic and methylmalonic acidemia. J. Clin. Investig. 66:484.
Storm, A. C., M. Hanigan, and N. B. Kristensen. 2011. Effects of ruminal ammonia and
butyrate concentrations on reticuloruminal epithelial blood flow and volatile fatty
acid absorption kinetics under washed reticulorumen conditions in lactating dairy
cows. J. Dairy Sci. 94:3980.
118
Storm, E., and E. Orskov. 1983. The nutritive value of rumen micro-organisms in
ruminants. 1. Large-scale isolation and chemical composition of rumen micro-
organisms. Br. J. Nutr. 50:463.
Sun, Y. B., and G. Y. Zhao. 2009. The relationship between the volatile fatty acids
supply and the nitrogen retention in growing sheep nourished by total intragastric
infusions. Sm. Rumin. Res. 81:8.
Sunny, N. E., S. L. Owens, R. L. Baldwin, S. W. El-Kadi, R. A. Kohn, and B. J.
Bequette. 2007. Salvage of blood urea nitrogen in sheep is highly dependent on
plasma urea concentration and the efficiency of capture within the digestive tract.
J. Anim. Sci. 85:1006.
Tayek, J. A. & Katz, J. 1997. Glucose production, recycling, Cori cycle, and
gluconeogenesis in humans: relationship to serum cortisol. Am. J. Physiol. 272:
E476.
UN. 2012. World population prospects: the 2012 revision. United Nations,
ESA/P/WP.227.
Walpole, M. E., B. L. Schurmann, P. Górka, G. B. Penner, M. E. Loewen, and T.
Mutsvangwa. 2013. Functional role of aquaporins and urea transporters in urea
flux across the ruminal epithelium. Page 269 in Energy and protein metabolism
and nutrition in sustainable animal production. J. W. Oltjen, E. Kebreab, H.
Lapierre, ed. EAAP publication no. 134.
Wickersham, T., E. Titgemeyer, and R. Cochran. 2008. Methodology for concurrent
determination of urea kinetics and the capture of recycled urea nitrogen by
ruminal microbes in cattle. Animal. 3:372.
Wu, G. 1995. Urea synthesis in enterocytes of developing pigs. Biochem. J. 312:717.


![Research Progress on the Antineoplastic Pharmacological ...[1]-[3]. The chemical components comprise volatile categories, organic acids and fatty acids, amino acids, sapo-nins, flavonoids,](https://img.pdfslide.net/doc/110x75/5fe310f02239632f48403fe8/research-progress-on-the-antineoplastic-pharmacological-1-3-the-chemical.jpg)