Embed Size (px)
Citation preview
ABSTRACT Title of Thesis: BREEDING CONSIDERATIONS FOR IMPROVING
CADMIUM AND ZINC HYPERACCUMULATION IN TWO THLASPI CAERULESCENS POPULATIONS
Eva Claire Creighton Synkowski, Master of Science, 2004
Thesis directed by: Professor Marla S. McIntosh Department of Natural Resource Sciences
Cadmium is the second most widespread soil metal contaminant in the world and
it has been suggested that phytoremediation using hyperaccumulator plants could be used
to effectively remove harmful levels of soil metals. This research was conducted to
provide basic information necessary for developing a breeding program to improve the
phytoremediation potential of Thlaspi caerulescens, a promising hyperaccumulator plant.
By determining the genetic structure of the source populations and estimating the
heritability of traits of interest, gain from selection was predicted. Bulk segregrant
analysis of DNA polymorphisms was used to identify markers linked to cadmium
hyperaccumulation. DNA markers would reduce time and expense of selecting superior
genotypes. However, confounding effects from marker technology, experimental design,
and sample size reduced the potential for implementing the detected markers in a
breeding program. Future experiments may still detect markers for hyperaccumulation
and the T. caerulescens populations studied are valuable for phytoremediation
application.
BREEDING CONSIDERATIONS FOR IMPROVING CADMIUM AND ZINC
HYPERACCUMULATION IN TWO THLASPI CAERULESCENS POPULATIONS
by
Eva Claire Creighton Synkowski
Thesis submitted to the Faculty of the Graduate School of the University of Maryland, College Park in partial fulfillment
of the requirements for the degree of Master of Science
2004
Advisory Committee: Professor Marla S. McIntosh, Chair Professor J. Scott Angle Dr. Rufus L. Chaney
TABLE OF CONTENTS List of Tables……………………………………………………………………………..iv List of Figures……………………………………………………………………………..v 1.0 Literature Review.......................................................................................................... 1
1.1 Introduction............................................................................................................... 1 1.2 Cadmium Pollution ................................................................................................... 3 1.3 Phytoremediation with Thlaspi caerulescens............................................................ 7 1.4 Selection and Breeding for Increasing Metal Hyperaccumulation ......................... 13 1.5 Marker Based Selection for Hyperaccumulation.................................................... 20 1.6 Hyperaccumulation Gene Identification and Genetic Engineering ........................ 23
2.0 Breeding Considerations for Improving Cadmium Hyperaccumulation in Two French Thlaspi caerulescens J. & C. Presl. Populations............................................................... 30
2.1 Introduction............................................................................................................. 30 2.2 Materials and Methods............................................................................................ 33 2.3 Results and Discussion ........................................................................................... 38
3.0 Bulk Segregant Analysis to Determine Cd and Zn Linked RAPD Markers............... 53 3.1 Introduction............................................................................................................. 53 3.2 Materials and Methods............................................................................................ 54
3.2.1 Bulk Preparation .............................................................................................. 54 3.2.2 DNA Extraction ............................................................................................... 58 3.2.3 RAPD Analysis................................................................................................ 59
3.3 Results and Discussion ........................................................................................... 59 3.3.1 Polymorphic Primer Summary ........................................................................ 59 3.3.2 Potential Marker Examples.............................................................................. 63 3.3.3 Categorical Primer Summary........................................................................... 68 3.3.4 BSA Population Effect..................................................................................... 70 3.3.5 BSA Method Effect.......................................................................................... 72
4.0 Marker Validation Experiment ................................................................................... 75 4.1 Introduction............................................................................................................. 75 4.2 Materials and Methods............................................................................................ 76
4.2.1 DNA Extraction and RAPD Analysis.............................................................. 76 4.2.2 Plant Material and Cultivation ......................................................................... 76 4.2.3 Soil Preparation and Characterization ............................................................. 78 4.2.4 Biomass Analysis............................................................................................. 81
4.3 Results..................................................................................................................... 83 4.3.1 Tissue Analysis ................................................................................................ 83 4.3.2 RAPD Data ...................................................................................................... 85 4.3.3 χ2 Analysis for Significant Marker Association .............................................. 86 4.3.4 Significant Marker Examples .......................................................................... 86
4.4 Discussion ............................................................................................................... 95 4.4.1 Example One: Exclusivity ............................................................................... 96 4.4.2 Example Two: Sensitivity of Allele Detection ................................................ 99 4.4.3 Example Three: Repeatability........................................................................ 100
ii
4.4.4 Using RAPD Markers in an MBS Program and Future Recommendations.. 102 5.0 Conclusion ................................................................................................................ 105 Appendix A. RAPD Data for Marker Validation Experiment....................................... 115
iii
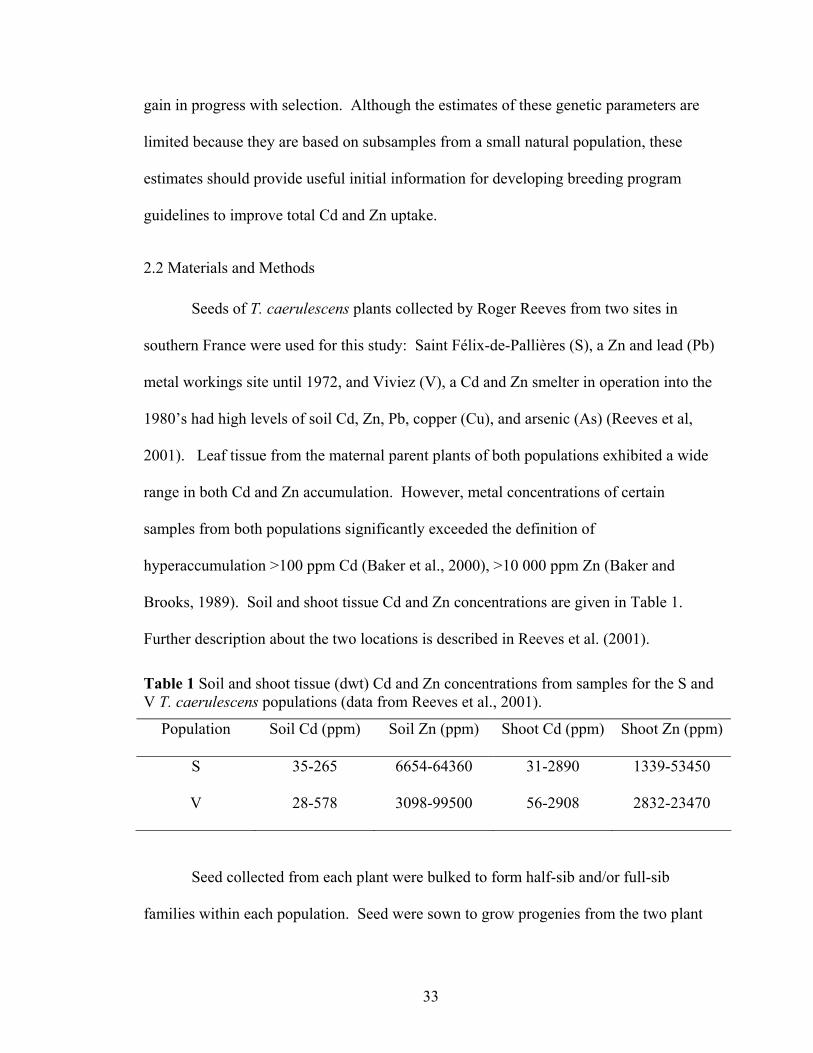
LIST OF TABLES Table 1 Soil and shoot tissue (dwt) Cd and Zn concentrations from samples for the S and
V T. caerulescens populations (data from Reeves et al., 2001)................................ 33 Table 2 GST, F, and c Statistics for S and V T. caerulescens Populations........................ 39 Table 3 Narrow sense heritability estimates for Cd and Zn concentration, plant biomass,
and total metal content in the S and V T. caerulescens populations......................... 45 Table 4 Genetic (rA) and phenotypic (rP) correlations for the S and V T. caerulescens
populations for Cd and Zn concentrations, biomass, and total Cd and Zn concentrations. .......................................................................................................... 47
Table 5 Estimates of percent gain in the of population mean in the first generation for Cd concentration, biomass, and total Cd content at 20%, 10% selection intensities for the S and V T. caerulescens populations. ................................................................. 49
Table 6 Mean shoot Cd concentrations (dwt) of individuals selected for the Cd bulks of the S T. caerulescens population. Concentrations were determined from tissue grown in homogenized Cd and Zn contaminated soil. ............................................. 55
Table 7 Mean shoot Zn concentrations (dwt) of individuals selected for the Zn bulks of the S T. caerulescens population. Concentrations were determined from tissue grown in homogenized Cd and Zn contaminated soil. ............................................. 56
Table 8 Mean shoot Cd concentrations (dwt) of individuals selected for the Cd bulks of the V T. caerulescens population. Concentrations were determined from tissue grown in homogenized Cd and Zn contaminated soil. ............................................. 57
Table 9 Mean shoot Zn concentrations (dwt) of individuals selected for the Zn bulks of the V T. caerulescens population. Concentrations were determined from tissue grown in homogenized Cd and Zn contaminated soil. ............................................. 58
Table 10 Primers producing potential markers present in the high Cd or Zn bulks for S or V T. caerulescens populations. ................................................................................. 61
Table 11 Primers producing potential markers present in the low Cd or Zn bulks for S or V T. caerulescens populations. ................................................................................. 62
Table 12 Total number of polymorphic loci from Bulk Segregant Analysis ................... 68 Table 13 T. caerulescens S Population significant markers for Cd or Zn accumulation.. 86 Table 14 T. caerulescens V Population significant markers for Cd or Zn accumulation. 86
iv
LIST OF FIGURES Figure 1 Means and SE bars for Cd (top) and Zn (bottom) accumulation in leaf tissue
(dwt) for families from two T. caerulescens populations chosen for high and low levels of Cd or Zn accumulation............................................................................... 35
Figure 2 S population dendrogram and numerical genetic distances created by POPGENE software using the UPGMA method......................................................................... 41
Figure 3 V population dendrogram and numerical genetic distances created by POPGENE software using the UPGMA method...................................................... 42
Figure 4 Cd (top) and Zn (bottom) accumulation coefficient of variation regressed on the number of polymorphic bands scored within a family for both the S and V T. caerulescens populations. ......................................................................................... 43
Figure 5 Extrapolations of total Cd removed over 10 years for the S (top) and V (bottom) T. caerulescens populations under selection for Cd concentration, biomass, or total Cd content versus no selection.................................................................................. 51
Figure 6 Banding pattern in bulk segregant analysis for Qiagen/Operon primer E-16. Potential markers are 1) SHC_E16 (825 bp) and 2) and 3) VLB_E16 (1250 bp). ... 63
Figure 7 Banding pattern in bulk segregant analysis for Qiagen/Operon primer J-06. Potential markers are 1) and 2) SLB_J06_1 (1100 bp), 3) and 5) VHB_J06 (600 bp) and 4) and 6) VLB_J06_2 (650 bp). ......................................................................... 64
Figure 8 Banding pattern in bulk segregant analysis for Qiagen/Operon primer E-20. Potential markers are 1) and 2) SLB_E20_2 (825 bp) and 3) and 4) VLB_E20_1 (2000 bp)................................................................................................................... 65
Figure 9 Banding pattern in bulk segregant analysis for Qiagen/Operon primer X-04. The potential marker is 1) SHZ_X04 (1100 bp). ............................................................. 66
Figure 10 Banding pattern in bulk segregant analysis for Qiagen/Operon primer G-17. The potential markers are 1) SHZ_G17 (900 bp), 2) SLZ_G17 (1000 bp), 3) VHC_G17 (900 bp), and 4) VLC_G17 (1000 bp).................................................... 67
Figure 11 Acidification curve for nitric acid addition to samples of St. Mary’s soil. ...... 79 Figure 12 Expected and observed Cd ± SE accumulation (ppm dwt) in the 8 T.
caerulescens genotypes used for MVE. (Expected data from Perner et al., submitted) ................................................................................................................. 84
Figure 13 Expected and observed Zn ± SE accumulation (ppm dwt) in the 8 T. caerulescens genotypes used for MVE. (Expected data from Perner et al., submitted) ................................................................................................................. 84
Figure 14 Banding pattern in bulk Segregant analysis for Qiagen/Operon primer E-03. The marker 1) SHZ_E03 (600 bp) was determined to be significantly associated with high Zn accumulation after the marker validation experiment χ2 analysis. ..... 87
Figure 15 The gel images for the expected high Zn accumulating family, S02, and the expected low Zn accumulating family, S12 with Qiagen/Operon primer E-03 (marker denoted with an arrow)................................................................................ 88
Figure 16 Banding pattern in bulk segregant analysis for Qiagen/Operon primer U-14. The marker 1) VLB_U14 (400 bp) was determined significantly associated with low Cd accumulation after the marker validation experiment χ2 analysis. ..................... 89
v
Figure 17 The gel images for the expected high Zn accumulating family, S02, and the expected low Zn accumulating family, S12 with Qiagen/Operon primer E-03 (marker denoted with an arrow)................................................................................ 90
Figure 18 Banding pattern in bulk segregant analysis for Qiagen/Operon primer N-13. The marker 1) SHC_N13 (1000 bp) was determined to be significantly associated with high Cd accumulation after the marker validation analysis χ2 analysis. .......... 91
Figure 19 The marker validation experiment gel images for the expected low Cd accumulating family, S15, and the expected high Cd accumulating family, S20, with Qiagen/Operon primer N-13 (marker denoted with an arrow). ................................ 92
Figure 20 Banding pattern in bulk segregant analysis for Qiagen/Operon primer J-06. The marker 1) VLB_J06_2 (650 bp) was determined to be significantly associated with low Zn accumulation after the marker validation experiment χ2 analysis. ...... 93
Figure 21 The marker validation experiment gel images for the expected high Zn accumulating family, V18, and the expected low Zn accumulating family, V19, with Qiagen/Operon primer J-06 (marker denoted with an arrow). ................................. 94
Figure 22 Banding pattern in bulk segregant analysis for Qiagen/Operon primer J-04 in the S population. The potential markers are 1) SHC_J04_1 (750 bp) and 2) SHC_J04_2 (675 bp)................................................................................................. 97
Figure 23 Further testing with Qiagen/Operon primer J-04, which caused two potential markers (denoted with arrows) linked to high Cd accumulation in bulk segregant analysis...................................................................................................................... 98
Figure 24 Banding pattern in bulk segregant analysis for Qiagen/Operon primer U-03 with the S population bulks. The marker is 1) SHC_U03_2 (675 bp)..................... 99
Figure 25 Further testing with Qiagen/Operon primer U-03, which caused one potential marker (denoted with an arrow) linked to high Cd accumulation in bulk segregant analysis.................................................................................................................... 100
Figure 26 Banding pattern in bulk segregant analysis for Qiagen/Operon primer X-16.................................................................................................................................. 101
Figure 27 Banding pattern in further testing with Qiagen/Operon primer U-03. ........... 101
vi
1
1.0 Literature Review
1.1 Introduction
The main objective of the research project presented here was to examine the
potential for using two populations of Thlaspi caerulescens for cadmium (Cd) and zinc
(Zn) phytoremediation. Although T. caerulescens is the focus of much of the current
phytoremediation research, a significant portion of the work has concentrated on
phenotypic analyses and feasibility studies. The less prevalent genetic research has
focused on gene identification, specifically using the model plant, Arabidopsis thaliana,
for potential genetic engineering approaches. Researchers are hopeful that once the
gene(s) for hyperaccumulation are identified, gene transfer can be used to exploit the
hyperaccumulation trait to make phytoremediation a feasible alternative for soil
remediation. There is a paucity of research that has focused on the possibility of selective
breeding of T. caerulescens to improve Cd and Zn phytoextraction by maximizing the
hyperaccumulation potential through recurrent selection and mating of superior
individuals. By using molecular analyses, important genetic parameters can be estimated
and efficient breeding designs can be determined. Further, using DNA markers to
identify superior hyperaccumulators can assist in a selective breeding program. Research
presented here involves the initial steps needed to begin a marker-assisted breeding
program to improve Cd and Zn phytoextraction of T. caerulescens using two populations
from southern France determined to be super-hyperaccumulators of Cd (Perner et al.,
submitted)
The text of this thesis is divided into five chapters. This chapter serves as an
introduction to the existing literature regarding the international problem of contaminated
2
soils, the proposal to use the hyperaccumulator T. caerulescens as a cost-effective soil
remediation strategy, and general information about concerns for a breeding program and
using hyperaccumulation linked markers.
The second chapter describes the first experiment, which was designed to
determine the genetic structure and mode of pollination of the natural parent populations
and estimate the level of heterozygosity of this genetic material. Additionally, this
experiment was used to make initial estimates for heritabilities for the traits of interest, as
well as estimates of potential gain from a selective breeding program. Further, this
experiment is the first report of these initial, but necessary, indices. The results from this
experiment showed that the phenotype and genotype for Cd accumulation are
significantly related, indicating that Cd hyperaccumulation is under a certain degree of
genetic control. This became the foundation for the subsequent experiments that
involved detecting markers linked to Cd hyperaccumulation.
Chapters three and four contain experiments two and three, respectively, which
were conducted to identify and validate markers associated with Cd and Zn
hyperaccumulation. The second experiment used Bulk segregant analysis (BSA), a
method which can efficiently identify markers linked to a trait of interest. These markers
needed to be tested for accuracy and significant association to hyperaccumulation, which
was completed in the third experiment. This is the first known experiment that has
detected markers associated with the hyperaccumulation trait, as opposed to focusing on
specific gene identification. Despite the detection of statistically significant Cd and Zn
associated markers, there are concerns with the practicality of using these markers in a
3
breeding program. Further work needs to be completed for useable markers to be
identified, and recommendations for this future research have been made.
Chapter Five serves as a summary to synthesize the key results from the three
experiments.
1.2 Cadmium Pollution
Cd is the second most widespread soil metal contaminant in the world (Michael,
2003) due mainly to mining and smelting ores, fertilizer applications, sewage sludge
amendments, and atmospheric deposition. Cd can become a serious human health risk
when present in soils used for food production and also restricts international trade under
the Codex Alimentarius regulations. Excessive soil Cd also threatens natural ecosystems
by posing health threats to wildlife. Cd in cultivated soils is most problematic for two
crops: rice and tobacco. For humans, once ingested, Cd accumulates in the kidney
cortex, potentially resulting in renal proximal tubular dysfunction and osteomalacia,
known as itai-itai disease (Chaney et al., 2001a). Crops grown in high Cd soils can
exceed acceptable US limits and exports to European countries, such as sunflower
kernels, duram wheat, and soybean, have been stopped because of national Cd limits for
specific foods (Chaney, personal communication). Severe heavy metal contamination,
which often occurs in areas surrounding smelting ore operations, can cause phytotoxicity
in the ecosystem, preventing any plants from surviving on the soil (Chaney et al., 2001b).
Heavy metal contamination also effects wildlife. For example, white-tailed ptarmigans
living in the south-central Colorado “ore-belt” cannot process calcium (Ca) effectively
due to the chronic exposure to Cd (Higgins, 2000). This leads to bone fracture and an
inability to build proper egg shells for their young (Higgins, 2000).
4
The risks associated with Cd in the soil depend on availability and uptake of the
metal by various plant species. Metal uptake may be affected by several factors
including climatic and plant genetic effects, as well as multiple soil parameters. Soil
conditions, such as pH, Cd concentration, Cd:Zn ratios, chloride concentration, and levels
of metal sorbents and organic matter significantly affect Cd uptake (Chaney et al.,
2001c). Some populations consume foods from land with soil Cd as high as 50-150 ppm
without incidence of Cd disease, but in Japan and China as little as 2 ppm soil Cd has
caused health problems (Chaney et al., 1998). Therefore, soil Cd concentration alone is
not a good predictor of high Cd accumulation by plants or the potential health risks to
humans. The risks associated with high levels of soil Cd may be overestimated when all
of the factors that contribute to Cd availability have not been considered.
Cd is a natural element of the Earth’s crust and is normally found combined with
another element such as oxygen (CdO), chlorine (CdCl2), or sulfur (CdSO4 or CdS). Cd
is usually extracted as a by-product with other metals like Zn and copper (Cu). Therefore,
Cd contamination is usually accompanied by additional heavy metal pollutants (USGS,
2003). Cd does not corrode easily, and is most often used for batteries, pigments, metal
coatings, and plastic stabilizers. Since Cd is a non-essential element or microelement,
acceptable levels of Cd in the drinking water (<5 ppb) and workplace (<100 µg/m3 as Cd
fumes and 200 µg/m3 as Cd dust) have been defined by the Environmental Protection
Agency (EPA) and Occupational Safety and Health Administration (OSHA),
respectively.
One of the most important determinants of Cd uptake by plants is Zn soil
concentration, due to the potential for phytotoxicity and inhibition of Cd translocation
5
(Chaney et al., 2001c). Thus, Cd:Zn ratios are an important consideration for assessing
the risk of Cd uptake. Generally, crops take up Cd and Zn in a ratio equal to the ratio of
the metals commonly found in the soil (1 Cd: 100 Zn) (Chaney et al., 2001b). Therefore,
when Zn concentrations may cause damage to the plant at 500 ppm, the biomass would
only have a 5 ppm Cd concentration (Chaney et al., 2001c), except for rice (Oryza
sativa) and tobacco (Nicotiana tabacum) crops for which the ratios of Cd and Zn
accumulation significantly deviate from this expectation (Chaney et al., 2001c; Simmons
et al., 2003). Thus, for polluted sites where the Cd:Zn ratio is often closer to 1:50
(Brown et al., 1995) or at least double the Cd available compared to a natural site, rice (or
tobacco) grown on contaminated land has the greatest potential for the transfer of soil Cd
to humans.
Although Cd soil pollution is a significant worldwide problem, it is most serious
in Asia. The potential and realized risks to human health of rice cultivation on
contaminated land in Asia are extensive. China, India, and Indonesia contain half of the
world’s population at 2.5 billion, and more than 90 percent of the world’s rice production
and consumption occurs in Asia (The Asia Rice Foundation, 2003). In a recent study of
soil heavy metal contamination in China, Cd concentration in rice randomly sampled
from the areas of four large cities (Beijing, Shenyang, Nanjing, and Xi’an) was higher
than government standards (Dong et al, 2001). Tissue analysis quantified that the crop
accumulated the metal in its grain, making the staple crop a main source of Cd for the
Chinese (Dong et al., 2001). This phenomenon is wide in scope, with over 600,000
hectares of rice paddy land in Japan, China, Korea, and Vietnam with high Cd soil
availability (R.L. Chaney, personal communication).
6
Another reason the human health risk from Cd is greatest for rice grown in Asia is
that the growing conditions promote Cd availability. In flooded rice paddies, both CdS
and ZnS is formed. Rice farmers tend to drain the paddies at the start of flowering to
optimize grain yield (Chaney et al., 2001b). However, when the paddies are drained, the
CdS is oxidized very rapidly making the Cd available for rice uptake. The ZnS persists
during this draining, and remains unavailable to plants (Chaney et al., 2001b). Therefore,
rice can take up large amounts of Cd without any potential for Zn phytotoxicity. It is this
interaction between Cd and Zn that is an important consideration in determining potential
risk to humans since this widespread cultivation practice creates the potential for high Cd
accumulation in rice. Because the proportion of rice in non-Asian diets is much less,
there is less concern for Cd in the food chain for western diets (Chaney et al., 1998). In
addition, dietary deficiencies of Ca, iron (Fe), and Zn increase the amount of Cd absorbed
by the kidney (Chaney et al., 1998). For many Asians who rely on rice for energy, Fe
and Zn deficiencies are common in a limited diet. Further, the process of milling the rice
removes Fe, Zn, and Ca, without changing the levels of Cd (Chaney et al., 1998).
Therefore, the problem of Cd contamination is most critical for subsistence farmers
growing rice on polluted lands.
In contrast, livestock grazing on land contaminated with Cd does not pose a risk
to the food chain. Livestock ingest crop plants that have Cd and Zn in the same ratio as
found in the soil, which is then stored in the liver and kidney (Chaney et al., 2001c). Low
levels of Cd in the liver and kidney do not affect the meat or milk consumed by humans
(Chaney et al., 2001c). Therefore, livestock provide a break in a potential exposure
7
pathway for soil Cd ingestion to humans, and meat and diary products provide the Fe, Zn,
and Ca necessary to help keep Cd unavailable in most western diets.
The situations where it is most necessary to mitigate human exposure to Cd are:
1) the subsistence farmers eating contaminated rice in Asia resulting in chronic lifetime
exposure and 2) workers who manufacture Cd, as in Nickel (Ni)-Cd battery production,
where large amounts of oral ingested Cd are readily absorbed to the lungs (Chaney et al.,
1998). Other situations may indeed be worthy of attention, but it is important to
understand the controlling factors involved in Cd availability so that the risks of Cd
contamination are not overestimated.
1.3 Phytoremediation with Thlaspi caerulescens
One proposed solution for soil Cd remediation is to use plants that
hyperaccumulate metals from the soil to their leaves (Chaney, 1983; Baker and Brooks,
1989; Baker et al., 1991). While many plants transport low concentrations of metals to
their leaf tissue, ‘hyperaccumulators’ store concentrations of metal in their leaves that are
usually phytotoxic. Hyperaccumulators are defined as accumulating trace metals in their
tissue at concentrations at least 100 times greater than normal plants (Baker and Brooks,
1989). Hyperaccumulators are the most promising plants to use for phytoremediation
technology, whereby repeated cropping and removal of their leaf tissue would gradually
remove heavy metals from a contaminated site. Harvested plant material could then be
sent through an ashing process to concentrate the metal for reuse as a “bio-ore” (Brown et
al., 1995). Application of phytoremediation technologies is still in its infancy. In 1998,
8
the US market for phytoremediation was estimated at 16.5-29.5 million dollars, with the
projected growth of the market to be 214-370 million dollars by 2005 (Glass, 1999).
Ideally, a plant used for phytoremediation would be fast growing with high
biomass, have deep roots, be easy to harvest, and accumulate multiple heavy metals in
their aerial parts (Clemens et al., 2002). Unfortunately, no known species meets each of
these criteria. A promising plant in phytoremediation research is Thlaspi caerulescens (J.
& C. Presl.), a documented hyperaccumulator of both Zn and Cd (Brown et al., 1995;
Lombi et al., 2000). T. caerulescens, a member of the Brassica family, is found
throughout the Alpine region of Europe, inhabiting both metalliferous and non-
metalliferous soils. It is related to the perennial pennycress, has a slow growth habit, and
forms a small basal rosette up to 15 cm high (Brown et al., 1995). T. caerulescens has
been recorded as accumulating up to 33 600 ppm dry weight (dwt) Zn (Brown et al.,
1995) and 14 000 ppm dwt Cd (Lombi et al., 2000) while foliar concentrations above
300-500 ppm Zn and 1- 70 ppm Cd are usually toxic (Pence et al., 2000). Thus, these
observed metal concentrations are quite extreme and are approximately 3 and 10 times
the levels defined for hyperaccumulation for Zn and Cd, respectively. In addition, these
are the highest levels of Cd accumulation reported in plants.
Most of the research on the ability of T. caerulescens plants to hyperaccumulate
has focused on Zn rather than Cd. Cd hyperaccumulation by T. caerulescens plants
varies considerably between populations and locations, suggesting both genetic and
environmental influences on the expression of Cd hyperaccumulation. Some populations,
such as those from southern France, are called ‘super hyperaccumulators’ because of
their extreme Cd accumulation uptake (Perner et al., submitted). Additional studies have
9
focused on identifying these unique populations and assessing variability in accumulation
(Lombi et al., 2000; Lombi et al., 2001b; Reeves et al., 2001; Zhao et al., 2002; Roosens
et al., 2003; Perner et al., submitted). More extensive research has proven the species
effectiveness in Zn remediation, and this appears to be a constitutive trait expressed in the
species (Assunção et al., 2003b, Roosens et al., 2003). Although T. caerulescens
hyperaccumulates Cd, Zn, and Ni, T. arvense is not known to hyperaccumulate metals
and is often used as a control species for T. caerulescens experiments because it typically
has 1 ppm Cd (Hammer and Keller, 2002) and up to 400 ppm Zn in the leaves (Whiting
et al., 2000; Whiting et al., 2001a and 2001b). Recently, it has been suggested that T.
caerulescens be designated as the model hyperaccumulator based on eight criteria,
including hyperaccumulation capabilities, compact growth habit, seed production, and a
compact diploid genome (Peer et al., 2003).
T. caerulescens (then identified as T. calaminare) was originally described as an
accumulator of Zn in 1865 found to contain over 17% of the metal in its ash. Despite this
long history, hyperaccumulation research is still limited in scope (Assunção et al.,
2003c). The term ‘hyperaccumulator’ was first used in 1977 (Brooks et al.) to describe
plants with high Ni concentrations, the definition of Zn hyperaccumulation was assigned
at > 10 000 ppm in 1989 (Baker and Brooks), and the Cd threshold was assigned at >
100 ppm in 2000 (Baker et al.). Hyperaccumulation is a rare trait, and the vast majority
of the approximately 400 species identified are Ni hyperaccumulators. Only 15 species
have been identified as Zn hyperaccumulators and Cd hyperaccumulation has been
limited to only 3 species (Assunção et al., 2003c). T. caerulescens is unique because it
hyperaccumulates both Zn and Cd. The most studied T. caerulescens population,
10
‘Prayon,’ collected from Belgium, is a well documented Zn hyperaccumulator (Ebbs et
al., 2002; Lombi et al., 2001a). More recent research has focused on southern France
populations, because of their superior capacity to hyperaccumulate Cd. Seeds from these
populations were collected by Roger Reeves in 1998 and described in the literature
(Reeves et al., 2001). Additionally, populations found throughout Europe have been
studied for metal hyperaccumulation, including seeds from the towns La Calamine,
Belgium (Assunção et al., 2003a), Monte Prinzera, Italy (Assunção et al., 2003b),
Ganges, France (Lombi et al., 2000), Pommiers and Les Malines, France (Escarré et al.,
2000), Avinieres and St Bresson, France, and Plombieres, Wilwerwiltz and Winseler,
Belgium (Dubois et al., 2003). Each of these populations has been studied under
different environmental and cultural conditions, making it difficult to compare results
across research studies and elucidate the hyperaccumulation mechanism(s). Since each of
these populations is relatively isolated geographically, it is plausible that the factors
involved with hyperaccumulation within each population has evolved independently
(Pollard et al., 2002; Dubois et al., 2003), further complicating the synthesis of published
results.
There are several potential contributing factors to hyperaccumulation, specifically
regarding the uptake, transport, and storage of heavy metals in the leaf tissue. Current
research about phytoremediation includes the role of rhizosphere acidification or
exudation (Luo et al., 2000; Gove et al., 2002; Whiting et al., 2001a; Hammer and Keller,
2002; Zhao et al., 2001; Collins et al., 2003), rhizospheric bacteria causing metal
mobilization (Delorme et al., 2001; Whiting et al., 2001b; Lodewyckx et al., 2002),
overexpression of cation root transporters (Zhao et al., 2002; Lombi et al., 2001a; Lombi
11
et al., 2002), or genetically controlled root foraging (Whiting et al., 2000; Haines, 2002).
Further, the evolutionary reason for hyperaccumulation has been debated, although
research suggests that hyperaccumulation of heavy metals provides protection against
herbivory and parasitism (Boyd and Martens, 1992).
Despite these unknowns, the application of T. caerulescens for remediation is still
promising. However, the small size and slow growth rate of T. caerulescens is a primary
limiting factor for using this technology However, research on plants grown in growth
chambers in pots containing homogenized soil from two contaminated sites, found that T.
caerulescens could be more effective than the high biomass crop Zea mays in the removal
of Cd and Zn (Lombi et al., 2001b). This conclusion was based on the concentrations in
leaf tissue from both Z. mays and T. caerulescens in three successive croppings over 391
days. T. caerulescens was more efficient on one of the two test soils. The soil in which
Z. mays was more effective had a relatively high Cu content and T. caerulescens has been
found to exhibit sensitivity to Cu (McLaughlin and Henderson, 1999). This was perhaps
the reason that Ebbs et al. (1997) found that while T. caerulescens had the highest
concentrations of Cd and Zn, three Brassica species removed the most metal in the higher
Cu test soil because the Brassica had approximately 10 times the biomass of T.
caerulescens. The test soil used in the experiment had Cu levels equivalent to those in
which T. caerulescens exhibited Cu sensitivity. Therefore, the application of T.
caerulescens may be limited to soils without high Cu concentrations.
Phytoremediation can be cost effective, but conclusive economic data is still
limited (Glass, 1999). Current methods of removing toxic metals from soils are
expensive. One method for heavy metal removal is soil vitrification, in which the
12
contaminated soil is heated to a molten state, breaking down the organic matter and
allowing the contaminants to conglomerate. The conglomerate is permanently left in the
soil, but no longer poses a threat to humans or wildlife. To use this method on the top 20
cm of contaminated soil has been estimated to cost $273 000 per hectare (McGrath et al.,
2000). Alternatively, simple disposal of the top 20 cm of contaminated soil to a landfill
would cost $117 000 per hectare (McGrath et al., 2000). This does not include the
additional cost to refill with clean top soil. Japan has over 500 000 hectares of rice
paddies polluted with Cd (Chaney, personal communication) and based on these cost
estimates, remediation of these areas by the proposed methods would cost from 58.5 to
136.5 billion dollars. Using hyperaccumulators to remediate the same land is estimated
to cost a fraction of the price because conventional farm practices could be used to grow
hyperaccumulators at an estimated to cost $1 084 per hectare (McGrath et al., 2000).
This estimate does not include the machinery, which may either be preexisting or need to
be purchased, cost of the seed, site monitoring, possible chemical amendments to
enhance metal availability, or general farm overhead (McGrath et al., 2000). Also, the
ash of the plants can either be recycled or disposed of in a landfill, which would cost an
additional $70 per ton/ hectare yield of dry matter (McGrath et al., 2000). Nevertheless,
these costs are trivial in comparison to traditional soil remediation methods. Further, the
burning of the biomass would produce a considerable amount of energy. This would
cover the costs of the recycling process, and the cultivation, harvest and transport of the
plants, and still generate a profit (Chaney and Zoepfl, 1998). Since Cd does not have
much economic value in the market (in 1998, the element cost less than $0.50/pound
13
(Plachy, 1998)), the economic gain for phytoremediation is from selling biomass for
energy, as well as the benefit from reclaiming polluted land (Chaney and Zoepfl, 1998).
1.4 Selection and Breeding for Increasing Metal Hyperaccumulation
The efficiency of phytoremediation with T. caerulescens could be improved by:1)
identification and increase through vegetative propagation or seed of superior genotypes;
2) breed improved cultivars through selection and recombination; and 3) genetically
engineer superior lines through gene isolation and transformation. The southern France
ecotypes appear to be promising Cd hyperaccumulators (Lombi et al., 2000; Perner et al.,
submitted). In the Saint Félix-de-Pallières (S) and Viviez (V) populations from southern
France, the plants with the lowest Cd concentration still accumulated three times more
than the definition of Cd hyperaccumulation (Perner et al, submitted). Therefore, based
on Cd concentration, using seed from either of these populations would be more effective
than using seed from any T. caerulescens population. Another approach would be to
selectively breed T. caerulescens to improve its ability to hyperaccumulate Cd and Zn.
The goal would be to select genotypes for mating that would produce progeny that
exceeded the accumulation and yield in parental material to develop cultivars for
increased metal removal per unit area. More problematic, due to risks associated with
genetic engineering, would be to insert genes for hyperaccumulation into high biomass
species. The goal of improving the germplasm would be to minimize the time necessary
for remediation. Some have estimated clean-up for sites to be over 10 successive
croppings (McGrath et al., 1993). Since many of the contaminated sites are currently
14
under cultivation, remediation needs to be timely so that interference with crop
production is limited.
Controlled crosses allow the breeder to combine desirable traits of different plants
into a single plant or line, as well as increase the number of favorable genes through
selection based on phenotype or genotype of target traits. For example Perner et al.
(submitted) found that the ‘Prayon’ ecotype produced twice the biomass of the two
southern France populations, S and V. On the other hand, ‘Prayon’ did not
hyperaccumulate Cd, while the S and V populations were super hyperaccumulators.
Depending on the heritabilities for biomass and hyperaccumulation, plants from ‘Prayon’
and the most effective S accumulator plants could be crossed to generate progeny with a
range of both desirable traits for continued mating and selection. The success of a cross,
in any breeding program, hinges on several key factors. Foremost, the desirable
characters need to be genetically controlled and there must be a means of identifying
plants possessing favorable genes. If environmental and genotype x environmental
interactions strongly influence a plant’s phenotype, progress based on phenotypic
selection and controlled matings will be limited. Results from Perner et al. (submitted)
provide a strong indication that hyperaccumulation for Cd and Zn in T. caerulescens is
genetically controlled. In a controlled growth chamber study on homogeneous soil
polluted with Cd and Zn, large phenotypic differences for Cd accumulation occurred
among and between families (Perner et al, submitted). Unlike research that has reported
differences in accumulation based on plants grown in different soils and climates
(Reeves et al., 2001), this study was conducted in a controlled environment in a
homogenous soil, and the variation among families was greater than variation within
15
families. Therefore, it is likely that genetic differences contributed to the phenotypic
variation.
A successful breeding program also depends on identifying existing genetic
variability for the trait of interest within the plant material. If the chosen populations’
genes for a trait of interest are identical, the phenotype of the trait is fixed. This occurs
with inbred populations or identified self-pollinating lines. However, some populations
maintain variability for traits of interest by cross-pollinating within their population. For
T. caerulescens, biologically significant variability for both Cd and Zn accumulation
within and among populations has been documented. For example, metal accumulation
ranged from approximately 50-2750 ppm Cd and 1100-9000 ppm Zn (Lombi et al.,
2000), 550-1400 ppm Cd and 9000-30000 ppm Zn (Escarré et al., 2000), 6-2908 ppm Cd
and 4600-53450 ppm Zn (Reeves et al., 2001), and 300-1300 ppm Cd and 790-2700 ppm
Zn (Perner et al., submitted). One of the earliest studies evaluating the differences
between populations of T. caerulescens found significant morphological differences
among populations from Great Britain (Ingrouille and Smirnoff, 1986). Further, using
two populations from Great Britain, significant variation for Zn accumulation was found
at both the population and family level (p<0.001) (Pollard and Baker, 1996). Similar
conclusions were reached in a sampling of six populations from southern France.
Significant differences in Cd and Zn accumulation occurred between the six populations
and within a family of ten siblings (p<0.01) (Escarré et al., 2000). In another study, two
populations from southern France, one from Great Britain, and one from Belgium showed
significant variation among the populations for Cd accumulation, but not for Zn
accumulation (Lombi et al., 2000). Finally, within two southern France populations,
16
there were significant differences in both Cd and Zn concentrations in the leaf tissue
when grown under uniform soil conditions among and between families (Perner et al.,
submitted). It is difficult to synthesize these results because of the confounding effect of
using different populations, as well as different growing conditions and/or soils.
However, genetic variation for hyperaccumulation appears to exist across the species.
This variation is a prerequisite for being able to select individuals to improve the
populations’ phenotype.
Phenotypic variation for the desirable trait due to genetic and environmental
effects that are not heritable will slow the progress of a breeding program. Therefore,
heritability, the degree to which a trait is passed from the parents to the progeny, is an
important determinant of gain from selection. The degree of heritability usually depends
on whether the trait is quantitative or qualitative in nature. Multigenic traits tend to have
lower heritability because of the lower probability of selecting parents with the potential
of passing on all of the desirable alleles at multiple loci. The number of genes involved
in Cd and Zn hyperaccumulation for T. caerulescens is one potential reason for moderate
heritabilities. Further, if the trait is largely affected by the environment, then the
heritability will also be low, since the phenotype is not primarily determined by
genotype. While it is clear that hyperaccumulation depends on a certain degree of metal
presence in the soil, there has not been a significant correlation established between
hyperaccumulation and soil metal concentration, thus indicating a large genetic
contribution to this trait (Pollard et al., 2002).
Heritability estimates are very important to a breeder, because if the heritability is
too low, then a breeder cannot expect a large phenotypic response in a selection breeding
17
program per se. Low heritability traits can still be selected for if breeding strategies, such
as selection based on a mean (rather than individual) in a highly controlled environment
are used. A conservative estimate of the broad sense heritability determined from
analysis of variance (ANOVA) for Zn uptake with two T. caerulescens populations from
Great Britain was found to be significantly different than zero (p<0.05) (Pollard and
Baker, 1996). The broad sense heritability for biomass was greater than that of Zn
accumulation, suggesting that selecting for biomass may be a more successful approach
than selecting for Zn uptake in order to increase total Zn removal from the soil (Pollard
and Baker, 1996). Distantly related to T. caerulescens, A. halleri, also a Zn
hyperaccumulator, heritability estimates of individual families ranged from 0.25 to 0.50,
suggesting that selection for hyperaccumulation would be successful (Macnair, 2002).
Finally, the breeding procedures utilized will ultimately determine the success of
improving a certain line, germplasm pool, or population. Breeding procedures are
usually developed based on the mode of pollination (selfing, outcrossing, or asexual). In
addition, data regarding inbreeding depression, heterosis, and combining ability can be
used to determine the best end product of a breeding program (i.e. developing inbred
lines, hybrids, synthetic or open-pollinated populations) to maximize gains. For T.
caerulescens, the mode of pollination appears to differ among the ecotypes. In the early
literature, T. caerulescens (formerly identified as T. alpestre) was estimated to be 95%
self-pollinated (Riley, 1956). Considering the small, inconspicuous flower size of T.
caerulescens, the entire species was assumed to be largely self-pollinated, and that a
small frequency of outcrossing occurred to maintain a certain level of heterozygosity
(Jain, 1976). More recent research has suggested that certain populations of T.
18
caerulescens, particularly those from metal contaminated sites, have greater outcrossing
rates. In an isozyme analysis of 28 populations of T. caerulescens, maximum outcrossing
was estimated at 88%, with this highest value attributed to a population from a high Zn
soil (Koch et al., 1998). A more recent study of allozymes and pollen:ovule ratios from
14 different populations found a similar result (Dubois et al., 2003). The authors suggest
that the populations from non-contaminated sites seem to have higher selfing rates than
those from contaminated sites (Dubois et al., 2003). Crosses with selected T.
caerulescens parents also indicated that the parents were heterozygous (and therefore,
part of an outcrossing event) because the first generation segregated for
hyperaccumulation (Frérot et al., 2003). These results are the first indications that
outcrossing rates may be specific to each population, but more research needs to be
completed to confirm these early reports. Although outcrossing may be common, T.
caerulescens appears to be fully self-compatible (Koch et al., 1998), which would allow
breeders to use designs for self pollinators.
Current information regarding the genetic basis of hyperaccumulation is minimal.
Fundamental questions about the number of genes, the presence of epistasis, and the
proportion of additive or dominant variance attributed to each gene remain unanswered.
All of these factors are important contributions for breeding strategies. A controlled
study utilizing crosses with inbred lines could answer many of these questions.
Recently, populations have been discovered in southern France that have a
unique ability to accumulate Cd in concentrations 10-80 times higher than other Cd
hyperaccumulators (Escarré et al., 2000; Lombi et al., 2000; Reeves et al., 2001; Peer et
al., 2003; Perner et al, submitted). Therefore, these populations are a logical choice to
19
serve as the parent material to increase metal accumulation through breeding. Some T.
caerulescens populations may mediate Cd accumulation through Zn transporters, but
these superior populations appear to have a separate mechanism for accumulating Cd
(Lombi et al., 2001).
Since Cd is not an essential element for metabolic functions, others have
suggested that Cd hyperaccumulation is dependent on the mechanisms by which the plant
hyperaccumulates Zn (Pence et al., 2000; Lombi et al., 2001a). Phenotypic correlations
in leaf tissue between Cd and Zn concentrations support this theory and have been
significant, even in the super hyperaccumulators from southern France (Roosens et al.,
2003; Perner et al., submitted). However, genetic correlations between Cd and Zn
concentrations are needed to confirm whether Cd and Zn hyperaccumulation are
independent from each other. Genetic correlations are due to either the genes being
pleiotropic or linked (Bernado, 2002). Pleiotropy, is less common, because this has a
physiological basis. If the gene(s) for Cd and Zn hyperaccumulation are pleiotropic the
genetic correlation would be expected to be close to 1. However, there may be some
overlap of the genes used for bi-metal hyperaccumulation, but some degree of
independence as well, in which case the genetic correlations would be significant but not
as great in magnitude.
If Cd and Zn hyperaccumulation are genetically correlated due to coupling, this
can be exploited in a selective breeding program. Improving Cd phytoextraction is of
preliminary interest because of the critical need to remove this metal from rice paddy
soils that have caused health problems throughout Asia (Section 1.2). However, Zn
pollution generally occurs in the same sites (Alloway and Steinnes, 1999). Therefore, if
20
Cd accumulation is improved in a breeding program through selection, then Zn
accumulation would also improve through indirect selection Similarly, if Cd
hyperaccumulation and biomass are positively genetically correlated, selection for either
trait would indirectly improve the other.
1.5 Marker Based Selection for Hyperaccumulation
Marker based selection (MBS) uses DNA markers linked to the target genes.
Commonly used markers include AFLPs (Amplified Fragment Length Polymorphism),
RAPDs (Random Amplified Polymorphic DNA), RFLPs (Restriction Fragment Length
Polymorphism), or SSRs (Simple Sequence Repeat). The most desirable marker type is
inexpensive, does not need sequence information to be developed, is not labor intensive,
gives the maximum amount of information, and uses a small amount of DNA. None of
the marker technologies have all of these characteristics, so markers are usually chosen
based on research goals and available resources.
MBS can be an efficient way to help identify plants for traits or species that are
difficult, expensive or time-consuming to evaluate, can not be evaluated on juvenile or
young plants, or are difficult to assay. In the case of Cd or Zn hyperaccumulation in T.
caerulescens, phenotypic screens have been conducted after the plants are grown for four
months on homogenized and contaminated soil. After the leaf is harvested, tissue
digestion analysis requires approximately 10-12 hours per 50 plant samples and then is
analyzed using an inductively coupled plasma emission spectroscopy (ICP). Thus, a
large amount of space, manpower and expensive equipment is needed. In contrast, DNA
markers can be run using a few leaves of a plant grown on any medium and selection can
be made before pollination. Further, DNA markers are useful for selecting plants with
21
traits that have a low heritability. Additional reasons for using markers in selection
include the ability to screen for multiple traits in one experiment, minimizing linkage
drag, and the ability to efficiently recover the recurrent parent’s genotype in a breeding
program (Young, 1999).
For hyperaccumulation, initially it is likely that selection would be solely based
on MBS, as opposed to Marker Assisted Selection (MAS) because other primary traits of
interest have not yet been established. MBS would be an effective means to screen the T.
caerulescens plants collected from different populations and environments to develop a
germplasm pool of superior metal hyperaccumulating genotypes. As a breeding program
develops and other traits, like biomass, become of more importance, selection may then
be based on MAS, which would allow other factors, such as biomass, to be included with
the marker data to select plants based on an index score assessing multiple traits.
The hyperaccumulation traits for both Cd and Zn are likely to be multigenic
(Pollard et al., 2002). Thus, useful markers for hyperaccumulation of either metal would
probably be associated with quantitative trait loci (QTL). Once a QTL has been
identified, a closely-linked marker can be used to track the genes of interest in
segregating progeny. In addition, the number of markers necessary can be minimized
using statistical procedures to determine which DNA fragments account for the greatest
amount of variation for the trait. There are two requirements to determine the effect and
map positions of QTL: a linkage map of polymorphic loci that cover the entire genome
and variation of the trait of interest within the population (Falconer and Mackay, 1996).
For T. caerulescens, without a published linkage map, markers that are related to
hyperaccumulation can only be determined by a single factor ANOVA. However, the
22
number of genes involved and gene effects cannot be determined without a map. Further,
detecting real QTL can be difficult depending on the population used and the heritability
of the trait. Research has suggested that using mapping populations below 500
individuals would not resolve reliable QTL (Young, 1999). In addition, once a mapping
population and QTL have been detected, repetition over several years, locations, and
among genetically unrelated populations is necessary to better understand the individual
effects of loci contributing to the phenotype (Young, 1999). While statistical methods
are powerful for QTL data, they cannot compensate for small populations, and/or
populations from a single environment or of one generation (Young, 1999). Therefore, a
considerable volume of work needs to be completed for a better understanding of the
genes involved in hyperaccumulation in T. caerulescens.
It is important to note that lines of T. caerulescens for QTL detection have not
been developed to date. For populations that tolerate self-pollination, generally parent
material is selfed to homozygosity and then lines with opposite traits are selected. For
example, in the case of QTL detection for Cd accumulation, ideally one parent would
have very high accumulation (>1000 ppm dwt Cd in leaf tissue) and one parent would not
accumulate Cd to be distinguished from a hyperaccumulator. Once these lines have been
selected, a cross between them would create an F1 population, in which the individuals
are genetically identical to one another (and therefore, phenotypically identical), but the
linkage disequilibrium (LD) of alleles is at a maximum. Once the F1 group is selfed, the
resulting F2 progeny will segregate to determine phenotypic and genetic linkages through
detecting recombination of allelic events as a result of LD. As subsequent generations
are produced, and/or the more random mating that occurs in a population, the more likely
23
alleles will be in linkage equilibrium making the detection of an association between a
trait and a molecular marker difficult. Using a greater number of markers to cover a
larger percentage of the genome is one method to compensate for using populations that
have been under random mating. Humans are close to a random mating population
(although not truly random mating), and genetic linkage detection requires a much
greater number of molecular markers, which are not likely available for plant species.
Finally, linkage detection can be completed with heterozygous parent material and
segregation of the F1, but more markers are necessary for powerful QTL identification.
1.6 Hyperaccumulation Gene Identification and Genetic Engineering
A large amount of the published molecular biology work with T. caerulescens has
focused on identifying genes involved with Zn transport across cell membranes. Most of
this work has been completed by isolating these Zn transport genes and then testing for
functional complementation in yeast (Pollard et al., 2002). This depends on comparative
bioinformatics between various plant species cDNA and genomic data (Pollard et al.,
2002). While the genome of related A. thaliana has been sequenced, it does not
accumulate metal (Peer et al., 2003), which may limit the amount of transferable genes
involved in the ability to hyperaccumulate. The earliest report of genes involved with Zn
transport identified three genes, ZIP (Zn-Iron Permease)1, ZIP2, and ZIP3 cloned from A.
thaliana (Grotz et al., 1998). Expression of ZIP1 and ZIP3 responded to Zn deficiency,
suggesting these may be involved in Zn transport for plants. The identified ZIP
transporters do not show sequence similarity to other families of membrane proteins
identified in metal transport, including the tranporter ATPases, ABC transporters, and
Nramp proteins (Grotz et al., 1998). The ZIP family proteins are believed to have eight
24
transmembrane domains, with both the amino and carboxy terminal ends on the
extracellular surface, with the size ranging from 309-476 amino acids (Grotz et al., 1998).
Between transmembrane regions III and IV there is an unpredictable length of amino
acids, which has been identified as the “variable region”. These proteins would not be
logical candidates for gene transfer to a larger biomass crop for phytoremediation, since
none of the sites for application would be Zn deficient.
Another study using A. thaliana identified a gene involved with Zn resistance and
accumulation with homology to Zn transport genes from mammalian cells. This gene
was named ZAT (Zn transporter of A. thaliana) and is characterized by six potential
transmembrane regions, and had 40-50% similarity to mammalian Zn transport genes at
the nucleotide level (van der Zaal., 1999). Using transgenic A. thaliana with the ZAT
gene in the sense orientation revealed that the protein was involved in Zn resistance and
increased the Zn accumulation in the roots (van der Zaal et al., 1999).
A Zn transporter was isolated in T. caerulescens (Prayon), named ZNT1 (Pence et
al., 2000). Complementation of this gene in yeast confirmed that it mediated high
affinity Zn uptake and low-affinity Cd uptake (Pence et al., 2000). Further, the gene was
overexpressed in T. caerulescens, when compared to the non-accumulator, T. arvense.
The authors conclude that the ZNT1 gene is an integral part of the hyperaccumulation
mechanism for T. caerulescens. Two other genes, ZTP1 (homolog of ZAT) and ZNT2
(homolog of ZNT1) were cloned from three different accessions of T. caerulescens
(From La Calamine, Belgium, Monte Prinzera, Italy, and Lellingen, Luxembourg)
(Assunção et al., 2001). High expression of these genes was observed from root tissue,
25
suggesting their involvement with the removal of Zn from the soil (Assunção et al.,
2001).
A physiological study was conducted to identify an independent Cd
transmembrane protein to mediate high affinity Cd transport (Lombi et al., 2001a). Two
ecotypes were used: Prayon (Belgium) and Ganges (southern France). The Ganges
ecotype had previously showed a much greater capacity for uptake of Cd than Prayon,
potentially indicating a different mechanism of Cd accumulation between the two
populations. Using radiotracer techniques, the authors concluded that the mechanisms
for Zn hyperaccumulation were similar between the two ecotypes, but that the Ganges
ecotype had different kinetic parameters for Cd uptake. In addition, Cd uptake was
reduced in the Prayon population when Zn was present in the soil solution. Conversely,
the uptake of Cd in the Ganges ecotype was not affected. This research suggests that the
populations which are superior in Cd accumulation (i.e. tolerant to >10 000 ppm tissue
concentration) may have independent and specific mechanisms for Cd uptake.
In a subsequent study, two ZIP genes, TcZNT1-G and TcIRT-G genes were
cloned and tested for expression in the Ganges ecotype (Lombi et al., 2002). These genes
were thought to be involved in Cd accumulation as accumulation was enhanced when
tested in Fe deficient conditions. In fact, the authors found overexpression of TcIRT-G in
the roots of Ganges plants in Fe deficient conditions (compared to no expression in the
Prayon ecotype). The authors conclude that TcIRT-G may be involved in Cd regulation
and accumulation, specifically in Fe deficient conditions. In terms of application in
remediation, these genes would probably not be of interest because polluted sites are not
Fe deficient.
26
For many plant species, metal tolerance and detoxification results in the
production of phytochelatins or metal binding proteins, which increase in the presence of
heavy metals (Cobbett, 2000). However, this appears to be a mechanism of heavy metal
tolerance as opposed to accumulation. For hyperaccumulator plants, phytochelatins have
not been found to be either the mechanism of tolerance or accumulation (Pollard et al.,
2002; Ebbs et al., 2002). Further, the traits for tolerance and accumulation have been
shown to be genetically independent characters (Macnair et al., 1999; Assunçäo et al.,
2003a; Bert et al., 2003), which means that there could be two different mechanisms for
these phenomena in T. caerulescens.
Tolerance is the ability of a plant to survive in a soil in which the level of
contaminant would be toxic to plants of the same or different species. In a review of the
genetics of tolerance, the trait appears to be governed by a small number of major genes
(Macnair, 1993). For both Cd and Zn, metal tolerance appears to be under the control of
one or two major genes (Macnair, 1993; Macnair et al., 1999; Schat et al., 1996). In
addition, minor genes may also contribute to the continuous variation for metal tolerance
(Macnair et al., 2000). In a recent study with A. halleri, the authors conclude that Cd
tolerance is controlled by two or three major genes with an additive effect (Bert et al.,
2003). Like tolerance, hyperaccumulation appears to be multigenic (Pollard et al., 2002)
but the number of genes involved has not yet been estimated. The most informative
study to date concerning Cd suggests that accumulation in A. halleri may be a complex
recessive character (Bert et al., 2003). While tolerance and accumulation may be
independent, plants used in phytoremediation application need to be both tolerant to high
levels of soil contaminants and superior hyperaccumulators.
27
Most of the work in gene identification and elucidating the genetics of
hyperaccumulation is still preliminary. The transporters that have been identified do not
explain the metal translocation from the roots to the shoots, which is a defining
characteristic for a hyperaccumulator (Pollard et al., 2002). In T. caerulescens, Zn is
shown to accumulate in the vacuolar compartment of shoot cells, which could be related
to tissue-specific expression of transporters not yet identified (Pollard et al., 2002). In
addition, the identification of transporters does not explain the extreme variation in metal
accumulation within a population. For example, in a southern France population, Cd
accumulation ranged from 300 – 1300 ppm (Perner et al., submitted). Clearly, assuming
transporters are involved in Cd hyperaccumulation, like Zn accumulation, all of the tested
plants would express them. Perhaps promoter elements for particular genes in multigene
families cause the variation in metal accumulation within populations (Pollard et al.,
2002). Pence et al. (2000) hypothesized that Zn accumulation differences between the
non-accumulator T. arvense and T. caerulescens were due to a greater density of Zn
transporters in the root-cell plasma membrane for T. caerulescens. Following the same
rationale, the variation in a population could be due to a variable number of genes coding
for transporters in each plant.
One of the biggest drawbacks to using T. caerulescens for phytoremediation is
plant biomass is quite low. Gene transfer into a higher biomass plant could improve
metal removal, but if hyperaccumulation is polygenic or controlled by QTL then gene
transfer is not currently practical. Successful gene transfer requires that gene insertion
occurs in a location of the genome where there would be stable expression with
Mendelian transmission, as well as not interfere with other gene expression (Gepts,
28
2002). In addition, transgenic molecular techniques tend to have a number of
uncertainties not found with traditional breeding approaches (Gepts, 2002). As
previously discussed, the ability to hyperaccumulate may be controlled by a few major
genes with additional modifier genes that control the degree of hyperaccumulation
(Pollard et al., 2002). To be able to successfully insert these genes, have them expressed
and work in concert without disturbing other functions within the genome, is very
daunting. There have been no known published reports of T. caerulescens gene transfer
to another plant although T. caerulescens has been transformed by floral dipping with
Agrobacterium tumefaciens with the ability to easily select the transformed individuals
with herbicide resistant and expressed green fluorescent protein (Peer et al., 2003). Thus,
T. caerulescens may be amenable to various gene insertions to improve performance but
additional research is needed to determine whether T. caerulescens genes can be inserted
and expressed in high biomass species.
Somatic hybridization between T. caerulescens and Brassica napus (Brewer et al.,
1999; Dushenkov et al., 2002) has produced plants with increased biomass that
hyperaccumulate Zn. In the first study, the hybrid was successful and accumulated Zn
and Cd at levels that would have otherwise been toxic to B. napus. Unfortunately, all of
the hybrids were infertile and eventually died. Since Brassica is a related species to T.
caerulescens, but with more substantial biomass, other attempts with different
populations and a greater number of hybrids may be more successful. In the second
study, 14 hybrids (both symmetric and asymmetric) were developed between B. juncea
and T. caerulescens (Dushenkov et al., 2002). Two of the 14 plants were able to produce
seeds, but the seed set was low. The asymmetric hybrids had greater biomass, as well as
29
heavy metal tolerance, and the ability to accumulate Zn and Ni. These two studies
indicate that hybridization may be an effective method to improve the efficiency of
accumulation of T. caerulescens. Since this method does not involve gene transfer,
hybridization may be a more successful approach for achieving hyperaccumulation in a
higher biomass crop.
30
2.0 Breeding Considerations for Improving Cadmium Hyperaccumulation in Two French Thlaspi caerulescens J. & C. Presl. Populations
2.1 Introduction
Soil Cd pollution has been a known health threat since the early 1970’s, when rice
grown on soils in Japan near Zn mines was found to have available Cd levels that caused
itai-itai disease (Chaney et al., 1998). In Asia, Japan has the largest area of soil Cd
pollution, with approximately 500 000 hectares. However, the problem is not limited to
Japan, as China has 100 000 hectares, and Korea, Vietnam, and Thailand each have less
than 10 000 hectares with high Cd levels (R.L. Chaney, personal communication).
Phytoremediation, using hyperaccumulators to extract soil metal contaminants and
concentrate them in harvestable shoot tissue, has been suggested as a cost effective
alternative to traditional soil remediation (Chaney, 1983). Thlaspi caerulescens is
considered to be the most promising species for phytoremediation of Cd and Zn polluted
soils, as certain populations can accumulate more than 1% Cd (Lombi et al., 2000) and
3% Zn (Brown et al., 1995) on a shoot dry biomass basis. Although, leaf concentrations
of Cd and Zn in T. caerulescens can be very high, the total amount of Cd and Zn removed
is limited by T. caerulescens’ slow growth rate and small stature. Thus, the efficiency of
remediating Cd and Zn polluted soils with T. caerulescens could be improved through
selection and recombination of superior ecotypes to increase the total uptake of Cd per
hectare. Most of the previous genetic research has focused on identifying genes involved
with Zn accumulation and the molecular physiology of Zn transporter proteins (Pence et
al., 2000; Lasat et al., 2000; Assunção et al., 2001). No research specifically focusing on
cultivar development and breeding strategies has been published. The intent of the
reported study is to estimate the genetic potential for increasing total plant uptake of Cd
31
and Zn via plant breeding and use the genetic estimates to recommend optimum
procedures for cultivar development.
We studied phenotypic and genetic variation among and between families in two
T. caerulescens populations from southern France that have been shown to accumulate
extremely high concentrations of Cd in their leaves and are considered to be “super
hyperaccumulators”. Progenies grown in growth chambers were assessed in a high Cd
soil with a Cd:Zn ratio of 1:17, with 48 ppm Cd and 821 ppm Zn. Soils with high Cd:Zn
ratios are problematic because soil Cd can be readily transferred into a crop. These
problem soils are not widespread in Asia, where soils used for rice production have a
Cd:Zn ratio close to 1:100 (Chaney, personal communication). However, the process of
draining the rice fields for optimum cultivation increases Cd availability to ratios close to
the one used for this study (Chaney et al., 1996).
The research objective was to collect and derive basic information necessary for
developing an effective breeding program including the mode of pollination, existing
genetic structure of the parent population and heritability estimates. This information can
assist plant breeders in determining the most effective mating designs and selection
schemes to improve a population or develop a cultivar.
Recent research suggests that the mode of pollination for T. caerulescens varies
among populations and reported outcrossing rates ranged from 12-88% in 28 sampled
populations (Koch et al., 1998), and both self- and cross-pollination occurred in
populations from contaminated sites (Dubois et al., 2003). Based on a previous study of
the southern France populations (Perner et al., submitted), there was significant
phenotypic variation in a homogeneous soil screen for Cd accumulation among and
32
within populations, suggesting a possible mixed-mating or outcrossing pollination
system. In order to better understand the genetic structure and estimate the breeding
potential of these promising populations, we used PCR random amplified polymorphic
DNA (RAPD) analysis. The resulting DNA RAPD bands were also used to establish the
relationship between the phenotypic and genetic variability. This relationship was used
to predict the effectiveness of assessing Cd and Zn leaf concentrations based on a
phenotypic screen for these two populations.
The phenotypic screen using plants grown in soil for four months and subsequent
leaf tissue analysis using inductively coupled plasma emission spectroscopy (ICP)
requires a significant amount of labor and time as well as expensive equipment and
reagents. Thus, marker based selection (MBS) could be a more efficient method of
selection in a breeding program because DNA markers could be detected with a small
amount of plant material grown in any material.
Currently, there is debate whether the Cd and Zn hyperaccumulation mechanisms
are independent from one another. Cd and Zn hyperaccumulation were not significantly
correlated in the southern France populations (Lombi et al., 2001), yet other studies have
reported significant phenotypic correlations between Cd and Zn leaf concentrations
(Roosens et al., 2003; Perner et al., submitted). However, phenotypic correlations
include the environmental correlations and may differ from genetic correlations. In this
experiment, genetic correlations are estimated to determine whether the genetic
mechanisms between Cd and Zn accumulation are independent. Finally, narrow sense
heritability for Cd and Zn concentrations, biomass, and total metal uptake were calculated
in order to estimate response to selection and these estimates can be used to then predict
33
gain in progress with selection. Although the estimates of these genetic parameters are
limited because they are based on subsamples from a small natural population, these
estimates should provide useful initial information for developing breeding program
guidelines to improve total Cd and Zn uptake.
2.2 Materials and Methods
Seeds of T. caerulescens plants collected by Roger Reeves from two sites in
southern France were used for this study: Saint Félix-de-Pallières (S), a Zn and lead (Pb)
metal workings site until 1972, and Viviez (V), a Cd and Zn smelter in operation into the
1980’s had high levels of soil Cd, Zn, Pb, copper (Cu), and arsenic (As) (Reeves et al,
2001). Leaf tissue from the maternal parent plants of both populations exhibited a wide
range in both Cd and Zn accumulation. However, metal concentrations of certain
samples from both populations significantly exceeded the definition of
hyperaccumulation >100 ppm Cd (Baker et al., 2000), >10 000 ppm Zn (Baker and
Brooks, 1989). Soil and shoot tissue Cd and Zn concentrations are given in Table 1.
Further description about the two locations is described in Reeves et al. (2001).
Table 1 Soil and shoot tissue (dwt) Cd and Zn concentrations from samples for the S and V T. caerulescens populations (data from Reeves et al., 2001).
Population Soil Cd (ppm) Soil Zn (ppm) Shoot Cd (ppm) Shoot Zn (ppm)
S 35-265 6654-64360 31-2890 1339-53450
V 28-578 3098-99500 56-2908 2832-23470
Seed collected from each plant were bulked to form half-sib and/or full-sib
families within each population. Seed were sown to grow progenies from the two plant
34
populations (S and V) in soil from a biosolids farm in St. Mary’s, Pennsylvania, where a
CdS industry had discharged large amounts of Cd into the sewer. Collected soil was
sieved and thoroughly mixed to minimize variation. The soil contained 48 ppm Cd and
821 ppm Zn as determined by atomic absorption spectrometry (AAS) analysis after hot
nitric acid digestion. Eight siblings of 24 or 25 families from each population were
grown in the polluted soil for approximately 70 days. Cd and Zn concentrations were
determined for leaf tissue of each plant using ICP analysis after hot nitric acid digestion
(Perner et al., submitted). Based on these data, four families from each population,
chosen for their extreme levels for Cd and Zn accumulation were further studied. Figure
1 presents the mean accumulation levels for Cd and Zn for the siblings from the eight
families used in this study.
Leaves were harvested from the siblings of the selected families and stored at -80
C until DNA isolation. Qiagen/Operon mini-prep kits were used for DNA extraction.
Leaves were ground in a mortar and pestle with liquid nitrogen. The standard extraction
procedure was followed including the optional centrifugation for five minutes at
maximum speed after step four (Qiagen/Operon, 2003). In addition, in the final elution
steps (12 and 13), 50 µL of AE Buffer were used (instead of 100 µL) to increase the final
DNA concentration. DNA concentrations were determined by a Genesys 2
spectrophotometer in a 1:50 (DNA:water) dilution, and additional AE Buffer was used to
correct concentrations to 35 ng/µL. DNA samples were stored in a freezer at -20 C.
DNA analysis was conducted with four siblings of each family (except V 19, which had
three).
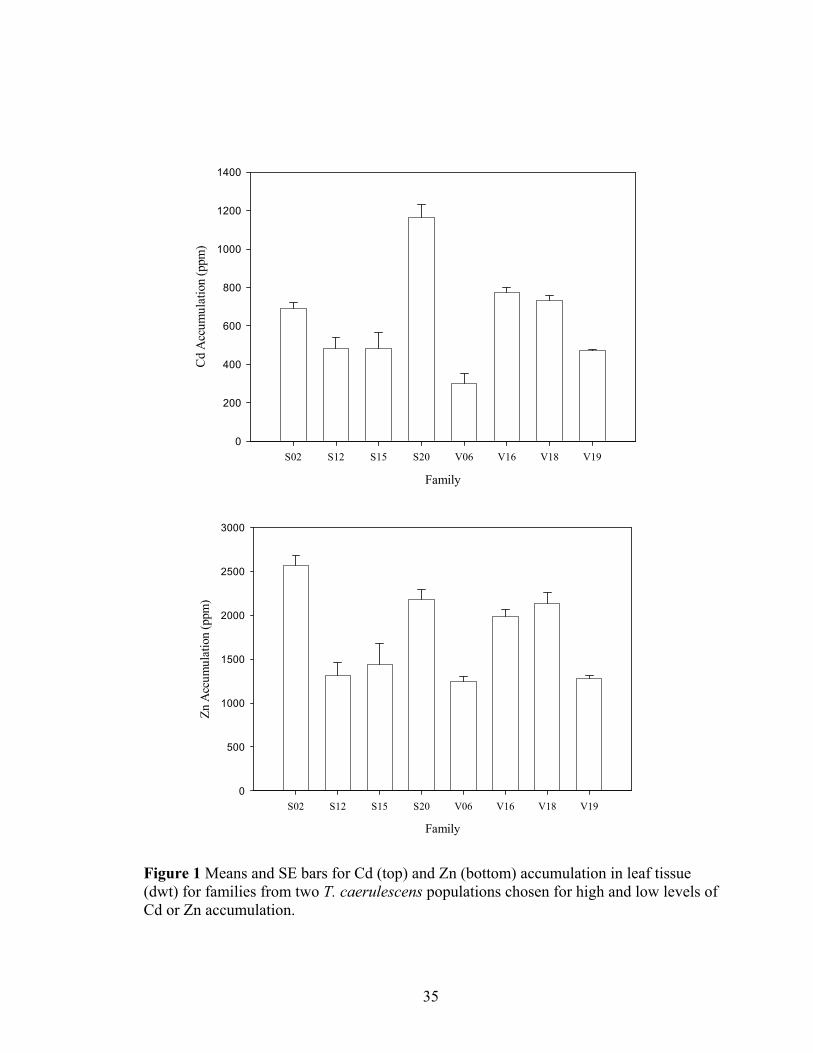
35
Family
S02 S12 S15 S20 V06 V16 V18 V19
Cd
Acc
umul
atio
n (p
pm)
0
200
400
600
800
1000
1200
1400
Family
S02 S12 S15 S20 V06 V16 V18 V19
Zn A
ccum
ulat
ion
(ppm
)
0
500
1000
1500
2000
2500
3000
Figure 1 Means and SE bars for Cd (top) and Zn (bottom) accumulation in leaf tissue (dwt) for families from two T. caerulescens populations chosen for high and low levels of Cd or Zn accumulation.
36
Polymorphic RAPD bands that were determined to be reproducible were used for
calculating the population variability indices and heritabilities. Limited DNA volume
constrained the number of primers that could be tested and replicated.
RAPD reactions were run using 0.8 µL 25mM MgCl2, 0.2 µL 40mM dNTP
(NEB), 0.4 µL 40 uM 10-mer (Qiagen/Operon), 0.1 unit Taq polymerase (NEB), 1 uL
10X Taq polymerase buffer (10 mM KCl, 10 mM (NH4)2SO4, 20 mM Tris-HCl, 2 mM
MgSO4, 0.1% Triton X-100) (NEB), and 28 ng genomic DNA. Distilled water was
added to reach a reaction volume of 10 uL. DNA was amplified in a Perkin Elmer
GeneAmp PCR System 9700 thermocycler, using an initial denaturation step of 1min at
94 C, followed by 35 cycles of three steps: denaturation at 94 C for 30 sec, annealing at
38 C for 1 min, and elongation at 72 C for 1 min 30 sec. Once 35 cycles were completed,
the samples were held for 10 min at 72 C for a final extension. The amplified DNA
fragments were visualized on a 1.5% agarose gel stained with ethidium bromide. Gels
were run at 100 V for 3 hours. Primers that produced polymorphisms were replicated in
a second thermocycler (Eppendorf Mastercyler). The same reaction mixture and cycling
profile as the first replication was used. The primers that caused the same
polymorphisms found in the original run were included for analysis. The two replications
were scored and any discrepancies between loci across all families were not included.
Nine primers (A05, A08, A15, A19, Z01, Z06, Z12, Z13, Z19) were used in the S
population to score 27 polymorphic loci. Six primers (A18, A19, G07, G19, D02, U19)
were used in the V population to score 16 polymorphic loci.
Genetic diversity among and within families from each population was quantified
using HT, HS, and GST with the program POPGENE (Yeh et al., 1997). HS is the average
37
gene diversity index within a family, HT is the gene diversity index for an entire
population, and GST is the relative magnitude of the gene differentiation calculated as
GST=(HT-HS)/HT (Nei, 1973). The inbreeding coefficient, F, was calculated as F=σq2/pq,
where σq2 is the variance of gene frequency, and p and q were the frequency of the
presence or absence of a RAPD band (Falconer and Mackay, 1996). The proportion of
individuals produced by outcrossing, c, was calculated from F, as c=(1-F)/(1+F)
(Falconer and Mackay, 1996). For Cd and Zn, the relationship between phenotypic
variation for Cd and Zn accumulation and genetic variability was determined using the
SAS Proc Regression (SAS version 8.0, 2000). The coefficient of variation (CV) from
phenotypic data for both Cd and Zn was regressed on the number of RAPD
polymorphisms within the family. The CV for both Cd and Zn was calculated using σfam,
the standard deviation of the family and µpop, the population mean for metal
accumulation. Thus, the CV is determined by CV = σfam/µpop * 100. (Data from one
sibling in family S 02 had Cd and Zn concentrations more than three standard deviations
from the family mean and was treated as an outlier and not included in the analysis).
Polymorphic data was also used to create dendrograms, or visual representations of the
genetic distance between families. POPGENE uses the unweighted pair group mean
average (UPGMA) method to create the dendrograms.
Heritabilities for leaf Cd and Zn concentrations, total metal uptake, and biomass
were estimated for both the S and V populations. Heritability estimates were based on
phenotypic data of eight siblings for 24 (S) or 25 (V) families and calculated using
variance components assuming a random model. The SAS VARCOMP_procedure was
used to estimate variance components and narrow sense heritability was estimated as the
38
ratio of VAR(among families)/[(VAR(among families) + VAR(within families)]
(Falconer and Mackay, 1996). To improve the estimates of heritabilities, we included the
percentage of outcrossing (calculated from the RAPD data), and the heritabilities
presented are a weighted average of the full- and half-sib heritabilities that better reflects
the initial populations’ genetic structure. These heritabilities were used to predict
progress from various selection designs for the aforementioned traits.
The SAS GLM procedure with MANOVA option was used to determine sums of
squares and cross products (MCP) of specific traits to calculate genetic correlations
between them (Falconer and Mackay, 1996). The genetic correlation, rA = COVXY/
√(VX*VY), where COVXY is the covariance between two traits, X and Y, and VX or VY is
the variation of the trait from phenotypic data (Bernardo, 2002). The covariance is
calculated as COVXY = MCPSibs – MCPEnv, where MCPSibs is the mean cross product of
the siblings, and MCPEnv is the mean cross product of the environment (Bernardo, 2002).
The genetic correlations were compared to the phenotypic correlations previously
determined for the plant material (Perner et al., submitted).
2.3 Results and Discussion
This is the first reported study using DNA polymorphisms to estimate population
genetic diversity of T. caerulescens. An earlier study of genetic variation in T.
caerulescens populations from both metalliferous and non-metalliferous soils was based
on isozyme analysis (Koch et al., 1998), which is at the protein rather than DNA level.
RAPD markers were found to be a useful tool for studying genetic variation because
scored loci were reproducible and polymorphic.
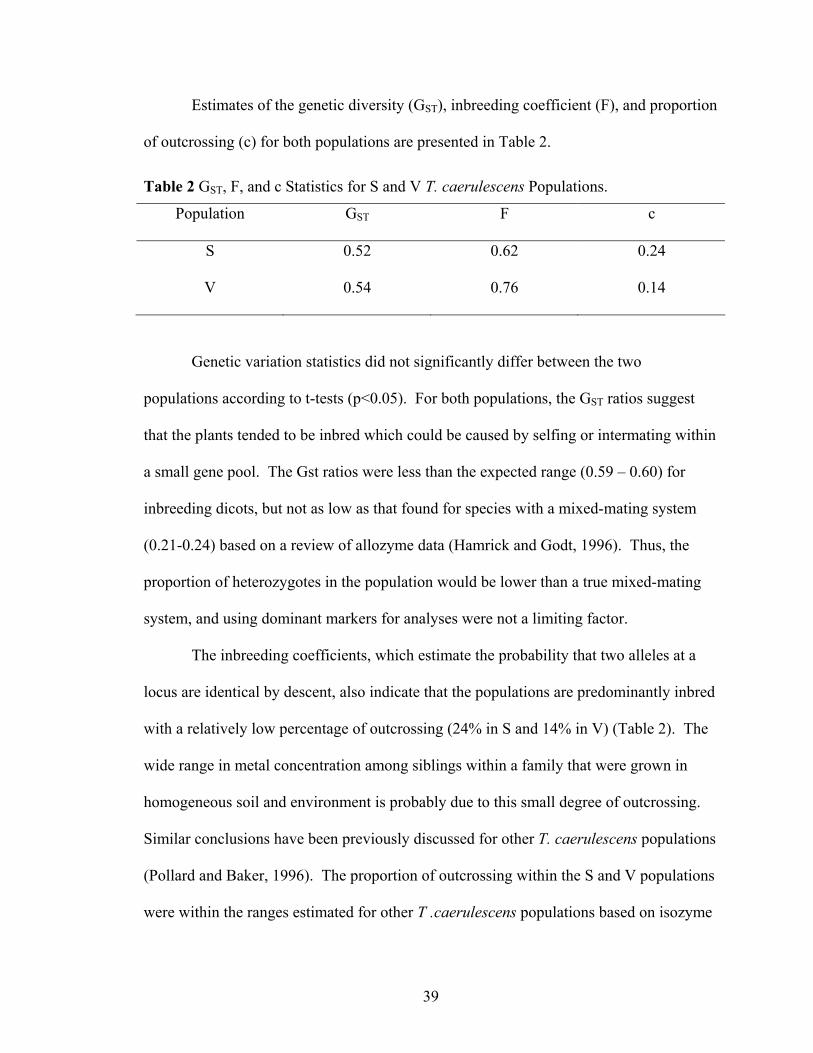
39
Estimates of the genetic diversity (GST), inbreeding coefficient (F), and proportion
of outcrossing (c) for both populations are presented in Table 2.
Table 2 GST, F, and c Statistics for S and V T. caerulescens Populations.
Population GST F c
S 0.52 0.62 0.24
V 0.54 0.76 0.14
Genetic variation statistics did not significantly differ between the two
populations according to t-tests (p<0.05). For both populations, the GST ratios suggest
that the plants tended to be inbred which could be caused by selfing or intermating within
a small gene pool. The Gst ratios were less than the expected range (0.59 – 0.60) for
inbreeding dicots, but not as low as that found for species with a mixed-mating system
(0.21-0.24) based on a review of allozyme data (Hamrick and Godt, 1996). Thus, the
proportion of heterozygotes in the population would be lower than a true mixed-mating
system, and using dominant markers for analyses were not a limiting factor.
The inbreeding coefficients, which estimate the probability that two alleles at a
locus are identical by descent, also indicate that the populations are predominantly inbred
with a relatively low percentage of outcrossing (24% in S and 14% in V) (Table 2). The
wide range in metal concentration among siblings within a family that were grown in
homogeneous soil and environment is probably due to this small degree of outcrossing.
Similar conclusions have been previously discussed for other T. caerulescens populations
(Pollard and Baker, 1996). The proportion of outcrossing within the S and V populations
were within the ranges estimated for other T .caerulescens populations based on isozyme
40
polymorphisms (Koch et al., 1998; Dubois et al., 2003). These outcrossing rates are
higher than previously estimated for T. caerulescens populations based on pollen count
(Riley, 1956). It appears that T. caerulescens populations vary in rate of outcrossing and
have unique genetic structures.
The outcrossing rates may differ between the S and V populations due to several
factors including the physical location and distance between the parent plants, since those
plants physically located close to each other would be expected to be more genetically
similar.
In the S population, plants were sampled from six different subareas. Figure 2
shows the dendrogram and the calculated genetic distances between the families for the S
population. In the dendrogram, families S12 and S15 are in the closest cluster and were
located in two different, but adjacent, subareas (R. Reeves, personal communication).
Each subarea had approximately a 50 m radius (R. Reeves, personal communication).
Families S02 and S20 are depicted in the second closest cluster, but these plants were
from subareas not adjacent to each other. Since gene flow between these two plants is
less likely, this cluster is most likely an artifact of using only 4 plants in the analysis from
a population that would be expected to be relatively similar.
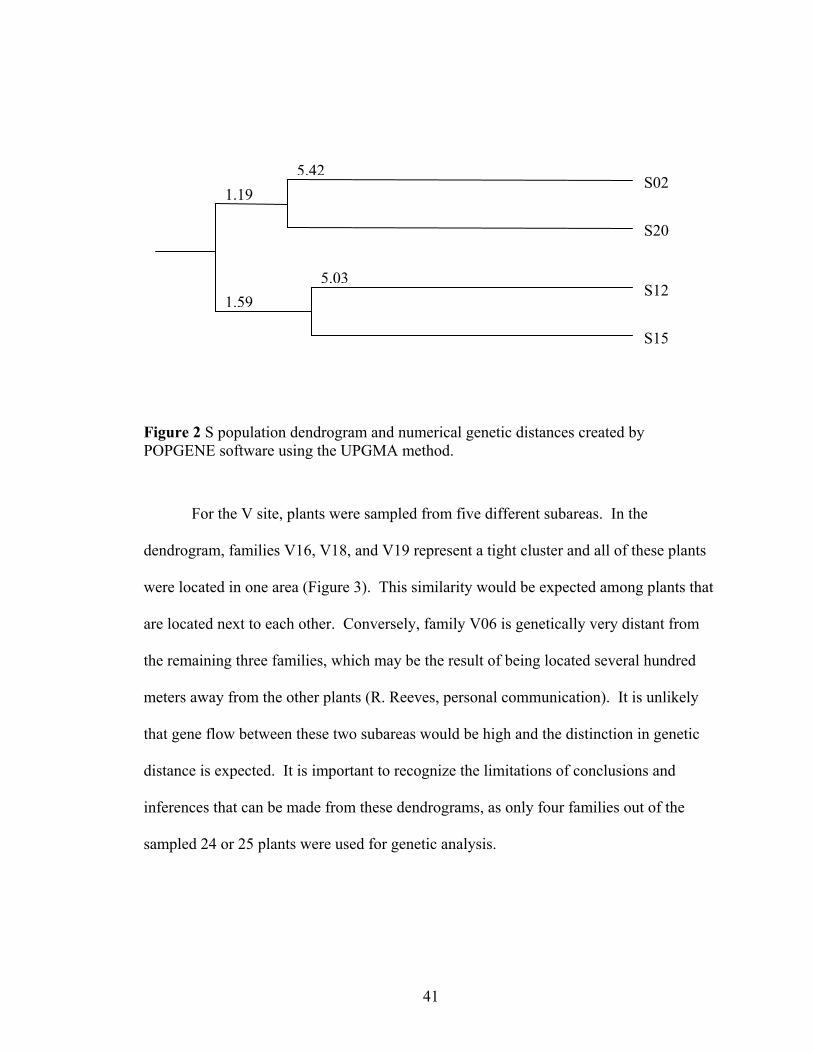
41
Figure 2 S population dendrogram and numerical genetic distances created by POPGENE software using the UPGMA method.
For the V site, plants were sampled from five different subareas. In the
dendrogram, families V16, V18, and V19 represent a tight cluster and all of these plants
were located in one area (Figure 3). This similarity would be expected among plants that
are located next to each other. Conversely, family V06 is genetically very distant from
the remaining three families, which may be the result of being located several hundred
meters away from the other plants (R. Reeves, personal communication). It is unlikely
that gene flow between these two subareas would be high and the distinction in genetic
distance is expected. It is important to recognize the limitations of conclusions and
inferences that can be made from these dendrograms, as only four families out of the
sampled 24 or 25 plants were used for genetic analysis.
S02
S20
S12
S15
5.42
5.03
1.19
1.59
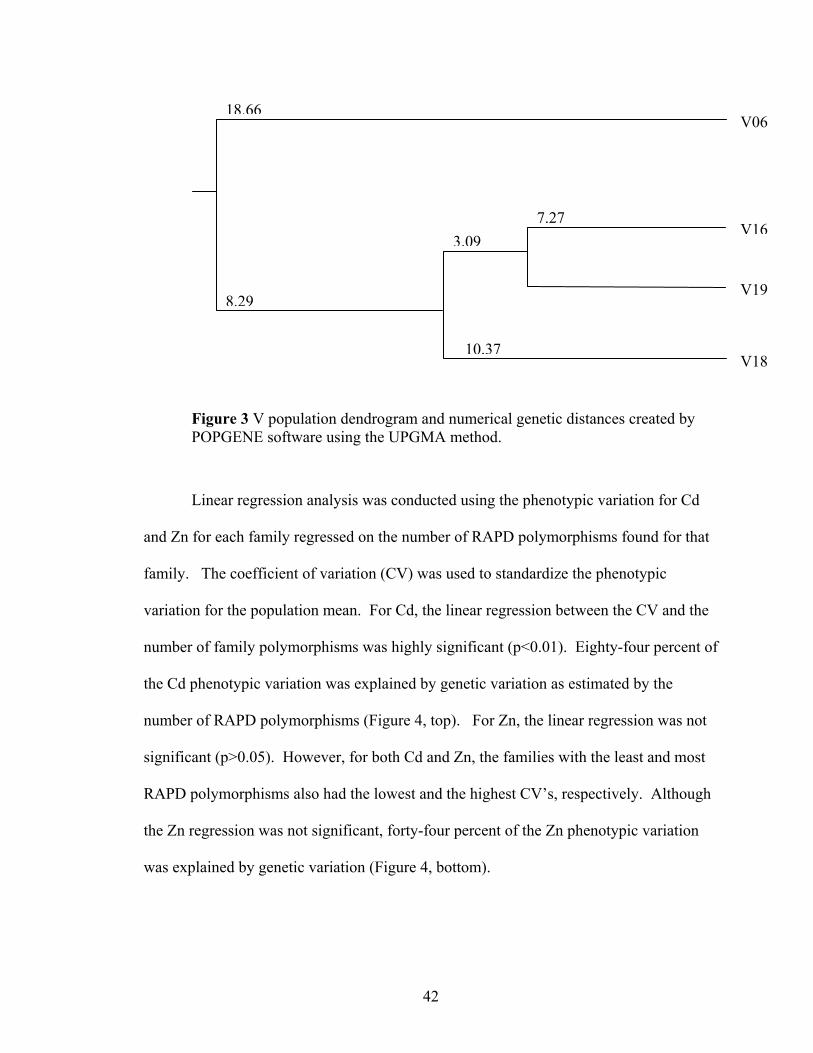
42
Figure 3 V population dendrogram and numerical genetic distances created by POPGENE software using the UPGMA method.
Linear regression analysis was conducted using the phenotypic variation for Cd
and Zn for each family regressed on the number of RAPD polymorphisms found for that
family. The coefficient of variation (CV) was used to standardize the phenotypic
variation for the population mean. For Cd, the linear regression between the CV and the
number of family polymorphisms was highly significant (p<0.01). Eighty-four percent of
the Cd phenotypic variation was explained by genetic variation as estimated by the
number of RAPD polymorphisms (Figure 4, top). For Zn, the linear regression was not
significant (p>0.05). However, for both Cd and Zn, the families with the least and most
RAPD polymorphisms also had the lowest and the highest CV’s, respectively. Although
the Zn regression was not significant, forty-four percent of the Zn phenotypic variation
was explained by genetic variation (Figure 4, bottom).
V06
V16
V19
V18
7.27 3.09
10.37
8.29
18.66
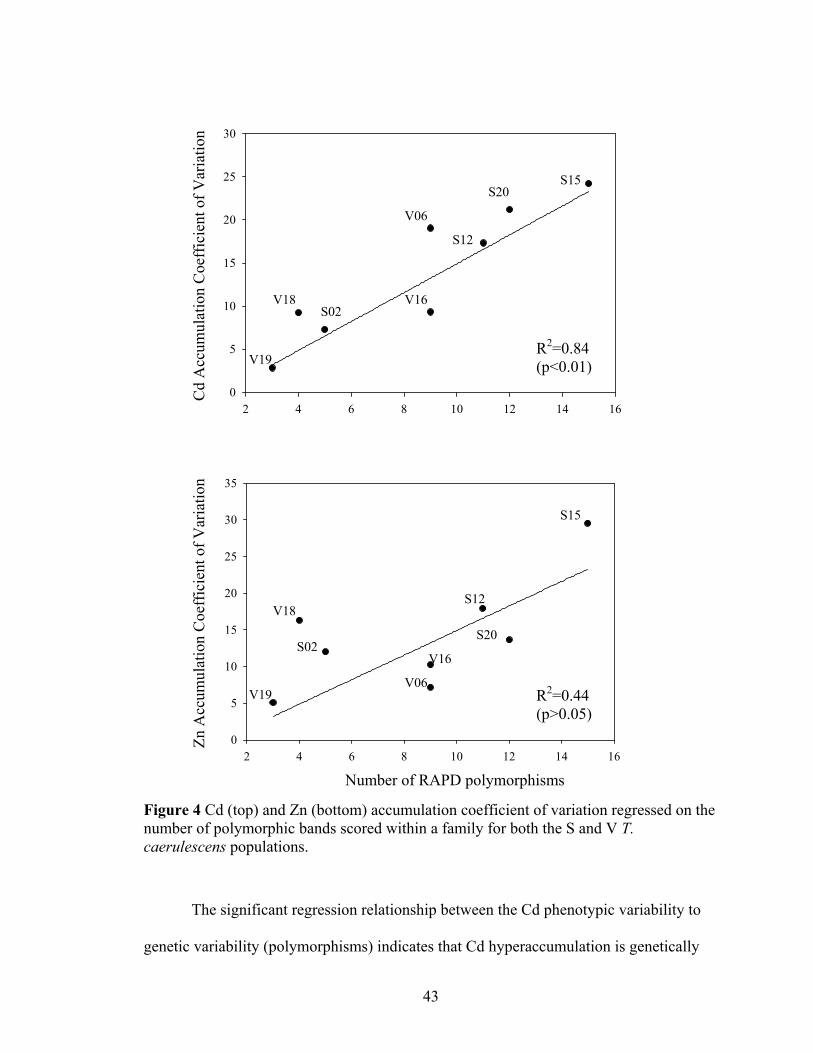
43
2 4 6 8 10 12 14 160
5
10
15
20
25
30
2 4 6 8 10 12 14 160
5
10
15
20
25
30
35
Figure 4 Cd (top) and Zn (bottom) accumulation coefficient of variation regressed on the number of polymorphic bands scored within a family for both the S and V T. caerulescens populations.
The significant regression relationship between the Cd phenotypic variability to
genetic variability (polymorphisms) indicates that Cd hyperaccumulation is genetically
Number of RAPD polymorphisms
Zn A
ccum
ulat
ion
Coe
ffic
ient
of V
aria
tion
R2=0.44 (p>0.05)
V19
S02
V18
V06
V16
S12
S20
S15
V19
V18 S02
V16
V06
S12
S20S15
Cd
Acc
umul
atio
n C
oeff
icie
nt o
f Var
iatio
n
R2=0.84 (p<0.01)
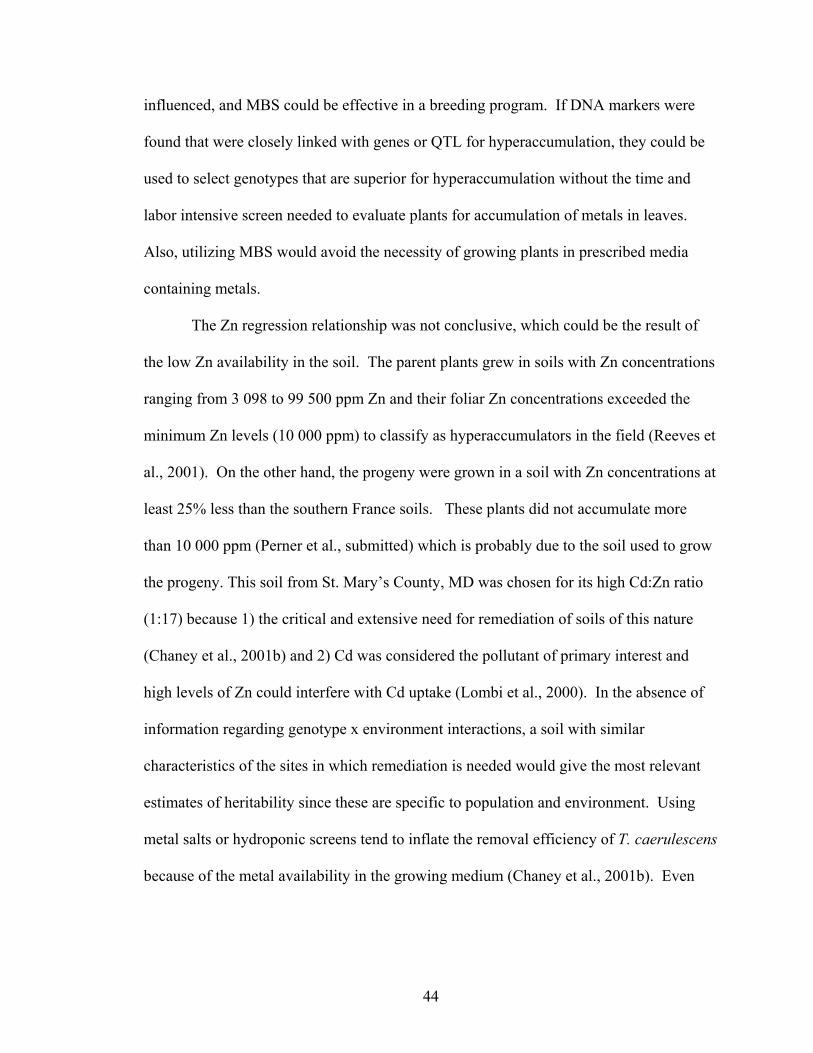
44
influenced, and MBS could be effective in a breeding program. If DNA markers were
found that were closely linked with genes or QTL for hyperaccumulation, they could be
used to select genotypes that are superior for hyperaccumulation without the time and
labor intensive screen needed to evaluate plants for accumulation of metals in leaves.
Also, utilizing MBS would avoid the necessity of growing plants in prescribed media
containing metals.
The Zn regression relationship was not conclusive, which could be the result of
the low Zn availability in the soil. The parent plants grew in soils with Zn concentrations
ranging from 3 098 to 99 500 ppm Zn and their foliar Zn concentrations exceeded the
minimum Zn levels (10 000 ppm) to classify as hyperaccumulators in the field (Reeves et
al., 2001). On the other hand, the progeny were grown in a soil with Zn concentrations at
least 25% less than the southern France soils. These plants did not accumulate more
than 10 000 ppm (Perner et al., submitted) which is probably due to the soil used to grow
the progeny. This soil from St. Mary’s County, MD was chosen for its high Cd:Zn ratio
(1:17) because 1) the critical and extensive need for remediation of soils of this nature
(Chaney et al., 2001b) and 2) Cd was considered the pollutant of primary interest and
high levels of Zn could interfere with Cd uptake (Lombi et al., 2000). In the absence of
information regarding genotype x environment interactions, a soil with similar
characteristics of the sites in which remediation is needed would give the most relevant
estimates of heritability since these are specific to population and environment. Using
metal salts or hydroponic screens tend to inflate the removal efficiency of T. caerulescens
because of the metal availability in the growing medium (Chaney et al., 2001b). Even
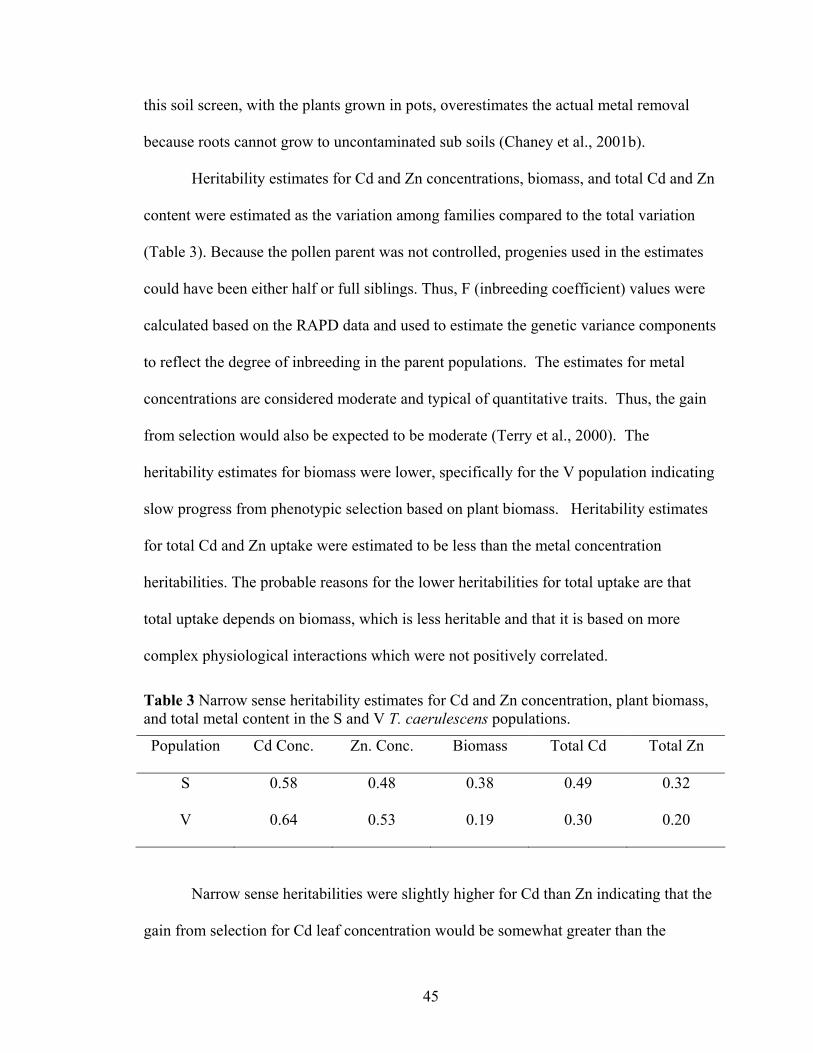
45
this soil screen, with the plants grown in pots, overestimates the actual metal removal
because roots cannot grow to uncontaminated sub soils (Chaney et al., 2001b).
Heritability estimates for Cd and Zn concentrations, biomass, and total Cd and Zn
content were estimated as the variation among families compared to the total variation
(Table 3). Because the pollen parent was not controlled, progenies used in the estimates
could have been either half or full siblings. Thus, F (inbreeding coefficient) values were
calculated based on the RAPD data and used to estimate the genetic variance components
to reflect the degree of inbreeding in the parent populations. The estimates for metal
concentrations are considered moderate and typical of quantitative traits. Thus, the gain
from selection would also be expected to be moderate (Terry et al., 2000). The
heritability estimates for biomass were lower, specifically for the V population indicating
slow progress from phenotypic selection based on plant biomass. Heritability estimates
for total Cd and Zn uptake were estimated to be less than the metal concentration
heritabilities. The probable reasons for the lower heritabilities for total uptake are that
total uptake depends on biomass, which is less heritable and that it is based on more
complex physiological interactions which were not positively correlated.
Table 3 Narrow sense heritability estimates for Cd and Zn concentration, plant biomass, and total metal content in the S and V T. caerulescens populations.
Population Cd Conc. Zn. Conc. Biomass Total Cd Total Zn
S 0.58 0.48 0.38 0.49 0.32
V 0.64 0.53 0.19 0.30 0.20
Narrow sense heritabilities were slightly higher for Cd than Zn indicating that the
gain from selection for Cd leaf concentration would be somewhat greater than the
46
response to selecting for Zn leaf concentration. One probable factor contributing to the
higher heritability for Cd was that the high Cd:Zn ratio of the soil was better able to
determine differences between genotypes for Cd accumulation than Zn. Broad sense
heritability estimates for Zn accumulation in populations from the United Kingdom were
variable and ranged from 0.11 to 0.82 (Pollard et al., 2002). The narrow sense
heritability estimates were near the middle of this range. Unfortunately, the heritability
estimates for biomass were only 0.38 and 0.19 for the S and V populations, respectively
and one of the greatest limitations of using T. caerulescens in phytoremediation is low
biomass. These estimates indicate that selecting for superior metal accumulation would
be more efficient at removing more total metal than trying to increase only biomass
within these populations. Roosens et al. (2003) recently noted that higher Cd tolerance
(reflected in biomass production) is more important than Cd metal concentration for
developing breeding lines. This is because tolerance was correlated with total Cd
content, and tolerance is a prerequisite for using hyperaccumulators in a contaminated
site (Roosens et al., 2003). However, in the S and V southern France populations,
phenotypic tolerance and high accumulation were strongly correlated; suggesting that
selecting for accumulation in populations from the Ganges region would be successful.
Ideally, both concentration and biomass would be maximized in a breeding program.
However, selection gain estimates can indicate which trait would be the most efficient to
target.
Genetic (rA) and phenotypic (rP) correlations are shown in Table 4. The genetic
correlations were determined from estimated and weighted variances and covariances,
making tests of significance extremely difficult. On the other hand, tests of significance
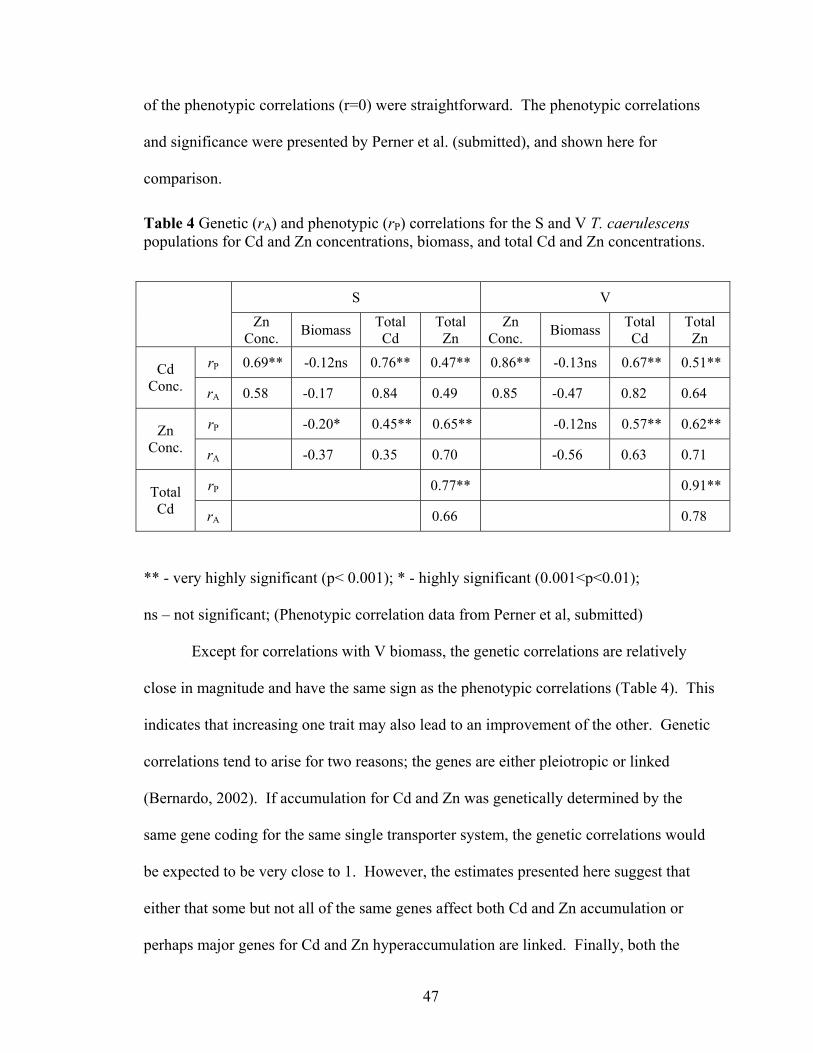
47
of the phenotypic correlations (r=0) were straightforward. The phenotypic correlations
and significance were presented by Perner et al. (submitted), and shown here for
comparison.
Table 4 Genetic (rA) and phenotypic (rP) correlations for the S and V T. caerulescens populations for Cd and Zn concentrations, biomass, and total Cd and Zn concentrations.
S V
Zn
Conc. Biomass Total Cd
Total Zn
Zn Conc. Biomass Total
Cd Total Zn
rP 0.69** -0.12ns 0.76** 0.47** 0.86** -0.13ns 0.67** 0.51** Cd Conc. rA 0.58 -0.17 0.84 0.49 0.85 -0.47 0.82 0.64
rP -0.20* 0.45** 0.65** -0.12ns 0.57** 0.62** Zn Conc. rA -0.37 0.35 0.70 -0.56 0.63 0.71
rP 0.77** 0.91** Total Cd rA 0.66 0.78
** - very highly significant (p< 0.001); * - highly significant (0.001<p<0.01);
ns – not significant; (Phenotypic correlation data from Perner et al, submitted)
Except for correlations with V biomass, the genetic correlations are relatively
close in magnitude and have the same sign as the phenotypic correlations (Table 4). This
indicates that increasing one trait may also lead to an improvement of the other. Genetic
correlations tend to arise for two reasons; the genes are either pleiotropic or linked
(Bernardo, 2002). If accumulation for Cd and Zn was genetically determined by the
same gene coding for the same single transporter system, the genetic correlations would
be expected to be very close to 1. However, the estimates presented here suggest that
either that some but not all of the same genes affect both Cd and Zn accumulation or
perhaps major genes for Cd and Zn hyperaccumulation are linked. Finally, both the
48
phenotypic and genetic correlations have the greatest magnitude for total Cd and total Zn,
which suggests that selecting for Cd could indirectly increase total Zn accumulation.
Progress from selection can be determined for specific types of recurrent selection
given certain selection intensities (Falconer and Mackay, 1996). Selection intensity is the
proportion of individuals chosen for the subsequent generation on the basis of phenotypic
performance (Falconer and Mackay, 1996). A standardized constant value is used to
determine progress in a population for a given percent selected (Fehr, 1987). Estimates
for percent gain for Cd concentration, biomass, and total Cd content using individual,
family, sibling, within family and combined selection for 20% and 10% selection
intensities are shown in Table 5. These values indicate the percent increase in the next
generation’s population mean for the trait of interest.
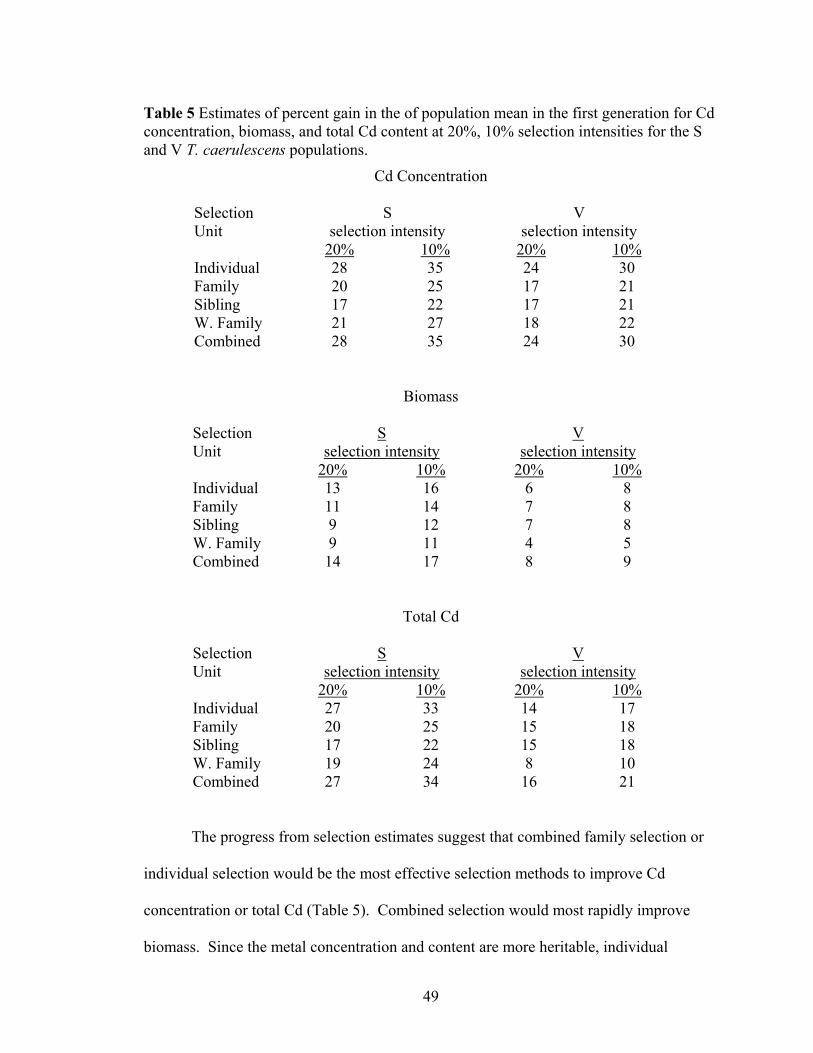
49
Table 5 Estimates of percent gain in the of population mean in the first generation for Cd concentration, biomass, and total Cd content at 20%, 10% selection intensities for the S and V T. caerulescens populations.
Cd Concentration
S V selection intensity selection intensity
Selection Unit
20% 10% 20% 10% Individual 28 35 24 30 Family 20 25 17 21 Sibling 17 22 17 21 W. Family 21 27 18 22 Combined 28 35 24 30
Biomass
S V selection intensity selection intensity
Selection Unit 20% 10% 20% 10% Individual 13 16 6 8 Family 11 14 7 8 Sibling 9 12 7 8 W. Family 9 11 4 5 Combined 14 17 8 9
Total Cd
S V selection intensity selection intensity
Selection Unit
20% 10% 20% 10% Individual 27 33 14 17 Family 20 25 15 18 Sibling 17 22 15 18 W. Family 19 24 8 10 Combined 27 34 16 21
The progress from selection estimates suggest that combined family selection or
individual selection would be the most effective selection methods to improve Cd
concentration or total Cd (Table 5). Combined selection would most rapidly improve
biomass. Since the metal concentration and content are more heritable, individual
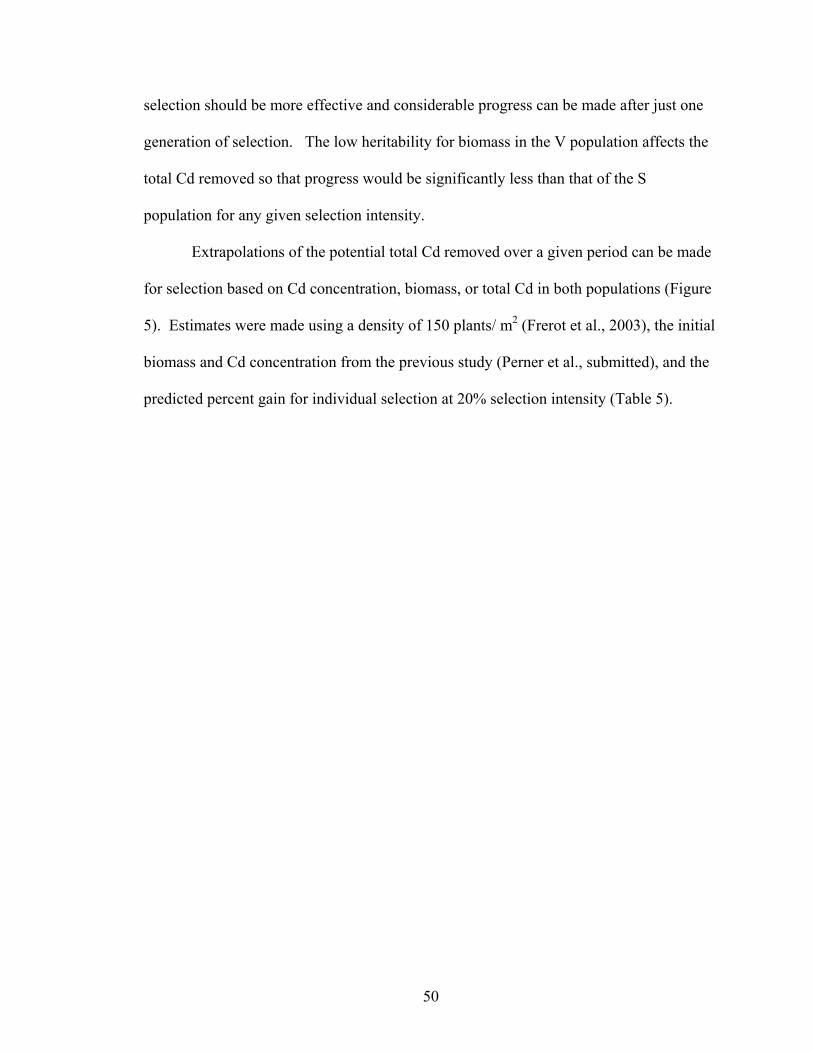
50
selection should be more effective and considerable progress can be made after just one
generation of selection. The low heritability for biomass in the V population affects the
total Cd removed so that progress would be significantly less than that of the S
population for any given selection intensity.
Extrapolations of the potential total Cd removed over a given period can be made
for selection based on Cd concentration, biomass, or total Cd in both populations (Figure
5). Estimates were made using a density of 150 plants/ m2 (Frerot et al., 2003), the initial
biomass and Cd concentration from the previous study (Perner et al., submitted), and the
predicted percent gain for individual selection at 20% selection intensity (Table 5).
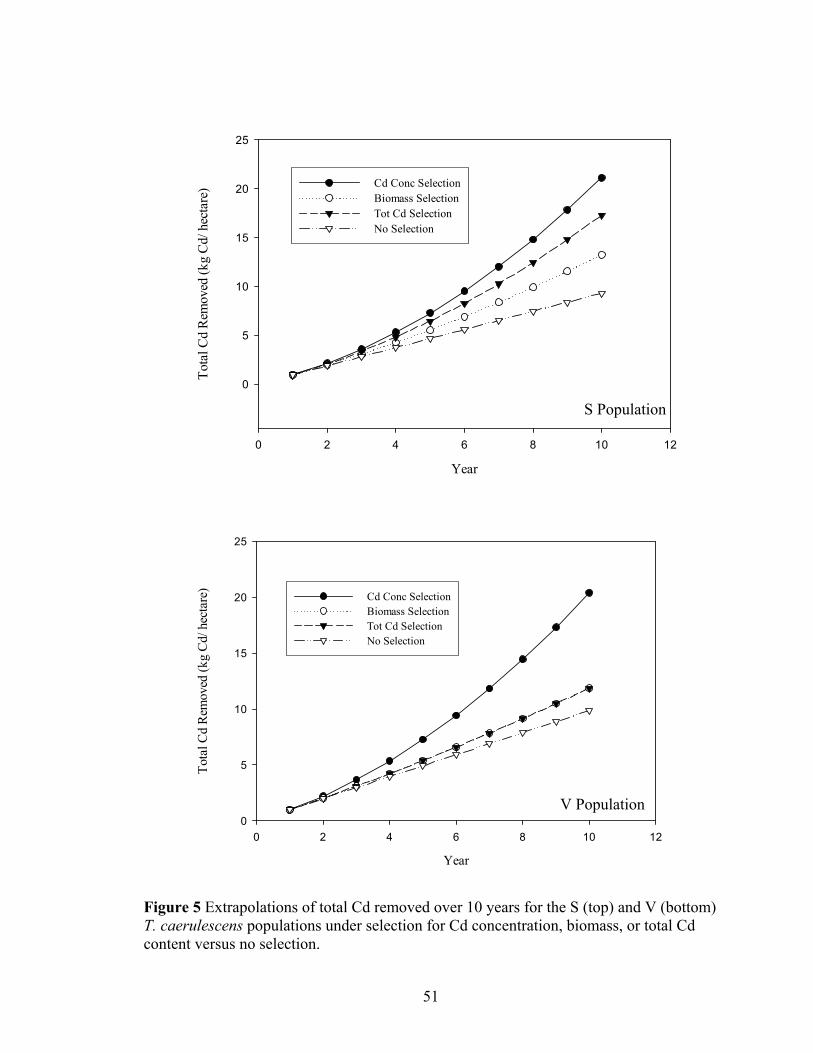
51
Year
0 2 4 6 8 10 12
Tota
l Cd
Rem
oved
(kg
Cd/ h
ecta
re)
0
5
10
15
20
25
Cd Conc SelectionBiomass SelectionTot Cd SelectionNo Selection
Year
0 2 4 6 8 10 12
Tota
l Cd
Rem
oved
(kg
Cd/
hec
tare
)
0
5
10
15
20
25
Cd Conc SelectionBiomass SelectionTot Cd SelectionNo Selection
Figure 5 Extrapolations of total Cd removed over 10 years for the S (top) and V (bottom) T. caerulescens populations under selection for Cd concentration, biomass, or total Cd content versus no selection.
S Population
V Population
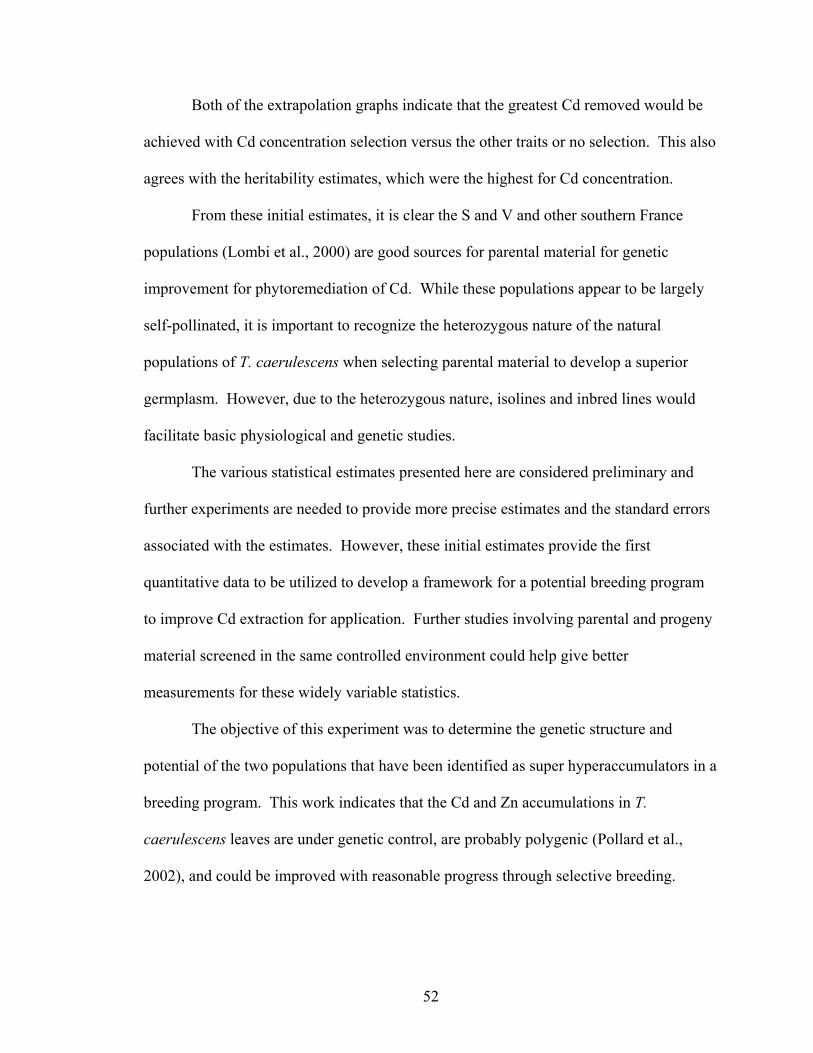
52
Both of the extrapolation graphs indicate that the greatest Cd removed would be
achieved with Cd concentration selection versus the other traits or no selection. This also
agrees with the heritability estimates, which were the highest for Cd concentration.
From these initial estimates, it is clear the S and V and other southern France
populations (Lombi et al., 2000) are good sources for parental material for genetic
improvement for phytoremediation of Cd. While these populations appear to be largely
self-pollinated, it is important to recognize the heterozygous nature of the natural
populations of T. caerulescens when selecting parental material to develop a superior
germplasm. However, due to the heterozygous nature, isolines and inbred lines would
facilitate basic physiological and genetic studies.
The various statistical estimates presented here are considered preliminary and
further experiments are needed to provide more precise estimates and the standard errors
associated with the estimates. However, these initial estimates provide the first
quantitative data to be utilized to develop a framework for a potential breeding program
to improve Cd extraction for application. Further studies involving parental and progeny
material screened in the same controlled environment could help give better
measurements for these widely variable statistics.
The objective of this experiment was to determine the genetic structure and
potential of the two populations that have been identified as super hyperaccumulators in a
breeding program. This work indicates that the Cd and Zn accumulations in T.
caerulescens leaves are under genetic control, are probably polygenic (Pollard et al.,
2002), and could be improved with reasonable progress through selective breeding.
53
3.0 Bulk Segregant Analysis to Determine Cd and Zn Linked RAPD Markers
3.1 Introduction
Depending on the trait, marker based selection (MBS) can be more efficient than
phenotypic selection for improving desirable traits in a breeding program. In the first
experiment, it was established that there is genetic variability for Cd and Zn accumulation
within the S and V populations, that Cd accumulation is moderately heritable, and that
the number of RAPD polymorphisms within a family was related to the phenotypic
variation for Cd accumulation. The goal of this second experiment was to determine
potential RAPD markers for the traits of both Cd and Zn hyperaccumulation that could be
used for MBS.
Michelmore et al. (1991) proposed bulk segregant analysis (BSA) as a rapid way
to identify markers linked to a trait of interest. Not only has BSA been used for high
resolution mapping to find simply inherited traits, but it can also be used to detect
markers linked to QTL (Liu, 1998). By combining the DNA from many individuals with
a similar phenotype for a specific trait, these collective samples are screened for DNA
polymorphisms. In this experiment, individuals with similarly high or low metal
accumulation levels (determined by Perner et al., submitted) were combined into Cd or
Zn bulks. The two bulks contained DNA from plants selected to maximize the
phenotypic differences between the bulks. Polymorphisms between the high and low
bulks for a specific metal within a population were scored as a potential marker. With
BSA, there can be three scenarios of possible polymorphisms: a true marker, a false
negative, or a false positive (Liu, 1998). A false negative is when a linked marker is not
polymorphic between the bulks and cannot be discerned from unlinked genomic bands
54
that are identical between bulks. A false positive occurs when there is a polymorphism
between bulks that is unlinked to the target gene. False positives can occur if the
polymorphic band is not reproducible or not determined to be associated with the trait of
interest. The probability of false positives and false negatives depend on the type of
population used, the bulk size and sensitivity of allele detection (Liu, 1998). Because of
the likelihood of false positives, it is necessary for the identified polymorphic markers to
be further tested to validate their potential linkage to Cd or Zn hyperaccumulation.
3.2 Materials and Methods
3.2.1 Bulk Preparation
For each of the two populations (S and V), four DNA bulks (samples comprised
of multiple individuals) were used: high Cd, low Cd, high Zn, and low Zn, for a total of
eight bulks. The individuals for each bulk were half sib progenies selected for further
study and were screened for phenotype as described in Section 2.2. The selected
individuals represent the most extreme metal concentration in the leaf tissue within that
population. The number of individuals per bulk ranged from 7 to 12. Phenotypic
accumulation, bulk average, and standard error for the bulks of the S and V populations
are presented in Tables 6-9. The bulk means within a population were significantly
different from each other for each metal according to t-tests (p<0.0001).
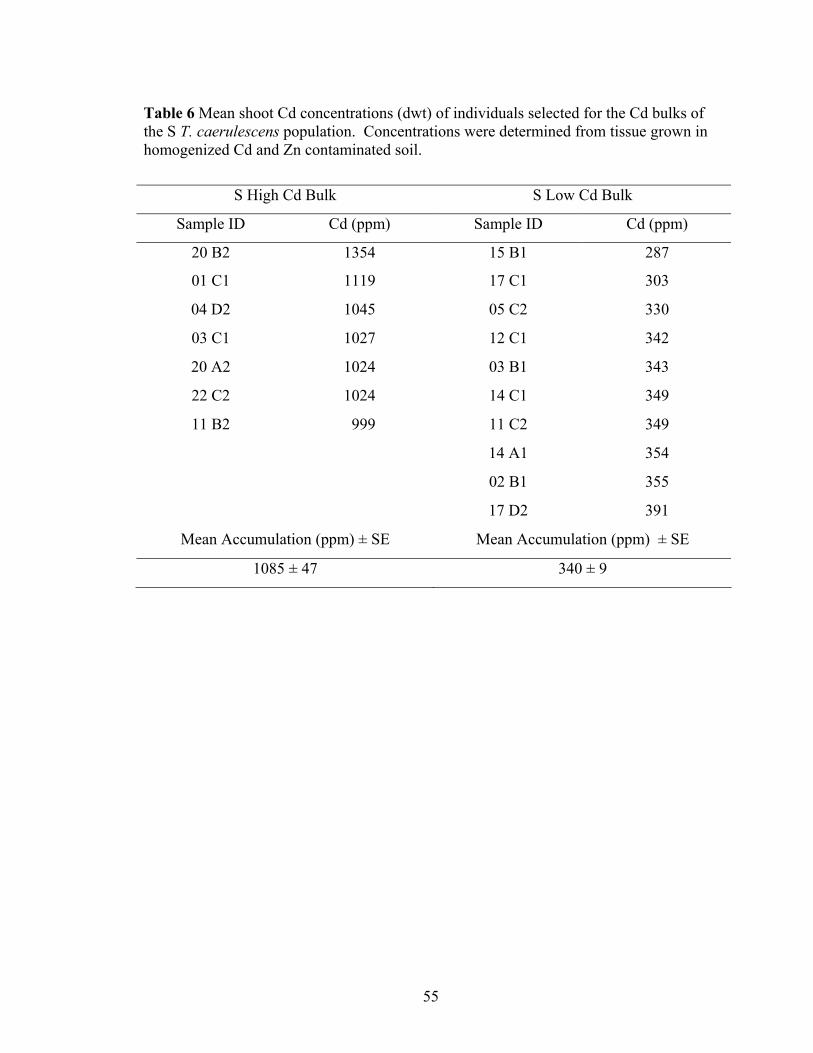
55
Table 6 Mean shoot Cd concentrations (dwt) of individuals selected for the Cd bulks of the S T. caerulescens population. Concentrations were determined from tissue grown in homogenized Cd and Zn contaminated soil.
S High Cd Bulk S Low Cd Bulk
Sample ID Cd (ppm) Sample ID Cd (ppm)
20 B2 1354 15 B1 287
01 C1 1119 17 C1 303
04 D2 1045 05 C2 330
03 C1 1027 12 C1 342
20 A2 1024 03 B1 343
22 C2 1024 14 C1 349
11 B2 999 11 C2 349
14 A1 354
02 B1 355
17 D2 391
Mean Accumulation (ppm) ± SE Mean Accumulation (ppm) ± SE
1085 ± 47 340 ± 9
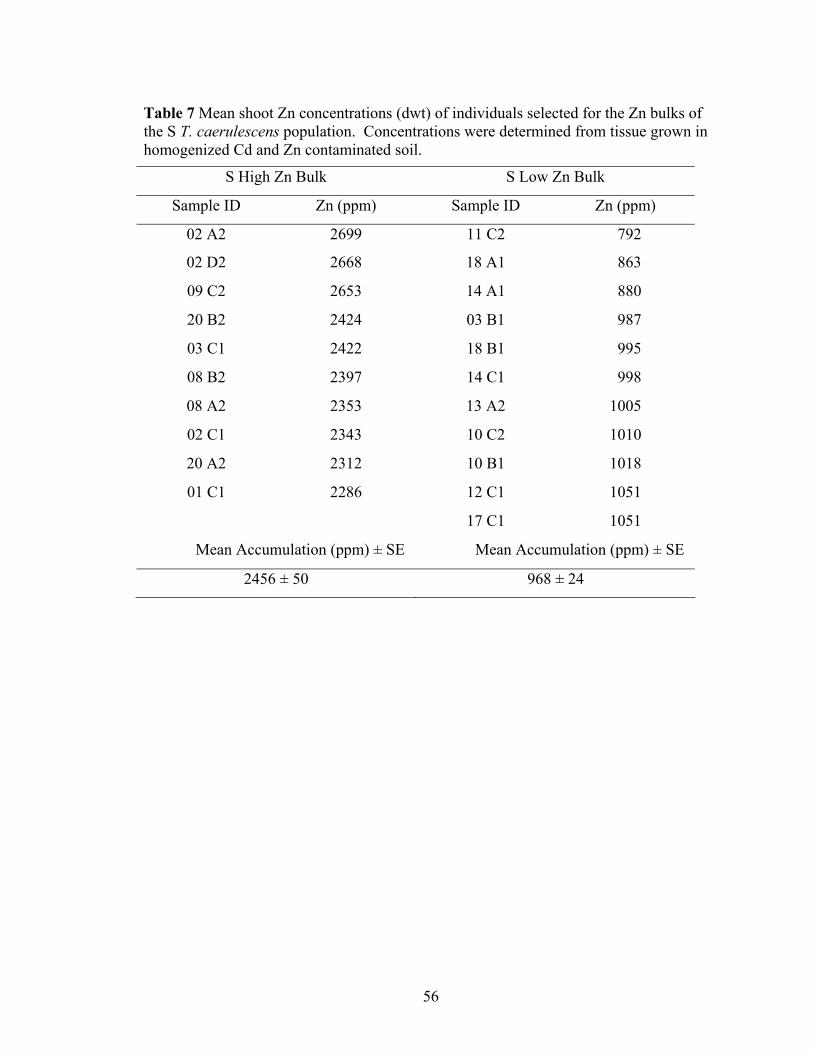
56
Table 7 Mean shoot Zn concentrations (dwt) of individuals selected for the Zn bulks of the S T. caerulescens population. Concentrations were determined from tissue grown in homogenized Cd and Zn contaminated soil.
S High Zn Bulk S Low Zn Bulk
Sample ID Zn (ppm) Sample ID Zn (ppm)
02 A2 2699 11 C2 792
02 D2 2668 18 A1 863
09 C2 2653 14 A1 880
20 B2 2424 03 B1 987
03 C1 2422 18 B1 995
08 B2 2397 14 C1 998
08 A2 2353 13 A2 1005
02 C1 2343 10 C2 1010
20 A2 2312 10 B1 1018
01 C1 2286 12 C1 1051
17 C1 1051
Mean Accumulation (ppm) ± SE Mean Accumulation (ppm) ± SE
2456 ± 50 968 ± 24
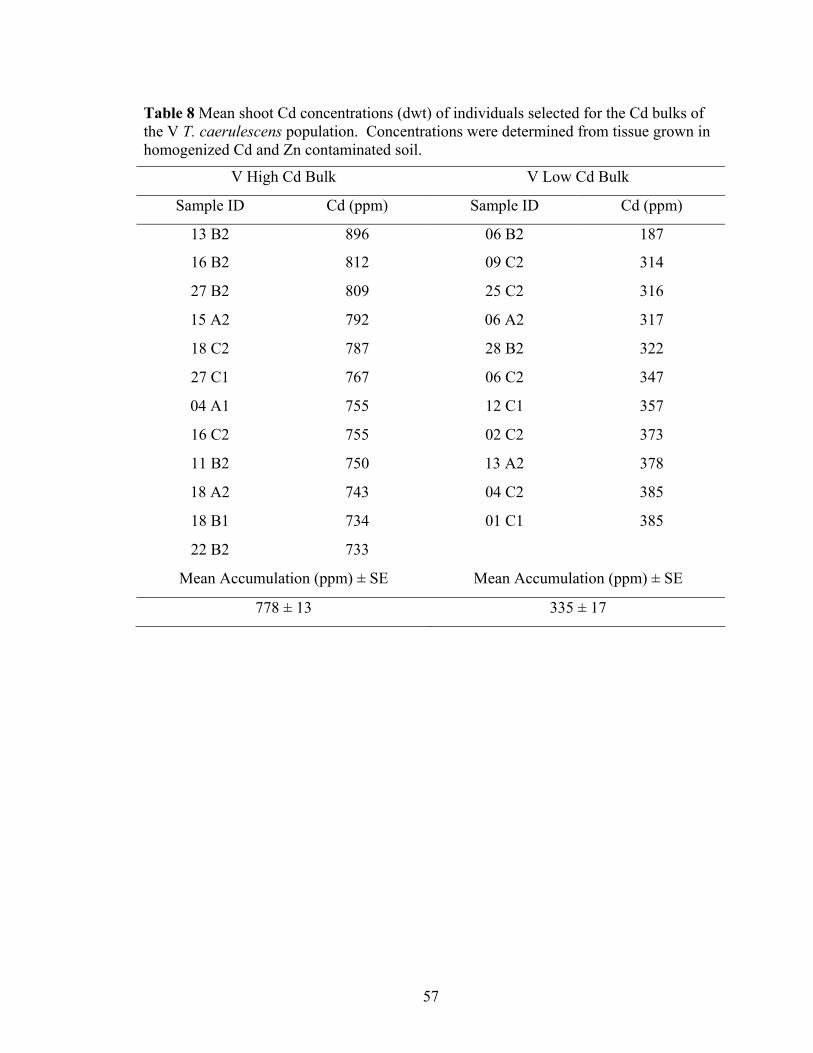
57
Table 8 Mean shoot Cd concentrations (dwt) of individuals selected for the Cd bulks of the V T. caerulescens population. Concentrations were determined from tissue grown in homogenized Cd and Zn contaminated soil.
V High Cd Bulk V Low Cd Bulk
Sample ID Cd (ppm) Sample ID Cd (ppm)
13 B2 896 06 B2 187
16 B2 812 09 C2 314
27 B2 809 25 C2 316
15 A2 792 06 A2 317
18 C2 787 28 B2 322
27 C1 767 06 C2 347
04 A1 755 12 C1 357
16 C2 755 02 C2 373
11 B2 750 13 A2 378
18 A2 743 04 C2 385
18 B1 734 01 C1 385
22 B2 733
Mean Accumulation (ppm) ± SE Mean Accumulation (ppm) ± SE
778 ± 13 335 ± 17
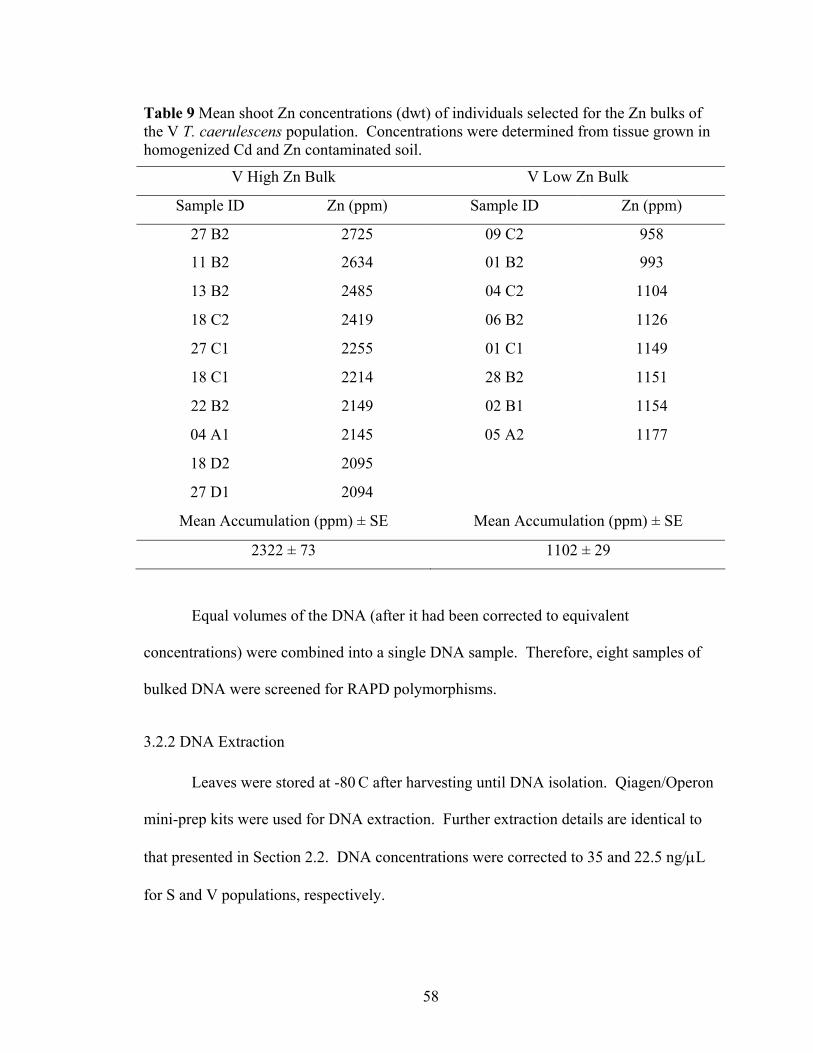
58
Table 9 Mean shoot Zn concentrations (dwt) of individuals selected for the Zn bulks of the V T. caerulescens population. Concentrations were determined from tissue grown in homogenized Cd and Zn contaminated soil.
V High Zn Bulk V Low Zn Bulk
Sample ID Zn (ppm) Sample ID Zn (ppm)
27 B2 2725 09 C2 958
11 B2 2634 01 B2 993
13 B2 2485 04 C2 1104
18 C2 2419 06 B2 1126
27 C1 2255 01 C1 1149
18 C1 2214 28 B2 1151
22 B2 2149 02 B1 1154
04 A1 2145 05 A2 1177
18 D2 2095
27 D1 2094
Mean Accumulation (ppm) ± SE Mean Accumulation (ppm) ± SE
2322 ± 73 1102 ± 29
Equal volumes of the DNA (after it had been corrected to equivalent
concentrations) were combined into a single DNA sample. Therefore, eight samples of
bulked DNA were screened for RAPD polymorphisms.
3.2.2 DNA Extraction
Leaves were stored at -80 C after harvesting until DNA isolation. Qiagen/Operon
mini-prep kits were used for DNA extraction. Further extraction details are identical to
that presented in Section 2.2. DNA concentrations were corrected to 35 and 22.5 ng/µL
for S and V populations, respectively.
59
3.2.3 RAPD Analysis
RAPD reactions were run using 0.4 µL 100mM MgSO4, 0.2 µL 40 mM dNTP
(NEB), 0.4 µL 40 µM 10-mer (Qiagen/Operon), 0.1 unit Taq polymerase (NEB), 1 µL
10X Taq polymerase buffer (10 mM KCl, 10 mM (NH4)2SO4, 20 mM Tris-HCl, 0.1%
Triton X-100) (NEB), and 28 ng genomic DNA. Distilled water was added to reach a
reaction volume of 10 µL. DNA was amplified in an Eppendorf Mastercycler
thermocycler, using an initial denaturation step of 1min at 94 C, followed by 35 cycles of
three steps: denaturation at 94 C for 30 sec, annealing at 38 C for 1 min, and elongation at
72 C for 1 min 30 sec. Once 35 cycles were completed, the samples were held for 10 min
at 72 C for a final extension. The amplified DNA fragments were visualized on a 1.5%
agarose gel stained with ethidium bromide. Gels were run at 100 V for 2 hours.
Limited DNA volume constrained the number of primers that could be screened
for potential markers. All bulks were screened with 181 10-mer primers (from Qiagen-
Operon Kits A, E, F, G, J, N, U, X, Z, and H-04). Greater DNA volume for the S Zn and
V Cd bulks allowed an additional 58 primers to be screened (H-05, D-02, D-03, D-05, D-
07, D-11, D-13, O-15) and University of British Columbia (UBC) primers #201-250.
3.3 Results and Discussion
3.3.1 Polymorphic Primer Summary
Fifty-six primers produced 102 polymorphic loci between a high and low bulk in
BSA that were labeled as potential markers. Forty of these potential markers were
present in the high Cd or Zn bulks and the remaining 62 loci were present in the low
60
bulks. Seventeen loci were potential markers for both Cd and Zn bulks. The potential
markers were divided into two groups: those present in the high or present in the low
bulks, and are presented in Tables 10 and 11, respectively. The markers have been listed
by their Qiagen/Operon description (kit letter and primer number) or UBC number. In
some cases, a primer generated multiple markers which were further distinguished for
specific identification. All markers were given a unique identification code based on the
population in which the polymorphism was found (S, V, or B for both populations), the
phenotypic bulk in which the marker was detected (H for high bulks or L for low bulks),
the specific metal the marker was linked to (Cd, Zn, or B for both metals), the primer that
caused the polymorphism(s), and additional sequential numbering for multiple markers
per primer. For example, marker VHC_E11_2 was a marker in the V population, in the
high Cd bulk, caused by Qiagen/Operon primer E-11 and was the second marker detected
with that specific primer. This coding is shown in the second column labeled ‘Marker
ID’ in the following tables.
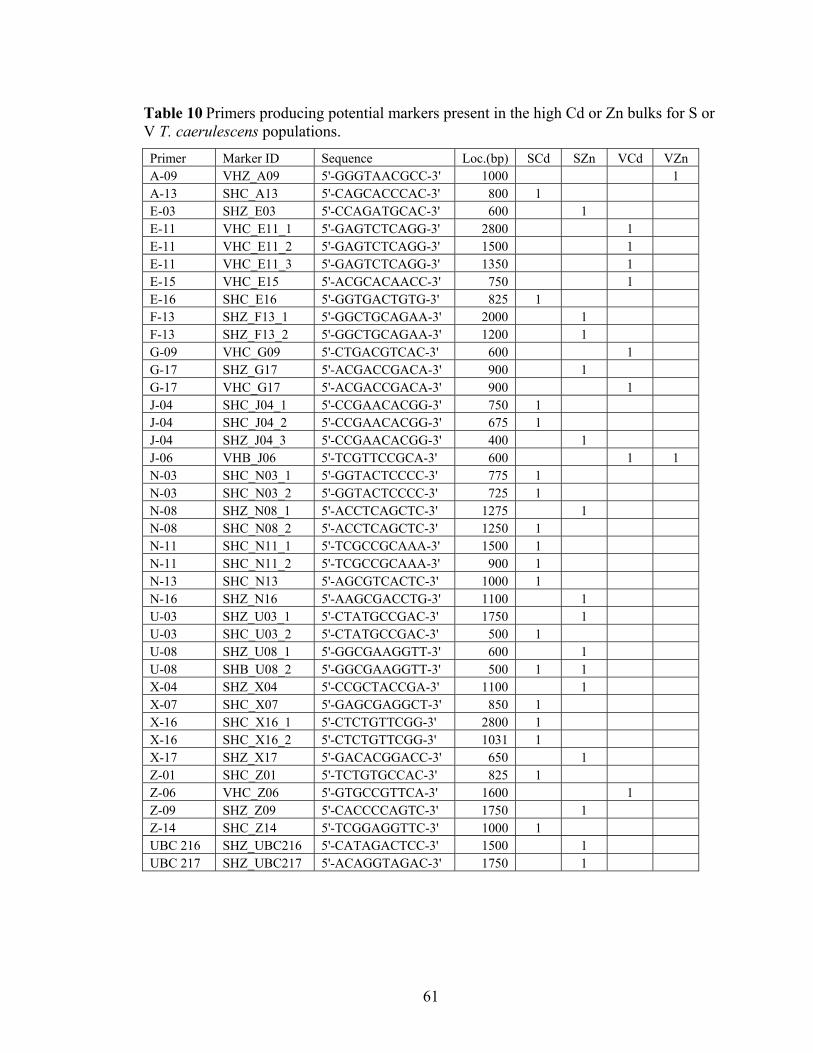
61
Table 10 Primers producing potential markers present in the high Cd or Zn bulks for S or V T. caerulescens populations.
Primer Marker ID Sequence Loc.(bp) SCd SZn VCd VZn A-09 VHZ_A09 5'-GGGTAACGCC-3' 1000 1 A-13 SHC_A13 5'-CAGCACCCAC-3' 800 1 E-03 SHZ_E03 5'-CCAGATGCAC-3' 600 1 E-11 VHC_E11_1 5'-GAGTCTCAGG-3' 2800 1 E-11 VHC_E11_2 5'-GAGTCTCAGG-3' 1500 1 E-11 VHC_E11_3 5'-GAGTCTCAGG-3' 1350 1 E-15 VHC_E15 5'-ACGCACAACC-3' 750 1 E-16 SHC_E16 5'-GGTGACTGTG-3' 825 1 F-13 SHZ_F13_1 5'-GGCTGCAGAA-3' 2000 1 F-13 SHZ_F13_2 5'-GGCTGCAGAA-3' 1200 1 G-09 VHC_G09 5'-CTGACGTCAC-3' 600 1 G-17 SHZ_G17 5'-ACGACCGACA-3' 900 1 G-17 VHC_G17 5'-ACGACCGACA-3' 900 1 J-04 SHC_J04_1 5'-CCGAACACGG-3' 750 1 J-04 SHC_J04_2 5'-CCGAACACGG-3' 675 1 J-04 SHZ_J04_3 5'-CCGAACACGG-3' 400 1 J-06 VHB_J06 5'-TCGTTCCGCA-3' 600 1 1 N-03 SHC_N03_1 5'-GGTACTCCCC-3' 775 1 N-03 SHC_N03_2 5'-GGTACTCCCC-3' 725 1 N-08 SHZ_N08_1 5'-ACCTCAGCTC-3' 1275 1 N-08 SHC_N08_2 5'-ACCTCAGCTC-3' 1250 1 N-11 SHC_N11_1 5'-TCGCCGCAAA-3' 1500 1 N-11 SHC_N11_2 5'-TCGCCGCAAA-3' 900 1 N-13 SHC_N13 5'-AGCGTCACTC-3' 1000 1 N-16 SHZ_N16 5'-AAGCGACCTG-3' 1100 1 U-03 SHZ_U03_1 5'-CTATGCCGAC-3' 1750 1 U-03 SHC_U03_2 5'-CTATGCCGAC-3' 500 1 U-08 SHZ_U08_1 5'-GGCGAAGGTT-3' 600 1 U-08 SHB_U08_2 5'-GGCGAAGGTT-3' 500 1 1 X-04 SHZ_X04 5'-CCGCTACCGA-3' 1100 1 X-07 SHC_X07 5'-GAGCGAGGCT-3' 850 1 X-16 SHC_X16_1 5'-CTCTGTTCGG-3' 2800 1 X-16 SHC_X16_2 5'-CTCTGTTCGG-3' 1031 1 X-17 SHZ_X17 5'-GACACGGACC-3' 650 1 Z-01 SHC_Z01 5'-TCTGTGCCAC-3' 825 1 Z-06 VHC_Z06 5'-GTGCCGTTCA-3' 1600 1 Z-09 SHZ_Z09 5'-CACCCCAGTC-3' 1750 1 Z-14 SHC_Z14 5'-TCGGAGGTTC-3' 1000 1 UBC 216 SHZ_UBC216 5'-CATAGACTCC-3' 1500 1 UBC 217 SHZ_UBC217 5'-ACAGGTAGAC-3' 1750 1
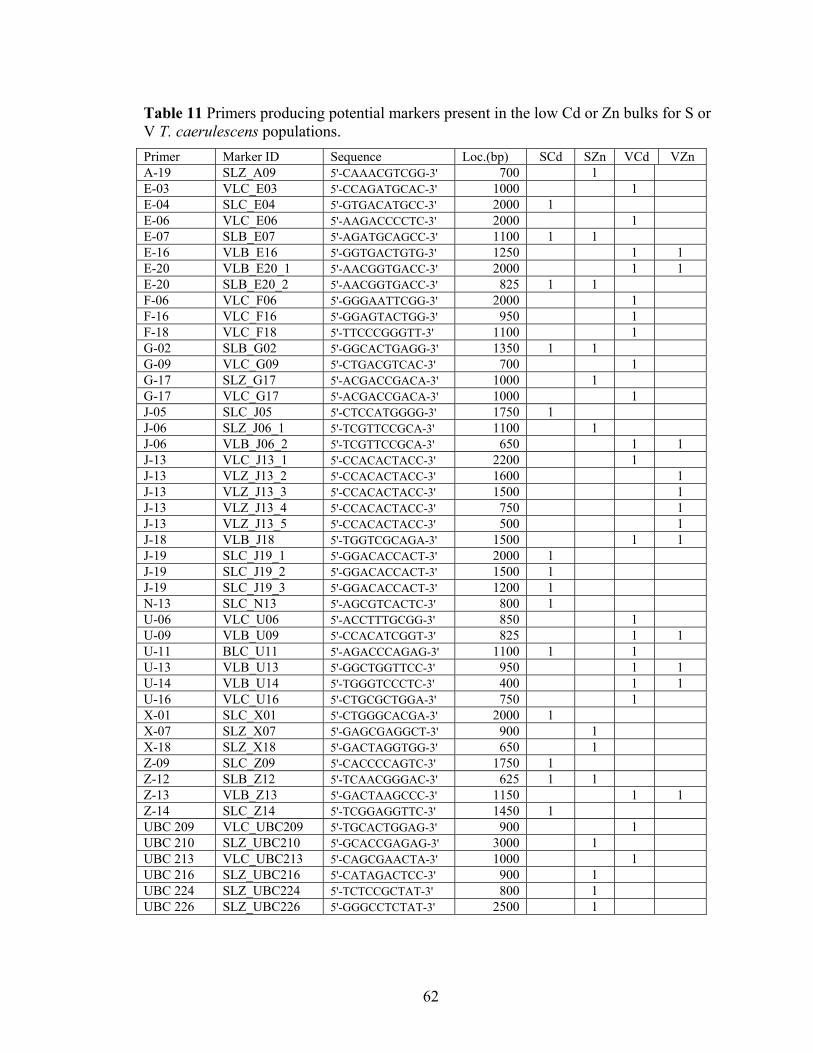
62
Table 11 Primers producing potential markers present in the low Cd or Zn bulks for S or V T. caerulescens populations. Primer Marker ID Sequence Loc.(bp) SCd SZn VCd VZn A-19 SLZ_A09 5'-CAAACGTCGG-3' 700 1 E-03 VLC_E03 5'-CCAGATGCAC-3' 1000 1 E-04 SLC_E04 5'-GTGACATGCC-3' 2000 1 E-06 VLC_E06 5'-AAGACCCCTC-3' 2000 1 E-07 SLB_E07 5'-AGATGCAGCC-3' 1100 1 1 E-16 VLB_E16 5'-GGTGACTGTG-3' 1250 1 1 E-20 VLB_E20_1 5'-AACGGTGACC-3' 2000 1 1 E-20 SLB_E20_2 5'-AACGGTGACC-3' 825 1 1 F-06 VLC_F06 5'-GGGAATTCGG-3' 2000 1 F-16 VLC_F16 5'-GGAGTACTGG-3' 950 1 F-18 VLC_F18 5'-TTCCCGGGTT-3' 1100 1 G-02 SLB_G02 5'-GGCACTGAGG-3' 1350 1 1 G-09 VLC_G09 5'-CTGACGTCAC-3' 700 1 G-17 SLZ_G17 5'-ACGACCGACA-3' 1000 1 G-17 VLC_G17 5'-ACGACCGACA-3' 1000 1 J-05 SLC_J05 5'-CTCCATGGGG-3' 1750 1 J-06 SLZ_J06_1 5'-TCGTTCCGCA-3' 1100 1 J-06 VLB_J06_2 5'-TCGTTCCGCA-3' 650 1 1 J-13 VLC_J13_1 5'-CCACACTACC-3' 2200 1 J-13 VLZ_J13_2 5'-CCACACTACC-3' 1600 1 J-13 VLZ_J13_3 5'-CCACACTACC-3' 1500 1 J-13 VLZ_J13_4 5'-CCACACTACC-3' 750 1 J-13 VLZ_J13_5 5'-CCACACTACC-3' 500 1 J-18 VLB_J18 5'-TGGTCGCAGA-3' 1500 1 1 J-19 SLC_J19_1 5'-GGACACCACT-3' 2000 1 J-19 SLC_J19_2 5'-GGACACCACT-3' 1500 1 J-19 SLC_J19_3 5'-GGACACCACT-3' 1200 1 N-13 SLC_N13 5'-AGCGTCACTC-3' 800 1 U-06 VLC_U06 5'-ACCTTTGCGG-3' 850 1 U-09 VLB_U09 5'-CCACATCGGT-3' 825 1 1 U-11 BLC_U11 5'-AGACCCAGAG-3' 1100 1 1 U-13 VLB_U13 5'-GGCTGGTTCC-3' 950 1 1 U-14 VLB_U14 5'-TGGGTCCCTC-3' 400 1 1 U-16 VLC_U16 5'-CTGCGCTGGA-3' 750 1 X-01 SLC_X01 5'-CTGGGCACGA-3' 2000 1 X-07 SLZ_X07 5'-GAGCGAGGCT-3' 900 1 X-18 SLZ_X18 5'-GACTAGGTGG-3' 650 1 Z-09 SLC_Z09 5'-CACCCCAGTC-3' 1750 1 Z-12 SLB_Z12 5'-TCAACGGGAC-3' 625 1 1 Z-13 VLB_Z13 5'-GACTAAGCCC-3' 1150 1 1 Z-14 SLC_Z14 5'-TCGGAGGTTC-3' 1450 1 UBC 209 VLC_UBC209 5'-TGCACTGGAG-3' 900 1 UBC 210 SLZ_UBC210 5'-GCACCGAGAG-3' 3000 1 UBC 213 VLC_UBC213 5'-CAGCGAACTA-3' 1000 1 UBC 216 SLZ_UBC216 5'-CATAGACTCC-3' 900 1 UBC 224 SLZ_UBC224 5'-TCTCCGCTAT-3' 800 1 UBC 226 SLZ_UBC226 5'-GGGCCTCTAT-3' 2500 1
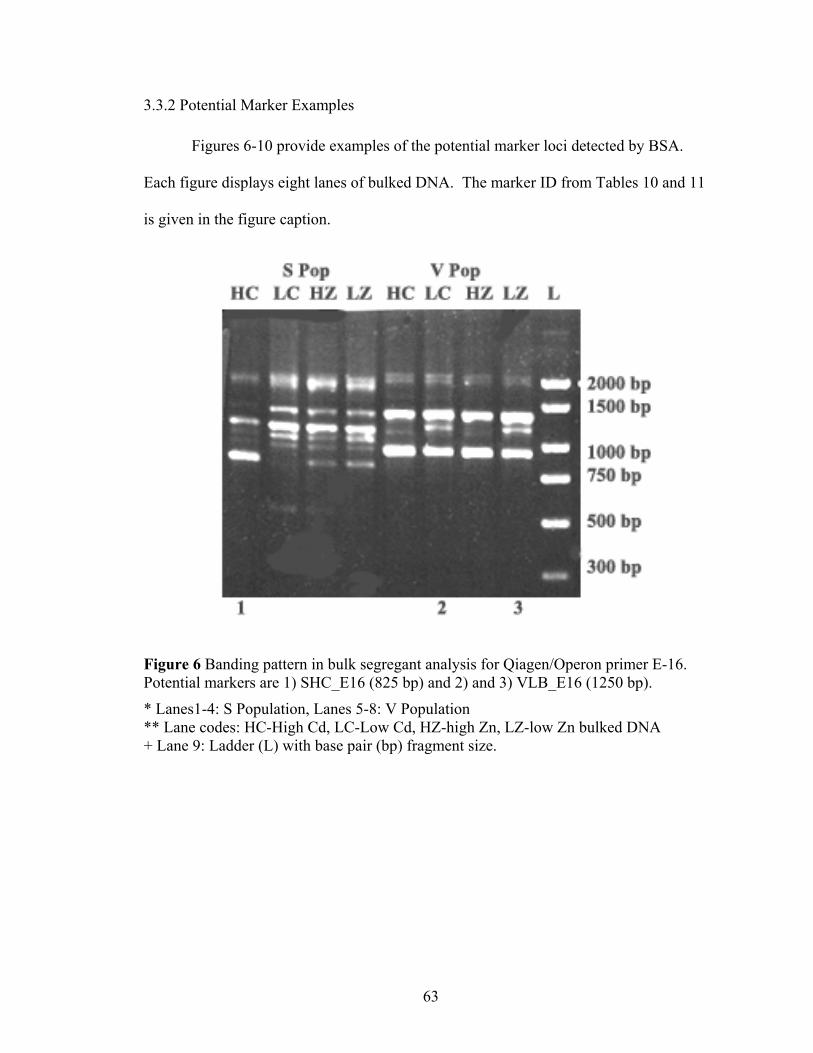
63
3.3.2 Potential Marker Examples
Figures 6-10 provide examples of the potential marker loci detected by BSA.
Each figure displays eight lanes of bulked DNA. The marker ID from Tables 10 and 11
is given in the figure caption.
Figure 6 Banding pattern in bulk segregant analysis for Qiagen/Operon primer E-16. Potential markers are 1) SHC_E16 (825 bp) and 2) and 3) VLB_E16 (1250 bp).
* Lanes1-4: S Population, Lanes 5-8: V Population ** Lane codes: HC-High Cd, LC-Low Cd, HZ-high Zn, LZ-low Zn bulked DNA + Lane 9: Ladder (L) with base pair (bp) fragment size.
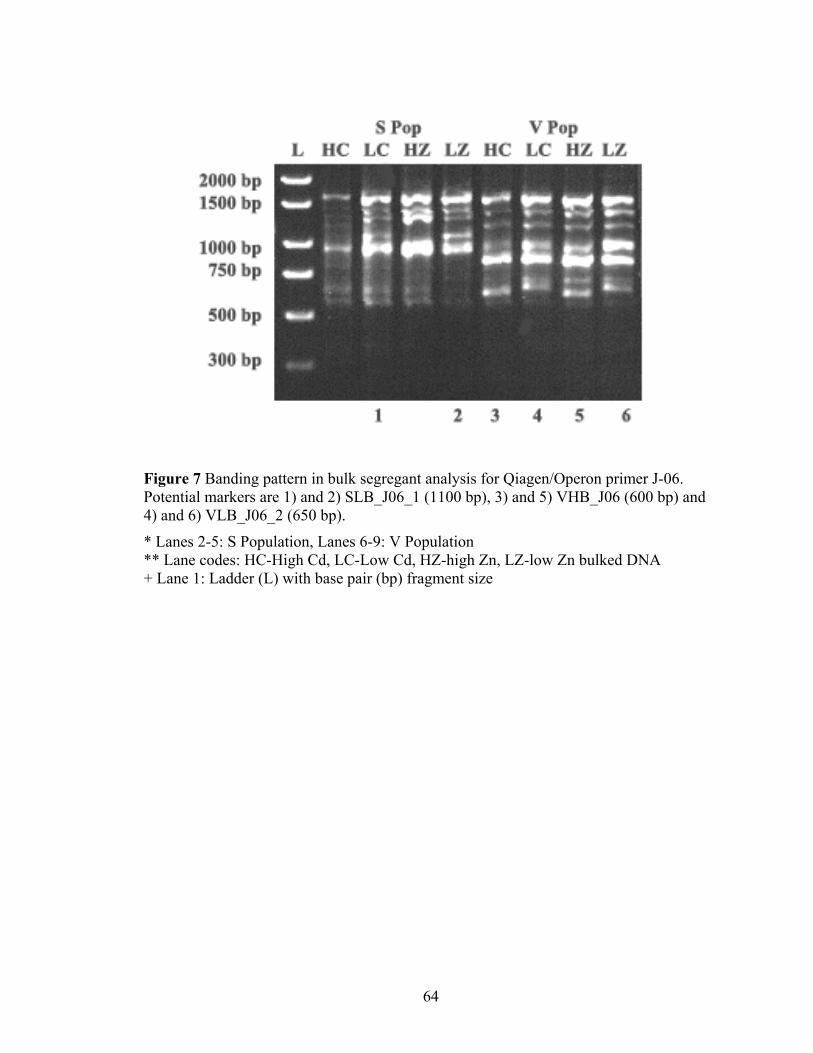
64
Figure 7 Banding pattern in bulk segregant analysis for Qiagen/Operon primer J-06. Potential markers are 1) and 2) SLB_J06_1 (1100 bp), 3) and 5) VHB_J06 (600 bp) and 4) and 6) VLB_J06_2 (650 bp).
* Lanes 2-5: S Population, Lanes 6-9: V Population ** Lane codes: HC-High Cd, LC-Low Cd, HZ-high Zn, LZ-low Zn bulked DNA + Lane 1: Ladder (L) with base pair (bp) fragment size
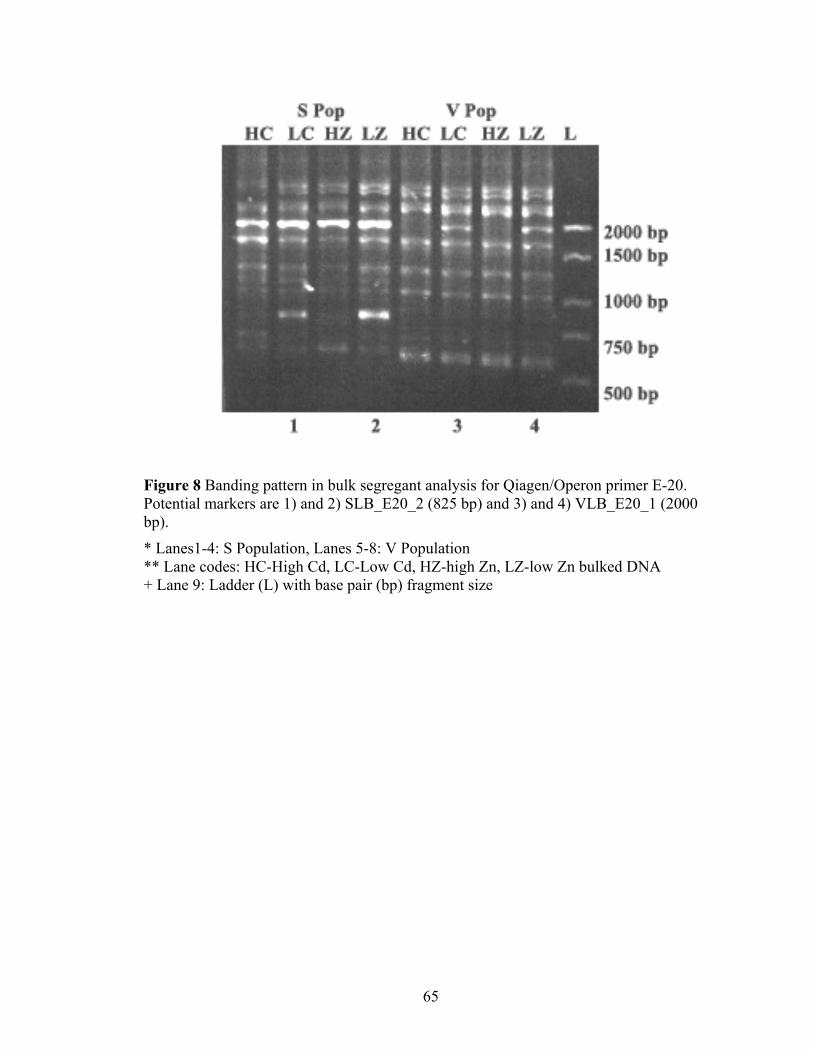
65
Figure 8 Banding pattern in bulk segregant analysis for Qiagen/Operon primer E-20. Potential markers are 1) and 2) SLB_E20_2 (825 bp) and 3) and 4) VLB_E20_1 (2000 bp).
* Lanes1-4: S Population, Lanes 5-8: V Population ** Lane codes: HC-High Cd, LC-Low Cd, HZ-high Zn, LZ-low Zn bulked DNA + Lane 9: Ladder (L) with base pair (bp) fragment size
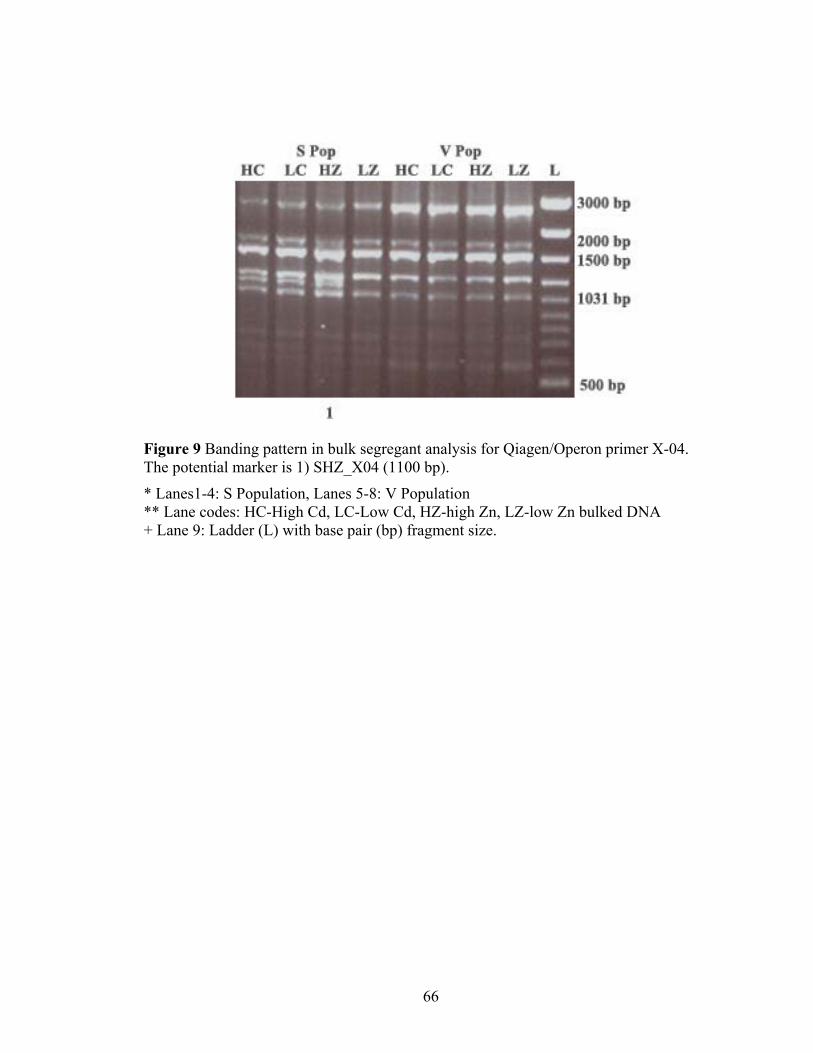
66
Figure 9 Banding pattern in bulk segregant analysis for Qiagen/Operon primer X-04. The potential marker is 1) SHZ_X04 (1100 bp).
* Lanes1-4: S Population, Lanes 5-8: V Population ** Lane codes: HC-High Cd, LC-Low Cd, HZ-high Zn, LZ-low Zn bulked DNA + Lane 9: Ladder (L) with base pair (bp) fragment size.
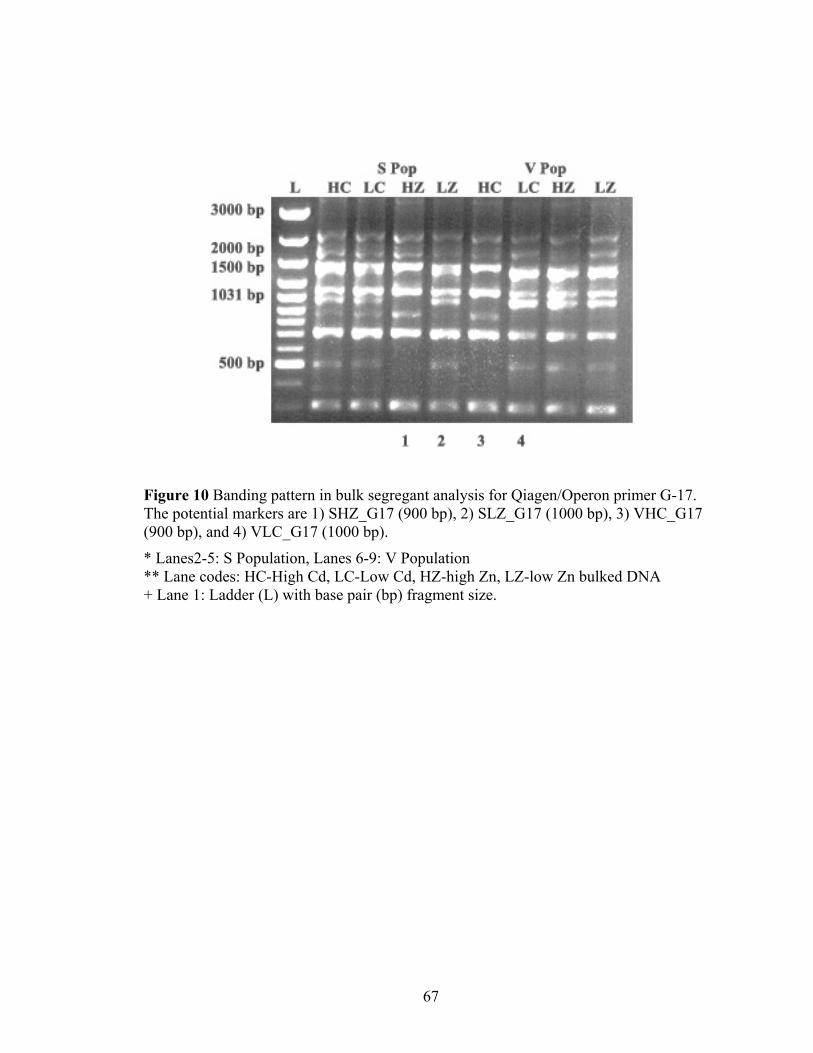
67
Figure 10 Banding pattern in bulk segregant analysis for Qiagen/Operon primer G-17. The potential markers are 1) SHZ_G17 (900 bp), 2) SLZ_G17 (1000 bp), 3) VHC_G17 (900 bp), and 4) VLC_G17 (1000 bp).
* Lanes2-5: S Population, Lanes 6-9: V Population ** Lane codes: HC-High Cd, LC-Low Cd, HZ-high Zn, LZ-low Zn bulked DNA + Lane 1: Ladder (L) with base pair (bp) fragment size.
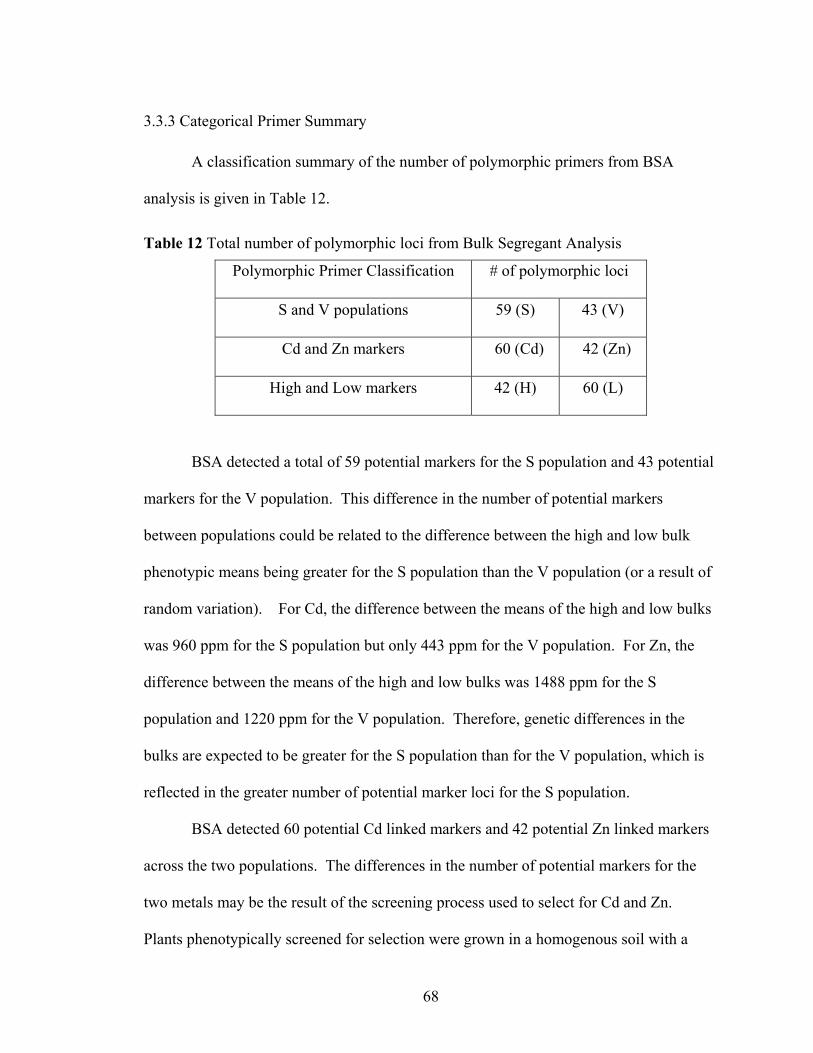
68
3.3.3 Categorical Primer Summary
A classification summary of the number of polymorphic primers from BSA
analysis is given in Table 12.
Table 12 Total number of polymorphic loci from Bulk Segregant Analysis
Polymorphic Primer Classification # of polymorphic loci
S and V populations 59 (S) 43 (V)
Cd and Zn markers 60 (Cd) 42 (Zn)
High and Low markers 42 (H) 60 (L)
BSA detected a total of 59 potential markers for the S population and 43 potential
markers for the V population. This difference in the number of potential markers
between populations could be related to the difference between the high and low bulk
phenotypic means being greater for the S population than the V population (or a result of
random variation). For Cd, the difference between the means of the high and low bulks
was 960 ppm for the S population but only 443 ppm for the V population. For Zn, the
difference between the means of the high and low bulks was 1488 ppm for the S
population and 1220 ppm for the V population. Therefore, genetic differences in the
bulks are expected to be greater for the S population than for the V population, which is
reflected in the greater number of potential marker loci for the S population.
BSA detected 60 potential Cd linked markers and 42 potential Zn linked markers
across the two populations. The differences in the number of potential markers for the
two metals may be the result of the screening process used to select for Cd and Zn.
Plants phenotypically screened for selection were grown in a homogenous soil with a
69
high Cd:Zn ratio. The soil had relatively low Zn to eliminate potential effects due to zinc
interference or phytotoxicity influencing the Cd concentrations. At the end of that
experiment, the plants ranged from approximately 190 – 1350 ppm Cd in the leaves
across both populations. This difference of over 1000 ppm in Cd leaf concentrations
between the low and high bulk means was biologically significant since the definition of
Cd hyperaccumulation is considered to be leaf concentrations of 100 ppm or more (Baker
et al., 2000).
Conversely, the difference in leaf concentrations of Zn was small in relation to the
defined accumulation level for a Zn hyperaccumulator of 10 000 ppm (Baker and Brooks,
1989). Although T. caerulescens is a known Zn hyperaccumulator and the Zn levels of
the parent plants grown in situ reached levels above 10 000 ppm (Reeves et al., 2001)
none of the progeny grown in low Zn soil exceeded 10 000 ppm Zn. Although the
heritability for leaf Zn concentration was only slightly less than the heritability for leaf
Cd concentrations, there may be different genes responsible for hyperaccumulation which
were not expressed in plants grown in a relatively low Zn soil. Because the BSA
phenotypes for Zn leaf concentrations were determined from plants grown in this soil, it
is likely that the high Cd:Zn ratio (1:17) and low Zn levels (821 ppm), was not effective
for discriminating genetic differences for Zn hyperaccumulation. There could be a
threshold level for soil Zn needed for plants to hyperaccumulate Zn and plants grown in
soils above the threshold would be needed to identify markers. Thus, DNA markers for
Zn hyperaccumulation would be beneficial if by eliminating the reliance on growing
plants in high Zn soils that would interfere with other traits of interest such as biomass.
70
RAPD markers found in the high bulks as compared to those in the low bulks
would be more useful as markers in a MBS breeding program. The presence of a marker
associated with the high bulk population would indicate that the plant has a gene or QTL
for Cd hyperaccumulation. On the other hand, a Cd marker associated with the low Cd
bulk would indicate that the plant had a gene or QTL that reduced its ability to
hyperaccumulate Cd. Thus, a marker found in the low bulk would assist the breeder in
eliminating plants from the population but would not assist in identifying genes that
contribute to improving Cd hyperaccumulation. Elimination of plant material would be
useful, but some type of further testing of these plants would be necessary to actually
discern the true superior individuals to use for subsequent generations. In other words,
while a low Cd marker identifies the individuals with the worst performance, it does not
discriminate between average and outstanding performance.
3.3.4 BSA Population Effect
In BSA, the DNA of individuals from one intermating population were combined
into bulks for PCR analysis. The bulks are constructed so that the individuals within each
bulk share a similar phenotype for a trait of interest, while other bulks of the population
have a different phenotype for this trait. Because the bulks are from an intermating
population, the DNA not associated with the trait of interest should be similar in each
bulk. Thus, differences in DNA bands between the bulks should be related to the
targeted (selected) genetic difference. The success of identifying markers linked to the
desired genes hinges on several components, including the plant populations and
screening procedures used to select the plants combined in the bulks.
71
The S and V populations used in the BSA were T. caerulescens collected from
southern France. Even though the populations were found relatively close geographically
(<200 km) (Reeves et al., 2001), they were in isolated areas and gene flow between them
was limited. Although it is not known how long these populations have been isolated, it
is possible that their genetic mechanisms for the hyperaccumulation trait evolved
separately and could be distinct. In addition, genes and their frequencies are undoubtedly
different between these populations due to genetic drift and mutations while
geographically isolated. Thus, the bulks were not compared between populations to
avoid genetic differences between the populations unrelated to metal accumulation.
The genetic structure of these two populations also influences the success of BSA.
BSA assumes that the markers adjacent to the targeted gene regions will be in linkage
disequilibrium (LD) (Michelmore et al., 1991). LD refers to two alleles (i.e a marker and
the target gene) that are more or less likely to appear together than by chance alone. LD
is the basis for generating genetic maps, as polymorphic markers detect recombinants that
are in LD. If possible, an F2 population is used for linkage mapping, as this is the stage in
which LD is at its greatest (For obligatory outcrossers, an F1 population can be used as
well). For natural populations, as used in this study, each generation of random mating
reduces the amount of LD, making linkage analysis more difficult. However, by
selecting extreme phenotypes, the populations were likely to have genetic differences for
Cd and possible Zn concentrations. Preliminary genotypic analysis confirmed that
individuals from families within the populations were segregating. Due to time
limitations, an F2 population, which would have provided more accurate and tightly
linked markers, was not feasible.
72
The number of individuals that constitute each bulk also affects the results. As
the number of individuals in a bulk decreases, the probability of false positives increases
(Michelmore et al., 1991). Therefore, fewer polymorphisms would have been detected if
the bulk size were larger because the number of false positives would have been reduced.
Also, the genetic background of the bulks was probably narrower than if the bulks were
generated by taking random selections from the entire population. This is because within
some of the bulks, there was more than one plant from a family in a bulk (Tables 6-9) or
multiple individuals were from the same sub-area of the sampling location (R. Reeves,
personal communication). These two factors create a more narrow genetic background
because of the incidence of self-pollination and likelihood of short pollen dispersal. A
narrow genetic background becomes problematic due to high frequency of false positives
when bulk size is limited
3.3.5 BSA Method Effect
Because T. caerulescens is a small plant and tissue was needed for metal analysis
and DNA amplification, the amount of available DNA became a limiting factor. In order
to effectively allocate the limited DNA, it became necessary to choose to test more
primers (to find the greatest number of polymorphisms) or to run replicates to confirm
reproducibility. Because RAPDs were being used for the experiment, the question of
replication is an important concern because profiles can be highly variable on
independent trials (Li and Quiros, 2001). For example, in experiment one, there was an
average of 56 ± 13% and 54 ± 5% reduction in reported bands (from total bands scored)
for the S and V populations, respectively, due to discrepancies between independent runs.
In fact, there was up to a 76% reduction of reported bands. For BSA, it was decided that
73
the optimal use of the DNA was to maximize the number of screened primers in order to
detect the greatest number of polymorphisms, followed by a marker validation study to
detect and eliminate non-reproducible markers. In addition, a greater number of primers
should target a wider percentage of the genome and improve the chance of finding a
tightly linked marker (especially in a natural population). This assumes that there is a
random distribution of loci detected as RAPD markers and sufficient polymorphism in
the target region (Michelmore et al., 1991). Both assumptions were not tested, but
previous data has concluded that RAPD markers evenly distribute throughout the genome
(Micehlmore et al., 1991), and the wide range in phenotypic accumulation, specifically
for Cd, suggested the necessary genetic differences. Successful phenotypic bulking is
dependent on the correlation between the genotype and phenotype (Liu, 1998). The
regression analysis from Chapter 2 suggest that the genotype and phenotype, specifically
for Cd, are significantly correlated and bulks would have hyperaccumulation linked
genetic differences.
Based on the results from the BSA study, the strategy to use more primers without
replication was probably not the most effective choice for DNA allocation. Fifty-six
different primers produced 102 potential marker loci which indicate that some of the
primers have multiple markers (the maximum was 5 potential loci from one primer).
When primers with multiple polymorphisms were repeated, the number of repeatable
polymorphic loci would be less. Other studies have found similar reductions in
repeatable polymorphic primers (Moeller and Schaal, 1999), suggesting that RAPD
polymorphisms are often not consistent. Therefore, replication of polymorphic primers
74
would have limited the number of false positive and negative markers (Liu, 1998) earlier
and reduced the volume of PCR and data collection for the subsequent experiment.
75
4.0 Marker Validation Experiment
4.1 Introduction
A marker validation experiment (MVE) was conducted to identify QTL
associated with hyperaccumulation of Cd and Zn. Hyperaccumulation appears to be
multigenic, which is expected because of the continuous variation observed in metal
accumulation for both Cd and Zn in multiple populations (Pollard et al., 2002). Since a
linkage map of T. caerulescens has not been determined, the exact location of markers
associated with QTL cannot be determined. In other words, multiple significantly
associated hyperaccumulation markers would not indicate a certain number of QTL, or
genes involved in hyperaccumulation, because it is unknown whether these markers are
located at the same or independent locations. The lack of relative location information
also means that the more statistically powerful composite or interval mapping for QTL
detection cannot be used. Nevertheless, QTL identification is possible in natural, or open
pollinated, populations, and is the strategy used when experimental crossing is not ethical
(human populations) or feasible in terms of time (ex. tree species) (Liu, 1998).
Essentially, polymorphic markers can be statistically associated with a trait if a marker
genotype accounts for a large percentage of the phenotypic variation observed for that
trait. The major assumption necessary for QTL identification in open pollinated
populations is that the maternal plants need to be heterozygous for both the marker and
the QTL (Liu, 1998). Otherwise, significant linkage between the marker and genotype
cannot be detected due to a lack of recombination events in the progeny.
The MVE was designed to determine which of the potential markers from BSA
were significantly associated with Cd or Zn accumulation. Ideally, a few loci could be
76
identified that accounted for a large portion of the variation in metal concentrations.
These RAPD bands could be used as effective markers to screen for hyperaccumulation
potential in new germplasm, as well as to develop more specific primers. In the MVE,
siblings of the BSA plants were grown and their DNA was tested with the same primers
that were polymorphic in BSA. The leaf tissue of these plants was also to be analyzed for
metal concentration and content to determine the effectiveness of the markers.
4.2 Materials and Methods
4.2.1 DNA Extraction and RAPD Analysis
Leaves were stored at -80 C after harvesting until DNA isolation. Qiagen/Operon
mini-prep kits were used for DNA extraction. Further extraction details are identical to
that presented in Section 2.2. DNA concentrations were corrected to 35 and 22.5 ng/µL
for S and V populations, respectively.
Because of the variability often found with RAPD analysis, the same reaction
mix, thermocycler, and protocol for BSA (Section 3.2.3) was used to validate the
markers. The 56 different primers that produced polymorphisms in the BSA were used
for the marker validation (Tables 10 and 11).
4.2.2 Plant Material and Cultivation
Plants grown from the seed collected in France were used to determine the
validity of the markers detected in BSA. These plants were siblings (i.e. new seed) of the
plants from previous studies (Perner et al., submitted, Experiments 1 and 2). The families
77
chosen for this study were based on phenotypic data from a previous screen (Perner et al.,
submitted). Based on the heritability estimates (Table 3) for Cd and Zn accumulation, the
concentrations of these metals should be similar within families. Seeds from the
families S02, S12, S15, S20, V06, V16, V18, and V19 were germinated in metro-mix
(containing 35-45% medium grade horticultural vermiculite, 55-65% choice Canadian
sphagnum peat moss, proprietary starter nutrient charge and other ingredients) in plastic
trays. For three months, plants germinated and grew under misters in a greenhouse
delivering a three second mist every six minutes. Plants were then moved to a growth
chamber until they were needed for this experiment, watered and fertilized as necessary
(Nitrogen(N)-Phosphorus(P)-Potassium(K); 20:20:20).
Plants were transferred into 10x10x10 cm pots containing 450 g of the soil
described in Section 4.2.3. Nylon mesh (<2mm) was placed in the bottom of each plastic
pot to prevent soil loss, and PVC pellets covered the top of the soil to prevent soil from
attaching to the leaves, and possibly increasing metal tissue concentrations. Since the
plants were over eight months old since germination, and had reached considerable size
(>30 leaves), plants were cropped at 1 cm above the soil one week after transfer.
Therefore leaf material for DNA analysis from every plant was collected at the start of
the experiment. Plants were grown on the contaminated soil for 63 days and watered
with deionized water as necessary. Tissue was harvested, triple-rinsed in deionized
water, and dried at 65 C for one week.
A randomized complete block design (RCBD) was used for the 80 total plants
screened in two identical growth chambers running under the same conditions. The
growth chamber was operated at 24/19 C for day/night temperature, 16/8 hr day/night
78
cycle; and relative humidity, 90%. Light intensity was 250 µE photosynthetically active
radiation (PAR) m-2 sec-1, and provided by a combination of cool-white fluorescent and
incandescent lamps. By the end of 63 days, Fusarium solani killed approximately half of
the test material so only 45 plants had enough tissue for phenotypic metal analysis.
4.2.3 Soil Preparation and Characterization
The soil used for this experiment was from a farm in Pennsylvania (the same as
Experiment 1), where Cd contamination had resulted from a biosolids application in the
latter half of the 20th century. This soil had a high Cd:Zn ratio and a Zn concentration
below the level that would reduce the growth of T. caerulescens and should not interfere
with Cd uptake. Thus, the soil was chosen for characteristics that were representative of
the most problematic Cd contaminated soils and to provide an adequate screen for Cd
accumulation. The untreated soil had a relatively high pH (~7) due to a previous
limestone application in an effort to minimize Cd uptake by plants. The soil was
prepared for the pot experiment by sieving < 2 mm while moist and then thoroughly
mixed. To insure that the pH would remain low enough to keep Cd bioavailable for T.
caerulescens uptake, the soil was acidified. A standard curve was developed to
determine the amount of nitric acid needed to lower the soil pH. The curve was
determined using 20 g samples from three five-gallon buckets of sieved soil that were
treated with seven acid treatments of 0.8 M HNO3 (0.5, 1, 1.5, 2.0, 3.0, 4.0, 5.0 mL).
Then, 0.01 M CaCl2 was added to reach a total volume of 40 mL. The soil samples were
placed on a reciprocal shaker for five days, then their pH was measured . The final
treatment of 5 mL of 0.8 HNO3 lowered the pH to 5.3 ± 0.1. The acidification curve can
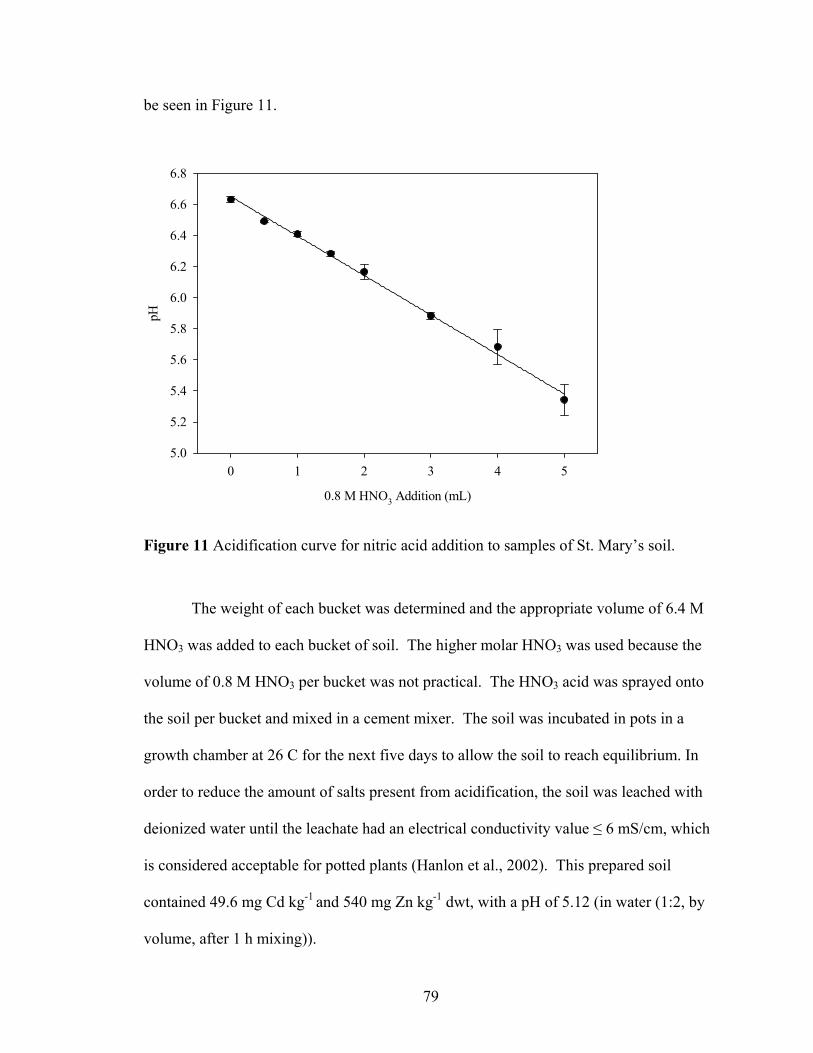
79
be seen in Figure 11.
0.8 M HNO3 Addition (mL)
0 1 2 3 4 5
pH
5.0
5.2
5.4
5.6
5.8
6.0
6.2
6.4
6.6
6.8
Figure 11 Acidification curve for nitric acid addition to samples of St. Mary’s soil.
The weight of each bucket was determined and the appropriate volume of 6.4 M
HNO3 was added to each bucket of soil. The higher molar HNO3 was used because the
volume of 0.8 M HNO3 per bucket was not practical. The HNO3 acid was sprayed onto
the soil per bucket and mixed in a cement mixer. The soil was incubated in pots in a
growth chamber at 26 C for the next five days to allow the soil to reach equilibrium. In
order to reduce the amount of salts present from acidification, the soil was leached with
deionized water until the leachate had an electrical conductivity value ≤ 6 mS/cm, which
is considered acceptable for potted plants (Hanlon et al., 2002). This prepared soil
contained 49.6 mg Cd kg-1 and 540 mg Zn kg-1 dwt, with a pH of 5.12 (in water (1:2, by
volume, after 1 h mixing)).
80
Fertilizer was added to the soil at a concentration of 100 mg kg-1 soil for N, P, K,
Mg, and 6 mg kg-1 soil B. Solutions were made using Ca(NO3)2*4H2O, K2HPO4,
MgSO4*7H2O, and HBO3. CaHPO4 was added to the soil as a powder because of its low
water solubility. This addition also helped raise the P application to the desired
concentration. After the fertilizer application, the soil was thoroughly mixed before
transferring to pots for the experiment. Plants were fertilized with soluble fertilizer (N-P-
K; 20:20:20) three times over the 63 days of growth.
The Cd and Zn concentrations of the soil were determined by a strong nitric acid
digestion that is used to detect the metal concentration that could become available to the
plants. Three samples of the soil were used for analysis. Five grams of air dried soil and
10 mL of concentrated HNO3 were heated for two hours at a mild reflux condition, and
then heated to incipient dryness. Ten milliliters of 3 M HCl was then added, followed by
an additional two hours mild reflux reaction. The sample was filtered and transferred to a
50 mL volumetric flask. The beaker and filter was rinsed and the sample was diluted to
volume with 0.1 M HCl. Two blanks, and two reference samples (NIST Montana Soil
#2711) were used for quality control. Zn and Cd were determined using flame AAS with
deuterium background correction.
The pH of each individual pot was determined after the plants had been harvested.
The average pH of all samples was 6.28 ± 0.03.
Each plant was grown in a 10x10x10 cm pot contained 450 g of soil (dwt) and
arranged in a completely randomized design (CRD) in two identical growth chambers.
Plants were watered as needed using deionized water.
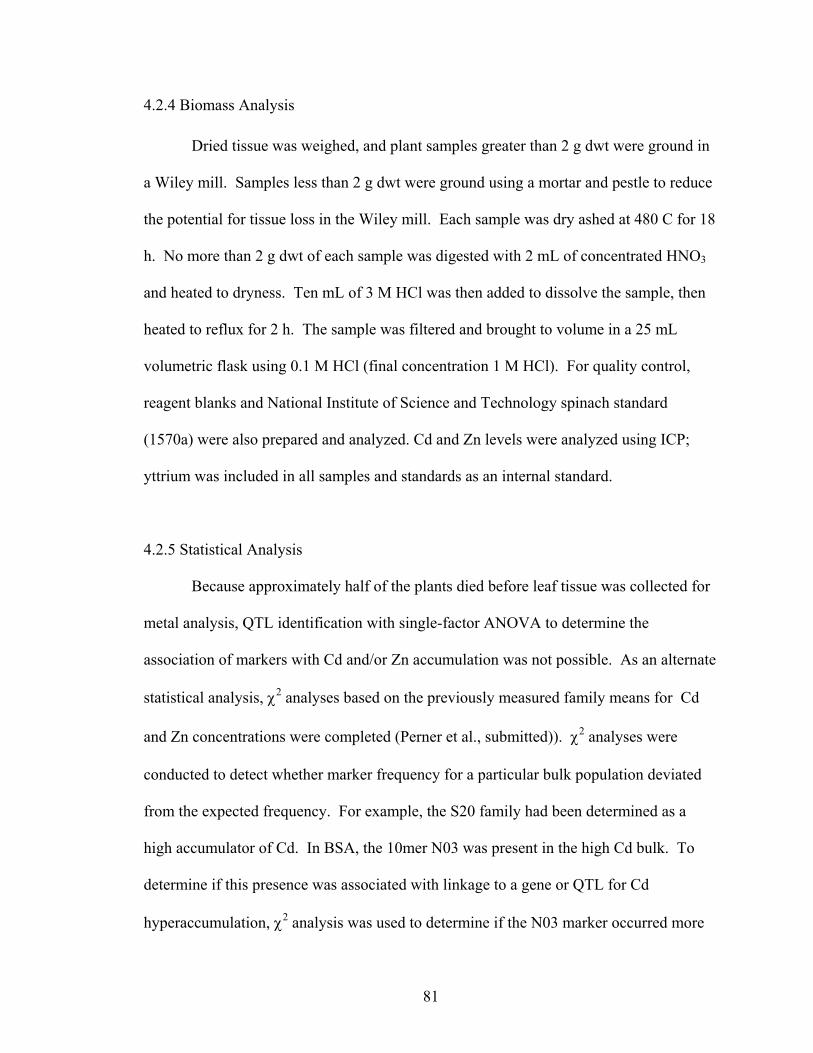
81
4.2.4 Biomass Analysis
Dried tissue was weighed, and plant samples greater than 2 g dwt were ground in
a Wiley mill. Samples less than 2 g dwt were ground using a mortar and pestle to reduce
the potential for tissue loss in the Wiley mill. Each sample was dry ashed at 480 C for 18
h. No more than 2 g dwt of each sample was digested with 2 mL of concentrated HNO3
and heated to dryness. Ten mL of 3 M HCl was then added to dissolve the sample, then
heated to reflux for 2 h. The sample was filtered and brought to volume in a 25 mL
volumetric flask using 0.1 M HCl (final concentration 1 M HCl). For quality control,
reagent blanks and National Institute of Science and Technology spinach standard
(1570a) were also prepared and analyzed. Cd and Zn levels were analyzed using ICP;
yttrium was included in all samples and standards as an internal standard.
4.2.5 Statistical Analysis
Because approximately half of the plants died before leaf tissue was collected for
metal analysis, QTL identification with single-factor ANOVA to determine the
association of markers with Cd and/or Zn accumulation was not possible. As an alternate
statistical analysis, χ2 analyses based on the previously measured family means for Cd
and Zn concentrations were completed (Perner et al., submitted)). χ2 analyses were
conducted to detect whether marker frequency for a particular bulk population deviated
from the expected frequency. For example, the S20 family had been determined as a
high accumulator of Cd. In BSA, the 10mer N03 was present in the high Cd bulk. To
determine if this presence was associated with linkage to a gene or QTL for Cd
hyperaccumulation, χ2 analysis was used to determine if the N03 marker occurred more
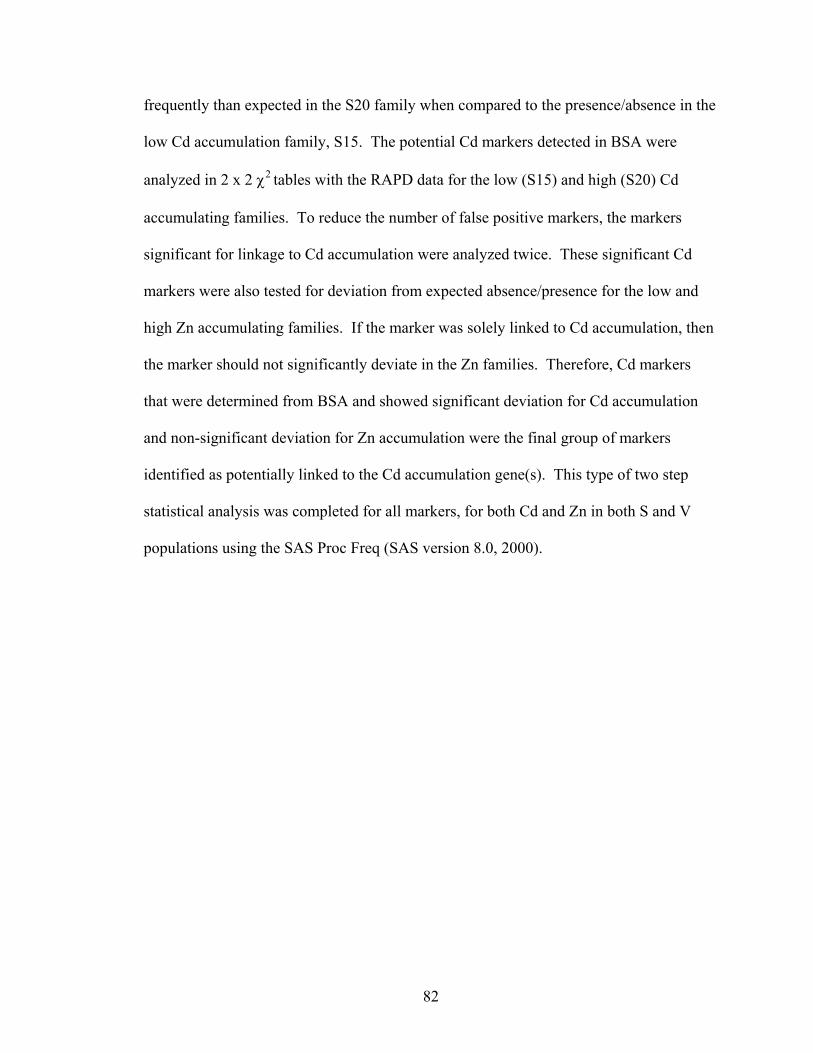
82
frequently than expected in the S20 family when compared to the presence/absence in the
low Cd accumulation family, S15. The potential Cd markers detected in BSA were
analyzed in 2 x 2 χ2 tables with the RAPD data for the low (S15) and high (S20) Cd
accumulating families. To reduce the number of false positive markers, the markers
significant for linkage to Cd accumulation were analyzed twice. These significant Cd
markers were also tested for deviation from expected absence/presence for the low and
high Zn accumulating families. If the marker was solely linked to Cd accumulation, then
the marker should not significantly deviate in the Zn families. Therefore, Cd markers
that were determined from BSA and showed significant deviation for Cd accumulation
and non-significant deviation for Zn accumulation were the final group of markers
identified as potentially linked to the Cd accumulation gene(s). This type of two step
statistical analysis was completed for all markers, for both Cd and Zn in both S and V
populations using the SAS Proc Freq (SAS version 8.0, 2000).
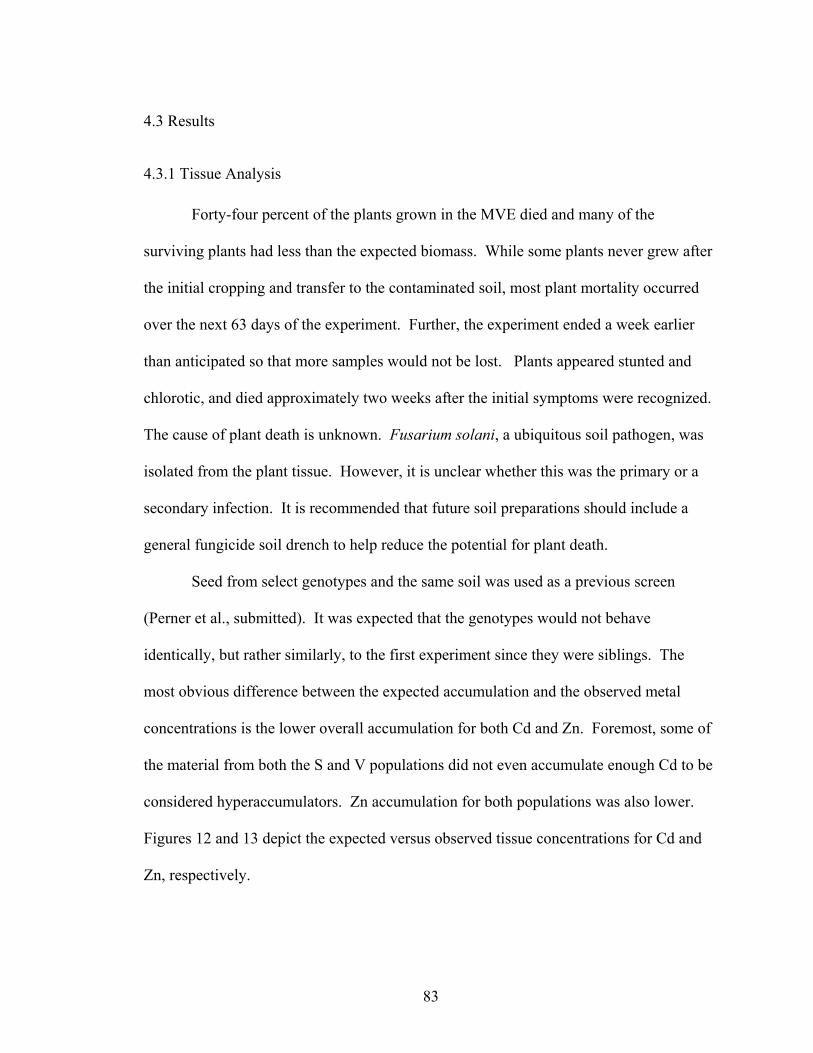
83
4.3 Results
4.3.1 Tissue Analysis
Forty-four percent of the plants grown in the MVE died and many of the
surviving plants had less than the expected biomass. While some plants never grew after
the initial cropping and transfer to the contaminated soil, most plant mortality occurred
over the next 63 days of the experiment. Further, the experiment ended a week earlier
than anticipated so that more samples would not be lost. Plants appeared stunted and
chlorotic, and died approximately two weeks after the initial symptoms were recognized.
The cause of plant death is unknown. Fusarium solani, a ubiquitous soil pathogen, was
isolated from the plant tissue. However, it is unclear whether this was the primary or a
secondary infection. It is recommended that future soil preparations should include a
general fungicide soil drench to help reduce the potential for plant death.
Seed from select genotypes and the same soil was used as a previous screen
(Perner et al., submitted). It was expected that the genotypes would not behave
identically, but rather similarly, to the first experiment since they were siblings. The
most obvious difference between the expected accumulation and the observed metal
concentrations is the lower overall accumulation for both Cd and Zn. Foremost, some of
the material from both the S and V populations did not even accumulate enough Cd to be
considered hyperaccumulators. Zn accumulation for both populations was also lower.
Figures 12 and 13 depict the expected versus observed tissue concentrations for Cd and
Zn, respectively.
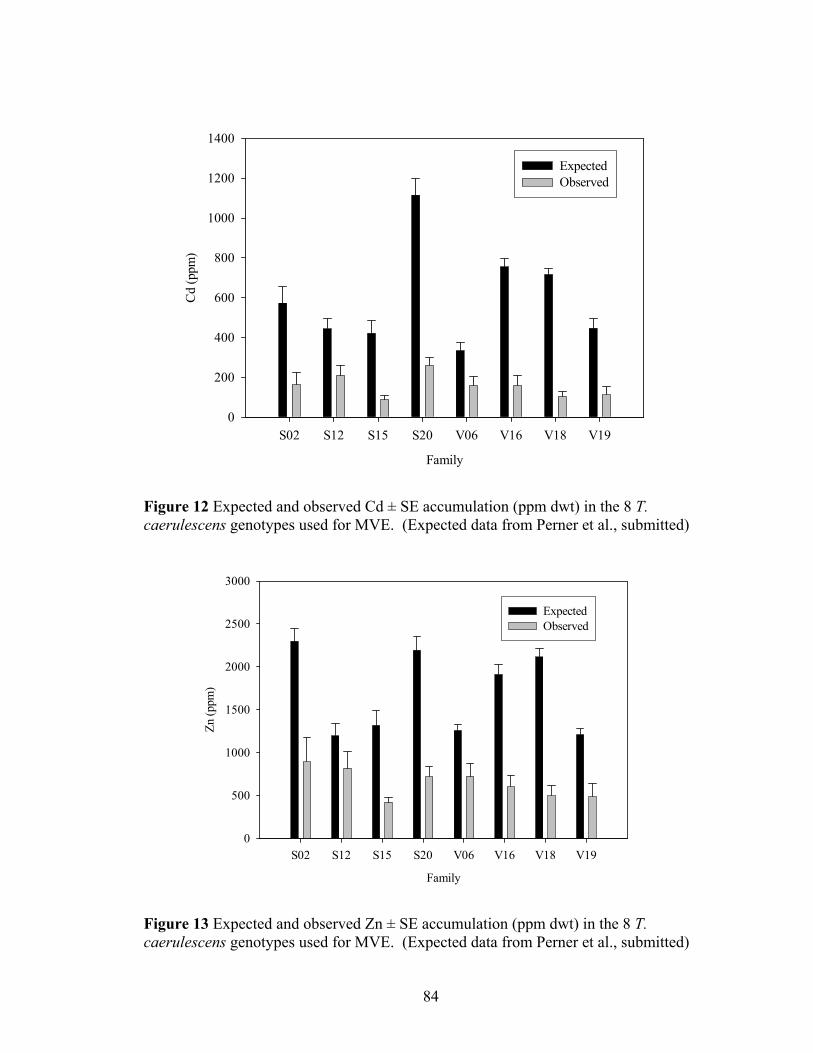
84
Family
S02 S12 S15 S20 V06 V16 V18 V19
Cd
(ppm
)
0
200
400
600
800
1000
1200
1400
ExpectedObserved
Figure 12 Expected and observed Cd ± SE accumulation (ppm dwt) in the 8 T. caerulescens genotypes used for MVE. (Expected data from Perner et al., submitted)
Family
S02 S12 S15 S20 V06 V16 V18 V19
Zn (p
pm)
0
500
1000
1500
2000
2500
3000
ExpectedObserved
Figure 13 Expected and observed Zn ± SE accumulation (ppm dwt) in the 8 T. caerulescens genotypes used for MVE. (Expected data from Perner et al., submitted)
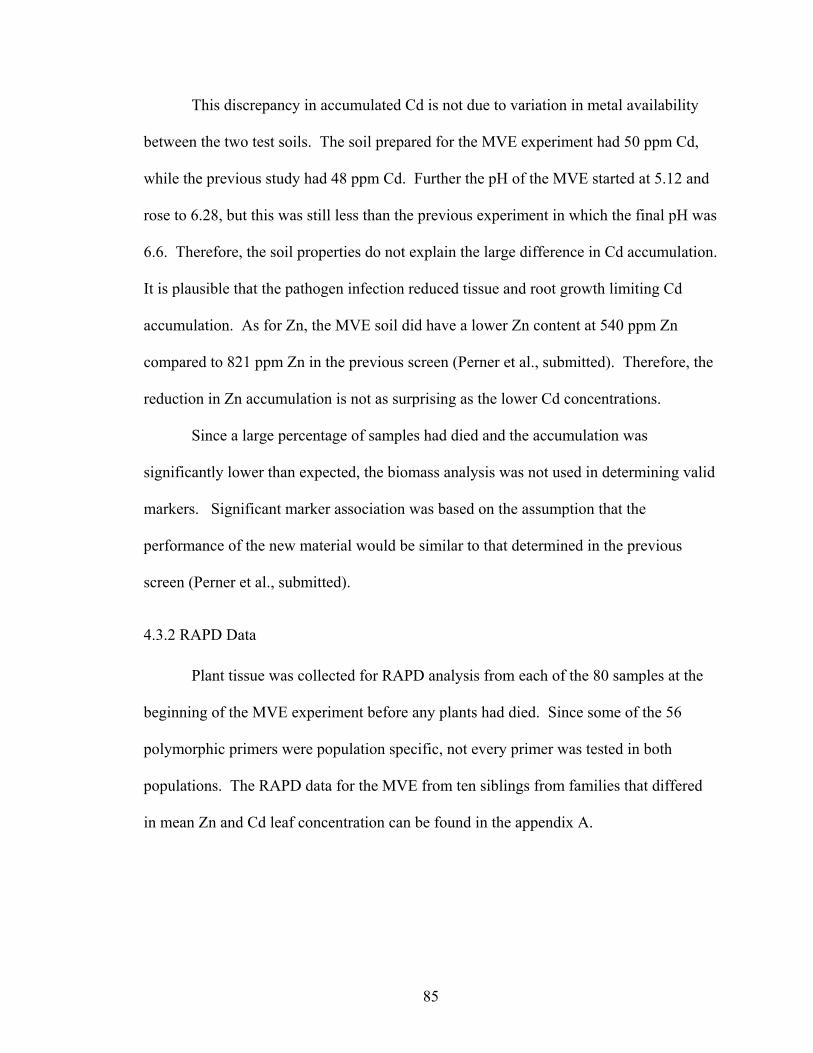
85
This discrepancy in accumulated Cd is not due to variation in metal availability
between the two test soils. The soil prepared for the MVE experiment had 50 ppm Cd,
while the previous study had 48 ppm Cd. Further the pH of the MVE started at 5.12 and
rose to 6.28, but this was still less than the previous experiment in which the final pH was
6.6. Therefore, the soil properties do not explain the large difference in Cd accumulation.
It is plausible that the pathogen infection reduced tissue and root growth limiting Cd
accumulation. As for Zn, the MVE soil did have a lower Zn content at 540 ppm Zn
compared to 821 ppm Zn in the previous screen (Perner et al., submitted). Therefore, the
reduction in Zn accumulation is not as surprising as the lower Cd concentrations.
Since a large percentage of samples had died and the accumulation was
significantly lower than expected, the biomass analysis was not used in determining valid
markers. Significant marker association was based on the assumption that the
performance of the new material would be similar to that determined in the previous
screen (Perner et al., submitted).
4.3.2 RAPD Data
Plant tissue was collected for RAPD analysis from each of the 80 samples at the
beginning of the MVE experiment before any plants had died. Since some of the 56
polymorphic primers were population specific, not every primer was tested in both
populations. The RAPD data for the MVE from ten siblings from families that differed
in mean Zn and Cd leaf concentration can be found in the appendix A.
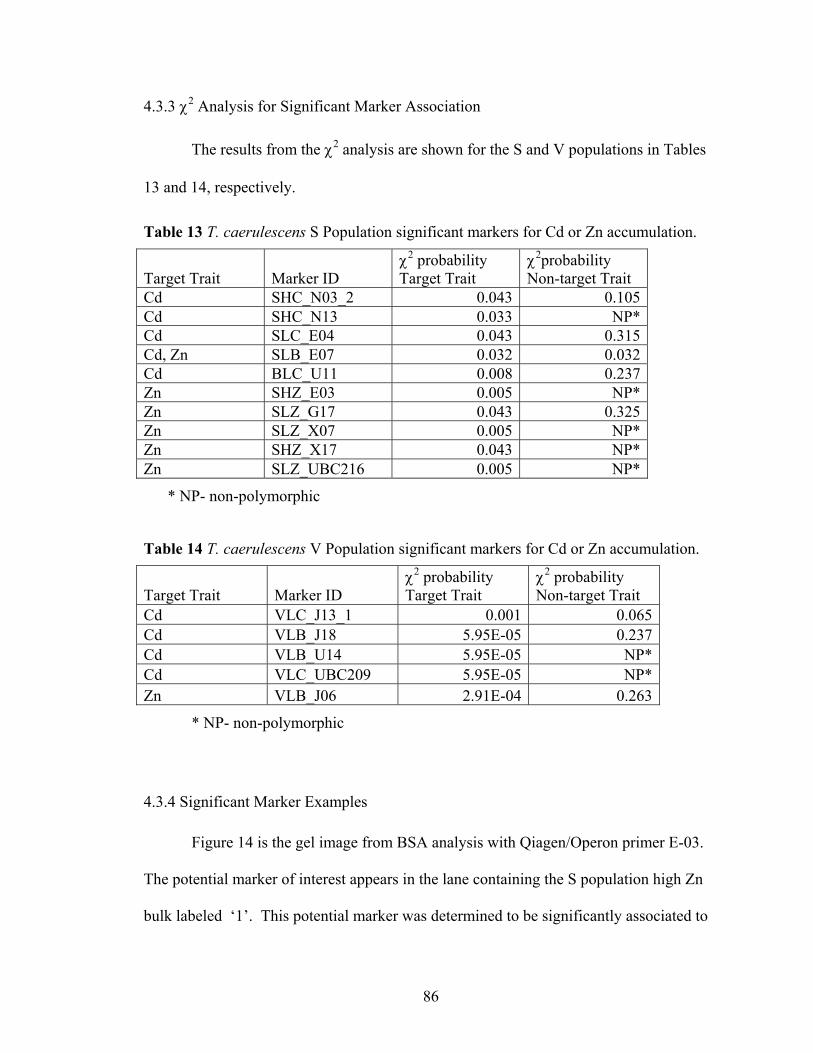
86
4.3.3 χ2 Analysis for Significant Marker Association
The results from the χ2 analysis are shown for the S and V populations in Tables
13 and 14, respectively.
Table 13 T. caerulescens S Population significant markers for Cd or Zn accumulation.
Target Trait Marker ID χ2 probability Target Trait
χ2probability Non-target Trait
Cd SHC_N03_2 0.043 0.105 Cd SHC_N13 0.033 NP* Cd SLC_E04 0.043 0.315 Cd, Zn SLB_E07 0.032 0.032 Cd BLC_U11 0.008 0.237 Zn SHZ_E03 0.005 NP* Zn SLZ_G17 0.043 0.325 Zn SLZ_X07 0.005 NP* Zn SHZ_X17 0.043 NP* Zn SLZ_UBC216 0.005 NP*
* NP- non-polymorphic
Table 14 T. caerulescens V Population significant markers for Cd or Zn accumulation.
Target Trait Marker ID χ2 probability Target Trait
χ2 probability Non-target Trait
Cd VLC_J13_1 0.001 0.065 Cd VLB_J18 5.95E-05 0.237 Cd VLB_U14 5.95E-05 NP* Cd VLC_UBC209 5.95E-05 NP* Zn VLB_J06 2.91E-04 0.263
* NP- non-polymorphic
4.3.4 Significant Marker Examples
Figure 14 is the gel image from BSA analysis with Qiagen/Operon primer E-03.
The potential marker of interest appears in the lane containing the S population high Zn
bulk labeled ‘1’. This potential marker was determined to be significantly associated to
87
high Zn accumulation in the S population after χ2 analysis. Figure 15 depicts the
significant marker SHZ_E03 for the high Zn family S02 and the low Zn family S12. The
marker was not present in either the expected high or low Cd accumulating families (not
shown).
Figure 14 Banding pattern in bulk Segregant analysis for Qiagen/Operon primer E-03. The marker 1) SHZ_E03 (600 bp) was determined to be significantly associated with high Zn accumulation after the marker validation experiment χ2 analysis.
* Lanes1-4: S Population, Lanes 5-8: V Population ** Lane codes: HC-High Cd, LC-Low Cd, HZ-high Zn, LZ-low Zn bulked DNA + Lane 9: Ladder (L) with base pair (bp) fragment size.
88
Figure 15 The gel images for the expected high Zn accumulating family, S02, and the expected low Zn accumulating family, S12 with Qiagen/Operon primer E-03 (marker denoted with an arrow).
* Lanes1-10: Ten siblings ** Lane 11: Ladder (L) + Lane Data: Marker presence (‘1), absence (‘0’), or missing data (‘.’)
Figure 16 is the gel image from BSA analysis with Qiagen/Operon primer U-14
displaying the potential marker significantly associated with low Cd accumulation in the
V population. Figure 17 depicts the significant marker VLB_U14 for the low Cd family
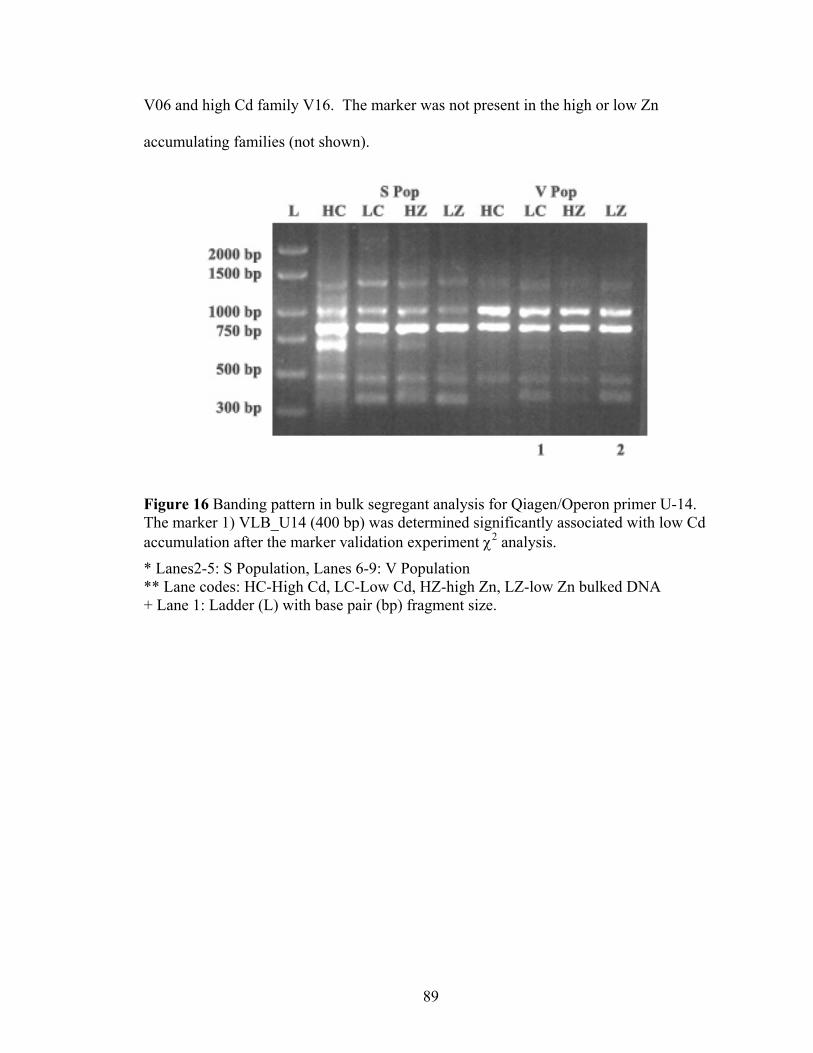
89
V06 and high Cd family V16. The marker was not present in the high or low Zn
accumulating families (not shown).
Figure 16 Banding pattern in bulk segregant analysis for Qiagen/Operon primer U-14. The marker 1) VLB_U14 (400 bp) was determined significantly associated with low Cd accumulation after the marker validation experiment χ2 analysis.
* Lanes2-5: S Population, Lanes 6-9: V Population ** Lane codes: HC-High Cd, LC-Low Cd, HZ-high Zn, LZ-low Zn bulked DNA + Lane 1: Ladder (L) with base pair (bp) fragment size.
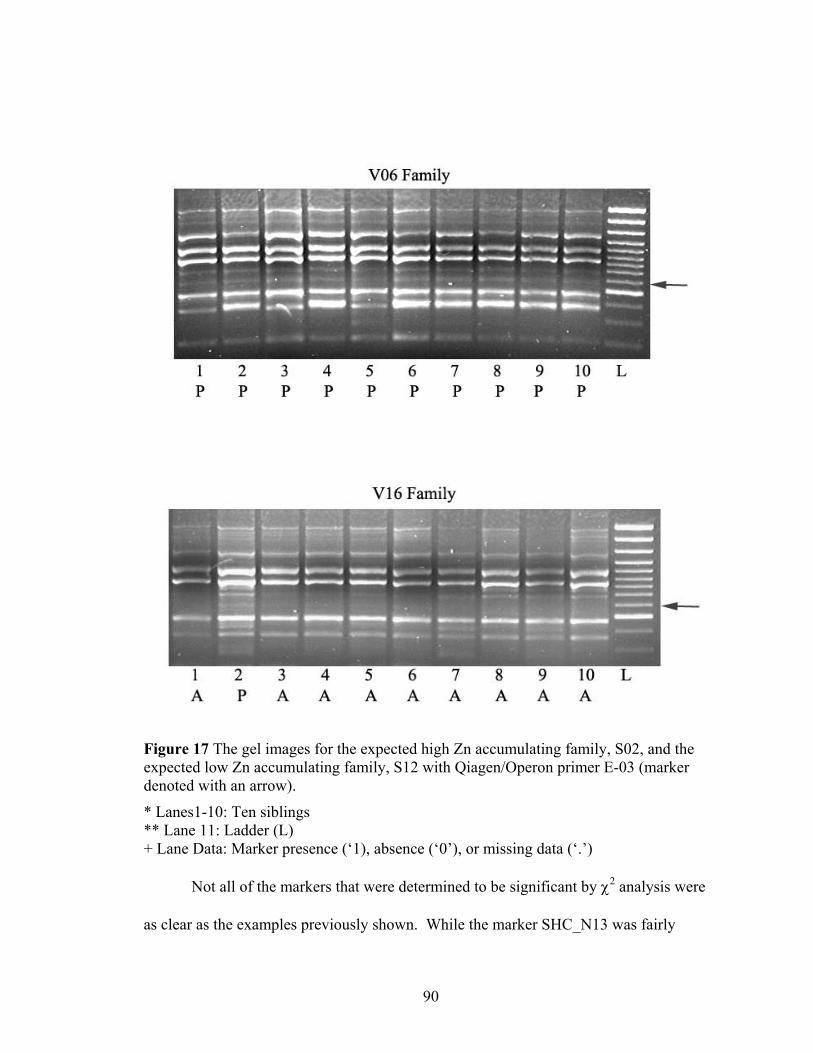
90
Figure 17 The gel images for the expected high Zn accumulating family, S02, and the expected low Zn accumulating family, S12 with Qiagen/Operon primer E-03 (marker denoted with an arrow).
* Lanes1-10: Ten siblings ** Lane 11: Ladder (L) + Lane Data: Marker presence (‘1), absence (‘0’), or missing data (‘.’) Not all of the markers that were determined to be significant by χ2 analysis were
as clear as the examples previously shown. While the marker SHC_N13 was fairly
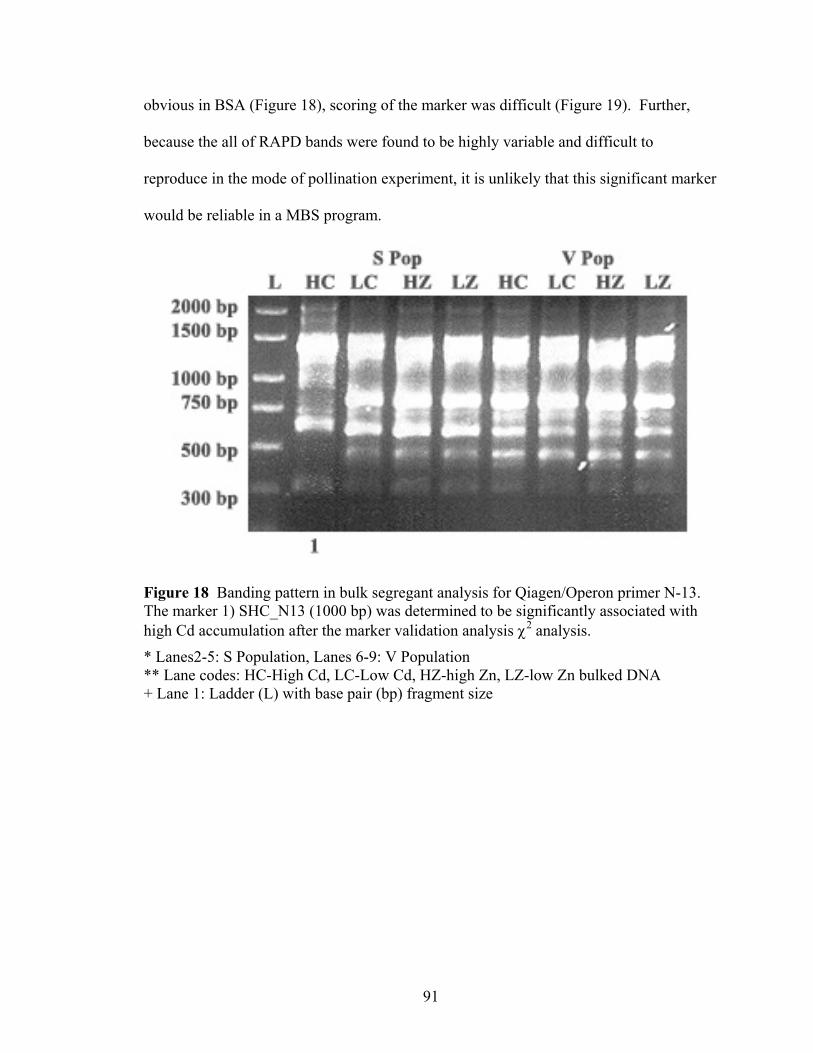
91
obvious in BSA (Figure 18), scoring of the marker was difficult (Figure 19). Further,
because the all of RAPD bands were found to be highly variable and difficult to
reproduce in the mode of pollination experiment, it is unlikely that this significant marker
would be reliable in a MBS program.
Figure 18 Banding pattern in bulk segregant analysis for Qiagen/Operon primer N-13. The marker 1) SHC_N13 (1000 bp) was determined to be significantly associated with high Cd accumulation after the marker validation analysis χ2 analysis.
* Lanes2-5: S Population, Lanes 6-9: V Population ** Lane codes: HC-High Cd, LC-Low Cd, HZ-high Zn, LZ-low Zn bulked DNA + Lane 1: Ladder (L) with base pair (bp) fragment size
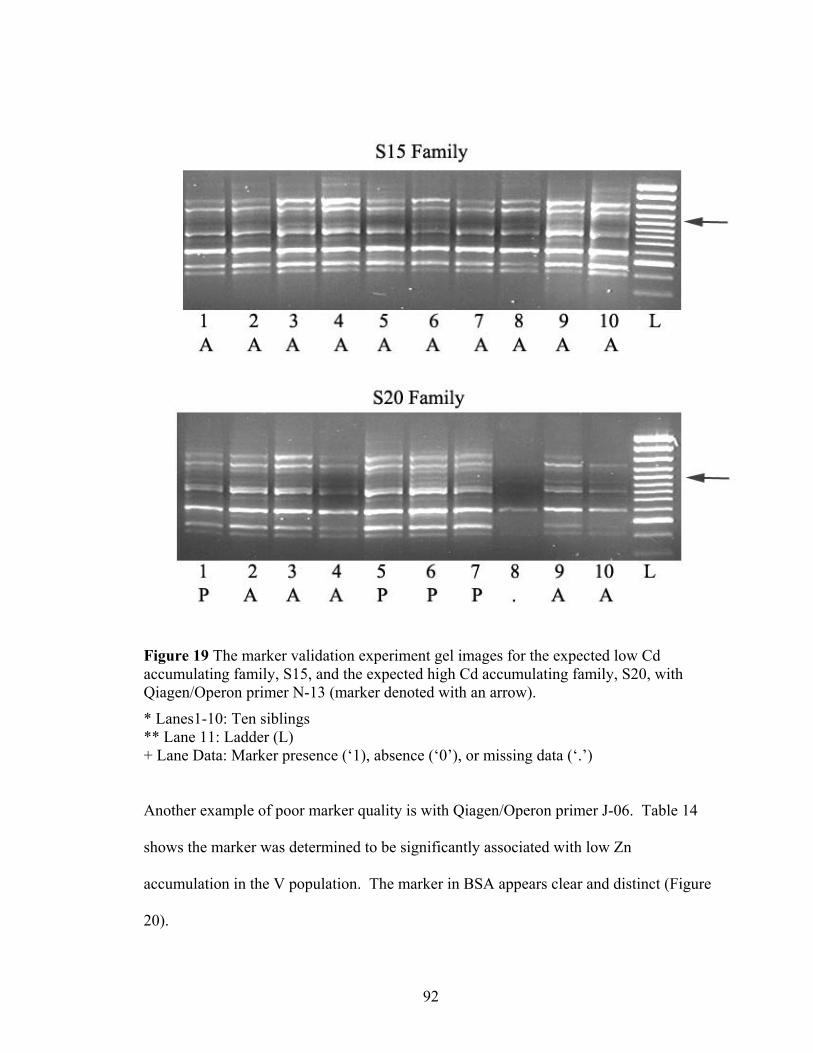
92
Figure 19 The marker validation experiment gel images for the expected low Cd accumulating family, S15, and the expected high Cd accumulating family, S20, with Qiagen/Operon primer N-13 (marker denoted with an arrow).
* Lanes1-10: Ten siblings ** Lane 11: Ladder (L) + Lane Data: Marker presence (‘1), absence (‘0’), or missing data (‘.’) Another example of poor marker quality is with Qiagen/Operon primer J-06. Table 14
shows the marker was determined to be significantly associated with low Zn
accumulation in the V population. The marker in BSA appears clear and distinct (Figure
20).
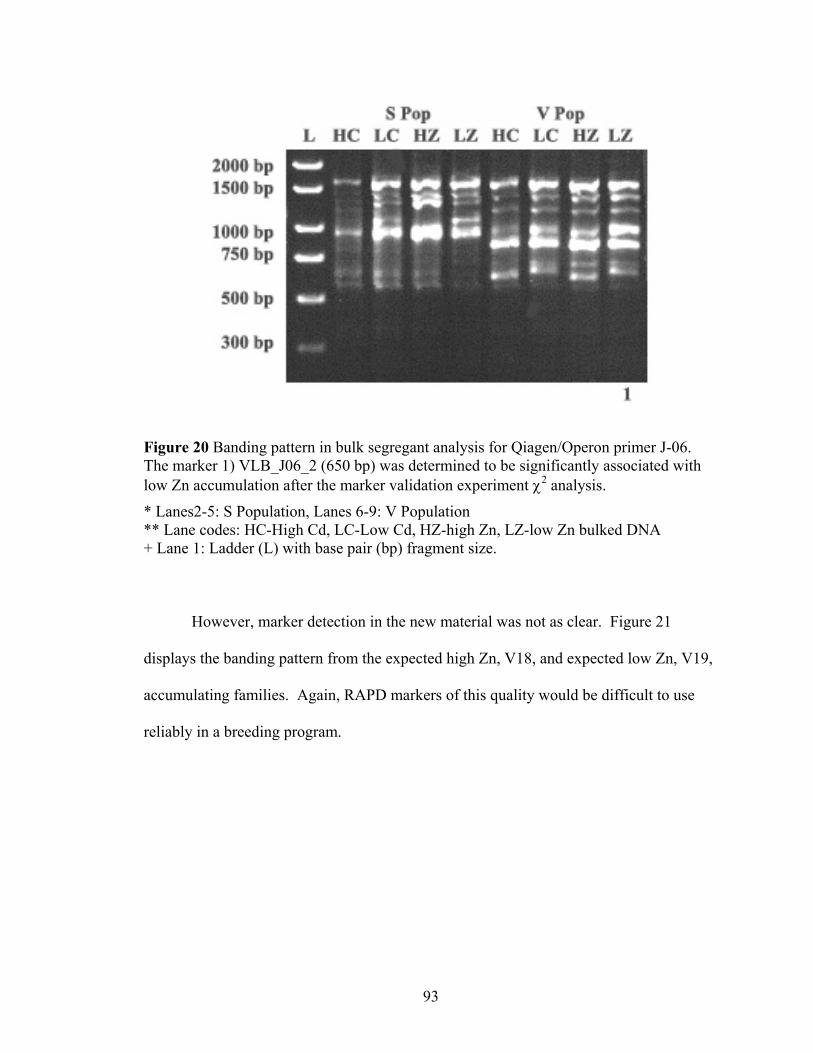
93
Figure 20 Banding pattern in bulk segregant analysis for Qiagen/Operon primer J-06. The marker 1) VLB_J06_2 (650 bp) was determined to be significantly associated with low Zn accumulation after the marker validation experiment χ2 analysis.
* Lanes2-5: S Population, Lanes 6-9: V Population ** Lane codes: HC-High Cd, LC-Low Cd, HZ-high Zn, LZ-low Zn bulked DNA + Lane 1: Ladder (L) with base pair (bp) fragment size.
However, marker detection in the new material was not as clear. Figure 21
displays the banding pattern from the expected high Zn, V18, and expected low Zn, V19,
accumulating families. Again, RAPD markers of this quality would be difficult to use
reliably in a breeding program.
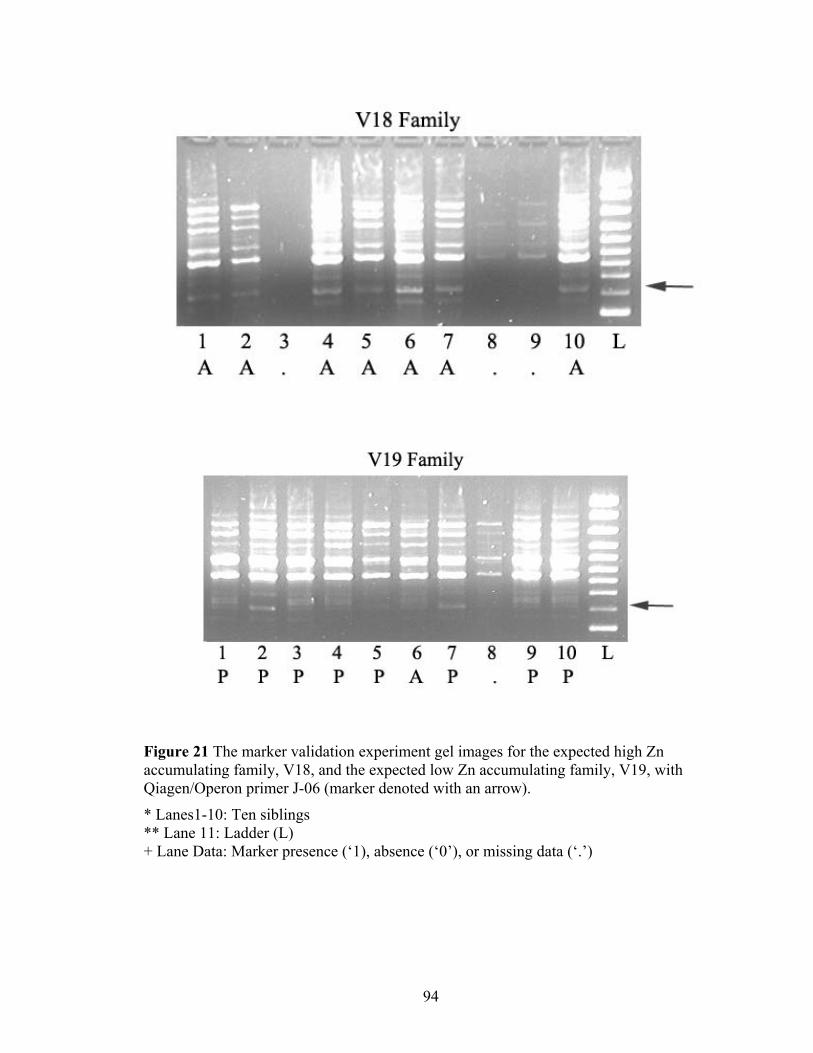
94
Figure 21 The marker validation experiment gel images for the expected high Zn accumulating family, V18, and the expected low Zn accumulating family, V19, with Qiagen/Operon primer J-06 (marker denoted with an arrow).
* Lanes1-10: Ten siblings ** Lane 11: Ladder (L) + Lane Data: Marker presence (‘1), absence (‘0’), or missing data (‘.’)
95
BSA analysis detected 102 potential marker loci and χ2 analysis determined that
16 of these markers were significantly associated with the target traits. For the S and V
populations, there were a total of 9 markers significantly associated with Cd
accumulation and 7 markers significantly associated with Zn accumulation. Fifteen
percent of the potential Cd markers (9/60) and 9% of the potential Zn markers (7/42) had
significant associations. The higher proportion of false positive markers for Zn than Cd
could be caused by the soil screening procedure used to evaluate the phenotype for the
bulks which appeared to be less effective for Zn than Cd (See Section 2.4).
An additional disadvantage of using the RAPDs is that statistically significant
markers were not always consistently good quality bands. For example, even though the
SHC_N13 marker appears to be bright and clear in the BSA analysis (Figure 18),
subsequent analysis in MVE was difficult. Although present in some of the expected
high Cd family siblings (S20, Figure 19) the marker was difficult to score and barely
detectable. Similarly, the potential marker VLB_J06_2 appeared more clearly in the BSA
screening (Figure 20) than in the individuals tested for validating the marker (Figure 21).
Thus, considering the inconsistency of RAPDs, as well as the potential differences in
banding patterns possible with different lab technicians, chemicals, or protocols, markers
of this quality would be difficult to use to screen germplasm in an MBS program.
4.4 Discussion
By examining the significant markers from χ2 analysis, it is clear that the marker
detection method did not result in quality RAPD markers. Despite statistical
significance, it is unrealistic that many of the markers could be consistently repeated and
96
accurately scored in an MBS program. Because T. caerulescens has only become a plant
species of economic interest within the last decade, there have been few published
genetic studies of T. caerulescens until recently. This study will be the first to report the
use of PCR to identify genetic markers for metal accumulation. Based on this lack of
fundamental genetic information, RAPDs were chosen as an inexpensive and fast method
to detect genomic polymorphisms. However, a significant drawback of RAPDs is that
bands can be inconsistent and difficult to detect.
Since the biomass data was not available for the MVE analysis, further testing
was completed to analyze the validity of both the method and results. This was not a
separate experiment with adequate statistical design, but rather to serve as an indication
of possible flaws within the marker detection method. The three examples below
highlight important issues found with the method and results. In each example, a specific
primer was tested in DNA samples from the 16 individuals (except for one individual in
the low Cd bulk for which there was no remaining DNA) that comprised the high Cd and
low Cd bulks in the S population. Only the individuals from the S population selected for
the Cd bulks were analyzed as it is this population and trait that are of primary interest for
this experiment.
4.4.1 Example One: Exclusivity
In BSA, Qiagen/Operon primer J-04 detected two potential Cd linked markers in
the S population shown in Figure 22.
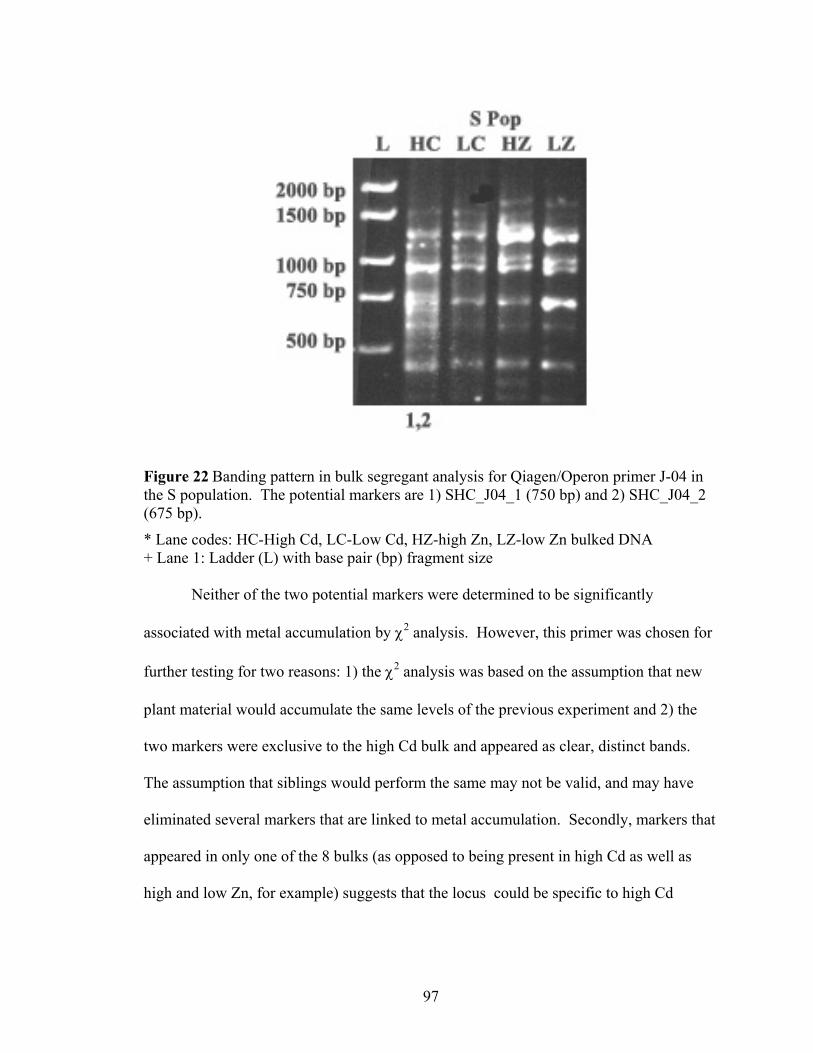
97
Figure 22 Banding pattern in bulk segregant analysis for Qiagen/Operon primer J-04 in the S population. The potential markers are 1) SHC_J04_1 (750 bp) and 2) SHC_J04_2 (675 bp).
* Lane codes: HC-High Cd, LC-Low Cd, HZ-high Zn, LZ-low Zn bulked DNA + Lane 1: Ladder (L) with base pair (bp) fragment size Neither of the two potential markers were determined to be significantly
associated with metal accumulation by χ2 analysis. However, this primer was chosen for
further testing for two reasons: 1) the χ2 analysis was based on the assumption that new
plant material would accumulate the same levels of the previous experiment and 2) the
two markers were exclusive to the high Cd bulk and appeared as clear, distinct bands.
The assumption that siblings would perform the same may not be valid, and may have
eliminated several markers that are linked to metal accumulation. Secondly, markers that
appeared in only one of the 8 bulks (as opposed to being present in high Cd as well as
high and low Zn, for example) suggests that the locus could be specific to high Cd
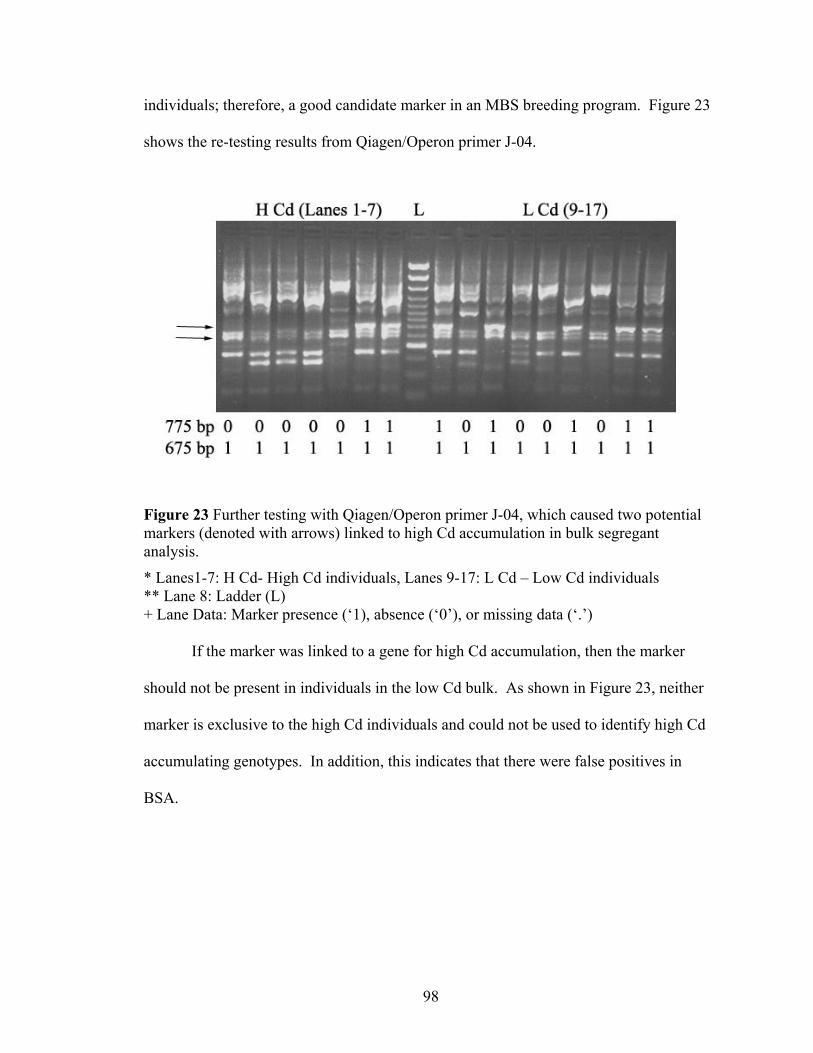
98
individuals; therefore, a good candidate marker in an MBS breeding program. Figure 23
shows the re-testing results from Qiagen/Operon primer J-04.
Figure 23 Further testing with Qiagen/Operon primer J-04, which caused two potential markers (denoted with arrows) linked to high Cd accumulation in bulk segregant analysis.
* Lanes1-7: H Cd- High Cd individuals, Lanes 9-17: L Cd – Low Cd individuals ** Lane 8: Ladder (L) + Lane Data: Marker presence (‘1), absence (‘0’), or missing data (‘.’) If the marker was linked to a gene for high Cd accumulation, then the marker
should not be present in individuals in the low Cd bulk. As shown in Figure 23, neither
marker is exclusive to the high Cd individuals and could not be used to identify high Cd
accumulating genotypes. In addition, this indicates that there were false positives in
BSA.
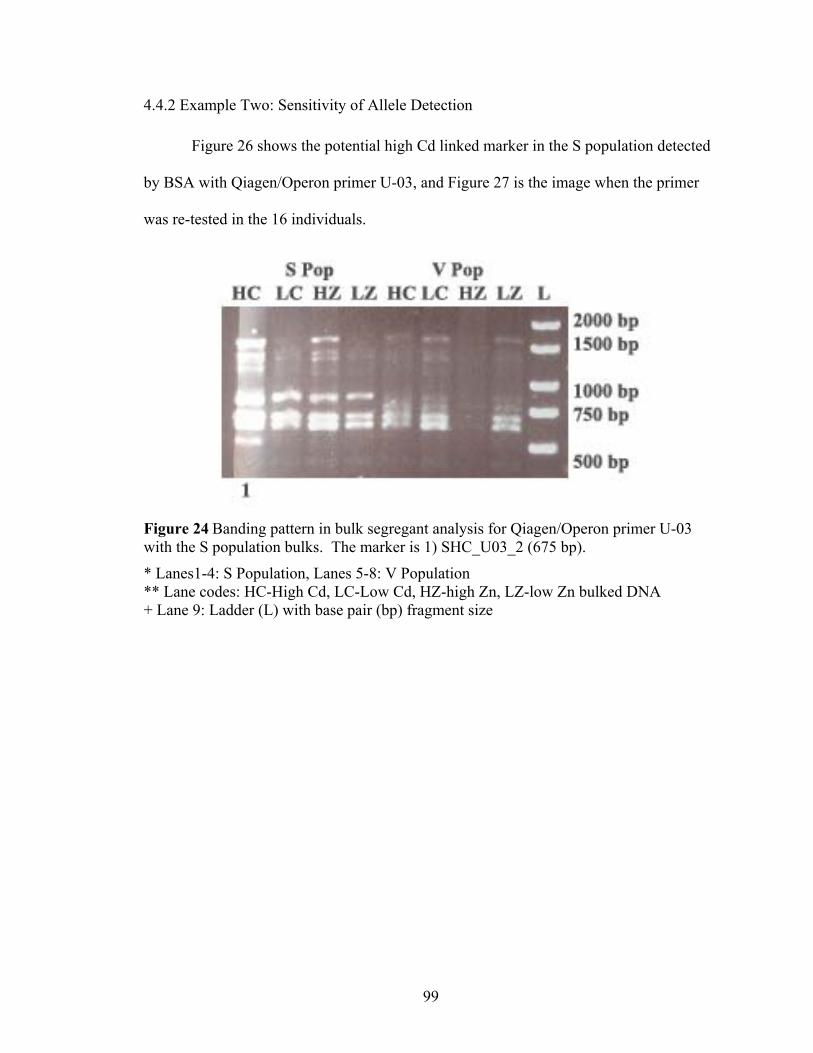
99
4.4.2 Example Two: Sensitivity of Allele Detection
Figure 26 shows the potential high Cd linked marker in the S population detected
by BSA with Qiagen/Operon primer U-03, and Figure 27 is the image when the primer
was re-tested in the 16 individuals.
Figure 24 Banding pattern in bulk segregant analysis for Qiagen/Operon primer U-03 with the S population bulks. The marker is 1) SHC_U03_2 (675 bp).
* Lanes1-4: S Population, Lanes 5-8: V Population ** Lane codes: HC-High Cd, LC-Low Cd, HZ-high Zn, LZ-low Zn bulked DNA + Lane 9: Ladder (L) with base pair (bp) fragment size
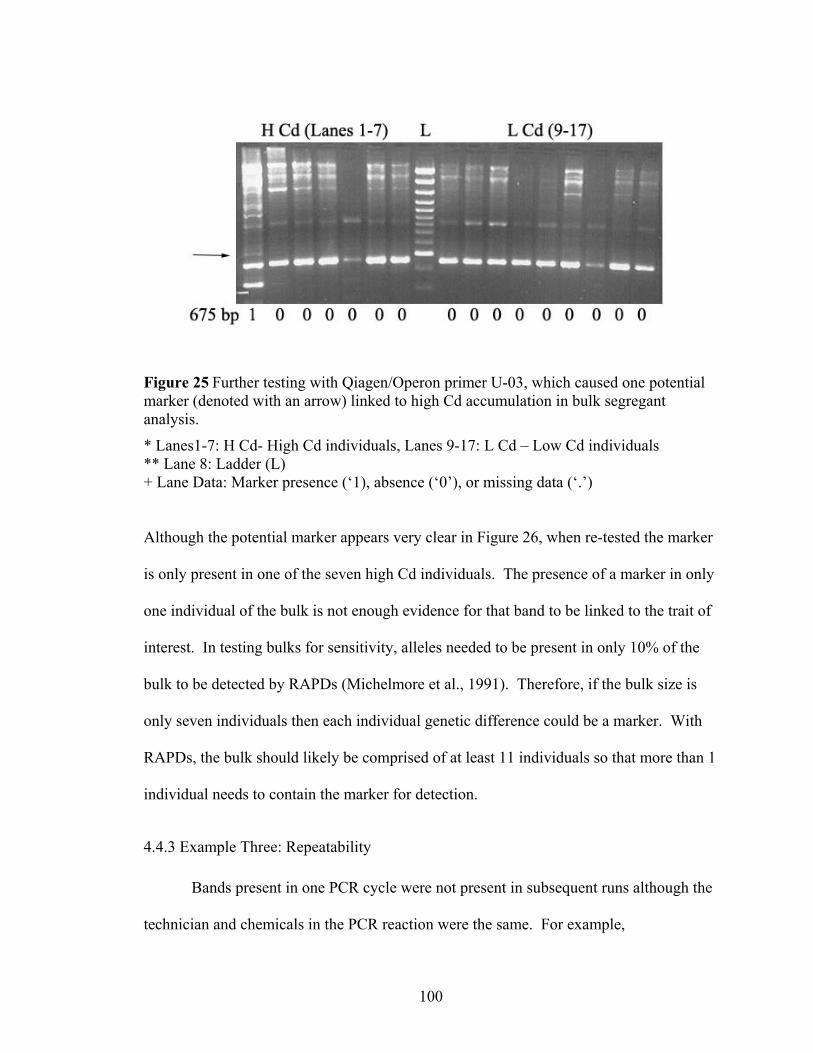
100
Figure 25 Further testing with Qiagen/Operon primer U-03, which caused one potential marker (denoted with an arrow) linked to high Cd accumulation in bulk segregant analysis.
* Lanes1-7: H Cd- High Cd individuals, Lanes 9-17: L Cd – Low Cd individuals ** Lane 8: Ladder (L) + Lane Data: Marker presence (‘1), absence (‘0’), or missing data (‘.’) Although the potential marker appears very clear in Figure 26, when re-tested the marker
is only present in one of the seven high Cd individuals. The presence of a marker in only
one individual of the bulk is not enough evidence for that band to be linked to the trait of
interest. In testing bulks for sensitivity, alleles needed to be present in only 10% of the
bulk to be detected by RAPDs (Michelmore et al., 1991). Therefore, if the bulk size is
only seven individuals then each individual genetic difference could be a marker. With
RAPDs, the bulk should likely be comprised of at least 11 individuals so that more than 1
individual needs to contain the marker for detection.
4.4.3 Example Three: Repeatability
Bands present in one PCR cycle were not present in subsequent runs although the
technician and chemicals in the PCR reaction were the same. For example,
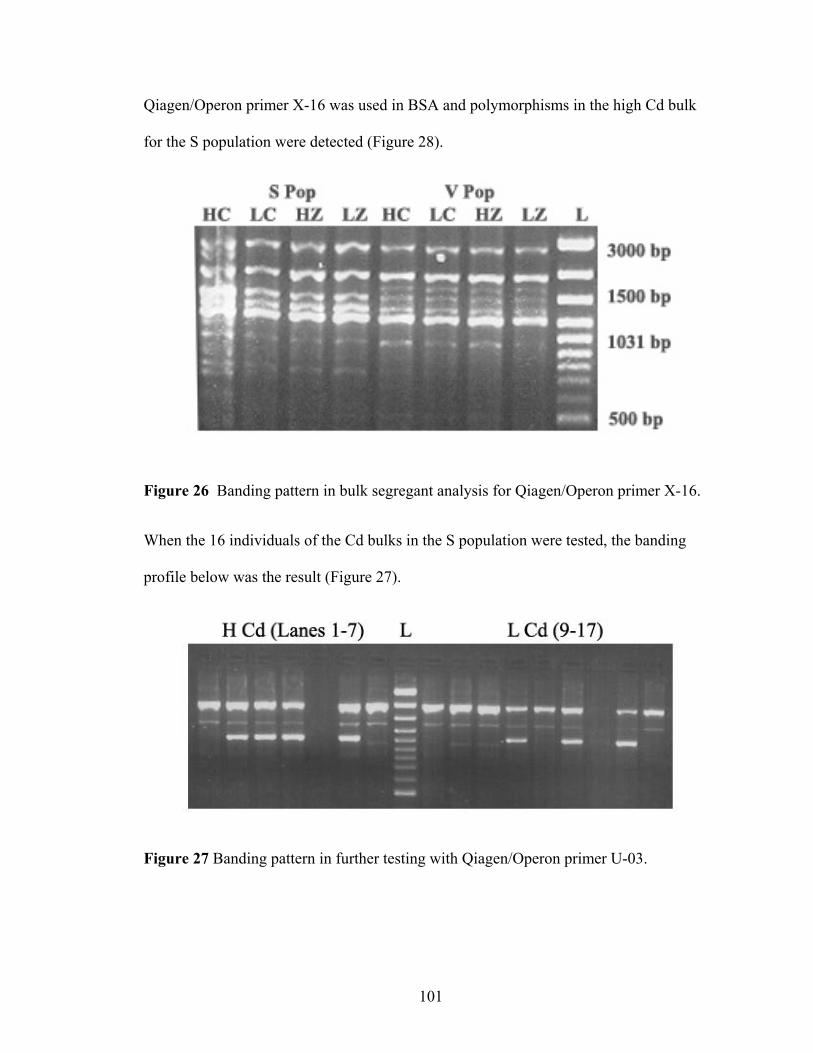
101
Qiagen/Operon primer X-16 was used in BSA and polymorphisms in the high Cd bulk
for the S population were detected (Figure 28).
Figure 26 Banding pattern in bulk segregant analysis for Qiagen/Operon primer X-16.
When the 16 individuals of the Cd bulks in the S population were tested, the banding
profile below was the result (Figure 27).
Figure 27 Banding pattern in further testing with Qiagen/Operon primer U-03.
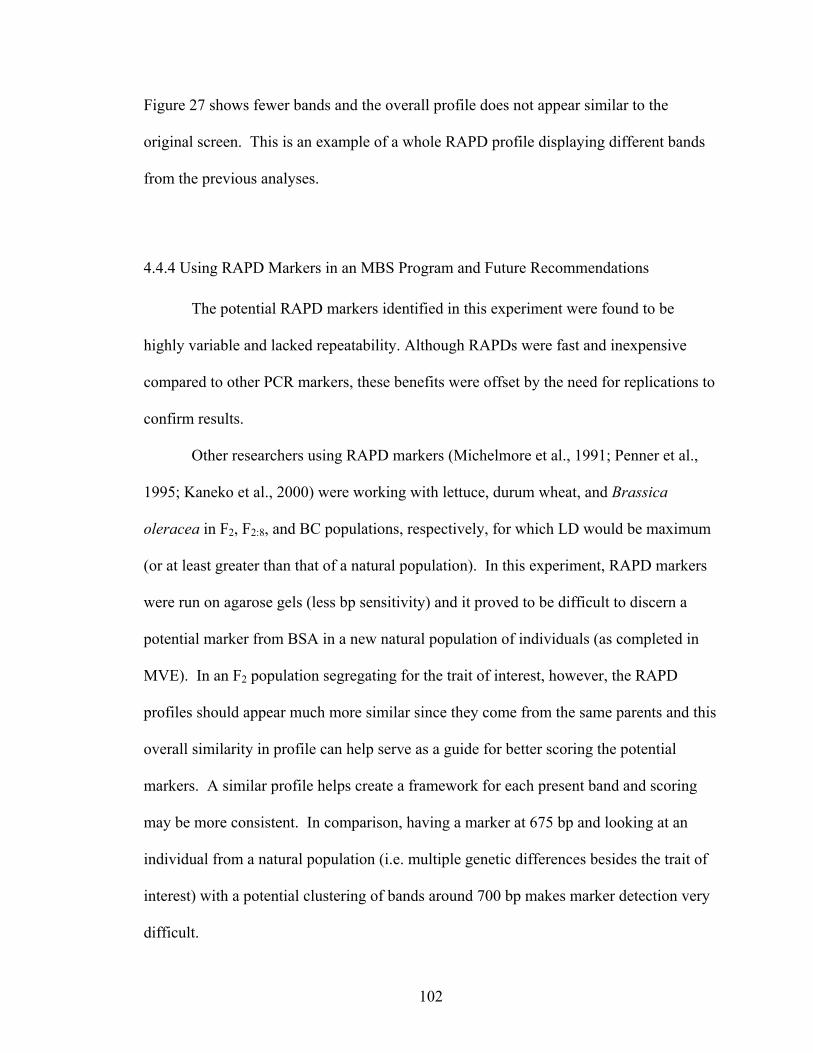
102
Figure 27 shows fewer bands and the overall profile does not appear similar to the
original screen. This is an example of a whole RAPD profile displaying different bands
from the previous analyses.
4.4.4 Using RAPD Markers in an MBS Program and Future Recommendations
The potential RAPD markers identified in this experiment were found to be
highly variable and lacked repeatability. Although RAPDs were fast and inexpensive
compared to other PCR markers, these benefits were offset by the need for replications to
confirm results.
Other researchers using RAPD markers (Michelmore et al., 1991; Penner et al.,
1995; Kaneko et al., 2000) were working with lettuce, durum wheat, and Brassica
oleracea in F2, F2:8, and BC populations, respectively, for which LD would be maximum
(or at least greater than that of a natural population). In this experiment, RAPD markers
were run on agarose gels (less bp sensitivity) and it proved to be difficult to discern a
potential marker from BSA in a new natural population of individuals (as completed in
MVE). In an F2 population segregating for the trait of interest, however, the RAPD
profiles should appear much more similar since they come from the same parents and this
overall similarity in profile can help serve as a guide for better scoring the potential
markers. A similar profile helps create a framework for each present band and scoring
may be more consistent. In comparison, having a marker at 675 bp and looking at an
individual from a natural population (i.e. multiple genetic differences besides the trait of
interest) with a potential clustering of bands around 700 bp makes marker detection very
difficult.
103
Another significant drawback of the project was that the metal accumulation in
the biomass for the MVE could not be determined due to plant death, and significant
marker association was determined based on χ2 analysis. Meaningful QTL detection
hinges on estimates of the phenotype means and variation for a specific marker genotype.
Given the circumstances, the χ2 analysis was the best way to handle the genomic data,
however, not ideal.
Further, QTL detection is most accurate when completed in large and genetically
independent populations, with multiple replications and environments (Young, 1999). In
fact, even when detecting QTL in a population of 100-200 individuals, with heritabilities
between 60-90%, only three to six QTL can be uncovered (Young, 1999). Considering
that the population used in this experiment was less than 100 individuals and the
heritabilities for the traits of interest were less than .60 (Table 3), it was not likely that
any significant markers would be detected, and these markers may be false positive
results. In his review of MAS with QTL, Young (1999) states that recognizing small
mapping populations are not adequate for QTL detection is the most important realization
needed in the scientific community.
In summary, the marker association analysis would have been improved by using
a co-dominant marker in an experimental population (where LD is a maximum) with at
least 500 individuals. However, it is important to recognize feasibility and limitations of
material and resources and design within these boundaries. Some of the greatest
limitations are the slow growth rate, generation time, and difficulty in forcing crosses
with T. caerulescens. This creates significant time limitations. Given the current
availability of material and resources the following experimental design may have
104
resulted in quality, significant marker association. Foremost, use a marker system that is
repeatable and reliable. SSR libraries would be ideal since it is a co-dominant marker
and is PCR based. These libraries can be developed by an outside company and then
tested for polymorphisms within our own lab. Use of the tissue collected from a previous
experiment (Perner et al., in review), as well as samples from an independently run tissue
analysis experiment (either in a different soil or replication of the previous experiment or
both) so that at least 500 samples are considered. Collect the PCR data from the 500+
individuals. Analyze the data for QTL marker association using a sib-pair approach,
which is ideal for small family size but a large number of families (Liu, 1998). This
would still be the first experiment completed for an MBS selection program, and it is
recommended that the results be tested again in separate germplasm and environments
before becoming the basis for an MBS program (Young, 1999).
105
5.0 Conclusion The main objective of the experiments presented here was to explore different
considerations necessary to begin a breeding program for improving Cd and Zn
phytoextraction within two promising populations of T. caerulescens. Because T.
caerulescens can hyperaccumulate Cd and Zn from contaminated soil, it is desirable to
improve upon this ability to make phytoremediation an efficient alternative to traditional
soil remediation.
The first experiment was designed to determine the mode of pollination and
original genetic structure of the two natural populations of T. caerulescens that are
considered to be “super-hyperaccumulators” , as well as develop estimates for genetic
parameters useful for developing plant breeding programs. These populations of T.
caerulescens appear to be predominantly inbred with some degree of outcrossing. The
significant regression relationship between the Cd phenotypic variability and genetic
variability suggests that Cd hyperaccumulation is genetically influenced and could be
genetically improved through a breeding program. Heritability estimates for both Cd and
Zn appear promising, and extrapolation of selection schemes also suggests that breeding
with selection would produce plants that should remove more Cd in a given amount of
time than without selection. All of these results suggest that the two southern France
populations of T. caerulescens are promising germplasm to use for a breeding program.
The second experiment was designed to detect markers that may be linked to Cd
and Zn hyperaccumulation by BSA. Any polymorphisms between bulks were considered
to be potential hyperaccumulation markers and 102 potential loci were detected. Since
there is a prevalence of false positives (Liu, 1998), the third experiment was used to
106
eliminate these markers with statistical QTL detection methods. Due to excessive plant
mortality, alternative χ2 analyses were used to identify statistically significant Cd and Zn
linked markers in both the S and V population. However, based on the confounding of
problems that resulted from marker technology, experimental design of the bulks (ex.
size), and sample size for QTL detection, the statistically significant markers could not be
reliably used for MBS at this stage. This does not, however, mean that the traits for Cd
and Zn cannot still be selected for using a marker based technology. Further, the two
populations examined are valuable germplasm in which the Cd and Zn
hyperaccumulation ability could be exploited in a selective breeding program.
107
REFERENCES Alloway, B.J., and E. Steinnes. 1999. Anthropogenic additions of cadmium to soils, p. 97-123, In M. J. McLaughlin and B. R. Singh, eds. Kluwer Academic Publishers, Boston. Asia Rice Foundation www.asiarice.org (posted August 27, 2003; verified September 20, 2003). Assuncao, A.G.L., P. Da Costa Martins, S. De Folter, R. Vooijs, H. Schat, and M.G.M. Aarts. 2001. Elevated expression of metal transporter genes in three accessions of the metal hyperaccumulator Thlaspi caerulescens. Plant, Cell and Environment 24:217-226. Assuncao, A.G.L., W.M. Bookum, N.H. J.M., R. Vooijs, H. Schat, and W.H.O. Ernst. 2003a. A cosegregation analysis of zinc (Zn) accumulation and Zn tolerance in the Zn hyperaccumulator Thlaspi caerulescens. New Phytol 159:383-390. Assuncao, A.G.L., W.M. Bookum, H.J.M. Nelissen, R. Vooijs, H. Schat, and W.H.O. Ernst. 2003b. Differential metal-specific tolerance and accumulation patterns among Thlaspi caerulescens populations originating from different soil types. New Phytol 159:411-419. Assuncao, A.G.L., H. Schat, and M.G.M. Aarts. 2003c. Thlaspi caerulescens, an attractive model species to study heavy metal hyperaccumulation in plants. New Phytol 159:351-360. Baker, A.J.M., and R.R. Brooks. 1989. Terrestial higher plants which hyperaccumulate metallic elements - A review of their distribution, ecology, and phytochemistry. Biorecovery 1:81-126. Baker, A.J.M., R.D. Reeves, and S.P. McGrath. 1991. In situ decontamination of heavy metal polluted soils using crops of metal-accumulating plants - A feasibility study., p. 600-605, In R. L. Hinchess and R. F. Olfenbuttel, eds. In situ bioreclamation. Butterworth-Heinemann, Boston, MA. Baker, A.J.M., S.P. McGrath, R.D. Reeves, and J.A.C. Smith. 2000. Metal hyperaccumulator plants: a review of the ecology and physiology of a biological resource for phytoremediation of metal-polluted soils, p. 171-188, In N. Terry and G. Banuelos, eds. Phytoremediation of contaminated soils and water. CRC Press LLC, Boca Raton, Fl. Bernardo, R. 2002. Breeding for Quantitative Traits in Plants Stemma Press, Woodbury, Minnesota. Bert, V., P. Meerts, P. Saumitou-Laprade, P. Salis, W. Gruber, and N. Verbruggen. 2003. Genetic basis of Cd tolerance and hyperaccumulation in Arabidopsis halleri. Plant and Soil 249:9-18.
108
Boyd, R.S., and S.N. Martens. 1992. The raison d'etre for metal hyperaccumulation by plants, p. 279-289, In A. J. M. Baker, et al., eds. The Vegetation of Ultramafic (Serpentine) Soils. Intercept Ltd., Andover. Brewer, E.P., J.A. Saunders, J.A. Angle, R.L. Chaney, and M.S. McIntosh. 1999. Somatic hybridization between the zinc accumulator Thlaspi caerulescens and Brassica napus. Theor. Appl. Genetics 99:761-771. Brooks, R.R., J. Lee, R.D. Reeves, and T. Jaffrre. 1977. Detection of nickeliferous rocks by analysis of herbarium specimens of indicator plants. Journal of Geochemical Exploration 7:49-57. Brown, S.L., R.L. Chaney, J.A. Angle, and A.J.M. Baker. 1995. Zinc and Cadmium Uptake by the Hyperaccumulator Thlaspi caerulescens Grown in Nutrient Solution. Soil Science Society of America Journal 59:125-133. Chaney, R.L. 1983. Plant uptake of inorganic waste constiuents, p. 50-76, In J. F. Parr, ed. Land treatment of hazardous wastes. Noyes Data Corp., Park Ridge, NJ. Chaney, R.L., J.A. Ryan, Y.-M. Li, R.M. Welch, P.G. Reeves, S.L. Brown, and C.E. Green. 1996. Phyto-availability and bio-availabitity in risk assessment for cadmium in agricultural environments, p. 49-78 Sources of Cadmium in the Environment. OECD, Paris, France. Chaney, R.L., J.A. Ryan, Y.-M. Li, and S.L. Brown. 1998. Soil cadmium as a threat to human health, p. 219-256, In M. J. McLaughlin and B. R. Singh, eds. Cadmium in Soils, Plants, and the Food Chain. Kluwer Academic Publishers, Dordrecht. Chaney, R.L., and F. Zoepfl. 1998. Sowing the Seeds for Renewable Energy, Soil Remediation, and Resource Recovery: A Conceptual Summary. Chaney, R.L., P.G. Reeves, and J.A. Angle. 2001a. Rice Plant Nutritional and Human Nutritional Characteristics Roles in Human Cd Toxicity, p. 288-289, In W. J. Horst, ed. Proc. Internation Plant Nutrition Colloquium, Hanover, Germany, 2001. Chaney, R.L., S.L. Brown, T.I. Stuczynski, W.L. Daniels, C.L. Henry, Y.-M. Li, G. Siebielec, M. Malik, J.A. Angle, J.A. Ryan, and H. Compton. 2001b. Risk Assessment and Remediation of Soils Contaminated by Mining and Smelting of Lead, Zinc, and Cadmium. Rev. Int. Contam. Ambient 16:175-192. Chaney, R.L., J.A. Ryan, Y.-M. Li, and J.A. Angle. 2001c. Transfer of cadmium through plants to the food chain, In J. K. Syers and M. Gochfeld, eds. Proceedings Workshop "Environmental Cadmium in the Food Chain: Sources, Pathways, and Risks." Brussels, Belgium, 2000.
109
Cheung, W.Y., R.K. Gugel, and B.S. Landry. 1998. Identification of RFLP markers linked to the white rust resistance gene (Acr) in mustard (Brassic juncea (L.) Czern. and Coss.). Genome 41:626-628. Clemens, S., M.G. Palmgren, and U. Kraemer. 2002. A long way ahead: understanding and engineering plant metal accumulation. Trends in Plant Science 7:309-315. Cobbett, C.S. 2000. Phytochelatins and Their Roles in Heavy Metal Detoxification. Plant Physiol. 123:825-832. Collins, R.N., G. Merrington, M.J. McLaughlin, and J.L. Morel. 2003. Organic Ligand and pH Effects on Isotopically Exchangeable Cadmium in Polluted Soils. Soil Science Society of America Journal 67:112-121. Delorme, T.A., J.V. Gagliardi, J.S. Angle, and R.L. Chaney. 2001. Influence of the zinc hyperaccumulator Thlaspi caerulescens J.&C. Presl. and the nonmetal accumulator Trifolium pratense L. on soil microbial populations. Can. J. Bot 47:773-776. Dong, W.Q.Y., Y. Cui, and X. Liu. 2001. Instances of Soil and Crop Heavy Metal Contamination in China. Soil and Sediment Contamination 10:497-510. Dubois, S., P.-O. Cheptou, C. Petit, P. Meerts, M. Poncelet, X. Vekemans, C. Lefebvre, and J. Escarre. 2003. Genetic structure and mating systems of metallicolous and nonmetallicolous populations of Thlaspi caerulescens. New Phytol 157:633-641. Dushenkov, S., M. Skarzhinskaya, K. Glimelius, D. Gleba, and I. Raskin. 2002. Bioengineering of a Phytoremediation Plant by Means of Somatic Hybridization. International Journal of Phytoremediation 4:117-126. Ebbs, S.D., M.M. Lasat, D.J. Brady, J. Cornish, R. Gordon, and L.V. Kochian. 1997. Phytoextraction of cadmium and zinc from a contaminated soil. J. Environ. Quality 26:1424-1430. Ebbs, S., I. Lau, B. Ahner, and L. Kochian. 2002. Phytochelatin synthesis is not responsible for Cd tolerance in the Zn/Cd hyperaccumulator Thlaspi caerulescens (J. & C. Presl). Planta 214:635-640. Escarre, J., C. Lefebvre, W. Gruber, M. LeBlanc, J. Lepart, Y. Riviere, and B. Delay. 2000. Zinc and cadmium hyperaccumulation by Thlaspi caerulescens from metalliferous and nonmetalliferous sites in the Mediterranean area: implications for phytoremediation. New Phytol 145:429-437. Falconer, D.S., and T.F.C. Mackay. 1996. Introduction to Quantitative Genetics Pearson Education, Harlow. Fehr, W.R. 1987. Principles of Cultivar Development McGraw-Hill, Inc., United States.
110
Frerot, H., C. Petit, C. Lefebvre, W. Gruber, C. Collin, and J. Escarre. 2003. Zinc and cadmium accumulation in controlled crosses between metallicolous and nonmetallicolous populations of Thlaspi caerulescens (Brassicaceae). New Phytol 157:643-648. Hammer, D., and C. Keller. 2002. Changes in the Rhizosphere of Metal Accumulating Plants Evidenced by Chemical Extractants. J. Environ. Quality 31:1561-1569. Gepts, P. 2002. A Comparison between Crop Domestication, Classical Plant Breeding, and Genetic Engineering. Crop Science 42:1780-1790. Glass, D.J. 1999. Current Market Trends in Phytoremediation. International Journal of Phytoremediation 1:1-8. Gove, B., J.J. Hutchison, S.D. Young, J. Craigon, and S.P. McGrath. 2002. Uptake of Metals by Plants Sharing a Rhizosphere with the Hyperaccumulator Thlaspi caerulescens. International Journal of Phytoremediation 4:267-281. Grotz, N., T. Fox, E. Connolly, W. Park, M.L. Guerinot, and D. Eide. 1998. Identification of a family of zinc transporter genes from Arabidopsis that respond to zinc deficiency. Proceedings of the National Acadmey of Sciences 95:7220-7224. Haines, B.J. 2002. Zincophilic root foraging in Thlaspi caerulescens. New Phytol 155:363-372. Hammer, D., and C. Keller. 2002. Changes in the Rhizosphere of Metal Accumulating Plants Evidenced by Chemical Extractants. J. Environ. Quality 31:1561-1569. Hamrick, J.L., and M.J.W. Godt. 1996. Effects of life history traits on genetic diversity in plant species. Philos. Trans. R. Soc. Lond. B Biol. Sci. 351:1291-1298. Hanlon, E.A., B.L. McNeal, and G. Kidder. 2002. Soil and Container Media Electrical Conductivity Interpretations Circular 1092 [Online]. Available by Soil and Water Science Department, Florida Cooperative Extension Service, Institute of Food and Agricultural Sciences, University of Florida hhtp://edis.ifas.ufl.edu/BODY_SS117. Higgins, M. 2000. Cadmium puts Rocky Mountain wildlife at risk [Online]. Available by Environmental News Network www.enn.com/news/enn-stories/2000/07/07132000/cadmium_14712.asp?P=1 (verified September 15, 2003). Ingrouille, M.J., and N. Smirnoff. 1986. Thlaspi caerulescens J.&C. Presl. (Thlaspi alpestre L.) in Britain. The New Phytologist 102:219-233. Jain, S.K. 1976. The evolution of inbreeding in plants. Annual Review of Ecology and Systematics 7:469-495.
111
Kaneko, Y., S.W. Bang, and Y. Matsuzawa. 2000. Early-bolting trait and RAPD markers in the specific monosomic addition line of the radish carrying the e-chromosome of Brassica oleracea. Plant Breeding 119:137-140. Koch, M., K. Mummenhoff, and H. Hurka. 1998. Systematics and evolutionary history of heavy metal tolerant Thlaspi caerulescens in Western Europe: evidence from genetic studies based on isozyme analysis. Biochemical Systematics and Ecology 26:823-838. Kraemer, U., J.D. Cotter-Howells, J.M. Charnock, A.J.M. Baker, and J.A.C. Smith. 1996. Free histidine as a metal chelator in plants that accumulate nickel. Nature 379:635-638. Li, G., and C.F. Quiros. 2001. Sequence-related amplified polymorphism (SRAP), a new marker system based on a simple PCR reaction: its application to mapping and gene tagging in Brassica. Theor. Appl. Genetics 103:455-461. Liu, B.H. 1998. Statistical Genomics CRC Press LLC, Boca Raton, Florida. Lodewyckx, C., M. Mergeay, J. Vangronsveld, H. Clijsters, and D. van der Lelie. 2002. Isolation, Characterization, and Identification of Bacteria Associated with the Zinc Hyperaccumulator Thlaspi caerulescens subsp. calaminaria. International Journal of Phytoremediation 4:101-115. Lombi, E., F.J. Zhao, S.J. Dunham, and S.P. McGrath. 2000. Cadmium accumulation in populations of Thlaspi caerulescens and Thlaspi goesingense. New Phytol 145:11-20. Lombi, E., F.J. Zhao, S.P. McGrath, S.D. Young, and G.A. Sacchi. 2001a. Physiological evidence for a high-affinity cadmium transporter highly expressed in a Thlaspi caerulescens ecotype. The New Phytologist 149:53-60. Lombi, E., F.J. Zhao, S.J. Dunham, and S.P. McGrath. 2001b. Phytoremediation of Heavy Metal-Contaminated Soils: Natural Hyperaccumulation versus Chemically Enhanced Phytoextraction. J. Environ. Quality 30:1919-1926. Lombi, E., K.L. Tearall, J.R. Howarth, F.J. Zhao, M.J. Hawkesford, and S.P. McGrath. 2002. Influence of Iron Status on Cadmium and Zinc Uptake by Different Ecotypes of the Hyperaccumulator Thlaspi caerulescens. Plant Physiol. 128:1359-1367. Luo, Y.M., P. Christie, and A.J.M. Baker. 2000. Soil Solution Zn and pH dynamics in non-rhizosphere soil and in the rhizosphere of Thlaspi caerulescens grown in a Zn/Cd-contaminated soil. Chemosphere 41:161-164. McGrath, S.P., C.M.D. Sidoli, A.J.M. Baker, and R.D. Reeves. 1993. The Potential for the use of Metal-Accumulating Plants for the In Situ Decontamination of Metal-Polluted Soils, p. 673-676, In H. J. P. Eijsackers and T. Hamers, eds. Integrated Soil and Sediment Research: A Basis for Proper Protection. Kluwer Academic Publishers, Netherlands.
112
McGrath, S.P., S.J. Dunham, and R.L. Correll. 2000. Potential for Phytoextractions of Zinc and Cadmium from Soils Using Hyperaccumulator Plants, p. 109-128, In N. Terry and G. Banuelos, eds. Phytoremediation of Contaminated Soil and Water. CRC Press LLC, Boca Raton, Fl. McLaughlin, M.J. and R. J. Henderson. 1999. Effect of zinc and copper on cadmium uptake by Thlaspi caerulescens and Cardaminopsis halleri, p. 886-887 In Proc. 5th International Conference on the Biogeochemistry of Trace Elements. Vienna, Austria, July 1999. Michael, M. 2003. New Company Employs Plants for Soil Remediation. Maryland Research 3(2):24. Michelmore, R.W., I. Paran, and R.V. Kesseli. 1991. Identification of markers linked to disease resistance genes by bulked segregant analysis: A rapid method to detect markers in specific genomic regions by using segregating populations. PNAS 88:9828-9832. Macnair, M.R. 1993. The genetics of metal tolerance in vascular plants. New Phytol 124:541-559. Macnair, M.R., V. Bert, S.B. Huitson, P. Saumitou-Laprade, and D. Petit. 1999. Zinc tolerance and hyperaccumulation are genetically independent characters. Proc. R. Soc. Lond. B 266:2175-2179. Macnair, M.R., G.H. Tilstone, and S.E. Smith. 2000. The Genetics of Metal Tolerance and Accumulation in Higher Plants, p. 235-250, In N. Terry and G. Banuelos, eds. Phytoremediation of Contaminated Soil and Water. CRC Press LLC, Boca Raton, Fl. Macnair, M.R. 2002. Within and between population generic variation for zinc accumulation in Arabidopsis halleri. New Phytologist 155:59-66. Moeller, D.A., and B.A. Schaal. 1999. Genetic relationships among Native American maize accessions of the Great Plains assessed by RAPDs. Theor. Appl. Genetics 99:1061-1067. Peer, W.A., M. Mamoudian, B. Lahner, R.D. Reeves, A. Murphy, and D.E. Salt. 2003. Identifying model metal hyperaccumulating plants: germplasm analysis of 20 Brassicaceae accessions from a wide geopgraphical area. New Phytol 159:421-430. Pence, N.S., P.B. Larsen, S.D. Ebbs, D.L.D. Letham, M.M. Lasat, D.F. Garvin, D. Eide, and L.V. Kochian. 2000. The molecular physiology of heavy metal transport in the Zn/Cd hyperaccumulator Thlaspi caerulescens. Proceedings of the National Acadmey of Sciences 97:4956-4960.
113
Penner, G.A., J. Clarke, L.J. Bezte, and D. Leisle. 1995. Identification of RAPD markers linked to a gene governing cadmium uptake in durum wheat. Genome 38:543-547. Perner, H., R.L. Chaney, R.D. Reeves, V. Romheld, M.S. McIntosh, J.A. Angle, and A.J.M. Baker. Variation in Cd- and Zn-Accumulation by French Genotypes of Thlaspi caerulescens J. & C. Presl. Grown on a Cd and Zn Contaminated Soil. pending publication. Plachy, J. 1998. Cadmium [Online]. Available by USGS http://minerals.usgs.gov/minerals/pubs/commodity/cadmium/140798.pdf (verified September 20, 2003). Pollard, A.J., and A.J.M. Baker. 1996. Quantitative genetics of zinc hyperaccumulation in Thlaspi caerulescens. The New Phytologist 132:113-118. Pollard, A.J., K.D. Powell, F.A. Harper, and J.A.C. Smith. 2002. The Genetic Basis of Metal Hyperaccumulation in Plants. Critical Reviews in Plant Sciences 21:539-566. Qiagen/Operon. 2001. DNeasy Plant Mini Kit Handbook Qiagen/Operon. Reeves, R.D., C. Schwartz, J.L. Morel, and J. Edmonson. 2001. Distribution and Metal-Accumulating Behavior of Thlaspi caerulescens and Associated Metallophytes in France. International Journal of Phytoremediation 3:145-172. Riley, R. 1956. The influence of the breeding system on the genecology of Thlaspi alpestre L. New Phytol:55:319-330. Roosens, N., N. Verbruggen, P. Meerts, P. Ximenez-Embun, and J.A.C. Smith. 2003. Natural variation in cadmium tolerance and its relationship to metal hyperaccumulation for seven populations of Thlaspi caerulescens from western Europe. Plant, Cell and Environment 26:1657-1672. SAS Insitute Inc. 2000. SAS. Release 8.0. SAS Insitute Inc. Schat, H., R. Vooijs, and E. Kuiper. 1996. Identical major gene loci for heavy-metal tolerance that have independently evolved in different local-populations and subspecies of Silene vulgaris. Evolution 50:1888-1895. Simmons, R.W., P. Pongsakul, R.L. Chaney, D. Saiyasitpanich, S. Klinphoklap, and W. Nobuntou. 2003. The relative exclusion of zinc and iron from rice grain in relation to rice grain cadmium as compared to soybean: Implications for human health. Plant and Soil 257:163-170. Terry, L.I., K. Chase, T. Jarvik, J. Orf, L. Mansur, and K.G. Lark. 2000. Soybean Quantitative Trait Loci for Resistance to Insects. Crop Science 40:375-382.
114
USGS ‘Cadmium Statistics and Information’ [Online]. Available at http://minerals.usgs.gov/minerals/pubs/commodity/cadmium/ (posted July 29, 2003; verified September 20, 2003). van der Zaal, B.J., L.W. Neuteboom, J.E. Pinas, A.N. Chardonnens, H. Schat, J.A.C. Verkleij, and P.J.J. Hooykaas. 1999. Overexpression of a Novel Arabidopsis Gene Related to Putative Zinc-Transporter Genes from Animals Can Lead to Enhanced Zinc Resistance and Accumulation. Plant Physiol. 119:1047-1055. Whiting, S.N., J.R. Leake, S.P. McGrath, and A.J.M. Baker. 2000. Positive responses to Zn and Cd by roots of the Zn and Cd hyperaccumulator Thlaspi caerulescens. The New Phytologist 145:199-210. Whiting, S.N., J.R. Leake, S.P. McGrath, and A.J.M. Baker. 2001a. Hyperaccumulation of Zn by Thlaspi caerulescens Can Ameliorate Zn Toxicity in the Rhizosphere of Cocropped Thlaspi arvense. Environmental Science and Technology 35:3237-3241. Whiting, S.N., M.P. De Souza, and N. Terry. 2001b. Rhizosphere Bacteria Mobilize Zn Hyperaccumulation by Thlaspi caerulescens. Environmental Science and Technology 35:3144-3150. Yeh, F.C., R.C. Yang, T.J.B. Boyle, Z.H. Ye, and J.X. Mao. 1997. Popgene, the user friendly shareware for population genetic analysis [Online]. Available by Molecular Biology and Biotechnology Centre, University of Alberta. Young, N.D. 1999. A cautiously optimistic vision for marker-assisted breeding. Molecular Breeding 5:505-510. Zhao, F.J., R.E. Hannon, and M.J. McLaughlin. 2001. Root exudates of the hyperaccumulator Thlaspi caerulescens do not enhance metal mobilization. New Phytologist 151:613-620. Zhao, F.J., R.E. Hamon, E. Lombi, M.J. McLaughlin, and S.P. McGrath. 2002. Characteristics of cadmium uptake in two contrasting ecotypes of the hyperaccumulator Thlaspi caerulescens. Journal of Experimental Botany 53:535-543.
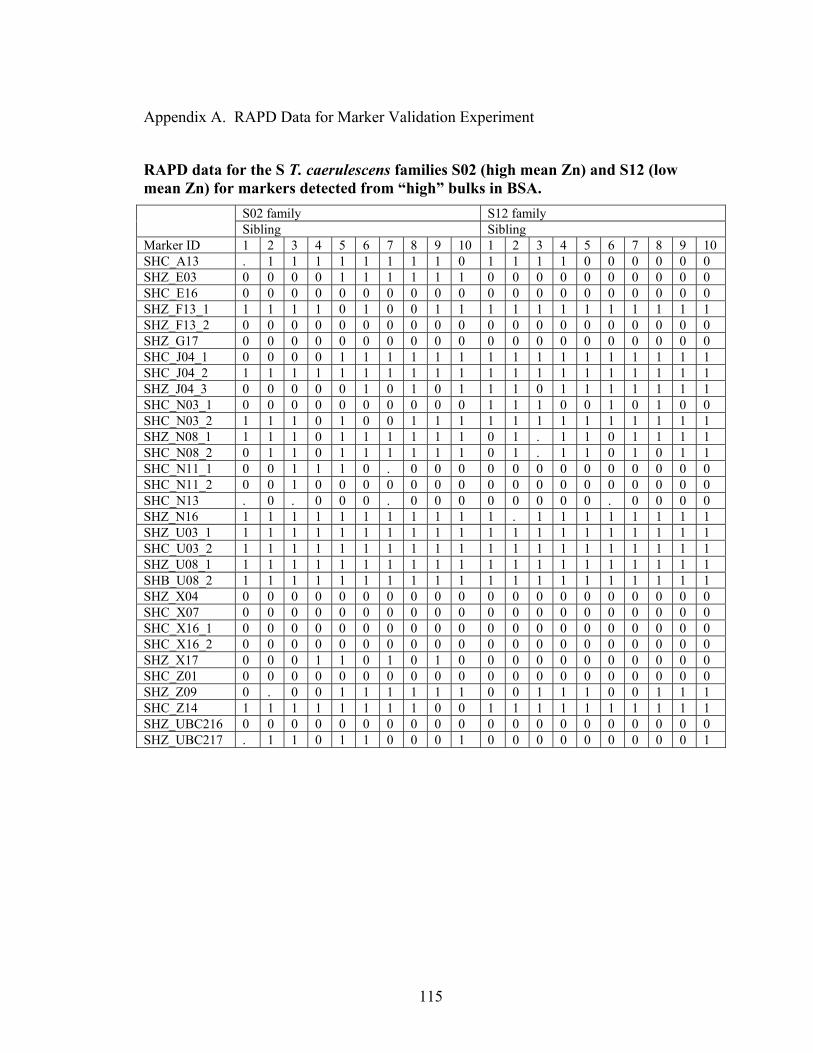
115
Appendix A. RAPD Data for Marker Validation Experiment
RAPD data for the S T. caerulescens families S02 (high mean Zn) and S12 (low mean Zn) for markers detected from “high” bulks in BSA.
S02 family S12 family Sibling Sibling Marker ID 1 2 3 4 5 6 7 8 9 10 1 2 3 4 5 6 7 8 9 10 SHC_A13 . 1 1 1 1 1 1 1 1 0 1 1 1 1 0 0 0 0 0 0 SHZ_E03 0 0 0 0 1 1 1 1 1 1 0 0 0 0 0 0 0 0 0 0 SHC_E16 0 0 0 0 0 0 0 0 0 0 0 0 0 0 0 0 0 0 0 0 SHZ_F13_1 1 1 1 1 0 1 0 0 1 1 1 1 1 1 1 1 1 1 1 1 SHZ_F13_2 0 0 0 0 0 0 0 0 0 0 0 0 0 0 0 0 0 0 0 0 SHZ_G17 0 0 0 0 0 0 0 0 0 0 0 0 0 0 0 0 0 0 0 0 SHC_J04_1 0 0 0 0 1 1 1 1 1 1 1 1 1 1 1 1 1 1 1 1 SHC_J04_2 1 1 1 1 1 1 1 1 1 1 1 1 1 1 1 1 1 1 1 1 SHZ_J04_3 0 0 0 0 0 1 0 1 0 1 1 1 0 1 1 1 1 1 1 1 SHC_N03_1 0 0 0 0 0 0 0 0 0 0 1 1 1 0 0 1 0 1 0 0 SHC_N03_2 1 1 1 0 1 0 0 1 1 1 1 1 1 1 1 1 1 1 1 1 SHZ_N08_1 1 1 1 0 1 1 1 1 1 1 0 1 . 1 1 0 1 1 1 1 SHC_N08_2 0 1 1 0 1 1 1 1 1 1 0 1 . 1 1 0 1 0 1 1 SHC_N11_1 0 0 1 1 1 0 . 0 0 0 0 0 0 0 0 0 0 0 0 0 SHC_N11_2 0 0 1 0 0 0 0 0 0 0 0 0 0 0 0 0 0 0 0 0 SHC_N13 . 0 . 0 0 0 . 0 0 0 0 0 0 0 0 . 0 0 0 0 SHZ_N16 1 1 1 1 1 1 1 1 1 1 1 . 1 1 1 1 1 1 1 1 SHZ_U03_1 1 1 1 1 1 1 1 1 1 1 1 1 1 1 1 1 1 1 1 1 SHC_U03_2 1 1 1 1 1 1 1 1 1 1 1 1 1 1 1 1 1 1 1 1 SHZ_U08_1 1 1 1 1 1 1 1 1 1 1 1 1 1 1 1 1 1 1 1 1 SHB_U08_2 1 1 1 1 1 1 1 1 1 1 1 1 1 1 1 1 1 1 1 1 SHZ_X04 0 0 0 0 0 0 0 0 0 0 0 0 0 0 0 0 0 0 0 0 SHC_X07 0 0 0 0 0 0 0 0 0 0 0 0 0 0 0 0 0 0 0 0 SHC_X16_1 0 0 0 0 0 0 0 0 0 0 0 0 0 0 0 0 0 0 0 0 SHC_X16_2 0 0 0 0 0 0 0 0 0 0 0 0 0 0 0 0 0 0 0 0 SHZ_X17 0 0 0 1 1 0 1 0 1 0 0 0 0 0 0 0 0 0 0 0 SHC_Z01 0 0 0 0 0 0 0 0 0 0 0 0 0 0 0 0 0 0 0 0 SHZ_Z09 0 . 0 0 1 1 1 1 1 1 0 0 1 1 1 0 0 1 1 1 SHC_Z14 1 1 1 1 1 1 1 1 0 0 1 1 1 1 1 1 1 1 1 1 SHZ_UBC216 0 0 0 0 0 0 0 0 0 0 0 0 0 0 0 0 0 0 0 0 SHZ_UBC217 . 1 1 0 1 1 0 0 0 1 0 0 0 0 0 0 0 0 0 1
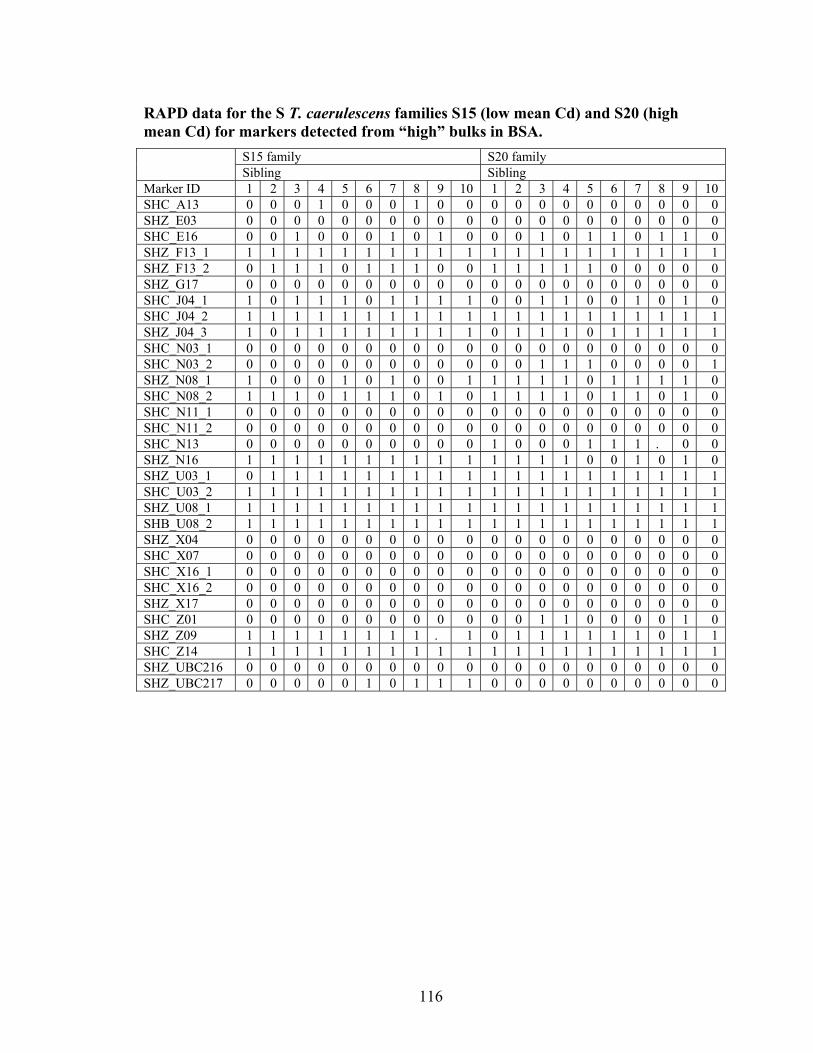
116
RAPD data for the S T. caerulescens families S15 (low mean Cd) and S20 (high mean Cd) for markers detected from “high” bulks in BSA.
S15 family S20 family Sibling Sibling Marker ID 1 2 3 4 5 6 7 8 9 10 1 2 3 4 5 6 7 8 9 10 SHC_A13 0 0 0 1 0 0 0 1 0 0 0 0 0 0 0 0 0 0 0 0 SHZ_E03 0 0 0 0 0 0 0 0 0 0 0 0 0 0 0 0 0 0 0 0 SHC_E16 0 0 1 0 0 0 1 0 1 0 0 0 1 0 1 1 0 1 1 0 SHZ_F13_1 1 1 1 1 1 1 1 1 1 1 1 1 1 1 1 1 1 1 1 1 SHZ_F13_2 0 1 1 1 0 1 1 1 0 0 1 1 1 1 1 0 0 0 0 0 SHZ_G17 0 0 0 0 0 0 0 0 0 0 0 0 0 0 0 0 0 0 0 0 SHC_J04_1 1 0 1 1 1 0 1 1 1 1 0 0 1 1 0 0 1 0 1 0 SHC_J04_2 1 1 1 1 1 1 1 1 1 1 1 1 1 1 1 1 1 1 1 1 SHZ_J04_3 1 0 1 1 1 1 1 1 1 1 0 1 1 1 0 1 1 1 1 1 SHC_N03_1 0 0 0 0 0 0 0 0 0 0 0 0 0 0 0 0 0 0 0 0 SHC_N03_2 0 0 0 0 0 0 0 0 0 0 0 0 1 1 1 0 0 0 0 1 SHZ_N08_1 1 0 0 0 1 0 1 0 0 1 1 1 1 1 0 1 1 1 1 0 SHC_N08_2 1 1 1 0 1 1 1 0 1 0 1 1 1 1 0 1 1 0 1 0 SHC_N11_1 0 0 0 0 0 0 0 0 0 0 0 0 0 0 0 0 0 0 0 0 SHC_N11_2 0 0 0 0 0 0 0 0 0 0 0 0 0 0 0 0 0 0 0 0 SHC_N13 0 0 0 0 0 0 0 0 0 0 1 0 0 0 1 1 1 . 0 0 SHZ_N16 1 1 1 1 1 1 1 1 1 1 1 1 1 1 0 0 1 0 1 0 SHZ_U03_1 0 1 1 1 1 1 1 1 1 1 1 1 1 1 1 1 1 1 1 1 SHC_U03_2 1 1 1 1 1 1 1 1 1 1 1 1 1 1 1 1 1 1 1 1 SHZ_U08_1 1 1 1 1 1 1 1 1 1 1 1 1 1 1 1 1 1 1 1 1 SHB_U08_2 1 1 1 1 1 1 1 1 1 1 1 1 1 1 1 1 1 1 1 1 SHZ_X04 0 0 0 0 0 0 0 0 0 0 0 0 0 0 0 0 0 0 0 0 SHC_X07 0 0 0 0 0 0 0 0 0 0 0 0 0 0 0 0 0 0 0 0 SHC_X16_1 0 0 0 0 0 0 0 0 0 0 0 0 0 0 0 0 0 0 0 0 SHC_X16_2 0 0 0 0 0 0 0 0 0 0 0 0 0 0 0 0 0 0 0 0 SHZ_X17 0 0 0 0 0 0 0 0 0 0 0 0 0 0 0 0 0 0 0 0 SHC_Z01 0 0 0 0 0 0 0 0 0 0 0 0 1 1 0 0 0 0 1 0 SHZ_Z09 1 1 1 1 1 1 1 1 . 1 0 1 1 1 1 1 1 0 1 1 SHC_Z14 1 1 1 1 1 1 1 1 1 1 1 1 1 1 1 1 1 1 1 1 SHZ_UBC216 0 0 0 0 0 0 0 0 0 0 0 0 0 0 0 0 0 0 0 0 SHZ_UBC217 0 0 0 0 0 1 0 1 1 1 0 0 0 0 0 0 0 0 0 0
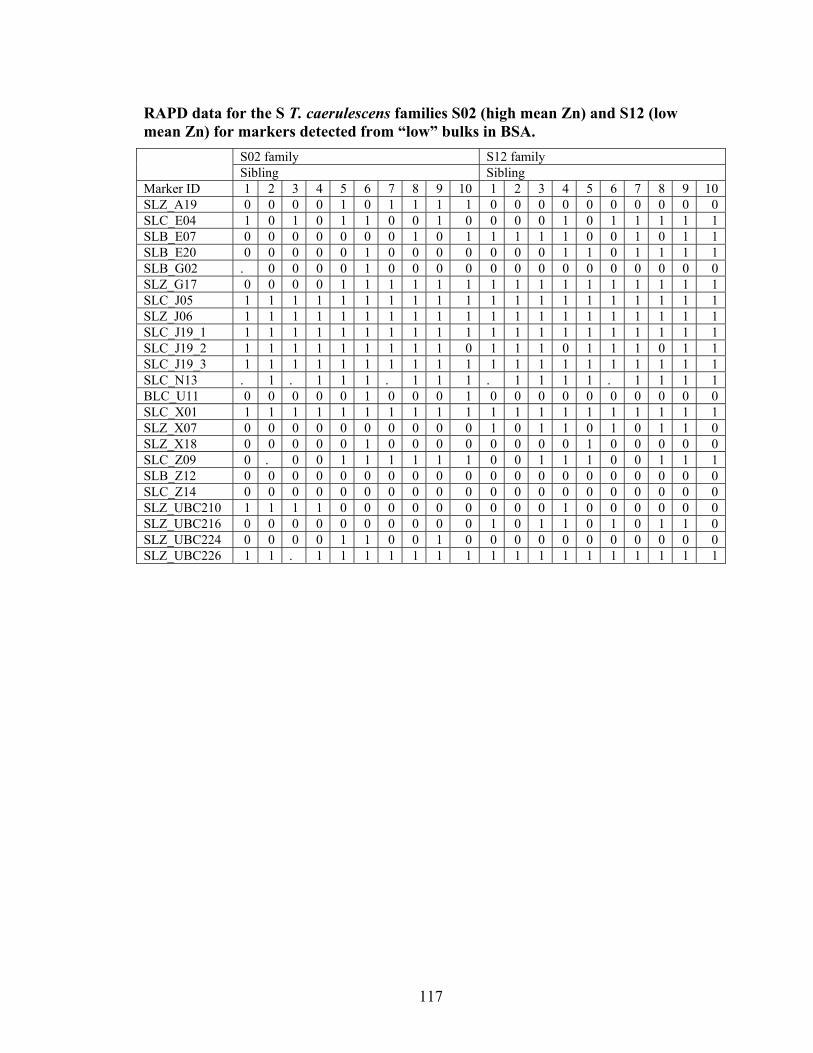
117
RAPD data for the S T. caerulescens families S02 (high mean Zn) and S12 (low mean Zn) for markers detected from “low” bulks in BSA.
S02 family S12 family Sibling Sibling Marker ID 1 2 3 4 5 6 7 8 9 10 1 2 3 4 5 6 7 8 9 10 SLZ_A19 0 0 0 0 1 0 1 1 1 1 0 0 0 0 0 0 0 0 0 0 SLC_E04 1 0 1 0 1 1 0 0 1 0 0 0 0 1 0 1 1 1 1 1 SLB_E07 0 0 0 0 0 0 0 1 0 1 1 1 1 1 0 0 1 0 1 1 SLB_E20 0 0 0 0 0 1 0 0 0 0 0 0 0 1 1 0 1 1 1 1 SLB_G02 . 0 0 0 0 1 0 0 0 0 0 0 0 0 0 0 0 0 0 0 SLZ_G17 0 0 0 0 1 1 1 1 1 1 1 1 1 1 1 1 1 1 1 1 SLC_J05 1 1 1 1 1 1 1 1 1 1 1 1 1 1 1 1 1 1 1 1 SLZ_J06 1 1 1 1 1 1 1 1 1 1 1 1 1 1 1 1 1 1 1 1 SLC_J19_1 1 1 1 1 1 1 1 1 1 1 1 1 1 1 1 1 1 1 1 1 SLC_J19_2 1 1 1 1 1 1 1 1 1 0 1 1 1 0 1 1 1 0 1 1 SLC_J19_3 1 1 1 1 1 1 1 1 1 1 1 1 1 1 1 1 1 1 1 1 SLC_N13 . 1 . 1 1 1 . 1 1 1 . 1 1 1 1 . 1 1 1 1 BLC_U11 0 0 0 0 0 1 0 0 0 1 0 0 0 0 0 0 0 0 0 0 SLC_X01 1 1 1 1 1 1 1 1 1 1 1 1 1 1 1 1 1 1 1 1 SLZ_X07 0 0 0 0 0 0 0 0 0 0 1 0 1 1 0 1 0 1 1 0 SLZ_X18 0 0 0 0 0 1 0 0 0 0 0 0 0 0 1 0 0 0 0 0 SLC_Z09 0 . 0 0 1 1 1 1 1 1 0 0 1 1 1 0 0 1 1 1 SLB_Z12 0 0 0 0 0 0 0 0 0 0 0 0 0 0 0 0 0 0 0 0 SLC_Z14 0 0 0 0 0 0 0 0 0 0 0 0 0 0 0 0 0 0 0 0 SLZ_UBC210 1 1 1 1 0 0 0 0 0 0 0 0 0 1 0 0 0 0 0 0 SLZ_UBC216 0 0 0 0 0 0 0 0 0 0 1 0 1 1 0 1 0 1 1 0 SLZ_UBC224 0 0 0 0 1 1 0 0 1 0 0 0 0 0 0 0 0 0 0 0 SLZ_UBC226 1 1 . 1 1 1 1 1 1 1 1 1 1 1 1 1 1 1 1 1
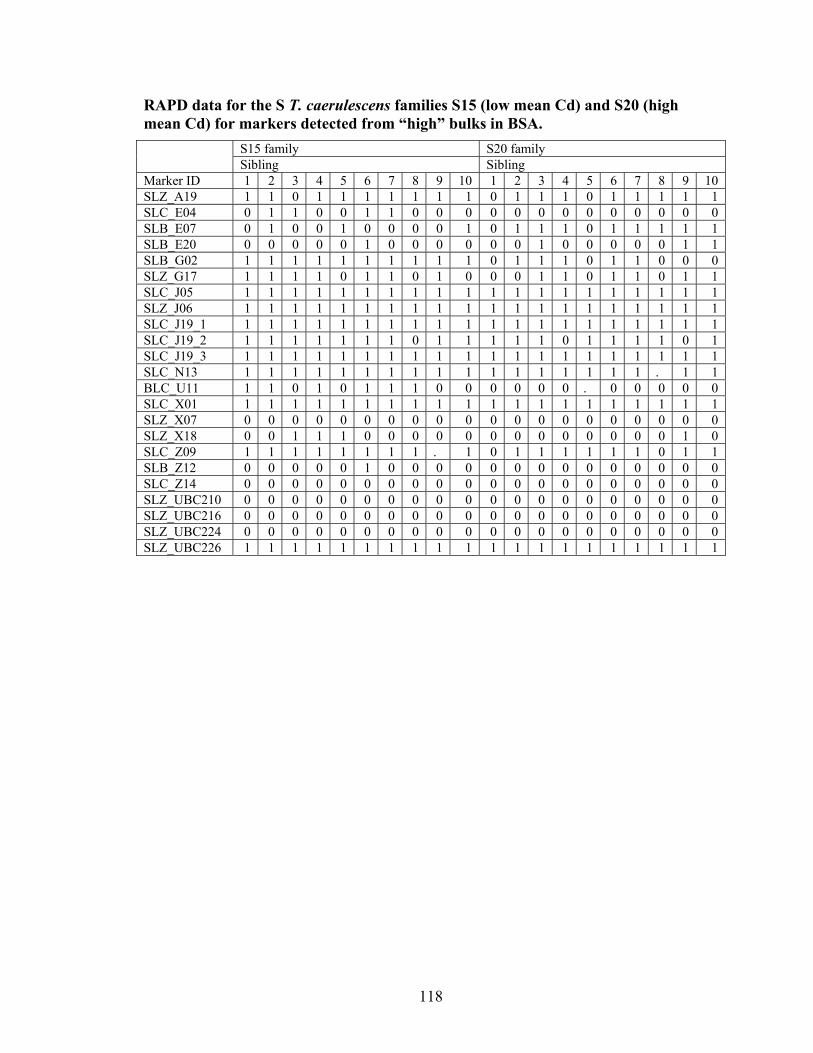
118
RAPD data for the S T. caerulescens families S15 (low mean Cd) and S20 (high mean Cd) for markers detected from “high” bulks in BSA.
S15 family S20 family Sibling Sibling Marker ID 1 2 3 4 5 6 7 8 9 10 1 2 3 4 5 6 7 8 9 10 SLZ_A19 1 1 0 1 1 1 1 1 1 1 0 1 1 1 0 1 1 1 1 1 SLC_E04 0 1 1 0 0 1 1 0 0 0 0 0 0 0 0 0 0 0 0 0 SLB_E07 0 1 0 0 1 0 0 0 0 1 0 1 1 1 0 1 1 1 1 1 SLB_E20 0 0 0 0 0 1 0 0 0 0 0 0 1 0 0 0 0 0 1 1 SLB_G02 1 1 1 1 1 1 1 1 1 1 0 1 1 1 0 1 1 0 0 0 SLZ_G17 1 1 1 1 0 1 1 0 1 0 0 0 1 1 0 1 1 0 1 1 SLC_J05 1 1 1 1 1 1 1 1 1 1 1 1 1 1 1 1 1 1 1 1 SLZ_J06 1 1 1 1 1 1 1 1 1 1 1 1 1 1 1 1 1 1 1 1 SLC_J19_1 1 1 1 1 1 1 1 1 1 1 1 1 1 1 1 1 1 1 1 1 SLC_J19_2 1 1 1 1 1 1 1 0 1 1 1 1 1 0 1 1 1 1 0 1 SLC_J19_3 1 1 1 1 1 1 1 1 1 1 1 1 1 1 1 1 1 1 1 1 SLC_N13 1 1 1 1 1 1 1 1 1 1 1 1 1 1 1 1 1 . 1 1 BLC_U11 1 1 0 1 0 1 1 1 0 0 0 0 0 0 . 0 0 0 0 0 SLC_X01 1 1 1 1 1 1 1 1 1 1 1 1 1 1 1 1 1 1 1 1 SLZ_X07 0 0 0 0 0 0 0 0 0 0 0 0 0 0 0 0 0 0 0 0 SLZ_X18 0 0 1 1 1 0 0 0 0 0 0 0 0 0 0 0 0 0 1 0 SLC_Z09 1 1 1 1 1 1 1 1 . 1 0 1 1 1 1 1 1 0 1 1 SLB_Z12 0 0 0 0 0 1 0 0 0 0 0 0 0 0 0 0 0 0 0 0 SLC_Z14 0 0 0 0 0 0 0 0 0 0 0 0 0 0 0 0 0 0 0 0 SLZ_UBC210 0 0 0 0 0 0 0 0 0 0 0 0 0 0 0 0 0 0 0 0 SLZ_UBC216 0 0 0 0 0 0 0 0 0 0 0 0 0 0 0 0 0 0 0 0 SLZ_UBC224 0 0 0 0 0 0 0 0 0 0 0 0 0 0 0 0 0 0 0 0 SLZ_UBC226 1 1 1 1 1 1 1 1 1 1 1 1 1 1 1 1 1 1 1 1
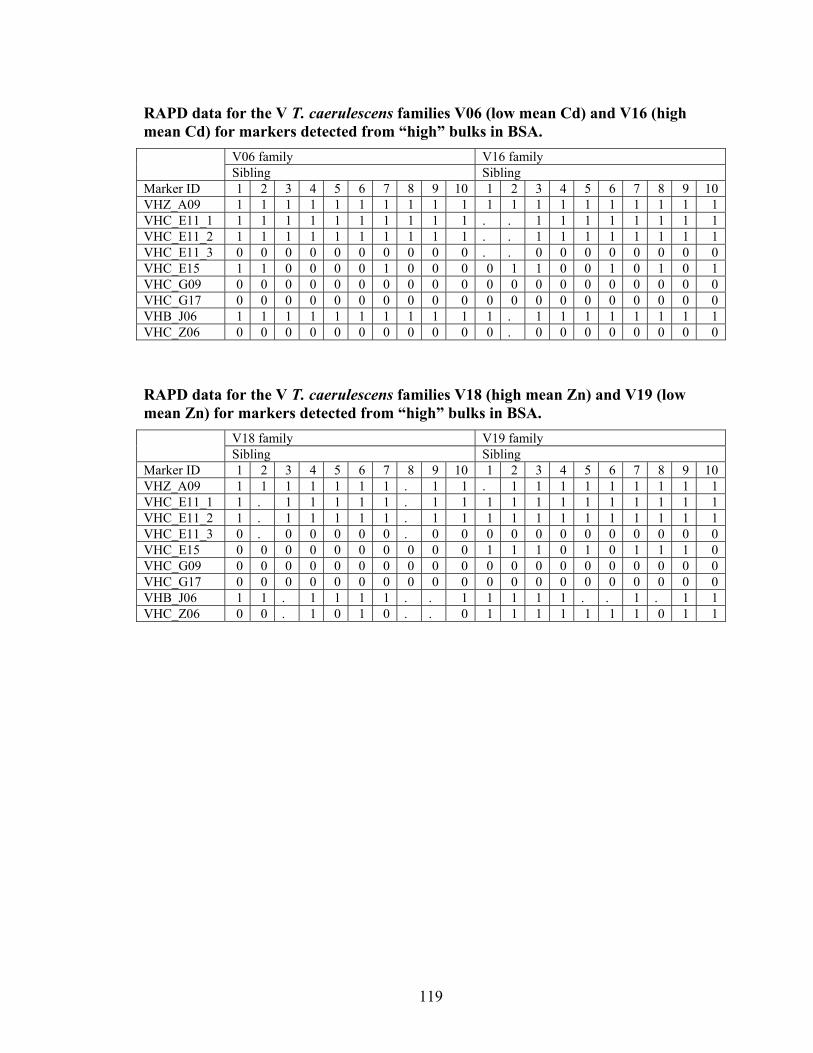
119
RAPD data for the V T. caerulescens families V06 (low mean Cd) and V16 (high mean Cd) for markers detected from “high” bulks in BSA.
V06 family V16 family Sibling Sibling Marker ID 1 2 3 4 5 6 7 8 9 10 1 2 3 4 5 6 7 8 9 10 VHZ_A09 1 1 1 1 1 1 1 1 1 1 1 1 1 1 1 1 1 1 1 1 VHC_E11_1 1 1 1 1 1 1 1 1 1 1 . . 1 1 1 1 1 1 1 1 VHC_E11_2 1 1 1 1 1 1 1 1 1 1 . . 1 1 1 1 1 1 1 1 VHC_E11_3 0 0 0 0 0 0 0 0 0 0 . . 0 0 0 0 0 0 0 0 VHC_E15 1 1 0 0 0 0 1 0 0 0 0 1 1 0 0 1 0 1 0 1 VHC_G09 0 0 0 0 0 0 0 0 0 0 0 0 0 0 0 0 0 0 0 0 VHC_G17 0 0 0 0 0 0 0 0 0 0 0 0 0 0 0 0 0 0 0 0 VHB_J06 1 1 1 1 1 1 1 1 1 1 1 . 1 1 1 1 1 1 1 1 VHC_Z06 0 0 0 0 0 0 0 0 0 0 0 . 0 0 0 0 0 0 0 0
RAPD data for the V T. caerulescens families V18 (high mean Zn) and V19 (low mean Zn) for markers detected from “high” bulks in BSA.
V18 family V19 family Sibling Sibling Marker ID 1 2 3 4 5 6 7 8 9 10 1 2 3 4 5 6 7 8 9 10 VHZ_A09 1 1 1 1 1 1 1 . 1 1 . 1 1 1 1 1 1 1 1 1 VHC_E11_1 1 . 1 1 1 1 1 . 1 1 1 1 1 1 1 1 1 1 1 1 VHC_E11_2 1 . 1 1 1 1 1 . 1 1 1 1 1 1 1 1 1 1 1 1 VHC_E11_3 0 . 0 0 0 0 0 . 0 0 0 0 0 0 0 0 0 0 0 0 VHC_E15 0 0 0 0 0 0 0 0 0 0 1 1 1 0 1 0 1 1 1 0 VHC_G09 0 0 0 0 0 0 0 0 0 0 0 0 0 0 0 0 0 0 0 0 VHC_G17 0 0 0 0 0 0 0 0 0 0 0 0 0 0 0 0 0 0 0 0 VHB_J06 1 1 . 1 1 1 1 . . 1 1 1 1 1 . . 1 . 1 1 VHC_Z06 0 0 . 1 0 1 0 . . 0 1 1 1 1 1 1 1 0 1 1
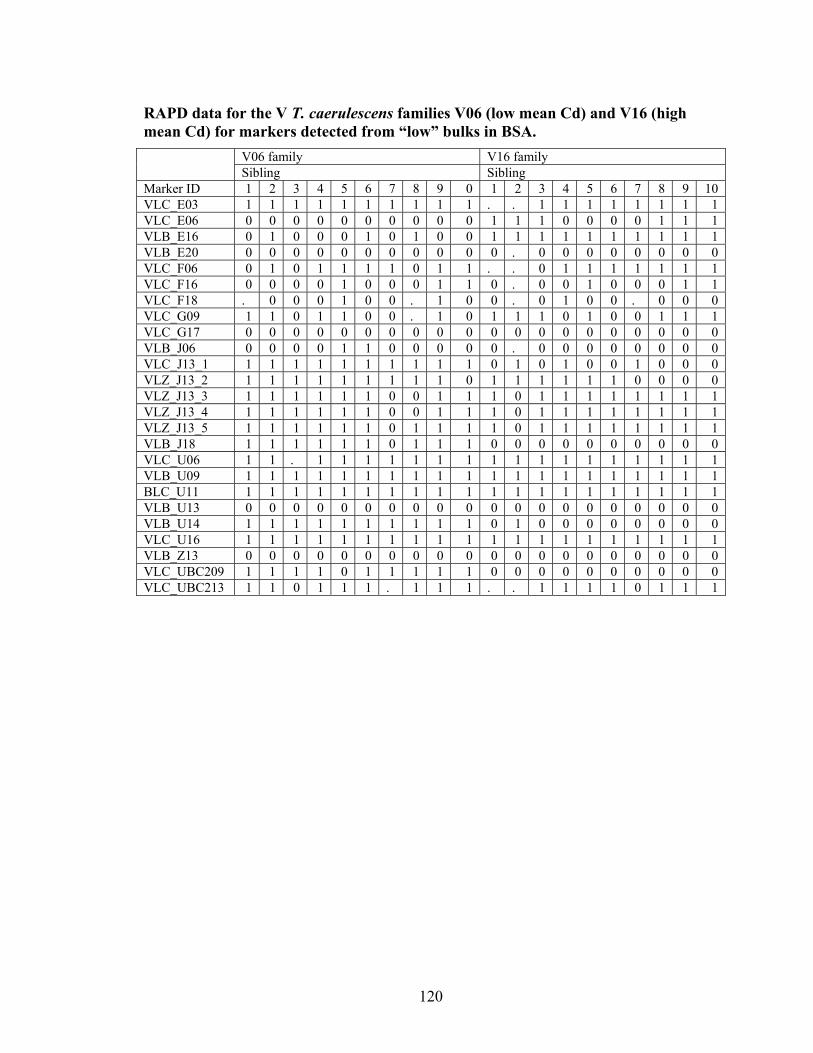
120
RAPD data for the V T. caerulescens families V06 (low mean Cd) and V16 (high mean Cd) for markers detected from “low” bulks in BSA.
V06 family V16 family Sibling Sibling Marker ID 1 2 3 4 5 6 7 8 9 0 1 2 3 4 5 6 7 8 9 10 VLC_E03 1 1 1 1 1 1 1 1 1 1 . . 1 1 1 1 1 1 1 1 VLC_E06 0 0 0 0 0 0 0 0 0 0 1 1 1 0 0 0 0 1 1 1 VLB_E16 0 1 0 0 0 1 0 1 0 0 1 1 1 1 1 1 1 1 1 1 VLB_E20 0 0 0 0 0 0 0 0 0 0 0 . 0 0 0 0 0 0 0 0 VLC_F06 0 1 0 1 1 1 1 0 1 1 . . 0 1 1 1 1 1 1 1 VLC_F16 0 0 0 0 1 0 0 0 1 1 0 . 0 0 1 0 0 0 1 1 VLC_F18 . 0 0 0 1 0 0 . 1 0 0 . 0 1 0 0 . 0 0 0 VLC_G09 1 1 0 1 1 0 0 . 1 0 1 1 1 0 1 0 0 1 1 1 VLC_G17 0 0 0 0 0 0 0 0 0 0 0 0 0 0 0 0 0 0 0 0 VLB_J06 0 0 0 0 1 1 0 0 0 0 0 . 0 0 0 0 0 0 0 0 VLC_J13_1 1 1 1 1 1 1 1 1 1 1 0 1 0 1 0 0 1 0 0 0 VLZ_J13_2 1 1 1 1 1 1 1 1 1 0 1 1 1 1 1 1 0 0 0 0 VLZ_J13_3 1 1 1 1 1 1 0 0 1 1 1 0 1 1 1 1 1 1 1 1 VLZ_J13_4 1 1 1 1 1 1 0 0 1 1 1 0 1 1 1 1 1 1 1 1 VLZ_J13_5 1 1 1 1 1 1 0 1 1 1 1 0 1 1 1 1 1 1 1 1 VLB_J18 1 1 1 1 1 1 0 1 1 1 0 0 0 0 0 0 0 0 0 0 VLC_U06 1 1 . 1 1 1 1 1 1 1 1 1 1 1 1 1 1 1 1 1 VLB_U09 1 1 1 1 1 1 1 1 1 1 1 1 1 1 1 1 1 1 1 1 BLC_U11 1 1 1 1 1 1 1 1 1 1 1 1 1 1 1 1 1 1 1 1 VLB_U13 0 0 0 0 0 0 0 0 0 0 0 0 0 0 0 0 0 0 0 0 VLB_U14 1 1 1 1 1 1 1 1 1 1 0 1 0 0 0 0 0 0 0 0 VLC_U16 1 1 1 1 1 1 1 1 1 1 1 1 1 1 1 1 1 1 1 1 VLB_Z13 0 0 0 0 0 0 0 0 0 0 0 0 0 0 0 0 0 0 0 0 VLC_UBC209 1 1 1 1 0 1 1 1 1 1 0 0 0 0 0 0 0 0 0 0 VLC_UBC213 1 1 0 1 1 1 . 1 1 1 . . 1 1 1 1 0 1 1 1
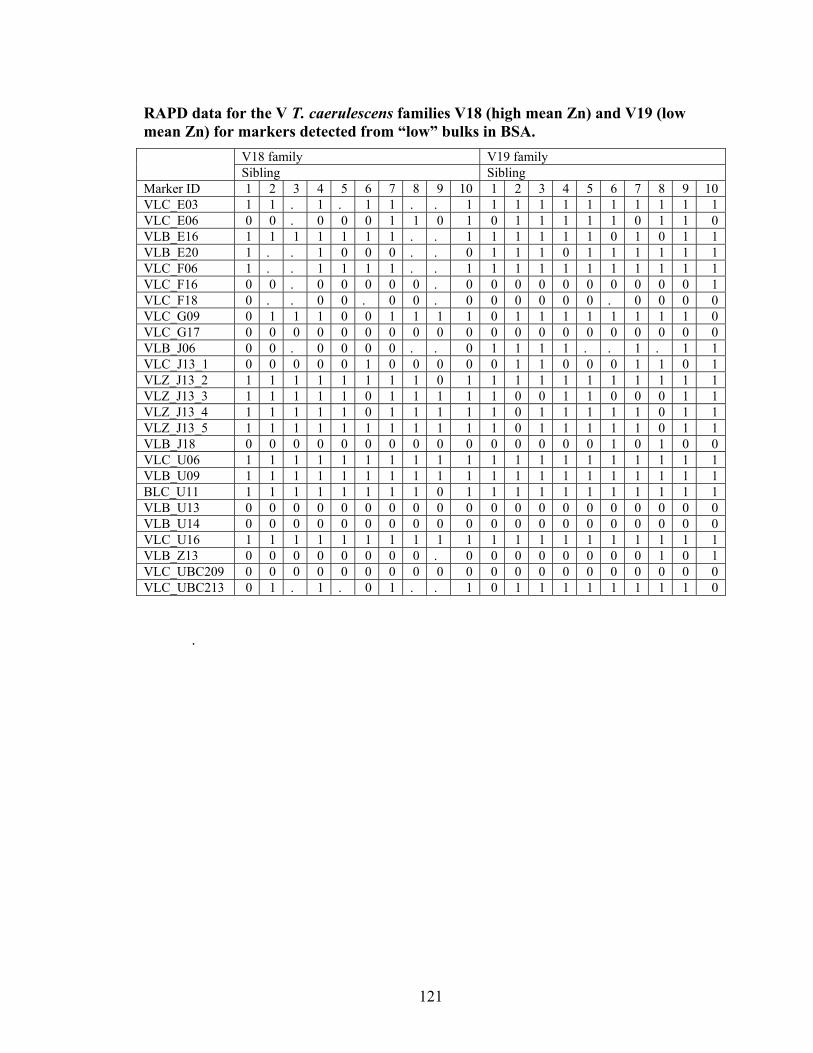
121
RAPD data for the V T. caerulescens families V18 (high mean Zn) and V19 (low mean Zn) for markers detected from “low” bulks in BSA.
V18 family V19 family Sibling Sibling Marker ID 1 2 3 4 5 6 7 8 9 10 1 2 3 4 5 6 7 8 9 10 VLC_E03 1 1 . 1 . 1 1 . . 1 1 1 1 1 1 1 1 1 1 1 VLC_E06 0 0 . 0 0 0 1 1 0 1 0 1 1 1 1 1 0 1 1 0 VLB_E16 1 1 1 1 1 1 1 . . 1 1 1 1 1 1 0 1 0 1 1 VLB_E20 1 . . 1 0 0 0 . . 0 1 1 1 0 1 1 1 1 1 1 VLC_F06 1 . . 1 1 1 1 . . 1 1 1 1 1 1 1 1 1 1 1 VLC_F16 0 0 . 0 0 0 0 0 . 0 0 0 0 0 0 0 0 0 0 1 VLC_F18 0 . . 0 0 . 0 0 . 0 0 0 0 0 0 . 0 0 0 0 VLC_G09 0 1 1 1 0 0 1 1 1 1 0 1 1 1 1 1 1 1 1 0 VLC_G17 0 0 0 0 0 0 0 0 0 0 0 0 0 0 0 0 0 0 0 0 VLB_J06 0 0 . 0 0 0 0 . . 0 1 1 1 1 . . 1 . 1 1 VLC_J13_1 0 0 0 0 0 1 0 0 0 0 0 1 1 0 0 0 1 1 0 1 VLZ_J13_2 1 1 1 1 1 1 1 1 0 1 1 1 1 1 1 1 1 1 1 1 VLZ_J13_3 1 1 1 1 1 0 1 1 1 1 1 0 0 1 1 0 0 0 1 1 VLZ_J13_4 1 1 1 1 1 0 1 1 1 1 1 0 1 1 1 1 1 0 1 1 VLZ_J13_5 1 1 1 1 1 1 1 1 1 1 1 0 1 1 1 1 1 0 1 1 VLB_J18 0 0 0 0 0 0 0 0 0 0 0 0 0 0 0 1 0 1 0 0 VLC_U06 1 1 1 1 1 1 1 1 1 1 1 1 1 1 1 1 1 1 1 1 VLB_U09 1 1 1 1 1 1 1 1 1 1 1 1 1 1 1 1 1 1 1 1 BLC_U11 1 1 1 1 1 1 1 1 0 1 1 1 1 1 1 1 1 1 1 1 VLB_U13 0 0 0 0 0 0 0 0 0 0 0 0 0 0 0 0 0 0 0 0 VLB_U14 0 0 0 0 0 0 0 0 0 0 0 0 0 0 0 0 0 0 0 0 VLC_U16 1 1 1 1 1 1 1 1 1 1 1 1 1 1 1 1 1 1 1 1 VLB_Z13 0 0 0 0 0 0 0 0 . 0 0 0 0 0 0 0 0 1 0 1 VLC_UBC209 0 0 0 0 0 0 0 0 0 0 0 0 0 0 0 0 0 0 0 0 VLC_UBC213 0 1 . 1 . 0 1 . . 1 0 1 1 1 1 1 1 1 1 0
.