Embed Size (px)
Citation preview

Investigation of Changes in Mitochondrial Dynamics in
Motor Neuron Diseases
by
Lynn Marie Duffy
Submitted for the degree of Doctor of Philosophy (PhD)
Sheffield Institute for Translational Neuroscience
University of Sheffield
February 2013
1
Abstract
Changes in mitochondrial dynamics, including alterations in the fusion/fission balance, have
repeatedly been observed in ageing and neurodegenerative disease, including ALS. We
investigated the effect ageing or disease has on mitochondrial network complexity in primary
dermal fibroblasts, derived from ALS patients or controls. Increased network complexity during
ageing was observed in the control cohort, though motility was unaffected. Conversely, network
complexity decreased in the sporadic ALS patient cohort upon ageing. We speculate that this
alteration in mitochondrial dynamics may contribute to the significant detrimental effect age has
on disease prognosis in ALS.
In mutant TARDBP (mTARDBP) patient fibroblasts, a trend towards increased network
complexity compared to age-matched controls was observed. Moreover, despite no discernible
differences in ATP levels in the mTARDBP fibroblasts compared to control samples, microarray
analysis hinted at changes in two metabolic pathways, glycolysis and the TCA cycle, both
known to influence mitochondrial dynamics. Subtle changes in the interaction of the ER and
mitochondria were also observed in the mTDP-43 fibroblasts. Furthermore, expression of two
autophagy genes, MAP1S and Atg12, was significantly altered in the mTARDBP fibroblasts.
However, LC3-II western blotting in either mTDP-43 or mC9ORF72 fibroblasts did not reveal
any significant differences, suggesting that changes in autophagy is not the primary cellular
process responsible for the mitochondrial morphology alterations.
HSP is characterised by defects in axonal transport, including mitochondrial transport. A mouse
model of SPG4-mediated HSP showed axonal swellings in cortical neurons, correlating with
impaired axonal transport. We showed that Tro19622 (a microtubule-interacting drug) did not
ameliorate the number of axonal swellings in the mutant neurons, though alterations in
microtubule integrity were apparent. Conversely, HDAC6 inhibitor, Tubastatin A, reduced the
number of axonal swellings in SPG4-mutant neurons to wild type levels, suggesting that
microtubule acetylation state could be an interesting therapeutic target for future investigation in
HSP.
2
Acknowledgments
I would firstly like to thank my supervisors Dr Andrew Grierson and Professor Pamela Shaw for
their encouragement and scientific input throughout the PhD course. Professor Shaw’s
dedication to the study of motor neurone disease has been inspiring and Andy’s enthusiasm for
science as well as his continued support, advice and patience has been invaluable over the four
years of the project. I would also like to thank the MitoTarget project for funding the PhD under
the EU Framework 7 directive, and for their support and advice at every meeting.
I am very grateful to Dr Scott Allen for teaching me western blotting, as well as his support,
advice, and “humorous” comments throughout the PhD. I would also like to thank Qurat-Ul-Ain
Mahmood and particularly Dr Kurt De Vos for their advice, and technical abilities, concerning
mitochondrial morphology image analysis. I would like to express my gratitude to the patients
and their partners for providing the fibroblast biopsy samples, and to Dr Johnathan Cooper-
Knock, Anne Gregory and Daniel Fillingham for collecting and culturing these new samples.
My sincerest thanks to Dr Laura Ferraiuolo for teaching me qPCR and microarray analysis with
a lot of patience, Dr Ellen Bennett for assisting with the mouse work and to Dr Heather
Mortiboys for sharing her expertise about both fibroblasts and mitochondria, helping with
western blotting analysis, giving me a roof over my head, friendship, advice and risotto!
Additionally, I would like to thank everyone at SITraN for all their help and discussions, and for
making it such a supportive work environment; I am especially grateful to Laura, Katie,
Heather, Rohini, Channa, Scott, Guy and Alifya for their friendship and for providing many
laughs throughout the PhD. Finally, I would like to say a big thank you to my parents, sister and
friends for their support and love through an extremely challenging four years. I always knew
that they were only a phone-call away for comfort, a chat or a sarcastic remark!
Contents
3

Chapter 1- Introduction 12
1.1: Mitochondria 171.1.1: Function 171.1.2: Morphology/ Dynamics 181.1.3: Mitochondrial Permeability Transition Pore 20
1.2: Amyotrophic Lateral Sclerosis 201.2.1: Classification and clinical features 20
1.2.1.1: Pathology of ALS...................................................................................................211.2.2: Aetiology of ALS 21
1.2.2.1: MND-linked genetic loci........................................Error! Bookmark not defined.1.2.2.2: SOD1: Physiological role and involvement in MND.............................................251.2.2.3: Tar DNA Binding Protein-43: physiological role and involvement in ALS..........261.2.2.4: C9ORF72 Discovery..............................................................................................30
1.2.3: Mitochondrial dysfunction in ALS: evidence in models and patients 331.2.3.1: Functional defects...................................................................................................331.2.3.2: Dysmorphology......................................................................................................35
1.3: Relationship between Dysmorphology and Dysfunction 371.3.1: Mitochondrial associated membranes 38
1.3.1.1: Roles of the ER-mitochondria association.............................................................381.3.1.2: Protein linkers of the MAM...................................................................................391.3.1.3: MAM and neurodegenerative disease....................................................................43
1.3.2: ER Stress 431.3.3: Macroautophagy 43
1.3.3.2 Mitophagy................................................................................................................451.3.3.3: Autophagy and neurodegeneration.........................................................................48
1.3.4: Apoptosis 481.3.4.1: Apoptosis in ALS...................................................................................................49
1.3.5: Mitochondrial involvement in ageing 501.3.6: Role of axonal transport in neurons 51
1.3.6.1: Impaired neuronal trafficking of mitochondria in ALS.........................................52
1.4: Hereditary Spastic Paraplegia 531.4.1: Classification and clinical features 53
1.4.1.1: HSP-linked genetic loci..........................................................................................551.4.2: Spastin 58
1.4.2.1: Cellular functions of spastin...................................................................................601.4.3: In vivo models of HSP 64
1.4.3.1: Drosophila melanogaster........................................................................................641.4.3.2: Danio rerio..............................................................................................................641.4.3.3: Mus musculus.........................................................................................................65
1.4.4: Spastin and Hereditary Spastic Paraplegia 67
1.5: Motor Neuron Vulnerability 681.5.1: Models of neurodegenerative disease 69
1.6: Hypothesis and aims of PhD 71
Chapter 2 - Materials and Methods 73
2.1: General 732.1.1: Ethics 732.1.2: Chemicals and reagents 732.1.3: Image analysis 732.1.4: Statistical analysis 73
4
2.2: Establishment and culture of human primary dermal fibroblasts 732.2.1: Establishment of primary human fibroblast cultures 732.2.2: Maintenance of the fibroblast cultures 742.2.3: Cryo-preservation of fibroblasts 742.2.4: Plating, and experimental growth conditions of, the fibroblasts 74
2.2.4.1: Plating densities......................................................................................................742.2.4.2: Growth conditions..................................................................................................75
2.3: Investigating mitochondrial morphology in dermal fibroblasts derived from ALS patients 75
2.3.1: Visualising the mitochondrial network in the human dermal fibroblasts77
2.3.1.1: Live cell imaging of the fibroblasts........................................................................772.3.2: Analysing the mitochondrial morphology in the fibroblasts 77
2.3.2.1: Network Complexity..............................................................................................772.3.2.2: Statistical analysis..................................................................................................79
2.3.3: Mitochondrial motility in fibroblasts 792.3.3.1: Statistical analysis of mitochondrial motility.........................................................82
2.3.4: Quantifying the relative ATP content of the mTARDBP fibroblasts 832.3.4.1: Statistical analysis of the relative ATP content in mTARDBP-expressing and control fibroblasts................................................................................................................83
2.3.5: Immunocytochemistry 842.3.5.1: Fixation of cells......................................................................................................842.3.5.2: Immunocytochemistry............................................................................................84
2.3.6: Mitochondrial Associated Membrane (MAM) analysis in the mTARDBP fibroblasts 85
2.3.6.1: Intensity Correlation Analysis of the endoplasmic reticulum and the mitochondria.............................................................................................................................................86
2.4: Gene expression profiling of the mTARDBP fibroblasts 892.4.1: RNA isolation and linear amplification 892.4.2: Running the microarray 902.4.3: Microarray analysis 902.4.4: RT qPCR 90
2.4.4.1: Complementary DNA (cDNA) synthesis from total RNA.....................................902.4.4.2: Primer design for RT qPCR...................................................................................912.4.4.3: Primer optimisation and assay conditions..............................................................912.4.4.4: Analysis of qPCR to ascertain relative gene expression........................................92
2.5: Assessment of autophagy in fibroblasts 942.5.1: Western blotting 94
2.5.1.1: Protein extraction from fibroblasts.........................................................................952.5.1.2: Protein concentration assay....................................................................................962.5.1.3: SDS-PAGE and protein transfer.............................................................................962.5.1.4: Protein immunoblotting..........................................................................................97
2.6: Investigating axonal transport defects in a mouse model of SPG4 HSP98
2.6.1: Genetic background of the SPG4 HSP mice 982.6.2: Primary cortical neuron culture 982.6.3: Drug treatment of the neurons 992.6.4: Spast Genotyping 99
2.6.4.1: DNA extraction......................................................................................................992.6.4.2: Mismatch PCR and restriction digest for spast genotyping...................................99
2.6.5: Immunocytochemistry of Spast cortical neurons for axonal swelling quantification 1002.6.6: Quantification of axonal swellings in primary culture 1002.6.7: Morphology and viability of neurons 101
5

Chapter 3 - Investigating changes in mitochondrial dynamics in ageing and neurodegenerative disease 102
3.1: Introduction 1023.1.1: Mitochondrial dynamics in health and disease 1023.1.2: Aims of investigation 102
3.2: Assessing mitochondrial dynamics in primary dermal fibroblasts 1043.2.1: Quantifying changes in mitochondrial fusion and fission104
3.2.1.1: Passage effect on mitochondrial dynamics...........................................................1063.2.2: Role of mitochondrial dynamics in ageing 107
3.2.2.1: Quantifying the relationship between ageing and morphology of mitochondria.1083.2.2.2: Quantifying the relationship between ageing and motility of mitochondria........110
3.2.3: Quantification of mitochondrial morphology in ALS patient fibroblasts1163.2.3.1: Quantifying mitochondrial morphology in sporadic ALS patient fibroblasts......1173.2.3.2: Quantifying mitochondrial morphology in patient fibroblasts expressing mTARDBP........................................................................................................................130
3.3: Conclusion 135
Chapter 4 - Functional analysis of mTARDBP-expressing fibroblasts138
4.1: Introduction 1384.1.1: TDP-43 and ALS 1384.1.2: TDP-43 and mitochondria 1384.1.3: Aims of investigation 139
4.2: Bioenergetic assessment of the mTARDBP fibroblasts 1404.2.1: Quantification of ATP levels in mTARDBP fibroblasts 140
4.3: Gene expression profiling 1424.3.1: Microarray Analysis of mTARDBP Patient vs Control Fibroblasts 1424.3.2: RT-qPCR optimisation 146
4.3.2.1: Identifying the ideal reference gene for qPCR.....................................................1464.3.3: Identification of gene expression changes to validate 155
4.3.3.1: Metabolism...........................................................................................................1564.3.3.2: Autophagy............................................................................................................160
4.3.4: Western blotting for LC3-I and LC3-II 1654.3.4.1: TDP-43.................................................................................................................1654.3.4.2: C9ORF72..............................................................................................................171
4.4: Quantification of MAMs in the mTARDBP fibroblasts 1774.4.1: Evidence from microarray analysis 1774.4.2: Colocalisation of ER and mitochondria in mTARDBP fibroblasts 178
4.5: Conclusion 182
Chapter 5 - Axonal transport in an HSP SPG4 mouse model 184
5.1: Introduction 1845.1.1: Axonal transport 184
5.1.1.1: Cytoskeletal structure: Microtubules....................................................................1845.1.2: Hereditary Spastic Paraplegia 1855.1.3: Aims of this investigation 186
6

5.2: Characterisation of the primary cortical neuron cultures 1875.2.1: Genotyping of the cortical neurons 1875.2.2: Axonal swellings in cortical neuron cultures 187
5.3: Characterisation of spast ∆E7 cortical neurons 1885.3.1: Effect of genetic background on number of axonal swellings 1885.3.2: Treatment with Tro19622 191
5.3.2.1: Tro19622 and microtubule dynamics...................................................................1915.3.2.2: Tro19622 and axonal swelling quantification......................................................1915.3.2.2: Effect of microtubule stabilisation on axonal transport.......................................2275.3.2.4: Tro19622 and neurite morphology.......................................................................1945.3.2.5: Viability of the cortical neurons treated with Tro19622......................................1975.3.2.6: Acetylation levels.................................................................................................199
5.3.3: Treatment with HDAC6 inhibitor - Tubastatin A 2025.3.3.1: Tubastatin A and swellings..................................................................................2025.3.3.2: HDAC6 inhibition and neurodegeneration...........................................................203
5.4: Conclusions 206
Chapter 6 - Discussion 208
6.1: Introduction 2086.1.1: Mitochondria in cellular homeostasis, ageing and neuronal maintenance
208
6.2: Use of cellular models in biomedical investigation 2106.2.1: Primary dermal fibroblasts 210
6.2.1.1: Investigating changes in mitochondrial dynamics...............................................2116.2.1.2: Autophagy investigation.........................................Error! Bookmark not defined.6.2.1.3 MAMs......................................................................Error! Bookmark not defined.6.2.1.4: Future work using primary dermal fibroblasts.....................................................221
6.2.2: Mitochondrial dynamics and axonal transport 2236.2.3: Primary cortical neurons 223
6.2.3.1: Future Work investigating SPG4 HSP.................................................................226
Bibliography 228
List of tables
Table 1.2: Identified Protein Linkers and Regulators at the MAM......................................41
Table 1.3: Genes implicated in HSP, with functional role......................................................55
Table 2.1: Control and patient fibroblasts used in the mitochondria morphology investigation.......................................................................................................................76
Table 2.2: An example of the numeric results of mitochondrial branching in a MitoTracker-loaded fibroblast.........................................................................................79
Table 2.3: Control and fibroblasts used in the mitochondria motility investigation...........80
Table 2.4: Control and patient fibroblasts used to quantify ATP levels...............................83
7

Table 2.5: Primary antibodies used throughout the project..................................................84
Table 2.7: Control and patient fibroblasts used to quantify the association between the ER and mitochondria...............................................................................................................85
Table 2.8: Control and patient fibroblasts used in gene expression profiling investigation.............................................................................................................................................89
Table 2.9: Additional controls for qPCR validation...............................................................89
Table 2.10: Primer sequences and optimised concentration used for qPCR validation of differential gene expression between control and mTARDBP patient cohorts............93
Table 2.11: Control and Patient Fibroblasts used for western blotting experiments..........94
Table 2.12: Buffers and solutions used throughout the protein expression analysis experiments........................................................................................................................95
Table 4.1: Control and mTARDBP fibroblasts used for microarray analysis....................142
Table 4.2: DAVID GO Analysis of the differentially expressed genes...............................143
Table 4.4: Manual classification of the differentially expressed genes................................145
Table 4.5: Control and mTARDBP fibroblasts used in optimisation of RT-qPCR reference genes..................................................................................................................................146
Table 4.6: Comparison of Ct values obtained with reference genes....................................155
Table 4.7: Standard deviation and coefficient of variation of Ct values obtained with reference genes.................................................................................................................155
Table 4.8: Assessment of co-variation of ER and mitochondria immunostaining in primary dermal fibroblasts............................................................................................................179
8
List of figures
Figure 1.1: Multiple pathogenic processes implicated in ALS...............................................22
Figure 1.2: The mitochondria-associated membrane (MAM)...............................................40
Figure 1.3: The canonical macro-autophagy pathway...........................................................44
Figure 1.4: An example of two pathways feeding into the induction of mitophagy.............46
Figure 1.5: The Structural Domains of Spastin.......................................................................59
Figure 2.1: Image processing to quantify mitochondrial branching in fibroblasts.............78
Figure 2.2: Analysing mitochondria motility in MitoTracker CMXRos Red stained fibroblasts...........................................................................................................................81
Figure 2.3: Quantifying mitochondrial motility in fibroblasts..............................................82
Figure 2.4: Preparing the image for Intensity Correlation Quotient Analysis.....................87
Figure 2.5: Calculating the ICQ of the mitochondria and ER Interaction...........................88
Figure 3.1: Calculation of mitochondrial network complexity............................................105
Figure 3.2: Influence of passage on network complexity of mitochondria.........................106
Figure 3.3: Changes in mitochondrial network complexity upon ageing...........................108
Figure 3.4: Quantifying motility of mitochondria.................................................................112
Figure 3.5: Mitochondrial motility in control fibroblasts at different ages........................113
Figure 3.6: Identification and removal of outliers when quantifying mitochondrial motility...........................................................................................................................................114
Figure 3.7: Interconnectivity of mitochondrial network in control fibroblasts compared to sporadic ALS patient fibroblasts when cultured in 1mg/ml glucose..........................118
Figure 3.8: Mitochondrial network complexity of sporadic patient fibroblasts cultured in the presence of media containing 1mg/ml glucose........................................................120
Figure 3.9: Comparison of mitochondrial network complexity upon culture in different concentrations of galactose.............................................................................................121
Figure 3.10: The involvement of pyruvate in the initiation of the TCA cycle....................122
Figure 3.11: Interconnectivity of mitochondrial network upon culture in presence of glucose or galactose.........................................................................................................123
Figure 3.12: Comparison of mitochondrial network complexity of control fibroblasts cultured in either glucose or galactose...........................................................................123
Figure 3.13: Changes in mitochondrial network complexity in ageing in control fibroblasts cultured in glucose-deprived media...............................................................................125
Figure 3.14: Interconnectivity of mitochondrial network in control fibroblasts compared to sporadic patients when cultured in 0.009mg/ml galactose......................................128
9

Figure 3.15: Network complexity of sporadic ALS patient fibroblast mitochondria cultured in glucose-deprived media...............................................................................129
Figure 3.16: Interconnectivity of mitochondrial network in a control fibroblast compared to a mTARDBP-expressing patient when cultured in 1mg/ml glucose.......................131
Figure 3.17: Network complexity of mTARDBP-expressing patient fibroblast mitochondria cultured in the presence of glucose................................................................................131
Figure 3.18: Interconnectivity of mitochondrial network in a control fibroblast compared to a mTARDBP-expressing patient when cultured in 0.009mg/ml galactose.............133
Figure 3.19: Network complexity of mTARDBP-expressing patient fibroblast mitochondria cultured in glucose-deprived media...............................................................................134
Figure 4.1: Levels of ATP in the mTARDBP patient fibroblasts compared to control levels...........................................................................................................................................141
Figure 4.2: Amplification plot and dissociation curve of ACTB..........................................149
Figure 4.3: Amplification plot and dissociation curve of U1 snRNA...................................152
Figure 4.4: Amplification plot and dissociation curve of PPIA............................................154
Figure 4.5: Alterations in gene expression in the glycolytic pathway.................................157
Figure 4.6: Altered regulation of Pyruvate Dehydrogenase in the mTDP-43 fibroblasts. 158
Figure 4.7: PFKFB4 and Glut3 expression changes between controls and mTARDBP samples..............................................................................................................................159
Figure 4.8: Processing of LC3 upon induction of autophagy – Involvement of Atg12 and MAP1S..............................................................................................................................162
Figure 4.9: MAP1S and Atg12 expression changes between control and mTARDBP samples..............................................................................................................................164
Figure 4.10: LC3 western blotting in mTARDBP patient fibroblasts.................................166
Figure 4.11: LC3-II levels in mTARDBP patient fibroblasts...............................................167
Figure 4.12: LC3 blotting in an ALS patient fibroblast expressing the C9ORF72 pathogenic expansion......................................................................................................173
Figure 4.13: LC3–II levels in C9ORF72 expansion patient fibroblasts...............................174
Figure 4.14: Dual immunostaining of the primary fibroblast cells.....................................179
Figure 4.15: Quantification of mitochondria and ER colocalisation in mTARDBP-expressing fibroblasts......................................................................................................180
Figure 5.1: Mismatch PCR and restriction digest for spast∆E7 genotyping.........................187
Figure 5.2: Quantification of axonal swellings......................................................................188
Figure 5.3: Effect of genetic background on the number of axonal swellings in cortical neurons.............................................................................................................................190
Figure 5.4: Persistence of axonal swellings in spast ∆E7/∆E7 primary cortical neurons following treatment with Tro19622................................................................................192
10
Figure 5.5: Quantification of the number of axonal swellings in the presence of Tro19622...........................................................................................................................................193
Figure 5.7: Improvement in neurite morphology upon treatment with Tro19622............196
Figure 5.8: Qualitative scoring of the improvement in neurite morphology upon treatment with Tro19622..................................................................................................................197
Figure 5.9: Assessment of cortical neuron culture viability.................................................198
Figure 5.10: Quantitative measurement of viability in spast +/+ and spast ∆E7/∆E7 cortical neuron cultures................................................................................................................198
Figure 5.11: Assessing morphology of the cytoskeleton in the presence of Tro19622.......200
Figure 5.12: Assessing the morphology of components of the cytoskeleton in spast +/∆E7 neurons upon treatment with Tro19622........................................................................201
Figure 5.13: Quantification of the number of axonal swellings in the presence of Tubastatin A.....................................................................................................................203
Figure 6.1: Mitochondrial network complexity of mC9ORF72 patient fibroblasts cultured in the presence of media containing 1mg/ml glucose..........Error! Bookmark not defined.
11

Abbreviations
Mutant proteins listed as mPROTEIN, e.g mutant Parkin is written as mParkin
Abbreviation Full name
AAA protein ATPases associated with various cellular activities
AD Alzheimer’s disease
ADDL Amyloid-β-derived diffusible ligands
ADOA Autosomal dominant optic atrophy
ALDOB Aldolase B
ADom Autosomal dominant
ALS Amyotrophic lateral sclerosis
ALS2 Alsin
AMPA α-amino-3-hydroxy-5-methyl-4-isoxazolepropionic acid
AMPK AMP-activated protein kinase
ANT Adenine nucleotide translocator
APAF-1 Apoptotic protease activating factor 1
APP Amyloid precursor protein
APS Ammonium persulfate
AR Autosomal recessive
ATG Autophagy-related
ATG12 Autophagy related 12
ATG13 Autophagy related 13
BiP Binding immunoglobulin protein
BMP Bone morphogenetic protein
BSA Bovine serum albumin
cDNA Complementary cDNA
CFTR Cystic fibrosis transmembrane conductance regulator
CHMP Charged multivesicular body protein
CMT2A Charcot-Marie-Tooth 2A
COX Cytochrome c oxidase
CSF Cerebrospinal fluid
12
Ct Threshold cycle
CTFs C-terminal fragments
CypD Cyclophilin D
DAVID Database for Annotation, Visualisation and Integrated Discovery
Db Diabetes
DCTN1 Dynactin
DNA Deoxyribonucleic acid
DNAse 1 Deoxyribonuclease 1
DOG 2-Deoxyglucose
Drp1 Dynamin related protein 1
dSpastin Drosophila Spastin
EAAT2 Excitatory amino acid transporter 2
EB1 End-binding protein 1
EB3 End-binding protein 3
ECAR Extracellular acidification rate
ECL Enhanced chemiluminescence
EDTA Ethylenediaminetetraacetic acid
eIF2α Eukaryotic translation initiation factor 2A
ENU N-ethyl-N-nitrosourea
ER Endoplasmic reticulum
ERMES ER-mitochondria–encounter-structure
ESCRT Endosomal sorting complex required for transport
ETC Electron transport chain
FAD Familial AD
FALS Familial ALS
FIG4 PI(3,5)P(2)5-phosphatase
FIP200 FAK family kinase-interacting protein of 200 kDa
FIS1 Fission 1 homolog
FTD Fronto-temporal dementia
FTD-U FTD with ubiquitinated inclusions
FUS/TLS Fused in sarcoma/translocated in liposarcoma
GA Golgi apparatus
13

GAPDHS Spermatogenic isoform of glyceraldehyde 3-phosphate dehydrogenase
GEM Gemini of coiled bodies
GFP Green fluorescent protein
GO Gene Ontology
HATs Histone acetyltransferases
HBSS Hank’s balanced salt solution
HBSS - - HBSS without calcium and magnesium
HDACs Histone deacetylases
HEK Human embryonic kidney
hnRNP Heterogeneous nuclear ribonucleoprotein
HRP Horseradish peroxidase
HSP Hereditary spastic paraplegia
IARS Isoleucyl-tRNA synthetase 2
ICA Intensity correlation analysis
ICQ Intensity correlation quotient
IMM Inner mitochondrial membrane
IMS Intermembrane space
IP3 Inositol-1.4.5-triphosphate
IP3R3s Inositol trisphosphate receptors, type 3
KEGG Kyoto Encyclopedia of Genes and Genomes
LMN Lower motor neurons
MAM Mitochondria associated membrane
MAPs Microtubule-associating proteins
MAP1S Microtubule-associated protein 1S
MBOs Membrane bound organelles
MEFs Mouse embryonic fibroblasts
MEM Minimal essential medium
MFN1/MFN2 Mitofusin 1 / Mitofusin 2
mHSPB1 Mutant heat shock 27kDa protein 1
MIT Microtubule interacting and transport
MPTP Mitochondria transition permeability pore
MTA Microtubule-targeting agent
14

MTBD Microtubule binding domain
mtDNA Mitochondrial DNA
mTOR Mammalian target of rapamycin
NAC N-acetyl-cysteine
NaCl Sodium chloride
NB + B27 Neurobasal medium containing B27 supplement, 100IU/ml penicillin, + P/S + L-Glut 100µg/ml streptomycin and 2mM glutamine
NGS Normal goat serum
NMJ Neuromuscular junction
NO RT No reverse transcriptase
npcRNA Non-protein coding RNA
NS Not significant
NTC No template control
Ob Obese
OMM Outer mitochondrial membrane
OPA1 Optic atrophy 1
OPTN Optineurin
PACS-2 Phosphofurin acidic cluster sorting protein 2
PBS-T Tween-20 (Polyoxyethylenesorbitan monolaurate) in PBS
PDH Pyruvate dehydrogenase
PDI Protein disulfide isomerase
PDP Pyruvate dehydrogenase phosphatase
PDPR Pyruvate dehydrogenase phosphatase regulatory subunit
PE Phosphatidylethanolamine
PGC-1α Peroxisome proliferator activated receptor gamma coactivator 1α
PINK1 PTEN induced putative kinase
PI3K Phosphatidylinositol 3-kinase complex
POLGA DNA polymerase subunit gamma
PPIA Peptidylprolyl isomerase A
PSEN Presenilin
RAB7 Ras-associated protein 7
REEP1 Receptor accessory protein 1
15
RNA Ribonucleic acid
ROI Region of interest
ROS Reactive oxygen species
RT Room temperature
RTN2 Reticulon 2
RT qPCR Real time, quantitative polymerase chain reaction
SOD1 Superoxide dismutase 1
SALS Sporadic ALS
SDS Sodium dodecyl sulfate
SDS-PAGE Sodium dodecyl sulfate polyacrylamide gel electrophoresis
SETX Senataxin
SIN-1 3-morpholinosydnonimine
Sirt3 Sirtuin-3
SMN Survival motor neuron
snRNA Small nuclear RNA
SOD2 Superoxide dismutase 2
TARDBP Transactive response-DNA binding protein
TCA Tricarboxylic acid
TEMED N,N,N’,N’ –tetramethylethylenediamine
+TIPs Microtubule plus-end tracking proteins
TM Transmembrane
Tm Melting temperature
TSPO Translocator protein 18kDa
TUNEL Terminal deoxynucleotide transferase dUTP nick end labelling
ULK Unc-51-like kinase
UMN Upper motor neuron
UPR Unfolded protein response
V/V Volume to volume
VAPB Vesicle-associated membrane protein-associated protein B/C
VDAC Voltage-gated anion channel
W/V Weight to volume
ΔΨm Mitochondrial membrane potential
16
Chapter 1- Introduction
1.1: MitochondriaMitochondria are highly specialised organelles in eukaryotic cells with multiple roles, including
the production of ATP, regulation of calcium homeostasis and induction of the intrinsic
apoptotic cascade. The mitochondrion is surrounded by a double unit membrane, composed of
the outer mitochondrial membrane (OMM) and the inner mitochondrial membrane (IMM), with
the intermembrane space (IMS) in between. The IMM has extensive folds (cristae) that project
into the interior of the mitochondria, named the mitochondrial matrix. This matrix harbours the
ribosomes, mitochondrial deoxyribonucleic acid (mtDNA), and enzymes involved in the
catalysis of ATP synthesis (Frey et al. 2000; Malka et al. 2005).
1.1.1: Function
A process termed oxidative phosphorylation achieves the synthesis of ATP; electrons, derived
from catabolic biochemical processes, flow along a sequence of four protein complexes
spanning the IMM, named the electron transport chain (ETC), before being passed onto the
terminal electron acceptor, oxygen. The transfer of electrons via specialised electron carriers,
and the resultant release of energy, is coupled to the pumping of H+ ions across the IMM, into
the IMS. This electrochemical proton gradient, and the subsequent flow of ions back across the
membrane into the matrix, is utilised by the enzyme ATP synthase to drive the energetically
unfavourable process of ATP synthesis (DiMauro 2004; Rezin et al. 2009; Valsecchi et al.
2010). It has recently been shown that the four protein complexes, rather than moving freely
within the IMM, are actually organised into supramolecular structures, termed
“supercomplexes”. The formation of these supercomplexes enables the mitochondria to function
more efficiently by permitting faster transport of electrons (Acin-Perez et al. 2008).
The mitochondria also act as key calcium buffers; in response to cytosolic calcium of around
2M, calcium levels in the mitochondria rise simultaneously to around 10M (Rizzuto et al.
2006; de Brito et al. 2010). In this role, the mitochondria are capable of influencing the
patterning of calcium propagation, and thus signalling, a trait particularly important at the
synapse of neuronal cells. Accordingly, mitochondria are found clustered at the synaptic bouton
(Billups et al. 2002; Cai et al. 2011). The buffering capability of the mitochondria is assisted via
the organelle’s linkage with the endoplasmic reticulum (ER), as later discussed. For example,
calcium released by the ER after inositol-1.4.5-triphosphate (IP3) stimulation is taken up by
mitochondria much more efficiently than calcium leaked from the ER (Rizzuto et al. 1993;
Hajnoczky et al. 1995).
17
Influx of calcium into mitochondria is also capable of influencing the cellular metabolic output;
multiple enzymes of the tricarboxylic acid (TCA) cycle and the ETC, including -ketoglutarate,
isocitrate dehydrogenase and pyruvate dehydrogenase, are regulated by the influx of calcium
(Bernardi 1999; de Brito et al. 2010). Thus, there is an intricate and bi-directional relationship
between mitochondria and cellular calcium levels, allowing mitochondrial metabolic output to
match demand (Van Den Bosch et al. 2006; Celsi et al. 2009).
Furthermore, excessive calcium signalling at the mitochondria determines the fate of the cell.
The mitochondria are central to the intrinsic apoptotic cascade, containing, or interacting with,
several proteins capable of either initiating or regulating the controlled-death process. For
example, excessive calcium influx, mediated by signalling at the ER or plasma membrane, can
result in permeability of the mitochondrial membrane, with release of the pro-apoptotic protein
cytochrome c. Once in the cytosol, cytochrome c is capable of activating the adaptor protein,
apoptotic protease activating factor 1 (Apaf-1), initiating the caspase cascade (Zimmermann et
al. 2001). The Bcl-2 family of proteins regulate the apoptotic process, capable of blocking, or
conversely, stimulating cytochrome c release from the mitochondria (Zimmermann et al. 2001).
Reflecting a common theme in cellular homeostasis, the morphology of the mitochondria is
critical in the regulation of all of the functions mentioned above.
1.1.2: Morphology/ Dynamics
Mitochondria are highly dynamic organelles, with their morphology ranging in shape from
highly branched networks to individual small rod-shape structures. This morphological
plasticity derives from a continuous cycle of fusion and fission, closely regulated by several
mitochondria-associated proteins (Seo et al. 2010).
Mitochondrial fusion is a two-stage process, requiring the fusion of both the outer and inner
membranes. The first mediator of mitochondrial fusion was identified in Drosophila
melanogaster. Fzo1 is a mitochondrial transmembrane GTPase capable of mediating OMM
fusion (Hales et al. 1997). Fzo1 has two mammalian orthologs, named Mitofusin 1 (Mfn1) and
Mitofusin 2 (Mfn2), which can be found anchored to the OMM via their C-terminal membrane-
binding domain (Santel et al. 2001; Eura et al. 2003). OMM fusion is mediated by the GTPase-
dependent tethering of opposing mitochondrial membranes, via the formation of
homomultimeric or heteromultimeric complexes composed of Mfn1 or Mfn2 (Santel et al.
2001; Chen et al. 2003). IMM fusion is achieved via another GTPase, named optic atrophy 1
(OPA1) (Cipolat et al. 2004). This protein localises to the IMM as an integral membrane protein
and is subject to both alternative splicing and post-translational proteolytic cleavage; however,
the precise function of these multiple isoforms remains unclear (Alexander et al. 2000; Delettre
et al. 2001).
18
Conversely, two proteins, Fission 1 homolog (Fis1) and Dynamin related protein 1 (Drp1),
regulate mitochondrial fission (Mozdy et al. 2000). Drp1, also a GTPase, basally localises to the
cytosol. Upon activation of mitochondrial fission, it is recruited to the mitochondria by the
OMM protein, Fis1, where it subsequently oligomerises, forming an OMM-localised complex
(Smirnova et al. 2001). Once at the mitochondrial surface, Drp1 undergoes a series of post-
translational modifications, such as phosphorylation and sumoylation, stabilising the complex at
the mitochondria (Chang et al. 2010). The Drp1 complex is then thought to encircle the
mitochondrial tubule, utilising its GTP-dependent hydrolysis to constrict both membranes and
eventually fragment the organelle (Ingerman et al. 2005; Friedman et al. 2011).
Upon fission, two daughter mitochondria are produced, possessing significant differences in
membrane potential. The daughter with the higher membrane potential proceeds to re-fuse back
into the mitochondrial network, while the depolarised daughter mitochondria may proceed to be
degraded by mitochondrial autophagy, as later discussed (Twig et al. 2008). Thus, regulation of
mitochondrial morphology is utilised as part of a cellular quality control system, segregating
defective mitochondria from the rest of the network.
Conversely, fusion enables the mitochondria to maintain an efficient system for: the deliverance
of ATP all over the cell (Koopman et al. 2005), the buffering of calcium levels (Raimondi et al.
2006), complementation of mtDNA (Karbowski et al. 2003), and the facilitation of lipid
membrane exchange (Osman et al. 2011). All of these processes are crucial in the maintenance
of mitochondrial functioning (Rube et al. 2004). Indeed, a study of mitochondrial morphology
in human primary fibroblasts revealed an increase in superoxide production results in an
increase in mitochondrial fusion and branching (Koopman et al. 2005). Thus, the notion has
arisen that networking of the mitochondria is an adaptive mechanism, enhancing the efficiency
of the mitochondria so that they are better able to cope with cellular stress (Koopman et al.
2005; Mortiboys et al. 2008).
Accordingly, it has been noted that loss of this mitochondrial connectivity, concomitant with the
formation of more punctate morphology, is seen upon conditions of mitochondrial dysfunction
(Karbowski et al. 2003; De Vos et al. 2005). Mitochondrial fragmentation, created by either an
inhibition of fusion or an increase in fission, can block the transmission of apoptotic calcium
waves throughout the mitochondrial network (Szabadkai et al. 2004). However, this
fragmentation is also capable of facilitating the induction of the intrinsic apoptotic cascade by
aiding the release of cytochrome c into the cytoplasm (Breckenridge et al. 2003; Germain et al.
2005; Knott et al. 2008).
Thus, the morphology of mitochondria has significant impact on the ability of the organelle to
function efficiently, and, as discussed later, aberrant functioning of the mitochondria influences
their morphology, which may lead to further deleterious effects (Koopman et al. 2005).
19

1.1.3: Mitochondrial Permeability Transition Pore
In the face of mitochondrial dysfunction, a pathological phenomena occurs, in which certain
mitochondrial proteins associate to form a pore in the IMM, permeabilising the membrane, as
evidenced by the associated swelling of the mitochondria (Iverson et al. 2004). Concomitant
with this, the ionic homeostasis of the organelle is disrupted, deregulating the proton-motive
force and subsequently diminishing the mitochondrial membrane potential (m),
consequently uncoupling oxidative phosphorylation (Zoratti et al. 1995). The resultant
generation of reactive oxygen species (ROS) and decrease in the production of ATP, alongside
the release of cytochrome c through the permeable membrane, renders the cell in an apoptotic
state (Iverson et al. 2004; Leung et al. 2008).
The composition of the mitochondria transition permeability pore (MPTP) remains
controversial. However, it is appreciated the multi-protein transmembrane channel forms at
contact sites between the OMM and the IMM (Martin 2010). The structural and modulatory
components of this channel have been suggested to include the voltage-gated anion channel
(VDAC) (Szabo et al. 1993; Martin 2010), adenine nucleotide translocator (ANT) (Halestrap et
al. 2003; Martin 2010) and cyclophilin D (CypD) (Crompton et al. 1998).
Formation and opening of the MPTP has been known to occur in the presence of calcium
overload, or oxidative stress; small ions and metabolites can then move freely across the IMM,
uncoupling electron flux and proton pumping, and inducing the collapse of the m (Crompton
et al. 1998). Thus, several components key in the generation of mitochondrial dysfunction
appear to converge on the formation of the MPTP, mediating the release of cytochrome c into
the cytoplasm.
1.2: Amyotrophic Lateral Sclerosis
1.2.1: Classification and clinical features
Amyotrophic lateral sclerosis (ALS) is a fatal neurodegenerative disorder with an incidence of
1-2/100,000 people (Wong et al. 1998). The disease is pathologically defined by the progressive
loss of motor neuron groups in the brain stem, motor cortex and spinal cord, including the
corticospinal tracts, the lower motor neurons (LMN) and anterior horn cells (Hughes 1982). The
degeneration of the pyramidal cells of the primary motor cortex is also observed (Maekawa et
al. 2004). Clinical presentation of the disease includes LMN signs of skeletal muscle wasting,
fasciculations and weakness and upper motor neuron (UMN) signs of spasticity, brisk reflexes
and pyramidal distribution weakness. Death typically results from respiratory failure within 3-5
years of disease onset (Shaw 2005; Bacman et al. 2006; Pasinelli et al. 2006).
20
1.2.1.1: Pathology of ALSThe neuropathology of ALS is defined by the presence of various inclusion bodies, including
perikaryal inclusions composed of phosphorylated neurofilaments and ubiquitinated proteins
(Cluskey et al. 2001). Lewy body-like cytoplasmic inclusions are also present, observed in the
LMNs of the spinal cord and brainstem and the corticospinal tract UMNs (Murayama et al.
1989). In some cases, these cytoplasmic inclusions contain aggregates of ubiquitin-
immunoreactive, TAR DNA binding protein-43 (TDP-43) or Superoxide dismutase 1 (SOD1),
as discussed later (Wong et al. 1995; Shaw 2005; Arai et al. 2006; Pasinelli et al. 2006).
Hyperphosphorylated neurofilamentous swellings are observed at the proximal axon and cell
body, forming axonal spheroids and hyaline conglomerate inclusions respectively (Munoz et al.
1988; Corbo et al. 1992). Pathogenic inclusions are also observed in the surrounding reactive
astrocytes, termed astrocytic hyaline inclusions, indicative of the contribution the dysfunction of
these supporting cells makes to the pathogenesis of ALS (Barbeito et al. 2004).
At a cytopathological level, mitochondrial dysmorphology is observed; swollen and vacuolated
mitochondria populate the motor neurons, as later discussed (Afifi et al. 1966; Sasaki et al.
2007). Fragmentation of the golgi apparatus (GA) is also apparent in the motor neurons,
contributing to the atrophy of the cells (Fujita et al. 2002).
The identification of ubiquitinated TDP-43 inclusions in the degenerating neuron consolidated
previous evidence of a clinical overlap between ALS and fronto-temporal dementia (FTD).
Approximately 7% of patients with ALS also exhibit clinical signs of dementia (Ringholz et al.
2005); in patients with bulbar onset ALS, the incidence of FTD is as high as 48% (Portet et al.
2001; Arai et al. 2006). Furthermore, around 50% of FTD patients also meet the criteria for
ALS (Lomen-Hoerth et al. 2002). Neuropathological examination revealed these ubiquitinated
TDP-43 inclusions to be present in FTD with ubiquitinated inclusions (FTD-U) with or without
ALS, sporadic ALS (sALS) and mutant SOD1 (mSOD1)- negative familial ALS (fALS) (Cairns
et al. 2007; Mackenzie et al. 2007). Thus, the notion of a clinical continuum of a single disease
has arisen, characterised by the presence of TDP-43 proteinopathy, as later discussed.
1.2.2: Aetiology of ALS
Despite intense research, the aetiology of ALS remains largely ambiguous, with the majority of
cases being sporadic in nature, and several pathogenic processes being implicated (Manfredi et
al. 2005; Shaw 2005) (Figure 1.1). However, in up to 10% of cases, the disease is familial in
origin; mutations in several genes have been identified and implicated in its pathogenesis.
However, both clinically and pathogenically, familial forms of the disorder are mainly
indistinguishable from the sporadic variant, indicating that similar pathogenic processes may be
involved in both forms of the disease (Manfredi et al. 2005; Shaw 2005). This is supported by
21
evidence that mutations in certain genes being causal or contributory to both familial and
sporadic forms of ALS (Table 1.1) (Shaw 2005; Pasinelli et al. 2006; Dion et al. 2009).
Figure 1.1: Multiple pathogenic processes implicated in ALS
Figure 1.1: Several pathogenic processes have been implicated as either causal or contributory to the aetiology of ALS, including excitotoxicity, mitochondrial dysfunction, oxidative stress, aberrant release of inflammatory mediators from surrounding glial cells, ER stress, impaired ribonucleic acid (RNA) metabolism and impaired protein regulation. It is currently unclear which of these processes, if any, represent the main pathogenic mechanism in disease initiation. Figure adapted from Shaw, 2005.
DISCUSS RELATIONSHIP BETWEEN FALS/SALS. IS THIS A GOOD CLASSIFICATION? SAY THAT SALS CAN BE FALS WITH LOW PENETRANCE OR THAT ALS HAS A GENETIC COMPONENT THAT CAN BE MONOGENIC (SOD) OR OLIGOGENIC.
22
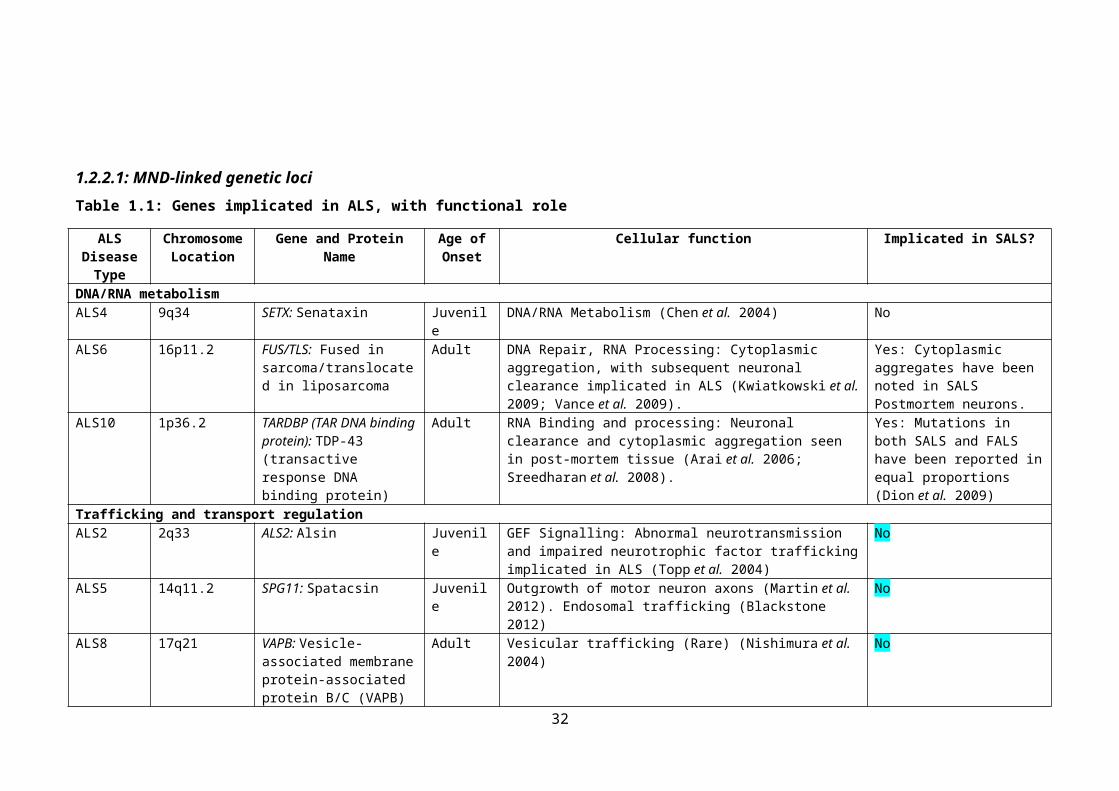
1.2.2.1: MND-linked genetic lociTable 1.1: Genes implicated in ALS, with functional role
ALS Disease Type
Chromosome Location
Gene and Protein Name Age of Onset
Cellular function Implicated in SALS?
DNA/RNA metabolismALS4 9q34 SETX: Senataxin Juvenile DNA/RNA Metabolism (Chen et al. 2004) NoALS6 16p11.2 FUS/TLS: Fused in
sarcoma/translocated in liposarcoma
Adult DNA Repair, RNA Processing: Cytoplasmic aggregation, with subsequent neuronal clearance implicated in ALS (Kwiatkowski et al. 2009; Vance et al. 2009).
Yes: Cytoplasmic aggregates have been noted in SALS Postmortem neurons.
ALS10 1p36.2 TARDBP (TAR DNA binding protein): TDP-43 (transactive response DNA binding protein)
Adult RNA Binding and processing: Neuronal clearance and cytoplasmic aggregation seen in post-mortem tissue (Arai et al. 2006; Sreedharan et al. 2008).
Yes: Mutations in both SALS and FALS have been reported in equal proportions (Dion et al. 2009)
Trafficking and transport regulationALS2 2q33 ALS2: Alsin Juvenile GEF Signalling: Abnormal neurotransmission and impaired
neurotrophic factor trafficking implicated in ALS (Topp et al. 2004)
No
ALS5 14q11.2 SPG11: Spatacsin Juvenile Outgrowth of motor neuron axons (Martin et al. 2012). Endosomal trafficking (Blackstone 2012)
No
ALS8 17q21 VAPB: Vesicle-associated membrane protein-associated protein B/C (VAPB)
Adult Vesicular trafficking (Rare) (Nishimura et al. 2004) No
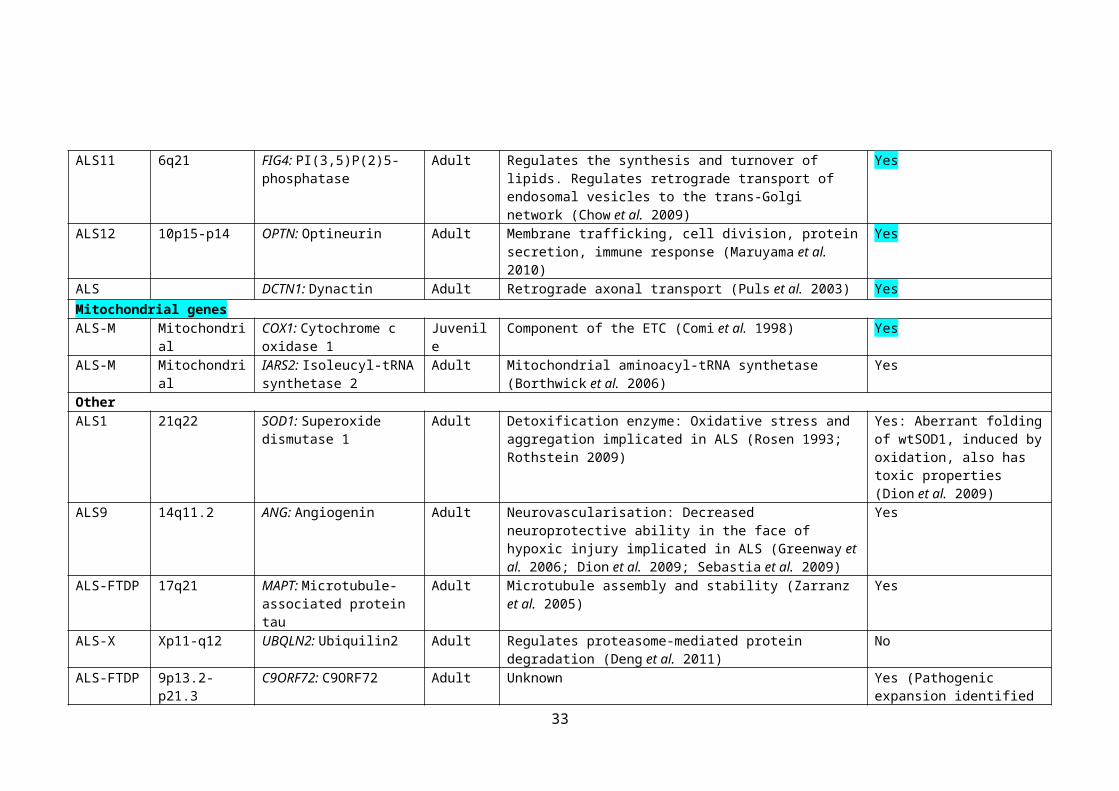
ALS11 6q21 FIG4: PI(3,5)P(2)5-phosphatase
Adult Regulates the synthesis and turnover of lipids. Regulates retrograde transport of endosomal vesicles to the trans-Golgi network (Chow et al. 2009)
Yes
ALS12 10p15-p14 OPTN: Optineurin Adult Membrane trafficking, cell division, protein secretion, immune response (Maruyama et al. 2010)
Yes
ALS DCTN1: Dynactin Adult Retrograde axonal transport (Puls et al. 2003) YesMitochondrial genesALS-M Mitochondrial COX1: Cytochrome c
oxidase 1Juvenile Component of the ETC (Comi et al. 1998) Yes
23
ALS-M Mitochondrial IARS2: Isoleucyl-tRNA synthetase 2
Adult Mitochondrial aminoacyl-tRNA synthetase (Borthwick et al. 2006)
Yes
OtherALS1 21q22 SOD1: Superoxide
dismutase 1Adult Detoxification enzyme: Oxidative stress and aggregation
implicated in ALS (Rosen 1993; Rothstein 2009)Yes: Aberrant folding of wtSOD1, induced by oxidation, also has toxic properties (Dion et al. 2009)
ALS9 14q11.2 ANG: Angiogenin Adult Neurovascularisation: Decreased neuroprotective ability in the face of hypoxic injury implicated in ALS (Greenway et al. 2006; Dion et al. 2009; Sebastia et al. 2009)
Yes
ALS-FTDP 17q21 MAPT: Microtubule-associated protein tau
Adult Microtubule assembly and stability (Zarranz et al. 2005) Yes
ALS-X Xp11-q12 UBQLN2: Ubiquilin2 Adult Regulates proteasome-mediated protein degradation (Deng et al. 2011)
No
ALS-FTDP 9p13.2-p21.3 C9ORF72: C9ORF72 Adult Unknown Yes (Pathogenic expansion identified in 4-21% of sporadic cases).
24
1.2.2.2: SOD1: Physiological role and involvement in MND
20% of familial cases of ALS result from autosomal dominant mutations in the gene encoding
SOD1 (Rosen 1993). This ubiquitous enzyme catalyses the conversion of a superoxide anion,
derived from oxidative phosphorylation, into hydrogen peroxide and dioxygen, and thus plays
imperative role in antioxidant defense (Banci et al. 2008).
MENTION RECESSIVE D-A MUTATION.EXPALAIN I113T SPORADIC MUTATION
1.2.2.2.1: Structure and location of ALS-causing mutations
SOD1 is a 32kDa homodimeric metalloenzyme, localised mainly in the cytosol of the cell. Each
of the two subunits forms a -barrel structure and possesses an active site capable of binding a
copper ion, which catalyses the dismutase activity, and a regulating zinc ion (Fridovich 1978;
Banci et al. 2008). The protein undergoes several post-translational modifications in order to
become functional, including the acquisition of the catalytic metal ions, the formation of
disulfide bonds and dimerisation of the two subunits (Arnesano et al. 2004; Banci et al. 2008).
The vast majority of mutations in SOD1 associated with ALS are missense point mutations,
which have been identified at over forty different locations throughout the gene. A large number
of these mutations are found clustered at the edges of the -barrels, at the dimer interface, or in
the zinc-binding pocket (Beckman et al. 2001). As pathogenic mutations have been identified in
SOD1 that do not cause impairment of enzymatic function, and because knock-out of the SOD1
gene does not cause motor neuron degeneration (Shefner et al. 1999), it appears that cellular
toxicity is not mediated by the loss of dismutase function. Thus, it is currently postulated that
mSOD1 confers toxicity via a gain of function mechanism (Pasinelli et al. 2006).
Most current knowledge of the pathogenic process of fALS in vivo has come from studies of
mSOD1 transgenic mouse models (reviewed by (Manfredi et al. 2005)). Furthermore, as the
pathology is largely indistinguishable between sporadic and familial ALS, these mouse models
can also be used to understand the pathogenesis of sALS.
Mitochondrial dysfunction is central to the aetiology of ALS, correlating with findings in
several other neurodegenerative disorders (Bacman et al. 2006; Lin et al. 2006). Accordingly,
SOD1 has been found to be, at least partially, localised to various regions of the mitochondria
(Jaarsma et al. 2001). Moreover, mSOD1 is highly abundant in mitochondria from nervous
tissue, when compared to tissue derived from other organs, such as the liver or heart (Mattiazzi
et al. 2002; Liu et al. 2004; Vijayvergiya et al. 2005; Damiano et al. 2006). However, its
actions once localised to mitochondrion is a highly debated topic. A diverse range of pathogenic
processes have been implicated, such as aberrant redox chemistry and oxidative stress. The
majority of the suggested processes correlate with the postulated sporadic pathogenic
25
perturbations in the neuronal system (Figure 1), again highlighting the commonality between
the familial and sporadic forms ALS (Manfredi et al. 2005; Pasinelli et al. 2006).
1.2.2.3: Tar DNA Binding Protein-43: physiological role and involvement in ALS
3% of all familial cases of ALS and 1.5% of sALS (LOW PENETRANCE?) are predicted to
arise from mutations in transactive response-DNA binding protein (TARDBP), encoding TDP-
43 (Sreedharan et al. 2008). This protein, structurally related to the hnRNP (heterogeneous
nuclear ribonucleoprotein) family, is composed of 414 amino acids, containing two RNA-
recognition motifs and a glycine-rich C-terminal domain (Wang et al. 2004). The hnRNP family
are nuclear ribosome-binding proteins, capable of forming complexes that bind heterogeneous
nuclear RNA. These complexes are present in the nucleus, regulating gene transcription and
post-transcriptional modification of the pre-mRNA, such as intron-splicing (Krecic et al. 1999).
The N-terminal domain of TDP-43 contains two nuclear-localisation signals, and the deletion of
the C-terminal domain of the protein decreases the shuttling of TDP-43 between the nucleus and
the cytoplasm (Ayala et al. 2008). The intracellular localisation of TDP-43 has been implicated
as important in the pathogenesis of ALS, as later discussed.
Though the biological role of this protein in the cell needs further characterisation, its structure
and basal localisation implicates TDP-43 in transcriptional regulation via control of RNA
splicing, transport and localisation (Buratti et al. 2008). Indeed, the C-terminal glycine domain
has been identified as important for interactions with other proteins, including hnRNPA1 and
hnRNPA2/B1 (Buratti et al. 2005). Furthermore, TDP-43 was first identified as a binding
protein of the tar-region of the DNA of HIV-1, mediating its transcriptional repression (Ou et al.
1995). It has since been found that the aforementioned association of TDP-43 with the hnRNP
family mediates exon skipping of the pre-mRNA, as noted with cystic fibrosis transmembrane
conductance regulator (CFTR) and survival motor neuron (SMN) transcripts (Colombrita et al.
2011). Additionally, in the case of SMN2, TDP-43 mediates the inclusion of exon 7, increasing
the levels of full-length SMN2 mRNA in the neuron (Bose et al. 2008). This interaction with
SMN also mediates the association of TDP-43 with Gemini of coiled bodies in the nucleus
(Wang et al. 2002), further implicating the protein in the regulation of RNA processing.
SMN INVOLVEMENT IN SMA
Additionally, TDP-43 has recently been identified as a component of stress granules, helping to
mediate the cessation of mRNA translation under conditions of cellular stress. These granules
act to block translation via the sequestration of actively translating mRNA. However, it is
currently unclear if the presence of TDP-43 is necessary for the formation of this complex
(Colombrita et al. 2009).
26
A systematic screen of ALS-associated and synthetic TDP-43 isoforms in both Drosophila and a
chick vertebrae system revealed an inherent need for the RNA-binding function of TDP-43 to
invoke neurotoxicity upon overexpression of the protein. This was observed in a dose-
dependent manner, implicating defects in the RNA-binding ability, and thus regulation of
mRNA processing in the pathogenesis of neurodegeneration (Voigt et al. 2010).
Furthermore, high throughput sequencing following depletion of TDP-43 in an adult mouse
brain identified 601 mRNA expression level changes and 965 altered mRNA splicing events
compared to control samples. Many of the affected genes are involved in the regulation of
synaptic activity, indicative of how malfunction of the protein could result in motor neuron
degeneration (Polymenidou et al. 2011).
Sequence analysis has revealed that the majority of ALS pathogenic mutations of TARDBP are
located in exon 6, encoding the C terminal glycine-rich domain (Kabashi et al. 2008; Kirby et
al. 2010). As mentioned, this region is implicated in protein-protein interaction, with specific
binding to hnRNPs (Liscic et al. 2008; Sreedharan et al. 2008). Thus, the pathogenic action of
the protein is hypothesised to arise from aberrant splicing or stabilisation of mRNA species.
Several genes important for neuronal functioning are regulated by the action of TDP-43. The
editing of GluR2, a subunit of the glutamatergic 2-amino-3-(3-hydroxy-5-methyl-isoxazol-4-yl)
propanoic acid (AMPA) receptor, is regulated by TDP-43 (Sommer et al. 1991). Thus, the
regulation of calcium homeostasis may be compromised in the presence of mTDP-43. TDP-43
also mediates the nuclear to cytoplasmic shuttling of RNA granules, including the mRNA of
neurofilament-light polypeptide and -actin. Furthermore, the binding of TDP-43 to its 3’ UTR
also stabilizes the neurofilament-light mRNA (Strong et al. 2007). Therefore, the stability of the
neuronal cytoskeleton may be disrupted by the expression of mutant TDP-43 (mTDP-43). Thus,
TDP-43 participates in the functioning of pathways essential for the maintenance of motor
neuronal physiology. This was further demonstrated by experiments in transgenic mice
overexpressing wild type TDP-43. The nuclear distribution and abundance of SMN-interacting
Gemini of coiled bodies (GEMs) are disrupted in this model. Conversely, depletion of TDP-43
prevents the formation of GEMs (Shan et al. 2010), providing further evidence of perturbed
neuronal RNA metabolism in the face of TDP-43 dysregulation.
Furthermore, the toxicity of the deregulation of TDP-43 can also manifest itself in
mitochondrial dysfunction; alterations in mitochondrial fusion and fission proteins have been
noted in TDP-43 transgenic mouse models. Abnormal trafficking and aggregation of defective
mitochondria was also observed (Xu et al. 2010). Thus, the bioenergetic status of the neuron
could be altered in the presence of mTDP-43. This mitochondrial defect will be discussed in
further detail later.
27

1.2.2.3.1: Pathogenesis
TDP-43 was first predicted to have a pathogenic role in ALS after identification of hyper-
phosphorylated, insoluble, C terminal fragments of the protein in the ubiquitinated cytoplasmic
inclusions that characterise sALS and non-SOD1 cases of fALS (Arai et al. 2006; Neumann et
al. 2006). This cytoplasmic accumulation of the TDP-43 arises concomitant with nuclear
depletion of the protein, further implicating defective transcriptional regulation as the
pathogenic mechanism of the mTDP-43 protein (Arai et al. 2006). As previously mentioned,
several neurodegenerative diseases are characterised by the presence of inclusions composed of
abnormal TDP-43, including FTD-U and Lewy-body related disease, now given the umbrella
term of TDP-43 proteinopathy (Geser et al. 2009). The pathological form of TDP-43 in these
diseases typically shows the same abnormal processing, including hyperphosphorylation,
ubiquitination and loss of the N-terminal portion of the protein (Liscic et al. 2008).
Other pathological inclusions identified in ALS, such as skein-like inclusions, neuronal
intranuclear inclusions and glial inclusions, also stain positive for TDP-43 (Arai et al. 2006),
indicating widespread dysfunction of this protein contributes to the neurodegeneration.
1.2.2.3.2: Models of TDP-43-mediated degeneration
Current mouse models of TARDBP have provided conflicting reports concerning the pathogenic
mechanism of dysregulated TDP-43. Differences may have arisen from the various methods of
model generation, including transient or stable transfection, random or targeted insertion of the
transgene, or whether the wild type or mutant form of the TDP-43 is inserted (Voigt et al.
2010). For example, it is debated whether the cleavage and aggregation of TDP-43 is necessary
to mediate its neurotoxic effects (Wils et al. 2010; Igaz et al. 2011).
However, the overall consensus is that overexpression of the wild type form of TDP-43 is as
toxic as the expression of the mutant form. Studies in both mice and Drosophila revealed the
expression of wild type TDP-43 resulted in the degeneration of various neuronal subpopulations
WHY NEURONAL? (Li et al. 2010; Wils et al. 2010). In the Drosophila melanogaster model,
axonal swelling, reduction in the number of synaptic boutons and a reduction in the number of
axonal branches were observed alongside motor neuron loss (Li et al. 2010). Thus, it has been
postulated that aberrant regulation of TDP-43 levels or a decreased ability to effectively clear
the protein may contribute to the pathogenesis of ALS.
Overexpression of full-length wild type human TDP-43 in mouse brain and spinal cord resulted
in the phosphorylation, N-terminal cleavage, intranuclear and cytoplasmic aggregation of the
ubiquitinated protein, mimicking the pathogenic state of the protein in ALS neurons. Motor
deficits are also evident, manifesting in gait abnormalities. This deficit arises from the axonal
degeneration of cortical and spinal motor neurons, resulting in early mortality in the transgenic
28
mice. Interestingly, a dose-dependent downregulation of endogenous mouse TDP-43 was seen,
implicating a self-regulating expression pattern of TDP-43 (Xu et al. 2010).
Expression of mutant forms of human TDP-43 throughout the nervous system in transgenic
mice also resulted in the aggregation of ubiquitinated proteins in neuronal populations,
including the spinal motor neurons. However, though the typical cytoplasmic aggregates of
TDP-43 were not observed in this model of ALS, expression of mTDP-43 still resulted in a
progressive and fatal neurodegenerative disorder (Wegorzewska et al. 2009).
1.2.2.3.3: Gain or loss of function in pathogenesis
It is currently unclear whether the neurotoxicity mediated by mTDP-43 expression derives from
a gain or loss of function mechanism. The identification of fragmented, hyperphosphorylated
TDP-43-containing cytoplasmic aggregates not only in ALS, but also in other
neurodegenerative disorders, supports a toxic gain of function mechanism of the protein. This is
supported by evidence derived from animal models where the overexpression of both the wild
type and mutant forms of TDP-43 are toxic. This toxicity was found to be dose-dependent; in
primary rat cortical neurons, the cellular degeneration correlated with the amount of mTDP-43
localised in the cytoplasm (Barmada et al. 2010).
Additionally, transfection of C-terminal fragments (CTFs) of TDP-43 into SH-SY5Y cells
recapitulated the pathological features of a TDP-43 proteinopathy, including the cytoplasmic
accumulation, hyperphosphorylation and ubiquitination of the protein, mediating cellular
toxicity (Nonaka et al. 2009). Furthermore, aggregates of these 25kDa CTFs of TDP-43 have
been observed to increase during the progression of the disease in transgenic mice (Wils et al.
2010). Thus, the accumulation of TDP-43 in the cytoplasm does appear to be toxic, reflecting a
common theme of pathogenic protein accumulation in neurodegeneration.
Conversely, the fact that the cytoplasmic deposition of TDP-43 is associated with a reciprocal
reduction of TDP-43 in the nucleus, suggests a loss of function mechanism in TDP-43-related
pathogenesis (Arai et al. 2006; Neumann et al. 2006). This theory is supported by the
identification of numerous genes implicated in neuronal maintenance that are under the control
of TDP-43, including SMN2, -actin and neurofilament-light (Strong et al. 2007; Bose et al.
2008; Colombrita et al. 2011), as well as the reliance on TDP-43 expression for the formation of
GEMs in the neuron (Shan et al. 2010). Furthermore, as mentioned, studies of TDP-43 mouse
models noted that ALS-like symptoms arose in the absence of TDP-43 cytoplasmic inclusions,
suggesting that disease in this model arises from defective functioning (Wegorzewska et al.
2009), i.e., compromised processing of nuclear pre-mRNA, and not the cytoplasmic
aggregation, of TDP-43. In support of this, it has been noted that the nuclear clearance of TDP-
43 is an early event in sALS, preceding the formation of the cytoplasmic aggregates (Giordana
et al. 2010). Dispersed cytoplasmic TDP-43, termed pre-inclusions have also been observed in 29

FTD-TDP (Brandmeir et al. 2008), further implicating nuclear clearance, and not cytoplasmic
aggregation, in the degeneration of neurons.
However, it is possible that mTDP-43 acts by both a gain and loss-of-function mechanism;
overexpression of human mTDP-43 in zebrafish resulted in the formation of shortened motor
neuron axons, excessive axonal branching and motor deficits. However, knockdown of
zebrafish TDP-43 resulted in the same pathogenic phenotype, which could be rescued by the
expression of human wild type TDP-43 (Kabashi et al. 2010). Thus, it appears that both gain
and loss of function defects in TDP-43 can mediate neurotoxicity.
1.2.2.4: C9ORF72 Discovery
Recently, two independent groups have identified a GGGGCC hexanucleotide repeat expansion
in the non-coding region of C9ORF72, located at locus 9p21, as being pathogenic in both ALS
and FTD ((DeJesus-Hernandez et al. 2011; Renton et al. 2011). Results between cohorts have
been variable, with factors such as ethnicity influencing frequency (Majounie et al. 2012), but
this pathogenic expansion is present in an average 37.5 12.2% of fALS cases across 3
cohorts, and 10.7 9% of sporadic cases, thus making it the most common genetic cause of
ALS identified to date (DeJesus-Hernandez et al. 2011; Renton et al. 2011; Cooper-Knock et al.
2012). However, the function of C9ORF72 in the cell is currently unknown, and is the subject
of intense research due to the implications for both ALS and FTD.
Analysis of the non-coding region of C9ORF72 revealed the polymorphic hexanucleotide repeat
expansion in intron 1, located between exons 1a and 1b. The length of the pathogenic expansion
is estimated to be between 6.5-12kb, corresponding to around 700-1600 repeats (DeJesus-
Hernandez et al. 2011; Renton et al. 2011). Conversely, control subjects were found to possess
around 2 repeats; however, expanded repeat sequences have been identified in healthy control
subjects (Cooper-Knock et al. 2012). The precise number of repeats required to be pathogenic is
presently unknown. 30 repeats has been set as a cut-off for the threshold for a pathogenic
expansion currently (Cooper-Knock et al. 2012).
Alternative splicing produces three transcript variants, predicted to result in the expression of 2
alternative protein isoforms of C9ORF72 (DeJesus-Hernandez et al. 2011). It is currently
unclear whether the pathogenic expansion has different effects on either isoform. However, as
discussed shortly, RNA expression levels may be isoform specific.
Presently, there is no common consensus as to which antibody against C9ORF72 is the best. In
spite of this, initial immunohistochemistry experiments revealed a punctate staining pattern
throughout the grey matter of the central nervous system (CNS) (Cooper-Knock et al. 2012).
30

The protein appears largely cytoplasmic in the neurons (DeJesus-Hernandez et al. 2011;
Cooper-Knock et al. 2012). Analysis of RNA levels saw the highest expression in the
cerebellum (Renton et al. 2011). It is currently unclear if there is isoform specificity in tissue
expression. No difference was observed in protein expression patterns between patients
possessing the pathogenic expansion and control samples, using a rabbit polyclonal antibody
whose epitope has been mapped to an internal region of human C9ORF72 (Santa Cruz Bio-
tech) (Cooper-Knock et al. 2012).
The clinical manifestation of ALS as a result of this pathogenic expansion is fairly typical. Both
disease duration and age of onset are lower when compared to other variants of ALS, but
otherwise, disease progression is relatively standard (Cooper-Knock et al. 2012). With regards
to the neuropathology, the presentation was also typical. The classical TDP-43-positive
inclusions were present in the spinal motor neurons, along with substantial loss of LMNs in the
spinal cord anterior horn. However, of note in the C9ORF72 expansion cases, was the
significant increase in extra-motor p62-positive neuronal cytoplasmic inclusions. These
inclusions, most pronounced in subregions of the hippocampus, may also stain positive for
OPTN and TDP-43, but a proportion are p62-positive and TDP-43-negative (Al-Sarraj et al.
2011). Furthermore, a significant increase in the number of nuclear RNA foci was observed in
the frontal cortex and spinal cord neurons in patients possessing the pathogenic expansion
(DeJesus-Hernandez et al. 2011; Cooper-Knock et al. 2012).
It has been postulated that the intronic expansion results in the generation of toxic RNA species.
These foci may sequester key RNA binding proteins, disrupting the splicing of mRNA. Indeed,
disruption of RNA metabolism has previously been implicated in the pathogenesis of ALS due
to mutations in TARDBP and FUS/TLS (Wegorzewska et al. 2009; Lagier-Tourenne et al. 2010;
Yang et al. 2010). Furthermore, in a family possessing the pathogenic expansion in C9ORF72,
defects in the metabolism of RNA encoding excitatory amino acid transporter 2 (EAAT2) was
discovered (Lin et al. 1998; Renton et al. 2011).
Conversely, the repeat expansion in C9ORF72 may manifest in disease through a loss of
function mechanism. DISCUSS!!!! There have been reports of a decrease in the RNA
expression levels of transcript variant 1 of C9ORF72 in patient lymphoblast cells, compared to
non-repeat patients (DeJesus-Hernandez et al. 2011). However, C9ORF72 RNA levels
remained unchanged in frontal cortex patient samples, though results were inconsistent between
laboratories (Renton et al. 2011). Furthermore, this loss of expression could not be
experimentally verified at the protein level (DeJesus-Hernandez et al. 2011). It is possible that
the turnover or function of the protein is affected (DeJesus-Hernandez et al. 2011). However,
there are controversies surrounding the currently available commercial antibodies, impeding
31
quantification of C9ORF72 protein levels and localisation (DeJesus-Hernandez et al. 2011;
Renton et al. 2011).
32
1.2.3: Mitochondrial dysfunction in ALS: evidence in models and patients
1.2.3.1: Functional defects
1.2.3.1.1: Oxidative phosphorylation defects
Oxidative stress, particularly that derived from oxidative phosphorylation, has been implicated
in the pathogenesis of ALS (Mattiazzi et al. 2002; Wiedemann et al. 2002). Studies in patients
with ALS have identified; (i) a sporadic micro-deletion in COI, encoding subunit I of
cytochrome-c oxidase, causing defective assembly of the holoenzyme (Comi et al. 1998); (ii)
evidence of reduced activity of the respiratory chain complexes in post-mortem spinal cord
tissue (Wiedemann et al. 2002); (iii) a significant increase in the levels of oxidised ETC
cofactor, CoQ10, in sALS cerebrospinal fluid (CSF) (Murata et al. 2008); (iv) an increase in the
amount of both lactate and ROS in patient blood samples, following exercise (Siciliano et al.
2002).
These observations have been supported by data generated using mSOD1 transgenic mice. A
reduction in ETC complex activity, beginning with a pre-symptomatic decrease in activity of
complex I, and progressing to decreased function of complex IV following disease onset, has
been observed in the ventral horn motor neurons of G93A mSOD1 transgenic mice (Gurney
1994; Jung et al. 2002; Mattiazzi et al. 2002). This decrease in ETC activity could be rescued
with the introduction of exogenous reduced cytochrome c. Thus, oxidised cytochrome c has
been implicated as a key defective protein in the respiratory chain in ALS (Kirkinezos et al.
2005).
1.2.3.1.2: Oxidative stress
The generation of ROS, derived from multiple sources including defective oxidative
phoshorylation, is devastating for both the mitochondria and the cell (Kruman et al. 1999;
Mattiazzi et al. 2002; Martin et al. 2009; Murphy 2009).
DEFECTIVE MITOCHONDRIA GIVE INCREASED ROS….HOW SPECIFIC?
ROS IN GLIA….ALSO IMPLICATED IN MND
Evidence of free radical damage, including increased levels of 3-nitrotyrosine, indicating
peroxynitrite-mediated nitration of protein tyrosine residues, has been found in patient CSF
(Tohgi et al. 1999). Furthermore, mSOD1 mouse models also displayed evidence of oxidative
stress in spinal motor neurons, including peroxidation of mitochondrial membrane lipids,
carbonylation of proteins and increased oxyradical production (Kruman et al. 1999).
33

This free radical-mediated damage can have severe consequences for both the mitochondria
and, indeed, the cell. For example, the peroxidation of the anionic IMM lipid cardiolipin
disrupts both its hydrophobic and electrostatic interactions with cytochrome c. Consequently,
cytochrome c becomes concentrated in the IMS, disrupting oxidative phosphorylation and
rendering the cell vulnerable to apoptotic induction (Guegan et al. 2001; Iverson et al. 2004;
Kirkinezos et al. 2005; Paradies et al. 2009). Furthermore, the levels of ROS produced by the
mitochondria is exacerbated, resulting in further cellular toxicity (Paradies et al. 2009).
LOOK FOR PAPER ON SOD1 IN IM….PNAS
1.2.3.1.4: Mitochondrial permeability transition
Recent evidence has implicated pathological MPTP in ALS, as the product of the convergence
of the aforementioned mitochondrial dysfunction. The dominant feature in G93A mSOD1
transgenic mice is the swelling of mitochondria, likely due to alterations in permeability of the
mitochondrial membrane, suggestive of VDAC opening (Jaarsma et al. 2001). Further study of
these mice have shown that genetic ablation of CypD, or pharmacological modulation of
VDAC, significantly delays onset and progression of the disease phenotype (Bordet et al. 2007;
Martin et al. 2009); thus, evidence suggests that formation of the MPTP is causally involved in
the ALS phenotype.
Conversely, there is evidence negating the role of mitochondria permeability transition in ALS.
It has been suggested that the vacuolisation observed in the mitochondria is not indicative of
pore formation, nor is there expansion of the mitochondrial matrix, a feature normally
associated with pore formation (Xu et al. 2004). Thus, activation of permeability transition
appears superfluous in the degeneration of motor neurons in ALS. It is evident that the pro-
apoptotic protein Bax is able to induce permeabilisation of the mitochondrial membrane,
permitting the cytosolic release of cytochrome c independent of the MPTP (Degli Esposti et al.
2003). Levels of Bax are increased in ALS motor neurons; it is therefore possible that this is
sufficient for the induction of apoptosis (Ekegren et al. 1999).
1.2.3.1.5: Excitotoxicity and impaired calcium buffering capacity
Evidence from both patients and models of the disease suggest that impaired calcium buffering
by mitochondria in the motor neuron is a key pathophysiological process in ALS. Raised levels
of glutamate have been reported in ALS patient CSF, possibly indicating elevated intracellular
calcium levels (Rothstein et al. 1990). Additionally, mSOD1-expressing neuroblastoma cells
showed increased levels of cytoplasmic calcium, found to be associated with a significant
decrease in m (Carri et al. 1997).
Furthermore, an early decrease in the calcium buffering capacity of the mitochondria, taken
from the brain and spinal cord of mSOD1 transgenic mice, has been noted, reducing the m
34

and creating dysfunctional mitochondria. Following challenge with calcium, these mitochondria
were also less efficient at membrane re-polarisation, suggesting that, in the presence of mSOD1,
the mitochondria are defective at calcium buffering, and thus sensitise the motor neuron to
excitotoxic stress (Damiano et al. 2006). Indeed, mSOD1 transgenic mice, crossed with mice
showing a decrease in the calcium permeability of spinal motor neuron AMPA receptors,
demonstrated a substantial delay (19.5%) in ALS symptom onset (Tateno et al. 2004). The
cause of the early increase in motor neuronal calcium levels is currently unknown. In sALS, it
may derive from the observed decreased expression of the glutamate transporter, EAAT2 (Shaw
et al. 1994; Guo et al. 2000). Furthermore, resulting from low expression of the GluR2 AMPA
receptor subunit, sALS patient motor neurons express a higher amount of calcium permeable
AMPA receptors than control samples (Kawahara et al. 2004). Thus, in sALS, extracellular
glutamate results in the excessive stimulation of the calcium-permeable AMPA receptor.
In fALS, murine models have demonstrated that mSOD1 is capable of interacting with AMPA
receptors in such a way as to render them more permeable to calcium (Spalloni et al. 2004).
Additionally, mSOD1 expression results in a significant loss of EAAT2 expression, specifically
in areas of neurodegeneration (Bendotti et al. 2001). Indeed, in numerous mSOD1 mouse
studies, the application of high concentrations of glutamate was toxic to the motor neurons,
consistent with the evidence of decreased calcium buffering in these cells (Roy et al. 1998;
Kruman et al. 1999; Jung et al. 2002). Therefore, upon expression of mSOD1, the physiological
calcium influx will exacerbate mitochondrial dysfunction leading to the eventual degeneration
of the motor neuron (Van Den Bosch et al. 2006).
As later discussed, dysfunction of the calcium buffering-interaction between mitochondria and
ER may contribute to deregulated calcium homeostasis in the degenerating motor neuron
(Grosskreutz et al. 2010). The ER stress reported in mSOD1 models contribute to the disruption
of this calcium buffering process (Atkin et al. 2006; Atkin et al. 2008).
1.2.3.2: Dysmorphology
1.2.3.2.1: Aberrant vacuolisation of mitochondria
Abnormalities in the morphology of mitochondria were initially noted in patient autopsy
specimens; subsarcolemmal aggregates of mitochondria were observed in the skeletal muscle
(Afifi et al. 1966). Fragmentation of the mitochondrial network, alongside swelling of
mitochondrial cristae, has also been detected sALS patients, specifically in the proximal axons
of anterior horn motor neurons (Sasaki et al. 2007; Magrane et al. 2009). In transgenic G93A
mSOD1 mice (Gurney 1994), ultrastructural studies revealed the presence of membrane bound
35

vacuoles, originating from the degenerating mitochondria, via distension of the OMM and
expansion of the IMS (Jaarsma et al. 2001).
1.2.3.2.2: Defective mitochondrial dynamics
Post-mortem examination of the anterior horn in sALS patients showed fragmentation of the
motor neuronal mitochondria, suggesting defective fusion or an increase in mitochondrial
fission is involved in the pathogenesis of ALS (Sasaki et al. 2007). This notion is supported by a
study of cultured motor neurons derived from G93A mSOD1 transgenic mice; mitochondria
displayed a decreased aspect ratio, suggesting a “rounding up” of individual mitochondria (De
Vos et al. 2007). Furthermore, an NSC-34 cell line stably transfected with mSOD1 also showed
fragmentation of the mitochondrial network, as well as significant remodelling of the
mitochondrial cristae (Menzies et al. 2002; Raimondi et al. 2006). Similarly, a morphological
study of differentiated NSC-34 cells transfected with IMS-targeted mSOD1 also demonstrated a
significant decrease in mitochondrial length, further indicative of mitochondrial fission in the
presence of mSOD1 (Magrane et al. 2009).
Consistent with this, the functioning of mitochondrial fusion protein OPA1 is reliant on the
maintenance of the m. Dissipation of this is sufficient to abolish the fusion process
(Duvezin-Caubet et al. 2006). Accordingly, a reduction in the m was seen in motor neurons
derived from mSOD1 mice. Thus, mitochondrial dysfunction can have substantial secondary
effects on the dynamic capabilities of mitochondria, impacting on their morphology (De Vos et
al. 2007).
Further evidence for defective mitochondrial fusion in ALS has also emerged from study of
both TDP-43 models and biosamples from sALS patients. In a transgenic mouse model with
neuronal expression of wild type human TDP-43, abnormal juxtanuclear clusters of
mitochondria were observed in the spinal motor neurons. These mitochondria appeared to be
degenerating, with vacuoles in the matrix and decreased cristae. Interestingly, expression levels
of Mfn1 were decreased, with concomitant increase in the expression of Fis1 and
phosphorylated Drp1, suggestive of a defect in the regulation of mitochondrial dynamics in the
presence of toxic levels of TDP-43 (Xu et al. 2010). It is possible that overexpression of TDP-
43 alters the RNA processing of genes implicated in mitochondrial maintenance, resulting in the
accumulation of dysfunctional, fragmented mitochondria. Evidence of defective mitochondrial
dynamics has also emerged from the study of sALS patient keratinocytes. Electron microscopy
revealed a significant decrease in the length, area and perimeter of the mitochondria in sALS
patient skin cells compared to control samples. Cristolysis was also observed, indicative of
mitochondrial degeneration in these peripheral cells (Rodriguez et al. 2012).
36

1.3: Relationship between Dysmorphology and DysfunctionA wealth of evidence supports the notion of an intricate relationship between dysfunction and
dysmorphology, particularly in the mitochondria. Investigation in CV1 cells revealed that
inhibition of electron transport, or ATP synthase, mimicking an oxidative phosphorylation
deficit, results in fragmentation of the mitochondrial network. The observed decrease in the
aspect ratio of the mitochondria resulted from Drp-1-mediated reversible fission (De Vos et al.
2005). Furthermore, the aforementioned consequences of defective oxidative phosphorylation,
such as lipid peroxidation, superoxide production and an altered REDOX state can all manifest
in morphological alterations (Shutt et al. 2012). For example, pathological levels of superoxide
in fibroblasts, derived from defects within the ETC, decrease the complexity of branching
patterns of the mitochondria, an effect postulated to arise from increased lipid peroxidation in
the mitochondrial membrane (Koopman et al. 2005).
Secondary consequences of defective oxidative phosphorylation can also impact on
mitochondrial morphology. As mentioned, depolarisation of the mitochondrial membrane
inhibits the action of the fusion protein OPA1 contributing to the observed fragmentation of the
mitochondrial network (Duvezin-Caubet et al. 2006). Furthermore, as later discussed, the
activation of the intrinsic apoptotic cascade in response to mitochondrial dysfunction results in
the recruitment of Drp-1 to the mitochondria, where it is seen to colocalise on the OMM with
Bax (Karbowski et al. 2002). This Drp1-mediated fission is possibly recapitulated in the ALS
motor neurons, where an aberrant increase in Bax mRNA level has been reported (Mu et al.
1996; Martin 1999; Gonzalez de Aguilar et al. 2000).
Thus, the functional deficits in motor neuron mitochondria result in a profound effect on the
morphology of the mitochondria. Interestingly, the reverse is also true; a change to the
morphological state of the mitochondria will serve to exacerbate, or indeed induce, functional
deficits in the organelle. The shift towards an unbranched, fragmented morphological state,
noted in models of ALS, could exacerbate mitochondria functional defects, via activation of
apoptosis and loss of the efficient energy delivery system required to meet the demands of the
metabolically active motor neuron (Karbowski et al. 2003; Koopman et al. 2005; Knott et al.
2008).
Furthermore, alterations in mitochondrial morphology will undoubtedly alter the organelle’s
interaction with surrounding structures, such as the ER, with further functional consequences
(Simmen et al. 2005). Additionally, the mitochondrial quality control system, mitochondrial
autophagy, is highly dependent on the morphology of the organelle (Ziviani et al. 2010).
Finally, axonal transport of mitochondria is also reliant on their morphology, as recently
demonstrated in a cellular model of mSOD1 ALS; fragmentation of the mitochondria abrogated
37
their axonal transport in both directions (Song et al. 2013). These processes, and their
relationship to mitochondrial morphology, are discussed in further detail below.
1.3.1: Mitochondrial associated membranes
The morphology and localisation of organelles is essential for their efficient functioning. The
association of ER and mitochondria highlights this; bidirectional communication between the
two is now appreciated as necessary for the maintenance of multiple cellular functions, such as
the homeostasis of calcium levels, lipid metabolism and regulation of apoptosis (Hayashi et al.
2009; de Brito et al. 2010).
The notion of this close positioning of the ER and the mitochondria first arose in the 1960s
(Ruby et al. 1969), with empirical evidence emerging in the 1990s, through fractionation
experiments (Vance 1990; Hayashi et al. 2009). Electron microscopy confirmed the direct
communication between the ER and mitochondria, mediated by physical linkers (Morre et al.
1971; Csordas et al. 2006). It is estimated that roughly 12% of the mitochondrial network is
associated with the peripheral tubular ER, at sites termed the “mitochondria associated
membrane” or “MAM”. The two organelles interact at distances ranging from 10-200nm (Soltys
et al. 1992; Csordas et al. 2006), though this association is appreciated to be highly dynamic.
1.3.1.1: Roles of the ER-mitochondria association
1.3.1.1.1: Lipid metabolism
One of the first identified roles for the MAM was in the homeostasis and membrane shuttling of
sphingolipids, phospholipids and cholesterol. The metabolic enzymes of cholesterol and its
derivatives are highly enriched at the MAM, suggesting that this area serves as a site for both
cholesterol synthesis and processing of its metabolites (Rusinol et al. 1994). Furthermore, the
enzyme required for the conversion of cholesterol to pregnenolone (cytochrome P450scc) is
located in the mitochondria, indicative of the shuttling of cholesterol between the two organelles
(Thomson 2003; de Brito et al. 2010), and highlighting the importance of the close juxtaposition
of the ER and the mitochondria.
1.3.1.1.2: Calcium homeostasis
Homeostasis of calcium levels is critical for the physiological functioning of the cell. However,
despite the effective calcium buffering capacity of mitochondria, the OMM calcium uniporter
has a notably low affinity for calcium (Rizzuto et al. 1993; Rizzuto et al. 1998; de Brito et al.
2010). This led to the proposal for the existence of a calcium microdomain, allowing focal
38
release of calcium at a high enough concentration to be efficiently buffered by the mitochondria
(Rizzuto et al. 1993; Rizzuto et al. 1998; de Brito et al. 2010). Accordingly, the close contact
points between the ER tubules and mitochondria are enriched in Inositol trisphosphate
receptors, type 3 (IP3R3s) (Mendes et al. 2005).
These calcium microdomains at the MAM allow mitochondrial metabolism to be finely tuned to
cellular calcium signals (Hayashi et al. 2009). Calcium regulates the activity of a number of
enzymes of the TCA cycle and the ETC (Bernardi 1999; de Brito et al. 2010). Thus, hormonal
stimulation can activate IP3 signalling, increasing subsequent calcium uptake into the
mitochondria, leading to increased output of the TCA cycle and the ETC (Hayashi et al. 2009).
However, this calcium uptake represents a delicate balance for the mitochondria. The entry of
calcium into the mitochondrial matrix is energetically costly due to transient depolarisation of
the IMM (de Brito et al. 2010). Furthermore, too much calcium entering the mitochondria
results in the opening of the MPTP, subsequent dissipation of the m, and the onset of
apoptosis (Bernardi 1999; Brustovetsky et al. 2002; de Brito et al. 2010). Indeed, a distance of
less than 5nm between the mitochondria and the ER is sufficient to result in calcium
overloading in the mitochondria (Csordas et al. 2006). This PTP-mediated induction of
apoptosis results in a deadly self-propagating loop; cytochrome c can stimulate the IP3R
enriched at the MAM, ensuring further overload of calcium into the mitochondria (Boehning et
al. 2003). Conversely, increasing the space between the two organelles abrogates this calcium
transmission, with subsequent damage to the metabolism of the mitochondria (Csordas et al.
2006).
1.3.1.1.3: Apoptosis
As well as regulating the calcium-mediated induction of apoptosis the morphology at the MAM
can also influence cell death. DRP1 and phosphofurin acidic cluster sorting protein 2 (PACS-2),
both involved in the maintenance of the MAM, as later discussed, can modulate the induction of
apoptosis through the fragmentation of the mitochondrial network and recruitment of the pro-
apoptotic protein Bid to the mitochondria. With such a key role in the regulation of apoptosis,
the distance between the ER and the mitochondria is finely regulated. It has been observed that
the distance can alter in response to increases in cytosolic calcium induced by IP3 stimulation
(Csordas et al. 2006).
1.3.1.2: Protein linkers of the MAM
The proteins responsible for the formation and regulation of the linkage between the ER and the
mitochondria are still being discovered, though some have been well characterised (Figure 1.2
and Table 1.2).
39
Figure 1.2: The mitochondria-associated membrane (MAM)
Figure 1.2: The identified physical linkers between the ER and the mitochondria are depicted. The Mmm1 and Mdm protein complex has only been identified in yeast; the mammalian counterpart remains elusive (Kornmann et al. 2009). Drp1 and PACS-2 play an indirect role in the regulation of the MAM (de Brito et al. 2010). Figure adapted from de Brito et al, 2010.
40

Table 1.2: Identified Protein Linkers and Regulators at the MAM
ER protein linker
Mitochondria protein linker
Significance at the MAM
Consequence of knockdown
Reference:
IP3R VDAC First proteins linked to the juxtaposition of the ER and mitochondria.
Linkage between ER and mitochondria remained, indicating that additional tethering proteins are present at the MAM.
(Csordas et al. 2006; Szabadkai et al. 2006).
Mfn2 Heterotypic interaction with Mfn1 or homotypic interaction with Mfn2.
First identification of calcium microdomain.
Mfn2 knockout MEFs saw 40% reduction in the juxtaposition of the ER and mitochondria, with subsequent decrease of mitochondrial calcium uptake.
(de Brito et al. 2008).
Mmm1 Mdm34, Mdm10, Mdm12
Only present in yeast as a tethering multimeric complex termed the ERMES*. Possibly a linker specifically for the transfer of phospholipids.
(Kornmann et al. 2009; de Brito et al. 2010).
VAPB PTPIP51 Implicates defective MAM regulation in ALS.
Knockdown in a HEK293 (human embryonic kidney) cell line resulted in a reduction and delay in mitochondrial calcium uptake.
(De Vos et al. 2012)
Adaptor, Chaperone and Regulatory Proteins at the MAM
Location Protein Consequence of knockdown Reference
ER Sig-1R Impaired functional recovery of IP3R3s after ATP stimulation, reducing mitochondrial calcium uptake following repeated IP3 stimulation.
(Hayashi et al. 2007)
Cytoplasm Grp-75 Decreased mitochondrial accumulation of calcium following IP3R3 stimulation.
(Szabadkai et al. 2006)
Cytoplasm PACS-2 Mitochondrial fragmentation via induction of cleavage of Bap31 and subsequent production of p20 and Drp1 activation. Activation of BiP in the ER, increasing cytosolic calcium levels.
(Simmen et al. 2005)
Cytoplasm Drp1 Mitochondrial fusion, reduction in ER membranes. (Cereghetti et al. 2010; Friedman et al. 2011)
Table 1.2: A list of the proteins thus far identified in either tethering or regulating the linkage of ER and mitochondria at the MAM. * ERMES: “ER-mitochondria –encounter-structure”
41
1.3.1.3: MAM and neurodegenerative disease
The maintenance of MAMs is particularly important for neuronal survival, and as such, has
been implicated in the pathogensis of several neurodegenerative diseases. Mutations in VAPB
result in a rare form of ALS (Nishimura et al. 2004). The ALS8 mutant, VAPBP56S, leads to an
increase in the binding of the protein to PTPIP51, and accumulation at the MAM. Enhanced
levels of mitochondrial calcium, with a concomitant decrease in cytosolic calcium levels, were
observed upon expression of VAPBP56S in cultured rat cortical neurons, confirming that
expression of this pathogenic mutation can disturb MAM regulation in a physiologically
relevant cell type (De Vos et al. 2012).
Mutations in Mfn2 result in the peripheral axonal neuropathy, Charcot-Marie-Tooth 2A
(CMT2A) (Zuchner et al. 2004). The disease may result from a defect of mitochondrial axonal
transport, possibly stemming from the inability to form MAMs upon mutation of Mfn2,
resulting in bioenergetic failure. Transfection of disease-relevant mutant constructs of Mfn2
failed to rescue the downregulation in the number of MAMs in Mfn2 knockout mouse
embryonic fibroblasts (MEFs) (de Brito et al. 2008; Raturi et al. 2013).
Mutations in the calcium-regulating protein Presenilin (PSEN) are the main cause of familial
Alzheimer’s disease (fAD). Expression of fAD-relevant PSEN-2 mutants in primary neurons
results in the excessive transfer of calcium into the mitochondria following IP3 R3 stimulation,
via the strengthening of the linkage between the two organelles (Zampese et al. 2011).
Furthermore, PSEN-2 also associates with the IP3R3s, leading to the suggestion that AD is a
disease of the MAM (Schon et al. 2010).
1.3.2: ER Stress
The “Unfolded Protein Response”, or UPR, in the ER is initiated by increased levels of
misfolded proteins in the cell. The subsequent signal transduction to the cytosol and nucleus
mediates the suppression of protein translation and the induction of both the ER chaperones and
ER-associated degradation (Hetz et al. 2009; Kanekura et al. 2009). Finally, if under chronic
stress, this pathway can lead to the induction of apoptosis. As previously mentioned, protein
aggregation is a common theme in neurodegeneration. Consequently, the UPR has been
implicated in the pathogenesis of ALS. Indeed, pathological hallmarks of ER stress are evident
in patients including enlargement of the rough ER and dissolution of Nissl bodies (Wakayama
1992; Cruz-Sanchez et al. 1993).
Increased levels of protein disulfide isomerase (PDI), binding immunoglobulin protein (BiP)
and phosphorylated eukaryotic translation initiation factor 2A (eIF2) have been observed in
42

the spinal cord of sALS patients and in animal models of ALS (Atkin et al. 2006; Wootz et al.
2006; Ilieva et al. 2007), indicating increased levels of ER stress in the spinal motor neurons.
Additionally, in mSOD1 transgenic mice, aggregates of mSOD1 accumulate in the ER, forming
high molecular weight species that physically interact with the ER chaperones, possibly
contributing to the defective UPR response (Atkin et al. 2006). Furthermore, the ALS
pathogenic mutation in VAPB nullifies the UPR-mediating function of the protein, leaving the
cell vulnerable to ER stress (Nishimura et al. 2004). TDP-43 mutations have also been shown to
induce ER stress; transgenic expression of mTDP-43 in C.elegans resulted in an upregulation of
BiP expression, indicative of UPR induction in this model (Vaccaro et al. 2012).
The cause of this increase in ER stress in ALS is unclear. It has been suggested that defective
mitochondria, resulting in increased oxidative stress and excitotoxicity in the cell may be the
cause (Ilieva et al. 2007). Furthermore, studies in mSOD1 NSC-34 cell lines revealed a
substantial increase in the levels of s-nitrosylated PDI, rendering this protein functionally
inactive, despite its upregulation in ALS spinal cord. Thus, PDI is unable to catalyse the correct
folding of proteins and protect against ER stress in the spinal cord (Walker et al. 2010).
1.3.3: Macroautophagy
Macroautophagy (referred to here as autophagy) describes the process of controlled degradation
of cytosolic components and organelles (Figure 1.3). This is achieved by the formation of an
isolation membrane, which elongates to enclose the condemned cargo in a double membrane
structure, termed the autophagosome. This structure then undergoes a series of maturation steps,
with input from various points along the endocytic pathway and its regulatory proteins,
including the endosomal sorting complex required for transport (ESCRT) proteins, SNAREs
and Ras-associated protein 7 (Rab7) (Hara et al. 2006). Finally, the mature autophagosome
undergoes acidification via fusion with the lysosome. This requires the trafficking of the
autophagosome to the lysosomal compartment, achieved using the microtubule tracks and the
molecular motor dynein (Ravikumar et al. 2005; Hara et al. 2006). Vacuolar-ATPases pump H+
into the lysosome, thus activating lysosomal enzymes, including acid hydrolase, which function
optimally at low pH (Mehrpour et al. 2010). Upon degradation of the macromolecules, the
resulting metabolites are released back into the cytosol.
Under nutrient-rich conditions, the cell requires autophagy to dispose of damaged organelles,
superfluous long-lived proteins and to prevent the toxic accumulation of aggregate-prone
proteins (Rubinsztein 2006; Mehrpour et al. 2010). In these instances, specific signals enable
the selective degradation of components no longer required. Upon starvation, the cell utilises
non-specific autophagy to maintain the levels of amino acids and fatty acids, thus ensuring the
continuation of metabolism and production of ATP (Kuma et al. 2004; Mehrpour et al. 2010).
43
Figure 1.3: The canonical macro-autophagy pathway
Figure 1.3: Upon induction of autophagy, AMPK inhibits the mTOR complex, activating the ULK:Atg13:FIP200 complex. Alongside the Beclin1 complex, ULK and binding partners initiate the formation of the isolation membrane, via the conjugation of the Atg5-Atg12 complex and the generation of LC3-II. Following elongation, the membrane closes around the cargo, forming the completed autophagosome. Subsequent fusion with the lysosome releases acid hydrolase, degrading both the cargo and the autophagosome. PE: phosphatidylethanolamine; AMPK: AMP-activated protein kinase; mTOR: mammalian target of rapamycin; ULK: unc-51-like kinase; Atg13: autophagy related 13; FIP200: FAK family kinase-interacting protein of 200 kDa. Figure adapted from (Ryter et al. 2012).
1.3.3.1: Regulation of autophagy
Over 30 autophagy-related (Atg) proteins have so far been identified, aiding both non-specific
and selective autophagy (Mehrpour et al. 2010). Under basal conditions, phophorylation
mediated by the mTOR complex inhibits ULK. However, upon induction of autophagy, AMPK
phosphorylates mTOR, resulting in the latter dissociating from the ULK:Atg13:Fip200
complex, which thus becomes activated (Ganley et al. 2009; Jung et al. 2009; Mehrpour et al.
2010). The subsequent activation of several Atg proteins, and nucleation of an isolation
membrane, is dependent on the joint function of the activated ULK complex and the class III
phosphatidylinositol 3-kinase (PI3K) complex, composed of the PI3K, Vps34, Beclin 1, p150
44
and Atg14L (Itakura et al. 2008; Mehrpour et al. 2010). Debate has arisen as to the source of the
lipids which make up the isolation membrane, with the ER, mitochondria and the plasma
membrane all being implicated (Axe et al. 2008; Hailey et al. 2010).
In the cytoplasm, autophagy-related 12 (Atg12) conjugates to Atg5 and interacts with Atg16L.
This complex is essential for the elongation of the isolation membrane (Mizushima et al. 1998;
Mizushima et al. 2003). Atg12 also aids in the generation of the key autophagy protein, LC3-II
(Tanida et al. 2002). Atg4 cleaves the pre-cursor protein LC3 in the cytoplasm, revealing a
glycine residue at the C-terminus. Upon induction of autophagy, this C-terminus of LC3-I
becomes conjugated to the polar head of phosphatidylethanolamine under the mediation of the
Atg12-Atg5:Atg16L complex, Atg7 and Atg3 (Hanada et al. 2007; Fujita et al. 2008; Mehrpour
et al. 2010). The result of this conjugation is the generation of LC3-II. The Beclin 1 complex
recruits the Atg12-Atg5:Atg16L complex and LC3-II to the isolation membrane to aid in its
elongation (Kabeya et al. 2000; Mizushima et al. 2003; Mehrpour et al. 2010), and subsequent
closure around the cargo to form the double membranous autophagosome.
1.3.3.2 Mitophagy
As mentioned, the cell is capable of carrying out content-specific autophagy. The specific
autophagic degradation of mitochondria has been termed mitophagy. In yeast, following
enforced respiration, the OMM-anchored autophagy protein, Atg32 confers selectivity by
mediating the association between the mitochondria and the autophagosome, via interaction
with Atg8 (Kanki et al. 2009).
45
Figure 1.4: An example of two pathways feeding into the induction of mitophagy
Figure 1.4: Defective mitochondrial function leads to an activation of AMPK and the subsequent inhibition of the mTOR complex. The resultant canonical autophagy pathway mediates the degradation of the defective mitochondria. Alternatively, a decrease in mitochondrial membrane potential causes accumulation of PINK1 on the OMM, the subsequent recruitment of Parkin, and the ubiquitination of mitochondrial proteins. This ubiquitination leads to the recruitment of p62 and LC3, formation of an isolation membrane and degradation of the defective mitochondria. Figure adapted from (Ding et al. 2012) and (Youle et al. 2011).
1.3.3.2.1: Mechanisms of mitophagy
In basal mammalian cellular homeostasis, several proteins have been identified as regulating the
induction of mitophagy (Figure 4.1). For example, a decrease in ATP production has been found
to induce the activity of AMPK, with the subsequent inhibition of mTOR and induction of the
canonical autophagy pathway (Ding et al. 2012).
However, of interest for the investigation of neurodegeneration, is the identification of both
Parkin and PTEN induced putative kinase (PINK1) as players in the mitophagy pathway (Youle
et al. 2011). PINK1 is rapidly turned over by proteolysis in healthy mitochondria. However,
upon damage and subsequent depolarisation of the mitochondria, proteolysis is inhibited and
PINK1 accumulates on the OMM, leading to the consequent recruitment of Parkin (Kim et al.
2008; Narendra et al. 2010; Vives-Bauza et al. 2010). Preliminary evidence suggests the PINK1
46
mediated phosphorylation of Parkin lead to this recruitment (Kim et al. 2008). The ubiquitinated
mitochondrial substrates of Parkin include Mfn and VDAC (Gegg et al. 2010; Geisler et al.
2010). p62, a known ubiquitin-binding adaptor, subsequently accumulates on the mitochondria
(Geisler et al. 2010). From here, p62 recruits the autophagosome to the damaged mitochondria
via its interaction with isolation membrane-bound LC3-II (Pankiv et al. 2007). Furthermore,
Parkin also binds with autophagy/Beclin-1 regulator 1 (AMBRA1), a protein capable of
promoting autophagy, via its interaction with the Beclin-1 complex (Van Humbeeck et al.
2011). Interestingly, genetic studies in Drosophila showed that inhibition of the PINK1/Parkin
pathway is capable of influencing the mitochondrial fusion/fission balance, highlighting the
mutual relationship between mitophagy and mitochondrial morphology (Poole et al. 2008).
1.3.3.2.1.1: Influence of mitochondrial morphology on mitophagy
However, evidence suggests that, though mitochondrial morphology is capable of influencing
the mitophagic response, it cannot initiate the pathway. The culture of primary cortical neurons
in the presence of nitric oxide initiated Fis1-regulated mitophagy (Barsoum et al. 2006).
However, a mutant active form of Fis1-induced mitochondrial fission but did not lead to
mitochondrial dysfunction or mitophagy (Gomes et al. 2008). Thus, dysfunction rather than
fission is responsible for the induction of mitophagy (Ding et al. 2012).
Overexpression of OPA1 in INS cells increased mitochondrial fusion and reduced levels of
mitophagy (Twig et al. 2008). Therefore, although fission does not induce mitophagy, it does
segregate defective mitochondria and ensure efficient degradation of the organelles. It has been
postulated that Parkin-mediated ubiquitination of Mfn1 and Mfn2 aids fission by preventing the
homotypic or heterotypic interactions of Mfn, thus inhibiting fusion of the defective
mitochondria back into the network (Ziviani et al. 2010). Parkin appears to have a dual role in
the mitophagy pathway, regulating its induction and priming the mitochondrial morphology to
achieve efficient degradation.
The involvement of PINK1 and Parkin in mitophagy has implicated this pathway in the
pathogenesis of PD. Evidence of defective mitophagy has also been observed in other
neurodegenerative diseases. In AD models and patients, dysfunctional cytochrome oxidase
(Maurer et al. 2000) and accumulation of -amyloid fragments (Casley et al. 2002) have both
been observed in the malfunctioning mitochondria. In Huntington’s disease (HD), the
pathogenesis has been partly attributed to defects in the recognition of autophagic cargo,
resulting in the accumulation of dysfunctional mitochondria (Casley et al. 2002).
47
1.3.3.3: Autophagy and neurodegeneration
The maintenance of autophagy in the neuron is essential for its functioning. Basally,
autophagosomes are barely detectable in the healthy neuron, as the turnover of autophagic
degradation is extremely efficient. Neurons require this efficient degradation of cellular
components in order to maintain homeostasis; these post-mitotic cells cannot dilute the
accumulation of damaged organelles and misfolded proteins through cell division. Therefore,
the appearance of autophagic vacuoles in neurons hints at defects in the progression of the
autophagy pathway and possible induction of autophagic stress (Lee 2012).
Defects in autophagy have long been suggested to be a pathogenic mechanism in the aetiology
of neurodegeneration, as evidenced by the common theme of toxic accumulation of proteins.
Mice deficient in Atg5, specifically in neural cells, developed neuronal cytoplasmic ubiquitin-
positive inclusion bodies, along with axonal swellings in several brain regions. Progressive
deficits in motor function were also observed (Hara et al. 2006).
In ALS, mSOD1 transgenic mice show an increase in autophagosome formation beginning at
the presymptomatic stage, suggesting that autophagic stress contributes to the
neurodegeneration (Li et al. 2008). Furthermore, these mice present with numerous
proteinaceous aggregates, indicating defective protein degradation (Chen et al. 2012). It is
possible that mSOD1 prevents the trafficking of the autophagosome to the lysosome, via its
disruption of the dynein/dynactin motor system, causing pathogenic accumulation of
autophagosomes in the neurons (Chen et al. 2012) (Strom et al. 2008).
In mTDP-43 models and patients, as well as the observed accumulation of ubiquitinated
proteins in the spinal motor neurons (Xu et al. 2011), the aggregated cytoplasmic 25kDa
fragments of TDP-43 interact with both p62 and LC3, suggesting a possible mechanism for
disrupting autophagy (Chen et al. 2012). Finally, patients expressing the pathogenic
hexanucleotide expansion in C9ORF72 present with a significant increase in cytoplasmic
inclusions composed of p62, ubiquitin, OPTN and TDP-43 in the brain, suggestive of defective
protein clearance in the presence of the pathogenic expansion (Cooper-Knock et al. 2012).
There is also evidence of dysfunctional autophagy in other neurodegenerative diseases, such as
AD and HD (Ravikumar et al. 2004; Son et al. 2012), resulting from the impaired maturation
and degradation of the autophagosome, and a failure of the autophagosome to recognize the
cytosolic cargo respectively (Casley et al. 2002; Yu et al. 2005) (Lee et al. 2010).
1.3.4: Apoptosis
In addition to the functional and morphological deficits afflicting mitochondria in ALS, their
intrinsic role in the initiation of the apoptotic cascade may also be an important factor. As
48

mentioned, changes in mitochondrial morphology are intricately associated with apoptosis;
mitochondria in apoptotic cells are converted from long reticular tubules to smaller, punctate
structures, implicating mitochondrial fission (Karbowski et al. 2002). Induction of apoptosis
requires the permeabilisation of the OMM, allowing release of pro-apoptotic cytochrome c from
the IMS (Liu et al. 1996). Mitochondrial fusion and fission proteins regulate this intrinsic
apoptotic cascade, in addition to the control of mitochondrial dynamics. For example, Drp1
mediates both a pro-fission and a pro-apoptotic role via the association with the OMM. The
protein is stabilised here by Bax-mediated sumoylation, linking fission and apoptosis (Wasiak et
al. 2007). Indeed, overexpression of a dominant-negative form of Drp1 mediates mitochondrial
fusion, conferring resistance against the induction of apoptosis via the preservation of the m
and the inhibition of cytochrome c release (Frank et al. 2001). Furthermore, overexpression of
Mfn2 prevented the translocation of Bax to the mitochondria (Karbowski et al. 2006), whereas
knockdown of Opa1 led to the depolarisation of the m, fragmentation of the network and
release of cytochrome c from the IMS (Olichon et al. 2003).
1.3.4.1: Apoptosis in ALS
As previously mentioned, in both patient samples and models of the disease, mitochondrial
fragmentation has been noted as a pathological feature of ALS, supporting a model in which the
motor neuron is vulnerable to induction of the apoptotic cascade. Indeed, in ALS patients,
biochemical markers of apoptosis have been reported at the final stages of disease (Yoshiyama
et al. 1994; Ekegren et al. 1999; Pasinelli et al. 2000; Guegan et al. 2003). Additionally, it has
been seen that, compared to control levels, pro-apoptotic Bax dimerisation in the motor cortex is
increased, and the protective Bax-Bcl-2 interaction is diminished in both sALS and fALS
patients (Martin 1999).
Evidence from mSOD1 models has contributed to the notion of apoptotic cell death in the
pathogenesis of ALS; sequential activation of caspases has been observed in G85R mSOD1
transgenic mice (Pasinelli et al. 2000; Pasinelli et al. 2004; Sathasivam et al. 2005). It is
possible that apoptosis initiation arises secondary to mSOD1-induced mitochondrial
dysfunction. This may be a direct consequence of mSOD1 localisation; anti-apoptotic Bcl-2 is
sequestered in the mSOD1 mitochondrial aggregates noted in fALS cases (Pasinelli et al. 2004).
In neuroblastoma cells, the formation of mSOD1 inclusions rendered the cells vulnerable to
apoptosis via caspase 3 activation, following oxidative stress. However, expression of dispersed
mSOD1 prevented apoptotic induction; thus the apoptosis-inducing ability of mSOD1 appears
to be linked to its aggregation state (Soo et al. 2009).
However, there is controversy surrounding the role of apoptosis in the neuronal degeneration in
ALS. mSOD1 transgenic mice lacking the upstream regulator of caspase 1, caspase 11, did not
present with any improvement in the disease phenotype (Kang et al. 2003; Pasinelli et al. 2004).
49

Furthermore, both morphological and biochemical markers of apoptosis, such as terminal
deoxynucleotide transferase dUTP nick end labeling (TUNEL) staining are scant, both in ALS
patients and models (Migheli et al. 1999).
Thus, in contrast to apoptosis-mediated neurodegeneration, the concept of ALS as a dying-back
neuropathy has arisen. Local toxicity resulting from the dysfunctional mitochondria induces
damage to the distal axon with the cumulative defects eventually spreading to the cell body.
This hypothesis, though speculative, specifically correlates with denervation noted at the
neuromuscular junction (NMJ) in both mouse models and ALS patients (Fischer et al. 2004;
Manfredi et al. 2005; Pun et al. 2006; Mead et al. 2011).
1.3.5: Mitochondrial involvement in ageing
Ageing is defined as the gradual impairment of biological processes, caused by progressive
deterioration of both function and structure of biological molecules in the cell. Interestingly, the
characteristics of ageing such as oxidative damage, impaired mitochondrial dynamics and
autophagy, are also associated with multiple disease states, including neurodegeneration
(Mammucari et al. 2010).
Due to their central role in bioenergetics, mitochondria have long been implicated in the ageing
process. One longstanding theory of ageing is that the cumulative damage to the cell caused by
ROS eventually results in senescence (Harman 1956). It is postulated that ROS, generated by
the leakage of electrons from the ETC in the mitochondria, result in cumulative damage to
macromolecules and other organelles in the cell (Mammucari et al. 2010). Additionally,
increasing ROS levels cause the accumulation of mtDNA mutations and deletions over time
(Corral-Debrinski et al. 1992; Krishnan et al. 2007). As well as exacerbating the defects in the
ETC, mtDNA mutations also lead to deficiencies in protein production in the mitochondria
(Guja et al. 2012); a decrease in the levels of cytochrome c oxidase (COX) have been observed
in aged cells, contributing to the dysfunction of the mitochondria (Bua et al. 2006). Under the
stress of overwhelming oxidative damage, the aged cell eventually undergoes apoptosis.
As previously mentioned, mitochondrial morphology has a substantial influence on several
cellular processes, including mitochondrial metabolism, regulation of REDOX signalling and
the maintenance of mtDNA integrity (Seo et al. 2010). It has been noted that the morphological
plasticity of mitochondria decreases with age due to reduction in the activity of peroxisome
proliferator activated receptor gamma coactivator 1 alpha (PGC-1), a key regulator of
mitochondrial biogenesis, with severe consequences for the cell (Seo et al. 2010). PGC-1
regulates expression of Mfn2, providing a link between mitochondrial morphology, biogenesis
and ageing (Cartoni et al. 2005). Indeed, in the skeletal muscles of aged individuals, a decrease
50
in the expression of Mfn2 and Drp1 was observed, alongside mitochondrial dysfunction (Crane
et al. 2010).
The decreased capacity for mitochondrial biogenesis upon ageing also influences mitophagic
flux in the cell. The levels of autophagy decline upon ageing (Wohlgemuth et al. 2010), as
evidenced by the appearance of giant mitochondria in ageing cells (Tandler et al. 1986); thus
the defective mitochondria accumulate in the cell, contributing to the oxidative damage
(Mammucari et al. 2010). The age-related dysregulation of mitochondrial dynamics appears to
contribute to this decline in mitophagy levels. Overexpression of Fis1 blocked the development
of the senescence-related phenotype in ageing cells, suggesting the inefficient segregation of
defective mitochondria contributes to senescence (Yoon et al. 2006). It is postulated that, in
post-mitotic ageing cells, the decrease in mitophagy-regulated mitochondrial biogenesis and
turnover leads to accumulation of oxidative damage and induction of the apoptotic cascade
(Mammucari et al. 2010).
However, controversy surrounds the ROS theory of ageing due to conflicting evidence from
mice; the depletion of DNA polymerase subunit gamma (POLGA), a catalytic subunit of
mitochondrial DNA polymerase, led to an increase in mtDNA mutations, impairment of the
respiratory chain, and a reduced life span, but with no evidence of an increase in oxidised
macromolecules or cellular hydrogen peroxide (Kujoth et al. 2005). As such, the theory of a
direct link between levels of ROS, mtDNA and respiration has been disputed. Furthermore,
mutations in mtDNA only reach a critical threshold in a proportion of senescent cells. Thus,
there must be another trigger for cellular senescence and global ageing (Mammucari et al.
2010).
Another popular theory for ageing is the progressive shortening of telomeres, preventing the
replication of cells (Harley et al. 1990). A recent study identified a link between DNA damage
and impaired mitochondrial biogenesis, unifying the two popular theories (Sahin et al. 2012). It
has been proposed that the accumulative telomere dysfunction leads to the activation of p53,
which subsequently binds to promoters of PGC-1, impairing regulation of mitochondrial
biogenesis (Sahin et al. 2010; Sahin et al. 2012). Consequently, the production of ROS
increases, impairing function in the cell (Sahin et al. 2010). Thus, both mitochondrial
morphology and function appear imperative for the continued functioning of the cell (Sahin et
al. 2012)….ELABORATE….MOUSE MODELS…SOD1 IN NEURONS AND GLIA
1.3.6: Role of axonal transport in neurons
Motor neurons are highly polarised cells; the cell body, the primary site of metabolism and
protein synthesis, must supply new proteins, functioning organelles and metabolites to the long
51
axonal and dendritic processes. Some axonal processes stretch for over a metre throughout the
body. Thus, the survival of the neuron is highly dependent on efficient axonal transport.
Accordingly, defective cellular transport is implicated as one of the key pathogenic features in
neurodegenerative disease (De Vos et al. 2008), and may provide an answer to selective
neuronal vulnerability, as later discussed.
Mitochondria are highly motile organelles, utilising the microtubule tracks to distribute evenly
along the axon, and travel to areas of metabolic demand. The m dictates their movement;
depolarisation results in the retrograde transport of the mitochondria. Conversely, mitochondria
with a high potential are preferentially transported anterogradely along the axon (Miller et al.
2004)…..HOW DOES THIS WORK?! This bioenergetic regulation ensures that functioning
mitochondria are positioned in areas of high metabolic demand, and dysfunctional mitochondria
are efficiently degraded at the soma.
1.3.6.1: Impaired neuronal trafficking of mitochondria in ALS
Axonal trafficking is dramatically perturbed in ALS motor neurons, as evidenced in mSOD1
transgenic mouse models. Deficits in retrograde axonal transport represents one of the earliest
pathological features seen in mSOD1 transgenic mouse motor neurons, appearing before onset
of clinical symptoms and accumulating throughout progression of the disease (Bilsland et al.
2010).
Dramatic impairment of both anterograde and retrograde transport of mitochondria has been
noted both in vitro and in vivo. A selective decrease in anterograde transport of mitochondria
has been observed in G93A mSOD1 motor neurons, resulting in a net increase in retrograde
transport, with a corresponding increase in mSOD1 immunoreactive mitochondria clustering at
the cell body (De Vos et al. 2007). Additionally, in sALS patients, abnormal accumulation of
mitochondria has been noted in the soma and proximal axon of the anterior horn neurons
(Sasaki et al. 2007).
mSOD1 has been implicated in this aggregation propensity of mitochondria; expression of the
mutant proteins in transgenic rats resulted in the pre-symptomatic accumulation of mSOD1-
enriched mitochondria into discrete clusters (Sotelo-Silveira et al. 2009). There are several
implications of this mitochondrial clustering; aggregation of the mitochondria will lead to the
depletion of mitochondria from along the axon. Distal depletion, due to the aforementioned
retrograde directional selectivity, would result in energy impairment near the NMJ, conducive
to the distal axonopathy in ALS. Additionally, sequestration and dysfunction of the
mitochondria will severely decrease energy available to power axonal transport, possibly
52
accounting for the impaired bi-directional transport of membrane-bound organelles noted in
transgenic mice motor neurons (De Vos et al. 2007).
Recent evidence also implicates TDP-43 as a regulating factor in the axonal transport of
mitochondria. Neuronal overexpression of human TDP-43 in a transgenic mouse model resulted
in the formation of cytoplasmic inclusions, containing accumulated mitochondria. This was seen
concomitant with the clearance of mitochondria from the motor axon terminals (Shan et al.
2010). It is possible that the RNA processing of proteins involved in axonal transport is
disrupted upon overexpression of TDP-43. It remains to be seen whether pathogenic mutations
in TARDBP also result in this defect in axonal transport.
Defects in axonal transport are also evident in several other neurodegenerative disorders,
including AD, HD and hereditary spastic paraplegia (HSP) (Gauthier et al. 2004; Karle et al.
2012; Shahpasand et al. 2012). The latter of these diseases shall now be discussed in further
detail.
1.4: Hereditary Spastic Paraplegia
1.4.1: Classification and clinical features
Hereditary Spastic Paraplegia (HSP) is the collective name of a group of heterogeneous
neurological disorders unified by the presence of spasticity and weakening of the lower limbs,
with the relative sparing of the upper limbs (Salinas et al. 2008) (Blackstone 2012). The disease
is relatively rare with a prevalence of around 3-9/100,000 people in Europe (Blackstone 2012).
Pathologically, it is defined by the retrograde degeneration of the axons of the lateral
corticospinal tract and posterior columns. In some instances, degeneration of the spinocerebellar
tracts has also been reported, as has the loss of Betz cells present in layer V of the motor cortex
(Salinas et al. 2008). The near absence of cell death in HSP has led to the disorder being
characterised as a dying back axonopathy, making it ideal for understanding the cause of
isolated axon impairment (Blackstone 2012). The HSPs can be classified as either a pure form
of the disease if the spastic paraplegia remains isolated, or complicated if the spasticity is
associated with additional clinical neurological features, such as ataxia, dementia or peripheral
neuropathy (Harding 1983).
The age of onset is variable, ranging from childhood to late in life. Severity and disease
progression is also variable, though life expectancy is normally unaffected. This phenotypic
heterogeneity is reflected in the genetic inheritance of the disease, which can be autosomal
dominant (accounting for 70% of cases) autosomal recessive or X-linked recessive (Salinas et
al. 2008). Furthermore, nearly 50 loci have been formally implicated (designated SPG1+), and
over 20 genes have been identified to date as causal or contributory to the pathogenesis of HSP,
53

though with variable penetrance, compounding the underlying variability in the onset and
progression of the disease (Blackstone 2012)(Table 1.3).
Out of the 48 known loci, 19 are autosomal dominant, 24 are autosomal recessive and 5 are due
to X-linked inheritance. Broadly speaking, the disease tends to present itself as pure if derived
from an autosomal dominant mutation in one of the known causative genes. Conversely, the
autosomal recessive forms tend to be juvenile onset and present as a complicated form of HSP
(Finsterer et al. 2012). The functional activities of the causative genes are multiple and diverse
(Table 1.3). However, common cellular pathogenic pathways have started to emerge, with many
of the genes being implicated in several pathways. The microtubule severing protein Spastin,
mutated in SPG4-related HSP, is one such protein implicated in several pathogenic pathways, as
will be discussed (Blackstone 2012).
54

1.4.1.1: HSP-linked genetic loci
Table 1.3: Genes implicated in HSP, with functional role
HSP Disease Type
Chromosome Location
Gene and Protein Name
Mode of Inheritance and
Age of Onset
HSP Phenotype
Cellular function
Membrane traffickingSPG4 2p22.3 SPAST: Spastin ADom: Adult
onsetBoth Microtubule severing (Errico et al. 2002). ER morphogenesis (Park et al. 2010),
endosomal trafficking (Reid et al. 2005), inhibitor of BMP signalling (Tsang et al. 2009).SPG6 15q11.1 NIPA1: Non
imprinted in Prader-Willi/Angelman syndrome 1
ADom: Adult onset
Pure Endosomal trafficking, inhibitor of BMP signalling (Tsang et al. 2009), magnesium transporter (Goytain et al. 2008).
SPG8 8q24 KIAA0196: Strumpellin
ADom: Adult onset
Pure Endosomal trafficking, regulation of actin polymerisation (Jia et al. 2010).
SPG10 12q13.3 KIF5A: Kinesin family member 5A
ADom: Juvenile to adult onset
Pure Subunit of kinesin; anterograde, microtubule based, fast axonal transport (Xia et al. 2003).
SPG11 15q13-q15 KIAA1840: Spatacsin
AR: Juvenile to adult onset
Both Outgrowth of motor neuron axons (Martin et al. 2012). Endosomal trafficking (Blackstone 2012)
SPG15 14q22-q24 ZFYVE26: Spastizin
AR: Juvenile onset
Complicated Abscission stage of cytokinesis (Sagona et al. 2010), endosomal trafficking (Blackstone 2012).
SPG20 13q12.3 SPG20: Spartin AR: Juvenile onset
Complicated Endosomal trafficking (Edwards et al. 2009), lipid droplet turnover (Eastman et al. 2009), inhibitor of BMP signalling (Tsang et al. 2009).
SPG21 15q21 ACP33: Maspardin
AR: Juvenile onset
Complicated Endosomal trafficking (Simpson et al. 2003).
* SPG33 10q24.2 ZFYVE27: Protrudin
ADom: Adult onset
Pure Rab-11 mediated membrane trafficking. Promotion of neurite extension (Mannan et al. 2006; Shirane et al. 2006).
SPG47 1p12-p13.2 AP4B1: Adaptor-related protein complex 4, beta 1
AR: Juvenile onset
Complicated Subunit of endocytic adaptor protein complex targeting proteins from trans-Golgi network to endosomal system (Abou Jamra et al. 2011)
55
subunitSPG48 7p22.2 AP-5: subunit of
KIAA0415AR: Adult onset Pure DNA repair (Slabicki et al. 2010). Subunit of AP-5, an endocytic adaptor protein complex
(Hirst et al. 2011)Regulation of mitochondriaSPG7 16q24.3 SPG7: Paraplegin AR: Juvenile to
adult onsetComplicated Subunit of the mitochondrial m-AAA ATPase complex; controls protein translation and
quality in the mitochondria (Tzoulis et al. 2008)SPG13 2q33.1 HSPD1: Heat
shock 60kDa protein 1
ADom: Adult onset
Pure Facilitates correct folding of proteins newly imported into the mitochondria (Hansen et al. 2002).
Organelle shapingSPG3A 14q11-q21 ATL1: Atlastin ADom: Juvenile
onsetPure ER / Golgi morphogenesis (Park et al. 2010), inhibitor of BMP signalling (Fassier et al.
2010).SPG12 19q13 RTN2: Reticulon
2ADom: Juvenile onset
Pure ER morphogenesis (Montenegro et al. 2012).
SPG17 11q12-q14 BSCL2: Seipin ADom: Early adult onset
Complicated Lipid droplet assembly at the ER (Szymanski et al. 2007).
SPG18 8p12-p11.22 ERLIN2: Erlin2 AR: Juvenile onset
Complicated ER associated degradation of IP3Rs (Pearce et al. 2007)
SPG31 2p21 REEP1: Receptor accessory protein 1
ADom: Juvenile onset
Both Coordinates ER morphogenesis and microtubule dynamics (Park et al. 2010).
Lipid or sterol modification and myelinationSPG2 Xq21 PLP1: Myelin
proteolipid protein
X-linked: Adult onset
Complicated Formation or maintenance of myelin in the central nervous system (Inoue 2005).
SPG5 8q12-q13 CYP7B1: cytochrome P450, family 7, subfamily B, polypeptide 1
AR: Juvenile to adult onset
Pure Metabolism of cholesterol (Goizet et al. 2009).
SPG35 16q21-q23 FA2H: Fatty acid 2-hydroxylase
AR: Juvenile onset
Complicated Hydroxylation of myelin lipids (Alderson et al. 2004)
SPG39 19p13.2 PNPLA2: Neuropathy target esterase
AR: Juvenile onset
Complicated Deacylation of phospholipids (Glynn 2005).
56
SPG44 1q42.13 GJC2: Connexin-47
AR: Adult onset Complicated Central myelination (Menichella et al. 2003), formation of gap junction channels between glial cells (Wasseff et al. 2011).
Inter/intra-cellular transportSPG22 Xq21 SLC16A2: Mono-
carboxylic acid transporter 8
X-linked: Juvenile onset
Complicated Transporter of thyroid hormone (Friesema et al. 2003).
SPG30 2q37 KIF1A: Kinesin 3 AR: Early adult onset
Complicated Anterograde microtubule dependent axonal transport (Okada et al. 1995).
SPG42 3q24-q26 SLC33A1: solute carrier family 33, member 1
ADom: Juvenile to adult onset.
Pure Acetyl-CoA transporter (Kanamori et al. 1997).
Axonal pathfindingSPG1 Xq28 L1CAM: L1 cell
adhesion molecule
X-linked: Perinatal
Complicated Neural cell adhesion, neuronal migration and differentiation (Jouet et al. 1994).
Table 1.3: As of 2012, 48 different loci have been implicated in HSP. Listed are those loci whose HSP-causative genes have been identified. These genes are functionally grouped according to their main cellular processes, though many of the genes fall into numerous categories. (AR = Autosomal recessive; AD = Autosomal dominant). Table adapted from Blackstone, 2012.
* Debate has arisen as to whether the G191V mutation identified in protrudin does result in SPG33, as it has been identified in only one family in Germany, and has also now been identified as a polymorphism in control cohorts (Martignoni et al. 2008).
57

1.4.2: Spastin
Mutations in spast gene are the most common cause of autosomal dominant HSP, responsible
for up to 40% of autosomal dominant cases. It is relatively common for carriers of the mutant
gene not to develop symptoms until they reach their third decade. The disease then manifests
itself as slowly progressive spasticity in the lower limbs, with loss of mobility only occurring
after two decades of symptoms (Salinas et al. 2008). However, in some cases of SPG4-related
HSP, onset of symptoms occurs in childhood, with a much more aggressive progression of
symptoms. In humans, spast expression is widespread throughout the CNS, though it is absent
in glial cells. Expression is both cytoplasmic and nuclear, except in the basal ganglia where
expression is solely nuclear (Wharton et al. 2003).
The spast gene, encoding the protein Spastin, was first identified as a candidate gene in
autosomal dominant HSP through a positional cloning strategy (Hazan et al. 1999). The gene
has a transcript length of 5212 base pairs, which translates into a 616-residue protein. The
resultant protein product was identified as belonging to sub-group 7 of the family of ATPases
associated with various cellular activities (AAA proteins) (Frohlich 2001; Frickey et al. 2004).
The AAA proteins are a large family of proteases, first described by Erdmann et al, with diverse
cellular roles, including protein degradation, gene expression, membrane fusion and maturation
and microtubule disassembly (Erdmann et al. 1991). However, despite this diversity, for each
process it is believed that the protein exerts its function through the coupling of ATP hydrolysis
and mechanical disassembly of the substrate (Frickey et al. 2004).
Each member is characterised by the presence of an AAA domain, a highly conserved P-loop
NTPase domain (Patel et al. 1998). This region contains two highly conserved motifs, namely
the Walker A and Walker B motifs, which represent the signature sequences of P-loop ATPases
(Walker et al. 1982). Functional studies of these motifs have revealed that the Walker A motif is
the area where ATP binding occurs and that this area is essential for ATP hydrolysis
(Whiteheart et al. 1994). Later investigation showed that mutations in the Walker A motif
abrogate the ability of the protein to bind ATP. Conversely, mutations in the Walker B motif
permit ATP binding, but prevent hydrolysis (Ogura et al. 2001; Evans et al. 2005). Therefore, it
appears only the Walker A motif is essential for the ATPase activity of the proteins.
The AAA proteins typically present with distinct modular domains, with the AAA domain at the
C-terminal end of the protein (Frickey et al. 2004). The N-terminal domain does not possess
ATPase activity. Instead it is believed to be the substrate recognition site, dictating the sub-
cellular localisation of the protein. Of those that have been studied, the AAA proteins are
capable of forming a hexameric ring structure upon oligomerisation, though in some proteins,
such as Katanin, this only occurs under specific conditions (Frickey et al. 2004). Though the
58
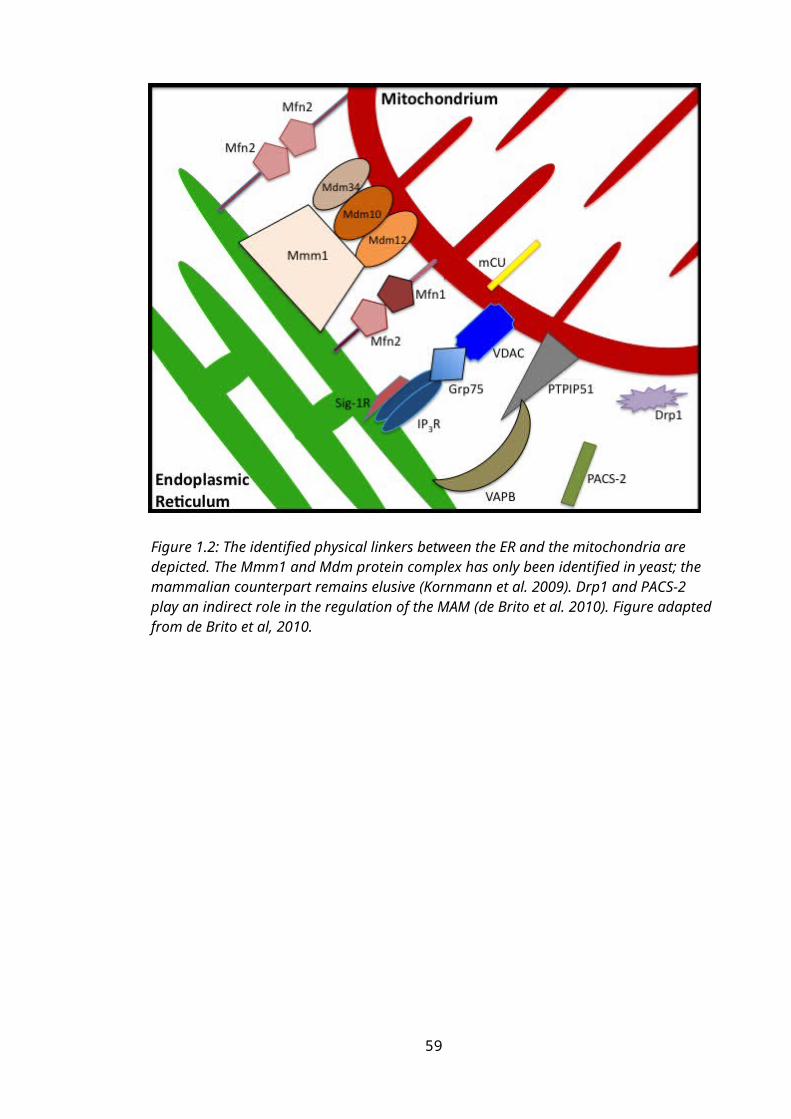
AAA proteins are highly diverse, the Spastin AAA domain bears a marked homology with the
domain in Katanin, also a microtubule severing protein capable of regulating the length of the
individual microtubules (McNally et al. 1993). It has been implicated in the regulation of
meiosis and mitosis, as suggested by the localisation of katanin to the centrosome and mitotic
spindles (Buster et al. 2002; Srayko et al. 2006).
The modular domain organisation of Spastin, depicted in Figure 1.5, provides insights into its
cellular function. The N-terminal portion of the protein is involved in the targeting of Spastin to
specific subcellular domains; the binding of certain adaptor proteins often mediates this process.
The transmembrane (TM) domain (Kammermeier et al. 2003; Blackstone 2012) is predicted to
form a partial membrane spanning hairpin loop, allowing the targeting of Spastin to
membranous organelles, including the endoplasmic reticulum (Park et al. 2010), which will be
discussed in further detail later. The Microtubule Interacting and Transport (MIT) domain spans
amino acid residues 116 to 197 and is predicted to form a 3 helical bundle (Ciccarelli et al.
2003; Yang et al. 2008), mediating interactions with the CHMP (charged multivesicular body
protein) family of proteins involved in endosomal trafficking and membrane scission, such as
Chmp1b (Reid et al. 2005). Finally in the N terminal portion, there is a Microtubule Binding
Domain (MTBD), capable of binding microtubules in an ATP-independent manner. As
discussed later, this domain is required for the severing of microtubules, alongside the C-
terminal catalytic AAA ATPase domain (White et al. 2007).
Figure 1.5: The Structural Domains of Spastin
Figure 1.5: TM: Transmembrane domain, MIT: Microtubule interacting and transport domain, MTBD: Microtubule binding domain, AAA: ATPase associated with various cellular activities. Figure adapted from (Shoukier et al. 2009).
Four different isoforms of Spastin are expressed in mammalian cells; a 67kDa product is
produced through translation from the 1st start codon, beginning at residue 1, and is hence called
M1 Spastin. Alternatively, a 60kDa protein (M87 Spastin) is produced via an alternative
translation initiation codon starting at residue 87 and driven by a cryptic promoter in exon 1 of
59

the gene (Claudiani et al. 2005; Mancuso et al. 2008). Both of these isoforms are subject to
post-transcriptional regulation through mRNA splicing. Exon 4 is lacking in a common splice
variant of the protein, resulting in variants of both M1 and M87 spastin without a 32 amino acid
region, though the function of this splicing is unknown (Svenson et al. 2001). Over 150
mutations have been identified in spast-associated HSP to date. However, no known HSP
mutations are present in exon 4, meaning the splice variants are not implicated in the
pathogenesis of the disease (Salinas et al. 2008). Though mainly clustered in the AAA domain,
the spectrum of identified mutations and deletions cover the entire gene, possibly explaining the
phenotypic heterogeneity. As discussed, the presence of different domains has profound
influences on the cellular localisation, and therefore function, of the protein.
One major implication of the expression of these different isoforms is the consequence of
complicated subcellular localisation. M87 Spastin lacks the first 85 amino acids, resulting in the
loss of expression of the TM domain. Subsequently, this isoform is predominantly localised in
the cytosolic pool, though it can be recruited to the endosomes and the cytokinetic midbody. It
is also expressed in the nucleus (Claudiani et al. 2005; Connell et al. 2009). Alternatively, M1
Spastin, possessing the hydrophobic transmembrane domain, is solely cytoplasmic due to the
presence of 2 nuclear export signals (Claudiani et al. 2005), and has been implicated in the early
secretory pathway, localizing to the ER and the very early ER to Golgi intermediate
compartment (Connell et al. 2009). Indeed, M1 Spastin was confirmed to exist as an integral
membrane protein through a partitioning experiment using Triton-X. M1 Spastin was observed
in the detergent phase as opposed to the aqueous phase, leading to the prediction that this
isoform partially spans the membrane using its hairpin loop domain (Park et al. 2010). Thus,
due to the expression of different isoforms and association with various adaptor proteins,
Spastin is active in various cellular processes, all with the potential to be pathogenically
involved in HSP.
1.4.2.1: Cellular functions of spastin
1.4.2.1.1: Microtubule severing
1.4.2.1.1.1: Role of microtubule severing in neuronal maintenance
Microtubules form one of the major components of the cytoskeleton. Composed of heterodimers
of and -tubulin, the microtubules form polarised tracts throughout the neuron. The fast
growing plus-end points towards the synapse whereas the slow growing minus end faces the cell
body (De Vos et al. 2008).
The important role of the microtubules in the maintenance of the neurons is reflected in the
level of regulation to which the microtubules are subjected. A variety of microtubule-
60
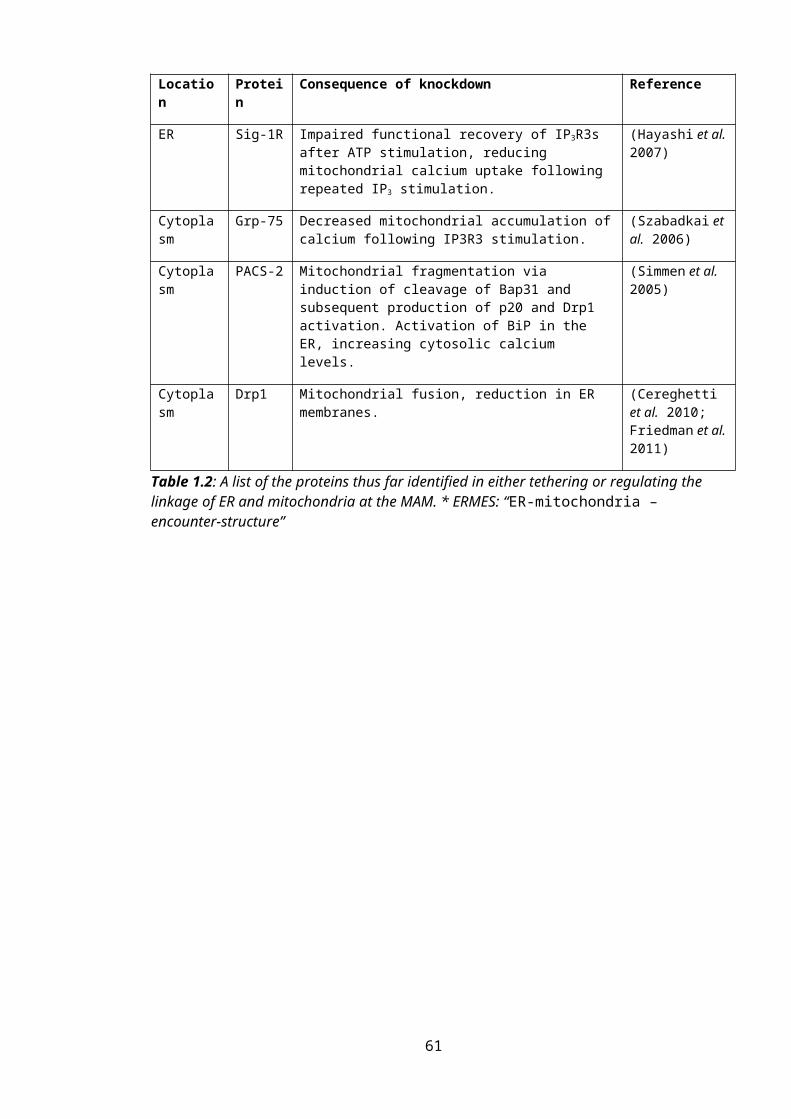
associating proteins (MAPs), as well as the intrinsic GTPase activity of tubulin, act to ensure
efficient assembly and localisation of the microtubules. Furthermore, the tubulin polymers are
subject to a diverse range of post-translational modifications including acetylation, tyrosination
and polyglutamylation, all of which regulate the stabilisation or dynamicity of the cytoskeletal
track (Baas et al. 2006; Fukushima et al. 2009).
In the developing neuron the microtubules are dynamic, coordinating extension or retraction of
the neurite, and permitting the motility of the growth cone. In the mature neuron, the
microtubule network acts as a railway for cargo transport bidirectionally along the axon (De
Vos et al. 2008; Fukushima et al. 2009). Common cargoes include neurofilaments,
mitochondria and lipids. Additionally, the microtubule polymers themselves are transported
bidirectionally along neurites, for maintenance of the cytoskeletal tracks. The capacity of a
microtubule to be transported is strictly related to its length; the short microtubules are
bidirectionally mobile whereas the longer polymers tend to exist in a stationary form (Baas et
al. 2006). Thus, any proteins acting to regulate microtubule length will have a key role in the
maintenance of the cytoskeleton in the neuron.
1.4.2.1.1.2: Evidence for role of spastin in microtubule severing
Spastin was first suggested to have a role in microtubule severing in light of its homology with
Katanin, a subgroup 7 AAA protein that severs microtubules in processes such as mitosis and
meiosis (Errico et al. 2002). Transfection studies with epitope-tagged Spastin in Cos7 cells
established the microtubule connection of the protein. Spastin was found localise to discrete
punctate structures near the GA and the centrosome when expressed at low levels, suggestive of
a localisation at the microtubule-organising centre. Furthermore, a dramatic reduction in the
intensity of tubulin staining was observed in 50% of wild type Spastin-transfected cells,
indicating a role for Spastin in the disassembly of microtubules (Errico et al. 2002).
Additionally, overexpression of mutant forms of Spastin revealed a filamentous expression
pattern, immunostaining positive for -tubulin, thus confirming the N-terminal-mediated
association of mutant Spastin with the microtubule network (Errico et al. 2002).
As mentioned, the enzymatic core of the AAA domain contains a central / nucleotide binding
domain (termed the Walker A and Walker B motif (Walker et al. 1982)). Mutations in these
Walker A or B motifs prevent either ATP binding or hydrolysis. In order to investigate the
pathogenic relevance of such mutations, recombinant forms of Spastin were generated
harbouring disease-related mutations in either the Walker A or Walker B residues. Transfection
studies with these constructs revealed that if ATPase activity is diminished, the mutant Spastin
(mSpastin) becomes kinetically trapped on the microtubules, resulting in the aforementioned
filamentous pattern in the cell body. This pattern was not observed when the mutant protein was
unable to bind ATP, indicating that upon binding, Spastin is targeted to the microtubules (Evans
61
et al. 2005). Thus, the cellular distribution of mSpastin depends on where in the AAA domain
the mutation is located, and this in turn can dictate the effect the mutation has on the
pathophysiology of the disease.
An additional study observed that overexpression of a disease relevant, ATPase deficient
mSpastin colocalised with a subset of microtubules but did not result in the degradation of
tubulin (McDermott et al. 2003). Thus, the microtubule severing activity of Spastin, and its
subsequent defect in the presence of an SPG-related mutation, occurs in neurons.
Further evidence of the role of Spastin in microtubule severing was established using an elegant
time-lapse experiment, where ATP and wild type Spastin were added to permeabilised, cytosol
depleted mammalian cells. A resultant time-dependent decrease in microtubule content was
observed; however, this severing effect was not observed when ATPase activity deficient
mSpastin was used, confirming the role of the AAA domain in microtubule severing (Evans et
al. 2005).
Independent structural studies of Spastin have resulted in conflicting models as to the how
Spastin achieves the severing of microtubules. It is appreciated that the protein forms a
hexameric ring, such that the pore entrance harbours the helices belonging to the AAA domain.
This hexameric form of Spastin assembles on the microtubule by seizing the acidic tubulin tails.
The protein is then anchored in place by the MTBD (White et al. 2007; Roll-Mecak et al. 2008).
Experiments in HeLa cells found that the addition of glutamate side chains on tubulin increases
the efficiency of Spastin microtubule severing; likely by increasing the acidity of the C-terminal
tubulin tail, and therefore strengthening its interaction with the basic residues of the pore loop in
the ATPase domain (Lacroix et al. 2010; Lumb et al. 2012).
Some of the adaptor proteins known to interact with the N-terminal domain of Spastin have
been identified as being either integral membrane or membrane-associated proteins. Thus, it has
been suggested that the Spastin acts to coordinate microtubule-severing activity with the
maintenance of specific membrane dynamics (Connell et al. 2009). Consequently, Spastin has
been found to have physiological roles in the regulation of ER morphogenesis and endosomal
dynamics.
1.4.2.1.2: Endoplasmic reticulum morphogenesisThe M1 isoform of Spastin has been found localised to the ER (Connell et al. 2009). Regulation
of ER morphogenesis has become increasingly of interest with regards to the pathogenesis of
HSP as more Spastin-interacting partners are identified. The interaction of the TM domain of
M1 Spastin with Atlastin, Reticulon 2 (Rtn2) and Receptor accessory protein 1 (REEP1) is
postulated to form an “ER morphogen complex”, acting in a coordinated manner with the
62
microtubule network to regulate ER morphogenesis. The complex promotes the alignment of
the ER along the microtubular cytoskeleton (Park et al. 2010; Blackstone 2012).
WHAT IS THE DISEASE MECHANISM IN HSP….RELATION TO ATLASTIN?
1.4.2.1.3: Endosome dynamicsThe M87 (short) isoform of Spastin is localised on endosomes via its MIT domain mediated
interaction with members of the ESCRT-III family of proteins, including Chmp1b (Reid et al.
2005; Connell et al. 2009). The interaction between Spastin and the ESCRT-III family appears
to be critical in the microtubule disruption event accompanying the final abscission stage of
cytokinesis (Yang et al. 2008; Connell et al. 2009).
Furthermore, preliminary evidence in immortalised cells revealed that Spastin interacts with
another endosomal protein, Protrudin (also known as ZFYVE27) (Mannan et al. 2006; Zhang et
al. 2012). This interaction promotes neurite outgrowth in a PC12 cell line, suggesting that
Spastin and Protrudin may play a role in the outgrowth of motor neuron axons (Zhang et al.
2012). If verified in neurons with endogenous proteins, this interaction could be pathologically
relevant; Protrudin has been implicated in the regulation of neurite extension and directional
membrane trafficking (Shirane et al. 2006). Both of these processes require the coordinated
activity of cytoskeletal remodeling and membrane trafficking: processes that could be coupled
through the microtubule severing input of Spastin.
1.4.2.1.4: Regulation of BMP signallingA recent role for Spastin in coupling microtubule severing with membrane scission has emerged
with regards to regulation of the BMP signalling pathway. In the mature neuron, BMP
signalling regulates both axonal growth and synaptic function (Wang et al. 2007; Blackstone
2012).
Regulation of the BMP pathway has recently been identified as a unifying process in HSP,
involving several of the causative HSP genes, namely Spastin, Spartin, Atlastin and NIPA1. It is
likely that Spastin regulates the BMP pathway through the control of BMP receptor levels, since
abscission is essential in the trafficking of membranes in the endosomal pathway (Lumb et al.
2012). Knockdown of atlastin in zebrafish demonstrated that overactivation of BMP signalling
resulted in the development of an abnormal architecture of the spinal motor axons, namely a
significant increase in axonal branching (Fassier et al. 2010)…..WHICH MOUSE MODEL IS
THIS ALSO SEEN IN?....zhu 2006? Furthermore, depletion of either Spastin or Spartin in
HeLa cells increased the concentration of phosphorylated SMAD1/5, a transcription factor
downstream in the BMP pathway, even in the absence of BMP4 stimulation (Fassier et al.
2010).
63
1.4.3: In vivo models of HSP
Several models have been generated to provide insight into the pathological consequences of
mutations in, or loss of expression of, Spastin.
1.4.3.1: Drosophila melanogaster
Knockdown of Drosophila Spastin (dSpastin) resulted in the accumulation and stabilisation of
the microtubule network, with a concomitant decrease in synaptic area. Overexpression of wild
type dSpastin resulted in the disassembly of the microtubules alongside a decrease in synaptic
strength (Trotta et al. 2004).
The importance of the AAA ATPase domain in this severing of microtubules was confirmed
using recombinant dSpastin with mutations either in the Walker A or Walker B pore loop. The
ATPase activity of the protein was diminished; subsequent microtubule severing activity was
also markedly decreased (Roll-Mecak et al. 2008).
1.4.3.2: Danio rerio
The role of Spastin function in the developing zebrafish embryo was examined using
morpholino-mediated transient gene knockdown. In these Spastin-knockdown fish, the
branchiomotor neurons exhibited decreased axonal outgrowth alongside aberrant positioning of
the neuronal cell bodies. Impaired outgrowth of spinal motor neuron axons was also observed.
The dynamicity of the microtubule network is regulated by a family of MAPs, termed the
microtubule plus-end tracking proteins (+TIPs), which form “comet-like” complexes at the
plus-end of the polymerising microtubules. Two of these +TIPs, end-binding protein 1 and 3
(EB1 and EB3), are recruited to the microtubule plus-end specifically to regulate axonal growth
and elongation, via microtubule polymerisation (Akhmanova et al. 2008).
Microinjection of EB3-green fluorescent protein (GFP), under the control of a neural-specific
promoter, into one-to-two cell zebrafish embryos allowed the visualisation of the microtubule
plus-end dynamics and therefore microtuble-mediated outgrowth. Upon knockdown of Spast
expression, an almost complete loss of EB3-GFP fluorescence in the discrete puncta was
observed, indicating an absence of the comet-like structures at the plus ends and thus a defect in
axon outgrowth. Furthermore, the same result was seen when the embryos were treated with a
microtubule destabilising drug, highlighting a novel role of microtubule severing in the
maintenance of growth cone activity. Spastin expression is necessary for the promotion of
coordinated anterograde growth. Accordingly, the observed neuronal defects in these
knockdown zebrafish manifested in the impairment of motility (Wood et al. 2006).
The aforementioned role of Spastin and protrudin in axonal outgrowth has also been highlighted
in zebrafish. Protrudin is an upstream inhibitor of rab-11, which in turn aids coordination of
64
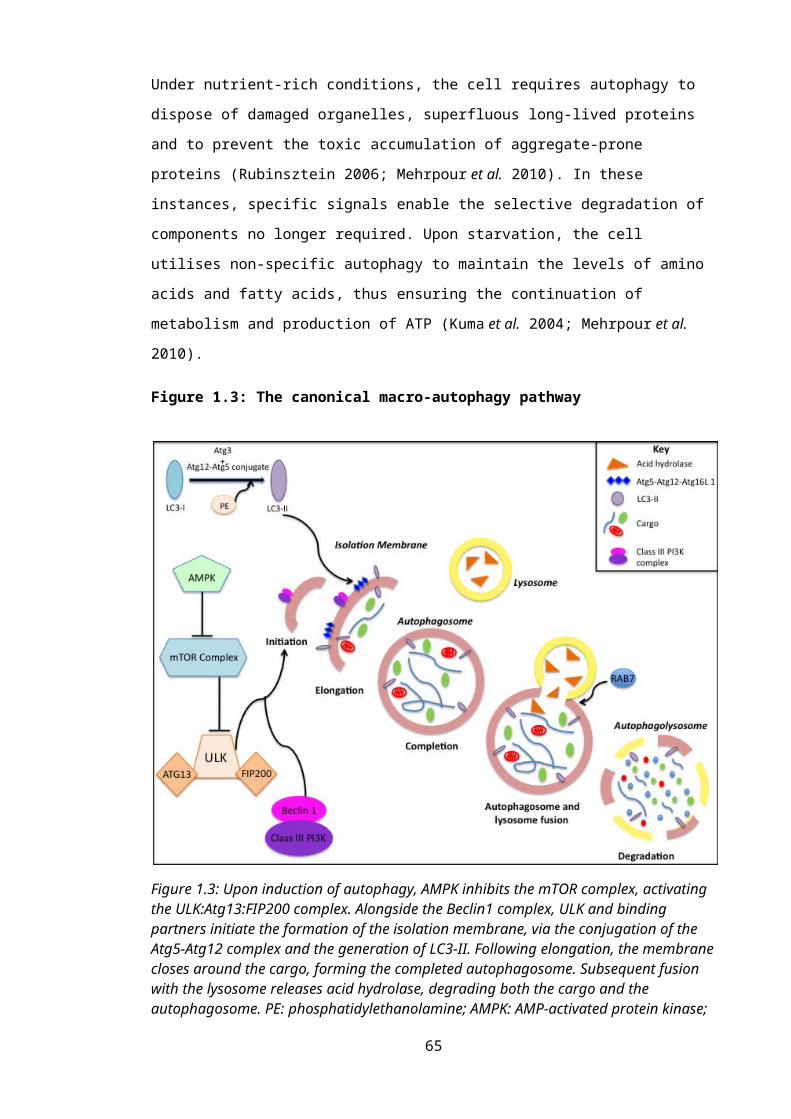
membrane trafficking during neurite extension (Shirane et al. 2006). In the zebrafish embryo,
the outgrowth of the spinal motor neurons was inhibited, alongside abnormal axonal branching,
when the fish were injected with either spastin or protrudin morpholinos. The severity of the
phenotype increased when both genes were simultaneously inhibited, and could be rescued with
the injection of either human spastin or protrudin (Zhang et al. 2012). Therefore, spastin and
protrudin may collaborate to regulate motor axon outgrowth.
1.4.3.3: Mus musculus
Tarrade utilised a mouse model expressing a deletion mutation in the spast gene, resulting in a
premature stop codon and a loss of expression at the protein level. Progressive axonal
degeneration was observed in the CNS, manifesting in a late and mild motor defect, as defined
by alterations in step length (Tarrade et al. 2006). A dosage effect was observed with expression
levels of spastin. Both the axonopathy and subsequent motor defect was more severe in the
homozygous mice compared to the heterozygotes, which were, in turn, more severe than the
wild type mice.
At a cellular level, the axonopathy was characterised by the appearance of axonal swellings,
which increased in number over time. Investigation of these swellings in primary cortical
neurons established that they developed after four days in culture. Intriguingly, these focal
swellings appeared to arise exclusively in the distal region of the neurite, at an area of
microtubule transition from a stable to dynamic state…..HOW DO YOU KNOW THAT THIS
IS THE PLACE WHERE DYNAMIC TO STABLE MT? Thus, it can be inferred that these
axonal swellings cause a disruption to the microtubule dynamics. Indeed, though not directly
quantified, retrograde axonal transport also appeared impaired in the neurons; abnormal
accumulation of mitochondria was observed in the proximal part of the neurite swellings
(Tarrade et al. 2006).
Defective axonal transport was also evident in a separate novel mouse model of SPG4,
generated using N-ethyl-N-nitrosourea (ENU)-induced mutagenesis to induce a pathogenic
splice site mutation in Spast.
Splice site mutation…..novel 50 cterm bases, premature stop codon,
A novel transcript was created encoding a truncated spastin protein, which was not detectable at
the protein level, essentially creating a spastin knockout mouse model (Kasher et al. 2009).
Mutations in this splice site have also been reported in human patients, making this mouse a
bone fide model of human disease (Fonknechten et al. 2000). As with the ATPase deficient
mouse model, gait abnormalities were also evident, developing from aged 7 months.
At a cellular level, axonal swellings were also present in cultured cortical neurons derived from
both heterozygous and homozygous mice. These swellings immunostained positive for multiple 65
components of the cytoplasm, including mitochondria, tau, neurofilaments, as well as -tubulin.
However, in contrast to the previous aforementioned mouse model, the distribution of swellings
in the axons was random rather than distally localised…..WHAT CAUSES THIS?!!!!
UNCLEAR WHY THESE DIFFERENCES OBSERVED….DIFFERENCE IN PLATING
DENSITIES?, EXPERIMENTAL SET-UP? GENETIC BACKGROUND?
A dosage effect of spastin was also evident in this mouse model, with regards to the frequency
of axonal swellings (Kasher et al. 2009).
Defects in axonal transport were also directly quantified, with a decrease in the anterograde
transport of membrane bound organelles (MBO) and mitochondria in both heterozygous
(mitochondria only) and homozygous (mitochondria and MBO) neurons. Furthermore, the
presence of the axonal swellings appeared to exacerbate the distal transport defect; in
homozygous mice, the frequency of movement decreased 40% distal to the swellings.
Anterograde transport was quantified as being decreased both proximal and distal to the
swellings, whereas retrograde transport only appeared defective distal to the swelling. Transport
of cargo was perturbed by an increased duration of pausing rather than blockage at the swelling.
This defect also appeared to be cargo specific, with mitochondrial anterograde transport reduced
in heterozygote neurons, whereas transport of MBOs was unaffected, again highlighting the
imperative role mitochondria have in maintaining neuronal health.
Interestingly, immunohistochemistry carried out on sections of cervical and lumbar spinal cords
derived from SPG4 patients revealed the presence of swellings in the long descending axons of
the corticospinal tracts (Kasher et al. 2009). Thus, the defects observed in mouse models are
relevant for the pathogenesis of the disease in humans.
The murine models of HSP strongly implicate defective axonal transport as causative or
contributing to the disease process. SPG10 and SPG30 also provide a precedent that abrogation
of axonal transport can manifest itself into HSP. KIF5A, encoding a subunit of the microtubule-
based anterograde motor protein, Kinesin, is mutated in SPG10 (Reid et al. 2002). Furthermore,
KIF1A is mutated in several families with autosomal recessive SPG30 (Klebe et al. 2012).
HSP-linked mutant forms of KIF5A perturb axonal transport, reminiscent of the increase in the
levels of pausing of cargo in an SPG4 mouse model (Karle et al. 2012). Thus, impairment of
motor based transport, either through defects in the motor itself, or in the microtubule track on
which it travels, can manifest itself in neurodegenerative disease. Retrograde degeneration of
the corticospinal tract highlights the need for efficient axonal transport in maintaining the
metabolically demanding, exceptionally long neurons of the pyramidal motor pathway.
66
1.4.4: Spastin and Hereditary Spastic Paraplegia
It is currently unclear whether the pathogenic spast mutations in HSP act in a dominant negative
manner or whether the disease arises as a consequence of haploinsufficiency. In fruitfly,
zebrafish and mouse models of the disease, decreasing or knocking out spastin activity results in
a stabilisation of the microtubule network, defects in axonal outgrowth and, in the mouse
models, an appearance of axonal swellings (Trotta et al. 2004; Tarrade et al. 2006; Wood et al.
2006; Kasher et al. 2009). Furthermore, no pathogenic swellings were observed in the axons
when mSpastin was transfected into wild type neurons (Tarrade et al. 2006). These models,
therefore, appear to support the notion that the disease arises due to the haploinsufficiency of
spastin. Indeed, the deletion mutant models only support the loss of function hypothesis. Further
support for a loss of function model in mSpast-mediated HSP has arisen following identification
of patients possessing whole exon deletion of Spast (Depienne et al. 2007).
However, in the cellular models of SPG4, the overexpression of mutant forms of spastin results
in the disturbance of microtubule dynamics, redistribution of spastin and defective
morphogenesis of membranous organelles such as the ER (Errico et al. 2002; McDermott et al.
2003; Evans et al. 2005). Furthermore, the co-transfection of mutant and wild type forms of
spastin in a mammalian cell line results in their colocalisation, raising the possibility that the
mutant form segregates the wild type protein in a dominant negative manner (Errico et al.
2002). Finally, some mutant forms of M1 spastin diminished the enzymatic activity of wild type
M87 spastin, further suggestive of the dominant negative action of mspastin (Solowska et al.
2008).
It is possible that both forms of mutant activity occur. Evidence in Drosophila found that both
knockdown of dspastin and overexpression of mspastin results in the excessive stabilisation of
the microtubule network at the NMJ, alongside neurodegeneration and locomotor impairment
(Orso et al. 2005). Thus, it is possible that both mechanisms may be pathogenically relevant in
SPG4, accounting for the phenotypic heterogeneity observed in the disease.
There has been some debate as to which isoform of Spastin is pathogenic in SPG4. There is
evidence to suggest that the less abundant, long M1 isoform mediates the toxic function; the N-
terminal region of spastin, only present in the M1 isoform, inhibited fast axonal transport in
squid axon (Solowska et al. 2008). Thus, M1 spastin’s ability to target the endoplasmic
reticulum and the endosomes may be important in the pathogenesis of the disease. Furthermore,
although M87 spastin is the most abundant isoform, M1 spastin is specifically enriched in the
brain and spinal cord (Connell et al. 2009), possibly explaining neuronal vulnerability and
implicating it as the main pathogenic form in SPG4.
The identification of several HSP proteins as key proteins in the maintenance of both endosomal
dynamics and ER morphogenesis suggests that abrogation of membrane modelling in the axon
67
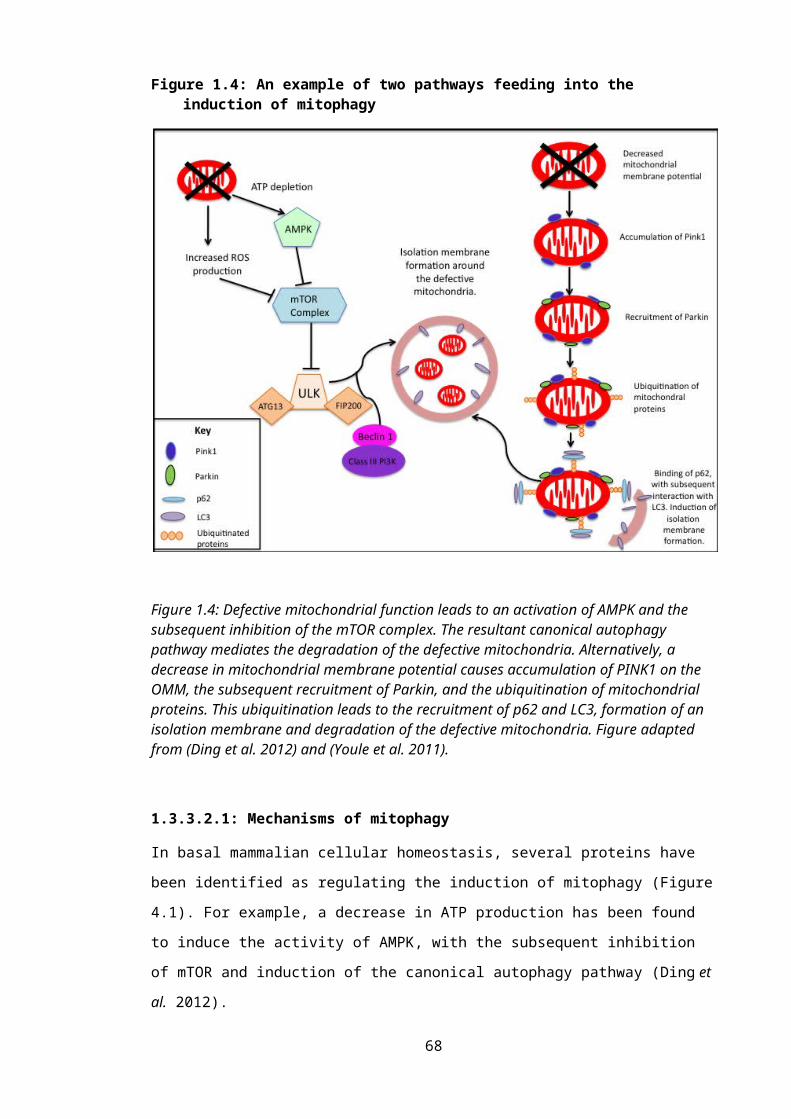
is a primary cause of axonal degeneration in HSP. It has been suggested that the correct
morphogenesis of the ER or the endosomal network is required to maintain bioenergetically
efficient axonal transport (Blackstone et al. 2011). Spastin likely functions in maintaining the
microtubules responsible for the transport of the ER or endosomal membranes. This disruption
to axonal transport is probably compounded by splicing of the microtubules affecting the
transport of cargo by the motor proteins on the microtubule track.
It has also been suggested that defects in membrane modeling could affect the trafficking of
receptors involved in signalling pathways important for the regulation and maintenance of
axonal transport. In Drosophila, it has been demonstrated that BMP signalling regulates
microtubule dynamics and inhibition of this pathway inhibits axonal transport (Wang et al.
2007). As mentioned, Spastin, along with several other HSP genes, has been implicated in
regulating the trafficking of the receptors of the BMP pathway (Tsang et al. 2009). Thus, the
multi-faceted nature of Spastin may integrate multiple cellular processes, making it
pathologically relevant.
1.5: Motor Neuron VulnerabilityIt has been shown that motor neurons are highly susceptible to excitotoxicity due to their
subunit composition of the AMPA receptor. It is relatively deficient in GluR2, potentially as a
consequence of transcriptional regulation, and thus highly permeable to calcium, upon
glutamate stimulation (Shaw et al. 1999). It is also notable that motor neurons also have a lower
calcium buffering ability compared to other cells, due to decreased levels of calcium buffering
proteins, such as parvalbumin and calbindin (Ince et al. 1993). Thus, the mitochondria are
forced to play a more pivotal role in the homeostasis of cytosolic calcium. Interestingly, motor
neurons within the oculomotor nuclei in the brainstem, and Onuf’s nucleus, spared degeneration
in ALS, do express calcium-binding proteins (Ince et al. 1993). Furthermore, overexpression of
parvalbumin delays disease onset in transgenic mice (Beers et al. 2001).
Moreover, elegant co-culture studies demonstrated that non-autonomous expression of mSOD1
can mediate the degeneration of the motor neuron. Expression of mSOD1 in astrocytes leads to
the degeneration of motor neurons, via the induction of motor neuron mitochondrial
dysfunction, namely a decrease in the mitochondrial redox state and the subsequent
depolarisation of the mitochondrial membrane potential (Bilsland et al. 2008)….EXPLAIN
Structural features of motor neurons may also render them vulnerable to degeneration. For
example, as discussed, the extreme axonal length of the long descending corticospinal tracts,
vulnerable in HSP, makes them susceptible to axonal transport deficits (Blackstone et al. 2011).
The lack of protein synthesis occurring in neurites serves to exacerbate this reliance on fast
axonal transport (Shaw 2005). Additionally, maintenance of these long axons requires a certain
68
level of membrane plasticity, also reliant on axonal transport and efficient functioning of the
endosomal pathway (Blackstone 2012). As mentioned, both of these processes are defective in
HSP. Furthermore, motor neurons have a high metabolic rate, necessary to meet the transport
demands, as well as to maintain the excitable nature of the cell. However, this high metabolic
rate leaves the cell extremely vulnerable to any deficits in respiration, such as those seen in ALS
(Shaw 2005).
Finally, it has been postulated that the motor neurons are selectively vulnerable in ALS due to
the specificity of protein composition seen in spinal cord mitochondria. mSOD1 may be
specifically recruited to spinal cord mitochondria due to the particular complement of proteins
expressed on the cytoplasmic face of the organelles (Liu et al. 2004). However, this evidence is
controversial; conflicting results refute any specificity of mSOD1 recruitment (Jaarsma et al.
2001; Vijayvergiya et al. 2005).
1.5.1: Models of neurodegenerative disease
Immortalised cell lines are frequently used in research as a simple model to understand complex
biological functioning in higher systems. The cell lines are favoured in research as they are
highly amenable to genetic manipulation, such as gene knock-down and stable or transient
transfection. A clonal population can also be derived from the cells, removing genetic
heterogeneity as a confounding factor. Furthermore, their fast growth rate allows the conduction
of high through-put studies, such as drug screens. However, immortalised cell lines invariably
have different metabolic rates and genetic make-up compared to neurons, meaning results
should be interpreted with caution. Furthermore, although the cells generally have originated
from a recognisable tissue, they will have undergone significant mutations when immortalised,
which may have an effect on their biology.
Conversely, primary cellular models, though less amenable to manipulation, represent a more
clinically relevant model to work on. Primary neurons derived from animal models have the
advantage of being relevant for investigation of neurodegenerative disease. These cells can be
genetically manipulated to further recapitulate the disease of interest. However, the primary
neurons are generally derived from an organism expressing a pure genetic background, and
therefore lacking the phenotypic heterogeneity present at the clinical level. Furthermore, the in
vitro conditions of culture is likely to influence results; as with any cellular model, in vitro data
requires validation using an in vivo model.
The use of in vivo models allows the understanding of the functioning of genes and protein
pathways in the context of the whole organism. Thus, the pathogenesis of disease can be better
understood. Targeted deletion of part of a gene can be used to study haploinsufficiency in vivo.
69
This targeted approach can be preferable to complete gene knock-out models, which are often
embryonically lethal. It also negates the need to generate a control model; if a mutant transgene
approach is adopted, a control line overexpressing the wild type protein is necessary. However,
this overexpression is often lethal, as demonstrated with the overexpression of Spastin and
TDP-43 (Trotta et al. 2004; Wils et al. 2010).
Several biomarkers have been developed to help elucidate pathogenic mechanisms of ALS, as
well as to try and improve efficiency of diagnosis of the disorder. These include:
Increased levels of glutamate, or increased evidence of oxidative stress, in the CSF
(Rothstein et al. 1990; Shaw et al. 1995; Bradley 1999; Spreux-Varoquaux et al. 2002;
Ilzecka et al. 2003) (Shaw et al. 1995; Tohgi et al. 1999; Simpson et al. 2004; Migliore
et al. 2005).
The presence of oxidative products, such as free radicals and protein associated
carbonyls, or increased levels of glutamate in the blood (Bradley 1999).
Evidence of impaired EAAT2 expression in the CSF (Rothstein et al. 1995; Fray et al.
1998).
However, these current molecular biomarkers, particularly those found in blood, are
susceptible to confounding, external factors linked to diet and drug intake (Migliore et al. 2005).
In light of this, fibroblasts derived from patients provide an ideal, easily accessible substrate on
which to conduct studies (Migliore et al. 2005). Primary human patient dermal fibroblasts also
express any pathogenic mutant proteins at a physiological level. Previous investigations have
ascertained that disease state fibroblasts do display functional abnormalities.
For example, both sALS and fALS fibroblasts exhibited increased sensitivity to oxidative stress
when exposed to SIN-1 (3-morpholinosydnonimine) or H2O2, respectively (Aguirre et al. 1998).
Furthermore, ALS patient-derived fibroblasts had impaired calcium homeostasis when
challenged with Bradykinin, and a dysfunctional glutamate re-uptake system compared to
control cells (Witt et al. 1994) (Tremolizzo et al. 2004).
However, it should be noted that fibroblasts are metabolically different to neurons; the majority
of their ATP production is derived from glycolysis, instead of oxidative phosphorylation, as
favoured by neurons (Benard et al. 2007). Thus, any metabolic data derived from human
fibroblasts should be interpreted with caution with regards to neurodegenerative disease.
Despite these differences, fibroblasts have recently come to the forefront in the search for
biomarkers of neurodegenerative disease. Fibroblasts derived from mutant Parkin (mParkin)-
mediated PD patients revealed a decrease in the activity of Complex I of the ETC, alongside
decreased ATP production and m (Mortiboys et al. 2008). An increase in the branching
complexity of the mitochondria was also observed when compared to control fibroblasts,
70
exacerbated by the presence of a Complex I inhibitor (Mortiboys et al. 2008). These
observations support the findings observed in fibroblasts afflicted with isolated Complex I
defects; minor deficits in ETC activity increases branching of the mitochondria, representing an
adaptive response of the cell. The formation of these interconnected networks creating an
efficient mechanism of energy deliverance (Koopman et al. 2005). Conversely, severe defects in
Complex I activity significantly decreases the networking of the mitochondria, suggestive of a
failure to cope with the resultant energy deficits (Koopman et al. 2005). Thus, this proof of
principle data generated in PD patient fibroblasts provides a precedent for utilising peripheral
cells not directly implicated in the pathogenesis of the disorder (Mortiboys et al. 2008).
IPS CELLS BETTER?
1.6: Hypothesis and aims of PhDThe efficient functioning of mitochondria is essential for the survival of the cell. With its critical
roles in matching bioenergetic demand with output, maintenance of calcium homeostasis and
regulation of the apoptotic cascade, any perturbation in mitochondrial function may have far-
reaching consequences. As discussed, dysfunction of the mitochondria has been highly
implicated in the pathogenesis of neurodegenerative disease, including ALS and HSP. In ALS,
mitochondrial dysfunction has been noted in both sporadic and familial forms of the disease.
The majority of evidence has derived from mSOD1 disease models (Magrane et al. 2009).
However, recent evidence indicates that expression of mutant TARDBP (mTARDBP) may also
result in mitochondrial dysfunction (Xu et al. 2011). In HSP, caused by mutations in Spast,
transport of the mitochondria along the axon is severely disrupted, contributing to the dying
back of the neuronal processes (Kasher et al. 2009).
Mitochondrial dysfunction is intricately related to the morphology of the organelle. Thus, any
defects in mitochondrial activity tend to result in changes in mitochondrial dynamics.
Furthermore, disease-related, activity-dependent changes in mitochondrial form have been
noted in peripheral cells, such as dermal fibroblasts (Mortiboys et al. 2008). There is thus
precedent that study of peripheral cells can be used to recapitulate the defects found in the
neurons upon neurodegeneration.
In light of this evidence, three main hypotheses were formed for this PhD:
Disruption of mitochondrial function in ALS, including excessive production of ROS,
biochemical changes and disruption of calcium homeostasis, will lead to mitochondrial
dysmorphology in patient dermal fibroblasts.
71
Physiological expression of mTARDBP in patient fibroblasts will result in defects in
gene expression, disturbing the functioning of the mitochondria.
Pharmacological intervention of microtubule dynamics in mSpast-expressing cortical
neurons will restore axonal transport in this model of HSP…..WHY?
In order to confirm these hypotheses, several aims were established:
To quantify mitochondrial morphology in both aged and patient fibroblasts; specific
changes in mitochondrial networking will be measured, indicating alterations in
mitochondrial dynamics.
o I will assess whether primary patient fibroblasts recapitulate the changes in
mitochondrial morphology that were reported in axons.
To characterise mTARDBP-expressing patient fibroblasts using available gene
expression microarray data, with the aim of elucidating the main pathological roles of
mTDP-43 in ALS.
To assess the impact of pharmacological intervention on axonal dysfunction in an SPG4
model. Dysfunction will be quantified by measuring the number of pathogenic axonal
swellings previously noted in this model of HSP.
o Primary cortical neurons from mSpast mice will be grown in the presence or
absence of microtubiule-targeting drugs to see if they are capable of restoring
efficient axonal transport in these cells.
EXPAND….
72
Chapter 2 - Materials and Methods
2.1: General
2.1.1: Ethics
For research involving human fibroblast biopsies, all samples were taken with informed consent
in accordance with the guidelines and regulations set by the Local Ethics Committee. For
research involving neurons obtained from mice, all procedures were conducted in accordance
with the regulations set by the Animals (Scientific Procedures) Act, 1986.
2.1.2: Chemicals and reagents
Unless otherwise stated, all chemicals and reagents were purchased from Sigma-Aldrich (Poole,
Dorset, UK). For Real Time, Quantitative Polymerase Chain Reaction (RT qPCR), primers
were obtained from Sigma-Aldrich (Haverhill, UK). The PBS used throughout the project was
Ca2+, Mg2+ free PBS from Sigma Aldrich (U.K).
2.1.3: Image analysis
All image analysis was carried out under blinded conditions using Image J software
(http://rsbweb.nih.gov/ij/).
2.1.4: Statistical analysis
All statistical analysis was carried out using GraphPad Prism 5 software. For all experiments P
value = 0.05.
2.2: Establishment and culture of human primary dermal fibroblasts Fibroblasts were cultured in minimal essential medium (MEM) (PAA, Austria) supplemented
with 10% FBS Gold (PAA, Austria), 100IU/ml penicillin, 100µg/ml streptomycin (Lonza,
Switzerland), 2mM glutamine (Lonza, Switzerland), 1X MEM Vitamins Solution (Lonza,
Switzerland), 0.1mM non-essential amino acids (Lonza, Switzerland), 1mM Sodium Pyruvate
(Lonza, Switzerland) and 50g/ml uridine. Cells were cultured continuously in this glucose-
containing medium unless otherwise stated.
2.2.1: Establishment of primary human fibroblast cultures
The cell cultures were established either at the Metabolic Biochemistry and Tissue Culture unit
of Sheffield’s Children NHS Foundation Trust or in the Sheffield Institute for Translational
Neuroscience. Skin biopsies were taken from the forearm of the subject and placed into 20ml 73
MEM. The biopsy was then dissected using sterile surgical blades, with each section of biopsy
then left in a T25 (Greiner Bio-One, Germany) coated with a layer of 50% FBS Gold and 50%
MEM. The samples were cultured in a humidified incubator maintained at 37°C and
supplemented with 5% CO2. Following outgrowth of the fibroblasts from the biopsy sample, the
cells were trypsinised and transferred to a T75 flask (Greiner Bio-One, Germany) (See Section
2.2.2). From here, the cells were routinely split 1:3 and cryo-preserved when confluent (See
Section 2.2.3).
2.2.2: Maintenance of the fibroblast cultures
The fibroblasts were grown in a T75 flask (Greiner Bio-One, Germany) and passaged 1:3 once
at around 80% confluency. During the passage of cells, all media was removed and cells were
washed with PBS. The cells were then incubated at 37°C in 1X Trypsin in PBS supplemented
with 1mM EDTA (Lonza, Switzerland) for 3 minutes to detach the cells from the surface of the
flask. Conditioned MEM was added to inhibit the action of the trypsin. Cells were then
centrifuged for 4 minutes at 400 xg; the resultant pellet was resuspended in fully supplemented
MEM, before equally aliquoting the cells into 3 separate T75 flasks.
2.2.3: Cryo-preservation of fibroblasts
When cells were at 80% confluency, they were trypsinised and centrifuged as per the protocol
outlined in the previous section. The resultant pellet was resuspended in FBS Gold
supplemented with 10% (v/v) DMSO. 750l of cell suspension was aliquoted into a 1ml
cryovial and placed into the Cell Freezing System (Thermoscientific, U.S.A) containing
isopropanol, which lowers the temperature by 1°C/minute. The cryovials were placed at -80°C
overnight, before being transferred to liquid nitrogen for long-term storage.
2.2.4: Plating, and experimental growth conditions of, the fibroblasts
2.2.4.1: Plating densities
When cells were at 80% confluency, they were trypsinised and centrifuged as per the protocol
outlined in Section 2.2.2. For the investigation of morphology and motility of mitochondria,
cells were plated at a density of 32,000 cells per well, in a 6 well plate (Greiner Bio-One,
Germany), containing 22X22mm coverslips (Menzel Glaser, Germany). For quantification of
the association between the ER and the mitochondria, the fibroblasts were seeded at a density of
13,000 cells per well (Greiner Bio-One, Germany) in a 24 well plate containing 13mm
coverslips (Menzel Glaser, Germany). All coverslips used were pre-coated with 20µg/ml Poly-
L-Lysine. For quantification of ATP levels, the fibroblasts were seeded at a density of 3,5000
cells per well in an opaque-walled 96 well plate (Greiner Bio-One, Germany).
74

2.2.4.2: Growth conditions
Cells were cultured in fully supplemented MEM for 24 hours following plating. For
morphology and ATP quantification, the fully supplemented MEM was then removed from half
of the wells. These cells were washed in PBS to ensure complete removal of the MEM, which
was then replaced with a glucose-free MEM, additionally supplemented with 0.9mg/ml or
0.009mg/ml D-galactose, for 24 hours.
2.3: Investigating mitochondrial morphology in dermal fibroblasts
derived from ALS patients 19 control-derived fibroblasts were cultured alongside fibroblasts derived from 9 sporadic ALS
patients and 3 mTARDBP ALS patients (criteria defined in Table 2.1). Control and patient
samples were age and gender matched where possible. Paired experiments were performed on
cells of similar passage and all experiments were carried out on cells under passage 14 to avoid
the implications of replicative senescence on the mitochondrial morphology. In the patients, the
average age of disease onset was 57.9 (range 37-74 years old), with average disease duration of
6.3 years from date of symptom onset to date of death.
75
Table 2.1: Control and patient fibroblasts used in the mitochondria morphology investigation
Age at Date of Biopsy (Years)
Gender Clinical Diagnosis Age at Onset of
Symptoms
Fibroblast I.D
Disease Duration(Months)
45 Male Control - FIBCON01 -43 Female Control - FIBCON02 -59 Female Control - FIBCON03 -50 Male Control - FIBCON04 -53 Female Control - FIBCON05 -36 Female Control - FIBCON08 -38 Male Control - FIBCON09 -54 Male Control - FIBCON11 -53 Female Control - FIBCON13 -29 Male Control - FIBCON17 -77 Female Control - FIBCON19 -74 Female Control - FIBCON156 -76 Female Control - FIBCON157 -49 Female Control - FIBCON158 -62 Female Control - FIBCON159 -31 Male Control - FIBCON161 -64 Female Control - FIBCON163 -49 Male Control - FIBCON164 -72 Female Control - FIBCON166 -54 Male sALS 53 FIBPAT18 4767 Female sALS 66 FIBPAT21 1671 Female sALS 70 FIBPAT23 2839 Male sALS 38 FIBPAT26 32.573 Male sALS 71 FIBPAT27 5476 Female sALS 74 FIBPAT31 5068 Male sALS 66 FIBPAT34 3343 Male sALS 40 FIBPAT37 5249 Male sALS 46 FIBPAT38 Alive40 Female fALS TARDBP A321V
+ C9ORF72 hexanucleotide repeat expansion
37 FIBPAT48 58.00
62 Male fALS TARDBP M337V
58 FIBPAT51 94.5
56 Male sALS TARDBP G287S 51 FIBPAT55 76.5
Disease duration calculated from date of symptom onset.
76
2.3.1: Visualising the mitochondrial network in the human dermal fibroblasts
Following 24 hour culture in MEM supplemented with either D-glucose or D-galactose (Section
2.2.4.2), cells were incubated for 3 minutes at 37°C in 1mM CMXRos MitoTracker Red
(Invitrogen, U.S.A) in DMSO made up to a final concentration of 132nM in conditioned media.
CMXRos MitoTracker Red is a mitochondria specific fluorescent dye, whose accumulation is
dependent on the mitochondrial membrane potential. After this incubation, the cells were
washed 3 times in fully supplemented MEM for one-minute intervals. The coverslips were then
mounted onto a 76X26mm microscope slide (Thermo Scientific, U.S.A), such that the
fibroblasts were placed flush into 200µl conditioned MEM contained within a well of high
vacuum grease. The coverslip was then sealed using non-toxic sealant grease composed of equal
parts lanolin, Vaseline and paraffin wax, forming an airtight chamber.
2.3.1.1: Live cell imaging of the fibroblasts
All imaging was carried out at ambient temperature (20-21°C) on a Zeiss Axioplan 2
fluorescent light microscope using a 63X Plan APOCHROMAT 1.4 oil immersion objective.
Images were optimised by Openlab5 software (Improvision) and captured by a CCD Camera
C4880-80 (Hamamatsu, Hertfordshire). The 520-570nm light was filtered to 25% via a neutral
density filter and exposure time was set as low (30ms) as possible, whilst still maintaining
visible CMXRos MitoTracker staining. Both of these measures were taken to keep bleaching
and phototoxicity to a minimum. Images were converted to a 12-bit Grayscale format before
analysis.
2.3.2: Analysing the mitochondrial morphology in the fibroblasts
All image analysis was carried out using ImageJ software (by W. Rasband, with plug-ins
written by G. Landini (http://www.densitry.bham.ac.uk/landinig/software/software.html)). 20-
30 images per growth condition were selected for analysis. Each image was subjected to a
quantifiable measurement of morphology, called the Network Complexity, as per guidelines
outlined in (De Vos et al. 2007).
2.3.2.1: Network Complexity
Network Complexity is a measure of branching of the mitochondria within the fibroblast (De
Vos et al. 2007). The image was first filtered using a 7X7 Mexican Hat shaped kernel, a filter
ideal for the size of mitochondria and capable of defining the edges of the mitochondrial
network (Koopman et al. 2005), before being subjected to a Huang threshold to remove
background from the image (Huang 1995). The image was then skeletonised, removing any
pixels touching a background pixel, except where removal would result in the breaking of a
77

continuous region of pixels, thus resulting in the formation of a single pixel-wide skeleton
(Figure 2.1).
Figure 2.1: Image processing to quantify mitochondrial branching in fibroblasts
Figure 2.1: A) Fibroblast loaded with MitoTracker CMXRos Red; B) 7X7 MexicanHat kernel applied; C) Huang threshold filter applied; D) Image is skeletonised, resulting in a single-pixel wide mitochondrial network, from which mitochondrial branching can be quantified.
The BinaryConnectivity plug-in (written by G. Landini and adapted by De Vos) was used to
calculate the network complexity of the mitochondrial network; it is calculated as the ratio
between the number of end points and branch points within the image (Table 2.2), such that in a
highly networked cell, the number of endpoints would be decreased compared to the number of
branch points, and vice versa.
78
Table 2.2: An example of the numeric results of mitochondrial branching in a MitoTracker-loaded fibroblast
Description Value CountBackground - 314239Single pixels 0 13End points 1 245Bifurcation 2 3301Three way node (Branch point) 3 776Four way 4 211Five way 5 29Six way 6 2Seven way 7 0
Table 2.2: Network Complexity calculated by dividing three-way branch points (Value 3+) and upwards by the number of end points (Value 2).
2.3.2.2: Statistical analysis
Each patient or neurologically heathy subject-derived fibroblast set was imaged on three
separate occasions, over three passages. The mean value calculated from the mean of each of
these experiments was plotted against age of the subject at the time of biopsy. Linear regression
analysis was used to ascertain significance both in the difference from zero and the difference
between the control and patient cohorts.
2.3.3: Mitochondrial motility in fibroblasts
It has been demonstrated that the plasticity of mitochondrial dynamics decreases with age (Seo
et al. 2010; Terman et al. 2010). We wanted to establish whether this correlates with a decrease
in the motility of the mitochondria.
Control fibroblasts were selected with a minimum of 20 years between the older and younger
control sample; the average age of the older control samples was 65.5 years, the average age of
the younger controls was 30.25 years. Controls are listed as the pairs they were analysed in
(Table 2.3).
79
Table 2.3: Non-disease state human fibroblasts used in the mitochondria motility investigation
Age at date of biopsy (Years)
Gender Fibroblast I.D
54 Male FIBCON1123 Female FIBCON18
59 Female FIBCON0338 Male FIBCON14
72 Female FIBCON16631 Male FIBCON161
77 Female FIBCON1929 Male FIBCON17
Cells were plated at a density of 32,000 cells/well on a 22mm x 22mm coverslip pre-coated with
20µg/ml poly-l-lysine. 48 hours later the mitochondria of the fibroblasts were stained using
CMXRos MitoTracker Red (Invitrogen, U.S.A) as per the protocol in previous section. A new
coverslip was placed onto a custom designed observational chamber and fixed into place using
high vacuum grease and sealant grease. 700µl of pre-warmed conditioned, fully supplemented
MEM was added on top. A coverslip containing fibroblasts stained with CMXRos MitoTracker
Red was then placed cell-side down onto the media and fixed in place with both high vacuum
and sealant grease.
The live fibroblasts were maintained at 37°C using an objective heater (IntraCel, Herts, U.K).
Mitochondrial motility was imaged using a Zeiss Axiovert 200 microscope with a 40X EC Plan-
Neofluar N.A 1.3 oil immersion objective and a neutral density filter to minimise bleaching.
Time-lapse videos were recorded at 0.33 frames/second, using Openlab5 software. 2-5 minute
recordings were captured per cell.
Mitochondrial motility was quantified according to the method provided by De Vos and Sheetz,
2007 (De Vos et al. 2007). Eight cells were imaged and analysed per coverslip. Two coverslips
were imaged per control at each passage. Each control was imaged for mitochondrial motility
over three passages (e.g passage 7, 8 and 9). Recordings were analysed from 0 to 102 seconds to
avoid the implications of Mitotracker CMXRos Red bleaching out of the sample and distorting
the calculations of the number of pixels moved/frame.
80

ImageJ was used to filter the pixels using a -1 -1 -1 -1 -1 kernel, removing
-1 -1 -1 -1 -1
-1 -1 24 -1 -1
-1 -1 -1 -1 -1
-1 -1 -1 -1 -1
background fluorescence from the image. The image was then converted into a binary format,
such that the mitochondria were now have a pixel value of 255 (Figure 2.2).
Figure 2.2: Analysing mitochondria motility in MitoTracker CMXRos Red stained fibroblasts
Figure 2.2: A) A control fibroblast. B) Despeckle the stack images to remove noise and invert the LUT. C) Apply a filter to threshold the pixels D) Convert the images into a binary format.
Images in the time series were sequentially subtracted from each other using the “Stack
dynamic class” plugin (written by De Vos) on Image J, which automates the subtraction
procedure (Figure 2.3). Any stationary mitochondria were thus removed, and any motile 81
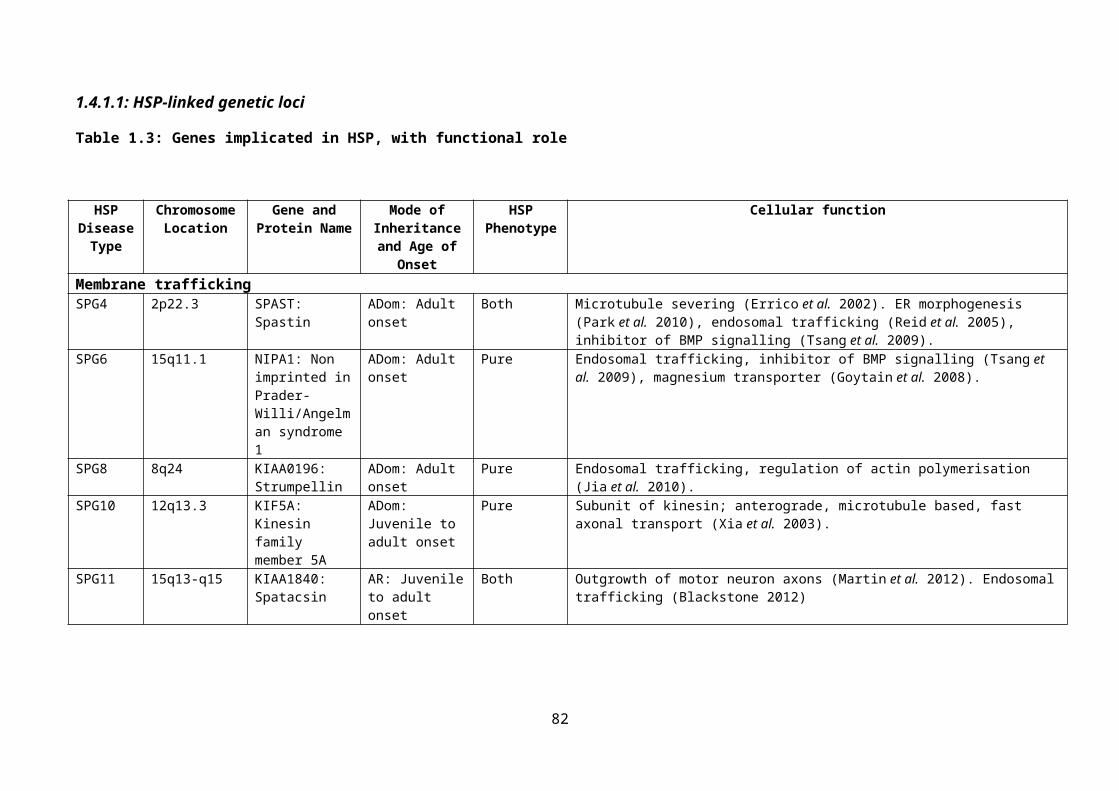
mitochondria retained in the subtracted image. Therefore, the resultant images only showed the
mitochondrial area that has moved between images for each time point. The mitochondrial
motility per time point can be calculated thusly:
Motilityt = (mitochondriat-1 / mitochondriat) X100
where Motilityt is the motility of the mitochondria for each time point, mitochondriat-1 is the
mitochondrial area that has moved between images for each timepoint, and mitochondriat is the
mitochondrial area from the corresponding original time point.
Figure 2.3: Quantifying mitochondrial motility in fibroblasts
Figure 2.3: A) Select region of interest to analyse. Apply the “Compile and Run” plug-in on ImageJ, and select “Stack dynamic class”; B) A list of numbers will be produced, enabling the calculation of the number of pixels moved / frame; C) The percentage of pixels moved over time was then calculated to quantify motility of the individual mitochondria.
2.3.3.1: Statistical analysis of mitochondrial motility
Each pair of control samples were imaged on three separate occasions. The mean value
calculated from the mean of each of these experiments was plotted against age of the sample.
Linear regression was used to ascertain whether the motility significantly differed with age, by
assessing the difference from zero.
82

2.3.4: Quantifying the relative ATP content of the mTARDBP fibroblasts
Table 2.4: Control and patient fibroblasts used to quantify ATP levels
Age at date of biopsy (Years)
Gender Clinical Diagnosis Fibroblast I.D
45 Male Control FibCon0154 Male Control FibCon1140 Female fALS TARDBP A321V +
C9ORF72 hexanucleotide repeat expansion
FibPat48
62 Male fALS TARDBP (M337V) FibPat5156 Male sALS TARDBP (G287S) FibPat55
Measurement of basal cellular ATP levels was carried out using the ATPLite kit (Perkin Elmer,
U.S.A) according to manufacturer’s instructions. Briefly, cells were seeded at a density of 3,500
cells/ well in a white, tissue culture treated, 96-well plate (Greiner Bio-One). 48 hours later, the
media was removed and the cells were washed once in PBS.
The ATPLite assay quantifies the ATP content of the cells using a luciferase-based reaction,
such that the amount of light emitted is proportional to the levels of ATP present:
100µl PBS and 50µl mammalian cell lysis solution was added to each well. The plate was then
agitated for 5 minutes RT. 50µl of lyophilized substrate solution mixed with ATPLite Buffer
was added to each well. The plate was then further agitated for 5 minutes at RT, before being
dark-adapted for 10 minutes. The luminescence from each well was read using a PheraStar plate
reader (BMG Labtech, Buckinghamshire).
The luminescence readings were normalised to cell number using Cyquant®cell proliferation
assay kit according to manufacturer’s instructions. Briefly, the plate was placed at -80°C
overnight to lyse the cells. 200µl of Cyquant was added to each well. The plate was then dark
adapted for 2-5 minutes before fluorescence, correlating to levels of double-stranded DNA, was
measured at a 420nm excitation and 520nm emission spectrum. ATP levels were quantified by
normalising the luminescence reading to the cell number.
2.3.4.1: Statistical analysis of the relative ATP content in mTARDBP-expressing and
control fibroblasts
Each patient and control fibroblast line was measured over 3 passages with triplicate values for
each passage. The mean value of these triplicate readings was then used as the final reading.
ATP + O2 + D-Luciferin Oxyluciferin + AMP + PPi + CO2 +LightLuciferase
Mg2+
83
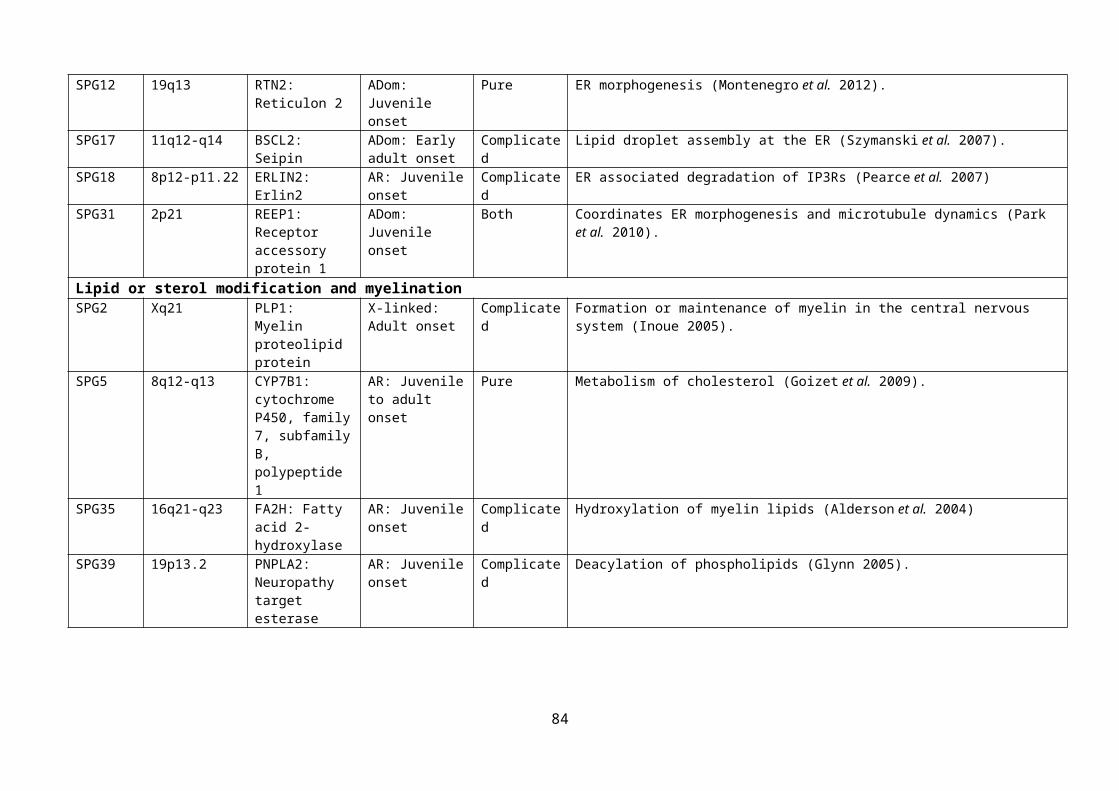
Statistical analysis was carried out using 2-way ANOVA, comparing ATP levels from both the
patient and control subject-derived fibroblasts and upon culture in the basal or respiration-
dependent media.
2.3.5: Immunocytochemistry
2.3.5.1: Fixation of cells
Primary fibroblasts were fixed when 60-70% confluent. Primary cortical neurons were fixed
following 7 days in culture.
For all cells, the media was aspirated and the cells were washed twice in PBS warmed to 37°C.
3.7% formaldehyde volume to volume (v/v) in PBS or 4% paraformaldehyde weight to volume
(w/v) in PBS was then added to the cells for 20 minutes at room temperature (RT). When fixed,
the cells were washed a further three times in PBS and stored at 4°C in PBS containing 0.001%
sodium azide.
2.3.5.2: Immunocytochemistry
Table 2.5: Primary antibodies used throughout the project
Antibody Epitope Raised in Dilution6-11B-1 Acetylated - tubulin Mouse 1:1000 RT 1 hourTOM20 (BD Bioscience, Oxford, U.K)
C terminus of Tom20 Mouse 1:500 4°C overnight
CALRETICULIN (ABCAM, Cambridge, U.K)
C terminus of Calreticulin Chicken 1:1000 4°C overnight
DM1A C terminus of -tubulin Mouse 1:1000 RT 1 hourSMI31 (Covance, U.S.A)
Phosphorylated neurofilament H
Mouse 1:1000 RT 1 hour
Table 2.6: Secondary antibodies throughout the project (Invitrogen, U.S.A)
Antibody DilutionAlexa Fluor 488 goat anti-chicken IgG 1:1000Alexa Fluor 488 goat anti-mouse IgG 1:1000Alexa Fluor 555 goat anti-mouse IgG 1:1000
Following fixation the cells were quenched in 1M glycine, made up in PBS, for 10 minutes at
RT then washed three times in PBS. The cells were then permeabilised using 0.1% Triton-X-
100 in PBS. After a further three PBS washes, the cells were blocked in 5% normal goat serum
(NGS) in PBS for 90 minutes at RT.
84
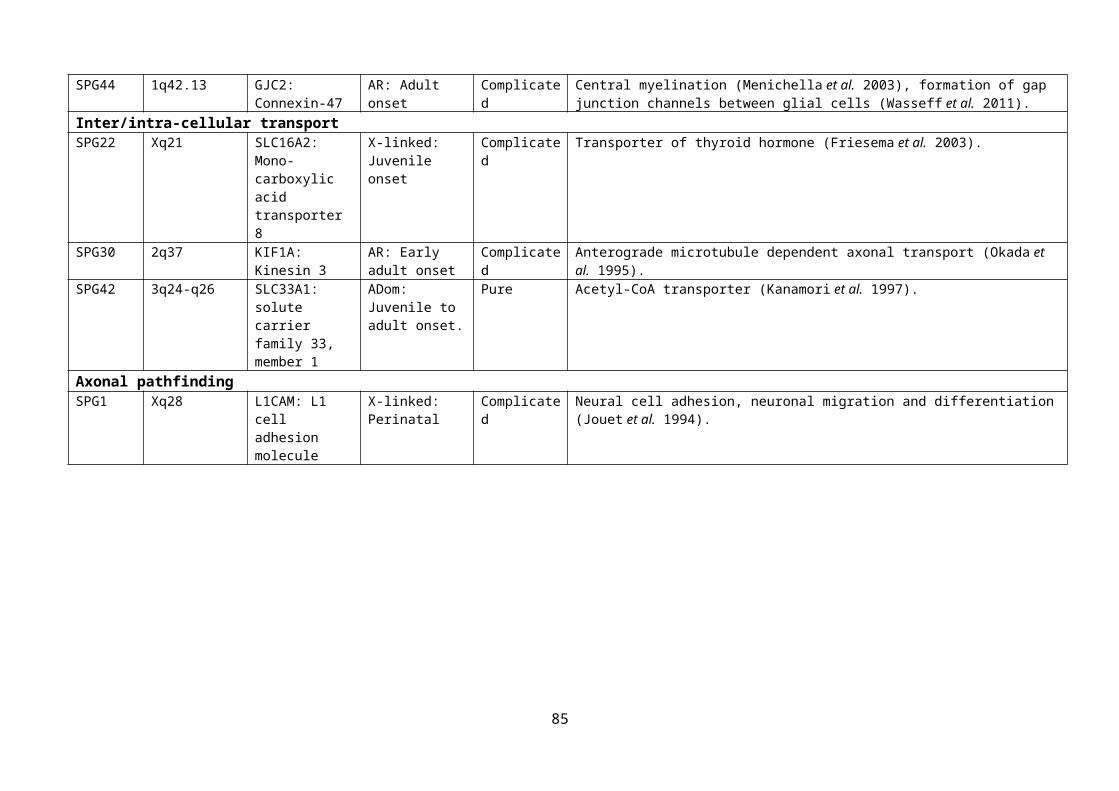
The selected primary antibody was diluted to the appropriate concentration in 5% NGS in PBS
and incubated with the coverslips for 60 minutes at RT or overnight at 4°C.
The coverslips were then washed three times in 0.2% Tween-20 (Polyoxyethylenesorbitan
monolaurate) in PBS (PBS-T), prior to incubation with the appropriate secondary antibody,
diluted in 5% NGS in PBS, for 60 minutes at RT.
The cells were incubated with 0.1% Hoechst stain in PBS-T for 2-3 minutes at RT. Excess
Hoechst was then removed by washing three times in 0.2% PBS-T.
Coverslips were then mounted in 50µl of 50% glycerol in PBS onto a microscope slide and
sealed using sealant grease composed of equal quantities of Lanolin, Vaseline and Paraffin wax.
Samples were stored at 4°C until further use.
2.3.6: Mitochondrial Associated Membrane (MAM) analysis in the mTARDBP
fibroblasts
Physical associations between the mitochondria and the ER provide an efficient mechanism for
the buffering of calcium levels in the cell. Mounting evidence implicates defective calcium
homeostasis, leading to excitotoxicity, in ALS (De Vos et al. 2012). To investigate this in the
patient derived fibroblasts, we looked at the co-localisation between mitochondria and the ER in
the mTARDBP fibroblasts and controls (Table 2.7).
Table 2.7: Control and patient fibroblasts used to quantify the association between the ER and mitochondria
Age at date of biopsy (Years)
Gender Clinical Diagnosis Fibroblast I.D
54 Male Control FIBCON1153 Female Control FIBCON1338 Male Control FIBCON1440 Female fALS TARDBP (A321V) + C9ORF72
hexanucleotide repeat expansionFIBPAT48
62 Male fALS TARDBP (M337V) FIBPAT5156 Male sALS TARDBP (G287S) FIBPAT55
13,000 cells/well were plated on 13mm coverslips pre-coated with 20µg/ml poly-l-lysine. 24
hours later the cells fixed in 4% (w/v) paraformaldehyde in PBS. Once fixed, the fibroblasts
were stored at 4°C in PBS containing 0.001% sodium azide.
The cells were dual immunostained for Tom20 (BD Biosciences, Oxford, U.K) and Calreticulin
(Abcam, Cambridge, U.K), additionally incubated with Hoechst stain, and mounted using the
protocol as described in previous section.
85
Imaging of the endoplasmic reticulum and the mitochondrial network was carried out on a Leica
TCS SP5 Confocal Microscope using a X63 objective. The cells were scanned sequentially at an
excitation wavelength of 488nm, 555nm and 385nm to visualise the ER network, mitochondria
and the nucleus respectively. Leica Application Suite software was used to optimise the images;
1024 by 1024 digital image resolution and an average line filter of 4 was applied, removing
background.
2.3.6.1: Intensity Correlation Analysis of the endoplasmic reticulum and the
mitochondria
Standard co-localisation analysis using the dye overlay method only takes into consideration the
coexistence of two proteins. Intensity Correlation Analysis (ICA) has been designed to
incorporate both the coexistence and the synchrony of two proteins (Li et al. 2004), such that if
they form part of the same complex you would expect the fluorescent staining intensity should
vary in synchrony, i.e. with each being present or absent. Random co-localisation should result
in asynchronous staining intensity.
2.3.6.1.1: ICA method
ICA works on the principle that “for any set of values, the sum of the differences from the mean
equal zero” (Li et al. 2004) i.e.: ∑N(Ai – a) = 0 where N = number of pixels, Ai = staining
intensity of each pixel and a = mean of distribution with N values of Ai.
If comparing two set of random staining: ∑N(Ai – a) (Bi – b) = 0
However, if the two staining intensities are dependent: ∑N(Ai – a) (Bi – b) > 0
Finally, if staining intensities are segregated: ∑N(Ai – a) (Bi – b) < 0
2.3.6.1.2: Calculating the intensity correlation quotient
Calculating the Intensity Correlation Quotient (ICQ) provides an overall guide of whether the
staining intensities are random, dependent, or associate in a segregated manner. For each image,
the number of pixels that generated positive or negative ∑N(Ai – a) (Bi – b) values are counted.
The ratio of the number of positive values to the total number of pixel pairs indicates the degree
of dependency of the two proteins. Subtracting 0.5 from this value then generates the ICQ, thus
giving the quotient a range of -0.5 to +0.5. Therefore, for random staining the ICQ = 0, for
dependent staining: 0 < ICQ ≤ 0.5 and for segregated staining: 0 > ICQ ≥ -0.5.
2.3.6.1.3: Analysing the images
2 coverslips per patient or control were imaged per passage, over a series of three passages. 30-
50 cells were analysed for each patient or control at each passage. The background was
86

subtracted from both the Calreticulin and Tom20 stained images. The cells were also
despeckled to further remove noise from the images (Figure 2.4).
Figure 2.4: Preparing the image for Intensity Correlation Quotient Analysis
Figure 2.4: A&B) Fibroblast immunostained for Calreticulin and Tom20; (C&D) Image Processing- On Image J run “Background subtraction from ROI” plugin and despeckle the image.
A region of interest (ROI) was selected on the mitochondria image to ensure the whole network
is incorporated in the analysis. ICQ was then calculated from this ROI using the Intensity
Correlation Analysis plug-in from Li et al, (Li et al. 2004)(Figure 2.5). Final values were
expressed as a percentage normalised to the highest control value in the experiment. Statistical
analysis was carried out using an unpaired, two-tailed Student’s t-test.
87
Figure 2.5: Calculating the ICQ of the mitochondria and ER Interaction
Figure 2.5: ROI selected on the Tom20 immunolabelled image. ICQ value calculated from this ROI using the Image Correlation Analysis plugin (J. Neurosci. (2004) 24: 4070-81).
88
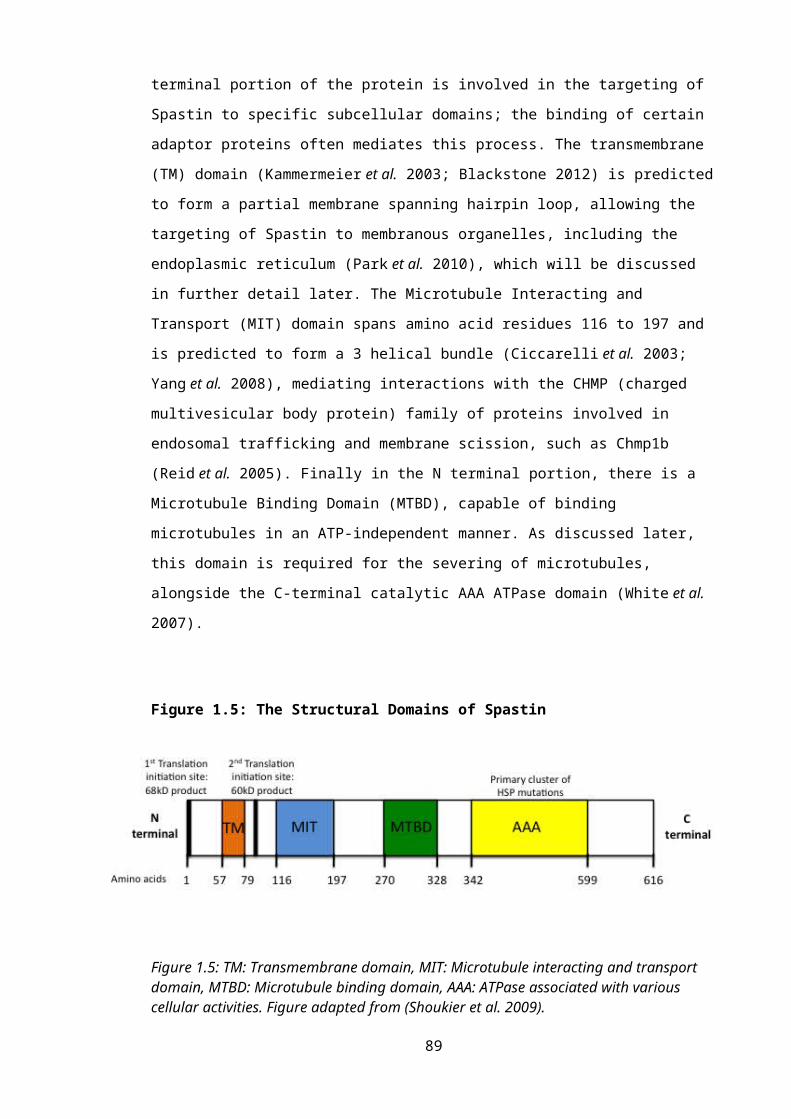
2.4: Gene expression profiling of the mTARDBP fibroblastsTo investigate the difference in gene expression between control subject fibroblasts and those
expressing a mutation in TARDBP, a microarray study was carried out using six control and
three patient samples. In the control cohort, the average age at the time of biopsy was 48.6 years
old. In the patient cohort, the average age at the time of biopsy was 52.6 years old. The average
age of disease onset was 48.6 years (ranging from 37 to 58 years) with an average disease
duration of 6.6 years (Table 2.8). For both the microarray study and the subsequent qPCR
validation, the fibroblasts used were between passage five and nine, and cultured in media
containing 1mg/ml glucose.
Table 2.8: Control and patient fibroblasts used in gene expression profiling investigation
Age at date of Biopsy (Years)
Gender Clinical Diagnosis Age at Onset of
Symptoms (Years)
Fibroblast I.D
Disease Duration (Months)
45 Male Control - FIBCON01 -43 Female Control - FIBCON02 -59 Female Control - FIBCON03 -54 Male Control - FIBCON11 -53 Female Control - FIBCON13 -38 Male Control - FIBCON14 -40 Female fALS TARDBP A321V +
C9ORF72 hexanucleotide repeat expansion
37 FIBPAT48 58
62 Male fALS TARDBP M337V 58 FIBPAT51 94.556 Male sALS TARDBP G287S 51 FIBPAT55 76.5
Table 2.9: Additional controls for qPCR validation
Age at date of biopsy Gender Fibroblast I.D50 Male FIBCON0456 Female FIBCON0636 Female FIBCON0838 Male FIBCON0944 Male FIBCON12
2.4.1: RNA isolation and linear amplification
Dr. Rohini Raman and Ms. Shelley Kramer carried out the fibroblast RNA isolation and linear
amplification, as well as the running of the microarray GeneChips.
89
Briefly, RNA was isolated from both patient and control fibroblasts using the RNeasy Mini Kit
(Qiagen) according to the manufacturer’s guidelines. The amount of eluted RNA was then
quantified on a NanoDrop1000 Spectrophotometer. The quality of the RNA was also verified
using the ratio of absorbance at 260nm/280nm. 50ng of this RNA was then linearly amplified
and biotin labelled using the One-Cycle Affymetrix Labelling Kit (Affymetrix). The resultant
single stranded biotin labelled cRNA was verified for quantity and quality using a NanoDrop
spectrophotometer and a Nano LabChip 6000 run on a 2100 Bioanalyser (Agilent, Palo Ato,
CA) respectively.
2.4.2: Running the microarray
The microarray was carried out using Human U133 Plus 2.0 GeneChips. Changes in gene
expression between the control cohort and the patients were quantified using the PLIER16
(Probe Logarithmic Intensity Error) algorithm in GeneSpring (Agilent Technologies, Berkshire,
U.K). PLIER16 was applied for background correction and normalisation of the probe
fluorescent intensities; from this, the signal intensity values could be derived. An unpaired t-test
was then used to detect differential gene expression across the control and mTARDBP cohorts.
Transcripts were considered differentially expressed between groups if they had a fold change
of 1.5 and a p-value of ≤ 0.05.
2.4.3: Microarray analysis
The identified differentially expressed transcripts were classified based on their molecular
function, as defined by their Gene Ontology (GO) term derived from NetAffx
(www.affymetrix.com/analysis/index.affx) or by GeneCards (www.genecards.org).
DAVID (Database for Annotation, Visualisation and Integrated Discovery, NIH;
http://david.abcc.ncifcrf.gov/) was also used to identify molecular processes and biological
pathways altered in the disease cohort, through the integration of several databases including
KEGG, Biocarta and Netaffx.
2.4.4: RT qPCR
2.4.4.1: Complementary DNA (cDNA) synthesis from total RNA
For each sample, 100ng of isolated total RNA was reverse transcribed using the High Capacity
RNA to cDNA kit (Applied Biosystems, U.S.A) as per the manufacturer’s protocol. A
simultaneous reaction without Reverse Transcriptase enzyme (No RT) was prepared as a control
90

for genomic DNA contamination. The resultant cDNA was then diluted to a final concentration
of 2.5ng/µl for use in the qPCR assays.
2.4.4.2: Primer design for RT qPCR
Primers were designed using Primer-BLAST software (NCBI) and Ensembl. The primers were
designed based on the following criteria:
Primer length of 18-30 bases.
Amplicon length of 50-150 base pairs.
Melting temperature of 58-60°C, with a <2°C difference in melting temperature (Tm)
between the forward and reverse primer.
20-80% G-C content
Primers were designed over exon-exon boundaries where possible to avoid potential
contamination of genomic DNA.
2.4.4.3: Primer optimisation and assay conditions
Seven varying primer concentrations, with differing combinations of 600nM, 300nM and
150nM forward and reverse primers were tested in triplicate for each primer set, alongside a no
template control. The optimal combination of primer concentrations was chosen based on the
lowest threshold cycle (Ct), the absence of primer dimers on the dissociation curve, the
amplification of a single product only and the combination of primers that gave the highest
reporter signal peak reading. Using the chosen optimal primer concentrations, a standard curve
was generated over a range of template cDNA concentrations, ranging from 0.625ng/µl to
10ng/µl, with 1 µl being used for each reaction, to ensure the optimum efficiency of the PCR.
Once the ideal primer sets had been selected, q-PCR was carried out using 2.5ng cDNA from
each control or patient sample, 1X HOT FIREPol ® EvaGreen® qPCR Mix Plus (ROX) (Solis
Biodyne, Estonia) and the appropriate volumes of both the forward and reverse primers, made
up to a volume of 20µl in deionised water. Each sample was run in triplicate.
91
The assays were run on a MX3000P Real-Time PCR system (Stratagene, U.S.A) using the
following conditions:
1: 95°C 10 minutes
2: 95°C 30 seconds
3: 60°C 1 minute
Repeat steps 2) and 3) 40 times
4: 95°C 1 minute
5: 60°C 30 seconds
6: 95°C 30 seconds
2.4.4.4: Analysis of qPCR to ascertain relative gene expression
The fluorescent signal intensity for each gene of interest was analysed using MxPro software
(Stratagene, Agilent Technologies, U.S.A). The expression value was then normalised to the
housekeeping gene peptidylprolyl isomerase A (PPIA) using the ddCt method (Applied
Biosystems User Bulletin No. 2 (P/N 4303859)). Each candidate gene Ct value was normalised
to the housekeeping gene Ct value, compensating for variation in the concentrations of the
initial RNA and thus the cDNA. This normalised value was named the dCt. Patient and control
dCt values were then normalised to the mean control dCt value, giving the ddCt. For each
sample, the ddCt was then transformed by function 2-ddct, giving the relative expression value of
the gene of interest for each patient and control (Livak et al. 2001).
PPIA was chosen as the housekeeping gene due to its stability in expression across all control
and patient fibroblasts on the microarray chips. It gives the lowest standard deviation of Ct
values across the samples compared to the common housekeeping gene ACTB and the RNA
splicing gene U1snRNA confirmed this. ACTB was also discounted due to its documented
interaction with TDP-43 (Wang et al. 2008).
The expression levels for each gene of interest in the TARDBP fibroblasts are expressed in
terms of their concentration in control fibroblasts. Statistical analysis of differential gene
expression was carried out using a two-tailed, unpaired student t-test.
92
Table 2.10: Primer sequences and optimised concentration used for qPCR validation of differential gene expression between control and mTARDBP patient cohorts
Gene Name Gene Primer Sequences Concentration
Cyclophilin A PPIA F 5’ TCCTAAAGCATACGGGTCCTGGCAT 3’
R 5’ ATGCTTGCCATCCAACCACTCAGT 3’
150nM
150nM
Microtubule-Associated protein 1S
MAP1S F 5’ GTGACCTGCAGGTGACCCTGATC 3’
R 5’ ACACCATGCTGTTGCTGCCCAA 3’
300nM
150nM
Autophagy 12 related homolog
ATG12 F 5’ GTCCAGTAGAGGGCAGTCCACCA 3’
R 5’CCTATGTGCTTGCTCTCCTGGCTAG 3’
300nM
300nM
Glucose transporter 3
GLUT3 F 5’ GCTCACGGCACGCTTGCGTA 3’
R 5’ GTCCCCTGAGGGCATTCGGC 3’
300nM
300nM
6-phosphofructo-2-kinase/fructose-2,6-biphosphatase 4
PFKFB4 F 5’ GACAGGCCTCAGAACGTGGACATC 3’
R 5’ TGCAGAGAGCAGTGCCTGCCTA 3’
150nM
150nM
- actin ACTB* F 5' GAGCTACGAGCTGCCTGACG 3'
R 5' GTAGTTTCGTGGATGCCACAG 3'
300nM
300nM
U1 spliceosomal RNA
U1snRNA* F 5'-ACCTGGCAGGGGAGATACCA-3'
R 5'-GGGGAAAGCGCGAACGCAGT-3'
600nM
600nM
* ACTB and U1snRNA primers designed by colleagues.
93
2.5: Assessment of autophagy in fibroblasts
2.5.1: Western blotting
To validate changes in the autophagy pathway in the mTARDBP and mutant C90RF72
(mC9ORF72) fibroblasts, western blots were carried out to investigate relative levels of LC3-II
in the patient samples (Table 2.11).
Table 2.11: Control and Patient Fibroblasts used for western blotting experiments
Age at Date of Biopsy (Years)
Gender Clinical Diagnosis Fibroblast I.D
59 Female Control FIBCON0356 Female Control FIBCON0636 Female Control FIBCON0862 Female Control FIBCON15964 Female Control FIBCON16341 Female Control FIBCON17340 Female fALS TARDBP A321V + C9ORF72
hexanucleotide repeat expansionFIBPAT48
62 Male fALS TARDBP M337V FIBPAT5156 Male sALS TARDBP G287S FIBPAT5564 Female fALS C9orf72 hexanucleotide repeat
expansionFIBPAT53
68 Female fALS C9orf72 hexanucleotide repeat expansion
FIBPAT72
To measure the levels of basal autophagy in fibroblasts derived from ALS patients and control
subjects, sodium dodecyl sulfate polyacrylamide gel electrophoresis (SDS-PAGE) was carried
out on protein samples extracted from either control fibroblasts or from patient cells harbouring
mutations in TARDBP or expressing the large hexanucleotide repeat expansion in the first intron
of C9ORF72. These samples were then probed for the autophagy marker rabbit polyclonal
antibody LC3, which recognises an N-terminal portion of the human LC3B (Novus Biologicals,
Cambridge, UK). The mouse polyclonal antibody DM1A, which recognises -tubulin, was used
as a loading control. Full details of the antibodies used in these western blotting experiments are
detailed below in Table 2.12.
Table 2.12: Antibodies used for western blotting experiments
Primary Antibody Epitope Raised in DilutionLC3 N terminus of LC3 B Rabbit 1:1000 4C OvernightDM1A C terminus of -tubulin Mouse 1:1000 4C Overnight
Secondary Antibody DilutionHRP conjugated goat anti-rabbit 1:5000 RT 1 hourHRP conjugated goat anti-mouse 1:10000 RT 1 hour
94
Two different growth conditions were used to measure basal levels of autophagy in the cells:
Complete media only
Complete media and 100nM Bafilomycin A1 in 1% ethanol in media for 2 hours.
2.5.1.1: Protein extraction from fibroblasts
Confluent T25 flasks (Greiner Bio-One) of either patient or control fibroblasts, treated as
mentioned in section 2.5.1, were harvested in preparation for protein extraction. The fibroblasts
were removed from the flask using trypsin according to the protocol outlined in section 2.2.2.
The suspended cells were then centrifuged for 4 minutes at 400xg; the resultant pellet was
washed twice in PBS, transferred to a 1.5ml eppendorf and further centrifuged for five minutes
at 20,000g.
Cell pellets were lysed in 20-30µl RIPA buffer (Table 2.13) containing a broad spectrum
protease inhibitor, Complete Protease Inhibitor Cocktail (Roche Diagnostics, East Sussex, UK),
2mM sodium orthovanadate, 1.25mM sodium fluoride and 1mM sodium pyrophosphate,
inhibiting protein tyrosine phosphatases and phosphatases respectively. The lysed cells were
then subjected to centrifugation for 20 minutes at 4°C at 18,000 x g; the resultant supernatant
was removed and stored at -80°C.
Table 2.13: Buffers and solutions used throughout the protein expression analysis experiments
Ripa Lysis buffer 50mM Tris (pH 8), 150mM sodium chloride (NaCl), 5mM Ethylenediaminetetraacetic acid (EDTA), 0.5% w/v Sodium Deoxycholate, 1% w/v NP40, 0.1% w/v sodium dodecyl sulfate (SDS), made up to volume in deionised water.
4 X Laemmli sample buffer 40% v/v Glycerol, 2% w/v SDS, 0.0025% w/v bromophenol blue, 25% v/v stacking gel buffer, 5% v/v β-mercaptoethanol made up to volume in deionised water.
Resolving gel buffer 1.5M Tris (pH 8.8), 0.4% w/v SDS made up to volume in deionised water.
Stacking gel buffer 0.5M Tris (pH 6.8), 0.4% w/v SDS made up to volume in deionised water.
95

For a 1.0mm thick 15% polyacrylamide resolving gel
1.8ml deionised water, 1.9ml resolving gel buffer, 3.7ml 30% acrylamide/bisacrylamide solution (National Diagnostics, Yorkshire), 112µl 10% ammonium persulfate (APS), 5µl N,N,N’,N’ –tetramethylethylenediamine (TEMED).
For a 1.0mm thick stacking gel 1ml deionised water, 444µl stacking gel buffer, 300µl 30% acrylamide/bisacrylamide solution, 28µl 10% APS, 5µl TEMED.
Running Buffer 20mM Tris-base, 192mM glycine, 0.1% w/v SDS made up to volume in deionised water.
Transfer Buffer 20mM Tris, 192mM glycine, 20% v/v methanol made up to volume with deionised water.
2.5.1.2: Protein concentration assay
The concentration of protein in the samples was quantified using a Coomassie Blue protein
assay solution (Fisher, Loughborough, U.K) according to manufacturers’ protocol. A Pherastar
plate reader (BMG Labtech, Buckinghamshire) was used to measure absorbance at the 595nm
wavelength; the concentration of the protein was then calculated from a standard curve created
with known concentrations of bovine serum albumin (BSA) (Thermoscientific. U.S.A).
Following calculation of the concentrations of the protein samples, appropriate volumes of 4 X
Laemmli sample buffer was added. The samples were then incubated at 95°C for 10 minutes,
centrifuged for 2 minutes at 400g before being divided into 20µg aliquots and stored at -80°C.
2.5.1.3: SDS-PAGE and protein transfer
The protein samples in 4X Laemmli buffer were incubated at 95°C for 5 minutes and
centrifuged for 1 minute at 20,000g. Approximately 18µg of protein, for each sample, was
loaded into a 1.0mm, 15% polyacylamide gel. 5µl of pre-stained protein marker (Biorad,
Hertfordshire, U.K) was also loaded adjacent to the samples.
The samples were run at 50V in 1X running buffer until they had passed through the stacking
gel. The voltage was then increased to 120V for approximately 120 minutes. Once run, the gel
was sandwiched between sponge, Whatman filter paper and nitrocellulose membrane (GE
Healthcare, Hertfordshire, U.K) all soaked in 1X transfer buffer. Proteins were then transferred
by electrophoresis from the gel to the membrane, in transfer buffer, using a current of 250mA
for 1 hour.
96

2.5.1.4: Protein immunoblotting
The successful transfer of protein onto the membrane was confirmed using reversible staining
with Ponceau S stain (0.1% w/v Ponceau S in 5% acetic acid made up to volume with deionised
water). The membrane was then cut at 37kDa, to allow DM1A and LC3 antibodies to probe the
same membrane.
Following removal of the Ponceau S stain using three washes in 0.1% PBS-T, the membranes
were blocked in 5% dried skimmed milk powder, made up in PBS, (blocking buffer), for 1 hour
with agitation at RT. The membranes were then incubated in a 1:1000 dilution of the LC3 rabbit
polyclonal antibody in blocking buffer. The loading control membranes were probed in a
1:1000 dilution of -tubulin mouse polyclonal antibody in blocking buffer. The membranes
were probed overnight at 4°C with agitation.
The membranes were washed three times for 10 minutes in 0.1% PBS-T before being incubated
at RT with either a 1:10000 dilution in blocking buffer of horseradish peroxidase (HRP)
conjugated goat anti-mouse secondary antibody (to probe -tubulin) or a 1:5000 dilution in
blocking buffer of HRP conjugated goat anti-rabbit secondary antibody (to probe LC3).
Membranes were incubated for 1 hour at RT with agitation. This was followed again by three 10
minute washes in 0.1% PBS-T.
Detection of antibody binding was achieved using enhanced chemiluminescence (ECL). Equal
volumes of reagents A and B were mixed together and incubated for 2 minutes with agitation
before being incubated with the membrane for 1 minute. Visualisation of the antibody-bound
protein bands, at sub-saturatung levels, was carried out on a GBox-HR Gel Doc system using a
4 megapixel, 16 bit, peltier cooled CCD camera and Genesnap software (Syngene, US).
Densitometry analysis was carried out using Genetools software (Syngene, US). Statistical
analysis was carried out by applying one-way ANOVA with Bonferroni post test.
97

2.6: Investigating axonal transport defects in a mouse model of SPG4
HSP
2.6.1: Genetic background of the SPG4 HSP mice
Axonal swellings were quantified on a range of genetic backgrounds, namely C57BL/6, FVB
and BALBC. The spastin c.1092+2T>G mutation was crossed onto the FVB and BALBC
backgrounds by back-crossing to each background for over five generations.
2.6.2: Primary cortical neuron culture
Primary cortical neurons cultures were used to investigate axonal transport defects in a mouse
model of SPG4 HSP.
Heterozygous mutant spastin c.1092+2T>G male and female mice were bred to generate
embryos either wild type, heterozygous or homozygous for the spastin c.1092+2T>G mutation.
E15.5 embryos were then taken from a sacrificed heterozygous mutant spastin c.1092+2T>G
time mated female mouse. The individual embryos were stored separately on ice, with a paw
clipping taken from each for later genotyping.
Throughout the preparation the embryos were stored in Hank’s Balanced Salt Solution (HBSS)
without calcium and magnesium (HBSS - -)(Lonza). The brains were removed from the
embryos by making small insertions along the transverse and sagittal divisions of the head. The
harvested brains were placed in HBSS (- -). The hindbrain was removed and the 2 hemispheres
separated, before the careful dissection and removal of midbrain, optic nerve and the meninges.
The cerebral cortices were then detached from the remaining forebrain and washed in 3ml
HBSS (- -). Individual cortices were prepared separately throughout to avoid cross
contamination of tissue from the different genotypes.
The tissue was then digested in 1ml HBSS (- -) containing 15µl 10X trypsin with versene for 15
minutes at 37°C. Following this incubation, 1ml of HBSS (+Ca2+, +Mg2+) containing 0.001%
deoxyribonuclease 1 (DNAse 1) was added to the samples, before being aspirated after a gentle
mixing.
500µl of triturating solution (HBSS (+Ca2+, +Mg2+) containing 1% albumax (Invitrogen), 0.05%
trypsin inhibitor (Sigma) and 0.001% DNAse 1, filter sterilised through a 0.2µm filter) was then
added to the cortices. Two glass Pasteur pipettes flamed to have progressively smaller openings
were then used to triturate the cortices down to single cells. 500µl of Neurobasal medium
(Gibco) containing B27 supplement (Gibco), 100IU/ml penicillin, 100µg/ml streptomycin
98
(Lonza) and 2mM glutamine (Lonza) (NB + B27 + P/S + L-Glut) was then added to each
sample, and the neurons further triturated using the Pasteur pipette with smallest opening. 10µl
of cell suspension was then added to 90µl of NB + B27 + P/S + L-Glut. 10µl of this suspension
was mixed with 10µl of Trypan blue solution; 10µl of this solution was used to ascertain a
viable cell count using a Countess® Automated Cell Counter.
Cells were plated in 1ml of NB + B27 + P/S + L-Glut at a density of approximately 0.2 million
cells/well on a 13mm diameter glass coverslip previously coated with 20µg/ml poly-l-lysine in a
24 well plate. Culture of the cells in this media is specifically designed to encourage and meet
the special requirement of the growth of embryonic neuronal cells. The plated neurons were
stored in a humidified incubator with 5% CO2 at 37°C. Three hours later, after allowing neurons
to settle, the media was changed to ensure complete removal of the triturating solution.
2.6.3: Drug treatment of the neurons
The cortical neurons were maintained for seven days following the culture. On day two and five
the cells were treated with either 3µM Tro19622 solubilised in 0.5% DMSO or 1µM Tubastatin
solubilised in 0.1% DMSO. Matching volumes of DMSO in NB + B27 + P/S + L-Glut or
untreated cells were used as the control conditions. Following 7 days treatment, the cortical
neurons were fixed in 3.7% formaldehyde as per the protocol in Section 2.3.5.1.
2.6.4: Spast Genotyping
2.6.4.1: DNA extraction
The embryo paw clippings were placed in 40µl of QuickExtract Solution 1.0 DNA extraction
solution (Epicentre®, UK). Samples were vortexed and incubated at 65C for 2 hours, with
vortexing occurring at half hour intervals. Samples were then heated at 98C for 2 minutes,
ending the reaction.
2.6.4.2: Mismatch PCR and restriction digest for spast genotyping
Primers had previously been designed to introduce a single-base (G/C) mismatch into the spast
DNA sequence. In the presence of the c.1092+2T>G mutation this mismatch generates a novel
Bsl restriction enzyme site, subsequently allowing the identification of the spast +/+ or the spast
mutants. The forward primer was used to introduce this G/C mismatch (shown in small case in
the following primer sequence):
Spas_Bs1I forward: 5’ CTTCCTTCTCTGCcGCCTGA
Spas_Bs1I reverse: 5’ CCATCTCCAGGCTTCAATGT.
99
Each PCR reaction was made up of 10µl mix, consisting of 3µl nuclease free water, 2µl
FIREPol 5X Mastermix (7.5mM MgCl2) (Solis Biodyne, Estonia), 2µl 20µM spas_ Bsl
forward primer, 2µl 20µM spas- Bsl reverse primer (1µM final concentration) and 1µl of
extracted DNA.
The following PCR cycle was used to amplify the samples:
1. 98°C for 30 sec
2. 92°C for 2 sec
3. 54°C for 15 sec
4. Go to step 2 for 39 times
5. 72°C for 2min
6. 15°C forever.
For the restriction digest, 0.5µl Bsl, 2µl 10 X Buffer 3 and 7.5µl nuclease-free water was added
to each sample. After brief centrifugation, the samples were incubated at 55°C for 45 minutes.
Following this digest a 112 base pair PCR product spanning exon 7 –intron 7-8 of the spast
gene is generated in the spast +/+ mice. In the spast ∆E7/∆E7, however, a cut product of 89 base
pairs is produced as a consequence of the mismatch PCR and the subsequent generation of the
Bsl restriction site.
Samples were then loaded onto a 150ml 3% agarose gel containing 2µl ethidium bromide and
run for 80 minutes at 100V. Hyperladder V was used as a reference marker. Samples were
visualised using a UV light cabinet.
2.6.5: Immunocytochemistry of Spast cortical neurons for axonal swelling
quantification
The primary cortical neurons derived from spast +/+, spast ∆E7/+ and spast ∆E7/∆E7 embryos were
immunostained for acetylated -tubulin and Hoechst according to the protocol described in
Section 2.3.5. Two coverslips per treatment condition, for neurons of each genotype, were
immunostained and stored at 4°C prior to imaging.
2.6.6: Quantification of axonal swellings in primary culture
Coverslips containing fixed mouse primary cortical neurons stained for acetylated -tubulin and
Hoechst were imaged on a Zeiss Axiovert 200 microscope using a 40X Plan-Neofluar 0.75 NA
objective. Serial images were taken moving uniformly across the coverslip, beginning in the top
left side and ending in the bottom right, avoiding the inclusion of nuclei or swellings in more
than one field of view. The number of live nuclei were counted for each frame. The number of
100
swellings immuno-reactive for acetylated -tubulin were then assessed in the same field of
view. Swellings were included in the count if they were equal to or bigger in size than a box
measuring 5m by 5m. Approximately 1000 nuclei were counted per coverslip, allowing the
number of swellings per 100 nuclei to be calculated and expressed as a percentage. Statistical
analysis was carried out by applying one-way ANOVA with Bonferroni post test.
2.6.7: Morphology and viability of neurons
In order to assess the effect of drug treatment on the morphology of the cortical neurons, the
cells were immunostained for either acetylated -tubulin, -tubulin or neurofilaments, using
primary antibodies listed in Table 2.5. The morphology of the neurites were then blindly
assessed using an arbitrary scale of 0 to 5, where 0 indicates a stability of the cytoskeleton and 5
indicates a breakdown of the cytoskeletal structures, resulting in a “beads on a string”
morphology (Pittman et al. 1993; Mills et al. 1998).
The Hoechst staining pattern of the cells assessed the viability of the neurons. Diffuse staining
indicates a living cell, whereas the condensed chromatin of an apoptotic or dead cell gives a
brighter fluorescent intensity. The viability of the neurons was assessed for both the spast +/+ or
spast ∆E7/∆E7 cells, treated for seven days with either 0.5% DMSO, 3µM Tro19622 or under basal
conditions. The viability of the neurons was expressed as a percentage of the total number of
cells.
101
Chapter 3 - Investigating changes in mitochondrial dynamics in ageing
and neurodegenerative disease
3.1: Introduction
3.1.1: Mitochondrial dynamics in health and disease
In this investigation we mainly focus on one aspect of mitochondrial dynamics: the process of
fusion and fission to maintain the mitochondrial network.
Regulation of mitochondrial dynamics is particularly important in neurons; mitochondria
provide the energy necessary for both synaptic development and maintenance (Mironov 2009;
Van Laar et al. 2013). Thus, it is essential that the mitochondria are able to travel to areas of
high metabolic demand and are fully functional when they get there. Accordingly, alterations in
mitochondrial dynamics have been noted in several neurodegenerative diseases, as discussed
later. For example, the neurodegenerative disease, autosomal dominant optic atrophy, (ADOA),
is characterised by loss of OPA1 function. The subsequent defects in mitochondrial fusion
induce mitochondrial dysfunction, including disruption of oxidative phosphorylation (Van
Bergen et al. 2011). Thus, there is a clear link between dynamics and the bioenergetic status of
mitochondria.
Cmt,
Benefit of peripheral cells.
Ageing in peripheral cells….spare resp capacity?
Recently, patient fibroblasts expressing pathogenic mutations in Park2 showed changes in both
mitochondrial function and morphology (Mortiboys et al. 2008), providing proof of principle
that primary dermal fibroblasts can recapitulate the pathogenic state seen in the neurons.
Als….mit function and morph in peripheral cells….but as yet unrelated to ageing?
3.1.2: Aims of investigation
In light of this evidence, the aims of this investigation were to examine mitochondrial dynamics
during ageing in control individuals and patients with sporadic and familial ALS. Both
mitochondrial morphology and motility were assessed in primary dermal fibroblasts. From this,
102
we sought to ascertain whether there were any alterations in mitochondrial dynamics that might
be mechanistic in ageing or ALS. We also aimed to determine whether these changes might be
associated with an underlying bioenergetic deficit in aged or patient cells.
103
3.2: Assessing mitochondrial dynamics in primary dermal fibroblasts
3.2.1: Quantifying changes in mitochondrial fusion and fission
In order to quantify any changes in mitochondrial dynamics in ageing or ALS patient
fibroblasts, a measurement of mitochondrial branching and interconnectivity was calculated;
network complexity is calculated by dividing the total number of branch-points in the reticulum
by the number of ends (Figure 3.1). It has been noted that the branching structure of
mitochondria is dominated by 3-way nodes (Sukhorukov et al. 2012). However, it was decided
to include the more complex branch points in the calculation to gain a true measurement of the
intricacy of the mitochondrial reticulum. We did not include the bifurcation points, as shown in
Figure 3.1A, as these do not represent true branch points.
104

Figure 3.1: Calculation of mitochondrial network complexity
Figure 3.1: A) Schematic diagram of the analysis of mitochondrial network complexity. 2 neighbouring pixels around the central pixel form a bifurcation point, excluded from the network complexity analysis. 3+ neighbouring pixels around the central pixel form the branching points of the mitochondrial reticulum. B) A primary human fibroblast stained with Mitotracker CMXRos Red. Examples of the nodes and ends of the mitochondrial network are highlighted. Network complexity is calculated by dividing the total number of branch-points (listed as 3-way nodes and upwards in Chapter 2) by the number of ends. Scale bars: 10m.
105
3.2.1.1: Passage effect on mitochondrial dynamics
The mitochondrial reticulum is inherently variable due to the heterogeneous and dynamic nature
of the organelle; mitochondria are constantly fusing and dividing, responding to external cues
such as energy demands, calcium levels and the requirement for redistribution (Chen et al.
2009; Seo et al. 2010). This morphological diversity is further compounded by experimental
variation. We therefore wished to assess the effect of fibroblast passage number on the
morphology of mitochondria. Network complexity was quantified over 5 passages in two
different control samples (FibCon03 and FibCon14) (Figure 3.2).
Figure 3.2: Influence of passage on network complexity of mitochondria
Figure 3.2: For each control subject-derived fibroblast set, at each passage, mitochondrial network complexity was calculated from a minimum of 20 cells on a single coverslip. N =1, at each passage.
It was observed that morphology of mitochondria does vary between passages. However, no
clear pattern was observed, suggesting the differences derive from experimental variation and
error, rather than the specific influence of passage. This variation has been further compounded
due to mitochondrial morphology at each passage only being imaged in one experiment.
Previous investigation has shown that mitochondrial morphology is independent of passage
number in human fibroblasts (Handran et al. 1997). However, as the morphological results are
variable, for each future investigation three separate experiments per sample were performed.
106

3.2.2: Role of mitochondrial dynamics in ageing
It has been noted for over 50 years that mitochondria play a role in the process of ageing. The
ROS theory of ageing postulates that the damage to the cell caused by accumulating ROS
eventually results in senescence (Harman 1956). Leakage of electrons from the ETC in the
mitochondria causes mounting damage to organelles in the cell (Mammucari et al. 2010),
progressive accumulation of mtDNA mutations (Corral-Debrinski et al. 1992; Krishnan et al.
2007), and thus further oxidative damage. Eventually, under the stress of overwhelming
oxidative damage, the aged cell undergoes apoptosis.
However, controversy surrounds this theory: the existence of a direct link between levels of
ROS and respiratory defects has been disputed. The complexity of assessing the effects of ROS
in the cell is typified in Leigh syndrome, which is characterised by mutations in the genes
encoding assembly factors of cytochrome c oxidase (Cox). The resultant increase in levels of
ROS derived from defective oxidative phosphorylation would be expected to be toxic for the
cell. However, a mouse model of Leigh syndrome actually demonstrated increased longevity
upon induction of oxidative stress (Dell'agnello et al. 2007).
Furthermore, it has been observed that an increase in cellular ROS enables mitochondria to
function more efficiently. For example, in C. elegans, the restriction of glucose, forcing
oxidative phosphorylation, was seen to extend life expectancy due to the increased formation of
ROS (Schulz et al. 2007). It was noted that the formation of ROS induces catalase, a strong
anti-oxidant, and subsequently increases the cell’s resistance to oxidative stress. Concordantly,
when Complex I is inhibited pharmacologically, increased levels of ROS mediate mitochondrial
fusion (Koopman et al. 2005), improving intermitochondrial signaling and consequently
increasing the efficiency of mitochondrial output.
Thus, it has been suggested that in ageing and senescence, ROS levels in the cell reach a
threshold where they are no longer beneficial, and instead result in the impaired function of the
cell and the induction of apoptosis (Murphy 2009). Following on from this, it can be appreciated
that the ageing process alters both the functioning and plasticity of mitochondria; the
appearance of giant mitochondria has been noted in post-mitotic ageing cardiac myocytes
(Terman et al. 2003), alongside a reduction in ATP output (Terman et al. 2005). A substantial
decline in both mitochondrial biogenesis and degradation upon ageing is predicted to derive
from a reduction in expression of PGC-1 following increased levels of ROS. Furthermore,
reductions in the expression of both Mfn2 and Drp1 have been noted in ageing skeletal muscle
(Crane et al. 2010).
107

3.2.2.1: Quantifying the relationship between ageing and morphology of
mitochondria
We wished to quantify the effect ageing has on mitochondrial dynamics in primary cells in
vitro, incorporating measurements of both morphology and motility. Dermal fibroblasts derived
from healthy controls of various ages were utilised to investigate whether there are changes in
the mitochondrial reticulum upon ageing. We predicted that the fibroblasts would demonstrate
enhanced interconnectivity of the mitochondrial reticulum as the age of the donor subject
increased; it has previously been postulated that, as the levels of ROS increase in the cell, the
mitochondria will become more fused as an adaptive response to ensure efficient functioning in
the face of cellular stress (Koopman et al. 2005). Network complexity was quantified in the
control subject fibroblasts and plotted against age on a scatter graph (Figure 3.3).
Figure 3.3: Changes in mitochondrial network complexity upon ageing
Figure 3.3: For each control subject N=3 or 4. Linear regression analysis: R2 value = 0.1123; t-test to establish whether the slope significantly differs from 0: p 0.01. Data points represent mean S.E.M.
An increase in network complexity was observed as the control subject fibroblasts increased in
age (the slope significantly differed from zero with a p-value of less than 0.01). As discussed,
this may represent an adaptive response to increases in cellular stress; mitochondrial hyper-
fusion has been observed in times of increased stress, such as upon nutrient-deprivation induced
autophagy (Gomes et al. 2011; Rambold et al. 2011) and oxidative damage (Yoon et al. 2006).
This fusion of the mitochondrial network enables the amelioration of mtDNA mutation
accumulation and damage by facilitating an equal distribution of the mtDNA nucleoids, permits
108
the efficient buffering of calcium levels and improves ATP deliverance throughout the cell, thus
protecting against the onset of apoptosis (Chen et al. 2007).
It has been suggested that increasing levels of ROS induce such adaptive mitochondrial fusion
response via the superoxide-mediated peroxidation of lipids within the mitochondrial
membrane, enabling fusion (Koopman et al. 2005). Recent investigation has supported the
importance of the intracellular redox state in the regulation of mitochondrial fusion (Shutt et al.
2012). Using in vitro fusion assays it was seen that increased levels of oxidised glutathione (a
key indicator of cellular stress) are capable of inducing the formation of in cis mitofusin
oligomers via the oxidation of cysteines in both Mfn1 and Mfn2, resulting in the generation of
disulphide bonds. The subsequent conformational change in the proteins aids the trans-docking
and tethering of the mitofusins, enhances fusion of the mitochondrial membrane (Shutt et al.
2012). Thus, in the present investigation, the increase in mitochondrial interconnectivity may
reflect an aberrant accumulation of oxidised glutathione derived from an age-related increase in
ROS production, resulting in enhanced Mfn-mediated mitochondrial fusion. Examination of the
redox state of the fibroblasts will be required to validate this hypothesis.
Following on from this theory, it should follow that this protective increase in mitochondrial
fusion during ageing could be blocked by the application of the anti-oxidant, N-acetyl-cysteine
(NAC), raising an interesting query concerning the overall benefit of anti-oxidant treatments
designed to ameliorate ageing-related increases in ROS……IS NAC HEALTHY
In support of ROS influencing the ageing process, it has been observed that expression of NAD-
dependent deacetylase sirtuin-3 (Sirt3), a mitochondria-localised protein deacetylase, prolongs
life span following caloric restriction in mammals and lower organisms (Giralt et al. 2012).
Sirt3 has multiple deacetylation targets, including proteins involved in the functioning of the
TCA cycle (Wang et al. 2010) and components of the ETC (Ahn et al. 2008) as well as
superoxide dismutase 2 (SOD2) (Qiu et al. 2010). Thus, Sirt3 plays a key role in both reducing
and detoxifying ROS produced by metabolism. Consequently, it may be predicted that in very
old subjects, the mitochondrial network may begin to fragment as levels of ROS become
pathogenic and mitochondria start to induce the process of apoptosis. Based on our results we
suggest that test subjects over 80 years old will be required to investigate this hypothesis.
Alternatively, the observed increase in mitochondrial branching may reflect a decrease in the
prevalence of autophagy upon ageing (Wohlgemuth et al. 2010; Liu et al. 2012). The noted
decline in the process of mitophagy is thought to contribute to the ageing process as it allows
the accumulation of aberrant mitochondria, exacerbating the levels of ROS damage and
contributing to the bioenergetic failure of the cell. Reductions in autophagy lead to increased
mitochondrial fusion; expression of dominant-negative Drp1 reduced levels of mitophagy,
indicating that fragmentation of the mitochondria acts as a permissive signal to induce the
109
process of autophagy in the cell (Chen et al. 2009; Frank et al. 2012). The relationship between
mitochondrial morphology and autophagy will be further discussed in Chapter 4.
3.2.2.2: Quantifying the relationship between ageing and motility of mitochondria
We next wanted to establish whether the noted alteration in the morphology of the mitochondria
upon ageing alters their motility. Mitochondria are required to be motile in the cell in order to
reach areas of metabolic demand, ensuring the widespread delivery of ATP and other
metabolites, alongside the efficient buffering of local calcium waves. This is particularly
important in the nervous system as neurons are very metabolically demanding, highly polarised,
and cover a large area. Thus, efficient transport of mitochondria is imperative for cellular
survival (Van Laar et al. 2013).
Long-range mitochondrial motility is mainly microtubule based, and utilises both kinesin and
dynein motors. Two adaptor proteins, Milton and Miro, the latter of which is located at the
OMM, act to regulate this movement. Milton acts to mediate the binding of kinesin to Miro,
whereas Miro uses its EF hands to coordinate the movement of mitochondria to areas requiring
both ATP production and buffering of calcium (Saotome et al. 2008; Wang et al. 2009).
The increased damage of DNA upon ageing attributed to telomeric attrition, alongside the
cumulative increase in ROS, is known to activate p53, which in turn represses the transcription
of PGC1 (Sahin et al. 2011). As PGC1 facilitates the transcription of Mfn2, this repression
may explain the noted decrease in Mfn2 expression upon ageing. Interestingly, in a role distinct
form its function as a mitochondrial fusion protein, Mfn2 has also been shown to regulate the
motility of neuronal mitochondria along the axon via its interaction with Miro at the OMM;
increased pausing of the mitochondria, and slower movement in either direction was observed
in Mfn2 knock-out mice (Misko et al. 2010).
Furthermore, experiments in rat clonal -cells over-expressing wild type Mfn1 showed evidence
of both impaired mitochondrial function, including a reduction in glucose-induced
mitochondrial hyperpolarisation, and a significant reduction in mitochondrial motility.
However, in this instance, the hypo-motility was postulated to derive from the induction of
increased fusion, as expression of dominant negative mutant Mfn1 resulted in fast Brownian
movement (Park et al. 2012). Thus, following on from the observation of an increase in
mitochondrial interconnectivity upon ageing, there is evidence to support the hypothesis that
motility decreases upon ageing, perhaps further influencing the declining bioenergetic status of
the cell.
110

In order to investigate this, the motility of mitochondria was assessed in control fibroblasts
spanning a wide age-range. The percentage of motile mitochondria was calculated by recording
a time-lapse video of living MitoTracker CMXRos-loaded fibroblasts, and then sequentially
subtracting images in the time series. Consequently, any stationary mitochondria will be
removed from the subtracted image, and any motile mitochondria retained. The resultant images
only depict the mitochondrial area that has relocated between each time point (explained further
in section 2.3.3).
Quantification of these subtracted images allows assessment of the percentage of motile
mitochondria (Figure 3.4). The binary image of the mitochondria is shown; each image
represents consecutive time-points of the recording. An example of a moving mitochondrion is
highlighted in the red circle.
111
Figure 3.4: Quantifying motility of mitochondria
Figure 3.4: A) Original image; B)Filtered and binarised image; C-F) Binary Time-lapse images of the mitochondrial network. C’-F’) Sequential subtraction of the images reveals the movement of this organelle. An example of a motile mitochondrion and corresponding pixel movement are highlighted in the fixed red circles. Scale bars: 10m.
The percentage of motile mitochondria was calculated for each cell, with the mean of each cell
recorded. The mean of each experiment was then plotted against the age of the sample (Figure
3.5).
112

Figure 3.5: Mitochondrial motility in control fibroblasts at different ages
Figure 3.5: Number of control pairs=4; for each control sample N=3 or 4. A) Percentage of pixels moved every 3 seconds in an individual cell; B) The mean percentage of motile mitochondria in control fibroblasts of various ages. R2 = 0.00174; slope not significantly different from zero. Data points represent mean S.E.M.
Unlike morphology, no clear correlation was seen between an increase in age and the motility of
mitochondria (Best-fit Slope = -0.00609 ± 0.0276; R2 = 0.0017)(Figure 3.5B).
As observed in Figure 3.5A, the motility of the mitochondria was consistent throughout the
recording. However, some outliers were evident in the recordings, deriving from the necessity
to re-focus the microscope throughout the time-lapse experiment. These outliers were removed
from the final mean calculation, after being identified by looking for loss of focus in the time-
lapse video, so as not to overestimate the movement of the organelles (Figure 3.6).
113
Figure 3.6: Identification and removal of outliers when quantifying mitochondrial motility
Figure 3.6: A-C) Binary Time-lapse images of the mitochondrial network. C’-F’) Sequentially subtracted images. Fixed red circles show the areas that drop out of focus in (B) and (B’). Scale bars: 10m.
114
In Figure 3.6, Image B depicts a cell that has dropped slightly out of focus when compared to
the previous time-lapse image (A), as shown by the loss of mitochondrial staining in the red
circles. The corresponding red circles in the subtracted image (A-B = B’) shows an
overestimation in the number of moved pixels. Re-focus of the microscope in Image C permits
the proper estimation of mitochondrial motility.
Average motility was approximately 20%. Fibroblasts are not overly reliant on mitochondrial
transport for their function; it may require dramatic changes in mitochondrial fusion/fission to
reveal any motility defects upon ageing.
Interestingly, it has been noted that both excessive fission and fusion can influence
mitochondrial motility. A study of vascular endothelial cells revealed that conditions that
encourage mitochondrial fission, such as dissipation of mitochondrial membrane potential and
reduction in cytosolic ATP, also limits mitochondrial motility (Giedt et al. 2012). In support of
this, Mfn1 or Mfn2-deficient embryonic fibroblasts also demonstrated a decrease in
mitochondrial motility alongside hyper-fission, with the organelles displaying a loss of directed
movement (Chen et al. 2003). Conversely, as mentioned, hyper-fusion of mitochondria also
restricts motility, as evidenced by the over-expression of Mfn1 in rat clonal -cells (Park et al.
2012). It has been postulated that the formation of a large mitochondrial reticulum essentially
hinders movement, an idea that would be particularly consequential in the narrow neuronal
processes (Chen et al. 2009).
Thus, it would be interesting to investigate motility changes in neuronal cells across a
substantial age range. Study of transport of fluorescence-labelled mitochondria in axons derived
from murine tibial nerves found a decrease in the anterograde transport in older mice (24
months) compared to younger mice (8 months). However, no difference was observed in
mitochondrial speed between the two cohorts (Gilley et al. 2012). It may be beneficial to
determine whether these changes in axonal transport correlate with changes in mitochondrial
fusion/fission dynamics.
If changes in mitochondrial movement were evident upon increasing age, it would have
potential consequences for the understanding of neurodegeneration, a known corollary of
ageing. Any changes in motility of the mitochondria would disrupt homeostasis of calcium
signalling and bioenergetic maintenance of the cell, both processes known to be defective in
neurodegeneration. Indeed, VAPB is mutated in a familial form of ALS, causing increased
cytosolic calcium levels due to dysregulation of the MAM (De Vos et al. 2012). It has been
suggested that this calcium peak would impact on the functioning of calcium-sensitive Miro and
thus impact on mitochondrial transport (Morotz et al. 2012).
115

Evidence of the relationship between ALS and ageing has been strengthened by the discovery
that both Sirt3 and PGC-1 expression protect against mitochondrial fragmentation and cell
death seen by expressing G93A mSOD1 in rat spinal cord motor neurons (Song et al. 2013). As
discussed, expression of Sirt3 has previously been seen to protect against ageing due to its
actions at the mitochondrion (Giralt et al. 2012). Furthermore, PCG-1, known to decrease in
expression upon ageing, also acts to reduce oxidative stress (Qiang et al. 2007; Reznick et al.
2007; Seo et al. 2010). In light of this close relationship between ageing and neurodegeneration,
we next asked whether alterations in mitochondrial dynamics are evident in ALS patient
fibroblasts.
3.2.3: Quantification of mitochondrial morphology in ALS patient fibroblasts
Defects in mitochondrial dynamics are a common feature of neurodegenerative disease; indeed,
mutations in genes responsible for fusion/fission regulation have been directly associated with
the pathogenesis of neurodegenerative disease, such as in CMT2A or ADOA (Alexander et al.
2000; Zuchner et al. 2004).
In some cases, the influence of mitochondrial dynamics may not be the primary cause of
neurodegeneration, but it may contribute to, or exacerbate, the disease. For example, in AD,
over-expression of either amyloid precursor protein (APP) or oligomeric amyloid--derived
diffusible ligands (ADDLs) in a neuron-like cell line resulted in mitochondrial fragmentation,
caused by disrupting the balance of fusion and fission proteins (Wang et al. 2009). Fission of
the mitochondrial network observed upon accumulation of -amyloid has been attributed to
increased S-nitrosylation of Drp1 in AD patient brains, causing an increase in the fission
activity of the protein. Indeed, inhibiting the S-nitrosylation of Drp1 reduced the levels of
mitochondrial fission and reduced the neurotoxic effects of -amyloid expression (Cho et al.
2009). Thus, regulation of mitochondrial morphology appears imperative to protect against the
Alzheimer’s phenotype.
Furthermore, the aetiology of PD has also been associated with defects in mitochondrial
dynamics. Functional depletion of both PINK1 and Parkin in D. melanogaster promoted
mitochondrial fusion, with the production of enlarged and swollen mitochondria, ultimately
resulting in degeneration of the fly tissue. Over-expression of Drp1 or down-regulation of Mfn2
rescued the phenotype, implicating mitochondrial dynamics in the degeneration (Deng et al.
2008; Poole et al. 2008).
However, studies in mammalian cells have produced conflicting results. In human fibroblasts
expressing mPINK1, fragmentation of the mitochondrial network was seen (Exner et al. 2007).
Conversely, mParkin-expressing patient fibroblasts revealed an increase in mitochondrial
116

branching compared to control samples (Mortiboys et al. 2008). It is possible that these
morphological defects arise from deregulation of the mitochondrial quality control system as
both PINK1 and Parkin have key roles in the initiation of the mitophagy pathway (Vives-Bauza
et al. 2010). The abnormal structure of the mitochondria in PD may reflect a failure of the
organelle to be efficiently cleared following mitochondrial dysfunction.
3.2.3.1: Quantifying mitochondrial morphology in sporadic ALS patient fibroblasts
Alterations in mitochondrial dynamics have also been observed in sporadic ALS patients; a
study of the anterior horn revealed fragmentation of the mitochondria in the motor neurons
(Sasaki et al. 2007). Thus, we decided to ascertain whether the mitochondrial reticulum is
altered in sALS patient fibroblasts compared to control samples. 9 sALS patient-derived
fibroblasts were imaged at the same time as 9 healthy control-subject fibroblasts (with
FibCon04 being utilised twice), as depicted in Figure 3.7. To assess the influence of age on the
mitochondrial morphology in sALS, the mitochondrial network complexity of these patient
fibroblasts was plotted alongside the mitochondrial network complexity of our entire control
cohort (Figure 3.8). As before, the fibroblasts were cultured standard media supplemented with
1mg/ml D-glucose and then loaded with CMXRos Mitotracker Red to visualise the
mitochondrial network.
The morphology of mitochondria in 9 sALS patients were then compared to the mitochondrial
morphology of the aforementioned 19 control fibroblasts (Figure 3.3), to establish whether an
age effect is also evidenced in the sALS fibroblasts (Figure 3.8).
117

Figure 3.7: Interconnectivity of mitochondrial network in control fibroblasts compared to sporadic ALS patient fibroblasts when cultured in 1mg/ml glucose
Figure 3.7: Age-matched control and sALS patient fibroblasts cultured in media containing 1mg/ml D-glucose and loaded with CMXRos Mitotracker Red. A) FibCon158 (Age 49); B) FibPat38 (Age 49); C) FibCon156 (Age 74); D) FibPat27 (Age 73). An area of interconnectivity of the mitochondrial network is highlighted and magnified in the yellow squares. Ages listed are age in years at date of biopsy. Scale bars: 10m.
118
Figure 3.8: Mitochondrial network complexity of sporadic patient fibroblasts cultured in the presence of media containing 1mg/ml glucose
Figure 3.8: For each control or patient subject N=3 or 4. Data points represent mean S.E.M. R2 value for sALS patients: 0.1665; where the slope significantly differs from 0: p 0.05. The difference between the control and patient slopes: Linear regression p 0.001.
The control subject-derived fibroblasts imaged at the same time as the nine patient-derived fibroblasts are highlighted in the graph by the black outline surrounding the blue circle.
In the sALS patient fibroblasts, in contrast to the control samples, a decrease in the
interconnectivity of the mitochondrial network is observed with increasing age. A significant
deviation from zero is seen in the quantification of network complexity in the older patient
fibroblasts, making the mitochondrial reticulum appear fragmented in comparison to their age-
matched control samples. Interestingly, the younger sALS patient fibroblast mitochondria
appear more fused compared to their age match controls, although additional samples need to be
tested to confirm this trend. Examples of the morphological alterations in mitochondria are
demonstrated in images of FibPat38 (age 49 years) and FibPat27 (age 73 years) in Figure 3.7.
If confirmed, the excessive mitochondrial fusion noted in some of the younger sALS patient
samples may represent an adaptive mechanism of the cell to cope with the pathogenic
implications of the disease. Conversely, the mitochondria fragmentation upon ageing may be
indicative of a failure to adapt to the increased levels of cellular stress. The increase in fission or
decrease in mitochondrial fusion is likely to have a pathogenic consequence for the cell. As
discussed, the maintenance of a healthy mitochondrial population requires efficient fusion of the
organelles. In light of this, it is appreciated that decreases in the networking of mitochondria
reflect stressed conditions in the cell; induction of bioenergetic deficits of the mitochondria (De
119
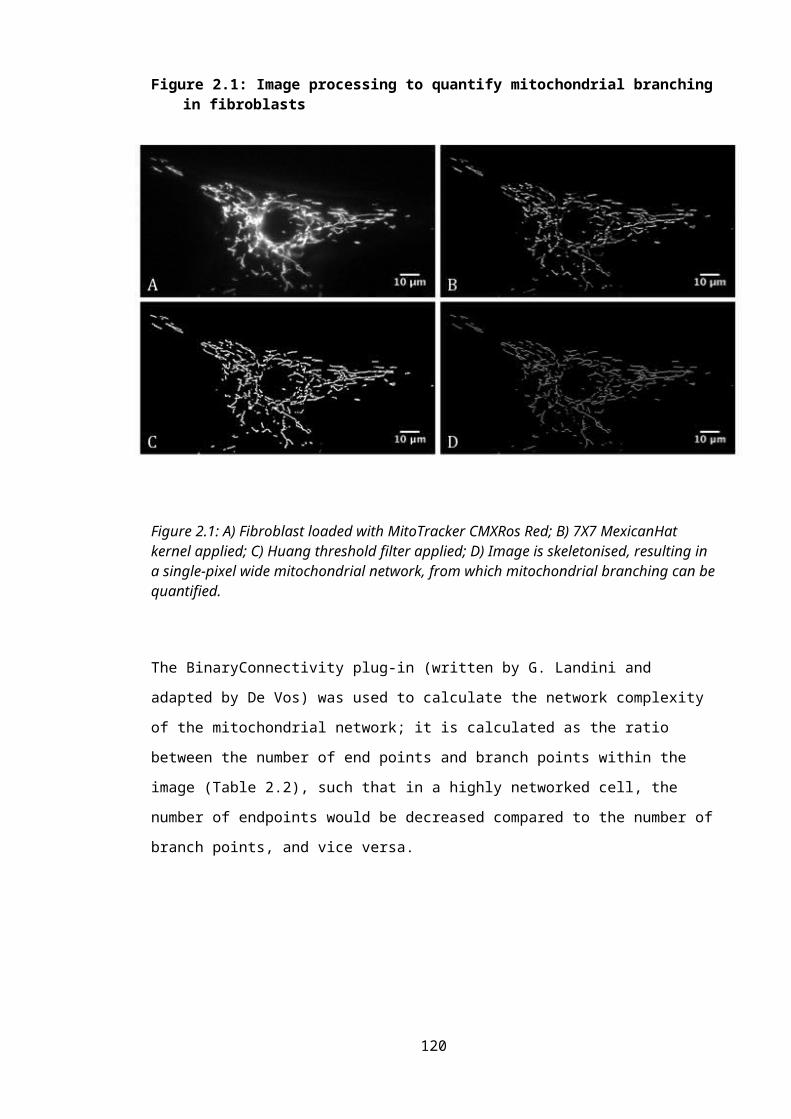
Vos et al. 2005), pathological increases in the cellular levels of superoxide (Koopman et al.
2005) and initiation of apoptosis (Karbowski et al. 2003) all result in the fragmentation of the
mitochondrial network. Thus, uncontrollable fission or the abrogation of fusion is noted as a
common pathological feature of neurodegenerative disease.
Interestingly, the aforementioned increase in mitochondrial fusion noted in the mParkin-
expressing fibroblasts compared to control samples was observed in patients with an average
age of 42 (Mortiboys et al. 2008), around the same age the sALS patient fibroblasts also showed
a trend towards increased mitochondrial fusion. Though the age of the fibroblast sample donors
was not mentioned in Exner et al, 2007, it would be interesting to know whether the patients
were over the age of 60, as mitochondrial fragmentation was noted in these fibroblasts. If the
patients were of an older age, it would indicate PD patient fibroblasts show the same pattern of
alterations in mitochondrial fusion/fission as seen in the sALS cohort.
3.2.3.1.1: Assessing defects in mitochondrial dynamics upon forced oxidative
phosphorylation
As previously discussed (Section 1.2.3.1.1), defects in oxidative phosphorylation have
consistently been implicated as a key pathogenic process in ALS, both in sporadic and familial
forms of the disease (Comi et al. 1998; Jung et al. 2002; Mattiazzi et al. 2002; Menzies et al.
2002; Wiedemann et al. 2002; Murata et al. 2008). Indeed, the evidence of increased
fragmentation of the mitochondrial network upon ageing in the sporadic ALS fibroblasts could
possibly hint at a bioenergetic defect in these patients. A wealth of evidence indicates there is a
close, bidirectional relationship between mitochondrial morphology/dynamics and the
bioenergetic status of the cell (De Vos et al. 2005; Koopman et al. 2005; Guillery et al. 2008;
Zorzano et al. 2010).
For example, direct inhibition of Complex I by the application of rotenone results in
fragmentation of the mitochondrial network in immortalised cell lines (De Vos et al. 2005;
Benard et al. 2007). Conversely, as seen in some cases of CMT2A (Loiseau et al. 2007) and
Type 2 diabetes (Bach et al. 2003; Bach et al. 2005), the loss of Mfn2 expression, resulting in
mitochondrial fragmentation, has been shown to disrupt the oxidative capacity of the cell,
creating increased reliance of the process of glycolysis (Pich et al. 2005; Zorzano et al. 2010).
We therefore decided to quantify the effect of oxidative phosphorylation on mitochondrial
dynamics in both the control and ALS patient fibroblasts. Cultured fibroblasts generate the
majority of their ATP via glycolysis. However, they can be forced to use oxidative
phosphorylation by culturing the cells in media deficient in glucose and containing galactose,
permitting the assessment of any potential defects in oxidative respiration. The necessary
conversion of galactose to glucose-6-phosphate abrogates any net gain of ATP from glycolysis,
thus forcing any energy generation to be respiration-dependent. 120
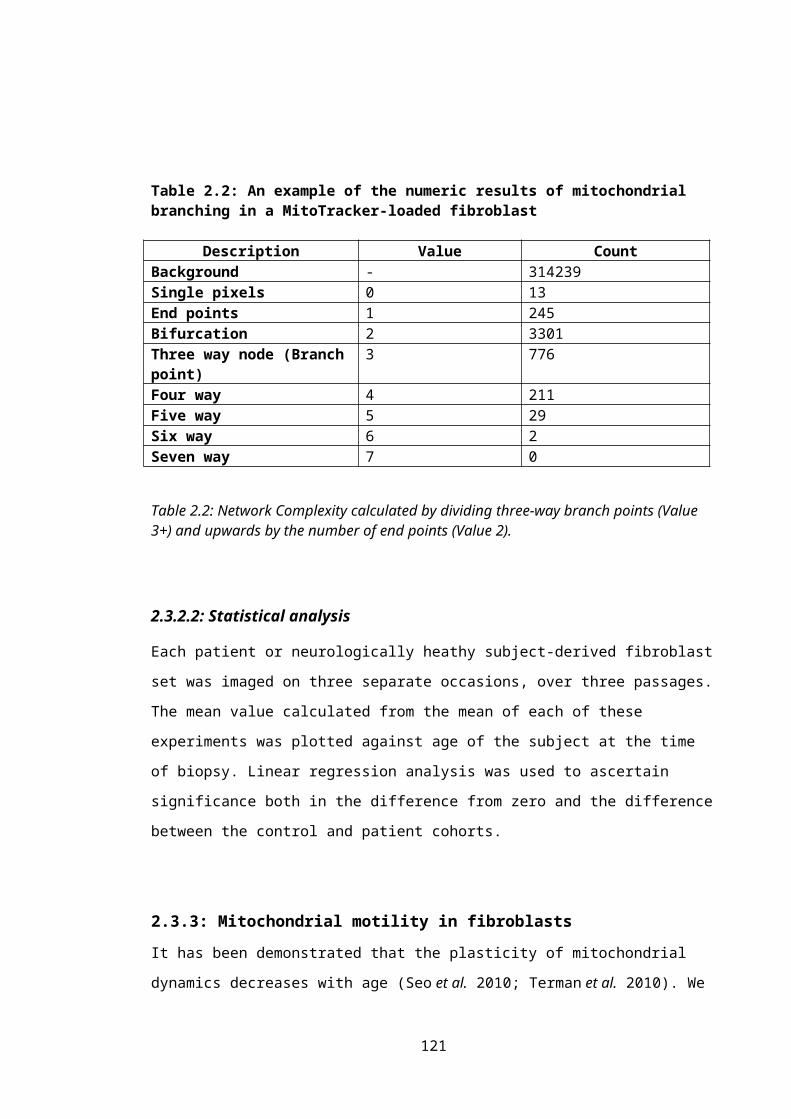
Due to a technical error, the fibroblasts were erroneously cultured in 0.009mg/ml D-galactose
instead of the recommended 0.9mg/ml, as used in several publications: (Hayashi et al. 1991;
Hofhaus et al. 1996; Mortiboys et al. 2008). Before continuing the investigation, we wished to
ensure that the mitochondrial morphology was not altered by this decreased concentration of
galactose. Therefore, 10 control subject fibroblasts were cultured in either 0.9mg/ml or
0.009mg/ml D-galactose for 24 hours before their mitochondrial morphology was quantified
(Figure 3.9).
Figure 3.9: Comparison of mitochondrial network complexity upon culture in different concentrations of galactose
Figure 3.9: For each control sample N=3. Mitochondrial network complexity of control-subject fibroblasts either in 0.9mg/ml D-galactose or 0.009mg/ml D-galactose. Data points represent mean S.E.M.
The observation that culture in 0.9mg/ml or 0.009mg/ml D-galactose did not affect the
morphology of the mitochondria may be because of the presence of 1mM sodium pyruvate in
the media. Pyruvate plays a key role in the process of carbohydrate metabolism, feeding into the
TCA cycle in the mitochondrial matrix, as the prelude to oxidative phosphorylation (Figure
3.10). Therefore, the presence of pyruvate in the media permits the generation of ATP via both
the TCA cycle and the ETC. Thus, the concentration of galactose in the media had little effect
on the levels of oxidative phosphorylation occurring in the fibroblasts. We therefore decided to
quantify mitochondrial morphology after the cells had been cultured in respiration-dependent
media containing 0.009mg/ml galactose to ascertain the influence of forced oxidative
phosphorylation on the mitochondria.
121

Figure 3.10: The involvement of pyruvate in the initiation of the TCA cycle
Figure 3.10: The TCA cycle, occurring in the mitochondrial matrix, generates NADH, which can then feed into the oxidative phosphorylation pathway as a reducing agent. Pyruvate is necessary to provide the acetyl-CoA, which then enters the cycle by being converted to citrate.
Interestingly, the culture of fibroblasts in the respiration-dependent media, as opposed to that
containing glucose, generally resulted in an increase in the interconnectivity of the
mitochondrial network. This is demonstrated using control fibroblasts in Figures 3.11 and 3.12.
122
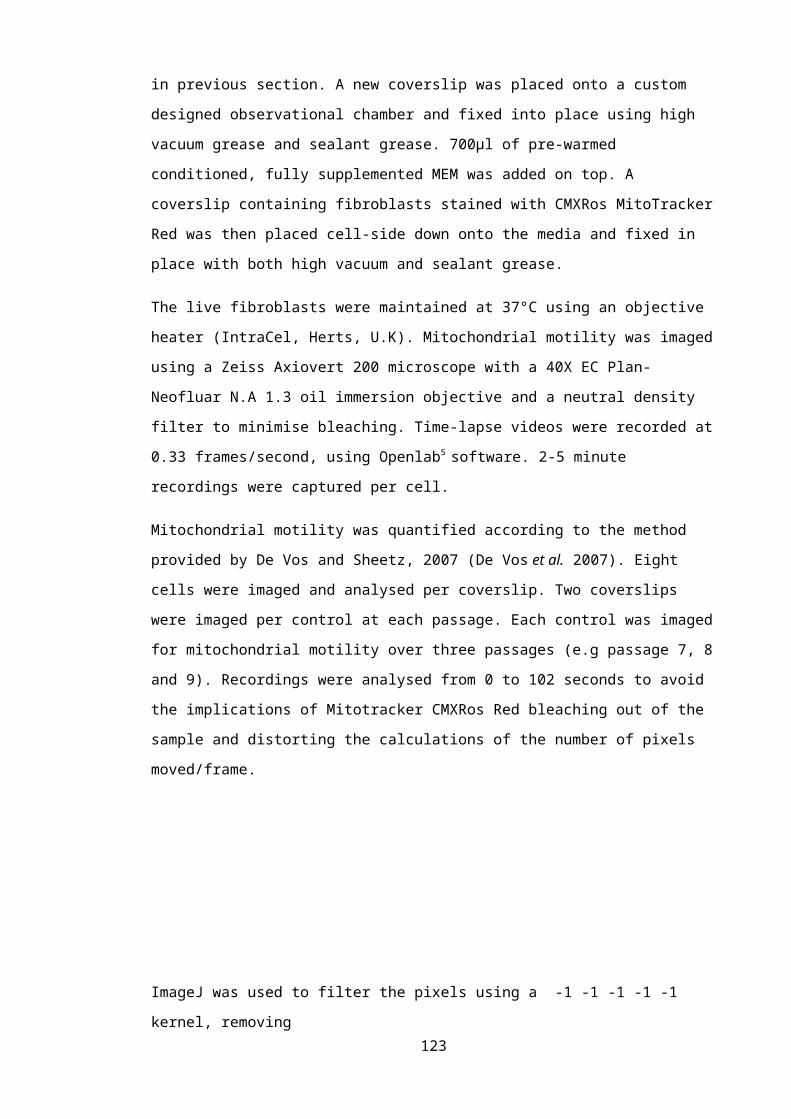
Figure 3.11: Interconnectivity of mitochondrial network upon culture in presence of glucose or galactose
Figure 3.11: Control fibroblasts loaded with CMXRos Mitotracker Red. A) Fibroblast cultured in 1mg/ml D-glucose; B) Fibroblast cultured in 0.009mg/ml D-galactose. An area of interconnectivity of the mitochondrial network is highlighted and magnified in the yellow squares. Scale bars: 10m.
Figure 3.12: Comparison of mitochondrial network complexity of control fibroblasts cultured in either glucose or galactose
123
Figure 3.12: For each control sample N=3. Mitochondrial network complexity of control fibroblasts cultured either in 1mg/ml D-glucose or 0.009mg/ml D-galactose. Data points represent mean S.E.M.
This result supports the notion of the close relationship between the oxidative state of the cell
and morphology of the mitochondria. It has previously been observed that a switch from a
glycolytic process of ATP synthesis to the mitochondrial-mediated oxidative phosphorylation
induces a reversible change of the mitochondria to a “condensed” state, the term used by
Hackenbrock et al, to describe the thinning and branching of the mitochondrial tubules
(Hackenbrock et al. 1971; Jakobs et al. 2003; Meeusen et al. 2004; Rossignol et al. 2004;
Malka et al. 2005; Benard et al. 2007). Thus, the increase in mitochondrial interconnectivity
observed in these experiments supports the notion that the formation of a physically
interconnected network of mitochondria allows the organelle to function more efficiently
(Koopman et al. 2005; Mortiboys et al. 2008), particularly when it is being relied upon to
synthesise the majority of the cell’s ATP content. Previous studies of mitochondrial morphology
in fibroblasts have supported the idea that the physiological generation of superoxide, derived
from the functioning of the ETC, is responsible for this increase in branching of the
mitochondria upon the switch to an oxidative state (Luo et al. 1997; Koopman et al. 2005).
Moreover, the predicted increase in superoxide production may alter the redox state of
glutathione, inducing mitochondrial hyper-fusion by mitofusin oxidation, as previously
discussed (Shutt et al. 2012). The fact that this increase in mitochondrial branching was
observed in the control cohort suggests that this morphological alteration represents a
physiological adaptive response of the mitochondria, and is not pathologically mediated.
Following the observation that culture of the cells in a respiration-dependent media leads to an
increase in the branching of the mitochondria, possibly alluding to an adaptive response by the
fibroblasts, we decided to see if change in mitochondrial morphology is independent of age.
Therefore, network complexity was quantified in control fibroblasts, cultured in glucose-
deprived media supplemented with 0.009mg/ml D-galactose, and plotted against sample age
(Figure 3.13).
124
Figure 3.13: Changes in mitochondrial network complexity in ageing in control fibroblasts cultured in glucose-deprived media
Figure 3.13: For each control sample N=3 or 4. Network complexity of control samples cultured in 0.009mg/ml D-galactose; R2 value: 0.03567; the slope does not significantly differ from zero. All data points represent mean S.E.M.
Upon quantification of network complexity, no significant difference was seen compared to
zero, indicating there is not an increase in interconnectivity of the mitochondria upon ageing in
respiration-dependent media (Figure 3.13). It is possible that, as age increases, the fibroblasts
become more dependent on mitochondrial respiration to meet their energy demands, and thus
the observed increase in mitochondrial interconnectivity, as seen in Figure 3.3, reflects a switch
to the use of oxidative phosphorylation. Subsequent culture in respiration dependent media
would then not elicit a further increase in mitochondrial network complexity.
Indeed, examination of a read-out of glycolytic activity, extracellular acidification rate (ECAR),
in the control fibroblasts found a significant decrease in ECAR occurs during ageing (R2 =
0.5127, P = <0.05) (S. Allen; Personal communication), indicating a decrease in the rate of
proton excretion from the cells, correlating to a reduction in glycolytic activity. Moreover,
preliminary evidence investigating the control fibroblast cohort showed an increase in spare
respiratory capacity as age increases (R2=0.5321, P = <0.05)(S. Allen; Personal
communication). From this evidence it may be hypothesised that the increase in mitochondrial
network complexity seen in Figure 3.3 reflects an increase in the efficiency of mitochondrial
function upon ageing.
125
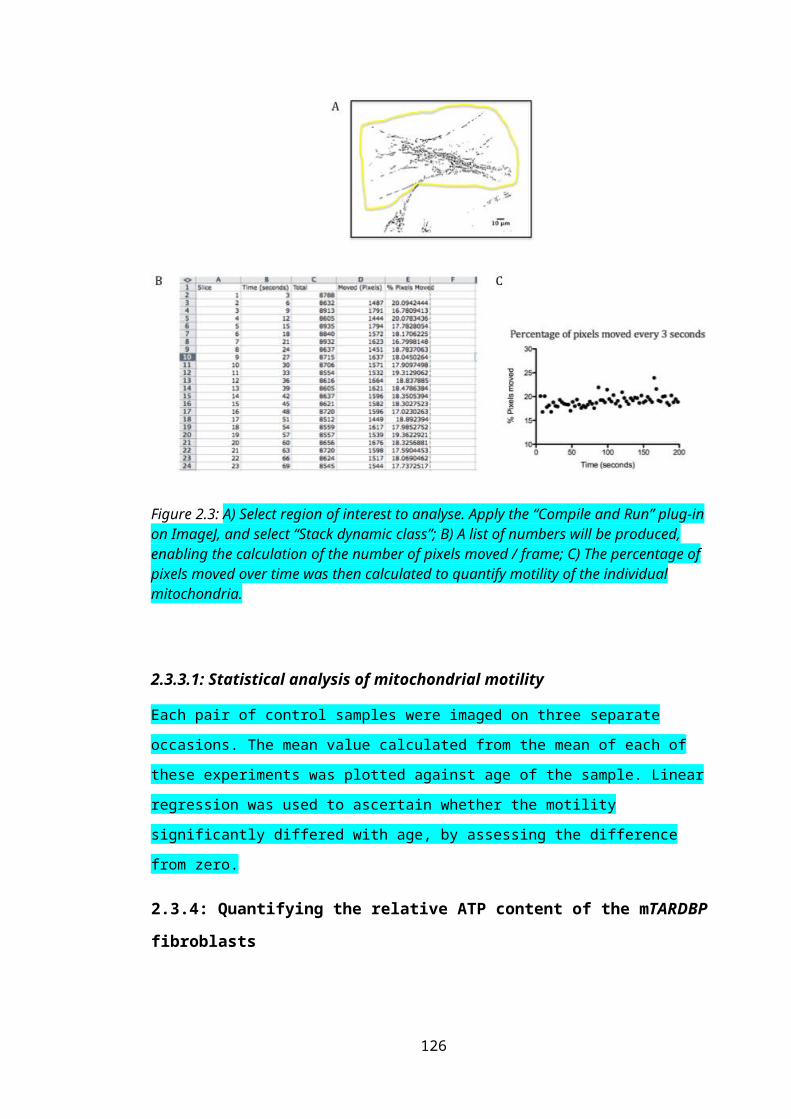
However, these results contradict previous evidence of a reduction in efficiency of oxidative
phosphorylation in human tissue including skeletal muscle and the heart, as age increases. This
reduced efficiency is likely due to accumulating defects in Complex I and IV, and, as such, can
then contribute further to aberrant ROS accumulation upon ageing (Desler et al. 2012).
Consequently, further investigation into the metabolic profile of fibroblasts during ageing will
be required to elucidate the cause of the changes in mitochondrial morphology noted in these
experiments.
Interestingly, particularly at the two ends of the age scale, the morphology of the mitochondria
is quite variable. In subjects at the higher end of the age range, this variability may arise from
differences in the handling of increased oxidative stress; as both oxidative phosphorylation and
ageing result in the accumulation of ROS, it is possible that the differences in morphology arise
from whether these ROS elicit an adaptive response, such as hyper-fusion, or conversely induce
mitochondrial fragmentation as a prelude to apoptosis.
3.2.3.1.2: Influence of forced oxidative phosphorylation on sporadic ALS patients
As neurons have a high metabolic demand, and use oxidative phosphorylation as their main
mechanism of energy generation, any defects in this pathway may have serious consequences.
Accordingly, defects in ETC function have repeatedly been highlighted as part of the
pathogenic process in sporadic ALS; a sporadic micro-deletion in COI, encoding subunit I of
cytochrome-c oxidase, was identified in an ALS patient, causing defective assembly of the
holoenzyme (Comi et al. 1998); post-mortem study of spinal cord tissue derived from both
sporadic and familial ALS patients found evidence of reduced activity of all of the respiratory
chain complexes (Wiedemann et al. 2002); a study of CSF taken from sALS patients saw a
significant increase in the levels of oxidised CoQ10, indicative of oxidative damage in these
patients (CSF) (Murata et al. 2008).
Recently, it has been shown that proteins known to regulate mitochondrial dynamics,
specifically mitochondrial fusion, are also directly capable of regulating bioenergetic output of
the mitochondria. For example, knockdown or expression of a null mutant of Mfn2 in
immortalised cell lines and MEFs resulted in repression of ETC complex activity, reduced
mitochondrial membrane potential and a reduction in cellular oxygen consumption (Chen et al.
2003; Pich et al. 2005).
As fusion of the mitochondrial network is known to enable the efficient distribution of ATP and
the maintenance of an even protonic potential distribution, it is understandable that Mfn2
regulates both fusion and mitochondrial metabolism. Under basal conditions, the transcription
co-activator PGC1 has been shown to regulate expression of Mfn2 in order to maintain
mitochondrial biogenesis and metabolic homeostasis. Additionally, under conditions of
metabolic demand, PGC1 further induces Mfn2 transcription to increase efficiency of 126
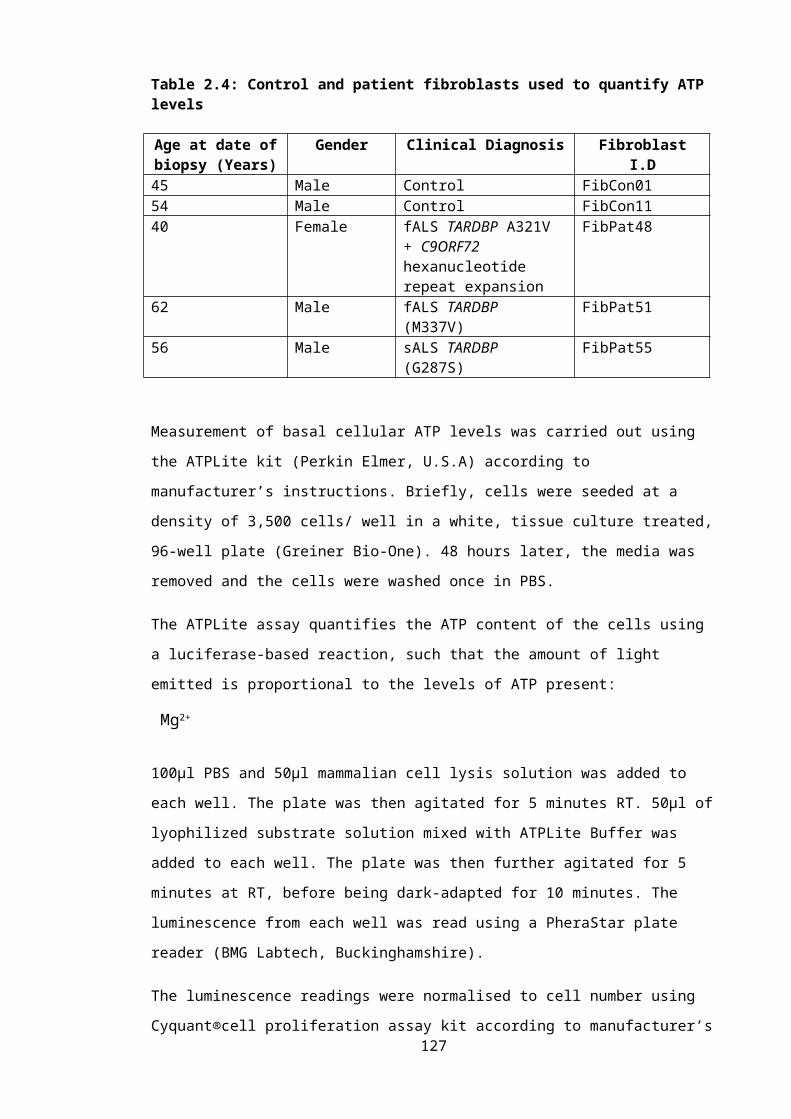
mitochondrial output (Soriano et al. 2006). It is currently unclear how Mfn2 acts to stimulate
mitochondrial metabolism, though it is possible that this action does not arise through the
protein’s fusion role; expression of truncated Mfn2 abolished the fusion activity but maintained
the stimulatory effect on oxidative phosphorylation (Pich et al. 2005).
It has been suggested that the ability of Mfn2 to regulate the activity of the ETC complexes is
linked to the role of Mfn2 in tethering the ER and mitochondria at the MAM (Section 1.3.1.2).
Alterations in Mfn2 expression could modify the distance between these two organelles, and
thus disrupt the homeostasis of calcium signalling in the cell, impacting on the expression of
multiple proteins involved in oxidative phosphorylation. As expected, changes in Mfn2
expression are capable of inducing disease; both obese subjects and patients suffering from type
2 diabetes express reduced levels of both Mfn2 mRNA and protein (Bach et al. 2005).
Accordingly, examination of muscle from patients revealed both a decrease in mitochondrial
mass and size, alongside a reduction in mitochondrial function (Ritov et al. 2005; Zorzano et al.
2009). Therefore, disruption of mitochondrial dynamics is capable of inducing a disease state in
cells, linked to disruption of the bioenergetic output.
Thus, the aforementioned fragmentation in the sporadic ALS patients upon ageing may be
indicative of a disruption in Mfn2 signalling, potentially impacting on the efficient functioning
of oxidative phosphorylation in the cells. We therefore decided to compare the morphology of
the mitochondrial network in the sporadic ALS patient fibroblasts cultured in 0.009mg/ml
galactose, and 1mM sodium pyruvate, with that of the control samples (Figure 3.14 and Figure
3.15).
127
Figure 3.14: Interconnectivity of mitochondrial network in control fibroblasts compared to sporadic patients when cultured in 0.009mg/ml galactose
Figure 3.14: Age-matched control and sALS patient fibroblasts cultured in 0.009mg/ml D-galactose and loaded with CMXRos Mitotracker Red. A) FibCon158 (Age 49); B) FibPat38 (Age 49); C) FibCon156 (Age 74); D) FibPat27 (Age 73). An area of interconnectivity of the mitochondrial network is highlighted and magnified in the yellow squares. Scale bars: 10m.
128
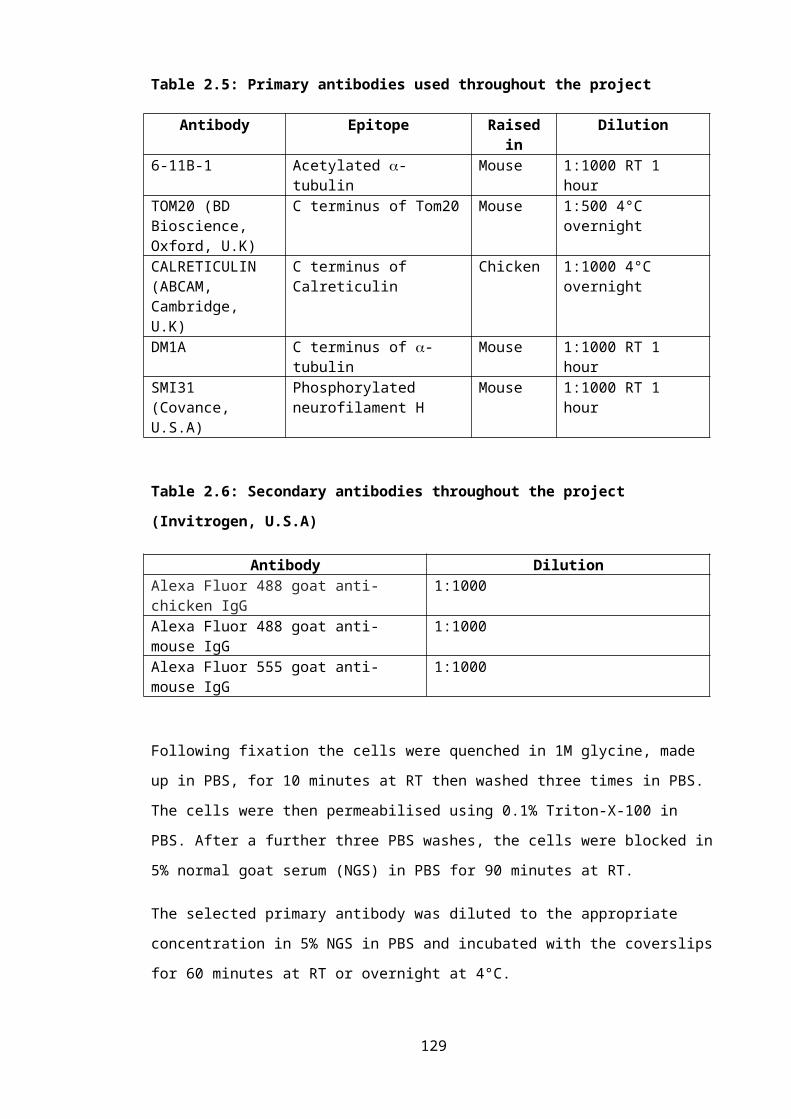
Figure 3.15: Network complexity of sporadic ALS patient fibroblast mitochondria cultured in glucose-deprived media
Figure 3.15: For each control or patient sample N=3 or 4. (A) R2 value for sALS patients: 0.002290; the slope does not significantly differ from zero. The difference between the control and patient slopes was not significant. All data points represent mean S.E.M.
Overall, the sALS patients did not demonstrate an increase in network complexity upon an
increase in age, with the slope not significantly differing from zero. Furthermore, the sALS
fibroblasts did not show differences in mitochondrial branching when compared to the control
samples. On the other hand, two of the sALS patient fibroblasts (FibPat38 and FibPat27)
LABEL ON GRAPH do appear to be outliers, with their network complexity falling distinctly
above or below the mean range of their age-matched control samples (Figure 3.15). However,
these same patient fibroblasts also appear as outliers with regards to their mitochondrial
morphology when cultured in 1mg/ml glucose (Section 3.2.3.1), where their main source of
energy generation was glycolysis.
It is possible that mitochondrial fusion was increased, perhaps via upregulation of Mfn2, in both
patient and control cells as an adaptive mechanism to cope with the change in metabolic
demand. It appears that this metabolic change prevents the noted mitochondrial morphology
changes seen in older ALS patient cells under glucose-rich culture conditions. Thus, the
physiological response to oxidative phosphorylation induction seems to restore mitochondrial
fusion in the older sporadic ALS patient fibroblasts. In light of this change in mitochondrial
morphology when the fibroblasts were cultured in the presence of different metabolic substrates,
more samples will be required to ascertain whether there really is a failure of the mitochondria
129
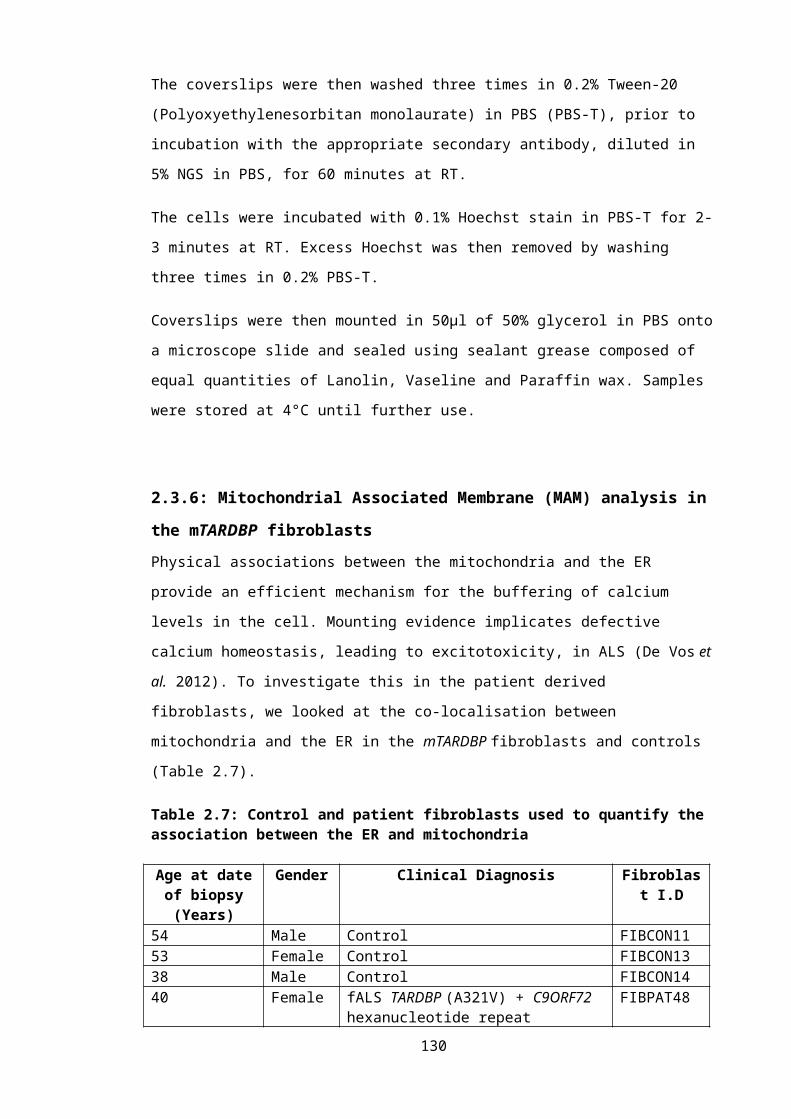
to fuse in the older ALS patients and, importantly, whether altering mitochondrial function is
capable of alleviating this proposed fusion defect.
Interestingly, a previous study of bioenergetic modulation of mitochondrial morphology in
primary fibroblasts revealed no effect of complete inhibition of glycolysis, via the application of
2-Deoxyglucose (DOG), on the morphology of the mitochondria (Guillery et al. 2008). From
this, the conclusion was drawn that the intracellular concentration of ATP has no bearing on the
morphology of the mitochondria (Guillery et al. 2008). Thus, the trend of mitochondrial
fragmentation seen in the oldest sporadic ALS patient fibroblasts can be postulated to arise from
a different source of cellular stress, separate from bioenergetic status of the mitochondria, such
as defective maintenance of calcium homeostasis, an uncontrollable rise in ROS levels or
dysfunction in the process of mitophagy. However, recent evidence by Giedt et al in 2012 seems
to conflict with evidence provided by Guillery et al. In vascular endothelial cells ATP
production by glycolysis does influence the morphology of the mitochondrial network; a slight
increase in mitochondrial fusion was observed when cytosolic ATP levels rose (Giedt et al.
2012). Therefore, the elucidation of the cause of the mitochondrial dysmorphology observed in
the sporadic patient fibroblasts requires further investigation.
3.2.3.2: Quantifying mitochondrial morphology in patient fibroblasts expressing
mTARDBP
Mounting evidence suggests that the expression of mTARDBP or over-expression of the wild
type protein can impact on both the function and morphology of the mitochondria. For example,
expression of human TDP-43 in mouse models resulted in mitochondrial aggregation,
vacuolisation and defective formation of the mitochondrial cristae (Shan et al. 2010; Xu et al.
2011).
Thus I followed my analysis of sporadic ALS patient fibroblasts with analysis of fibroblasts
derived from patients with TARDBP mutations. Three patients were imaged alongside three
healthy control samples, as depicted in Figure 3.16, before being plotted alongside all the
controls to assess the influence of age on mitochondrial morphology in the presence of a
TARDBP mutation (Figure 3.17).
130
Figure 3.16: Interconnectivity of mitochondrial network in a control fibroblast compared to a mTARDBP-expressing patient when cultured in 1mg/ml glucose
Figure 3.16: Age-matched control and mTARDBP patient fibroblasts cultured in 1mg/ml D-glucose and loaded with CMXRos Mitotracker Red. A) FibCon09 (Age 38 years); B) A321V mTDP-43 FibPat48 (Age 40 years). An area of interconnectivity of the mitochondrial network is highlighted and magnified in the yellow squares. Scale bars: 10m.
Figure 3.17: Network complexity of mTARDBP-expressing patient fibroblast mitochondria cultured in the presence of glucose
Figure 3.17: For each control or patient sample N=3 or 4. Data points represent mean S.E.M. R2 value for mTARDBP patients: 0.0005721; the slope does not significantly differ from zero. The difference between the control and patient slopes was not significant.
The slope of the network complexity of the mTARDBP-expressing fibroblasts did not
significantly differ from zero, indicating there is not a trend in these cells to alter their
131
mitochondrial morphology upon an increase in age. Furthermore, the slope did not significantly
differ from the control cohort. However, the absence of any significant changes may be
attributed to the low cohort number in the mTARDBP group.
Indeed, both FibPat48, expressing A321V mTDP-43, and FibPat51, expressing M337V mTDP-
43, appear to have an increased interconnectivity of the mitochondrial network compared to
their age-matched controls. This was not observed with FibPat55, expressing G287S mTDP-43.
This result raises an interesting query as to whether the different mutations in TARDBP
differentially affect mitochondria, or whether other genetic, epigenetic or environmental factors
play a role. A larger cohort number will be necessary to address these issues.
3.2.3.2.1: Influence of forced oxidative phosphorylation on mTARDBP ALS patients
Though there is little evidence to suggest mutations in TARDBP manifest in defective oxidative
phosphorylation, due to the large number of gene changes associated with expression of mTDP-
43 (Polymenidou et al. 2011), it is possible that the pathway of oxidative phosphorylation is
altered in these cells. We therefore decided to culture the mTARDBP patient fibroblasts in
respiration-dependent media for 24 hours alongside healthy control cells (Figure 3.18), before
assessing their mitochondrial morphology alongside the whole control cohort (Figure 3.19).
132

Figure 3.18: Interconnectivity of mitochondrial network in a control fibroblast compared to a mTARDBP-expressing patient when cultured in 0.009mg/ml galactose
Figure 3.18: Age-matched control and mTARDBP patient fibroblasts cultured in 0.009mg/ml D-galactose and loaded with CMXRos Mitotracker Red. A) FibCon09 (Age 38 years); B) A321V mTDP-43 FibPat48 (Age 40 years). An area of interconnectivity of the mitochondrial network is highlighted and magnified in the yellow squares. Scale bars: 10m.
133
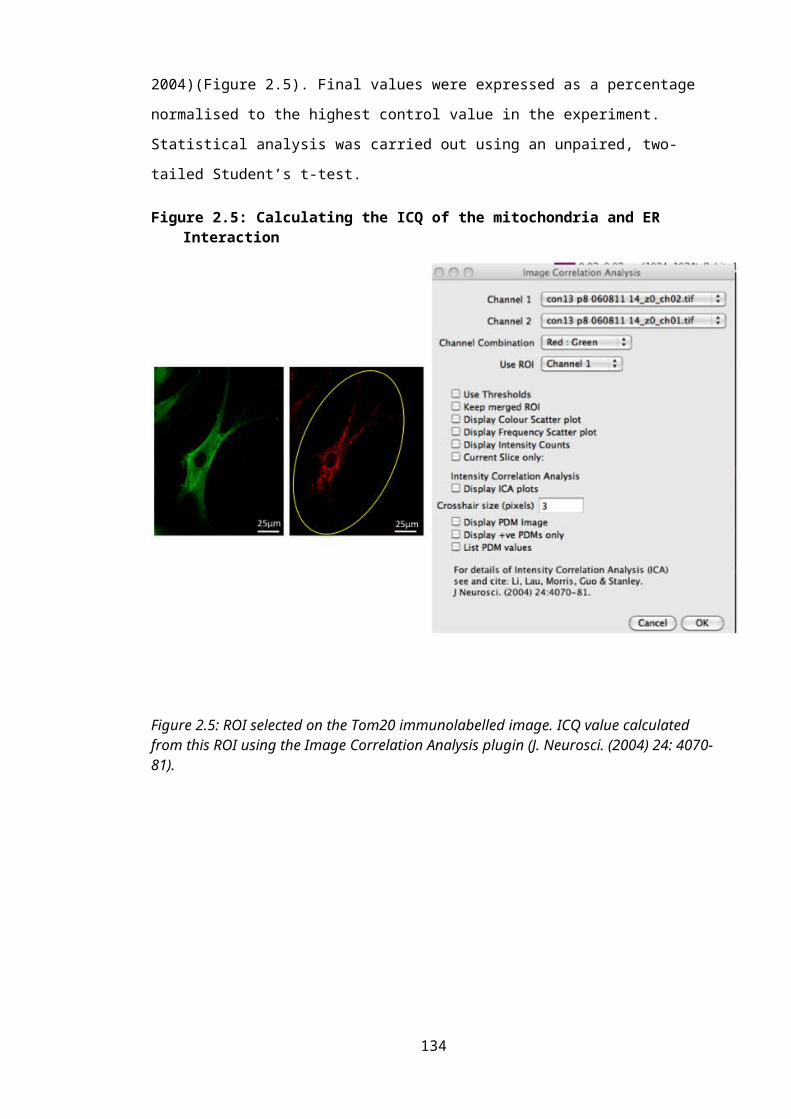
Figure 3.19: Network complexity of mTARDBP-expressing patient fibroblast mitochondria cultured in glucose-deprived media
Figure 3.19: For each control or patient sample N=3 or 4. Data points represent mean S.E.M. R2 value for mTARDBP patients: 0.1693; the slope does not significantly differ from zero. The difference between the control and patient slopes was not significant. All data points represent mean S.E.M.
The network complexity in all three mTARDBP patient fibroblasts appears increased compared
to the age-matched control samples, as depicted in Figure 3.18. However, again likely due to the
low cohort number, neither the difference from zero, nor the comparison between the patients
and controls, were significant.
This increase in network complexity in respiration-dependent media could indicate a potential
defect in oxidative phosphorylation, such as an excessive production of ROS, resulting from
increased superoxide formation. If so, the enhanced interconnectivity of the mitochondrial
reticulum would represent a pathogenic response of the cell, rather the normal adaptive response
in the face of forced oxidative respiration, perhaps indicating a defect in ETC function in the
presence of mTARDBP. The evidence of an aberrant increase in the difference of network
complexity between the two metabolic conditions supported this hypothesis. In both FibPat48
and FibPat55, there appears to be an excessive response to the conversion towards the use of
oxidative phosphorylation, hinting at a pathogenic response to the use of the ETC. Indeed, in
these patient fibroblasts, when compared to glucose-enriched conditions, an average increase in
network complexity of 29.5% and 37% respectively, was observed, compared to an average
12% increase seen in the control cohort.
134

However, as the increase in mitochondrial branching was observed in two of the patients under
glucose-rich conditions, and FibPat51 did not show an excessive increase in network
complexity upon forced oxidative phosphorylation (increasing an average of 15.8% when
compared to glucose-enriched culture conditions), it may alternatively be postulated that the
aberrant increased interconnectivity of the mitochondrial reticulum either derives from overall
malfunctioning metabolism of carbohydrates or another source of cellular stress such as
defective calcium handling or deficiencies in the mitophagy pathway.
3.3: ConclusionBroadly speaking, during ageing, it is appreciated that there are cumulative defects in the
functioning of the cell. The cause of these defects may derive from several sources, including
aberrant metabolism, irregular calcium homeostasis or pathogenic levels of ROS production. It
appears that increased fusion of the mitochondrial network is capable of protecting the cells
from this dysfunction (Figure 3.3). However, in ALS, despite the disease being characterised by
the presence of cellular defects similar to those seen upon ageing, in this investigation, the
fibroblasts seem to lose their ability to undergo mitochondrial fusion during ageing (Figure 3.8).
Interestingly, it is known that age is a strong disease modifier; prognosis is worse for patients
with disease onset in later life (Chio et al. 2009). …IS THIS RELATED TO AGE-RELATED
SURVIVAL? A systematic review carried out in 2009 found that patients under the age of 40
have longer survival, which can exceed 10 years. Conversely, in patients over the age of 80, the
median survival was found to be less than two years (WHICH TYPES OF ALS?!!) (Chio et al.
2009). The oldest patient assessed in this investigation was 76 years old at the time of skin
biopsy. It would be interesting to see whether the trend for increasing mitochondrial
fragmentation continues as the age of the patient increases. Furthermore, expanding the size of
the patient cohort may allow the identification of a threshold, where age, relating to changes in
mitochondrial morphology, becomes a key modifier of disease prognosis.
It may be postulated that if mitochondrial fusion is normally a protective mechanism, in
patients with a later age at onset the observed mitochondrial fragmentation could contribute to
the more rapid progression of disease in these patients. As mentioned, more samples will be
required to firmly validate this hypothesis, but it may be suggested that pharmaceutical
intervention with pro-fusion drugs in older sALS patients could be beneficial.
As neurodegenerative disease is typically characterised by fragmentation of the mitochondrial
network (Alexander et al. 2000; Zuchner et al. 2004; Wang et al. 2009), it would be interesting
to further investigate the pathogenic dysfunction underlying the changes in mitochondrial
morphology in the sALS patients. However, the results obtained with these patient samples
were highly variable, possibly as a consequence of the sporadic nature of their disease, as well
135

as from the typical genetic variation seen amongst patients. Thus, unless the cohort size was
further expanded, it is likely that interpreting any functional results will be problematic, as
ascertaining any commonalities between patients, and attributing this to a single mechanism,
would be difficult. In search of such a mechanism, it would be interesting to investigate whether
there are any gene expression patterns associated with the patients that show age-dependent
mitochondrial differences. Such changes could provide a common link between the samples of
the patient cohort; it may be possible that there are genes altered in ageing capable of inducing
mitochondrial fusion, such as Mfn2, that fail to be upregulated in the disease samples.
However, as fibroblasts are mainly glycolytic, the observed fragmentation may reflect a defect
in either glycolysis or the TCA cycle. Alternatively, it may be that an external influence on the
mitochondrial network causes fragmentation, such as defective calcium homeostasis or a
pathophysiological response to an accumulation of ROS. Interestingly, an increased sensitivity
to oxidative stress has been observed in both sporadic and mSOD1 ALS myoblasts (Bradley et
al. 2009).
Changes in energy metabolism have been implicated in the pathogenesis of ALS, with muscle
hypermetabolism leading to a decrease in energy stores (Browne et al. 2006; Dupuis et al.
2011). These abnormalities in muscle metabolism were shown in the mSOD1 transgenic mice,
with a decrease in ATP production and an increase in mitochondrial uncoupling proteins being
observed (D'Alessandro et al. 2011). Interestingly, in the present investigation, the switch of
fibroblast culture from glucose-containing media to one containing galactose and pyruvate
elicited a rescue of the mitochondrial network in the sALS cohort. This was unexpected, as
defects in the functioning of the ETC have been previously highlighted in ALS aetiology.
It may be that culture of the sALS fibroblasts in respiration-dependent media, therefore forcing
oxidative phosphorylation, pushes mitochondria to function at their full capacity, eliciting the
increase in mitochondrial fusion and over-riding the primary mitochondrial fragmentation
defect observed in glucose-containing media. Indeed, the significant increase in spare
respiratory capacity in the control cohort upon increasing age was not observed in the sporadic
ALS cohort (S. Allen; Personal communication). It is possible that, upon culture in respiration-
dependent media, the mitochondria are already working at full capacity, and are therefore
maximally branched to reflect this. It may be that culture of the sALS fibroblasts in respiration-
dependent media for longer than 24 hours would reveal morphological defects in the
mitochondria, as any remaining glucose-stores are depleted and the mitochondria are unable to
further enhance their functioning to meet the bioenergetic demands of the cell.
Interestingly, it has been observed that a ketogenic diet is beneficial in an animal model of ALS
(Zhao et al. 2006); mSOD1 mice fed with a ketogenic diet showed a delay in a decline in motor
performance, and a delayed loss of motor neurons in the spinal cord. This improvement has
been attributed to ketone bodies eliciting a reduction in Complex I defects in the ETC, alongside 136
a promotion of ATP production (Zhao et al. 2006). As the presence of a principal ketone body,
D-beta-3 hydroxybutyrate, is capable of improving the efficiency of mitochondria, it may also
act to increase their spare respiratory capacity and thus be beneficial to the sALS fibroblast
cohort. Indeed, infusion of D-beta-3 hydroxybutyrate into a mouse model of PD protected
against the dopaminergic neurodegeneration induced by 1-Methyl-4-phenyl-1,2,3,6-
tetrahydropyridine treatment. Again, this protection derived from an increase in mitochondrial
efficiency (Tieu et al. 2003). Measurement of intracellular levels of ROS, or direct assessment
of mitochondrial function, will be necessary to confirm these hypotheses in order to shed light
on the mechanisms underlying altered mitochondrial dynamics in the sALS cohort.
In contradiction to the morphological changes observed in the sALS patients, the patient
fibroblasts expressing mTARDBP generally demonstrated a trend towards increased
mitochondrial interconnectivity when compared to age-matched control fibroblasts.
Interestingly, two of the patient cells (FibPat48 and FibPat51) demonstrated differences in
mitochondrial morphology when cultured in either glucose or galactose. However, in FibPat48
and FibPat55, the increase in branching elicited by the change in metabolic conditions was
excessive compared to the age-matched control samples, indicating a heightened sensitivity of
mitochondria to forced oxidative phosphorylation, perhaps indicative of dysfunction in the ETC.
In this cohort of patients, the underlying genetic cause of the disease is known, eliminating
some of the variation seen in the sporadic data set. Furthermore, as a consequence of the far-
reaching role TDP-43 plays in the cell, due to the regulation of gene splicing, and despite the
absence of statistical significance in the changes in mitochondrial dynamics, likely due to the
low cohort number, we considered that it would be worthwhile to attempt to elucidate the
pathways involved in mediating these changes in mitochondrial dynamics. The results of this
further investigation are discussed in Chapter 4.
137
Chapter 4 - Functional analysis of mTARDBP-expressing fibroblasts
4.1: Introduction
4.1.1: TDP-43 and ALS
It is estimated that 3% of fALS and 1.5% of sALS arise due to mutations in TARDBP, encoding
TDP-43, following a study of a Caucasian cohort (Sreedharan et al. 2008). The TDP-43 protein,
mainly nuclear in localisation, is thought to be key in regulating RNA metabolism and splicing.
Histopathological study of brain samples derived from patients with classical ALS or FTLD-
ALS identified numerous inclusions that stain positive for TDP-43 (Arai et al. 2006).
Additionally, hyper-phosphorylated, insoluble, C terminal fragments of TDP-43, contained in
ubiquitinated cytoplasmic inclusions, have also been noted in both familial and sporadic ALS,
excluding mSOD1-mediated ALS (Arai et al. 2006; Neumann et al. 2006). Concomitant with
this cytoplasmic accumulation is the nuclear depletion of TDP-43, suggesting that dysregulation
of transcription could be a pathogenic process in TDP-43 proteinopathy (Arai et al. 2006). In
ongoing experiments, analysis of our patient fibroblasts also supported this observation of
reduced levels of nuclear TDP-43 in the presence of a TARDBP mutation (C. Hewamadduma;
Personal communication).
In vivo studies reveal an inherent need for the RNA-binding function of TDP-43 to mediate
neurotoxicity upon overexpression of the protein, further implicating the deregulation of mRNA
processing in the pathogenesis of neurodegeneration (Voigt et al. 2010). Accordingly, RNA
sequencing, following depletion of TDP-43 in an adult mouse brain, found expression level
changes in 601 mRNA transcripts and 965 altered mRNA splicing events compared to control
samples (Polymenidou et al. 2011). Exon expression array analysis on our mTARDBP
fibroblasts also revealed numerous mRNA splicing changes when compared to healthy control
samples (R. Highley; Personal communication). Thus, to some extent, these peripheral cells
mimic the molecular pathology observed in mTARDBP-expressing neurons.
4.1.2: TDP-43 and mitochondria
Mitochondrial dysfunction can arise in cells expressing both wild type and mutant TDP-43
(Barmada et al. 2010; Duan et al. 2010; Hong et al. 2012). This can manifest as mitochondrial
dysmorphology, such as decreased cristae and vacuoles in the mitochondrial matrix, as
evidenced in a transgenic mouse model (Xu et al. 2010). Furthermore, neuron-specific
expression of human-TDP-43 in a mouse model lead to the abnormal aggregation of
138

mitochondria in spinal motor neurons. It is believed this accumulation is a consequence of
abnormal mitochondrial trafficking; it arises alongside the depletion of mitochondria at the NMJ
(Shan et al. 2010).
The clustering of mitochondria was also observed in another mouse model expressing human
TDP-43 (Xu et al. 2010). Interestingly, an alteration in the expression levels of several fusion
and fission-regulating proteins was also seen, with an enhancement in Fis1 and phosphorylated
Drp1 expression, and a decrease in Mfn1, suggesting an upregulation of fission or a defect in
the fusion machinery (Xu et al. 2010).
In vitro evidence has further supported the notion of a link between mTDP-43 expression and
dysfunctional mitochondria. In the NSC-34 motor-neuronal cell line, overexpression of either
wild type or disease-relevant mutant full-length TDP-43, or the C-terminal fragments of the
protein, resulted in mitochondrial damage, and the activation of mitophagy (Hong et al. 2012).
Thus, there is a precedent that the presence of mTARDBP could result in mitochondrial
dysfunction or disruption of mitochondrial dynamics. This in turn could influence the
bioenergetic status of the cell, further exacerbating the mitochondrial dysfunction. Indeed, this
dysfunction of mitochondria was indicated in the mTARDBP patient fibroblasts, with a trend
towards aberrant branching of the mitochondria seen under both basal and glucose-deprived
conditions (Figure 3.17 and 3.19). However, despite all this evidence, the precise mechanisms
by which expression of mTDP-43 aberrantly affect the mitochondria are unknown; it is unclear
whether the dysmorphology leads to the mitochondrial dysfunction, or whether defective
functioning of the organelle results in the noted morphological alterations.
4.1.3: Aims of investigation
The aims of this investigation were to characterise the mTARDBP-expressing patient
fibroblasts, with particular reference to mitochondrial dysfunction. We wished to ascertain the
reasons for the aberrant increase in mitochondrial morphology under both basal and glucose-
deprived conditions (Chapter 3), testing the bioenergetic efficiency of the cells and examining
biological pathways known to influence mitochondrial morphology, such as calcium
homeostasis. Furthermore, we wished to test the hypothesis that changes in gene expression in
the presence of mTARDBP accompany mitochondrial changes in primary dermal fibroblasts.
139
4.2: Bioenergetic assessment of the mTARDBP fibroblasts
4.2.1: Quantification of ATP levels in mTARDBP fibroblasts
Any changes in mitochondrial morphology may be indicative of functional defects in the cell,
particularly bioenergetic changes. Under both glucose-enriched and glucose-deprived
conditions, analysis of the patient fibroblasts expressing mTARDBP was suggestive of enhanced
levels of mitochondrial fusion compared to control samples (Figure 3.17 and 3.19). Particularly
when cultured in the respiration-dependent media, such alterations could be indicative of a
defect in oxidative phosphorylation. Furthermore, an increase in branching of the mitochondria
is suggestive of an adaptive response of the organelle to maintain efficient production of ATP
(Guillery et al. 2008). We therefore decided to assess the levels of ATP of the mTARDBP
fibroblasts under both glucose-enriched conditions and upon culture in respiration-dependent
media (Figure 4.1).
It was hypothesised that, upon culture in basal media, the patient-derived fibroblasts would
show either a significant increase or decrease in their ATP levels, compared to the control
subject fibroblasts. Such a change in ATP levels would help elucidate whether the trend towards
an increase in mitochondrial network complexity, noted in the mTARDP fibroblasts, derives
from an adaptive or a pathogenic change in the cell. Additionally, when the fibroblasts were
cultured in the respiration-dependent media, it was hypothesised that the patient fibroblasts
would show reduced levels of ATP compared to the control subjects, indicative of a defect in
oxidative phosphorylation, as suggested by the mitochondrial morphology analysis, particularly
in FibPat48 and FibPat51.
ATP was calculated as an arbitrary luminescent value by dividing the luminescent intensity by
the mean cell number across the three wells for each sample; cell number was quantified by the
measurement of double-stranded DNA.
140

Figure 4.1: Levels of ATP in the mTARDBP patient fibroblasts compared to control levels
Figure 4.1: A) ATP levels quantified in the individual patient (FibPat48, FibPat51 and FibPat55) and control subjects, when cells were cultured in the presence of either glucose or galactose; B) ATP levels quantified in the pooled control and patient subjects under different growth conditions. In both graphs Con01, Con11 Pat51 and Pat55 N=3; Pat48 N=2. Bars represent mean S.E.M.
No significant difference was seen in ATP levels between control and patient samples in either
growth conditions.
However, a small (non-significant) increase in ATP levels was seen in both control and patient
subjects when cultured in respiration-dependent media. INCREASED OUTPUT USING
OXIDATIVE PhOSPHORYLATION.
Interestingly, G287S….reflect problem with etc?
It may be that the fibroblasts needed to be cultured in glucose-deprived conditions for longer
than 24 hours for any pathogenic defects to be revealed.
141
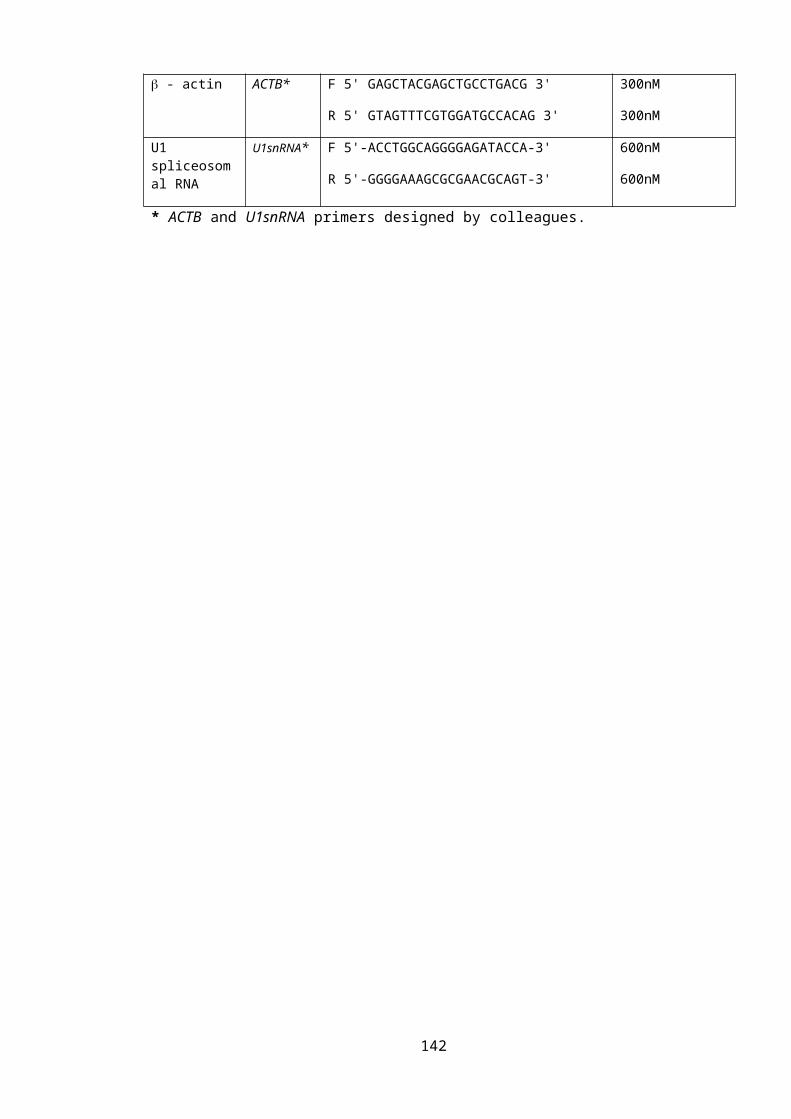
4.3: Gene expression profiling
4.3.1: Microarray Analysis of mTARDBP Patient vs Control Fibroblasts
A previous student in the laboratory performed a microarray study comparing gene expression
between control samples and mTARDBP patient fibroblasts, following culture of the cells in
media containing 1mg/ml glucose. I therefore analysed this microarray data to see if any key
cellular processes were significantly altered.
Microarray analysis was carried out comparing gene expression profiles from 6 neurologically
normal control fibroblast samples and the 3 ALS patient fibroblast samples harbouring
mutations in TARDBP (Table 4.1).
Table 4.1: Control and mTARDBP fibroblasts used for microarray analysis
Age at Date of Biopsy
Gender Clinical Diagnosis Fibroblast ID
45 Male Control FIBCON0143 Female Control FIBCON0259 Female Control FIBCON0354 Male Control FIBCON1153 Female Control FIBCON1338 Male Control FIBCON1440 Female fALS A321V mTDP-43 +
C9ORF72 hexanucleotide repeat expansion
FIBPAT48
62 Male fALS M337V mTDP-43 FIBPAT5156 Male sALS G287S mTDP-43 FIBPAT55
Samples were analysed according to the protocol described in Chapter 2, section 2.4.3. Briefly,
changes in gene expression were quantified using the PLIER16 algorithm in Genespring. Using
an unpaired t-test, transcripts were considered differentially expressed between groups if they
had a fold change of ≥1.5 and a p-value of ≤ 0.05.
The analysis showed a significant change in the transcription profile of 409 genes. However,
following removal of gene duplicates, a significant change in the expression profile of 369
genes between control and ALS samples was found. 92 of these genes were upregulated in the
mTARDBP samples, with the remaining 277 transcripts significantly downregulated.
To categorise these gene expression changes, the Database for Annotation, Visualisation and
Integrated Discovery (DAVID) Gene Ontology (GO) analysis, using DAVID Bioinformatics
Resources 6.7 (http://david.abcc.ncifcrf.gov/) was applied to ascertain the top 30 biological
processes and pathways altered in mTARDBP fibroblasts, along with the number, percentage
and statistical significance of genes involved in each pathway (Table 4.2).
142
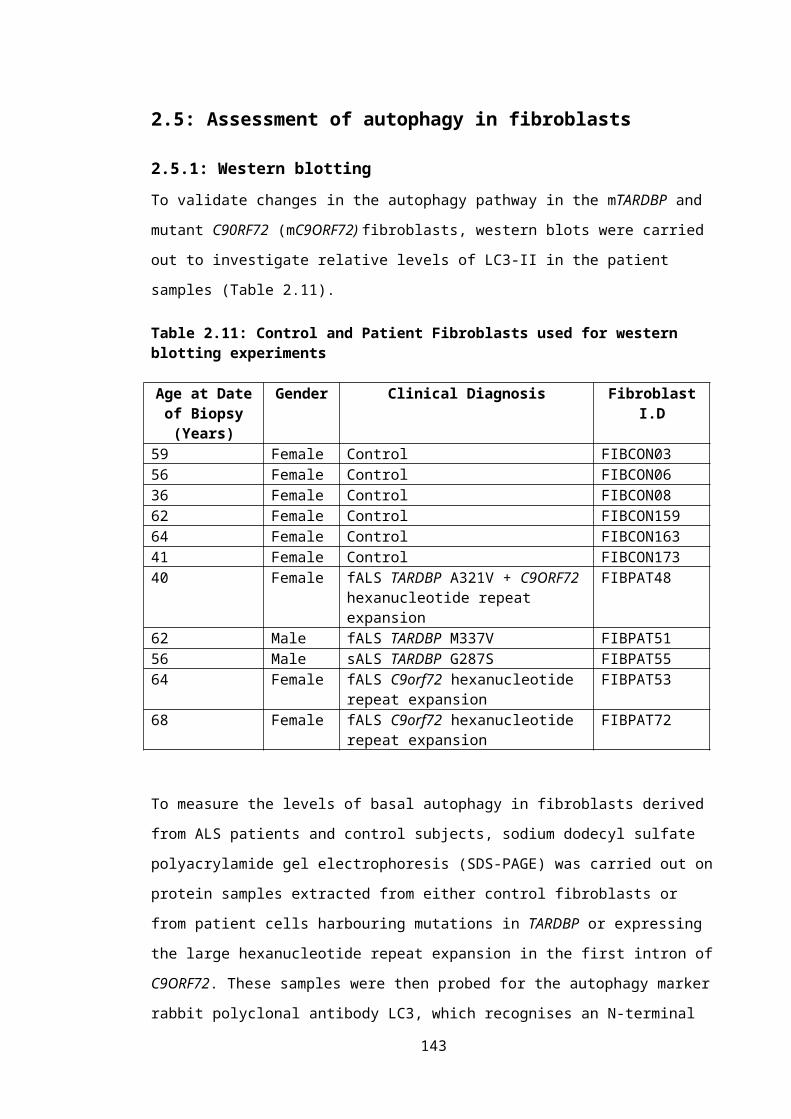
Table 4.2: DAVID GO Analysis of the differentially expressed genes
Biological Process Count Percentage P Value: Microtubule bundle formation 4 1.17 0.00219Actin cytoskeleton organisation 12 3.51 0.00252Small GTPase mediated signal transduction 14 4.09 0.00340Actin filament-based process 12 3.51 0.00412Negative regulation of macromolecule biosynthetic process 20 5.85 0.00444Cell projection morphogenesis 12 3.51 0.00465Cell morphogenesis 15 4.39 0.00492Cytoskeleton organisation 17 4.97 0.00530Cellular component morphogenesis 16 4.68 0.00533Neuron differentiation 17 4.97 0.00553Cell part morphogenesis 12 3.51 0.00644Cell projection organisation 15 4.39 0.00654Negative regulation of biosynthetic process 20 5.85 0.00724Regulation of cell proliferation 25 7.31 0.00746Integrin-mediated signalling pathway 6 1.75 0.00828Negative regulation of transcription from RNA polymerase II promoter 12 3.51 0.00848Positive regulation of cell projection organisation 5 1.46 0.00976Regulation of cell development 10 2.92 0.01156Regulation of protein localisation 8 2.34 0.01204Negative regulation of cellular biosynthetic process 19 5.56 0.01207Cell fate commitment 8 2.34 0.01249Regulation of cellular localisation 11 3.22 0.01394Biological adhesion 22 6.43 0.01431Cell adhesion 22 6.43 0.01451Neuron projection morphogenesis 10 2.92 0.01454Positive regulation of cellular component organisation 9 2.63
0.01611
Neuron projection development 11 3.22 0.01702G1/S transition of mitotic cell cycle 5 1.46 0.01775Regulation of establishment of protein localisation 7 2.05 0.02155Regulation of cell projection organisation 6 1.75 0.02166
Table 4.2: Count: Number of genes altered in expression that are involved in this process. Percentage: percentage of genes altered in expression out of the total number of genes involved in this biological pathway. P-value: significance of enrichment.
The functional DAVID GO analysis revealed an enrichment of processes such as cell adhesion,
cytoskeletal organisation and maintenance, signal transduction and cellular morphogenesis.
143
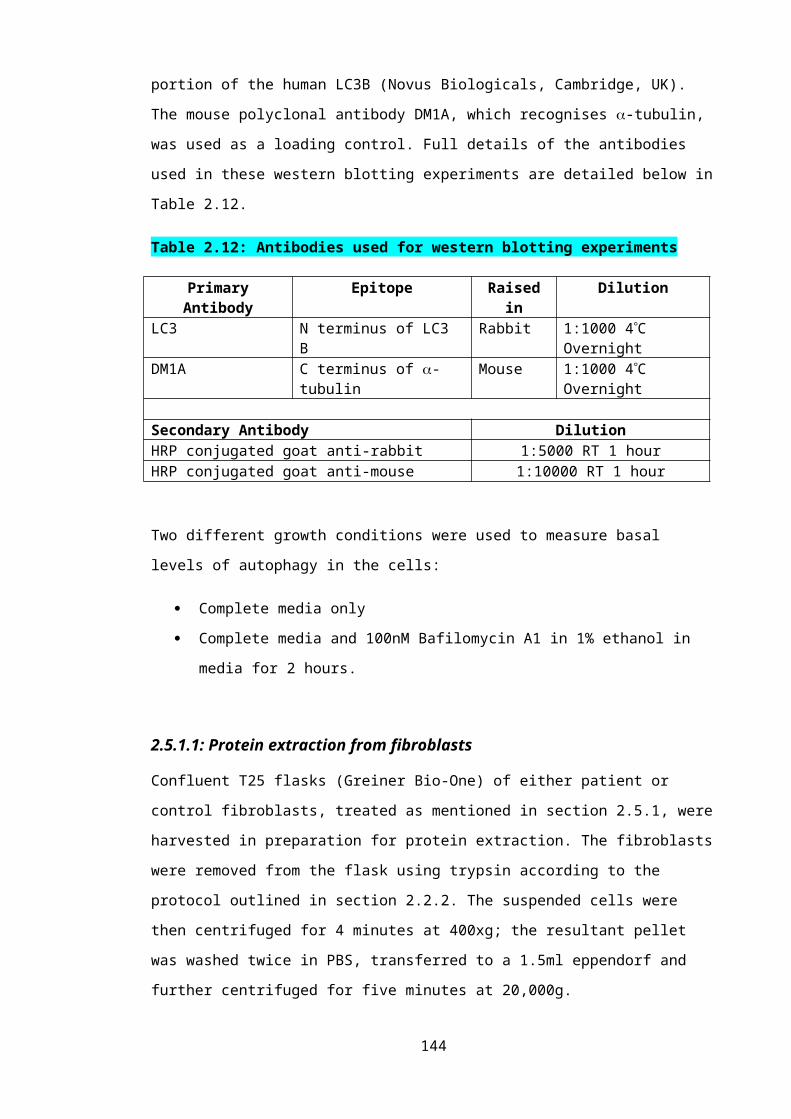
The biological pathways altered in mTDP-43 fibroblasts were also classified using DAVID
KEGG (Kyoto Encyclopedia of Genes and Genomes) pathway analysis. The identified
biological processes were presented alongside the number, percentage and statistical
significance of genes involved in each pathway (Table 4.3).
Table 4.3: DAVID KEGG Analysis of the differentially expressed genes
Biological Process Count Percentage P ValueRegulation of actin cytoskeleton 12 3.51 0.00099Neurotrophin signalling pathway 8 2.34 0.00502Focal adhesion 10 2.92 0.00698ECM-receptor interaction 6 1.75 0.01399Arrhythmogenic right ventricular cardiomyopathy (ARVC) 5 1.46 0.04040Small cell lung cancer 5 1.46 0.05489Axon guidance 6 1.75 0.06907Pathogenic Escherichia coli infection 4 1.17 0.07316Cell adhesion molecules (CAMs) 6 1.75 0.07465
Table 4.3: Count: Number of genes altered in expression involved in this biological process. Percentage: percentage of genes altered in expression out of the total number of genes involved in this biological pathway. P-value: significance of enrichment.
DAVID KEGG pathway analysis mainly highlighted pathways impacting on the actin
cytoskeleton, which has roles in axonal guidance, synapse formation and axonal outgrowth.
Changes in actin cytoskeletal regulation also have implications for mitochondrial morphology,
through the mitochondrial recruitment of Drp1 (De Vos et al. 2005).
As one of the main physiological roles of fibroblasts involves providing structural support for
tissue, the apparent enrichment of processes related to cytoskeletal regulation and cell adhesion
is perhaps not surprising. However, the relevance of these pathway changes in relation to ALS
and the effect of mTARDBP on the maintenance of the motor neuron are unclear. Furthermore,
both GO and KEGG analysis utilise multiple comparisons to characterise the different
biological processes. However, upon application of Bonferroni correction, none of the listed
biological processes appeared to be significantly altered upon expression of mTARDBP.
PLIER ALGORITHM…..OVER-ESTIMATE GENE EXPRESSION CHANGES. GENES
NOT ENRICHED ENOUGH…..OF LIMITED USE IN THESE CIRCUMSTANCES DUE TO
LOW NUMBER OF GENE CHANGES AND FOLD DIFFERENCES.
Due to this lack of significance, and the proposed enrichment of processes mainly attributed to
fibroblasts, it was decided to manually examine the altered genes, classifying their molecular
function categories using their GO terms derived from NetAffx (Table 4.4).
144
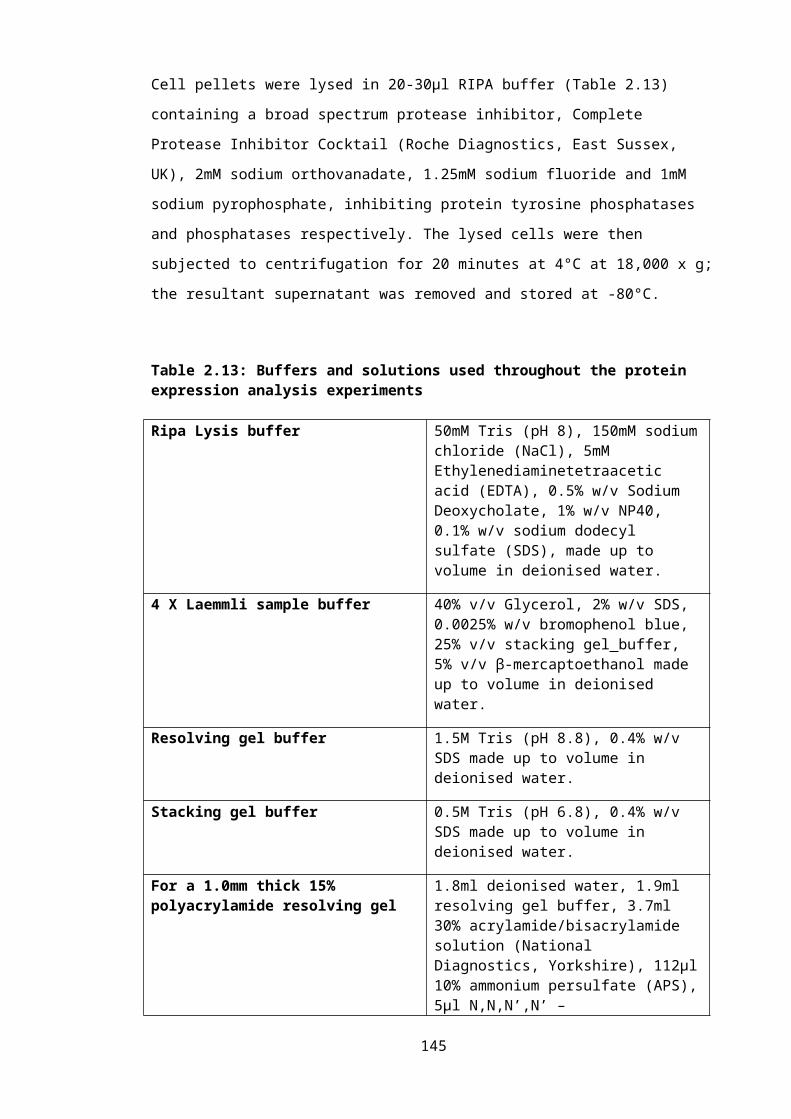
Table 4.4: Manual classification of the differentially expressed genes
The expression changes of genes relating to pathways potentially influencing both
mitochondrial and neuronal homeostasis were then further investigated and validated using RT-
qPCR.
Biological process Number of genes alteredTranscription 51Protein Regulation 23Signalling
Calcium
30
8Transport
Protein Ion Molecular
20
1064
Metabolism
Glycolysis Krebs Cycle Insulin Mediated Aldehyde Sphingolipid
17
42312
Cell adhesion 16Endoplasmic Reticulum Associated 14Cell cycle 12Nervous System Related 11Mitochondrial Associated 10RNA processing 10Extracellular Matrix Associated 8Cytoskeleton 7Apoptosis 7Stress Response 7Translation 6Angiogenesis 5Golgi Apparatus Associated 5Immune Response 5Inflammation 3Miscellaneous 34Unknown 83
145
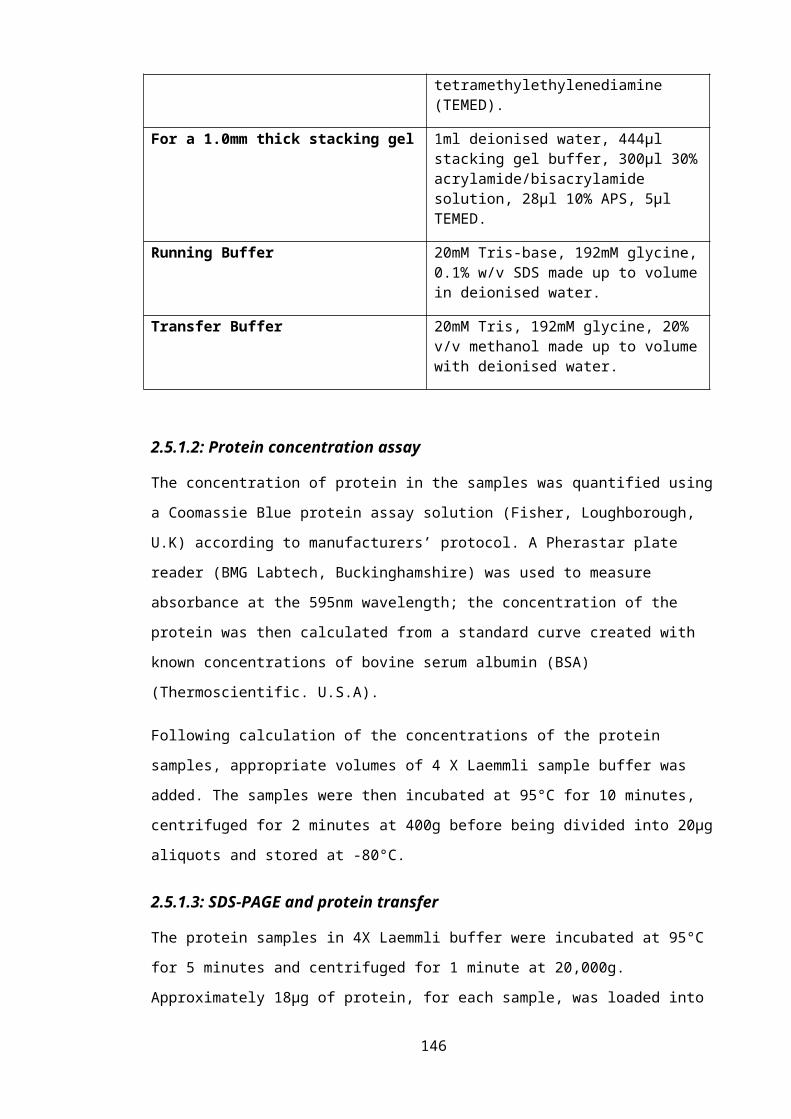
4.3.2: RT-qPCR optimisation
4.3.2.1: Identifying the ideal reference gene for qPCR
Though a common technique, RT-qPCR can produce extremely variable results, with several
steps, including tissue culture, RNA extraction and cDNA synthesis all potential sources of
experimental variation (Galiveti et al. 2010). It is therefore necessary to include a stable
reference throughout each assay. This reference gene can be used to correct for the variation
seen between samples and runs, and thus minimise experimental error in fold-change
calculations.
In order to be a reference gene, the gene of interest must be expressed in a wide variety of cells
and demonstrate minimal variation in expression across samples. However, each common
reference gene has caveats, such as expression variability or interaction with a gene of interest.
Thus, it is necessary to test several reference genes to identify one that is optimal for each
experiment (Galiveti et al. 2010).
Therefore, three different genes were assessed as potential normalising genes, namely ACTB
(encoding -Actin), PPIA (encoding Cyclophilin A) and the non-protein coding RNA
(npcRNA) U1 snRNA. The amplification properties and variability of expression were tested
amongst six controls and three mTARDBP patients (Table 4.5).
Table 4.5: Control and mTARDBP fibroblasts used in optimisation of RT-qPCR reference genes
Age at Date of Biopsy (Years)
Gender Clinical Diagnosis Age at Onset of
Symptoms
Fibroblast I.D
Disease Duration(Months)
45 Male Control - FIBCON01 -43 Female Control - FIBCON02 -59 Female Control - FIBCON03 -54 Male Control - FIBCON11 -53 Female Control - FIBCON13 -38 Male Control - FIBCON14 -40 Female fALS A321V mTDP-
43 + C9ORF72 hexanucleotide repeat expansion
37 FIBPAT48 58
62 Male fALS M337V mTDP-43
58 FIBPAT51 94.5
56 Male sALS G287S mTDP-43
51 FIBPAT55 76.5
146
4.3.2.1.1: -ActinACTB, encoding -Actin, is one of the most common reference genes used, along with GAPDH.
The protein is highly abundant in most cell types and generally is expressed at similar levels
across samples (Galiveti et al. 2010). However, there is evidence of an interaction between -
Actin mRNA and TDP-43; in the somatodendrite of cultured hippocampal neurons, RNA
granules have been found, containing both TDP-43 and -Actin mRNA. Repeated stimulation
of these neurons with KCl caused a cumulative increase in the number of these TDP-43-
containing clusters, suggesting that TDP-43 acts in response to neuronal activation by
modulating neuronal plasticity via its interaction with -Actin mRNA (Wang et al. 2008).
Though this evidence is derived from experiments carried out in neuronal cells, we cannot rule
out the possibility of an interaction between -Actin and TDP-43 in human fibroblasts.
Furthermore, as TDP-43 is known regulate the splicing and expression of mRNA transcripts,
this interaction may influence the amplification of the ACTB transcript in the presence of
mTARDBP. Thus, ACTB may not be a reliable reference gene to ascertain the effect of
mTARDBP on gene expression.
To assess the reliability of ACTB as a reference gene for these experiments, the amplification
plot and dissociation curve derived from the PCR of control and patient cDNA using ACTB
primers was examined (Figure 4.2).
147

Figure 4.2: Amplification plot and dissociation curve of ACTB
Figure 4.2: A) Amplification plot of ACTB using 2.5ng/reaction cDNA derived from 6 control and 3 mTARDBP patient samples. B) Dissociation (melting) curve of ACTB PCR products, representing the change in fluorescence seen upon the gradual increase in temperature. NTC: No template control; No RT: No reverse-transcriptase control.
148
Figure 4.2A depicts the amplification plot of the gene of interest, in this case, ACTB, in the 9
samples. A no template control (NTC) and a no reverse transcriptase sample (No RT) were used
as negative controls. The cycle threshold (Ct) values for each sample were measured as the first
cycle in which the fluorescence produced is distinguishable as being above the background
signal. The adaptive baselines throughout all the experiments were automatically generated
using a best-fit model, taking into account the first cycle producing fluorescent levels and the
end cycle before the exponential production of fluorescence. With the amplification of ACTB,
all of the samples entered the exponential phase at a similar number of cycles, suggesting a
similar level of expression.
Figure 4.2B shows the dissociation curve of ACTB in the 9 samples. The dissociation (melting)
curve is derived from the samples being subjected to a gradual increase in temperature
following the annealing stage. The denaturing of the double helix causes the dissociation of dye
and a subsequent reduction in the fluorescent signal. The presence of a single homogeneous
dissociation peak in all samples means only a single product has been amplified.
However, the dissociation curve produced by the amplification of ACTB revealed several peaks,
one produced by the NTC indicative of the presence of primer dimers. The peak produced by
the no RT sample dissociates at a similar temperature to the main product suggesting genomic
DNA contamination of the RNA samples. The primers for this gene were designed near the 3’
UTR to better match the location of probes used in the microarray.
PLUS….AVOID VARIATION THAT MAY ARISE FROM SPLICE VARIANTS OF THE
GENE. however, THOUGH IDEAL FOR DETERMING SIG DIFFERENCE IN OVERALL
GENETIC LEVELS AND FOR IDENTIFYING ROBUST GENE CHANGES….NOT IDEAL
FOR INVESTIGATING GENE EXPRESSION CHANGES PERHAPS RESULTING FORM A
MUTATION IN TDP-43, A PROTEIN INVOLVED IN THE REGULATION OF GENE
SPLICING.
Thus, they were not designed as intron spanning, leaving the experiment vulnerable to genomic
amplification, as seen by the substantial amplification, and relatively high plateau level, of the
No RT control sample. Furthermore, corresponding to the amplification plot, the melting peak
of the G287S mTDP-43 sample appears at a slightly higher temperature than the other samples.
Therefore, in the G287S mTDP-43 sample there is possibly a subtle difference in the
amplification product. Additionally, the large variation in the plateau levels seen between
samples in Figure 4.2A, with the G287S mTDP-43 sample ending its exponential phase of
increasing fluorescence earliest, suggests that the reaction ended prematurely due to an
insufficient amount of cDNA to work with. Though this technical fault will not influence the Ct
149
values derived from the experiment, this observation, alongside the aberrant amplification of
both the No RT and the NTC sample, does hint at the need for further optimisation of the assay.
Thus, for these experiments, ACTB does not appear to be an ideal reference gene.
4.3.2.1.2: U1 snRNA
Recently npcRNAs have come to the forefront in the understanding of RNA metabolism.
Though normalising genes are typically protein-coding, due to their constitutive expression
levels and stability, npcRNAs have also been suggested as ideal candidates for reference genes
in RT-qPCR (Galiveti et al. 2010). Therefore, the small nuclear RNA (snRNA) molecule, U1
snRNA, was also assessed as a potential reference gene in this experiment. U1 snRNA has
previously been evaluated as a normalising gene compared to other npcRNAs and the traditional
candidates, including ACTB and GAPDH using a variety of human tissues. When assessed for a
number of factors, including variation between samples, stability and constitutive expression,
U1 snRNA was shown to be an ideal reference gene (Galiveti et al. 2010). Therefore, this
npcRNA was assessed as a reference gene in the same way as ACTB (Figure 4.3).
150
Figure 4.3: Amplification plot and dissociation curve of U1 snRNA
Figure 4.3: A) Amplification plot of U1 snRNA using 2.5ng/reaction cDNA derived from 6 control and 3 mTARDBP patient samples. B) Dissociation (melting) curve of U1 snRNA PCR product, representing the change in fluorescence seen upon the gradual increase in temperature.
151
In Figure 4.3A, the cDNA derived from the A321V mTDP-43 sample is an outlier, showing a
slightly earlier amplification. Furthermore, the No RT sample also gave an amplification
product only 6 cycles further on from the main amplification products. This high concentration
of the no RT-derived product likely arose due to U1 snRNA being intron-less. Amplification of
genomic DNA was confirmed with the dissociation curve (Figure 4.3B), along with the NTC
sample producing a separate peak indicative of primer dimers, the PCR product of the no RT
sample had a very similar melting peak to the main PCR products. Thus, the U1 snRNA primers
produce genomic amplification, diminishing the reliability of the data.
4.3.2.1.3: PPIA
Finally, PPIA was also assessed as a potential reference gene. The encoded protein product,
Cyclophilin A, is a member of the peptidyl-prolyl cis-trans isomerase family. These enzymes
act to accelerate the folding of proteins by catalysing the cis-trans isomerisation of the peptide
bonds. Cyclophilin A has also been implicated as a key protein in immuno-suppression (Colgan
et al. 2005).
As a ubiquitous protein, Cyclophilin A has previously been used as a reference gene in RT-
qPCR experiments. Recently, PPIA was used, alongside ACTB, as a reference gene to quantify
gene changes in cells overexpressing TDP-43 or with TDP-43 knocked down (Cohen et al.
2012). Furthermore, PPIA was also used to normalise expression values of both TARDBP and
Fus in mouse brain tissue (Polymenidou et al. 2011). Thus, there is precedent of PPIA
expression being utilised to normalise gene changes when investigating TDP-43. Moreover, at
the times of these RT-qPCR experiments, there was no known association between PPIA,
Cyclophilin A and TARDBP or TDP-43. Additionally, Cyclophilin A did not appear to have
altered expression levels in the presence of mTARDBP, according to the microarray expression
data. Based on this precedent, PPIA was also assessed as a potential reference gene (Figure 4.4).
152
Figure 4.4: Amplification plot and dissociation curve of PPIA
Figure 4.4: A) Amplification plot of PPIA using 2.5ng/reaction cDNA derived from 6 control and 3 mTARDBP patient samples. B) Dissociation (melting) curve of PPIA PCR product, representing the change in fluorescence seen upon the gradual increase in temperature.
153

There was amplification in the NTC product (Figure 4.4A), shown as likely primer dimers on
the dissociation (melting) curve (Figure 4.4B). However, this product amplifies only after 10
additional cycles compared to the RT-PCR products. Thus, the primer dimers can be easily
excluded, and should not influence the final results. The primers used to amplify PPIA were
designed across an exon-exon boundary, avoiding genomic DNA contamination. Accordingly,
the No-RT control sample showed only the same amplification profile as the NTC sample,
indicative of the presence of primer dimers but not of genomic DNA contamination (data not
shown).
Furthermore, there were no discernible outliers on the amplification plot, in contrast to the
aforementioned results obtained using ATCB or U1 snRNA. Indeed, when Ct values were
compared between genes (Table 4.6), the thresholds derived from PPIA amplification produced
both the lowest standard deviation and more importantly the lowest coefficient of variation
(standard deviation/mean) across the six control and three mTARDBP patient cDNA samples
(Table 4.7).
Table 4.6: Comparison of Ct values obtained with reference genes
ACTB PPIA U1snRNAMean critical threshold valueFIbCon01 18.26 21.19 23.20FibCon02 18.60 21.45 22.98FibCon03 17.31 20.70 21.92FibCon11 16.65 20.41 21.77FibCon13 17.50 20.83 22.16FibCon14 17.88 20.94 22.27FibPat48 17.03 20.69 21.45FibPat51 17.65 20.68 21.81FibPat55 19.04 21.53 22.45
Table 4.7: Standard deviation and coefficient of variation of Ct values obtained with reference genes
ACTB PPIA U1snRNAStandard deviation 0.763 0.379 0.653Coefficient of variation 0.043 0.018 0.029
4.3.3: Identification of gene expression changes to validate
Manual classification of the gene expression changes did not reveal any changes in any of the
proteins that directly regulate mitochondrial dynamics, such as Fis1 or Mfn2. In support of this,
overexpression of M337V mTDP-43 in a mouse model did not influence the dynamics of the
mitochondria; it was postulated that the M337V mutation disrupts the ability of TDP-43 to
interact with the fusion and fission machinery (Xu et al. 2011; Cozzolino et al. 2012). It is
therefore feasible that there are disturbances in the function of other cellular pathways capable
154
of influencing the morphology of the mitochondria. Below I describe pathways affected by
changes in the gene expression in the mTDP-43 fibroblasts.
4.3.3.1: Metabolism
4.3.3.1.1: GlycolysisAs mentioned, fibroblasts utilise glucose as their main metabolic substrate in generating ATP
(Guillery et al. 2008; Mortiboys et al. 2008). The gene expression profiling of the mTDP-43
fibroblasts revealed alterations in expression of multiple genes implicated in the glycolytic
pathway (Figure 4.5). There is a 1.75 – fold down-regulation in the expression of a neuronal
glucose transporter, Glut3, whose protein product has previously demonstrated to facilitate
glucose uptake in MEFs (Kawauchi et al. 2008). Thus, it may be postulated that there is a
decrease in the levels of glucose capable of entering the cells.
There is also an alteration in expression of a gene capable of regulating the rate-limiting step of
the conversion of fructose 6-phosphate to fructose 1,6-bisphosphate. Fructose 2,6 bisphosphate
is produced from fructose 6 phosphate by 6-phosphofructo-2-kinase/fructose-2,6-biphosphatase
4 (PFKFB4) as a side product of glycolysis. Fructose 2,6 bisphosphate then acts to positively
regulate the activity of 6-phosphofructo-1-kinase, thus increasing the rate of glycolysis.
Expression of PFKFB4 is decreased 1.5 fold in mTDP-43 fibroblasts, alluding to a decrease in
glycolytic activity. However, PFKFB4 is a bi-functional enzyme, possessing both kinase and
phosphatase activity, and therefore capable of either increasing or decreasing the rate of
glycolysis respectively. It is therefore difficult to establish the effect of its apparent
downregulation in the mTDP-43 fibroblasts, with respect to their metabolic activity.
Further along the glycolytic pathway, Aldolase B (ALDOB) is also down-regulated in
expression (1.5 fold). This liver-type aldolase catalyses the conversion of fructose 1,6
bisphosphate to 2 molecules of glyceraldehyde 3-phosphate. Therefore, any decrease in
expression would be predicted to reduce the functioning of glycolysis. Conversely, a
spermatogenic specific isoform of glyceraldehyde 3-phosphate dehydrogenase (GAPDHS) is
increased is expression 1.6 fold in the mTARDBP fibroblasts, increasing the rate of conversion
of glyceraldehyde 3-phosphate to 1,3-bisphosphoglycerate.
155
Figure 4.5: Alterations in gene expression in the glycolytic pathway
Figure 4.5: PFKFB4, which regulates the enzyme that converts fructose 6-phosphate to fructose 1,6 bisphosphate, is downregulated 1.5 fold, as is the gene encoding the glucose transporter Glut3 (1.75 fold) and the enzyme aldolase B (ALDOB) (1.5 fold), key in the generation of glyceraldehyde 3-phosphate. Conversely, the spermatogenic isoform of glyceraldehyde 3-phosphate dehydrogenase (GAPDHS) was increased in expression (1.6 fold), increasing the production of 1,3 bisphosphoglycerate, possibly as a compensatory mechanism. Reactions highlighted in the red boxes are the rate-limiting steps in glycolysis and the TCA cycle.
4.3.3.1.2: Tricarboxylic Acid CycleGene expression profiling also revealed alterations in the regulation of the TCA cycle, which
occurs in the mitochondrial matrix, prior to oxidative phosphorylation. Pyruvate dehydrogenase
(PDH), which catalyses the conversion of pyruvate to Acetyl CoA, is regulated through
phosphorylation via the activity of both pyruvate dehydrogenase kinase (PDK) and pyruvate
dehydrogenase phosphatase (PDP). PDK1 is downregulated 1.5 fold, and PDPR, the inhibitory
regulating protein of PDP is also decreased 1.7 fold in expression (Figure 4.6). Therefore, in the
presence of mTARDBP there appears to be an upregulation in the activity of pyruvate
dehydrogenase, increasing the amount of Acetyl Co-A available to feed into the TCA cycle.
It may be postulated that this apparent increase in the activity of the TCA cycle acts as a
compensatory mechanism due to the aforementioned decrease in the levels of glycolysis in the
156
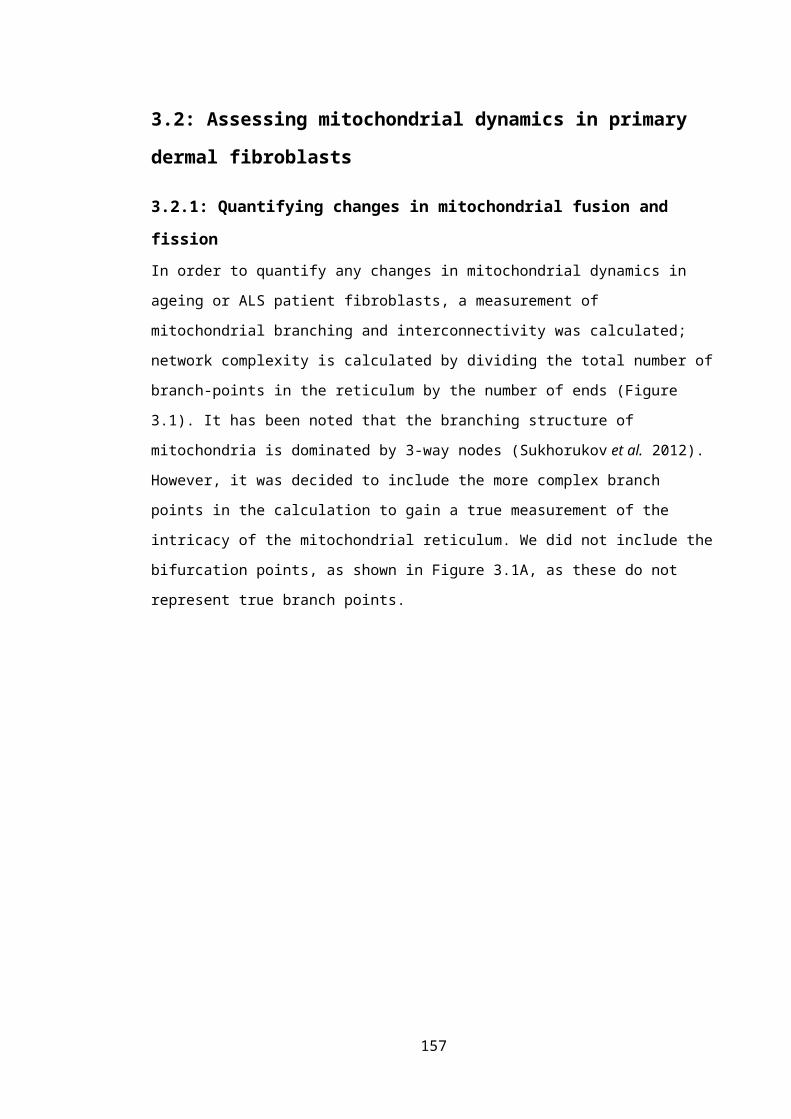
mTARDBP fibroblasts; an increase in the efficiency of the TCA cycle will increase the levels of
NADH feeding into oxidative phosphorylation.
Any potential defect in glycolysis would result in a metabolic stress on the fibroblasts. It is
possible that the mitochondria would adapt to this stress by increasing their interconnectivity
(Koopman et al. 2005). As discussed in Section 3.2.3.2, the fibroblasts expressing mTDP-43
showed a trend towards an increase in mitochondrial network complexity under glucose-
enriched conditions. Moreover, this increase may possibly also be attributed to an increase in
oxidative phosphorylation activity as a compensation for the loss of glycolysis; it is known that
increasing mitochondrial respiration elicits an increase in mitochondrial interconnectivity
(Benard et al. 2007).
Interestingly, study of mSOD1 expression in an NSC-34 motor-neuronal cell line showed that
the previously observed depletion of glutathione in the presence of mSOD1 results from a
reduction in the flow of pyruvate, derived from glucose metabolism, through the TCA cycle
(D'Alessandro et al. 2011). The fibroblasts in our investigation were cultured in the presence of
both sodium pyruvate and L-glutamine. As both are capable of feeding into the TCA cycle, with
glutamine entering as -ketoglutarate, any changes in this metabolic process will impact on the
functioning of the cell. It may be postulated that, in the mTARDBP fibroblasts, the suggestion of
an increase in branching may also reflect the hyper-functioning of the TCA cycle, in contrast to
what is observed in the mSOD1-expressing cells, following the apparent defects in glycolysis.
Figure 4.6: Altered regulation of Pyruvate Dehydrogenase in the mTDP-43 fibroblasts
157
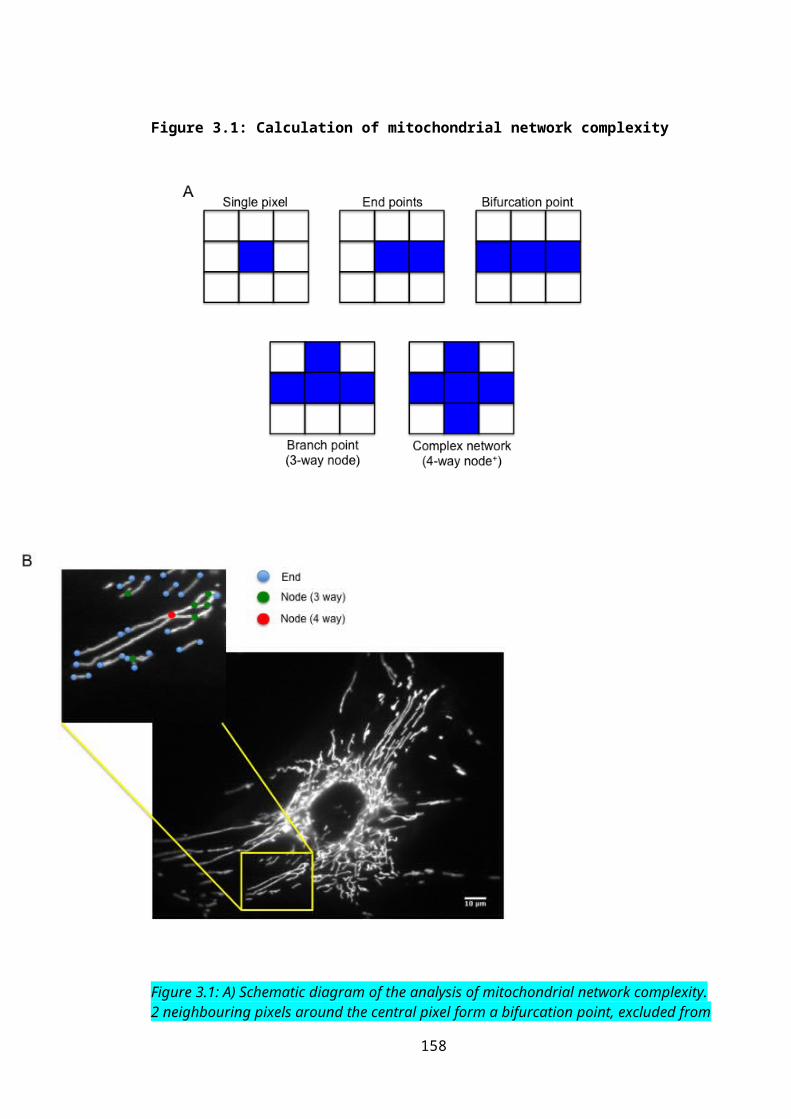
Figure 4.6: Pyruvate dehydrogenase kinase (PDK1) is decreased in expression (1.5 fold), promoting activation of PDH. Additionally, Pyruvate dehydrogenase phosphatase regulatory subunit (PDPR) is decreased in its expression (1.7 fold). As this protein usually inhibits the sensitivity and activity of PDP, its downregulation also promotes the activation of PDH.
4.3.3.1.3: Expression changes of metabolic genes
The expression changes of both PFKFB4 and Glut3 were further investigated using qPCR, to
determine whether genes involved in the glycolytic pathway are effected upon expression of
mTARDBP (Figure 4.7).
Figure 4.7: PFKFB4 and Glut3 expression changes between controls and mTARDBP samples
158

Figure 4.7: A) Relative expression levels of PFKFB4 in control samples vs mTARDBP patient samples; B) Relative expression levels of Glut3 in control samples vs mTARDBP patient samples. Bars represent mean S.E.M. Statistical test: Student’s t-test; NS = Not significant.
Though the expression changes of these two metabolic genes were not significant, it would be
interesting to investigate further the expression changes of genes specifically relating to the
TCA cycle, as this has previously been implicated as defective in ALS (D'Alessandro et al.
2011) and can impact on the efficiency of oxidative phosphorylation.
4.3.3.2: Autophagy
Compromised function of the autophagy pathway has been implicated in the pathogenesis of
neurodegenerative disease, including ALS (Li et al. 2008). The aggregation of 25kDa fragments
of TDP-43 in the cytoplasm is a key pathological feature in mTARDBP-mediated ALS (Arai et
al. 2006). Furthermore, these fragments interact with both p62 and LC3 (Wang et al. 2010;
Brady et al. 2011); thus, it could be postulated that any defects in autophagy are exacerbated by
the sequestration of these key autophagy proteins in aggregates. Moreover, overexpression of
mTDP-43 in a mouse model led to an accumulation of ubiquitinated proteins in both the frontal
cortex and in spinal motor neurons (Xu et al. 2011), suggesting aberrant functioning of
autophagy upon expression of mTARDBP. Moreover, TDP-43 has been shown to regulate the
expression of Atg7, a key enzyme in the conjugation of Atg12 to Atg3 and Atg5; indeed,
depletion of TDP-43 impaired the efficiency of the autophagy pathway (Bose et al. 2011).
Finally, following ligation of an axon of the hypoglossal nerve, mouse brain-stem microsomes
revealed the accumulation of TDP-43 alongside markers of both the ER and autophagosomes.
Interestingly, autophagosome formation was impaired in the ligated nerve, alongside a reduction
in nuclear TDP-43 (Sato et al. 2009).159
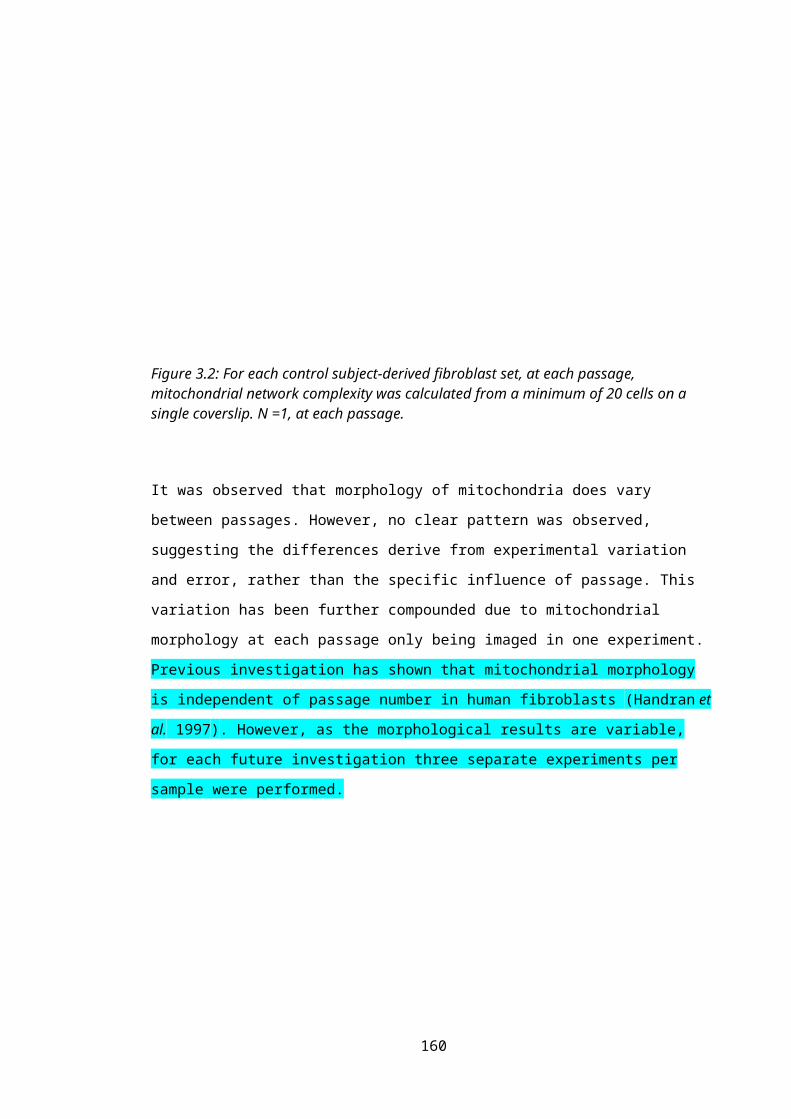
A defect in the autophagic process of degradation in the presence of mTARDBP is also
supported by evidence of alterations in mitochondrial morphology under different nutrient
conditions (Figure 3.17 and 3.19). Upon removal of glucose from the media, mitochondrial
networks showed a trend towards being abnormally increased. Excessive branching of the
mitochondria may be indicative of a failure of autophagy or mitophagy to efficiently remove the
defective mitochondria. Study of tumorigenic lung epithelial cells found excessive
mitochondrial fusion and increased mitochondrial mass alongside decreased LC3-II lipidation
(Thomas et al. 2012; Gomes et al. 2013). Additionally, induced fragmentation of mitochondria
in HeLa cells, following exposure to phenanthroline, increased activation of the autophagy
pathway, reducing mitochondrial mass (Park et al. 2012).
However, it has also been observed that fusion acts to protect mitochondria from
autophagosomal degradation, particularly in the face of amino acid starvation (Gomes et al.
2011; Rambold et al. 2011). Furthermore, the specific induction of mitophagy requires the
initial priming of the mitochondria for the autophagy machinery, a process carried out by
PINK1 and Parkin. Upon damage and subsequent depolarisation of the mitochondria, PINK1
accumulates on the OMM, resulting in the recruitment of Parkin (Kim et al. 2008; Narendra et
al. 2010; Vives-Bauza et al. 2010). Depolarisation inhibits the activity of OPA1, resulting in
fragmentation of the mitochondrial network. Therefore, it would be expected that any decrease
in mitophagic degradation would result in the accumulation of fragmented, dysfunctional
mitochondria. This was noted in Atg5 knockout MEFs, where inhibition of macroautophagy
increased the number of dysfunctional, fragmented mitochondria (Frank et al. 2012).
Thus, although it is appreciated that defects in fusion/fission dynamics can influence the process
of mitophagy, and there is evidence to suggest that loss of fission can reduce mitophagy
activity, the situation requires further investigation. Accordingly, in order to ascertain whether
autophagy is reduced in the presence of mTARDBP, the suggested changes in expression of
genes linked to autophagy were investigated before LC3-II levels were analysed in the
mTARDBP fibroblasts.
4.3.3.2.1: Evidence of disturbed autophagy from microarray analysisIn support of the hypothesis of defective gross autophagy or organelle-specific mitophagy,
microarray analysis of the mTARDBP-expressing fibroblasts revealed a 1.52 fold
downregulation in Atg12 expression and a 1.57 fold decrease in microtubule-associated protein
(MAP1S) expression (Figure 4.8). Both of these proteins have been linked to autophagy
initiation, with the loss of function in either protein inducing mitochondrial dysfunction and
dysmorphology, including increased mitochondrial mass (Radoshevich et al. 2010; Xie et al.
2011).
160

Figure 4.8: Processing of LC3 upon induction of autophagy – Involvement of Atg12 and MAP1S
Figure 4.8: The Atg genes, including Atg12, process LC3 upon the induction of autophagy. MAP1S links both LC3-I and LC3-II to the microtubule network, permitting LC3 conversion and autophagosome degradation.
As part of a complex with Atg5 and Atg16L, Atg12 mediates the conjugation of PE to the C-
terminus of LC3-I, converting it to LC3-II, a process essential for the formation of the
autophagosome. Recent evidence has revealed that Atg12 also conjugates with Atg3. The loss
of this complex formation in MEFs resulted in an expansion in mitochondrial mass alongside
reduced targeting of the mitochondria to the autophagosome (Radoshevich et al. 2010).
Furthermore, targeted damage of the mitochondria in human primary cells resulted in the
upregulation of several autophagy genes, including Atg12. This upregulation impacted on
mitochondrial function, improving m and enhancing ATP production (Mai et al. 2012).
Thus, Atg12, as well as being essential in the induction of autophagy, is also important in the
maintenance of mitochondrial homeostasis.
161

Ablation of MAP1S in mice revealed that this protein product interacts with both LC3-I and
LC3-II, recruiting them to the microtubule (Xie et al. 2011). It has been shown that the
conversion of LC3-I to LC3-II, and thus the initiation of the autophagy pathway, requires
interaction with the microtubule network; depolymerisation of microtubules prevented this
autophagosome formation (Fass et al. 2006; Kochl et al. 2006). Furthermore, the association of
LC3-II with the microtubule network is essential for efficient autophagosome degradation, as
the intracytoplasmic vacuole needs to be trafficked to the lysosome (Xie et al. 2011). Therefore,
MAP1S is involved in both the initiation of the pathway, and the final degradation of the
autophagosome, making this protein influential in the flux of the autophagy pathway.
Furthermore, MAP1S has also been shown to interact with the mitochondria-localised LRPPRC
(leucine-rich pentatricopeptide repeat containing). This protein also interacts with Parkin and
PINK1 and has been suggested as a component of the PINK1/Parkin mitophagy pathway
(Rakovic et al. 2011), linking MAP1S to the regulation of mitophagy as well as autophagy.
Indeed, MAP1S-knockout mice showed an accumulation of defective mitochondria,
characterised by cristolysis and a significant increase in size, highlighting how the activity of
autophagy and mitophagy are critical in maintaining mitochondrial homeostasis (Xie et al.
2011). Further analysis of the microarray data also identified several regulating factors of
autophagy as being altered in the presence of mTARDBP, such as proteins involved in the
calcium regulation, as shall be discussed further below.
162
4.3.3.2.2: Excitotoxicity
Excitotoxicity has been suggested to inhibit autophagy through IP3R activation (Mehrpour et al.
2010). An in vitro study revealed that an IP3R antagonist induced autophagy via the disruption
of a molecular complex formed by the interaction of Beclin-1 and IP3R (Vicencio et al. 2009).
Beclin-1, as a component of the PI3K-complex, plays an essential role in the activation of the
Atg proteins, and the initial nucleation of the isolation membrane. Thus, Beclin-1 tethering at
the ER via IP3R acts to inhibit autophagy activation. Accordingly, autophagy was inhibited by
the overexpression of an IP3R-ligand binding domain, seen to co-immunoprecipitate with
Beclin-1 (Vicencio et al. 2009). This evidence suggests that the activation of IP3R by excessive
calcium influx upon excitotoxicity will inhibit the Beclin-1-mediated initiation of autophagy.
Excitotoxicity is one of the postulated pathogenic mechanisms in ALS (Van Den Bosch et al.
2006), and in these mTDP-43 fibroblasts, the microarray data showed that expression of the
gene encoding a glutamate transporter, SLC1A1, is decreased 2.3 fold. This potential for an
increased influx of calcium into the cell may partly recapitulate the excitotoxic state seen in the
ALS motor neurons.
4.3.3.2.3: Expression changes of genes involved in the autophagy pathway
Expression changes of MAP1S and Atg12 in the mTARDBP fibroblasts were validated using
RT-qPCR (Figure 4.9).
Figure 4.9: MAP1S and Atg12 expression changes between control and mTARDBP samples
Figure 4.9: A) Relative expression levels of MAP1S in control samples vs mTARDBP patient samples; B) Relative expression levels of Atg12 in control samples vs mTARDBP patient samples. Bars represent mean S.E.M. Statistical test: Student’s t-test. Where values differ significantly: * p 0.05.
163
As both genes were downregulated about 30% in the pooled mTARDBP patients compared to
the pooled control samples, it can be postulated that autophagic activity is decreased in the
patient samples. To investigate this further, LC3 protein expression levels were quantified in
mTDP-43 fibroblasts and compared to control levels.
4.3.4: Western blotting for LC3-I and LC3-II
4.3.4.1: TDP-43
LC3 protein levels, assessed by western blotting, can be used to quantify autophagy. As
discussed, LC3 is initially synthesised as pro-LC3, before being proteolytically processed by
Atg4 to form cytoplasmic LC3-I. Upon the induction of autophagy, the exposed glycine at the
C-terminal of LC3-I is conjugated to the polar head of PE, mediated by the Atg12-Atg5:Atg16L
complex, Atg7 and Atg3, to form LC3-II (See figure 4.10) (Hanada et al. 2007; Fujita et al.
2008; Mehrpour et al. 2010). The Beclin-1 complex subsequently recruits the lipidated LC3-II
to the forming isolation membrane to aid its elongation (Kabeya et al. 2000; Mizushima et al.
2003; Mehrpour et al. 2010).
Thus, LC3-II is capable of acting as a protein marker reliably associated with both the
developing and completed autophagosome, and therefore act as a read-out of overall autophagy
activity (Klionsky et al. 2012). However, this methodology cannot provide information
concerning the flux through the autophagy pathway; this would require the arrest of the pathway
at a chosen point and the recording of the time-dependent accumulation of the protein marker at
the point of the blockage (Klionsky et al. 2012).
To date, LC3-II is the only well characterizedprotein that is specifically localized to autophagic structures throughout theprocess from phagophore to lysosomal degradation [16].
Based on the importance of LC3 processing for autophagosome formation and function,antibodies to LC3-I and LC3-II are widely used in western blotting techniques to monitorautophagy [12,13,18].
In light of this, Bafilomycin A1 can be used to ascertain whether any changes in autophagy
activity derive from the prevention of autophagosome formation or the failure of the structure to
recycle. Bafilomycin A1 is a specific inhibitor of the vacuolar type H+ ATPase, which acts to
maintain the lysosomal pH. Thus, application of the drug prevents the fusion of the
164
autophagosome with the lysosome, thereby allowing the investigation of LC3-II processing in
the presence or absence of degradation at the lysosome.
FURTHER INCREASED LC3-2 IN BAF….INDICATES INCREASED FORMATION OF
AUTOPHAGOSOME, NO CHANGE IN BAF….PROBLEM WITH DEGRADATION
The LC3 protein expression levels were quantified in the three mTARDBP patient fibroblasts
alongside control samples, either under untreated or Bafilomycin A1-treated conditions (Figure
4.10).
Figure 4.10: LC3 western blotting in mTARDBP patient fibroblasts
165
Figure 4.10: Western blots of LC3 expression in A) Control and A321V mTDP-43 patient fibroblasts; B) Control and M337V mTDP-43 patient fibroblasts; C) Control and G287S mTDP-43 patient fibroblasts; Blots depict staining with -Tubulin or LC3. Cells were either untreated or treated with 100nM Bafilomycin A1.
Results were expressed as LC3-II normalised to -tubulin protein expression, in both untreated
cells and fibroblasts treated with 100nM Bafilomycin A1 for two hours prior to collection
(Figure 4.10). It was decided not to express LC3-II as a ratio of LC3-I expression, as typically
presented, as LC3-I has been noted to be more labile than LC3-II, and less sensitive to detection
(Klionsky et al. 2012). Thus, it was considered more appropriate to focus on LC3-II levels only
as an indicator of autophagy activity in the fibroblasts.
Figure 4.11: LC3-II levels in mTARDBP patient fibroblasts
166
Figure 4.11: For all samples: N=3. A) A321V mTDP-43 vs control; B) M337V mTDP-43 vs control; C) G287S mTDP-43 vs control; D) combined mTARDBP patients vs controls. LC3-II levels were normalised to -tubulin. Cells were either untreated, or treated with 100nM Bafilomycin A1 for two hours. Bars represent mean S.E.M. Statistical test: One-way ANOVA with Bonferroni post-test correction.
167

Reflecting the variation in gene expression seen with the quantitative RT-PCR analysis, the LC3
western blotting results also revealed differences between the three patients. Expression of the
A321V mutation in TDP-43 appeared to have little effect on the levels of LC3-II either under
untreated conditions or upon treatment with 100nM Bafilomycin A1 (Figure 4.11A). This was
unexpected as RT q-PCR revealed that the expression of both Atg12 and MAP1S were
decreased around 40% in this patient. It was therefore predicted that the conversion of LC3-I to
LC3-II would be defective, explaining the increased interconnectivity of the mitochondrial
network observed in FibPat48 when compared to control samples. However, as western blotting
only provides information concerning the levels of LC3-II present at one particular time-point,
and does not give an indication regarding the flux of the autophagy pathway, it may be that
further investigation using GFP-tagged LC3-II will permit a more detailed analysis as to the
impact A321V mTDP-43 has on the autophagy pathway. Stimulation of the pathway may also
be necessary, through the treatment of the fibroblasts with Rapamycin, an inhibitor of mTOR.
Forcing activation of the autophagy pathway may well reveal any defects potentially resulting
from the observed reduction in expression of both Atg12 and MAP1S.
Conversely, the cells expressing M337V mTDP-43 displayed a (non-significant) subtle increase
in LC3-II ratio under basal conditions (Figure 4.11B). This could indicate either an increase in
the formation of autophagosomes, and hence an increase in the induction of autophagy, or a
failure of the autophagosomes to be efficiently recycled. However, following treatment with
Bafilomycin A1, no difference in the ratio of LC3-II was seen compared to the control sample,
suggesting that there is not an increase in the initation of autophagic activity.
Thus, it may be that, in the presence of M337V mTDP-43, there is a slight defect in the
degradation of the autophagosome at the lysosome. It is likely over time that any defect in
autophagosome recycling will result in the downregulation of autophagy activity, due to a
decrease in the necessary starting materials (Xie et al. 2011). This assumption appears to be
reflected in the RT-qPCR results quantifying both MAP1S and Atg12, which FibPat51 about
30% and 50% respectively compared to the mean control value. In particular, a deficiency in
MAP1S has been linked to a defect in autophagosome degradation, due to the disturbance in the
interaction of the autophagosome with the microtubule network (Xie et al. 2011). Furthermore,
as seen in Figure 3.17 in Chapter 3, the mitochondria exhibited an increase in their branching
and networking compared to control samples; this increase in network complexity was
seemingly unrelated to any defects in oxidative phosphorylation (Figure 3.19). An abnormal
increase in the interconnectivity of the mitochondria can be indicative of a substantial failure of
autophagy to clear the defective mitochondrial from the cell, allowing their fusion back into the
network (Thomas et al. 2012; Gomes et al. 2013).
168
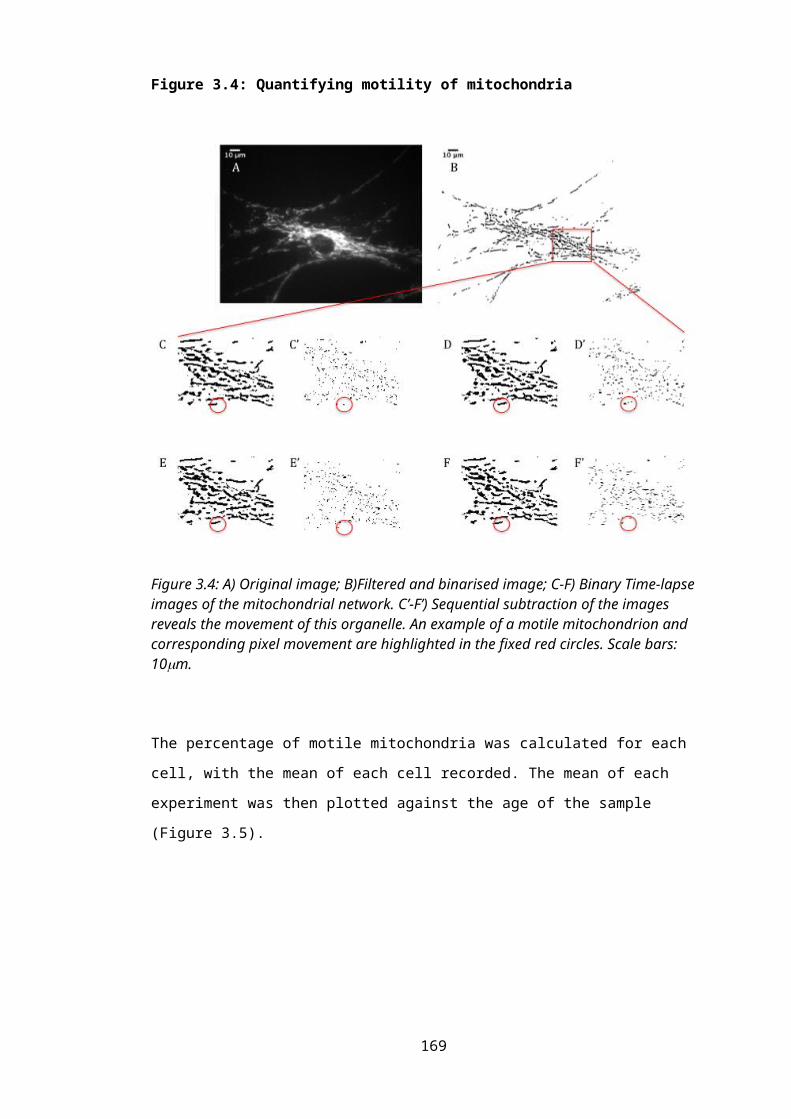
This hypothesis of the apparent failure of the M337V mTDP-43-expressing cells to efficiently
degrade the autophagosome is not unexpected following mutation of TDP-43. It has been
recently demonstrated that TDP-43 directly interacts with HDAC6 mRNA in vitro, and that the
silencing of TDP-43, mediated by RNAi, results in the reduced expression of HDAC6 mRNA
(Kim et al. 2010). Thus, any defects in the functioning of TDP-43 may directly impact on the
metabolism, and therefore expression, of HDAC6 mRNA. As later discussed in Chapter 5,
HDAC6 has a key role in the process of autophagy; it is responsible for the recruitment of the
actin-remodelling machinery, which subsequently assembles the F-actin network, enabling the
fusion of the autophagosome with the lysosome (Lee et al. 2010). Consequently, upon HDAC6
deficiency, failure of autophagosome maturation is observed, leading to the build-up of toxic
protein aggregates, a key pathogenic feature of neurodegenerative disease, including ALS.
Furthermore, HDAC6 has also been shown to be instrumental in the process of Parkin-mediated
mitophagy. Following Parkin-mediated ubiquitination of the defective mitochondria, HDAC6 is
recruited, alongside P62, to assemble the autophagy machinery required to clear the impaired
organelles. Following knockout of HDAC6 in MEFs, a significant failure to clear CCCP-treated
mitochondria was observed. The perinuclear mitochondrial aggregates typically formed during
the process of mitophagy were also noticeably absent, suggesting that HDAC6 is necessary for
both the transport and degradation of mitochondria in mitophagy (Lee et al. 2010). This
essential role of HDAC6 in mitophagy and the known role of TDP-43 in the regulation of
HDAC6 mRNA may serve to explain the significant change in mitochondrial morphology in the
presence of M337V mTDP-43 (Figure 3.17).
Finally, the patient expressing the mutation G287S in TDP-43 showed a non-significant
decrease in the amount of LC3-II under basal, untreated conditions, compared to control levels.
Furthermore, though the results were variable, and therefore non-significant, a slight increase in
LC3-II levels was also observed following treatment in Bafilomycin A1. This may be indicative
of a high rate of LC3-II processing in these mutant fibroblasts, suggestive of an increased rate of
autophagy.
However, further investigation will be required to confirm this hypothesis, such as measuring
autophagic flux using GFP-tagged LC3-II. Furthermore, though it has been demonstrated that,
upon increased levels of autophagic activity (Rambold et al. 2011), mitochondria become fused
as a protective mechanism, FibPat55, expressing G287S mTDP-43, did not show increased
fusion in glucose-enriched media (Figure 3.17). Excessive fusion was seen when cultured in
respiration-dependent media. However, this suggests a defect in the process of oxidative
phosphorylation rather than autophagy.
In light of variation between the mTARDBP patients, when the results were combined, no
difference was observed in LC3-II levels upon treatment or under basal conditions. Moreover,
169

the observation of only subtle differences between individual patients and control samples
suggests that the trend towards increased mitochondrial fusion seen in the mTARDBP patient
fibroblasts is possibly independent of any changes in autophagy and may still be attributed to a
protective mechanism in the face of increased cellular stress, such as ETC deficiency or defects
in calcium homeostasis. The latter of these cellular stresses will be further investigated later in
this chapter.
4.3.4.2: C9ORF72
At the time of these experiments, it was discovered that the patient expressing the novel A321V
mutation in TDP-43 also possessed a hexanucleotide repeat expansion of predicted pathogenic
length in the non-coding region of C9ORF72. Since A321V is a unique mutation that has not
been reported by other groups, it is unclear whether the amino acid change in TDP-43 would be
pathogenic; prediction software that carries out bioinformatic analyses to determine the effects
of the mutation on the structure and function on the protein produced conflicting results as to
whether the change manifest in disease (Kirby et al. 2010). However, as this patient is a familial
case, we are currently waiting to see if anyone else develops ALS; if so, we hope to ascertain
whether either the A321V mutation or the C9ORF72 expansion co-segregates with the disease.
Despite these complications, and the western blotting experiments using FibPat48, possessing
both the A321V mutation in TDP-43 and the pathogenic expansion in C9ORF72 not indicating
any defects, we still felt it worthwhile to investigate the influence mC9ORF72 on the autophagy
pathway.
Quantitative RT PCR analysis revealed there is a 40% decrease in Atg12 and MAP1S, two genes
both involved in the process of autophagy. Furthermore, several lines of evidence link
dysfunction of C9ORF72 to the deregulation of autophagy; pathological study of the C9ORF72
expansion cases revealed a significant increase in extra-motor, neuronal cytoplasmic inclusions.
These inclusions stained positive for p62 and OPTN, two proteins with key roles in the process
of autophagy (Al-Sarraj et al. 2011; Cooper-Knock et al. 2012).
Additionally, it has recently been noted that C9ORF72 interacts with the autophagy protein,
FIP200 (discussed further in section 4.5) (Behrends et al. 2010). As part of a complex with
Atg12 and ULK, FIP200 translocates to the pre-autophagosomal membrane, where it mediates
the nucleation of the isolation membrane and the activation of several Atg proteins (Jung et al.
2009). Furthermore, neural-specific deletion of FIP200 in mice resulted in axonal degeneration,
progressive neuronal loss and subsequent degeneration of the cerebellum, highlighting the
importance of autophagy activity in neuronal maintenance (Liang et al. 2010). In light of this,
we decided to quantify LC3 protein expression levels in other patients possessing the
170
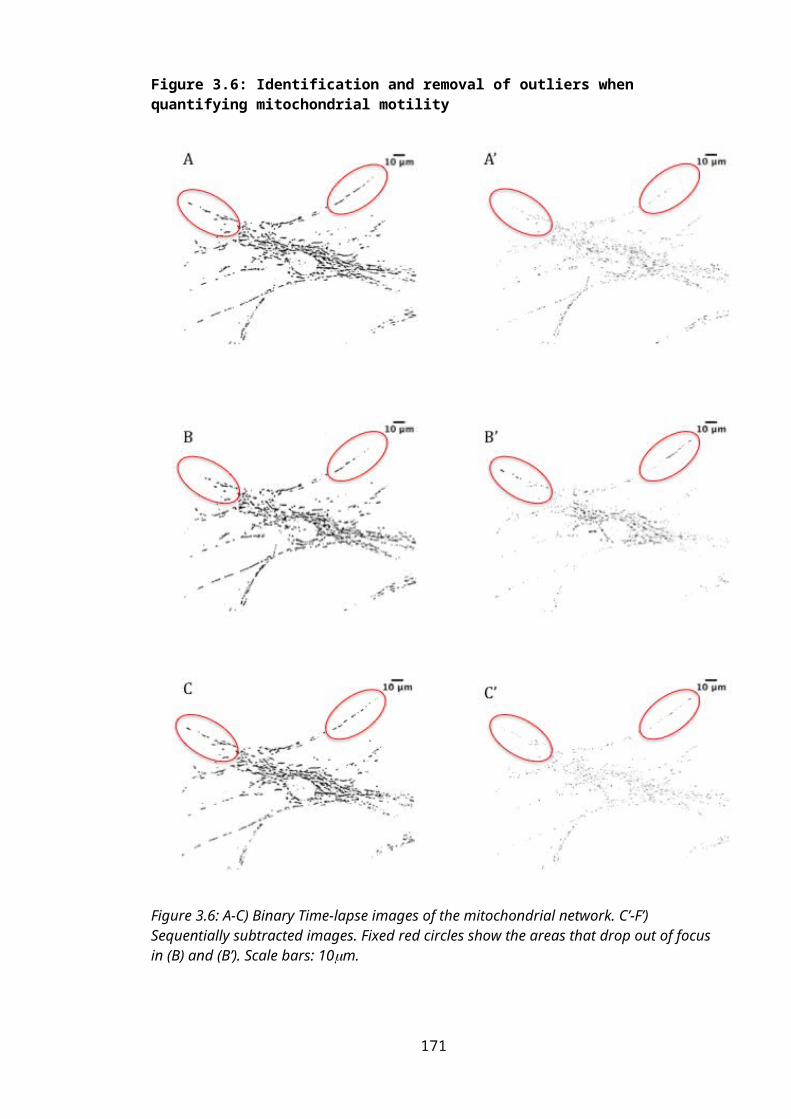
pathogenic expansion in C9ORF72 (Figure 4.12 and 4.13); the same experimental set-up was
used as with the mTARDBP fibroblasts.
171
Figure 4.12: LC3 blotting in an ALS patient fibroblast expressing the C9ORF72 pathogenic expansion
172
Figure 4.12: Western blots of LC3 expression C9ORF72-expansion patient fibroblasts. Blots depict staining with -Tubulin or LC3. Cells were either untreated or treated with 100nM Bafilomycin A1. Figure A) Protein samples loaded on same gel and immunoblotted on same membrane, but not loaded in lane order depicted in figure.
Figure 4.13: LC3–II levels in C9ORF72 expansion patient fibroblasts
173
Figure 4.13: For all samples: N=3 or 4. A) A321V mTDP-43 + C9ORF72 pathogenic expansion vs control; B) C9ORF72 expansion FibPat72 vs control; C) C9ORF72 expansion FibPat53 vs control; D) Combined C9ORF72 pathogenic expansion patients vs controls. LC3-II levels were normalised to -tubulin. Cells were either untreated, or treated with 100nM Bafilomycin A1 for two hours. Bars represent mean S.E.M. Statistical test: One-way ANOVA with Bonferroni post-test correction.
Interestingly, in this set of experiments, FibPat48 patient, expressing both the mutation in
TARDBP and the pathogenic expansion in C9ORF72, showed a decrease in LC3-II ratio
expression under untreated conditions (Figure 4.13A). However, the changes did not reach
significance, due to variability. Similar results were observed in FibPat53, with a (non-
significant) reduction in the level of LC3-II in the untreated cells (Figure 4.13B). However, in
both patient samples, there was no change in LC3-II levels compared to control samples when
the cells were treated with Bafilomycin A1. It may be hypothesised that these fibroblasts have
an increased rate of autophagy, resulting in an increase in the turnover of LC3-II. Although it
has not been definitively established whether the pathogenic inclusions noted in neurons in
C9ORF72-patients are also present in patient fibroblasts, preliminary evidence by Renton et al
indicates a cytoplasmic accumulation of C9ORF72, alongside a reduction of the protein in the
nucleus (Renton et al. 2011). It is therefore possible that the upregulation in autophagy, hinted
at by the western blotting investigation, may be in order to combat the dysfunctional protein
accumulation in the cytoplasm. This observation may explain the trend towards increased
mitochondrial interconnectivity noted in FibPat48 (Figure 3.17).
Conversely, expression of the C9ORF72 pathogenic expansion in FibPat72 hinted at a reduction
in the levels of LC3-II compared to control samples under both untreated and treated conditions.
Similar results were observed under basal conditions when the three patients were pooled
(Figure 4.13D). There may be a trend towards a decrease in the conversion of LC3-I to LC3-II,
indicative of a decrease in the induction of autophagy. The aforementioned interaction between
C9ORF72 and FIP200 permits the hypothesis that the initiation of autophagy is disrupted due to
defects in the formation of the FIP200:Ulk:Atg12 complex.
However, though no statistical significance was observed, levels of autophagic activity were
variable between the patients. As discussed, the variation observed may arise from the
differences in disease penetrance seen with mC9ORF72. Additionally, the technique of western
blotting provides inherent variability, making it difficult to ascertain statistical significance.
Induction of the autophagy pathway through the use of rapamycin may help to reduce the
variability; any defect at baseline could prevent induction of LC3-II conversion, enhancing the
differences between the control and patient samples. The specific blocking of different points of
the autophagy process could then be utilised to be able to conclusively ascertain the location of
174
this defect along the pathway. Furthermore, perhaps a more refined technique, such as the live
imaging of LC3-II flux through the pathway, combined with the forced induction of the
autophagy pathway using Rapamycin, would provide further clarity regarding the role of
autophagy in ALS.
HDAC6
promotes autophagy by recruiting a cortactin-dependent,
actin-remodelling machinery, which in turn assembles an
F-actin network that stimulates autophagosome–lysosome
fusion and substrate degradation.
Basal, non starvation induced.
Our data indicate that F-actin polymerization assists autophagosome–lysosome fusion
CORTACTIN (a key component of the F-actin polymerizationMachinery) = SUBSTRATE OF HDAC6.
ubiquitin-dependent, actin-remodelling machinery promotesQC autophagy by stimulating the fusion of autophagosomesand lysosomes,
175
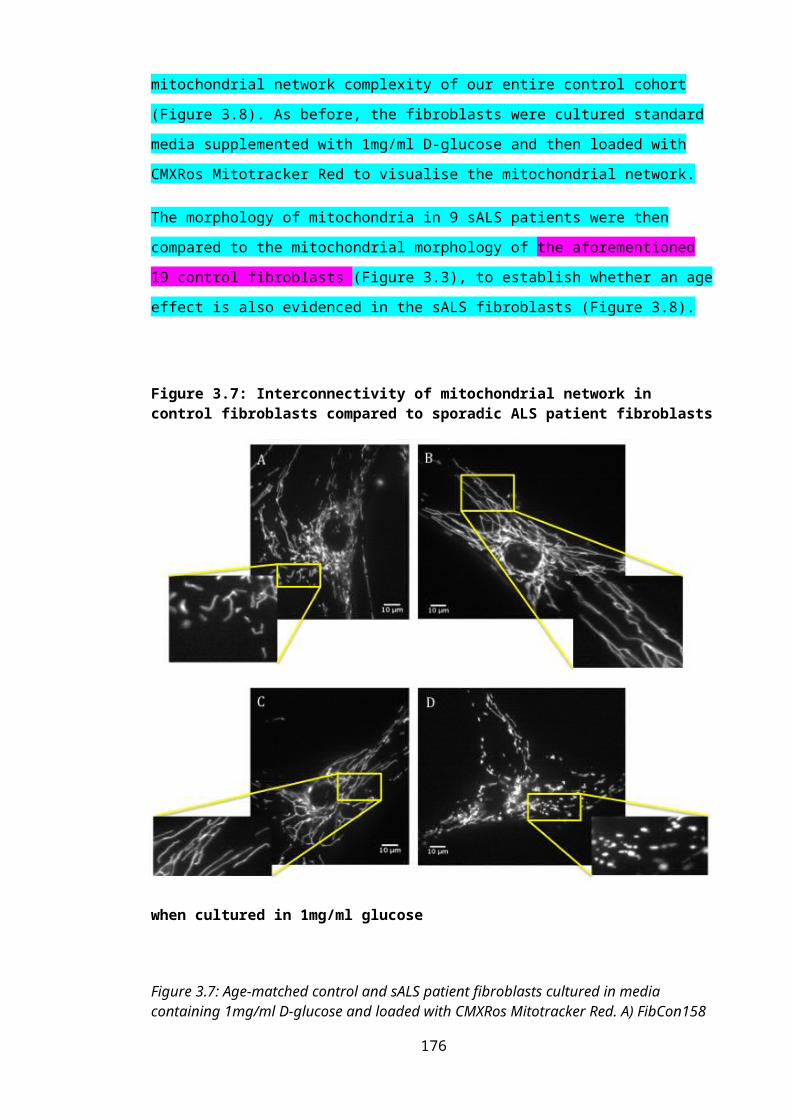
4.4: Quantification of MAMs in the mTARDBP fibroblastsIt is estimated that 12% of the mitochondrial network forms associations with the peripheral
tubular ER, at sites termed the “mitochondria associated membrane” or “MAM” (Csordas et al.
2006; Hayashi et al. 2009). Several proteins mediate this linkage of the two organelles,
including Mfn2, IP3R, VDAC, PTPIP51 and VAPB. The bidirectional communication between
the ER and mitochondria permits the maintenance of several cellular functions, including
calcium homeostasis and the regulation of apoptosis (Hayashi et al. 2009; de Brito et al. 2010).
4.4.1: Evidence from microarray analysis
The aforementioned microarray analysis revealed changes in the expression level of several
genes related to the maintenance of calcium homeostasis in the cells. For example, ORAI2 and
ORAI3 were both downregulated 1.5 fold in the mTDP-43 patients. These genes encode proteins
that are essential in controlling the flux of extracellular calcium across the plasma membrane.
Upon depletion of calcium in the ER stores, the sensor proteins, STIMs, relocate close to the
plasma membrane and form puncta with the Orai proteins. Following this oligomerisation, the
Orai proteins form the pore of an ion channel in the plasma membrane, permitting the influx of
extracellular calcium upon depletion of calcium from the ER (Prakriya et al. 2006; Contreras et
al. 2010).
As key components underlying this store-operated calcium entry (SOCE), it is highly likely that
expression changes in both ORAI2 and ORAI3 will influence the regulation of intracellular
calcium concentration, which could impact on mitochondrial function. Furthermore, CALM3,
encoding Calmodulin 3, was also shown to be downregulated 1.67 fold in the patient fibroblasts
compared to control samples. As this protein regulates multiple calcium-modulated enzymes
(Contreras et al. 2010), any potential changes in gene expression would indicate both a
disruption in calcium homeostasis and a defect in the efficiency of the cellular response to
calcium signalling.
Furthermore, alterations in ER functioning and UPR are implicated as a pathogenic mechanism
in ALS, and have recently been noted in the presence of mTDP-43. Expression of mTDP-43 in
a C.elegans model led to an increase in the expression of BiP, indicative of UPR induction
(Vaccaro et al. 2012). Additionally, electron microscopic analysis of sALS patient motor
neurons found an increase in the amount of rough ER-localised TDP-43, correlating with the
clearance of TDP-43 from the nucleus (Sasaki 2010). Finally, the induction of ER stress in
cultured neuronal cells increased the aggregation of ALS-linked C-terminal fragments of TDP-
176

43 (Suzuki et al. 2011). It therefore appears that expression of mTARDBP can manifest in ER
dysfunction, which will in turn impact on the functioning of the mitochondria.
Interestingly, microarray analysis showed 1.55-fold downregulation of Erlin2, encoding a
protein that aids in the regulation of IP3R degradation. As mentioned, these IP3Rs form a
component of the MAM (Csordas et al. 2006); thus, it can be postulated that an expression
change in Erlin2 would impact on the morphological structure of the MAMs. Furthermore, the
expression changes of two Atlastin genes, ATL1 and ATL3, are altered in the mTARDBP patient
fibroblasts; downregulated 1.95 fold and upregulated 1.93 fold respectively. Atlastins are
involved in the maintenance of ER tubular network biogenesis and morphology (Orso et al.
2009); it is therefore likely that any changes in these proteins will influence MAM formation.
Finally, alterations in MAM regulation have been directly implicated in the pathogenesis of
ALS; disease-associated mutations in VAPB result in an increase in the binding of this protein
to PTPIP51. Subsequently, homeostasis at the MAM is disrupted. Expression of disease-
associated VAPBP56S was seen to increase both cytosolic and mitochondrial calcium
concentration (De Vos et al. 2012; Morotz et al. 2012). Furthermore, an aberrant association has
been demonstrated between mSOD1 and VDAC on spinal cord mitochondria; this interaction
correlated with an inhibition of VDAC1 conductance (Israelson et al. 2010). As VDAC forms a
component of the MAM, it may be postulated that the formation of this ER-mitochondria
interaction is disrupted in SOD1-mediated ALS.
4.4.2: Colocalisation of ER and mitochondria in mTARDBP fibroblasts
In light of this evidence, it was hypothesised that the formation or maintenance of MAMs is
disrupted in the mTARDBP patient fibroblasts. We therefore looked for evidence of defective
MAMs in the mTARDBP patient fibroblasts; dual immunostaining was carried out to visualise
colocalisation of mitochondria and the ER (Figure 4.14).
177
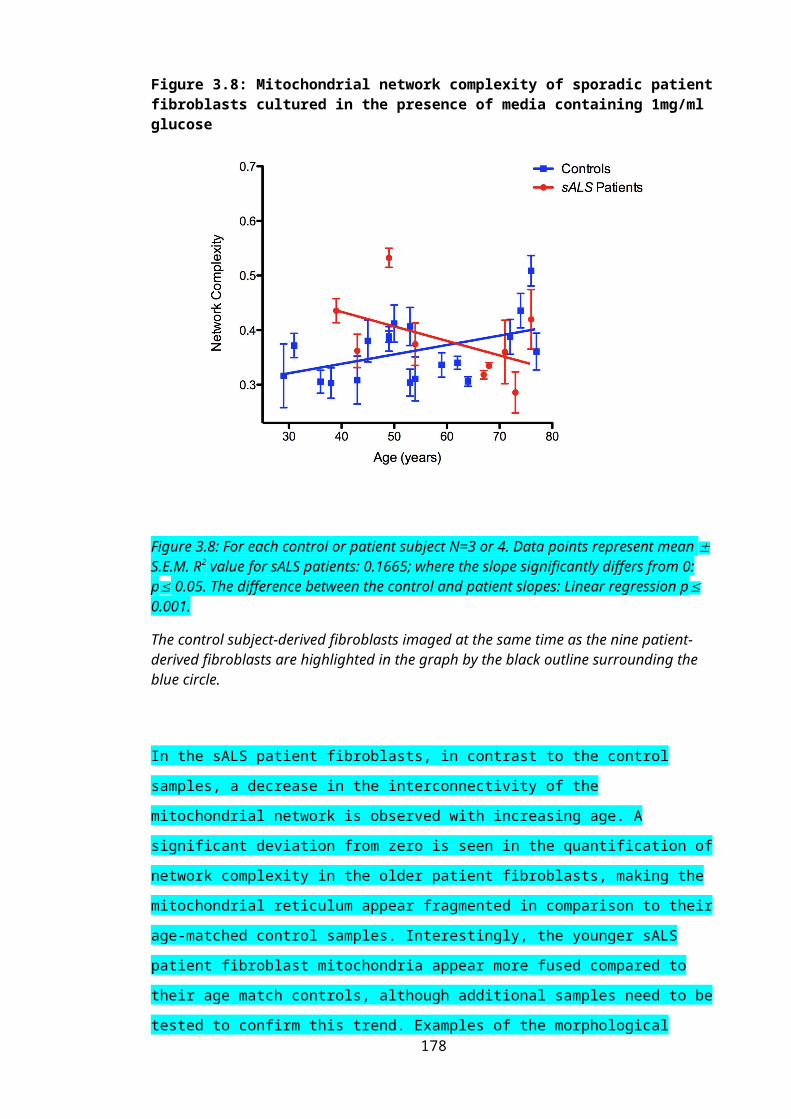
Figure 4.14: Dual immunostaining of the primary fibroblast cells
Figure 4.14: A) Control fibroblasts immunostained to visualise the nuclei (hoechst), mitochondria (Tom20) and the ER (calreticulin); B) M337V mTDP-43 patient fibroblast cells immunostained to visualise the nuclei, mitochondria and the ER. Merged images are seen in the bottom right of both panels.
Co-variation of ER and mitochondrial antibodies were analysed by Intensity correlation quotient
(ICQ) analysis, as described in section 2.3.6.1. In all patient and control samples, mean ICQ
values from each experiment significantly differed from zero in a positive direction, indicating
that there is significant segregation of the immunostaining of the ER and mitochondria; thus,
there is an interaction of the two organelles in cultured fibroblasts (Table 4.8).
Table 4.8: Assessment of co-variation of ER and mitochondria immunostaining in primary dermal fibroblasts
Fibroblast ID Mean ICQ value Significantly different from zero
P value
FibCon11 0.0618 Yes 0.0234FibCon13 0.0618 Yes 0.0145FibCon14 0.0559 Yes 0.0018FibPat48 0.0624 Yes 0.0112FibPat51 0.0762 Yes 0.0056FibPat55 0.0671 Yes 0.0294
For each sample N=3. Statistical test used: One sample, two-tailed t-test against theoretical mean of zero; P value significant if 0.05.
178
In order to compare co-variance of the ER and mitochondria between control and patient
samples and to ascertain whether expression of mTARDBP alters this relationship between ER
and mitochondria, ICQ values were normalised to the highest control value in that experiment,
and expressed as a percentage (Figure 4.15).
Figure 4.15: Quantification of mitochondria and ER colocalisation in mTARDBP-expressing fibroblasts
Figure 4.15: A) Percentage ICQ quantified in A321V mTDP-43 patient vs FibCon14; B) Percentage ICQ quantified in M337V mTDP-43 patient vs FibCon11; C) Percentage ICQ quantified in G287S mTDP-43 patient vs FibCon13; D) Percentage ICQ quantified in pooled mTDP-43 patients vs control samples. ICQ values expressed as a percentage of the maximum control value. Bars represent mean S.E.M. Statistical test: Student’s t-test; NS = Not significant.
179

Using a Student’s t-test, no significant difference was observed between any of the mTARDBP
patients when compared to control ICQ values. Nonetheless, generally a slight increase in co-
localisation was seen in the patient samples, suggesting a leaning towards a closer relationship
between the ER and mitochondria in the presence of mTDP-43. This increase was most
pronounced in the patient expressing M337V mTDP-43. It is possible that this trend of
increased co-localisation of the ER and mitochondria has arisen as a consequence of the
observed (non-significant) increase in mitochondrial network complexity in the mTARDBP
fibroblasts, providing a larger surface area for any potential interactions of the two organelles.
180
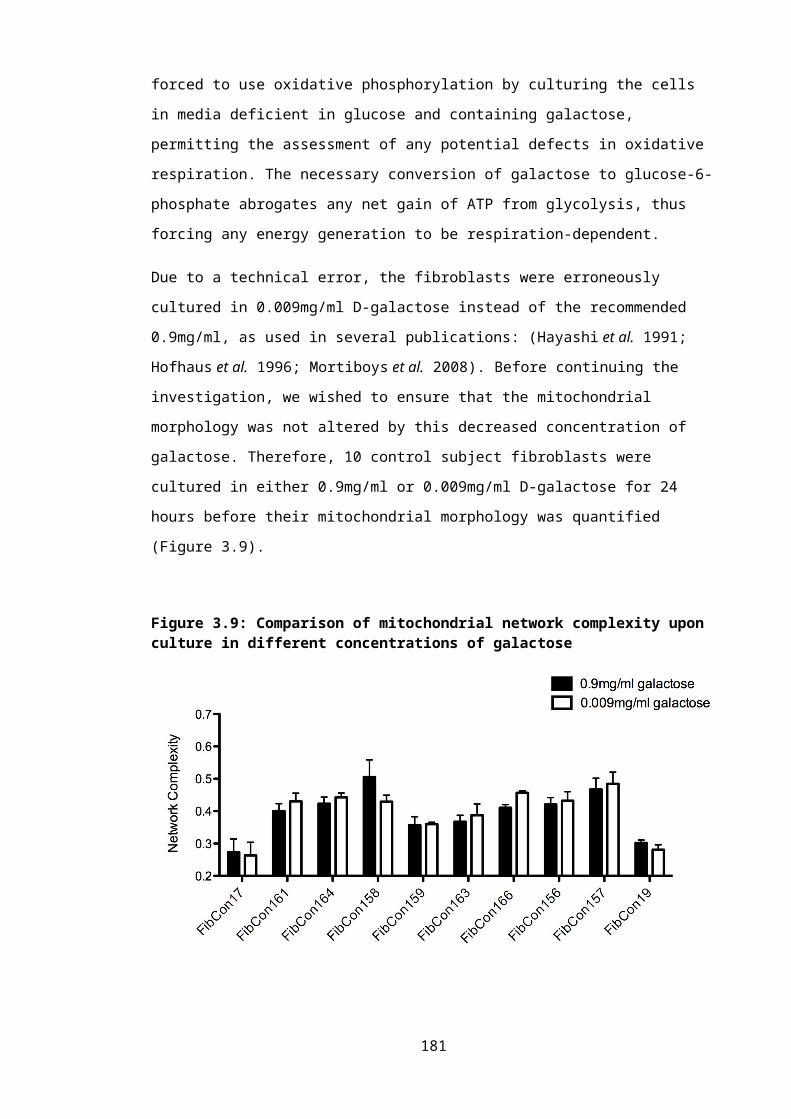
4.5: ConclusionFollowing on from the identification of increased fusion of the mitochondrial network in the
mTARDBP fibroblasts compared to control samples, we wished to investigate any functional
defects that may be present in these patient cells. Four aspects of mitochondrial or cellular
function were examined, comparing control fibroblasts with those expressing mTARDBP:
ATP levels, following metabolic changes, using different culture conditions to quantify
ATP output from the processes of glycolysis or oxidative phosphorylation.
Gene expression changes
Autophagy activity under basal conditions
Association between mitochondria and ER
Firstly, we examined the bioenergetic status of the fibroblasts by measuring their ATP levels
when the cells were cultured in either glucose-enriched or glucose-deprived conditions. No
significant difference was observed between patient and control samples in this assay. The
absence of any defect in ATP production suggests that mitochondrial ATP production by
mTARDBP fibroblasts is normal. However, it is possible that the severe mitochondrial
dysfunction previously reported in the presence of mTDP-43 is specific to the neurons (Shan et
al. 2010; Xu et al. 2010). This would not be unexpected, as TDP-43 has been shown to regulate
the RNA metabolism of multiple genes essential to neuronal function, such as SMN and NF
(Strong et al. 2007; Bose et al. 2008).
Nevertheless, subtle alterations that may impact on mitochondria were noted when gene
expression changes were investigated in the mTARDBP fibroblasts compared to control cells.
Following this analysis, changes were implicated in several pathways, including metabolism,
calcium homeostasis and autophagy. However, these three processes are intricately related,
making it difficult to ascertain which, if any, of these changes is a primary mechanism in this
cellular model of ALS, and which may be responsible for mediating the noted alterations in
mitochondrial morphology. Interestingly, all of these cellular processes have been highlighted
as defective in the pathophysiology of ALS, confirming patient primary fibroblasts as a useful
tool in the study of neurodegenerative disease.
However, as will be later discussed, there are issues arising from the use of patient samples.
Briefly, the genetic heterogeneity means results are variable between patients, raising questions
concerning the advantage of pooling patient data. The finding that FibPat48 expressed both an
A321V TDP-43 mutation and the pathogenic expansion in C9ORF72 highlighted this issue.
As the function of C9ORF72 remains unknown, it is currently unclear whether the degeneration
of neurons arises as a consequence of the dysfunctional protein product, or is due to toxicity
181

arising from the generation of toxic RNA species, or a combination of these factors. However,
preliminary evidence has noted that the protein product of C9ORF72 interacts with FIP200,
which, as one of its multiple roles in the cell, aids in the initiation of autophagy (Behrends et al.
2010; Liang et al. 2010). A proteomic study of the autophagy system was carried out to enable a
better understanding of the global architecture of the autophagy network (Behrends et al. 2010).
For the study of FIP200, the protein was retrovirally expressed as a Flag-HA fusion protein in
an HEK 293T cell line. Proteins found in the resulting anti-HA immune complexes were then
identified using mass spectrometry (Behrends et al. 2010). Identification of C9ORF72 as
potentially interacting with FIP200 was listed on the Falcon database, the Harper lab
proteomics, genetics and informatics server, as supplementary data.
In both the mTDP-43 and mC9ORF72-expressing fibroblasts there is a suggestion of a
disruption of the autophagy pathway. However, due to variability any significance in the
changes could not be established. Nevertheless, using the data in Figures 4.12 and 4.14, it would
be possible to conduct post hoc power calculations to determine appropriate group sizes in order
to try and obtain a significant result. Unfortunately, as patient samples are limiting, the time
course for obtaining the necessary additional skin biopsies might be quite prolonged.
As discussed, alterations in both autophagy and mitophagy have been noted in numerous
neurodegenerative disorders, including PD. Interestingly, in mParkin-expressing fibroblasts, an
increase in the branching of the mitochondria was observed (Mortiboys et al. 2008), reflecting
the suggested increase in interconnectivity noted in the mTARDBP fibroblasts.
Finally, using ICQ analysis, a significant interaction was observed between ER and
mitochondria, suggestive of the presence of MAMs in dermal fibroblasts. However, this
association was not altered in the presence of mTARDBP, though, as previously discussed, this
investigation may benefit from technical refinement.
182
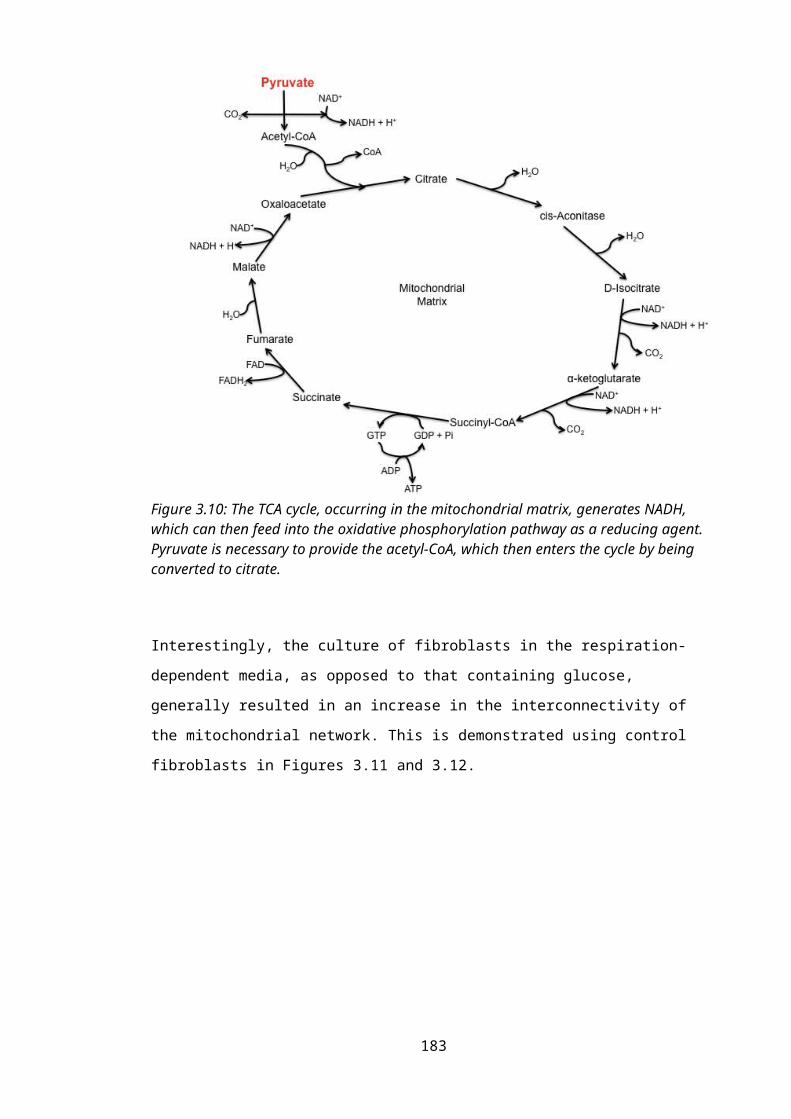
Chapter 5 - Axonal transport in an HSP SPG4 mouse model
5.1: Introduction
5.1.1: Axonal transport
Motor neurons are highly polarised cells; the cell body, the primary site of metabolism and
protein synthesis, must supply new proteins, functioning organelles, and metabolites to the long
axonal and dendritic processes (De Vos et al. 2008). Furthermore, it is imperative for the cell
body to be able to effectively communicate with the cell periphery (Chevalier-Larsen et al.
2006). However, axonal processes can stretch for over a metre throughout the body. Thus,
survival of the neuron is highly dependent on efficient axonal transport.
5.1.1.1: Cytoskeletal structure: Microtubules
The cytoskeletal network provides essential structural support to the neuron. However, it is also
required to be dynamic, allowing the cell the freedom to grow or change morphologically. As
later mentioned, several microtubule-associated proteins (MAPs) assist in regulating this
cytoskeletal fluidity (Chevalier-Larsen et al. 2006).
There are three major components of the cytoskeleton: microtubules, actin and intermediate
filaments. Microtubules are composed of polymerised heterodimers of and -tubulin, forming
polarised tracts throughout the neuron. In the axon, the fast growing plus-end, containing
exposed -tubulin, is directed outwards, towards the synapse, whereas the slow growing minus
end, ending in -tubulin, faces the cell body (Chevalier-Larsen et al. 2006; De Vos et al. 2008).
This is not the case in the dendrite, with the heterodimers instead found in mixed polarity states
(Hirokawa et al. 2004).
As mentioned, the cytoskeleton is dynamic, particularly in the developing neuron, aiding growth
and flexibility at the growth cone. However, in the more mature neuron, the microtubule
cytoskeleton is stabilised through its interaction with MAPs, such as Tau (Hirokawa et al.
1996). The dynamicity of the microtubule network is additionally regulated by a family of
MAPs, termed the microtubule plus-end tracking proteins (+TIPs), which form “comet-like”
complexes at the plus-end of the polymerising microtubules. Two of these +TIPs, end-binding
protein 1 and 3 (EB1 and EB3), are recruited to the microtubule plus-end specifically to regulate
axonal growth and elongation, via microtubule polymerisation (Akhmanova et al. 2008).
Furthermore, microtubules also undergo a diverse range of post-translational modifications
183
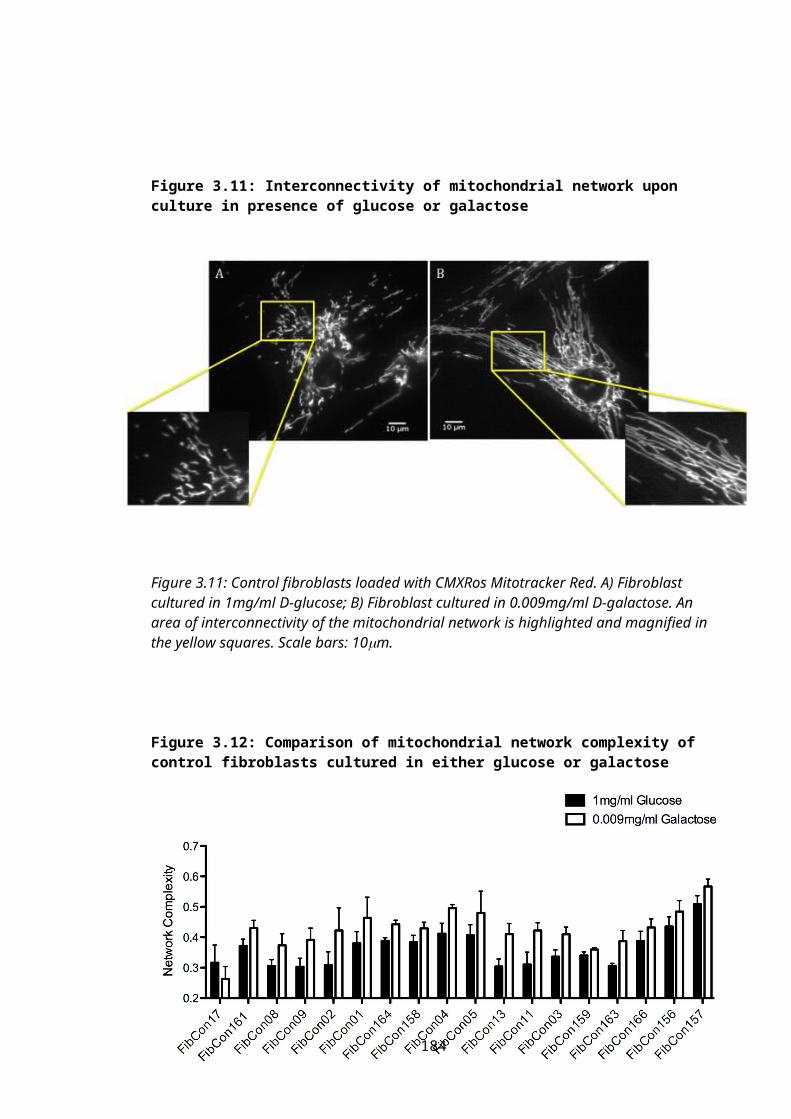
including acetylation, tyrosination and polyglutamylation, all of which are also thought to
regulate the dynamicity of the cytoskeletal track (Baas et al. 2006; Fukushima et al. 2009).
In the mature neuron, the microtubule network acts as a railway for cargo to be transported
bidirectionally along the axon, by the ATP-hydrolysing motors, Dynein and Kinesin (De Vos et
al. 2008; Fukushima et al. 2009). The microtubule network and associated motors primarily
transports cargo over long distances, whereas the actin filaments and motors are used for shorter
distances (Chevalier-Larsen et al. 2006). Thus, any disruption to the microtubule track will
invariably impact on the functioning of the long axons of the motor neuronal network.
5.1.2: Hereditary Spastic Paraplegia
Hereditary Spastic Paraplegia (HSP) is a group of heterogeneous neurological disorders,
characterised by the spasticity and weakening of the lower limbs (Salinas et al. 2008;
Blackstone 2012). Pathologically, retrograde degeneration of axons in the lateral corticospinal
tract and posterior columns is observed (Behan et al. 1974), leading to the disease being
described as a “dying-back axonopathy”. In up to 40% of autosomal dominant cases, the disease
is caused by mutations in the spast gene. The resultant protein product, Spastin, belongs to the
family of ATPases associated with various cellular activities (AAA proteins) (Frohlich 2001;
Frickey et al. 2004).
Extensive in vitro studies have revealed the role of Spastin in the severing of microtubules. For
example, a reduction in the intensity of tubulin staining was observed in a significant proportion
of wild type Spastin-transfected cells, indicating the basal role of the protein in the cell (Errico
et al. 2002). Furthermore, overexpression of mutant forms of Spastin caused a filamentous
expression pattern of both -Tubulin and mSpastin, with loss of the protein’s ATPase activity
kinetically trapping it on the microtubules and diminishing its severing capabilities (Errico et al.
2002; Evans et al. 2005). Thus, a pathogenic role of Spastin in HSP appears to be linked to its
reduced microtubule-severing activity. Such defects in the processing of microtubules are likely
to manifest in disruption to the process of axonal transport. Accordingly, murine models of
Spastin-mediated HSP provide evidence of such dysfunction.
A mouse model expressing a deletion mutation in the spast gene, resulting in loss of expression
at the protein level, revealed progressive axonal degeneration in the CNS, manifesting in a late
and mild motor defect (Tarrade et al. 2006). Cytopathologically, axonal swellings were
observed, increasing in number over time. Retrograde axonal transport also appeared impaired
in the neurons; there was an abnormal accumulation of mitochondria in the proximal part of the
neurite swellings (Tarrade et al. 2006).184
Another mouse model of SPG4 HSP has also been generated, using ENU mutagenesis, resulting
in a c.1092+2T>G mutation in the spast gene. This mutation causes exon 7 of the spast mRNA
to be skipped, resulting in either early degradation of the protein or in a failure to be translated.
Thus, essentially a Spastin knockout mouse model was created (spast ∆E7/∆E7) (Kasher et al.
2009). As previously mentioned, mutations in this splice site have been reported in human
patients, making this mouse a true model of human disease (Fonknechten et al. 2000).
Previous experiments have indicated that the c.1092+2T>G mutation in the spast gene induced
a specific disruption in anterograde axonal transport in primary cortical neurons of mice
heterozygous or homozygous for this mutation. A decrease in the anterograde transport of
membrane-bound organelles (MBOs) and mitochondria in both spast ∆E7/+ and spast ∆E7/∆E7
neurons was observed. Furthermore, the presence of axonal swellings appeared to exacerbate
the transport defect in spast ∆E7/∆E7 mice, with the frequency of movement almost halving distal
to the swellings (Kasher et al. 2009).
This axonal transport defect is alluded to in the spast ∆E7/+ and spast ∆E7/∆E7 cortical neurons, with
the formation of acetylated -tubulin immunoreactive swellings throughout the axon, also
containing components of the cytoskeleton, such as Tau, neurofilaments and APP, as well as
other cellular organelles, including mitochondria. ALL CYTOSKELETAL
COMPOENENTS….TRAFFICKING DEFECT GLOBAL IN ITS EFFECT.
THEORY: Increased pausing due to defective axonal transport resulting from loss of spastin…
causes swellings….block retrograde transport as well distal to the swelling
A dosage effect of mSpastin, with regards to the frequency of axonal swellings, was evident in
this mouse model, with the number of swellings increasing as Spastin expression decreased
(Kasher et al. 2009). Thus, these swellings can be quantified, potentially helping to characterise
the severity of the axonal transport defects.
5.1.3: Aims of this investigation
The aims of this investigation were to further characterise the cortical neurons derived from
spast +/+, spast ∆E7/+ and spast ∆E7/∆E7 mice, particularly examining the effect genetic background
has on the action of wild type and mutant Spastin.
Furthermore, we wished to test the effect of pharmacological intervention on the number of
axonal swellings in the cortical neurons. Due to the essential role Spastin plays in the
maintenance of microtubule dynamicity, we decided to test microtubule and MAP- targeting
drugs.185
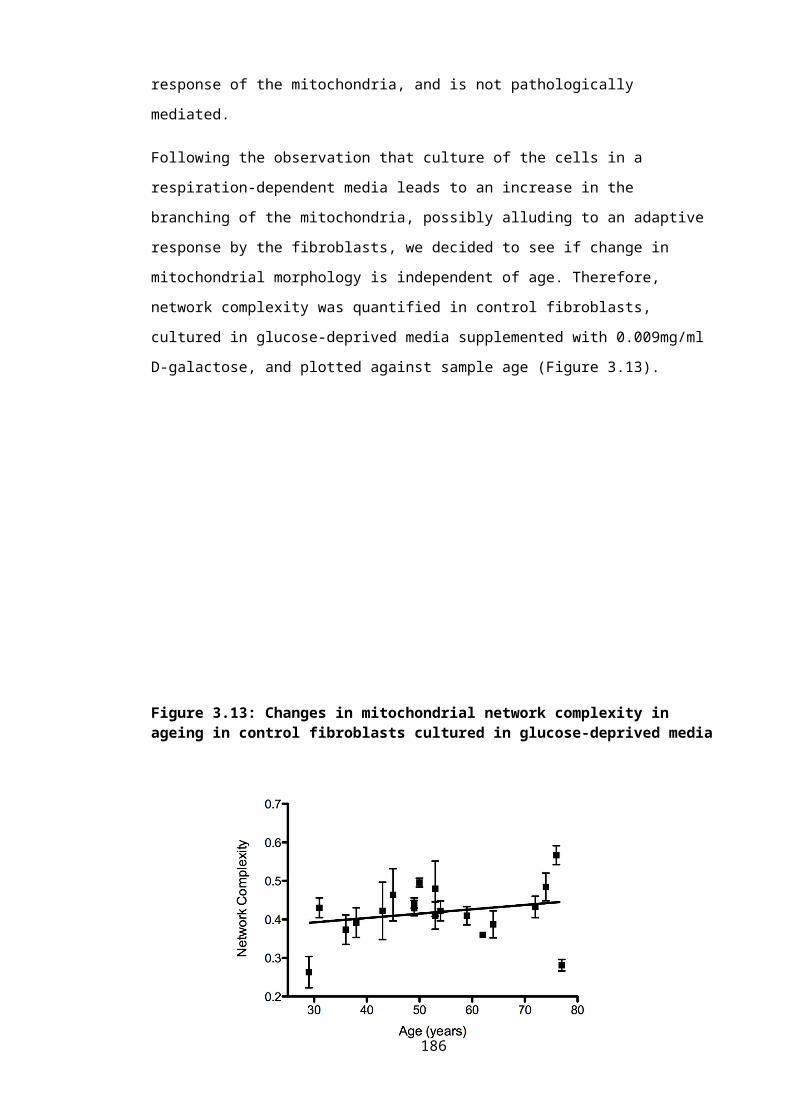
5.2: Characterisation of the primary cortical neuron cultures
5.2.1: Genotyping of the cortical neurons
As discussed in Chapter 2, the c.1092+2T>G Spastin mutation does not create a restriction site
to allow genotyping. Therefore, mismatch primers were previously designed, introducing a
novel Bs1I restriction enzyme site in the presence of the c.1092+2T>G mutation (Kasher et al.
2009)(Figure 5.1). The resultant restriction digest products consist of an 89bp band in the
presence of the c.1092+2T>G mutation, or an 112bp band in the wild type samples. Generally,
for each litter, the expected Mendelian ratio of genotypes was observed.
Figure 5.1: Mismatch PCR and restriction digest for spast∆E7 genotyping
Figure 5.1: Mismatch-PCR and Bsl restriction digest genotyping of DNA extracted from a mouse litter derived from the in-cross of heterozygous mutant Spastin c.1092+2T>G mice. The introduced Bsl restriction site generates an 89bp band in the spast +/∆E7 tissue (lanes 3 and 4) and the spast ∆E7/∆E7 samples (lane 6). The spast +/+ product is 112bp, seen in lanes 1, 2, 5 and 7.
5.2.2: Axonal swellings in cortical neuron cultures
As previously described, the spast ∆E7/∆E7 mouse model is characterised by progressive motor
deficits, as evidenced by changes in gait. At a cytopathological level, defects in axonal transport
were observed, along with the formation of acetylated -tubulin-positive swellings, randomly
distributed throughout the axon (Kasher et al. 2009).
To distinguish the difference between normal, non-specific accumulations and the pathological
swellings, Kasher and colleagues previously carried out a series of measurements, ascertaining
the optimum size of swelling that denotes the pathogenic accumulation of organelles and
cytosolic components (Kasher 2009). Swellings are assumed to be spherical and it was
established that any swellings that were the same size as, or larger than, a box measuring 5m
by 5m (i.e. had a radius of >2.5m, and thus an area of >19.6m2) were to be considered an
abnormal axonal swelling, and included in the count.
186

Using Hoechst-stained nuclei, 1000 viable neurons were counted. The number of swellings,
measuring 5m by 5m, were calculated per 100 nuclei in the spast +/+, spast ∆E7/+ and spast ∆E7/∆E7 cultures. The Hoechst-stained nuclei were also used to ensure a neurite swelling was
being quantified, rather than “bleed through” from the nuclei stain (Figure 5.2).
Figure 5.2: Quantification of axonal swellings
Figure 5.2: A): Cortical neurons stained for acetylated -tubulin; axonal swellings are highlighted in red. The corresponding area on the Hoechst-stained nuclei image, (B), is highlighted, ensuring the observed swelling is not derived from the staining of the nuclei.
5.3: Characterisation of spast ∆E7 cortical neurons
5.3.1: Effect of genetic background on number of axonal swellings
In the majority of mouse experiments, the pathogenic mutation of interest can be maintained on
several different genetic backgrounds, including the strains C57BL/6, FVB and BALBC. Each
of these strains possess an unique genetic makeup, with various modifier genes subtly impacting
on the overall phenotype of the organism, even in the presence of the same pathogenic mutation.
The existence of these confounding alleles means that the use of well-characterised
backgrounds permits more accurate interpretation of results. The availability of several different
backgrounds also enables the identification of confounding alleles or modifier genes which may
not previously been appreciated. Furthermore, certain genetic backgrounds may display a more
187
pronounced phenotype, and thus be more amenable for experimentation (Montagutelli 2000;
Laboratory 2006).
However, it is appreciated that difference in background can dramatically influence
experimental results. A well-characterised example is the discovery that, when expressed on a
B6 genetic background, mutations in the leptin-regulating genes, diabetes (db) and obese (ob),
manifest in transient diabetes along with obesity. However, when the same mutations are
expressed on a C57BLKS/J background, obesity and overt diabetes is observed (Coleman et al.
1973; Coleman 1978; Montagutelli 2000). Thus, there must be modifier genes present in each
genetic background, capable of altering the manifestation of diabetes in these mice.
However, it is unclear whether a change in genetic background would influence the effect of
mSpastin expression in mouse-derived cortical neurons. We therefore decided to quantify the
number of axonal swellings in cortical neurons derived from a range of genetic backgrounds,
namely C57BL/6, FVB and BALBC (Figure 5.3).
188
Figure 5.3: Effect of genetic background on the number of axonal swellings in cortical neurons
Figure 5.3: Representing results derived from cortical neurons from different genetic backgrounds: BALBC N=2, C57BL/6 N=2, FVB N=1. A) spast +/+; B) spast ∆E7/+; C) spast ∆E7/∆E7 cultures. D) Fold-change of both spast ∆E7/+ and spast ∆E7/∆E7 neuronal axonal swellings normalised to spast +/+culture levels, across the three genetic backgrounds. Quantified axonal swellings measuring over 5m by 5m. Bars represent mean S.E.M.
No significant difference was observed between the different genetic backgrounds in any of the
genotypes. There were some subtle alterations seen between the backgrounds; the C57BL/6
background appeared to express a higher number of axonal swellings across all three genotypes.
However, generally there was roughly a two-fold increase in the number of swellings seen
between the spast and spast ∆E7/∆E7 cultures (Figure 5.3D); this remained consistent across the
genetic backgrounds.
Thus, future experiments, testing the effectiveness of pharmaceutical intervention at
ameliorating the swelling formation, were carried out using cortical neurons derived from mice
of each of the genetic backgrounds.
189

5.3.2: Treatment with Tro19622
5.3.2.1: Tro19622 and microtubule dynamics
Though associated with the regulation of mitochondrial permeability (Bordet et al. 2007),
Tro19622 has also recently been linked to the regulation of microtubule dynamics; the drug
protected against microtubule-targeting agent (MTA)-induced neurotoxicity in vitro. It was
demonstrated in differentiated neuronal cells that the typical neurite shrinkage, seen after
treatment with MTAs, was prevented via the stabilisation of EB1 and EB3 at the microtubule
plus-ends, thus decreasing the duration of microtubule attenuation (Rovini et al. 2010).
Furthermore, treatment of the neurons with Tro19622 also prevented the MTA-induced
inhibition of mitochondrial trafficking along the microtubule network (Rovini et al. 2010).
Due to the evidence that Tro19622 is capable of preserving the necessary dynamicity of
neuronal microtubules, it was predicted that treatment of spast ∆E7/+ and spast ∆E7/∆E7 primary
cortical neurons with the drug would help ameliorate the aforementioned defects in axonal
transport, as evidenced by the decreased accumulation in axonal swellings.
Indeed, the loss of function of Spastin does lead to a reduction in the levels of tubulin
polymerisation and turnover both in vitro and in vivo (Trotta et al. 2004; Evans et al. 2005;
Zhang et al. 2007), as well as decreasing axonal outgrowth in a zebrafish model (Wood et al.
2006). It therefore appears that Spastin expression directly influences microtubule outgrowth.
Tro19622 has been demonstrated in vitro to promote both neurite outgrowth and an increase in
spinal motor neuron branching (Bordet et al. 2007; Rovini et al. 2010).
Upon downregulation of Spastin, the stable long microtubules become more susceptibile to
numerous post-translational modifications including detyrosination and acetylation, and thus
recruit +TIPs with less efficiency (Peris et al. 2006; Fassier et al. 2013), reducing plus-end
outgrowth. Thus, the stabilisation of EB3-comets at the plus end of microtubules in the presence
of Tro19622 may ameliorate the changes in microtubule dynamics, and axonal transport, seen
upon the loss of Spastin function in the neuron.
5.3.2.2: Tro19622 and axonal swelling quantification
The cortical neurons of the three genotypes were treated 24 and 96 hours post-preparation with
either 3µM Tro19622 solubilised in 0.5% DMSO, or 0.5% DMSO as a vehicle control. Basal
media was used as the control condition. Axonal swellings were quantified in the 7-day old
neurons, using the criteria described in section 5.2.2 (Figure 5.4 and 5.5). 3µM Tro19622 has
previously been shown to preserve EB comets at the microtubule tip in differentiated neuronal
cells (Rovini et al. 2010). Thus, at this dosage, the drug is capable of influencing and preserving
the dynamicity of the microtubular network. A separate in vitro assay, using purified motor
neurons, revealed that 3µM Tro19622 is capable of mediating a survival effect in the neurons
190
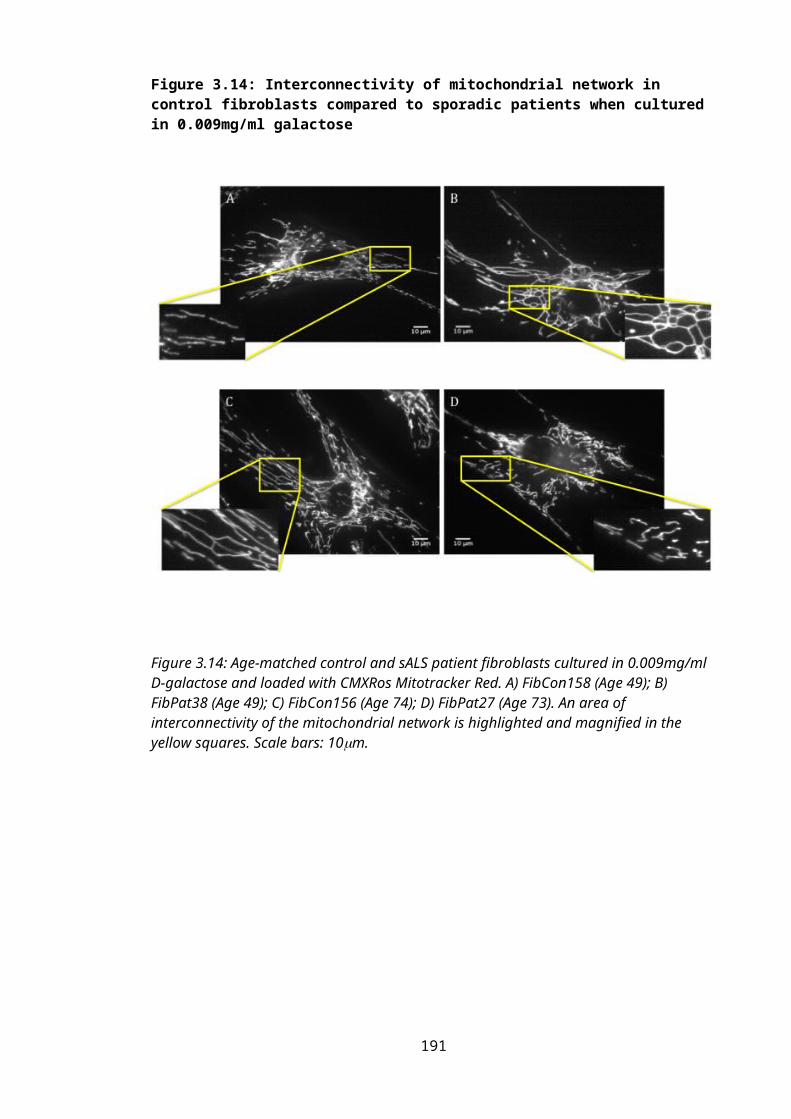
cultured in the absence of neurotrophic factors (Bordet et al. 2007). 3µM Tro19622 was found
to be the EC50 in this experiment. A dosage effect was seen in this survival assay; the maximum
dose of 10µM Tro19622 resulted in the survival of 74% of the neurons. However, it has been
noted in another group’s personal data that treatment with 10µM Tro19622 resulted in neuronal
toxicity, and is therefore not suitable to use in this investigation.
Figure 5.4: Persistence of axonal swellings in spast ∆E7/∆E7 primary cortical neurons following treatment with Tro19622
Figure 5.4: Following treatment of the spast ∆E7/∆E7 primary cortical neurons with 3M Tro19622, the number of quantified axonal swellings was still observed to be similar to pre-treatment, basal levels. Figure shows spast ∆E7/∆E7 cultures immunostained for acetylated -tubulin. Quantified swellings are depicted with a black arrow.
191
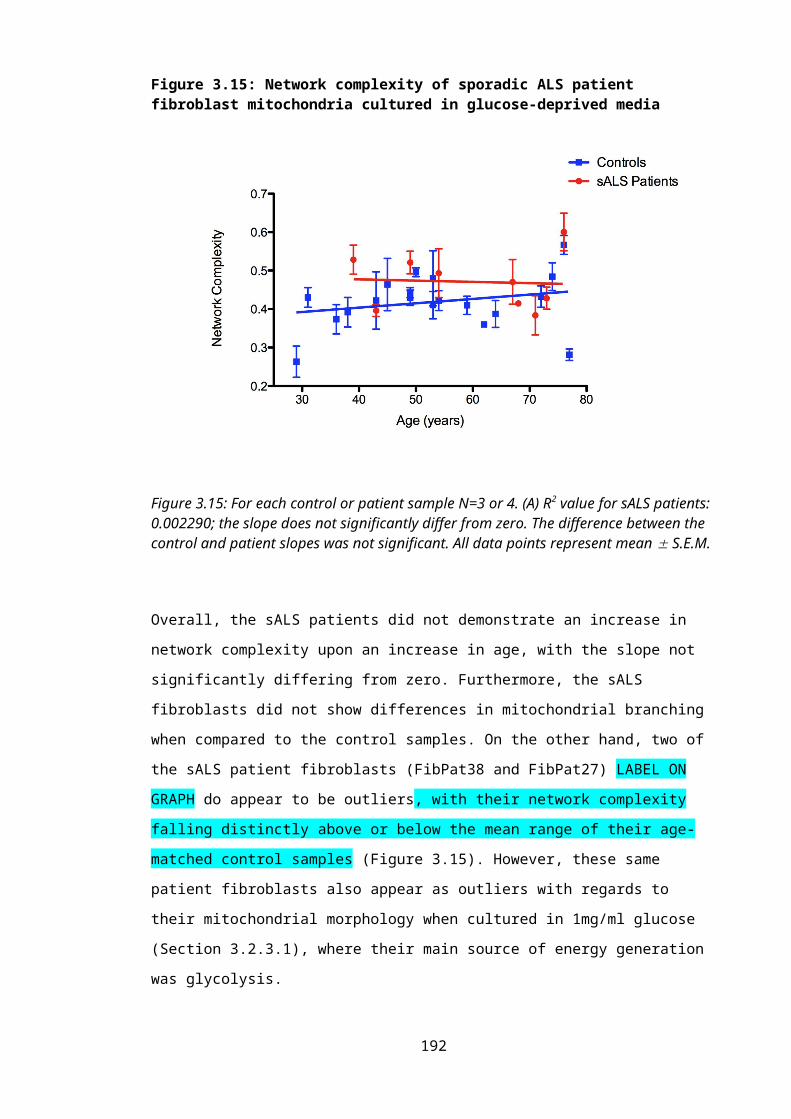
Figure 5.5: Quantification of the number of axonal swellings in the presence of Tro19622
Figure 5.5: A) Genotype B) Treatment conditions. N=5. Combined results derived from cortical neurons from different genetic backgrounds: BALBC N=2, C57BL/6 N=2, FVB N=1. Quantified axonal swellings measuring over 5m by 5m. Bars represent mean S.E.M. Statistical test: 1-way Anova with either Bonferroni’s or Dunn’s multiple comparison test. Where values differ significantly: ** p< 0.01.
Under basal conditions, a doubling in the number of axonal swellings was observed in the spast ∆E7/∆E7 cortical neurons when compared to the spast +/+ neurons (Figure 5.3B). However, the
expected 50% basal increase in the number of swellings in the spast ∆E7/+ cultures compared to
spast +/+ neurons was not observed, contrasting results seen by Kasher et al, in 2009.
Surprisingly, a (non-significant) increase was seen in the spast ∆E7/+ neurons compared to wild
type cultures upon treatment with Tro19622. Furthermore, when the cultures were treated with
0.5% DMSO as a vehicle control, the number of axonal swellings in the spast +/+ neurons
increased 1.2-fold compared to the untreated cells, abrogating the significant difference
previously seen between the spast +/+ and spast ∆E7/∆E7 cultures.
Following 7 days of treatment with 3μM Tro19622, no significant difference in the quantity of
axonal swellings in the spast +/+, spast ∆E7/+ and spast ∆E7/∆E7 cultures were observed when
compared to basal levels. Thus, at this dosage, the drug appears to be ineffective at ameliorating
the defects in axonal transport, seen upon the mutation of Spastin.
192
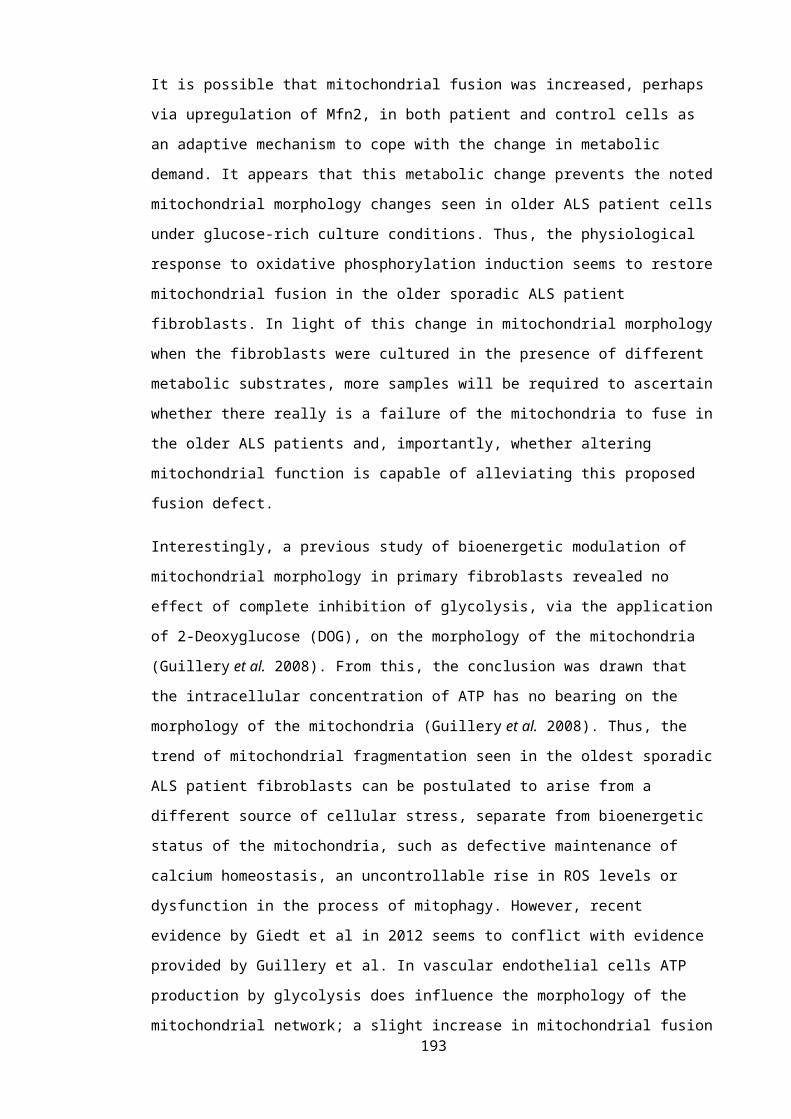
5.3.2.3: Tro19622 and neurite morphology
In spite of being unable to ameliorate the number of axonal swellings, it was observed that
treatment of the cultures with Tro19622 significantly improved the morphology of the neurons.
To qualitatively confirm this, images of the neurons from each treatment group were scored
using a subjective scale, under blinded conditions. The scale spanned from 5, where the neurites
appear stable, to 0, where the cytoskeletal structures appear to have broken down, fragmenting
the appearance of the neurite staining (Figure 5.6). Fields of view equating to 1000 nuclei were
scored for each treatment condition in all three genotypes, and the scoring was grouped into
three distinct bins, 0-1, 2-3 and 4-5. The relative frequencies of each binning group were then
expressed as a percentage of the total (Figure 5.7 and 5.8).
193

Figure 5.6: Scoring of neurite morphology in cortical neuron cultures
Figure 5.6: Cortical neurons immunostained for acetylated -tubulin. Neurites were scored using an arbitrary scale from 0-5, where 0 represents fragmented neurite staining, and 5 represents an intact neurite.
194
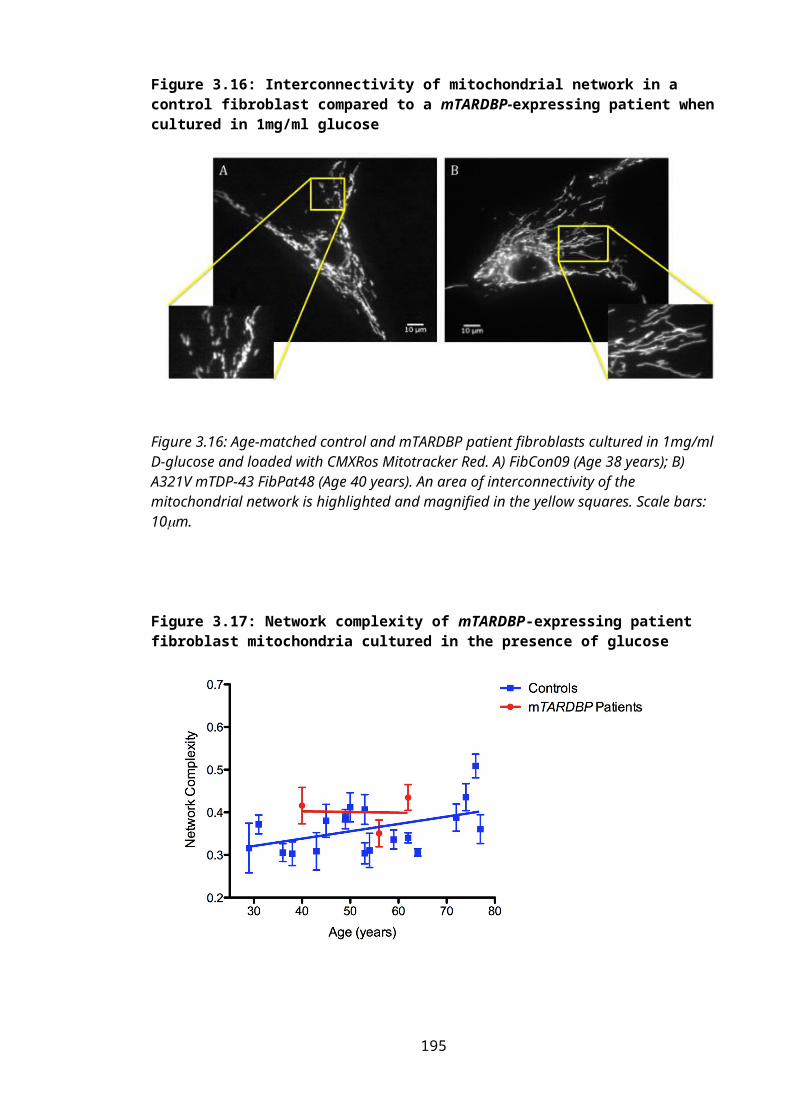
Figure 5.7: Improvement in neurite morphology upon treatment with Tro19622
Figure 5.7: Figure depicting spast ∆E7/∆E7 cultured neurons stained for acetylated -tubulin. Images from all genotypes were scored on an arbitrary scale from 0-5 to determine the effect of treatment with Tro19622 on the morphology of the neurons. A-B) Untreated; moderate fragmentation of the neurite; C-D) 0.5% DMSO; moderate to substantial fragmentation of the neurite; E-F) 3M Tro19622; stable, intact neurites. Scale bars: 10m.
195
Figure 5.8: Qualitative scoring of the improvement in neurite morphology upon treatment with Tro19622
Figure 5.8: Blind scoring of the morphology of the neurites after treatment with Tro19622. N=4. A) spast +/+ cortical neurons; B) spast ∆E7/∆E7cortical neurons. Images were scored on a scale of 0-5 and grouped into binning boundaries 0-1, 2-3 and 4-5.
Following scoring of each genotype, under each treatment condition, the treatment of the
neurons with 3M Tro19622 was seen to improve the morphology of the neurites. Independent
of genotype, and therefore unrelated to the presence of Spastin, the neurites appeared stabilised
upon treatment with the drug; there was a significant reduction in the “beads on a string”
morphology (Pittman et al. 1993), indicative of cytoskeletal structure breakdown.
5.3.2.4: Viability of the cortical neurons treated with Tro19622
Following the discovery of improved morphology of the neurons following treatment with
Tro19622, we wondered whether the drug acts upon the apoptotic pathway. Two of the
molecular targets of Tro19622 are components of the MPTP (VDAC and Translocator protein
18kDa (TSPO)), a complex involved in the induction of apoptosis (Bordet et al. 2007). It is thus
possible that the drug alters the level of cell death in the culture, leaving only the healthy
neurons.
Hoechst stain is a fluorescent dye used to stain nuclear DNA; the resulting staining pattern
allows the assessment of the viability of the culture. Upon induction of apoptosis numerous
changes occur in the cell, including the fragmentation of the nucleus and condensation of the
chromatin (Wyllie et al. 1981). It is this compaction of the DNA that results in the bright
fluorescence of the chromosomes, allowing the neuron to then be quantified as either dying or
dead (Figure 5.9).
196

Figure 5.9: Assessment of cortical neuron culture viability
Figure 5.9: Neurons stained with Hoechst. Viability assessed over 1000 live nuclei. Dying and dead neurons, encircled in red, are depicted by degenerating or fully condensed nuclei.
The viability was assessed in the spast +/+ and spast ∆E7/∆E7 cultures from two genetic
backgrounds (BALBC, and FVB), with live or dead neurons expressed as a percentage of the
total number of neurons counted (Figure 5.10).
Figure 5.10: Quantitative measurement of viability in spast +/+ and spast ∆E7/∆E7 cortical neuron cultures
Figure 5.10: N=3. A) spast +/+ cortical neurons; B) spast ∆E7/∆E7 cortical neurons. Viability was assessed in the number of fields of view equating to 1000 live nuclei, in cultures representing the three treatment conditions. Alive and dead cells were expressed as a percentage of the total number of nuclei in the field of view. Bars represent mean S.E.M.
197

Though it appears that viability is higher under basal conditions, likely attributed to the toxic
effect of 0.5% DMSO, there is no significant difference between the treatment groups when
quantifying alive or dead cells in either wild type or homozygous cultures.
5.3.2.5: Acetylation levels
As the improvement in the morphology of the cortical neurons in the presence of Tro19622
appears to be independent of viability, it was possible that the drug treatment instead influences
the acetylation state of the microtubules. Acetylation is a common post-translational
modification of the microtubules in the axon. The presence of acetylated residues (specifically
Lys40 on -tubulin) on the inside of the microtubule polymer is indicative of, though it may not
be the cause of, stability of the microtubule network (Matsuyama et al. 2002; Haggarty et al.
2003; Dompierre et al. 2007).
In order to assess whether the improvement in cytoskeletal morphology derives from the
increased acetylation of the microtubules, the neurons were immunostained for -tubulin,
revealing both acetylated and non-acetylated tubulin, acetylated -tubulin specifically, or the
neurofilament network (Figure 5.11). It was theorised that the appearance of a stabilised
network, following neurofilament staining, would indicate an improved stability of the
cytoskeleton overall. Conversely, if the -tubulin staining revealed fragmentation of the
neurites, it could be postulated that the apparent improvement in neurite morphology, upon
treatment with Tro19622, is not due to the acetylation of the microtubule network. Again, the
morphology of the neurons was qualitatively assessed using an arbitrary scale of 0-5.
Analysis was carried out using spast +/∆E7 cortical neurons; the most common genotype produced
from a timed mating. The improvement in neurite morphology, following treatment with
Tro19622, was found to be independent of genotype (Figure 5.8), meaning the effect of
Tro19622 on the morphology of the cytoskeleton in the spast +/∆E7 cultures can also be taken as
representative of the spast +/+ and the spast ∆E7/∆E7 cultures.
198
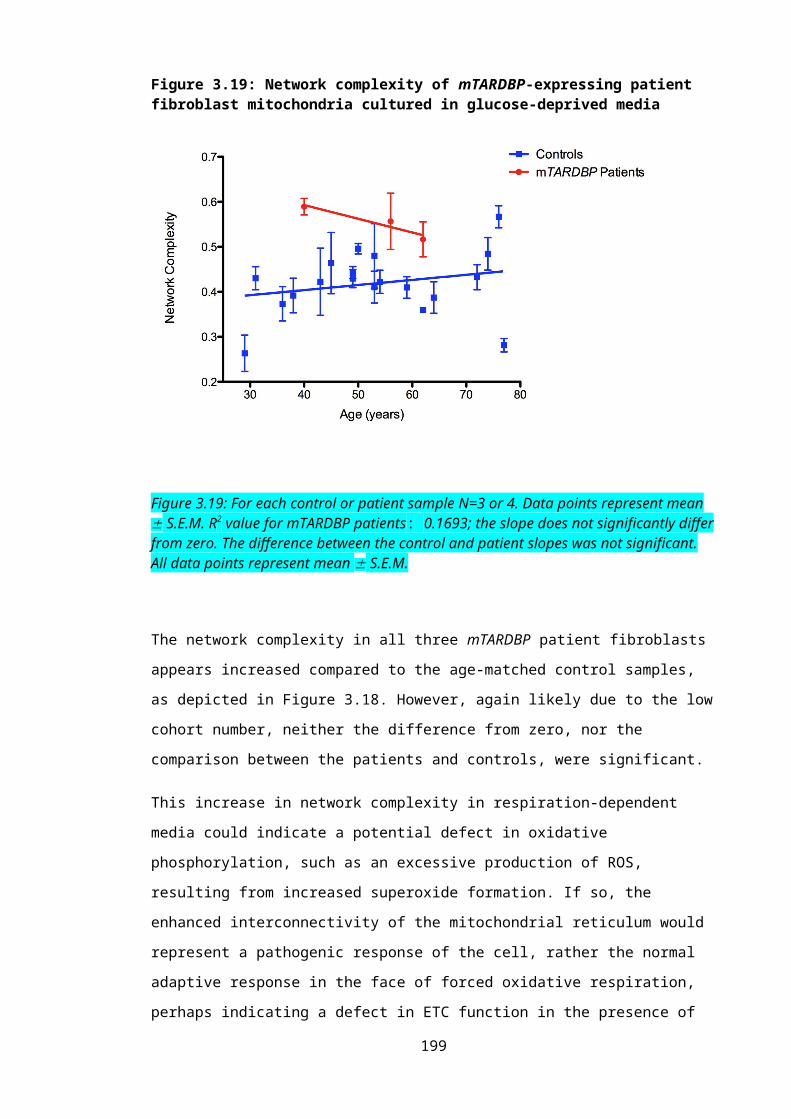
Figure 5.11: Assessing morphology of the cytoskeleton in the presence of Tro19622
Figure 5.11: Assessment of cytoskeleton morphology in spast ∆E7/+ cortical neurons: A-C) Cultures from each treatment condition stained for acetylated -tubulin; D-F) Cultures from each treatment condition stained for -tubulin (DM1A antibody); G-I) Cultures for each treatment group stained for neurofilaments (SM31 antibody).
199
Figure 5.12: Assessing the morphology of components of the cytoskeleton in spast +/∆E7 neurons upon treatment with Tro19622
Figure 5.12: N=1. A) Qualitative scoring of cortical neurons stained for acetylated -tubulin; B) Scoring of cortical neurons stained for -tubulin; C) Qualitative scoring of cortical neurons stained for neurofilaments. Neurite morphology was assessed using an arbitrary scale of 0-5.
As depicted in Figures 5.11 and 5.12, the structural integrity of the neurofilaments, either under
basal conditions or in the presence of Tro19622, appeared fragmented, as expected in
embryonic neurons cultured for seven days. Conversely, staining for -tubulin revealed stable
networks independent of treatment group. Staining for acetylated -tubulin revealed the
aforementioned pattern of improved morphology in the presence of Tro19622. Thus, from this
preliminary evidence, it appears that application of Tro19622 has no effect on the integrity of
the neurofilament network but may increase acetylation, and preserve the morphology of the
microtubules in the neurite. Stabilisation of the microtubule network, derived from increased
lysine acetylation may result in the perceived improved appearance of neurite morphology in
the AAT-stained cultures. These results reinforce the evidence suggesting that Tro19622 acts
mainly on the microtubule network rather than all components of the cytoskeleton.
200
5.3.3: Treatment with HDAC6 inhibitor - Tubastatin A
As previously discussed, post-translational modification of the microtubules regulates the
dynamicity of the cytoskeleton, which in turn impacts on the efficiency of axonal transport
(Maruta et al. 1986). Acetylation of lys40 on the luminal face of -tubulin is associated with
stabilisation of the microtubule network, and the efficiency of the severing activity of Katanin
(Sudo et al. 2010).
Furthermore, this post-translational modification also improves axonal transport, independent of
microtubule stabilisation, via the increase in the efficiency of recruitment of both retrograde and
anterograde transport motors to the microtubule tracks. It has been noted in vitro that loss of lys-
40 acetylation reduces the interaction of Kinesin-1 with the microtubules, with a subsequent
decrease in the motility of the motor protein (Reed et al. 2006). Thus, acetylation of tubulin
appears to regulate the polarised trafficking of cargoes in the neurons (Reed et al. 2006).
Additionally, Dynein, and the p150GLUED subunit of Dynactin, are also preferentially recruited to
acetylated microtubules (Dompierre et al. 2007), which may be of importance when considering
the exacerbated distal retrograde transport defect in the HSP-model cortical neurons.
Acetylation in the cell is intricately regulated by histone acetyltransferases (HATs) and histone
deacetylases (HDACs). In the neuron, two proteins, both implicated in neurodegenerative
disease, namely HDAC6 and SIRT2, mainly regulate the deacetylation of tubulin (Glozak et al.
2005; Pallos et al. 2008). HDAC6 is a class II HDAC, predominantly localised to the
cytoplasm. This class IIb deacetylase has distinctive substrate specificity for non-histone
proteins, including -tubulin, (Dompierre et al. 2007), meaning this protein is highly implicated
in the regulation of axonal transport.
It was thus postulated that treatment of the HSP cortical neurons with the specific HDAC6
inhibitor, Tubastatin A, would increase levels of tubulin acetylation, improve the defect in
axonal transport, and subsequently ameliorate the number of axonal swellings seen in the spast ∆E7/∆E7 cultures. Indeed, treatment of cultured mutant-heat shock 27kDa protein 1 (HSPB1) dorsal
root ganglion neurons with Tubastatin A corrected the mitochondrial axonal transport defect
seen in these CMT-modelling neurons (d'Ydewalle et al. 2011).
5.3.3.1: Tubastatin A and swellings
The cortical neurons of the three genotypes were treated 24 and 96 hours post-plating with
either 1µM Tubastatin A solubilised in 0.1% DMSO, or 0.1% DMSO as a vehicle control. Basal
media was used as the control condition. Again, axonal swellings were quantified according to
the criteria described in section 5.2.2 (Figure 5.13). 1µM Tubastatin A was the dose previously
found to rescue the CMT2 phenotype in the mHSPB1 mouse model (d'Ydewalle et al. 2011)
201
Figure 5.13: Quantification of the number of axonal swellings in the presence of Tubastatin A
Figure 5.13: A) Genotype B) Treatment conditions.
N=3: 2 BALBC and 1 C57BL/6. Bars represent mean S.E.M. Statistical test: 1-way Anova with either Bonferroni’s or Dunn’s multiple comparison test. Where values differ significantly: * p<0.05, ** p< 0.01, *** p<0.001.
As with the previous experiment, a significant increase in the number of swellings in the spast ∆E7/∆E7 cultures was observed, when compared to the spast +/+ and spast +/∆E7 neurons, under both
basal and vehicle-control conditions. Furthermore, a significant decrease in the quantity of
swellings in the spast ∆E7/∆E7 cortical neurons was seen following 7-day treatment with
Tubastatin A. The number of swellings in the spast ∆E7/∆E7 neurons was reduced to wild type
levels following drug treatment. Thus, the specific inhibition of HDAC6 appears to ameliorate
the axonal transport defect seen in the spast ∆E7/∆E7 cultures.
5.3.3.2: HDAC6 inhibition and neurodegeneration
HDACs act in the cell to regulate the acetylation levels on both histones and cytoskeletal
tubulin. They can therefore influence the functioning of cellular transport, dynamicity and
genetic expression patterning, via the control of epigenetics (Dietz et al. 2010). However, the 202

activity of the various proteins controlling acetylation is by no means straightforward. For
example, activation of Sirt1 and Sirt5, two NAD-dependent protein deacetylases, is protective to
the neuron; conversely, activation of Sirt2, Sirt3 and Sirt6 results in the promotion of neuronal
apoptosis (Pfister et al. 2008; Dietz et al. 2010). Despite this complexity, pharmacological
regulation of HDAC activity is therapeutically implicated in numerous pathologies, including
neurodegeneration.
The inhibition of HDAC6 as a therapeutic avenue has recently been suggested for numerous
neurodegenerative disorders, including HD and AD. In HD, treatment of striatal precursor-
derived cell lines, taken from a transgenic mouse carrying two copies of mHtt, restored the
vesicular transport and release of BDNF back to control levels (Dompierre et al. 2007).
Furthermore, in a Drosophila model of HD, the inhibition of Sirt2 activity had a neuroprotective
effect (Pallos et al. 2008). This evidence suggests that an increase in tubulin acetylation levels is
protective against the pathogenesis of HD.
In AD, Tubastatin A-mediated inhibition of HDAC6 in primary A-expressing hippocampal
neurons restored the axonal transport of mitochondria back to control levels, ameliorating the
A-induced defects in both velocity and motility of the organelles. Interestingly, the increase in
acetylated -tubulin also abrogated the A-mediated activation of Drp1 and Fis1, preventing the
pathogenic fragmentation of mitochondria (Kim et al. 2012). It therefore appears that HDAC6
inhibition can also impact on mitochondrial dynamics, as well as axonal transport.
As discussed, Tubastatin A has previously been shown to ameliorate defects in axonal transport
seen in a mutant HSPB1 (mHSPB1)-induced mouse model of CMT. Study of DRG neurons
expressing mHSPB1 revealed evidence of defective axonal transport of mitochondria, resulting
in a decreased number of mitochondria populating the neurite. 21-day treatment with Tubastatin
A restored efficient mitochondrial transport, increasing motor performance of the transgenic
mice and preventing the observed distal axonal loss (d'Ydewalle et al. 2011).
Interestingly, studies of murine models, as well as patient-derived data, in AD, HD and CMT
has demonstrated a significant decrease in the levels of acetylated -tubulin in the relevant
neuronal cells (Hempen et al. 1996; Dompierre et al. 2007; d'Ydewalle et al. 2011; Kim et al.
2012). Thus, it can be appreciated why the pharmacological inhibition of deacetylation is
beneficial in these neurological disorders. However, in HSP, there is so far no evidence of a
pathogenic decrease in the levels of tubulin acetylation. Furthermore, evidence suggests that the
functioning of Spastin is not regulated by the acetylation state of tubulin, as opposed to the
activity of Katanin (Sudo et al. 2010). Therefore, the observed amelioration in the number of
axonal swellings seen in the spast ∆E7/∆E7 cultures following treatment with 1M Tubastatin A
may be tentatively attributed to the improvement in axonal transport following increased -
tubulin acetylation.
203
As previously discussed, acetylation of -tubulin leads to an increase in the binding of motor
proteins to the microtubule track. It has been postulated that this increase in the efficiency of
binding derives from a conformational change in the microtubules, induced by the post-
translational modification (Dompierre et al. 2007). This structural change may present a domain
of the tubulin that possesses a higher affinity for the motor proteins; in support of this, the
binding sites of both Dynein and Kinesin-1 overlap on the microtubules (Mizuno et al. 2004;
Dompierre et al. 2007), explaining why both anterograde and retrograde transport is influenced
by HDAC6 inhibition.
Previous analysis of our mouse model of SPG4-mediated HSP revealed that the observed
defects in axonal transport were mainly in the anterograde direction, though disruption to
transport in axonal segments distal to swellings was also exacerbated in the retrograde direction
(Kasher et al. 2009). Therefore, an increase in the affinity of Kinesin-1 and Dynein to the
acetylated microtubules would help to alleviate the defects in the bi-directional transport seen in
HSP, potentially reducing the pausing frequency of cargo at the axonal swellings. Thus, even if
an increase in acetylation has no effect on the severing defect, the recruitment of the motor
proteins may serve to compensate for the loss of Spastin in the regulation of axonal transport.
FASSIER EVIDENCE….HELP STABILISE THE MICROTUBULES IN THE SWELLINGS
TO FURTHER ENABLE RESTORATION OF TRANSPORT?
Alternatively, it is possible that the Tubastatin A-mediated improvement in axonal transport
influences the autophagy and the ubiquitin-proteasome pathway. As discussed in Chapter 4, in
the autophagy pathway, the autophagosome must be trafficked along the microtubules in order
to fuse with the lysosome, permitting efficient degradation of the waste cargo (Mehrpour et al.
2010). Defects in axonal transport will result in a build-up of waste proteins in the neurite. It is
currently unclear if the swellings observed in the spast∆E7 cultures contain ubiquitinated proteins
destined for the lysosome, consequent to defects in the autophagy pathway. However, the toxic
accumulation of proteins is a common pathogenic feature of neurodegenerative disease (Son et
al. 2012), as previously discussed. Thus, the increased efficiency of axonal transport may
improve the functioning of the autophagosomal pathway, reducing the accumulation of proteins
observed in the axons.
204
5.4: ConclusionsIn contradiction to what was seen by Kasher et al in 2009, in this experiment, the spast +/∆E7
neurons did not present with an increased number of axonal swellings compared to wild type
neurons, indicating no axonal transport defect upon the expression of only a single copy of
functioning Spastin. The absence of an axonal transport defect in the spast +/∆E7 cortical neurons
was unexpected, as it is this genotype that most accurately represents the clinical pathogenic
mutation (Kasher et al. 2009).
However, it is possible that the expected increase in the number of axonal swellings in the spast +/∆E7 cortical neurons was lost due to alterations in experimental setup. The density of the
cultures was increased to help reduce the toxicity resulting fron the high concentration of
DMSO required to solubilise Tro19622; this may alter the formation of axonal swellings.
Furthermore, logistically, an increase in culture density, and thus an increase in the number of
nuclei per field, results in fewer fields of view being analysed. Moreover, it has been observed
by colleagues that both the size and number of axonal swellings increases when the cells are
plated at a lower density. Though the reason behind this is currently unclear, it possibly derives
from an increase in cellular stress resulting from the lower density. These factors may have a
bearing on the number of swellings counted, and the subsequent calculation of the percentage of
axonal swellings.
Despite these anomalies, pharmacological treatment of the spast∆E7 cultures has revealed an
exciting potential for therapeutic intervention in mSpastin-mediated HSP. Tubastatin A affects
the acetylation of cytosolic proteins specifically, rather than the histones (d'Ydewalle et al.
2011). Therefore, the therapeutic effect of this drug can be attributed to the acetylation of -
tubulin and consequent alterations in axonal transport, rather than any epigenetic effect. This
may be important for HSP, which is categorised as a dying-back axonopathy, with defective
axonal transport implicated as the main pathogenic process.
However, questions remain about the success of HDAC6 inhibition in ameliorating the number
of axonal swellings in the spast ∆E7/∆E7 neurons. As mentioned, loss of Spastin results in a
stabilisation of the microtubule network (Trotta et al. 2004), and that acetylation further
increases this stability (Matsuyama et al. 2002). Furthermore, the activity of Spastin is not
influenced by the acetylation of tubulin. On the other hand, Katanin does have a higher affinity
for acetylated microtubules compared to unmodified tubulin (Sudo et al. 2010). It may therefore
be postulated that an increase in tubulin acetylation enables Katanin to partially compensate for
the loss of Spastin-mediated microtubule severing. However, it has been noted that the
expression of Katanin dramatically decreases following development (Solowska et al. 2008).
205
Furthermore, HDAC6, as well as regulating axonal transport, has also been implicated in the
regulation of nutrient-independent basal autophagy, imperative for intracellular quality control,
and further highlighting the essential role for HDAC6 activity in the regulation of
neurodegeneration. HDAC6 regulates the fusion of autophagosomes to lysosomes by recruiting
actin-remodelling proteins that stimulates the formation of the autophagolysosome (Lee et al.
2010). Thus, inhibition of HDAC6 would be predicted to result in the failure of autophagosome
maturation and the toxic accumulation of protein aggregates, therefore exacerbating the
formation of axonal swellings, instead of producing the noted decrease in number.
Due to these observations, it can be suggested that, unless there is an unknown function of
HDAC6, which, if inhibited, is beneficial to neuronal transport the reduction in the quantity of
axonal swellings following Tubastatin A treatment may be attributed to an increased affinity of
the molecular motors to the microtubule track, subsequently improving efficiency of axonal
transport, independent of microtubule stabilisation.
In light of these contradictions, it will be necessary to biochemically assess the acetylation
levels in the spast∆E7 cultures, to see if this post-translational mechanism is altered in a model of
HSP. This will also help to explain why, if an increase in acetylation is protective to the neuron,
the observed upregulation in the presence of Tro19622 did not result in an amelioration of the
number of axonal swellings. This could also possibly be attributed to the high concentration of
DMSO, preventing the rescue in axonal transport induced by acetylation, as previously
discussed. It will also be necessary to treat the spast∆E7 cultures later on in their development, to
ascertain whether Tubastatin A acts to prevent the initial formation of the swellings or whether
it is capable of eradicating them once they are developed.
206
Chapter 6 - Discussion
6.1: Introduction
6.1.1: Mitochondria in cellular homeostasis, ageing and neuronal maintenance
Mitochondria are highly specialised organelles carrying out several essential roles in eukaryotic
cells, including ATP production, regulation of calcium homeostasis and induction of the
intrinsic apoptotic cascade. In light of these functions, they have a key role in neuronal
maintenance and function. Neurons are highly metabolic with a heavy reliance on ATP,
stemming from their large size and role in the transduction of synaptic signalling.
Interestingly, neurons mainly utilise oxidative phosphorylation to meet these energy demands,
thus making the cells further dependent on efficient mitochondrial function.
Unsurprisingly, mitochondrial dysfunction has repeatedly been highlighted as a pathogenic
process in both ageing and most of the neurodegenerative disorders including ALS.
ALS: DISEASE OF OLD AGE….GRADUAL AND CUMULATIVE DEFECT IN
MITOCHONDRIAL FUNCTION?
NOT AS SEVERE AS LEIBERS OR MIT DISORDERS….SPECIFIC GENETIC DEFECT IN
MITOCHONDRIA, BUT DOES AFFECT NEURONS MAINLY….
An enduring hypothesis concerning the mechanics of ageing is the cumulative generation of
ROS by the leakage of electrons from the ETC. It is postulated that, over time, the levels of
generated free radicals lead to progressive accumulation of mtDNA mutations and deletions
(Corral-Debrinski et al. 1992; Krishnan et al. 2007), deficiencies in mitochondrial protein
production (Guja et al. 2012), and accumulative damage to macromolecules and other
organelles in the cell (Mammucari et al. 2010)…..ROS AND MT?
Furthermore, as well as contributing to the ageing of the cell, mitochondria can also provide a
read-out of the functional decline upon increasing age. It has been hypothesised that cumulative
telomere dysfunction activates p53, which subsequently binds to the promoters of both PGC-1
and PGC-1, repressing their transcription, and thus impairing mitochondrial biogenesis and
metabolic function (Sahin et al. 2010; Sahin et al. 2012). Consequently, the production of ROS
increases, further impairing function in the cell (Sahin et al. 2010; Sahin et al. 2012).
The largest risk factor for neurodegenerative disease is ageing (Desler et al. 2012), and as such
these diseases are increasing in incidence as people live longer. It may be hypothesised that the
pathology noted in neurodegenerative disease is a consequence of the exacerbation of the 207
defects seen in ageing. Indeed, there are several pathophysiological processes that overlap
between ageing and neuronal degeneration.
For example, in ALS, oxidative stress, particularly that derived from defective oxidative
phosphorylation, has been implicated in the pathogenesis of ALS, following study of both
patients and animal models (Comi et al. 1998; Jung et al. 2002; Mattiazzi et al. 2002;
Wiedemann et al. 2002; Murata et al. 2008). Accordingly, damage arising from aberrant free
radical activity has also been noted in patient samples and animal models, including
peroxidation of mitochondrial membrane lipids, carbonylation of proteins and increased
oxyradical production (Kruman et al. 1999; Tohgi et al. 1999; Mattiazzi et al. 2002; Murphy
2009), all of which can severely effect the functioning of the mitochondria. Furthermore,
evidence from both patients and models of the disease implicate impaired calcium buffering by
mitochondria in the motor neuron as a key pathogenic process in ALS; for example, mSOD1-
expressing neuroblastoma cells had increased levels of cytoplasmic calcium, concomitant with a
significant decrease in m (Carri et al. 1997)….LINKTO SOD…SOD MITOCHONDRIA
CANNOT BE RESCUED BY WT SOD, KO OF SOD IS ONLY TOXIC IN FLIES….WHY?
Consequently, several clinical trials investigating ALS have involved drugs targeted to
mitochondria (Shefner et al. 2004; Bordet et al. 2007; Cudkowicz et al. 2011). The most recent
promising trial has come from the testing of Dexpramipexole, a drug shown to improve the
efficiency of oxidative phosphorylation. When tested in SH-SY5Y neuroblastoma cells,
Dexpramipexole treatment improved ATP production levels upon culture in respiration-
dependent media, thus increasing the bioenergetic efficiency of the cells (Alavian et al. 2012).
However, despite this improvement in mitochondrial function, it has recently been announced
that Dexpramipexole has failed in Phase III trials in the treatment of ALS (Biogen Idec press
release). Interestingly, in our investigation, no defects in ATP production were observed in
mTARDBP patient fibroblasts compared to control fibroblast samples, when the cells were
cultured in either glucose-enriched or glucose-deprived media (Figure 4.1).
It has long been appreciated that neuronal maintenance and functioning requires the
maintenance of mitochondrial dynamics (reviewed in Van Laar and Berman, 2012). There is an
intricate relationship between mitochondrial form and function. For example, changes in the
fusion/fission dynamics of mitochondria can directly influence oxidative phosphorylation (Van
Bergen et al. 2011). The opposite has also been shown to be true, with defects in the ETC
inducing changes in mitochondrial interconnectivity (De Vos et al. 2005).
Accordingly, all aspects of mitochondrial dynamics are hypothesised to be altered as age
increases. The decrease in expression of PGC-1 during ageing has implications for
mitochondrial biogenesis, and, via its activation of Mfn2, mitochondrial metabolism and the
balance of mitochondrial fusion/fission. Furthermore, a decline in mitochondrial motility was
208
observed in aged mouse tibial nerve axons compared to younger samples (Gilley et al. 2012).
Finally, activity of the autophagy pathway diminishes as age increases as evidenced by the
appearance of giant mitochondria in post-mitotic ageing cardiac myocytes (Terman et al. 2003).
Affirming the relationship between ageing and neurodegeneration, alterations in mitochondrial
dynamics are also observed in ALS. Defects in both mitochondrial fusion/fission and axonal
transport have been reported; post-mortem examination of the anterior horn in sALS patients
showed fragmentation of the motor neuronal mitochondria, suggestive of defective fusion or an
increase in mitochondrial fission (Sasaki et al. 2007). Furthermore, neuronal expression of wild
type human TDP-43 in a transgenic mouse model resulted in abnormal juxtanuclear clusters of
vacuolated mitochondria in the spinal motor neurons. Interestingly, expression levels of Mfn1
were decreased, with a simultaneous increase in expression levels of both Fis1 and
phosphorylated Drp1, suggesting a defect in the regulation of mitochondrial dynamics may be
pathogenic in this ALS mouse model (Xu et al. 2010).
With regards to axonal transport, impairment of bi-directional transport of mitochondria has
been noted both in vitro and in vivo. A selective decrease in anterograde transport of
mitochondria was observed in G93A mSOD1 motor neurons, alongside a corresponding
increase in mSOD1-containing mitochondria at the cell body (De Vos et al. 2007). Furthermore,
abnormal accumulation of mitochondria in the soma and proximal axon of the anterior horn
neurons was reported in a post-mortem study of sALS patient spinal cord samples (Sasaki et al.
2007).
In light of this evidence, the aims of this investigation, concerning both ALS and ageing, was to
assess mitochondrial dynamic changes under two growth conditions in primary dermal
fibroblasts. From this, owing to the close relationship between form and function, the functional
state of the mitochondria, and thus the cell, may be inferred. Furthermore, we wished to assess
whether accumulating stress upon ageing influences cells from ALS patients differently
compared to cells from age-matched healthy controls.
6.2: Use of cellular models in biomedical investigation
6.2.1: Primary dermal fibroblasts
Throughout this investigation, primary dermal fibroblasts derived from both ALS patients and
control subjects were used to investigate mitochondrial form and function. These cells were
chosen as they are easily accessible and tractable model for experimental use. However, due to
their divergent function from neurons, care must be taken when interpreting any results in
relation to neurodegenerative disease. For example, fibroblasts use glycolysis as their preferred
209
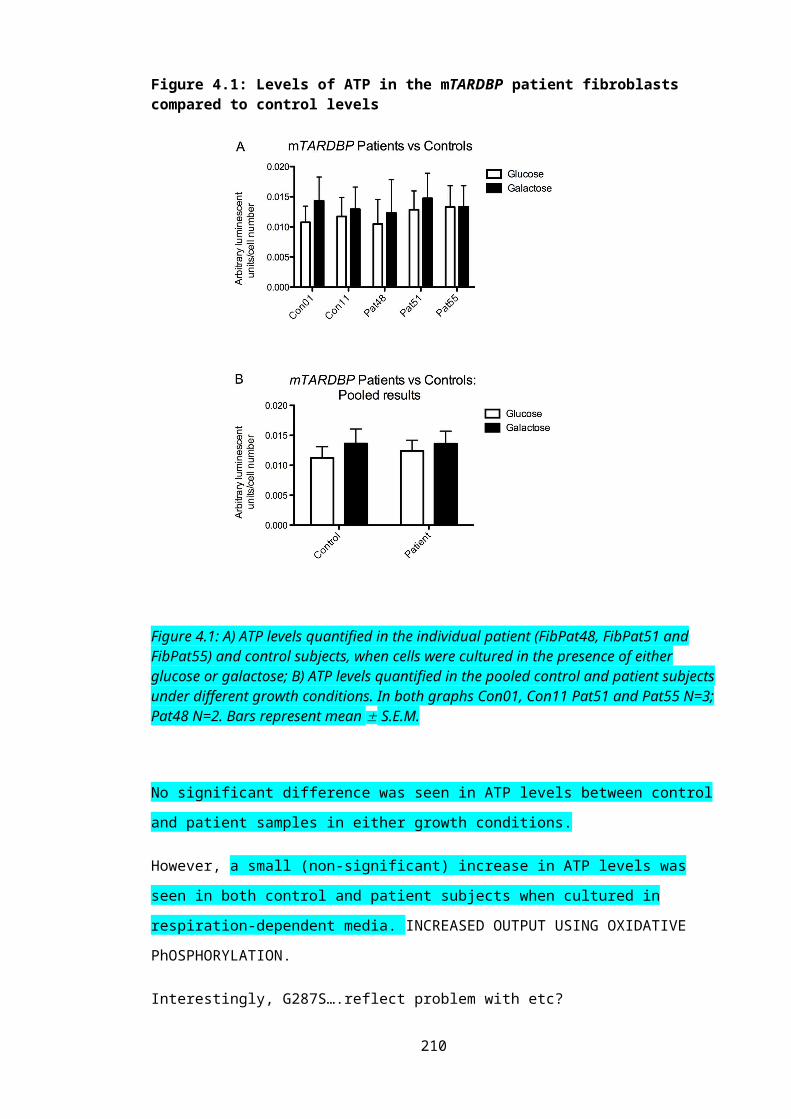
process for the generation of ATP, as opposed to oxidative phosphorylation, meaning caution is
required upon the analysis of bioenergetic defects in either ageing or ALS patient fibroblasts.
Nevertheless, it has been previously been shown that fibroblasts do, to some extent, recapitulate
defects seen in degenerating neurons. For example, a study of mParkin primary dermal
fibroblasts reported a deficiency in Complex I activity alongside a significant decrease in ATP
production compared to control samples. Interestingly, alterations in mitochondrial morphology
were also observed, with the mutant fibroblasts exhibiting a significant increase in
mitochondrial fusion (Mortiboys et al. 2008). Thus, these peripheral cells can provide an insight
into the pathological state of the neuron in neurodegenerative disease. Furthermore, the flat
shape of primary fibroblasts allows an insight into the morphology of the mitochondrial network
that is not technically achievable with cultured primary neurons.
6.2.1.1: Investigating changes in mitochondrial dynamics
6.2.1.1.1: Control and sALS patient fibroblasts
In the control cohort, increased mitochondrial interconnectivity was observed as the age of the
donor increased. It may be hypothesised that this increase in mitochondrial network complexity
represents a protective mechanism in the cell to cope with increasing age. Mitochondrial fusion
acts as an adaptive mechanism, and might be allowing the cell to endure the physiological
changes associated with ageing, including increasing oxidative stress, diminishing
mitochondrial metabolic output and an increase in the formation of mtDNA….??? HOW DO
YOU KNOW THAT IT IS AN ADAPTATION?
Conversely, when the fibroblasts from the control cohort were cultured in respiration-dependent
media, though an increase in network complexity was observed when compared to culture in
glucose-enriched conditions, the trend of increasing mitochondrial interconnectivity with ageing
was not seen. Thus, in fibroblasts derived from relatively healthy subjects, the ability to adapt to
forced oxidative phosphorylation remains consistent throughout ageing.
Interestingly in the control primary dermal fibroblasts, the spare respiratory capacity of these
cells increased during ageing, perhaps due to their noted reduction in glycolytic capacity (S.
Allen; Personal communication). ABSOLUTE? HOW IS THIS DEFINED? Thus, the older
fibroblasts appear to possess the ability to cope with an increased metabolic demand on the
mitochondria even in the face of the aforementioned functional defects seen in ageing. This
finding correlates with the observed consistency in the increased branching of the mitochondrial
network upon increased mitochondrial metabolism. As discussed shortly, this apparent increase
in mitochondrial efficiency upon ageing is unusual. It would be interesting to assess the levels
of mitochondrial respiratory chain supercomplexes in both the control and sALS patient
210

fibroblast cohort, to see if there is a difference in the quantity of these macromolecular
complexes as age increases or in a disease, and whether this correlates with the noted changes in
mitochondrial morphology.
In contrast to the results seen in the primary fibroblast control cohort, it has been shown in
brain, heart, and skeletal muscle that spare respiratory capacity decreases during ageing (Desler
et al. 2012). Further investigation will be required to establish whether the results noted in the
primary fibroblasts are an experimental artefact, specific to the cell type. This could be achieved
by converting the fibroblasts to motor neurons and again assessing mitochondrial function in
comparison to age.
The observed decline in mitochondrial spare respiratory capacity in various tissue has been
proposed to be a consequence of the noted increasing defects in oxidative phosphorylation, with
evidence of both Complex I and IV declining in function as age increases. Interestingly,
mitochondrial respiratory chain supercomplexes have previously been observed to undergo age-
related destabilisation in rat heart tissue, possibly underlying the typical increase in inefficient
electron flux along the ETC and reduction in spare respiratory capacity seen during ageing
(Gomez et al. 2009; Gomez et al. 2012). Furthermore, telomeric shortening during ageing
influences expression of two key regulators of mitochondrial dynamics, PGC-1 and PGC-1
(Sahin et al. 2011), as well as disrupting transcription of nuclear genes capable of regulating
mitochondrial function (Desler et al. 2012). Any changes in spare respiratory capacity will
impact enormously on neuronal function; when active, neurons function at approximately 80%
of their maximal mitochondrial-respiratory capacity (Nicholls 2002; Desler et al. 2012).
Consequently, age-related decline in spare respiratory capacity will render the neuron
susceptible to bioenergetic exhaustion, and subsequently increase the risk of neurodegenerative
disease.
This decline in mitochondrial functioning serves to further highlight the relationship between
neurodegenerative disease and ageing. Indeed, in the sALS patient fibroblast cohort, spare
respiratory capacity was found to always be lower than that their age-matched control samples
(S. Allen; Personal communication). It may therefore be interesting to examine Mfn2
expression in both control and sALS patient fibroblasts; as this gene is capable of promoting
both mitochondrial fusion and oxidative phosphorylation, it would be interesting to see whether
its expression alters as age increases…..MFN2 MUTATION DISEASE, WHY NOT MFN1?
As any changes in mitochondrial morphology are capable of influencing the motility of the
organelle, it was decided to investigate whether ageing in the control primary fibroblasts
influences mitochondrial movement. Though it has been reported that increased mitochondrial
fusion inhibits efficient mitochondrial transport, no significant changes were observed in this
investigation concerning the motility of the organelles as age increased. However, previous ex
211
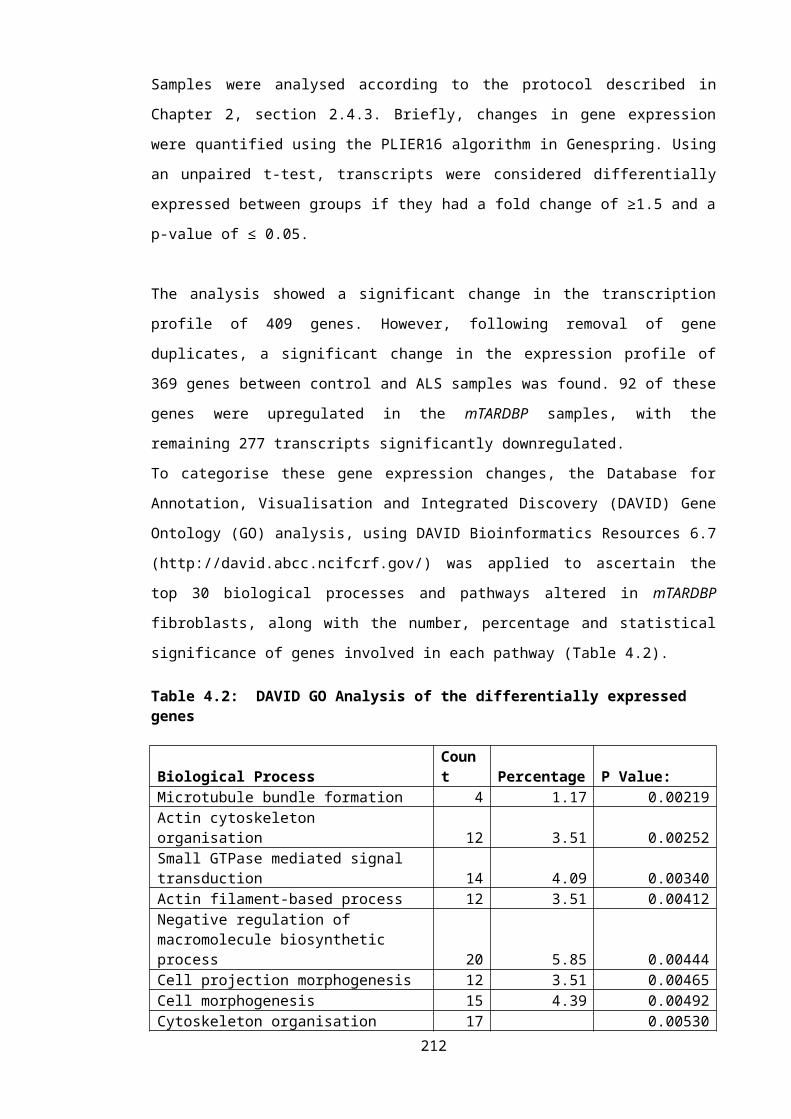
vivo investigation of mitochondrial transport in tibial nerve axons derived from young and old
mice revealed a significant decrease in anterograde transport upon ageing, re-enforcing the
notion that ageing can predispose to organelle dysfunction in neurodegenerative disease (Gilley
et al. 2012). It would be interesting to investigate whether these reported changes arise
concomitant with alterations in mitochondrial morphology. Unfortunately, the differences in
shape between fibroblasts and neurons will make it technically difficult to measure network
complexity in the neuronal cells…..MEASURE SOMETHING ELSE.
In contrast to the results observed in the control cohort, in the sporadic ALS cohort, a decrease
in branching was seen as age increases. It therefore appears that, in their diseased state, the cells
lose their ability to fuse the mitochondria. As mentioned, it is known that PGC-1 expression
alters upon ageing, and that this can influence Mfn2 expression. It may be possible that the
dynamics of this gene expression pattern in altered in ALS fibroblasts during ageing. However,
the activity of Mfn2 following PGC-1 induced expression is thought to be independent of its
fusion-inducing capabilities, so that the origin of this loss of fusion remains to be elucidated.
Whatever the cause of this mitochondrial fragmentation, it does suggest that the sALS primary
fibroblasts have lost the protection mitochondrial fusion supplies against the dysfunction
elicited by the disease state. For example, mitochondrial fragmentation may disrupt formation
of MAMs, possibly resulting in aberrant increases in cytosolic calcium concentration, which, in
turn would exacerbate the mitochondrial dysfunction. Furthermore, the loss of mitochondrial
fusion will leave the cell vulnerable to the increasing levels of ROS noted in both ageing and
neurodegenerative disease. Indeed, preliminary data from a DCF assay found that though ROS
levels decreased upon ageing in the control cohort, perhaps reflecting the protective ability of
mitochondrial fusion, oxidative stress increased by around 50% in the sALS patients from age
39 years to age 74 years (S. Allen; Personal communication). However, both cohort sizes were
small so these results will need to be validated. Furthermore, induction of the intrinsic apoptotic
cascade at times of increased cellular stress is linked to mitochondrial fragmentation
(Karbowski et al. 2002).
These results led us to conclude that the mitochondrial fusion state is correlated to age, and that
this relationship could interact to modify the prognosis of ALS. Interestingly, age has also been
noted as a modifier of the prognosis in Alzheimer’s disease, another neurodegenerative disease
characterised by mitochondrial fragmentation; patients diagnosed when 60-70 years old have a
prognosis of 7-10 years survival, however, in patients diagnosed when over 90 years old, life
expectancy is reduced to less than 3 years (Zanetti et al. 2009). In light of this evidence, it is
possible that targeting the fusion/fission dynamic in ageing sALS patients may be a therapeutic
approach worth investigating.
212
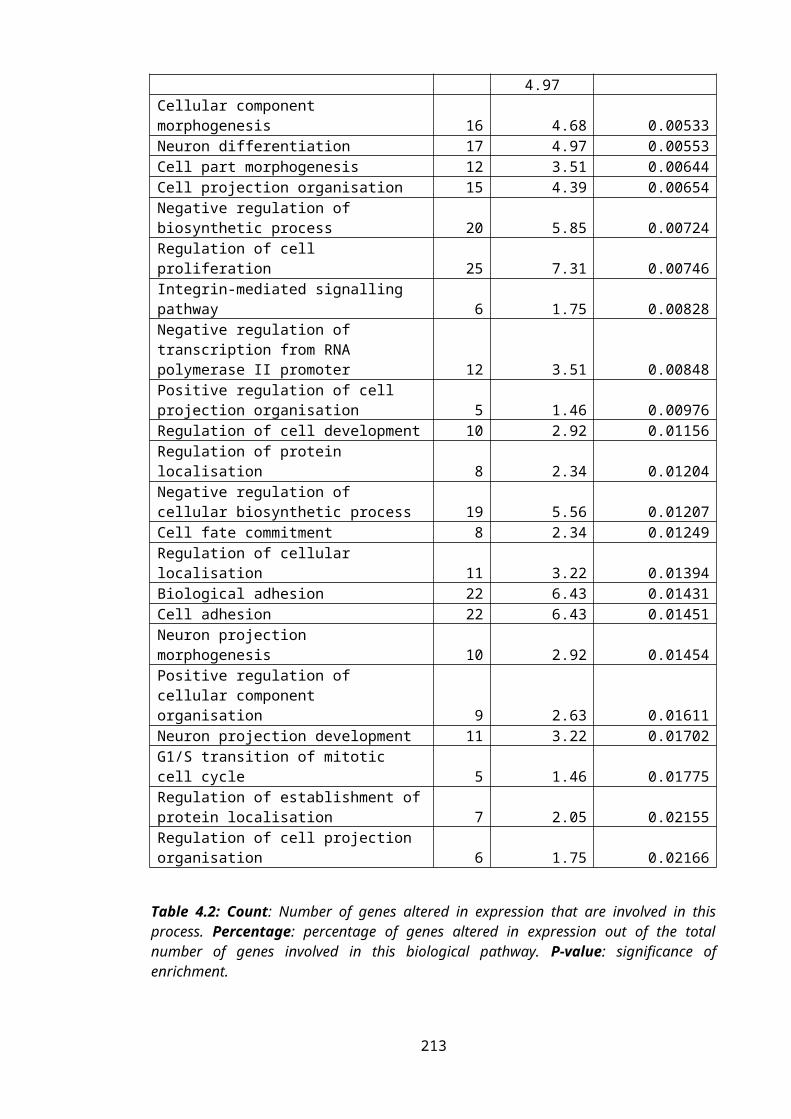
Identification of morphological changes in the sporadic ALS patients highlights another benefit
of working with primary fibroblasts. Patient-derived cells afford the opportunity to have a
model of sporadic disease, something not possible with an animal model. In this instance, the
results seemed to suggest a commonality between sALS patients and defects in mitochondrial
function. Further investigation to ascertain the precise changes in mitochondrial activity, and its
link to ageing, would be interesting in this cohort.
6.2.1.1.2: mTARDBP patient fibroblasts
Another benefit of working with patient-derived cells is that they express disease-associated
mutant proteins at a physiological level. This is of particular benefit when working with TDP-
43, a protein noted to be toxic upon over-expression (Ash et al. 2010; Estes et al. 2011).
Furthermore, the ability of TDP-43 to self-regulate its own expression, (Ayala et al. 2011),
leads to difficulties in creating stable transfection-based models. Conversely, the study of
patient fibroblasts provides a replicate of either the physiological or pathological expression of
TDP-43 that occurs in the patient. In the same way, the study of C9ORF72 and the disease-
related hexanucleotide repeat expansion benefits from the existence of patient fibroblasts. The
100% GC nucleotide content of the expansion results in difficulty creating and maintaining a
pathological repeat in plasmid vectors. However, the study of mC9ORF72 fibroblasts is not
without limitations and problems, as discussed later.
In spite of these benefits, there are caveats to be considered when working with patient derived
cells, some of which have impacted on this investigation. For example, though the protein of
interest is expressed at physiological levels, it is also expressed on heterogeneous genetic
backgrounds between unrelated patients. This is compounded by different environmental
exposures between patients, such as medication or diet, which can further contribute to genetic
variability. Additionally, differences in age of the donor will make a difference to the
functioning of the cell. We have already demonstrated that age influences mitochondrial
morphology, it may also influence changes in other cellular or mitochondrial functions, such as
calcium homeostasis. For example, alterations in mitochondrial fusion or fission may impact on
the formation or maintenance of MAMs, disrupting the regulation of calcium signalling.
Indeed, as with the sporadic cohort, variation was seen amongst the patients expressing
mTARDBP. For example, though both FibPat48 (A321V) and FibPat51 (M337V) exhibited a
trend towards an increase in fusion of mitochondria, FibPat55 (G287S) did not until the cells
were cultured in respiration-dependent media. Moreover, this variability is compounded by the
fact that it is currently unclear if the A321V mutation in TDP-43 is pathogenic; it is a novel
mutation, and the patient in question also possesses the hexanucleotide repeat expansion in
C9ORF72, also postulated to be pathogenic.
213
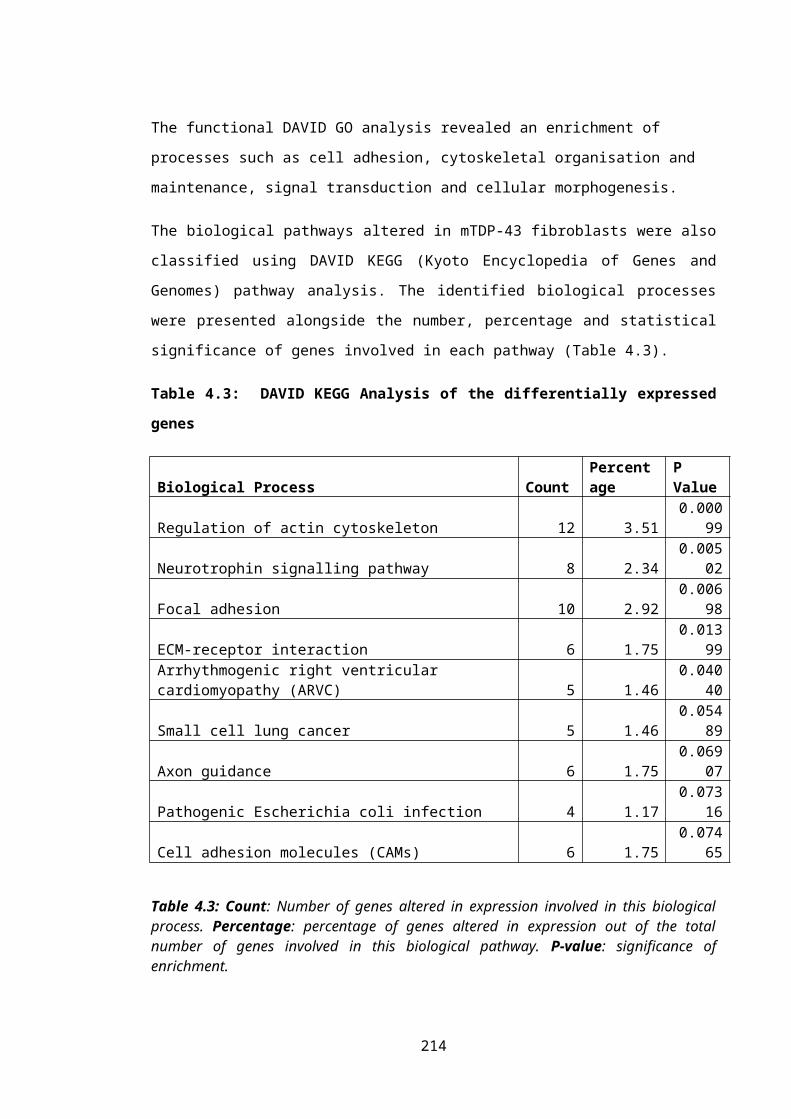
Unfortunately, the mTARDBP patient fibroblast cohort was too small to ascertain whether there
is an age effect on mitochondrial morphology in these cells. However, we wished to further
investigate the cause of this increased branching in the patient samples. As mitochondrial
morphology can be influenced by a variety of cellular processes, there were several avenues that
could be explored, including defective metabolism, disruption of calcium homeostasis and
altered functioning of the autophagy pathway.
6.2.1.2: Autophagy investigation
Microarray analysis revealed potential changes in both metabolism, including deregulation of
glycolysis and the TCA cycle, and autophagy. Decreases in expression of two genes involved in
both the initiation and progress of the autophagy pathway, namely Atg12 and MAP1S, were
subsequently validated using RT-qPCR. However, though FibPat48 and FibPat51 displayed
similar expression levels, FibPat55 was again an outlier when examining the expression of both
genes. Despite this inconsistency between samples, the expression levels were presented for
groups of mTARDBP patients versus controls in Chapter 4, Figure 4.9, in order to reflect the
microarray analysis. The variability between patients may be attributed to differences in age, or
potentially to the different mutations present in TDP-43, and raises questions about the pooling
of data retrieved from the cohort. It is possible that grouping of data may obscure any change
noted in individual patients.
Subsequent western blotting to assess LC3-II levels in mTARDBP patient fibroblasts showed no
significant differences between the patient and control cells, either under basal conditions or
following treatment with Bafilomycin A1. However, in FibPat51 expressing M337V mTDP-43,
there was the suggestion of a defect in autophagosome recycling, and FibPat55, expressing
G287S mTDP-43, potentially indicated an increase in the rate of autophagy, though result were
variable. Both of these changes could influence mitochondrial morphology.
However, analysis of the mTARDBP cohort was confounded by the discovery that one of the
patients carried the newly identified hexanucleotide repeat expansion in the first intron of
C9ORF72. Mutation of two potentially pathogenic genes appears to be unusually common in
C9ORF72-linked disease; for example, expression of the C9ORF72 expansion has been noted
alongside the deletion of serine at position 292 in TDP-43. As with the A321V mutation, it is
unclear whether this serine deletion is pathogenic. However, in this patient, the dual expression
of the mutations resulted in FTLD rather than ALS (Kaivorinne et al. 2012). Furthermore,
another FTLD patient has recently been identified as expressing the C9ORF72 mutation
alongside an Ala239Thr variant in MAPT. The patient developed evidence of a tauopathy
alongside the classical C9ORF72 pathological symptoms, including the p62-postive inclusions
214
in the hippocampus. Interestingly, the identified mutation in MAPT is typically benign,
suggesting that the C9ORF72 mutation is capable of influencing the pathogenicity of other
proteins (King et al. 2013). Finally, mutation of C9ORF72 has been associated with
Parkinsonian-like symptoms (Luigetti et al. 2013). The process of autophagy, specifically
mitophagy, is implicated in the pathogenesis of Parkinson’s disease. However, studies have so
far failed to find a link between the hexanucleotide expansion in C9ORF72 and PD (Harms et
al. 2012; van Rheenen et al. 2012). Interestingly, an oligogenic basis has been suggested to be
common in ALS (van Blitterswijk et al. 2012), perhaps explaining the variation noted between
patients throughout this investigation.
Adding to this variability, the penetrance of the C9ORF72 mutation is incomplete, with many
factors seeming to affect the allele becoming pathogenic. For example, though the mutation is
autosomal dominant, examination of one cohort found the C9ORF72 expansion at pathogenic
length in 0.6% of the control population (Cooper-Knock et al. 2012). It has also been suggested
that the mutation is derived from a common founder as it always segregates on the same
haplotype and does not derive de novo (Majounie et al. 2012). Thus, there must be additional
variables involved in the pathogenecity of the gene. It is currently unclear whether expansion
length influences penetrance, due to limitations of the screening method, though anticipation
has not yet been observed. Other genetic variables are likely to play a role, including the
aforementioned skew towards oligogenecity seen with C9ORF72 pathogenesis (van Blitterswijk
et al. 2012). Combined with the disputed pathogenicity of A321V mTDP-43, it is thus difficult
to establish the derivation of disease in this patient. Nevertheless, as this patient is a familial
case, it may be possible in the future to ascertain whether either the A321V mutation or the
C9ORF72 expansion co-segregates with the disease.
The investigation was further confounded by C9ORF72 expansion length variability. Due to the
nature of the repeat-primed PCR assay, it is not possible to accurately quantify the number of
repeats within the expansion, though it is known that these can be different between patients. In
addition to this, microarray analysis of three control subject fibroblasts revealed very low
expression levels of C9ORF72. Isoform 1 of C9ORF72 was detected at very low levels in both
the nucleus and cytoplasm, though slightly higher in the latter. Conversely, isoform 2 of the
gene was not detected in any of the samples; expression of isoform 3 was not investigated (P.
Heath; Personal communication). Furthermore, it cannot be clarified whether the mC9ORF72
patients express the protein at high levels in their fibroblasts due to problems with the available
antibodies, as discussed in Chapter 1.
Thus, there may be differences in either expression levels or expansion length in C9ORF72
between patient and control samples. Combined with the genetic heterogeneity, this raises
questions concerning the grouping together of data derived from the individual patients. Indeed,
215

though trends were observed within the data, the sample sizes used makes it impossible to
garner robust conclusions. Furthermore, it is difficult to ascertain whether any changes observed
in the individual patient-derived cells derive from an effect of the mutant protein or from
clinical variability arising from the heterogeneity of the test subjects.
Reflecting the variability inherent to the study of C9ORF72, and as somewhat expected, the
results obtained from investigating LC3-II levels in the mC9ORF72 fibroblasts were not
consistent between patients. No defects in autophagy activity were observed in FibPat48. This
was unexpected as both TDP-43 and C9ORF72 have been linked to the process of autophagy,
through HDAC6 and FIP200 respectively. It may be that autophagy needs to be induced by
rapamycin treatment in order to identify any defects present in this patient sample.
As with FibPat55 expressing G287S mTDP-43, in FibPat53, expressing the hexanucleotide
repeat expansion in C9ORF72, there was also a suggestion of an increase in the rate of
autophagic flux. It is not uncommon for autophagic activity to be elevated in neurodegenerative
disease, as a consequence of the accumulation of toxic protein aggregates. Indeed, in both ALS
and HD, an early increase in autophagosome formation has been noted, suggesting that the
unbalanced state of autophagic stress contributes to the pathogenic status of the cell (Li et al.
2008; Son et al. 2012). However, it will be necessary to carry out flux measurements in these
cells, as western blotting cannot provide the information as to whether it is an increase in
autophagic flux or autophagic stress that is observed in these patient fibroblasts.
Conversely, FibPat72 exhibited a trend towards decreased levels of autophagy, specifically with
LC3-II expression changes indicative of a defect in the initiation of autophagy. Interestingly,
deletion of FIP200 expression in mice resulted in decreased autophagosome formation (Liang et
al. 2010). In light of the perceived association between FIP200 and C9ORF72 (Behrends et al.
2010), it was hypothesised that each of the hexanucleotide expansion-containing patient
samples would show defects in autophagy initation. However the results observed may have
been confounded by the aforementioned problems of variation in both C9ORF72 expression
levels and expansion length.
Furthermore, quantification of mitochondrial morphology in C9ORF72 expansion-expressing
FibPat72, in glucose-enriched media, tentatively revealed a decrease in network complexity
compared to age-matched control samples (Figure 6.1). More patient fibroblasts expressing the
hexanucleotide repeat expansion will need to be investigated before the apparent fragmentation
of the mitochondrial network can be verified.
216
Figure 6.1: Mitochondrial network complexity of mC9ORF72 patient fibroblasts cultured in the presence of media containing 1mg/ml glucose
Figure 6.1: For each control or patient sample N=3 or 4. R2 value: 0.1246; where the slope significantly differs from 0: p 0.01. The difference between the control and patient slopes: Linear regression p 0.001.
As previously discussed in Chapter 4, changes in mitochondrial fusion/fission have been linked
to autophagic activity in the cell. Fragmentation of the mitochondrial network has been noted
upon initiation of mitophagy (Barsoum et al. 2006). However, this fragmentation is not essential
for induction of the pathway; it is believed to occur in response to the mitochondrial dysfunction
necessary for mitophagy initiation (Gomes et al. 2008; Ding et al. 2012). Furthermore,
knockout of Atg5 in a mouse model resulted in an increase in mitochondrial fission (Frank et al.
2012). It was postulated that this fragmentation reflects a pool of dysfunctional mitochondria
accumulated due to a decrease in autophagic activity. Thus, the hint of decreased network
complexity in FibPat72 corresponds with the identification of a possible problem with
autophagy initiation, potentially linked to dysfunction of FIP200 activity in the presence of the
C9ORF72 hexanucleotide repeat expansion.
Further investigation will be required to fully understand the involvement of the autophagy
pathway in the pathogenesis of mTARDBP or mC9ORF72-mediated ALS. Unfortunately,
analysis of the effect of induced autophagy could not be achieved as treatment of the fibroblasts
with rapamycin failed to induce autophagy, as assessed by the formation of LC3-II. The low
levels of LC3-II under these un-stimulated conditions suggests that autophagic activity is low in
fibroblasts; stressing the cells via forced induction of autophagy may have helped to unearth
more pronounced defects in the pathway in the patient fibroblasts. However, it has previously
been noted that Rapamycin treatment may not be the most effective drug to induce autophagy in
fibroblasts, as its inhibition of mTORC1 has been found to not be sufficient to elicit a robust
autophagic response. Conversely, treatment of mouse embryonic fibroblasts with Torin-1, a
compound capable of inhibitng both mTORC1 and mTORC2, as well as suppressing the 217
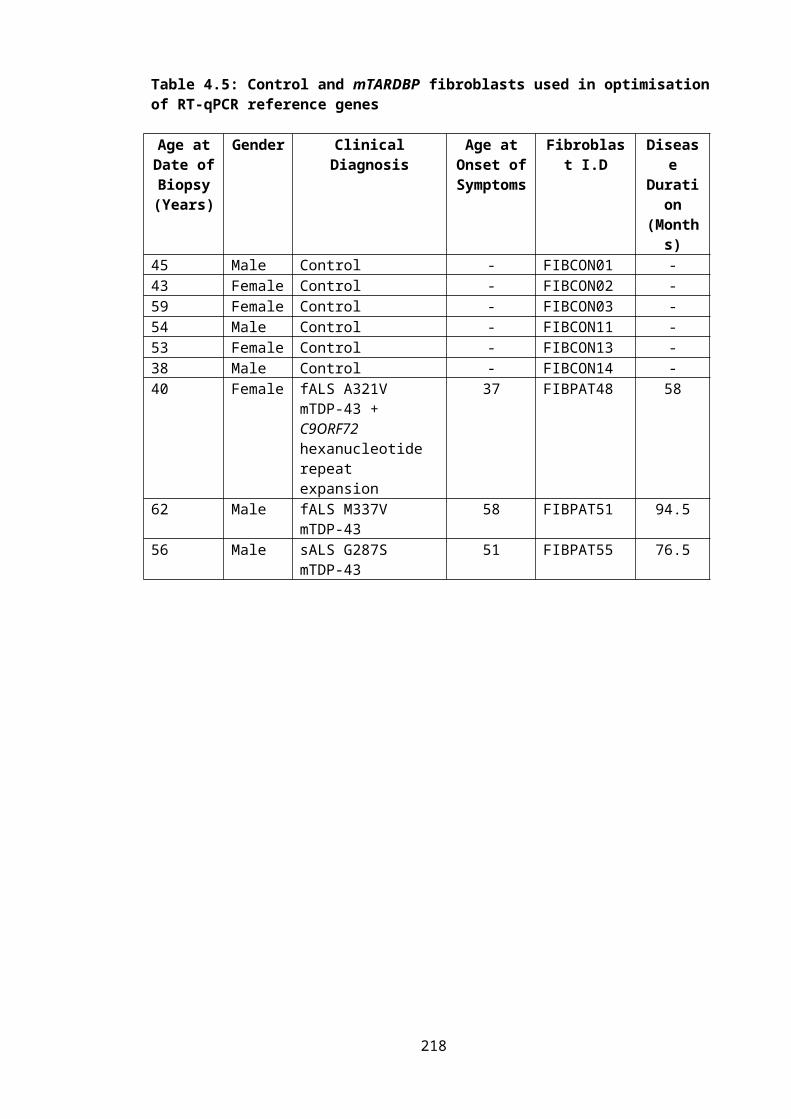
rapamycin-resistant functions of mTORC1, resulted in a robust induction of LC3-II formation,
indicative of autophagy activation (Ref). This result has since been repeated by a colleague in
our laboratory, which will permit the investigation of the effect of induced autophagy in the
ALS patient–derived fibroblasts.
It will also be interesting to ascertain whether the subtle differences in both mitochondrial
morphology and LC3-II levels in these mTARDBP and mC9ORF72 fibroblasts derive from
alterations in macroautophagy, or specifically mitophagy. Defects in autophagy are common in
neurodegenerative disease, and cytoplasmic accumulations of both TDP-43 (C. Hewamadduma;
Personal communication), and C9ORF72 (Renton et al. 2011) have been observed in patient-
derived fibroblasts. However, an interaction of Parkin and TDP-43 has been observed,
potentially linking mutations in TARDBP to the mitophagy pathway (Hebron et al. 2013).
Further investigation will be needed to clarify this point.
Due to the discussed caveats in using primary fibroblasts and the variation noted with the
autophagy results, it may be desirable to investigate the effect of C9ORF72 and the repeat
expansion in a lymphoblastoid cell line. Preliminary southern blot analysis assessing C9ORF72
expansion size using genomic DNA from both primary fibroblasts and spinal cord tissue has
shown several bands, indicative of diversity in the length of the hexanucleotide repeat
expansion in both the patient-derived fibroblasts and spinal tissue (A. Higginbottom; Personal
communication). Conversely, as shown by DeJesus-Hernandez et al, in 2011, southern blot
analysis using lymphoblast cell lines gives only one additional allele, indicating relative stability
in expansion length within this polyclonal population. Thus, using a polyclonal population such
as a lymphoblastoid cell line would ensure stable expression of mC9ORF72, perhaps helping to
reduce variation in results.
6.2.1.3 MAMs
Despite inherent variability in studying patient-derived cells, compounded by their different
pathogenic mutations, it is possible that commonalities do exist between these patients. Indeed,
in each of the mTARDBP patient samples, the proposed pathogenic mutation occurred in the
glycine-rich region, an area utilised in RNA-binding. Therefore, despite carrying different
mutations, the individual patients may have disruption in the RNA metabolism of similar genes,
and thus roughly the same pathogenic effect is observed. Indeed, study of MAMs in the primary
dermal fibroblasts produced a similar result in each of the mTARDBP patient samples.
Deregulation of calcium homeostasis will have a profound impact on cell function, due to the
integral role calcium plays in cell signalling, regulation of metabolism and initiation of
218
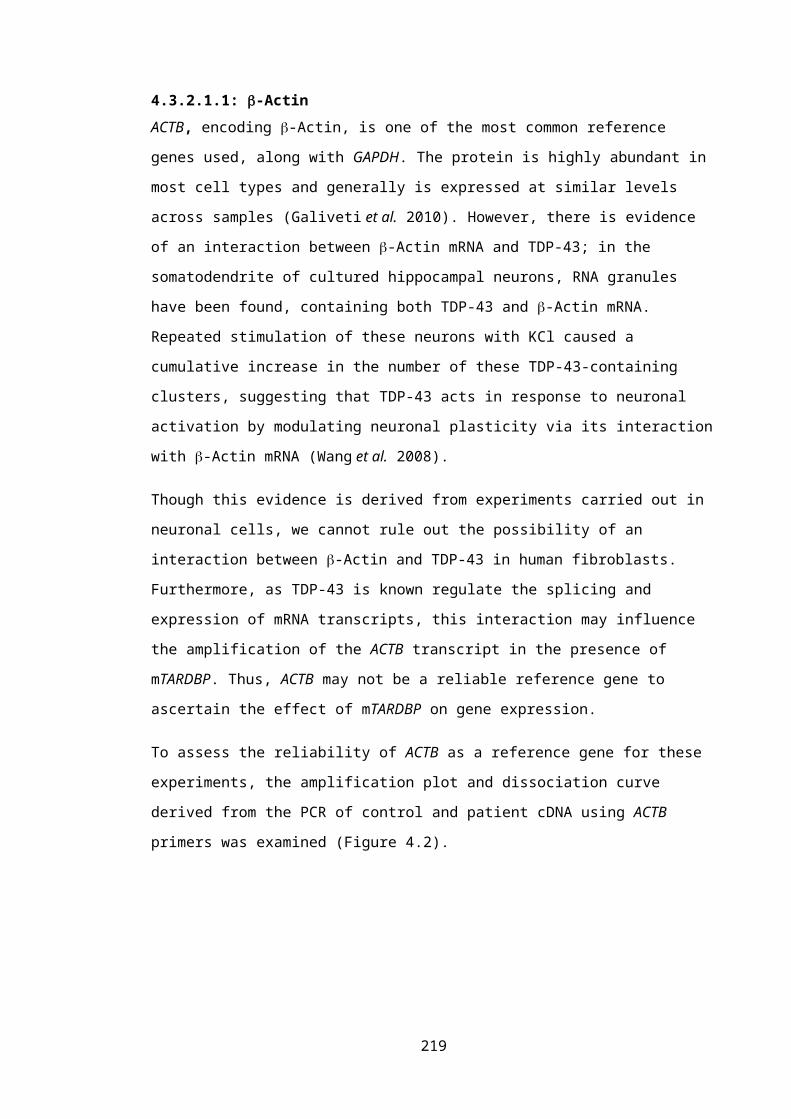
apoptosis. The formation and maintenance of MAMs plays an important role in this regulation
of calcium homeostasis. For example, the expression of the ALS-mutant VAPBP56S in a
HEK293 cell line resulted in a decrease in the distance found between the ER and mitochondria
and thus a significant increase in the levels of calcium in the mitochondria (De Vos et al. 2012).
Such an overload will alter the bioenergetic homeostasis of the mitochondria; calcium regulates
the activity of a number of enzymes in the TCA cycle, including pyruvate dehydrogenase and
succinate dehydrogenase (Bernardi 1999; de Brito et al. 2010), to ensure the metabolic output
matches cellular demand.
It was postulated that in the mTARDBP fibroblasts there is a disruption in MAM formation,
perhaps deriving from the noted trend towards an increase in mitochondrial branching in these
patient samples. Indeed, ICQ analysis suggested an increased association of the ER and
mitochondria in all three of the mTARDBP-expressing fibroblasts. It would be interesting to
investigate whether there is any evidence of mitochondrial calcium overloading in these patient
samples, a pathological state which may explain the potential increased mitochondrial
interconnectivity due to established relationship between calcium homeostasis and metabolic
output.
For example, an increase in calcium activates PDHP (the phosphatase capable of activating the
E1 subunit of PDH). This calcium-mediated activation of PDHP will serve to exacerbate the
effect of the aforementioned noted decrease in the expression levels of PDPR. Furthermore,
PDK1, whose gene expression is decreased 1.5 fold in the mTARDBP patient fibroblasts, is also
inhibited by an increase in intra-mitochondrial calcium. Thus, the slight increase in the
colocalisation of the ER and mitochondria may result in the noted increase in the functioning of
the TCA cycle.
Furthermore, the accumulation of calcium in the mitochondria, with the subsequent reduction of
calcium around the ER, impacts on the sensitisation of the IP3Rs and consequently on the
efficient propagation of the calcium wave (Duchen 2000). This may be compounded by the
aforementioned potential downregulation in the expression of Calm3.
Increased levels of calcium in mitochondria are known to exacerbate levels of ROS production,
via interactions with various proteins in the organelle. As discussed, elevated calcium levels
inhibit functioning of mitochondrial respiratory enzymes and interfere with the interaction
between the IMM lipid, cardiolipin, respiratory enzymes and cytochrome c (Damiano et al,
2006, Iverson et al, 2004). Disruption of these interactions will destabilise the localisation of
cytochrome c on the IMM, leaving the organelle vulnerable to the production of ROS, as well as
disturbing the function of the ETC (Iverson et al. 2004). Associated with this, it has been
hypothesised that calcium binding to cardiolipin may impair the flow of electrons along the
ETC, specifically impeding flow at the level of complex III (Paradies et al. 2009). These
219

deficits induced by excessive calcium influx into the mitochondria will influence the dynamics
of the organelle. Increased production of ROS has previously been noted to result in an increase
in mitochondrial interconnectivity (Koopman et al. 2005), presumably as an adaptive response
to enable efficient functioning of mitochondria in the face of increased cellular stress. As
mentioned, increased branching of the mitochondria was observed in the patient expressing
M337V mTDP-43 under both basal conditions and under conditions of metabolic stress.
However, the changes seen in mitochondria and ER colocalisation in the mTARDP patients
compared to control samples were both non-significant and relatively small. It is unlikely that
these changes are substantial enough to have a physiological impact, thus no further
investigation was made. Nevertheless, it may be necessary to culture the fibroblasts under
conditions of glucose deprivation for at least 24 hours; the absence of glucose has been shown
to induce ER stress following activation of the IRE pathway and UPR (Badiola et al. 2011). It
may be possible that this exacerbation of ER stress is needed to reveal any pathogenic changes
in MAM maintenance in the mTARDBP fibroblasts. It would also be interesting to quantify any
changes in auto-fluorescence of NADH, a measure of the function of the TCA cycle (Duchen
2000), both to validate the changes seen in the microarray analysis and to assess whether MAM
alterations have an influence in these patient cells.
Furthermore, it may also be worthwhile to look at whether the prevalence of MAMs changes
during ageing; the aforementioned increase in mitochondrial network complexity as age
increases has the potential to impact on MAM formation, perhaps contributing to the increased
cellular stress previously seen upon ageing. If any changes are identified, this may explain the
variation observed in the ICQ investigation that accounted for the lack of statistical significance.
Moreover, it may be that the use of an in situ proximity ligation assay, such as the Duolink
assay used in the VAPB/PTPIP51 investigation, would provide more conclusive results (De Vos
et al. 2012). This methodology is capable of detecting weak interactions due to signal
amplification increasing the sensitivity. Additionally, transient interactions can be detected, an
important quality in light of the dynamic nature of MAM formation.
6.2.1.4: Future work using primary dermal fibroblasts
Though the morphological change observed in mitochondria of primary dermal fibroblasts upon
ageing, in both control and disease samples, hints at associated changes in mitochondrial
function, it will be necessary to carry out functional measurements to confirm this. In particular,
the functioning of Complex I of the ETC should be investigated; changes in this complex are
known to correlate with mitochondrial morphological changes (Koopman et al. 2005).
Furthermore, particularly in FibPat55, expressing G287S mTDP-43, enhanced mitochondrial
220
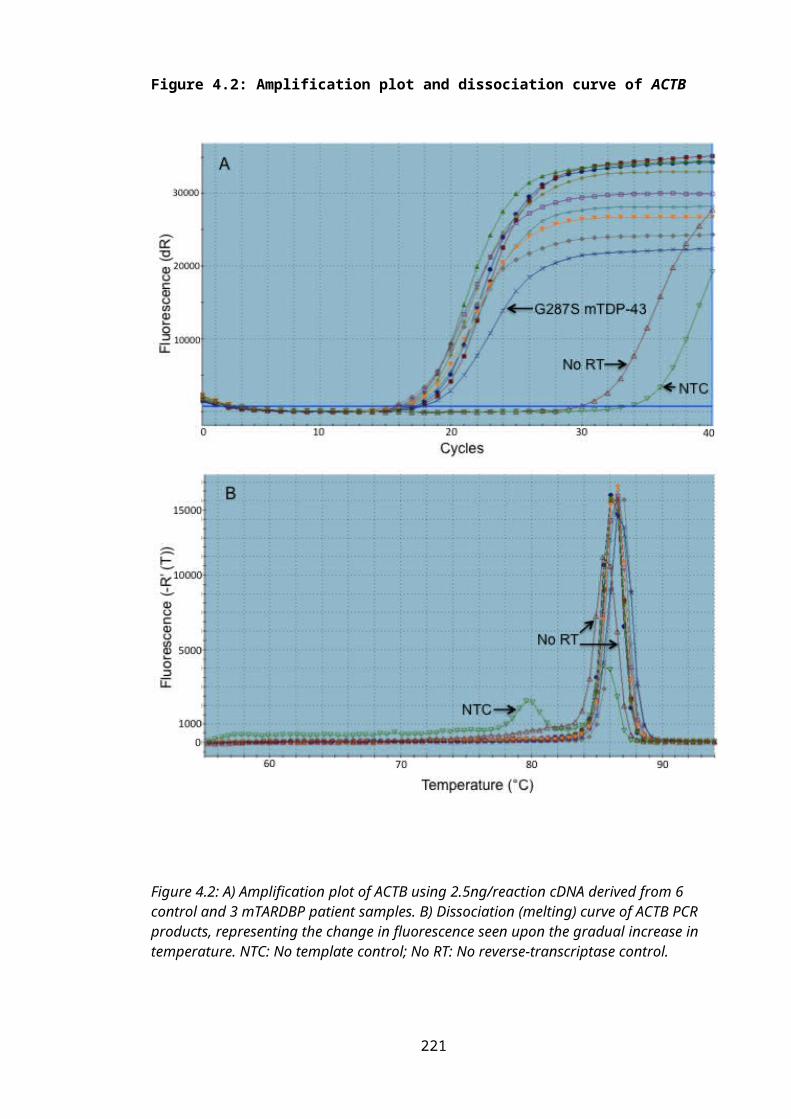
fusion upon culture in respiration-dependent media is further indicative of defects in the
functioning of the ETC.
Related to this, it will be important to measure ROS levels in both the control and patient
samples, as many of the hypothesised defects in mitochondrial functioning, related to the noted
changes in mitochondrial morphology in both ageing and ALS, involve changes in ROS
production. If ROS production is found to correlate with age in sALS patient fibroblasts, it
would be interesting to treat these cells with pro-fusion drugs to see whether a forced change in
mitochondrial dynamics is capable of ameliorating production of ROS, thereby confirming that
an increase in mitochondrial fusion can protect against the detrimental effects of increased ROS
production.
However, any defects in oxidative phosphorylation, leading to oxidative stress, would be
expected to result in a decrease in ATP production following culture in respiration dependent
media. This was not observed when ATP levels were quantified in mTARDBP fibroblasts
(Figure 4.1). It may be necessary to culture in respiration dependent media for longer than 24
hours in order to exacerbate dysfunction of the ETC; residual glycogen stores in the fibroblasts
may prevent any defects being observed after 24 hours of exogenous glucose deprivation.
Similarly, though no significant defects were observed upon quantification of MAMs in the
mTARDBP fibroblasts, it is possible that differences may be noted upon further optimisation of
the experimental conditions. For example, culture of the fibroblasts in galactose-containing
media instead of glucose is likely to encourage association between the ER and mitochondria in
order to increase the efficiency of oxidative phosphorylation via calcium signalling (Hayashi et
al. 2009). It may be postulated that any defects in MAM formation in the presence of
mTARDBP would thus be revealed under these forced conditions. Deprivation of glucose has
also been shown to induce ER stress (Badiola et al. 2011), which may further exacerbate any
existing defects in MAM formation. Incidentally, several genes involved in ER function, such
as Erlin2, Atl1 and Atl2, were altered in expression in the microarray analysis of the mTDP-43
fibroblasts. It would be interesting to validate these expression changes using RT qPCR.
Furthermore, as previously mentioned, the use of an in situ proximity ligation assay, such as a
Duolink kit would provide more conclusive results than those obtained using conventional
immunocytochemistry. If aberrant formation or maintenance of MAMs was noted in the mTDP-
43 patient fibroblasts, any consequent defect in calcium homeostasis could subsequently be
assessed using a Fura-2 based assay, providing further insight into mitochondrial dysfunction in
the patient fibroblasts.
With regard to quantification of autophagy levels in the patient fibroblasts, it would be desirable
to induce autophagy initiation in the cells, either by rapamycin treatment or starvation, to see if
221
a more severe defect is revealed under these forced conditions. Furthermore, it would be
interesting to knockdown C9ORF72 expression in control fibroblasts to see if a defect in
autophagy can be observed. As well as confirming the relationship between C9ORF72 activity
and autophagy, this experiment would also help to ascertain whether the observed pathology in
ALS patients is a result of loss of C9ORF72 function or arises as a consequence of the intronic
expansion resulting in the generation of toxic RNA species.
6.2.2: Mitochondrial dynamics and axonal transport
As discussed, regulation of mitochondrial dynamics is extremely important in neuronal
maintenance. One aspect of this is the regulation of mitochondrial motility, enabling efficient
axonal transport. Due to their critical role in neuronal function, defects in mitochondrial axonal
transport have repeatedly been associated with neurodegeneration and the induction of a “dying
back axonopathy” (Blackstone 2012).
This dying back of axons in the lateral corticospinal tract and posterior columns characterises
HSP (Blackstone 2012). Further evidence of defective axonal transport in this disease came
from study of a mouse model of SPG4 HSP, where expression of Spastin is essentially knocked
out (Kasher et al. 2009). A specific disruption in anterograde axonal transport of mitochondria
and MBOs was noted in primary cortical neurons derived from transgenic mice heterozygous or
homozygous for the mutant protein (Kasher et al. 2009). Concomitant with this transport defect,
axonal swellings were noted in the cortical neurons. These swellings consisted of components
of the cytoskeleton, such as Tau, neurofilaments and APP, as well as other cellular organelles,
including mitochondria, and were observed to increase in number as expression of spastin
decreased. Interestingly, the presence of swellings was also noted upon inspection of HSP
patient post-mortem spinal cord sections (Kasher et al. 2009). Thus, it is possible that these
swellings play a role in the pathogenesis of SPG4 HSP.
Consequently, the aim of this investigation, looking at HSP, was to further characterise the
cortical neurons derived from spast +/+, spast ∆E7/+ and spast ∆E7/∆E7 mice. Specifically, we wished
to identify a pharmacological intervention, focusing on MAPs, which is capable of ameliorating
the number of swellings formed in the mutant mouse cortical neurons.
6.2.3: Primary cortical neurons
In contrast to study of patient derived primary fibroblasts, working with cortical neurons from
mouse models provides the benefit of a homologous genetic background resulting from over
five generations of back-crossing. Nevertheless, we wished to observe whether genetic
background can influence the effect mSpastin has on the pathology of the neurons. Following 222
quantification of axonal swellings in cortical neurons taken from mice expressing the mutant
Spastin on the FVB, BALBC or C57BL/6 genetic background, no difference in axonal swelling
number was observed between these strains, further supporting the argument that any defect in
the functioning of the cortical neurons is a result of the Spastin mutation. In further contrast to
the fibroblast work, study of cortical neurons also means any results observed are obtained from
a pathologically relevant cell type, displaying neuronal characteristics similar to the
corticospinal neurons afflicted in HSP.
However, a homogeneous genetic background does not reflect the clinical situation of genetic
diversity in man, though it does make the interpretation of any results easier. Furthermore, it
was found that the primary cortical neurons were highly sensitive to pharmacological
intervention. This was evident upon treatment of the neurons with 0.5% DMSO either as a
solubilising agent for the microtubule-interacting drug, Tro19622, or as a vehicle control. Both
neuronal morphology and the formation of swellings were altered upon this DMSO treatment.
The high concentration of DMSO was necessary due to the lipophilic properties of the
cholesterol-like drug (Santos et al. 2003; Bordet 2010); elevated levels of DMSO were required
to efficiently solubilise Tro19622 in the media.
However, it has been noted that treatment of cells with DMSO does influence their physiology.
Numerous cellular processes have been identified as altered in the presence of varying
concentrations of DMSO, including lipid metabolism, apoptosis, protein expression, ROS
scavenging and enzymatic activity (Santos et al. 2003). It was noted over 30 years ago that the
application of DMSO on neurons disrupted their axonal transport. Treatment of a cat vagus
nerve with 5-10% DMSO substantially blocked fast axonal transport, as well as causing
swelling or shrinkage of the axon (Donoso et al. 1977). This influence on axonal transport is
believed to derive from the stabilising effect DMSO has on microtubule polymerisation in vitro
(Donoso et al. 1977), something that could dramatically influence the functioning of the
cytoskeleton in the absence of Spastin, where the microtubules are already aberrantly stabilised
(Fassier et al. 2012). Though the levels of DMSO used on the cat vagus nerve were 10-20 times
higher than the dosage used in the present experiment, the former investigation was carried out
using fully developed neurons in an ex vivo setting. It is possible that cultured embryonic
neurons are more susceptible to the actions of DMSO. Indeed, in vitro treatment of rat
hippocampal neurons with 0.4% DMSO abolished the diffusion barrier at the axon initial
segment, significantly disrupting the polarisation of the neuron (Winckler et al. 1999). It has
been postulated that even low doses of DMSO uncouple the membrane from the membrane
skeleton (Winckler et al. 1999). As discussed, Spastin has been associated with the linkage of
the plasma membrane and the cytoskeleton, particularly in the process of endocytosis
(Blackstone 2012). Thus, the loss of Spastin, coupled with the application of DMSO, is likely to
223
influence the functioning of the neuron, including axonal transport, and therefore prevent any
potential therapeutic effect of Tro19622.
Moreover, recent evidence by Fassier et al may further explain why application of Tro19622
was not effective in reducing the number of axonal swellings in these neurons. Investigation of
a SPG4 mouse model surprisingly found no evidence of the altered polymerisation of tubulin, as
the average velocity of the EB3-GFP comets at the plus-end of the microtubules was unaltered.
Interestingly, a significant decrease in the number of microtubule plus-ends was noted in the
spast ∆/∆ neurons (Fassier et al. 2013). Thus, it is feasible that, in the absence of Spastin, the
uncleaved microtubules are subject to various post-translational modifications, significantly
altering their dynamicity. The resulting lack of microtubule plus-ends may disrupt the p150Glued
Dynactin–mediated loading of the retrograde-directed cargoes (Vaughan et al. 2002), possibly
explaining the observed Brownian movement and stalling of the cargoes at the pathogenic
swellings, as well as the distal exacerbation of retrograde axonal transport (Fassier et al. 2013).
It is therefore possible that Tro19622 was unable to restore efficient axonal transport in the
spast ∆E7/∆E7 neurons, due to decreased levels of microtubule plus-ends in the absence of Spastin.
The effect of the drug-mediated upregulation of EB3-protein recruitment to the plus-ends of the
microtubules will thus be negated. Furthermore, the predicted drug-induced increase in the
microtubule polymerisation rate appears irrelevant in light of the evidence of unaffected
microtubule polymerisation in the spast ∆E7/∆E7 neurons.
However, in an unexpected role, preliminary evidence suggests that application of Tro19622
increases acetylation of tubulin (Figure 5.12), a post-translational modification thought to
regulate the dynamicity of the microtubule network (Baas et al. 2006; Fukushima et al. 2009).
The addition of acetyl-Lys40 on -tubulin is indicative of stability of the microtubule network
(Matsuyama et al. 2002; Haggarty et al. 2003; Dompierre et al. 2007), and is thus an important
factor in the regulation of axonal transport. Opposing activity of HATs and HDACs regulate
acetylation levels on both histones and cytoskeletal tubulin. Accordingly, pharmacological
regulation of HDAC activity has been therapeutically implicated in several neurodegenerative
disorders, including HD, AD and CMT.
In a mHSPB1-induced mouse model of CMT, study of the DRG neurons found evidence of
defective axonal transport of mitochondria. Treatment with a specific inhibitor of HDAC6,
Tubastatin A, was able to restore mitochondrial transport (d'Ydewalle et al. 2011), possibly by
increasing the efficiency in the binding of motor proteins to the microtubule track (Dompierre et
al. 2007). As both anterograde and retrograde axonal transport was disrupted in our mouse
model of SPG4-mediated HSP (Kasher et al. 2009), increasing the affinity of Kinesin-1 and
Dynein to the microtubule network via the inhibition of deacetylation was hypothesised to be
224
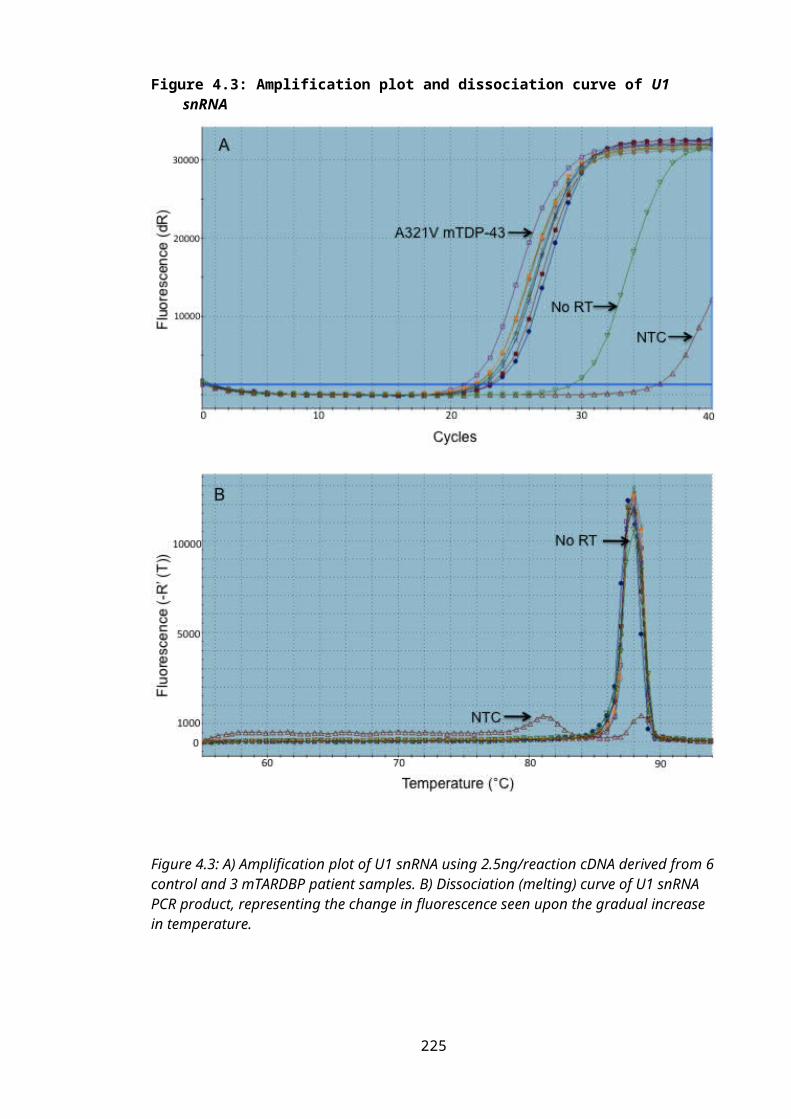
beneficial in the spast ∆E7/∆E7 neurons, as evidenced by a decrease in the number of axonal
swellings.
However, no amelioration in the number of axonal swellings was observed in Tro19622-treated
spast ∆E7/∆E7 cortical neurons compared to untreated cultures. Conversely, treatment of neurons
with Tubastatin A significantly reduced the number of swellings in the homozygous cortical
neurons down to wild type levels (Figure 5.13). In contrast to Tro19622, Tubastatin A was
solubilised in 0.1% DMSO. It may be proposed that this reduction in DMSO concentration
enabled the necessary change in microtubule dynamics to occur, allowing the recruitment of
motor proteins to the microtubule network, and thus permitting the drug to produce a reduction
in the number of swellings. It may be worth testing whether the ability of Tubastatin A to
reduce axonal swelling frequency is maintained when the drug is solubilised in 0.5% DMSO.
Conversely, it may be that Tro19622 is simply not potent enough to influence the formation of
axonal swellings, as it took the application of a highly specific HDAC6 inhibitor to see an
affect.
6.2.3.1: Future Work investigating SPG4 HSP
Due to the implication of aberrant tubulin acetylation in the pathogenesis of mspast-mediated
HSP, as demonstrated by the effective treatment of the neurons by Tubastatin A, it will be
crucial to definitively quantify any changes in the acetylation state of -tubulin between wild
type and mSpast primary cortical neurons. This can be achieved by carrying out western
blotting of the neuronal samples, using anti-acetylated -tubulin. It may be hypothesised that
acetylation is aberrantly decreased in the mutant neurons, restricting the dynamicity of the
microtubule network.
In order to further consolidate the beneficial effects of Tubastatin A treatment in the primary
spast ∆E7/∆E7 cortical neurons, it will also be necessary to carry out quantification of axonal
transport in these cells, likely focusing on the mitochondria. It would be interesting to see if the
HDAC6 inhibitor can ameliorate the defect in anterograde transport previously noted upon
knockdown of Spastin.
It would also be interesting to ascertain whether treatment of the neurons with Tubastatin A acts
by either preventing the formation of the pathogenic swellings, or eradicating them once
formed. Since the drug was added to the culture one-day post-prep, it is currently unclear which
mechanism Tubastatin A works by. It will be necessary to allow the neurons to grow in culture,
form the pathogenic swellings and then add the drug treatment. I would predict that the drug
will be able to eradicate the swellings after their formation, by enabling more efficient axonal
transport by microtubule acetylation, and thus helping to remove the blockage once it has
formed. However, this may require a longer treatment or an increased concentration of the drug.
Indeed, in vivo, the treatment length of Tubastatin A was 21 days (ref).225
Finally, it will be interesting to assess whether it is the inhibition of HDAC6 that mediates the
reduction in the number of axonal swellings. Though biochemical assays were carried out to
establish the specificity of Tubastatin A for HDAC6 (REF), the drug did also exhibit the ability
to inhibit the activity of HDAC8, albeit at a lower efficacy. Thus, it is necessary to establish that
the amelioration of axonal swellings occurs through HDAC6 inhibition.This could be achieved
by either crossing a HDAC6 knockout mouse with the spast ∆E7/∆E7 mouse, or applying siRNA
against HDAC6 in the spast ∆E7/∆E7 mouse. Subsequent investigation into the number of axonal
swellings, the efficiency of axonal transport and the overall phenotype of the mouse would
ascertain the influence of direct HDAC6 inhibition on the mspast phenotype. If these
experiments look promising, it may be appropriate to move Tubastatin A treatment into in vivo
work studying HSP.
GALACTOSE FOR LONGER, H202, IPS CELLS
PLIER OVER EXAGGERATE
226

Bibliography
Abou Jamra, R., O. Philippe, A. Raas-Rothschild, S. H. Eck, E. Graf, R. Buchert, G. Borck, A. Ekici, F. F. Brockschmidt, M. M. Nothen, A. Munnich, T. M. Strom, A. Reis and L. Colleaux (2011). "Adaptor Protein Complex 4 Deficiency Causes Severe Autosomal-Recessive Intellectual Disability, Progressive Spastic Paraplegia, Shy Character, and Short Stature." American Journal of Human Genetics 88(6): 788-795.
Acin-Perez, R., P. Fernandez-Silva, M. L. Peleato, A. Perez-Martos and J. A. Enriquez (2008). "Respiratory Active Mitochondrial Supercomplexes." Molecular Cell 32(4): 529-539.
Afifi, A. K., F. P. Aleu, J. Goodgold and B. MacKay (1966). "Ultrastructure of Atrophic Muscle in Amyotrophic Lateral Sclerosis." Neurology 16(5): 475-481.
Aguirre, T., L. Van Den Bosch, K. Goetschalckx, P. Tilkin, G. Mathijs, J. J. Cassiman and W. Robberecht (1998). "Increased Sensitivity of Fibroblasts from Amyotrophic Lateral Sclerosis Patients to Oxidative Stress." Annals of Neurology 43(4): 452-457.
Ahn, B. H., H. S. Kim, S. Song, I. H. Lee, J. Liu, A. Vassilopoulos, C. X. Deng and T. Finkel (2008). "A Role for the Mitochondrial Deacetylase Sirt3 in Regulating Energy Homeostasis." Proceedings of the National Academy of Sciences of the United States of America 105(38): 14447-14452.
Akhmanova, A. and M. O. Steinmetz (2008). "Tracking the Ends: A Dynamic Protein Network Controls the Fate of Microtubule Tips." Nature Reviews. Molecular Cell Biology 9(4): 309-322.
Al-Sarraj, S., A. King, C. Troakes, B. Smith, S. Maekawa, I. Bodi, B. Rogelj, A. Al-Chalabi, T. Hortobagyi and C. E. Shaw (2011). "P62 Positive, Tdp-43 Negative, Neuronal Cytoplasmic and Intranuclear Inclusions in the Cerebellum and Hippocampus Define the Pathology of C9orf72-Linked Ftld and Mnd/Als." Acta Neuropathologica 122(6): 691-702.
Alavian, K. N., S. I. Dworetzky, L. Bonanni, P. Zhang, S. Sacchetti, M. A. Mariggio, M. Onofrj, A. Thomas, H. Li, J. E. Mangold, A. P. Signore, U. Demarco, D. R. Demady, P. Nabili, E. Lazrove, P. J. Smith, V. K. Gribkoff and E. A. Jonas (2012). "Effects of Dexpramipexole on Brain Mitochondrial Conductances and Cellular Bioenergetic Efficiency." Brain Research 1446: 1-11.
Alderson, N. L., B. M. Rembiesa, M. D. Walla, A. Bielawska, J. Bielawski and H. Hama (2004). "The Human Fa2h Gene Encodes a Fatty Acid 2-Hydroxylase." The Journal of Biological Chemistry 279(47): 48562-48568.
Alexander, C., M. Votruba, U. E. Pesch, D. L. Thiselton, S. Mayer, A. Moore, M. Rodriguez, U. Kellner, B. Leo-Kottler, G. Auburger, S. S. Bhattacharya and B. Wissinger (2000). "Opa1, Encoding a Dynamin-Related Gtpase, Is Mutated in Autosomal Dominant Optic Atrophy Linked to Chromosome 3q28." Nature Genetics 26(2): 211-215.
227
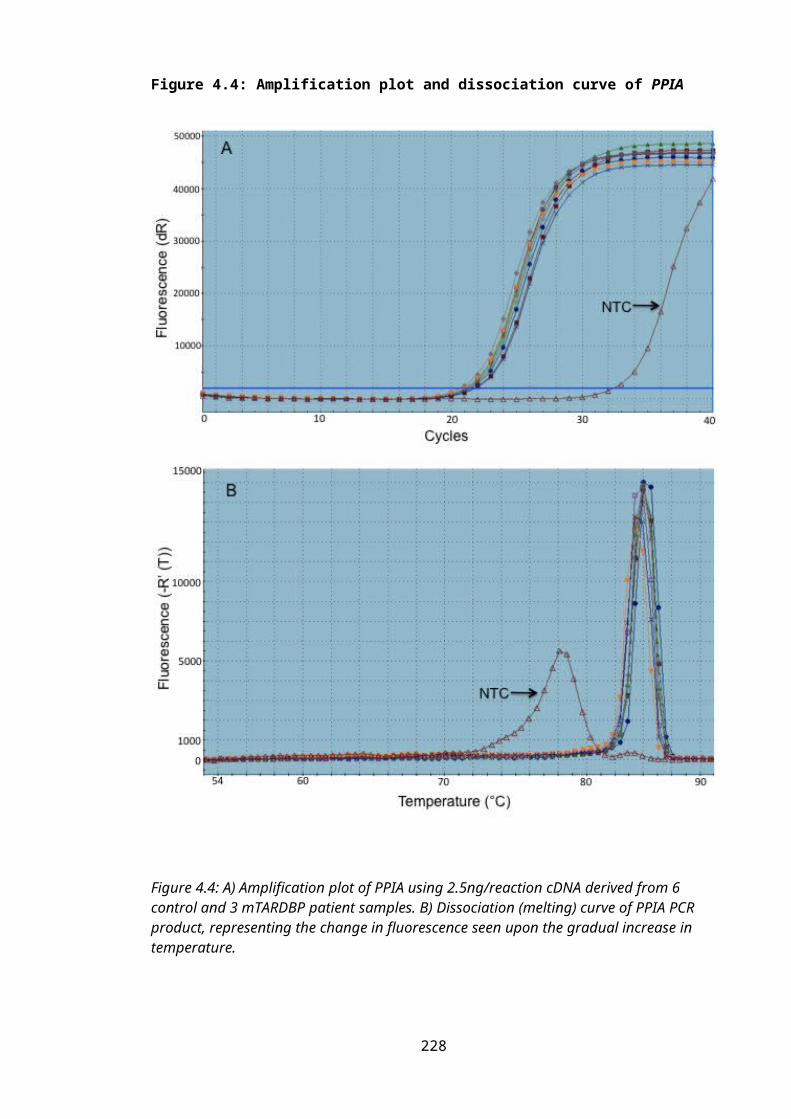
Arai, T., M. Hasegawa, H. Akiyama, K. Ikeda, T. Nonaka, H. Mori, D. Mann, K. Tsuchiya, M. Yoshida, Y. Hashizume and T. Oda (2006). "Tdp-43 Is a Component of Ubiquitin-Positive Tau-Negative Inclusions in Frontotemporal Lobar Degeneration and Amyotrophic Lateral Sclerosis." Biochem Biophys Res Commun 351(3): 602-611.
Arnesano, F., L. Banci, I. Bertini, M. Martinelli, Y. Furukawa and T. V. O'Halloran (2004). "The Unusually Stable Quaternary Structure of Human Cu,Zn-Superoxide Dismutase 1 Is Controlled by Both Metal Occupancy and Disulfide Status." The Journal of Biological Chemistry 279(46): 47998-48003.
Ash, P. E., Y. J. Zhang, C. M. Roberts, T. Saldi, H. Hutter, E. Buratti, L. Petrucelli and C. D. Link (2010). "Neurotoxic Effects of Tdp-43 Overexpression in C. Elegans." Human Molecular Genetics 19(16): 3206-3218.
Atkin, J. D., M. A. Farg, B. J. Turner, D. Tomas, J. A. Lysaght, J. Nunan, A. Rembach, P. Nagley, P. M. Beart, S. S. Cheema and M. K. Horne (2006). "Induction of the Unfolded Protein Response in Familial Amyotrophic Lateral Sclerosis and Association of Protein-Disulfide Isomerase with Superoxide Dismutase 1." The Journal of Biological Chemistry 281(40): 30152-30165.
Atkin, J. D., M. A. Farg, B. J. Turner, D. Tomas, J. A. Lysaght, J. Nunan, A. Rembach, P. Nagley, P. M. Beart, S. S. Cheema and M. K. Horne (2006). "Induction of the Unfolded Protein Response in Familial Amyotrophic Lateral Sclerosis and Association of Protein-Disulfide Isomerase with Superoxide Dismutase 1." J Biol Chem 281(40): 30152-30165.
Atkin, J. D., M. A. Farg, A. K. Walker, C. McLean, D. Tomas and M. K. Horne (2008). "Endoplasmic Reticulum Stress and Induction of the Unfolded Protein Response in Human Sporadic Amyotrophic Lateral Sclerosis." Neurobiol Dis 30(3): 400-407.
Axe, E. L., S. A. Walker, M. Manifava, P. Chandra, H. L. Roderick, A. Habermann, G. Griffiths and N. T. Ktistakis (2008). "Autophagosome Formation from Membrane Compartments Enriched in Phosphatidylinositol 3-Phosphate and Dynamically Connected to the Endoplasmic Reticulum." The Journal of Cell Biology 182(4): 685-701.
Ayala, Y. M., L. De Conti, S. E. Avendano-Vazquez, A. Dhir, M. Romano, A. D'Ambrogio, J. Tollervey, J. Ule, M. Baralle, E. Buratti and F. E. Baralle (2011). "Tdp-43 Regulates Its Mrna Levels through a Negative Feedback Loop." The EMBO Journal 30(2): 277-288.
Ayala, Y. M., P. Zago, A. D'Ambrogio, Y. F. Xu, L. Petrucelli, E. Buratti and F. E. Baralle (2008). "Structural Determinants of the Cellular Localization and Shuttling of Tdp-43." Journal of Cell Science 121(Pt 22): 3778-3785.
Baas, P. W., C. Vidya Nadar and K. A. Myers (2006). "Axonal Transport of Microtubules: The Long and Short of It." Traffic 7(5): 490-498.
Bach, D., D. Naon, S. Pich, F. X. Soriano, N. Vega, J. Rieusset, M. Laville, C. Guillet, Y. Boirie, H. Wallberg-Henriksson, M. Manco, M. Calvani, M. Castagneto, M. Palacin, G. Mingrone, J. R. Zierath, H. Vidal and A. Zorzano (2005). "Expression of Mfn2, the Charcot-Marie-Tooth Neuropathy Type 2a Gene, in Human Skeletal Muscle: Effects
228
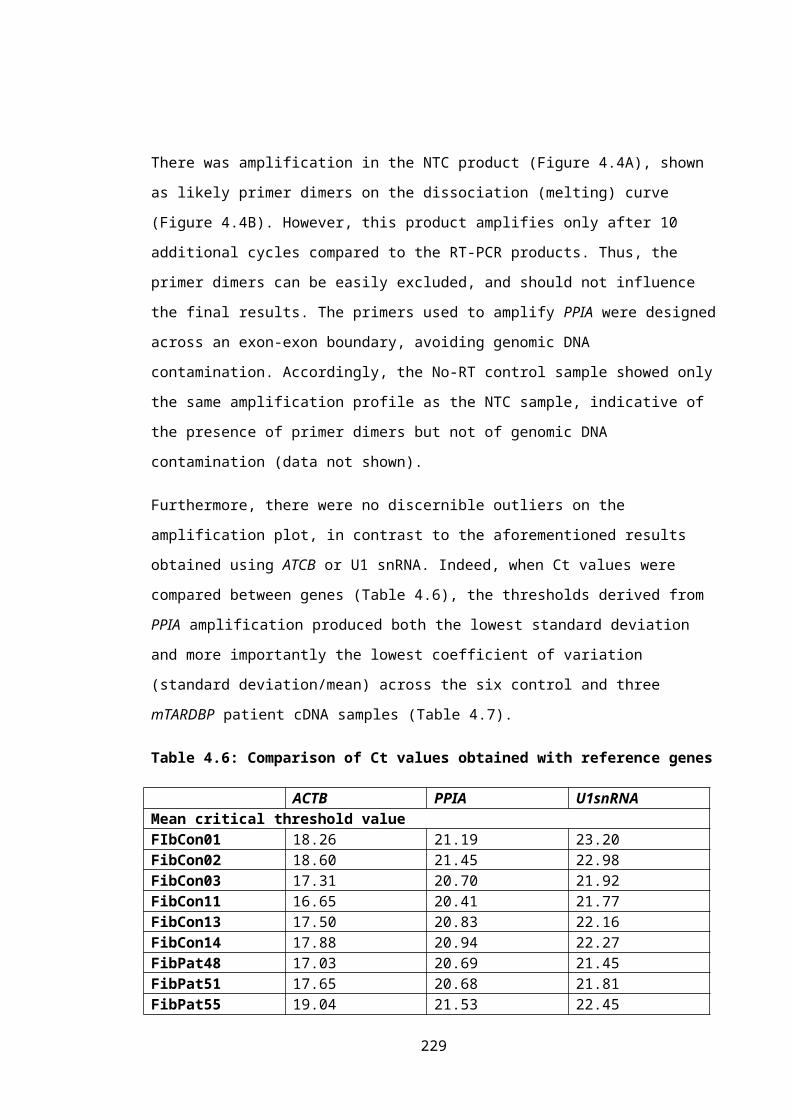
of Type 2 Diabetes, Obesity, Weight Loss, and the Regulatory Role of Tumor Necrosis Factor Alpha and Interleukin-6." Diabetes 54(9): 2685-2693.
Bach, D., S. Pich, F. X. Soriano, N. Vega, B. Baumgartner, J. Oriola, J. R. Daugaard, J. Lloberas, M. Camps, J. R. Zierath, R. Rabasa-Lhoret, H. Wallberg-Henriksson, M. Laville, M. Palacin, H. Vidal, F. Rivera, M. Brand and A. Zorzano (2003). "Mitofusin-2 Determines Mitochondrial Network Architecture and Mitochondrial Metabolism. A Novel Regulatory Mechanism Altered in Obesity." The Journal of Biological Chemistry 278(19): 17190-17197.
Bacman, S. R., W. G. Bradley and C. T. Moraes (2006). "Mitochondrial Involvement in Amyotrophic Lateral Sclerosis: Trigger or Target?" Mol Neurobiol 33(2): 113-131.
Badiola, N., C. Penas, A. Minano-Molina, B. Barneda-Zahonero, R. Fado, G. Sanchez-Opazo, J. X. Comella, J. Sabria, C. Zhu, K. Blomgren, C. Casas and J. Rodriguez-Alvarez (2011). "Induction of Er Stress in Response to Oxygen-Glucose Deprivation of Cortical Cultures Involves the Activation of the Perk and Ire-1 Pathways and of Caspase-12." Cell Death & Disease 2: e149.
Banci, L., I. Bertini, M. Boca, S. Girotto, M. Martinelli, J. S. Valentine and M. Vieru (2008). "Sod1 and Amyotrophic Lateral Sclerosis: Mutations and Oligomerization." PLoS One 3(2): e1677.
Barbeito, L. H., M. Pehar, P. Cassina, M. R. Vargas, H. Peluffo, L. Viera, A. G. Estevez and J. S. Beckman (2004). "A Role for Astrocytes in Motor Neuron Loss in Amyotrophic Lateral Sclerosis." Brain Research. Brain Research Reviews 47(1-3): 263-274.
Barmada, S. J., G. Skibinski, E. Korb, E. J. Rao, J. Y. Wu and S. Finkbeiner (2010). "Cytoplasmic Mislocalization of Tdp-43 Is Toxic to Neurons and Enhanced by a Mutation Associated with Familial Amyotrophic Lateral Sclerosis." The Journal of Neuroscience : The Official Journal of the Society for Neuroscience 30(2): 639-649.
Barsoum, M. J., H. Yuan, A. A. Gerencser, G. Liot, Y. Kushnareva, S. Graber, I. Kovacs, W. D. Lee, J. Waggoner, J. Cui, A. D. White, B. Bossy, J. C. Martinou, R. J. Youle, S. A. Lipton, M. H. Ellisman, G. A. Perkins and E. Bossy-Wetzel (2006). "Nitric Oxide-Induced Mitochondrial Fission Is Regulated by Dynamin-Related Gtpases in Neurons." The EMBO Journal 25(16): 3900-3911.
Beckman, J. S., A. G. Estevez, J. P. Crow and L. Barbeito (2001). "Superoxide Dismutase and the Death of Motoneurons in Als." Trends in Neurosciences 24(11 Suppl): S15-20.
Beers, D. R., B. K. Ho, L. Siklos, M. E. Alexianu, D. R. Mosier, A. H. Mohamed, Y. Otsuka, M. E. Kozovska, R. E. McAlhany, R. G. Smith and S. H. Appel (2001). "Parvalbumin Overexpression Alters Immune-Mediated Increases in Intracellular Calcium, and Delays Disease Onset in a Transgenic Model of Familial Amyotrophic Lateral Sclerosis." Journal of Neurochemistry 79(3): 499-509.
Behan, W. M. and M. Maia (1974). "Strumpell's Familial Spastic Paraplegia: Genetics and Neuropathology." Journal of Neurology, Neurosurgery, and Psychiatry 37(1): 8-20.
229
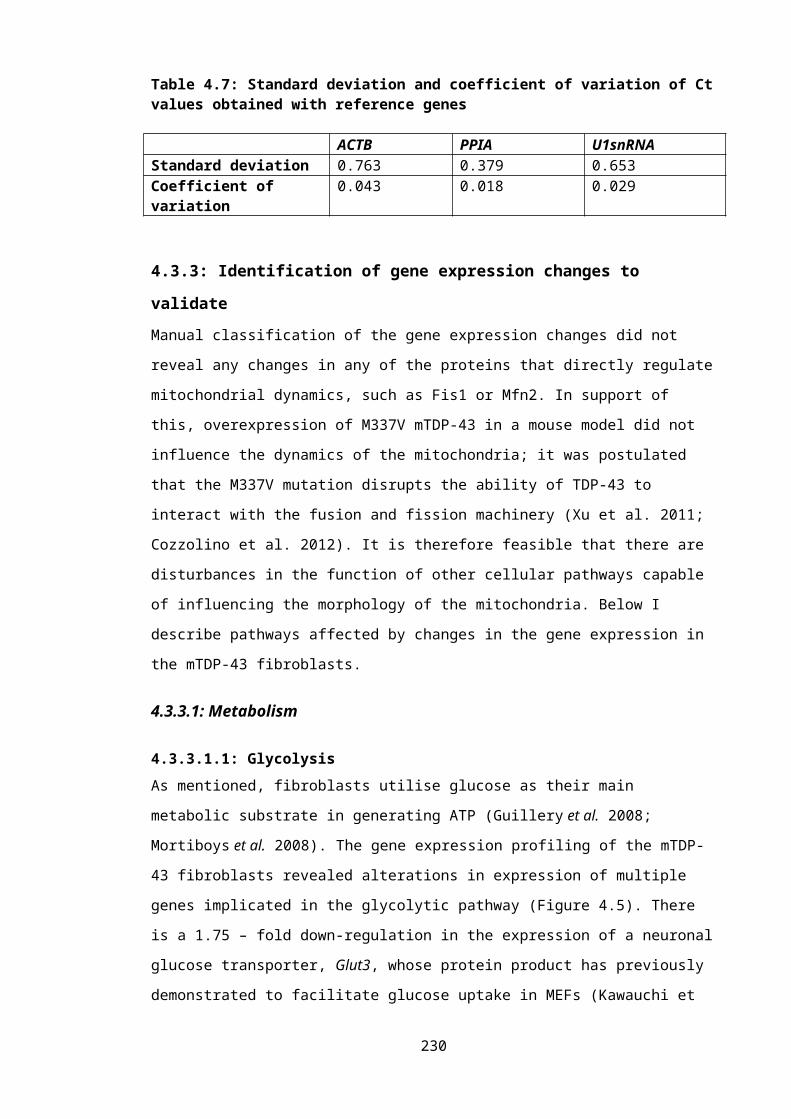
Behrends, C., M. E. Sowa, S. P. Gygi and J. W. Harper (2010). "Network Organization of the Human Autophagy System." Nature 466(7302): 68-76.
Benard, G., N. Bellance, D. James, P. Parrone, H. Fernandez, T. Letellier and R. Rossignol (2007). "Mitochondrial Bioenergetics and Structural Network Organization." Journal of Cell Science 120(Pt 5): 838-848.
Benard, G., N. Bellance, D. James, P. Parrone, H. Fernandez, T. Letellier and R. Rossignol (2007). "Mitochondrial Bioenergetics and Structural Network Organization." J Cell Sci 120(Pt 5): 838-848.
Bendotti, C., M. Tortarolo, S. K. Suchak, N. Calvaresi, L. Carvelli, A. Bastone, M. Rizzi, M. Rattray and T. Mennini (2001). "Transgenic Sod1 G93a Mice Develop Reduced Glt-1 in Spinal Cord without Alterations in Cerebrospinal Fluid Glutamate Levels." J Neurochem 79(4): 737-746.
Bernardi, P. (1999). "Mitochondrial Transport of Cations: Channels, Exchangers, and Permeability Transition." Physiological Reviews 79(4): 1127-1155.
Billups, B. and I. D. Forsythe (2002). "Presynaptic Mitochondrial Calcium Sequestration Influences Transmission at Mammalian Central Synapses." The Journal of Neuroscience : The Official Journal of the Society for Neuroscience 22(14): 5840-5847.
Bilsland, L. G., N. Nirmalananthan, J. Yip, L. Greensmith and M. R. Duchen (2008). "Expression of Mutant Sod1 in Astrocytes Induces Functional Deficits in Motoneuron Mitochondria." Journal of Neurochemistry 107(5): 1271-1283.
Bilsland, L. G., E. Sahai, G. Kelly, M. Golding, L. Greensmith and G. Schiavo (2010). "Deficits in Axonal Transport Precede Als Symptoms in Vivo." Proceedings of the National Academy of Sciences of the United States of America 107(47): 20523-20528.
Blackstone, C. (2012). "Cellular Pathways of Hereditary Spastic Paraplegia." Annual Review of Neuroscience 35: 25-47.
Blackstone, C., C. J. O'Kane and E. Reid (2011). "Hereditary Spastic Paraplegias: Membrane Traffic and the Motor Pathway." Nature Reviews. Neuroscience 12(1): 31-42.
Boehning, D., R. L. Patterson, L. Sedaghat, N. O. Glebova, T. Kurosaki and S. H. Snyder (2003). "Cytochrome C Binds to Inositol (1,4,5) Trisphosphate Receptors, Amplifying Calcium-Dependent Apoptosis." Nature Cell Biology 5(12): 1051-1061.
Bordet, T. (2010). "Olesoxime (Tro19622): A Novel Mitochondrial-Targeted Neuroprotective Compound." Pharmaceuticals 3: 345-368.
Bordet, T., B. Buisson, M. Michaud, C. Drouot, P. Galea, P. Delaage, N. P. Akentieva, A. S. Evers, D. F. Covey, M. A. Ostuni, J. J. Lacapere, C. Massaad, M. Schumacher, E. M. Steidl, D. Maux, M. Delaage, C. E. Henderson and R. M. Pruss (2007). "Identification and Characterization of Cholest-4-En-3-One, Oxime (Tro19622), a Novel Drug Candidate for Amyotrophic Lateral Sclerosis." The Journal of Pharmacology and Experimental Therapeutics 322(2): 709-720.
230
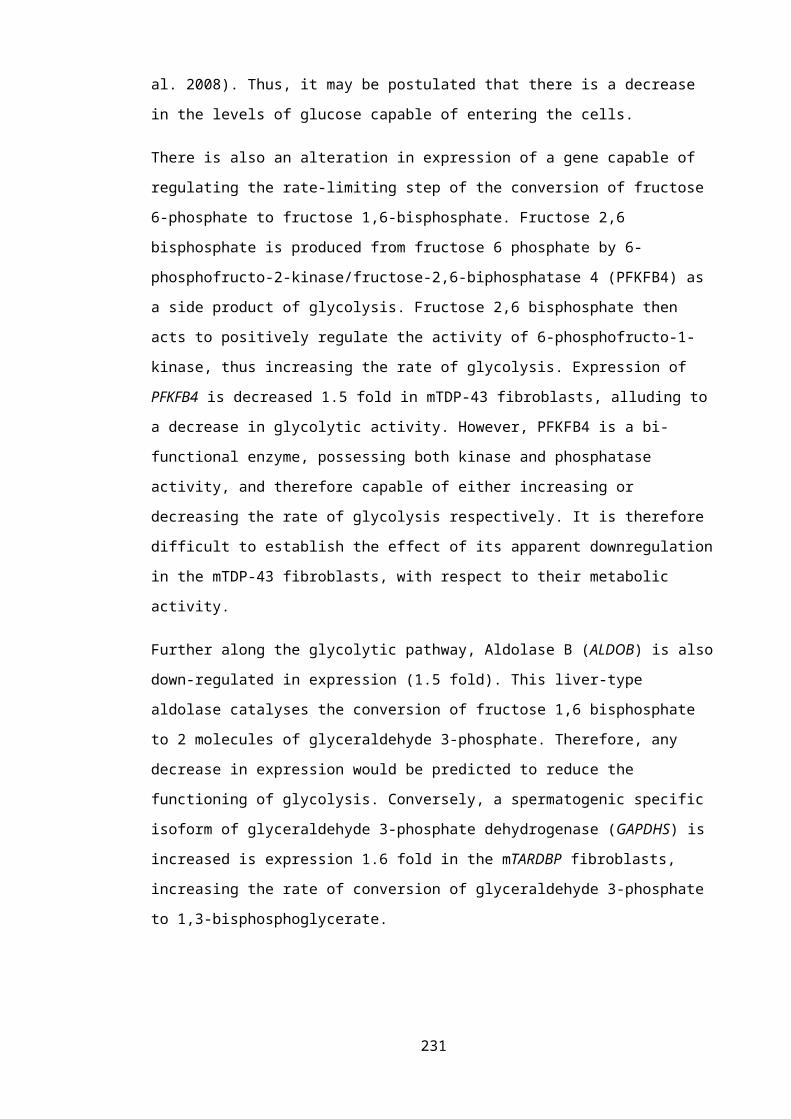
Borthwick, G. M., R. W. Taylor, T. J. Walls, K. Tonska, G. A. Taylor, P. J. Shaw, P. G. Ince and D. M. Turnbull (2006). "Motor Neuron Disease in a Patient with a Mitochondrial Trnaile Mutation." Annals of Neurology 59(3): 570-574.
Bose, J. K., C. C. Huang and C. K. Shen (2011). "Regulation of Autophagy by Neuropathological Protein Tdp-43." The Journal of Biological Chemistry 286(52): 44441-44448.
Bose, J. K., I. F. Wang, L. Hung, W. Y. Tarn and C. K. Shen (2008). "Tdp-43 Overexpression Enhances Exon 7 Inclusion During the Survival of Motor Neuron Pre-Mrna Splicing." The Journal of Biological Chemistry 283(43): 28852-28859.
Bradley, L. J., J. W. Taanman, C. Kallis and R. W. Orrell (2009). "Increased Sensitivity of Myoblasts to Oxidative Stress in Amyotrophic Lateral Sclerosis Peripheral Tissues." Experimental Neurology 218(1): 92-97.
Bradley, W. G. (1999). "Biological Markers in Amyotrophic Lateral Sclerosis: Help or Hindrance?" J Neurol 246 Suppl 3: III13-15.
Brady, O. A., P. Meng, Y. Zheng, Y. Mao and F. Hu (2011). "Regulation of Tdp-43 Aggregation by Phosphorylation and P62/Sqstm1." Journal of Neurochemistry 116(2): 248-259.
Brandmeir, N. J., F. Geser, L. K. Kwong, E. Zimmerman, J. Qian, V. M. Lee and J. Q. Trojanowski (2008). "Severe Subcortical Tdp-43 Pathology in Sporadic Frontotemporal Lobar Degeneration with Motor Neuron Disease." Acta Neuropathologica 115(1): 123-131.
Breckenridge, D. G., M. Stojanovic, R. C. Marcellus and G. C. Shore (2003). "Caspase Cleavage Product of Bap31 Induces Mitochondrial Fission through Endoplasmic Reticulum Calcium Signals, Enhancing Cytochrome C Release to the Cytosol." The Journal of Cell Biology 160(7): 1115-1127.
Browne, S. E., L. Yang, J. P. DiMauro, S. W. Fuller, S. C. Licata and M. F. Beal (2006). "Bioenergetic Abnormalities in Discrete Cerebral Motor Pathways Presage Spinal Cord Pathology in the G93a Sod1 Mouse Model of Als." Neurobiology of Disease 22(3): 599-610.
Brustovetsky, N., T. Brustovetsky, R. Jemmerson and J. M. Dubinsky (2002). "Calcium-Induced Cytochrome C Release from Cns Mitochondria Is Associated with the Permeability Transition and Rupture of the Outer Membrane." Journal of Neurochemistry 80(2): 207-218.
Bua, E., J. Johnson, A. Herbst, B. Delong, D. McKenzie, S. Salamat and J. M. Aiken (2006). "Mitochondrial DNA-Deletion Mutations Accumulate Intracellularly to Detrimental Levels in Aged Human Skeletal Muscle Fibers." American Journal of Human Genetics 79(3): 469-480.
Buratti, E. and F. E. Baralle (2008). "Multiple Roles of Tdp-43 in Gene Expression, Splicing Regulation, and Human Disease." Frontiers in Bioscience : a Journal and Virtual Library 13: 867-878.
231
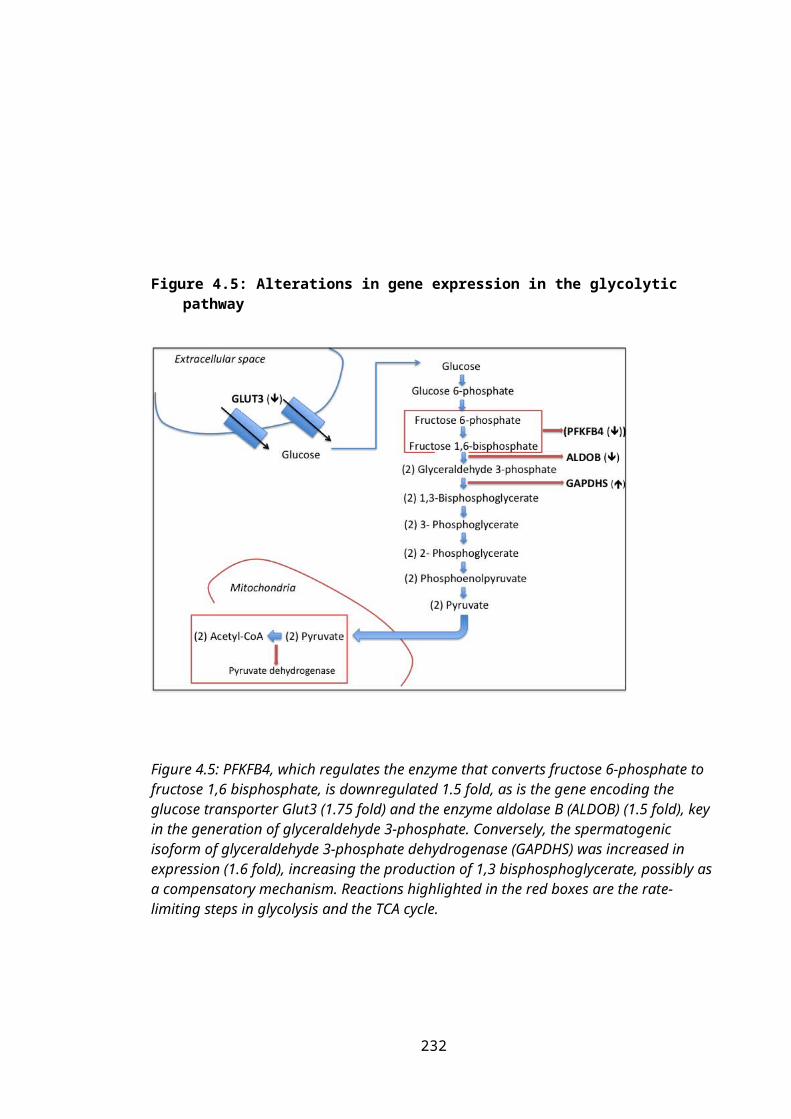
Buratti, E., A. Brindisi, M. Giombi, S. Tisminetzky, Y. M. Ayala and F. E. Baralle (2005). "Tdp-43 Binds Heterogeneous Nuclear Ribonucleoprotein a/B through Its C-Terminal Tail: An Important Region for the Inhibition of Cystic Fibrosis Transmembrane Conductance Regulator Exon 9 Splicing." The Journal of Biological Chemistry 280(45): 37572-37584.
Buster, D., K. McNally and F. J. McNally (2002). "Katanin Inhibition Prevents the Redistribution of Gamma-Tubulin at Mitosis." Journal of Cell Science 115(Pt 5): 1083-1092.
Cai, Q., M. L. Davis and Z. H. Sheng (2011). "Regulation of Axonal Mitochondrial Transport and Its Impact on Synaptic Transmission." Neuroscience Research 70(1): 9-15.
Cairns, N. J., M. Neumann, E. H. Bigio, I. E. Holm, D. Troost, K. J. Hatanpaa, C. Foong, C. L. White, 3rd, J. A. Schneider, H. A. Kretzschmar, D. Carter, L. Taylor-Reinwald, K. Paulsmeyer, J. Strider, M. Gitcho, A. M. Goate, J. C. Morris, M. Mishra, L. K. Kwong, A. Stieber, Y. Xu, M. S. Forman, J. Q. Trojanowski, V. M. Lee and I. R. Mackenzie (2007). "Tdp-43 in Familial and Sporadic Frontotemporal Lobar Degeneration with Ubiquitin Inclusions." The American Journal of Pathology 171(1): 227-240.
Carri, M. T., A. Ferri, A. Battistoni, L. Famhy, R. Gabbianelli, F. Poccia and G. Rotilio (1997). "Expression of a Cu,Zn Superoxide Dismutase Typical of Familial Amyotrophic Lateral Sclerosis Induces Mitochondrial Alteration and Increase of Cytosolic Ca2+ Concentration in Transfected Neuroblastoma Sh-Sy5y Cells." FEBS Letters 414(2): 365-368.
Cartoni, R., B. Leger, M. B. Hock, M. Praz, A. Crettenand, S. Pich, J. L. Ziltener, F. Luthi, O. Deriaz, A. Zorzano, C. Gobelet, A. Kralli and A. P. Russell (2005). "Mitofusins 1/2 and Erralpha Expression Are Increased in Human Skeletal Muscle after Physical Exercise." The Journal of Physiology 567(Pt 1): 349-358.
Casley, C. S., L. Canevari, J. M. Land, J. B. Clark and M. A. Sharpe (2002). "Beta-Amyloid Inhibits Integrated Mitochondrial Respiration and Key Enzyme Activities." Journal of Neurochemistry 80(1): 91-100.
Celsi, F., P. Pizzo, M. Brini, S. Leo, C. Fotino, P. Pinton and R. Rizzuto (2009). "Mitochondria, Calcium and Cell Death: A Deadly Triad in Neurodegeneration." Biochimica et Biophysica Acta 1787(5): 335-344.
Cereghetti, G. M., V. Costa and L. Scorrano (2010). "Inhibition of Drp1-Dependent Mitochondrial Fragmentation and Apoptosis by a Polypeptide Antagonist of Calcineurin." Cell Death and Differentiation 17(11): 1785-1794.
Chang, C. R. and C. Blackstone (2010). "Dynamic Regulation of Mitochondrial Fission through Modification of the Dynamin-Related Protein Drp1." Annals of the New York Academy of Sciences 1201: 34-39.
Chen, H. and D. C. Chan (2009). "Mitochondrial Dynamics--Fusion, Fission, Movement, and Mitophagy--in Neurodegenerative Diseases." Human Molecular Genetics 18(R2): R169-176.
232
Chen, H., S. A. Detmer, A. J. Ewald, E. E. Griffin, S. E. Fraser and D. C. Chan (2003). "Mitofusins Mfn1 and Mfn2 Coordinately Regulate Mitochondrial Fusion and Are Essential for Embryonic Development." The Journal of Cell Biology 160(2): 189-200.
Chen, H., S. A. Detmer, A. J. Ewald, E. E. Griffin, S. E. Fraser and D. C. Chan (2003). "Mitofusins Mfn1 and Mfn2 Coordinately Regulate Mitochondrial Fusion and Are Essential for Embryonic Development." J Cell Biol 160(2): 189-200.
Chen, H., J. M. McCaffery and D. C. Chan (2007). "Mitochondrial Fusion Protects against Neurodegeneration in the Cerebellum." Cell 130(3): 548-562.
Chen, S., X. Zhang, L. Song and W. Le (2012). "Autophagy Dysregulation in Amyotrophic Lateral Sclerosis." Brain Pathology 22(1): 110-116.
Chen, Y. Z., C. L. Bennett, H. M. Huynh, I. P. Blair, I. Puls, J. Irobi, I. Dierick, A. Abel, M. L. Kennerson, B. A. Rabin, G. A. Nicholson, M. Auer-Grumbach, K. Wagner, P. De Jonghe, J. W. Griffin, K. H. Fischbeck, V. Timmerman, D. R. Cornblath and P. F. Chance (2004). "DNA/Rna Helicase Gene Mutations in a Form of Juvenile Amyotrophic Lateral Sclerosis (Als4)." Am J Hum Genet 74(6): 1128-1135.
Chevalier-Larsen, E. and E. L. Holzbaur (2006). "Axonal Transport and Neurodegenerative Disease." Biochimica et Biophysica Acta 1762(11-12): 1094-1108.
Chio, A., G. Logroscino, O. Hardiman, R. Swingler, D. Mitchell, E. Beghi and B. G. Traynor (2009). "Prognostic Factors in Als: A Critical Review." Amyotrophic Lateral Sclerosis : Official Publication of the World Federation of Neurology Research Group on Motor Neuron Diseases 10(5-6): 310-323.
Cho, D. H., T. Nakamura, J. Fang, P. Cieplak, A. Godzik, Z. Gu and S. A. Lipton (2009). "S-Nitrosylation of Drp1 Mediates Beta-Amyloid-Related Mitochondrial Fission and Neuronal Injury." Science 324(5923): 102-105.
Chow, C. Y., J. E. Landers, S. K. Bergren, P. C. Sapp, A. E. Grant, J. M. Jones, L. Everett, G. M. Lenk, D. M. McKenna-Yasek, L. S. Weisman, D. Figlewicz, R. H. Brown and M. H. Meisler (2009). "Deleterious Variants of Fig4, a Phosphoinositide Phosphatase, in Patients with Als." American Journal of Human Genetics 84(1): 85-88.
Ciccarelli, F. D., C. Proukakis, H. Patel, H. Cross, S. Azam, M. A. Patton, P. Bork and A. H. Crosby (2003). "The Identification of a Conserved Domain in Both Spartin and Spastin, Mutated in Hereditary Spastic Paraplegia." Genomics 81(4): 437-441.
Cipolat, S., O. Martins de Brito, B. Dal Zilio and L. Scorrano (2004). "Opa1 Requires Mitofusin 1 to Promote Mitochondrial Fusion." Proc. Natl. Acad. Sci. U.S.A. 101(45): 15927-15932.
Claudiani, P., E. Riano, A. Errico, G. Andolfi and E. I. Rugarli (2005). "Spastin Subcellular Localization Is Regulated through Usage of Different Translation Start Sites and Active Export from the Nucleus." Experimental Cell Research 309(2): 358-369.
233
Cluskey, S. and D. B. Ramsden (2001). "Mechanisms of Neurodegeneration in Amyotrophic Lateral Sclerosis." Molecular Pathology : MP 54(6): 386-392.
Cohen, T. J., A. W. Hwang, T. Unger, J. Q. Trojanowski and V. M. Lee (2012). "Redox Signalling Directly Regulates Tdp-43 Via Cysteine Oxidation and Disulphide Cross-Linking." The EMBO Journal 31(5): 1241-1252.
Coleman, D. L. (1978). "Obese and Diabetes: Two Mutant Genes Causing Diabetes-Obesity Syndromes in Mice." Diabetologia 14(3): 141-148.
Coleman, D. L. and K. P. Hummel (1973). "The Influence of Genetic Background on the Expression of the Obese (Ob) Gene in the Mouse." Diabetologia 9(4): 287-293.
Colgan, J., M. Asmal, B. Yu and J. Luban (2005). "Cyclophilin a-Deficient Mice Are Resistant to Immunosuppression by Cyclosporine." Journal of Immunology 174(10): 6030-6038.
Colombrita, C., E. Onesto, C. Tiloca, N. Ticozzi, V. Silani and A. Ratti (2011). "Rna-Binding Proteins and Rna Metabolism: A New Scenario in the Pathogenesis of Amyotrophic Lateral Sclerosis." Archives Italiennes de Biologie 149(1): 83-99.
Colombrita, C., E. Zennaro, C. Fallini, M. Weber, A. Sommacal, E. Buratti, V. Silani and A. Ratti (2009). "Tdp-43 Is Recruited to Stress Granules in Conditions of Oxidative Insult." Journal of Neurochemistry 111(4): 1051-1061.
Comi, G. P., A. Bordoni, S. Salani, L. Franceschina, M. Sciacco, A. Prelle, F. Fortunato, M. Zeviani, L. Napoli, N. Bresolin, M. Moggio, C. D. Ausenda, J. W. Taanman and G. Scarlato (1998). "Cytochrome C Oxidase Subunit I Microdeletion in a Patient with Motor Neuron Disease." Annals of Neurology 43(1): 110-116.
Connell, J. W., C. Lindon, J. P. Luzio and E. Reid (2009). "Spastin Couples Microtubule Severing to Membrane Traffic in Completion of Cytokinesis and Secretion." Traffic 10(1): 42-56.
Contreras, L., I. Drago, E. Zampese and T. Pozzan (2010). "Mitochondria: The Calcium Connection." Biochimica et Biophysica Acta 1797(6-7): 607-618.
Cooper-Knock, J., C. Hewitt, J. R. Highley, A. Brockington, A. Milano, S. Man, J. Martindale, J. Hartley, T. Walsh, C. Gelsthorpe, L. Baxter, G. Forster, M. Fox, J. Bury, K. Mok, C. J. McDermott, B. J. Traynor, J. Kirby, S. B. Wharton, P. G. Ince, J. Hardy and P. J. Shaw (2012). "Clinico-Pathological Features in Amyotrophic Lateral Sclerosis with Expansions in C9orf72." Brain : A Journal of Neurology 135(Pt 3): 751-764.
Corbo, M. and A. P. Hays (1992). "Peripherin and Neurofilament Protein Coexist in Spinal Spheroids of Motor Neuron Disease." Journal of Neuropathology and Experimental Neurology 51(5): 531-537.
Corral-Debrinski, M., T. Horton, M. T. Lott, J. M. Shoffner, M. F. Beal and D. C. Wallace (1992). "Mitochondrial DNA Deletions in Human Brain: Regional Variability and Increase with Advanced Age." Nature Genetics 2(4): 324-329.
234
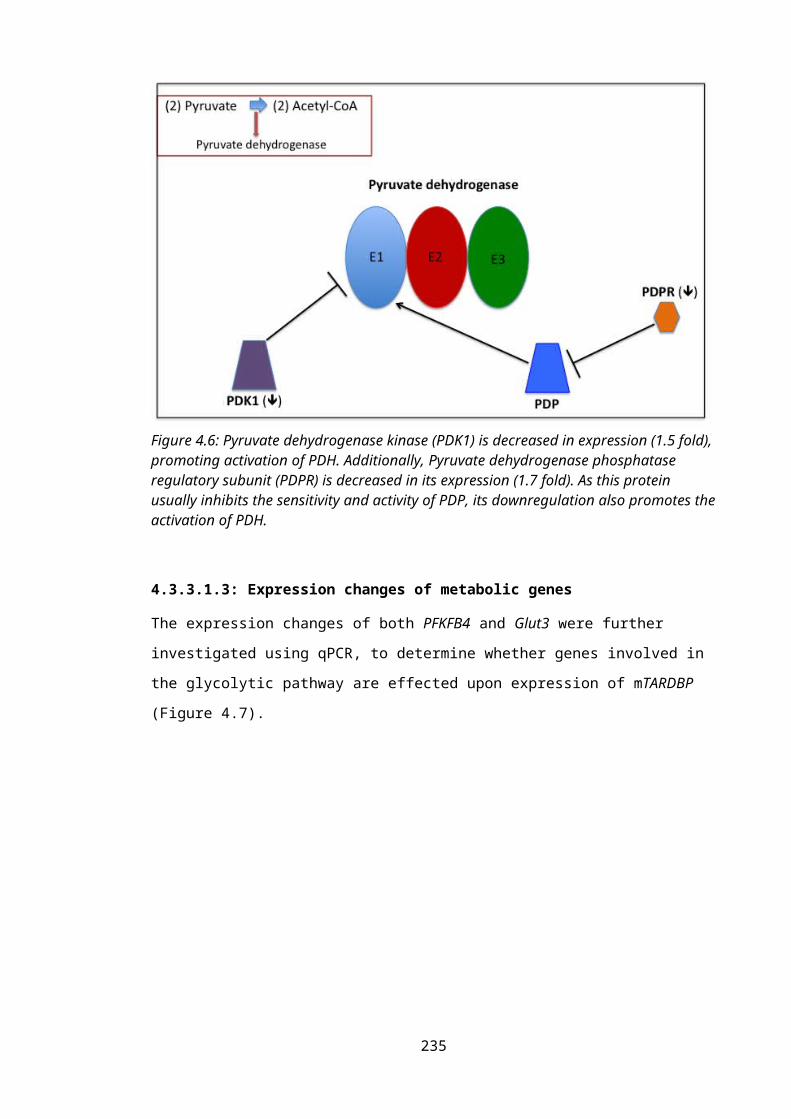
Cozzolino, M., A. Ferri, C. Valle and M. T. Carri (2012). "Mitochondria and Als: Implications from Novel Genes and Pathways." Molecular and Cellular Neurosciences.
Crane, J. D., M. C. Devries, A. Safdar, M. J. Hamadeh and M. A. Tarnopolsky (2010). "The Effect of Aging on Human Skeletal Muscle Mitochondrial and Intramyocellular Lipid Ultrastructure." The Journals of Gerontology. Series A, Biological Sciences and Medical Sciences 65(2): 119-128.
Crompton, M., S. Virji and J. M. Ward (1998). "Cyclophilin-D Binds Strongly to Complexes of the Voltage-Dependent Anion Channel and the Adenine Nucleotide Translocase to Form the Permeability Transition Pore." European Journal of Biochemistry / FEBS 258(2): 729-735.
Cruz-Sanchez, F. F., A. Moral, J. de Belleroche and M. L. Rossi (1993). "Amyotrophic Lateral Sclerosis Brain Banking: A Proposal to Standardize Protocols and Neuropathological Diagnostic Criteria." Journal of Neural Transmission. Supplementum 39: 215-222.
Csordas, G., C. Renken, P. Varnai, L. Walter, D. Weaver, K. F. Buttle, T. Balla, C. A. Mannella and G. Hajnoczky (2006). "Structural and Functional Features and Significance of the Physical Linkage between Er and Mitochondria." The Journal of Cell Biology 174(7): 915-921.
Cudkowicz, M., M. E. Bozik, E. W. Ingersoll, R. Miller, H. Mitsumoto, J. Shefner, D. H. Moore, D. Schoenfeld, J. L. Mather, D. Archibald, M. Sullivan, C. Amburgey, J. Moritz and V. K. Gribkoff (2011). "The Effects of Dexpramipexole (Kns-760704) in Individuals with Amyotrophic Lateral Sclerosis." Nature Medicine 17(12): 1652-1656.
D'Alessandro, G., E. Calcagno, S. Tartari, M. Rizzardini, R. W. Invernizzi and L. Cantoni (2011). "Glutamate and Glutathione Interplay in a Motor Neuronal Model of Amyotrophic Lateral Sclerosis Reveals Altered Energy Metabolism." Neurobiology of Disease 43(2): 346-355.
d'Ydewalle, C., J. Krishnan, D. M. Chiheb, P. Van Damme, J. Irobi, A. P. Kozikowski, P. Vanden Berghe, V. Timmerman, W. Robberecht and L. Van Den Bosch (2011). "Hdac6 Inhibitors Reverse Axonal Loss in a Mouse Model of Mutant Hspb1-Induced Charcot-Marie-Tooth Disease." Nature Medicine 17(8): 968-974.
Damiano, M., A. A. Starkov, S. Petri, K. Kipiani, M. Kiaei, M. Mattiazzi, M. Flint Beal and G. Manfredi (2006). "Neural Mitochondrial Ca2+ Capacity Impairment Precedes the Onset of Motor Symptoms in G93a Cu/Zn-Superoxide Dismutase Mutant Mice." J Neurochem 96(5): 1349-1361.
de Brito, O. M. and L. Scorrano (2008). "Mitofusin 2 Tethers Endoplasmic Reticulum to Mitochondria." Nature 456(7222): 605-610.
de Brito, O. M. and L. Scorrano (2010). "An Intimate Liaison: Spatial Organization of the Endoplasmic Reticulum-Mitochondria Relationship." The EMBO Journal 29(16): 2715-2723.
235
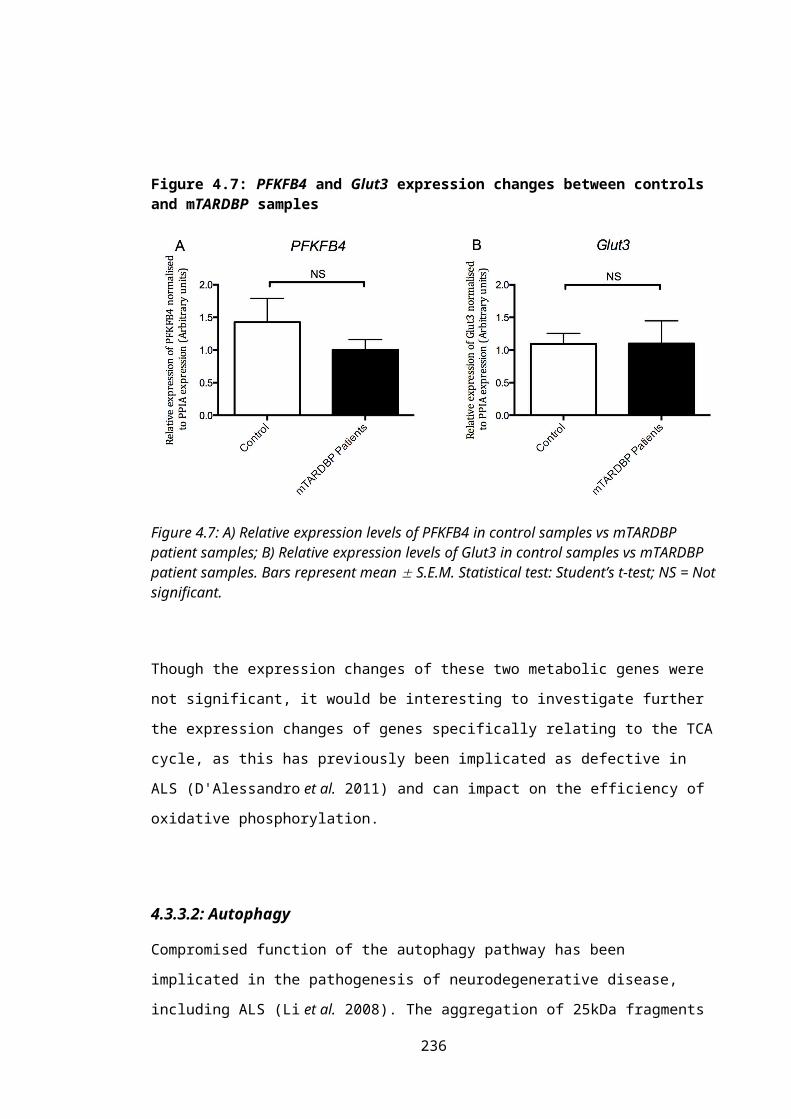
De Vos, K. J., V. J. Allan, A. J. Grierson and M. P. Sheetz (2005). "Mitochondrial Function and Actin Regulate Dynamin-Related Protein 1-Dependent Mitochondrial Fission." Curr Biol 15(7): 678-683.
De Vos, K. J., V. J. Allan, A. J. Grierson and M. P. Sheetz (2005). "Mitochondrial Function and Actin Regulate Dynamin-Related Protein 1-Dependent Mitochondrial Fission." Current Biology : CB 15(7): 678-683.
De Vos, K. J., A. L. Chapman, M. E. Tennant, C. Manser, E. L. Tudor, K. F. Lau, J. Brownlees, S. Ackerley, P. J. Shaw, D. M. McLoughlin, C. E. Shaw, P. N. Leigh, C. C. Miller and A. J. Grierson (2007). "Familial Amyotrophic Lateral Sclerosis-Linked Sod1 Mutants Perturb Fast Axonal Transport to Reduce Axonal Mitochondria Content." Human Molecular Genetics 16(22): 2720-2728.
De Vos, K. J., A. J. Grierson, S. Ackerley and C. C. Miller (2008). "Role of Axonal Transport in Neurodegenerative Diseases." Annual Review of Neuroscience 31: 151-173.
De Vos, K. J., G. M. Morotz, R. Stoica, E. L. Tudor, K. F. Lau, S. Ackerley, A. Warley, C. E. Shaw and C. C. Miller (2012). "Vapb Interacts with the Mitochondrial Protein Ptpip51 to Regulate Calcium Homeostasis." Human Molecular Genetics 21(6): 1299-1311.
De Vos, K. J. and M. P. Sheetz (2007). "Visualization and Quantification of Mitochondrial Dynamics in Living Animal Cells." Methods in Cell Biology 80: 627-682.
Degli Esposti, M. and C. Dive (2003). "Mitochondrial Membrane Permeabilisation by Bax/Bak." Biochemical and Biophysical Research Communications 304(3): 455-461.
DeJesus-Hernandez, M., I. R. Mackenzie, B. F. Boeve, A. L. Boxer, M. Baker, N. J. Rutherford, A. M. Nicholson, N. A. Finch, H. Flynn, J. Adamson, N. Kouri, A. Wojtas, P. Sengdy, G. Y. Hsiung, A. Karydas, W. W. Seeley, K. A. Josephs, G. Coppola, D. H. Geschwind, Z. K. Wszolek, H. Feldman, D. S. Knopman, R. C. Petersen, B. L. Miller, D. W. Dickson, K. B. Boylan, N. R. Graff-Radford and R. Rademakers (2011). "Expanded Ggggcc Hexanucleotide Repeat in Noncoding Region of C9orf72 Causes Chromosome 9p-Linked Ftd and Als." Neuron 72(2): 245-256.
Delettre, C., J. M. Griffoin, J. Kaplan, H. Dollfus, B. Lorenz, L. Faivre, G. Lenaers, P. Belenguer and C. P. Hamel (2001). "Mutation Spectrum and Splicing Variants in the Opa1 Gene." Human Genetics 109(6): 584-591.
Dell'agnello, C., S. Leo, A. Agostino, G. Szabadkai, C. Tiveron, A. Zulian, A. Prelle, P. Roubertoux, R. Rizzuto and M. Zeviani (2007). "Increased Longevity and Refractoriness to Ca(2+)-Dependent Neurodegeneration in Surf1 Knockout Mice." Human Molecular Genetics 16(4): 431-444.
Deng, H., M. W. Dodson, H. Huang and M. Guo (2008). "The Parkinson's Disease Genes Pink1 and Parkin Promote Mitochondrial Fission and/or Inhibit Fusion in Drosophila." Proceedings of the National Academy of Sciences of the United States of America 105(38): 14503-14508.
236
Deng, H. X., W. Chen, S. T. Hong, K. M. Boycott, G. H. Gorrie, N. Siddique, Y. Yang, F. Fecto, Y. Shi, H. Zhai, H. Jiang, M. Hirano, E. Rampersaud, G. H. Jansen, S. Donkervoort, E. H. Bigio, B. R. Brooks, K. Ajroud, R. L. Sufit, J. L. Haines, E. Mugnaini, M. A. Pericak-Vance and T. Siddique (2011). "Mutations in Ubqln2 Cause Dominant X-Linked Juvenile and Adult-Onset Als and Als/Dementia." Nature 477(7363): 211-215.
Depienne, C., E. Fedirko, S. Forlani, C. Cazeneuve, P. Ribai, I. Feki, C. Tallaksen, K. Nguyen, B. Stankoff, M. Ruberg, G. Stevanin, A. Durr and A. Brice (2007). "Exon Deletions of Spg4 Are a Frequent Cause of Hereditary Spastic Paraplegia." Journal of Medical Genetics 44(4): 281-284.
Desler, C., T. L. Hansen, J. B. Frederiksen, M. L. Marcker, K. K. Singh and L. Juel Rasmussen (2012). "Is There a Link between Mitochondrial Reserve Respiratory Capacity and Aging?" Journal of Aging Research 2012: 192503.
Dietz, K. C. and P. Casaccia (2010). "Hdac Inhibitors and Neurodegeneration: At the Edge between Protection and Damage." Pharmacological Research : The Official Journal of the Italian Pharmacological Society 62(1): 11-17.
DiMauro, S. (2004). "Mitochondrial Diseases." Biochimica et Biophysica Acta 1658(1-2): 80-88.
Ding, W. X. and X. M. Yin (2012). "Mitophagy: Mechanisms, Pathophysiological Roles, and Analysis." Biological Chemistry 393(7): 547-564.
Dion, P. A., H. Daoud and G. A. Rouleau (2009). "Genetics of Motor Neuron Disorders: New Insights into Pathogenic Mechanisms." Nat Rev Genet 10(11): 769-782.
Dompierre, J. P., J. D. Godin, B. C. Charrin, F. P. Cordelieres, S. J. King, S. Humbert and F. Saudou (2007). "Histone Deacetylase 6 Inhibition Compensates for the Transport Deficit in Huntington's Disease by Increasing Tubulin Acetylation." The Journal of Neuroscience : The Official Journal of the Society for Neuroscience 27(13): 3571-3583.
Donoso, J. A., J. P. Illanes and F. Samson (1977). "Dimethylsulfoxide Action on Fast Axoplasmic Transport and Ultrastructure of Vagal Axons." Brain Research 120(2): 287-301.
Duan, W., X. Li, J. Shi, Y. Guo, Z. Li and C. Li (2010). "Mutant Tar DNA-Binding Protein-43 Induces Oxidative Injury in Motor Neuron-Like Cell." Neuroscience 169(4): 1621-1629.
Duchen, M. R. (2000). "Mitochondria and Calcium: From Cell Signalling to Cell Death." The Journal of Physiology 529 Pt 1: 57-68.
Dupuis, L., P. F. Pradat, A. C. Ludolph and J. P. Loeffler (2011). "Energy Metabolism in Amyotrophic Lateral Sclerosis." Lancet Neurology 10(1): 75-82.
Duvezin-Caubet, S., R. Jagasia, J. Wagener, S. Hofmann, A. Trifunovic, A. Hansson, A. Chomyn, M. F. Bauer, G. Attardi, N. G. Larsson, W. Neupert and A. S. Reichert (2006). "Proteolytic Processing of Opa1 Links Mitochondrial Dysfunction to
237

Alterations in Mitochondrial Morphology." The Journal of Biological Chemistry 281(49): 37972-37979.
Eastman, S. W., M. Yassaee and P. D. Bieniasz (2009). "A Role for Ubiquitin Ligases and Spartin/Spg20 in Lipid Droplet Turnover." The Journal of Cell Biology 184(6): 881-894.
Edwards, T. L., V. E. Clowes, H. T. Tsang, J. W. Connell, C. M. Sanderson, J. P. Luzio and E. Reid (2009). "Endogenous Spartin (Spg20) Is Recruited to Endosomes and Lipid Droplets and Interacts with the Ubiquitin E3 Ligases Aip4 and Aip5." The Biochemical Journal 423(1): 31-39.
Ekegren, T., E. Grundstrom, D. Lindholm and S. M. Aquilonius (1999). "Upregulation of Bax Protein and Increased DNA Degradation in Als Spinal Cord Motor Neurons." Acta Neurologica Scandinavica 100(5): 317-321.
Erdmann, R., F. F. Wiebel, A. Flessau, J. Rytka, A. Beyer, K. U. Frohlich and W. H. Kunau (1991). "Pas1, a Yeast Gene Required for Peroxisome Biogenesis, Encodes a Member of a Novel Family of Putative Atpases." Cell 64(3): 499-510.
Errico, A., A. Ballabio and E. I. Rugarli (2002). "Spastin, the Protein Mutated in Autosomal Dominant Hereditary Spastic Paraplegia, Is Involved in Microtubule Dynamics." Human Molecular Genetics 11(2): 153-163.
Estes, P. S., A. Boehringer, R. Zwick, J. E. Tang, B. Grigsby and D. C. Zarnescu (2011). "Wild-Type and A315t Mutant Tdp-43 Exert Differential Neurotoxicity in a Drosophila Model of Als." Human Molecular Genetics 20(12): 2308-2321.
Eura, Y., N. Ishihara, S. Yokota and K. Mihara (2003). "Two Mitofusin Proteins, Mammalian Homologues of Fzo, with Distinct Functions Are Both Required for Mitochondrial Fusion." Journal of Biochemistry 134(3): 333-344.
Evans, K. J., E. R. Gomes, S. M. Reisenweber, G. G. Gundersen and B. P. Lauring (2005). "Linking Axonal Degeneration to Microtubule Remodeling by Spastin-Mediated Microtubule Severing." The Journal of Cell Biology 168(4): 599-606.
Exner, N., B. Treske, D. Paquet, K. Holmstrom, C. Schiesling, S. Gispert, I. Carballo-Carbajal, D. Berg, H. H. Hoepken, T. Gasser, R. Kruger, K. F. Winklhofer, F. Vogel, A. S. Reichert, G. Auburger, P. J. Kahle, B. Schmid and C. Haass (2007). "Loss-of-Function of Human Pink1 Results in Mitochondrial Pathology and Can Be Rescued by Parkin." The Journal of Neuroscience : The Official Journal of the Society for Neuroscience 27(45): 12413-12418.
Fass, E., E. Shvets, I. Degani, K. Hirschberg and Z. Elazar (2006). "Microtubules Support Production of Starvation-Induced Autophagosomes but Not Their Targeting and Fusion with Lysosomes." The Journal of Biological Chemistry 281(47): 36303-36316.
Fassier, C., J. A. Hutt, S. Scholpp, A. Lumsden, B. Giros, F. Nothias, S. Schneider-Maunoury, C. Houart and J. Hazan (2010). "Zebrafish Atlastin Controls Motility and Spinal Motor Axon Architecture Via Inhibition of the Bmp Pathway." Nature Neuroscience 13(11): 1380-1387.
238

Fassier, C., A. Tarrade, L. Peris, S. Courageot, P. Mailly, C. Dalard, S. Delga, N. Roblot, J. Lefevre, D. Job, J. Hazan, P. A. Curmi and J. Melki (2012). "Microtubule-Targeting Drugs Rescue Axonal Swellings in Cortical Neurons from Spastin Knock-out Mice." Disease Models & Mechanisms.
Fassier, C., A. Tarrade, L. Peris, S. Courageot, P. Mailly, C. Dalard, S. Delga, N. Roblot, J. Lefevre, D. Job, J. Hazan, P. A. Curmi and J. Melki (2013). "Microtubule-Targeting Drugs Rescue Axonal Swellings in Cortical Neurons from Spastin Knockout Mice." Disease Models & Mechanisms 6(1): 72-83.
Finsterer, J., W. Loscher, S. Quasthoff, J. Wanschitz, M. Auer-Grumbach and G. Stevanin (2012). "Hereditary Spastic Paraplegias with Autosomal Dominant, Recessive, X-Linked, or Maternal Trait of Inheritance." Journal of the Neurological Sciences 318(1-2): 1-18.
Fischer, L. R., D. G. Culver, P. Tennant, A. A. Davis, M. Wang, A. Castellano-Sanchez, J. Khan, M. A. Polak and J. D. Glass (2004). "Amyotrophic Lateral Sclerosis Is a Distal Axonopathy: Evidence in Mice and Man." Exp Neurol 185(2): 232-240.
Fonknechten, N., D. Mavel, P. Byrne, C. S. Davoine, C. Cruaud, D. Bonsch, D. Samson, P. Coutinho, M. Hutchinson, P. McMonagle, J. M. Burgunder, A. Tartaglione, O. Heinzlef, I. Feki, T. Deufel, N. Parfrey, A. Brice, B. Fontaine, J. F. Prud'homme, J. Weissenbach, A. Durr and J. Hazan (2000). "Spectrum of Spg4 Mutations in Autosomal Dominant Spastic Paraplegia." Human Molecular Genetics 9(4): 637-644.
Frank, M., S. Duvezin-Caubet, S. Koob, A. Occhipinti, R. Jagasia, A. Petcherski, M. O. Ruonala, M. Priault, B. Salin and A. S. Reichert (2012). "Mitophagy Is Triggered by Mild Oxidative Stress in a Mitochondrial Fission Dependent Manner." Biochimica et Biophysica Acta 1823(12): 2297-2310.
Frank, S., B. Gaume, E. S. Bergmann-Leitner, W. W. Leitner, E. G. Robert, F. Catez, C. L. Smith and R. J. Youle (2001). "The Role of Dynamin-Related Protein 1, a Mediator of Mitochondrial Fission, in Apoptosis." Developmental Cell 1(4): 515-525.
Fray, A. E., P. G. Ince, S. J. Banner, I. D. Milton, P. A. Usher, M. R. Cookson and P. J. Shaw (1998). "The Expression of the Glial Glutamate Transporter Protein Eaat2 in Motor Neuron Disease: An Immunohistochemical Study." Eur J Neurosci 10(8): 2481-2489.
Frey, T. G. and C. A. Mannella (2000). "The Internal Structure of Mitochondria." Trends in Biochemical Sciences 25(7): 319-324.
Frickey, T. and A. N. Lupas (2004). "Phylogenetic Analysis of Aaa Proteins." Journal of Structural Biology 146(1-2): 2-10.
Fridovich, I. (1978). "The Biology of Oxygen Radicals." Science 201(4359): 875-880.
Friedman, J. R., L. L. Lackner, M. West, J. R. DiBenedetto, J. Nunnari and G. K. Voeltz (2011). "Er Tubules Mark Sites of Mitochondrial Division." Science 334(6054): 358-362.
239
Friesema, E. C., S. Ganguly, A. Abdalla, J. E. Manning Fox, A. P. Halestrap and T. J. Visser (2003). "Identification of Monocarboxylate Transporter 8 as a Specific Thyroid Hormone Transporter." The Journal of Biological Chemistry 278(41): 40128-40135.
Frohlich, K. U. (2001). "An Aaa Family Tree." Journal of Cell Science 114(Pt 9): 1601-1602.
Fujita, N., T. Itoh, H. Omori, M. Fukuda, T. Noda and T. Yoshimori (2008). "The Atg16l Complex Specifies the Site of Lc3 Lipidation for Membrane Biogenesis in Autophagy." Molecular Biology of the Cell 19(5): 2092-2100.
Fujita, Y., K. Okamoto, A. Sakurai, H. Kusaka, H. Aizawa, B. Mihara and N. K. Gonatas (2002). "The Golgi Apparatus Is Fragmented in Spinal Cord Motor Neurons of Amyotrophic Lateral Sclerosis with Basophilic Inclusions." Acta Neuropathologica 103(3): 243-247.
Fukushima, N., D. Furuta, Y. Hidaka, R. Moriyama and T. Tsujiuchi (2009). "Post-Translational Modifications of Tubulin in the Nervous System." Journal of Neurochemistry 109(3): 683-693.
Galiveti, C. R., T. S. Rozhdestvensky, J. Brosius, H. Lehrach and Z. Konthur (2010). "Application of Housekeeping Npcrnas for Quantitative Expression Analysis of Human Transcriptome by Real-Time Pcr." RNA 16(2): 450-461.
Ganley, I. G., H. Lam du, J. Wang, X. Ding, S. Chen and X. Jiang (2009). "Ulk1.Atg13.Fip200 Complex Mediates Mtor Signaling and Is Essential for Autophagy." The Journal of Biological Chemistry 284(18): 12297-12305.
Gauthier, L. R., B. C. Charrin, M. Borrell-Pages, J. P. Dompierre, H. Rangone, F. P. Cordelieres, J. De Mey, M. E. MacDonald, V. Lessmann, S. Humbert and F. Saudou (2004). "Huntingtin Controls Neurotrophic Support and Survival of Neurons by Enhancing Bdnf Vesicular Transport Along Microtubules." Cell 118(1): 127-138.
Gegg, M. E., J. M. Cooper, K. Y. Chau, M. Rojo, A. H. Schapira and J. W. Taanman (2010). "Mitofusin 1 and Mitofusin 2 Are Ubiquitinated in a Pink1/Parkin-Dependent Manner Upon Induction of Mitophagy." Human Molecular Genetics 19(24): 4861-4870.
Geisler, S., K. M. Holmstrom, D. Skujat, F. C. Fiesel, O. C. Rothfuss, P. J. Kahle and W. Springer (2010). "Pink1/Parkin-Mediated Mitophagy Is Dependent on Vdac1 and P62/Sqstm1." Nature Cell Biology 12(2): 119-131.
Germain, M., J. P. Mathai, H. M. McBride and G. C. Shore (2005). "Endoplasmic Reticulum Bik Initiates Drp1-Regulated Remodelling of Mitochondrial Cristae During Apoptosis." The EMBO Journal 24(8): 1546-1556.
Geser, F., M. Martinez-Lage, L. K. Kwong, V. M. Lee and J. Q. Trojanowski (2009). "Amyotrophic Lateral Sclerosis, Frontotemporal Dementia and Beyond: The Tdp-43 Diseases." Journal of Neurology 256(8): 1205-1214.
240

Giedt, R. J., D. R. Pfeiffer, A. Matzavinos, C. Y. Kao and B. R. Alevriadou (2012). "Mitochondrial Dynamics and Motility inside Living Vascular Endothelial Cells: Role of Bioenergetics." Annals of Biomedical Engineering 40(9): 1903-1916.
Gilley, J., A. Seereeram, K. Ando, S. Mosely, S. Andrews, M. Kerschensteiner, T. Misgeld, J. P. Brion, B. Anderton, D. P. Hanger and M. P. Coleman (2012). "Age-Dependent Axonal Transport and Locomotor Changes and Tau Hypophosphorylation in a "P301l" Tau Knockin Mouse." Neurobiology of Aging 33(3): 621 e621-621 e615.
Giordana, M. T., M. Piccinini, S. Grifoni, G. De Marco, M. Vercellino, M. Magistrello, A. Pellerino, B. Buccinna, E. Lupino and M. T. Rinaudo (2010). "Tdp-43 Redistribution Is an Early Event in Sporadic Amyotrophic Lateral Sclerosis." Brain Pathology 20(2): 351-360.
Giralt, A. and F. Villarroya (2012). "Sirt3, a Pivotal Actor in Mitochondrial Functions: Metabolism, Cell Death and Aging." The Biochemical Journal 444(1): 1-10.
Glozak, M. A., N. Sengupta, X. Zhang and E. Seto (2005). "Acetylation and Deacetylation of Non-Histone Proteins." Gene 363: 15-23.
Glynn, P. (2005). "Neuropathy Target Esterase and Phospholipid Deacylation." Biochimica et Biophysica Acta 1736(2): 87-93.
Goizet, C., A. Boukhris, A. Durr, C. Beetz, J. Truchetto, C. Tesson, M. Tsaousidou, S. Forlani, L. Guyant-Marechal, B. Fontaine, J. Guimaraes, B. Isidor, O. Chazouilleres, D. Wendum, D. Grid, F. Chevy, P. F. Chinnery, P. Coutinho, J. P. Azulay, I. Feki, F. Mochel, C. Wolf, C. Mhiri, A. Crosby, A. Brice and G. Stevanin (2009). "Cyp7b1 Mutations in Pure and Complex Forms of Hereditary Spastic Paraplegia Type 5." Brain : A Journal of Neurology 132(Pt 6): 1589-1600.
Gomes, L. C., G. Di Benedetto and L. Scorrano (2011). "During Autophagy Mitochondria Elongate, Are Spared from Degradation and Sustain Cell Viability." Nature Cell Biology 13(5): 589-598.
Gomes, L. C. and L. Scorrano (2008). "High Levels of Fis1, a Pro-Fission Mitochondrial Protein, Trigger Autophagy." Biochimica et Biophysica Acta 1777(7-8): 860-866.
Gomes, L. C. and L. Scorrano (2013). "Mitochondrial Morphology in Mitophagy and Macroautophagy." Biochimica et Biophysica Acta 1833(1): 205-212.
Gomez, L. A. and T. M. Hagen (2012). "Age-Related Decline in Mitochondrial Bioenergetics: Does Supercomplex Destabilization Determine Lower Oxidative Capacity and Higher Superoxide Production?" Seminars in Cell & Developmental Biology 23(7): 758-767.
Gomez, L. A., J. S. Monette, J. D. Chavez, C. S. Maier and T. M. Hagen (2009). "Supercomplexes of the Mitochondrial Electron Transport Chain Decline in the Aging Rat Heart." Archives of Biochemistry and Biophysics 490(1): 30-35.
241
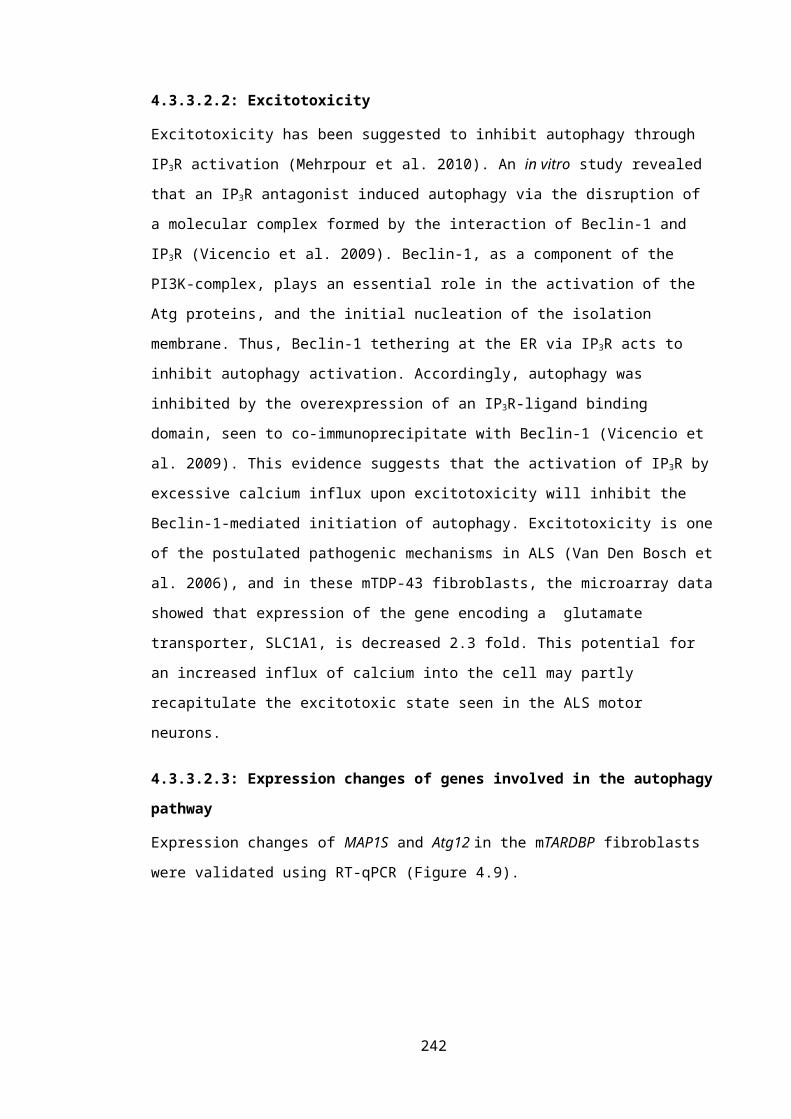
Gonzalez de Aguilar, J. L., J. W. Gordon, F. Rene, M. de Tapia, B. Lutz-Bucher, C. Gaiddon and J. P. Loeffler (2000). "Alteration of the Bcl-X/Bax Ratio in a Transgenic Mouse Model of Amyotrophic Lateral Sclerosis: Evidence for the Implication of the P53 Signaling Pathway." Neurobiol Dis 7(4): 406-415.
Goytain, A. and G. A. Quamme (2008). "Identification and Characterization of a Novel Family of Membrane Magnesium Transporters, Mmgt1 and Mmgt2." American Journal of Physiology. Cell Physiology 294(2): C495-502.
Greenway, M. J., P. M. Andersen, C. Russ, S. Ennis, S. Cashman, C. Donaghy, V. Patterson, R. Swingler, D. Kieran, J. Prehn, K. E. Morrison, A. Green, K. R. Acharya, R. H. Brown, Jr. and O. Hardiman (2006). "Ang Mutations Segregate with Familial and 'Sporadic' Amyotrophic Lateral Sclerosis." Nat Genet 38(4): 411-413.
Grosskreutz, J., L. Van Den Bosch and B. U. Keller (2010). "Calcium Dysregulation in Amyotrophic Lateral Sclerosis." Cell Calcium 47(2): 165-174.
Guegan, C. and S. Przedborski (2003). "Programmed Cell Death in Amyotrophic Lateral Sclerosis." J Clin Invest 111(2): 153-161.
Guegan, C., M. Vila, G. Rosoklija, A. P. Hays and S. Przedborski (2001). "Recruitment of the Mitochondrial-Dependent Apoptotic Pathway in Amyotrophic Lateral Sclerosis." J Neurosci 21(17): 6569-6576.
Guillery, O., F. Malka, P. Frachon, D. Milea, M. Rojo and A. Lombes (2008). "Modulation of Mitochondrial Morphology by Bioenergetics Defects in Primary Human Fibroblasts." Neuromuscular Disorders : NMD 18(4): 319-330.
Guillery, O., F. Malka, P. Frachon, D. Milea, M. Rojo and A. Lombes (2008). "Modulation of Mitochondrial Morphology by Bioenergetics Defects in Primary Human Fibroblasts." Neuromuscul Disord 18(4): 319-330.
Guja, K. E. and M. Garcia-Diaz (2012). "Hitting the Brakes: Termination of Mitochondrial Transcription." Biochimica et Biophysica Acta 1819(9-10): 939-947.
Guo, Z., M. S. Kindy, I. Kruman and M. P. Mattson (2000). "Als-Linked Cu/Zn-Sod Mutation Impairs Cerebral Synaptic Glucose and Glutamate Transport and Exacerbates Ischemic Brain Injury." J Cereb Blood Flow Metab 20(3): 463-468.
Gurney, M. E. (1994). "Transgenic-Mouse Model of Amyotrophic Lateral Sclerosis." N Engl J Med 331(25): 1721-1722.
Hackenbrock, C. R., T. G. Rehn, E. C. Weinbach and J. J. Lemasters (1971). "Oxidative Phosphorylation and Ultrastructural Transformation in Mitochondria in the Intact Ascites Tumor Cell." J Cell Biol 51(1): 123-137.
Haggarty, S. J., K. M. Koeller, J. C. Wong, C. M. Grozinger and S. L. Schreiber (2003). "Domain-Selective Small-Molecule Inhibitor of Histone Deacetylase 6 (Hdac6)-Mediated Tubulin Deacetylation." Proceedings of the National Academy of Sciences of the United States of America 100(8): 4389-4394.
242
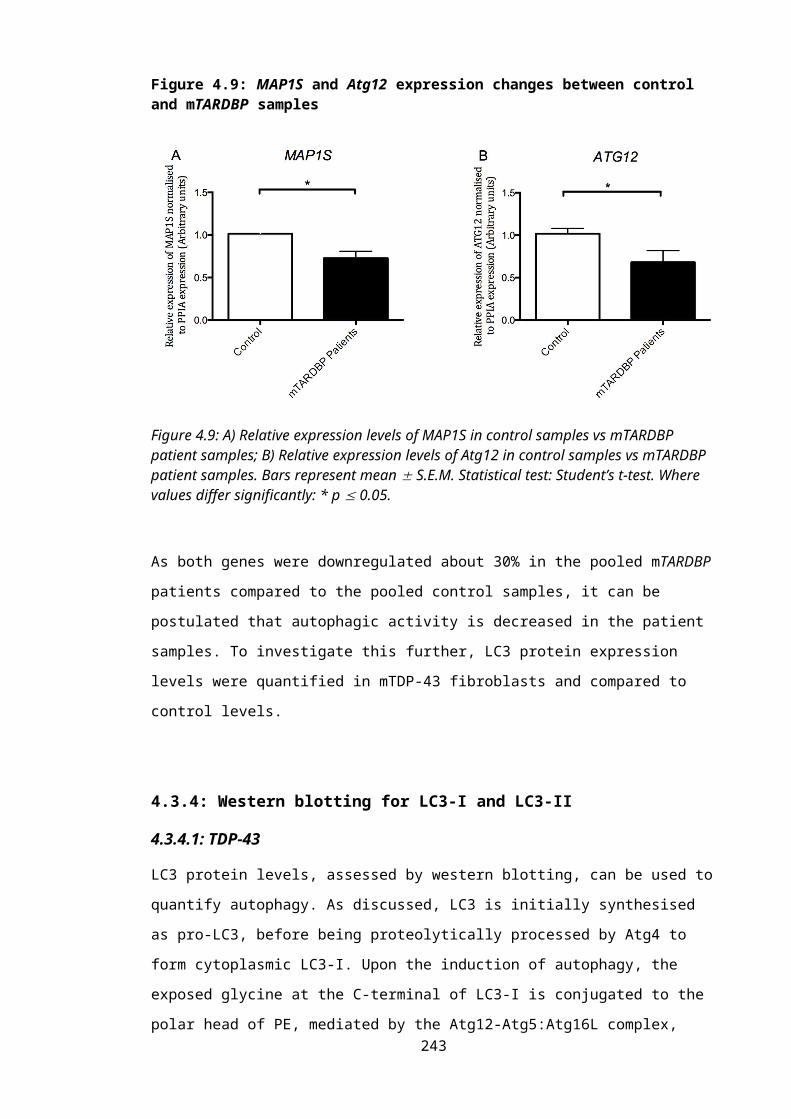
Hailey, D. W., A. S. Rambold, P. Satpute-Krishnan, K. Mitra, R. Sougrat, P. K. Kim and J. Lippincott-Schwartz (2010). "Mitochondria Supply Membranes for Autophagosome Biogenesis During Starvation." Cell 141(4): 656-667.
Hajnoczky, G., L. D. Robb-Gaspers, M. B. Seitz and A. P. Thomas (1995). "Decoding of Cytosolic Calcium Oscillations in the Mitochondria." Cell 82(3): 415-424.
Hales, K. G. and M. T. Fuller (1997). "Developmentally Regulated Mitochondrial Fusion Mediated by a Conserved, Novel, Predicted Gtpase." Cell 90(1): 121-129.
Halestrap, A. P. and C. Brenner (2003). "The Adenine Nucleotide Translocase: A Central Component of the Mitochondrial Permeability Transition Pore and Key Player in Cell Death." Current Medicinal Chemistry 10(16): 1507-1525.
Hanada, T., N. N. Noda, Y. Satomi, Y. Ichimura, Y. Fujioka, T. Takao, F. Inagaki and Y. Ohsumi (2007). "The Atg12-Atg5 Conjugate Has a Novel E3-Like Activity for Protein Lipidation in Autophagy." The Journal of Biological Chemistry 282(52): 37298-37302.
Handran, S. D., J. L. Werth, D. C. DeVivo and S. M. Rothman (1997). "Mitochondrial Morphology and Intracellular Calcium Homeostasis in Cytochrome Oxidase-Deficient Human Fibroblasts." Neurobiology of Disease 3(4): 287-298.
Hansen, J. J., A. Durr, I. Cournu-Rebeix, C. Georgopoulos, D. Ang, M. N. Nielsen, C. S. Davoine, A. Brice, B. Fontaine, N. Gregersen and P. Bross (2002). "Hereditary Spastic Paraplegia Spg13 Is Associated with a Mutation in the Gene Encoding the Mitochondrial Chaperonin Hsp60." American Journal of Human Genetics 70(5): 1328-1332.
Hara, T., K. Nakamura, M. Matsui, A. Yamamoto, Y. Nakahara, R. Suzuki-Migishima, M. Yokoyama, K. Mishima, I. Saito, H. Okano and N. Mizushima (2006). "Suppression of Basal Autophagy in Neural Cells Causes Neurodegenerative Disease in Mice." Nature 441(7095): 885-889.
Harding, A. E. (1983). "Classification of the Hereditary Ataxias and Paraplegias." Lancet 1(8334): 1151-1155.
Harley, C. B., A. B. Futcher and C. W. Greider (1990). "Telomeres Shorten During Ageing of Human Fibroblasts." Nature 345(6274): 458-460.
Harman, D. (1956). "Aging: A Theory Based on Free Radical and Radiation Chemistry." Journal of Gerontology 11(3): 298-300.
Harms, M. B., D. Neumann, B. A. Benitez, B. Cooper, D. Carrell, B. A. Racette, J. S. Perlmutter, A. Goate and C. Cruchaga (2012). "Parkinson Disease Is Not Associated with C9orf72 Repeat Expansions." Neurobiology of Aging.
Hayashi, J., S. Ohta, A. Kikuchi, M. Takemitsu, Y. Goto and I. Nonaka (1991). "Introduction of Disease-Related Mitochondrial DNA Deletions into Hela Cells Lacking Mitochondrial DNA Results in Mitochondrial Dysfunction." Proceedings of the National Academy of Sciences of the United States of America 88(23): 10614-10618.
243
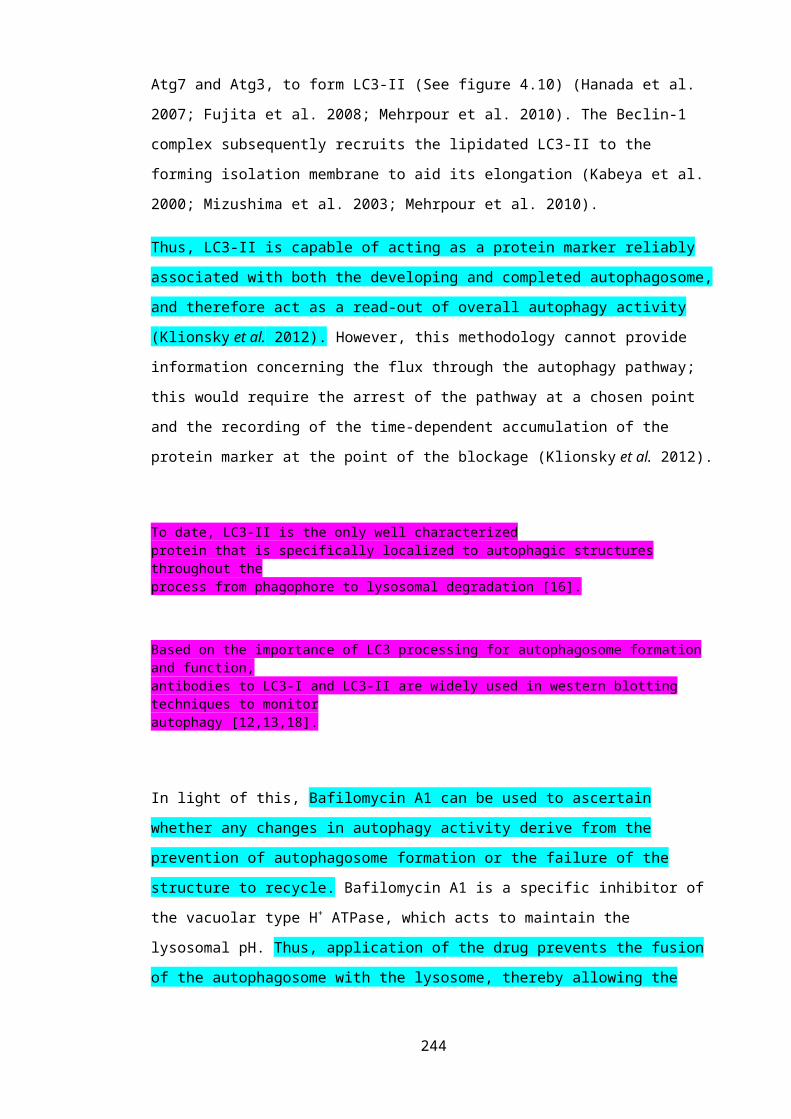
Hayashi, T., R. Rizzuto, G. Hajnoczky and T. P. Su (2009). "Mam: More Than Just a Housekeeper." Trends in Cell Biology 19(2): 81-88.
Hayashi, T. and T. P. Su (2007). "Sigma-1 Receptor Chaperones at the Er-Mitochondrion Interface Regulate Ca(2+) Signaling and Cell Survival." Cell 131(3): 596-610.
Hazan, J., N. Fonknechten, D. Mavel, C. Paternotte, D. Samson, F. Artiguenave, C. S. Davoine, C. Cruaud, A. Durr, P. Wincker, P. Brottier, L. Cattolico, V. Barbe, J. M. Burgunder, J. F. Prud'homme, A. Brice, B. Fontaine, B. Heilig and J. Weissenbach (1999). "Spastin, a New Aaa Protein, Is Altered in the Most Frequent Form of Autosomal Dominant Spastic Paraplegia." Nature Genetics 23(3): 296-303.
Hebron, M. L., I. Lonskaya, K. Sharpe, P. P. Weerasinghe, N. K. Algarzae, A. R. Shekonyan and C. E. Moussa (2013). "Parkin Ubiquitinates Tar-DNA Binding Protein-43 (Tdp-43) and Promotes Its Cytosolic Accumulation Via Interaction with Histone Deacetylase 6 (Hdac6)." The Journal of Biological Chemistry 288: 4103-4115.
Hempen, B. and J. P. Brion (1996). "Reduction of Acetylated Alpha-Tubulin Immunoreactivity in Neurofibrillary Tangle-Bearing Neurons in Alzheimer's Disease." Journal of neuropathology and experimental neurology 55(9): 964-972.
Hetz, C., P. Thielen, S. Matus, M. Nassif, F. Court, R. Kiffin, G. Martinez, A. M. Cuervo, R. H. Brown and L. H. Glimcher (2009). "Xbp-1 Deficiency in the Nervous System Protects against Amyotrophic Lateral Sclerosis by Increasing Autophagy." Genes & Development 23(19): 2294-2306.
Hirokawa, N., T. Funakoshi, R. Sato-Harada and Y. Kanai (1996). "Selective Stabilization of Tau in Axons and Microtubule-Associated Protein 2c in Cell Bodies and Dendrites Contributes to Polarized Localization of Cytoskeletal Proteins in Mature Neurons." The Journal of Cell Biology 132(4): 667-679.
Hirokawa, N. and R. Takemura (2004). "Molecular Motors in Neuronal Development, Intracellular Transport and Diseases." Current Opinion in Neurobiology 14(5): 564-573.
Hirst, J., L. D. Barlow, G. C. Francisco, D. A. Sahlender, M. N. Seaman, J. B. Dacks and M. S. Robinson (2011). "The Fifth Adaptor Protein Complex." PLoS Biology 9(10): e1001170.
Hofhaus, G., D. R. Johns, O. Hurko, G. Attardi and A. Chomyn (1996). "Respiration and Growth Defects in Transmitochondrial Cell Lines Carrying the 11778 Mutation Associated with Leber's Hereditary Optic Neuropathy." The Journal of Biological Chemistry 271(22): 13155-13161.
Hong, K., Y. Li, W. Duan, Y. Guo, H. Jiang, W. Li and C. Li (2012). "Full-Length Tdp-43 and Its C-Terminal Fragments Activate Mitophagy in Nsc34 Cell Line." Neuroscience Letters 530(2): 144-149.
Huang, L. a. W., M (1995). "Image Thresholding by Minimizing the Measures of Fuzziness." Pattern Recognition 28(1): 41-51
244
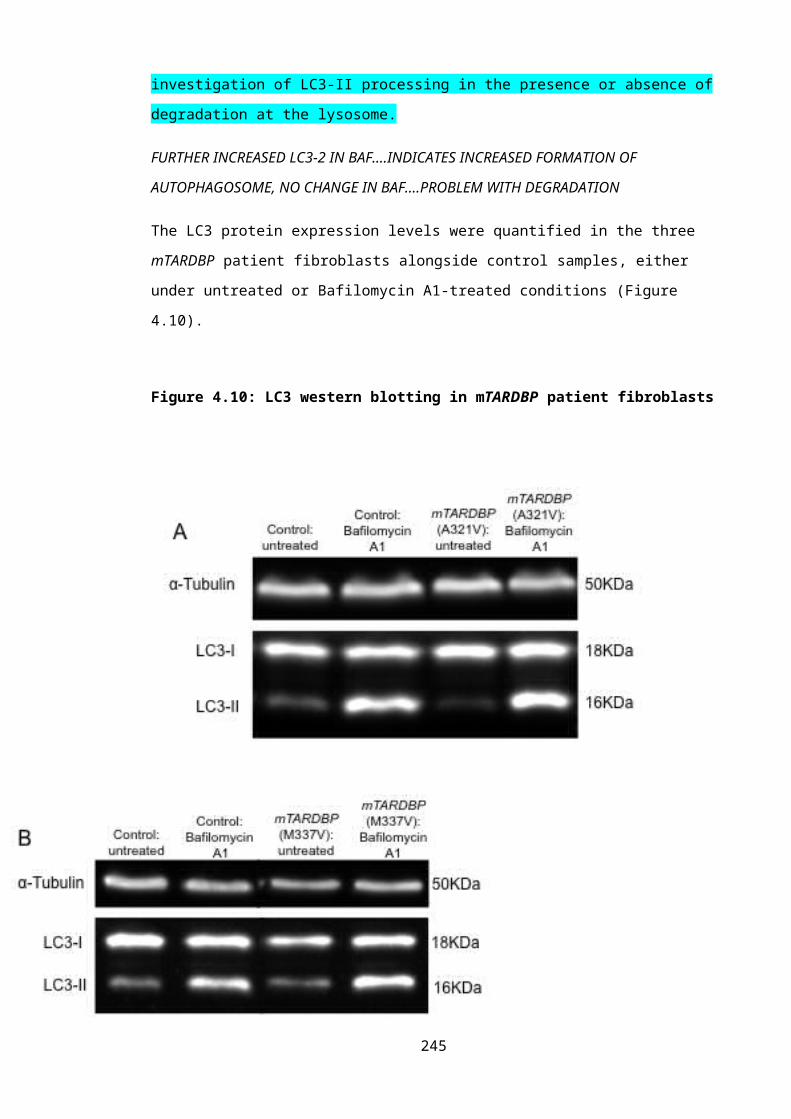
.
Hughes, J. T. (1982). "Pathology of Amyotrophic Lateral Sclerosis." Advances in Neurology 36: 61-74.
Igaz, L. M., L. K. Kwong, E. B. Lee, A. Chen-Plotkin, E. Swanson, T. Unger, J. Malunda, Y. Xu, M. J. Winton, J. Q. Trojanowski and V. M. Lee (2011). "Dysregulation of the Als-Associated Gene Tdp-43 Leads to Neuronal Death and Degeneration in Mice." The Journal of Clinical Investigation 121(2): 726-738.
Ilieva, E. V., V. Ayala, M. Jove, E. Dalfo, D. Cacabelos, M. Povedano, M. J. Bellmunt, I. Ferrer, R. Pamplona and M. Portero-Otin (2007). "Oxidative and Endoplasmic Reticulum Stress Interplay in Sporadic Amyotrophic Lateral Sclerosis." Brain : A Journal of Neurology 130(Pt 12): 3111-3123.
Ilzecka, J., Z. Stelmasiak, J. Solski, S. Wawrzycki and M. Szpetnar (2003). "Plasma Amino Acids Percentages in Amyotrophic Lateral Sclerosis Patients." Neurol Sci 24(4): 293-295.
Ince, P., N. Stout, P. Shaw, J. Slade, W. Hunziker, C. W. Heizmann and K. G. Baimbridge (1993). "Parvalbumin and Calbindin D-28k in the Human Motor System and in Motor Neuron Disease." Neuropathology and Applied Neurobiology 19(4): 291-299.
Ingerman, E., E. M. Perkins, M. Marino, J. A. Mears, J. M. McCaffery, J. E. Hinshaw and J. Nunnari (2005). "Dnm1 Forms Spirals That Are Structurally Tailored to Fit Mitochondria." The Journal of Cell Biology 170(7): 1021-1027.
Inoue, K. (2005). "Plp1-Related Inherited Dysmyelinating Disorders: Pelizaeus-Merzbacher Disease and Spastic Paraplegia Type 2." Neurogenetics 6(1): 1-16.
Israelson, A., N. Arbel, S. Da Cruz, H. Ilieva, K. Yamanaka, V. Shoshan-Barmatz and D. W. Cleveland (2010). "Misfolded Mutant Sod1 Directly Inhibits Vdac1 Conductance in a Mouse Model of Inherited Als." Neuron 67(4): 575-587.
Itakura, E., C. Kishi, K. Inoue and N. Mizushima (2008). "Beclin 1 Forms Two Distinct Phosphatidylinositol 3-Kinase Complexes with Mammalian Atg14 and Uvrag." Molecular Biology of the Cell 19(12): 5360-5372.
Iverson, S. L. and S. Orrenius (2004). "The Cardiolipin-Cytochrome C Interaction and the Mitochondrial Regulation of Apoptosis." Arch Biochem Biophys 423(1): 37-46.
Jaarsma, D., F. Rognoni, W. van Duijn, H. W. Verspaget, E. D. Haasdijk and J. C. Holstege (2001). "Cuzn Superoxide Dismutase (Sod1) Accumulates in Vacuolated Mitochondria in Transgenic Mice Expressing Amyotrophic Lateral Sclerosis-Linked Sod1 Mutations." Acta Neuropathologica 102(4): 293-305.
Jakobs, S., N. Martini, A. C. Schauss, A. Egner, B. Westermann and S. W. Hell (2003). "Spatial and Temporal Dynamics of Budding Yeast Mitochondria Lacking the Division Component Fis1p." J Cell Sci 116(Pt 10): 2005-2014.
245
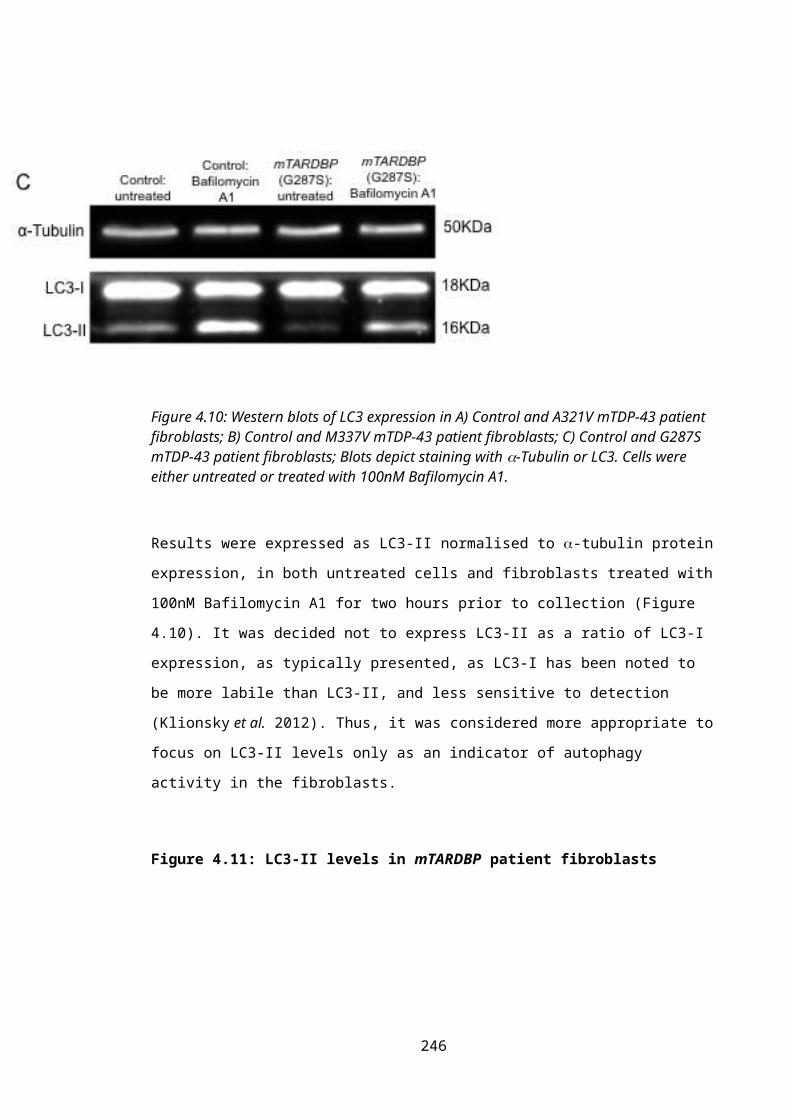
Jia, D., T. S. Gomez, Z. Metlagel, J. Umetani, Z. Otwinowski, M. K. Rosen and D. D. Billadeau (2010). "Wash and Wave Actin Regulators of the Wiskott-Aldrich Syndrome Protein (Wasp) Family Are Controlled by Analogous Structurally Related Complexes." Proceedings of the National Academy of Sciences of the United States of America 107(23): 10442-10447.
Jouet, M., A. Rosenthal, G. Armstrong, J. MacFarlane, R. Stevenson, J. Paterson, A. Metzenberg, V. Ionasescu, K. Temple and S. Kenwrick (1994). "X-Linked Spastic Paraplegia (Spg1), Masa Syndrome and X-Linked Hydrocephalus Result from Mutations in the L1 Gene." Nature Genetics 7(3): 402-407.
Jung, C., C. M. Higgins and Z. Xu (2002). "Mitochondrial Electron Transport Chain Complex Dysfunction in a Transgenic Mouse Model for Amyotrophic Lateral Sclerosis." J Neurochem 83(3): 535-545.
Jung, C. H., C. B. Jun, S. H. Ro, Y. M. Kim, N. M. Otto, J. Cao, M. Kundu and D. H. Kim (2009). "Ulk-Atg13-Fip200 Complexes Mediate Mtor Signaling to the Autophagy Machinery." Molecular Biology of the Cell 20(7): 1992-2003.
Kabashi, E., L. Lin, M. L. Tradewell, P. A. Dion, V. Bercier, P. Bourgouin, D. Rochefort, S. Bel Hadj, H. D. Durham, C. Vande Velde, G. A. Rouleau and P. Drapeau (2010). "Gain and Loss of Function of Als-Related Mutations of Tardbp (Tdp-43) Cause Motor Deficits in Vivo." Human Molecular Genetics 19(4): 671-683.
Kabashi, E., P. N. Valdmanis, P. Dion, D. Spiegelman, B. J. McConkey, C. Vande Velde, J. P. Bouchard, L. Lacomblez, K. Pochigaeva, F. Salachas, P. F. Pradat, W. Camu, V. Meininger, N. Dupre and G. A. Rouleau (2008). "Tardbp Mutations in Individuals with Sporadic and Familial Amyotrophic Lateral Sclerosis." Nature Genetics 40(5): 572-574.
Kabeya, Y., N. Mizushima, T. Ueno, A. Yamamoto, T. Kirisako, T. Noda, E. Kominami, Y. Ohsumi and T. Yoshimori (2000). "Lc3, a Mammalian Homologue of Yeast Apg8p, Is Localized in Autophagosome Membranes after Processing." The EMBO Journal 19(21): 5720-5728.
Kaivorinne, A. L., V. Moilanen, M. Kervinen, A. E. Renton, B. J. Traynor, K. Majamaa and A. M. Remes (2012). "Novel Tardbp Sequence Variant and C9orf72 Repeat Expansion in a Family with Frontotemporal Dementia." Alzheimer Disease and Associated Disorders.
Kammermeier, L., J. Spring, M. Stierwald, J. M. Burgunder and H. Reichert (2003). "Identification of the Drosophila Melanogaster Homolog of the Human Spastin Gene." Development Genes and Evolution 213(8): 412-415.
Kanamori, A., J. Nakayama, M. N. Fukuda, W. B. Stallcup, K. Sasaki, M. Fukuda and Y. Hirabayashi (1997). "Expression Cloning and Characterization of a Cdna Encoding a Novel Membrane Protein Required for the Formation of O-Acetylated Ganglioside: A Putative Acetyl-Coa Transporter." Proceedings of the National Academy of Sciences of the United States of America 94(7): 2897-2902.
Kanekura, K., H. Suzuki, S. Aiso and M. Matsuoka (2009). "Er Stress and Unfolded Protein Response in Amyotrophic Lateral Sclerosis." Molecular Neurobiology 39(2): 81-89.
246
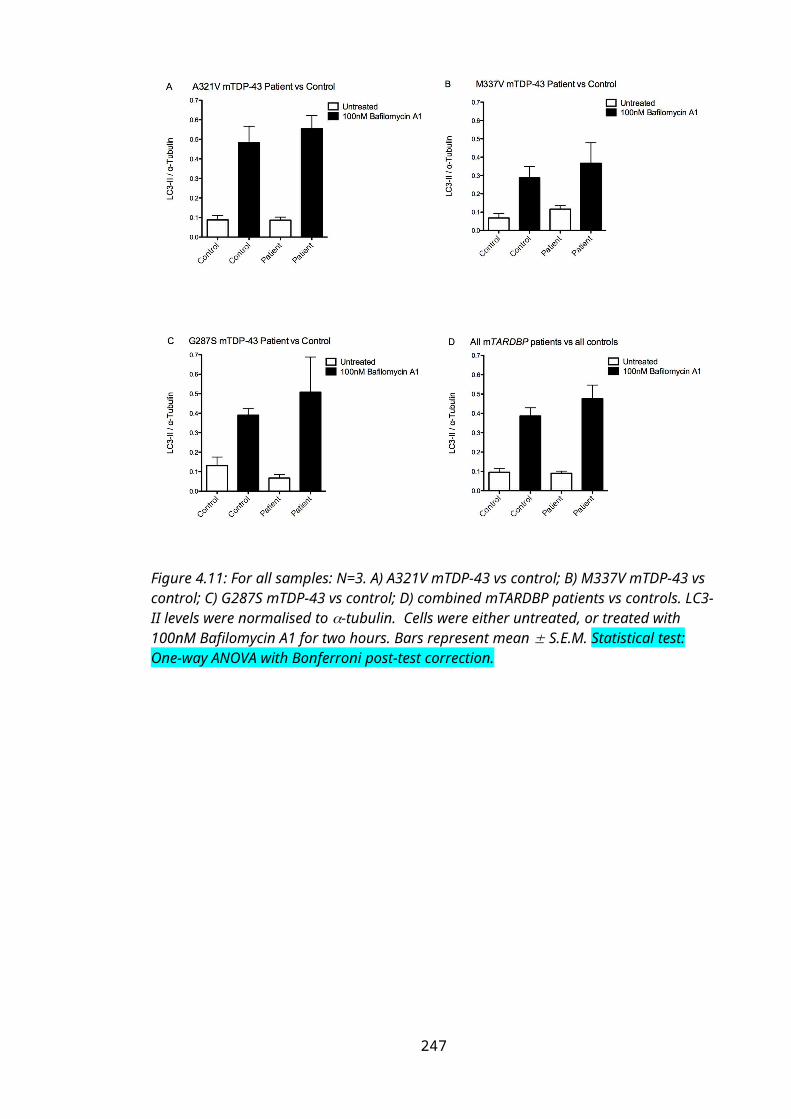
Kang, S. J., I. Sanchez, N. Jing and J. Yuan (2003). "Dissociation between Neurodegeneration and Caspase-11-Mediated Activation of Caspase-1 and Caspase-3 in a Mouse Model of Amyotrophic Lateral Sclerosis." J Neurosci 23(13): 5455-5460.
Kanki, T., K. Wang, Y. Cao, M. Baba and D. J. Klionsky (2009). "Atg32 Is a Mitochondrial Protein That Confers Selectivity During Mitophagy." Developmental Cell 17(1): 98-109.
Karbowski, M., Y. J. Lee, B. Gaume, S. Y. Jeong, S. Frank, A. Nechushtan, A. Santel, M. Fuller, C. L. Smith and R. J. Youle (2002). "Spatial and Temporal Association of Bax with Mitochondrial Fission Sites, Drp1, and Mfn2 During Apoptosis." The Journal of Cell Biology 159(6): 931-938.
Karbowski, M., K. L. Norris, M. M. Cleland, S. Y. Jeong and R. J. Youle (2006). "Role of Bax and Bak in Mitochondrial Morphogenesis." Nature 443(7112): 658-662.
Karbowski, M. and R. J. Youle (2003). "Dynamics of Mitochondrial Morphology in Healthy Cells and During Apoptosis." Cell Death Differ 10(8): 870-880.
Karbowski, M. and R. J. Youle (2003). "Dynamics of Mitochondrial Morphology in Healthy Cells and During Apoptosis." Cell Death and Differentiation 10(8): 870-880.
Karle, K. N., D. Mockel, E. Reid and L. Schols (2012). "Axonal Transport Deficit in a Kif5a( -/- ) Mouse Model." Neurogenetics 13(2): 169-179.
Kasher, P. (2009). An Investigation of the Mechanisms of Disease in Hereditary Spastic Paraplegia Caused by Spastin Mutation. Academic Unit of Neurology. Sheffield, University of Sheffield. PhD.
Kasher, P. R., K. J. De Vos, S. B. Wharton, C. Manser, E. J. Bennett, M. Bingley, J. D. Wood, R. Milner, C. J. McDermott, C. C. Miller, P. J. Shaw and A. J. Grierson (2009). "Direct Evidence for Axonal Transport Defects in a Novel Mouse Model of Mutant Spastin-Induced Hereditary Spastic Paraplegia (Hsp) and Human Hsp Patients." Journal of Neurochemistry 110(1): 34-44.
Kawahara, Y., K. Ito, H. Sun, H. Aizawa, I. Kanazawa and S. Kwak (2004). "Glutamate Receptors: Rna Editing and Death of Motor Neurons." Nature 427(6977): 801.
Kawauchi, K., K. Araki, K. Tobiume and N. Tanaka (2008). "P53 Regulates Glucose Metabolism through an Ikk-Nf-Kappab Pathway and Inhibits Cell Transformation." Nat Cell Biol 10(5): 611-618.
Kim, C., H. Choi, E. S. Jung, W. Lee, S. Oh, N. L. Jeon and I. Mook-Jung (2012). "Hdac6 Inhibitor Blocks Amyloid Beta-Induced Impairment of Mitochondrial Transport in Hippocampal Neurons." PLoS One 7(8): e42983.
Kim, S. H., N. P. Shanware, M. J. Bowler and R. S. Tibbetts (2010). "Amyotrophic Lateral Sclerosis-Associated Proteins Tdp-43 and Fus/Tls Function in a Common Biochemical Complex to Co-Regulate Hdac6 Mrna." The Journal of Biological Chemistry 285(44): 34097-34105.
247
Kim, Y., J. Park, S. Kim, S. Song, S. K. Kwon, S. H. Lee, T. Kitada, J. M. Kim and J. Chung (2008). "Pink1 Controls Mitochondrial Localization of Parkin through Direct Phosphorylation." Biochemical and Biophysical Research Communications 377(3): 975-980.
King, A., S. Al-Sarraj, C. Troakes, B. N. Smith, S. Maekawa, M. Iovino, M. G. Spillantini and C. E. Shaw (2013). "Mixed Tau, Tdp-43 and P62 Pathology in Ftld Associated with a C9orf72 Repeat Expansion and P.Ala239thr Mapt (Tau) Variant." Acta Neuropathologica 125(2): 303-310.
Kirby, J., E. F. Goodall, W. Smith, J. R. Highley, R. Masanzu, J. A. Hartley, R. Hibberd, H. C. Hollinger, S. B. Wharton, K. E. Morrison, P. G. Ince, C. J. McDermott and P. J. Shaw (2010). "Broad Clinical Phenotypes Associated with Tar-DNA Binding Protein (Tardbp) Mutations in Amyotrophic Lateral Sclerosis." Neurogenetics 11(2): 217-225.
Kirkinezos, I. G., S. R. Bacman, D. Hernandez, J. Oca-Cossio, L. J. Arias, M. A. Perez-Pinzon, W. G. Bradley and C. T. Moraes (2005). "Cytochrome C Association with the Inner Mitochondrial Membrane Is Impaired in the Cns of G93a-Sod1 Mice." J Neurosci 25(1): 164-172.
Klebe, S., A. Lossos, H. Azzedine, E. Mundwiller, R. Sheffer, M. Gaussen, C. Marelli, M. Nawara, W. Carpentier, V. Meyer, A. Rastetter, E. Martin, D. Bouteiller, L. Orlando, G. Gyapay, K. H. El-Hachimi, B. Zimmerman, M. Gamliel, A. Misk, I. Lerer, A. Brice, A. Durr and G. Stevanin (2012). "Kif1a Missense Mutations in Spg30, an Autosomal Recessive Spastic Paraplegia: Distinct Phenotypes According to the Nature of the Mutations." European Journal of Human Genetics : EJHG 20(6): 645-649.
Klionsky, D. J., F. C. Abdalla, H. Abeliovich, R. T. Abraham, A. Acevedo-Arozena, K. Adeli, L. Agholme, M. Agnello, P. Agostinis, J. A. Aguirre-Ghiso, H. J. Ahn, O. Ait-Mohamed, S. Ait-Si-Ali, T. Akematsu, S. Akira, H. M. Al-Younes, M. A. Al-Zeer, M. L. Albert, R. L. Albin, J. Alegre-Abarrategui, M. F. Aleo, M. Alirezaei, A. Almasan, M. Almonte-Becerril, A. Amano, R. Amaravadi, S. Amarnath, A. O. Amer, N. Andrieu-Abadie, V. Anantharam, D. K. Ann, S. Anoopkumar-Dukie, H. Aoki, N. Apostolova, P. Auberger, M. Baba, S. K. Backues, E. H. Baehrecke, B. A. Bahr, X. Y. Bai, Y. Bailly, R. Baiocchi, G. Baldini, W. Balduini, A. Ballabio, B. A. Bamber, E. T. Bampton, G. Banhegyi, C. R. Bartholomew, D. C. Bassham, R. C. Bast, Jr., H. Batoko, B. H. Bay, I. Beau, D. M. Bechet, T. J. Begley, C. Behl, C. Behrends, S. Bekri, B. Bellaire, L. J. Bendall, L. Benetti, L. Berliocchi, H. Bernardi, F. Bernassola, S. Besteiro, I. Bhatia-Kissova, X. Bi, M. Biard-Piechaczyk, J. S. Blum, L. H. Boise, P. Bonaldo, D. L. Boone, B. C. Bornhauser, K. R. Bortoluci, I. Bossis, F. Bost, J. P. Bourquin, P. Boya, M. Boyer-Guittaut, P. V. Bozhkov, N. R. Brady, C. Brancolini, A. Brech, J. E. Brenman, A. Brennand, E. H. Bresnick, P. Brest, D. Bridges, M. L. Bristol, P. S. Brookes, E. J. Brown, J. H. Brumell, N. Brunetti-Pierri, U. T. Brunk, D. E. Bulman, S. J. Bultman, G. Bultynck, L. F. Burbulla, W. Bursch, J. P. Butchar, W. Buzgariu, S. P. Bydlowski, K. Cadwell, M. Cahova, D. Cai, J. Cai, Q. Cai, B. Calabretta, J. Calvo-Garrido, N. Camougrand, M. Campanella, J. Campos-Salinas, E. Candi, L. Cao, A. B. Caplan, S. R. Carding, S. M. Cardoso, J. S. Carew, C. R. Carlin, V. Carmignac, L. A. Carneiro, S. Carra, R. A. Caruso, G. Casari, C. Casas, R. Castino, E. Cebollero, F. Cecconi, J. Celli, H. Chaachouay, H. J. Chae, C. Y. Chai, D. C. Chan, E. Y. Chan, R. C. Chang, C. M. Che, C. C. Chen, G. C. Chen, G. Q. Chen, M. Chen, Q. Chen, S. S. Chen, W. Chen, X. Chen, Y. G. Chen, Y. Chen, Y. J. Chen, Z. Chen, A. Cheng, C. H. Cheng, Y. Cheng, H. Cheong, J. H.
248
Cheong, S. Cherry, R. Chess-Williams, Z. H. Cheung, E. Chevet, H. L. Chiang, R. Chiarelli, T. Chiba, L. S. Chin, S. H. Chiou, F. V. Chisari, C. H. Cho, D. H. Cho, A. M. Choi, D. Choi, K. S. Choi, M. E. Choi, S. Chouaib, D. Choubey, V. Choubey, C. T. Chu, T. H. Chuang, S. H. Chueh, T. Chun, Y. J. Chwae, M. L. Chye, R. Ciarcia, M. R. Ciriolo, M. J. Clague, R. S. Clark, P. G. Clarke, R. Clarke, P. Codogno, H. A. Coller, M. I. Colombo, S. Comincini, M. Condello, F. Condorelli, M. R. Cookson, G. H. Coombs, I. Coppens, R. Corbalan, P. Cossart, P. Costelli, S. Costes, A. Coto-Montes, E. Couve, F. P. Coxon, J. M. Cregg, J. L. Crespo, M. J. Cronje, A. M. Cuervo, J. J. Cullen, M. J. Czaja, M. D'Amelio, A. Darfeuille-Michaud, L. M. Davids, F. E. Davies, M. De Felici, J. F. de Groot, C. A. de Haan, L. De Martino, A. De Milito, V. De Tata, J. Debnath, A. Degterev, B. Dehay, L. M. Delbridge, F. Demarchi, Y. Z. Deng, J. Dengjel, P. Dent, D. Denton, V. Deretic, S. D. Desai, R. J. Devenish, M. Di Gioacchino, G. Di Paolo, C. Di Pietro, G. Diaz-Araya, I. Diaz-Laviada, M. T. Diaz-Meco, J. Diaz-Nido, I. Dikic, S. P. Dinesh-Kumar, W. X. Ding, C. W. Distelhorst, A. Diwan, M. Djavaheri-Mergny, S. Dokudovskaya, Z. Dong, F. C. Dorsey, V. Dosenko, J. J. Dowling, S. Doxsey, M. Dreux, M. E. Drew, Q. Duan, M. A. Duchosal, K. Duff, I. Dugail, M. Durbeej, M. Duszenko, C. L. Edelstein, A. L. Edinger, G. Egea, L. Eichinger, N. T. Eissa, S. Ekmekcioglu, W. S. El-Deiry, Z. Elazar, M. Elgendy, L. M. Ellerby, K. E. Eng, A. M. Engelbrecht, S. Engelender, J. Erenpreisa, R. Escalante, A. Esclatine, E. L. Eskelinen, L. Espert, V. Espina, H. Fan, J. Fan, Q. W. Fan, Z. Fan, S. Fang, Y. Fang, M. Fanto, A. Fanzani, T. Farkas, J. C. Farre, M. Faure, M. Fechheimer, C. G. Feng, J. Feng, Q. Feng, Y. Feng, L. Fesus, R. Feuer, M. E. Figueiredo-Pereira, G. M. Fimia, D. C. Fingar, S. Finkbeiner, T. Finkel, K. D. Finley, F. Fiorito, E. A. Fisher, P. B. Fisher, M. Flajolet, M. L. Florez-McClure, S. Florio, E. A. Fon, F. Fornai, F. Fortunato, R. Fotedar, D. H. Fowler, H. S. Fox, R. Franco, L. B. Frankel, M. Fransen, J. M. Fuentes, J. Fueyo, J. Fujii, K. Fujisaki, E. Fujita, M. Fukuda, R. H. Furukawa, M. Gaestel, P. Gailly, M. Gajewska, B. Galliot, V. Galy, S. Ganesh, B. Ganetzky, I. G. Ganley, F. B. Gao, G. F. Gao, J. Gao, L. Garcia, G. Garcia-Manero, M. Garcia-Marcos, M. Garmyn, A. L. Gartel, E. Gatti, M. Gautel, T. R. Gawriluk, M. E. Gegg, J. Geng, M. Germain, J. E. Gestwicki, D. A. Gewirtz, S. Ghavami, P. Ghosh, A. M. Giammarioli, A. N. Giatromanolaki, S. B. Gibson, R. W. Gilkerson, M. L. Ginger, E. Goncu, C. Gongora, C. D. Gonzalez, R. Gonzalez, C. Gonzalez-Estevez, R. A. Gonzalez-Polo, E. Gonzalez-Rey, N. V. Gorbunov, S. Gorski, S. Goruppi, R. A. Gottlieb, D. Gozuacik, G. E. Granato, G. D. Grant, K. N. Green, A. Gregorc, F. Gros, C. Grose, T. W. Grunt, P. Gual, J. L. Guan, K. L. Guan, S. M. Guichard, A. S. Gukovskaya, I. Gukovsky, J. Gunst, A. B. Gustafsson, A. J. Halayko, A. N. Hale, S. K. Halonen, M. Hamasaki, F. Han, T. Han, M. K. Hancock, M. Hansen, H. Harada, M. Harada, S. E. Hardt, J. W. Harper, A. L. Harris, J. Harris, S. D. Harris, M. J. Hebert, K. A. Heidenreich, M. H. Helfrich, G. V. Helgason, E. P. Henske, B. Herman, P. K. Herman, C. Hetz, S. Hilfiker, J. A. Hill, L. J. Hocking, P. Hofman, T. G. Hofmann, J. Hohfeld, T. L. Holyoake, M. H. Hong, D. A. Hood, G. S. Hotamisligil, E. J. Houwerzijl, M. Hoyer-Hansen, B. Hu, C. A. Hu, H. M. Hu, Y. Hua, C. Huang, J. Huang, S. Huang, W. P. Huang, T. B. Huber, W. K. Huh, T. H. Hung, T. R. Hupp, G. M. Hur, J. B. Hurley, S. N. Hussain, P. J. Hussey, J. J. Hwang, S. Hwang, A. Ichihara, S. Ilkhanizadeh, K. Inoki, T. Into, V. Iovane, J. L. Iovanna, N. Y. Ip, Y. Isaka, H. Ishida, C. Isidoro, K. Isobe, A. Iwasaki, M. Izquierdo, Y. Izumi, P. M. Jaakkola, M. Jaattela, G. R. Jackson, W. T. Jackson, B. Janji, M. Jendrach, J. H. Jeon, E. B. Jeung, H. Jiang, J. X. Jiang, M. Jiang, Q. Jiang, X. Jiang, A. Jimenez, M. Jin, S. Jin, C. O. Joe, T. Johansen, D. E. Johnson, G. V. Johnson, N. L. Jones, B. Joseph, S. K. Joseph, A. M. Joubert, G. Juhasz, L. Juillerat-Jeanneret, C. H. Jung, Y. K. Jung, K. Kaarniranta, A. Kaasik, T. Kabuta, M. Kadowaki, K. Kagedal, Y. Kamada, V. O. Kaminskyy, H. H. Kampinga, H. Kanamori, C. Kang, K. B. Kang, K. I. Kang, R. Kang, Y. A. Kang, T. Kanki, T. D. Kanneganti, H. Kanno, A. G. Kanthasamy, A. Kanthasamy, V. Karantza, G. P. Kaushal, S. Kaushik, Y. Kawazoe, P.
249

Y. Ke, J. H. Kehrl, A. Kelekar, C. Kerkhoff, D. H. Kessel, H. Khalil, J. A. Kiel, A. A. Kiger, A. Kihara, D. R. Kim, D. H. Kim, E. K. Kim, H. R. Kim, J. S. Kim, J. H. Kim, J. C. Kim, J. K. Kim, P. K. Kim, S. W. Kim, Y. S. Kim, Y. Kim, A. Kimchi, A. C. Kimmelman, J. S. King, T. J. Kinsella, V. Kirkin, L. A. Kirshenbaum, K. Kitamoto, K. Kitazato, L. Klein, W. T. Klimecki, J. Klucken, E. Knecht, B. C. Ko, J. C. Koch, H. Koga, J. Y. Koh, Y. H. Koh, M. Koike, M. Komatsu, E. Kominami, H. J. Kong, W. J. Kong, V. I. Korolchuk, Y. Kotake, M. I. Koukourakis, J. B. Kouri Flores, A. L. Kovacs, C. Kraft, D. Krainc, H. Kramer, C. Kretz-Remy, A. M. Krichevsky, G. Kroemer, R. Kruger, O. Krut, N. T. Ktistakis, C. Y. Kuan, R. Kucharczyk, A. Kumar, R. Kumar, S. Kumar, M. Kundu, H. J. Kung, T. Kurz, H. J. Kwon, A. R. La Spada, F. Lafont, T. Lamark, J. Landry, J. D. Lane, P. Lapaquette, J. F. Laporte, L. Laszlo, S. Lavandero, J. N. Lavoie, R. Layfield, P. A. Lazo, W. Le, L. Le Cam, D. J. Ledbetter, A. J. Lee, B. W. Lee, G. M. Lee, J. Lee, J. H. Lee, M. Lee, M. S. Lee, S. H. Lee, C. Leeuwenburgh, P. Legembre, R. Legouis, M. Lehmann, H. Y. Lei, Q. Y. Lei, D. A. Leib, J. Leiro, J. J. Lemasters, A. Lemoine, M. S. Lesniak, D. Lev, V. V. Levenson, B. Levine, E. Levy, F. Li, J. L. Li, L. Li, S. Li, W. Li, X. J. Li, Y. B. Li, Y. P. Li, C. Liang, Q. Liang, Y. F. Liao, P. P. Liberski, A. Lieberman, H. J. Lim, K. L. Lim, K. Lim, C. F. Lin, F. C. Lin, J. Lin, J. D. Lin, K. Lin, W. W. Lin, W. C. Lin, Y. L. Lin, R. Linden, P. Lingor, J. Lippincott-Schwartz, M. P. Lisanti, P. B. Liton, B. Liu, C. F. Liu, K. Liu, L. Liu, Q. A. Liu, W. Liu, Y. C. Liu, Y. Liu, R. A. Lockshin, C. N. Lok, S. Lonial, B. Loos, G. Lopez-Berestein, C. Lopez-Otin, L. Lossi, M. T. Lotze, P. Low, B. Lu, Z. Lu, F. Luciano, N. W. Lukacs, A. H. Lund, M. A. Lynch-Day, Y. Ma, F. Macian, J. P. MacKeigan, K. F. Macleod, F. Madeo, L. Maiuri, M. C. Maiuri, D. Malagoli, M. C. Malicdan, W. Malorni, N. Man, E. M. Mandelkow, S. Manon, I. Manov, K. Mao, X. Mao, Z. Mao, P. Marambaud, D. Marazziti, Y. L. Marcel, K. Marchbank, P. Marchetti, S. J. Marciniak, M. Marcondes, M. Mardi, G. Marfe, G. Marino, M. Markaki, M. R. Marten, S. J. Martin, C. Martinand-Mari, W. Martinet, M. Martinez-Vicente, M. Masini, P. Matarrese, S. Matsuo, R. Matteoni, A. Mayer, N. M. Mazure, D. J. McConkey, M. J. McConnell, C. McDermott, C. McDonald, G. M. McInerney, S. L. McKenna, B. McLaughlin, P. J. McLean, C. R. McMaster, G. A. McQuibban, A. J. Meijer, M. H. Meisler, A. Melendez, T. J. Melia, G. Melino, M. A. Mena, J. A. Menendez, R. F. Menna-Barreto, M. B. Menon, F. M. Menzies, C. A. Mercer, A. Merighi, D. E. Merry, S. Meschini, C. G. Meyer, T. F. Meyer, C. Y. Miao, J. Y. Miao, P. A. Michels, C. Michiels, D. Mijaljica, A. Milojkovic, S. Minucci, C. Miracco, C. K. Miranti, I. Mitroulis, K. Miyazawa, N. Mizushima, B. Mograbi, S. Mohseni, X. Molero, B. Mollereau, F. Mollinedo, T. Momoi, I. Monastyrska, M. M. Monick, M. J. Monteiro, M. N. Moore, R. Mora, K. Moreau, P. I. Moreira, Y. Moriyasu, J. Moscat, S. Mostowy, J. C. Mottram, T. Motyl, C. E. Moussa, S. Muller, K. Munger, C. Munz, L. O. Murphy, M. E. Murphy, A. Musaro, I. Mysorekar, E. Nagata, K. Nagata, A. Nahimana, U. Nair, T. Nakagawa, K. Nakahira, H. Nakano, H. Nakatogawa, M. Nanjundan, N. I. Naqvi, D. P. Narendra, M. Narita, M. Navarro, S. T. Nawrocki, T. Y. Nazarko, A. Nemchenko, M. G. Netea, T. P. Neufeld, P. A. Ney, I. P. Nezis, H. P. Nguyen, D. Nie, I. Nishino, C. Nislow, R. A. Nixon, T. Noda, A. A. Noegel, A. Nogalska, S. Noguchi, L. Notterpek, I. Novak, T. Nozaki, N. Nukina, T. Nurnberger, B. Nyfeler, K. Obara, T. D. Oberley, S. Oddo, M. Ogawa, T. Ohashi, K. Okamoto, N. L. Oleinick, F. J. Oliver, L. J. Olsen, S. Olsson, O. Opota, T. F. Osborne, G. K. Ostrander, K. Otsu, J. H. Ou, M. Ouimet, M. Overholtzer, B. Ozpolat, P. Paganetti, U. Pagnini, N. Pallet, G. E. Palmer, C. Palumbo, T. Pan, T. Panaretakis, U. B. Pandey, Z. Papackova, I. Papassideri, I. Paris, J. Park, O. K. Park, J. B. Parys, K. R. Parzych, S. Patschan, C. Patterson, S. Pattingre, J. M. Pawelek, J. Peng, D. H. Perlmutter, I. Perrotta, G. Perry, S. Pervaiz, M. Peter, G. J. Peters, M. Petersen, G. Petrovski, J. M. Phang, M. Piacentini, P. Pierre, V. Pierrefite-Carle, G. Pierron, R. Pinkas-Kramarski, A. Piras, N. Piri, L. C. Platanias, S. Poggeler, M. Poirot, A. Poletti, C. Pous, M. Pozuelo-Rubio, M.
250
Praetorius-Ibba, A. Prasad, M. Prescott, M. Priault, N. Produit-Zengaffinen, A. Progulske-Fox, T. Proikas-Cezanne, S. Przedborski, K. Przyklenk, R. Puertollano, J. Puyal, S. B. Qian, L. Qin, Z. H. Qin, S. E. Quaggin, N. Raben, H. Rabinowich, S. W. Rabkin, I. Rahman, A. Rami, G. Ramm, G. Randall, F. Randow, V. A. Rao, J. C. Rathmell, B. Ravikumar, S. K. Ray, B. H. Reed, J. C. Reed, F. Reggiori, A. Regnier-Vigouroux, A. S. Reichert, J. J. Reiners, Jr., R. J. Reiter, J. Ren, J. L. Revuelta, C. J. Rhodes, K. Ritis, E. Rizzo, J. Robbins, M. Roberge, H. Roca, M. C. Roccheri, S. Rocchi, H. P. Rodemann, S. Rodriguez de Cordoba, B. Rohrer, I. B. Roninson, K. Rosen, M. M. Rost-Roszkowska, M. Rouis, K. M. Rouschop, F. Rovetta, B. P. Rubin, D. C. Rubinsztein, K. Ruckdeschel, E. B. Rucker, 3rd, A. Rudich, E. Rudolf, N. Ruiz-Opazo, R. Russo, T. E. Rusten, K. M. Ryan, S. W. Ryter, D. M. Sabatini, J. Sadoshima, T. Saha, T. Saitoh, H. Sakagami, Y. Sakai, G. H. Salekdeh, P. Salomoni, P. M. Salvaterra, G. Salvesen, R. Salvioli, A. M. Sanchez, J. A. Sanchez-Alcazar, R. Sanchez-Prieto, M. Sandri, U. Sankar, P. Sansanwal, L. Santambrogio, S. Saran, S. Sarkar, M. Sarwal, C. Sasakawa, A. Sasnauskiene, M. Sass, K. Sato, M. Sato, A. H. Schapira, M. Scharl, H. M. Schatzl, W. Scheper, S. Schiaffino, C. Schneider, M. E. Schneider, R. Schneider-Stock, P. V. Schoenlein, D. F. Schorderet, C. Schuller, G. K. Schwartz, L. Scorrano, L. Sealy, P. O. Seglen, J. Segura-Aguilar, I. Seiliez, O. Seleverstov, C. Sell, J. B. Seo, D. Separovic, V. Setaluri, T. Setoguchi, C. Settembre, J. J. Shacka, M. Shanmugam, I. M. Shapiro, E. Shaulian, R. J. Shaw, J. H. Shelhamer, H. M. Shen, W. C. Shen, Z. H. Sheng, Y. Shi, K. Shibuya, Y. Shidoji, J. J. Shieh, C. M. Shih, Y. Shimada, S. Shimizu, T. Shintani, O. S. Shirihai, G. C. Shore, A. A. Sibirny, S. B. Sidhu, B. Sikorska, E. C. Silva-Zacarin, A. Simmons, A. K. Simon, H. U. Simon, C. Simone, A. Simonsen, D. A. Sinclair, R. Singh, D. Sinha, F. A. Sinicrope, A. Sirko, P. M. Siu, E. Sivridis, V. Skop, V. P. Skulachev, R. S. Slack, S. S. Smaili, D. R. Smith, M. S. Soengas, T. Soldati, X. Song, A. K. Sood, T. W. Soong, F. Sotgia, S. A. Spector, C. D. Spies, W. Springer, S. M. Srinivasula, L. Stefanis, J. S. Steffan, R. Stendel, H. Stenmark, A. Stephanou, S. T. Stern, C. Sternberg, B. Stork, P. Stralfors, C. S. Subauste, X. Sui, D. Sulzer, J. Sun, S. Y. Sun, Z. J. Sun, J. J. Sung, K. Suzuki, T. Suzuki, M. S. Swanson, C. Swanton, S. T. Sweeney, L. K. Sy, G. Szabadkai, I. Tabas, H. Taegtmeyer, M. Tafani, K. Takacs-Vellai, Y. Takano, K. Takegawa, G. Takemura, F. Takeshita, N. J. Talbot, K. S. Tan, K. Tanaka, D. Tang, I. Tanida, B. A. Tannous, N. Tavernarakis, G. S. Taylor, G. A. Taylor, J. P. Taylor, L. S. Terada, A. Terman, G. Tettamanti, K. Thevissen, C. B. Thompson, A. Thorburn, M. Thumm, F. Tian, Y. Tian, G. Tocchini-Valentini, A. M. Tolkovsky, Y. Tomino, L. Tonges, S. A. Tooze, C. Tournier, J. Tower, R. Towns, V. Trajkovic, L. H. Travassos, T. F. Tsai, M. P. Tschan, T. Tsubata, A. Tsung, B. Turk, L. S. Turner, S. C. Tyagi, Y. Uchiyama, T. Ueno, M. Umekawa, R. Umemiya-Shirafuji, V. K. Unni, M. I. Vaccaro, E. M. Valente, G. Van den Berghe, I. J. van der Klei, W. van Doorn, L. F. van Dyk, M. van Egmond, L. A. van Grunsven, P. Vandenabeele, W. P. Vandenberghe, I. Vanhorebeek, E. C. Vaquero, G. Velasco, T. Vellai, J. M. Vicencio, R. D. Vierstra, M. Vila, C. Vindis, G. Viola, M. T. Viscomi, O. V. Voitsekhovskaja, C. von Haefen, M. Votruba, K. Wada, R. Wade-Martins, C. L. Walker, C. M. Walsh, J. Walter, X. B. Wan, A. Wang, C. Wang, D. Wang, F. Wang, G. Wang, H. Wang, H. G. Wang, H. D. Wang, J. Wang, K. Wang, M. Wang, R. C. Wang, X. Wang, Y. J. Wang, Y. Wang, Z. Wang, Z. C. Wang, D. G. Wansink, D. M. Ward, H. Watada, S. L. Waters, P. Webster, L. Wei, C. C. Weihl, W. A. Weiss, S. M. Welford, L. P. Wen, C. A. Whitehouse, J. L. Whitton, A. J. Whitworth, T. Wileman, J. W. Wiley, S. Wilkinson, D. Willbold, R. L. Williams, P. R. Williamson, B. G. Wouters, C. Wu, D. C. Wu, W. K. Wu, A. Wyttenbach, R. J. Xavier, Z. Xi, P. Xia, G. Xiao, Z. Xie, D. Z. Xu, J. Xu, L. Xu, X. Xu, A. Yamamoto, S. Yamashina, M. Yamashita, X. Yan, M. Yanagida, D. S. Yang, E. Yang, J. M. Yang, S. Y. Yang, W. Yang, W. Y. Yang, Z. Yang, M. C. Yao, T. P. Yao, B. Yeganeh, W. L. Yen, J. J. Yin, X. M. Yin, O. J. Yoo, G. Yoon, S. Y. Yoon, T. Yorimitsu, Y.
251

Yoshikawa, T. Yoshimori, K. Yoshimoto, H. J. You, R. J. Youle, A. Younes, L. Yu, S. W. Yu, W. H. Yu, Z. M. Yuan, Z. Yue, C. H. Yun, M. Yuzaki, O. Zabirnyk, E. Silva-Zacarin, D. Zacks, E. Zacksenhaus, N. Zaffaroni, Z. Zakeri, H. J. Zeh, 3rd, S. O. Zeitlin, H. Zhang, H. L. Zhang, J. Zhang, J. P. Zhang, L. Zhang, M. Y. Zhang, X. D. Zhang, M. Zhao, Y. F. Zhao, Y. Zhao, Z. J. Zhao, X. Zheng, B. Zhivotovsky, Q. Zhong, C. Z. Zhou, C. Zhu, W. G. Zhu, X. F. Zhu, X. Zhu, Y. Zhu, T. Zoladek, W. X. Zong, A. Zorzano, J. Zschocke and B. Zuckerbraun (2012). "Guidelines for the Use and Interpretation of Assays for Monitoring Autophagy." Autophagy 8(4): 445-544.
Klionsky, D. J., F. C. Abdalla, H. Abeliovich and e. al. (2012). "Guidelines for the Use and Interpretation of Assays for Monitoring Autophagy." Autophagy 8(4): 445-544.
Knott, A. B. and E. Bossy-Wetzel (2008). "Impairing the Mitochondrial Fission and Fusion Balance: A New Mechanism of Neurodegeneration." Ann N Y Acad Sci 1147: 283-292.
Kochl, R., X. W. Hu, E. Y. Chan and S. A. Tooze (2006). "Microtubules Facilitate Autophagosome Formation and Fusion of Autophagosomes with Endosomes." Traffic 7(2): 129-145.
Koopman, W. J., S. Verkaart, H. J. Visch, F. H. van der Westhuizen, M. P. Murphy, L. W. van den Heuvel, J. A. Smeitink and P. H. Willems (2005). "Inhibition of Complex I of the Electron Transport Chain Causes O2-. -Mediated Mitochondrial Outgrowth." American journal of physiology. Cell physiology 288(6): C1440-1450.
Koopman, W. J., H. J. Visch, S. Verkaart, L. W. van den Heuvel, J. A. Smeitink and P. H. Willems (2005). "Mitochondrial Network Complexity and Pathological Decrease in Complex I Activity Are Tightly Correlated in Isolated Human Complex I Deficiency." Am J Physiol Cell Physiol 289(4): C881-890.
Kornmann, B., E. Currie, S. R. Collins, M. Schuldiner, J. Nunnari, J. S. Weissman and P. Walter (2009). "An Er-Mitochondria Tethering Complex Revealed by a Synthetic Biology Screen." Science 325(5939): 477-481.
Krecic, A. M. and M. S. Swanson (1999). "Hnrnp Complexes: Composition, Structure, and Function." Current Opinion in Cell Biology 11(3): 363-371.
Krishnan, K. J., L. C. Greaves, A. K. Reeve and D. M. Turnbull (2007). "Mitochondrial DNA Mutations and Aging." Annals of the New York Academy of Sciences 1100: 227-240.
Kruman, II, W. A. Pedersen, J. E. Springer and M. P. Mattson (1999). "Als-Linked Cu/Zn-Sod Mutation Increases Vulnerability of Motor Neurons to Excitotoxicity by a Mechanism Involving Increased Oxidative Stress and Perturbed Calcium Homeostasis." Exp Neurol 160(1): 28-39.
Kujoth, G. C., A. Hiona, T. D. Pugh, S. Someya, K. Panzer, S. E. Wohlgemuth, T. Hofer, A. Y. Seo, R. Sullivan, W. A. Jobling, J. D. Morrow, H. Van Remmen, J. M. Sedivy, T. Yamasoba, M. Tanokura, R. Weindruch, C. Leeuwenburgh and T. A. Prolla (2005). "Mitochondrial DNA Mutations, Oxidative Stress, and Apoptosis in Mammalian Aging." Science 309(5733): 481-484.
252

Kuma, A., M. Hatano, M. Matsui, A. Yamamoto, H. Nakaya, T. Yoshimori, Y. Ohsumi, T. Tokuhisa and N. Mizushima (2004). "The Role of Autophagy During the Early Neonatal Starvation Period." Nature 432(7020): 1032-1036.
Kwiatkowski, T. J., Jr., D. A. Bosco, A. L. Leclerc, E. Tamrazian, C. R. Vanderburg, C. Russ, A. Davis, J. Gilchrist, E. J. Kasarskis, T. Munsat, P. Valdmanis, G. A. Rouleau, B. A. Hosler, P. Cortelli, P. J. de Jong, Y. Yoshinaga, J. L. Haines, M. A. Pericak-Vance, J. Yan, N. Ticozzi, T. Siddique, D. McKenna-Yasek, P. C. Sapp, H. R. Horvitz, J. E. Landers and R. H. Brown, Jr. (2009). "Mutations in the Fus/Tls Gene on Chromosome 16 Cause Familial Amyotrophic Lateral Sclerosis." Science 323(5918): 1205-1208.
Laboratory, T. J. (2006). "The Importance of Genetic Background in Mouse-Based Biomedical Research." JAX NOTES.
Lacroix, B., J. van Dijk, N. D. Gold, J. Guizetti, G. Aldrian-Herrada, K. Rogowski, D. W. Gerlich and C. Janke (2010). "Tubulin Polyglutamylation Stimulates Spastin-Mediated Microtubule Severing." The Journal of Cell Biology 189(6): 945-954.
Lagier-Tourenne, C., M. Polymenidou and D. W. Cleveland (2010). "Tdp-43 and Fus/Tls: Emerging Roles in Rna Processing and Neurodegeneration." Human Molecular Genetics 19(R1): R46-64.
Lee, J. A. (2012). "Neuronal Autophagy: A Housekeeper or a Fighter in Neuronal Cell Survival?" Experimental Neurobiology 21(1): 1-8.
Lee, J. H., W. H. Yu, A. Kumar, S. Lee, P. S. Mohan, C. M. Peterhoff, D. M. Wolfe, M. Martinez-Vicente, A. C. Massey, G. Sovak, Y. Uchiyama, D. Westaway, A. M. Cuervo and R. A. Nixon (2010). "Lysosomal Proteolysis and Autophagy Require Presenilin 1 and Are Disrupted by Alzheimer-Related Ps1 Mutations." Cell 141(7): 1146-1158.
Lee, J. Y., H. Koga, Y. Kawaguchi, W. Tang, E. Wong, Y. S. Gao, U. B. Pandey, S. Kaushik, E. Tresse, J. Lu, J. P. Taylor, A. M. Cuervo and T. P. Yao (2010). "Hdac6 Controls Autophagosome Maturation Essential for Ubiquitin-Selective Quality-Control Autophagy." The EMBO Journal 29(5): 969-980.
Lee, J. Y., Y. Nagano, J. P. Taylor, K. L. Lim and T. P. Yao (2010). "Disease-Causing Mutations in Parkin Impair Mitochondrial Ubiquitination, Aggregation, and Hdac6-Dependent Mitophagy." The Journal of Cell Biology 189(4): 671-679.
Leung, A. W. and A. P. Halestrap (2008). "Recent Progress in Elucidating the Molecular Mechanism of the Mitochondrial Permeability Transition Pore." Biochimica et Biophysica Acta 1777(7-8): 946-952.
Li, L., X. Zhang and W. Le (2008). "Altered Macroautophagy in the Spinal Cord of Sod1 Mutant Mice." Autophagy 4(3): 290-293.
Li, Q., A. Lau, T. J. Morris, L. Guo, C. B. Fordyce and E. F. Stanley (2004). "A Syntaxin 1, Galpha(O), and N-Type Calcium Channel Complex at a Presynaptic Nerve Terminal: Analysis by Quantitative Immunocolocalization." The Journal of Neuroscience : The Official Journal of the Society for Neuroscience 24(16): 4070-4081.
253
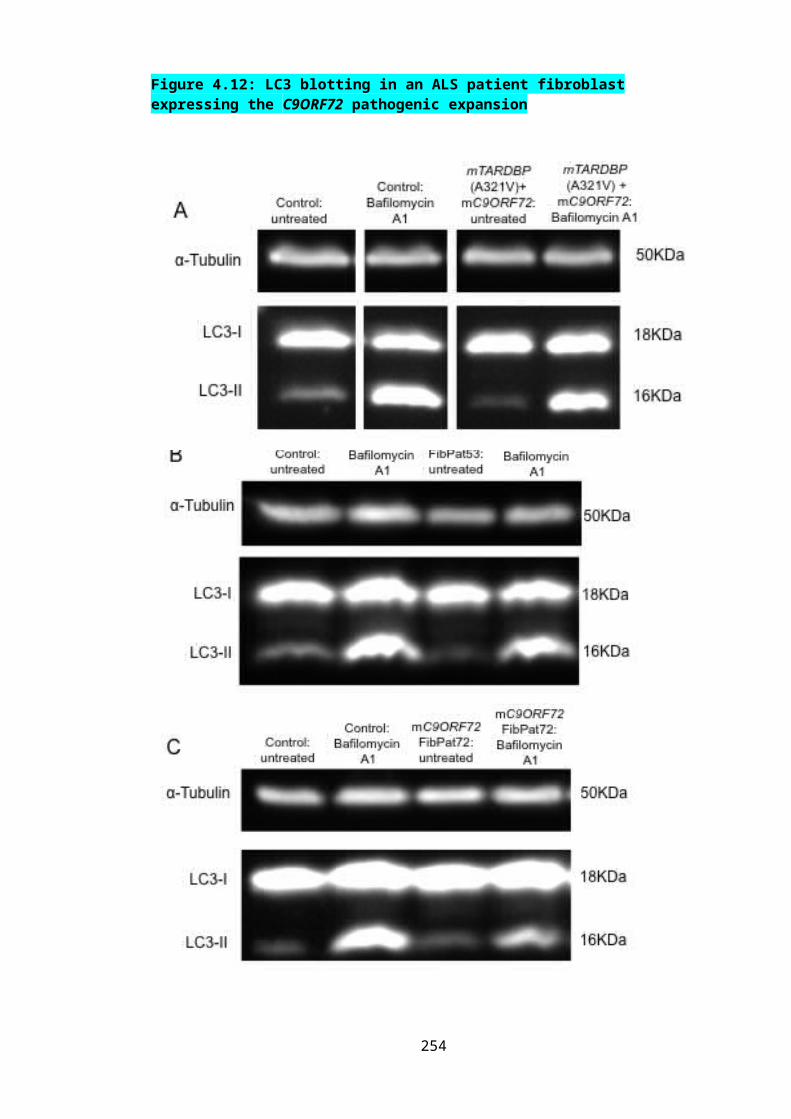
Li, Y., P. Ray, E. J. Rao, C. Shi, W. Guo, X. Chen, E. A. Woodruff, 3rd, K. Fushimi and J. Y. Wu (2010). "A Drosophila Model for Tdp-43 Proteinopathy." Proceedings of the National Academy of Sciences of the United States of America 107(7): 3169-3174.
Liang, C. C., C. Wang, X. Peng, B. Gan and J. L. Guan (2010). "Neural-Specific Deletion of Fip200 Leads to Cerebellar Degeneration Caused by Increased Neuronal Death and Axon Degeneration." The Journal of Biological Chemistry 285(5): 3499-3509.
Lin, C. L., L. A. Bristol, L. Jin, M. Dykes-Hoberg, T. Crawford, L. Clawson and J. D. Rothstein (1998). "Aberrant Rna Processing in a Neurodegenerative Disease: The Cause for Absent Eaat2, a Glutamate Transporter, in Amyotrophic Lateral Sclerosis." Neuron 20(3): 589-602.
Lin, M. T. and M. F. Beal (2006). "Mitochondrial Dysfunction and Oxidative Stress in Neurodegenerative Diseases." Nature 443(7113): 787-795.
Liscic, R. M., L. T. Grinberg, J. Zidar, M. A. Gitcho and N. J. Cairns (2008). "Als and Ftld: Two Faces of Tdp-43 Proteinopathy." European Journal of Neurology : The Official Journal of the European Federation of Neurological Societies 15(8): 772-780.
Liscic, R. M., L. T. Grinberg, J. Zidar, M. A. Gitcho and N. J. Cairns (2008). "Als and Ftld: Two Faces of Tdp-43 Proteinopathy." Eur J Neurol 15(8): 772-780.
Liu, J., C. Lillo, P. A. Jonsson, C. Vande Velde, C. M. Ward, T. M. Miller, J. R. Subramaniam, J. D. Rothstein, S. Marklund, P. M. Andersen, T. Brannstrom, O. Gredal, P. C. Wong, D. S. Williams and D. W. Cleveland (2004). "Toxicity of Familial Als-Linked Sod1 Mutants from Selective Recruitment to Spinal Mitochondria." Neuron 43(1): 5-17.
Liu, X., C. N. Kim, J. Yang, R. Jemmerson and X. Wang (1996). "Induction of Apoptotic Program in Cell-Free Extracts: Requirement for Datp and Cytochrome C." Cell 86(1): 147-157.
Liu, Y., S. Shi, Z. Gu, Y. Du, M. Liu, S. Yan, J. Gao, J. Li, Y. Shao, W. Zhong, X. Chen and C. Li (2012). "Impaired Autophagic Function in Rat Islets with Aging." Age.
Livak, K. J. and T. D. Schmittgen (2001). "Analysis of Relative Gene Expression Data Using Real-Time Quantitative Pcr and the 2(-Delta Delta C(T)) Method." Methods 25(4): 402-408.
Loiseau, D., A. Chevrollier, C. Verny, V. Guillet, N. Gueguen, M. A. Pou de Crescenzo, M. Ferre, M. C. Malinge, A. Guichet, G. Nicolas, P. Amati-Bonneau, Y. Malthiery, D. Bonneau and P. Reynier (2007). "Mitochondrial Coupling Defect in Charcot-Marie-Tooth Type 2a Disease." Annals of Neurology 61(4): 315-323.
Lomen-Hoerth, C., T. Anderson and B. Miller (2002). "The Overlap of Amyotrophic Lateral Sclerosis and Frontotemporal Dementia." Neurology 59(7): 1077-1079.
Luigetti, M., D. Quaranta, A. Conte, C. Piccininni, S. Lattante, A. Romano, G. Silvestri, M. Zollino and M. Sabatelli (2013). "Frontotemporal Dementia, Parkinsonism and Lower Motor Neuron Involvement in a Patient with C9orf72 Expansion." Amyotrophic Lateral Sclerosis and Frontotemporal Degeneration 14(1): 66-69.
254
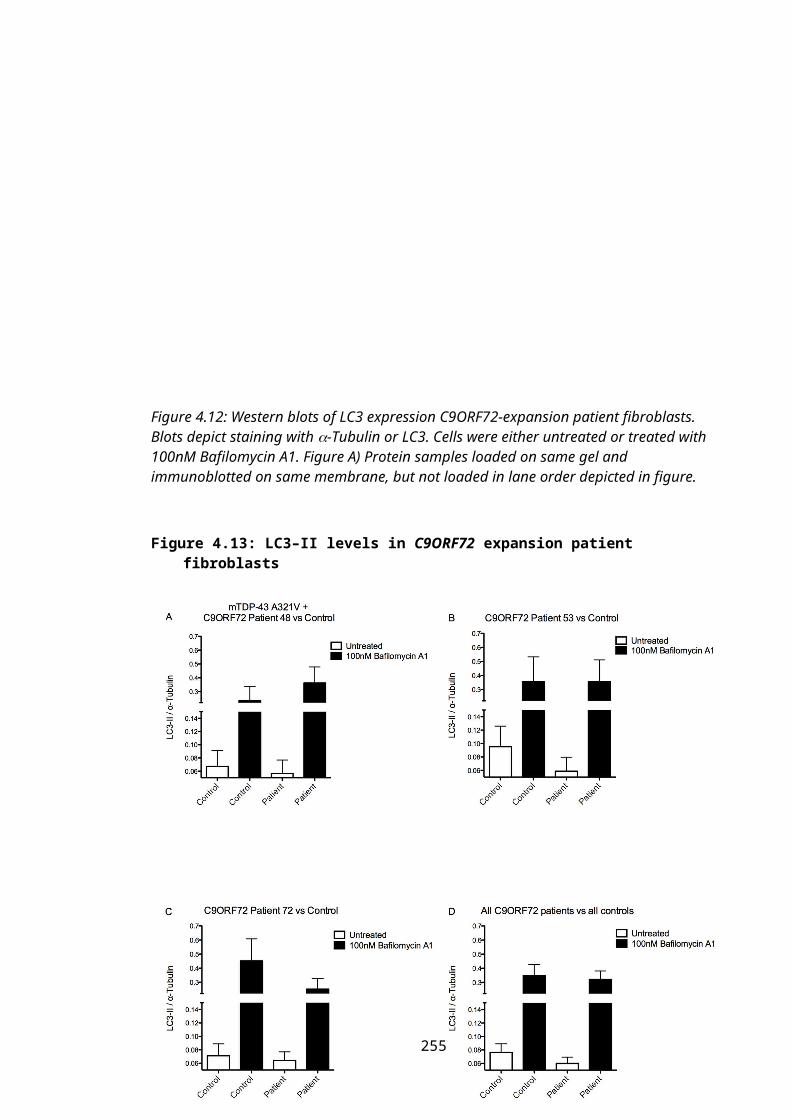
Lumb, J. H., J. W. Connell, R. Allison and E. Reid (2012). "The Aaa Atpase Spastin Links Microtubule Severing to Membrane Modelling." Biochimica et Biophysica Acta 1823(1): 192-197.
Luo, X., S. Pitkanen, S. Kassovska-Bratinova, B. H. Robinson and D. C. Lehotay (1997). "Excessive Formation of Hydroxyl Radicals and Aldehydic Lipid Peroxidation Products in Cultured Skin Fibroblasts from Patients with Complex I Deficiency." J Clin Invest 99(12): 2877-2882.
Mackenzie, I. R., E. H. Bigio, P. G. Ince, F. Geser, M. Neumann, N. J. Cairns, L. K. Kwong, M. S. Forman, J. Ravits, H. Stewart, A. Eisen, L. McClusky, H. A. Kretzschmar, C. M. Monoranu, J. R. Highley, J. Kirby, T. Siddique, P. J. Shaw, V. M. Lee and J. Q. Trojanowski (2007). "Pathological Tdp-43 Distinguishes Sporadic Amyotrophic Lateral Sclerosis from Amyotrophic Lateral Sclerosis with Sod1 Mutations." Annals of Neurology 61(5): 427-434.
Maekawa, S., S. Al-Sarraj, M. Kibble, S. Landau, J. Parnavelas, D. Cotter, I. Everall and P. N. Leigh (2004). "Cortical Selective Vulnerability in Motor Neuron Disease: A Morphometric Study." Brain : A Journal of Neurology 127(Pt 6): 1237-1251.
Magrane, J., I. Hervias, M. S. Henning, M. Damiano, H. Kawamata and G. Manfredi (2009). "Mutant Sod1 in Neuronal Mitochondria Causes Toxicity and Mitochondrial Dynamics Abnormalities." Human Molecular Genetics 18(23): 4552-4564.
Magrane, J. and G. Manfredi (2009). "Mitochondrial Function, Morphology, and Axonal Transport in Amyotrophic Lateral Sclerosis." Antioxidants & Redox Signaling 11(7): 1615-1626.
Mai, S., B. Muster, J. Bereiter-Hahn and M. Jendrach (2012). "Autophagy Proteins Lc3b, Atg5 and Atg12 Participate in Quality Control after Mitochondrial Damage and Influence Lifespan." Autophagy 8(1): 47-62.
Majounie, E., A. E. Renton, K. Mok, E. G. Dopper, A. Waite, S. Rollinson, A. Chio, G. Restagno, N. Nicolaou, J. Simon-Sanchez, J. C. van Swieten, Y. Abramzon, J. O. Johnson, M. Sendtner, R. Pamphlett, R. W. Orrell, S. Mead, K. C. Sidle, H. Houlden, J. D. Rohrer, K. E. Morrison, H. Pall, K. Talbot, O. Ansorge, D. G. Hernandez, S. Arepalli, M. Sabatelli, G. Mora, M. Corbo, F. Giannini, A. Calvo, E. Englund, G. Borghero, G. L. Floris, A. M. Remes, H. Laaksovirta, L. McCluskey, J. Q. Trojanowski, V. M. Van Deerlin, G. D. Schellenberg, M. A. Nalls, V. E. Drory, C. S. Lu, T. H. Yeh, H. Ishiura, Y. Takahashi, S. Tsuji, I. Le Ber, A. Brice, C. Drepper, N. Williams, J. Kirby, P. Shaw, J. Hardy, P. J. Tienari, P. Heutink, H. R. Morris, S. Pickering-Brown and B. J. Traynor (2012). "Frequency of the C9orf72 Hexanucleotide Repeat Expansion in Patients with Amyotrophic Lateral Sclerosis and Frontotemporal Dementia: A Cross-Sectional Study." Lancet Neurology 11(4): 323-330.
Malka, F., O. Guillery, C. Cifuentes-Diaz, E. Guillou, P. Belenguer, A. Lombes and M. Rojo (2005). "Separate Fusion of Outer and Inner Mitochondrial Membranes." EMBO Rep 6(9): 853-859.
255
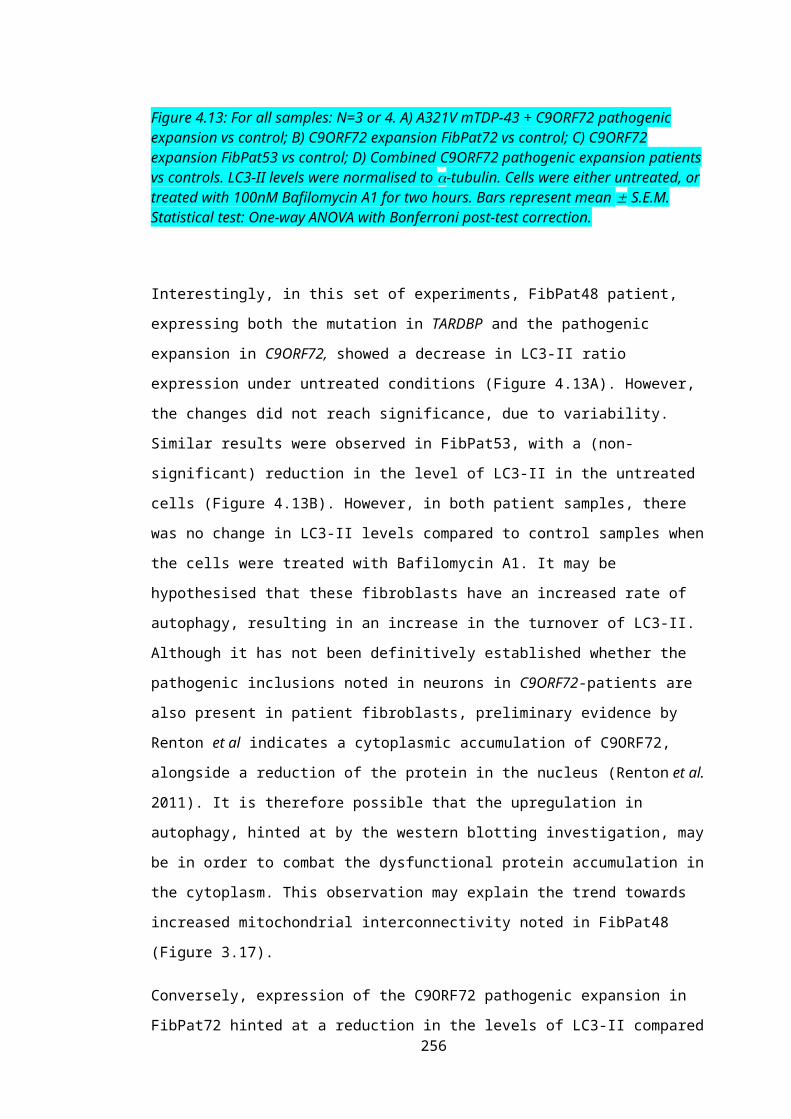
Malka, F., O. Guillery, C. Cifuentes-Diaz, E. Guillou, P. Belenguer, A. Lombes and M. Rojo (2005). "Separate Fusion of Outer and Inner Mitochondrial Membranes." EMBO Reports 6(9): 853-859.
Mammucari, C. and R. Rizzuto (2010). "Signaling Pathways in Mitochondrial Dysfunction and Aging." Mechanisms of Ageing and Development 131(7-8): 536-543.
Mancuso, G. and E. I. Rugarli (2008). "A Cryptic Promoter in the First Exon of the Spg4 Gene Directs the Synthesis of the 60-Kda Spastin Isoform." BMC Biology 6: 31.
Manfredi, G. and Z. Xu (2005). "Mitochondrial Dysfunction and Its Role in Motor Neuron Degeneration in Als." Mitochondrion 5(2): 77-87.
Mannan, A. U., P. Krawen, S. M. Sauter, J. Boehm, A. Chronowska, W. Paulus, J. Neesen and W. Engel (2006). "Zfyve27 (Spg33), a Novel Spastin-Binding Protein, Is Mutated in Hereditary Spastic Paraplegia." American Journal of Human Genetics 79(2): 351-357.
Martignoni, M., E. Riano and E. I. Rugarli (2008). "The Role of Zfyve27/Protrudin in Hereditary Spastic Paraplegia." American Journal of Human Genetics 83(1): 127-128; author reply 128-130.
Martin, E., C. Yanicostas, A. Rastetter, S. M. Naini, A. Maouedj, E. Kabashi, S. Rivaud-Pechoux, A. Brice, G. Stevanin and N. Soussi-Yanicostas (2012). "Spatacsin and Spastizin Act in the Same Pathway Required for Proper Spinal Motor Neuron Axon Outgrowth in Zebrafish." Neurobiology of Disease 48(3): 299-308.
Martin, L. J. (1999). "Neuronal Death in Amyotrophic Lateral Sclerosis Is Apoptosis: Possible Contribution of a Programmed Cell Death Mechanism." J Neuropathol Exp Neurol 58(5): 459-471.
Martin, L. J. (2010). "The Mitochondrial Permeability Transition Pore: A Molecular Target for Amyotrophic Lateral Sclerosis Therapy." Biochimica et Biophysica Acta 1802(1): 186-197.
Martin, L. J., B. Gertz, Y. Pan, A. C. Price, J. D. Molkentin and Q. Chang (2009). "The Mitochondrial Permeability Transition Pore in Motor Neurons: Involvement in the Pathobiology of Als Mice." Experimental Neurology 218(2): 333-346.
Martin, L. J., B. Gertz, Y. Pan, A. C. Price, J. D. Molkentin and Q. Chang (2009). "The Mitochondrial Permeability Transition Pore in Motor Neurons: Involvement in the Pathobiology of Als Mice." Exp Neurol.
Maruta, H., K. Greer and J. L. Rosenbaum (1986). "The Acetylation of Alpha-Tubulin and Its Relationship to the Assembly and Disassembly of Microtubules." The Journal of Cell Biology 103(2): 571-579.
Maruyama, H., H. Morino, H. Ito, Y. Izumi, H. Kato, Y. Watanabe, Y. Kinoshita, M. Kamada, H. Nodera, H. Suzuki, O. Komure, S. Matsuura, K. Kobatake, N. Morimoto, K. Abe, N. Suzuki, M. Aoki, A. Kawata, T. Hirai, T. Kato, K. Ogasawara, A. Hirano, T. Takumi, H. Kusaka, K. Hagiwara, R. Kaji and H. Kawakami (2010). "Mutations of Optineurin in Amyotrophic Lateral Sclerosis." Nature 465(7295): 223-226.
256

Matsuyama, A., T. Shimazu, Y. Sumida, A. Saito, Y. Yoshimatsu, D. Seigneurin-Berny, H. Osada, Y. Komatsu, N. Nishino, S. Khochbin, S. Horinouchi and M. Yoshida (2002). "In Vivo Destabilization of Dynamic Microtubules by Hdac6-Mediated Deacetylation." The EMBO Journal 21(24): 6820-6831.
Mattiazzi, M., M. D'Aurelio, C. D. Gajewski, K. Martushova, M. Kiaei, M. F. Beal and G. Manfredi (2002). "Mutated Human Sod1 Causes Dysfunction of Oxidative Phosphorylation in Mitochondria of Transgenic Mice." J Biol Chem 277(33): 29626-29633.
Maurer, I., S. Zierz and H. J. Moller (2000). "A Selective Defect of Cytochrome C Oxidase Is Present in Brain of Alzheimer Disease Patients." Neurobiology of Aging 21(3): 455-462.
McDermott, C. J., A. J. Grierson, J. D. Wood, M. Bingley, S. B. Wharton, K. M. Bushby and P. J. Shaw (2003). "Hereditary Spastic Paraparesis: Disrupted Intracellular Transport Associated with Spastin Mutation." Annals of Neurology 54(6): 748-759.
McNally, F. J. and R. D. Vale (1993). "Identification of Katanin, an Atpase That Severs and Disassembles Stable Microtubules." Cell 75(3): 419-429.
Mead, R. J., E. J. Bennett, A. J. Kennerley, P. Sharp, C. Sunyach, P. Kasher, J. Berwick, B. Pettmann, G. Battaglia, M. Azzouz, A. Grierson and P. J. Shaw (2011). "Optimised and Rapid Pre-Clinical Screening in the Sod1(G93a) Transgenic Mouse Model of Amyotrophic Lateral Sclerosis (Als)." PLoS One 6(8): e23244.
Meeusen, S., J. M. McCaffery and J. Nunnari (2004). "Mitochondrial Fusion Intermediates Revealed in Vitro." Science 305(5691): 1747-1752.
Mehrpour, M., A. Esclatine, I. Beau and P. Codogno (2010). "Overview of Macroautophagy Regulation in Mammalian Cells." Cell Research 20(7): 748-762.
Mendes, C. C., D. A. Gomes, M. Thompson, N. C. Souto, T. S. Goes, A. M. Goes, M. A. Rodrigues, M. V. Gomez, M. H. Nathanson and M. F. Leite (2005). "The Type Iii Inositol 1,4,5-Trisphosphate Receptor Preferentially Transmits Apoptotic Ca2+ Signals into Mitochondria." The Journal of Biological Chemistry 280(49): 40892-40900.
Menichella, D. M., D. A. Goodenough, E. Sirkowski, S. S. Scherer and D. L. Paul (2003). "Connexins Are Critical for Normal Myelination in the Cns." The Journal of Neuroscience : The Official Journal of the Society for Neuroscience 23(13): 5963-5973.
Menzies, F. M., M. R. Cookson, R. W. Taylor, D. M. Turnbull, Z. M. Chrzanowska-Lightowlers, L. Dong, D. A. Figlewicz and P. J. Shaw (2002). "Mitochondrial Dysfunction in a Cell Culture Model of Familial Amyotrophic Lateral Sclerosis." Brain 125(Pt 7): 1522-1533.
Migheli, A., C. Atzori, R. Piva, M. Tortarolo, M. Girelli, D. Schiffer and C. Bendotti (1999). "Lack of Apoptosis in Mice with Als." Nat Med 5(9): 966-967.
Migliore, L., I. Fontana, R. Colognato, F. Coppede, G. Siciliano and L. Murri (2005). "Searching for the Role and the Most Suitable Biomarkers of Oxidative Stress in
257
Alzheimer's Disease and in Other Neurodegenerative Diseases." Neurobiol Aging 26(5): 587-595.
Miller, K. E. and M. P. Sheetz (2004). "Axonal Mitochondrial Transport and Potential Are Correlated." Journal of Cell Science 117(Pt 13): 2791-2804.
Mills, J. C., V. M. Lee and R. N. Pittman (1998). "Activation of a Pp2a-Like Phosphatase and Dephosphorylation of Tau Protein Characterize Onset of the Execution Phase of Apoptosis." Journal of Cell Science 111 ( Pt 5): 625-636.
Mironov, S. L. (2009). "Complexity of Mitochondrial Dynamics in Neurons and Its Control by Adp Produced During Synaptic Activity." The International Journal of Biochemistry & Cell Biology 41(10): 2005-2014.
Misko, A., S. Jiang, I. Wegorzewska, J. Milbrandt and R. H. Baloh (2010). "Mitofusin 2 Is Necessary for Transport of Axonal Mitochondria and Interacts with the Miro/Milton Complex." The Journal of Neuroscience : The Official Journal of the Society for Neuroscience 30(12): 4232-4240.
Mizuno, N., S. Toba, M. Edamatsu, J. Watai-Nishii, N. Hirokawa, Y. Y. Toyoshima and M. Kikkawa (2004). "Dynein and Kinesin Share an Overlapping Microtubule-Binding Site." The EMBO Journal 23(13): 2459-2467.
Mizushima, N., A. Kuma, Y. Kobayashi, A. Yamamoto, M. Matsubae, T. Takao, T. Natsume, Y. Ohsumi and T. Yoshimori (2003). "Mouse Apg16l, a Novel Wd-Repeat Protein, Targets to the Autophagic Isolation Membrane with the Apg12-Apg5 Conjugate." Journal of Cell Science 116(Pt 9): 1679-1688.
Mizushima, N., T. Noda, T. Yoshimori, Y. Tanaka, T. Ishii, M. D. George, D. J. Klionsky, M. Ohsumi and Y. Ohsumi (1998). "A Protein Conjugation System Essential for Autophagy." Nature 395(6700): 395-398.
Montagutelli, X. (2000). "Effect of the Genetic Background on the Phenotype of Mouse Mutations." Journal of the American Society of Nephrology : JASN 11 Suppl 16: S101-105.
Montenegro, G., A. P. Rebelo, J. Connell, R. Allison, C. Babalini, M. D'Aloia, P. Montieri, R. Schule, H. Ishiura, J. Price, A. Strickland, M. A. Gonzalez, L. Baumbach-Reardon, T. Deconinck, J. Huang, G. Bernardi, J. M. Vance, M. T. Rogers, S. Tsuji, P. De Jonghe, M. A. Pericak-Vance, L. Schols, A. Orlacchio, E. Reid and S. Zuchner (2012). "Mutations in the Er-Shaping Protein Reticulon 2 Cause the Axon-Degenerative Disorder Hereditary Spastic Paraplegia Type 12." The Journal of Clinical Investigation 122(2): 538-544.
Morotz, G. M., K. J. De Vos, A. Vagnoni, S. Ackerley, C. E. Shaw and C. C. Miller (2012). "Amyotrophic Lateral Sclerosis-Associated Mutant Vapbp56s Perturbs Calcium Homeostasis to Disrupt Axonal Transport of Mitochondria." Human Molecular Genetics 21(9): 1979-1988.
Morre, D. J., W. D. Merritt and C. A. Lembi (1971). "Connections between Mitochondria and Endoplasmic Reticulum in Rat Liver and Onion Stem." Protoplasma 73(1): 43-49.
258
Mortiboys, H., K. J. Thomas, W. J. Koopman, S. Klaffke, P. Abou-Sleiman, S. Olpin, N. W. Wood, P. H. Willems, J. A. Smeitink, M. R. Cookson and O. Bandmann (2008). "Mitochondrial Function and Morphology Are Impaired in Parkin-Mutant Fibroblasts." Ann Neurol 64(5): 555-565.
Mortiboys, H., K. J. Thomas, W. J. Koopman, S. Klaffke, P. Abou-Sleiman, S. Olpin, N. W. Wood, P. H. Willems, J. A. Smeitink, M. R. Cookson and O. Bandmann (2008). "Mitochondrial Function and Morphology Are Impaired in Parkin-Mutant Fibroblasts." Annals of Neurology 64(5): 555-565.
Mozdy, A. D., J. M. McCaffery and J. M. Shaw (2000). "Dnm1p Gtpase-Mediated Mitochondrial Fission Is a Multi-Step Process Requiring the Novel Integral Membrane Component Fis1p." J Cell Biol 151(2): 367-380.
Mu, X., J. He, D. W. Anderson, J. Q. Trojanowski and J. E. Springer (1996). "Altered Expression of Bcl-2 and Bax Mrna in Amyotrophic Lateral Sclerosis Spinal Cord Motor Neurons." Annals of Neurology 40(3): 379-386.
Munoz, D. G., C. Greene, D. P. Perl and D. J. Selkoe (1988). "Accumulation of Phosphorylated Neurofilaments in Anterior Horn Motoneurons of Amyotrophic Lateral Sclerosis Patients." Journal of Neuropathology and Experimental Neurology 47(1): 9-18.
Murata, T., C. Ohtsuka and Y. Terayama (2008). "Increased Mitochondrial Oxidative Damage in Patients with Sporadic Amyotrophic Lateral Sclerosis." J Neurol Sci 267(1-2): 66-69.
Murayama, S., Y. Ookawa, H. Mori, I. Nakano, Y. Ihara, S. Kuzuhara and M. Tomonaga (1989). "Immunocytochemical and Ultrastructural Study of Lewy Body-Like Hyaline Inclusions in Familial Amyotrophic Lateral Sclerosis." Acta Neuropathologica 78(2): 143-152.
Murphy, M. P. (2009). "How Mitochondria Produce Reactive Oxygen Species." Biochem J 417(1): 1-13.
Narendra, D. P., S. M. Jin, A. Tanaka, D. F. Suen, C. A. Gautier, J. Shen, M. R. Cookson and R. J. Youle (2010). "Pink1 Is Selectively Stabilized on Impaired Mitochondria to Activate Parkin." PLoS Biology 8(1): e1000298.
Neumann, M., D. M. Sampathu, L. K. Kwong, A. C. Truax, M. C. Micsenyi, T. T. Chou, J. Bruce, T. Schuck, M. Grossman, C. M. Clark, L. F. McCluskey, B. L. Miller, E. Masliah, I. R. Mackenzie, H. Feldman, W. Feiden, H. A. Kretzschmar, J. Q. Trojanowski and V. M. Lee (2006). "Ubiquitinated Tdp-43 in Frontotemporal Lobar Degeneration and Amyotrophic Lateral Sclerosis." Science 314(5796): 130-133.
Nicholls, D. G. (2002). "Mitochondrial Function and Dysfunction in the Cell: Its Relevance to Aging and Aging-Related Disease." The International Journal of Biochemistry & Cell Biology 34(11): 1372-1381.
Nishimura, A. L., M. Mitne-Neto, H. C. Silva, A. Richieri-Costa, S. Middleton, D. Cascio, F. Kok, J. R. Oliveira, T. Gillingwater, J. Webb, P. Skehel and M. Zatz (2004). "A Mutation in the Vesicle-Trafficking Protein Vapb Causes Late-Onset Spinal
259
Muscular Atrophy and Amyotrophic Lateral Sclerosis." Am J Hum Genet 75(5): 822-831.
Nishimura, A. L., M. Mitne-Neto, H. C. Silva, A. Richieri-Costa, S. Middleton, D. Cascio, F. Kok, J. R. Oliveira, T. Gillingwater, J. Webb, P. Skehel and M. Zatz (2004). "A Mutation in the Vesicle-Trafficking Protein Vapb Causes Late-Onset Spinal Muscular Atrophy and Amyotrophic Lateral Sclerosis." American Journal of Human Genetics 75(5): 822-831.
Nonaka, T., F. Kametani, T. Arai, H. Akiyama and M. Hasegawa (2009). "Truncation and Pathogenic Mutations Facilitate the Formation of Intracellular Aggregates of Tdp-43." Human Molecular Genetics 18(18): 3353-3364.
Ogura, T. and A. J. Wilkinson (2001). "Aaa+ Superfamily Atpases: Common Structure--Diverse Function." Genes to Cells : Devoted to Molecular & Cellular Mechanisms 6(7): 575-597.
Okada, Y., H. Yamazaki, Y. Sekine-Aizawa and N. Hirokawa (1995). "The Neuron-Specific Kinesin Superfamily Protein Kif1a Is a Unique Monomeric Motor for Anterograde Axonal Transport of Synaptic Vesicle Precursors." Cell 81(5): 769-780.
Olichon, A., L. Baricault, N. Gas, E. Guillou, A. Valette, P. Belenguer and G. Lenaers (2003). "Loss of Opa1 Perturbates the Mitochondrial Inner Membrane Structure and Integrity, Leading to Cytochrome C Release and Apoptosis." The Journal of Biological Chemistry 278(10): 7743-7746.
Orso, G., A. Martinuzzi, M. G. Rossetto, E. Sartori, M. Feany and A. Daga (2005). "Disease-Related Phenotypes in a Drosophila Model of Hereditary Spastic Paraplegia Are Ameliorated by Treatment with Vinblastine." The Journal of Clinical Investigation 115(11): 3026-3034.
Orso, G., D. Pendin, S. Liu, J. Tosetto, T. J. Moss, J. E. Faust, M. Micaroni, A. Egorova, A. Martinuzzi, J. A. McNew and A. Daga (2009). "Homotypic Fusion of Er Membranes Requires the Dynamin-Like Gtpase Atlastin." Nature 460(7258): 978-983.
Osman, C., D. R. Voelker and T. Langer (2011). "Making Heads or Tails of Phospholipids in Mitochondria." The Journal of Cell Biology 192(1): 7-16.
Ou, S. H., F. Wu, D. Harrich, L. F. Garcia-Martinez and R. B. Gaynor (1995). "Cloning and Characterization of a Novel Cellular Protein, Tdp-43, That Binds to Human Immunodeficiency Virus Type 1 Tar DNA Sequence Motifs." Journal of Virology 69(6): 3584-3596.
Pallos, J., L. Bodai, T. Lukacsovich, J. M. Purcell, J. S. Steffan, L. M. Thompson and J. L. Marsh (2008). "Inhibition of Specific Hdacs and Sirtuins Suppresses Pathogenesis in a Drosophila Model of Huntington's Disease." Human Molecular Genetics 17(23): 3767-3775.
Pankiv, S., T. H. Clausen, T. Lamark, A. Brech, J. A. Bruun, H. Outzen, A. Overvatn, G. Bjorkoy and T. Johansen (2007). "P62/Sqstm1 Binds Directly to Atg8/Lc3 to
260
Facilitate Degradation of Ubiquitinated Protein Aggregates by Autophagy." The Journal of Biological Chemistry 282(33): 24131-24145.
Paradies, G., G. Petrosillo, V. Paradies and F. M. Ruggiero (2009). "Role of Cardiolipin Peroxidation and Ca2+ in Mitochondrial Dysfunction and Disease." Cell Calcium 45(6): 643-650.
Park, K. S., A. Wiederkehr and C. B. Wollheim (2012). "Defective Mitochondrial Function and Motility Due to Mitofusin 1 Overexpression in Insulin Secreting Cells." The Korean Journal of Physiology & Pharmacology : Official Journal of the Korean Physiological Society and the Korean Society of Pharmacology 16(1): 71-77.
Park, S. H., P. P. Zhu, R. L. Parker and C. Blackstone (2010). "Hereditary Spastic Paraplegia Proteins Reep1, Spastin, and Atlastin-1 Coordinate Microtubule Interactions with the Tubular Er Network." The Journal of Clinical Investigation 120(4): 1097-1110.
Park, S. J., J. H. Shin, E. S. Kim, Y. K. Jo, J. H. Kim, J. J. Hwang, J. C. Kim and D. H. Cho (2012). "Mitochondrial Fragmentation Caused by Phenanthroline Promotes Mitophagy." FEBS Letters 586(24): 4303-4310.
Pasinelli, P., M. E. Belford, N. Lennon, B. J. Bacskai, B. T. Hyman, D. Trotti and R. H. Brown, Jr. (2004). "Amyotrophic Lateral Sclerosis-Associated Sod1 Mutant Proteins Bind and Aggregate with Bcl-2 in Spinal Cord Mitochondria." Neuron 43(1): 19-30.
Pasinelli, P. and R. H. Brown (2006). "Molecular Biology of Amyotrophic Lateral Sclerosis: Insights from Genetics." Nat Rev Neurosci 7(9): 710-723.
Pasinelli, P., M. K. Houseweart, R. H. Brown, Jr. and D. W. Cleveland (2000). "Caspase-1 and -3 Are Sequentially Activated in Motor Neuron Death in Cu,Zn Superoxide Dismutase-Mediated Familial Amyotrophic Lateral Sclerosis." Proc Natl Acad Sci U S A 97(25): 13901-13906.
Patel, S. and M. Latterich (1998). "The Aaa Team: Related Atpases with Diverse Functions." Trends in Cell Biology 8(2): 65-71.
Pearce, M. M., Y. Wang, G. G. Kelley and R. J. Wojcikiewicz (2007). "Spfh2 Mediates the Endoplasmic Reticulum-Associated Degradation of Inositol 1,4,5-Trisphosphate Receptors and Other Substrates in Mammalian Cells." The Journal of Biological Chemistry 282(28): 20104-20115.
Peris, L., M. Thery, J. Faure, Y. Saoudi, L. Lafanechere, J. K. Chilton, P. Gordon-Weeks, N. Galjart, M. Bornens, L. Wordeman, J. Wehland, A. Andrieux and D. Job (2006). "Tubulin Tyrosination Is a Major Factor Affecting the Recruitment of Cap-Gly Proteins at Microtubule Plus Ends." The Journal of Cell Biology 174(6): 839-849.
Pfister, J. A., C. Ma, B. E. Morrison and S. R. D'Mello (2008). "Opposing Effects of Sirtuins on Neuronal Survival: Sirt1-Mediated Neuroprotection Is Independent of Its Deacetylase Activity." PLoS One 3(12): e4090.
261
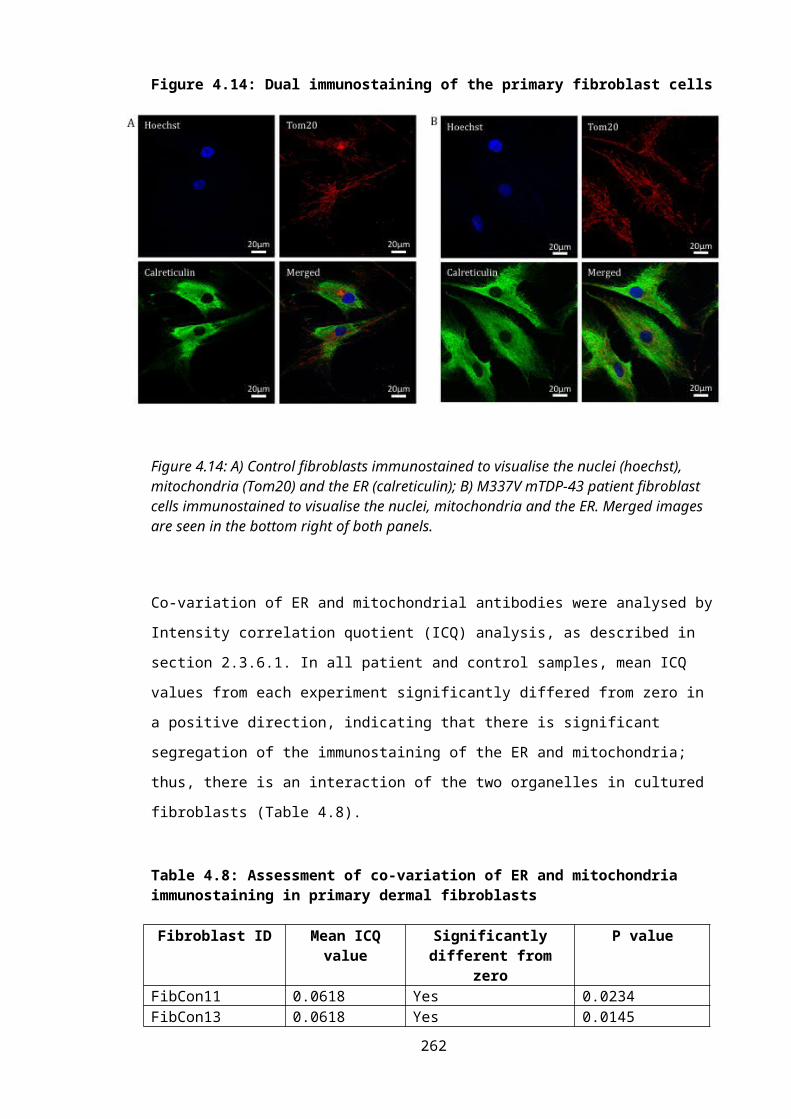
Pich, S., D. Bach, P. Briones, M. Liesa, M. Camps, X. Testar, M. Palacin and A. Zorzano (2005). "The Charcot-Marie-Tooth Type 2a Gene Product, Mfn2, up-Regulates Fuel Oxidation through Expression of Oxphos System." Human Molecular Genetics 14(11): 1405-1415.
Pittman, R. N., S. Wang, A. J. DiBenedetto and J. C. Mills (1993). "A System for Characterizing Cellular and Molecular Events in Programmed Neuronal Cell Death." The Journal of Neuroscience : The Official Journal of the Society for Neuroscience 13(9): 3669-3680.
Polymenidou, M., C. Lagier-Tourenne, K. R. Hutt, S. C. Huelga, J. Moran, T. Y. Liang, S. C. Ling, E. Sun, E. Wancewicz, C. Mazur, H. Kordasiewicz, Y. Sedaghat, J. P. Donohue, L. Shiue, C. F. Bennett, G. W. Yeo and D. W. Cleveland (2011). "Long Pre-Mrna Depletion and Rna Missplicing Contribute to Neuronal Vulnerability from Loss of Tdp-43." Nature Neuroscience 14(4): 459-468.
Poole, A. C., R. E. Thomas, L. A. Andrews, H. M. McBride, A. J. Whitworth and L. J. Pallanck (2008). "The Pink1/Parkin Pathway Regulates Mitochondrial Morphology." Proceedings of the National Academy of Sciences of the United States of America 105(5): 1638-1643.
Poole, A. C., R. E. Thomas, L. A. Andrews, H. M. McBride, A. J. Whitworth and L. J. Pallanck (2008). "The Pink1/Parkin Pathway Regulates Mitochondrial Morphology." Proc Natl Acad Sci U S A 105(5): 1638-1643.
Portet, F., C. Cadilhac, J. Touchon and W. Camu (2001). "Cognitive Impairment in Motor Neuron Disease with Bulbar Onset." Amyotrophic Lateral Sclerosis and Other Motor Neuron Disorders : Official Publication of the World Federation of Neurology, Research Group on Motor Neuron Diseases 2(1): 23-29.
Prakriya, M., S. Feske, Y. Gwack, S. Srikanth, A. Rao and P. G. Hogan (2006). "Orai1 Is an Essential Pore Subunit of the Crac Channel." Nature 443(7108): 230-233.
Puls, I., C. Jonnakuty, B. H. LaMonte, E. L. Holzbaur, M. Tokito, E. Mann, M. K. Floeter, K. Bidus, D. Drayna, S. J. Oh, R. H. Brown, Jr., C. L. Ludlow and K. H. Fischbeck (2003). "Mutant Dynactin in Motor Neuron Disease." Nat Genet 33(4): 455-456.
Pun, S., A. F. Santos, S. Saxena, L. Xu and P. Caroni (2006). "Selective Vulnerability and Pruning of Phasic Motoneuron Axons in Motoneuron Disease Alleviated by Cntf." Nature Neuroscience 9(3): 408-419.
Qiang, W., K. Weiqiang, Z. Qing, Z. Pengju and L. Yi (2007). "Aging Impairs Insulin-Stimulated Glucose Uptake in Rat Skeletal Muscle Via Suppressing Ampkalpha." Experimental & Molecular Medicine 39(4): 535-543.
Qiu, X., K. Brown, M. D. Hirschey, E. Verdin and D. Chen (2010). "Calorie Restriction Reduces Oxidative Stress by Sirt3-Mediated Sod2 Activation." Cell Metabolism 12(6): 662-667.
Radoshevich, L., L. Murrow, N. Chen, E. Fernandez, S. Roy, C. Fung and J. Debnath (2010). "Atg12 Conjugation to Atg3 Regulates Mitochondrial Homeostasis and Cell Death." Cell 142(4): 590-600.
262
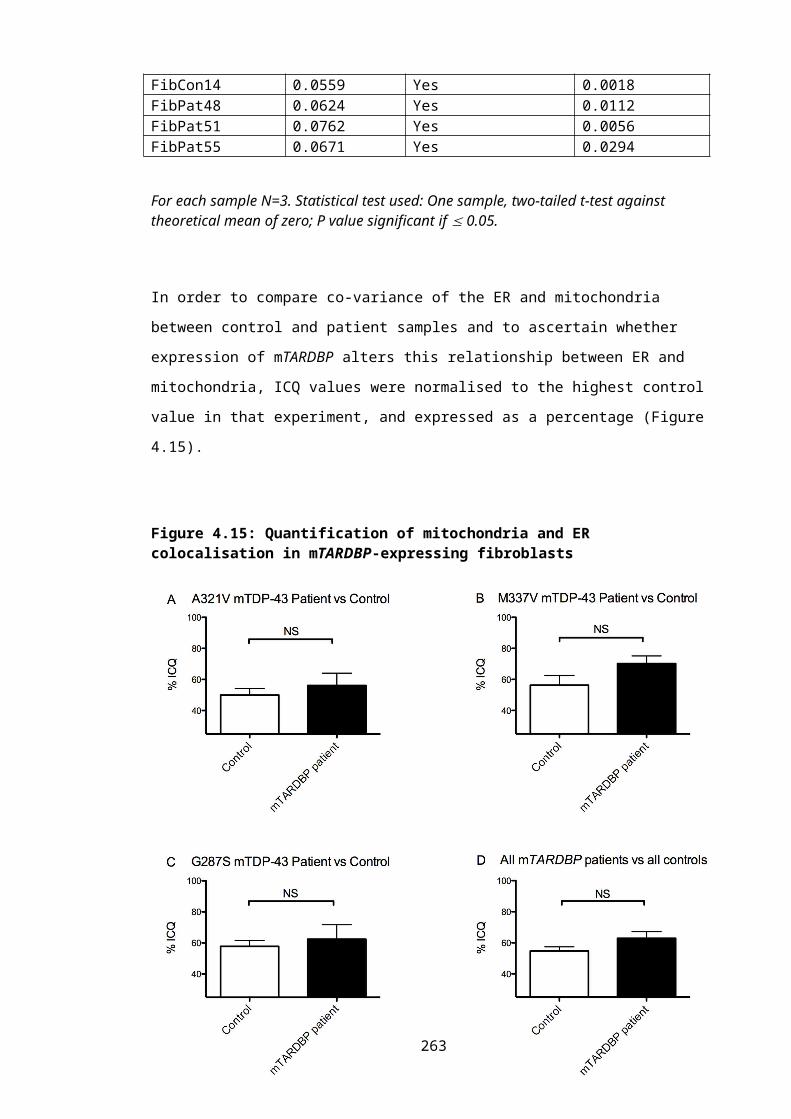
Raimondi, A., A. Mangolini, M. Rizzardini, S. Tartari, S. Massari, C. Bendotti, M. Francolini, N. Borgese, L. Cantoni and G. Pietrini (2006). "Cell Culture Models to Investigate the Selective Vulnerability of Motoneuronal Mitochondria to Familial Als-Linked G93asod1." Eur J Neurosci 24(2): 387-399.
Rakovic, A., A. Grunewald, L. Voges, S. Hofmann, S. Orolicki, K. Lohmann and C. Klein (2011). "Pink1-Interacting Proteins: Proteomic Analysis of Overexpressed Pink1." Parkinson's Disease 2011: 153979.
Rambold, A. S., B. Kostelecky, N. Elia and J. Lippincott-Schwartz (2011). "Tubular Network Formation Protects Mitochondria from Autophagosomal Degradation During Nutrient Starvation." Proceedings of the National Academy of Sciences of the United States of America 108(25): 10190-10195.
Raturi, A. and T. Simmen (2013). "Where the Endoplasmic Reticulum and the Mitochondrion Tie the Knot: The Mitochondria-Associated Membrane (Mam)." Biochimica et Biophysica Acta 1833(1): 213-224.
Ravikumar, B., A. Acevedo-Arozena, S. Imarisio, Z. Berger, C. Vacher, C. J. O'Kane, S. D. Brown and D. C. Rubinsztein (2005). "Dynein Mutations Impair Autophagic Clearance of Aggregate-Prone Proteins." Nature Genetics 37(7): 771-776.
Ravikumar, B., C. Vacher, Z. Berger, J. E. Davies, S. Luo, L. G. Oroz, F. Scaravilli, D. F. Easton, R. Duden, C. J. O'Kane and D. C. Rubinsztein (2004). "Inhibition of Mtor Induces Autophagy and Reduces Toxicity of Polyglutamine Expansions in Fly and Mouse Models of Huntington Disease." Nature Genetics 36(6): 585-595.
Reed, N. A., D. Cai, T. L. Blasius, G. T. Jih, E. Meyhofer, J. Gaertig and K. J. Verhey (2006). "Microtubule Acetylation Promotes Kinesin-1 Binding and Transport." Current Biology : CB 16(21): 2166-2172.
Reid, E., J. Connell, T. L. Edwards, S. Duley, S. E. Brown and C. M. Sanderson (2005). "The Hereditary Spastic Paraplegia Protein Spastin Interacts with the Escrt-Iii Complex-Associated Endosomal Protein Chmp1b." Human Molecular Genetics 14(1): 19-38.
Reid, E., M. Kloos, A. Ashley-Koch, L. Hughes, S. Bevan, I. K. Svenson, F. L. Graham, P. C. Gaskell, A. Dearlove, M. A. Pericak-Vance, D. C. Rubinsztein and D. A. Marchuk (2002). "A Kinesin Heavy Chain (Kif5a) Mutation in Hereditary Spastic Paraplegia (Spg10)." American Journal of Human Genetics 71(5): 1189-1194.
Renton, A. E., E. Majounie, A. Waite, J. Simon-Sanchez, S. Rollinson, J. R. Gibbs, J. C. Schymick, H. Laaksovirta, J. C. van Swieten, L. Myllykangas, H. Kalimo, A. Paetau, Y. Abramzon, A. M. Remes, A. Kaganovich, S. W. Scholz, J. Duckworth, J. Ding, D. W. Harmer, D. G. Hernandez, J. O. Johnson, K. Mok, M. Ryten, D. Trabzuni, R. J. Guerreiro, R. W. Orrell, J. Neal, A. Murray, J. Pearson, I. E. Jansen, D. Sondervan, H. Seelaar, D. Blake, K. Young, N. Halliwell, J. B. Callister, G. Toulson, A. Richardson, A. Gerhard, J. Snowden, D. Mann, D. Neary, M. A. Nalls, T. Peuralinna, L. Jansson, V. M. Isoviita, A. L. Kaivorinne, M. Holtta-Vuori, E. Ikonen, R. Sulkava, M. Benatar, J. Wuu, A. Chio, G. Restagno, G. Borghero, M. Sabatelli, D. Heckerman, E. Rogaeva, L. Zinman, J. D. Rothstein, M. Sendtner, C. Drepper, E. E. Eichler, C. Alkan, Z. Abdullaev, S. D. Pack, A. Dutra, E. Pak, J. Hardy, A. Singleton, N. M. Williams, P. Heutink, S.
263
Pickering-Brown, H. R. Morris, P. J. Tienari and B. J. Traynor (2011). "A Hexanucleotide Repeat Expansion in C9orf72 Is the Cause of Chromosome 9p21-Linked Als-Ftd." Neuron 72(2): 257-268.
Rezin, G. T., G. Amboni, A. I. Zugno, J. Quevedo and E. L. Streck (2009). "Mitochondrial Dysfunction and Psychiatric Disorders." Neurochem Res 34(6): 1021-1029.
Reznick, R. M., H. Zong, J. Li, K. Morino, I. K. Moore, H. J. Yu, Z. X. Liu, J. Dong, K. J. Mustard, S. A. Hawley, D. Befroy, M. Pypaert, D. G. Hardie, L. H. Young and G. I. Shulman (2007). "Aging-Associated Reductions in Amp-Activated Protein Kinase Activity and Mitochondrial Biogenesis." Cell Metabolism 5(2): 151-156.
Ringholz, G. M., S. H. Appel, M. Bradshaw, N. A. Cooke, D. M. Mosnik and P. E. Schulz (2005). "Prevalence and Patterns of Cognitive Impairment in Sporadic Als." Neurology 65(4): 586-590.
Ritov, V. B., E. V. Menshikova, J. He, R. E. Ferrell, B. H. Goodpaster and D. E. Kelley (2005). "Deficiency of Subsarcolemmal Mitochondria in Obesity and Type 2 Diabetes." Diabetes 54(1): 8-14.
Rizzuto, R., M. Brini, M. Murgia and T. Pozzan (1993). "Microdomains with High Ca2+ Close to Ip3-Sensitive Channels That Are Sensed by Neighboring Mitochondria." Science 262(5134): 744-747.
Rizzuto, R., P. Pinton, W. Carrington, F. S. Fay, K. E. Fogarty, L. M. Lifshitz, R. A. Tuft and T. Pozzan (1998). "Close Contacts with the Endoplasmic Reticulum as Determinants of Mitochondrial Ca2+ Responses." Science 280(5370): 1763-1766.
Rizzuto, R. and T. Pozzan (2006). "Microdomains of Intracellular Ca2+: Molecular Determinants and Functional Consequences." Physiological Reviews 86(1): 369-408.
Rodriguez, G. E., D. M. Gonzalez, G. M. Monachelli, J. J. Costa, A. F. Nicola and R. E. Sica (2012). "Morphological Abnormalities in Mitochondria of the Skin of Patients with Sporadic Amyotrophic Lateral Sclerosis." Arquivos de Neuro-Psiquiatria 70(1): 40-44.
Roll-Mecak, A. and R. D. Vale (2008). "Structural Basis of Microtubule Severing by the Hereditary Spastic Paraplegia Protein Spastin." Nature 451(7176): 363-367.
Rosen, D. R. (1993). "Mutations in Cu/Zn Superoxide Dismutase Gene Are Associated with Familial Amyotrophic Lateral Sclerosis." Nature 364(6435): 362.
Rossignol, R., R. Gilkerson, R. Aggeler, K. Yamagata, S. J. Remington and R. A. Capaldi (2004). "Energy Substrate Modulates Mitochondrial Structure and Oxidative Capacity in Cancer Cells." Cancer Res 64(3): 985-993.
Rothstein, J. D. (2009). "Current Hypotheses for the Underlying Biology of Amyotrophic Lateral Sclerosis." Annals of Neurology 65 Suppl 1: S3-9.
264
Rothstein, J. D., G. Tsai, R. W. Kuncl, L. Clawson, D. R. Cornblath, D. B. Drachman, A. Pestronk, B. L. Stauch and J. T. Coyle (1990). "Abnormal Excitatory Amino Acid Metabolism in Amyotrophic Lateral Sclerosis." Annals of Neurology 28(1): 18-25.
Rothstein, J. D., M. Van Kammen, A. I. Levey, L. J. Martin and R. W. Kuncl (1995). "Selective Loss of Glial Glutamate Transporter Glt-1 in Amyotrophic Lateral Sclerosis." Annals of Neurology 38(1): 73-84.
Rovini, A., M. Carre, T. Bordet, R. M. Pruss and D. Braguer (2010). "Olesoxime Prevents Microtubule-Targeting Drug Neurotoxicity: Selective Preservation of Eb Comets in Differentiated Neuronal Cells." Biochemical Pharmacology 80(6): 884-894.
Roy, J., S. Minotti, L. Dong, D. A. Figlewicz and H. D. Durham (1998). "Glutamate Potentiates the Toxicity of Mutant Cu/Zn-Superoxide Dismutase in Motor Neurons by Postsynaptic Calcium-Dependent Mechanisms." J Neurosci 18(23): 9673-9684.
Rube, D. A. and A. M. van der Bliek (2004). "Mitochondrial Morphology Is Dynamic and Varied." Mol Cell Biochem 256-257(1-2): 331-339.
Rubinsztein, D. C. (2006). "The Roles of Intracellular Protein-Degradation Pathways in Neurodegeneration." Nature 443(7113): 780-786.
Ruby, J. R., R. F. Dyer and R. G. Skalko (1969). "Continuities between Mitochondria and Endoplasmic Reticulum in the Mammalian Ovary." Zeitschrift fur Zellforschung und Mikroskopische Anatomie 97(1): 30-37.
Rusinol, A. E., Z. Cui, M. H. Chen and J. E. Vance (1994). "A Unique Mitochondria-Associated Membrane Fraction from Rat Liver Has a High Capacity for Lipid Synthesis and Contains Pre-Golgi Secretory Proteins Including Nascent Lipoproteins." The Journal of Biological Chemistry 269(44): 27494-27502.
Ryter, S. W., K. Nakahira, J. A. Haspel and A. M. Choi (2012). "Autophagy in Pulmonary Diseases." Annual Review of Physiology 74: 377-401.
Sagona, A. P., I. P. Nezis, N. M. Pedersen, K. Liestol, J. Poulton, T. E. Rusten, R. I. Skotheim, C. Raiborg and H. Stenmark (2010). "Ptdins(3)P Controls Cytokinesis through Kif13a-Mediated Recruitment of Fyve-Cent to the Midbody." Nature Cell Biology 12(4): 362-371.
Sahin, E., S. Colla, M. Liesa, J. Moslehi, F. L. Muller, M. Guo, M. Cooper, D. Kotton, A. J. Fabian, C. Walkey, R. S. Maser, G. Tonon, F. Foerster, R. Xiong, Y. A. Wang, S. A. Shukla, M. Jaskelioff, E. S. Martin, T. P. Heffernan, A. Protopopov, E. Ivanova, J. E. Mahoney, M. Kost-Alimova, S. R. Perry, R. Bronson, R. Liao, R. Mulligan, O. S. Shirihai, L. Chin and R. A. DePinho (2011). "Telomere Dysfunction Induces Metabolic and Mitochondrial Compromise." Nature 470(7334): 359-365.
Sahin, E. and R. A. Depinho (2010). "Linking Functional Decline of Telomeres, Mitochondria and Stem Cells During Ageing." Nature 464(7288): 520-528.
Sahin, E. and R. A. DePinho (2012). "Axis of Ageing: Telomeres, P53 and Mitochondria." Nature Reviews. Molecular Cell Biology 13(6): 397-404.
265
Salinas, S., C. Proukakis, A. Crosby and T. T. Warner (2008). "Hereditary Spastic Paraplegia: Clinical Features and Pathogenetic Mechanisms." Lancet Neurology 7(12): 1127-1138.
Santel, A. and M. T. Fuller (2001). "Control of Mitochondrial Morphology by a Human Mitofusin." Journal of Cell Science 114(Pt 5): 867-874.
Santos, N. C., J. Figueira-Coelho, J. Martins-Silva and C. Saldanha (2003). "Multidisciplinary Utilization of Dimethyl Sulfoxide: Pharmacological, Cellular, and Molecular Aspects." Biochemical Pharmacology 65(7): 1035-1041.
Saotome, M., D. Safiulina, G. Szabadkai, S. Das, A. Fransson, P. Aspenstrom, R. Rizzuto and G. Hajnoczky (2008). "Bidirectional Ca2+-Dependent Control of Mitochondrial Dynamics by the Miro Gtpase." Proceedings of the National Academy of Sciences of the United States of America 105(52): 20728-20733.
Sasaki, S. (2010). "Endoplasmic Reticulum Stress in Motor Neurons of the Spinal Cord in Sporadic Amyotrophic Lateral Sclerosis." Journal of Neuropathology and Experimental Neurology 69(4): 346-355.
Sasaki, S. and M. Iwata (2007). "Mitochondrial Alterations in the Spinal Cord of Patients with Sporadic Amyotrophic Lateral Sclerosis." Journal of Neuropathology and Experimental Neurology 66(1): 10-16.
Sasaki, S. and M. Iwata (2007). "Mitochondrial Alterations in the Spinal Cord of Patients with Sporadic Amyotrophic Lateral Sclerosis." J Neuropathol Exp Neurol 66(1): 10-16.
Sathasivam, S., A. J. Grierson and P. J. Shaw (2005). "Characterization of the Caspase Cascade in a Cell Culture Model of Sod1-Related Familial Amyotrophic Lateral Sclerosis: Expression, Activation and Therapeutic Effects of Inhibition." Neuropathol Appl Neurobiol 31(5): 467-485.
Sato, T., S. Takeuchi, A. Saito, W. Ding, H. Bamba, H. Matsuura, Y. Hisa, I. Tooyama and M. Urushitani (2009). "Axonal Ligation Induces Transient Redistribution of Tdp-43 in Brainstem Motor Neurons." Neuroscience 164(4): 1565-1578.
Schon, E. A. and E. Area-Gomez (2010). "Is Alzheimer's Disease a Disorder of Mitochondria-Associated Membranes?" Journal of Alzheimer's Disease : JAD 20 Suppl 2: S281-292.
Schulz, T. J., K. Zarse, A. Voigt, N. Urban, M. Birringer and M. Ristow (2007). "Glucose Restriction Extends Caenorhabditis Elegans Life Span by Inducing Mitochondrial Respiration and Increasing Oxidative Stress." Cell Metabolism 6(4): 280-293.
Sebastia, J., D. Kieran, B. Breen, M. A. King, D. F. Netteland, D. Joyce, S. F. Fitzpatrick, C. T. Taylor and J. H. Prehn (2009). "Angiogenin Protects Motoneurons against Hypoxic Injury." Cell Death and Differentiation 16(9): 1238-1247.
Seo, A. Y., A. M. Joseph, D. Dutta, J. C. Hwang, J. P. Aris and C. Leeuwenburgh (2010). "New Insights into the Role of Mitochondria in Aging: Mitochondrial Dynamics and More." Journal of Cell Science 123(Pt 15): 2533-2542.
266
Shahpasand, K., I. Uemura, T. Saito, T. Asano, K. Hata, K. Shibata, Y. Toyoshima, M. Hasegawa and S. Hisanaga (2012). "Regulation of Mitochondrial Transport and Inter-Microtubule Spacing by Tau Phosphorylation at the Sites Hyperphosphorylated in Alzheimer's Disease." The Journal of Neuroscience : The Official Journal of the Society for Neuroscience 32(7): 2430-2441.
Shan, X., P. M. Chiang, D. L. Price and P. C. Wong (2010). "Altered Distributions of Gemini of Coiled Bodies and Mitochondria in Motor Neurons of Tdp-43 Transgenic Mice." Proceedings of the National Academy of Sciences of the United States of America 107(37): 16325-16330.
Shaw, P. J. (2005). "Molecular and Cellular Pathways of Neurodegeneration in Motor Neurone Disease." J Neurol Neurosurg Psychiatry 76(8): 1046-1057.
Shaw, P. J., R. M. Chinnery and P. G. Ince (1994). "Non-Nmda Receptors in Motor Neuron Disease (Mnd): A Quantitative Autoradiographic Study in Spinal Cord and Motor Cortex Using [3h]Cnqx and [3h]Kainate." Brain Research 655(1-2): 186-194.
Shaw, P. J., V. Forrest, P. G. Ince, J. P. Richardson and H. J. Wastell (1995). "Csf and Plasma Amino Acid Levels in Motor Neuron Disease: Elevation of Csf Glutamate in a Subset of Patients." Neurodegeneration 4(2): 209-216.
Shaw, P. J., P. G. Ince, G. Falkous and D. Mantle (1995). "Oxidative Damage to Protein in Sporadic Motor Neuron Disease Spinal Cord." Annals of Neurology 38(4): 691-695.
Shaw, P. J., T. L. Williams, J. Y. Slade, C. J. Eggett and P. G. Ince (1999). "Low Expression of Glur2 Ampa Receptor Subunit Protein by Human Motor Neurons." Neuroreport 10(2): 261-265.
Shefner, J. M., M. E. Cudkowicz, D. Schoenfeld, T. Conrad, J. Taft, M. Chilton, L. Urbinelli, M. Qureshi, H. Zhang, A. Pestronk, J. Caress, P. Donofrio, E. Sorenson, W. Bradley, C. Lomen-Hoerth, E. Pioro, K. Rezania, M. Ross, R. Pascuzzi, T. Heiman-Patterson, R. Tandan, H. Mitsumoto, J. Rothstein, T. Smith-Palmer, D. MacDonald and D. Burke (2004). "A Clinical Trial of Creatine in Als." Neurology 63(9): 1656-1661.
Shefner, J. M., A. G. Reaume, D. G. Flood, R. W. Scott, N. W. Kowall, R. J. Ferrante, D. F. Siwek, M. Upton-Rice and R. H. Brown, Jr. (1999). "Mice Lacking Cytosolic Copper/Zinc Superoxide Dismutase Display a Distinctive Motor Axonopathy." Neurology 53(6): 1239-1246.
Shirane, M. and K. I. Nakayama (2006). "Protrudin Induces Neurite Formation by Directional Membrane Trafficking." Science 314(5800): 818-821.
Shoukier, M., J. Neesen, S. M. Sauter, L. Argyriou, N. Doerwald, D. V. Pantakani and A. U. Mannan (2009). "Expansion of Mutation Spectrum, Determination of Mutation Cluster Regions and Predictive Structural Classification of Spast Mutations in Hereditary Spastic Paraplegia." European Journal of Human Genetics : EJHG 17(2): 187-194.
267
Shutt, T., M. Geoffrion, R. Milne and H. M. McBride (2012). "The Intracellular Redox State Is a Core Determinant of Mitochondrial Fusion." EMBO Reports 13(10): 909-915.
Siciliano, G., C. D'Avino, A. Del Corona, R. Barsacchi, C. Kusmic, A. Rocchi, E. Pastorini and L. Murri (2002). "Impaired Oxidative Metabolism and Lipid Peroxidation in Exercising Muscle from Als Patients." Amyotrophic Lateral Sclerosis and Other Motor Neuron Disorders : Official Publication of the World Federation of Neurology, Research Group on Motor Neuron Diseases 3(2): 57-62.
Simmen, T., J. E. Aslan, A. D. Blagoveshchenskaya, L. Thomas, L. Wan, Y. Xiang, S. F. Feliciangeli, C. H. Hung, C. M. Crump and G. Thomas (2005). "Pacs-2 Controls Endoplasmic Reticulum-Mitochondria Communication and Bid-Mediated Apoptosis." The EMBO Journal 24(4): 717-729.
Simpson, E. P., Y. K. Henry, J. S. Henkel, R. G. Smith and S. H. Appel (2004). "Increased Lipid Peroxidation in Sera of Als Patients: A Potential Biomarker of Disease Burden." Neurology 62(10): 1758-1765.
Simpson, M. A., H. Cross, C. Proukakis, A. Pryde, R. Hershberger, A. Chatonnet, M. A. Patton and A. H. Crosby (2003). "Maspardin Is Mutated in Mast Syndrome, a Complicated Form of Hereditary Spastic Paraplegia Associated with Dementia." American Journal of Human Genetics 73(5): 1147-1156.
Slabicki, M., M. Theis, D. B. Krastev, S. Samsonov, E. Mundwiller, M. Junqueira, M. Paszkowski-Rogacz, J. Teyra, A. K. Heninger, I. Poser, F. Prieur, J. Truchetto, C. Confavreux, C. Marelli, A. Durr, J. P. Camdessanche, A. Brice, A. Shevchenko, M. T. Pisabarro, G. Stevanin and F. Buchholz (2010). "A Genome-Scale DNA Repair Rnai Screen Identifies Spg48 as a Novel Gene Associated with Hereditary Spastic Paraplegia." PLoS Biology 8(6): e1000408.
Smirnova, E., L. Griparic, D. L. Shurland and A. M. van der Bliek (2001). "Dynamin-Related Protein Drp1 Is Required for Mitochondrial Division in Mammalian Cells." Molecular Biology of the Cell 12(8): 2245-2256.
Solowska, J. M., G. Morfini, A. Falnikar, B. T. Himes, S. T. Brady, D. Huang and P. W. Baas (2008). "Quantitative and Functional Analyses of Spastin in the Nervous System: Implications for Hereditary Spastic Paraplegia." The Journal of Neuroscience : The Official Journal of the Society for Neuroscience 28(9): 2147-2157.
Soltys, B. J. and R. S. Gupta (1992). "Interrelationships of Endoplasmic Reticulum, Mitochondria, Intermediate Filaments, and Microtubules--a Quadruple Fluorescence Labeling Study." Biochemistry and Cell Biology = Biochimie et Biologie Cellulaire 70(10-11): 1174-1186.
Sommer, B., M. Kohler, R. Sprengel and P. H. Seeburg (1991). "Rna Editing in Brain Controls a Determinant of Ion Flow in Glutamate-Gated Channels." Cell 67(1): 11-19.
Son, J. H., J. H. Shim, K. H. Kim, J. Y. Ha and J. Y. Han (2012). "Neuronal Autophagy and Neurodegenerative Diseases." Experimental & Molecular Medicine 44(2): 89-98.
268
Song, W., Y. Song, B. Kincaid, B. Bossy and E. Bossy-Wetzel (2013). "Mutant Sod1(G93a) Triggers Mitochondrial Fragmentation in Spinal Cord Motor Neurons: Neuroprotection by Sirt3 and Pgc-1alpha." Neurobiology of Disease 51: 72-81.
Soo, K. Y., J. D. Atkin, M. K. Horne and P. Nagley (2009). "Recruitment of Mitochondria into Apoptotic Signaling Correlates with the Presence of Inclusions Formed by Amyotrophic Lateral Sclerosis-Associated Sod1 Mutations." J Neurochem 108(3): 578-590.
Soriano, F. X., M. Liesa, D. Bach, D. C. Chan, M. Palacin and A. Zorzano (2006). "Evidence for a Mitochondrial Regulatory Pathway Defined by Peroxisome Proliferator-Activated Receptor-Gamma Coactivator-1 Alpha, Estrogen-Related Receptor-Alpha, and Mitofusin 2." Diabetes 55(6): 1783-1791.
Sotelo-Silveira, J. R., P. Lepanto, V. Elizondo, S. Horjales, F. Palacios, L. Martinez-Palma, M. Marin, J. S. Beckman and L. Barbeito (2009). "Axonal Mitochondrial Clusters Containing Mutant Sod1 in Transgenic Models of Als." Antioxidants & Redox Signaling 11(7): 1535-1545.
Spalloni, A., F. Albo, F. Ferrari, N. Mercuri, G. Bernardi, C. Zona and P. Longone (2004). "Cu/Zn-Superoxide Dismutase (Gly93-->Ala) Mutation Alters Ampa Receptor Subunit Expression and Function and Potentiates Kainate-Mediated Toxicity in Motor Neurons in Culture." Neurobiol Dis 15(2): 340-350.
Spreux-Varoquaux, O., G. Bensimon, L. Lacomblez, F. Salachas, P. F. Pradat, N. Le Forestier, A. Marouan, M. Dib and V. Meininger (2002). "Glutamate Levels in Cerebrospinal Fluid in Amyotrophic Lateral Sclerosis: A Reappraisal Using a New Hplc Method with Coulometric Detection in a Large Cohort of Patients." J Neurol Sci 193(2): 73-78.
Srayko, M., T. O'Toole E, A. A. Hyman and T. Muller-Reichert (2006). "Katanin Disrupts the Microtubule Lattice and Increases Polymer Number in C. Elegans Meiosis." Current Biology : CB 16(19): 1944-1949.
Sreedharan, J., I. P. Blair, V. B. Tripathi, X. Hu, C. Vance, B. Rogelj, S. Ackerley, J. C. Durnall, K. L. Williams, E. Buratti, F. Baralle, J. de Belleroche, J. D. Mitchell, P. N. Leigh, A. Al-Chalabi, C. C. Miller, G. Nicholson and C. E. Shaw (2008). "Tdp-43 Mutations in Familial and Sporadic Amyotrophic Lateral Sclerosis." Science 319(5870): 1668-1672.
Strom, A. L., P. Shi, F. Zhang, J. Gal, R. Kilty, L. J. Hayward and H. Zhu (2008). "Interaction of Amyotrophic Lateral Sclerosis (Als)-Related Mutant Copper-Zinc Superoxide Dismutase with the Dynein-Dynactin Complex Contributes to Inclusion Formation." The Journal of Biological Chemistry 283(33): 22795-22805.
Strong, M. J., K. Volkening, R. Hammond, W. Yang, W. Strong, C. Leystra-Lantz and C. Shoesmith (2007). "Tdp43 Is a Human Low Molecular Weight Neurofilament (Hnfl) Mrna-Binding Protein." Molecular and Cellular Neurosciences 35(2): 320-327.
Sudo, H. and P. W. Baas (2010). "Acetylation of Microtubules Influences Their Sensitivity to Severing by Katanin in Neurons and Fibroblasts." The Journal of
269
Neuroscience : The Official Journal of the Society for Neuroscience 30(21): 7215-7226.
Sukhorukov, V. M., D. Dikov, A. S. Reichert and M. Meyer-Hermann (2012). "Emergence of the Mitochondrial Reticulum from Fission and Fusion Dynamics." PLoS Computational Biology 8(10): e1002745.
Suzuki, H., K. Lee and M. Matsuoka (2011). "Tdp-43-Induced Death Is Associated with Altered Regulation of Bim and Bcl-Xl and Attenuated by Caspase-Mediated Tdp-43 Cleavage." The Journal of Biological Chemistry 286(15): 13171-13183.
Svenson, I. K., A. E. Ashley-Koch, P. C. Gaskell, T. J. Riney, W. J. Cumming, H. M. Kingston, E. L. Hogan, R. M. Boustany, J. M. Vance, M. A. Nance, M. A. Pericak-Vance and D. A. Marchuk (2001). "Identification and Expression Analysis of Spastin Gene Mutations in Hereditary Spastic Paraplegia." American Journal of Human Genetics 68(5): 1077-1085.
Szabadkai, G., K. Bianchi, P. Varnai, D. De Stefani, M. R. Wieckowski, D. Cavagna, A. I. Nagy, T. Balla and R. Rizzuto (2006). "Chaperone-Mediated Coupling of Endoplasmic Reticulum and Mitochondrial Ca2+ Channels." The Journal of Cell Biology 175(6): 901-911.
Szabadkai, G., A. M. Simoni, M. Chami, M. R. Wieckowski, R. J. Youle and R. Rizzuto (2004). "Drp-1-Dependent Division of the Mitochondrial Network Blocks Intraorganellar Ca2+ Waves and Protects against Ca2+-Mediated Apoptosis." Molecular Cell 16(1): 59-68.
Szabo, I., V. De Pinto and M. Zoratti (1993). "The Mitochondrial Permeability Transition Pore May Comprise Vdac Molecules. Ii. The Electrophysiological Properties of Vdac Are Compatible with Those of the Mitochondrial Megachannel." FEBS Letters 330(2): 206-210.
Szymanski, K. M., D. Binns, R. Bartz, N. V. Grishin, W. P. Li, A. K. Agarwal, A. Garg, R. G. Anderson and J. M. Goodman (2007). "The Lipodystrophy Protein Seipin Is Found at Endoplasmic Reticulum Lipid Droplet Junctions and Is Important for Droplet Morphology." Proceedings of the National Academy of Sciences of the United States of America 104(52): 20890-20895.
Tandler, B. and C. L. Hoppel (1986). "Studies on Giant Mitochondria." Annals of the New York Academy of Sciences 488: 65-81.
Tanida, I., T. Nishitani, T. Nemoto, T. Ueno and E. Kominami (2002). "Mammalian Apg12p, but Not the Apg12p.Apg5p Conjugate, Facilitates Lc3 Processing." Biochemical and Biophysical Research Communications 296(5): 1164-1170.
Tarrade, A., C. Fassier, S. Courageot, D. Charvin, J. Vitte, L. Peris, A. Thorel, E. Mouisel, N. Fonknechten, N. Roblot, D. Seilhean, A. Dierich, J. J. Hauw and J. Melki (2006). "A Mutation of Spastin Is Responsible for Swellings and Impairment of Transport in a Region of Axon Characterized by Changes in Microtubule Composition." Human Molecular Genetics 15(24): 3544-3558.
Tateno, M., H. Sadakata, M. Tanaka, S. Itohara, R. M. Shin, M. Miura, M. Masuda, T. Aosaki, M. Urushitani, H. Misawa and R. Takahashi (2004). "Calcium-Permeable
270
Ampa Receptors Promote Misfolding of Mutant Sod1 Protein and Development of Amyotrophic Lateral Sclerosis in a Transgenic Mouse Model." Human Molecular Genetics 13(19): 2183-2196.
Terman, A. and U. T. Brunk (2005). "The Aging Myocardium: Roles of Mitochondrial Damage and Lysosomal Degradation." Heart, Lung & Circulation 14(2): 107-114.
Terman, A., H. Dalen, J. W. Eaton, J. Neuzil and U. T. Brunk (2003). "Mitochondrial Recycling and Aging of Cardiac Myocytes: The Role of Autophagocytosis." Experimental Gerontology 38(8): 863-876.
Terman, A., T. Kurz, M. Navratil, E. A. Arriaga and U. T. Brunk (2010). "Mitochondrial Turnover and Aging of Long-Lived Postmitotic Cells: The Mitochondrial-Lysosomal Axis Theory of Aging." Antioxidants & Redox Signaling 12(4): 503-535.
Thomas, K. J. and M. R. Jacobson (2012). "Defects in Mitochondrial Fission Protein Dynamin-Related Protein 1 Are Linked to Apoptotic Resistance and Autophagy in a Lung Cancer Model." PLoS One 7(9): e45319.
Thomson, M. (2003). "Does Cholesterol Use the Mitochondrial Contact Site as a Conduit to the Steroidogenic Pathway?" BioEssays : News and Reviews in Molecular, Cellular and Developmental Biology 25(3): 252-258.
Tieu, K., C. Perier, C. Caspersen, P. Teismann, D. C. Wu, S. D. Yan, A. Naini, M. Vila, V. Jackson-Lewis, R. Ramasamy and S. Przedborski (2003). "D-Beta-Hydroxybutyrate Rescues Mitochondrial Respiration and Mitigates Features of Parkinson Disease." The Journal of Clinical Investigation 112(6): 892-901.
Tohgi, H., T. Abe, K. Yamazaki, T. Murata, E. Ishizaki and C. Isobe (1999). "Remarkable Increase in Cerebrospinal Fluid 3-Nitrotyrosine in Patients with Sporadic Amyotrophic Lateral Sclerosis." Annals of Neurology 46(1): 129-131.
Topp, J. D., N. W. Gray, R. D. Gerard and B. F. Horazdovsky (2004). "Alsin Is a Rab5 and Rac1 Guanine Nucleotide Exchange Factor." J Biol Chem 279(23): 24612-24623.
Tremolizzo, L., S. Beretta and C. Ferrarese (2004). "Peripheral Markers of Glutamatergic Dysfunction in Neurological Diseases: Focus on Ex Vivo Tools." Crit Rev Neurobiol 16(1-2): 141-146.
Trotta, N., G. Orso, M. G. Rossetto, A. Daga and K. Broadie (2004). "The Hereditary Spastic Paraplegia Gene, Spastin, Regulates Microtubule Stability to Modulate Synaptic Structure and Function." Current Biology : CB 14(13): 1135-1147.
Tsang, H. T., T. L. Edwards, X. Wang, J. W. Connell, R. J. Davies, H. J. Durrington, C. J. O'Kane, J. P. Luzio and E. Reid (2009). "The Hereditary Spastic Paraplegia Proteins Nipa1, Spastin and Spartin Are Inhibitors of Mammalian Bmp Signalling." Human Molecular Genetics 18(20): 3805-3821.
Twig, G., A. Elorza, A. J. Molina, H. Mohamed, J. D. Wikstrom, G. Walzer, L. Stiles, S. E. Haigh, S. Katz, G. Las, J. Alroy, M. Wu, B. F. Py, J. Yuan, J. T. Deeney, B. E. Corkey and
271
O. S. Shirihai (2008). "Fission and Selective Fusion Govern Mitochondrial Segregation and Elimination by Autophagy." The EMBO Journal 27(2): 433-446.
Tzoulis, C., P. S. Denora, F. M. Santorelli and L. A. Bindoff (2008). "Hereditary Spastic Paraplegia Caused by the Novel Mutation 1047insc in the Spg7 Gene." Journal of Neurology 255(8): 1142-1144.
Vaccaro, A., A. Tauffenberger, P. E. Ash, Y. Carlomagno, L. Petrucelli and J. A. Parker (2012). "Tdp-1/Tdp-43 Regulates Stress Signaling and Age-Dependent Proteotoxicity in Caenorhabditis Elegans." PLoS Genetics 8(7): e1002806.
Valsecchi, F., W. J. Koopman, G. R. Manjeri, R. J. Rodenburg, J. A. Smeitink and P. H. Willems (2010). "Complex I Disorders: Causes, Mechanisms, and Development of Treatment Strategies at the Cellular Level." Developmental Disabilities Research Reviews 16(2): 175-182.
Van Bergen, N. J., J. G. Crowston, L. S. Kearns, S. E. Staffieri, A. W. Hewitt, A. C. Cohn, D. A. Mackey and I. A. Trounce (2011). "Mitochondrial Oxidative Phosphorylation Compensation May Preserve Vision in Patients with Opa1-Linked Autosomal Dominant Optic Atrophy." PLoS One 6(6): e21347.
van Blitterswijk, M., M. A. van Es, E. A. Hennekam, D. Dooijes, W. van Rheenen, J. Medic, P. R. Bourque, H. J. Schelhaas, A. J. van der Kooi, M. de Visser, P. I. de Bakker, J. H. Veldink and L. H. van den Berg (2012). "Evidence for an Oligogenic Basis of Amyotrophic Lateral Sclerosis." Human Molecular Genetics 21(17): 3776-3784.
Van Den Bosch, L., P. Van Damme, E. Bogaert and W. Robberecht (2006). "The Role of Excitotoxicity in the Pathogenesis of Amyotrophic Lateral Sclerosis." Biochimica et Biophysica Acta 1762(11-12): 1068-1082.
Van Humbeeck, C., T. Cornelissen, H. Hofkens, W. Mandemakers, K. Gevaert, B. De Strooper and W. Vandenberghe (2011). "Parkin Interacts with Ambra1 to Induce Mitophagy." The Journal of Neuroscience : The Official Journal of the Society for Neuroscience 31(28): 10249-10261.
Van Laar, V. S. and S. B. Berman (2013). "The Interplay of Neuronal Mitochondrial Dynamics and Bioenergetics: Implications for Parkinson's Disease." Neurobiology of Disease 51: 43-55.
van Rheenen, W., M. van Blitterswijk, M. H. Huisman, L. Vlam, P. T. van Doormaal, M. Seelen, J. Medic, D. Dooijes, M. de Visser, A. J. van der Kooi, J. Raaphorst, H. J. Schelhaas, W. L. van der Pol, J. H. Veldink and L. H. van den Berg (2012). "Hexanucleotide Repeat Expansions in C9orf72 in the Spectrum of Motor Neuron Diseases." Neurology 79(9): 878-882.
Vance, C., B. Rogelj, T. Hortobagyi, K. J. De Vos, A. L. Nishimura, J. Sreedharan, X. Hu, B. Smith, D. Ruddy, P. Wright, J. Ganesalingam, K. L. Williams, V. Tripathi, S. Al-Saraj, A. Al-Chalabi, P. N. Leigh, I. P. Blair, G. Nicholson, J. de Belleroche, J. M. Gallo, C. C. Miller and C. E. Shaw (2009). "Mutations in Fus, an Rna Processing Protein, Cause Familial Amyotrophic Lateral Sclerosis Type 6." Science 323(5918): 1208-1211.
272

Vance, J. E. (1990). "Phospholipid Synthesis in a Membrane Fraction Associated with Mitochondria." The Journal of Biological Chemistry 265(13): 7248-7256.
Vaughan, P. S., P. Miura, M. Henderson, B. Byrne and K. T. Vaughan (2002). "A Role for Regulated Binding of P150(Glued) to Microtubule Plus Ends in Organelle Transport." The Journal of Cell Biology 158(2): 305-319.
Vicencio, J. M., C. Ortiz, A. Criollo, A. W. Jones, O. Kepp, L. Galluzzi, N. Joza, I. Vitale, E. Morselli, M. Tailler, M. Castedo, M. C. Maiuri, J. Molgo, G. Szabadkai, S. Lavandero and G. Kroemer (2009). "The Inositol 1,4,5-Trisphosphate Receptor Regulates Autophagy through Its Interaction with Beclin 1." Cell Death and Differentiation 16(7): 1006-1017.
Vijayvergiya, C., M. F. Beal, J. Buck and G. Manfredi (2005). "Mutant Superoxide Dismutase 1 Forms Aggregates in the Brain Mitochondrial Matrix of Amyotrophic Lateral Sclerosis Mice." J Neurosci 25(10): 2463-2470.
Vives-Bauza, C., C. Zhou, Y. Huang, M. Cui, R. L. de Vries, J. Kim, J. May, M. A. Tocilescu, W. Liu, H. S. Ko, J. Magrane, D. J. Moore, V. L. Dawson, R. Grailhe, T. M. Dawson, C. Li, K. Tieu and S. Przedborski (2010). "Pink1-Dependent Recruitment of Parkin to Mitochondria in Mitophagy." Proceedings of the National Academy of Sciences of the United States of America 107(1): 378-383.
Voigt, A., D. Herholz, F. C. Fiesel, K. Kaur, D. Muller, P. Karsten, S. S. Weber, P. J. Kahle, T. Marquardt and J. B. Schulz (2010). "Tdp-43-Mediated Neuron Loss in Vivo Requires Rna-Binding Activity." PLoS One 5(8): e12247.
Wakayama, I. (1992). "Morphometry of Spinal Motor Neurons in Amyotrophic Lateral Sclerosis with Special Reference to Chromatolysis and Intracytoplasmic Inclusion Bodies." Brain Research 586(1): 12-18.
Walker, A. K., M. A. Farg, C. R. Bye, C. A. McLean, M. K. Horne and J. D. Atkin (2010). "Protein Disulphide Isomerase Protects against Protein Aggregation and Is S-Nitrosylated in Amyotrophic Lateral Sclerosis." Brain : A Journal of Neurology 133(Pt 1): 105-116.
Walker, J. E., M. Saraste, M. J. Runswick and N. J. Gay (1982). "Distantly Related Sequences in the Alpha- and Beta-Subunits of Atp Synthase, Myosin, Kinases and Other Atp-Requiring Enzymes and a Common Nucleotide Binding Fold." The EMBO Journal 1(8): 945-951.
Wang, H. Y., I. F. Wang, J. Bose and C. K. Shen (2004). "Structural Diversity and Functional Implications of the Eukaryotic Tdp Gene Family." Genomics 83(1): 130-139.
Wang, I. F., N. M. Reddy and C. K. Shen (2002). "Higher Order Arrangement of the Eukaryotic Nuclear Bodies." Proceedings of the National Academy of Sciences of the United States of America 99(21): 13583-13588.
Wang, I. F., L. S. Wu, H. Y. Chang and C. K. Shen (2008). "Tdp-43, the Signature Protein of Ftld-U, Is a Neuronal Activity-Responsive Factor." Journal of Neurochemistry 105(3): 797-806.
273
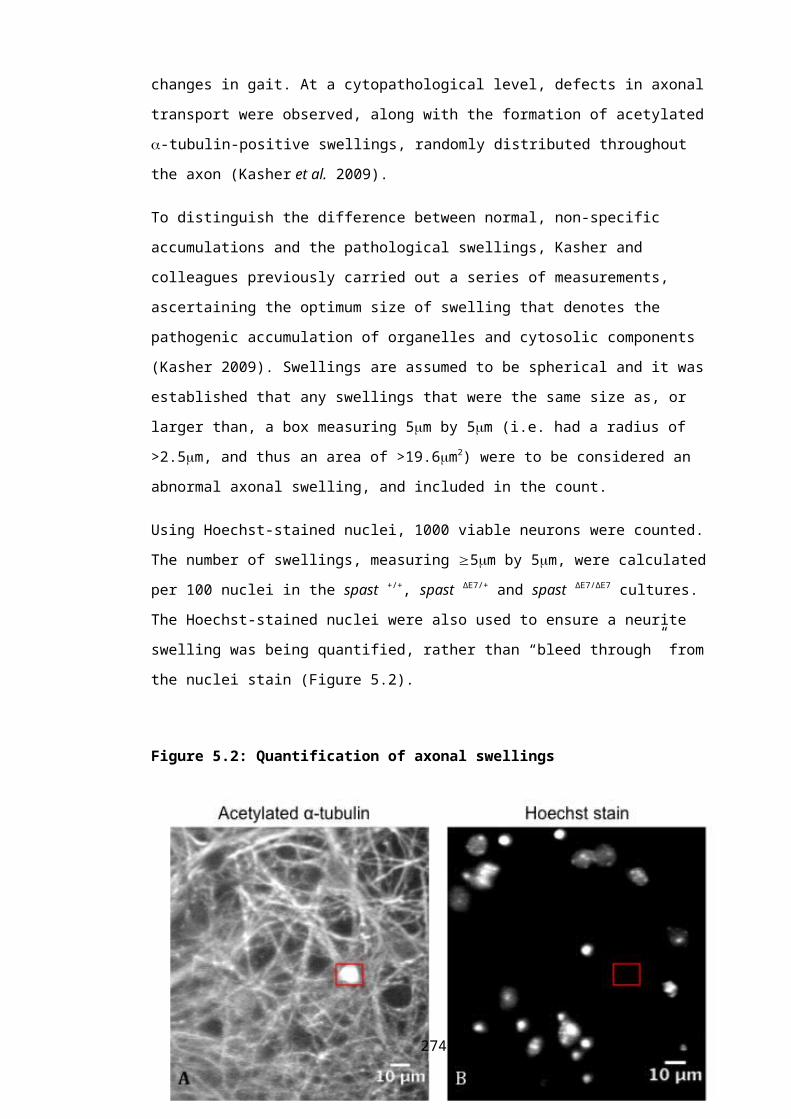
Wang, Q., Y. Zhang, C. Yang, H. Xiong, Y. Lin, J. Yao, H. Li, L. Xie, W. Zhao, Y. Yao, Z. B. Ning, R. Zeng, Y. Xiong, K. L. Guan, S. Zhao and G. P. Zhao (2010). "Acetylation of Metabolic Enzymes Coordinates Carbon Source Utilization and Metabolic Flux." Science 327(5968): 1004-1007.
Wang, X., H. Fan, Z. Ying, B. Li, H. Wang and G. Wang (2010). "Degradation of Tdp-43 and Its Pathogenic Form by Autophagy and the Ubiquitin-Proteasome System." Neuroscience Letters 469(1): 112-116.
Wang, X. and T. L. Schwarz (2009). "The Mechanism of Ca2+ -Dependent Regulation of Kinesin-Mediated Mitochondrial Motility." Cell 136(1): 163-174.
Wang, X., W. R. Shaw, H. T. Tsang, E. Reid and C. J. O'Kane (2007). "Drosophila Spichthyin Inhibits Bmp Signaling and Regulates Synaptic Growth and Axonal Microtubules." Nature Neuroscience 10(2): 177-185.
Wang, X., B. Su, H. G. Lee, X. Li, G. Perry, M. A. Smith and X. Zhu (2009). "Impaired Balance of Mitochondrial Fission and Fusion in Alzheimer's Disease." The Journal of Neuroscience : The Official Journal of the Society for Neuroscience 29(28): 9090-9103.
Wasiak, S., R. Zunino and H. M. McBride (2007). "Bax/Bak Promote Sumoylation of Drp1 and Its Stable Association with Mitochondria During Apoptotic Cell Death." The Journal of Cell Biology 177(3): 439-450.
Wasseff, S. K. and S. S. Scherer (2011). "Cx32 and Cx47 Mediate Oligodendrocyte:Astrocyte and Oligodendrocyte:Oligodendrocyte Gap Junction Coupling." Neurobiology of Disease 42(3): 506-513.
Wegorzewska, I., S. Bell, N. J. Cairns, T. M. Miller and R. H. Baloh (2009). "Tdp-43 Mutant Transgenic Mice Develop Features of Als and Frontotemporal Lobar Degeneration." Proc Natl Acad Sci U S A 106(44): 18809-18814.
Wharton, S. B., C. J. McDermott, A. J. Grierson, J. D. Wood, C. Gelsthorpe, P. G. Ince and P. J. Shaw (2003). "The Cellular and Molecular Pathology of the Motor System in Hereditary Spastic Paraparesis Due to Mutation of the Spastin Gene." Journal of Neuropathology and Experimental Neurology 62(11): 1166-1177.
White, S. R., K. J. Evans, J. Lary, J. L. Cole and B. Lauring (2007). "Recognition of C-Terminal Amino Acids in Tubulin by Pore Loops in Spastin Is Important for Microtubule Severing." The Journal of Cell Biology 176(7): 995-1005.
Whiteheart, S. W., K. Rossnagel, S. A. Buhrow, M. Brunner, R. Jaenicke and J. E. Rothman (1994). "N-Ethylmaleimide-Sensitive Fusion Protein: A Trimeric Atpase Whose Hydrolysis of Atp Is Required for Membrane Fusion." The Journal of Cell Biology 126(4): 945-954.
Wiedemann, F. R., G. Manfredi, C. Mawrin, M. F. Beal and E. A. Schon (2002). "Mitochondrial DNA and Respiratory Chain Function in Spinal Cords of Als Patients." J Neurochem 80(4): 616-625.
Wils, H., G. Kleinberger, J. Janssens, S. Pereson, G. Joris, I. Cuijt, V. Smits, C. Ceuterick-de Groote, C. Van Broeckhoven and S. Kumar-Singh (2010). "Tdp-43
274
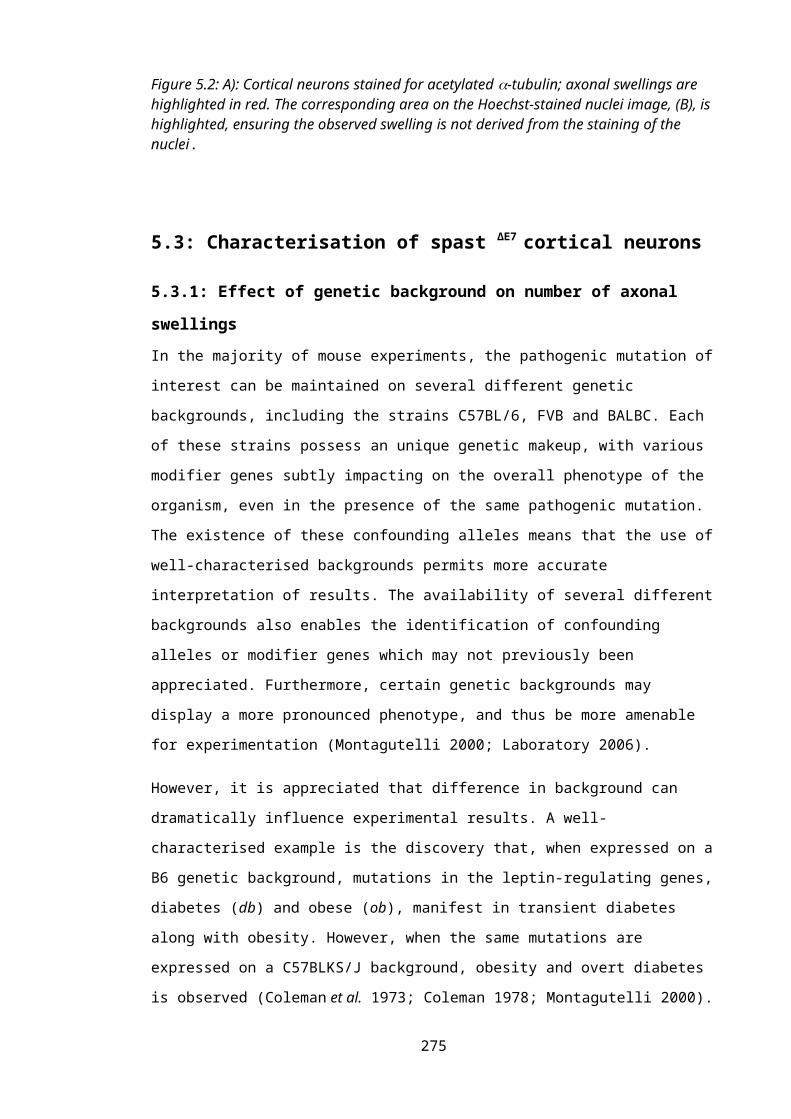
Transgenic Mice Develop Spastic Paralysis and Neuronal Inclusions Characteristic of Als and Frontotemporal Lobar Degeneration." Proceedings of the National Academy of Sciences of the United States of America 107(8): 3858-3863.
Winckler, B., P. Forscher and I. Mellman (1999). "A Diffusion Barrier Maintains Distribution of Membrane Proteins in Polarized Neurons." Nature 397(6721): 698-701.
Witt, M. R., O. Gredal, K. Dekermendjian, M. Unden and M. Nielsen (1994). "Calcium Homeostasis in Fibroblasts from Patients with Amyotrophic Lateral Sclerosis." J Neurol Sci 126(2): 206-212.
Wohlgemuth, S. E., A. Y. Seo, E. Marzetti, H. A. Lees and C. Leeuwenburgh (2010). "Skeletal Muscle Autophagy and Apoptosis During Aging: Effects of Calorie Restriction and Life-Long Exercise." Experimental Gerontology 45(2): 138-148.
Wong, P. C., C. A. Pardo, D. R. Borchelt, M. K. Lee, N. G. Copeland, N. A. Jenkins, S. S. Sisodia, D. W. Cleveland and D. L. Price (1995). "An Adverse Property of a Familial Als-Linked Sod1 Mutation Causes Motor Neuron Disease Characterized by Vacuolar Degeneration of Mitochondria." Neuron 14(6): 1105-1116.
Wong, P. C., J. D. Rothstein and D. L. Price (1998). "The Genetic and Molecular Mechanisms of Motor Neuron Disease." Current Opinion in Neurobiology 8(6): 791-799.
Wood, J. D., J. A. Landers, M. Bingley, C. J. McDermott, V. Thomas-McArthur, L. J. Gleadall, P. J. Shaw and V. T. Cunliffe (2006). "The Microtubule-Severing Protein Spastin Is Essential for Axon Outgrowth in the Zebrafish Embryo." Human Molecular Genetics 15(18): 2763-2771.
Wootz, H., I. Hansson, L. Korhonen and D. Lindholm (2006). "Xiap Decreases Caspase-12 Cleavage and Calpain Activity in Spinal Cord of Als Transgenic Mice." Experimental Cell Research 312(10): 1890-1898.
Wyllie, A. H., G. J. Beattie and A. D. Hargreaves (1981). "Chromatin Changes in Apoptosis." The Histochemical Journal 13(4): 681-692.
Xia, C. H., E. A. Roberts, L. S. Her, X. Liu, D. S. Williams, D. W. Cleveland and L. S. Goldstein (2003). "Abnormal Neurofilament Transport Caused by Targeted Disruption of Neuronal Kinesin Heavy Chain Kif5a." The Journal of Cell Biology 161(1): 55-66.
Xie, R., S. Nguyen, K. McKeehan, F. Wang, W. L. McKeehan and L. Liu (2011). "Microtubule-Associated Protein 1s (Map1s) Bridges Autophagic Components with Microtubules and Mitochondria to Affect Autophagosomal Biogenesis and Degradation." The Journal of Biological Chemistry 286(12): 10367-10377.
Xu, Y. F., T. F. Gendron, Y. J. Zhang, W. L. Lin, S. D'Alton, H. Sheng, M. C. Casey, J. Tong, J. Knight, X. Yu, R. Rademakers, K. Boylan, M. Hutton, E. McGowan, D. W. Dickson, J. Lewis and L. Petrucelli (2010). "Wild-Type Human Tdp-43 Expression Causes Tdp-43 Phosphorylation, Mitochondrial Aggregation, Motor Deficits, and Early Mortality in Transgenic Mice." The Journal of Neuroscience : The Official Journal of the Society for Neuroscience 30(32): 10851-10859.
275

Xu, Y. F., Y. J. Zhang, W. L. Lin, X. Cao, C. Stetler, D. W. Dickson, J. Lewis and L. Petrucelli (2011). "Expression of Mutant Tdp-43 Induces Neuronal Dysfunction in Transgenic Mice." Molecular Neurodegeneration 6: 73.
Xu, Z., C. Jung, C. Higgins, J. Levine and J. Kong (2004). "Mitochondrial Degeneration in Amyotrophic Lateral Sclerosis." J Bioenerg Biomembr 36(4): 395-399.
Yang, D., N. Rismanchi, B. Renvoise, J. Lippincott-Schwartz, C. Blackstone and J. H. Hurley (2008). "Structural Basis for Midbody Targeting of Spastin by the Escrt-Iii Protein Chmp1b." Nature Structural & Molecular Biology 15(12): 1278-1286.
Yang, S., S. T. Warraich, G. A. Nicholson and I. P. Blair (2010). "Fused in Sarcoma/Translocated in Liposarcoma: A Multifunctional DNA/Rna Binding Protein." The International Journal of Biochemistry & Cell Biology 42(9): 1408-1411.
Yoon, Y. S., D. S. Yoon, I. K. Lim, S. H. Yoon, H. Y. Chung, M. Rojo, F. Malka, M. J. Jou, J. C. Martinou and G. Yoon (2006). "Formation of Elongated Giant Mitochondria in Dfo-Induced Cellular Senescence: Involvement of Enhanced Fusion Process through Modulation of Fis1." Journal of Cellular Physiology 209(2): 468-480.
Yoshiyama, Y., T. Yamada, K. Asanuma and T. Asahi (1994). "Apoptosis Related Antigen, Le(Y) and Nick-End Labeling Are Positive in Spinal Motor Neurons in Amyotrophic Lateral Sclerosis." Acta Neuropathologica 88(3): 207-211.
Youle, R. J. and D. P. Narendra (2011). "Mechanisms of Mitophagy." Nature Reviews. Molecular Cell Biology 12(1): 9-14.
Yu, W. H., A. M. Cuervo, A. Kumar, C. M. Peterhoff, S. D. Schmidt, J. H. Lee, P. S. Mohan, M. Mercken, M. R. Farmery, L. O. Tjernberg, Y. Jiang, K. Duff, Y. Uchiyama, J. Naslund, P. M. Mathews, A. M. Cataldo and R. A. Nixon (2005). "Macroautophagy--a Novel Beta-Amyloid Peptide-Generating Pathway Activated in Alzheimer's Disease." The Journal of Cell Biology 171(1): 87-98.
Zampese, E., C. Fasolato, M. J. Kipanyula, M. Bortolozzi, T. Pozzan and P. Pizzo (2011). "Presenilin 2 Modulates Endoplasmic Reticulum (Er)-Mitochondria Interactions and Ca2+ Cross-Talk." Proceedings of the National Academy of Sciences of the United States of America 108(7): 2777-2782.
Zanetti, O., S. B. Solerte and F. Cantoni (2009). "Life Expectancy in Alzheimer's Disease (Ad)." Archives of Gerontology and Geriatrics 49 Suppl 1: 237-243.
Zarranz, J. J., I. Ferrer, E. Lezcano, M. I. Forcadas, B. Eizaguirre, B. Atares, B. Puig, J. C. Gomez-Esteban, C. Fernandez-Maiztegui, I. Rouco, T. Perez-Concha, M. Fernandez, O. Rodriguez, A. B. Rodriguez-Martinez, M. M. de Pancorbo, P. Pastor and J. Perez-Tur (2005). "A Novel Mutation (K317m) in the Mapt Gene Causes Ftdp and Motor Neuron Disease." Neurology 64(9): 1578-1585.
Zhang, C., D. Li, Y. Ma, J. Yan, B. Yang, P. Li, A. Yu, C. Lu and X. Ma (2012). "Role of Spastin and Protrudin in Neurite Outgrowth." Journal of Cellular Biochemistry 113(7): 2296-2307.
276
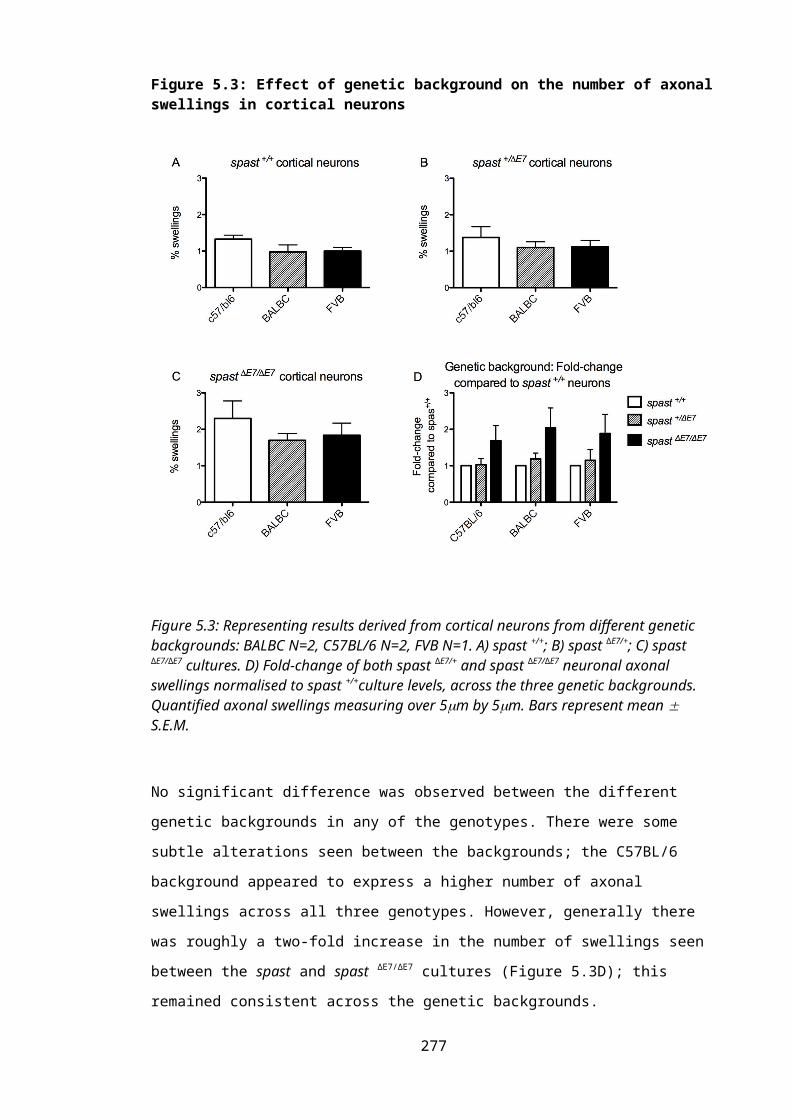
Zhang, D., G. C. Rogers, D. W. Buster and D. J. Sharp (2007). "Three Microtubule Severing Enzymes Contribute to the "Pacman-Flux" Machinery That Moves Chromosomes." The Journal of Cell Biology 177(2): 231-242.
Zhao, Z., D. J. Lange, A. Voustianiouk, D. MacGrogan, L. Ho, J. Suh, N. Humala, M. Thiyagarajan, J. Wang and G. M. Pasinetti (2006). "A Ketogenic Diet as a Potential Novel Therapeutic Intervention in Amyotrophic Lateral Sclerosis." BMC Neuroscience 7: 29.
Zimmermann, K. C., C. Bonzon and D. R. Green (2001). "The Machinery of Programmed Cell Death." Pharmacology & Therapeutics 92(1): 57-70.
Ziviani, E. and A. J. Whitworth (2010). "How Could Parkin-Mediated Ubiquitination of Mitofusin Promote Mitophagy?" Autophagy 6(5): 660-662.
Zoratti, M. and I. Szabo (1995). "The Mitochondrial Permeability Transition." Biochimica et Biophysica Acta 1241(2): 139-176.
Zorzano, A., M. Liesa and M. Palacin (2009). "Role of Mitochondrial Dynamics Proteins in the Pathophysiology of Obesity and Type 2 Diabetes." The International Journal of Biochemistry & Cell Biology 41(10): 1846-1854.
Zorzano, A., M. Liesa, D. Sebastian, J. Segales and M. Palacin (2010). "Mitochondrial Fusion Proteins: Dual Regulators of Morphology and Metabolism." Seminars in Cell & Developmental Biology 21(6): 566-574.
Zuchner, S., I. V. Mersiyanova, M. Muglia, N. Bissar-Tadmouri, J. Rochelle, E. L. Dadali, M. Zappia, E. Nelis, A. Patitucci, J. Senderek, Y. Parman, O. Evgrafov, P. D. Jonghe, Y. Takahashi, S. Tsuji, M. A. Pericak-Vance, A. Quattrone, E. Battaloglu, A. V. Polyakov, V. Timmerman, J. M. Schroder and J. M. Vance (2004). "Mutations in the Mitochondrial Gtpase Mitofusin 2 Cause Charcot-Marie-Tooth Neuropathy Type 2a." Nature Genetics 36(5): 449-451.
277