Embed Size (px)
Citation preview
Vol. 18: 175-185,1999 AQUATIC MICROBIAL ECOLOGY
Aquat Microb Ecol Published August 9
Abundance, biomass and growth rates of pelagic microorganisms in a tropical coastal ecosystem
Petra W a l l b e r g l . * , Per R. ~ o n s s o n ~ , Ron Johnstone'
'Department of Zoology. Stockholm University, S-106 91 Stockholm, Sweden 'Tjarno Marine Biological Laboratory, S-452 96 Stromstad, Sweden
ABSTRACT: In situ growth rates of ciliates and heterotrophic nanoflagellates were determined after size fractionation during rainy and dry seasons at 2 coastal stations off Zanzibar Island, Tanzania. In addition, bacterial and primary production and the biomass components in the pelagic microbial com- munity were measured. The bacterial and primary production, and growth rates of heterotrophic nanoflagellates were significantly higher during the rainy season. For the ciliate community the growth rate between the seasons did not differ, but the number of positive growth estimates increased by a fac- tor of 5 in the rainy seasons compared with the dry seasons. Further, the diversity of ciliates increased with the amount of rain, and the size distribution indicated a shift towards a community with larger spe- cies. Data obtained from these experiments are summarised in a carbon budget for each season. Car- bon budgets indicate that the carbon flow through the heterotrophic microbial food web was approxi- mately 3 times higher during the rainy season compared with the dry season. However, due to the relatively lower production of larger diatoms, heterotrophic microplankton may be relatively more important as a carbon source for higher trophic levels, such as copepods, during the dry season.
KEY WORDS: Ciliates . Microbial food web . Growth rates . Carbon budget . East Africa
INTRODUCTION
The composition and the production pattern of the plankton community are likely to influence the food- web structure of larger predators, nutrient cycling and the sinking flux. In general, stratified and oligotrophic pelagic ecosystems are to a higher extent based on a microbial food web (including bacteria, protozoa and autotrophic pico- and nanophytoplankton) in contrast to turbulent and nutrient-rich environments where a diatom-based food chain develops (Cushing 1989, Legendre & Rassoulzadegan 1995). However, the rela- tive dominance of a diatom-based food chain and the microbial food web varies in both space and time. For instance, microbial-web dominance usually increases from coastal areas to offshore (Kiarboe et al. 1990), and a bloom of larger phytoplankton is generally closely followed by the development of a microbial food web (Sorokin 1981).
The dominance of a microbial food web in olig- otrophic waters may partly be explained by the strong competition for nutrients that will select for small cells with large area-to-volume ratios. Therefore, nano- sized autotrophic flagellates and pico-sized cyanobac- teria are usually the major contributors to the ocean photosynthesis (Waterbury et al. 1979, Li et al. 1983). Heterotrophic bacteria growing on e.g. exudates from autotrophs may also successfully compete for nutrients in oligotrophic waters. For instance, in studies con- ducted in oceanic environments the biomass of het- erotrophic bacteria has been reported to even exceed autotrophic biomass (Fuhrman et al. 1989, Cho & Azam 1990, Roman et al. 1995). On a global scale bacterial abundance shows a low regional and seasonal varia- tion (Ducklow & Carlson 1992) which indicates a strong control of the bacterial community (Fenchel 1982). This control is fundamental for the coexistence of small and larger cells and can be due to substrate limitation or predation or the combined effect of both (Pengerud et al. 1987). Important predators of the very small cells at the food-web base are heterotrophic fla-
0 Inter-Research 1999

Aquat Microb Ecol 18: 175-185, 1999
gellates and ciliates (Andersen & Fenchel 1985, Sherr et al. 1989), which form a link to larger zooplankton, e.g. copepods (Jonsson & Tiselius 1990).
The generally nutrient-limited situations in tropical and subtropical areas suggest that the transport of car- bon from bacteria to higher trophic levels could be a significant pathway in these ecosystems. For instance, based on high C:chlorophyll ratios in faecal pellets Roman et al. (1995) reported that zooplankton ( ~ 2 0 0 pm) in the Sargasso Sea mainly consumed het- erotrophic carbon sources. Intense research over the past decades has considerably advanced our knowl- edge about pelagic ecosystems in temperate waters. From tropical ecosystems there are several studies on different components of the microbial food web (e.g. Gilron & Lynn 1989, Torreton et al. 1989, Stoecker et al. 1996), but limited data on the dynamics within micro- bial plankton communities (Roman et al. 1995, Recker- mann & Veldhuis 1997).
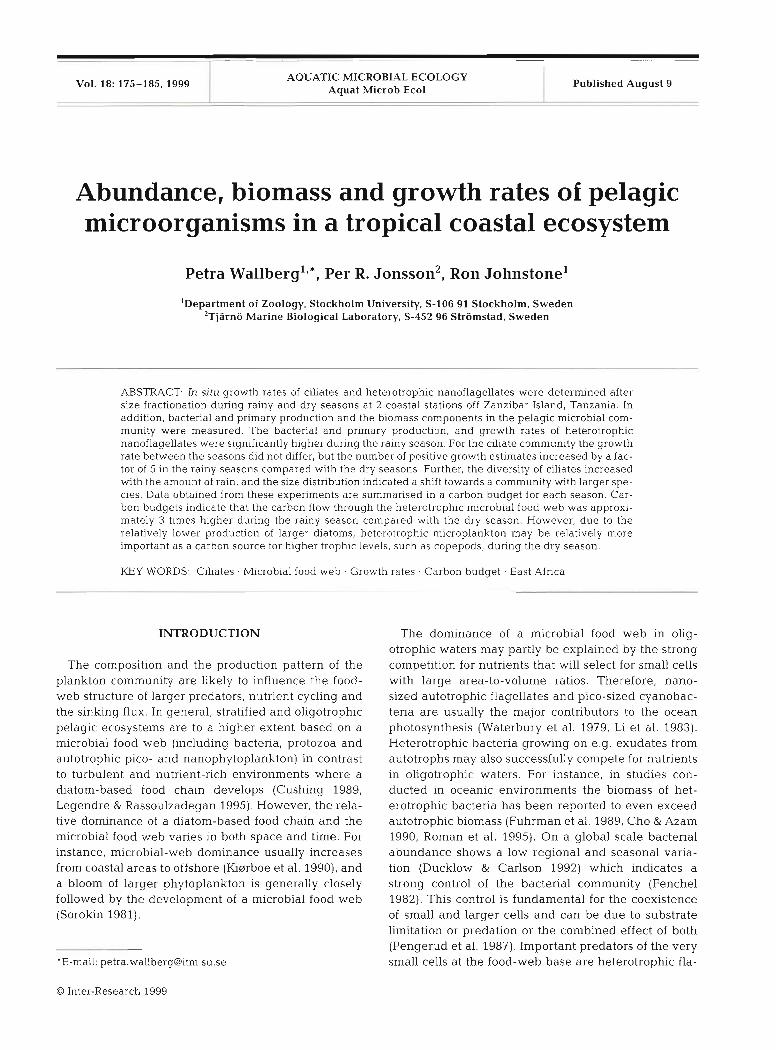
Although the seasonal variability in tropical and sub- Fig. 1. Tanzania and Zanzibar Island. The sampling stations, tropical oceans is not as pronounced as in temperate situated outside Zanzibar Town, are marked with an X
regions, the plankton community may exhibit a sea- sonal cycle. In the open seas the seasonality can be related to input of nutrients due to changes in the to get the largest contrast between the stations, sam- depth of the mixed layer (Roman et al. 1995), and in ples from the nearshore station were always collected nearshore areas to nutrient input from land, depending at low tide and samples from the offshore station at on the seasonality in rainfall (Gallegos et al. 1992, high tide. Hama & Handa 1994). The purpose of this study is to Nutrient analysis. For the determination of the con- describe the food-web structure and to quantify the centration of dissolved nutrients duplicate samples of carbon fluxes within the microbial community in a 50 m1 of seawater were filtered through a 0.45 pm coastal ecosystem off the coast of Zanzibar (Unguja) 25 mm Millex-HA filter that had been acid washed Island, Tanzania, and test for differences between the with 10% HCl and thoroughly rinsed with Milli-Q rainy and the dry seasons. water. Fifty m1 of unfiltered seawater was collected for
estimation of total nitrogen and phosphorus concentra- tions. Except for the analysis of ammonium, samples were stored frozen until analysis using an autoanalyser (Lachat Quick Chem 800). For measurements of ammonium concentrations, triplicate samples were preserved with phenol and analyzed directly after sampling according to Parsons et al. (1989) using a Shi- madzu - 1201 spectrophotometer.
Dissolved organic carbon (DOC). Duplicate 7 m1 samples of seawater were filtered through a 0.45 pm 25 mm Millex-HA filter that had been acid washed with 10% HC1 and thoroughly rinsed with Milli-Q water. Samples were preserved with 100 p1 1 M HC1. The samples were stored at 4OC until analyzed with a Shimadzu TOC 5000.
Particulate organic carbon (POC). Duplicate sam- ples (500 ml) were filtered onto a precombusted (450°C for 3 h) GF/F 25 mm glass fibre filter (Whatman). Fil- ters were then dried at 40°C overnight and stored frozen until analyzed with a Carlo Erba 1106 Elemen- tal Analyzer. The carbon content of non-filtered blank filters was subtracted from the filter samples.
MATERIAL AND METHODS
Sampling site. Zanzibar Island is situated off the Tanzanian coast (5"40'-6'30' S, 3g010'-39'35' E). The rainy seasons occur during March to May and October to November. The north-east monsoon blows from December to April and is characterised by higher air temperatures (>3OoC), lower wind speeds and calmer seas. The south-east monsoon blows from June to October and is by contrast characterised by cooler air temperatures (-25"C), higher wind speeds and rougher seas. The tidal amplitude varies between 0.9 and 4.6 m. Seawater was collected at 2 stations off Zanzibar town (Fig. 1). In this area there is no freshwa- ter supply from rivers but untreated sewage water is discharged into the coastal water. Each station was sampled twice on each sampling occasion in August 1995 and 1996 (dry season), and April 1996 and 1997 (rainy season) at 2.5 m depth. The depths at the sam- pling stations were 15 and 25 m, respectively. In order
2
Is: Prlson Is. X
.- 'G- ... ..
Chumbe Is. c

Wallberg et al.. Growth rates of tropical microorganisms
Picoplankton. Twenty m1 of seawater was preserved with formalin to a final concentration of 2.5 %. For enu- meration and measurement of picocyanobacteria, 10 m1 of seawater was collected on a 0.6 pm 25 mm polycarbonate filter (Poretics). For enumeration of het- erotrophic bacteria, 1 or 2 m1 of seawater was stained with DAPI (Porter & Feig 1980) and filtered through 0.2 pm 25 mm black polycarbonate filters (Poretics). Samples were counted in an epifluorescence micro- scope at 1200x magnification, using UV excitation light. At least 300 cells per filter were counted.
Abundances and growth rates of ciliates and het- erotrophic nanoflagellates. To estimate the abun- dance and growth rates of heterotrophic nanoflagel- lates (HNF) seawater was filtered by gravity through a 5 pm polycarbonate filter (Poretics) and triplicate sam- ples were incubated for 20 h in a water bath at ambient water temperature. Incident light was screened to 75 % I. by a neutral filter. At the start and at the end of the experiment, 10 m1 of live samples was stained with proflavine, fixed with ice-cold glutaraldehyde, and fil- tered onto 0.8 pm 25 mm black polycarbonate filters (Poretics) (Haas 1982). The filters were stored frozen and enumerated within 24 h in an epifluorescence microscope.
Abundance and growth rates of ciliates were mea- sured in size fractionated water samples. The seawater was filtered with reversed filtration through 200 pm and 50 pm sieves to remove larger predators. Triplicate samples were incubated for 24 h in 2.5 l polycarbonate bottles. Triplicate 1 1 samples from each fraction were preserved in 1 % acid Lugol's solution initially and at the end of each experiment. After 24 h, the fixed sam- ples were concentrated on a 10 pm mesh net and rinsed into 50 m1 containers. This method is quantita- tive according to Tiselius (1989). After overnight sedi- mentation half of the sedimentation chamber or at least 400 cells (not including the autotrophic Mesodinium rubra) were counted in an inverted microscope at 250x magnification. Identification of the ciliates to family or genus was based on Montagnes & Lynn (1991) and Marshal1 (1969).
Population growth rates ( p ) for HNF and ciliates were calculated from the changes in abundance, assuming exponential growth: p = ln[N(t)/N(O)]/t, where N(0) and N(t) are the mean number of cells at the start and at the end of the experiment, and t is the duration of the experiment. Ingestion rate was calcu- lated from the growth rate assuming complete het- erotrophy and a carbon gross growth efficiency of 30 % (e.g. Fenchel & Finlay 1983, Andersen & S~lrensen 1986, Wallberg & Andersson unpubl.).
Biomass estimations. The size of different taxonomic groups was measured under the microscope using an ocular micrometer (eukaryotic taxonomic groups 250
cells sample-', bacteria 2300 cells sample-'). The car- bon content of bacteria was calculated from data in Simon & Azam (1989) and pico- and nanoplankton according to Verity et al. (1992):
Heterotrophic bacteria:
logloC = -1.036 + 0.599(10gBV) Pico- and nanoplankton:
logloC = -0.363 + 0.863(10gBV)
RVis biovolume in pm3 cell-' and the carbon content (C) is given in pg C cell-'. The carbon content of cili- ates was calculated using a conversion factor of 0.19 pg C pm-3 (Putt & Stoecker 1989).
Mixotrophic ciliates. To get an estimate of the per- centage of mixotrophic ciliates, 1 seawater sample (225 ml) from each station was preserved with 20% formalin buffered with hexamethylenetetramine to a final concentration of 2% (Stoecker et al. 1989). 100 m1 was concentrated overnight in a settling chamber and ciliates in half of the chamber were examined with blue excitation light in an epifluorescence microscope. The samples collected in August 1995 were lost.
Other microplankton components. One litre of sea- water was preserved with l % acid Lugol's solution and thereafter treated as the samples for the estimation of ciliate growth rates. In this case the dominant phyto- plankton genera were identified and for the abun- dance of di.n.oflagellates 2 diagonals of th.e chamber (44.6 mm2) were scanned at 250x magnification.
Chlorophyll a. The concentration of chlorophyll a was determined according to Parsons et al. (1989). Duplicate samples of 2 1 of seawater were filtered onto 0.65 pm 47 mm Millipore membrane filters, extracted in 90% acetone overnight and measured using a Shi- madzu - 1201 spectrophotometer.
Primary production. Thirty m1 of seawater was gen- tly poured into polycarbonate bottles (Nalgene) and 5 pCi of s~dium( '~C)bicarbonate (0.1 mCi mmol-l) was added. Triplicate light and dark bottles were incubated from noon until sunset in a water bath at ambient tem- perature. The incident light was screened to 75 % I. by a neutral filter. Subsamples of 5 m1 were added to scin- tillation vials, acidified with 300 p1 of 6 M HCl and thereafter bubbled for 40 min. Fifteen m1 of scintilla- tion fluid Optiphase Hisafe 3 (Wallac) was added and the samples were counted in a Beckman LS1801 scin- tillation counter using a quench correcting program. Dissolved inorganic carbon concentration in the water was calculated from pH and salinity (Parsons et al. 1989).
Bacterial production. The bacterial production was determined using the tritiated thymidine method as modified by Smith & Azam (1992). Tritiated thymidine (46 Ci mmol-l) was added to a final concentration of 20 nM, which was at the level of saturation. The con-

Aquat Microb Ecol 18: 175-185, 1999
version factor for the number of cells produced per m01 thymidine incorporated was estimated according to Kirchman & Ducklow (1993) and determined to be 1.3 X 10''. The production in terms of carbon biomass (pg C 1-l) was calculated by multiplying the number of cells produced by the average cell carbon content. The bacterial production was assumed to be constant over a 24 h period and carbon gross growth efficiency to be 50 % (Ducklow & Carlson 1992).
Statistical analysis. As the experimental set up was not designed to test for differences between the sta- tions, these data were pooled. The differences of bio- logical and chemical parameters between the seasons were statistically tested using a l-factor analysis of variance (ANOVA). Homogeneity of the variances was checked for with Cochran's test (Winer et al. 1991). An ci of 0.05 was used in all statistical tests.
RESULTS
Hydrography and nutrients
The temperature in the water column varied between 25 and 2g°C, with the lowest measurements recorded during the dry seasons (August; Table 1). The variation within the seasons was 51°C. The rainfall during the sampling periods was 14 times higher dur-
Table 1. Average values of environmental variables during the sampling penods
Month and Temp Rainfall PH year ("'4 (mm mo-')
August 1995 25 57 8.1 August 1996 26 11 8.3 Apnl 1996 29 259 8.2 April 1997 28 369 8.1
Table 2. Average values with standard deviations of nutrient and chlorophyll a concentrations during the rainy and dry
seasons, respectively. All values are given in pg 1-'
Parameter Rainy season Dry season
Phosphate Nitrate Ammonia Silica Total N Total P DOC POC Chlorophyll a
Rainy Dry
Season
Fig. 2. Biomasses of heterotrophic microorganisms and pico- cyanobacteria during the sampling seasons. Error bars show
the standard deviation
ing the rainy seasons (April) than during the dry sea- sons (Directorate of Meteorology, Zanzibar). Although the highest concentrations of ammonium and phospho- rus were measured during the rainy seasons, only sil- ica was significantly different (p = 0.002; Table 2), with lower values during the rainy compared with the dry seasons. In contrast, the concentration of total nitrogen as well as POC were significantly higher during the rainy seasons (total N, p = 0.035; POC, p = 0.001). The concentration of total phosphorus did not significantly differ between the seasons (p = 0.2), although the high- est concentrations were measured during the rainy seasons.
Plankton biomass
Changes in the nutrient concentration in the water may translate into changes in the biomass at different trophic levels. In this study the abundance and bio- mass of heterotrophic bacteria, nanoflagellates and cil- iates did not differ between the seasons (Fig. 2). The highest abundances of heterotrophic bacteria was measured during the rainy season in 1996 with 3.6 to 4.6 X log cells I-' at the nearshore station; this coincided with relatively higher ammonium concentrations. In contrast, for the picocyanobacteria the highest recorded values occurred during the dry season in 1995 with 1.5 to 1.6 X 10⁸ cells 1-l, and this coincided with the highest abundances of HNF (5.6 to 5.8 X 10⁶ cells I-'). An analysis of the correlation between the abundances of cyanobacteria and HNF gave a coeffi- cient of 0.65 (Spearman rank correlation, p = 0.006; Fig. 3). If the outlier (i.e. the point to the lower right of the major cluster) is excluded, this correlation in- creases to 0.78 (Spearman rank correlation, p =

Wallberg et al.. Growth rates of tropical rmcroorganisms
Fig. 3. Correlations between the abundances of heterotrophic nanoflagellates (HNF) and picocyanobacteria, and between
HNF and heterotrophic bacteria
0.0008). The corresponding correlation coefficient for the abundance of bacteria and HNF was 0.03 (Spear- man rank correlation, p = 0.4; Fig. 3).
The most dominant groups of ciliates belonged to Strombidiidae (Laboea, Strornbidium and Tontonia) and to the suborders Strobilidina and Tintinnina. The highest abundance of ciliates occurred during the rainy season in 1996 with 5700 cells I-', but similar val- ues were also obtained during the dry season (e.g. 4200 cells 1-' in 1995). Chloroplast containing ciliates (excluding Mesodinium rubra) constituted on average 31 % (range 19 to 461") of the total ciliate community and mainly belonged to the family Strombidiidae. Abundances of tintinnids varied between 37 and 285 cells 1-', with the highest values occurring during the rainy seasons. Abundant tintinnid species included Tintinnopsis spp., Cordonellopsis ecauda fa, C. contracta, Protorhabdonella curta, Rhabdonella brandti, R. hebe, Epiplocyloides brandti, Amphorides minor, A . quadrilineata, Amphorellopsis acuta, Dada- yiella ganymedes, Eutintinnus spp. and Salpingella spp. Although the abundance of ciliates did not signif- icantly differ between the seasons, the size distribution indicated a shift towards a community with larger spe- cies as the level of rainfall increased. During the rainy
Rainy Dry
Season
Fig. 4. Size distribution of ciliates during the rainy and dry seasons
seasons ciliates in the size range >35 pm constituted 50% of the biomass whilst the corresponding value during the dry seasons was 30% (Fig. 4 ) . Also, the diversity showed a tendency to increase with the amount of rainfall (Fig. 5).
The abundance of dinoflagellates varied between 1 and 3 X 10³ cells 1-' and was dominated by the genera Protoperidinium, Gyrodinium, Gymnodinium and Cer- atiurn. The microphytoplankton was mainly dominated by diatoms such as Chaetoceros spp., Rhizosolenia
Aug -96 Aug -95 April -96 April -97 Season
Increasing ramfall
Fig. 5. Composition of the ciliate community correlated to the amount of rainfall. The sampling seasons are ordered accord- ing to an increasing amount of rainfall towards the right in the
figure

180 Aquat Microb Ecol 18: 175-185, 1999
spp., Hemialus spp., Bactenastum furcatum, Pleu- rosiqma spp., Thalassionema nitzschioides, Thalas- sionema frauenfeldii, and Guinardia spp. Blooms of the filamentous cyanobacteria Trichodesrnium spp. occurred in April, a phenomenon previously observed at this time of the year (Lugomela & Semesi 1996 and references therein). The variation in biomass of auto- trophic plankton was estimated with chlorophyll a and did not significantly differ between the seasons (p =
0.7; Table 2).
Plankton production
Variations in nutrient concentration may influence the growth rate of autotrophs and heterotrophic bade- Fig. 7. Percentage of chate taxa (Strobilidiidae spp., Tintin- ria, with effects extending to higher trophic levels. Sig- nina spp., Strornbidhdae spp., Scuticociliatida, Prostomatida, nificantly higher production rates were obtained dur- Monodinium spp.), grouped in 3 different size classes (<20.
ing the rainy seasons both for the primary (P = 0.004) 20-35 and >35 pm). showing detectable growth rates corre- lated with the amount of rainfall and the bacterial production (p = 0.031; Fig. 6). The pri-
mary production was on average almost 6 times and the bacterial production 7 times higher during the rainy seasons compared with the dry seasons. The ing the dry seasons compared to the rainy seasons higher primary production rates were also reflected by (Fig. 7) . For instance, no positive growth rates were the significantly lower concentrations of silica during obtained at the offshore station during the dry seasons. the rainy season. With increasing rainfall an increasing number of incu-
For HNF the growth rate was significantly higher bations resulted in positive growth rates, in particular during the rainy seasons (p = 0.006). The specific for the larger ciliates. A bloom of the ciliate Laboea sp. growth rates varied between 0.0 and 0.6 d-' (average occurred on 1 sampling occasion during the rainy sea- 0.3 d-') during the dry seasons and between 0.2 and son in 1996 at the nearshore station, which coincided 2.5 d-' (average 1 . 2 d-') during the rainy seasons. Thus, with the highest estimated growth rates for ciliates and the highest growth rates of HNF did not coincide with HNF, and the highest abundance and production of the highest abundances. In contrast to the growth rates heterotrophic bacteria. On this occasion the only posi- of HNF, the growth rates of ciliates did not differ tive growth rates for ciliates within the taxa Tintinnina between the seasons; however, the number of positive (Favella azonca), Strobilidina and Strombidiidae estimates of growth rates was considerably fewer dur- >35 pm were obtained (Table 3).
Rainy Dry
Season
Fig. 6. Average values of the primary and bacterial production during the rainy and dry seasons. Error bars shows the stan-
dard deviation
Table 3. Summary of data for the range of specific growth rates for different taxa and size classes of ciliates obtalned in
this study. Average values are given withln parentheses
Cell volume Specific growth rate (pm3) (d- ')
Strobilidiidae
Strombidiidae
Tin tinnina
Scut~cociliati.da
Prostomatida
Monodinium spp

Wallberg et al.: Growth rat es of tropical microorganisms 181
DISCUSSION
Control of the plankton community
In tropical and subtropical nearshore areas varia- tions within the plankton community can be related to input of nutrients from land, depending on the season- ality in rainfall (Gallegos et al. 1992, Hama & Handa 1994). In this study the concentrations of dissolved inorganic nutrients, apart from silica, were not signifi- cantly different between the 2 seasons. This may reflect that the turnover of nutrients was rapid since concentrations of total nitrogen and POC were twice as high during the rainy season. Further, the significantly lower concentration of silica coincided with a higher primary production. For heterotrophic microorganisms the difference between the studied seasons mainly occurred as an increase in growth rates rather than in abundance and biomass. This indicates that there was a tight coupling between different components of the microbial food web. In a modelling approach to assess the control of the abundance of heterotrophic bacteria (Sanders et al. 1992) and HNF (Gas01 1994), it was con- cluded that these communities are mainly controlled by resource limitation in oligotrophic environments and by predation in nutrient-rich systems. The weak correlation between heterotrophic bacteria and HNF in this study suggests that the bacterial abundance was controlled by substrate availability, and that HNF was also dependent on food sources other than hetero- trophic bacteria. This latter hypothesis is supported by the relatively high correlation between the abun- dances of HNF and cyanobacteria in comparison with the lack of correlation between the abundances of HNF and heterotrophic bacteria.
For ciliates the threshold concentration for survival ranges between 10 and 100 pg C I-', which is near or above average typical prey biomass levels in the sea (Montagnes 1996). This indicates that the abundance of ciliates is mainly controlled by the availability of prey. However, data from Danish coastal waters indi- cate that the ciliate community can also be predator controlled (Nielsen & Kiarboe 1991). It is possible that this reflects that food generally limits ciliate abun- dance but that top-down control increases in impor- tance as a regulating factor in more nutrient-enriched systems.
sons. In laboratory cultures it has been demonstrated that when the food is not limiting, ciliate growth rates are closely correlated with cell size (Fenchel 1968, Fin- lay 1977) and temperature (Finlay 1977, Verity 1985). Comparison of in situ ciliate growth rates with growth models derived from cell size and ambient tempera- ture could therefore indicate the degree to which the growth of natural ciliate populations may be limited by food availability. Montagnes (1996) compared labora- tory-derived data on the growth rates of species of Strobilidium and Strombidiun~ and values obtained from predictive formulas. The predictive equation sug- gested by Miiller & Geller (1993) was found to agree best with observed growth rates. This equation was therefore used on data from this study to compare the observed and predicted growth rates for Strobilidium spp. with the assumption that the p,,, of these species show a similar functional dependence on size and tem- perature. The formula used was:
where p,,, is the maximum growth rate, d-'; Tis tem- perature, "C; and Vis ciliate cell volun~e, All the predicted values were higher than the present esti- mates by a factor of 1.6 to 3.5 (Table 4). When testing the equation by Muller & Geller (1993), Montagnes (1996) found that the main source of over-prediction of growth rate was related to temperatures >20°C, which may explain some of the differences between the pre- dicted and the estimated p,,,. The largest difference between the predicted and the estimated p,,, occurred for the smallest cells. In fact, estimated p,,, values did not vary between the size groups. Differ- ences between the size classes were more reflected by the fact that only the smaller-sized ciliate group showed positive growth rates during the most nutrient- constrained situations, i.e. the dry seasons and at the offshore station.
The increase in the number of positive growth rates with increasing rainfall may reflect changes in produc- tion, as well as composition, of the food sources. Fur- ther, methodological problems for estimation of proto-
Table 4. Predicted growth rate according to Miiller & Geller (1993), and the in situ estimated growth rate for Strobilidium spp. of 2 different cell volumes at 25'C (dry season) and 29°C
(rainy season)
Control of ciliate growth rate
Estimated growth rates for ciliates were within the range reported from other areas (Gilron & Lynn 1989, Pierce & Turner 1992), but, in contrast to other groups, growth rate for ciliates did not differ between the sea-
Cell volume Temperature Predicted p,,, Estimated p,,, (vnl3) ("C) (d-'1 (d-'1

182 Aquat Microb Ecol 18: 175-185, 1999
zoan growth rates must be considered. For instance, the fractionation method assumes that mortality is solely caused by larger predators that are removed by filtration. Nielsen & Ki~rboe (1991) suggested that sim- ilarly sized predators such as heterotrophic dinoflagel- lates, which feed on smaller ciliates, will cause an underestimate of the growth rate of small ciliates rela- tive to larger ciliates. Consequently, growth rates of ciliates, as well as those of HNF, calculated from in situ incubations can therefore, at best, be considered as
Rainy Season
conservative. However, the 5-fold increase in the num- ber of positive growth rates and the higher number of positive estimates for the ciliates in the larger size group during the rainy seasons indicate that the ciliate community is controll.ed by food rather than by tem- perature or predators. This conclusion is also sup- ported by the observation that the shift in the size dis- tribution towards a community with larger ciliates coincided with an increase in the production of both heterotrophic and autotrophic plankton.
Phyroplankron >l0 pm Ciliates
Nanophpoplankton 2-10 pm 1 0 . 8 7
Cyanobacreria < 2 pm 1 , " " g 6
/
I Hererotrophic Bacteria 1 14
DOC 1500
Dry Season
DOC 1400
/
Fig. 8. Budgets for the flow of carbon through the microbial food web during the rainy and dry seasons investigated in the present study. Inward- and autward- going arrows represent consumption, production and respiration (pg C 1.' d-'). In the boxes the number to the right represents the carbon demand estimated from the obtained production rates, and the number to the left represents the net
production of the assumed prey
Phyroplankron >l0 pm
Nanophy~oplank~o~~ 2-10 pm
Cyanobacterla < 2 pm
A preliminary carbon budget
Ciliates 12
HNF 12
The data obtained in this study were used to establish a preliminary carbon budget between bacteria, HNF, cili- ates and phytoplankton for the dry and the rainy seasons, respectively (Fig. 8). The data that were used to calculate the magnitude of the different fluxes are presented in Table 5. In this study the fractionated primary production was not measured. However, the aver- age total primary production is similar to the total primary production obtained in diel experiments (105 pg C 1-' d-' during a rainy season and 19 pg C 1-' d-I during a dry season; Wallberg & Andersson unpubl.) when fraction- ated primary production was mea- sured. From the diel experiments the percentage distribution between the size classes was used to get an esti- mate of the production of cyanobacte- ria (10 and 50% during the rainy and dry seasons, respectively), nanophyto- plankton (30 and 40% during the rainy and dry seasons, respectively), and phytoplankton > l 0 pm (60 and 10% during the rainy and dry seasons, respectively).
The production of heterotrophic bac- teria amounted to approximately 10% of the primary production. This sug- gests that the bacterial production could have phytoplankton as the only source for DOC (Ducklow & Carlson 1992). The production of heterotrophic bacteria and cyanobacteria balances the HNF carbon demand better during the dry seasons than estimates from the rainy seasons. It is possible that the estimates of the diel production of het- erotrophic bacteria are underesti-
Hercrorroph~c Bacreria
? 4 4.2 4.2
i. W

Wallberg et al.: Growth rates of tropical microorganisms 183
Table 5. Summary of data for the flow of carbon within the microbial food web during the rainy and dry seasons studied. The val- ues for the bacterial and the primary net production are the average values measured during the seasons. The net production of HNF and ciliates was calculated by using the averages of the estimated specific growth rates obtained for each season. The gross
growth efficiency was assumed to be 30 % for protozoa and 50 % for bacteria
Taxon Standing stock Specific growth rate Net production Carbon consumption (pg c I-') (pg C 1-X d-') (pg C l-l d-l)
Dry Rainy Dry Rainy Dry Rainy Dry Rainy
Autotrophic Cyanobactena 7 + 5 6 r 3 11 12 Nanoplankton 8 36 Microplankton 2 72 Total 21 k 15 1 2 0 r 7 3
Heterotrophic Bacteria 1 7 k 6 4 0 2 4 1 2 - t 2 1 4 + 1 9 4 28 Nanoflagellates 1 2 6 9 r 5 0.3 1.2 3.6 10.8 12 36 Microplankton 4 k 2 5 + 2 0.9 0.9 3.6 4.5 12 15
mated as the production was extrapolated over 24 h. As the primary production and, hence, the production of phytoplankton exudates increase during the day, the bacterial production is likely to show a diel varia- tion (Hagstrom et al. 1988, Wallberg & Andersson unpubl.). Higher primary production during the rainy (Hama & Handa 1994, Wallberg & Andersson unpubl.) as compared to the dry seasons would also give more exudates, with the potential to support higher bacterial production rates. In line with this, results from experi- ments conducted in the same area suggest that the diel variation in bacterial production is higher during the rainy than the dry season (Wallberg & Andersson unpubl.).
Even though the bacterial diel production may be underestimated, the carbon budget implies that a sig- nificant part of the carbon demand by HNF might be supported by the picocyanobacteria. This uptake route could be particularly important during the dry seasons, when as much as 92% of the HNF carbon demand potentially could be met by cyanobacteria. The corre- sponding value for the rainy seasons was 33%. Although the production of cyanobacteria was not directly measured and may be overestimated, the importance of cyanobacteria as a carbon source for HNF is supported by the relatively high correlation between the abundance of cyanobacteria and HNF. Similarly, Hagstrom et al. (1988) estimated that 57 % of HNF carbon demand was met by cyanobacteria in the Mediterranean Sea. Also, in the Arabian Sea Recker- mann & Veldhuis (1997) estimated that HNF could sat- isfy their carbon demand exclusively from picophyto- plankton.
The carbon budget suggests that 30 to 100% of the nanoflagellate fraction was consumed by ciliates, with the lowest percentage estimated for the rainy season.
However, it is unlikely that food sources would be idle assets in an oligotrophic environment. Due to the methodological problems described above, the ciliate production may have been underestimated. In addition to ciliates, heterotrophic dinoflagellates may also feed on nanoflagellates. The relative significance of these 2 protist groups as predators on nanoflagellates is still unclear but laboratory data suggest that dinoflagel- lates ingest prey that correspond to their own size most efficiently (Hansen 1992).
In summary, the results from this study indicate that the heterotrophic microorganisms increased their growth rate during the rainy season without major changes in biomass. The hypothesis that the bacterial production balances the carbon demand by HNF sug- gests that the carbon flow from heterotrophic and autotrophic bacteria via HNF to ciliates was approxi- mately 3 times higher during the rainy season com- pared to the dry season. In this context it is interesting to note that when the average of all ciliate growth rates (not only the positive growth rates) was calculated, the growth rate for the rainy season was 3 times higher than the average value for the dry season. However, in spite of a higher efficiency in the carbon flow during the rainy season, heterotrophic microplankton may have been more important as a carbon source for higher trophic levels during the dry season due to the relatively lower production of larger phytoplankton.
Acknowledgements. This work was supported by grants from the Swedish International Development Cooperation/Depart- ment for Research Cooperation (SIDAISAREC). We thank Anders Sjosten for the nutrient analyses and help with the POC and DOC analysis, the boatmen at the Institute of Marine Sciences, Zanzibar, for assistance during sampling, and the Directorate of Meteorology, Zanzibar, for the rainfall data. The use of laboratory facilities at the Institute of Marine Sciences, Zanzibar, is gratefully acknowledged.

Aquat Microb Ecol 18: 175-185, 1999
LITERATURE CITED
Andersen P, Fenchel T (1985) Bacterivory by micro- heterotrophic flagellates in seawater samples. Limnol Oceanogr 30:198-202
Andersen P, Ssrensen HM (1986) Population dynamics and trophic coupling in pelagic microorganisms in eutrophic coastal waters. Mar Ecol Prog Ser 33:99-109
Cho BC, Azam F (1990) Biogeochemical significance of bacte- rial biomass in the ocean's euphotic zone. Mar Ecol Prog Ser 63:253-259
Cushing DH (1989) A difference in structure between ecosys- tems in strongly stratified waters and in those that are only weakly stratified. J Plankton Res 11:l-13
Ducklow HW, Carlson CA (1992) Oceanic bacterial produc- tion. Adv Microb Ecol 12:113-181
Fenchel T (1968) The ecology of marine microbenthos. 111 The reproductive potential of ciliates. Ophelia 5:123-136
Fenchel T (1982) Ecology of heterotrophic microflagellates. IV Quantitative occurrence and importance as bacterial consumers. Mar Ecol Prog Ser 9:35-42
Fenchel T, Finlay BJ (1983) Respiration rates in heterotrophic free-living protozoa. Microb Ecol 9:99-122
Finlay BJ (1977) The dependence of reproductive rate on cell size and temperature in freshwater ciliated protozoa. Oecologia (Berl) 30:75-81
Fuhrman JA, Sleeter TD, Carlson CA, Proctor LM (1989) Dominance of bacterial biomass in the Sargasso Sea and its ecological implications. Mar Ecol Prog Ser 57:207-217
Gallegos CL, Jordan TE, CorreLl DL (1992) Event-scale response of phytoplankton to watershed inputs in a subestuary: timing, magnitude, and location of blooms. Lirnnol Oceanogr 37313-828
Gasol JM (1994) A frame work for assessment of top-down vs bottom-up control of heterotrophic nanoflagellate abun- dance. Mar Ecol Prog Ser 113:291-300
Gilron GL, Lynn DH (1989) Estimates of in situ population growth rates of four tintinnine ciliate species near Kin- stone Harbour, Jamaica. Estuar Coast Shelf Sci 29:l-10
Haas LW (1982) Improved epifluorescence microscopy for ob- serving planktonic micro-organisms. Ann Inst Oceanogr 58(Suppl):261-266
Hagstrijm A, Azam F, Andersson A, Wikner J , Rassoulzade- gan F (1988) Microbial loop in an oligotrophic pelagic marine ecosystem: possible roles of cyanobacteria and nanoflagellates in the organic fluxes. Mar Ecol Prog Ser 493171-178
Harna J , Handa N (1994) Variability of the biomass, chemical composition and productivity of phytoplankton in Kiru-ura bay, Japan during the rainy season. Estuar Coastal Shelf Sci 39:497-509
Hansen PJ (1992) Prey size selection, feeding rates and growth dynamics of heterotrophic dinoflagellates with special emphasis on Gyrodinium spirale. Mar Biol 114: 327-334
Jonsson PR, Tiselius P (1990) Feeding behaviour, prey detec- tion and capture efficiency of the copepod Acartia tonsa feeding on planktonic ciliates. Mar Ecol Prog Ser 60:35-44
fiwrboe T, Kaas H, Kruse B. Mshlenberg F. Tiselius P, Aerte- bjerg G (1990) The structure of the pelagic food web in relation to water column structure in the Skagerrak. Mar Ecol Prog Ser 59:19-32
Kirchman DL, Ducklow HW (1993) Estimating conversion fac- tors for the thymidine and leucine methods for measuring bacterial production. In: Kemp PF, Sherr BF, Sherr EB, Cole J J (eds) Handbook of methods in aquatic microbial ecology. Lewis Publishers, London, p 513-517
Legendre L, Rassoulzadegan F (1995) Plankton and nutrient dynamics in marine waters. Ophelia 4 1: 153-172
Li WKW, Subba Rao DV, Harrison WG, Smith JC, Cullen JJ , Irwin B, Platt T (1983) Autotrophic picoplankton in the tropical ocean. Science 219:292-295
Lugomela CV, Semesi AK (1996) Spatial and temporal varia- tions In phytoplankton in Zanzibar near shore waters. In: Bjork M, Semesi AK, Pedersen M, Bergman B (eds) Cur- rent trends in marine botanical research in the East Africa region. SIDA/Department for Research Cooperation, Stockholm, p 235-251
Marshall SM (1969) Protozoa order: Tintinnida. Fich Ident Zooplancton, Charlottenlund, p 117-124
Montagnes DJS (1996) Growth responses of planktonic cili- ates in the genera Strobilidium and Strombidium. Mar Ecol Prog Ser 130:241-254
Montagnes DJS, Lynn DH (1991) Taxonomy of Choreotrichs, the major marine planktonic ciliates, with emphasis on the aloricate forms. Mar Microb Food Webs 5:59-74
Miiller H, Geller W (1993) Maximum growth rates and aquatic ciliated protozoa: the dependence on body size and temperature reconsidered. Arch Hydrobiol 126: 315-327
Nielsen TG, Kierrboe T (1991) Effects of a storm event on the structure of the pelagic food web with special emphasis on planktonic ciliates. J Plankton Res 13:35-51
Parsons R, Maita Y. Lalli CM (1989) A manual of chemical and biologcal methods for seawater analysis. Pergamon Press, Oxford, p 14-17, 141-149
Pengerud B, Skjoldal EF, Thingstad TF (1987) The reciprocal interaction between degradation of glucose and ecosys- tem structure. Studies in mixed chemostat cultures of marine bacteria, algae, and bacterivorous nanoflagellates. Mar Ecol Prog Ser 35:lll-117
Pierce RW, Turner JT (1992) Ecology of planktonic ciliates in marine food webs. Rev Aquat Sci 6:139-181
Porter KG, Feig Y (1980) The use of DAPI for identifying and counting aquatic microflora. Limnol Oceanogr 25: 943-948
Putt M, Stoecker DK (1989) An experimentally determined carbon-volume ratio for marine oligotrichous ciliates from estuarine and coastal waters. Limnol Oceanogr 34: 1097-1103
Reckermann M, Veldhuis MJW (1997) Trophic interactions between picophytoplankton and micro- and nanozoo- plankton in the western Arabian Sea during the NE mon- soon 1993. Aquat Microb Ecol 12:263-273
Roman MR, Caron DA, Kremer P, Lessard EJ. Madin LP, Mal- one TC, Napp JM, Peele ER, Youngbluth MJ (1995) Spa- tial and temporal changes in the partitioning of organlc carbon in the plankton community of the Sargasso Sea off Bermuda. Deep-Sea Res 42:973-992
Sanders RW, Caron, DA, Berninger UG (1992) Relationship between bacteria and heterotrophic nanoplankton in marine and fresh waters: an inter-ecosystem comparison. Mar Ecol Prog Ser 86:l-14
Sherr BF, Sherr EB. Pedros-Alio C (1989) Simultaneous mea- surement of bacterioplankton production and protozoan bacterivory in estuarine water. Mar Ecol Prog Ser 54: 209-219
Sirnon M, Azam F (1989) Protein content and protein synthe- sis rates of planktonic marine bacteria. Mar Ecol Prog Ser 51:201-213
Smith DC, Azam F (1992) A simple economical method for measuring bacterial protein synthesis rates in seawater using 3~- leuc ine . Mar Microb Food Webs 6:107-114
Sorokin YI (1981) Microheterotrophic organisms in marine

Wallberg et al.. Growth rates of tropical microorganisms
ecosysten1s. In: Longhurst AR (ed) Analysis of marine ecosystems. Academic Press, London, p 293-342
Stoecker DK, Taniguchi A, Michaels AE (1989) Abundance of autotrophic, rnixotrophic and heterotrophic planktonic cil- iates in shelf and slope waters. Mar Ecol Prog Ser 50: 24 1-254
Stoecker DK, Gustafson DE, Verity PG (1996) Micro- and mesoprotozooplankton at 140°W in the equatorial Pacific: heterotrophs and mixotrophs. Aquat Microb Ecol 10: 273-282
Tiselius P (1989) Contribution of aloricate ciliates to the diet of Acartia clausi and Centropages hamatus in coastal waters. Mar Ecol Prog Ser 56:49-56
Torreton JP, Guiral D, Arfi R (1989) Bacterioplankton biomass
Editorial responsibility: Tom Fenchel, Helsing~r, Denmark
and production during destratification in a mononlictic eutrophic bay of a tropical lagoon. Mar Ecol Prog Ser 57: 53-67
Verity PG (1985) Grazing, respiration, excretion, and growth rates of tintinnids. Limnol Oceanogr 30: 1268-1 282
Verity PG, Robertson CY, Tonzo CR, Andrews MG, Nelson JR, Sieracki ME (1992) Relationships between cell volume and the carbon and nitrogen content of marine photosyn- thetic nanoplankton. Limnol Oceanogr 37:1434-1446
Waterbury JB, Watson SW, Guillard RRL, Brand LE (1979) Widespread occurrence of a unicellular, marine plank- tonic, cyanobacterium. Nature 227:293-294
Winer BJ, Brown DR, Michels KM (1991) Statistical principles in experimental design. McGraw-Hill, New York
Submitted: February 26,1998; Accepted: December 21, 1998 Proofs received from author(s): July 19, 1999