Embed Size (px)
Citation preview

AC-Induced Bias Potential
Effect on Corrosion of Steels
J.E. Jackson, A.N. Lasseigne, D.L. Olson, and B. Mishra
Feb. 5, 2009
G2MTGeneration 2 Materials Technology LLC

Report Documentation Page Form ApprovedOMB No. 0704-0188
Public reporting burden for the collection of information is estimated to average 1 hour per response, including the time for reviewing instructions, searching existing data sources, gathering andmaintaining the data needed, and completing and reviewing the collection of information. Send comments regarding this burden estimate or any other aspect of this collection of information,including suggestions for reducing this burden, to Washington Headquarters Services, Directorate for Information Operations and Reports, 1215 Jefferson Davis Highway, Suite 1204, ArlingtonVA 22202-4302. Respondents should be aware that notwithstanding any other provision of law, no person shall be subject to a penalty for failing to comply with a collection of information if itdoes not display a currently valid OMB control number.
1. REPORT DATE 05 FEB 2009 2. REPORT TYPE
3. DATES COVERED 00-00-2009 to 00-00-2009
4. TITLE AND SUBTITLE AC-Induced Bias Potential Effect on Corrosion of Steels
5a. CONTRACT NUMBER
5b. GRANT NUMBER
5c. PROGRAM ELEMENT NUMBER
6. AUTHOR(S) 5d. PROJECT NUMBER
5e. TASK NUMBER
5f. WORK UNIT NUMBER
7. PERFORMING ORGANIZATION NAME(S) AND ADDRESS(ES) Generation 2 Materials Technology LLC,10281 Foxfire St,Firestone,CO,80504
8. PERFORMING ORGANIZATIONREPORT NUMBER
9. SPONSORING/MONITORING AGENCY NAME(S) AND ADDRESS(ES) 10. SPONSOR/MONITOR’S ACRONYM(S)
11. SPONSOR/MONITOR’S REPORT NUMBER(S)
12. DISTRIBUTION/AVAILABILITY STATEMENT Approved for public release; distribution unlimited
13. SUPPLEMENTARY NOTES 2009 U.S. Army Corrosion Summit, 3-5 Feb, Clearwater Beach, FL
14. ABSTRACT
15. SUBJECT TERMS
16. SECURITY CLASSIFICATION OF: 17. LIMITATION OF ABSTRACT Same as
Report (SAR)
18. NUMBEROF PAGES
37
19a. NAME OFRESPONSIBLE PERSON
a. REPORT unclassified
b. ABSTRACT unclassified
c. THIS PAGE unclassified
Standard Form 298 (Rev. 8-98) Prescribed by ANSI Std Z39-18

Overview Introduction
Background
Literature review
Magnetocorrosion JIP
Proposed AC Corrosion Models
AC Simulated Corrosion testing
Stainless steel pipe and coating
Cathodic protection
Experimental Setup
Preliminary test arrangement
Current test arrangement
Experimental analysis techniques
Assessment of Models
Proposed Research
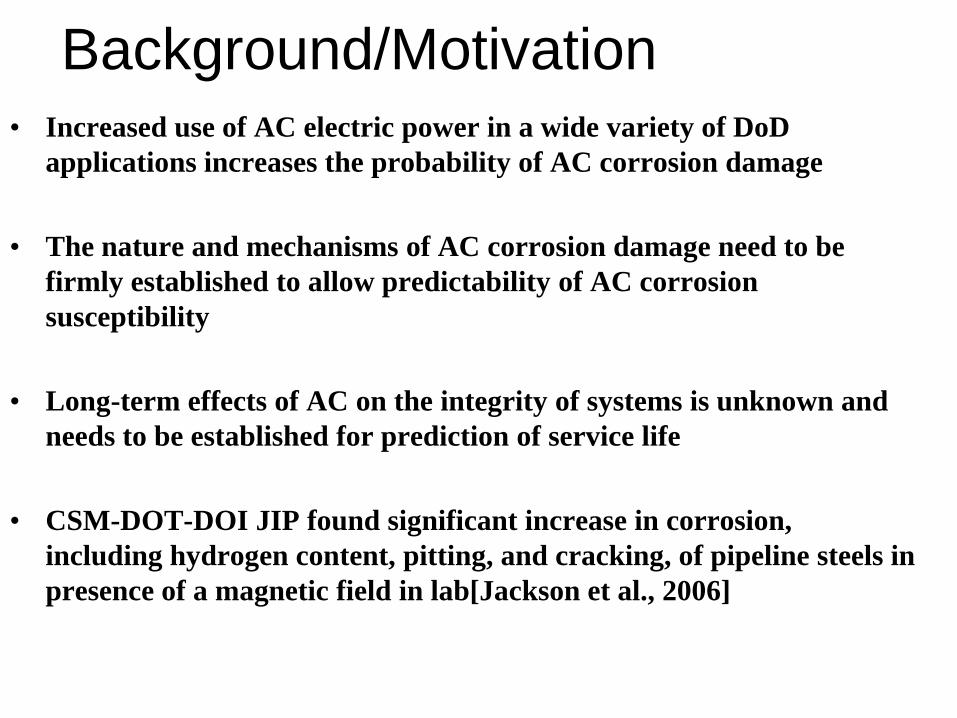
Background/Motivation• Increased use of AC electric power in a wide variety of DoD
applications increases the probability of AC corrosion damage
• The nature and mechanisms of AC corrosion damage need to be
firmly established to allow predictability of AC corrosion
susceptibility
• Long-term effects of AC on the integrity of systems is unknown and
needs to be established for prediction of service life
• CSM-DOT-DOI JIP found significant increase in corrosion,
including hydrogen content, pitting, and cracking, of pipeline steels in
presence of a magnetic field in lab[Jackson et al., 2006]

Effect of AC Current Density

Effect of AC Frequency
• Suggests that one
solution is to
change the
frequency of AC
power to reduce
corrosion damage

AC/DC Corrosion Map
(Lalvani and Zhang, 1995)
• AC current
alters protection
of systems using
cathodic
protection
• AC current
density will be
very high at
defects and
holes

Electronic Model of Pits (Nielsen)
Schematic illustration of the electrical equivalent circuit for AC-corrosion as
proposed by Nielsen and Cohn (2000).
Electronic
model of two
pits with
different
voltages, etc.
Pit is a hole in
coating, which
allows
different
reactions
relative to AC
current

Pourbaix Diagram (Nielsen)
AC corrosion is
promoting a strong
cathode behavior
which pulls out
hydrogen ions out of
pits and making
hydrogen gas
- Then hydroxyl ions
make up difference to
satisfy equilibrium
equation, so more
OH’s are made
(mainly in coating
pits)
Pourbaix-diagram showing dangerous region in respect to AC induced corrosion (as
proposed by Neilsen, et al., 2006)

Alkalization Model 1
• DC stray current:
– Potential lowered (more cathodic) where the current enters the pipeline
– Potential increased (more anodic) where DC exits the pipeline (increasing risk of corrosion)
– DC stray current avoided by adding an excess of CP
• AC stray current:
– Excess CP fatal due to an unexpected increase in pH at coating faults
– CP current produces OH- ions (Galsgaard, 2006)

AC Corrosion in Pits (Bosch & Bogaerts)
AC corrosion rate increases due to stirring in the near surface electrolyte by an
increase in exchange current density of the anode reaction, and can experience
diffusion-limited current density, il.
Bosch and Bogaerts
(1998) found:
•AC corrosion
sensitive to Tafel
parameters
•Concentration
polarization in the pit
causes a measured
drop in voltage
•limited by the
diffusion-limited
current density.

AC Passive Layer Rectification Model 2
•A typical AC
welding cycle for
AC welding of
passive alloy will
produce a
asymmetry.
•Possibly apply to
AC corrosion
where asymmetric
currents lead to
rectification or
stripping of passive
layer.
AC arc parameter changes in (I) positive and (II) negative half-
cycles, causing asymmetric surface potential phenomena
(Pokhodnaya, 1991).

AC Self-biasing (from RF) Model 3
Voltage waveforms at generator (Va) and target (Vb)
in sinusoidally-excited rf discharge (Chapman, 1980).
Voltage and target current waveforms when a high
frequency glow discharge circuit is square wave excited
(Chapman, 1980).

Measured AC Corrosion Kinetics
(Goidanich, 2005)
Shift is indicative of another potential (bias potential) acting on the system

AC Self-biasing Model 3
Figure 9. The self-bias phenomena due to AC behavior for a typical active metal
(A) (B)
(A) Enhanced corrosion and
possible increased alkalinity
(B) Enhanced hydrogen
egress into the steel.

AC Self-biasing Model 3
G = -nfE - nq( V) (1)
Additional external work term due to
a shift in surface potential due to
asymmetrical AC behavior
{
Shift of all lines associated with an
electrochemical half-cell reaction
Boundary lines derived from the Nernst equation:
Pourbaix-diagram (potential vs. pH) showing shift in boundary
lines due to a shift in potential resulting from applied AC.
E
pH
E=Eo - RTln(activities) - nq( V) (2)

AC Self-biasing Model 3b for stainless
Evans diagram showing the effect of self-bias phenomena due
to AC behavior for a typical passive metal.
• Shift in potential resulting in
shift from the passive region to
an active region
• Increase corrosion rate by
orders of magnitude if
cathode line shifts to intersect
active anode line
• For stainless and passivating
alloys which previously
formed passive film, damaged
as a result of AC rectification
Unstable
Scratched or
rectified
Passivated

AC Surface Layer Stirring Model 4
•Stirring of the
Helmholtz and the
Gouy-Chapman layers
due to AC fields
•A result of rapid
changes of the self-
generated magnetic field
(Lenz’s Law)
Schematic of AC surface stirring model.

Electromagnetic stirring Model 4
• Interface potential at charged surface is proportional to number of ions attached at surface (+ & -)
• Potential and kinetic energies affect thickness and diffusivity of the surface layer
Electromagnetic fields disturb the
HDL and GCL surface layers
and cause increased
hydrogen diffusion

AC Surface Layer Stirring Model
Effect of stirring in the exchange current density on both the reduction
and oxidation half-cell reaction and the resulting shift in the corrosion
rate (for a non-passive alloy).
• Increases the
exchange current
density for the
hydrogen cathodic
half cell reaction on
the Evan’s diagram
• Amplifies the
potential corrosion
current.

222)()/1( LCRZ
R is a function of the concentration of
carriers and scattering in solution
C (Capacitance) is a function of the HDL strength
L (Inductance) is a function of the GCL
Measurements will show magnetism affects
corrosion rate; change of capacitance and/or
inductance reveal location of corrosion
Impedance Measurements for Stirring Model 4

Results-
Electrochemical
Impedance
Spectroscopy

Model Testing Matrix
Table 4. Expected responsible phenomena and test methods to assess each proposed model of AC corrosion.
Model Responsible
Phenomena
Tested By:
Passive Layer
Rectification
conduction pitting and cracking assessment,
potentiostat measurements
Surface Layer
Stirring
induction impedance measurements
Self-Biasing induction and/or
conduction
poteniostat measurements
Alkalization induction pH meter

Experimental Setup & Matrix
Experimental setup to test for AC corrosion mechanism
Experimental matrix showing the use of variable resistors to control amount and
type of AC current experienced by sample for AC corrosion.
Configuration Resistor
A
Resistor
B Result
1 ∞ 0 100% induction, no AC
conduction
2 ∞ Variable Variable induction, no AC
conduction
3 0 ∞ No induction, 100% AC
conduction
4 Variable ∞ No induction, variable
conduction
5 Variable Variable Variable induction, variable
conduction

Experimental Setup
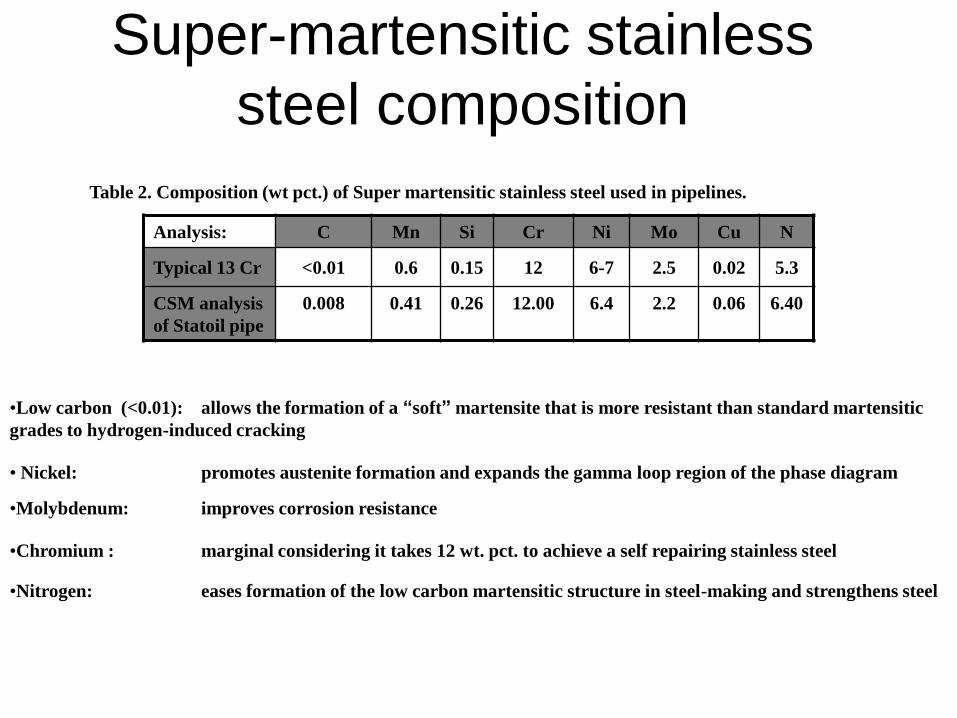
Super-martensitic stainless
steel composition
Analysis: C Mn Si Cr Ni Mo Cu N
Typical 13 Cr <0.01 0.6 0.15 12 6-7 2.5 0.02 5.3
CSM analysis
of Statoil pipe
0.008 0.41 0.26 12.00 6.4 2.2 0.06 6.40
Table 2. Composition (wt pct.) of Super martensitic stainless steel used in pipelines.
•Low carbon (<0.01): allows the formation of a “soft” martensite that is more resistant than standard martensitic
grades to hydrogen-induced cracking
• Nickel: promotes austenite formation and expands the gamma loop region of the phase diagram
•Molybdenum: improves corrosion resistance
•Chromium : marginal considering it takes 12 wt. pct. to achieve a self repairing stainless steel
•Nitrogen: eases formation of the low carbon martensitic structure in steel-making and strengthens steel

Results- PittingPit at 925X on 13Cr sample after 408 hours
(17 days) test in artificial seawater under an
applied AC of 8010 A/m2, showing resulting
pitting typical over surface.
No Pitting observed at 50X following
testing without AC current in
solution for 17 days

Results- Pitting
Pitting with AC current applied
No Pitting without AC current applied
Pits at 25X
Pits at 1000X
Pits at 500X

Proposed Effect on H Ingress
Schematic plot of possible effect of AC on hydrogen ingress in 13 Cr Super martensitic stainless steel.
Can also have a cathode problem related to hydrogen generation

Proposed Research• A Joint Industry Project is proposed to investigate the effects of AC
corrosion on metallic structures and assemblies
– The JIP will:
» verify the proposed models of AC corrosion
» develop analytical tools to assess the susceptibility to AC
corrosion
» identify practices to assess and mitigate AC corrosion
• Separate AC corrosion projects can be established to investigate
your specific needs
Summary• Results suggest the increased use of electric power in DoD
applications requires a thorough understanding of AC corrosion.

Acknowledgements
• DOI-MMS and DOT-PHMSA
• Jenny Collins for technical assistance
•

Contact Info
• Joshua Jackson - Gen 2 Materials Technology LLC
303-895-7146 [email protected]
• David L Olson - Colorado School of Mines
303-273-3955 [email protected]
• Brajendra Mishra - Colorado School of Mines
303-273-3893 [email protected]

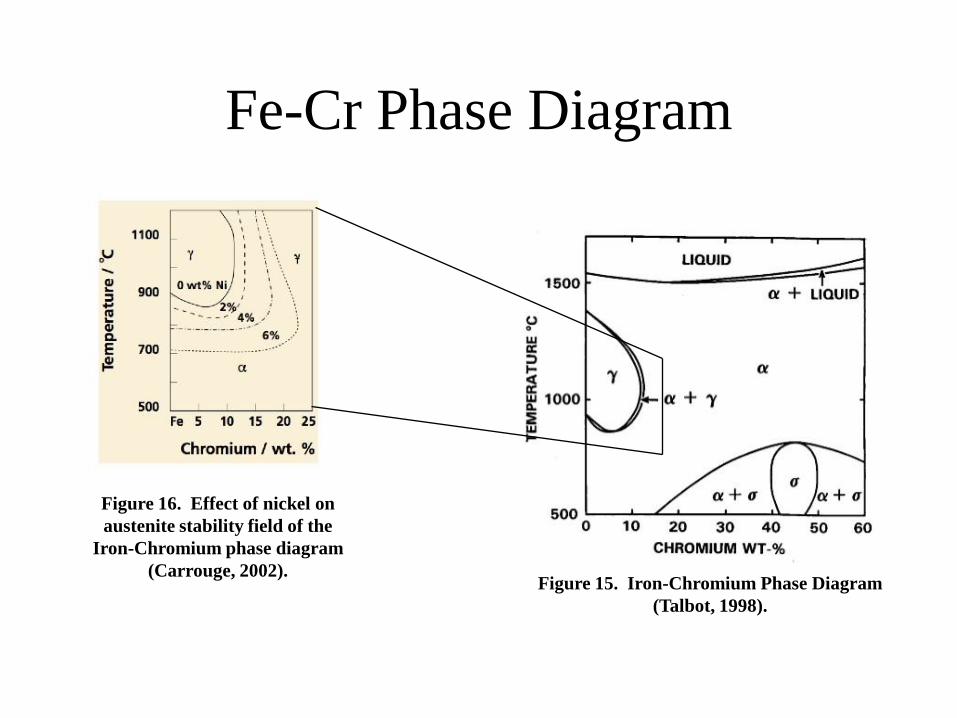
Fe-Cr Phase Diagram
Figure 15. Iron-Chromium Phase Diagram
(Talbot, 1998).
Figure 16. Effect of nickel on
austenite stability field of the
Iron-Chromium phase diagram
(Carrouge, 2002).
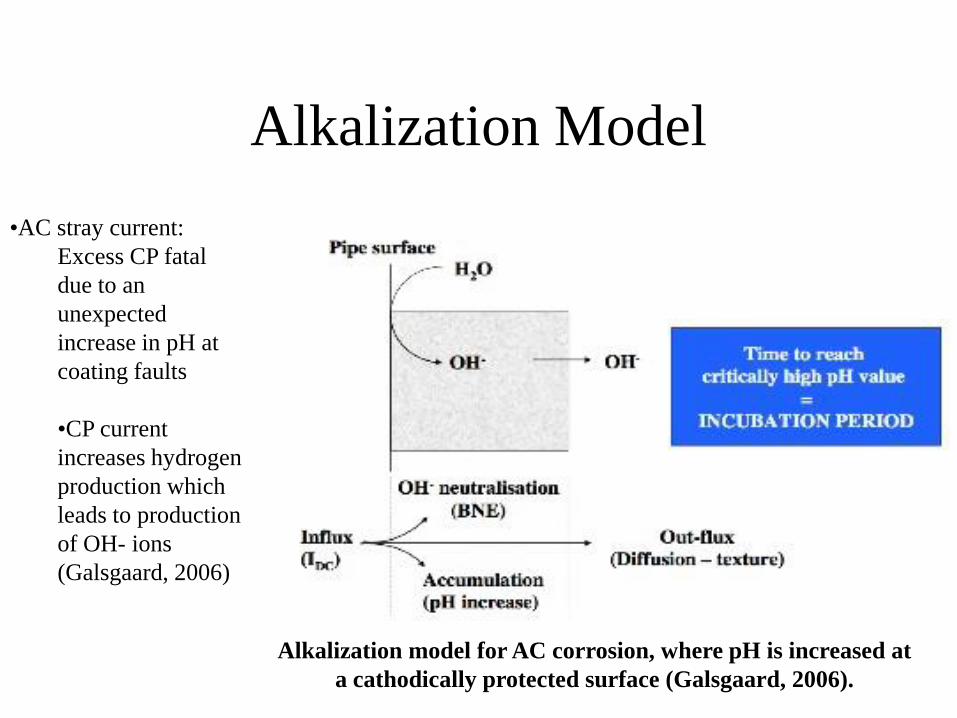
Alkalization Model
Alkalization model for AC corrosion, where pH is increased at
a cathodically protected surface (Galsgaard, 2006).
•AC stray current:
Excess CP fatal
due to an
unexpected
increase in pH at
coating faults
•CP current
increases hydrogen
production which
leads to production
of OH- ions
(Galsgaard, 2006)

Pourbaix Diagram and AC Corrosion
Pourbaix diagram for iron in water, based on theoretical calculations
of the thermodynamics of electrochemical reactions.
Electrochemical reactions relating
to the Pourbaix diagram of iron in
water.
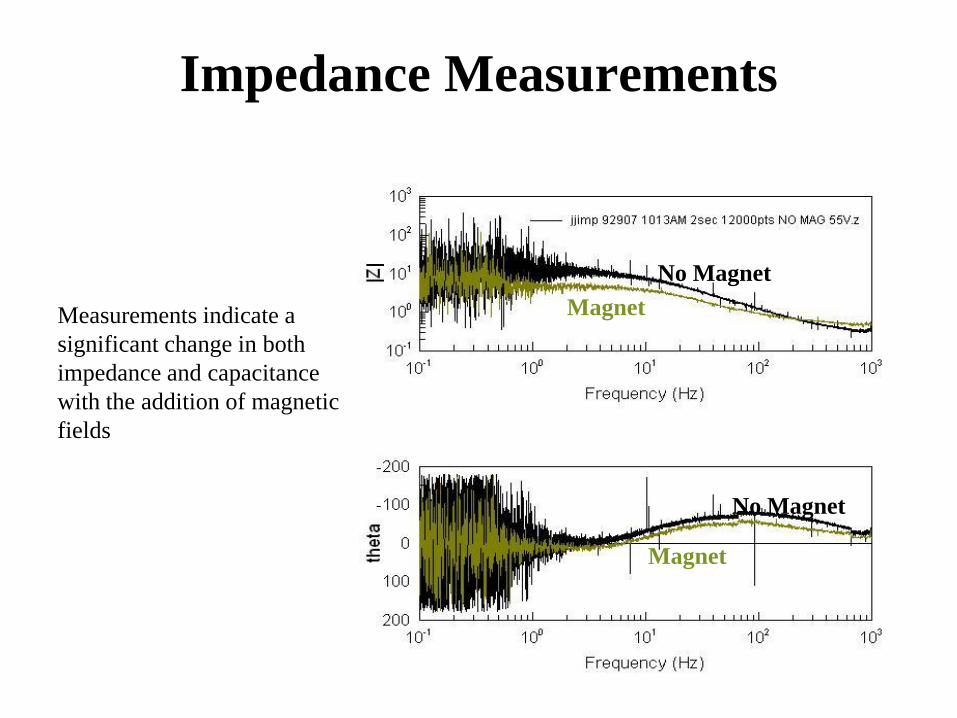
Measurements indicate a
significant change in both
impedance and capacitance
with the addition of magnetic
fields
Impedance Measurements
No Magnet
No Magnet
Magnet
Magnet

References• Bosch R.W. and Bogaerts, W.F., “A Theoretical Study of AC-Induced Corrosion Considering Diffusion Phenomena.” Corrosion
Science Vol. 40, No. 2/3, 1998, pp. 323-336.
• Chapman, B.N., 1980, “RF Discharges”, Glow Discharge Processes, Chapter 5, New York: John Wiley & Sons, pp. 143-146
.
• Deev, G.F., and Patskevich, I.R., Art. Svarka, No. 5, 1980, pp. 67-68.
• Galsgaard, F., Nielsen, L.V., Cohn, P., and Baumgarten, B., “AC/DC Interference Corrosion in Pipelines: Summary Report”MetriCorr ApS, Glostrup, Denmark, 2006.
• Goidanich, S., Lazzari, L., Ormellese, M., Pedeferri, M., “Influence of AC on Corrosion Kinetics For Carbon Steel, Zinc, andCopper,” Politecnico di Milano, Dipartimento di Chimica, Milano Italy, 2005.
• Kulbotten, H. and Kristian, J. “Direct Electric Heating System for Preventing Wax and Hydrates in Pipleines. Sinteff EnergyResearch, Tronheim, Norway, 2006.
• Nielsen L.V., “Role of Alkalization in AC induced Corrosion of Pipelines and Consequences hereof in Relation to CP Requirements,”) CORROSION (NACE) MetriCorr ApS, Roedovre, Denmark, 2005.
• Nielsen L.V., Baumgarten and Cohn P, “On-site measurements of AC induced corrosion: Effect of AC and DC parameters- A Report from the Danish Activites,” CeoCor conference, June 2004.
• Nielsen L.V., Baumgarten B. and Cohn P., “Investigating AC and DC Stray Current- A Report from the Danish Activites,” CeoCor, Roedovre, Denmark, 2005.
• Nielsen L.V. and Cohn P., “AC-Corrosion and Electrical Equivalent Diagrams,” CeoCor 2000.
• Nielsen L.V., Nielsen K.V., Baumgarten B., Breuning-Madsen H., Cohn P., Rosenberg H., “AC-Induced Corrosion in Pipelines: Detection, Characterization, and Mitigation,” MetriCorr ApS, Roedovre, Denmark, 2006.
• Pokhodnya, I.K., Gorpenyuk, V.N., Milichenko, S.S., Ponomarev, V.E., Starodubsev, L.V. and Shvachko, V.I., 1991, Metallurgy of Arc Welding: Arc Processes and Electrode Melting, Vol. 1, Chapter 2, Riecansky Sci. Publishing, Cambridge, UK.
• Talbot, D., Talbot, J., Ralph, B. and Kurzydlowski, K.J., The Quantitative Description of the Microstructure of Materials, CRCSeries in Materials Science and Technology, Corrosion Science and Technology, CRC Press, 1998.