Embed Size (px)
Citation preview
QLD ACPS Symposium – 15 September, 2009 1
ACARP PROJECT C17036
DELINEATION OF LARGE DIAMETER DMC PERFORMANCE
“PRELIMINARY FINDINGS”
Andy MeyersA&B Mylec
2
Presentation Outline• Project Aims Overview• Key Project Milestones• Plant Audit Program
– The Newlands plant– Testing program details– Managing sample analysis
• Preliminary Data Analysis– Test run summary and example data set– Test run performance data by size– Trends?– Medium stability– Duplicate test run outcomes– Particle size aspects
QLD ACPS Symposium – 15 September, 2009
3
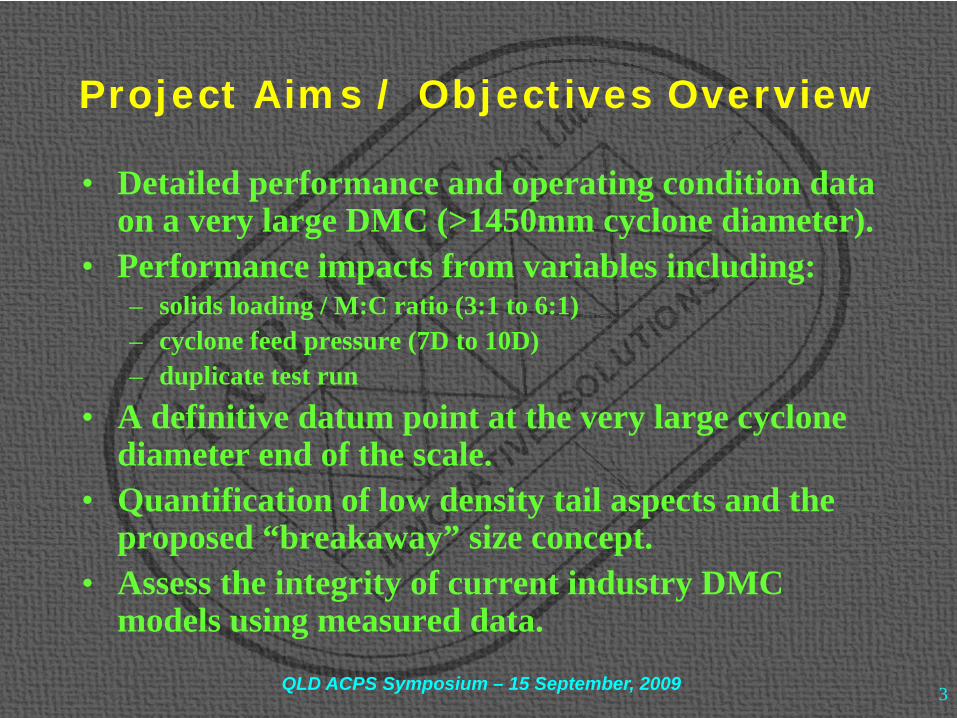
Project Aims / Objectives Overview
• Detailed performance and operating condition data on a very large DMC (>1450mm cyclone diameter).
• Performance impacts from variables including:– solids loading / M:C ratio (3:1 to 6:1)– cyclone feed pressure (7D to 10D)– duplicate test run
• A definitive datum point at the very large cyclone diameter end of the scale.
• Quantification of low density tail aspects and the proposed “breakaway” size concept.
• Assess the integrity of current industry DMC models using measured data.
QLD ACPS Symposium – 15 September, 2009
4
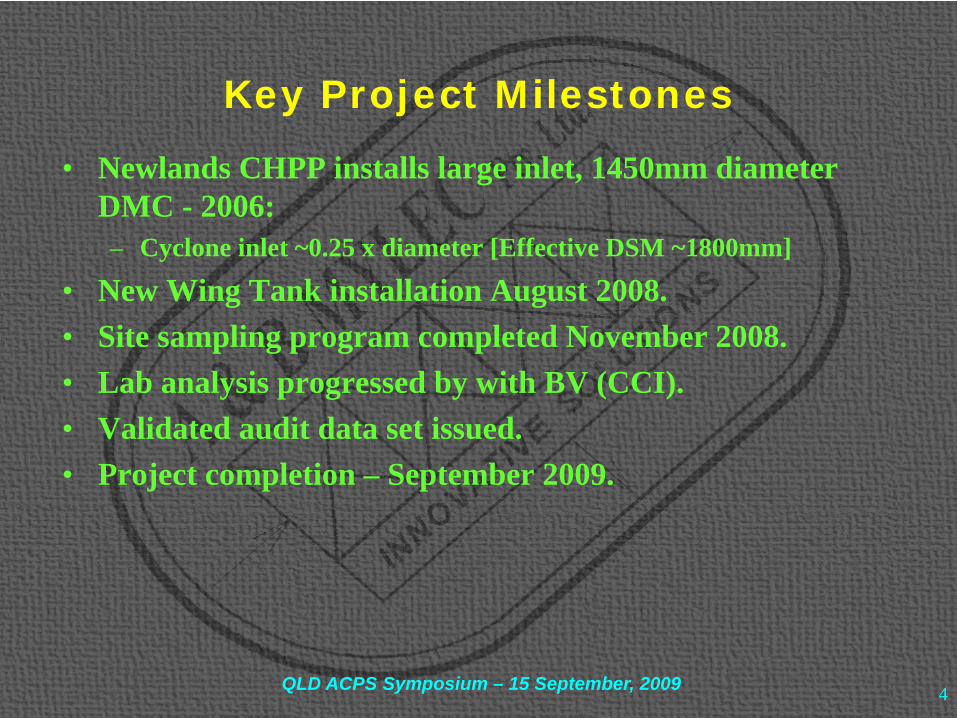
Key Project Milestones
• Newlands CHPP installs large inlet, 1450mm diameter DMC - 2006:– Cyclone inlet ~0.25 x diameter [Effective DSM ~1800mm]
• New Wing Tank installation August 2008.• Site sampling program completed November 2008.• Lab analysis progressed by with BV (CCI).• Validated audit data set issued.• Project completion – September 2009.
QLD ACPS Symposium – 15 September, 2009
5
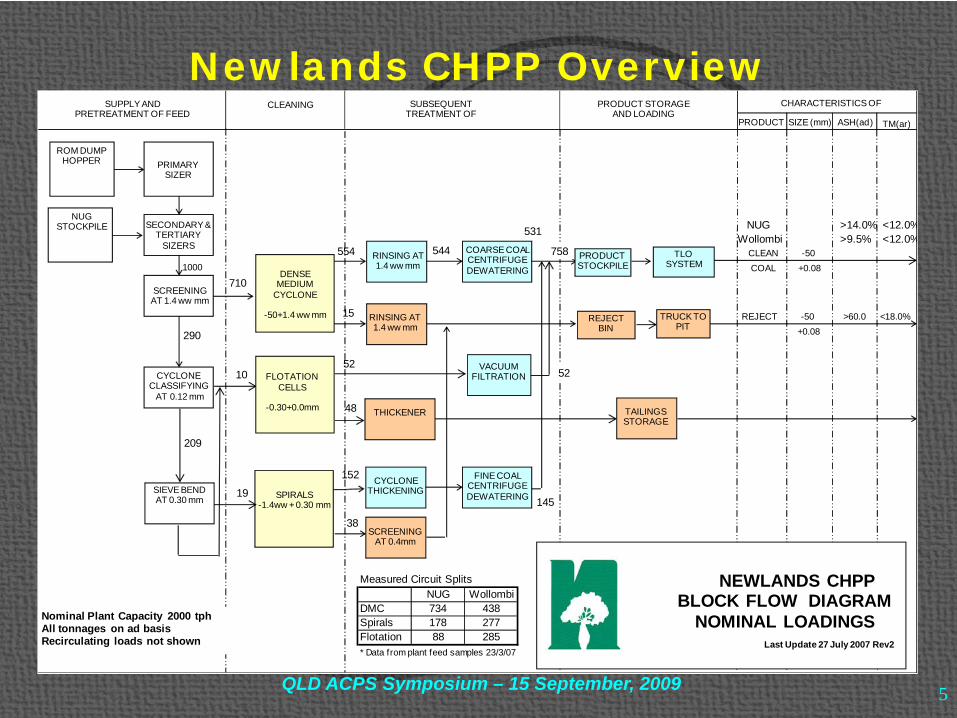
Newlands CHPP Overview
NUG >14.0% <12.0%Wollombi >9.5% <12.0%
Measured Circuit SplitsNUG Wollombi
DMC 734 438Spirals 178 277Flotation 88 285* Data from plant feed samples 23/3/07
544
38
152
48
52
15
554
19
10
710
ROM DUMP HOPPER PRIMARY
SIZER
SCREENING AT 1.4 ww mm
SECONDARY & TERTIARY
SIZERS
CYCLONE CLASSIFYING
AT 0.12 mm
SUPPLY AND PRETREATMENT OF FEED
CLEANING SUBSEQUENT TREATMENT OF
PRODUCT STORAGE AND LOADING
CHARACTERISTICS OF
PRODUCT ASH(ad)SIZE (mm)
1000TLO
SYSTEMDENSE
MEDIUM CYCLONE
-50+1.4 ww mm
SPIRALS-1.4ww + 0.30 mm
SCREENING AT 0.4mm
COARSE COAL CENTRIFUGE DEWATERING
RINSING AT 1.4 ww mm
RINSING AT 1.4 ww mm
CYCLONETHICKENING
FINE COAL CENTRIFUGE DEWATERING
REJECT BIN
TRUCK TOPIT
FLOTATION CELLS
-0.30+0.0mm
VACUUM FILTRATION
THICKENER TAILINGS STORAGE
Nominal Plant Capacity 2000 tphAll tonnages on ad basisRecirculating loads not shown
NEWLANDS CHPP BLOCK FLOW DIAGRAM
NOMINAL LOADINGSLast Update 27 July 2007 Rev2
531
145
290
209
CLEANCOAL
-50+0.08
REJECT -50 >60.0+0.08
SIEVE BEND AT 0.30 mm
NUGSTOCKPILE
758 PRODUCT STOCKPILE
TM(ar)
<18.0%
52
QLD ACPS Symposium – 15 September, 2009
6
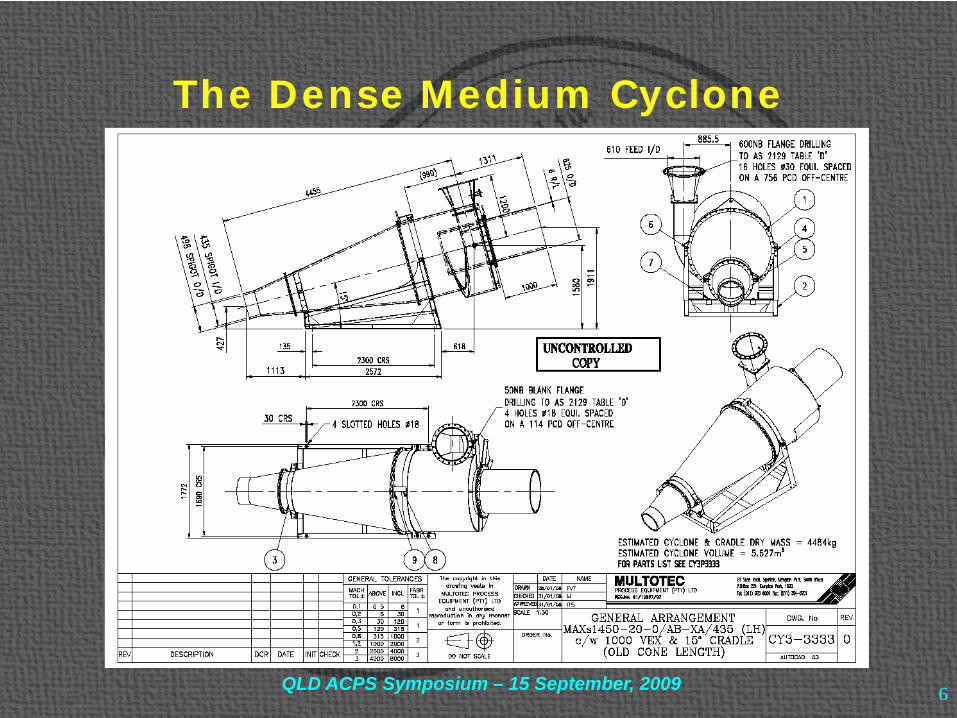
The Dense Medium Cyclone
QLD ACPS Symposium – 15 September, 2009
7
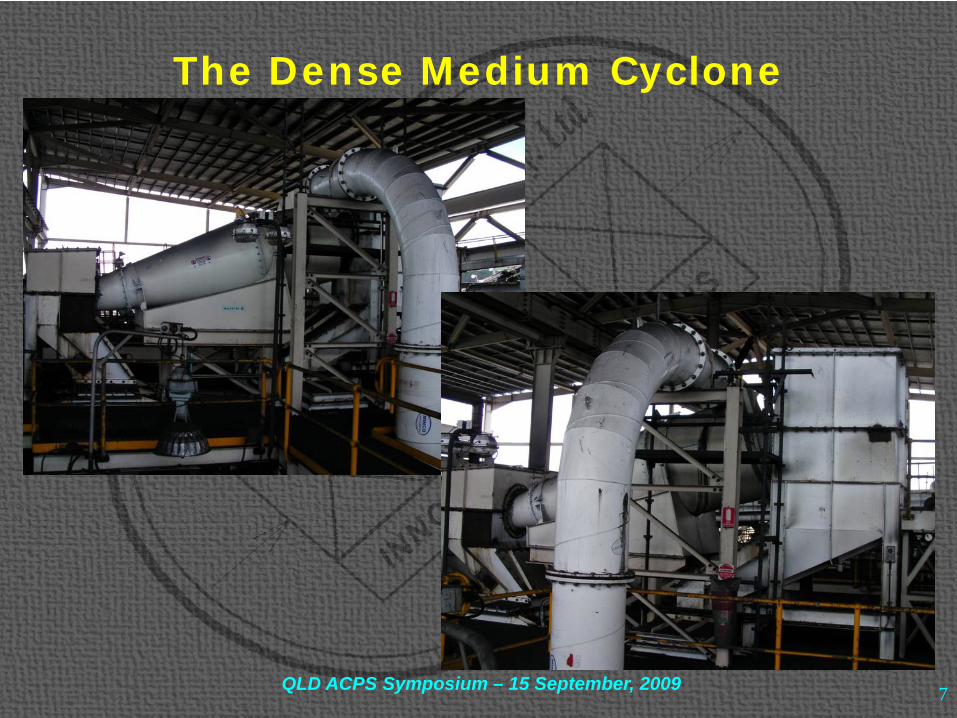
The Dense Medium Cyclone
QLD ACPS Symposium – 15 September, 2009
8
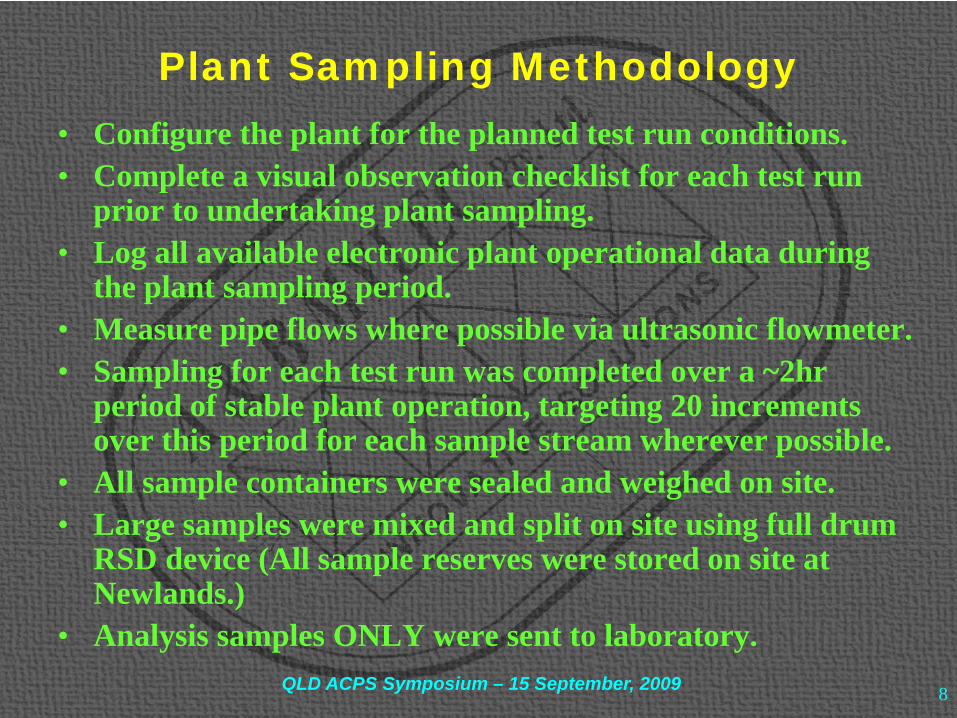
Plant Sampling Methodology
• Configure the plant for the planned test run conditions.• Complete a visual observation checklist for each test run
prior to undertaking plant sampling.• Log all available electronic plant operational data during
the plant sampling period.• Measure pipe flows where possible via ultrasonic flowmeter.• Sampling for each test run was completed over a ~2hr
period of stable plant operation, targeting 20 increments over this period for each sample stream wherever possible.
• All sample containers were sealed and weighed on site.• Large samples were mixed and split on site using full drum
RSD device (All sample reserves were stored on site at Newlands.)
• Analysis samples ONLY were sent to laboratory.QLD ACPS Symposium – 15 September, 2009
9
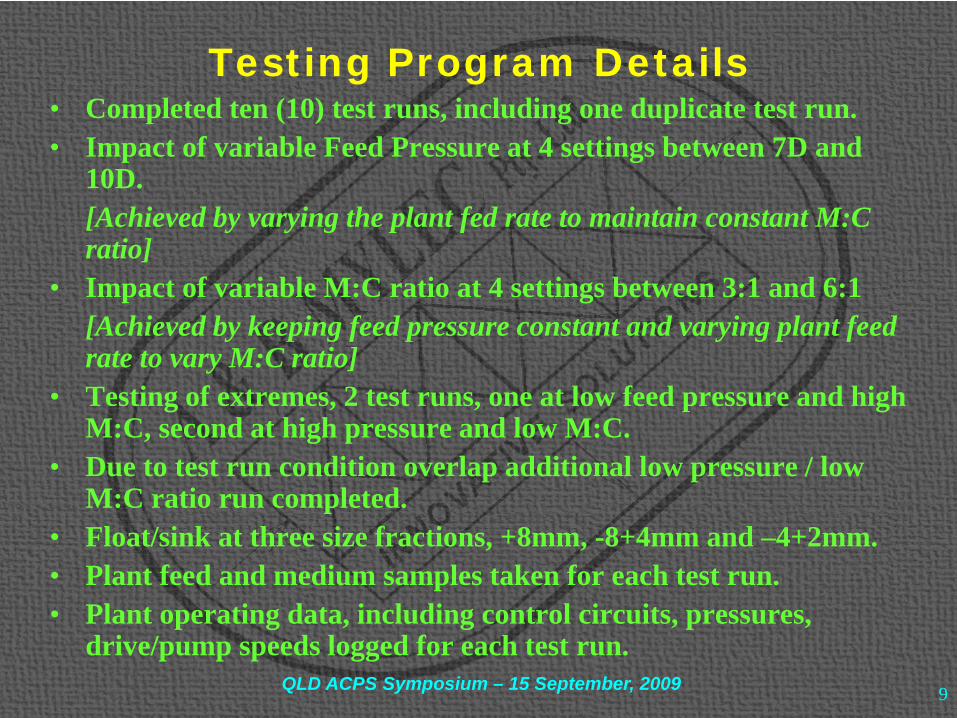
Testing Program Details• Completed ten (10) test runs, including one duplicate test run.• Impact of variable Feed Pressure at 4 settings between 7D and
10D.[Achieved by varying the plant fed rate to maintain constant M:C ratio]
• Impact of variable M:C ratio at 4 settings between 3:1 and 6:1[Achieved by keeping feed pressure constant and varying plant feed rate to vary M:C ratio]
• Testing of extremes, 2 test runs, one at low feed pressure and high M:C, second at high pressure and low M:C.
• Due to test run condition overlap additional low pressure / low M:C ratio run completed.
• Float/sink at three size fractions, +8mm, -8+4mm and –4+2mm.• Plant feed and medium samples taken for each test run.• Plant operating data, including control circuits, pressures,
drive/pump speeds logged for each test run.QLD ACPS Symposium – 15 September, 2009
10
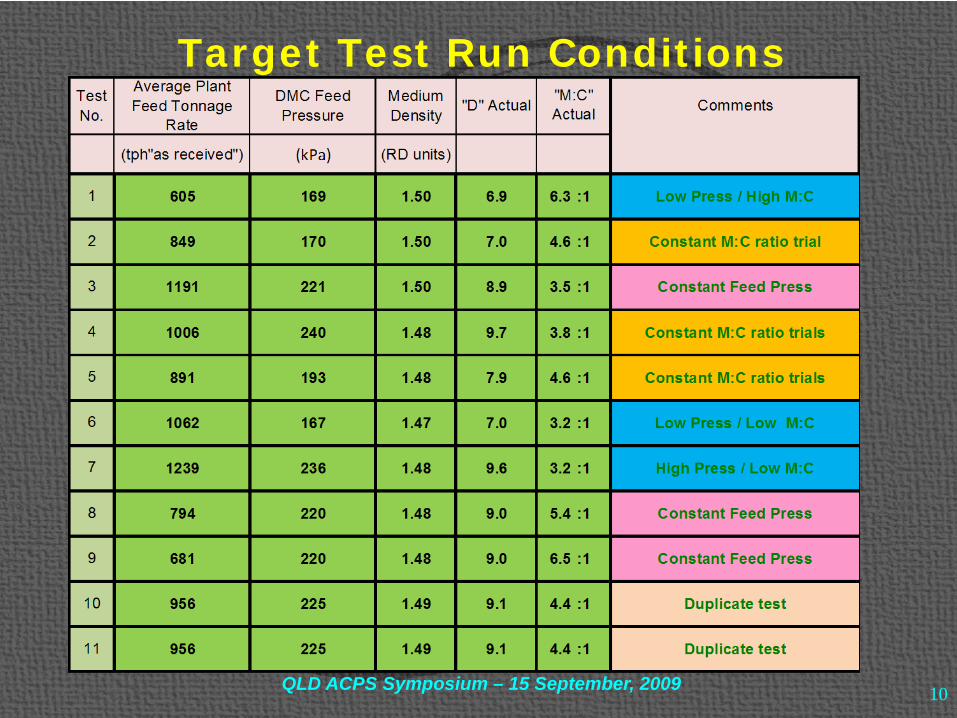
Target Test Run Conditions
QLD ACPS Symposium – 15 September, 2009
11
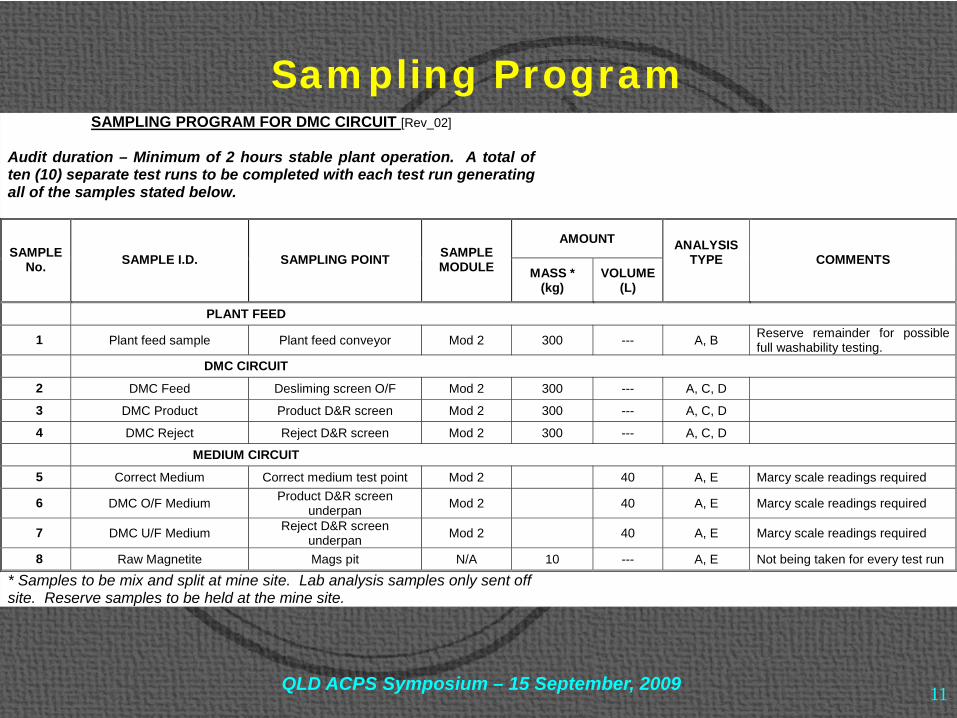
Sampling ProgramSAMPLING PROGRAM FOR DMC CIRCUIT [Rev_02]
Audit duration – Minimum of 2 hours stable plant operation. A total of ten (10) separate test runs to be completed with each test run generating all of the samples stated below.
AMOUNT SAMPLE
No. SAMPLE I.D. SAMPLING POINT SAMPLE MODULE MASS *
(kg) VOLUME
(L)
ANALYSIS TYPE
COMMENTS
PLANT FEED
1 Plant feed sample Plant feed conveyor Mod 2 300 --- A, B Reserve remainder for possible full washability testing.
DMC CIRCUIT
2 DMC Feed Desliming screen O/F Mod 2 300 --- A, C, D
3 DMC Product Product D&R screen Mod 2 300 --- A, C, D
4 DMC Reject Reject D&R screen Mod 2 300 --- A, C, D
MEDIUM CIRCUIT
5 Correct Medium Correct medium test point Mod 2 40 A, E Marcy scale readings required
6 DMC O/F Medium Product D&R screen underpan Mod 2 40 A, E Marcy scale readings required
7 DMC U/F Medium Reject D&R screen underpan Mod 2 40 A, E Marcy scale readings required
8 Raw Magnetite Mags pit N/A 10 --- A, E Not being taken for every test run
* Samples to be mix and split at mine site. Lab analysis samples only sent off site. Reserve samples to be held at the mine site.
QLD ACPS Symposium – 15 September, 2009
12
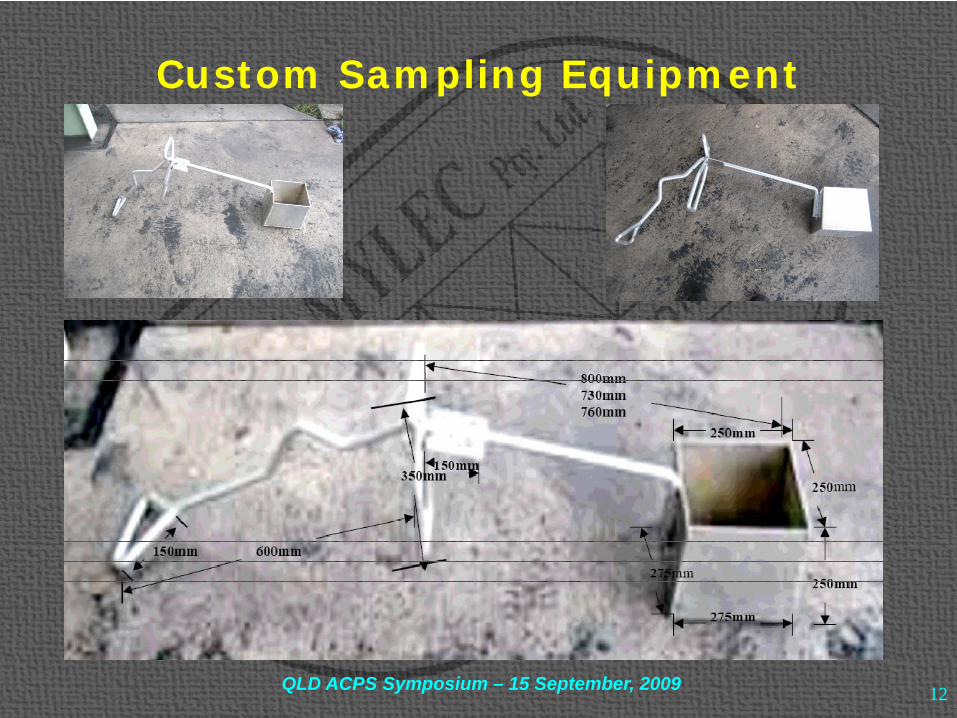
Custom Sampling Equipment
QLD ACPS Symposium – 15 September, 2009
13
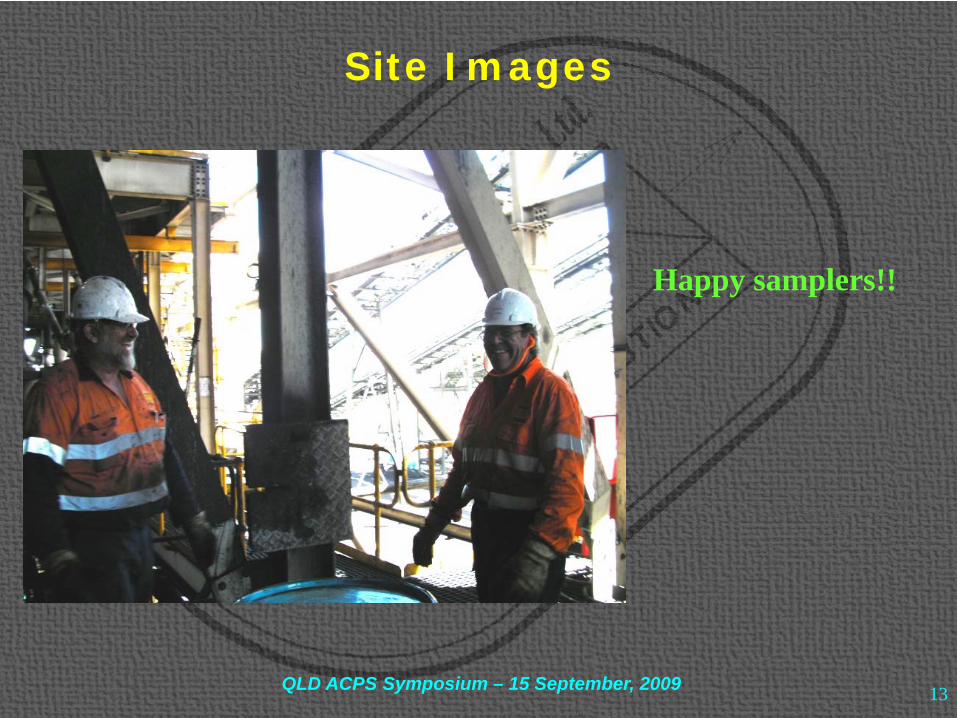
Site Images
Happy samplers!!
QLD ACPS Symposium – 15 September, 2009
14
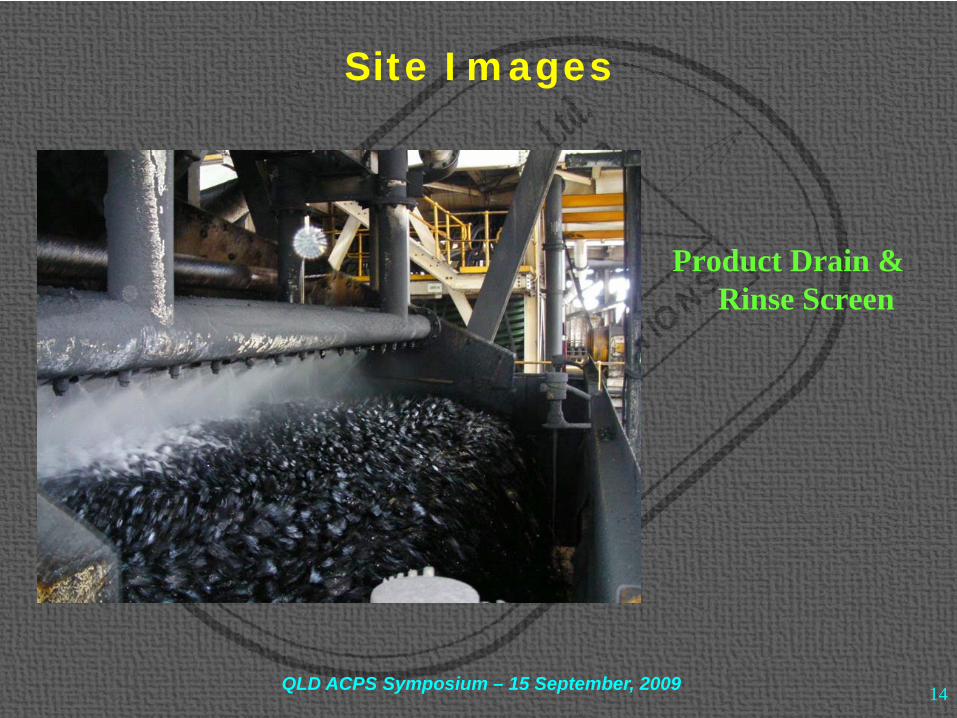
Site Images
Product Drain & Rinse Screen
QLD ACPS Symposium – 15 September, 2009
15
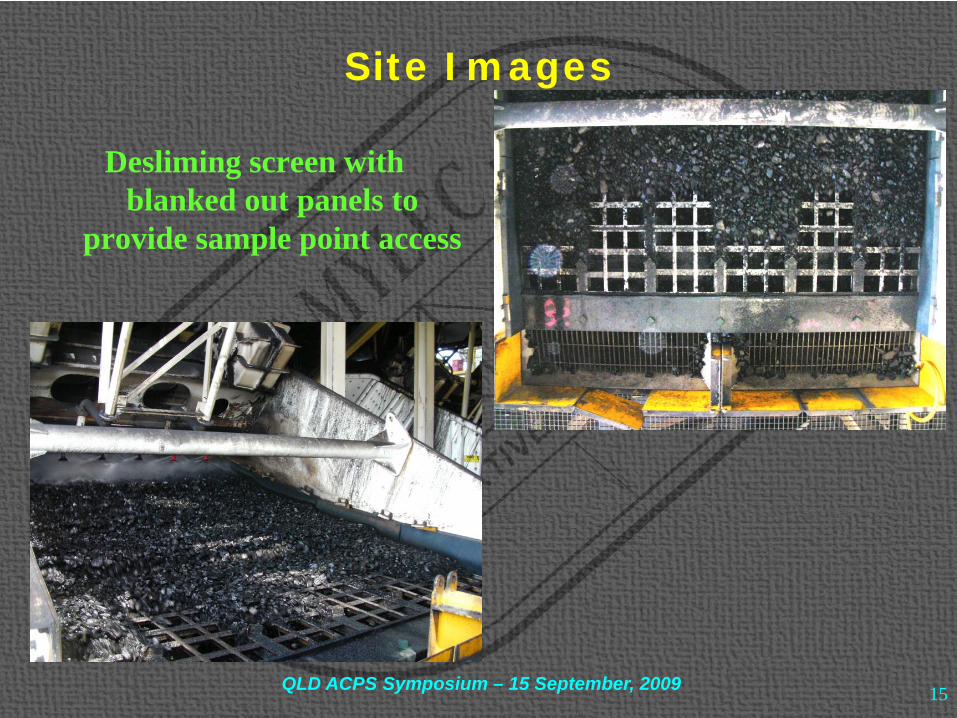
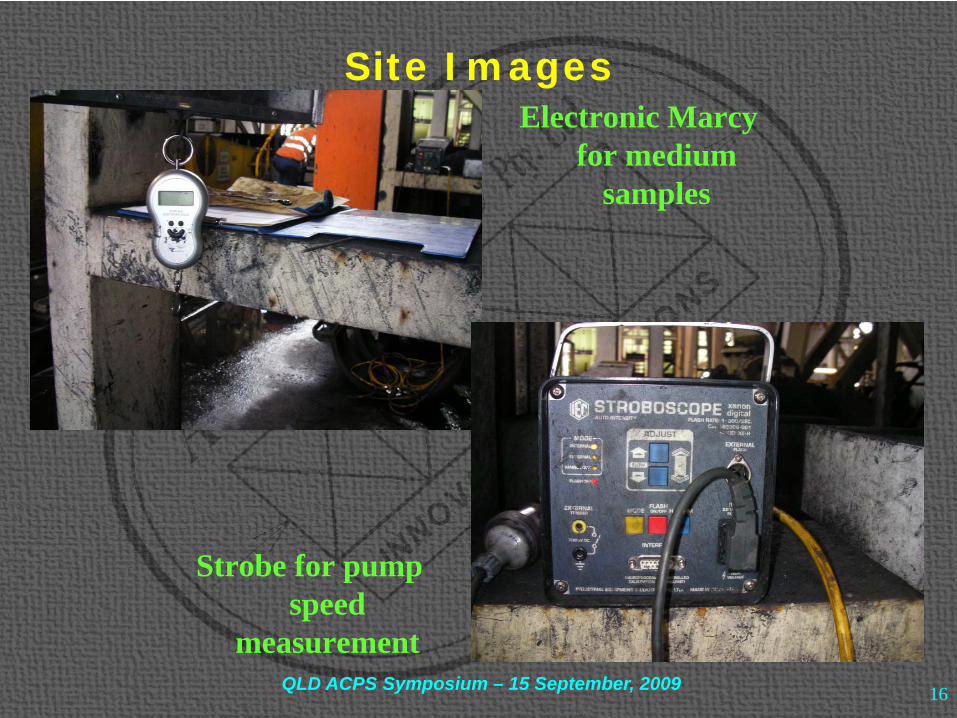
Site Images
Desliming screen with blanked out panels to
provide sample point access
QLD ACPS Symposium – 15 September, 2009
16
Site ImagesElectronic Marcy
for medium samples
Strobe for pump speed
measurementQLD ACPS Symposium – 15 September, 2009
17
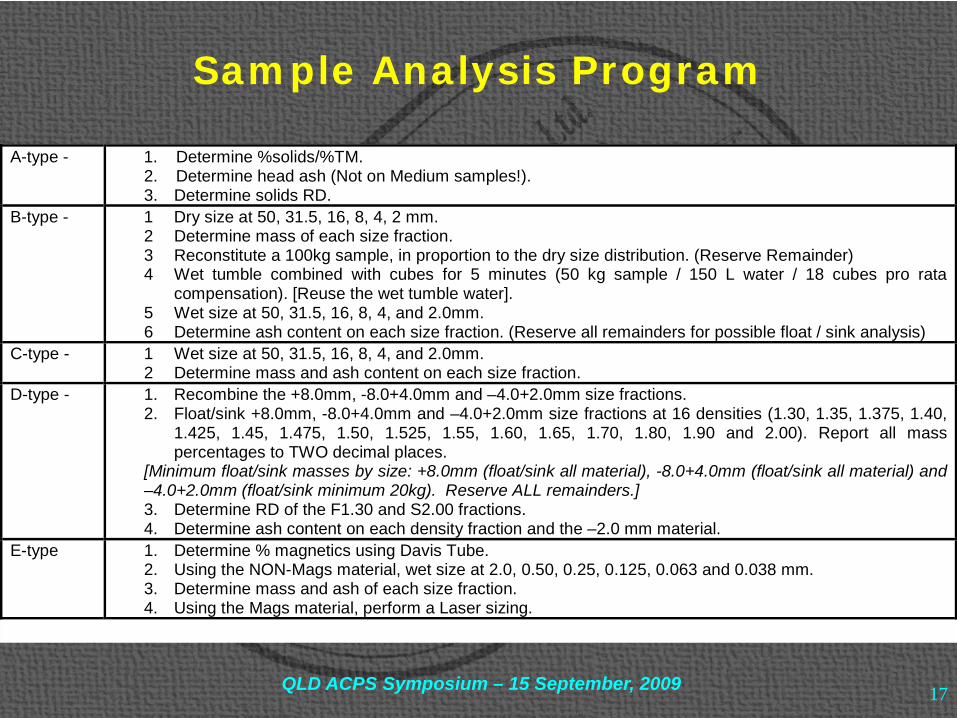
Sample Analysis Program
A-type - 1. Determine %solids/%TM. 2. Determine head ash (Not on Medium samples!). 3. Determine solids RD.
B-type - 1 Dry size at 50, 31.5, 16, 8, 4, 2 mm. 2 Determine mass of each size fraction. 3 Reconstitute a 100kg sample, in proportion to the dry size distribution. (Reserve Remainder) 4 Wet tumble combined with cubes for 5 minutes (50 kg sample / 150 L water / 18 cubes pro rata
compensation). [Reuse the wet tumble water]. 5 Wet size at 50, 31.5, 16, 8, 4, and 2.0mm. 6 Determine ash content on each size fraction. (Reserve all remainders for possible float / sink analysis)
C-type - 1 Wet size at 50, 31.5, 16, 8, 4, and 2.0mm. 2 Determine mass and ash content on each size fraction.
D-type - 1. Recombine the +8.0mm, -8.0+4.0mm and –4.0+2.0mm size fractions. 2. Float/sink +8.0mm, -8.0+4.0mm and –4.0+2.0mm size fractions at 16 densities (1.30, 1.35, 1.375, 1.40,
1.425, 1.45, 1.475, 1.50, 1.525, 1.55, 1.60, 1.65, 1.70, 1.80, 1.90 and 2.00). Report all mass percentages to TWO decimal places.
[Minimum float/sink masses by size: +8.0mm (float/sink all material), -8.0+4.0mm (float/sink all material) and –4.0+2.0mm (float/sink minimum 20kg). Reserve ALL remainders.] 3. Determine RD of the F1.30 and S2.00 fractions. 4. Determine ash content on each density fraction and the –2.0 mm material.
E-type 1. Determine % magnetics using Davis Tube. 2. Using the NON-Mags material, wet size at 2.0, 0.50, 0.25, 0.125, 0.063 and 0.038 mm. 3. Determine mass and ash of each size fraction. 4. Using the Mags material, perform a Laser sizing.
QLD ACPS Symposium – 15 September, 2009
18
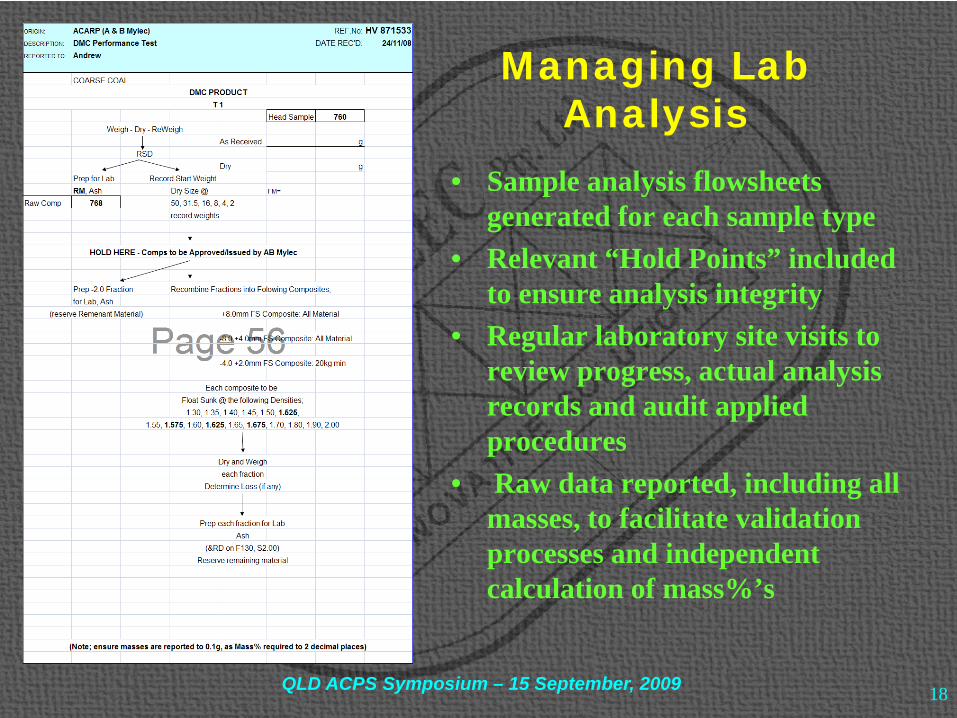
Managing Lab Analysis
• Sample analysis flowsheetsgenerated for each sample type
• Relevant “Hold Points” included to ensure analysis integrity
• Regular laboratory site visits to review progress, actual analysis records and audit applied procedures
• Raw data reported, including all masses, to facilitate validation processes and independent calculation of mass%’s
QLD ACPS Symposium – 15 September, 2009
19
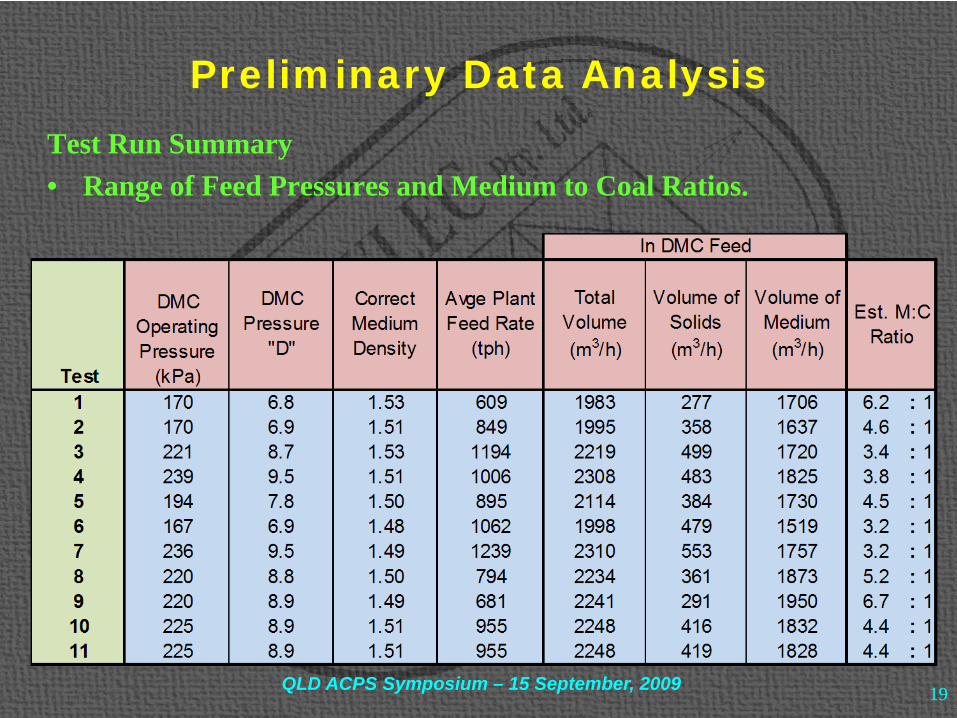
Preliminary Data Analysis
Test Run Summary• Range of Feed Pressures and Medium to Coal Ratios.
QLD ACPS Symposium – 15 September, 2009
20
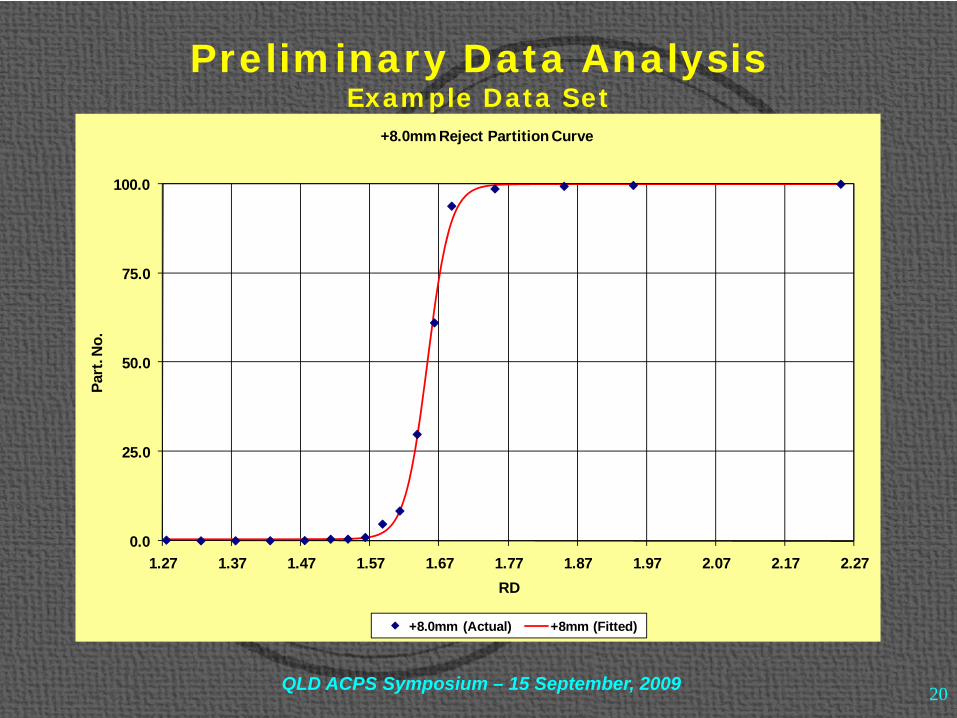
Preliminary Data AnalysisExample Data Set
0.0
25.0
50.0
75.0
100.0
1.27 1.37 1.47 1.57 1.67 1.77 1.87 1.97 2.07 2.17 2.27
Part
. No.
RD
+8.0mm Reject Partition Curve
+8.0mm (Actual) +8mm (Fitted)
QLD ACPS Symposium – 15 September, 2009
21
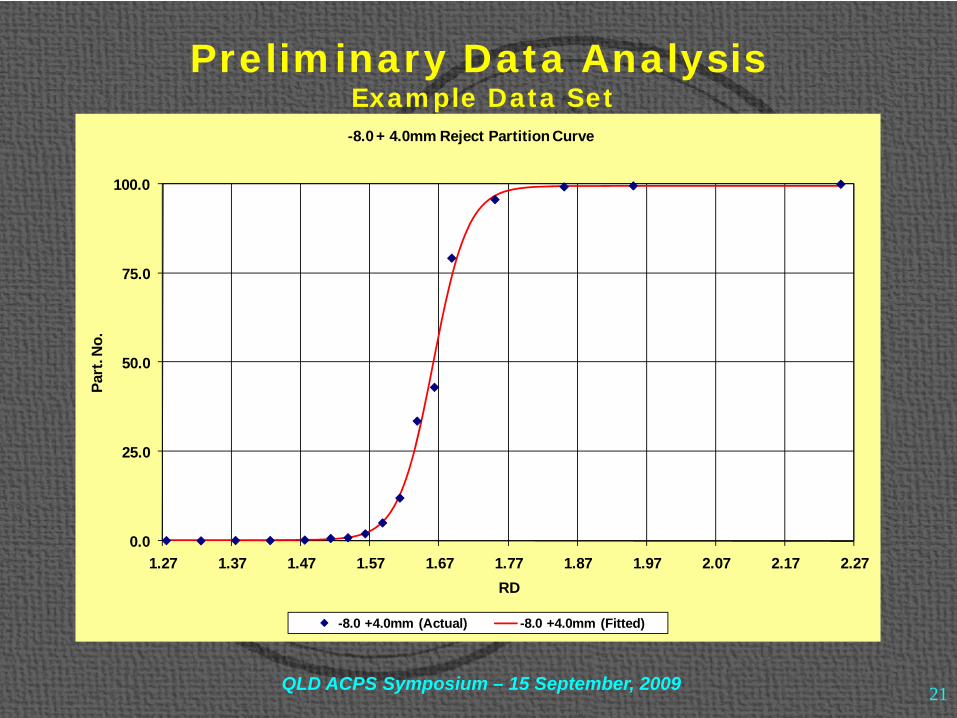
Preliminary Data AnalysisExample Data Set
0.0
25.0
50.0
75.0
100.0
1.27 1.37 1.47 1.57 1.67 1.77 1.87 1.97 2.07 2.17 2.27
Part
. No.
RD
-8.0 + 4.0mm Reject Partition Curve
-8.0 +4.0mm (Actual) -8.0 +4.0mm (Fitted)
QLD ACPS Symposium – 15 September, 2009

22
Preliminary Data AnalysisExample Data Set
0.0
25.0
50.0
75.0
100.0
1.27 1.37 1.47 1.57 1.67 1.77 1.87 1.97 2.07 2.17 2.27
Part
. No.
RD
-4.0 + 2.0mm Reject Partition Curve
-4.0 +2.0mm (Actual) -4.0 +2.0mm (Fitted)
QLD ACPS Symposium – 15 September, 2009
23
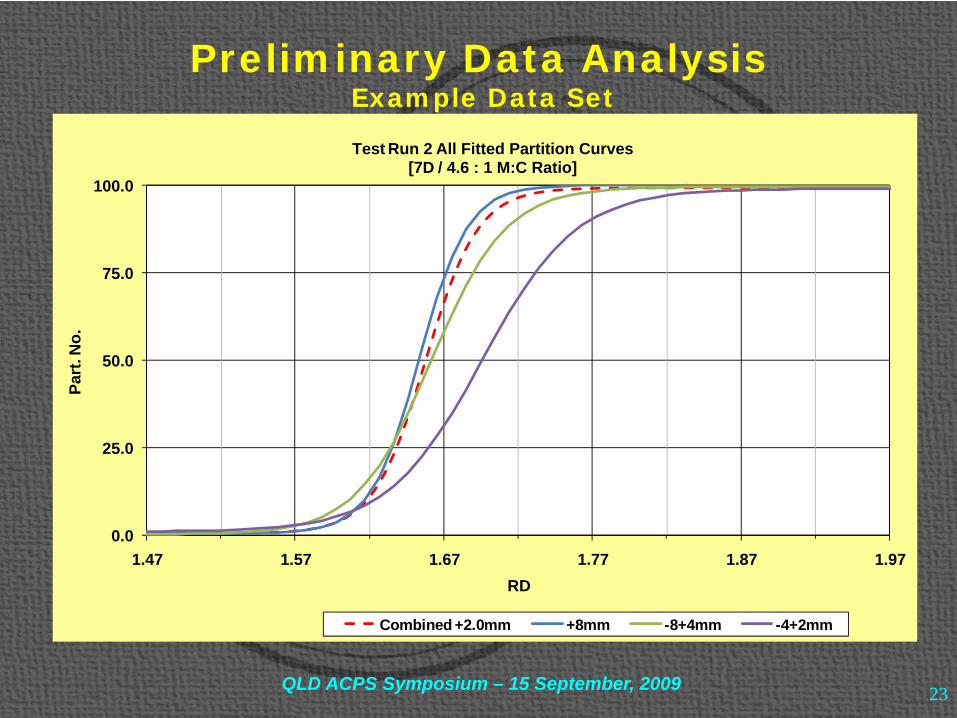
Preliminary Data AnalysisExample Data Set
0.0
25.0
50.0
75.0
100.0
1.47 1.57 1.67 1.77 1.87 1.97
Part
. No.
RD
Test Run 2 All Fitted Partition Curves[7D / 4.6 : 1 M:C Ratio]
Combined +2.0mm +8mm -8+4mm -4+2mm
QLD ACPS Symposium – 15 September, 2009
24
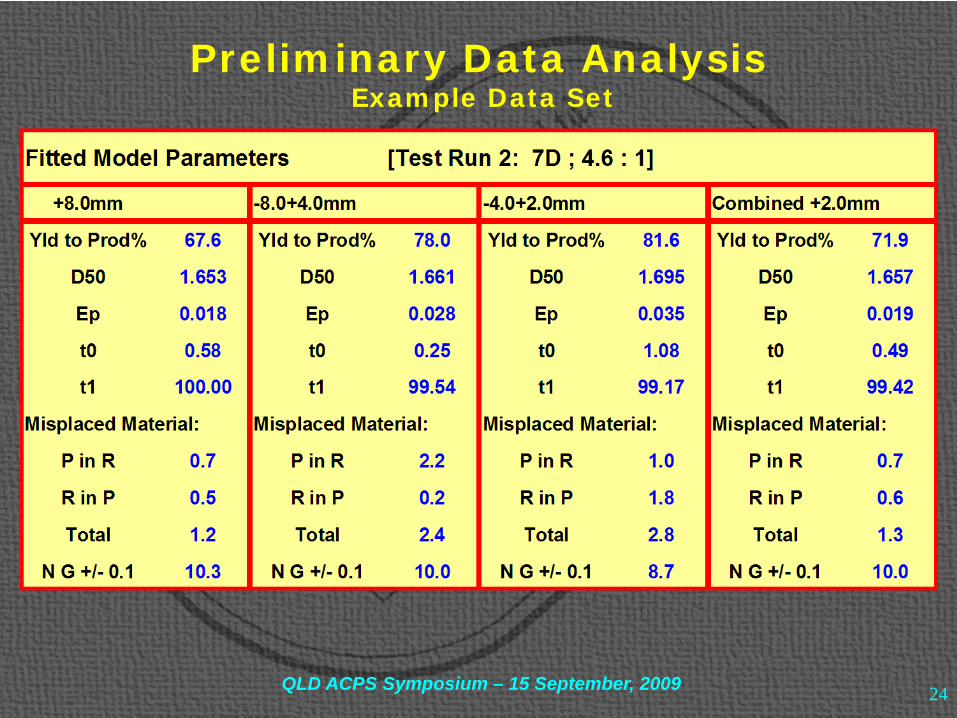
Preliminary Data AnalysisExample Data Set
QLD ACPS Symposium – 15 September, 2009
25
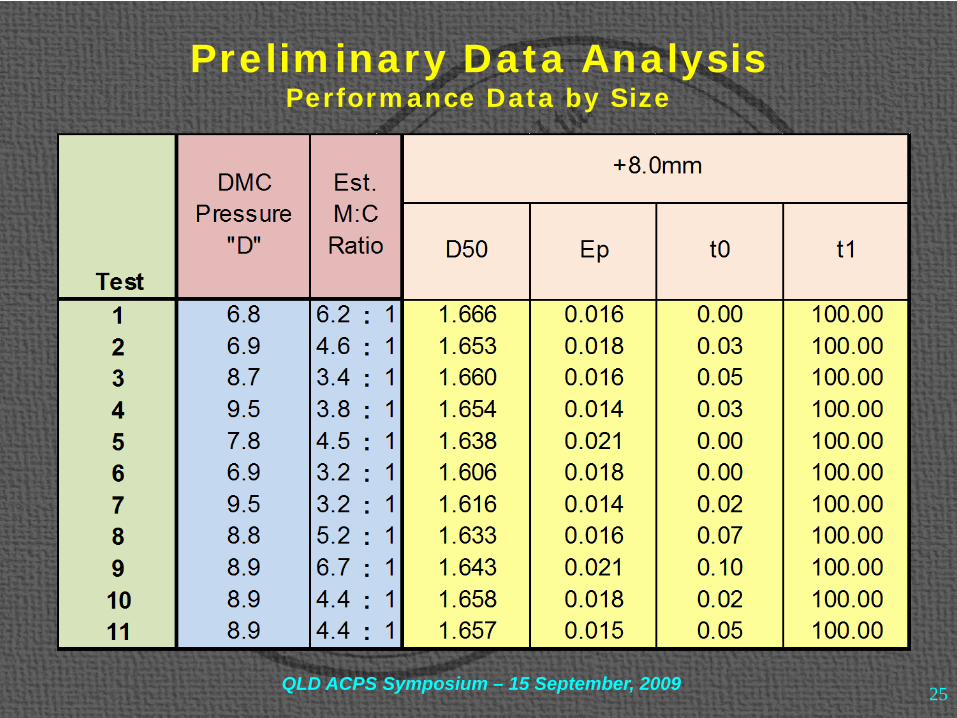
Preliminary Data AnalysisPerformance Data by Size
QLD ACPS Symposium – 15 September, 2009

26
Preliminary Data AnalysisPerformance Data by Size
QLD ACPS Symposium – 15 September, 2009
27
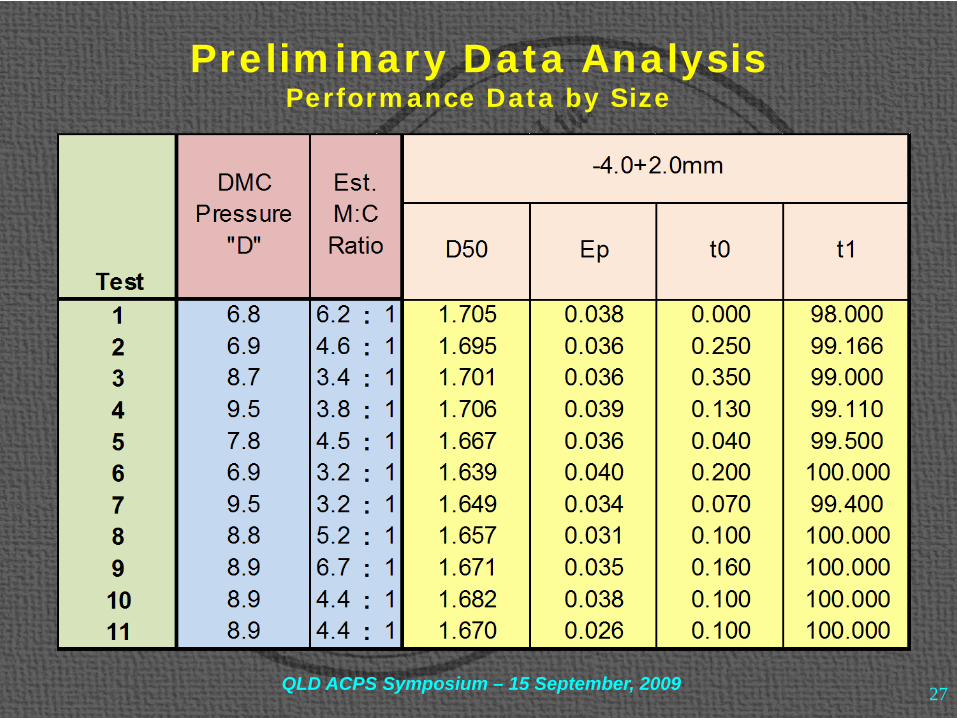
Preliminary Data AnalysisPerformance Data by Size
QLD ACPS Symposium – 15 September, 2009
28
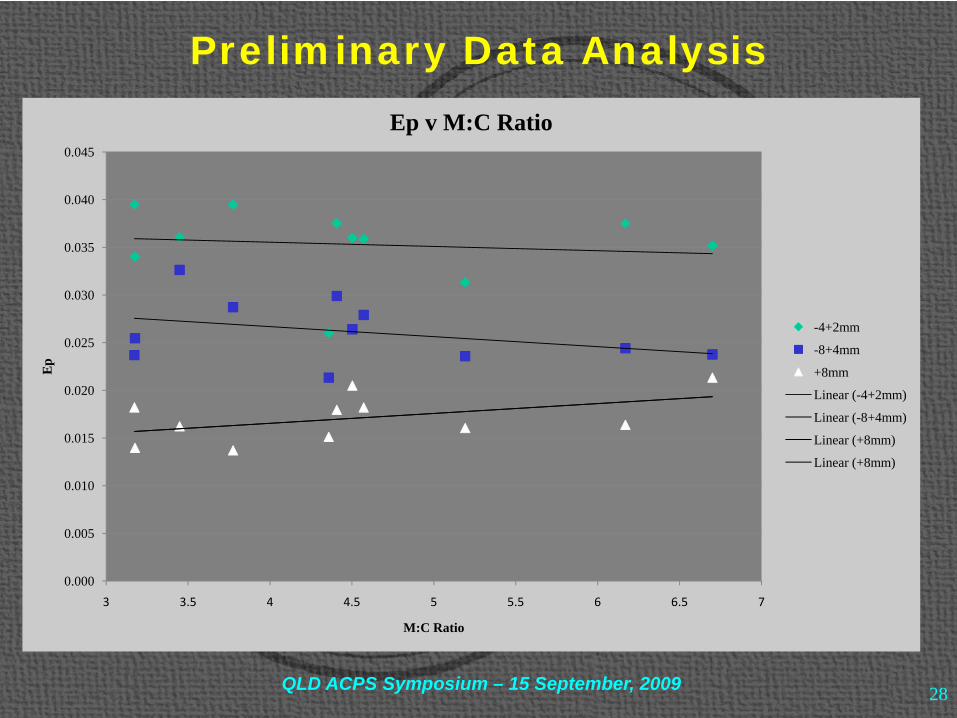
Preliminary Data Analysis
0.000
0.005
0.010
0.015
0.020
0.025
0.030
0.035
0.040
0.045
3 3.5 4 4.5 5 5.5 6 6.5 7
Ep
M:C Ratio
Ep v M:C Ratio
-4+2mm
-8+4mm
+8mm
Linear (-4+2mm)
Linear (-8+4mm)
Linear (+8mm)
Linear (+8mm)
QLD ACPS Symposium – 15 September, 2009
29
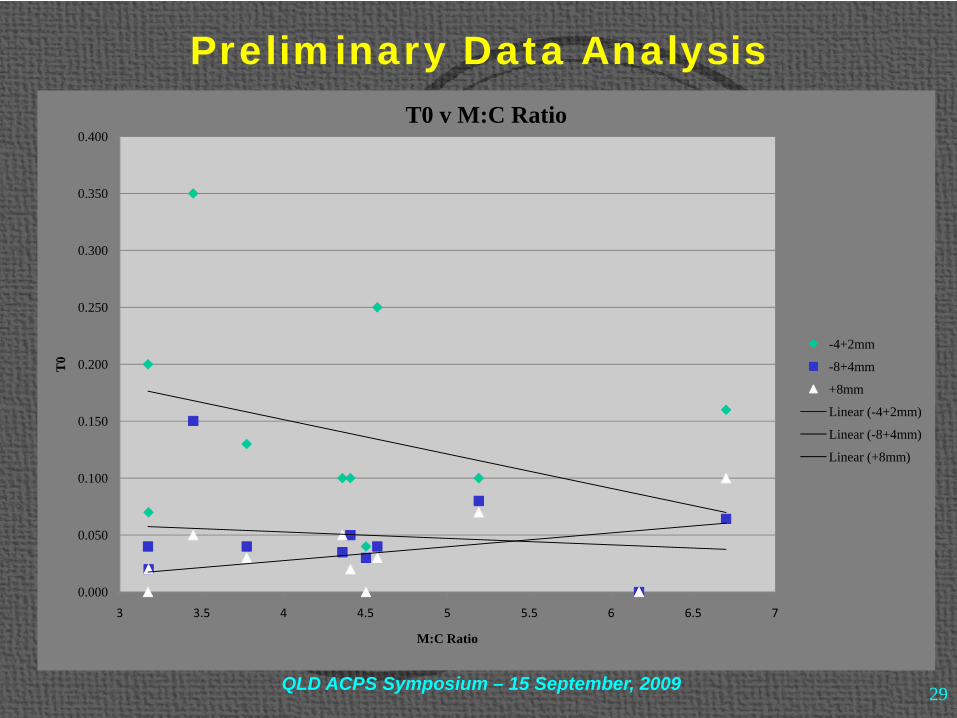
Preliminary Data Analysis
0.000
0.050
0.100
0.150
0.200
0.250
0.300
0.350
0.400
3 3.5 4 4.5 5 5.5 6 6.5 7
T0
M:C Ratio
T0 v M:C Ratio
-4+2mm
-8+4mm
+8mm
Linear (-4+2mm)
Linear (-8+4mm)
Linear (+8mm)
QLD ACPS Symposium – 15 September, 2009
30
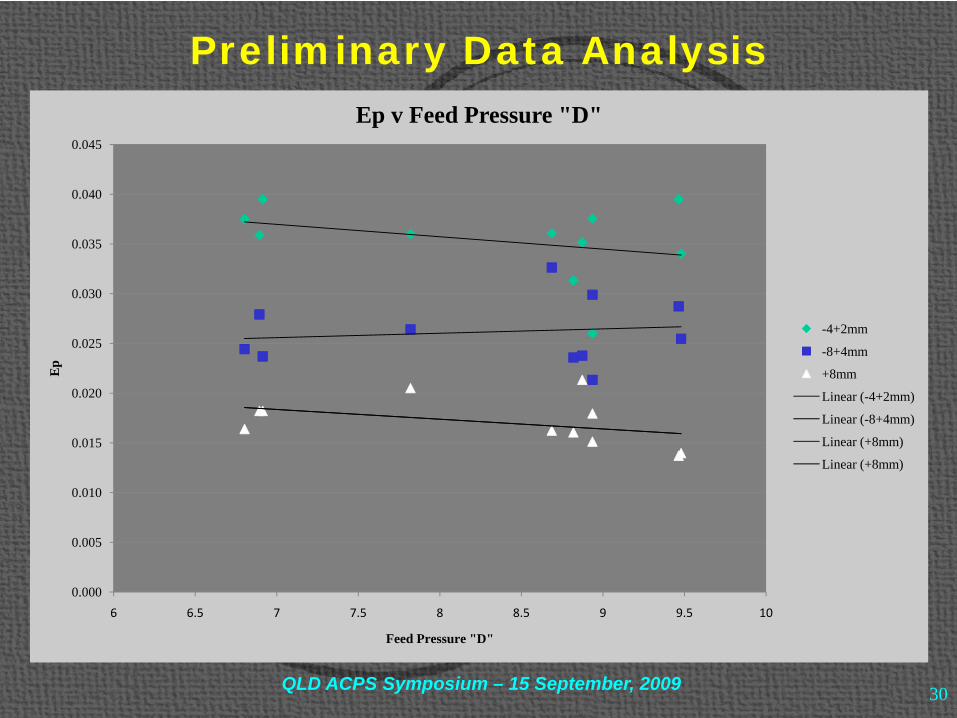
Preliminary Data Analysis
0.000
0.005
0.010
0.015
0.020
0.025
0.030
0.035
0.040
0.045
6 6.5 7 7.5 8 8.5 9 9.5 10
Ep
Feed Pressure "D"
Ep v Feed Pressure "D"
-4+2mm
-8+4mm
+8mm
Linear (-4+2mm)
Linear (-8+4mm)
Linear (+8mm)
Linear (+8mm)
QLD ACPS Symposium – 15 September, 2009
31
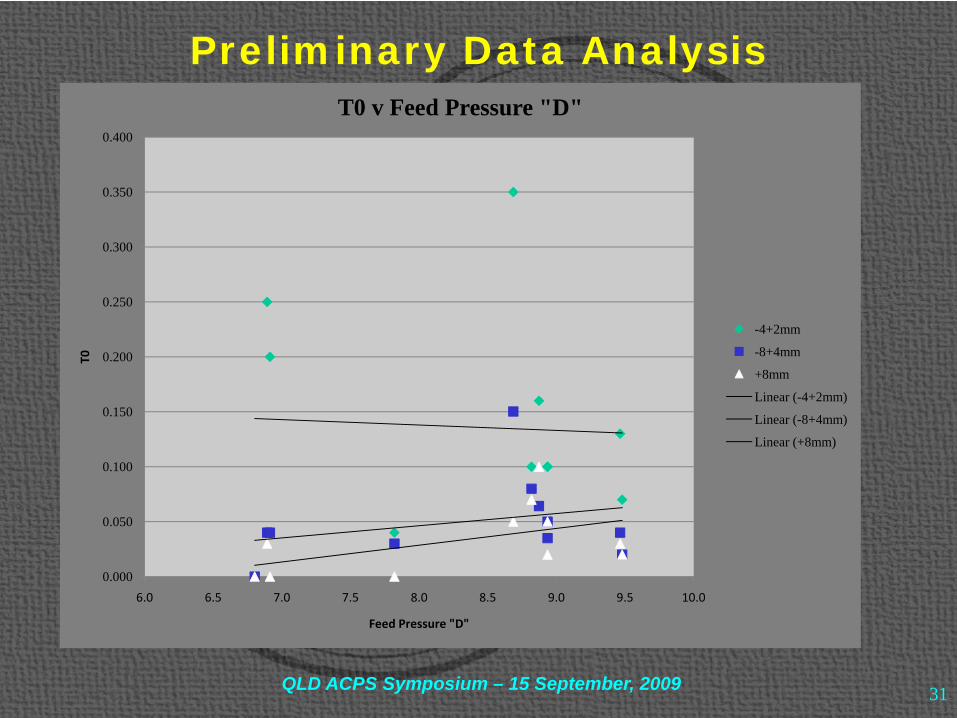
Preliminary Data Analysis
0.000
0.050
0.100
0.150
0.200
0.250
0.300
0.350
0.400
6.0 6.5 7.0 7.5 8.0 8.5 9.0 9.5 10.0
T0
Feed Pressure "D"
T0 v Feed Pressure "D"
-4+2mm
-8+4mm
+8mm
Linear (-4+2mm)
Linear (-8+4mm)
Linear (+8mm)
QLD ACPS Symposium – 15 September, 2009
32
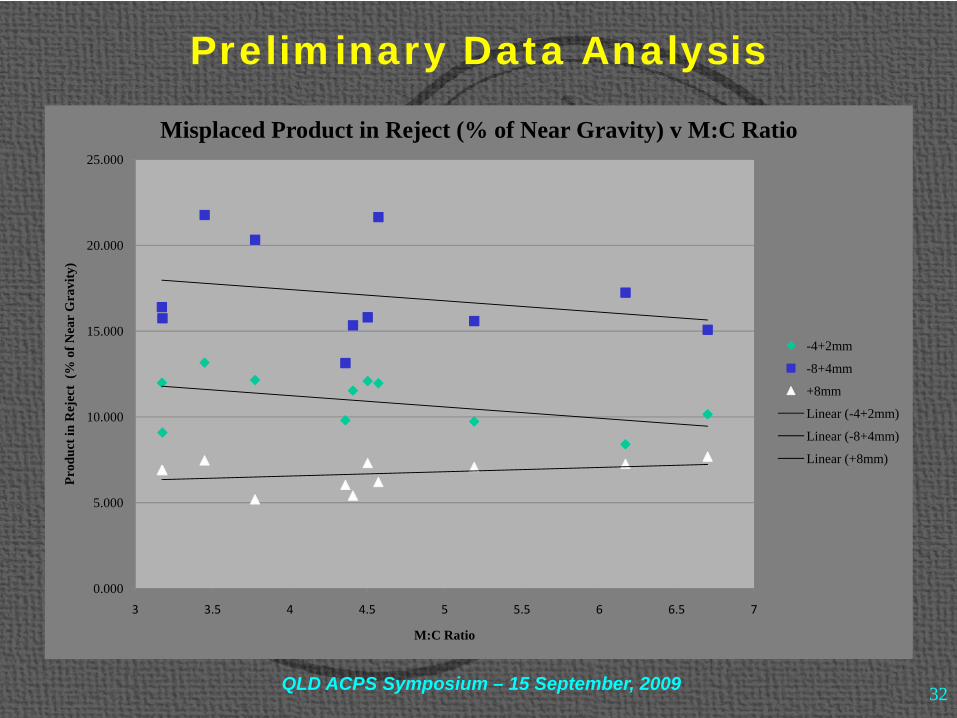
Preliminary Data Analysis
0.000
5.000
10.000
15.000
20.000
25.000
3 3.5 4 4.5 5 5.5 6 6.5 7
Prod
uct i
n R
ejec
t (%
of N
ear
Gra
vity
)
M:C Ratio
Misplaced Product in Reject (% of Near Gravity) v M:C Ratio
-4+2mm
-8+4mm
+8mm
Linear (-4+2mm)
Linear (-8+4mm)
Linear (+8mm)
QLD ACPS Symposium – 15 September, 2009
33
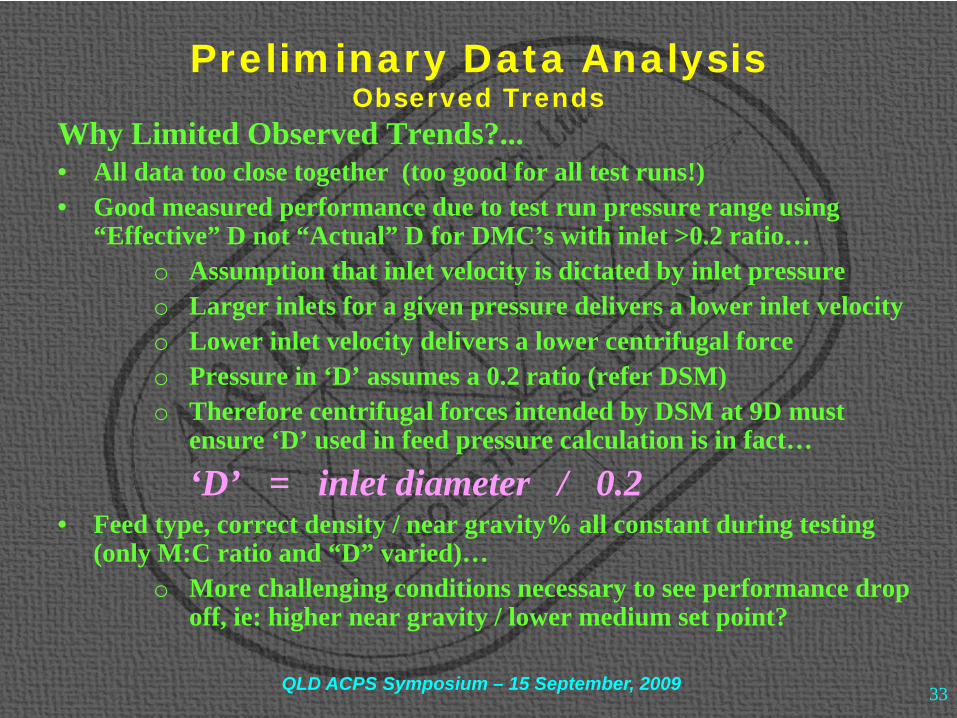
Preliminary Data AnalysisObserved Trends
Why Limited Observed Trends?...• All data too close together (too good for all test runs!)• Good measured performance due to test run pressure range using
“Effective” D not “Actual” D for DMC’s with inlet >0.2 ratio…o Assumption that inlet velocity is dictated by inlet pressureo Larger inlets for a given pressure delivers a lower inlet velocityo Lower inlet velocity delivers a lower centrifugal forceo Pressure in ‘D’ assumes a 0.2 ratio (refer DSM)o Therefore centrifugal forces intended by DSM at 9D must
ensure ‘D’ used in feed pressure calculation is in fact…
‘D’ = inlet diameter / 0.2• Feed type, correct density / near gravity% all constant during testing
(only M:C ratio and “D” varied)…o More challenging conditions necessary to see performance drop
off, ie: higher near gravity / lower medium set point?
QLD ACPS Symposium – 15 September, 2009
34
Preliminary Data AnalysisObserved Trends
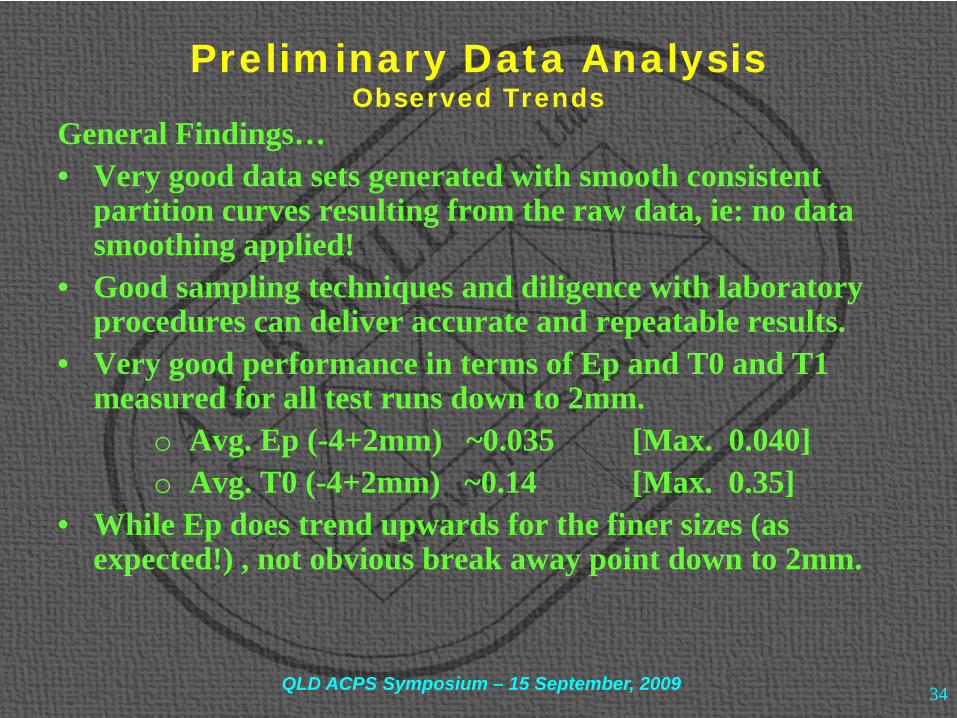
General Findings…• Very good data sets generated with smooth consistent
partition curves resulting from the raw data, ie: no data smoothing applied!
• Good sampling techniques and diligence with laboratory procedures can deliver accurate and repeatable results.
• Very good performance in terms of Ep and T0 and T1 measured for all test runs down to 2mm.
o Avg. Ep (-4+2mm) ~0.035 [Max. 0.040]o Avg. T0 (-4+2mm) ~0.14 [Max. 0.35]
• While Ep does trend upwards for the finer sizes (as expected!) , not obvious break away point down to 2mm.
QLD ACPS Symposium – 15 September, 2009
35
Preliminary Data AnalysisMedium Stability
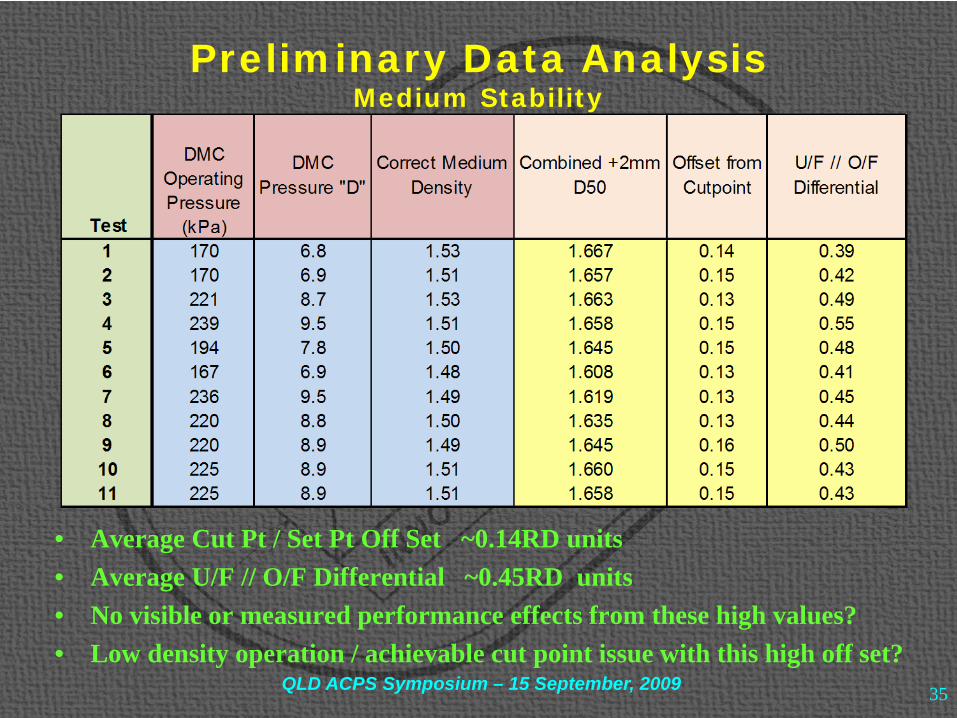
• Average Cut Pt / Set Pt Off Set ~0.14RD units• Average U/F // O/F Differential ~0.45RD units• No visible or measured performance effects from these high values?• Low density operation / achievable cut point issue with this high off set?
QLD ACPS Symposium – 15 September, 2009
36
Preliminary Data AnalysisDuplicate Test Run
Sampling Approach…• Increments were collected simultaneously during sampling period, with
an ‘A’ and ‘B’ sample being generated, ie: Test Runs 10 and 11.• Subjected to the same suite of analysis without lab being aware test runs
were any different / same.• Provides a quantitative guide to sampling and analysis errors in Partition
Curve generation / interpolation.
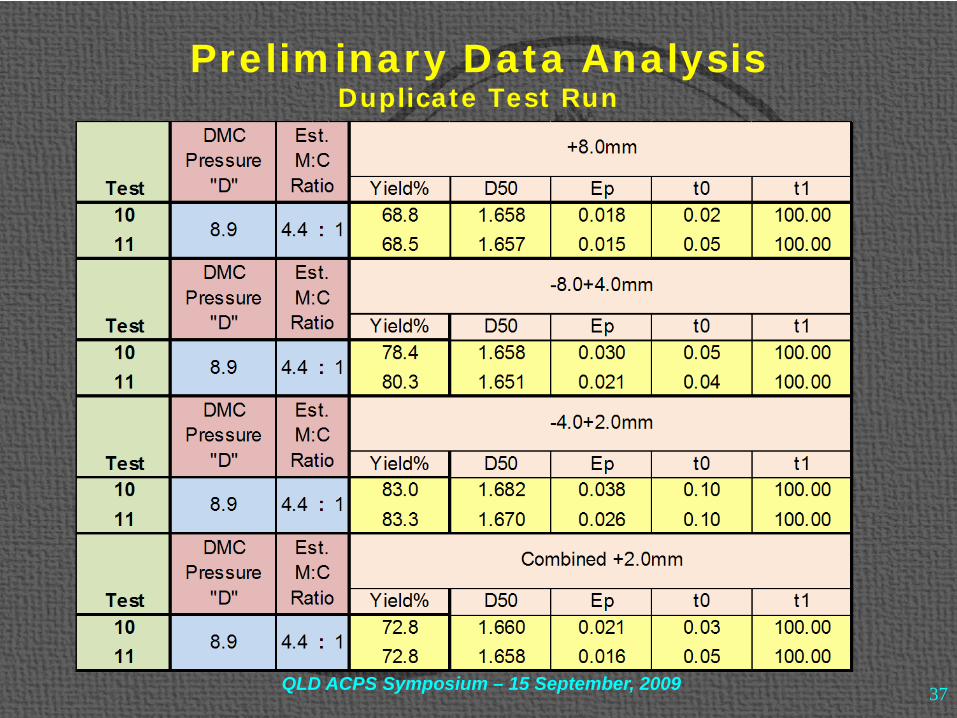
Outcomes…• Good agreement of all size fractions for Yield%, Ep, T1 and T0.• Interpolation of parameters can contribute to errors due to curve shape
issues.o Use alternate models or manually fit data, ie: draw curve
QLD ACPS Symposium – 15 September, 2009
37
Preliminary Data AnalysisDuplicate Test Run
QLD ACPS Symposium – 15 September, 2009
38
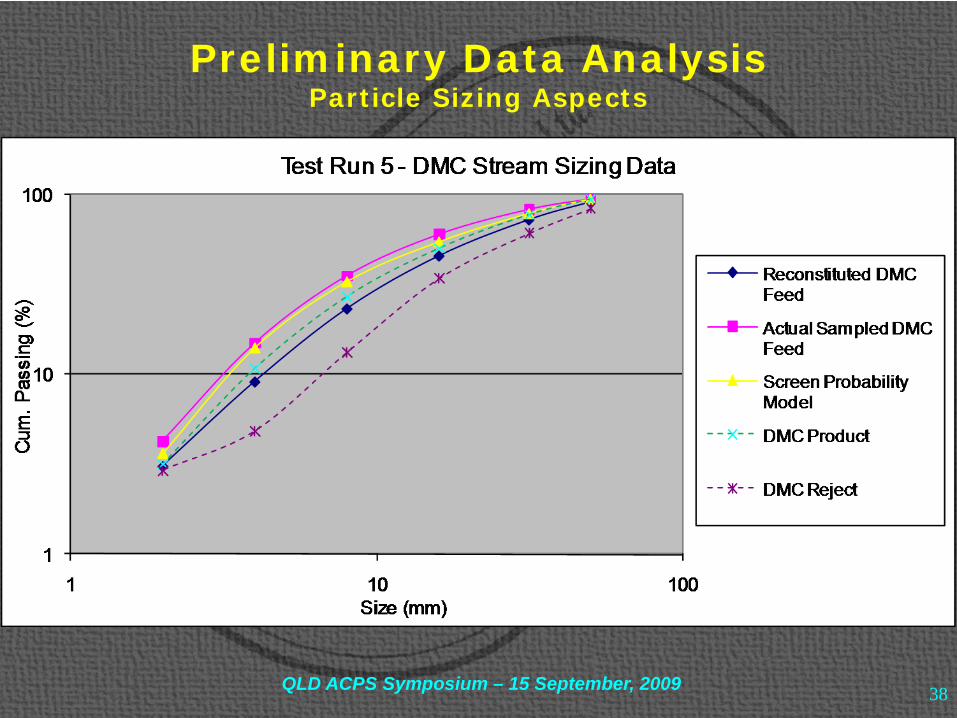
Preliminary Data AnalysisParticle Sizing Aspects
QLD ACPS Symposium – 15 September, 2009
39
Preliminary Data AnalysisParticle Sizing Aspects
• Sampled DMC feed generally finer than the predicted.o Some sampling aspects related to this stream (refer earlier
photo!)
• Predicted DMC feed uses Probability model applied to plant feed data.
• Predicted seems always finer than the recombined (similar to other literature).
• Further evaluation of all test run data continuing to investigate observed treads and assess impacts on efficiency parameter determination.
QLD ACPS Symposium – 15 September, 2009

40
Questions???
For a copy of this presentation goto…
www.abmylec.com.au/links
QLD ACPS Symposium – 15 September, 2009