Embed Size (px)
Citation preview
Accelerating the realisation of key interface
technologies in transport and energy
- the PNDC
Professor Graeme Burt
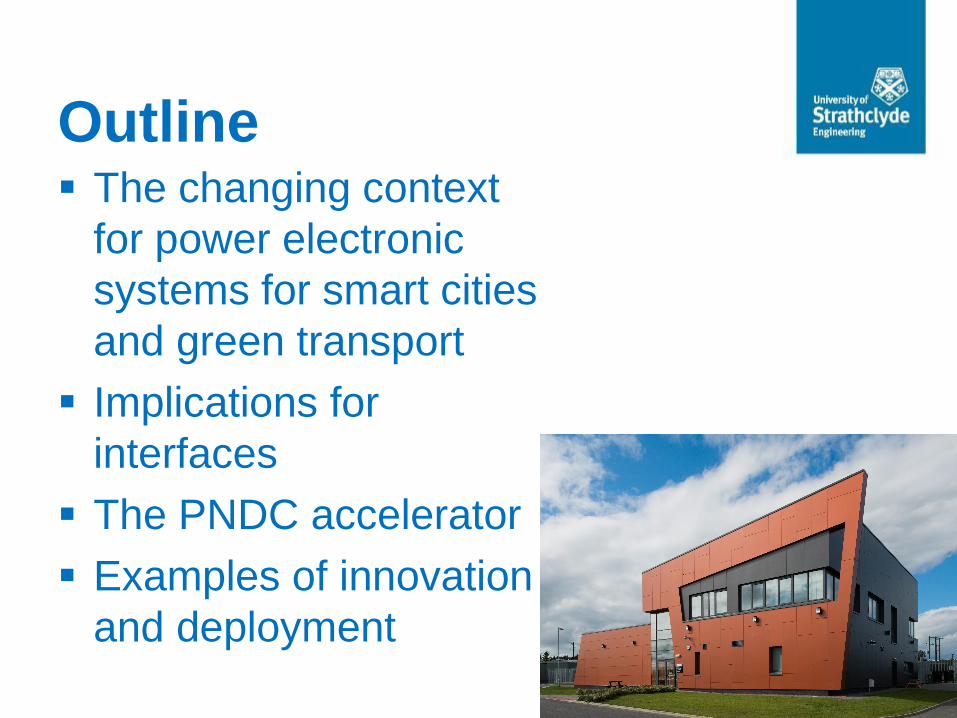
Outline The changing context
for power electronic
systems for smart cities
and green transport
Implications for
interfaces
The PNDC accelerator
Examples of innovation
and deployment
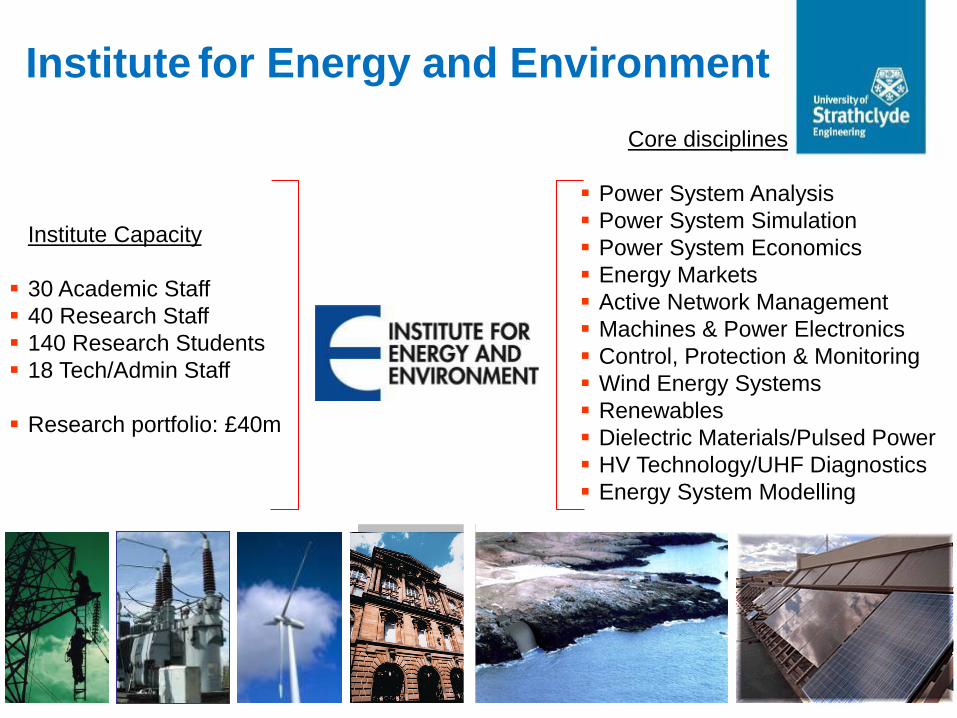
Core disciplines
Power System Analysis
Power System Simulation
Power System Economics
Energy Markets
Active Network Management
Machines & Power Electronics
Control, Protection & Monitoring
Wind Energy Systems
Renewables
Dielectric Materials/Pulsed Power
HV Technology/UHF Diagnostics
Energy System Modelling
Institute Capacity
30 Academic Staff
40 Research Staff
140 Research Students
18 Tech/Admin Staff
Research portfolio: £40m
Institute for Energy and Environment
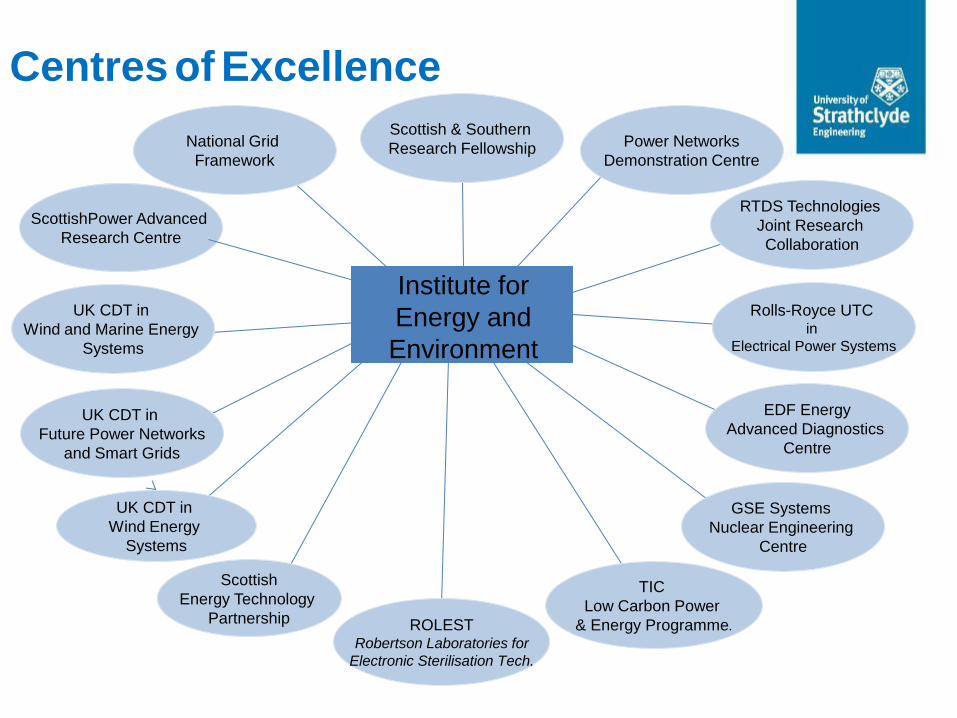
Centres of Excellence
ROLEST Robertson Laboratories for
Electronic Sterilisation Tech.
Institute for
Energy and
Environment
Power Networks
Demonstration Centre
Rolls-Royce UTC in
Electrical Power Systems
Scottish
Energy Technology
Partnership
ScottishPower Advanced
Research Centre
UK CDT in
Wind Energy
Systems
UK CDT in
Wind and Marine Energy
Systems
UK CDT in
Future Power Networks
and Smart Grids
National Grid
Framework
GSE Systems
Nuclear Engineering
Centre
EDF Energy
Advanced Diagnostics
Centre
Scottish & Southern
Research Fellowship
RTDS Technologies
Joint Research
Collaboration
TIC
Low Carbon Power
& Energy Programme.

CONTEXT
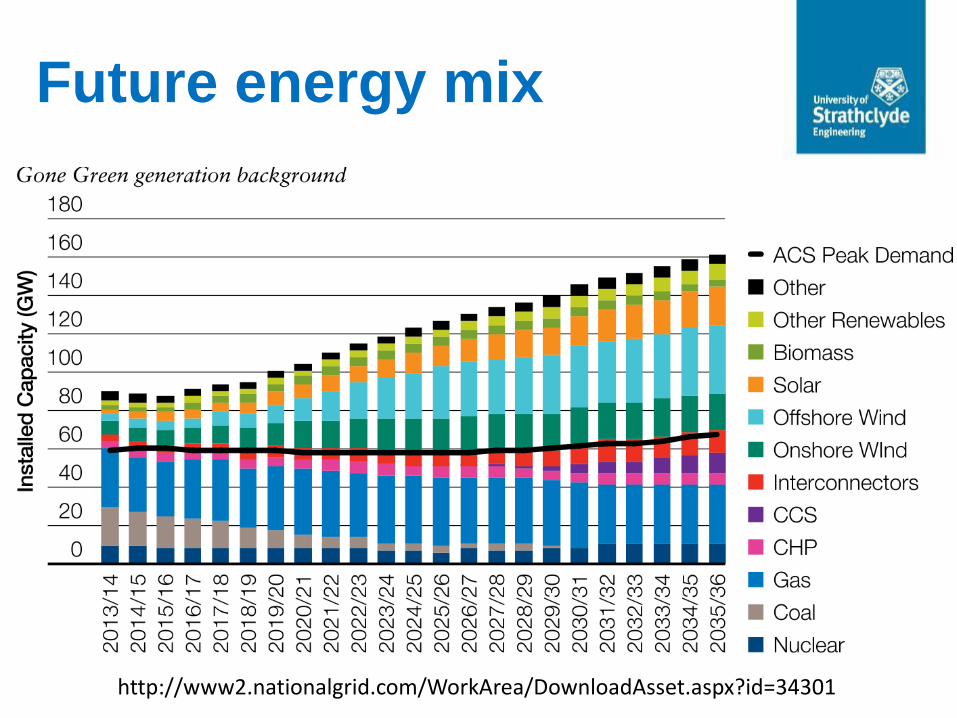
http://www2.nationalgrid.com/WorkArea/DownloadAsset.aspx?id=34301
Future energy mix
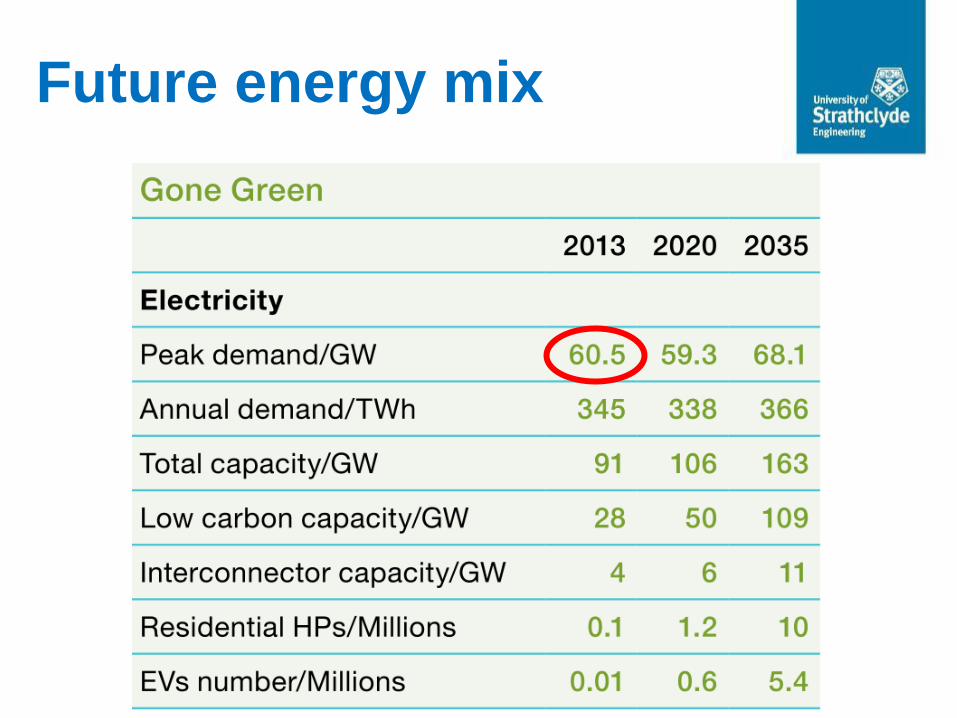
Future energy mix
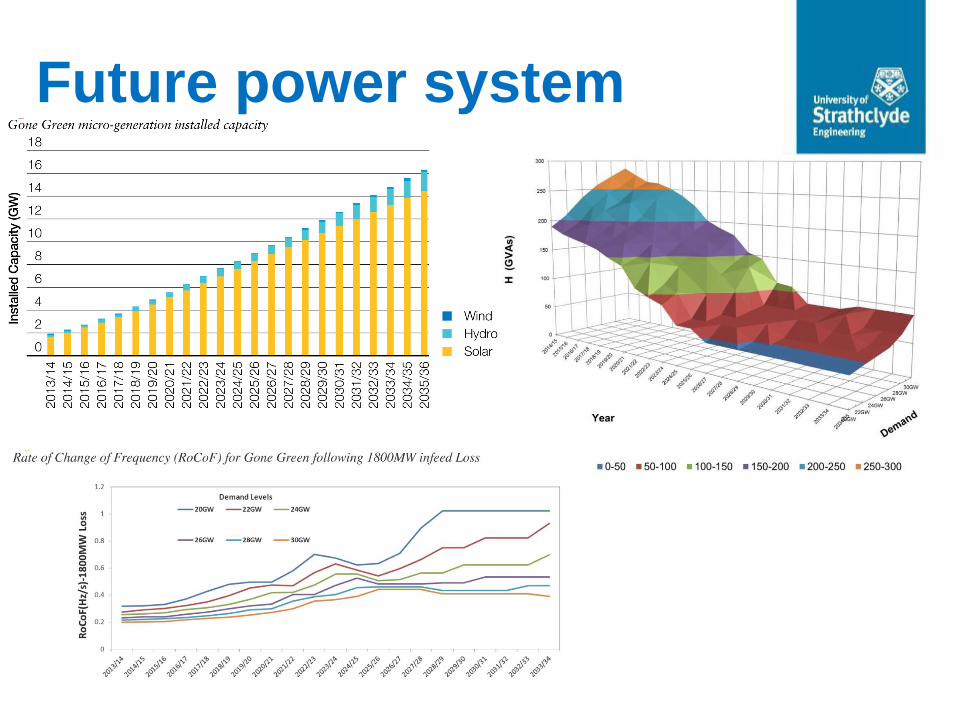
Future power system
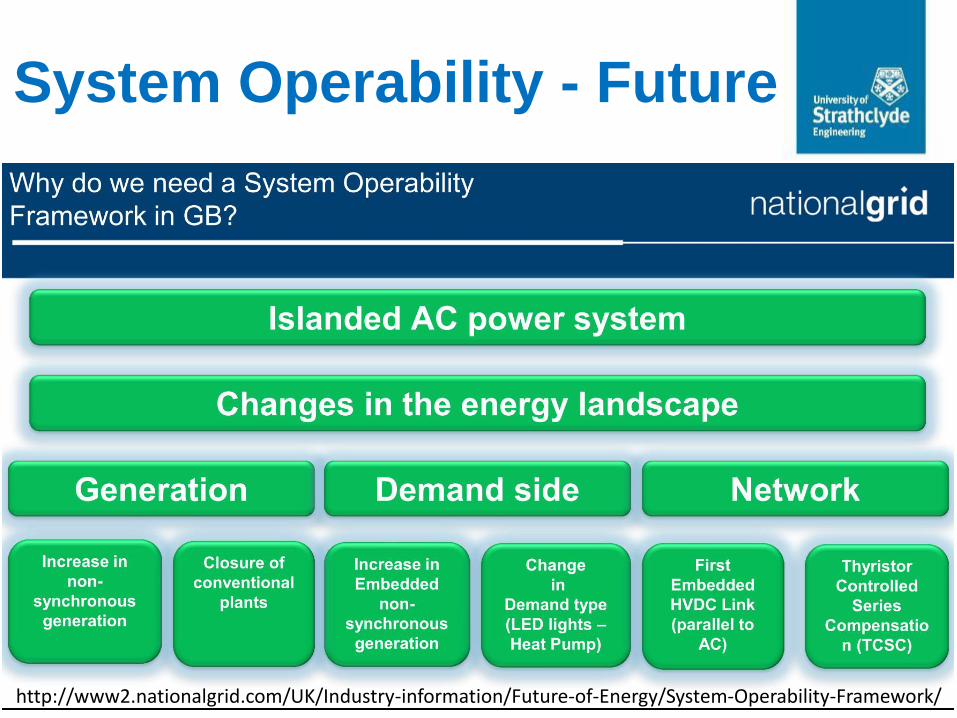
System Operability - Future
http://www2.nationalgrid.com/UK/Industry-information/Future-of-Energy/System-Operability-Framework/
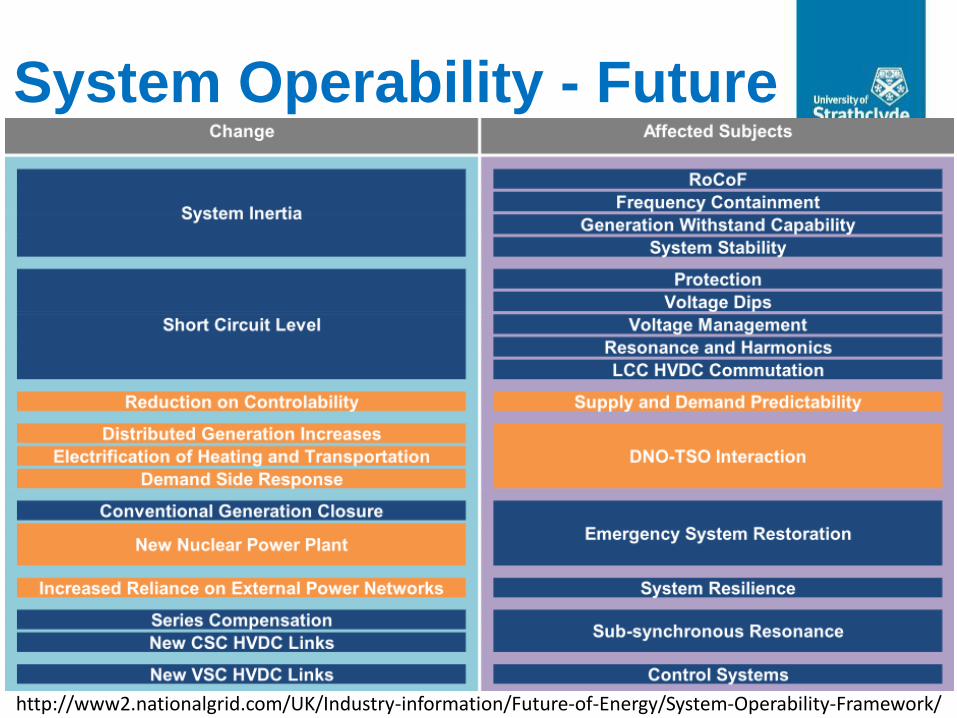
System Operability - Future
http://www2.nationalgrid.com/UK/Industry-information/Future-of-Energy/System-Operability-Framework/
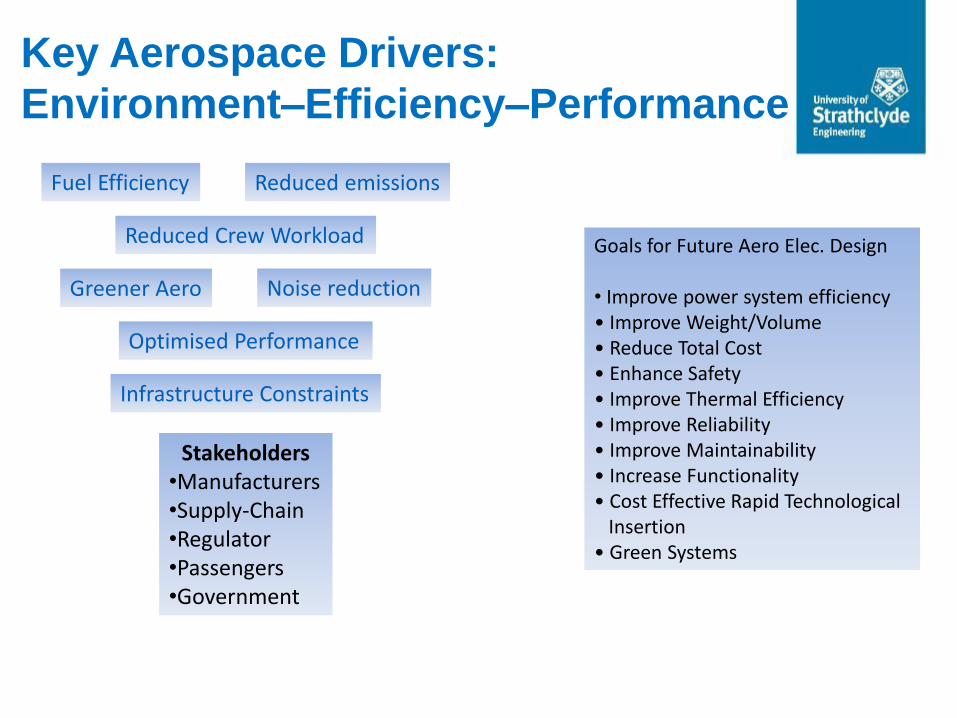
Key Aerospace Drivers:
Environment–Efficiency–Performance
Noise reduction Greener Aero
Infrastructure Constraints
Reduced Crew Workload
Optimised Performance
Fuel Efficiency Reduced emissions
Stakeholders •Manufacturers •Supply-Chain •Regulator •Passengers •Government
Goals for Future Aero Elec. Design • Improve power system efficiency • Improve Weight/Volume • Reduce Total Cost • Enhance Safety • Improve Thermal Efficiency • Improve Reliability • Improve Maintainability • Increase Functionality • Cost Effective Rapid Technological Insertion • Green Systems
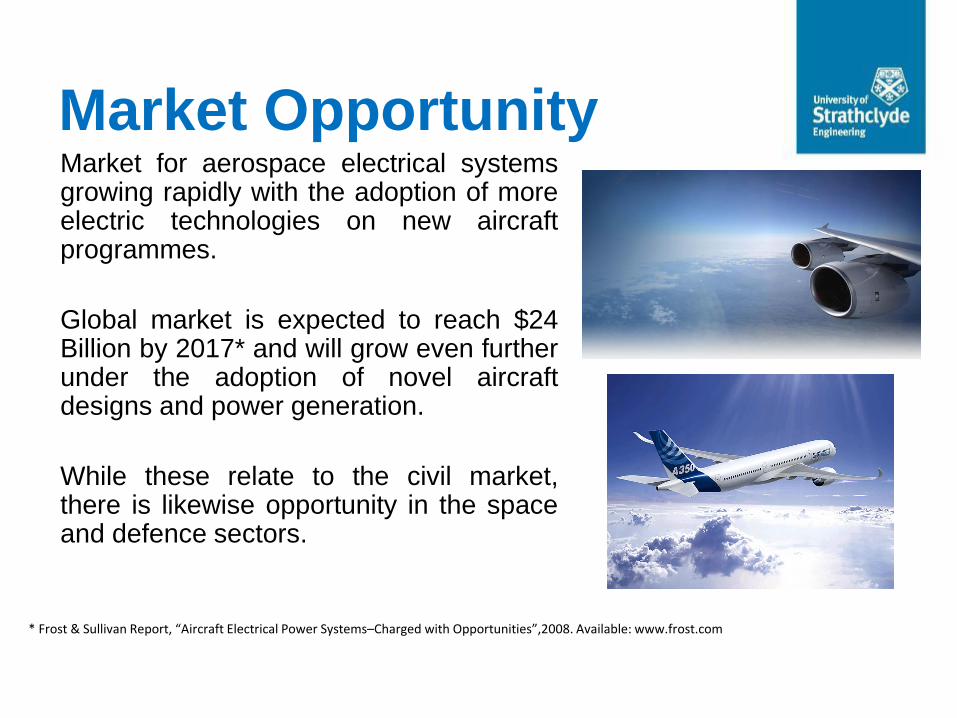
Market Opportunity Market for aerospace electrical systems growing rapidly with the adoption of more electric technologies on new aircraft programmes.
Global market is expected to reach $24 Billion by 2017* and will grow even further under the adoption of novel aircraft designs and power generation.
While these relate to the civil market, there is likewise opportunity in the space and defence sectors.
* Frost & Sullivan Report, “Aircraft Electrical Power Systems–Charged with Opportunities”,2008. Available: www.frost.com

IMPLICATIONS

Challenges for measurements • Lower system inertia
– Frequency is never “nominal”
– ROCOF levels are rising
• Harmonics
• Inter-harmonics
• Unbalance, Faults
• Inaccessibility, Voltage, Weather
• “Loose” standards
• How do we calibrate? – Meters (wideband)
– Instrumentation
– On-site? Off-site?
– How do we ensure robust measurement in “real world” conditions? Can we?
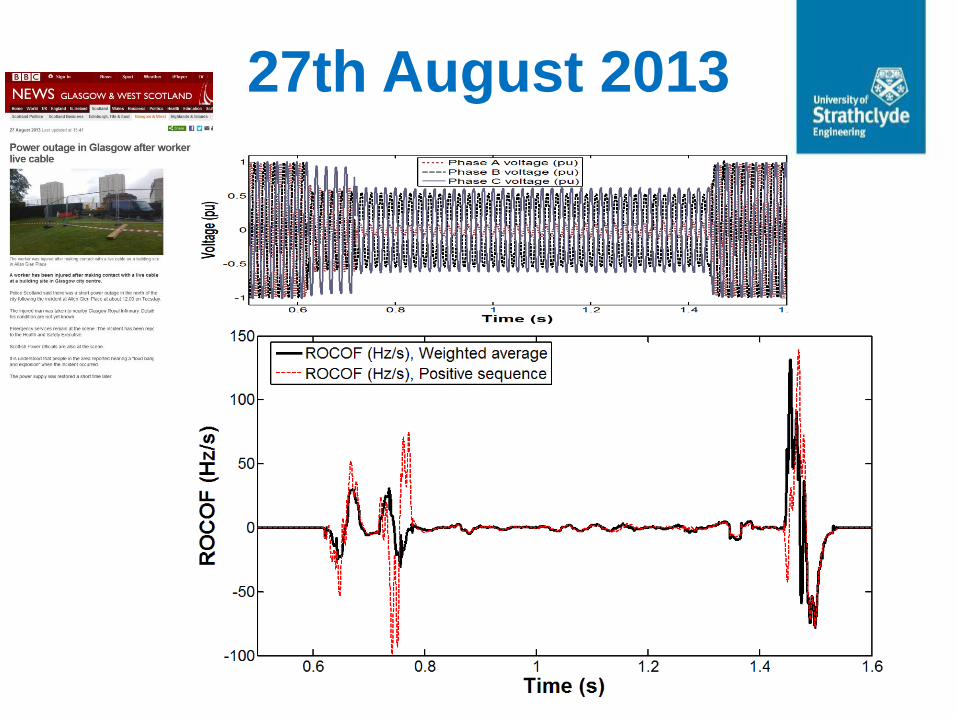
27th August 2013
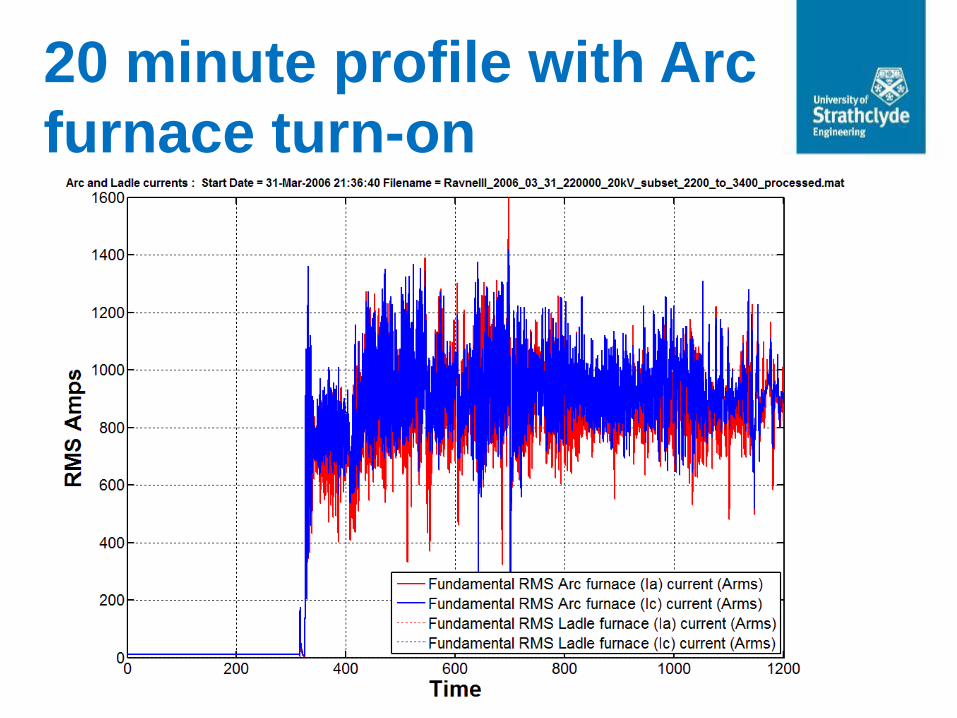
20 minute profile with Arc
furnace turn-on
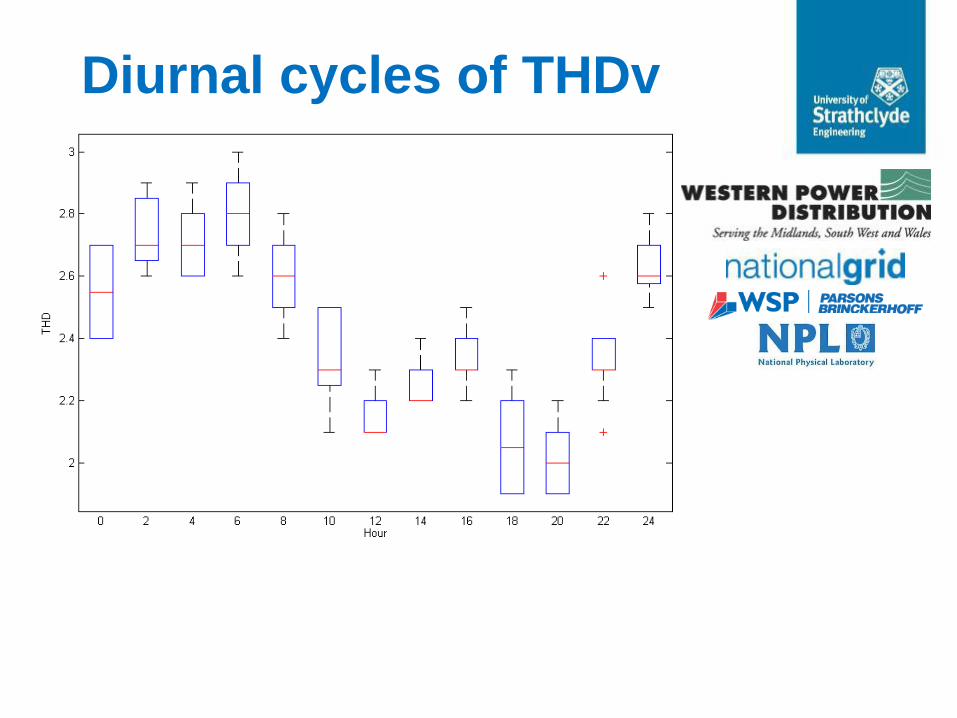
Diurnal cycles of THDv
Weak systems implications
• Higher frequency dynamics and voltage/reactive power
issues
• Potential for maloperation of frequency-based protection
• Constraints on renewables
• Low fault levels, delayed (or maybe too fast?) converter
fault responses?
• Emulation of inertia?
• Openness of grid codes and standards
• Fidelity of measurements
• Predictability of behaviour & simulation models
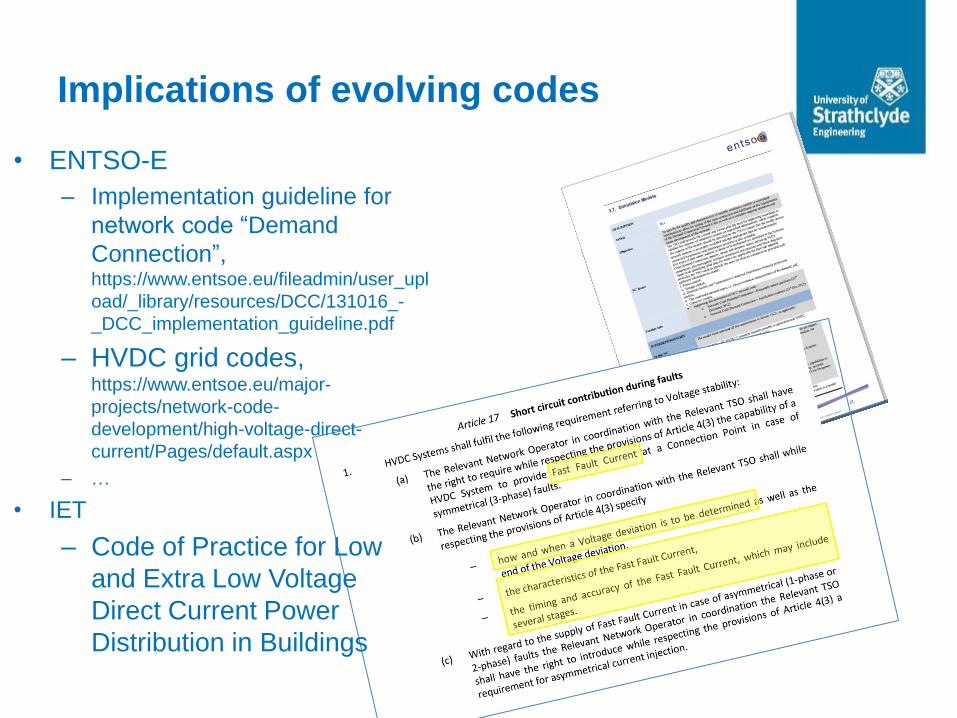
Implications of evolving codes
• ENTSO-E
– Implementation guideline for
network code “Demand
Connection”, https://www.entsoe.eu/fileadmin/user_upl
oad/_library/resources/DCC/131016_-
_DCC_implementation_guideline.pdf
– HVDC grid codes, https://www.entsoe.eu/major-
projects/network-code-
development/high-voltage-direct-
current/Pages/default.aspx
– …
• IET
– Code of Practice for Low
and Extra Low Voltage
Direct Current Power
Distribution in Buildings
PNDC – SMART GRID ACCELERATOR
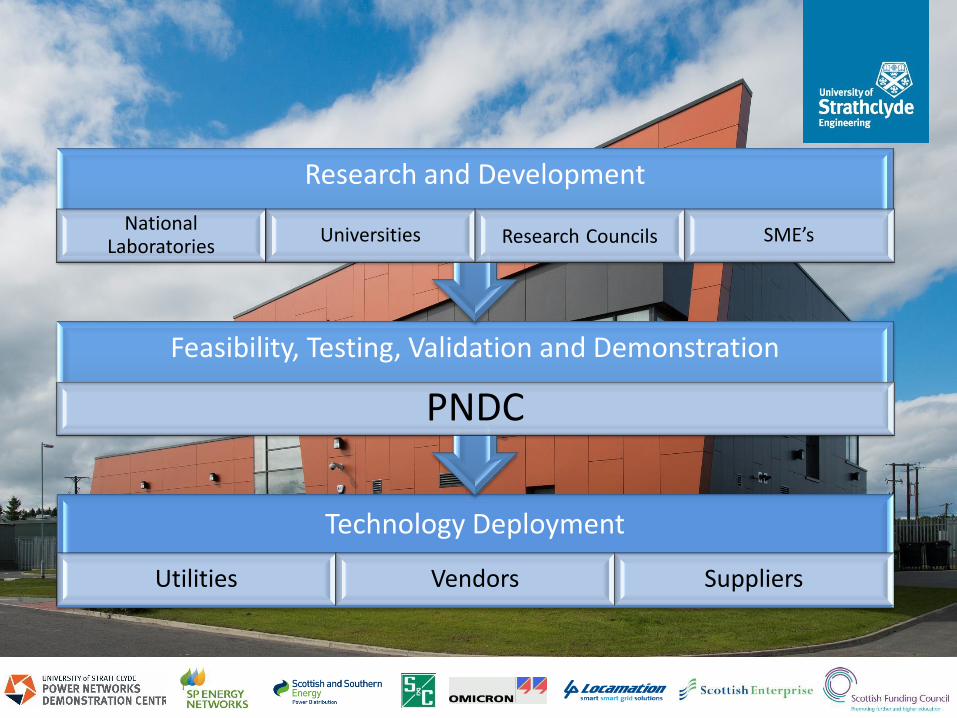
Technology Deployment
Utilities Vendors Suppliers
Feasibility, Testing, Validation and Demonstration
PNDC
Research and Development
National Laboratories
Universities Research Councils SME’s
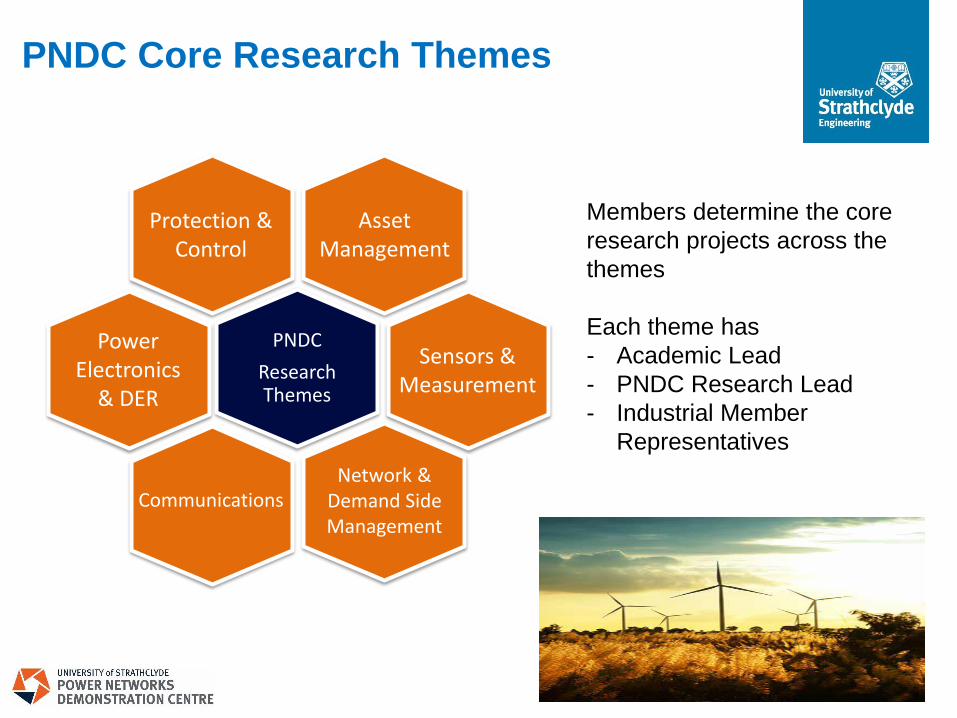
PNDC Core Research Themes
PNDC
Research Themes
Protection & Control
Power Electronics
& DER
Communications
Asset Management
Sensors & Measurement
Network & Demand Side Management
Members determine the core
research projects across the
themes
Each theme has
- Academic Lead
- PNDC Research Lead
- Industrial Member
Representatives
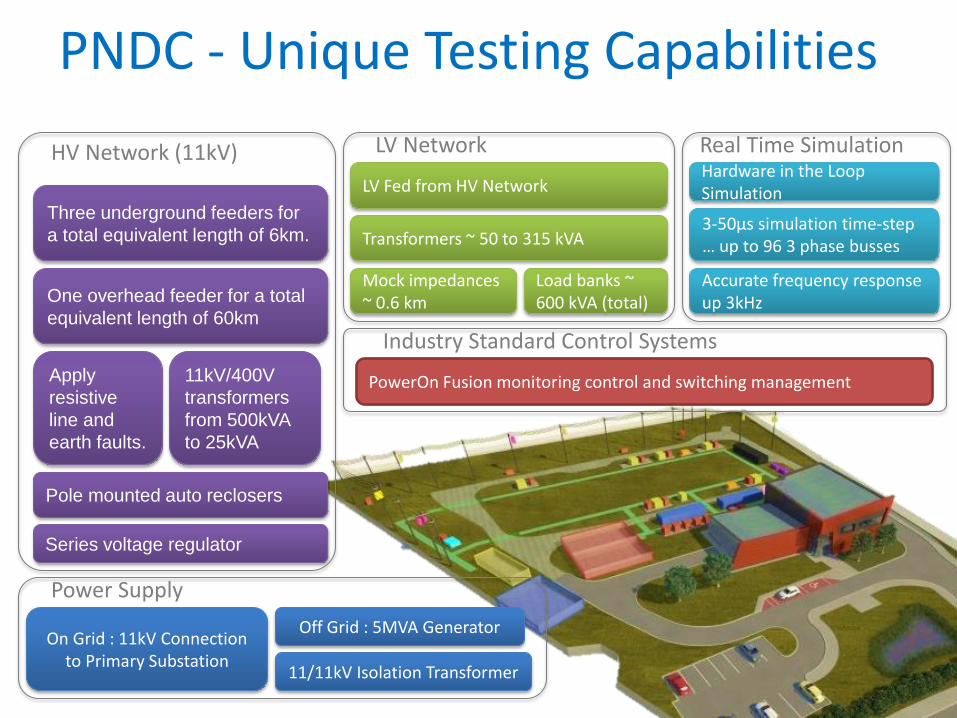
PNDC - Unique Testing Capabilities
On Grid : 11kV Connection to Primary Substation
11/11kV Isolation Transformer
Off Grid : 5MVA Generator
Power Supply
One overhead feeder for a total
equivalent length of 60km
Pole mounted auto reclosers
Three underground feeders for
a total equivalent length of 6km.
Series voltage regulator
11kV/400V
transformers
from 500kVA
to 25kVA
Apply
resistive
line and
earth faults.
HV Network (11kV)
Transformers ~ 50 to 315 kVA
Mock impedances ~ 0.6 km
Load banks ~ 600 kVA (total)
LV Fed from HV Network
LV Network
3-50µs simulation time-step … up to 96 3 phase busses
Accurate frequency response up 3kHz
Hardware in the Loop Simulation
Real Time Simulation
PowerOn Fusion monitoring control and switching management
Industry Standard Control Systems
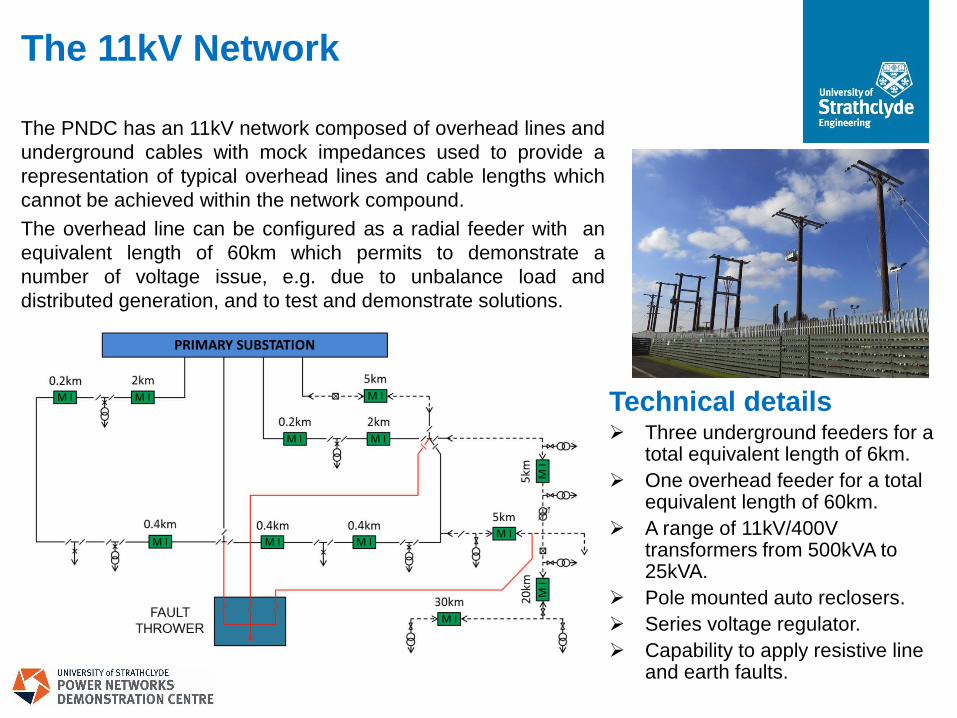
The 11kV Network
Technical details Three underground feeders for a
total equivalent length of 6km.
One overhead feeder for a total equivalent length of 60km.
A range of 11kV/400V transformers from 500kVA to 25kVA.
Pole mounted auto reclosers.
Series voltage regulator.
Capability to apply resistive line and earth faults.
The PNDC has an 11kV network composed of overhead lines and
underground cables with mock impedances used to provide a
representation of typical overhead lines and cable lengths which
cannot be achieved within the network compound.
The overhead line can be configured as a radial feeder with an
equivalent length of 60km which permits to demonstrate a
number of voltage issue, e.g. due to unbalance load and
distributed generation, and to test and demonstrate solutions.
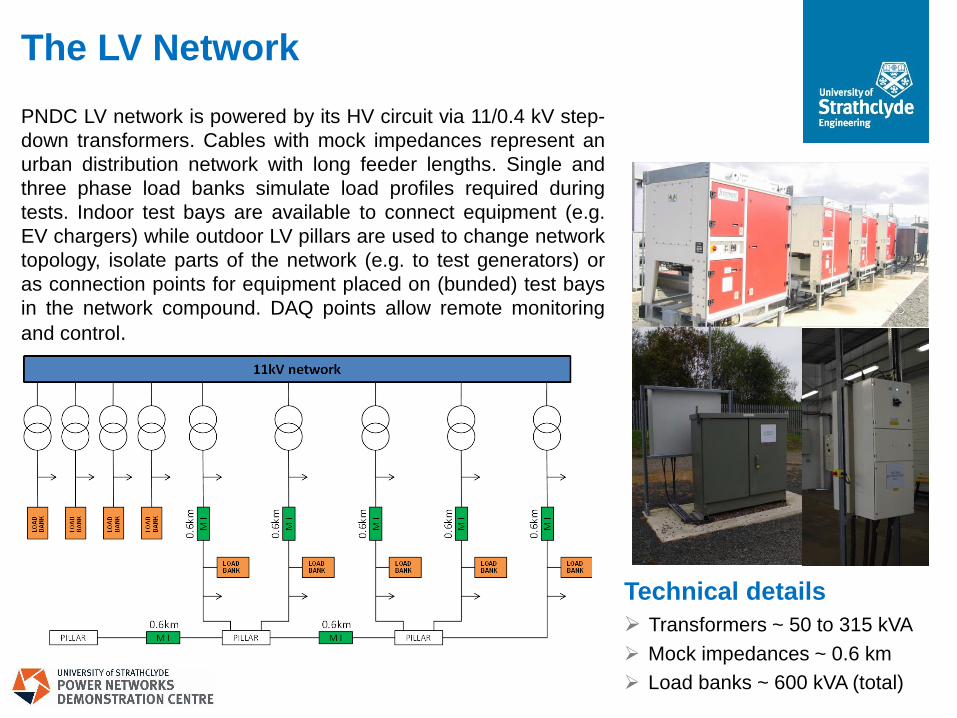
Technical details
Transformers ~ 50 to 315 kVA
Mock impedances ~ 0.6 km
Load banks ~ 600 kVA (total)
PNDC LV network is powered by its HV circuit via 11/0.4 kV step-
down transformers. Cables with mock impedances represent an
urban distribution network with long feeder lengths. Single and
three phase load banks simulate load profiles required during
tests. Indoor test bays are available to connect equipment (e.g.
EV chargers) while outdoor LV pillars are used to change network
topology, isolate parts of the network (e.g. to test generators) or
as connection points for equipment placed on (bunded) test bays
in the network compound. DAQ points allow remote monitoring
and control.
The LV Network
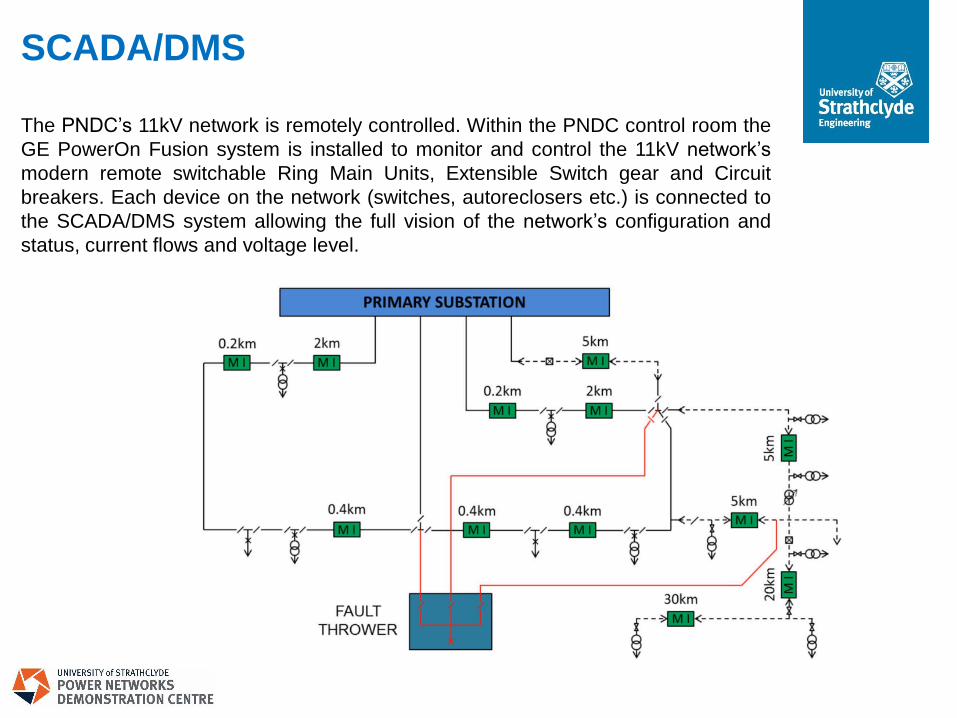
The PNDC’s 11kV network is remotely controlled. Within the PNDC control room the
GE PowerOn Fusion system is installed to monitor and control the 11kV network’s
modern remote switchable Ring Main Units, Extensible Switch gear and Circuit
breakers. Each device on the network (switches, autoreclosers etc.) is connected to
the SCADA/DMS system allowing the full vision of the network’s configuration and
status, current flows and voltage level.
SCADA/DMS
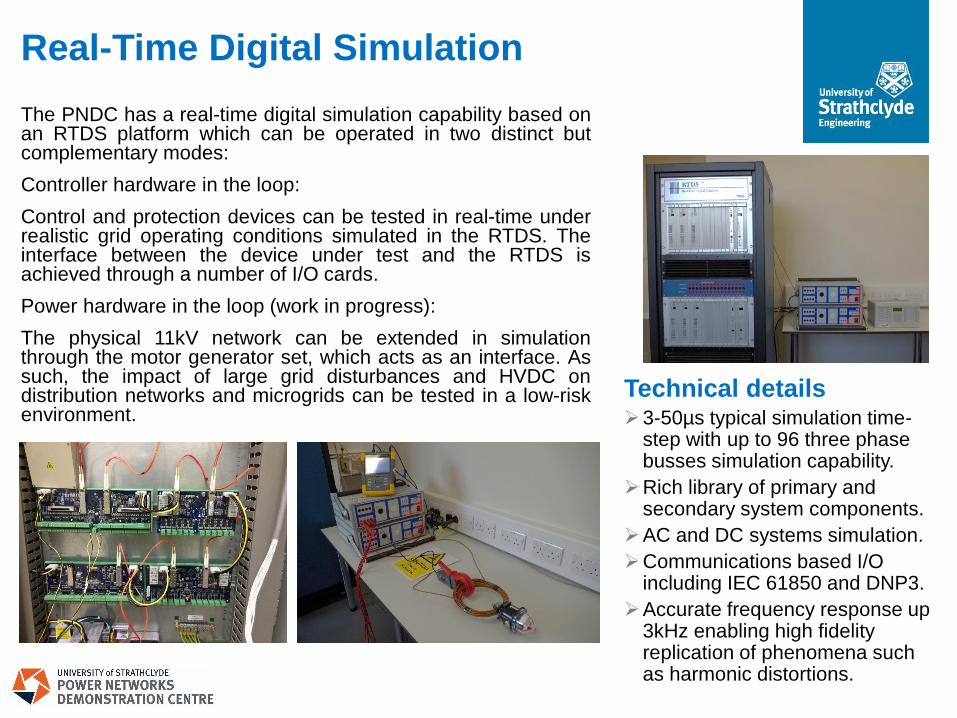
Technical details 3-50µs typical simulation time-
step with up to 96 three phase busses simulation capability.
Rich library of primary and secondary system components.
AC and DC systems simulation.
Communications based I/O including IEC 61850 and DNP3.
Accurate frequency response up 3kHz enabling high fidelity replication of phenomena such as harmonic distortions.
The PNDC has a real-time digital simulation capability based on an RTDS platform which can be operated in two distinct but complementary modes:
Controller hardware in the loop:
Control and protection devices can be tested in real-time under realistic grid operating conditions simulated in the RTDS. The interface between the device under test and the RTDS is achieved through a number of I/O cards.
Power hardware in the loop (work in progress):
The physical 11kV network can be extended in simulation through the motor generator set, which acts as an interface. As such, the impact of large grid disturbances and HVDC on distribution networks and microgrids can be tested in a low-risk environment.
Real-Time Digital Simulation
PNDC – EXAMPLE PROJECTS
~
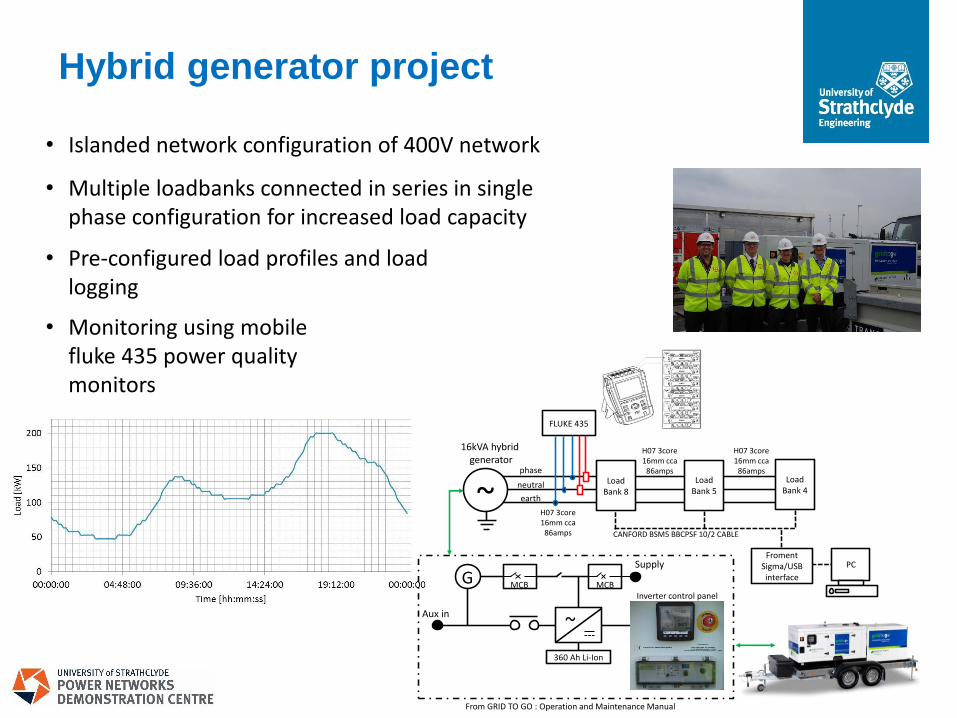
16kVA hybrid generator
phase
neutral
earth
LoadBank 8
LoadBank 5
LoadBank 4
FLUKE 435
PCFroment
Sigma/USB interface
CANFORD BSM5 BBCPSF 10/2 CABLE
G MCB MCB
~
360 Ah Li-Ion
Inverter control panel
Aux in
Supply
From GRID TO GO : Operation and Maintenance Manual
H07 3core 16mm cca
86amps
H07 3core 16mm cca
86amps
H07 3core 16mm cca
86amps
Hybrid generator project
• Islanded network configuration of 400V network
• Multiple loadbanks connected in series in single phase configuration for increased load capacity
• Pre-configured load profiles and load logging
• Monitoring using mobile fluke 435 power quality monitors

EV integration project
• Integration testing of induction charger
• Sensitivity study for penetration scenarios
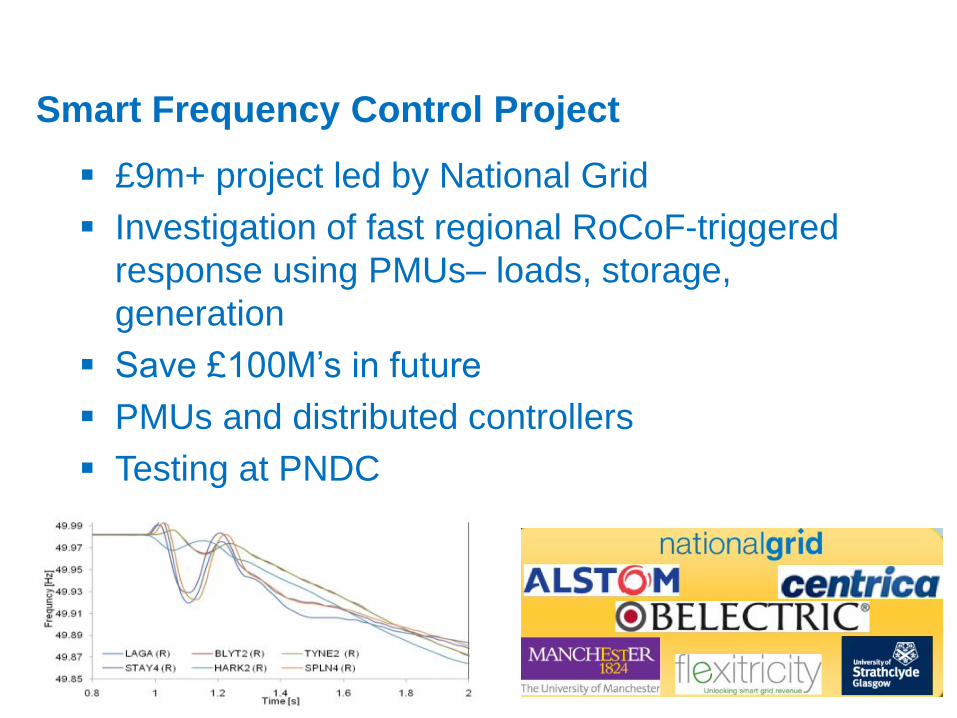
Smart Frequency Control Project
£9m+ project led by National Grid
Investigation of fast regional RoCoF-triggered
response using PMUs– loads, storage,
generation
Save £100M’s in future
PMUs and distributed controllers
Testing at PNDC
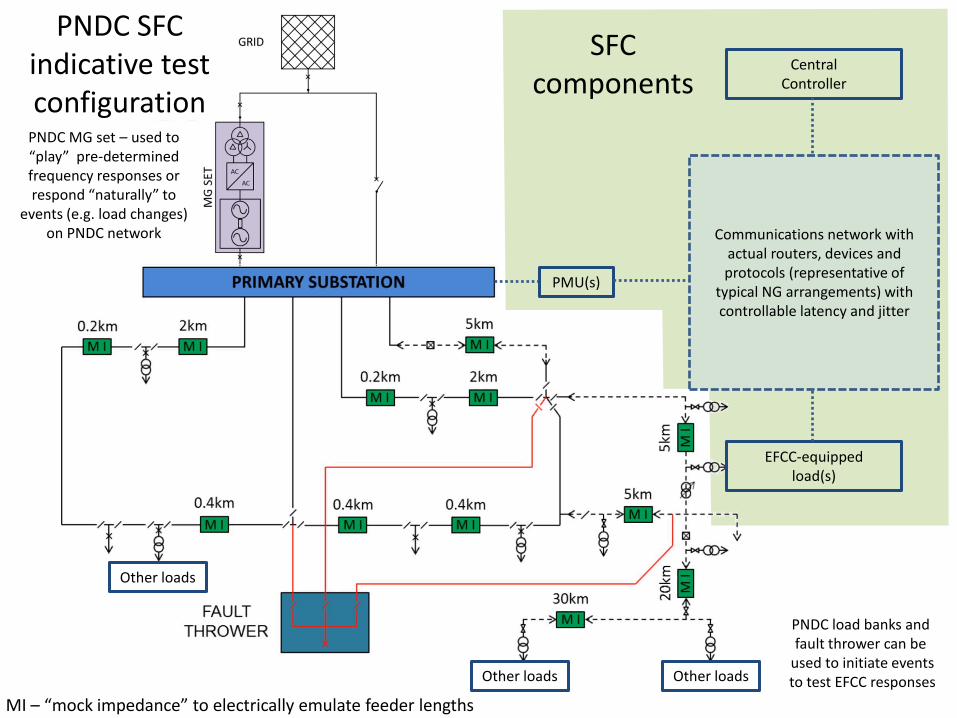
EFCC-equipped load(s)
PMU(s)
Other loads Other loads
Other loads
Central Controller
Communications network with actual routers, devices and protocols (representative of
typical NG arrangements) with controllable latency and jitter
PNDC SFC indicative test configuration
MI – “mock impedance” to electrically emulate feeder lengths
SFC components
PNDC MG set – used to “play” pre-determined frequency responses or respond “naturally” to
events (e.g. load changes) on PNDC network
PNDC load banks and fault thrower can be
used to initiate events to test EFCC responses

Protection of converter-dominated systems project
NG System Operability Framework
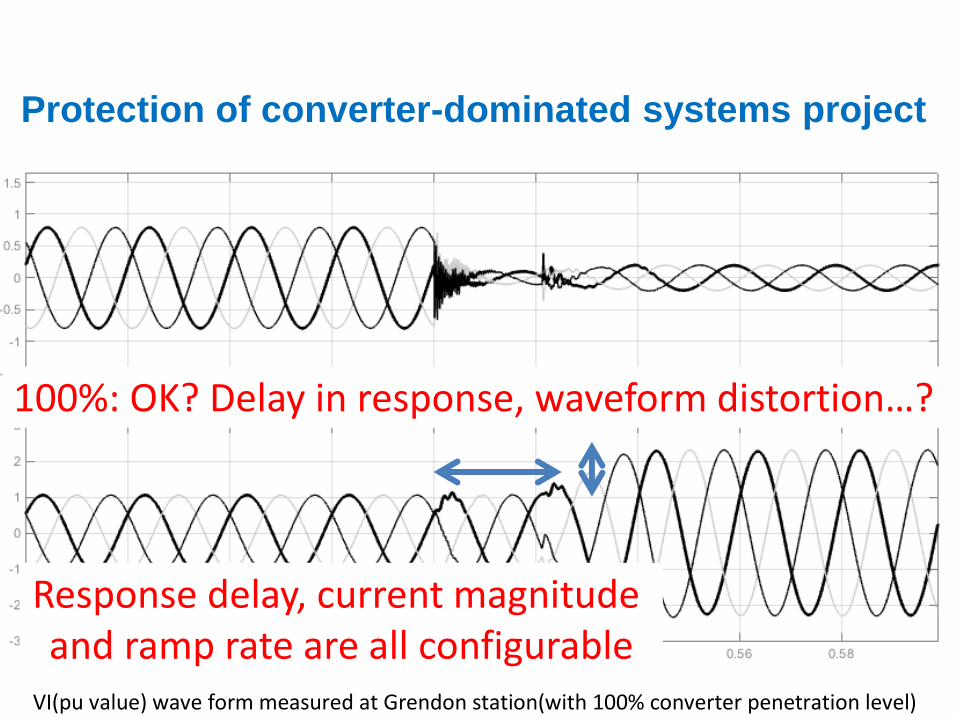
VI(pu value) wave form measured at Grendon station(with 100% converter penetration level)
100%: OK? Delay in response, waveform distortion…?
Protection of converter-dominated systems project
Response delay, current magnitude and ramp rate are all configurable
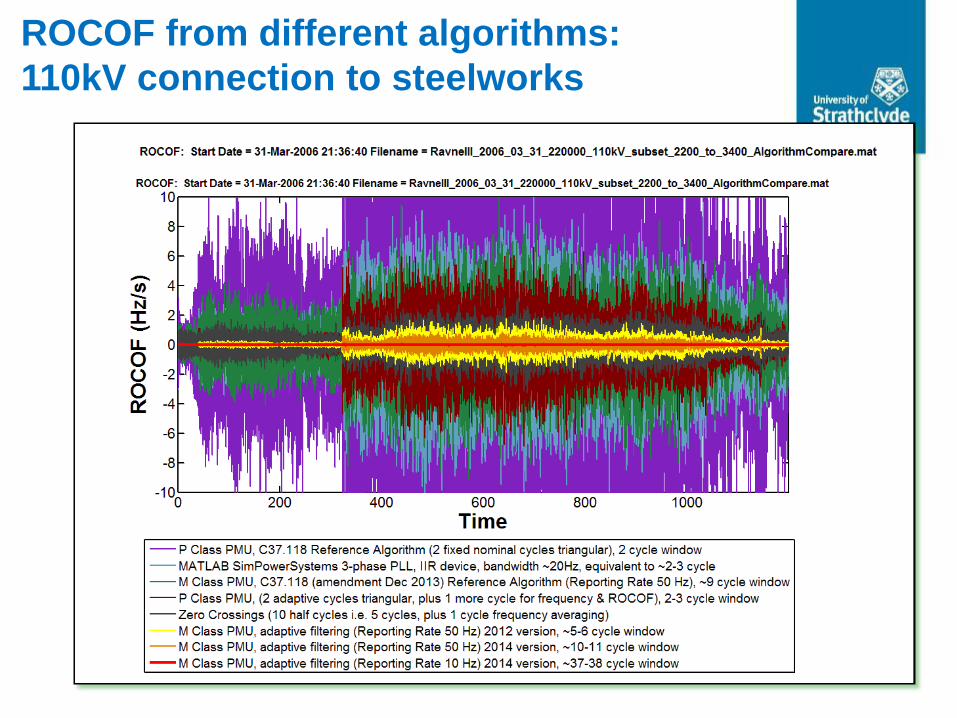
ROCOF from different algorithms:
110kV connection to steelworks

European EURAMET EMRP projects
ENG63 GridSens (PNDC, State
Estimation, Impedance and Network
Topology determination)
ENG52 SmartGrids II (PMUs and
PMU metrological calibration
infrastructure)

Conclusions
Changing sectors are
challenging power systems
integration solutions, with
implications for devices
and systems
Contributions to innovation
and technology
acceleration, including
opportunities for
collaboration and co-
funding