Embed Size (px)
Citation preview
Davis School District
130 North Main Street pg. 1 ph: 801-402-5305 Farmington, UT 84025 fax: 801-402-5240
Accessing & Interpreting SAGE Student Reports A Guide for Parents
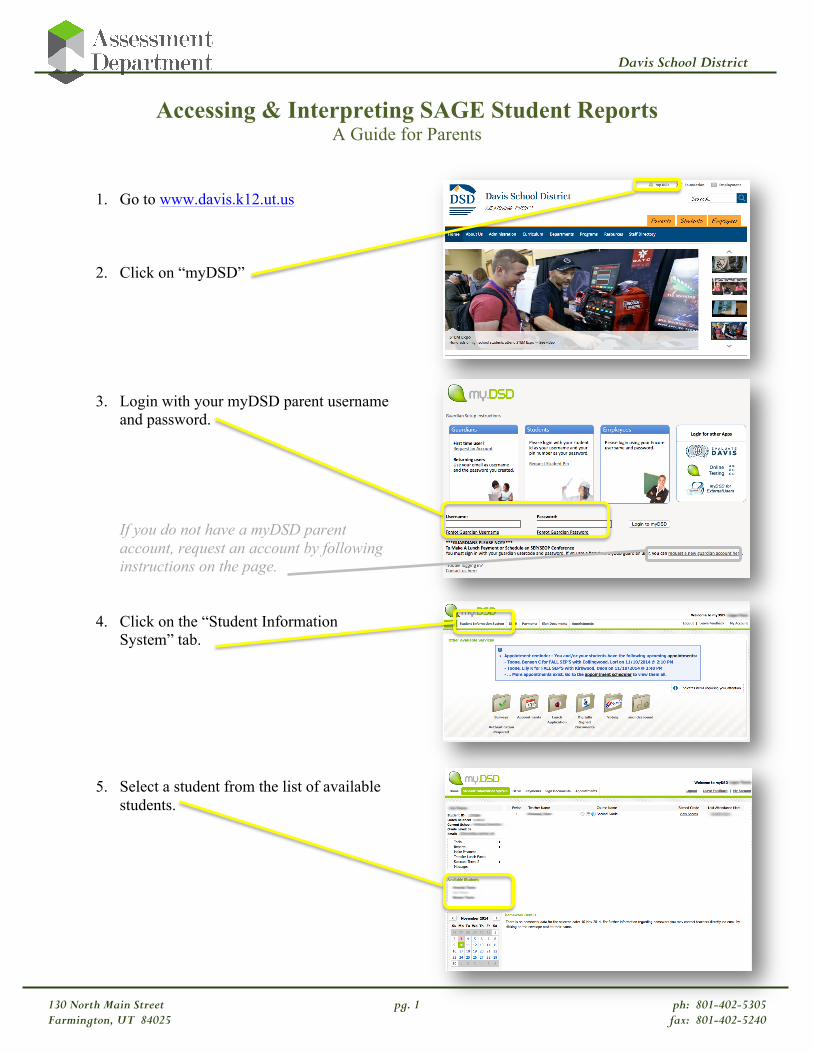
1. Go to www.davis.k12.ut.us
2. Click on “myDSD” 3. Login with your myDSD parent username
and password. If you do not have a myDSD parent
account, request an account by following instructions on the page.
4. Click on the “Student Information
System” tab. 5. Select a student from the list of available
students.
Davis School District
130 North Main Street pg. 2 ph: 801-402-5305 Farmington, UT 84025 fax: 801-402-5240
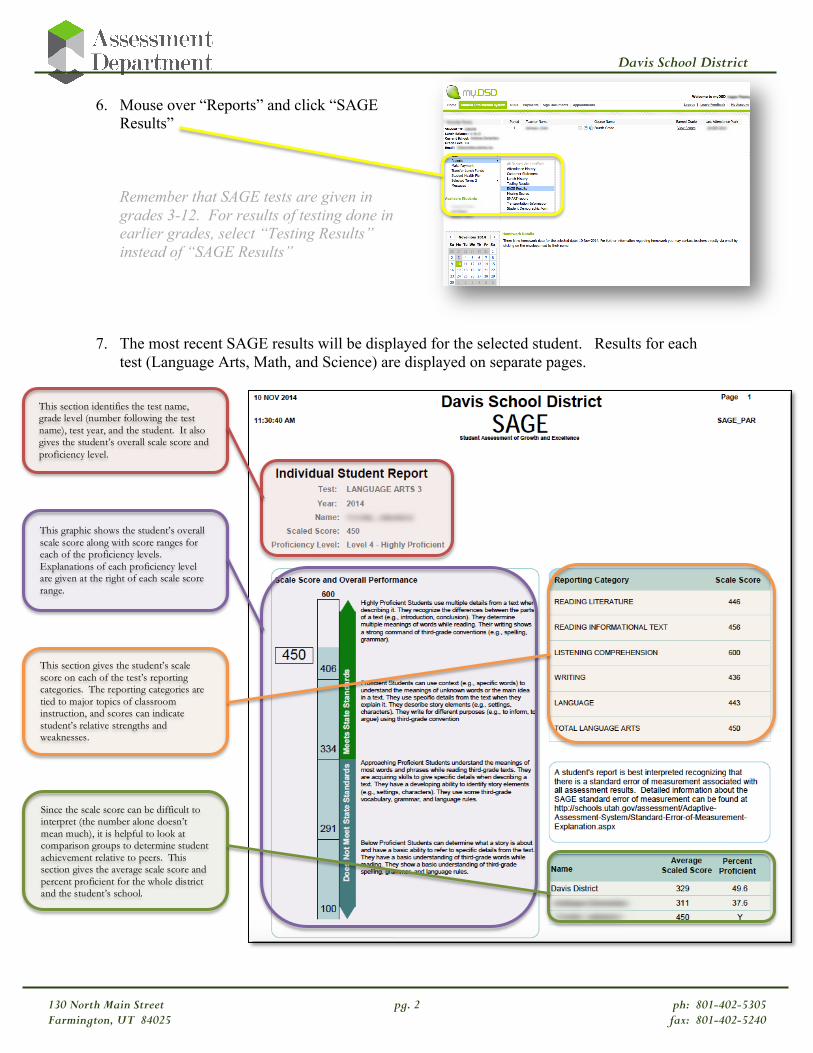
6. Mouse over “Reports” and click “SAGE Results”
Remember that SAGE tests are given in
grades 3-12. For results of testing done in earlier grades, select “Testing Results” instead of “SAGE Results”
7. The most recent SAGE results will be displayed for the selected student. Results for each
test (Language Arts, Math, and Science) are displayed on separate pages. This section identifies the test name,
grade level (number following the test name), test year, and the student. It also gives the student’s overall scale score and proficiency level.
This graphic shows the student’s overall scale score along with score ranges for each of the proficiency levels. Explanations of each proficiency level are given at the right of each scale score range.
This section gives the student’s scale score on each of the test’s reporting categories. The reporting categories are tied to major topics of classroom instruction, and scores can indicate student’s relative strengths and weaknesses.
Since the scale score can be difficult to interpret (the number alone doesn’t mean much), it is helpful to look at comparison groups to determine student achievement relative to peers. This section gives the average scale score and percent proficient for the whole district and the student’s school.