Embed Size (px)
Citation preview
Health and Safety Executive
Accident statistics for floating offshore units on the UK Continental Shelf 19802005
Prepared by Det Norske Veritas for the Health and Safety Executive 2007
RR567 Research Report
Health and Safety Executive
Accident statistics for floating offshore units on the UK Continental Shelf 19802005
Det Norske Veritas Veritasveien 1 N1322 Hovik Norway
In 1999, during a project undertaken by DNV on behalf of the UK Health & Safety Executive (HSE), four databases holding information about UK Continental Shelf (UKCS) semisubmersible flooding incidents were interrogated. The survey revealed that that none of them had a complete recording of such incidents. In addition, it was identified that there were incidents which were not recorded in any of these sources. Consequently, the event frequencies being obtained varied with the availability of sources. There was no reason to believe that the situation and figures for other types of events on floating units should be any different. Hence, it was proposed to initiate a series of projects, but addressing all types of risks to floating units. The most recent one, Accident Statistics for Floating Offshore Units on the UK Continental Shelf 1980 – 2003, was completed in 2005. This current project updates the data of the previous project by two further years, 2004 and 2005. This report supercedes Research Report RR353.
This report and the work it describes were funded by the Health and Safety Executive (HSE). Its contents, including any opinions and/or conclusions expressed, are those of the authors alone and do not necessarily reflect HSE policy.
HSE Books
© Crown copyright 2007
First published 2007
All rights reserved. No part of this publication may bereproduced, stored in a retrieval system, or transmitted inany form or by any means (electronic, mechanical,photocopying, recording or otherwise) without the priorwritten permission of the copyright owner.
Applications for reproduction should be made in writing to:Licensing Division, Her Majesty’s Stationery Office,St Clements House, 216 Colegate, Norwich NR3 1BQor by email to hmsolicensing@cabinetoffice.x.gsi.gov.uk
ii
Table of Content Page
1 EXECUTIVE SUMMARY.......................................................................................11.1 Background 1
1.2 Confidentiality 1
1.3 Objectives 1
1.4 Results 2
2 INTRODUCTION ....................................................................................................6
3 OBJECTIVES AND SCOPE OF WORK..................................................................7
4 EXPOSURE DATA..................................................................................................8
4.1 Mobile offshore drilling units (MODUs) 8
4.2 Mobile Production Units (MOPUs) 9
4.3 Monohull units 11
4.4 Accommodation Units 13
5 INCIDENT REPORTING IN UK WATERS ..........................................................14
6 OVERVIEW OF DATABASES .............................................................................15
6.1 ORION 15
6.2 MAIB 15
6.3 BLOWOUT 16
6.4 WOAD 16
7 EVENT CLASSIFICATION AND CODING PRINCIPLES...................................18
8 ACCIDENT STATISTICS .....................................................................................20
8.1 Accident frequencies, all databases combined 21
8.2 Number of accidents for accommodation units 22
8.3 Occurrence frequencies, all databases combined 23
8.4 Number of occurrences for accommodation units 28
9 CONCLUSIONS ....................................................................................................30
10 REFERENCES.......................................................................................................31
Appendix A Detailed Statistics
iii

iv
1 EXECUTIVE SUMMARY
1.1 Background In 1999, during a project undertaken by DNV on behalf of the UK Health & Safety Executive (HSE), four databases holding information about UK Continental Shelf (UKCS) semi-submersible flooding incidents were interrogated. The survey revealed that that none of them had a complete recording of such incidents. In addition, it was identified that there were incidents which were not recorded in any of these sources. Consequently, the event frequencies being obtained varied with the availability of sources. There was no reason to believe that the situation and figures for other types of events on floating units should be any different. Hence, it was proposed to initiate a series of projects, but addressing all types of risks to floating units. The most recent one, Accident Statistics for Floating Offshore Units on the UK Continental Shelf 1980 – 2003, was completed in 2005. This current project updates the data of the previous project by two further years, 2004 and 2005.
1.2 Confidentiality In order to ensure that the final results of the project were accurate and in line with the Quality Control requirements of the DNV’s WOAD databank it was necessary to obtain "raw" data from each of the Databases interrogated. Raw data is defined as the data concerning a specific incident which identified the installation, operator, location, date and time. The data so obtained enabled quality checks to be undertaken on the different databases to prevent double counting of an incident or accident.
It is a condition of the contract between the HSE and DNV, the custodians of the WOAD databank, that any information so obtained will only be exported in a non attributable form to protect confidentiality. That is, any request for data obtained by WOAD as a result of this project will result in data being supplied which is non-attributable and will not allow identification of the name of the installation, company, location, date or time of an incident. It will thus be impossible to pinpoint the installation or operator by any means.
1.3 Objectives The main objective of the project is to obtain complete statistics (i.e. accident frequencies) for accidents and incidents having occurred on floating units engaged in the oil and gas activities on the UKCS in the period 1980-2005, including number of accidents and incidents with corresponding frequencies per type of floating unit. Floating units in this project are defined as comprising semi-submersibles, jackups, ships and tension-leg platforms engaged in drilling, accommodation, production and storage. The latter two types are classified as “floating” installations although they are defined as “fixed installations” by the HSE under the Safety Case Regulations.
The results from this study will serve as a reference document for data to be used in future Risk Assessments of offshore floating units and furthermore, be a valuable reference document for UK Health & Safety Executive (HSE)/ Offshore Safety Division (OSD) when reviewing Safety Cases.
Page 1
To fulfil this objective, relevant databases were interrogated with respect to both population and accident data, thus forming a complete data basis for obtaining comprehensive accident statistics for the said type of units, geographical area and time period. The following databases were selected for interrogation: • ORION (the former Sun Safety System); UK HSE-Offshore Safety Division • MAIB accident database; UK Marine Accidents Investigation Bureau • Offshore Blowout Database BLOWOUT; SINTEF, Norway • Worldwide Offshore Accident Databank WOAD;, DNV, Norway It had been noted by the HSE that extensive reference was made to the WOAD database in many of the Safety Cases submitted to them by the offshore operators. Consequently the decision was made to utilise the WOAD incident definitions, codings and format in the new database. Utilising the same methodology and format should enable the operators and owners of offshore installations to readily adapt to the use of the new database. DNV, as the custodians of the WOAD database was therefore selected as the contractor to undertake the work on behalf of the HSE. A major part of the work of DNV has thus been the redefining of each incident, in the various databases interrogated, to reflect the definitions, codings and format used in WOAD.
1.4 Results The information being available for each incident has been reviewed and the chain of events has been obtained. The classification of events has been done according to the WOAD concept. One accident may comprise a chain of consecutive events (accident outcomes or occurrences), e.g. a blowout resulting in explosion, fire and oil spill. This means that one single accident or incident may give rise to several occurrences. The total number of occurrences will thus be much higher than the total number of accidents recorded. When giving frequencies per type of event, this is presented as number of occurrences per unit per year. However, when presenting frequencies irrespective of type of event, the figures are given as number of accidents per unit per year.
By combining and merging the results from the interrogation of the four databases, ORION, MAIB, WOAD and BLOWOUT, the accident and occurrence frequencies for floating units in the UKCS in the period 1980-2005 are estimated. In the following tables the accident (or occurrence) frequencies, i.e. number of accidents (or occurrences) per unit year, are given per type of installation, event (only occurrences) and the periods 1980-1989, 1990-2005 and 1980-2005. N denotes number of accidents (or occurrences) and F denotes average annual frequency per unit in the specific time period, i.e. number of accidents (or occurrences) per unit and year. The source All databases combined refers to the database obtained by pooling the four mentioned databases and removing the overlapping records.
Care should be taken when trying to compare statistics for the period 1980-1989 and 1990-2005, since the reporting requirements and systems changed dramatically in the UK around 1990 following the issuing of the Lord Cullen Report following the Piper Alpha accident in 1988.
Note that ‘-‘ is applied where no accidents/occurrences have been recorded (and hence no frequencies calculated) or if the given event is not applicable/relevant for the given type of unit.
The results, after having interrogated the databases and removed overlapping records are also detailed in the associated Excel spreadsheet. The spreadsheet, together with this report, may be downloaded by accessing the HSE web site www.hse.gov.uk . Within the spreadsheet, in addition to other fields each of the incidents is described in “free text”.
Page 2
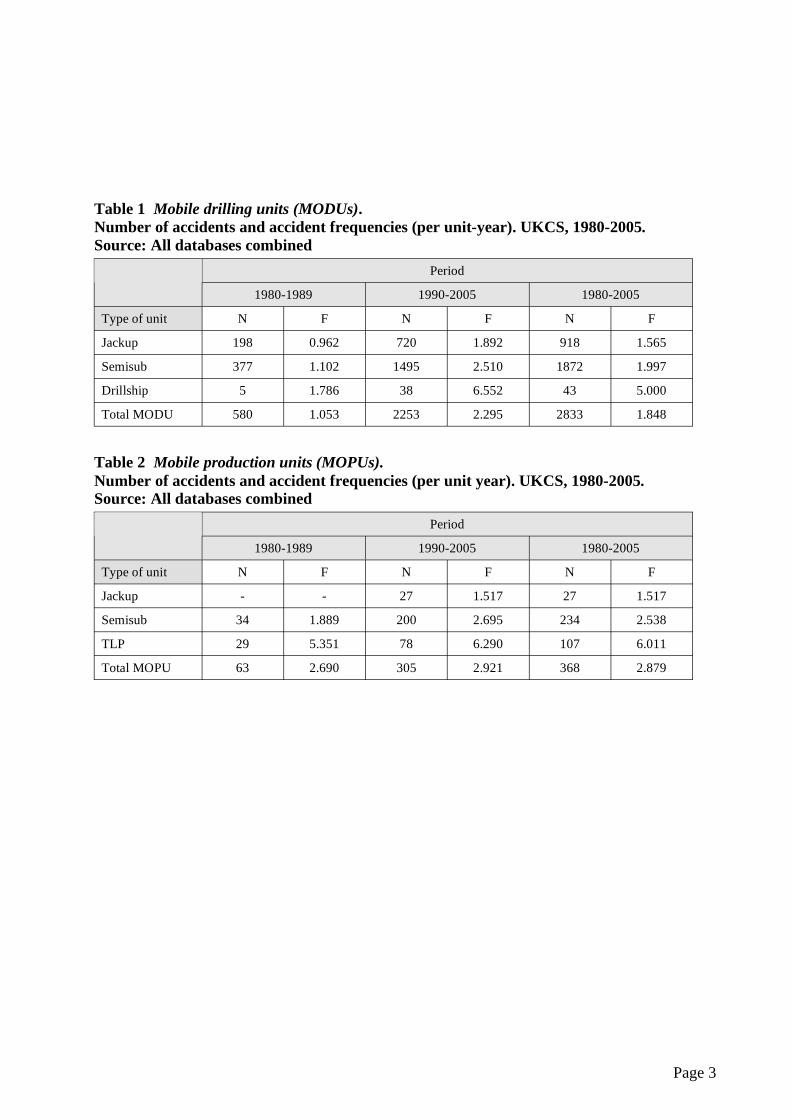
Table 1 Mobile drilling units (MODUs).Number of accidents and accident frequencies (per unit-year). UKCS, 1980-2005.Source: All databases combined
Period
1980-1989 1990-2005 1980-2005
Type of unit N F N F N F
Jackup 198 0.962 720 1.892 918 1.565
Semisub 377 1.102 1495 2.510 1872 1.997
Drillship 5 1.786 38 6.552 43 5.000
Total MODU 580 1.053 2253 2.295 2833 1.848
Table 2 Mobile production units (MOPUs).Number of accidents and accident frequencies (per unit year). UKCS, 1980-2005.Source: All databases combined
Period
1980-1989 1990-2005 1980-2005
Type of unit N F N F N F
Jackup - - 27 1.517 27 1.517
Semisub 34 1.889 200 2.695 234 2.538
TLP 29 5.351 78 6.290 107 6.011
Total MOPU 63 2.690 305 2.921 368 2.879
Page 3
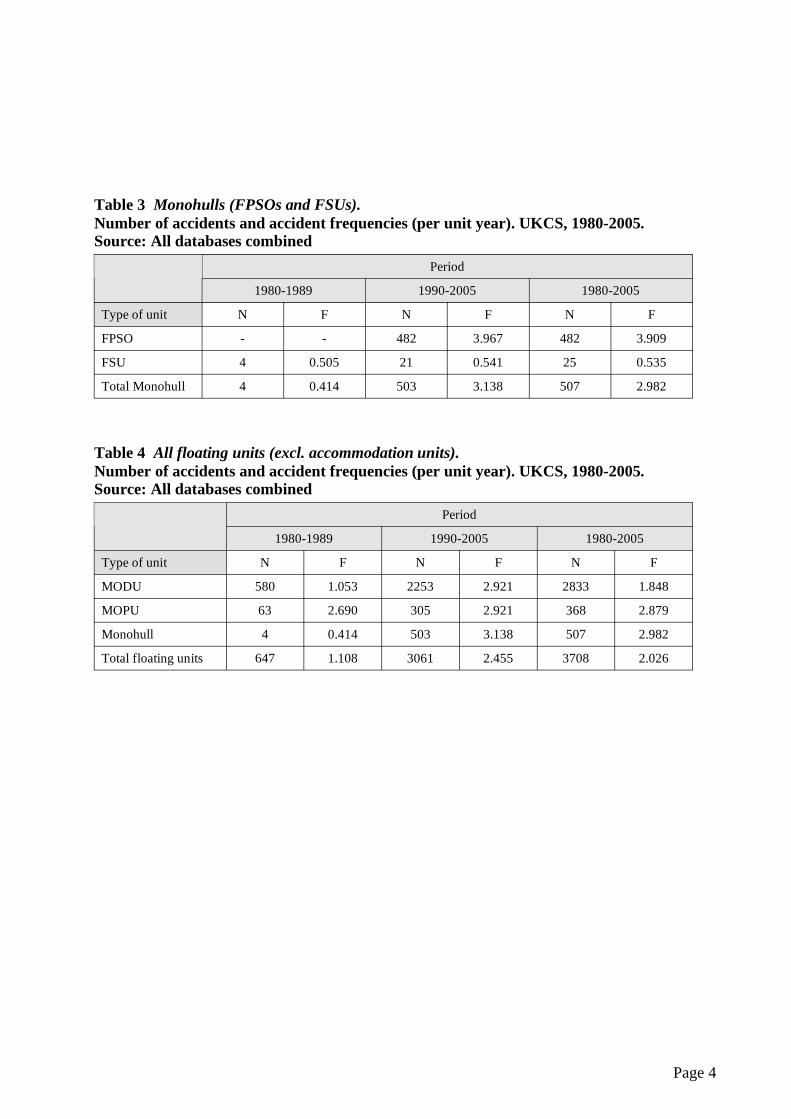
Table 3 Monohulls (FPSOs and FSUs).Number of accidents and accident frequencies (per unit year). UKCS, 1980-2005.Source: All databases combined
Period
1980-1989 1990-2005 1980-2005
Type of unit N F N F N F
FPSO - - 482 3.967 482 3.909
FSU 4 0.505 21 0.541 25 0.535
Total Monohull 4 0.414 503 3.138 507 2.982
Table 4 All floating units (excl. accommodation units).Number of accidents and accident frequencies (per unit year). UKCS, 1980-2005.Source: All databases combined
Period
1980-1989 1990-2005 1980-2005
Type of unit N F N F N F
MODU 580 1.053 2253 2.921 2833 1.848
MOPU 63 2.690 305 2.921 368 2.879
Monohull 4 0.414 503 3.138 507 2.982
Total floating units 647 1.108 3061 2.455 3708 2.026
Page 4
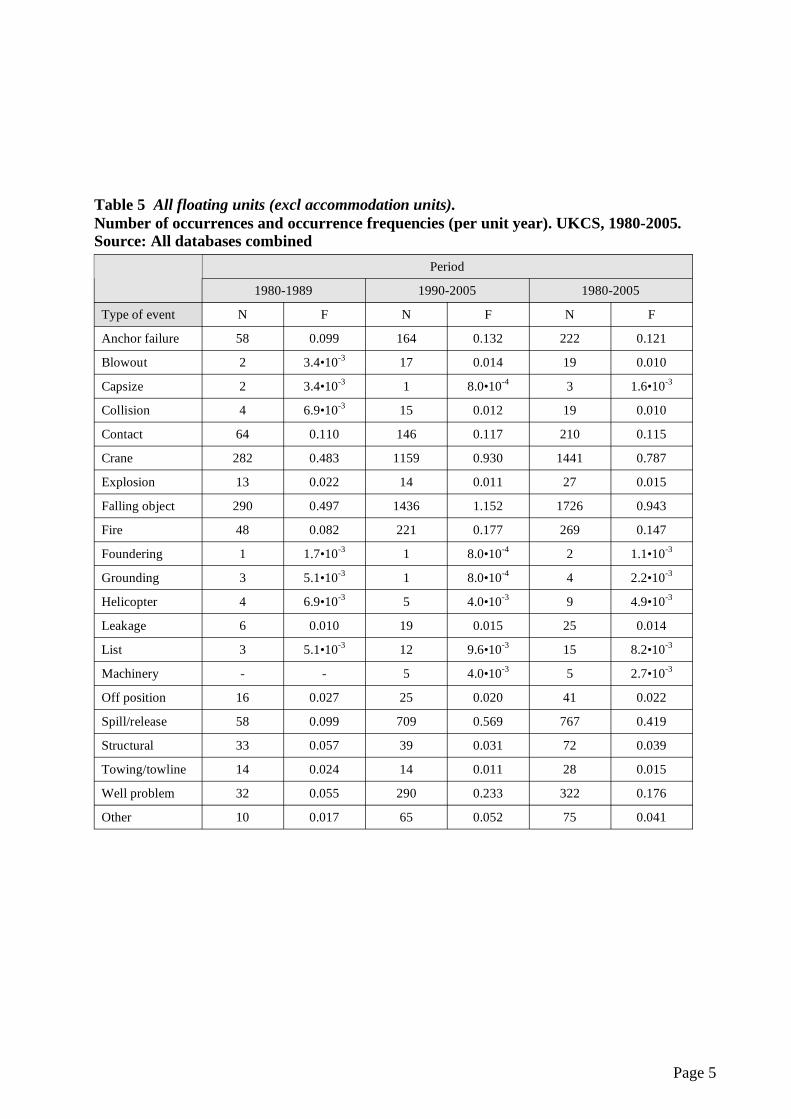
Table 5 All floating units (excl accommodation units).Number of occurrences and occurrence frequencies (per unit year). UKCS, 1980-2005.Source: All databases combined
Period
1980-1989 1990-2005 1980-2005
Type of event N F N F N F
Anchor failure 58 0.099 164 0.132 222 0.121
Blowout 2 3.4•10-3 17 0.014 19 0.010
Capsize 2 3.4•10-3 1 8.0•10-4 3 1.6•10-3
Collision 4 6.9•10-3 15 0.012 19 0.010
Contact 64 0.110 146 0.117 210 0.115
Crane 282 0.483 1159 0.930 1441 0.787
Explosion 13 0.022 14 0.011 27 0.015
Falling object 290 0.497 1436 1.152 1726 0.943
Fire 48 0.082 221 0.177 269 0.147
Foundering 1 1.7•10-3 1 8.0•10-4 2 1.1•10-3
Grounding 3 5.1•10-3 1 8.0•10-4 4 2.2•10-3
Helicopter 4 6.9•10-3 5 4.0•10-3 9 4.9•10-3
Leakage 6 0.010 19 0.015 25 0.014
List 3 5.1•10-3 12 9.6•10-3 15 8.2•10-3
Machinery - - 5 4.0•10-3 5 2.7•10-3
Off position 16 0.027 25 0.020 41 0.022
Spill/release 58 0.099 709 0.569 767 0.419
Structural 33 0.057 39 0.031 72 0.039
Towing/towline 14 0.024 14 0.011 28 0.015
Well problem 32 0.055 290 0.233 322 0.176
Other 10 0.017 65 0.052 75 0.041
Page 5
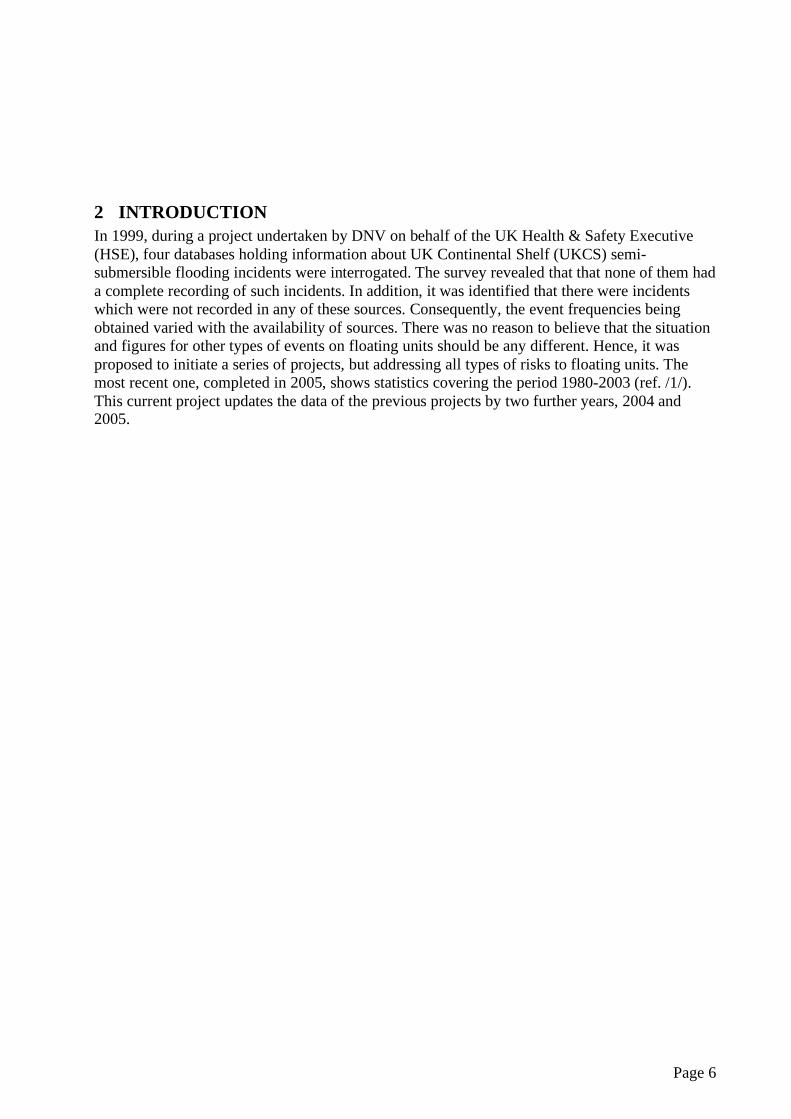
2 INTRODUCTION In 1999, during a project undertaken by DNV on behalf of the UK Health & Safety Executive (HSE), four databases holding information about UK Continental Shelf (UKCS) semi-submersible flooding incidents were interrogated. The survey revealed that that none of them had a complete recording of such incidents. In addition, it was identified that there were incidents which were not recorded in any of these sources. Consequently, the event frequencies being obtained varied with the availability of sources. There was no reason to believe that the situation and figures for other types of events on floating units should be any different. Hence, it was proposed to initiate a series of projects, but addressing all types of risks to floating units. The most recent one, completed in 2005, shows statistics covering the period 1980-2003 (ref. /1/). This current project updates the data of the previous projects by two further years, 2004 and 2005.
Page 6
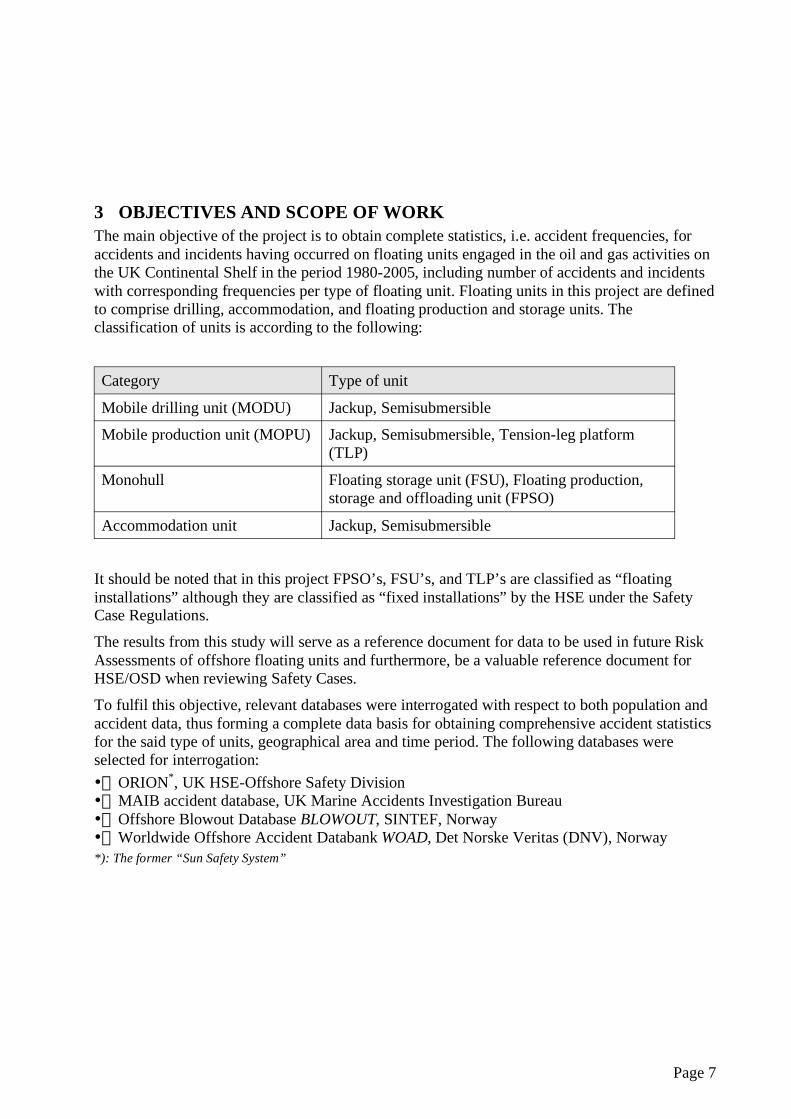
3 OBJECTIVES AND SCOPE OF WORK The main objective of the project is to obtain complete statistics, i.e. accident frequencies, for accidents and incidents having occurred on floating units engaged in the oil and gas activities on the UK Continental Shelf in the period 1980-2005, including number of accidents and incidents with corresponding frequencies per type of floating unit. Floating units in this project are defined to comprise drilling, accommodation, and floating production and storage units. The classification of units is according to the following:
Category Type of unit
Mobile drilling unit (MODU) Jackup, Semisubmersible
Mobile production unit (MOPU) Jackup, Semisubmersible, Tension-leg platform (TLP)
Monohull Floating storage unit (FSU), Floating production, storage and offloading unit (FPSO)
Accommodation unit Jackup, Semisubmersible
It should be noted that in this project FPSO’s, FSU’s, and TLP’s are classified as “floating installations” although they are classified as “fixed installations” by the HSE under the Safety Case Regulations.
The results from this study will serve as a reference document for data to be used in future Risk Assessments of offshore floating units and furthermore, be a valuable reference document for HSE/OSD when reviewing Safety Cases.
To fulfil this objective, relevant databases were interrogated with respect to both population and accident data, thus forming a complete data basis for obtaining comprehensive accident statistics for the said type of units, geographical area and time period. The following databases were selected for interrogation: • ORION*, UK HSE-Offshore Safety Division • MAIB accident database, UK Marine Accidents Investigation Bureau • Offshore Blowout Database BLOWOUT, SINTEF, Norway • Worldwide Offshore Accident Databank WOAD, Det Norske Veritas (DNV), Norway *): The former “Sun Safety System”
Page 7
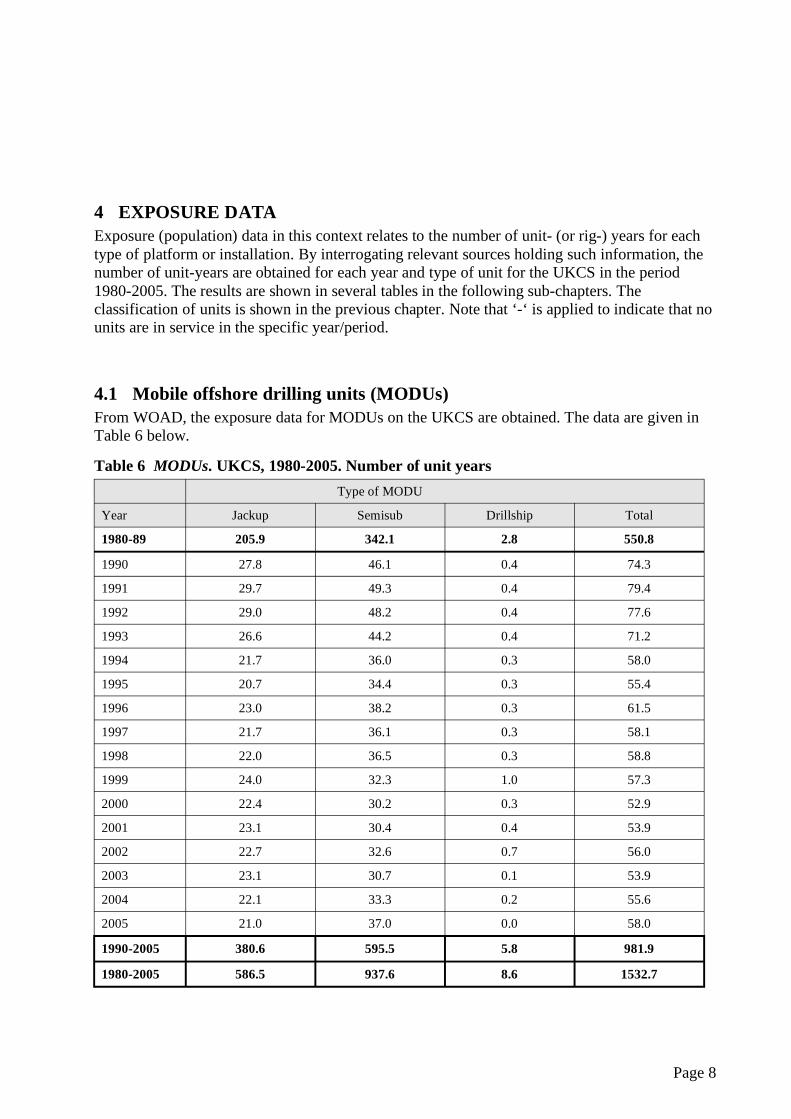
4 EXPOSURE DATA Exposure (population) data in this context relates to the number of unit- (or rig-) years for each type of platform or installation. By interrogating relevant sources holding such information, the number of unit-years are obtained for each year and type of unit for the UKCS in the period 1980-2005. The results are shown in several tables in the following sub-chapters. The classification of units is shown in the previous chapter. Note that ‘-‘ is applied to indicate that no units are in service in the specific year/period.
4.1 Mobile offshore drilling units (MODUs) From WOAD, the exposure data for MODUs on the UKCS are obtained. The data are given in Table 6 below.
Table 6 MODUs. UKCS, 1980-2005. Number of unit years Type of MODU
Year Jackup Semisub Drillship Total
1980-89 205.9 342.1 2.8 550.8
1990 27.8 46.1 0.4 74.3
1991 29.7 49.3 0.4 79.4
1992 29.0 48.2 0.4 77.6
1993 26.6 44.2 0.4 71.2
1994 21.7 36.0 0.3 58.0
1995 20.7 34.4 0.3 55.4
1996 23.0 38.2 0.3 61.5
1997 21.7 36.1 0.3 58.1
1998 22.0 36.5 0.3 58.8
1999 24.0 32.3 1.0 57.3
2000 22.4 30.2 0.3 52.9
2001 23.1 30.4 0.4 53.9
2002 22.7 32.6 0.7 56.0
2003 23.1 30.7 0.1 53.9
2004 22.1 33.3 0.2 55.6
2005 21.0 37.0 0.0 58.0
1990-2005 380.6 595.5 5.8 981.9
1980-2005 586.5 937.6 8.6 1532.7
Page 8
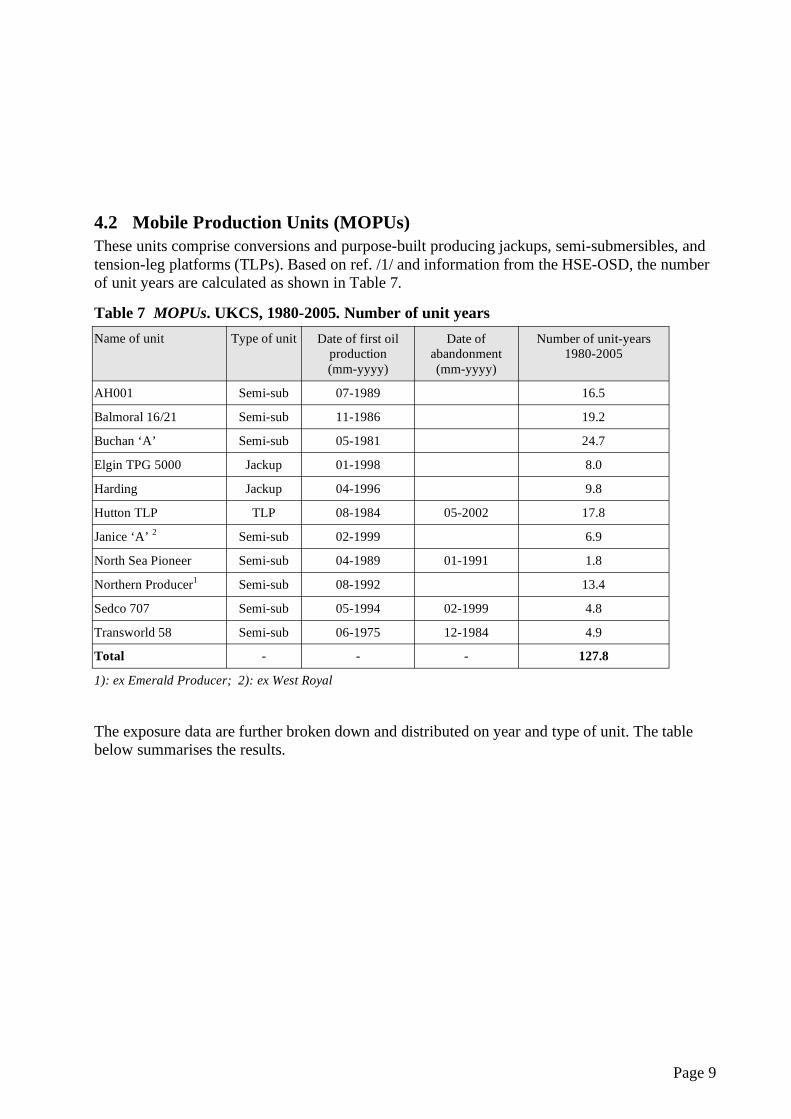
4.2 Mobile Production Units (MOPUs) These units comprise conversions and purpose-built producing jackups, semi-submersibles, and tension-leg platforms (TLPs). Based on ref. /1/ and information from the HSE-OSD, the number of unit years are calculated as shown in Table 7.
Table 7 MOPUs. UKCS, 1980-2005. Number of unit years Name of unit Type of unit Date of first oil
production (mm-yyyy)
Date of abandonment (mm-yyyy)
Number of unit-years 1980-2005
AH001 Semi-sub 07-1989 16.5
Balmoral 16/21 Semi-sub 11-1986 19.2
Buchan ‘A’ Semi-sub 05-1981 24.7
Elgin TPG 5000 Jackup 01-1998 8.0
Harding Jackup 04-1996 9.8
Hutton TLP TLP 08-1984 05-2002 17.8
Janice ‘A’ 2 Semi-sub 02-1999 6.9
North Sea Pioneer Semi-sub 04-1989 01-1991 1.8
Northern Producer1 Semi-sub 08-1992 13.4
Sedco 707 Semi-sub 05-1994 02-1999 4.8
Transworld 58 Semi-sub 06-1975 12-1984 4.9
Total - - - 127.8
1): ex Emerald Producer; 2): ex West Royal
The exposure data are further broken down and distributed on year and type of unit. The table below summarises the results.
Page 9
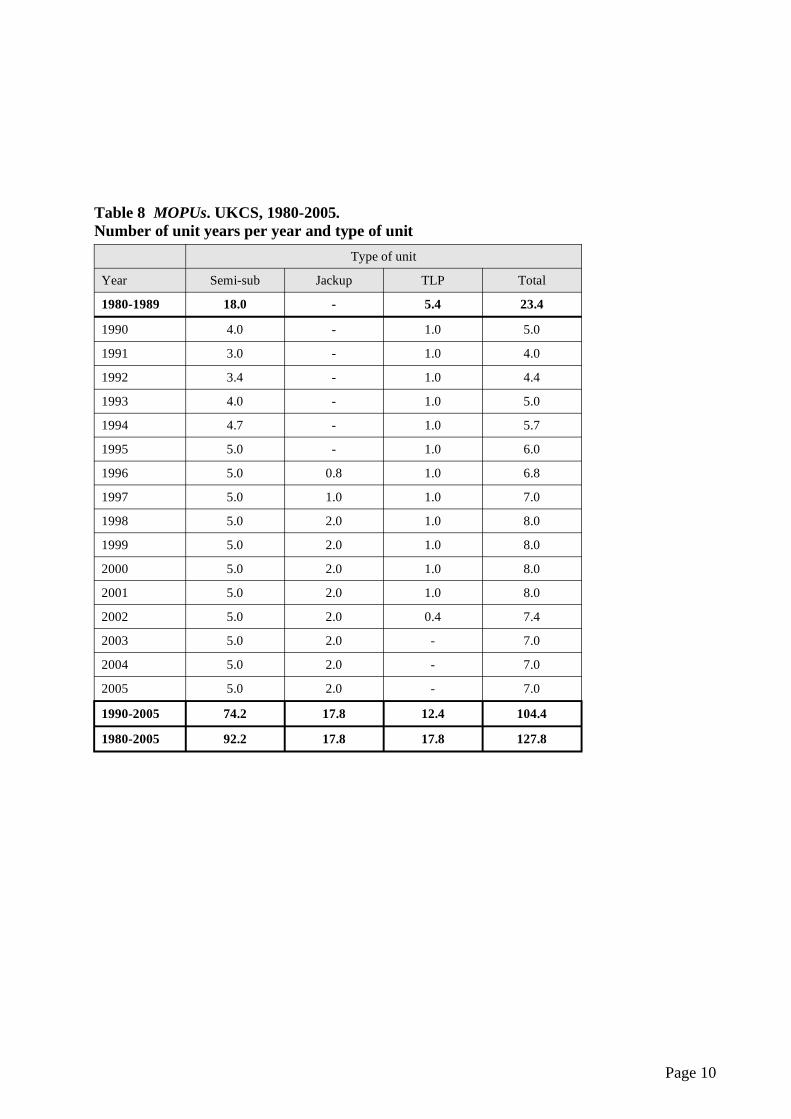
Table 8 MOPUs. UKCS, 1980-2005.Number of unit years per year and type of unit
Type of unit
Year Semi-sub Jackup TLP Total
1980-1989 18.0 - 5.4 23.4
1990 4.0 - 1.0 5.0
1991 3.0 - 1.0 4.0
1992 3.4 - 1.0 4.4
1993 4.0 - 1.0 5.0
1994 4.7 - 1.0 5.7
1995 5.0 - 1.0 6.0
1996 5.0 0.8 1.0 6.8
1997 5.0 1.0 1.0 7.0
1998 5.0 2.0 1.0 8.0
1999 5.0 2.0 1.0 8.0
2000 5.0 2.0 1.0 8.0
2001 5.0 2.0 1.0 8.0
2002 5.0 2.0 0.4 7.4
2003 5.0 2.0 - 7.0
2004 5.0 2.0 - 7.0
2005 5.0 2.0 - 7.0
1990-2005 74.2 17.8 12.4 104.4
1980-2005 92.2 17.8 17.8 127.8
Page 10
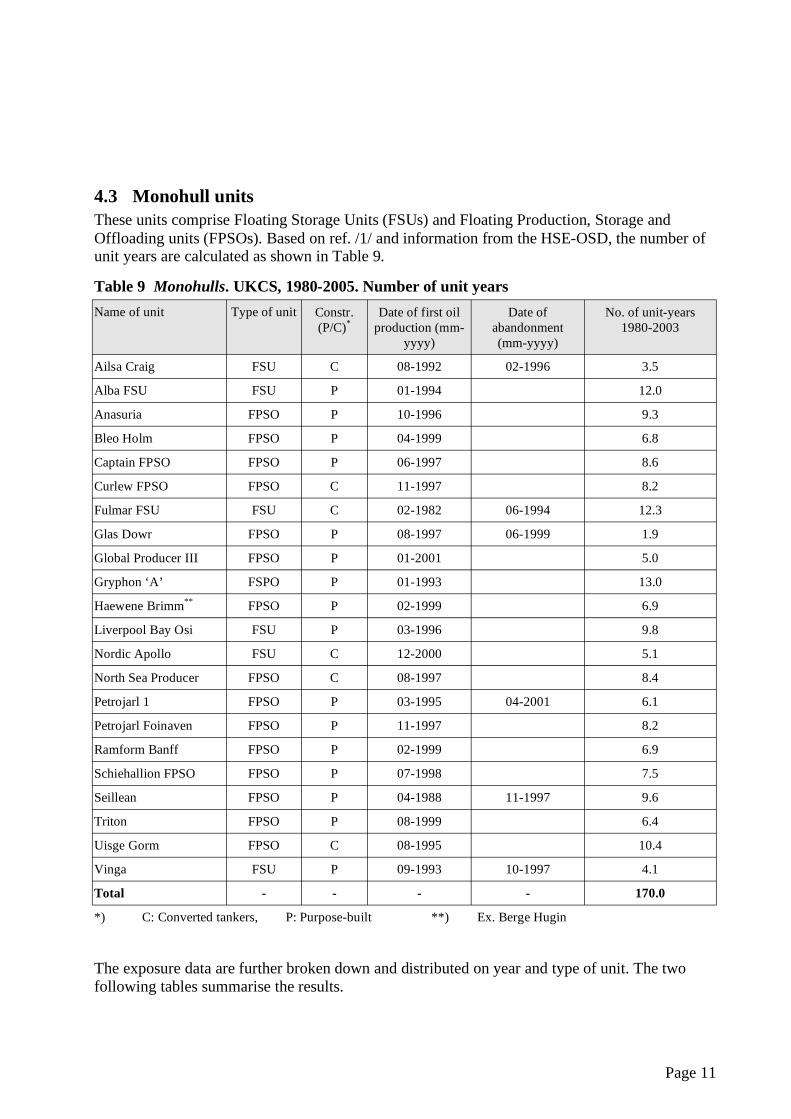
4.3 Monohull units These units comprise Floating Storage Units (FSUs) and Floating Production, Storage and Offloading units (FPSOs). Based on ref. /1/ and information from the HSE-OSD, the number of unit years are calculated as shown in Table 9.
Table 9 Monohulls. UKCS, 1980-2005. Number of unit years Name of unit Type of unit Constr.
(P/C)* Date of first oil
production (mm-yyyy)
Date of abandonment (mm-yyyy)
No. of unit-years 1980-2003
Ailsa Craig FSU C 08-1992 02-1996 3.5
Alba FSU FSU P 01-1994 12.0
Anasuria FPSO P 10-1996 9.3
Bleo Holm FPSO P 04-1999 6.8
Captain FPSO FPSO P 06-1997 8.6
Curlew FPSO FPSO C 11-1997 8.2
Fulmar FSU FSU C 02-1982 06-1994 12.3
Glas Dowr FPSO P 08-1997 06-1999 1.9
Global Producer III FPSO P 01-2001 5.0
Gryphon ‘A’ FSPO P 01-1993 13.0
Haewene Brimm ** FPSO P 02-1999 6.9
Liverpool Bay Osi FSU P 03-1996 9.8
Nordic Apollo FSU C 12-2000 5.1
North Sea Producer FPSO C 08-1997 8.4
Petrojarl 1 FPSO P 03-1995 04-2001 6.1
Petrojarl Foinaven FPSO P 11-1997 8.2
Ramform Banff FPSO P 02-1999 6.9
Schiehallion FPSO FPSO P 07-1998 7.5
Seillean FPSO P 04-1988 11-1997 9.6
Triton FPSO P 08-1999 6.4
Uisge Gorm FPSO C 08-1995 10.4
Vinga FSU P 09-1993 10-1997 4.1
Total - - - - 170.0
*) C: Converted tankers, P: Purpose-built **) Ex. Berge Hugin
The exposure data are further broken down and distributed on year and type of unit. The two following tables summarise the results.
Page 11
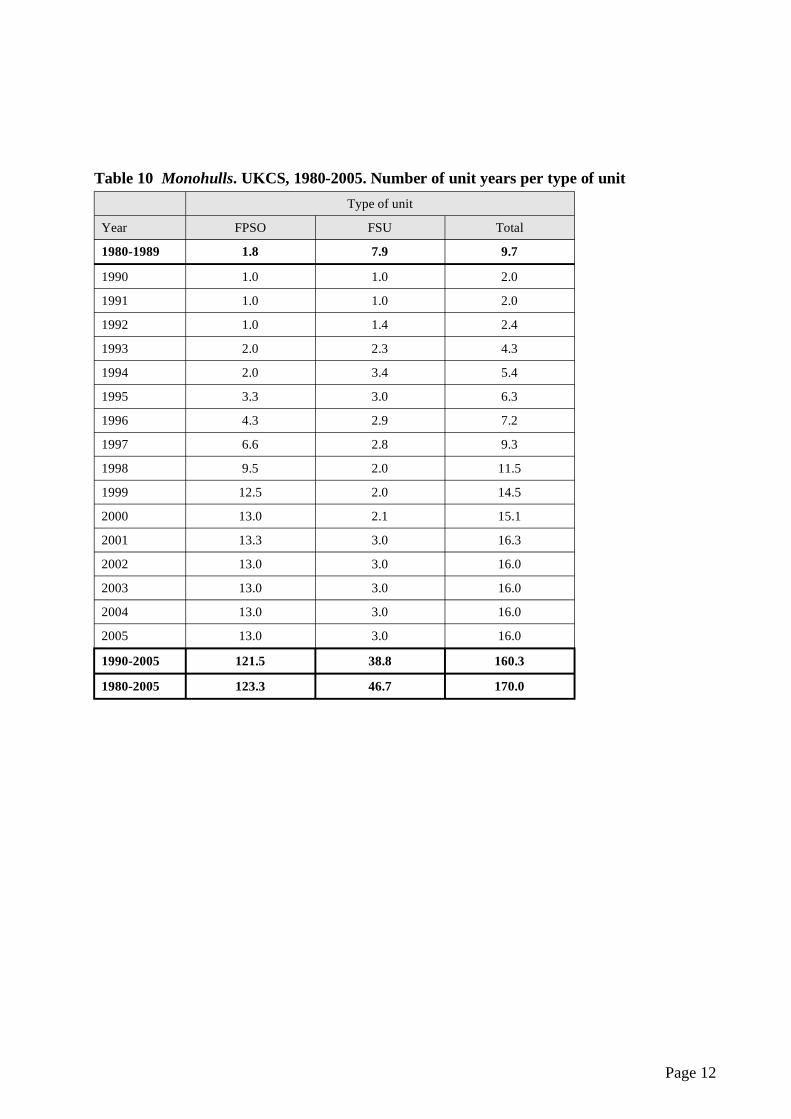
Table 10 Monohulls. UKCS, 1980-2005. Number of unit years per type of unit Type of unit
Year FPSO FSU Total
1980-1989 1.8 7.9 9.7
1990 1.0 1.0 2.0
1991 1.0 1.0 2.0
1992 1.0 1.4 2.4
1993 2.0 2.3 4.3
1994 2.0 3.4 5.4
1995 3.3 3.0 6.3
1996 4.3 2.9 7.2
1997 6.6 2.8 9.3
1998 9.5 2.0 11.5
1999 12.5 2.0 14.5
2000 13.0 2.1 15.1
2001 13.3 3.0 16.3
2002 13.0 3.0 16.0
2003 13.0 3.0 16.0
2004 13.0 3.0 16.0
2005 13.0 3.0 16.0
1990-2005 121.5 38.8 160.3
1980-2005 123.3 46.7 170.0
Page 12
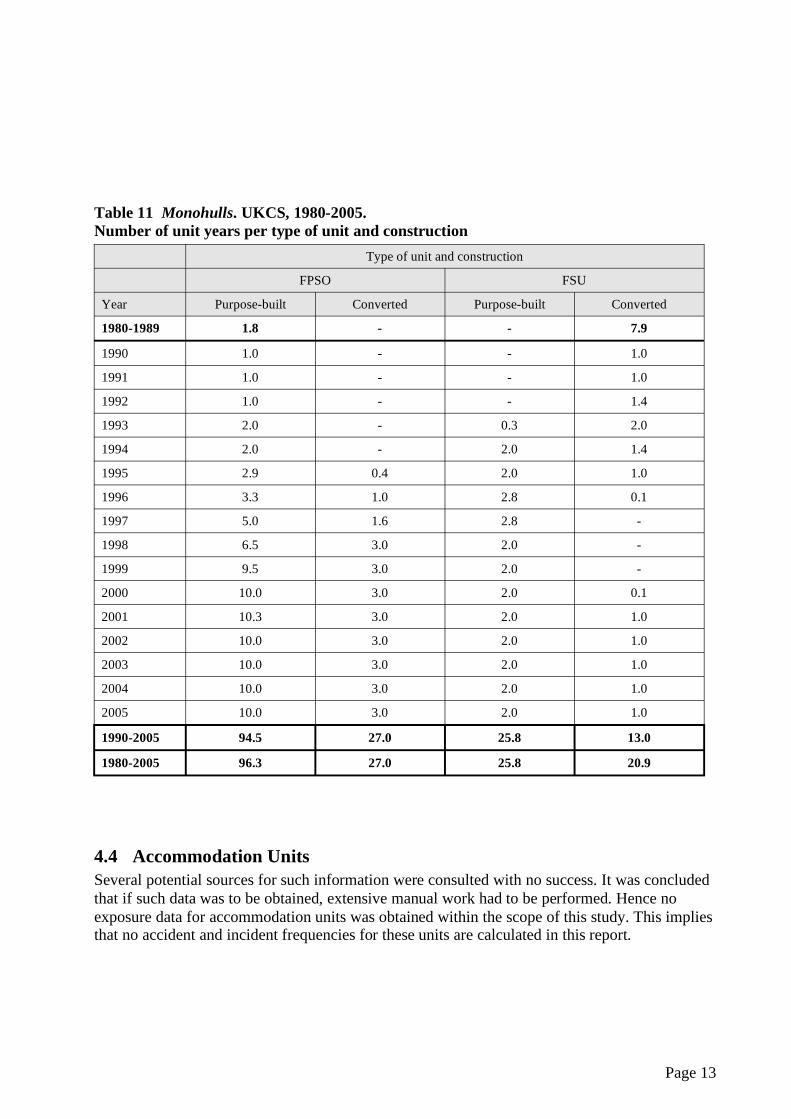
Table 11 Monohulls. UKCS, 1980-2005.Number of unit years per type of unit and construction
Type of unit and construction
FPSO FSU
Year Purpose-built Converted Purpose-built Converted
1980-1989 1.8 - - 7.9
1990 1.0 - - 1.0
1991 1.0 - - 1.0
1992 1.0 - - 1.4
1993 2.0 - 0.3 2.0
1994 2.0 - 2.0 1.4
1995 2.9 0.4 2.0 1.0
1996 3.3 1.0 2.8 0.1
1997 5.0 1.6 2.8 -
1998 6.5 3.0 2.0 -
1999 9.5 3.0 2.0 -
2000 10.0 3.0 2.0 0.1
2001 10.3 3.0 2.0 1.0
2002 10.0 3.0 2.0 1.0
2003 10.0 3.0 2.0 1.0
2004 10.0 3.0 2.0 1.0
2005 10.0 3.0 2.0 1.0
1990-2005 94.5 27.0 25.8 13.0
1980-2005 96.3 27.0 25.8 20.9
4.4 Accommodation Units Several potential sources for such information were consulted with no success. It was concluded that if such data was to be obtained, extensive manual work had to be performed. Hence no exposure data for accommodation units was obtained within the scope of this study. This implies that no accident and incident frequencies for these units are calculated in this report.
Page 13
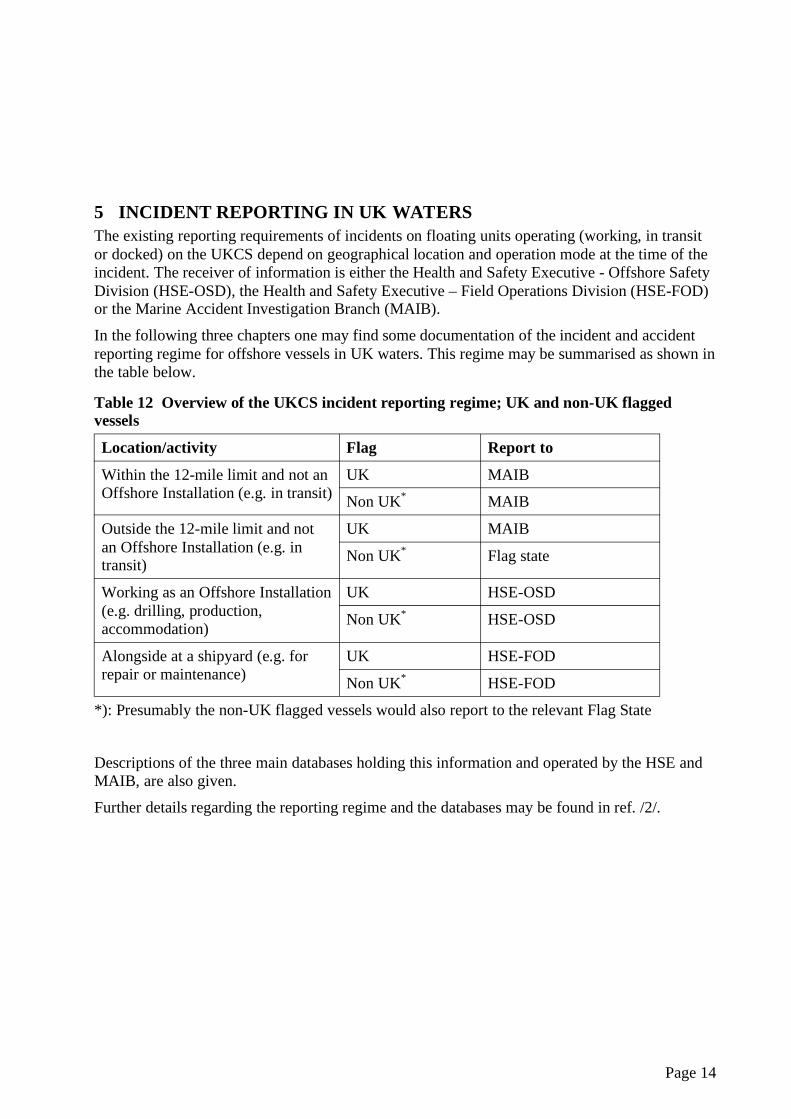
5 INCIDENT REPORTING IN UK WATERS The existing reporting requirements of incidents on floating units operating (working, in transit or docked) on the UKCS depend on geographical location and operation mode at the time of the incident. The receiver of information is either the Health and Safety Executive - Offshore Safety Division (HSE-OSD), the Health and Safety Executive – Field Operations Division (HSE-FOD) or the Marine Accident Investigation Branch (MAIB).
In the following three chapters one may find some documentation of the incident and accident reporting regime for offshore vessels in UK waters. This regime may be summarised as shown in the table below.
Table 12 Overview of the UKCS incident reporting regime; UK and non-UK flagged vessels
Location/activity Flag Report to
Within the 12-mile limit and not an Offshore Installation (e.g. in transit)
UK MAIB
Non UK* MAIB
Outside the 12-mile limit and not an Offshore Installation (e.g. in transit)
UK MAIB
Non UK* Flag state
Working as an Offshore Installation (e.g. drilling, production, accommodation)
UK HSE-OSD
Non UK* HSE-OSD
Alongside at a shipyard (e.g. for repair or maintenance)
UK HSE-FOD
Non UK* HSE-FOD
*): Presumably the non-UK flagged vessels would also report to the relevant Flag State
Descriptions of the three main databases holding this information and operated by the HSE andMAIB, are also given.
Further details regarding the reporting regime and the databases may be found in ref. /2/.
Page 14
6 OVERVIEW OF DATABASES This chapter gives a short presentation of the 4 databases being interrogated in this project.
6.1 ORION The Reporting of Injuries, Diseases and Dangerous Occurrences Regulations 1995 (RIDDOR 95) arrangement came into force on 1 April 1996 and requires that all work-related accidents, diseases and dangerous occurrences in the UK and UK Continental Shelf are to be reported to the HSE. It applies to all work activities and to defined types of incidents. The incidents are to be reported using the OIR/9B and F2508A forms. These forms are to be completed and submitted to the HSE.
Prior to 1 April 1996 injuries and dangerous occurrences were reported on the OIR/9A form. This form was created under the Mineral Workings (Offshore Installations) Act 1971 and the Offshore Installations (Inspectors and Casualties) Regulations 1973.
The information submitted on the OIR/9A, OIR/9B and F2508A forms are recorded in a database, “ORION” (the former Sun Safety System), run by the HSE-OSD offices in Bootle, Liverpool.
The Sun Safety System (now ORION) was primarily developed to record incident data reported on the OIR/9A form. Other information is however recorded on the database, including details of inspections, investigations, prosecutions and the registration and location details of Offshore Installations. The OIR/9A form was first published in October 1990, and the Sun Safety System was implemented in 1st January 1991. The Sun Safety System does however contain some data on pre 1991 incidents (imported from previous systems maintained by the Safety Directorate of the Department of Energy), though not all fields on the OIR/9A form are available for this data. The Sun Safety System was decommissioned year 2000 and all data from 1991(incl.) was transferred to ORION.
Note that notification of hydrocarbon releases (voluntarily submitted on the OIR/12 form) are also recorded in a separate and specifically designed database which is maintained by the HSE-OSD offices in Bootle, Liverpool.
6.2 MAIB The Marine Accident Investigation Branch (MAIB) is a distinct and separate branch within the Department of the Environment, Transport and the Regions (DETR). Its Chief Inspector reports directly to the Secretary of State for the Environment, Transport and the Regions on marine accident investigations. The authority of the MAIB to investigate marine accidents originates from the Merchant Shipping Act 1995. MAIB’s responsibility covers the investigation of accidents to or on:
all UK registered vessels anywhere in the world other vessels being within the 12-mile zone of the UK coast (UK territorial waters)
For offshore floating vessels all accidents and incidents occurring in transit should be reported to MAIB according to the above.
Page 15
Accidents must be reported as soon as possible to the MAIB by the quickest means available. Serious injuries and dangerous occurrences must be reported within 14 days or within 14 days after arrival at the next port if the vessel is at sea at time of the accident. The reporting form presently being used is IRF (1/98).
About 2000 accidents are reported per year to MAIB of which about 500 require some sort of MAIB correspondence follow-up, for clarification purposes or investigation. Most of these are from UK waters. Additional information about reporting and investigations of accidents by the MAIB is found in Memorandum on the Investigations of Marine Accidents; MAIB/DETR. January 1998.
MAIB maintains a database covering accidents and incidents from 1991 to date. The received forms and notifications are recorded in the database by a staff of two persons. Beside the said forms and notifications, the ‘Coast Guard Morning Reports’ serves as first-hand information input to the database. Today the database contains some 22.000 events covering all types of incidents and accidents, ranging from smaller low-consequence events and near-misses to major accidents with loss of life.
6.3 BLOWOUT The SINTEF Offshore Blowout Database (BLOWOUT) is a comprehensive event database for blowout risk assessment. The database includes information on 552 (November 2006) offshore blowouts/well releases that have occurred worldwide since 1955.
The database includes blowout/well release descriptions worldwide and drilling and production exposure data for several areas with focus on the US Gulf of Mexico Outer Continental Shelf (US GoM OCS), Norwegian waters, and UK waters.
The blowouts/well releases are categorized in several parameters, emphasizing blowout causes. The database contains 51 different fields describing each blowout/well release. In addition, the database allows for attachment of any electronic file(s) to the blowout description. The various fields are grouped in six different groups:
• Category and location • Well description
• Present operation • Blowout causes
• Blowout Characteristics • Other
ExproSoft has been contracted to operate the SINTEF Offshore Blowout Database from 1 May 2001 by SINTEF.
6.4 WOAD One of the main sources for offshore accident information for public use is the Worldwide Offshore Accident Databank (WOAD) operated by Det Norske Veritas (DNV). WOAD contains some 5,200 events from the period 1970-2006, derived mainly from public-domain sources such as Lloyds Casualty Reports, newspapers and official publications. Most of the data is from the
Page 16
UK and Norwegian Sectors and the US Gulf of Mexico. Exposure data is also provided, allowing accident frequencies to be calculated for different accident types, installation/rig/platform types, geographical locations, degrees of damage, etc.
Page 17
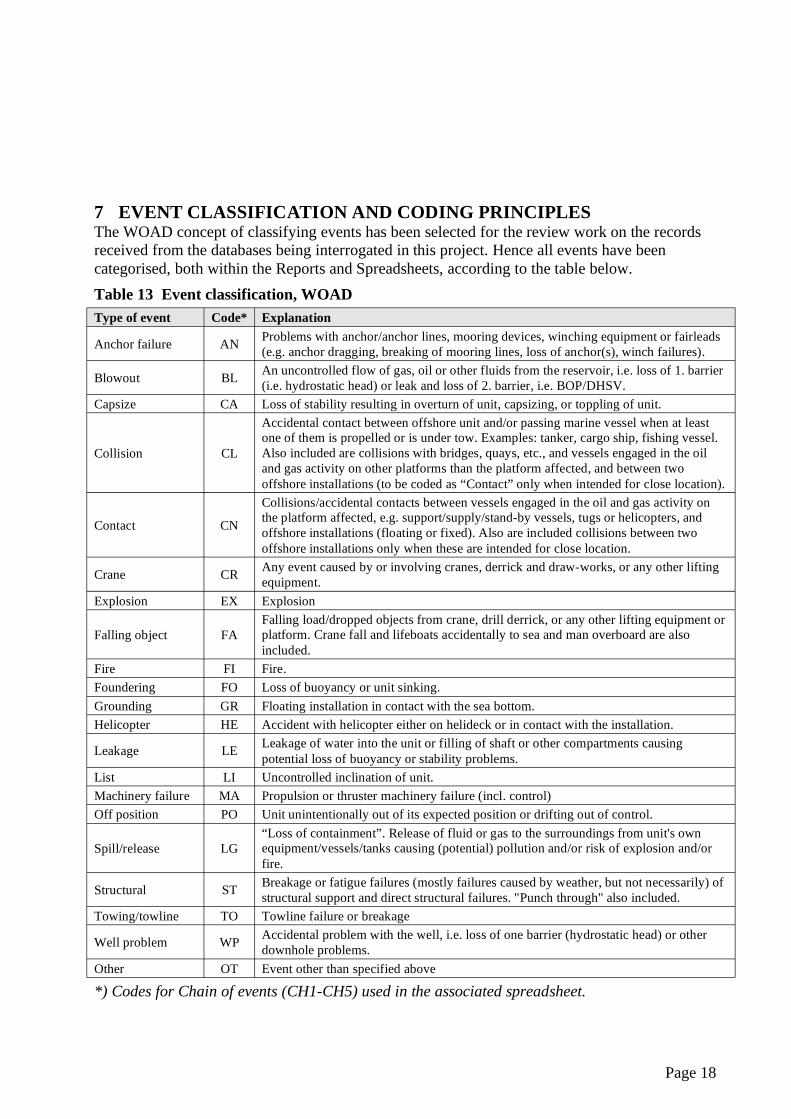
7 EVENT CLASSIFICATION AND CODING PRINCIPLES The WOAD concept of classifying events has been selected for the review work on the records received from the databases being interrogated in this project. Hence all events have been categorised, both within the Reports and Spreadsheets, according to the table below. Table 13 Event classification, WOAD Type of event Code* Explanation
Anchor failure AN Problems with anchor/anchor lines, mooring devices, winching equipment or fairleads (e.g. anchor dragging, breaking of mooring lines, loss of anchor(s), winch failures).
Blowout BL An uncontrolled flow of gas, oil or other fluids from the reservoir, i.e. loss of 1. barrier (i.e. hydrostatic head) or leak and loss of 2. barrier, i.e. BOP/DHSV.
Capsize CA Loss of stability resulting in overturn of unit, capsizing, or toppling of unit.
Collision CL
Accidental contact between offshore unit and/or passing marine vessel when at least one of them is propelled or is under tow. Examples: tanker, cargo ship, fishing vessel. Also included are collisions with bridges, quays, etc., and vessels engaged in the oil and gas activity on other platforms than the platform affected, and between two offshore installations (to be coded as “Contact” only when intended for close location).
Contact CN
Collisions/accidental contacts between vessels engaged in the oil and gas activity on the platform affected, e.g. support/supply/stand-by vessels, tugs or helicopters, and offshore installations (floating or fixed). Also are included collisions between two offshore installations only when these are intended for close location.
Crane CR Any event caused by or involving cranes, derrick and draw-works, or any other lifting equipment.
Explosion EX Explosion
Falling object FA Falling load/dropped objects from crane, drill derrick, or any other lifting equipment or platform. Crane fall and lifeboats accidentally to sea and man overboard are also included.
Fire FI Fire. Foundering FO Loss of buoyancy or unit sinking. Grounding GR Floating installation in contact with the sea bottom. Helicopter HE Accident with helicopter either on helideck or in contact with the installation.
Leakage LE Leakage of water into the unit or filling of shaft or other compartments causing potential loss of buoyancy or stability problems.
List LI Uncontrolled inclination of unit. Machinery failure MA Propulsion or thruster machinery failure (incl. control) Off position PO Unit unintentionally out of its expected position or drifting out of control.
Spill/release LG “Loss of containment”. Release of fluid or gas to the surroundings from unit's own equipment/vessels/tanks causing (potential) pollution and/or risk of explosion and/or fire.
Structural ST Breakage or fatigue failures (mostly failures caused by weather, but not necessarily) of structural support and direct structural failures. "Punch through" also included.
Towing/towline TO Towline failure or breakage
Well problem WP Accidental problem with the well, i.e. loss of one barrier (hydrostatic head) or other downhole problems.
Other OT Event other than specified above
*) Codes for Chain of events (CH1-CH5) used in the associated spreadsheet.
Page 18
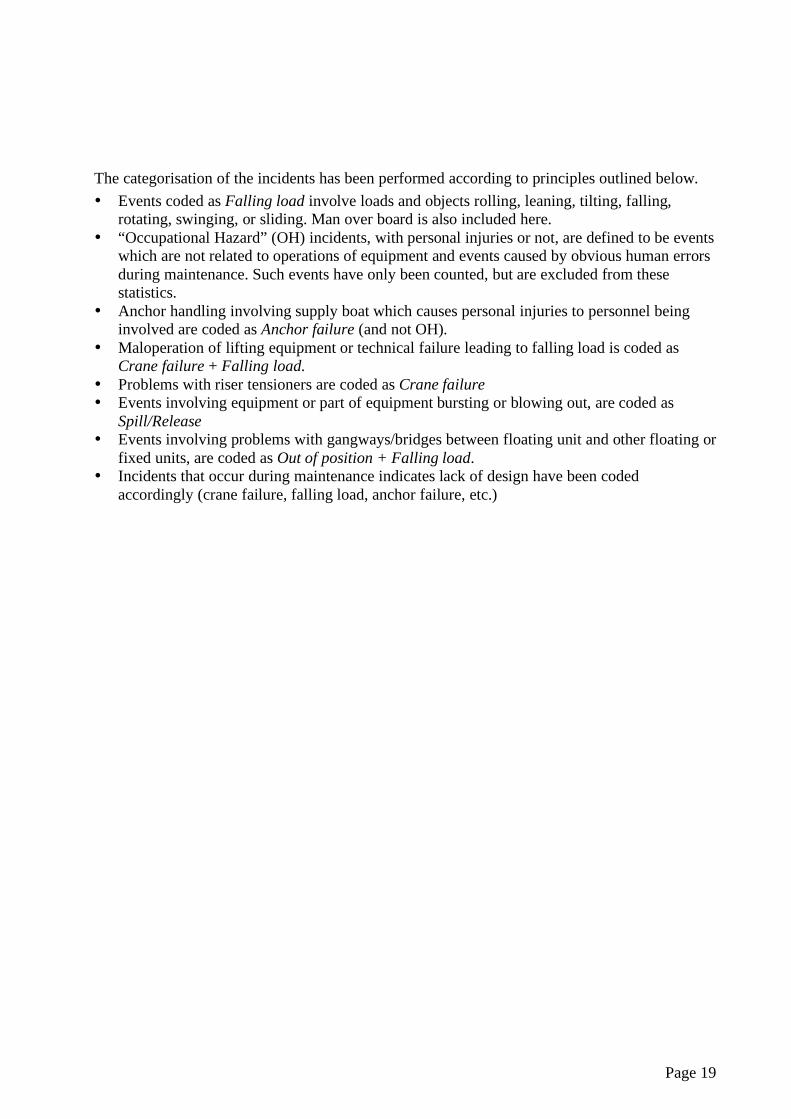
The categorisation of the incidents has been performed according to principles outlined below. • Events coded as Falling load involve loads and objects rolling, leaning, tilting, falling,
rotating, swinging, or sliding. Man over board is also included here. • “Occupational Hazard” (OH) incidents, with personal injuries or not, are defined to be events
which are not related to operations of equipment and events caused by obvious human errors during maintenance. Such events have only been counted, but are excluded from these statistics.
• Anchor handling involving supply boat which causes personal injuries to personnel being involved are coded as Anchor failure (and not OH).
• Maloperation of lifting equipment or technical failure leading to falling load is coded as Crane failure + Falling load.
• Problems with riser tensioners are coded as Crane failure • Events involving equipment or part of equipment bursting or blowing out, are coded as
Spill/Release • Events involving problems with gangways/bridges between floating unit and other floating or
fixed units, are coded as Out of position + Falling load. • Incidents that occur during maintenance indicates lack of design have been coded
accordingly (crane failure, falling load, anchor failure, etc.)
Page 19
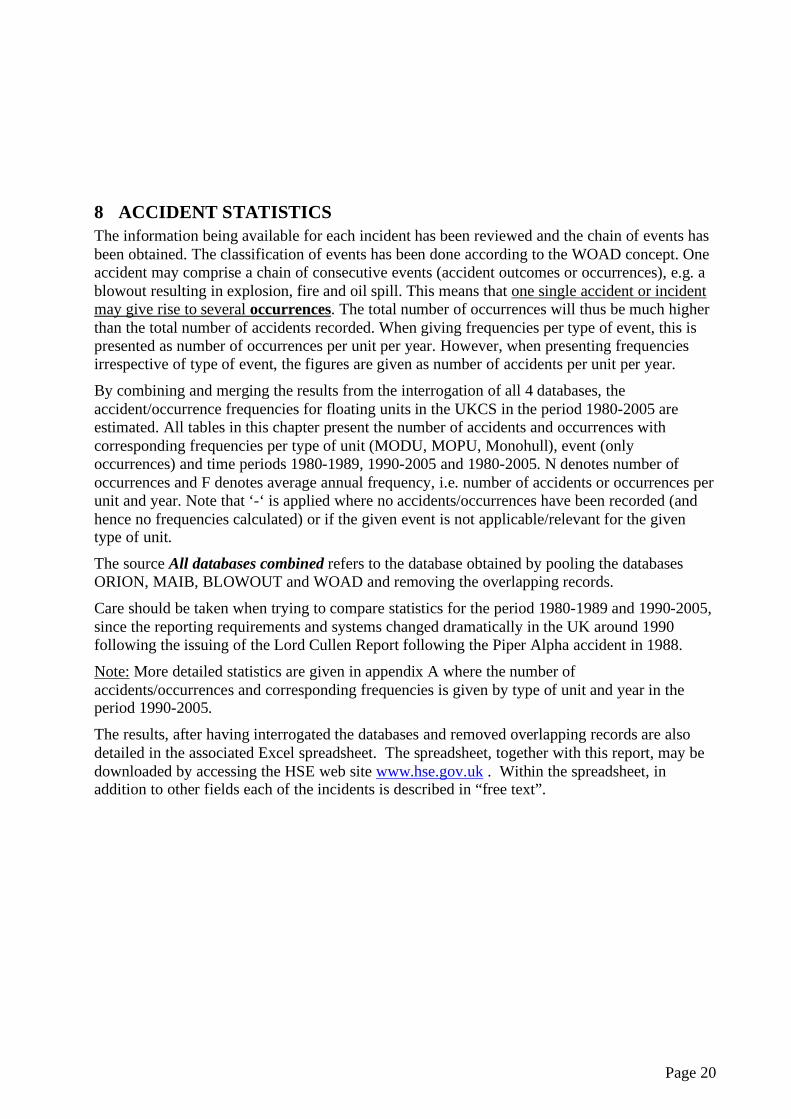
8 ACCIDENT STATISTICS The information being available for each incident has been reviewed and the chain of events has been obtained. The classification of events has been done according to the WOAD concept. One accident may comprise a chain of consecutive events (accident outcomes or occurrences), e.g. a blowout resulting in explosion, fire and oil spill. This means that one single accident or incident may give rise to several occurrences. The total number of occurrences will thus be much higher than the total number of accidents recorded. When giving frequencies per type of event, this is presented as number of occurrences per unit per year. However, when presenting frequencies irrespective of type of event, the figures are given as number of accidents per unit per year.
By combining and merging the results from the interrogation of all 4 databases, the accident/occurrence frequencies for floating units in the UKCS in the period 1980-2005 are estimated. All tables in this chapter present the number of accidents and occurrences with corresponding frequencies per type of unit (MODU, MOPU, Monohull), event (only occurrences) and time periods 1980-1989, 1990-2005 and 1980-2005. N denotes number of occurrences and F denotes average annual frequency, i.e. number of accidents or occurrences per unit and year. Note that ‘-‘ is applied where no accidents/occurrences have been recorded (and hence no frequencies calculated) or if the given event is not applicable/relevant for the given type of unit.
The source All databases combined refers to the database obtained by pooling the databases ORION, MAIB, BLOWOUT and WOAD and removing the overlapping records.
Care should be taken when trying to compare statistics for the period 1980-1989 and 1990-2005, since the reporting requirements and systems changed dramatically in the UK around 1990 following the issuing of the Lord Cullen Report following the Piper Alpha accident in 1988.
Note: More detailed statistics are given in appendix A where the number of accidents/occurrences and corresponding frequencies is given by type of unit and year in the period 1990-2005.
The results, after having interrogated the databases and removed overlapping records are also detailed in the associated Excel spreadsheet. The spreadsheet, together with this report, may be downloaded by accessing the HSE web site www.hse.gov.uk . Within the spreadsheet, in addition to other fields each of the incidents is described in “free text”.
Page 20
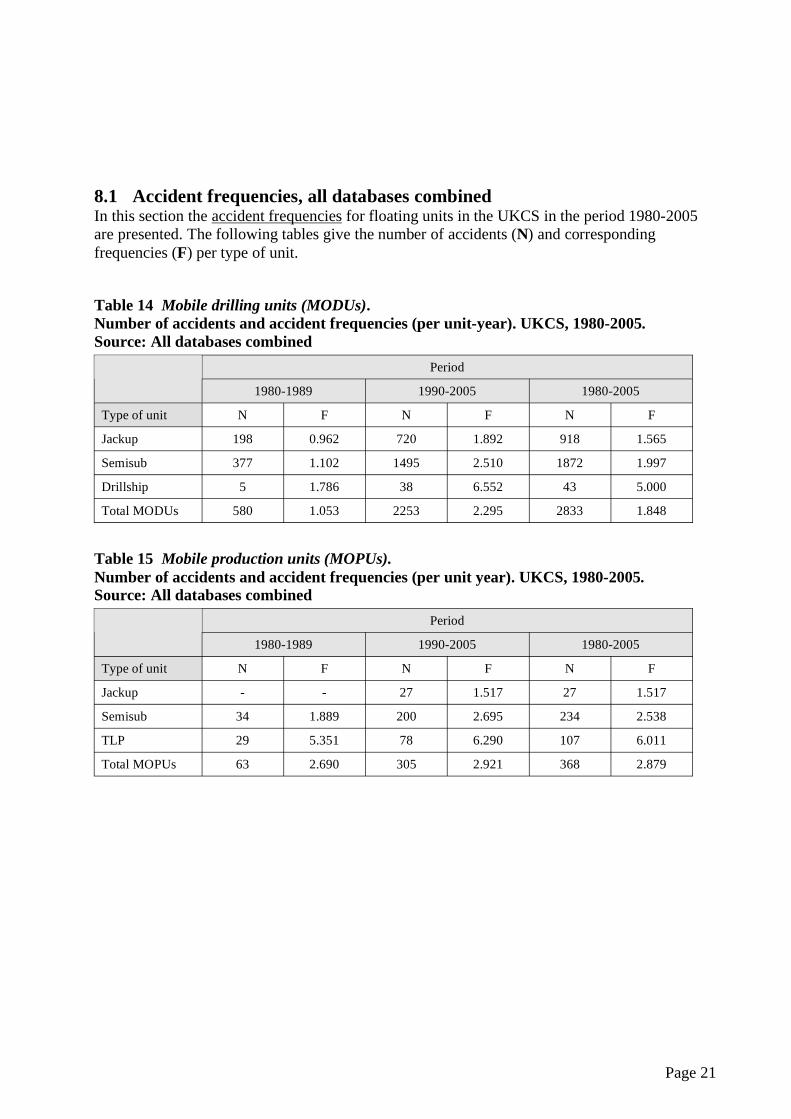
8.1 Accident frequencies, all databases combined In this section the accident frequencies for floating units in the UKCS in the period 1980-2005 are presented. The following tables give the number of accidents (N) and corresponding frequencies (F) per type of unit.
Table 14 Mobile drilling units (MODUs).Number of accidents and accident frequencies (per unit-year). UKCS, 1980-2005.Source: All databases combined
Period
1980-1989 1990-2005 1980-2005
Type of unit N F N F N F
Jackup 198 0.962 720 1.892 918 1.565
Semisub 377 1.102 1495 2.510 1872 1.997
Drillship 5 1.786 38 6.552 43 5.000
Total MODUs 580 1.053 2253 2.295 2833 1.848
Table 15 Mobile production units (MOPUs).Number of accidents and accident frequencies (per unit year). UKCS, 1980-2005.Source: All databases combined
Period
1980-1989 1990-2005 1980-2005
Type of unit N F N F N F
Jackup - - 27 1.517 27 1.517
Semisub 34 1.889 200 2.695 234 2.538
TLP 29 5.351 78 6.290 107 6.011
Total MOPUs 63 2.690 305 2.921 368 2.879
Page 21
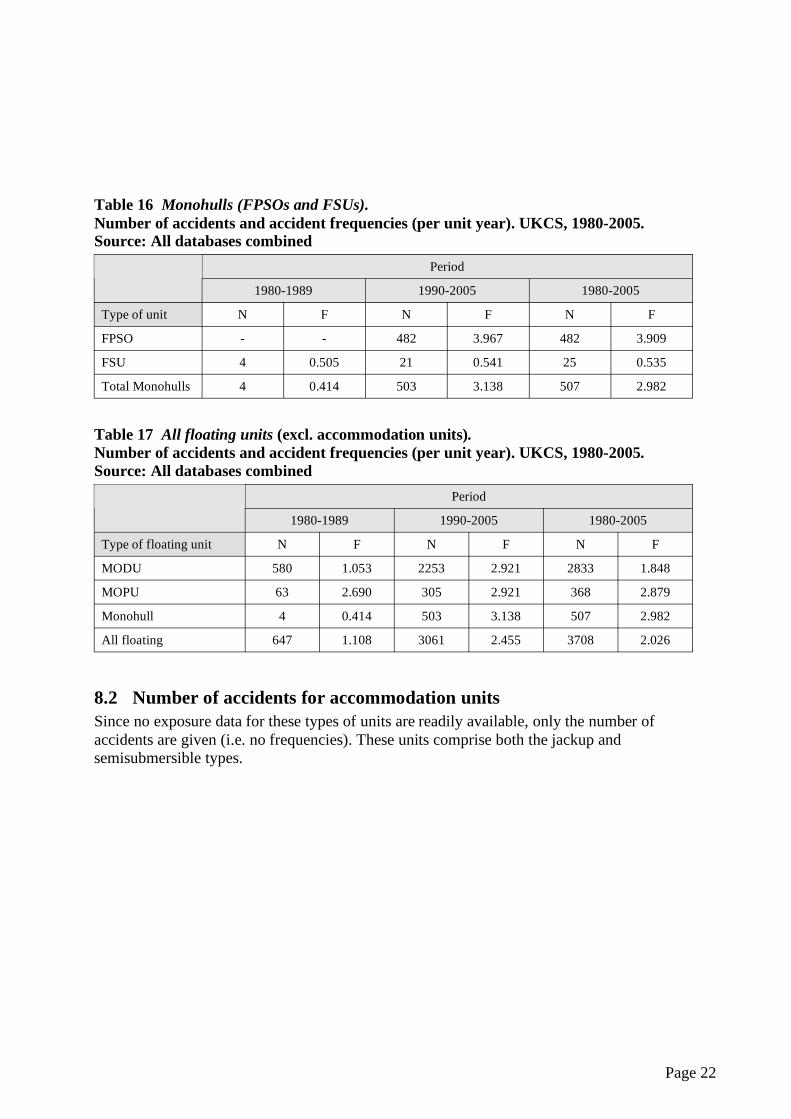
Table 16 Monohulls (FPSOs and FSUs).Number of accidents and accident frequencies (per unit year). UKCS, 1980-2005.Source: All databases combined
Period
1980-1989 1990-2005 1980-2005
Type of unit N F N F N F
FPSO - - 482 3.967 482 3.909
FSU 4 0.505 21 0.541 25 0.535
Total Monohulls 4 0.414 503 3.138 507 2.982
Table 17 All floating units (excl. accommodation units).Number of accidents and accident frequencies (per unit year). UKCS, 1980-2005.Source: All databases combined
Period
1980-1989 1990-2005 1980-2005
Type of floating unit N F N F N F
MODU 580 1.053 2253 2.921 2833 1.848
MOPU 63 2.690 305 2.921 368 2.879
Monohull 4 0.414 503 3.138 507 2.982
All floating 647 1.108 3061 2.455 3708 2.026
8.2 Number of accidents for accommodation units Since no exposure data for these types of units are readily available, only the number of accidents are given (i.e. no frequencies). These units comprise both the jackup and semisubmersible types.
Page 22
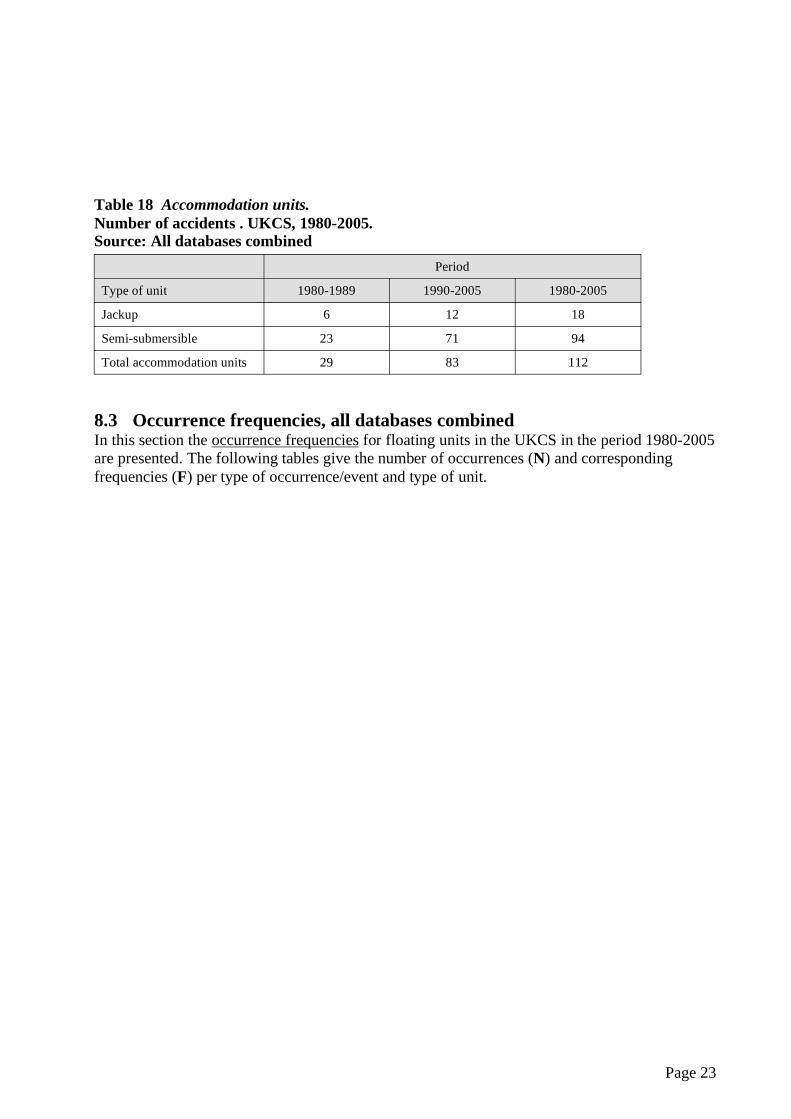
Table 18 Accommodation units.Number of accidents . UKCS, 1980-2005.Source: All databases combined
Period
Type of unit 1980-1989 1990-2005 1980-2005
Jackup 6 12 18
Semi-submersible 23 71 94
Total accommodation units 29 83 112
8.3 Occurrence frequencies, all databases combined In this section the occurrence frequencies for floating units in the UKCS in the period 1980-2005 are presented. The following tables give the number of occurrences (N) and corresponding frequencies (F) per type of occurrence/event and type of unit.
Page 23
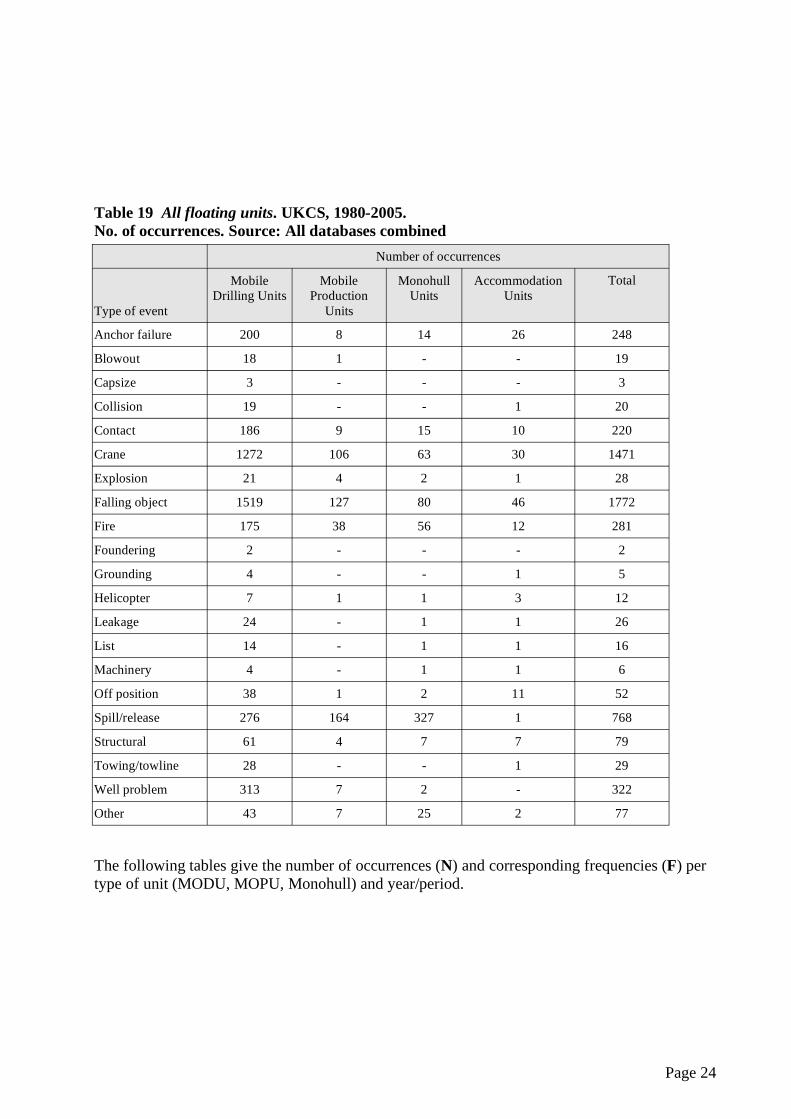
Table 19 All floating units. UKCS, 1980-2005.No. of occurrences. Source: All databases combined
Number of occurrences
Mobile Mobile Monohull Accommodation Total Drilling Units Production Units Units
Type of event Units
Anchor failure 200 8 14 26 248
Blowout 18 1 - - 19
Capsize 3 - - - 3
Collision 19 - - 1 20
Contact 186 9 15 10 220
Crane 1272 106 63 30 1471
Explosion 21 4 2 1 28
Falling object 1519 127 80 46 1772
Fire 175 38 56 12 281
Foundering 2 - - - 2
Grounding 4 - - 1 5
Helicopter 7 1 1 3 12
Leakage 24 - 1 1 26
List 14 - 1 1 16
Machinery 4 - 1 1 6
Off position 38 1 2 11 52
Spill/release 276 164 327 1 768
Structural 61 4 7 7 79
Towing/towline 28 - - 1 29
Well problem 313 7 2 - 322
Other 43 7 25 2 77
The following tables give the number of occurrences (N) and corresponding frequencies (F) per type of unit (MODU, MOPU, Monohull) and year/period.
Page 24
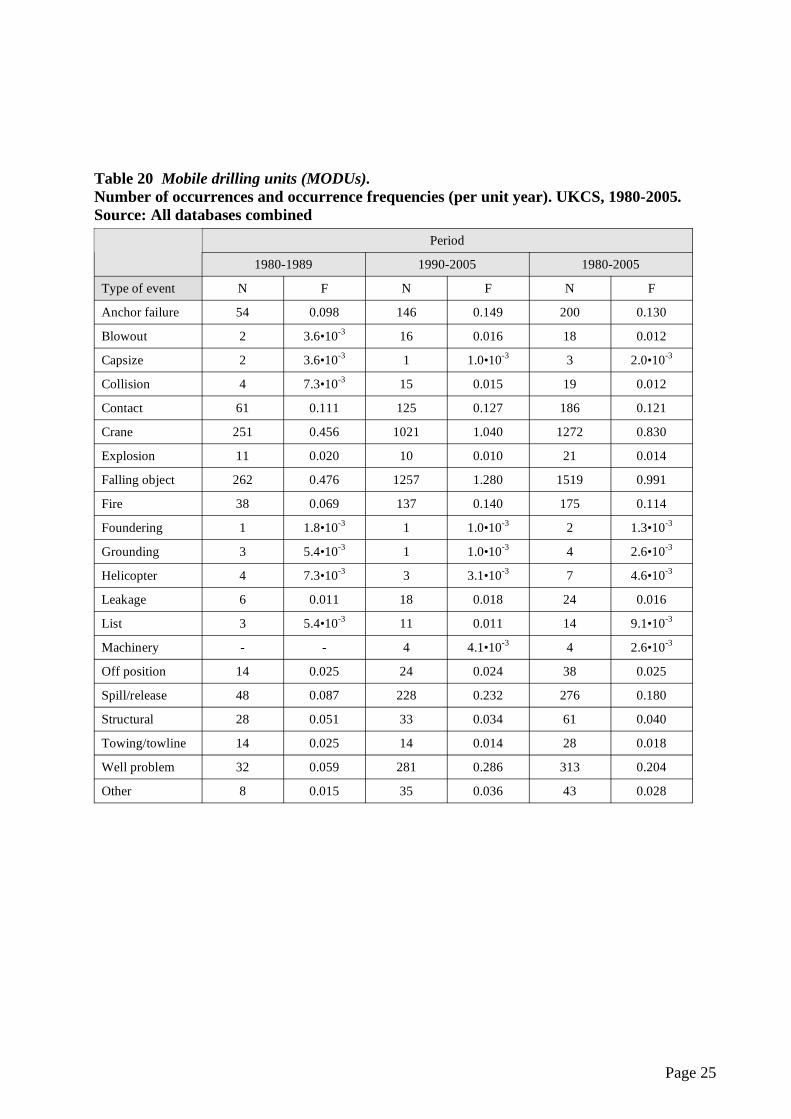
Table 20 Mobile drilling units (MODUs).Number of occurrences and occurrence frequencies (per unit year). UKCS, 1980-2005.Source: All databases combined
Period
1980-1989 1990-2005 1980-2005
Type of event N F N F N F
Anchor failure 54 0.098 146 0.149 200 0.130
Blowout 2 3.6•10-3 16 0.016 18 0.012
Capsize 2 3.6•10-3 1 1.0•10-3 3 2.0•10-3
Collision 4 7.3•10-3 15 0.015 19 0.012
Contact 61 0.111 125 0.127 186 0.121
Crane 251 0.456 1021 1.040 1272 0.830
Explosion 11 0.020 10 0.010 21 0.014
Falling object 262 0.476 1257 1.280 1519 0.991
Fire 38 0.069 137 0.140 175 0.114
Foundering 1 1.8•10-3 1 1.0•10-3 2 1.3•10-3
Grounding 3 5.4•10-3 1 1.0•10-3 4 2.6•10-3
Helicopter 4 7.3•10-3 3 3.1•10-3 7 4.6•10-3
Leakage 6 0.011 18 0.018 24 0.016
List 3 5.4•10-3 11 0.011 14 9.1•10-3
Machinery - - 4 4.1•10-3 4 2.6•10-3
Off position 14 0.025 24 0.024 38 0.025
Spill/release 48 0.087 228 0.232 276 0.180
Structural 28 0.051 33 0.034 61 0.040
Towing/towline 14 0.025 14 0.014 28 0.018
Well problem 32 0.059 281 0.286 313 0.204
Other 8 0.015 35 0.036 43 0.028
Page 25
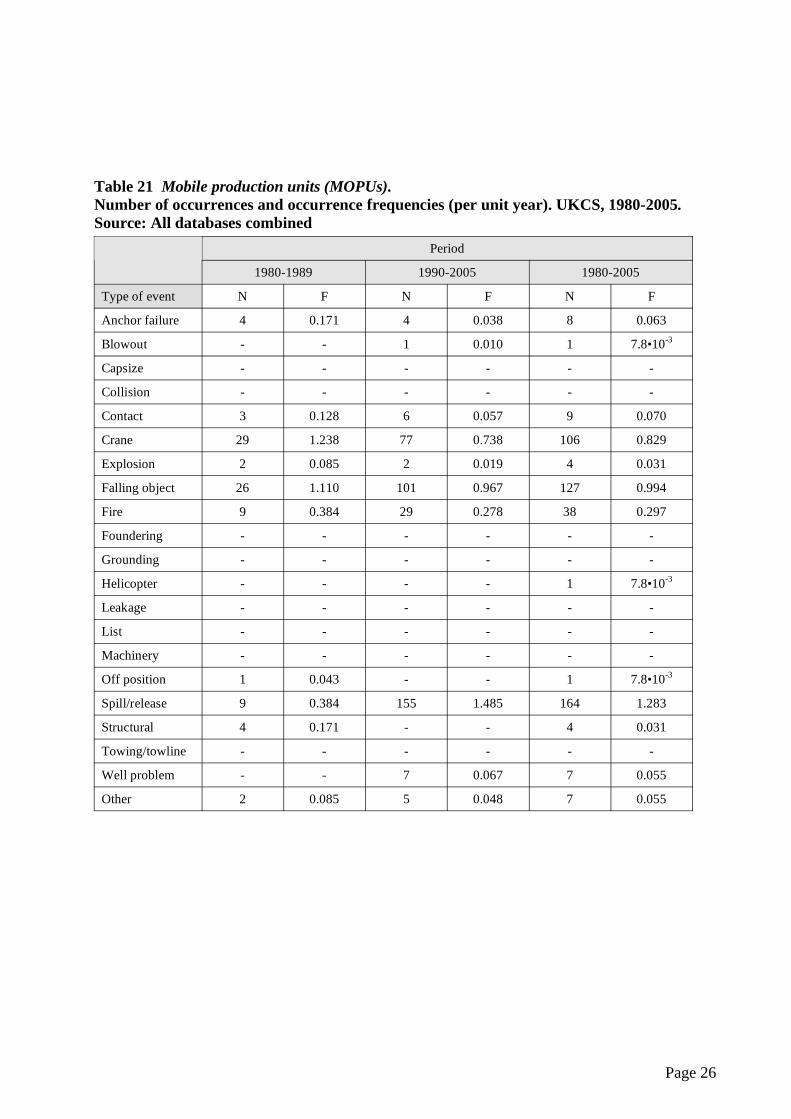
Table 21 Mobile production units (MOPUs).Number of occurrences and occurrence frequencies (per unit year). UKCS, 1980-2005.Source: All databases combined
Period
1980-1989 1990-2005 1980-2005
Type of event N F N F N F
Anchor failure 4 0.171 4 0.038 8 0.063
Blowout - - 1 0.010 1 7.8•10-3
Capsize - - - - - -
Collision - - - - - -
Contact 3 0.128 6 0.057 9 0.070
Crane 29 1.238 77 0.738 106 0.829
Explosion 2 0.085 2 0.019 4 0.031
Falling object 26 1.110 101 0.967 127 0.994
Fire 9 0.384 29 0.278 38 0.297
Foundering - - - - - -
Grounding - - - - - -
Helicopter - - - - 1 7.8•10-3
Leakage - - - - - -
List - - - - - -
Machinery - - - - - -
Off position 1 0.043 - - 1 7.8•10-3
Spill/release 9 0.384 155 1.485 164 1.283
Structural 4 0.171 - - 4 0.031
Towing/towline - - - - - -
Well problem - - 7 0.067 7 0.055
Other 2 0.085 5 0.048 7 0.055
Page 26
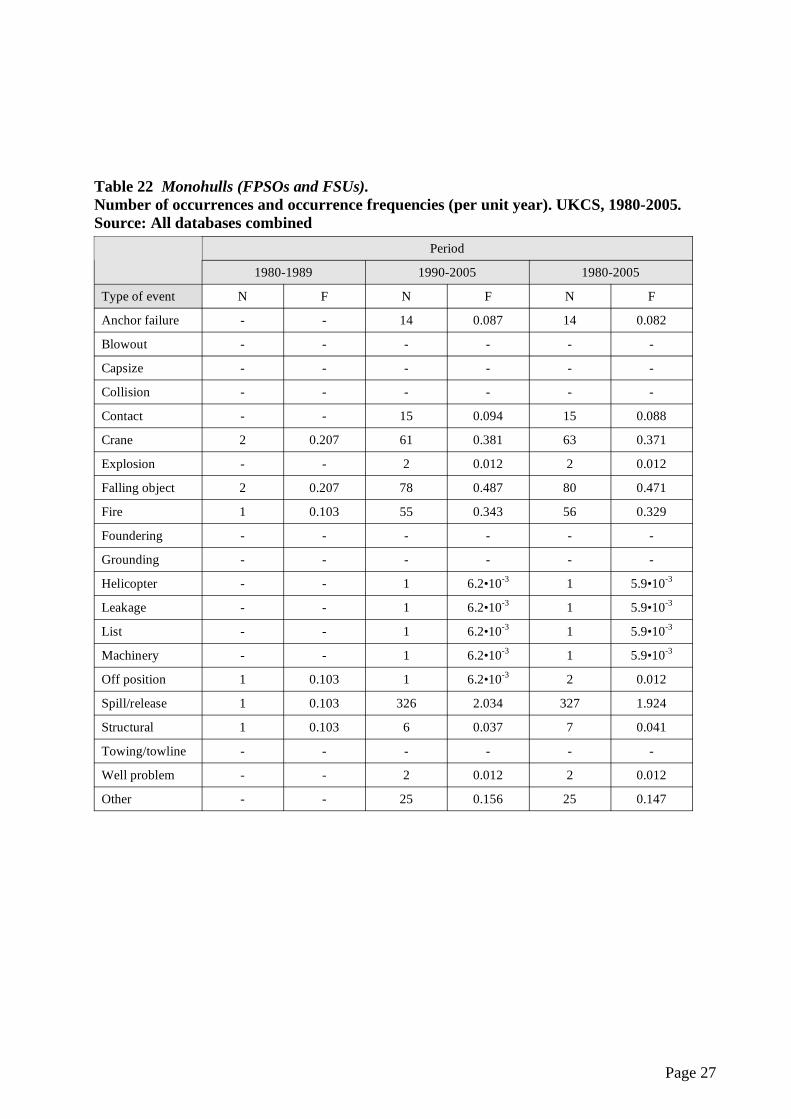
Table 22 Monohulls (FPSOs and FSUs).Number of occurrences and occurrence frequencies (per unit year). UKCS, 1980-2005.Source: All databases combined
Period
1980-1989 1990-2005 1980-2005
Type of event N F N F N F
Anchor failure - - 14 0.087 14 0.082
Blowout - - - - - -
Capsize - - - - - -
Collision - - - - - -
Contact - - 15 0.094 15 0.088
Crane 2 0.207 61 0.381 63 0.371
Explosion - - 2 0.012 2 0.012
Falling object 2 0.207 78 0.487 80 0.471
Fire 1 0.103 55 0.343 56 0.329
Foundering - - - - - -
Grounding - - - - - -
Helicopter - - 1 6.2•10-3 1 5.9•10-3
Leakage - - 1 6.2•10-3 1 5.9•10-3
List - - 1 6.2•10-3 1 5.9•10-3
Machinery - - 1 6.2•10-3 1 5.9•10-3
Off position 1 0.103 1 6.2•10-3 2 0.012
Spill/release 1 0.103 326 2.034 327 1.924
Structural 1 0.103 6 0.037 7 0.041
Towing/towline - - - - - -
Well problem - - 2 0.012 2 0.012
Other - - 25 0.156 25 0.147
Page 27
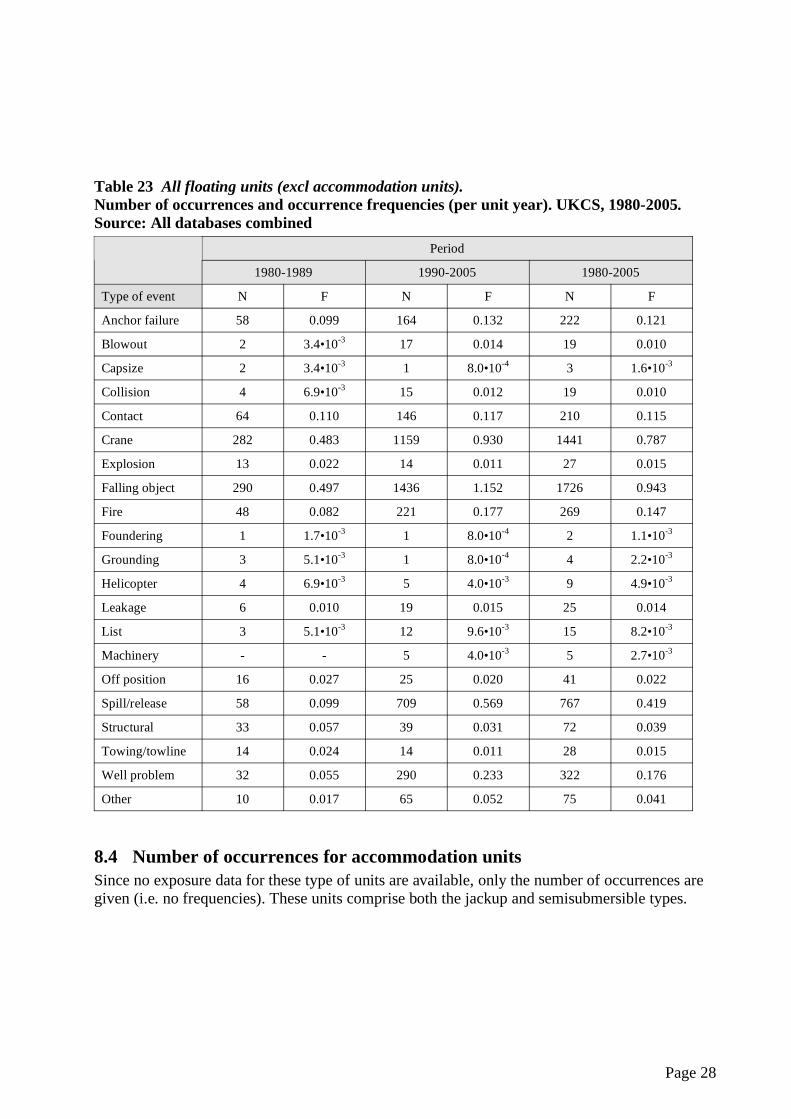
Table 23 All floating units (excl accommodation units).Number of occurrences and occurrence frequencies (per unit year). UKCS, 1980-2005.Source: All databases combined
Period
1980-1989 1990-2005 1980-2005
Type of event N F N F N F
Anchor failure 58 0.099 164 0.132 222 0.121
Blowout 2 3.4•10-3 17 0.014 19 0.010
Capsize 2 3.4•10-3 1 8.0•10-4 3 1.6•10-3
Collision 4 6.9•10-3 15 0.012 19 0.010
Contact 64 0.110 146 0.117 210 0.115
Crane 282 0.483 1159 0.930 1441 0.787
Explosion 13 0.022 14 0.011 27 0.015
Falling object 290 0.497 1436 1.152 1726 0.943
Fire 48 0.082 221 0.177 269 0.147
Foundering 1 1.7•10-3 1 8.0•10-4 2 1.1•10-3
Grounding 3 5.1•10-3 1 8.0•10-4 4 2.2•10-3
Helicopter 4 6.9•10-3 5 4.0•10-3 9 4.9•10-3
Leakage 6 0.010 19 0.015 25 0.014
List 3 5.1•10-3 12 9.6•10-3 15 8.2•10-3
Machinery - - 5 4.0•10-3 5 2.7•10-3
Off position 16 0.027 25 0.020 41 0.022
Spill/release 58 0.099 709 0.569 767 0.419
Structural 33 0.057 39 0.031 72 0.039
Towing/towline 14 0.024 14 0.011 28 0.015
Well problem 32 0.055 290 0.233 322 0.176
Other 10 0.017 65 0.052 75 0.041
8.4 Number of occurrences for accommodation units Since no exposure data for these type of units are available, only the number of occurrences are given (i.e. no frequencies). These units comprise both the jackup and semisubmersible types.
Page 28
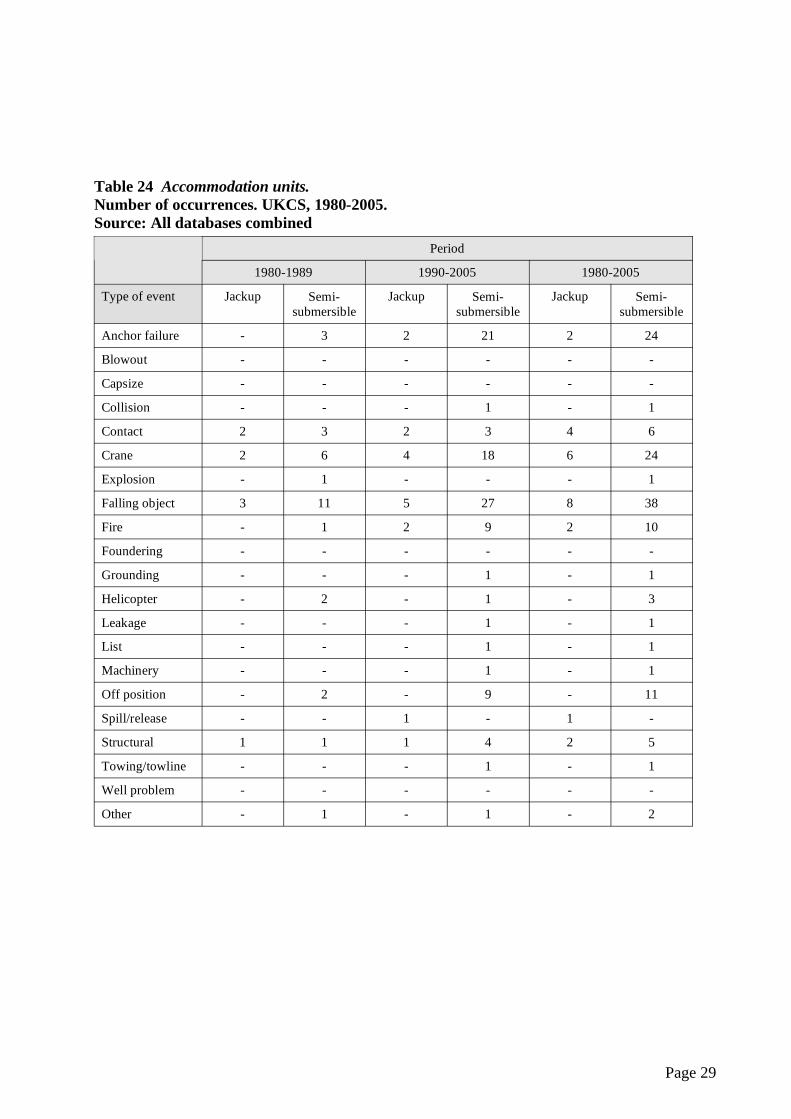
Table 24 Accommodation units.Number of occurrences. UKCS, 1980-2005.Source: All databases combined
Period
1980-1989 1990-2005 1980-2005
Type of event Jackup Semi-submersible
Jackup Semi-submersible
Jackup Semi-submersible
Anchor failure - 3 2 21 2 24
Blowout - - - - - -
Capsize - - - - - -
Collision - - - 1 - 1
Contact 2 3 2 3 4 6
Crane 2 6 4 18 6 24
Explosion - 1 - - - 1
Falling object 3 11 5 27 8 38
Fire - 1 2 9 2 10
Foundering - - - - - -
Grounding - - - 1 - 1
Helicopter - 2 - 1 - 3
Leakage - - - 1 - 1
List - - - 1 - 1
Machinery - - - 1 - 1
Off position - 2 - 9 - 11
Spill/release - - 1 - 1 -
Structural 1 1 1 4 2 5
Towing/towline - - - 1 - 1
Well problem - - - - - -
Other - 1 - 1 - 2
Page 29
9 CONCLUSIONS The main source for accident and incident information available to the UKCS offshore industry should be this database as it, and the associated spreadsheet, together contain comprehensive UKCS data from the most relevant accident databases.
This database is understood to be the only UKCS accident and incident database which is both publicly and freely available to the offshore industry and others. It has been created in the WOAD format, with which the offshore industry is familiar and it is regularly updated with accident and incident information from relevant international databases. In addition the format of the spreadsheet, which contains a free text description of each incident, allows a sort capability to be utilised thus enabling specific data to be extracted from the database as and when required.
The results from this study would serve as a reference document for data to be used in future Risk Assessments of offshore fixed units and furthermore, be a valuable reference document for UK Health & Safety Executive (HSE)/ Offshore Safety Division (OSD) when reviewing Safety Cases for floating installations.
To fulfil the objectives set out for this project, relevant UK and Norwegian databases were interrogated with respect to both population and accident data forming a complete data basis for obtaining comprehensive accident statistics for the listed type of units, geographical area and time period.
The result after having interrogated the identified databases and removing overlapping records shows a total of 3820 events comprising accidents, hazardous situations and near-misses on floating units on the UKCS in the period 1980-2005.
Page 30
10 REFERENCES
/1/ Accident statistics for floating offshore units on the UK Continental Shelf 1980 – 2003. Det Norske Veritas/UK Health & Safety Executive. HSE Research Report Series. Report No. RR353. http://www.hse.gov.uk/research/rrhtm/rr353.htm
/2/ Accident statistics for floating offshore units on the UK Continental Shelf 1980 – 2001. Det Norske Veritas/UK Health & Safety Executive. Research Report Series. Report No. RR095. http://www.hse.gov.uk/research/rrhtm/rr095.htm
- o0o -
Page 31

Page 32
APPENDIXA
DETAILED STATISTICS
Page A-1
A. 1 Introduction The information being available for each incident has been reviewed and the chain of events has been obtained. The classification of events has been done according to the WOAD concept. One accident may comprise a chain of consecutive events (accident outcomes or occurrences), e.g. a blowout resulting in explosion, fire and oil spill. This means that one single accident or incident may give rise to several occurrences. The total number of occurrences will thus be much higher than the total number of accidents recorded. When giving frequencies per type of event, this is presented as number of occurrences per unit per year.
A. 2 Accident statistics By combining and merging the results from the interrogation of all 4 databases, the occurrence frequencies for floating units in the UKCS in the period 1980-2005 are estimated. All tables in this appendix present the number of occurrences with corresponding frequencies per type of unit and event for the time periods 1980-1989, 1990-2005 and 1980-2005 and for each year in the period 1990-2005. N denotes number of occurrences and F denotes average annual frequency per unit, i.e. number of occurrences per unit year. Since no exposure data are readily available for floating accommodation units (comprising both the jackup and semisubmersible types), only the number of occurrences are given (i.e. no frequencies). Note that ‘-‘ is applied where no accidents/occurrences have been recorded (and hence no frequencies calculated) or if the given event is not applicable/relevant for the given type of unit.
The source All databases combined refers to the database obtained by pooling the databases ORION, MAIB, BLOWOUT and WOAD and removing the overlapping records.
Care should be taken when trying to compare statistics for the period 1980-89 and 1990-2005, since the reporting requirements and systems changed dramatically in the UK around 1990 following the issuing of the Lord Cullen Report following the Piper Alpha accident in 1988.
The results, after having interrogated the databases and removed overlapping records are also detailed in the associated Excel spreadsheet. The spreadsheet, together with this report, may be downloaded by accessing the HSE web site www.hse.gov.uk . Within the spreadsheet, in addition to other fields each of the incidents is described in “free text”.
Page A-2
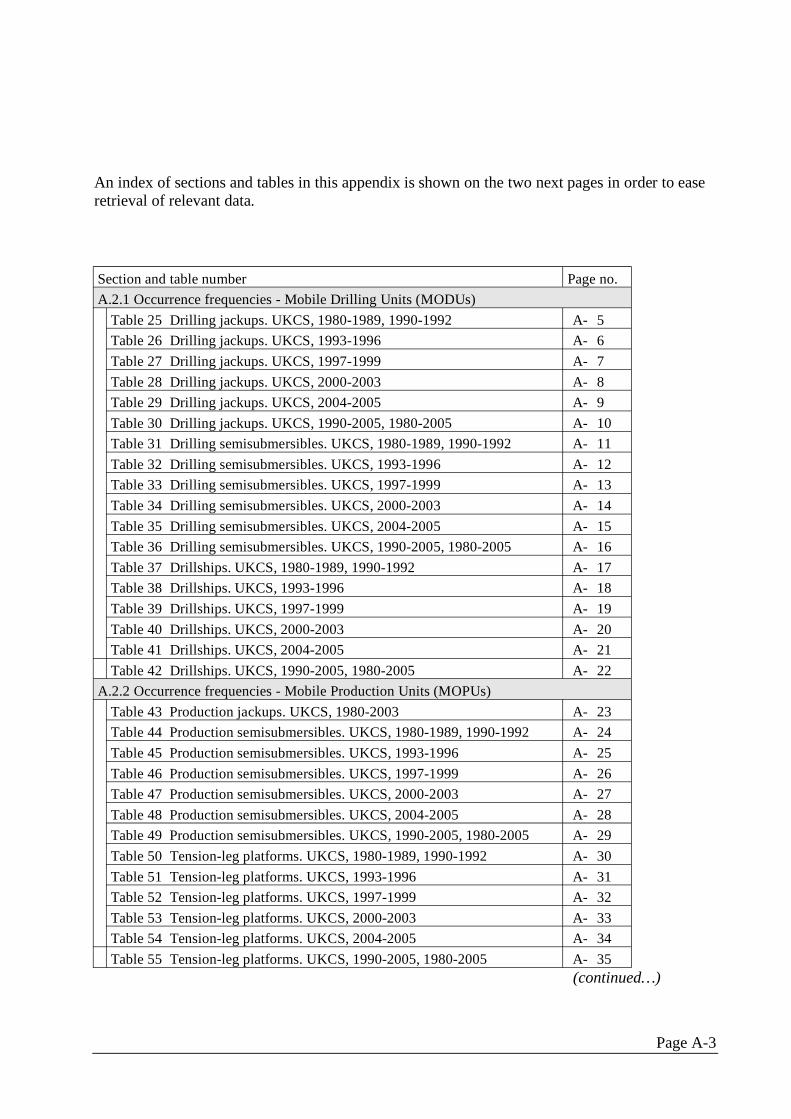
An index of sections and tables in this appendix is shown on the two next pages in order to ease retrieval of relevant data.
Section and table number Page no. A.2.1 Occurrence frequencies - Mobile Drilling Units (MODUs)
Table 25 Drilling jackups. UKCS, 1980-1989, 1990-1992 A- 5 Table 26 Drilling jackups. UKCS, 1993-1996 A- 6 Table 27 Drilling jackups. UKCS, 1997-1999 A- 7 Table 28 Drilling jackups. UKCS, 2000-2003 A- 8 Table 29 Drilling jackups. UKCS, 2004-2005 A- 9 Table 30 Drilling jackups. UKCS, 1990-2005, 1980-2005 A- 10 Table 31 Drilling semisubmersibles. UKCS, 1980-1989, 1990-1992 A- 11 Table 32 Drilling semisubmersibles. UKCS, 1993-1996 A- 12 Table 33 Drilling semisubmersibles. UKCS, 1997-1999 A- 13 Table 34 Drilling semisubmersibles. UKCS, 2000-2003 A- 14 Table 35 Drilling semisubmersibles. UKCS, 2004-2005 A- 15 Table 36 Drilling semisubmersibles. UKCS, 1990-2005, 1980-2005 A- 16 Table 37 Drillships. UKCS, 1980-1989, 1990-1992 A- 17 Table 38 Drillships. UKCS, 1993-1996 A- 18 Table 39 Drillships. UKCS, 1997-1999 A- 19 Table 40 Drillships. UKCS, 2000-2003 A- 20 Table 41 Drillships. UKCS, 2004-2005 A- 21 Table 42 Drillships. UKCS, 1990-2005, 1980-2005 A- 22
A.2.2 Occurrence frequencies - Mobile Production Units (MOPUs) Table 43 Production jackups. UKCS, 1980-2003 A- 23 Table 44 Production semisubmersibles. UKCS, 1980-1989, 1990-1992 A- 24 Table 45 Production semisubmersibles. UKCS, 1993-1996 A- 25 Table 46 Production semisubmersibles. UKCS, 1997-1999 A- 26 Table 47 Production semisubmersibles. UKCS, 2000-2003 A- 27 Table 48 Production semisubmersibles. UKCS, 2004-2005 A- 28 Table 49 Production semisubmersibles. UKCS, 1990-2005, 1980-2005 A- 29 Table 50 Tension-leg platforms. UKCS, 1980-1989, 1990-1992 A- 30 Table 51 Tension-leg platforms. UKCS, 1993-1996 A- 31 Table 52 Tension-leg platforms. UKCS, 1997-1999 A- 32 Table 53 Tension-leg platforms. UKCS, 2000-2003 A- 33 Table 54 Tension-leg platforms. UKCS, 2004-2005 A- 34 Table 55 Tension-leg platforms. UKCS, 1990-2005, 1980-2005 A- 35
(continued…)
Page A-3
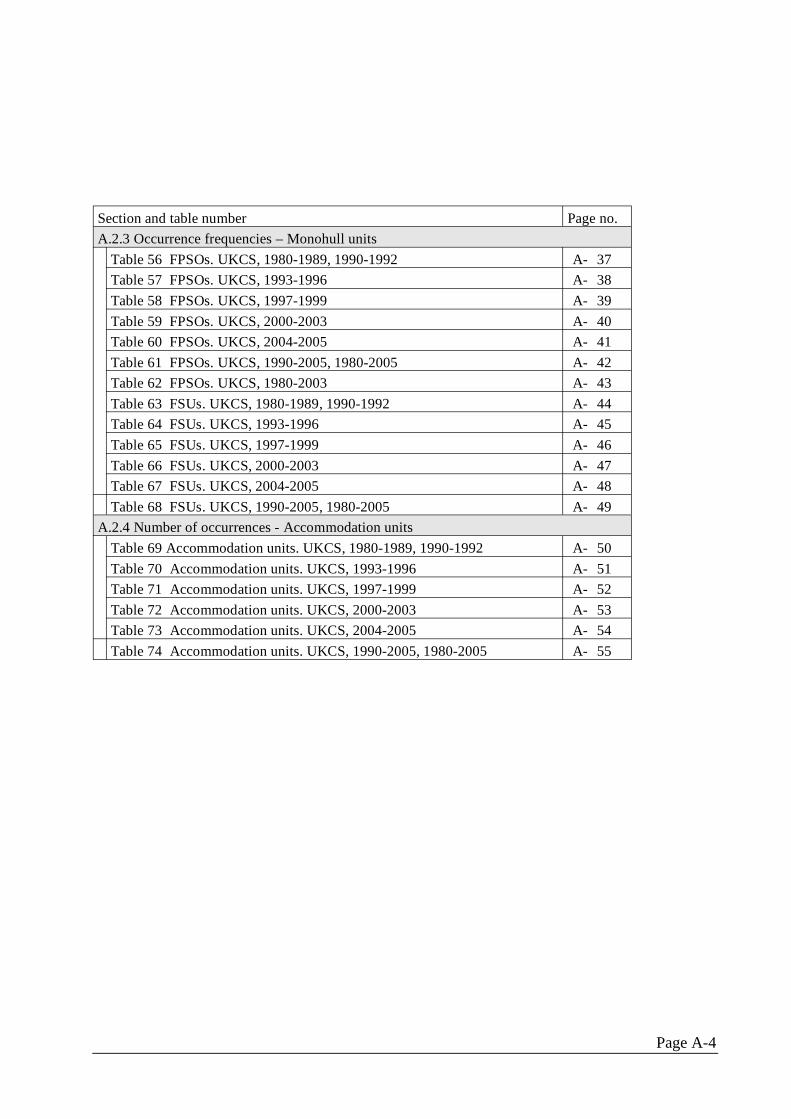
Section and table number Page no. A.2.3 Occurrence frequencies – Monohull units
Table 56 FPSOs. UKCS, 1980-1989, 1990-1992 A- 37 Table 57 FPSOs. UKCS, 1993-1996 A- 38 Table 58 FPSOs. UKCS, 1997-1999 A- 39 Table 59 FPSOs. UKCS, 2000-2003 A- 40 Table 60 FPSOs. UKCS, 2004-2005 A- 41 Table 61 FPSOs. UKCS, 1990-2005, 1980-2005 A- 42 Table 62 FPSOs. UKCS, 1980-2003 A- 43 Table 63 FSUs. UKCS, 1980-1989, 1990-1992 A- 44 Table 64 FSUs. UKCS, 1993-1996 A- 45 Table 65 FSUs. UKCS, 1997-1999 A- 46 Table 66 FSUs. UKCS, 2000-2003 A- 47 Table 67 FSUs. UKCS, 2004-2005 A- 48 Table 68 FSUs. UKCS, 1990-2005, 1980-2005 A- 49
A.2.4 Number of occurrences - Accommodation units Table 69 Accommodation units. UKCS, 1980-1989, 1990-1992 A- 50 Table 70 Accommodation units. UKCS, 1993-1996 A- 51 Table 71 Accommodation units. UKCS, 1997-1999 A- 52 Table 72 Accommodation units. UKCS, 2000-2003 A- 53 Table 73 Accommodation units. UKCS, 2004-2005 A- 54 Table 74 Accommodation units. UKCS, 1990-2005, 1980-2005 A- 55
Page A-4
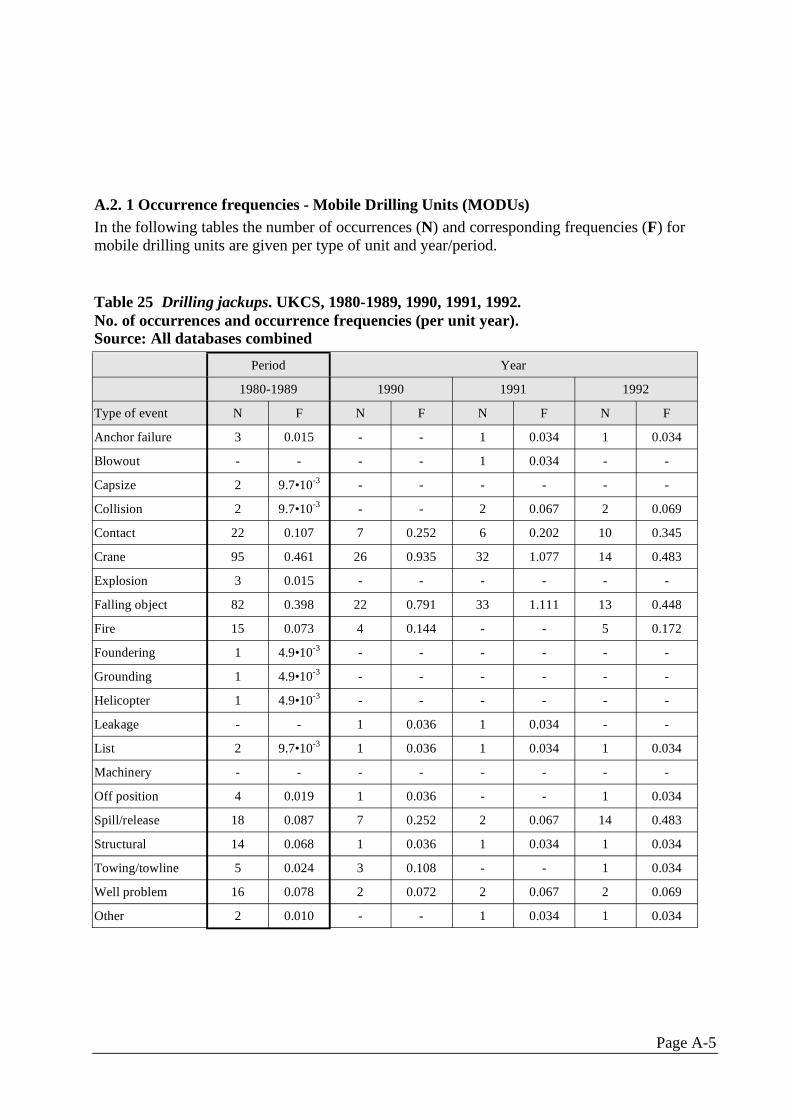
A.2. 1 Occurrence frequencies - Mobile Drilling Units (MODUs) In the following tables the number of occurrences (N) and corresponding frequencies (F) for mobile drilling units are given per type of unit and year/period.
Table 25 Drilling jackups. UKCS, 1980-1989, 1990, 1991, 1992. No. of occurrences and occurrence frequencies (per unit year). Source: All databases combined
Period Year
1980-1989 1990 1991 1992
Type of event N F N F N F N F
Anchor failure 3 0.015 - - 1 0.034 1 0.034
Blowout - - - - 1 0.034 - -
Capsize 2 9.7•10-3 - - - - - -
Collision 2 9.7•10-3 - - 2 0.067 2 0.069
Contact 22 0.107 7 0.252 6 0.202 10 0.345
Crane 95 0.461 26 0.935 32 1.077 14 0.483
Explosion 3 0.015 - - - - - -
Falling object 82 0.398 22 0.791 33 1.111 13 0.448
Fire 15 0.073 4 0.144 - - 5 0.172
Foundering 1 4.9•10-3 - - - - - -
Grounding 1 4.9•10-3 - - - - - -
Helicopter 1 4.9•10-3 - - - - - -
Leakage - - 1 0.036 1 0.034 - -
List 2 9.7•10-3 1 0.036 1 0.034 1 0.034
Machinery - - - - - - - -
Off position 4 0.019 1 0.036 - - 1 0.034
Spill/release 18 0.087 7 0.252 2 0.067 14 0.483
Structural 14 0.068 1 0.036 1 0.034 1 0.034
Towing/towline 5 0.024 3 0.108 - - 1 0.034
Well problem 16 0.078 2 0.072 2 0.067 2 0.069
Other 2 0.010 - - 1 0.034 1 0.034
Page A-5
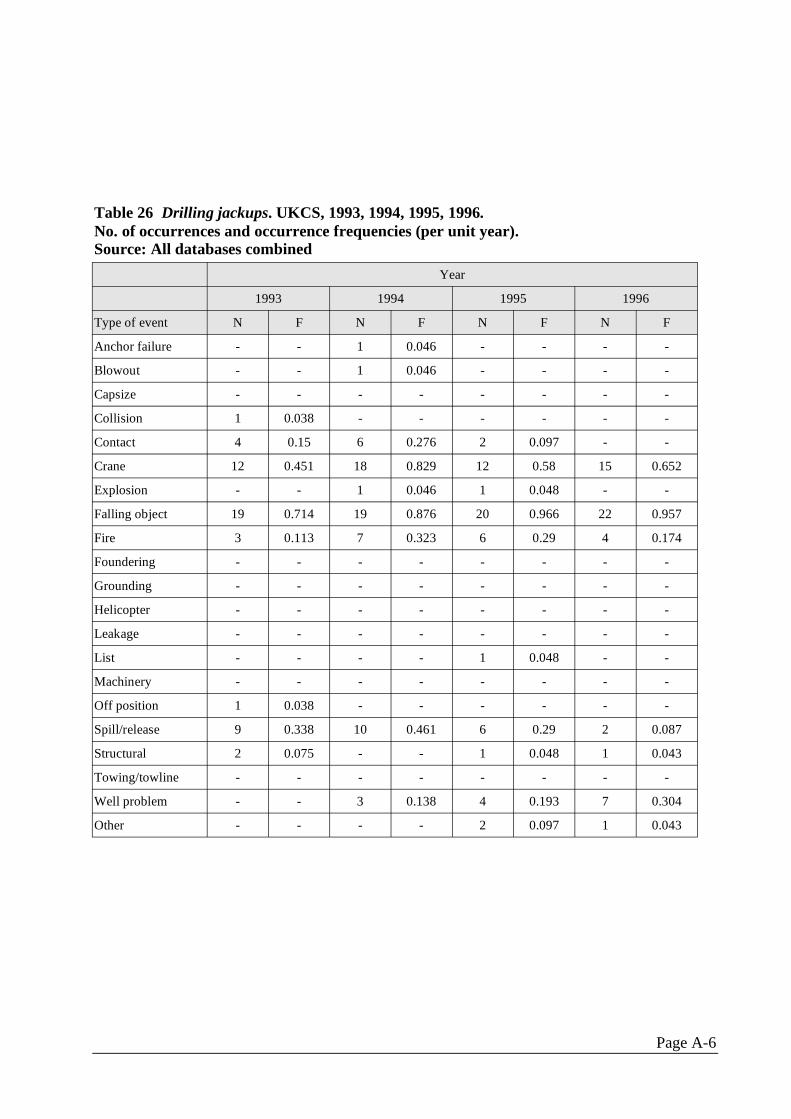
Table 26 Drilling jackups. UKCS, 1993, 1994, 1995, 1996.No. of occurrences and occurrence frequencies (per unit year).Source: All databases combined
Year
1993 1994 1995 1996
Type of event N F N F N F N F
Anchor failure - - 1 0.046 - - - -
Blowout - - 1 0.046 - - - -
Capsize - - - - - - - -
Collision 1 0.038 - - - - - -
Contact 4 0.15 6 0.276 2 0.097 - -
Crane 12 0.451 18 0.829 12 0.58 15 0.652
Explosion - - 1 0.046 1 0.048 - -
Falling object 19 0.714 19 0.876 20 0.966 22 0.957
Fire 3 0.113 7 0.323 6 0.29 4 0.174
Foundering - - - - - - - -
Grounding - - - - - - - -
Helicopter - - - - - - - -
Leakage - - - - - - - -
List - - - - 1 0.048 - -
Machinery - - - - - - - -
Off position 1 0.038 - - - - - -
Spill/release 9 0.338 10 0.461 6 0.29 2 0.087
Structural 2 0.075 - - 1 0.048 1 0.043
Towing/towline - - - - - - - -
Well problem - - 3 0.138 4 0.193 7 0.304
Other - - - - 2 0.097 1 0.043
Page A-6
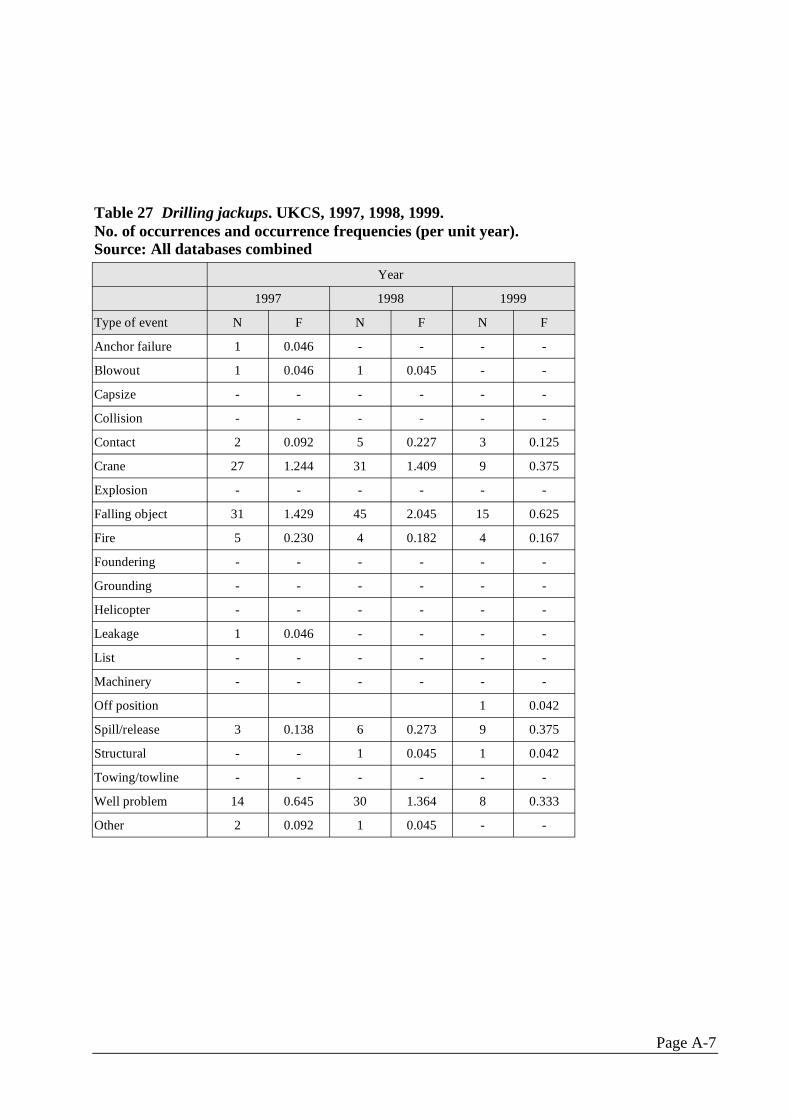
Table 27 Drilling jackups. UKCS, 1997, 1998, 1999.No. of occurrences and occurrence frequencies (per unit year).Source: All databases combined
Year
1997 1998 1999
Type of event N F N F N F
Anchor failure 1 0.046 - - - -
Blowout 1 0.046 1 0.045 - -
Capsize - - - - - -
Collision - - - - - -
Contact 2 0.092 5 0.227 3 0.125
Crane 27 1.244 31 1.409 9 0.375
Explosion - - - - - -
Falling object 31 1.429 45 2.045 15 0.625
Fire 5 0.230 4 0.182 4 0.167
Foundering - - - - - -
Grounding - - - - - -
Helicopter - - - - - -
Leakage 1 0.046 - - - -
List - - - - - -
Machinery - - - - - -
Off position 1 0.042
Spill/release 3 0.138 6 0.273 9 0.375
Structural - - 1 0.045 1 0.042
Towing/towline - - - - - -
Well problem 14 0.645 30 1.364 8 0.333
Other 2 0.092 1 0.045 - -
Page A-7
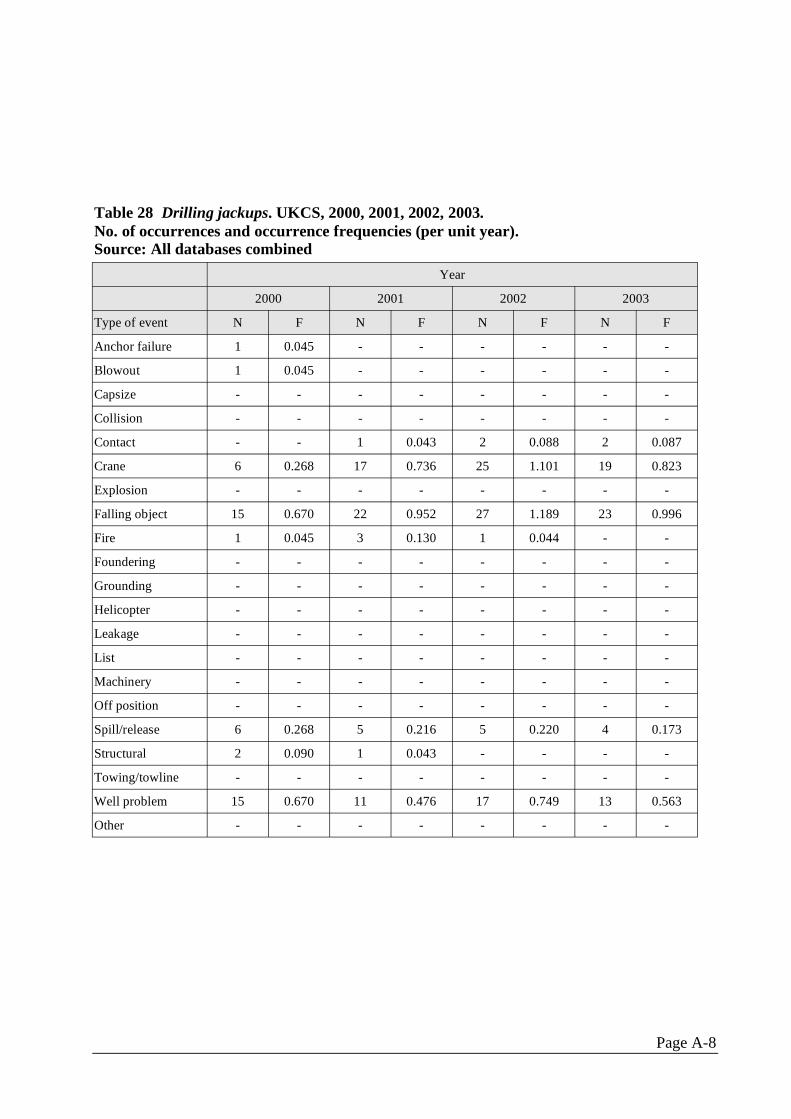
Table 28 Drilling jackups. UKCS, 2000, 2001, 2002, 2003.No. of occurrences and occurrence frequencies (per unit year).Source: All databases combined
Year
2000 2001 2002 2003
Type of event N F N F N F N F
Anchor failure 1 0.045 - - - - - -
Blowout 1 0.045 - - - - - -
Capsize - - - - - - - -
Collision - - - - - - - -
Contact - - 1 0.043 2 0.088 2 0.087
Crane 6 0.268 17 0.736 25 1.101 19 0.823
Explosion - - - - - - - -
Falling object 15 0.670 22 0.952 27 1.189 23 0.996
Fire 1 0.045 3 0.130 1 0.044 - -
Foundering - - - - - - - -
Grounding - - - - - - - -
Helicopter - - - - - - - -
Leakage - - - - - - - -
List - - - - - - - -
Machinery - - - - - - - -
Off position - - - - - - - -
Spill/release 6 0.268 5 0.216 5 0.220 4 0.173
Structural 2 0.090 1 0.043 - - - -
Towing/towline - - - - - - - -
Well problem 15 0.670 11 0.476 17 0.749 13 0.563
Other - - - - - - - -
Page A-8
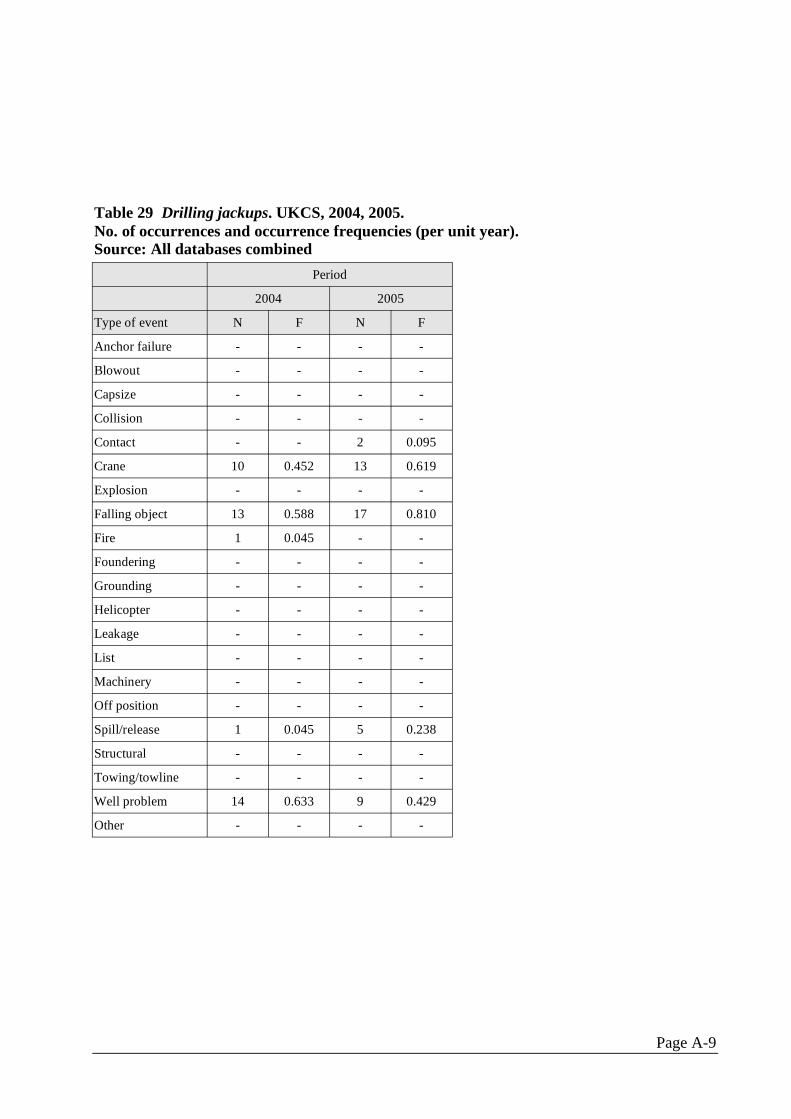
Table 29 Drilling jackups. UKCS, 2004, 2005.No. of occurrences and occurrence frequencies (per unit year).Source: All databases combined
Period
2004 2005
Type of event N F N F
Anchor failure - - - -
Blowout - - - -
Capsize - - - -
Collision - - - -
Contact - - 2 0.095
Crane 10 0.452 13 0.619
Explosion - - - -
Falling object 13 0.588 17 0.810
Fire 1 0.045 - -
Foundering - - - -
Grounding - - - -
Helicopter - - - -
Leakage - - - -
List - - - -
Machinery - - - -
Off position - - - -
Spill/release 1 0.045 5 0.238
Structural - - - -
Towing/towline - - - -
Well problem 14 0.633 9 0.429
Other - - - -
Page A-9
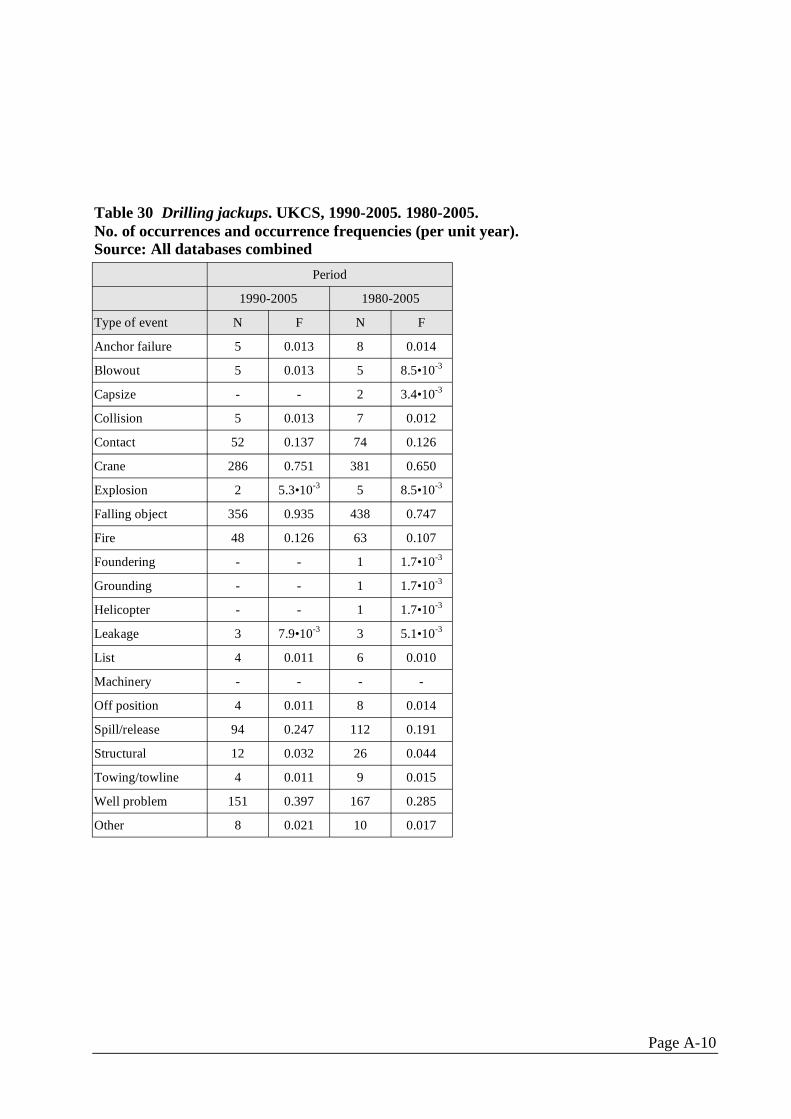
Table 30 Drilling jackups. UKCS, 1990-2005. 1980-2005.No. of occurrences and occurrence frequencies (per unit year).Source: All databases combined
Period
1990-2005 1980-2005
Type of event N F N F
Anchor failure 5 0.013 8 0.014
Blowout 5 0.013 5 8.5•10-3
Capsize - - 2 3.4•10-3
Collision 5 0.013 7 0.012
Contact 52 0.137 74 0.126
Crane 286 0.751 381 0.650
Explosion 2 5.3•10-3 5 8.5•10-3
Falling object 356 0.935 438 0.747
Fire 48 0.126 63 0.107
Foundering - - 1 1.7•10-3
Grounding - - 1 1.7•10-3
Helicopter - - 1 1.7•10-3
Leakage 3 7.9•10-3 3 5.1•10-3
List 4 0.011 6 0.010
Machinery - - - -
Off position 4 0.011 8 0.014
Spill/release 94 0.247 112 0.191
Structural 12 0.032 26 0.044
Towing/towline 4 0.011 9 0.015
Well problem 151 0.397 167 0.285
Other 8 0.021 10 0.017
Page A-10
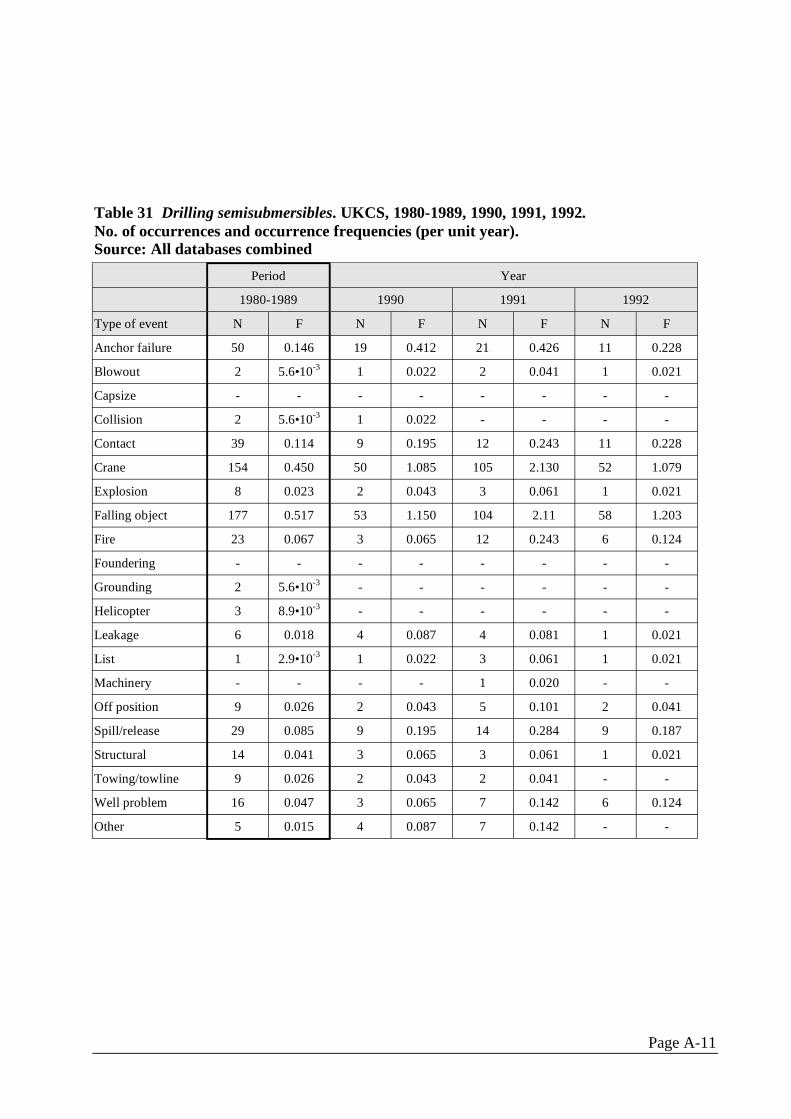
Table 31 Drilling semisubmersibles. UKCS, 1980-1989, 1990, 1991, 1992.No. of occurrences and occurrence frequencies (per unit year).Source: All databases combined
Period Year
1980-1989 1990 1991 1992
Type of event N F N F N F N F
Anchor failure 50 0.146 19 0.412 21 0.426 11 0.228
Blowout 2 5.6•10-3 1 0.022 2 0.041 1 0.021
Capsize - - - - - - - -
Collision 2 5.6•10-3 1 0.022 - - - -
Contact 39 0.114 9 0.195 12 0.243 11 0.228
Crane 154 0.450 50 1.085 105 2.130 52 1.079
Explosion 8 0.023 2 0.043 3 0.061 1 0.021
Falling object 177 0.517 53 1.150 104 2.11 58 1.203
Fire 23 0.067 3 0.065 12 0.243 6 0.124
Foundering - - - - - - - -
Grounding 2 5.6•10-3 - - - - - -
Helicopter 3 8.9•10-3 - - - - - -
Leakage 6 0.018 4 0.087 4 0.081 1 0.021
List 1 2.9•10-3 1 0.022 3 0.061 1 0.021
Machinery - - - - 1 0.020 - -
Off position 9 0.026 2 0.043 5 0.101 2 0.041
Spill/release 29 0.085 9 0.195 14 0.284 9 0.187
Structural 14 0.041 3 0.065 3 0.061 1 0.021
Towing/towline 9 0.026 2 0.043 2 0.041 - -
Well problem 16 0.047 3 0.065 7 0.142 6 0.124
Other 5 0.015 4 0.087 7 0.142 - -
Page A-11
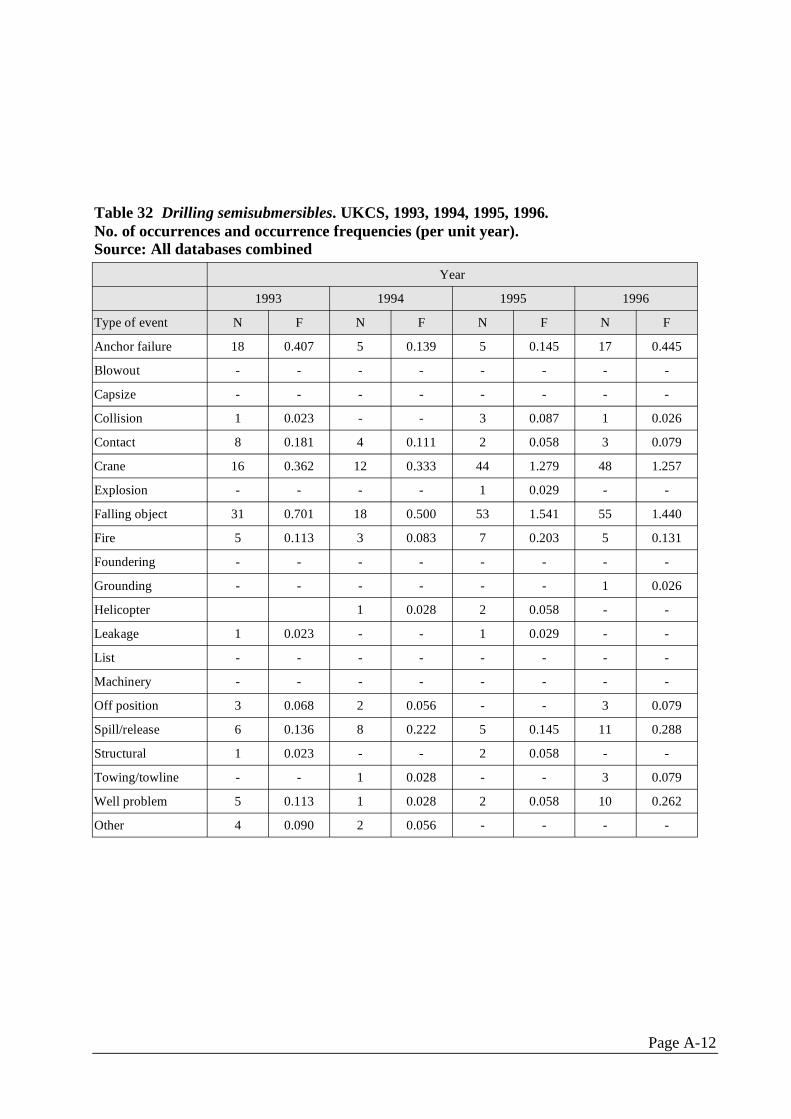
Table 32 Drilling semisubmersibles. UKCS, 1993, 1994, 1995, 1996. No. of occurrences and occurrence frequencies (per unit year). Source: All databases combined
Year
1993 1994 1995 1996
Type of event N F N F N F N F
Anchor failure 18 0.407 5 0.139 5 0.145 17 0.445
Blowout - - - - - - - -
Capsize - - - - - - - -
Collision 1 0.023 - - 3 0.087 1 0.026
Contact 8 0.181 4 0.111 2 0.058 3 0.079
Crane 16 0.362 12 0.333 44 1.279 48 1.257
Explosion - - - - 1 0.029 - -
Falling object 31 0.701 18 0.500 53 1.541 55 1.440
Fire 5 0.113 3 0.083 7 0.203 5 0.131
Foundering - - - - - - - -
Grounding - - - - - - 1 0.026
Helicopter 1 0.028 2 0.058 - -
Leakage 1 0.023 - - 1 0.029 - -
List - - - - - - - -
Machinery - - - - - - - -
Off position 3 0.068 2 0.056 - - 3 0.079
Spill/release 6 0.136 8 0.222 5 0.145 11 0.288
Structural 1 0.023 - - 2 0.058 - -
Towing/towline - - 1 0.028 - - 3 0.079
Well problem 5 0.113 1 0.028 2 0.058 10 0.262
Other 4 0.090 2 0.056 - - - -
Page A-12
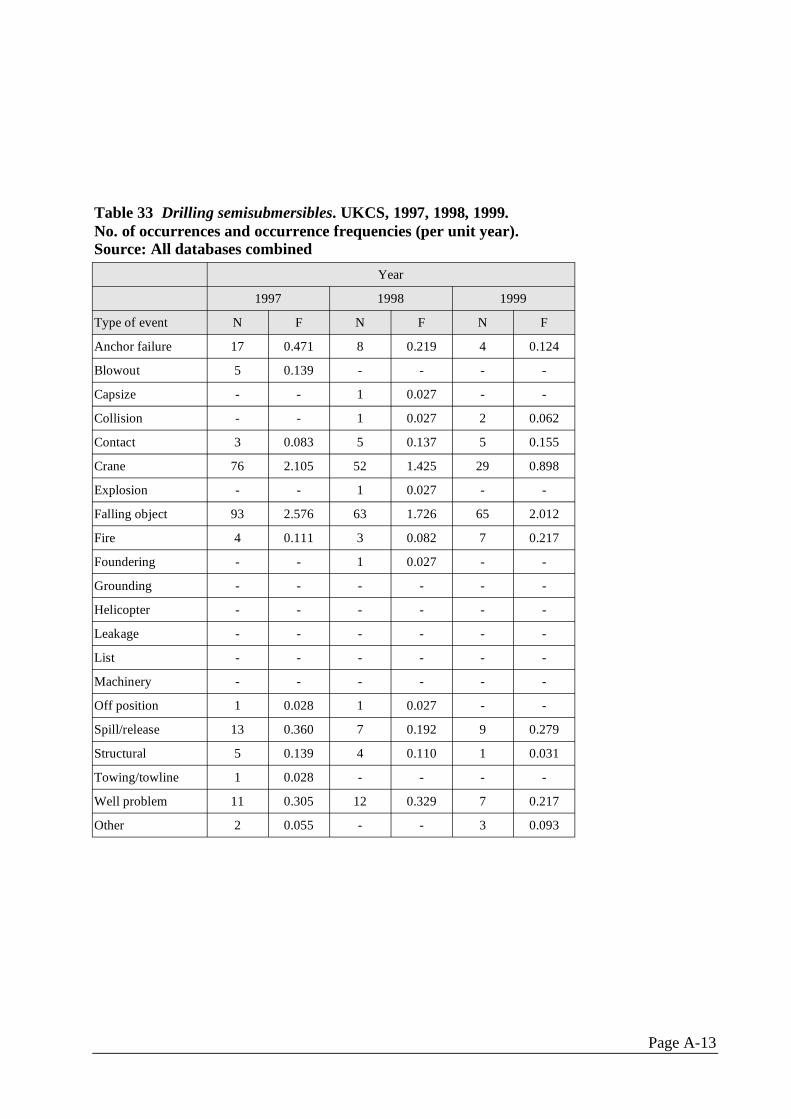
Table 33 Drilling semisubmersibles. UKCS, 1997, 1998, 1999. No. of occurrences and occurrence frequencies (per unit year). Source: All databases combined
Year
1997 1998 1999
Type of event N F N F N F
Anchor failure 17 0.471 8 0.219 4 0.124
Blowout 5 0.139 - - - -
Capsize - - 1 0.027 - -
Collision - - 1 0.027 2 0.062
Contact 3 0.083 5 0.137 5 0.155
Crane 76 2.105 52 1.425 29 0.898
Explosion - - 1 0.027 - -
Falling object 93 2.576 63 1.726 65 2.012
Fire 4 0.111 3 0.082 7 0.217
Foundering - - 1 0.027 - -
Grounding - - - - - -
Helicopter - - - - - -
Leakage - - - - - -
List - - - - - -
Machinery - - - - - -
Off position 1 0.028 1 0.027 - -
Spill/release 13 0.360 7 0.192 9 0.279
Structural 5 0.139 4 0.110 1 0.031
Towing/towline 1 0.028 - - - -
Well problem 11 0.305 12 0.329 7 0.217
Other 2 0.055 - - 3 0.093
Page A-13
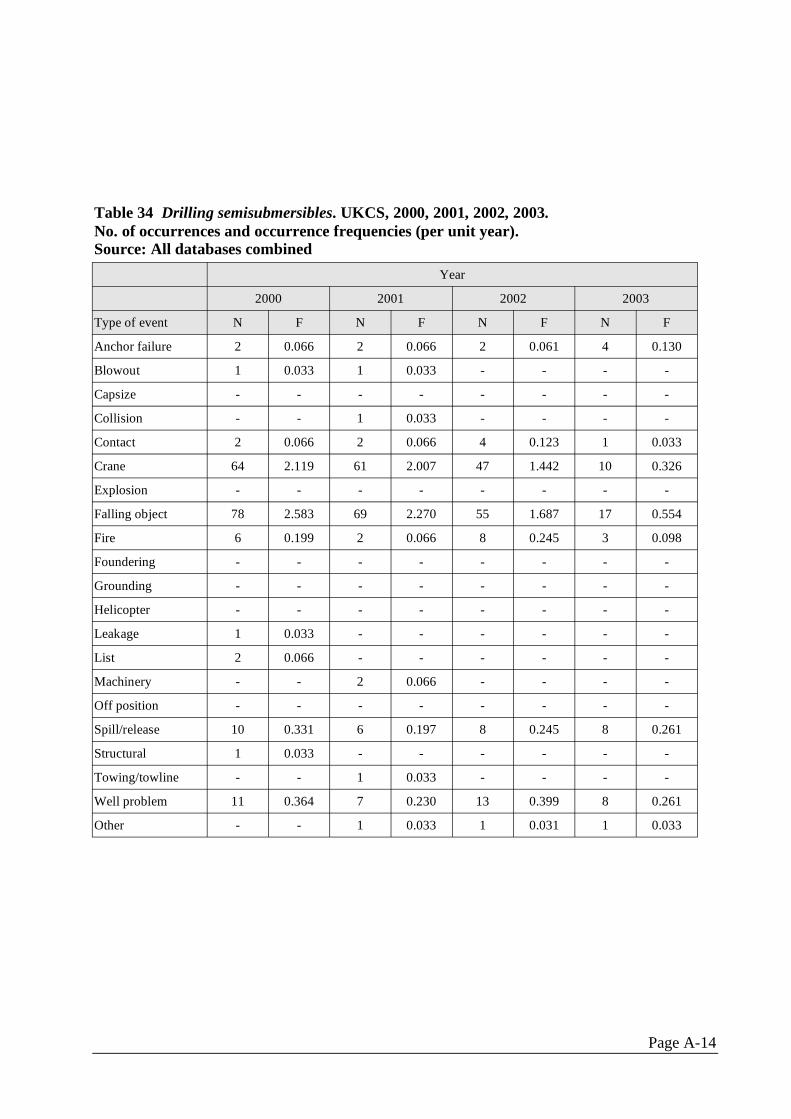
Table 34 Drilling semisubmersibles. UKCS, 2000, 2001, 2002, 2003. No. of occurrences and occurrence frequencies (per unit year). Source: All databases combined
Year
2000 2001 2002 2003
Type of event N F N F N F N F
Anchor failure 2 0.066 2 0.066 2 0.061 4 0.130
Blowout 1 0.033 1 0.033 - - - -
Capsize - - - - - - - -
Collision - - 1 0.033 - - - -
Contact 2 0.066 2 0.066 4 0.123 1 0.033
Crane 64 2.119 61 2.007 47 1.442 10 0.326
Explosion - - - - - - - -
Falling object 78 2.583 69 2.270 55 1.687 17 0.554
Fire 6 0.199 2 0.066 8 0.245 3 0.098
Foundering - - - - - - - -
Grounding - - - - - - - -
Helicopter - - - - - - - -
Leakage 1 0.033 - - - - - -
List 2 0.066 - - - - - -
Machinery - - 2 0.066 - - - -
Off position - - - - - - - -
Spill/release 10 0.331 6 0.197 8 0.245 8 0.261
Structural 1 0.033 - - - - - -
Towing/towline - - 1 0.033 - - - -
Well problem 11 0.364 7 0.230 13 0.399 8 0.261
Other - - 1 0.033 1 0.031 1 0.033
Page A-14
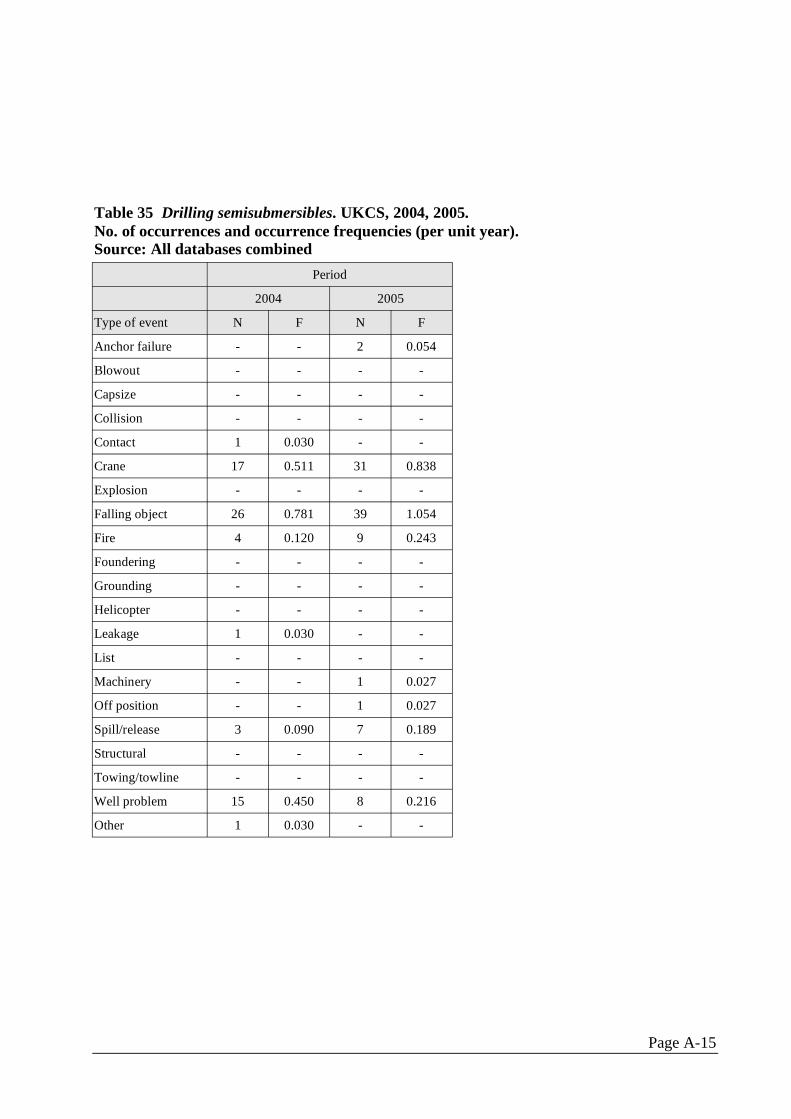
Table 35 Drilling semisubmersibles. UKCS, 2004, 2005.No. of occurrences and occurrence frequencies (per unit year).Source: All databases combined
Period
2004 2005
Type of event N F N F
Anchor failure - - 2 0.054
Blowout - - - -
Capsize - - - -
Collision - - - -
Contact 1 0.030 - -
Crane 17 0.511 31 0.838
Explosion - - - -
Falling object 26 0.781 39 1.054
Fire 4 0.120 9 0.243
Foundering - - - -
Grounding - - - -
Helicopter - - - -
Leakage 1 0.030 - -
List - - - -
Machinery - - 1 0.027
Off position - - 1 0.027
Spill/release 3 0.090 7 0.189
Structural - - - -
Towing/towline - - - -
Well problem 15 0.450 8 0.216
Other 1 0.030 - -
Page A-15
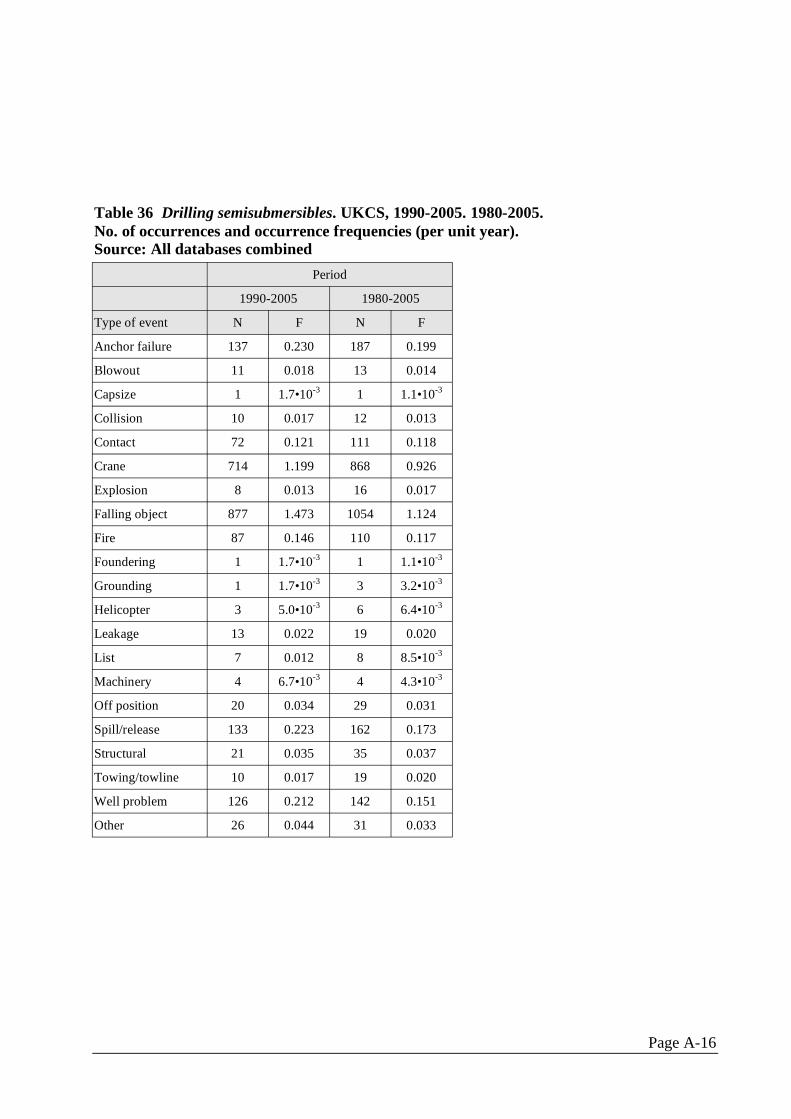
Table 36 Drilling semisubmersibles. UKCS, 1990-2005. 1980-2005. No. of occurrences and occurrence frequencies (per unit year). Source: All databases combined
Period
1990-2005 1980-2005
Type of event N F N F
Anchor failure 137 0.230 187 0.199
Blowout 11 0.018 13 0.014
Capsize 1 1.7•10-3 1 1.1•10-3
Collision 10 0.017 12 0.013
Contact 72 0.121 111 0.118
Crane 714 1.199 868 0.926
Explosion 8 0.013 16 0.017
Falling object 877 1.473 1054 1.124
Fire 87 0.146 110 0.117
Foundering 1 1.7•10-3 1 1.1•10-3
Grounding 1 1.7•10-3 3 3.2•10-3
Helicopter 3 5.0•10-3 6 6.4•10-3
Leakage 13 0.022 19 0.020
List 7 0.012 8 8.5•10-3
Machinery 4 6.7•10-3 4 4.3•10-3
Off position 20 0.034 29 0.031
Spill/release 133 0.223 162 0.173
Structural 21 0.035 35 0.037
Towing/towline 10 0.017 19 0.020
Well problem 126 0.212 142 0.151
Other 26 0.044 31 0.033
Page A-16
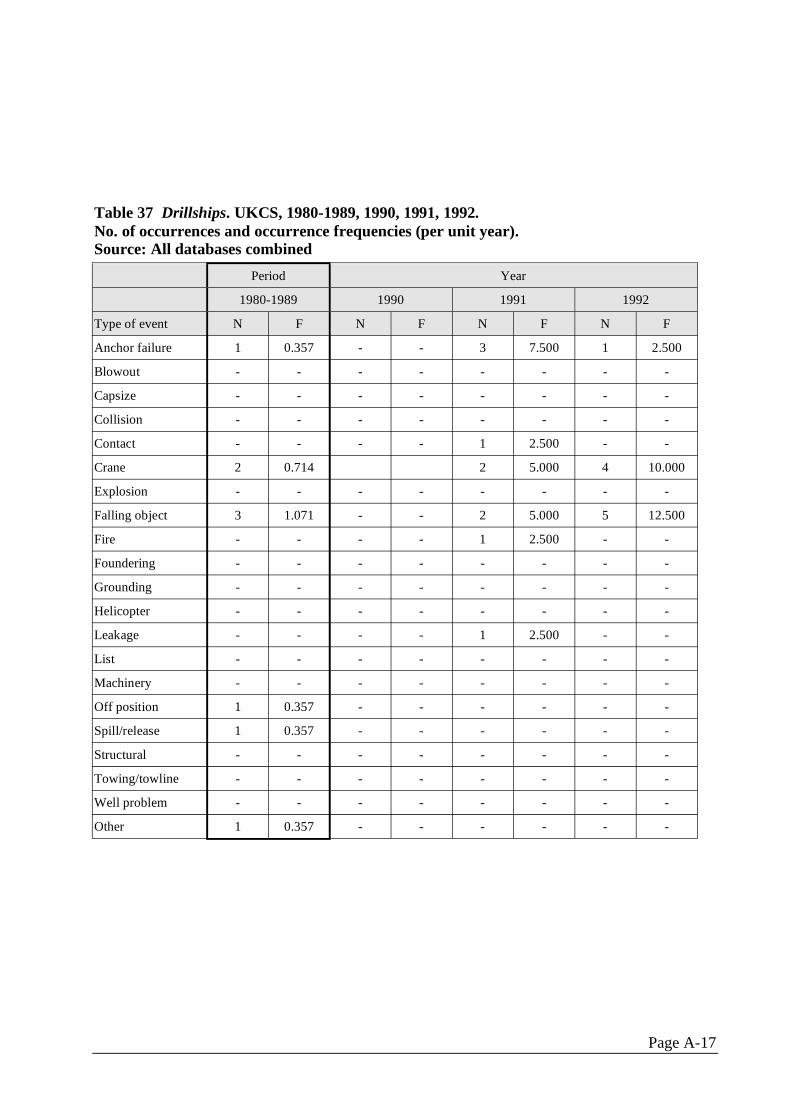
Table 37 Drillships. UKCS, 1980-1989, 1990, 1991, 1992.No. of occurrences and occurrence frequencies (per unit year).Source: All databases combined
Period Year
1980-1989 1990 1991 1992
Type of event N F N F N F N F
Anchor failure 1 0.357 - - 3 7.500 1 2.500
Blowout - - - - - - - -
Capsize - - - - - - - -
Collision - - - - - - - -
Contact - - - - 1 2.500 - -
Crane 2 0.714 2 5.000 4 10.000
Explosion - - - - - - - -
Falling object 3 1.071 - - 2 5.000 5 12.500
Fire - - - - 1 2.500 - -
Foundering - - - - - - - -
Grounding - - - - - - - -
Helicopter - - - - - - - -
Leakage - - - - 1 2.500 - -
List - - - - - - - -
Machinery - - - - - - - -
Off position 1 0.357 - - - - - -
Spill/release 1 0.357 - - - - - -
Structural - - - - - - - -
Towing/towline - - - - - - - -
Well problem - - - - - - - -
Other 1 0.357 - - - - - -
Page A-17
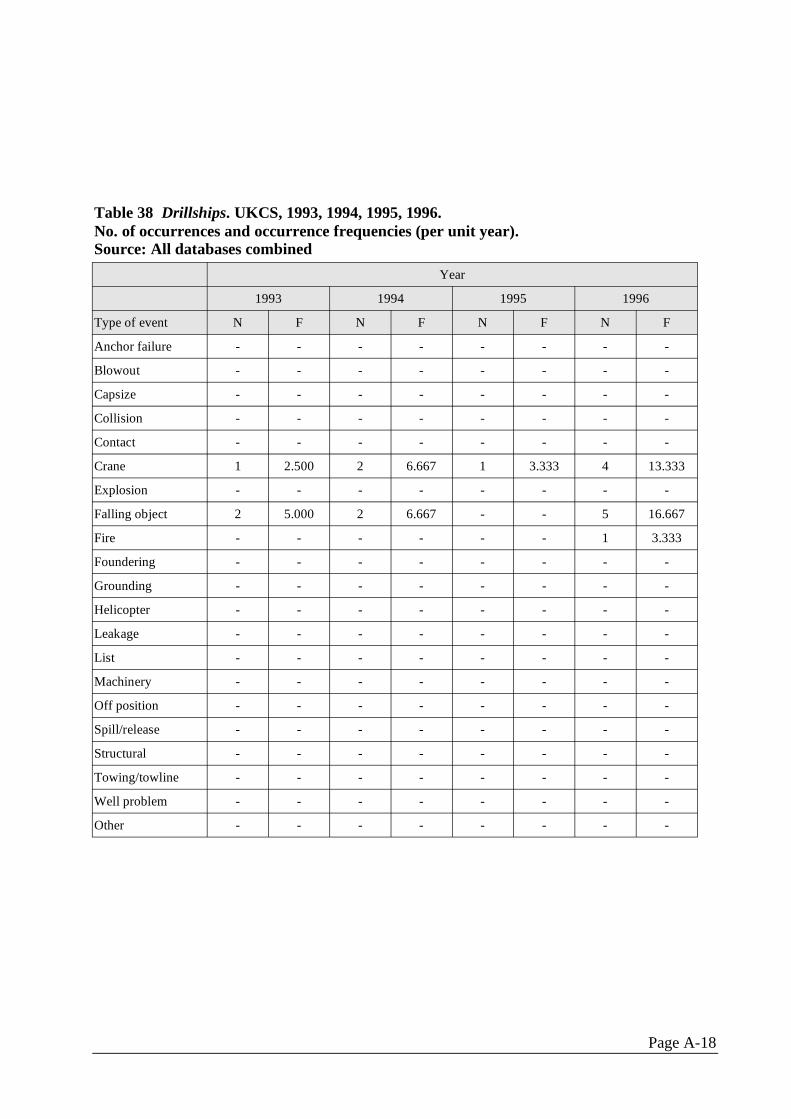
Table 38 Drillships. UKCS, 1993, 1994, 1995, 1996.No. of occurrences and occurrence frequencies (per unit year).Source: All databases combined
Year
1993 1994 1995 1996
Type of event N F N F N F N F
Anchor failure - - - - - - - -
Blowout - - - - - - - -
Capsize - - - - - - - -
Collision - - - - - - - -
Contact - - - - - - - -
Crane 1 2.500 2 6.667 1 3.333 4 13.333
Explosion - - - - - - - -
Falling object 2 5.000 2 6.667 - - 5 16.667
Fire - - - - - - 1 3.333
Foundering - - - - - - - -
Grounding - - - - - - - -
Helicopter - - - - - - - -
Leakage - - - - - - - -
List - - - - - - - -
Machinery - - - - - - - -
Off position - - - - - - - -
Spill/release - - - - - - - -
Structural - - - - - - - -
Towing/towline - - - - - - - -
Well problem - - - - - - - -
Other - - - - - - - -
Page A-18
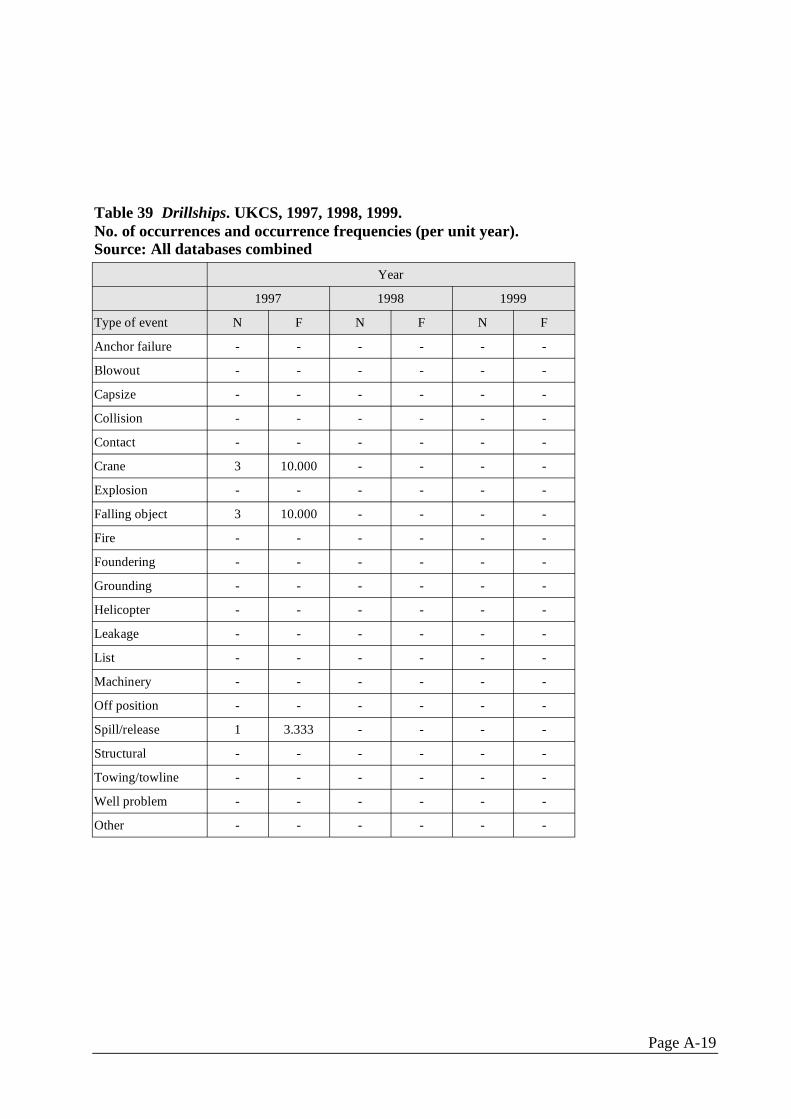
Table 39 Drillships. UKCS, 1997, 1998, 1999.No. of occurrences and occurrence frequencies (per unit year).Source: All databases combined
Year
1997 1998 1999
Type of event N F N F N F
Anchor failure - - - - - -
Blowout - - - - - -
Capsize - - - - - -
Collision - - - - - -
Contact - - - - - -
Crane 3 10.000 - - - -
Explosion - - - - - -
Falling object 3 10.000 - - - -
Fire - - - - - -
Foundering - - - - - -
Grounding - - - - - -
Helicopter - - - - - -
Leakage - - - - - -
List - - - - - -
Machinery - - - - - -
Off position - - - - - -
Spill/release 1 3.333 - - - -
Structural - - - - - -
Towing/towline - - - - - -
Well problem - - - - - -
Other - - - - - -
Page A-19
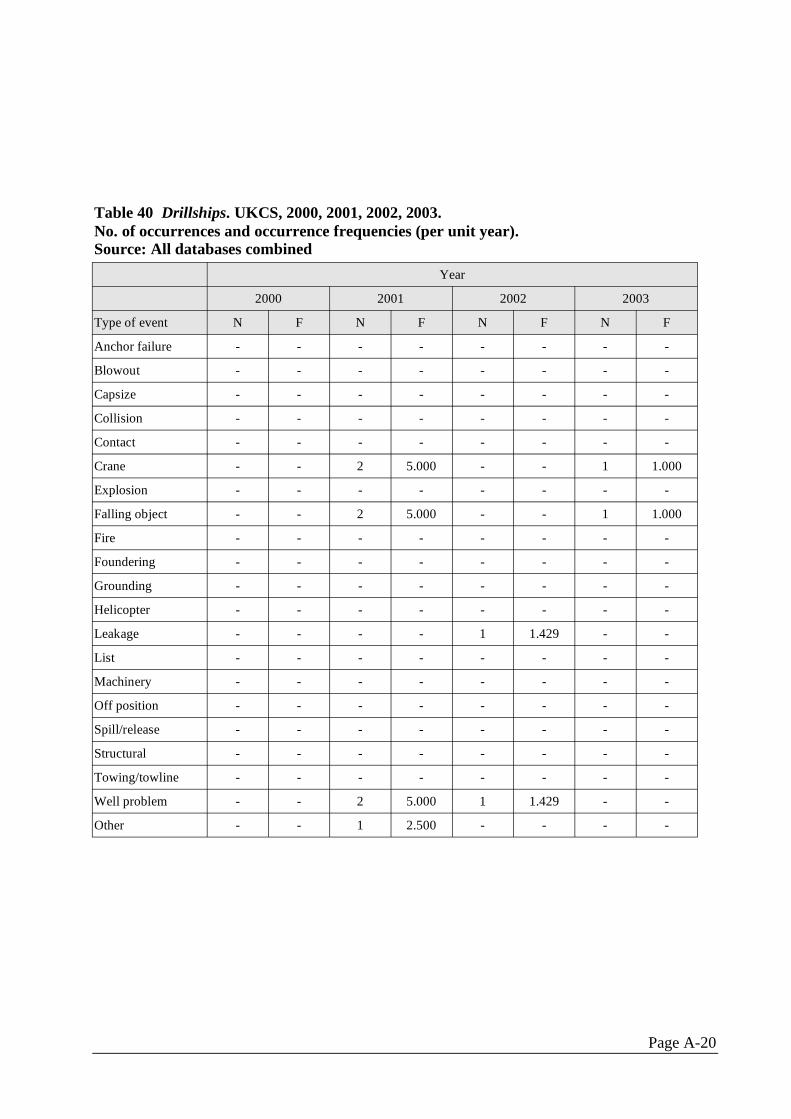
Table 40 Drillships. UKCS, 2000, 2001, 2002, 2003.No. of occurrences and occurrence frequencies (per unit year).Source: All databases combined
Year
2000 2001 2002 2003
Type of event N F N F N F N F
Anchor failure - - - - - - - -
Blowout - - - - - - - -
Capsize - - - - - - - -
Collision - - - - - - - -
Contact - - - - - - - -
Crane - - 2 5.000 - - 1 1.000
Explosion - - - - - - - -
Falling object - - 2 5.000 - - 1 1.000
Fire - - - - - - - -
Foundering - - - - - - - -
Grounding - - - - - - - -
Helicopter - - - - - - - -
Leakage - - - - 1 1.429 - -
List - - - - - - - -
Machinery - - - - - - - -
Off position - - - - - - - -
Spill/release - - - - - - - -
Structural - - - - - - - -
Towing/towline - - - - - - - -
Well problem - - 2 5.000 1 1.429 - -
Other - - 1 2.500 - - - -
Page A-20
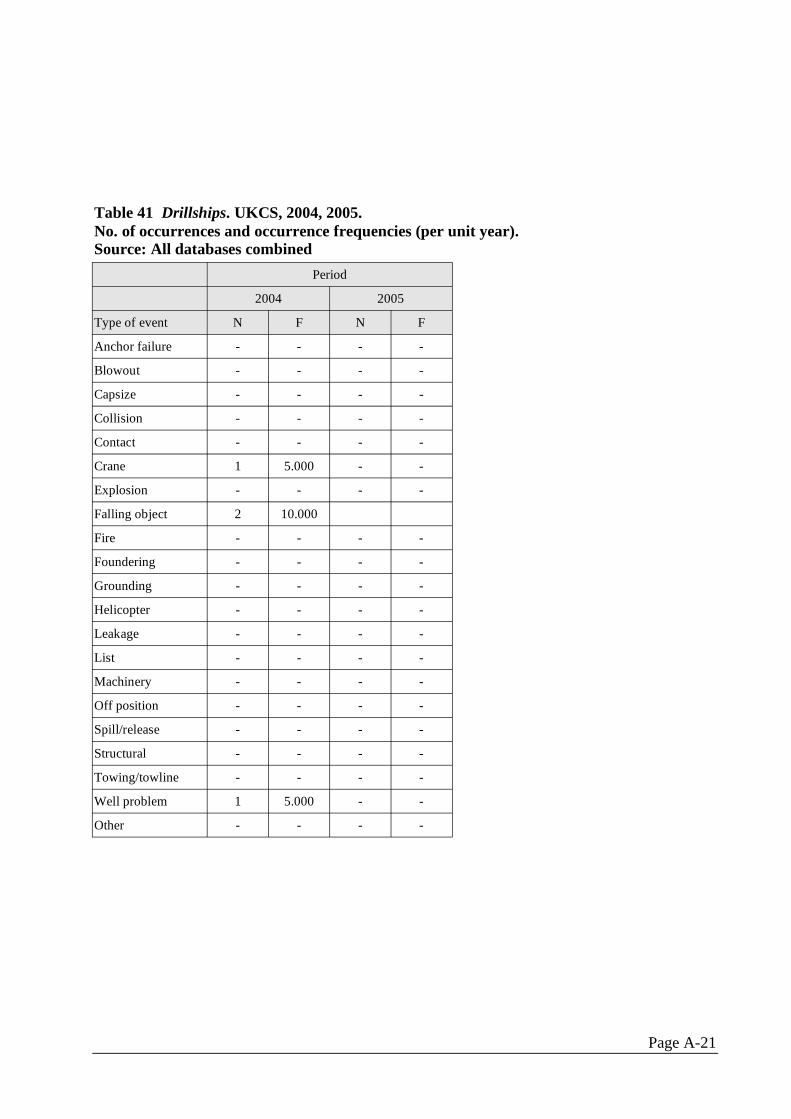
Table 41 Drillships. UKCS, 2004, 2005.No. of occurrences and occurrence frequencies (per unit year).Source: All databases combined
Period
2004 2005
Type of event N F N F
Anchor failure - - - -
Blowout - - - -
Capsize - - - -
Collision - - - -
Contact - - - -
Crane 1 5.000 - -
Explosion - - - -
Falling object 2 10.000
Fire - - - -
Foundering - - - -
Grounding - - - -
Helicopter - - - -
Leakage - - - -
List - - - -
Machinery - - - -
Off position - - - -
Spill/release - - - -
Structural - - - -
Towing/towline - - - -
Well problem 1 5.000 - -
Other - - - -
Page A-21

Table 42 Drillships. UKCS, 1990-2005. 1980-2005.No. of occurrences and occurrence frequencies (per unit year).Source: All databases combined
Period
1990-2005 1980-2005
Type of event N F N F
Anchor failure 4 0.690 5 0.581
Blowout - - - -
Capsize - - - -
Collision - - - -
Contact 1 0.172 1 0.116
Crane 21 3.621 23 2.674
Explosion - - - -
Falling object 24 4.138 27 3.140
Fire 2 0.345 2 0.233
Foundering - - - -
Grounding - - - -
Helicopter - - - -
Leakage 2 0.345 2 0.233
List - - - -
Machinery - - - -
Off position - - 1 0.116
Spill/release 1 0.172 2 0.233
Structural - - - -
Towing/towline - - - -
Well problem 4 0.690 4 0.465
Other 1 0.172 2 0.233
Page A-22
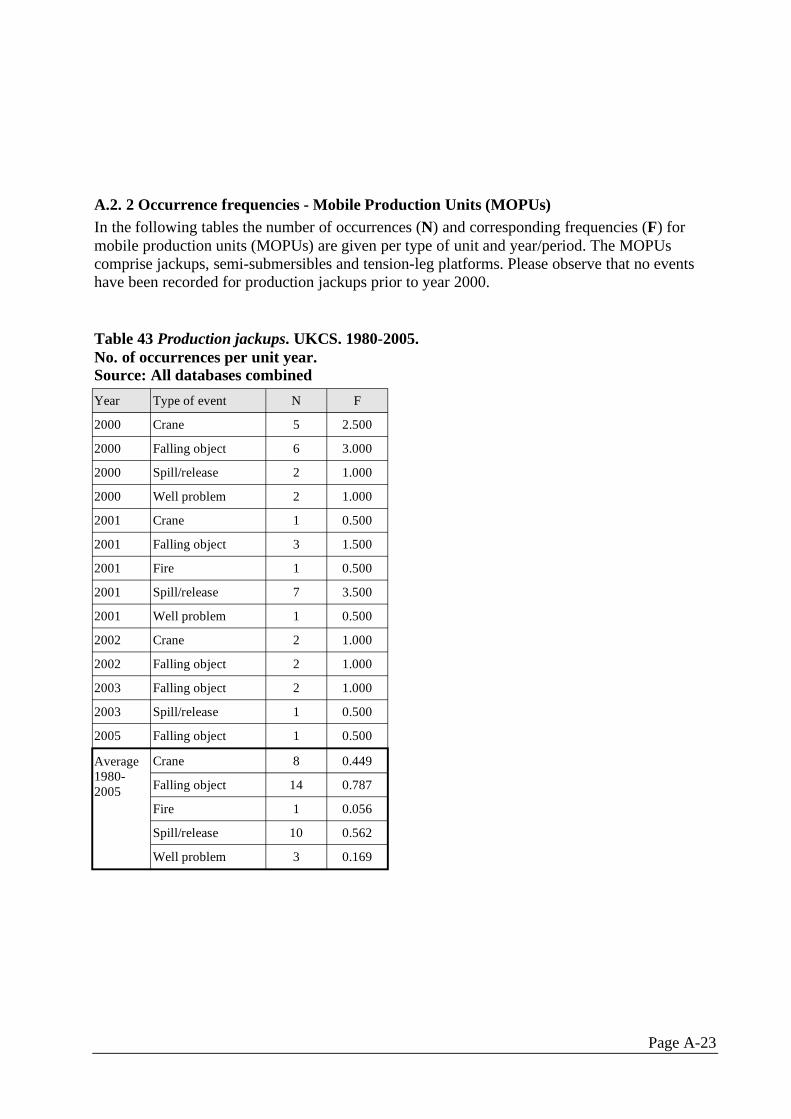
A.2. 2 Occurrence frequencies - Mobile Production Units (MOPUs)In the following tables the number of occurrences (N) and corresponding frequencies (F) formobile production units (MOPUs) are given per type of unit and year/period. The MOPUscomprise jackups, semi-submersibles and tension-leg platforms. Please observe that no eventshave been recorded for production jackups prior to year 2000.
Table 43 Production jackups. UKCS. 1980-2005.No. of occurrences per unit year.Source: All databases combined
Year Type of event N F
2000 Crane 5 2.500
2000 Falling object 6 3.000
2000 Spill/release 2 1.000
2000 Well problem 2 1.000
2001 Crane 1 0.500
2001 Falling object 3 1.500
2001 Fire 1 0.500
2001 Spill/release 7 3.500
2001 Well problem 1 0.500
2002 Crane 2 1.000
2002 Falling object 2 1.000
2003 Falling object 2 1.000
2003 Spill/release 1 0.500
2005 Falling object 1 0.500
Average 1980-2005
Crane 8 0.449
Falling object 14 0.787
Fire 1 0.056
Spill/release 10 0.562
Well problem 3 0.169
Page A-23
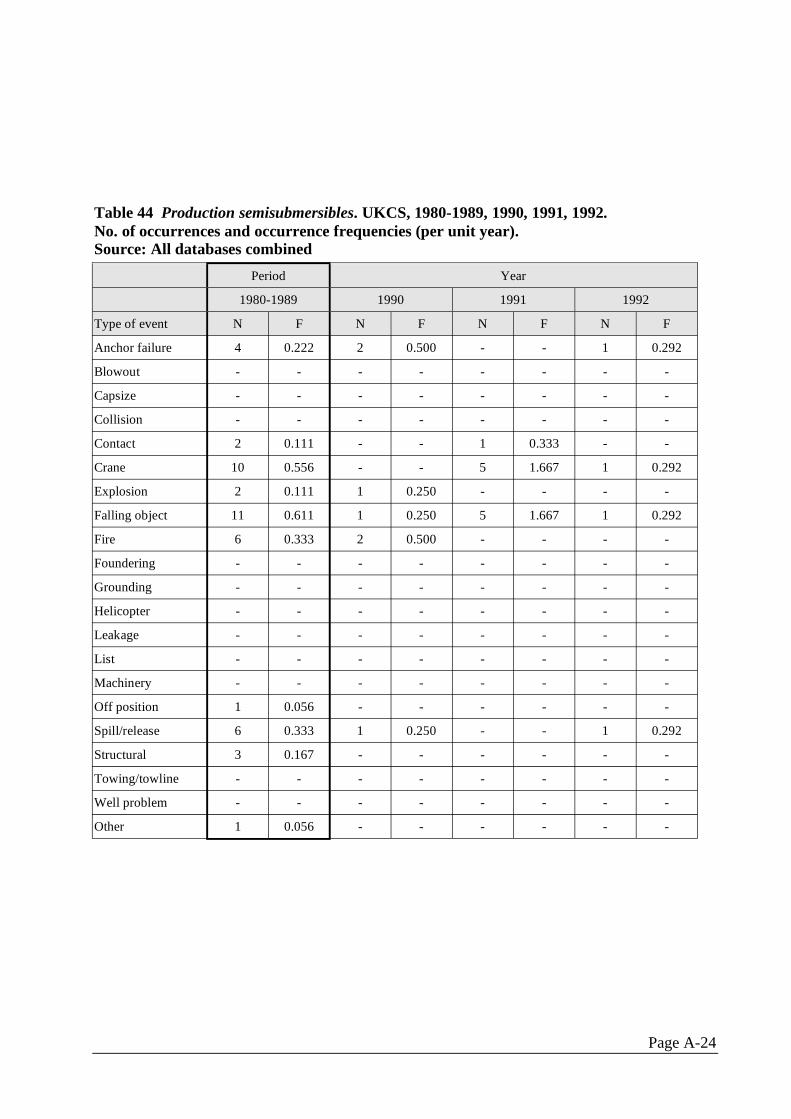
Table 44 Production semisubmersibles. UKCS, 1980-1989, 1990, 1991, 1992.No. of occurrences and occurrence frequencies (per unit year).Source: All databases combined
Period Year
1980-1989 1990 1991 1992
Type of event N F N F N F N F
Anchor failure 4 0.222 2 0.500 - - 1 0.292
Blowout - - - - - - - -
Capsize - - - - - - - -
Collision - - - - - - - -
Contact 2 0.111 - - 1 0.333 - -
Crane 10 0.556 - - 5 1.667 1 0.292
Explosion 2 0.111 1 0.250 - - - -
Falling object 11 0.611 1 0.250 5 1.667 1 0.292
Fire 6 0.333 2 0.500 - - - -
Foundering - - - - - - - -
Grounding - - - - - - - -
Helicopter - - - - - - - -
Leakage - - - - - - - -
List - - - - - - - -
Machinery - - - - - - - -
Off position 1 0.056 - - - - - -
Spill/release 6 0.333 1 0.250 - - 1 0.292
Structural 3 0.167 - - - - - -
Towing/towline - - - - - - - -
Well problem - - - - - - - -
Other 1 0.056 - - - - - -
Page A-24
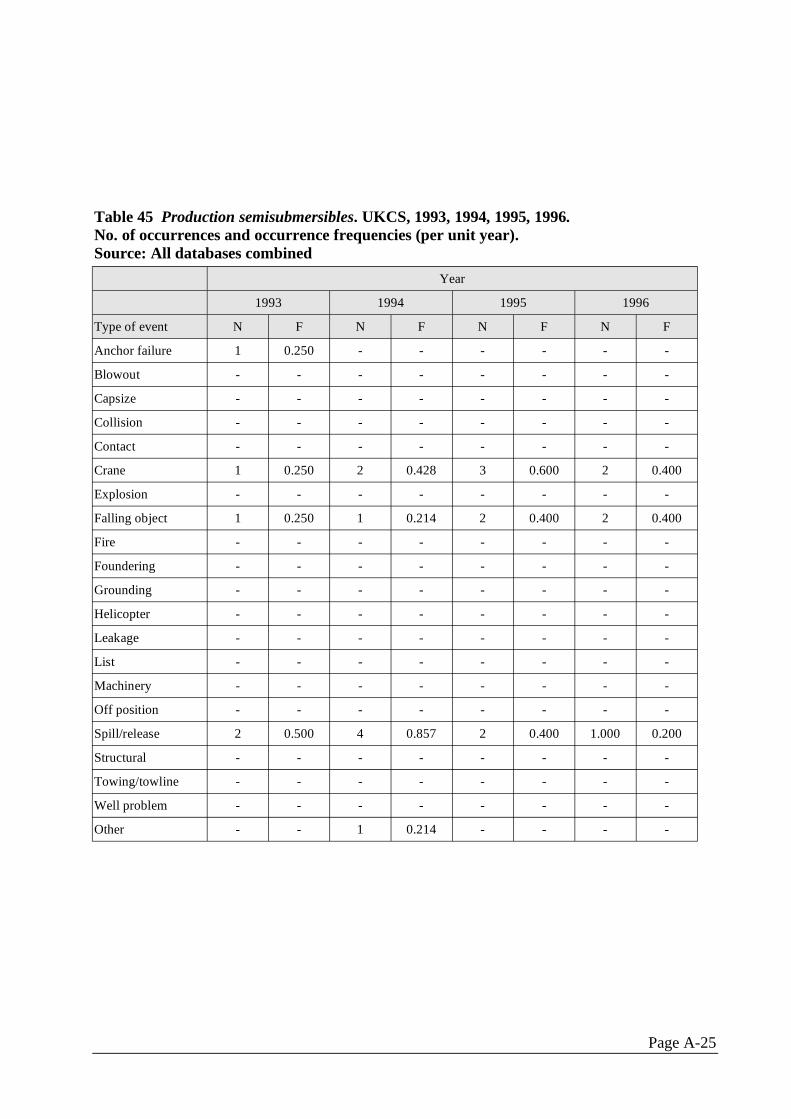
Table 45 Production semisubmersibles. UKCS, 1993, 1994, 1995, 1996. No. of occurrences and occurrence frequencies (per unit year). Source: All databases combined
Year
1993 1994 1995 1996
Type of event N F N F N F N F
Anchor failure 1 0.250 - - - - - -
Blowout - - - - - - - -
Capsize - - - - - - - -
Collision - - - - - - - -
Contact - - - - - - - -
Crane 1 0.250 2 0.428 3 0.600 2 0.400
Explosion - - - - - - - -
Falling object 1 0.250 1 0.214 2 0.400 2 0.400
Fire - - - - - - - -
Foundering - - - - - - - -
Grounding - - - - - - - -
Helicopter - - - - - - - -
Leakage - - - - - - - -
List - - - - - - - -
Machinery - - - - - - - -
Off position - - - - - - - -
Spill/release 2 0.500 4 0.857 2 0.400 1.000 0.200
Structural - - - - - - - -
Towing/towline - - - - - - - -
Well problem - - - - - - - -
Other - - 1 0.214 - - - -
Page A-25
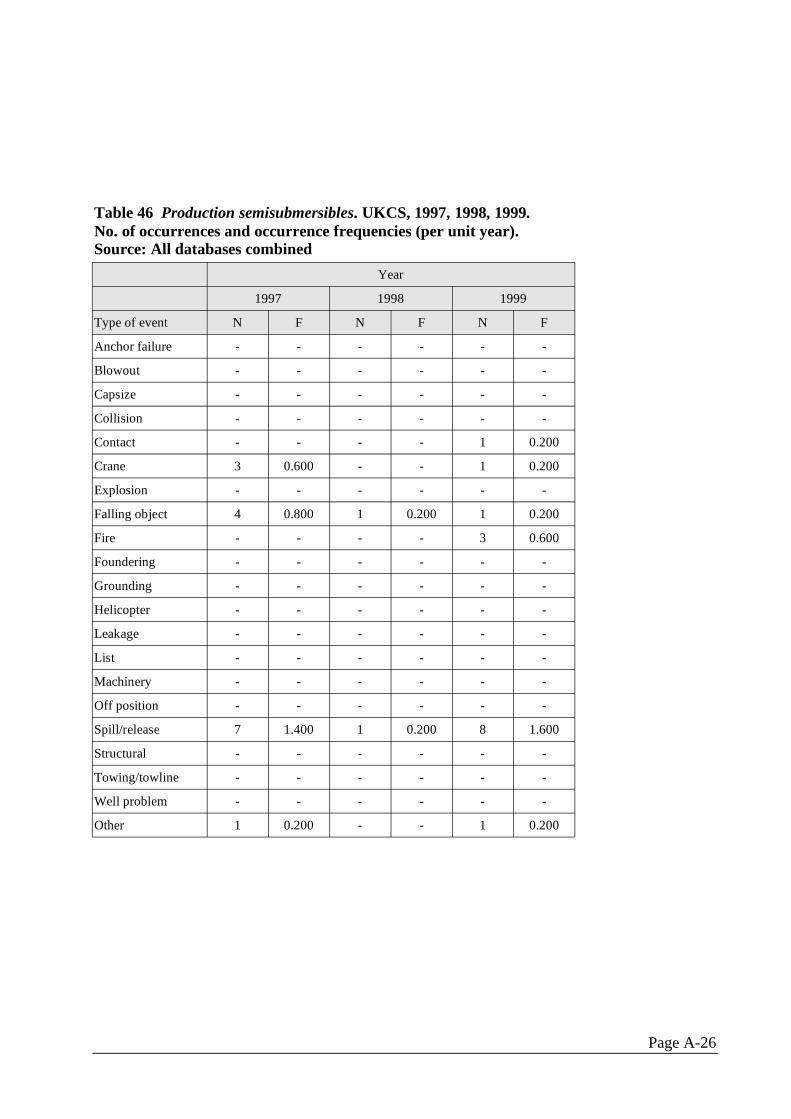
Table 46 Production semisubmersibles. UKCS, 1997, 1998, 1999. No. of occurrences and occurrence frequencies (per unit year). Source: All databases combined
Year
1997 1998 1999
Type of event N F N F N F
Anchor failure - - - - - -
Blowout - - - - - -
Capsize - - - - - -
Collision - - - - - -
Contact - - - - 1 0.200
Crane 3 0.600 - - 1 0.200
Explosion - - - - - -
Falling object 4 0.800 1 0.200 1 0.200
Fire - - - - 3 0.600
Foundering - - - - - -
Grounding - - - - - -
Helicopter - - - - - -
Leakage - - - - - -
List - - - - - -
Machinery - - - - - -
Off position - - - - - -
Spill/release 7 1.400 1 0.200 8 1.600
Structural - - - - - -
Towing/towline - - - - - -
Well problem - - - - - -
Other 1 0.200 - - 1 0.200
Page A-26
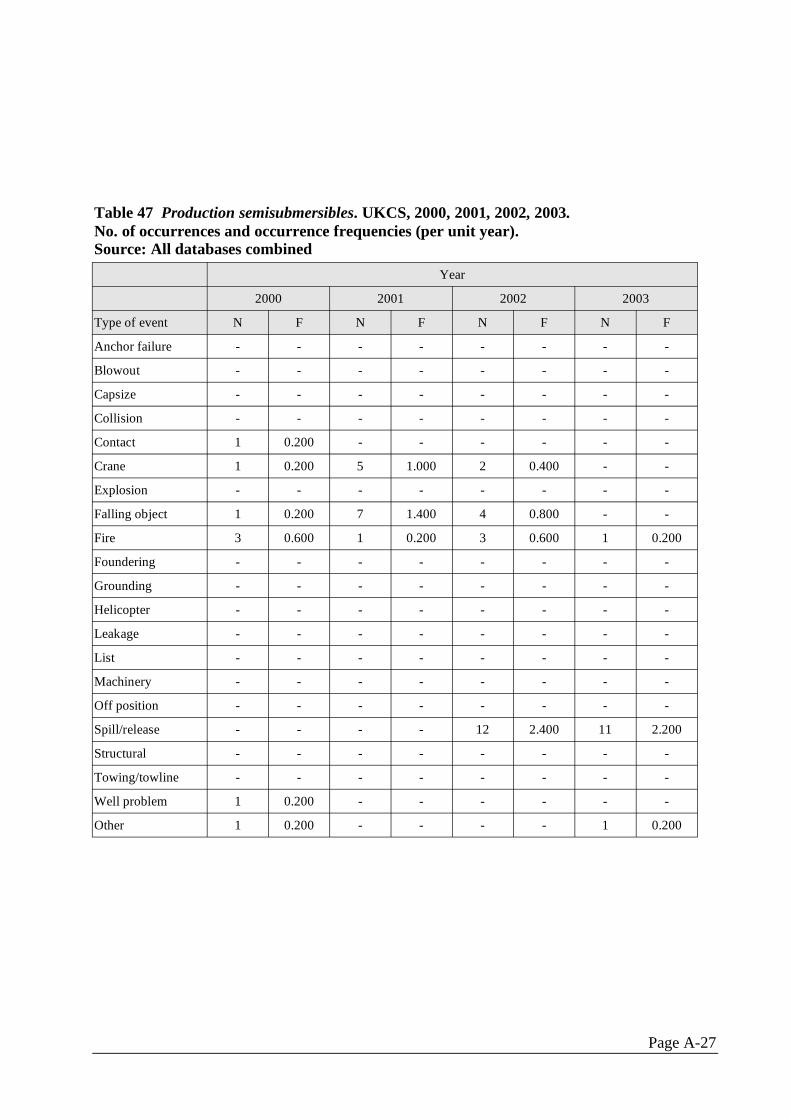
Table 47 Production semisubmersibles. UKCS, 2000, 2001, 2002, 2003. No. of occurrences and occurrence frequencies (per unit year). Source: All databases combined
Year
2000 2001 2002 2003
Type of event N F N F N F N F
Anchor failure - - - - - - - -
Blowout - - - - - - - -
Capsize - - - - - - - -
Collision - - - - - - - -
Contact 1 0.200 - - - - - -
Crane 1 0.200 5 1.000 2 0.400 - -
Explosion - - - - - - - -
Falling object 1 0.200 7 1.400 4 0.800 - -
Fire 3 0.600 1 0.200 3 0.600 1 0.200
Foundering - - - - - - - -
Grounding - - - - - - - -
Helicopter - - - - - - - -
Leakage - - - - - - - -
List - - - - - - - -
Machinery - - - - - - - -
Off position - - - - - - - -
Spill/release - - - - 12 2.400 11 2.200
Structural - - - - - - - -
Towing/towline - - - - - - - -
Well problem 1 0.200 - - - - - -
Other 1 0.200 - - - - 1 0.200
Page A-27
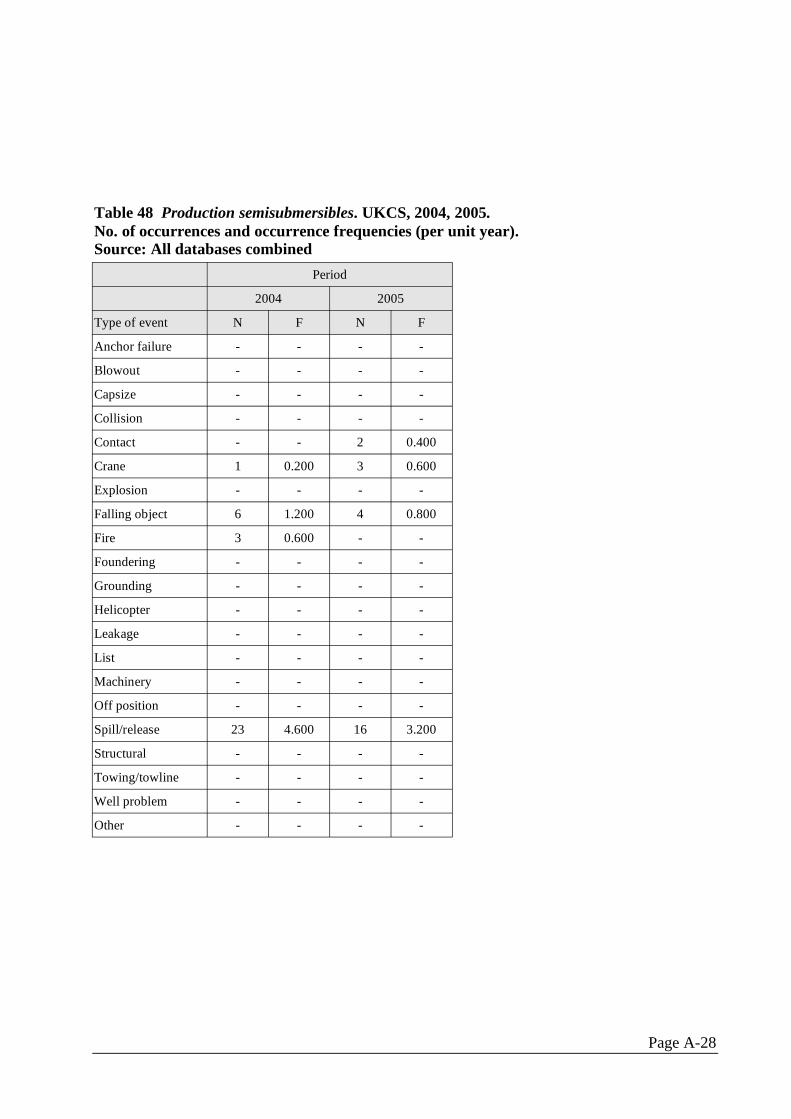
Table 48 Production semisubmersibles. UKCS, 2004, 2005.No. of occurrences and occurrence frequencies (per unit year).Source: All databases combined
Period
2004 2005
Type of event N F N F
Anchor failure - - - -
Blowout - - - -
Capsize - - - -
Collision - - - -
Contact - - 2 0.400
Crane 1 0.200 3 0.600
Explosion - - - -
Falling object 6 1.200 4 0.800
Fire 3 0.600 - -
Foundering - - - -
Grounding - - - -
Helicopter - - - -
Leakage - - - -
List - - - -
Machinery - - - -
Off position - - - -
Spill/release 23 4.600 16 3.200
Structural - - - -
Towing/towline - - - -
Well problem - - - -
Other - - - -
Page A-28
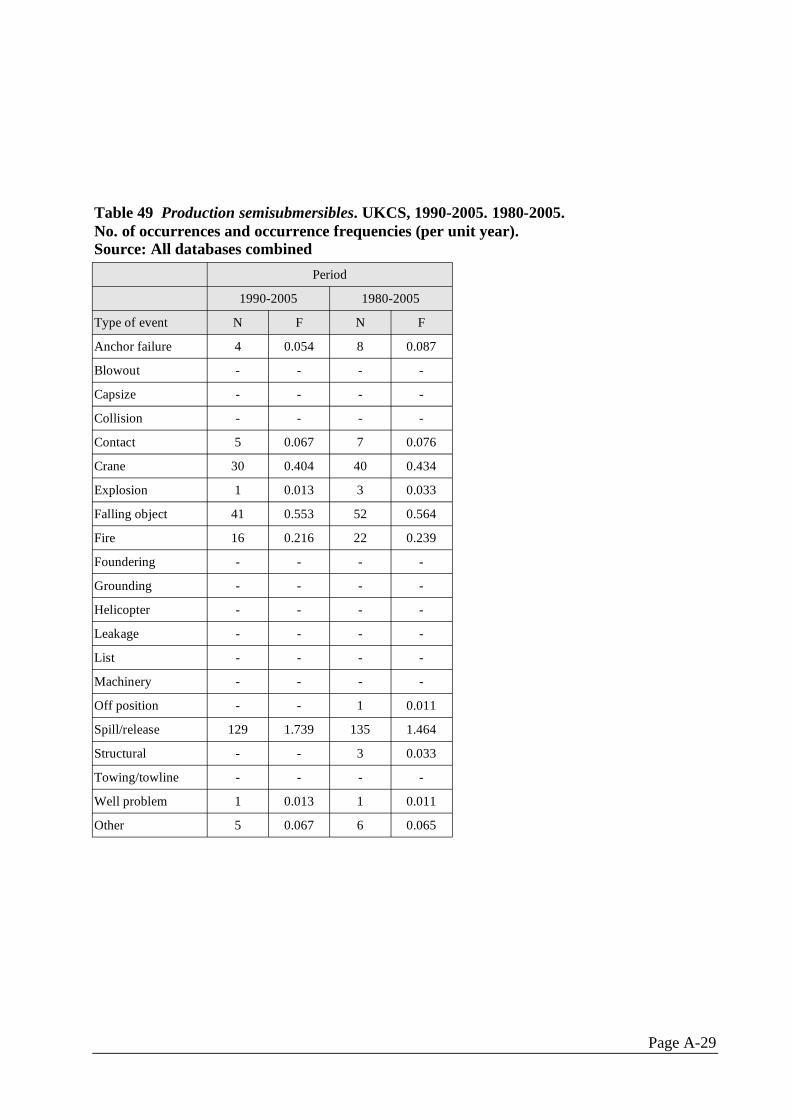
Table 49 Production semisubmersibles. UKCS, 1990-2005. 1980-2005. No. of occurrences and occurrence frequencies (per unit year). Source: All databases combined
Period
1990-2005 1980-2005
Type of event N F N F
Anchor failure 4 0.054 8 0.087
Blowout - - - -
Capsize - - - -
Collision - - - -
Contact 5 0.067 7 0.076
Crane 30 0.404 40 0.434
Explosion 1 0.013 3 0.033
Falling object 41 0.553 52 0.564
Fire 16 0.216 22 0.239
Foundering - - - -
Grounding - - - -
Helicopter - - - -
Leakage - - - -
List - - - -
Machinery - - - -
Off position - - 1 0.011
Spill/release 129 1.739 135 1.464
Structural - - 3 0.033
Towing/towline - - - -
Well problem 1 0.013 1 0.011
Other 5 0.067 6 0.065
Page A-29
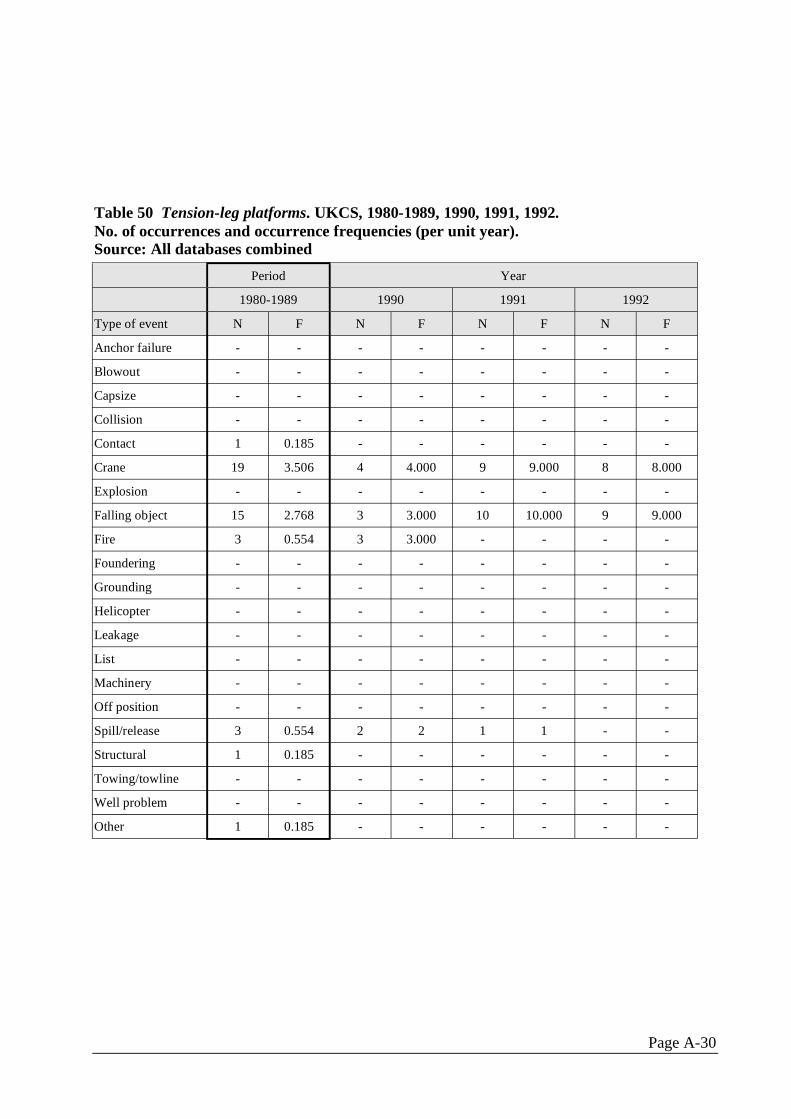
Table 50 Tension-leg platforms. UKCS, 1980-1989, 1990, 1991, 1992. No. of occurrences and occurrence frequencies (per unit year). Source: All databases combined
Period Year
1980-1989 1990 1991 1992
Type of event N F N F N F N F
Anchor failure - - - - - - - -
Blowout - - - - - - - -
Capsize - - - - - - - -
Collision - - - - - - - -
Contact 1 0.185 - - - - - -
Crane 19 3.506 4 4.000 9 9.000 8 8.000
Explosion - - - - - - - -
Falling object 15 2.768 3 3.000 10 10.000 9 9.000
Fire 3 0.554 3 3.000 - - - -
Foundering - - - - - - - -
Grounding - - - - - - - -
Helicopter - - - - - - - -
Leakage - - - - - - - -
List - - - - - - - -
Machinery - - - - - - - -
Off position - - - - - - - -
Spill/release 3 0.554 2 2 1 1 - -
Structural 1 0.185 - - - - - -
Towing/towline - - - - - - - -
Well problem - - - - - - - -
Other 1 0.185 - - - - - -
Page A-30
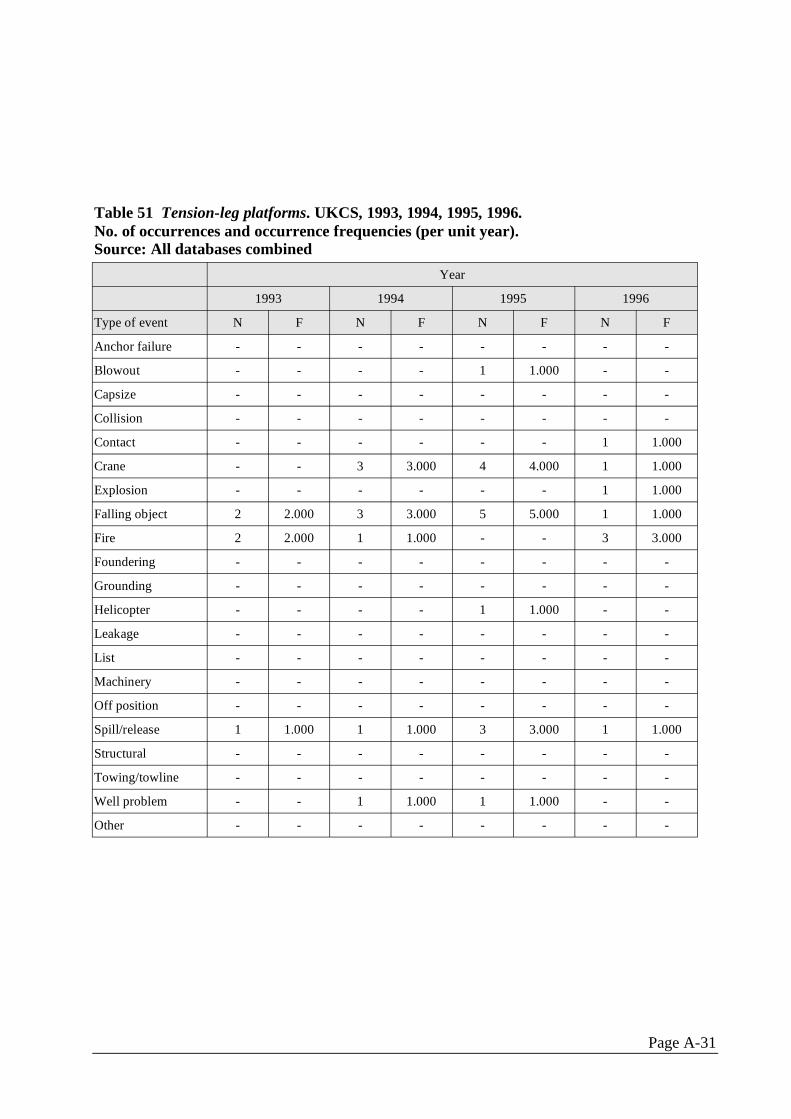
Table 51 Tension-leg platforms. UKCS, 1993, 1994, 1995, 1996. No. of occurrences and occurrence frequencies (per unit year). Source: All databases combined
Year
1993 1994 1995 1996
Type of event N F N F N F N F
Anchor failure - - - - - - - -
Blowout - - - - 1 1.000 - -
Capsize - - - - - - - -
Collision - - - - - - - -
Contact - - - - - - 1 1.000
Crane - - 3 3.000 4 4.000 1 1.000
Explosion - - - - - - 1 1.000
Falling object 2 2.000 3 3.000 5 5.000 1 1.000
Fire 2 2.000 1 1.000 - - 3 3.000
Foundering - - - - - - - -
Grounding - - - - - - - -
Helicopter - - - - 1 1.000 - -
Leakage - - - - - - - -
List - - - - - - - -
Machinery - - - - - - - -
Off position - - - - - - - -
Spill/release 1 1.000 1 1.000 3 3.000 1 1.000
Structural - - - - - - - -
Towing/towline - - - - - - - -
Well problem - - 1 1.000 1 1.000 - -
Other - - - - - - - -
Page A-31
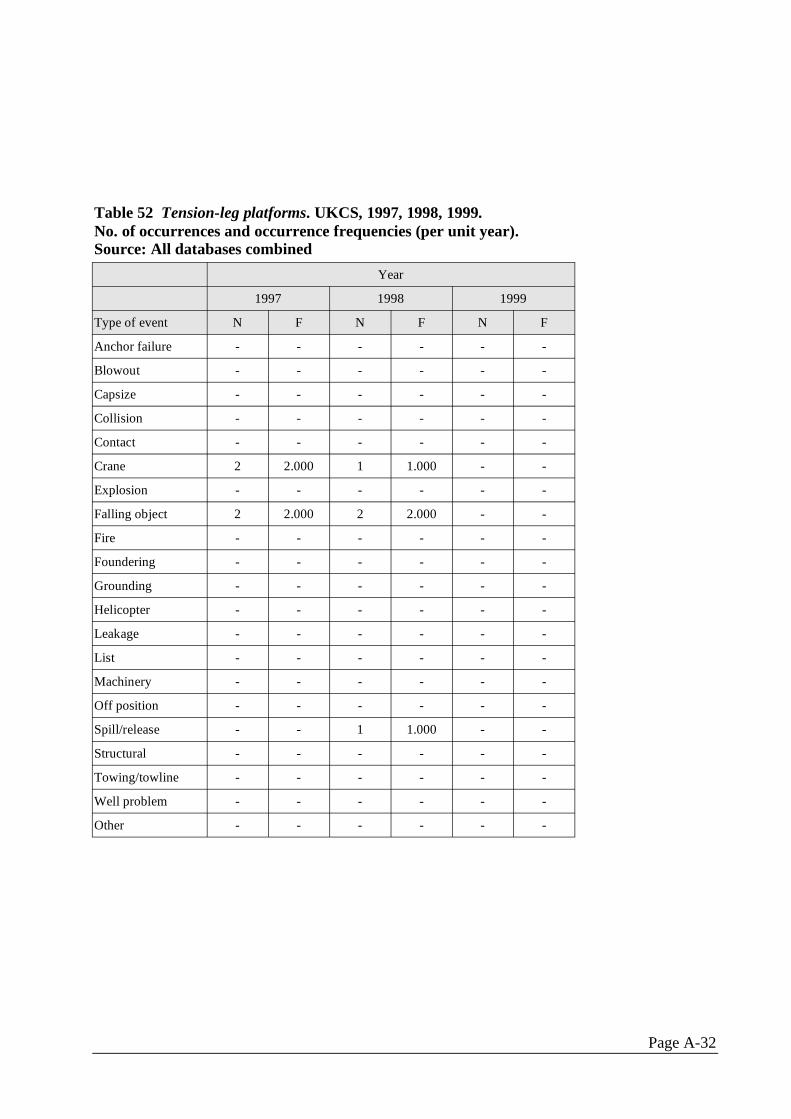
Table 52 Tension-leg platforms. UKCS, 1997, 1998, 1999.No. of occurrences and occurrence frequencies (per unit year).Source: All databases combined
Year
1997 1998 1999
Type of event N F N F N F
Anchor failure - - - - - -
Blowout - - - - - -
Capsize - - - - - -
Collision - - - - - -
Contact - - - - - -
Crane 2 2.000 1 1.000 - -
Explosion - - - - - -
Falling object 2 2.000 2 2.000 - -
Fire - - - - - -
Foundering - - - - - -
Grounding - - - - - -
Helicopter - - - - - -
Leakage - - - - - -
List - - - - - -
Machinery - - - - - -
Off position - - - - - -
Spill/release - - 1 1.000 - -
Structural - - - - - -
Towing/towline - - - - - -
Well problem - - - - - -
Other - - - - - -
Page A-32
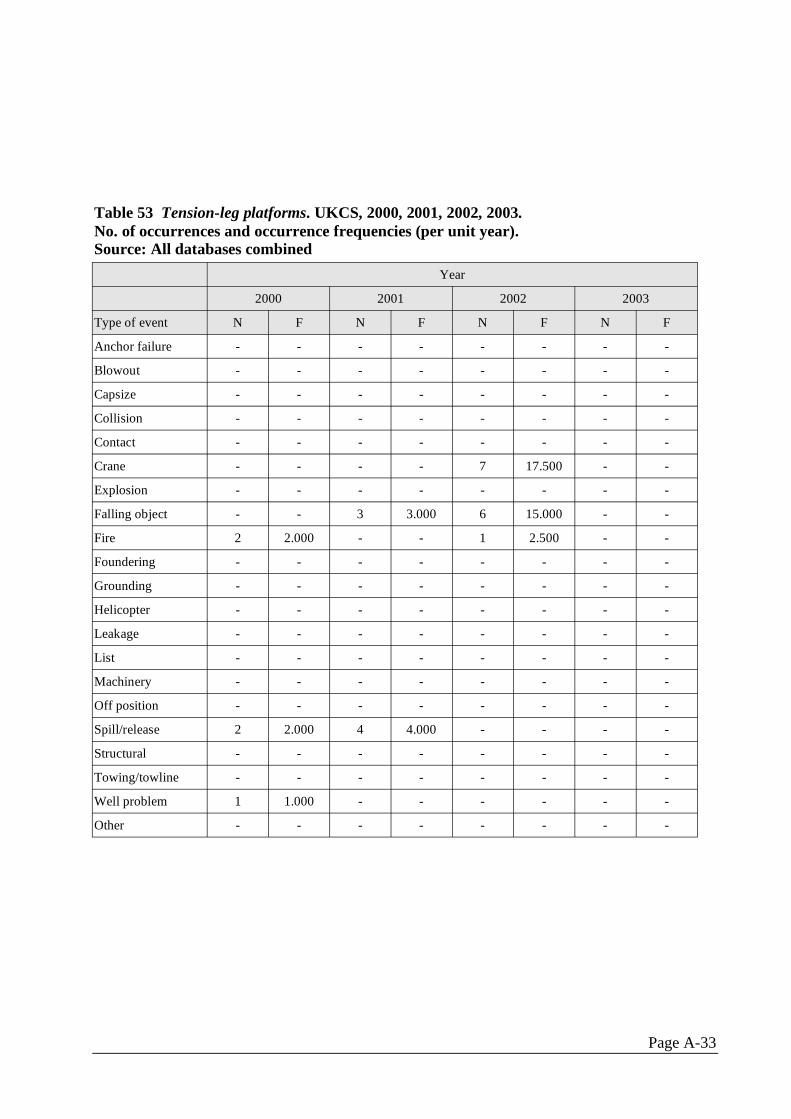
Table 53 Tension-leg platforms. UKCS, 2000, 2001, 2002, 2003. No. of occurrences and occurrence frequencies (per unit year). Source: All databases combined
Year
2000 2001 2002 2003
Type of event N F N F N F N F
Anchor failure - - - - - - - -
Blowout - - - - - - - -
Capsize - - - - - - - -
Collision - - - - - - - -
Contact - - - - - - - -
Crane - - - - 7 17.500 - -
Explosion - - - - - - - -
Falling object - - 3 3.000 6 15.000 - -
Fire 2 2.000 - - 1 2.500 - -
Foundering - - - - - - - -
Grounding - - - - - - - -
Helicopter - - - - - - - -
Leakage - - - - - - - -
List - - - - - - - -
Machinery - - - - - - - -
Off position - - - - - - - -
Spill/release 2 2.000 4 4.000 - - - -
Structural - - - - - - - -
Towing/towline - - - - - - - -
Well problem 1 1.000 - - - - - -
Other - - - - - - - -
Page A-33
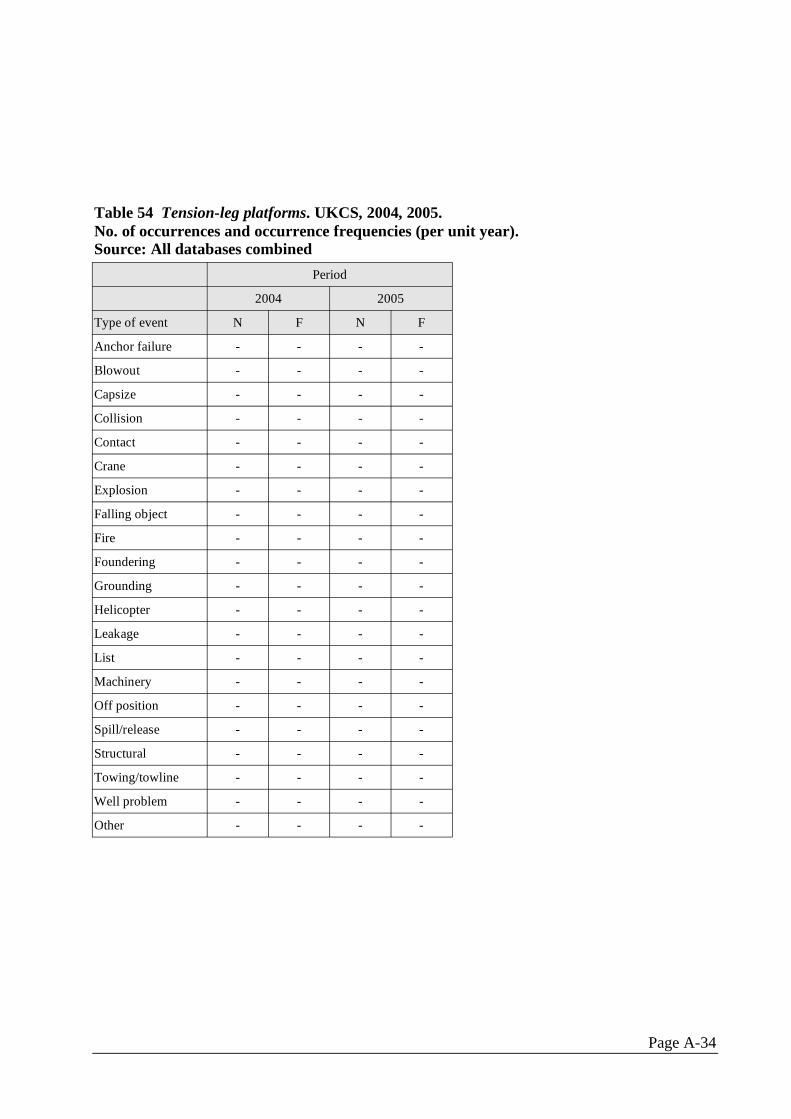
Table 54 Tension-leg platforms. UKCS, 2004, 2005.No. of occurrences and occurrence frequencies (per unit year).Source: All databases combined
Period
2004 2005
Type of event N F N F
Anchor failure - - - -
Blowout - - - -
Capsize - - - -
Collision - - - -
Contact - - - -
Crane - - - -
Explosion - - - -
Falling object - - - -
Fire - - - -
Foundering - - - -
Grounding - - - -
Helicopter - - - -
Leakage - - - -
List - - - -
Machinery - - - -
Off position - - - -
Spill/release - - - -
Structural - - - -
Towing/towline - - - -
Well problem - - - -
Other - - - -
Page A-34
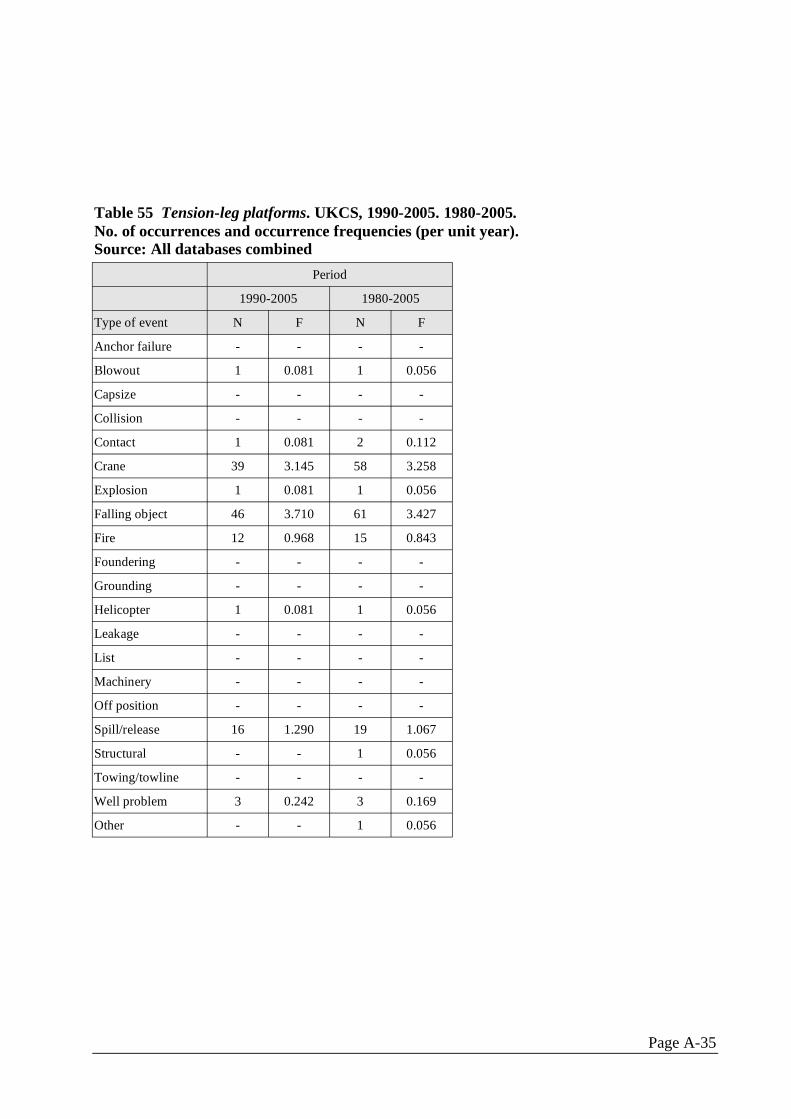
Table 55 Tension-leg platforms. UKCS, 1990-2005. 1980-2005. No. of occurrences and occurrence frequencies (per unit year). Source: All databases combined
Period
1990-2005 1980-2005
Type of event N F N F
Anchor failure - - - -
Blowout 1 0.081 1 0.056
Capsize - - - -
Collision - - - -
Contact 1 0.081 2 0.112
Crane 39 3.145 58 3.258
Explosion 1 0.081 1 0.056
Falling object 46 3.710 61 3.427
Fire 12 0.968 15 0.843
Foundering - - - -
Grounding - - - -
Helicopter 1 0.081 1 0.056
Leakage - - - -
List - - - -
Machinery - - - -
Off position - - - -
Spill/release 16 1.290 19 1.067
Structural - - 1 0.056
Towing/towline - - - -
Well problem 3 0.242 3 0.169
Other - - 1 0.056
Page A-35
A.2. 3 Occurrence frequencies - Monohull units In the following tables the number of occurrences (N) and corresponding frequencies (F) for monohull units are given per type of unit and year/period. The monohulls comprise both FSUs and FPSOs (both converted tankers and purpose-built units).
Page A-36
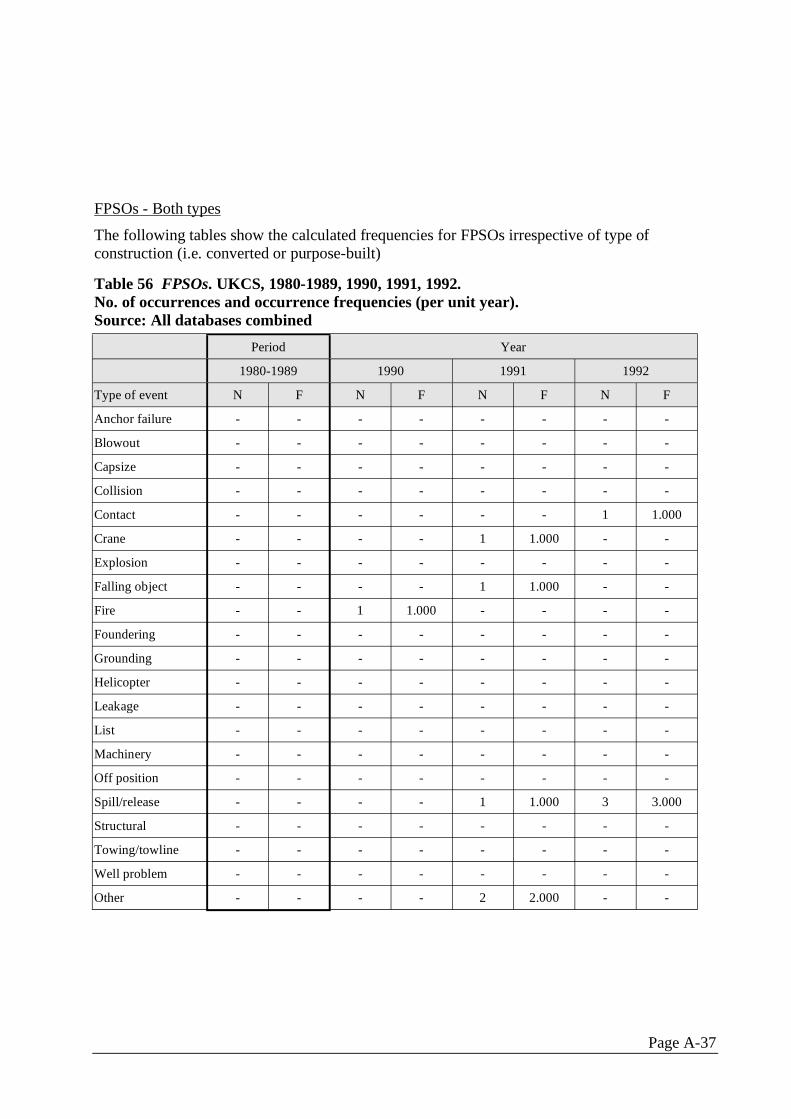
FPSOs - Both types
The following tables show the calculated frequencies for FPSOs irrespective of type of construction (i.e. converted or purpose-built)
Table 56 FPSOs. UKCS, 1980-1989, 1990, 1991, 1992.No. of occurrences and occurrence frequencies (per unit year).Source: All databases combined
Period Year
1980-1989 1990 1991 1992
Type of event N F N F N F N F
Anchor failure - - - - - - - -
Blowout - - - - - - - -
Capsize - - - - - - - -
Collision - - - - - - - -
Contact - - - - - - 1 1.000
Crane - - - - 1 1.000 - -
Explosion - - - - - - - -
Falling object - - - - 1 1.000 - -
Fire - - 1 1.000 - - - -
Foundering - - - - - - - -
Grounding - - - - - - - -
Helicopter - - - - - - - -
Leakage - - - - - - - -
List - - - - - - - -
Machinery - - - - - - - -
Off position - - - - - - - -
Spill/release - - - - 1 1.000 3 3.000
Structural - - - - - - - -
Towing/towline - - - - - - - -
Well problem - - - - - - - -
Other - - - - 2 2.000 - -
Page A-37
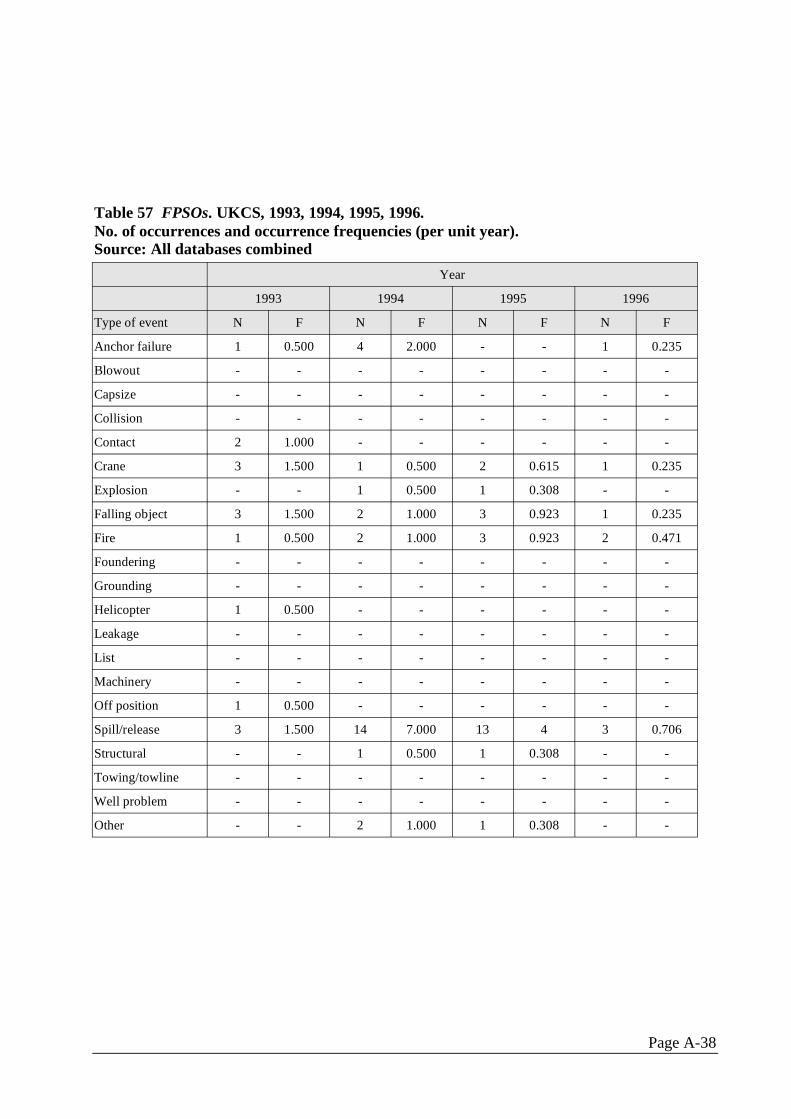
Table 57 FPSOs. UKCS, 1993, 1994, 1995, 1996.No. of occurrences and occurrence frequencies (per unit year).Source: All databases combined
Year
1993 1994 1995 1996
Type of event N F N F N F N F
Anchor failure 1 0.500 4 2.000 - - 1 0.235
Blowout - - - - - - - -
Capsize - - - - - - - -
Collision - - - - - - - -
Contact 2 1.000 - - - - - -
Crane 3 1.500 1 0.500 2 0.615 1 0.235
Explosion - - 1 0.500 1 0.308 - -
Falling object 3 1.500 2 1.000 3 0.923 1 0.235
Fire 1 0.500 2 1.000 3 0.923 2 0.471
Foundering - - - - - - - -
Grounding - - - - - - - -
Helicopter 1 0.500 - - - - - -
Leakage - - - - - - - -
List - - - - - - - -
Machinery - - - - - - - -
Off position 1 0.500 - - - - - -
Spill/release 3 1.500 14 7.000 13 4 3 0.706
Structural - - 1 0.500 1 0.308 - -
Towing/towline - - - - - - - -
Well problem - - - - - - - -
Other - - 2 1.000 1 0.308 - -
Page A-38
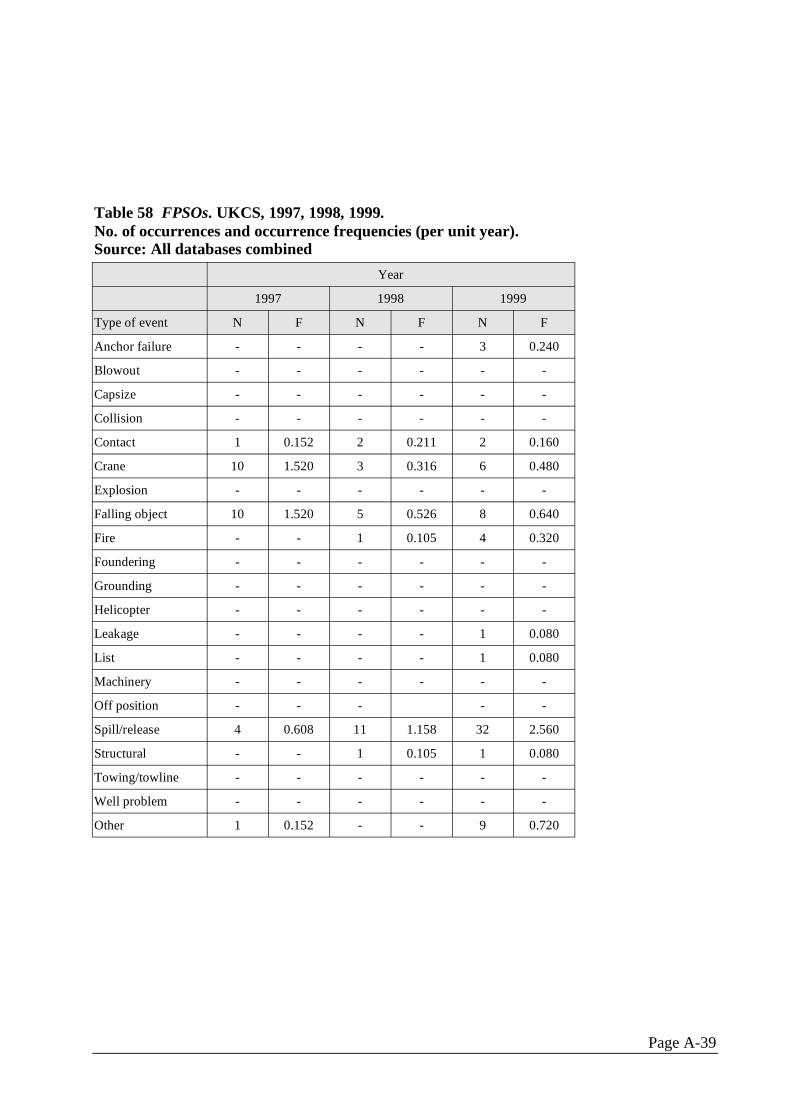
Table 58 FPSOs. UKCS, 1997, 1998, 1999.No. of occurrences and occurrence frequencies (per unit year).Source: All databases combined
Year
1997 1998 1999
Type of event N F N F N F
Anchor failure - - - - 3 0.240
Blowout - - - - - -
Capsize - - - - - -
Collision - - - - - -
Contact 1 0.152 2 0.211 2 0.160
Crane 10 1.520 3 0.316 6 0.480
Explosion - - - - - -
Falling object 10 1.520 5 0.526 8 0.640
Fire - - 1 0.105 4 0.320
Foundering - - - - - -
Grounding - - - - - -
Helicopter - - - - - -
Leakage - - - - 1 0.080
List - - - - 1 0.080
Machinery - - - - - -
Off position - - - - -
Spill/release 4 0.608 11 1.158 32 2.560
Structural - - 1 0.105 1 0.080
Towing/towline - - - - - -
Well problem - - - - - -
Other 1 0.152 - - 9 0.720
Page A-39
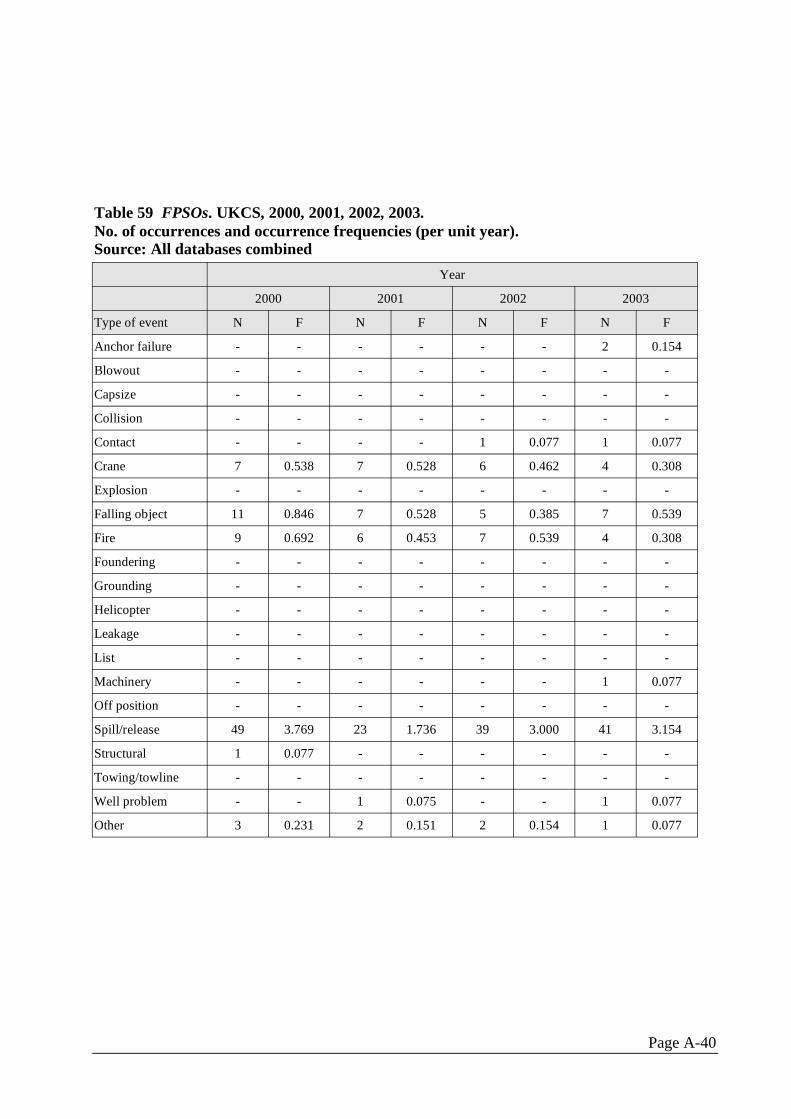
Table 59 FPSOs. UKCS, 2000, 2001, 2002, 2003.No. of occurrences and occurrence frequencies (per unit year).Source: All databases combined
Year
2000 2001 2002 2003
Type of event N F N F N F N F
Anchor failure - - - - - - 2 0.154
Blowout - - - - - - - -
Capsize - - - - - - - -
Collision - - - - - - - -
Contact - - - - 1 0.077 1 0.077
Crane 7 0.538 7 0.528 6 0.462 4 0.308
Explosion - - - - - - - -
Falling object 11 0.846 7 0.528 5 0.385 7 0.539
Fire 9 0.692 6 0.453 7 0.539 4 0.308
Foundering - - - - - - - -
Grounding - - - - - - - -
Helicopter - - - - - - - -
Leakage - - - - - - - -
List - - - - - - - -
Machinery - - - - - - 1 0.077
Off position - - - - - - - -
Spill/release 49 3.769 23 1.736 39 3.000 41 3.154
Structural 1 0.077 - - - - - -
Towing/towline - - - - - - - -
Well problem - - 1 0.075 - - 1 0.077
Other 3 0.231 2 0.151 2 0.154 1 0.077
Page A-40
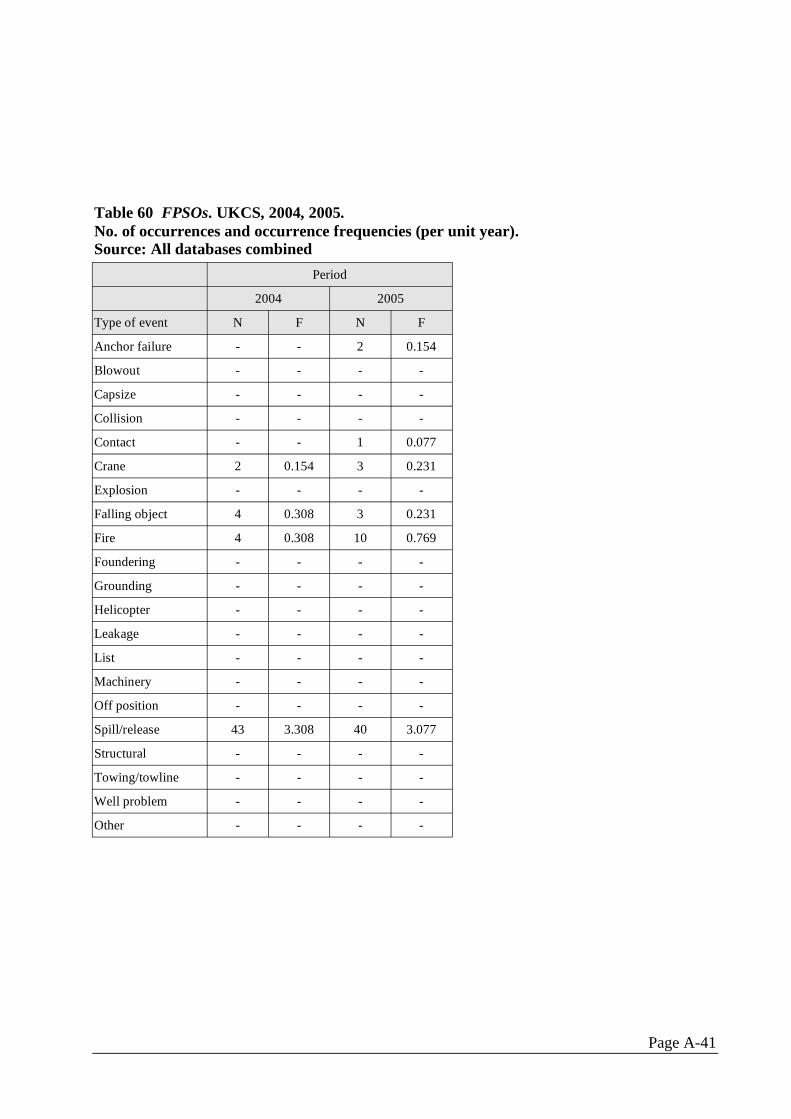
Table 60 FPSOs. UKCS, 2004, 2005.No. of occurrences and occurrence frequencies (per unit year).Source: All databases combined
Period
2004 2005
Type of event N F N F
Anchor failure - - 2 0.154
Blowout - - - -
Capsize - - - -
Collision - - - -
Contact - - 1 0.077
Crane 2 0.154 3 0.231
Explosion - - - -
Falling object 4 0.308 3 0.231
Fire 4 0.308 10 0.769
Foundering - - - -
Grounding - - - -
Helicopter - - - -
Leakage - - - -
List - - - -
Machinery - - - -
Off position - - - -
Spill/release 43 3.308 40 3.077
Structural - - - -
Towing/towline - - - -
Well problem - - - -
Other - - - -
Page A-41
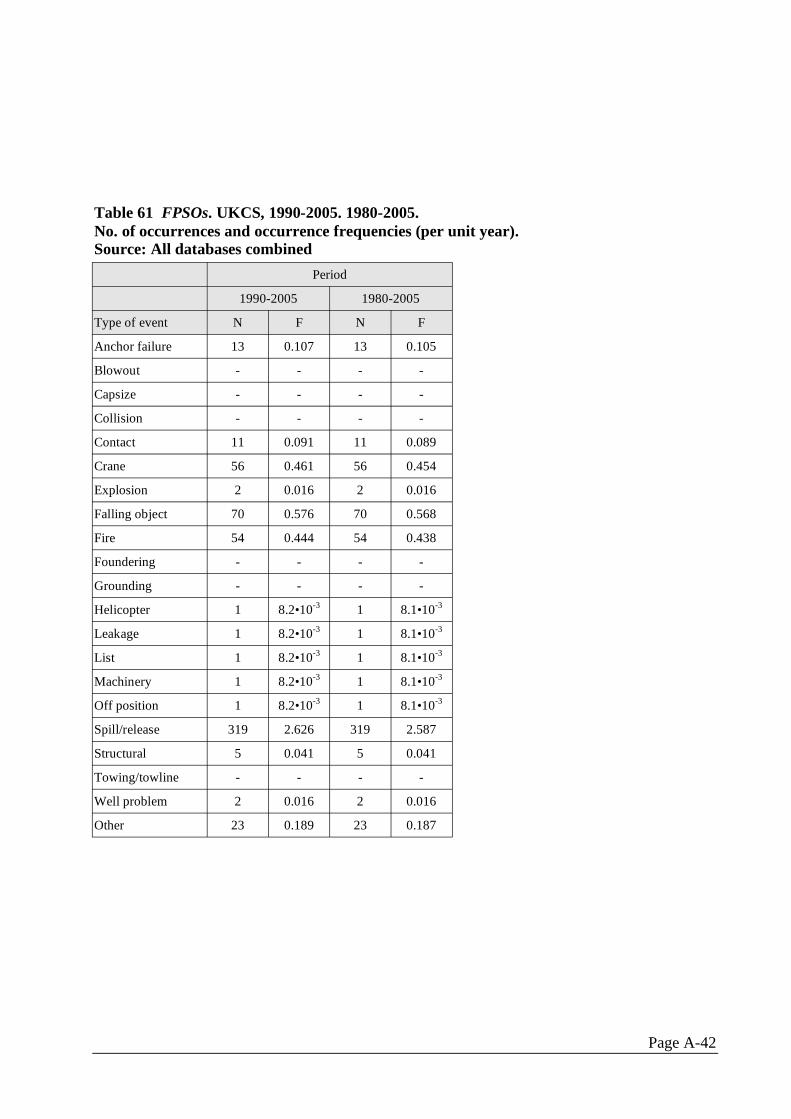
Table 61 FPSOs. UKCS, 1990-2005. 1980-2005.No. of occurrences and occurrence frequencies (per unit year).Source: All databases combined
Period
1990-2005 1980-2005
Type of event N F N F
Anchor failure 13 0.107 13 0.105
Blowout - - - -
Capsize - - - -
Collision - - - -
Contact 11 0.091 11 0.089
Crane 56 0.461 56 0.454
Explosion 2 0.016 2 0.016
Falling object 70 0.576 70 0.568
Fire 54 0.444 54 0.438
Foundering - - - -
Grounding - - - -
Helicopter 1 8.2•10-3 1 8.1•10-3
Leakage 1 8.2•10-3 1 8.1•10-3
List 1 8.2•10-3 1 8.1•10-3
Machinery 1 8.2•10-3 1 8.1•10-3
Off position 1 8.2•10-3 1 8.1•10-3
Spill/release 319 2.626 319 2.587
Structural 5 0.041 5 0.041
Towing/towline - - - -
Well problem 2 0.016 2 0.016
Other 23 0.189 23 0.187
Page A-42
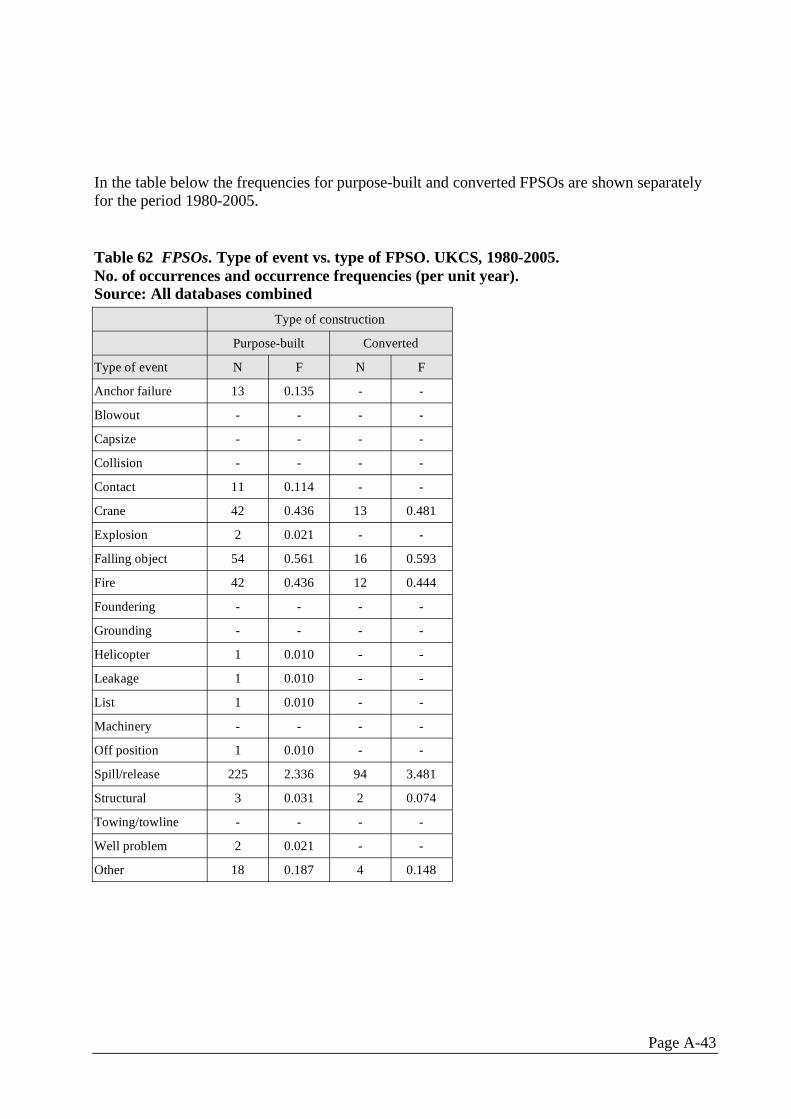
In the table below the frequencies for purpose-built and converted FPSOs are shown separately for the period 1980-2005.
Table 62 FPSOs. Type of event vs. type of FPSO. UKCS, 1980-2005. No. of occurrences and occurrence frequencies (per unit year). Source: All databases combined
Type of construction
Purpose-built Converted
Type of event N F N F
Anchor failure 13 0.135 - -
Blowout - - - -
Capsize - - - -
Collision - - - -
Contact 11 0.114 - -
Crane 42 0.436 13 0.481
Explosion 2 0.021 - -
Falling object 54 0.561 16 0.593
Fire 42 0.436 12 0.444
Foundering - - - -
Grounding - - - -
Helicopter 1 0.010 - -
Leakage 1 0.010 - -
List 1 0.010 - -
Machinery - - - -
Off position 1 0.010 - -
Spill/release 225 2.336 94 3.481
Structural 3 0.031 2 0.074
Towing/towline - - - -
Well problem 2 0.021 - -
Other 18 0.187 4 0.148
Page A-43
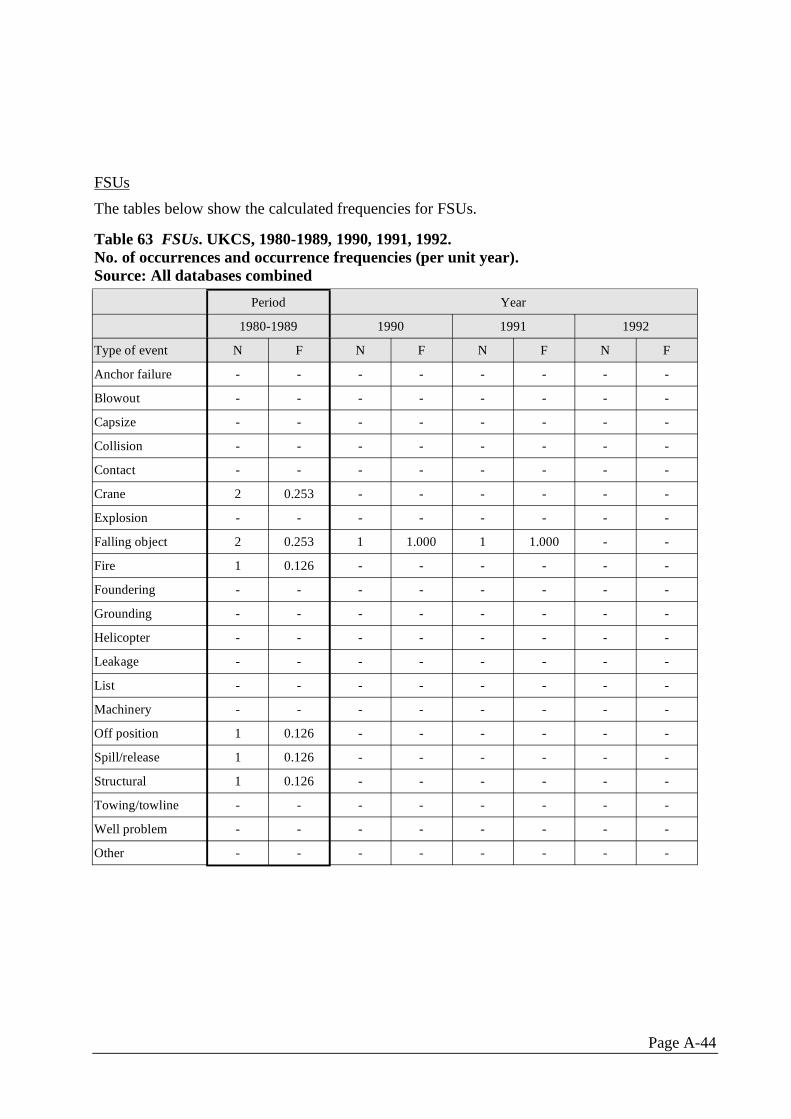
FSUs The tables below show the calculated frequencies for FSUs.
Table 63 FSUs. UKCS, 1980-1989, 1990, 1991, 1992.No. of occurrences and occurrence frequencies (per unit year).Source: All databases combined
Period Year
1980-1989 1990 1991 1992
Type of event N F N F N F N F
Anchor failure - - - - - - - -
Blowout - - - - - - - -
Capsize - - - - - - - -
Collision - - - - - - - -
Contact - - - - - - - -
Crane 2 0.253 - - - - - -
Explosion - - - - - - - -
Falling object 2 0.253 1 1.000 1 1.000 - -
Fire 1 0.126 - - - - - -
Foundering - - - - - - - -
Grounding - - - - - - - -
Helicopter - - - - - - - -
Leakage - - - - - - - -
List - - - - - - - -
Machinery - - - - - - - -
Off position 1 0.126 - - - - - -
Spill/release 1 0.126 - - - - - -
Structural 1 0.126 - - - - - -
Towing/towline - - - - - - - -
Well problem - - - - - - - -
Other - - - - - - - -
Page A-44
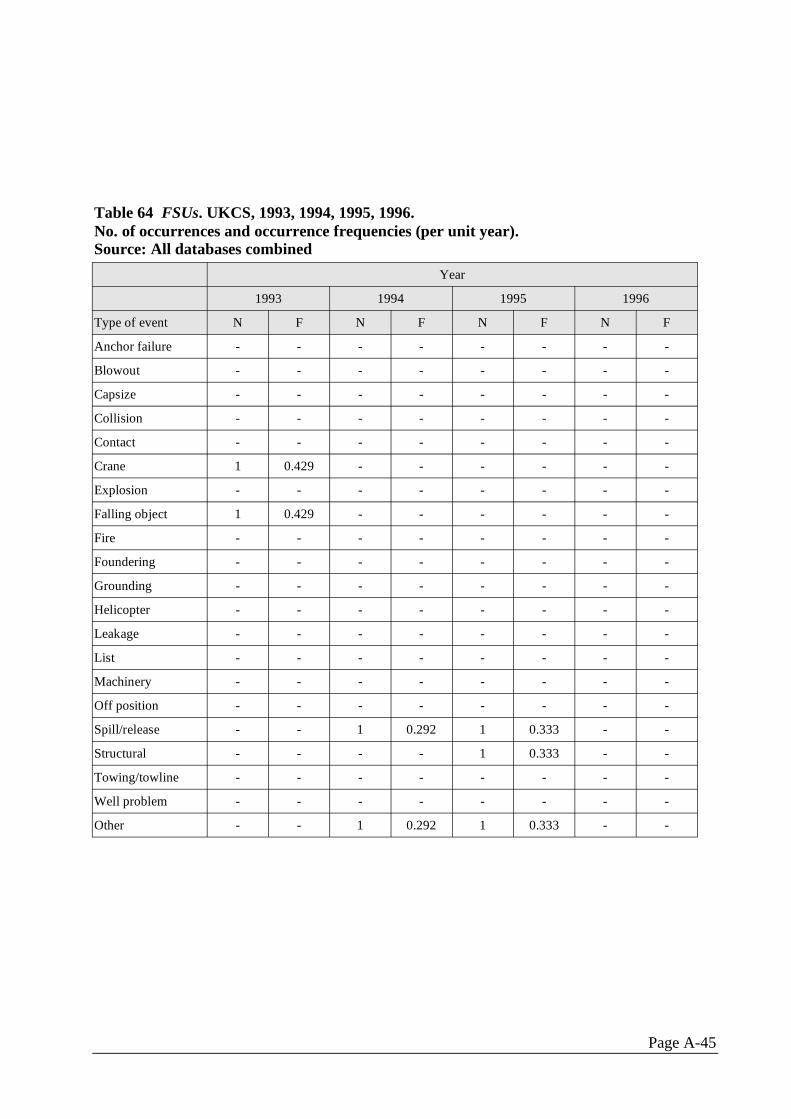
Table 64 FSUs. UKCS, 1993, 1994, 1995, 1996.No. of occurrences and occurrence frequencies (per unit year).Source: All databases combined
Year
1993 1994 1995 1996
Type of event N F N F N F N F
Anchor failure - - - - - - - -
Blowout - - - - - - - -
Capsize - - - - - - - -
Collision - - - - - - - -
Contact - - - - - - - -
Crane 1 0.429 - - - - - -
Explosion - - - - - - - -
Falling object 1 0.429 - - - - - -
Fire - - - - - - - -
Foundering - - - - - - - -
Grounding - - - - - - - -
Helicopter - - - - - - - -
Leakage - - - - - - - -
List - - - - - - - -
Machinery - - - - - - - -
Off position - - - - - - - -
Spill/release - - 1 0.292 1 0.333 - -
Structural - - - - 1 0.333 - -
Towing/towline - - - - - - - -
Well problem - - - - - - - -
Other - - 1 0.292 1 0.333 - -
Page A-45
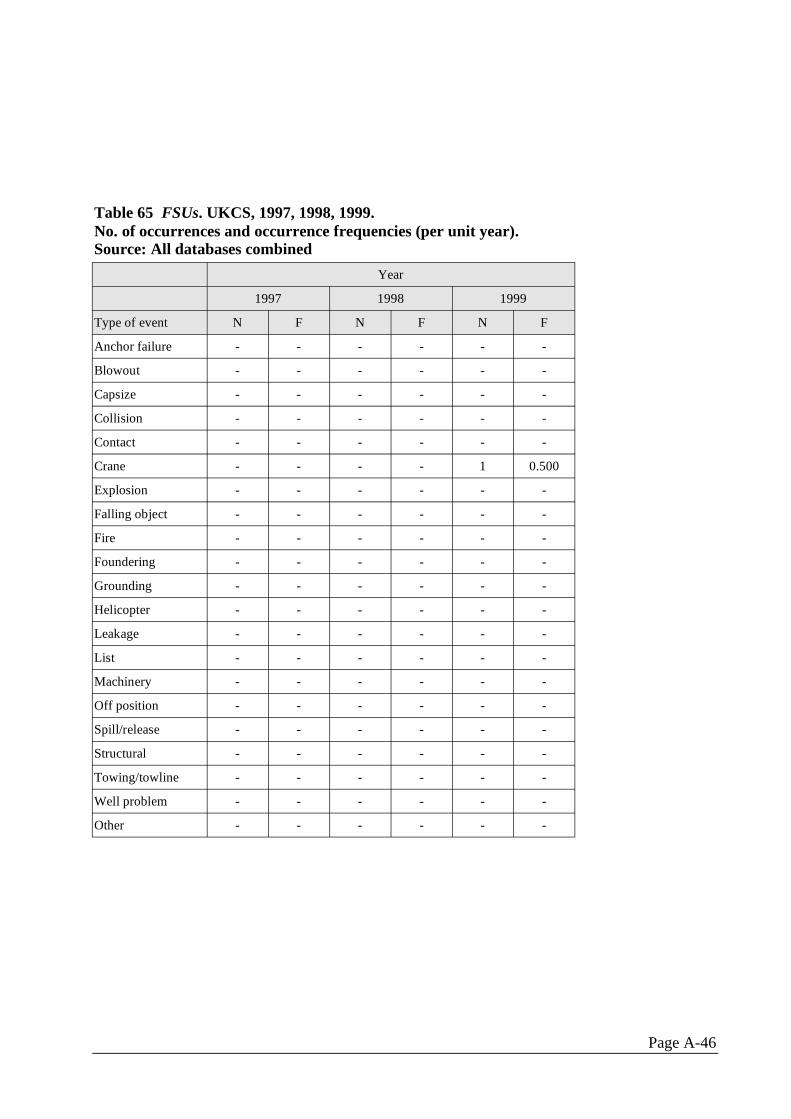
Table 65 FSUs. UKCS, 1997, 1998, 1999.No. of occurrences and occurrence frequencies (per unit year).Source: All databases combined
Year
1997 1998 1999
Type of event N F N F N F
Anchor failure - - - - - -
Blowout - - - - - -
Capsize - - - - - -
Collision - - - - - -
Contact - - - - - -
Crane - - - - 1 0.500
Explosion - - - - - -
Falling object - - - - - -
Fire - - - - - -
Foundering - - - - - -
Grounding - - - - - -
Helicopter - - - - - -
Leakage - - - - - -
List - - - - - -
Machinery - - - - - -
Off position - - - - - -
Spill/release - - - - - -
Structural - - - - - -
Towing/towline - - - - - -
Well problem - - - - - -
Other - - - - - -
Page A-46
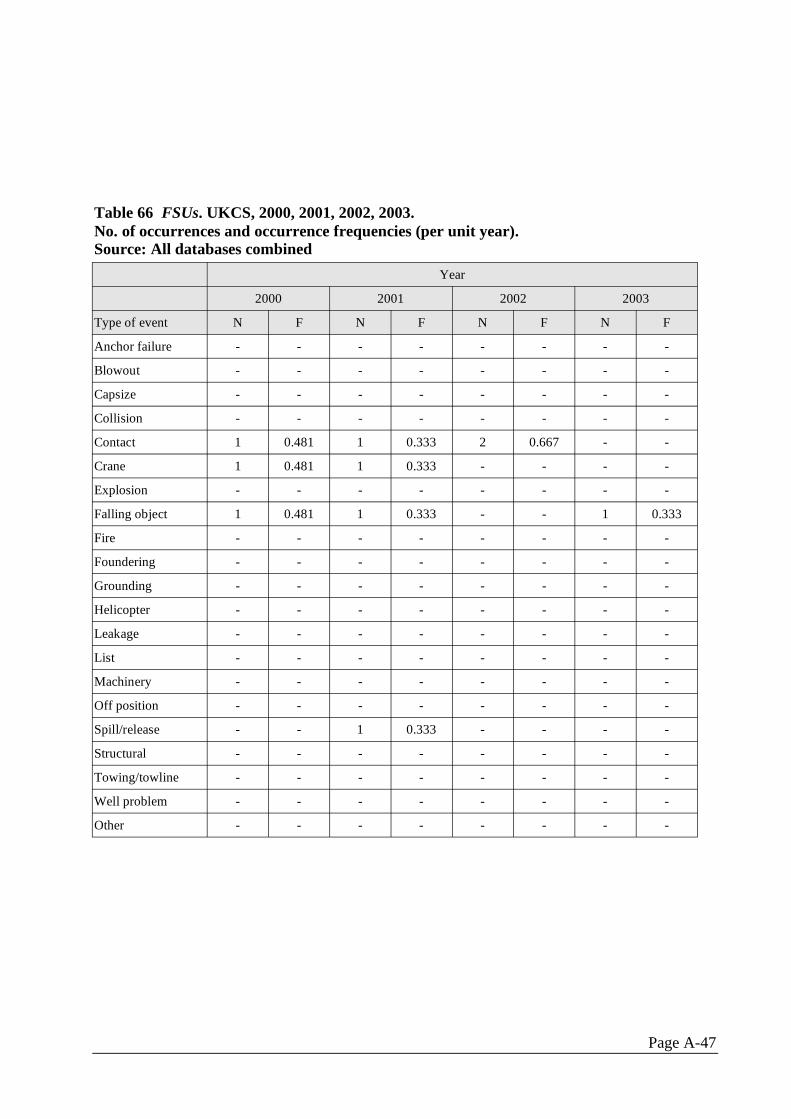
Table 66 FSUs. UKCS, 2000, 2001, 2002, 2003.No. of occurrences and occurrence frequencies (per unit year).Source: All databases combined
Year
2000 2001 2002 2003
Type of event N F N F N F N F
Anchor failure - - - - - - - -
Blowout - - - - - - - -
Capsize - - - - - - - -
Collision - - - - - - - -
Contact 1 0.481 1 0.333 2 0.667 - -
Crane 1 0.481 1 0.333 - - - -
Explosion - - - - - - - -
Falling object 1 0.481 1 0.333 - - 1 0.333
Fire - - - - - - - -
Foundering - - - - - - - -
Grounding - - - - - - - -
Helicopter - - - - - - - -
Leakage - - - - - - - -
List - - - - - - - -
Machinery - - - - - - - -
Off position - - - - - - - -
Spill/release - - 1 0.333 - - - -
Structural - - - - - - - -
Towing/towline - - - - - - - -
Well problem - - - - - - - -
Other - - - - - - - -
Page A-47

Table 67 FSUs. UKCS, 2004, 2005.No. of occurrences and occurrence frequencies (per unit year).Source: All databases combined
Period
2004 2005
Type of event N F N F
Anchor failure - - - -
Blowout - - - -
Capsize - - - -
Collision - - - -
Contact - - - -
Crane 1 0.333 - -
Explosion - - - -
Falling object 2 0.667 - -
Fire 1 0.333 - -
Foundering - - - -
Grounding - - - -
Helicopter - - - -
Leakage - - - -
List - - - -
Machinery - - - -
Off position - - - -
Spill/release 2 0.667 2 0.667
Structural - - - -
Towing/towline - - - -
Well problem - - - -
Other - - - -
Page A-48

Table 68 FSUs. UKCS, 1990-2005. 1980-2005.No. of occurrences and occurrence frequencies (per unit year).Source: All databases combined
Period
1990-2005 1980-2005
Type of event N F N F
Anchor failure 1 0.026 1 0.021
Blowout - - - -
Capsize - - - -
Collision - - - -
Contact 4 0.103 4 0.086
Crane 5 0.129 7 0.150
Explosion - - - -
Falling object 8 0.206 10 0.214
Fire 1 0.026 2 0.043
Foundering - - - -
Grounding - - - -
Helicopter - - - -
Leakage - - - -
List - - - -
Machinery - - - -
Off position - - 1 0.021
Spill/release 7 0.180 8 0.171
Structural 1 0.026 2 0.043
Towing/towline - - - -
Well problem - - - -
Other 2 0.052 2 0.043
Page A-49
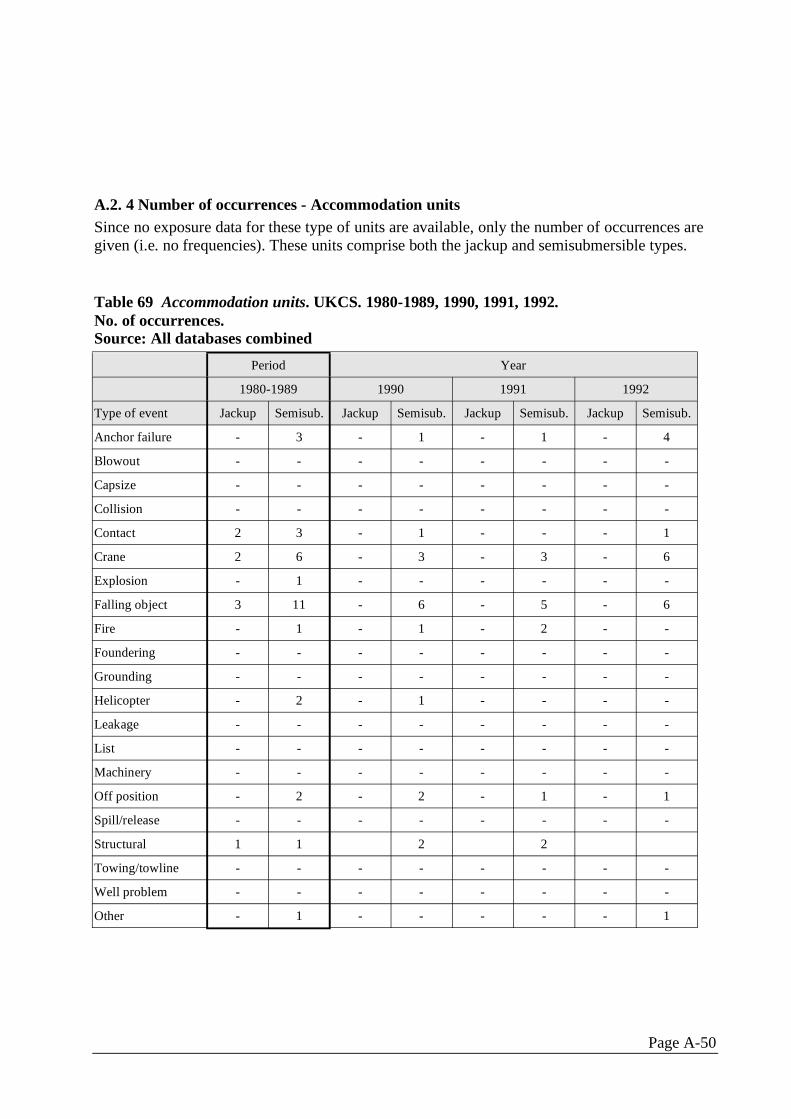
A.2. 4 Number of occurrences - Accommodation units Since no exposure data for these type of units are available, only the number of occurrences are given (i.e. no frequencies). These units comprise both the jackup and semisubmersible types.
Table 69 Accommodation units. UKCS. 1980-1989, 1990, 1991, 1992.No. of occurrences.Source: All databases combined
Period Year
1980-1989 1990 1991 1992
Type of event Jackup Semisub. Jackup Semisub. Jackup Semisub. Jackup Semisub.
Anchor failure - 3 - 1 - 1 - 4
Blowout - - - - - - - -
Capsize - - - - - - - -
Collision - - - - - - - -
Contact 2 3 - 1 - - - 1
Crane 2 6 - 3 - 3 - 6
Explosion - 1 - - - - - -
Falling object 3 11 - 6 - 5 - 6
Fire - 1 - 1 - 2 - -
Foundering - - - - - - - -
Grounding - - - - - - - -
Helicopter - 2 - 1 - - - -
Leakage - - - - - - - -
List - - - - - - - -
Machinery - - - - - - - -
Off position - 2 - 2 - 1 - 1
Spill/release - - - - - - - -
Structural 1 1 2 2
Towing/towline - - - - - - - -
Well problem - - - - - - - -
Other - 1 - - - - - 1
Page A-50
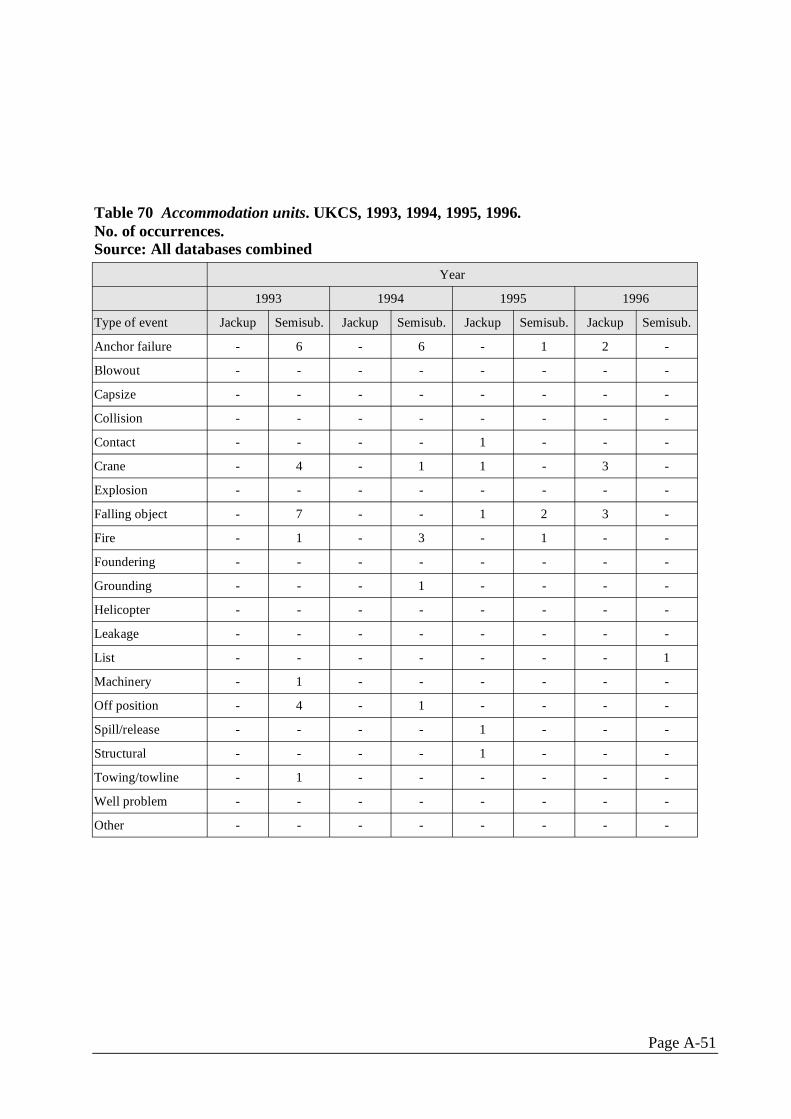
Table 70 Accommodation units. UKCS, 1993, 1994, 1995, 1996.No. of occurrences.Source: All databases combined
Year
1993 1994 1995 1996
Type of event Jackup Semisub. Jackup Semisub. Jackup Semisub. Jackup Semisub.
Anchor failure - 6 - 6 - 1 2 -
Blowout - - - - - - - -
Capsize - - - - - - - -
Collision - - - - - - - -
Contact - - - - 1 - - -
Crane - 4 - 1 1 - 3 -
Explosion - - - - - - - -
Falling object - 7 - - 1 2 3 -
Fire - 1 - 3 - 1 - -
Foundering - - - - - - - -
Grounding - - - 1 - - - -
Helicopter - - - - - - - -
Leakage - - - - - - - -
List - - - - - - - 1
Machinery - 1 - - - - - -
Off position - 4 - 1 - - - -
Spill/release - - - - 1 - - -
Structural - - - - 1 - - -
Towing/towline - 1 - - - - - -
Well problem - - - - - - - -
Other - - - - - - - -
Page A-51
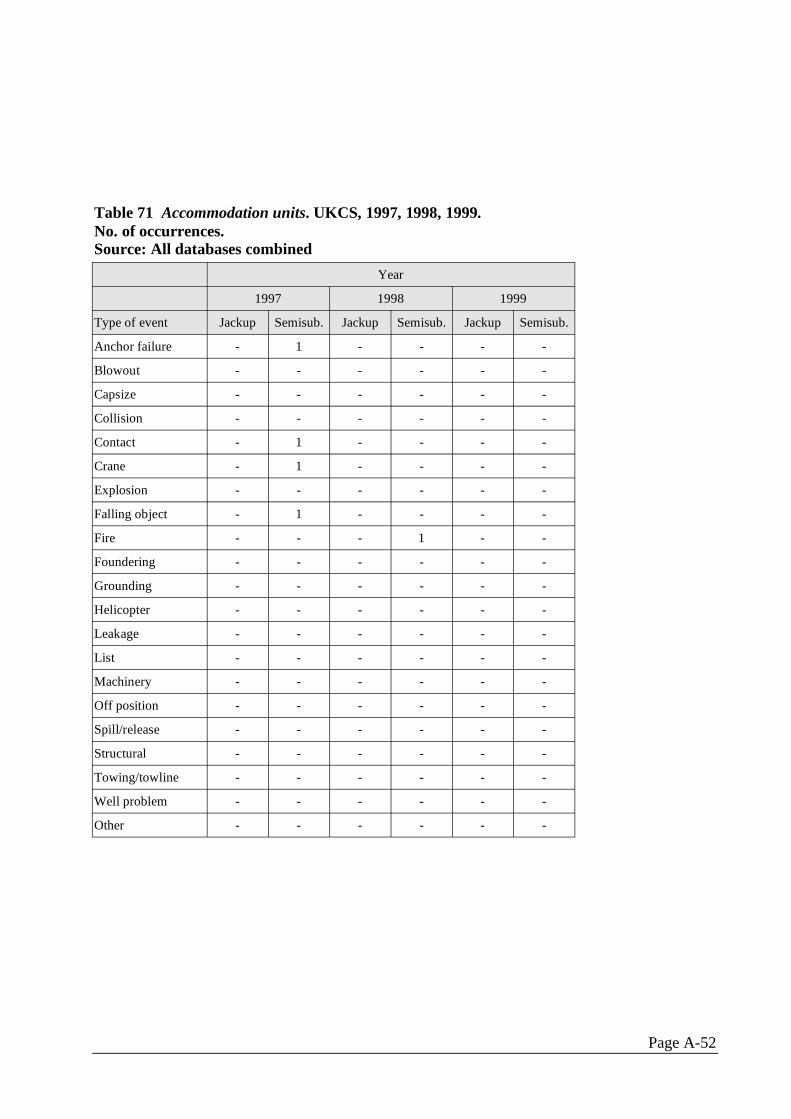
Table 71 Accommodation units. UKCS, 1997, 1998, 1999.No. of occurrences.Source: All databases combined
Year
1997 1998 1999
Type of event Jackup Semisub. Jackup Semisub. Jackup Semisub.
Anchor failure - 1 - - - -
Blowout - - - - - -
Capsize - - - - - -
Collision - - - - - -
Contact - 1 - - - -
Crane - 1 - - - -
Explosion - - - - - -
Falling object - 1 - - - -
Fire - - - 1 - -
Foundering - - - - - -
Grounding - - - - - -
Helicopter - - - - - -
Leakage - - - - - -
List - - - - - -
Machinery - - - - - -
Off position - - - - - -
Spill/release - - - - - -
Structural - - - - - -
Towing/towline - - - - - -
Well problem - - - - - -
Other - - - - - -
Page A-52

Table 72 Accommodation units. UKCS, 2000, 2001, 2002, 2003.No. of occurrences.Source: All databases combined
Year
2000 2001 2002 2003
Type of event Jackup Semisub. Jackup Semisub. Jackup Semisub. Jackup Semisub.
Anchor failure - - - 1 - - - -
Blowout - - - - - - - -
Capsize - - - - - - - -
Collision - - - - - - - -
Contact 1 - - - - - - -
Crane - - - - - - - -
Explosion - - - - - - - -
Falling object - - - - 1 - - -
Fire - - - - - - - -
Foundering - - - - - - - -
Grounding - - - - - - - -
Helicopter - - - - - - - -
Leakage - - - - - - - -
List - - - - - - - -
Machinery - - - - - - - -
Off position - - - - - - - -
Spill/release - - - - - - - -
Structural - - - - - - - -
Towing/towline - - - - - - - -
Well problem - - - - - - - -
Other - - - - - - - -
Page A-53
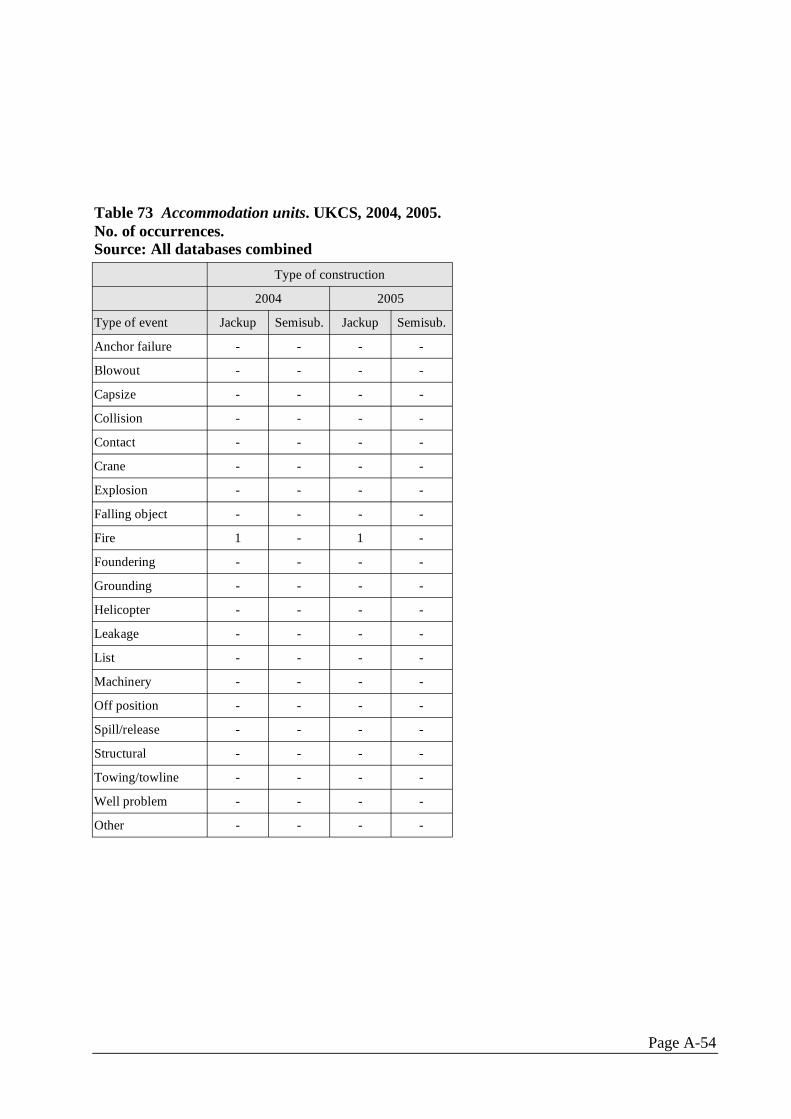
Table 73 Accommodation units. UKCS, 2004, 2005.No. of occurrences.Source: All databases combined
Type of construction
2004 2005
Type of event Jackup Semisub. Jackup Semisub.
Anchor failure - - - -
Blowout - - - -
Capsize - - - -
Collision - - - -
Contact - - - -
Crane - - - -
Explosion - - - -
Falling object - - - -
Fire 1 - 1 -
Foundering - - - -
Grounding - - - -
Helicopter - - - -
Leakage - - - -
List - - - -
Machinery - - - -
Off position - - - -
Spill/release - - - -
Structural - - - -
Towing/towline - - - -
Well problem - - - -
Other - - - -
Page A-54
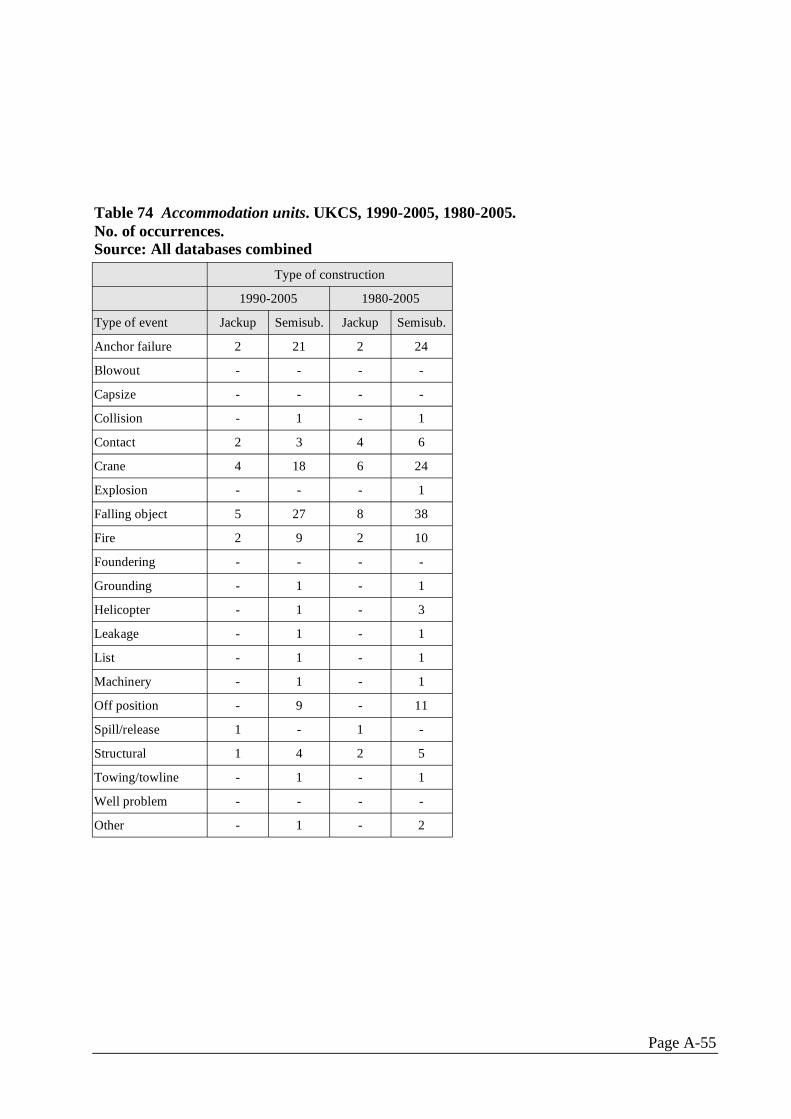
Table 74 Accommodation units. UKCS, 1990-2005, 1980-2005.No. of occurrences.Source: All databases combined
Type of construction
1990-2005 1980-2005
Type of event Jackup Semisub. Jackup Semisub.
Anchor failure 2 21 2 24
Blowout - - - -
Capsize - - - -
Collision - 1 - 1
Contact 2 3 4 6
Crane 4 18 6 24
Explosion - - - 1
Falling object 5 27 8 38
Fire 2 9 2 10
Foundering - - - -
Grounding - 1 - 1
Helicopter - 1 - 3
Leakage - 1 - 1
List - 1 - 1
Machinery - 1 - 1
Off position - 9 - 11
Spill/release 1 - 1 -
Structural 1 4 2 5
Towing/towline - 1 - 1
Well problem - - - -
Other - 1 - 2
Page A-55

Published by the Health and Safety Executive 06/07
Health and Safety Executive
Accident statistics for floating offshore units on the UK Continental Shelf 19802005
In 1999, during a project undertaken by DNV on behalf of the UK Health & Safety Executive (HSE), four databases holding information about UK Continental Shelf (UKCS) semisubmersible flooding incidents were interrogated. The survey revealed that that none of them had a complete recording of such incidents. In addition, it was identified that there were incidents which were not recorded in any of these sources. Consequently, the event frequencies being obtained varied with the availability of sources. There was no reason to believe that the situation and figures for other types of events on floating units should be any different. Hence, it was proposed to initiate a series of projects, but addressing all types of risks to floating units. The most recent one, Accident Statistics for Floating Offshore Units on the UK Continental Shelf 1980 – 2003, was completed in 2005. This current project updates the data of the previous project by two further years, 2004 and 2005. This report supercedes Research Report RR353
This report and the work it describes were funded by the Health and Safety Executive (HSE). Its contents, including any opinions and/or conclusions expressed, are those of the authors alone and do not necessarily reflect HSE policy.
RR567
www.hse.gov.uk