Embed Size (px)
Citation preview

AccountAncy futures
The carbon jigsaw

84
ABouT AccA
ACCA (the Association of Chartered Certified Accountants) is the global body for professional accountants. We aim to offer business-relevant, first-choice qualifications to people of application, ability and ambition around the world who seek a rewarding career in accountancy, finance and management.
Founded in 1904, ACCA has consistently held unique core values: opportunity, diversity, innovation, integrity and accountability. We believe that accountants bring value to economies at all stages of their development. We seek to develop capacity in the profession and encourage the adoption of global standards. Our values are aligned to the needs of employers in all sectors and we ensure that, through our qualifications, we prepare accountants for business. We seek to open up the profession to people of all backgrounds and remove artificial barriers, innovating our qualifications and their delivery to meet the diverse needs of trainee professionals and their employers.
We support our 140,000 members and 404,000 students in 170 countries, helping them to develop successful careers in accounting and business, based on the skills required by employers. We work through a network of 83 offices and centres and more than 8,000 Approved Employers worldwide, who provide high standards of employee learning and development. Through our public interest remit, we promote appropriate regulation of accounting and conduct relevant research to ensure accountancy continues to grow in reputation and influence.
ABouT AccounTAncy fuTuRes
The economic, political and environmental climate has exposed shortcomings in the way public policy and regulation have developed in areas such as financial regulation, financial reporting, corporate transparency, climate change and assurance provision.
In response to the challenges presented to the accountancy profession by this new business environment, ACCA’s Accountancy Futures programme has four areas of focus – access to finance, audit and society, carbon accounting, and narrative reporting. Through research, comment and events ACCA will contribute to the forward agenda of the international profession, business and society at large.
www.accaglobal.com/af
© The Association of Chartered Certified Accountants, 2010
To help readers understand how the carbon crisis will affect businesses The Carbon Jigsaw presents a collection of briefing papers about the key issues in the field of climate change and the low-carbon economy.

The carbon jigsaw
The Association of Chartered Certified Accountants (London)

AcknowledgemenTs
ACCA would like to thank it partners in this project, for contributing their time and expertise, and authoring specific chapters: Forum for the Future, author of the Climate Futures section; Baker and McKenzie, author of the Carbon Law section; KPMG, author of the Carbon Reporting and Assurance section; Deloitte, author of Emission Rights Accounting section. In developing content for several chapters, ACCA relied heavily on guidance developed by the Carbon Trust, the Climate Group, and Defra.
© The Association of Chartered Certified Accountants, 2010
3The Carbon jigsaw
section 1: The stern review: a summary 5
section 2: emission rights accounting 9
section 3: Carbon reporting and assurance 29
section 4: The world of carbon business 41
section 5: Carbon law 49
section 6: Climate futures 61
section 7: The science of climate change 71
section 8: Climate terminology 79
contents

4

5The Carbon jigsaw
secTion 1:
The stern Review: a summary

6
AcknowledgemenT
ACCA would like to thank Chris Jofeh, Director, Arup, for his technical assistance with this section.

7The Carbon jigsaw seCTion 1: The sTern reView: a sUMMarY
inTRoducTion
In 2005 the UK government commissioned former World Bank Chief Economist, Sir Nicholas Stern, to investigate the economic impacts and potential policy responses to climate change.
The resulting report focused primarily on the impacts of climate change on growth and development, the economics of stabilisation, the policy responses for both climate change adaptation and mitigation and the potential for international collective action.1 The Stern Review, as it has come to be known, has become the single most influential body of economic policy work in the field of climate change, not just within the UK but also globally. The work provided the first rigorous economic analysis of the cost to the global economy of action versus inaction on climate change.
In 2008, as Professor of Economics and Government at the London School of Economics, Lord Stern went on to develop the framework for a global treaty to address climate change.
The sTeRn Review (2005) – key elemenTs
impact of climate change on growth and developmentThe costs of climate change were estimated as equivalent to 5% of global GDP every year for eternity. If a wider range of risks and impacts (eg environment and health) were accounted for, this would rise to more than 20%. The impacts would not, however, be proportional to wealth – the poor would suffer most.
economics of stabilisationThere is a strong need to decouple the link between greenhouse gas emission growth and GDP growth. To do this, Stern advised that emissions must peak in the next 10–20 years and fall by 1–3% annually thereafter. So the emissions intensity of GDP would need to be around a quarter of today’s level by 2050. The cost of doing this falls between –2 and 5% of GDP, an average of about 1% of GDP annually.
1. The findings of both these reviews, The Stern Review (2005) and The Global Deal on Climate Change (2008), are summarised at: www.hm-treasury.gov.uk/sternreview_index.htm
Policy responses for mitigationBecause greenhouse emissions are currently an externality for producers, there need to be incentives to drive low-carbon choices. Stern advocates:
a global carbon price, through emissions trading and •carbon taxes, as well as measures to ensure that dangerous investment decisions are not made during the cross-over period
close collaboration between government and industry •to drive technology and R&D; global public energy R&D should double to about US$20 billion a year for the development of a diverse portfolio of technologies
widespread encouragement of behavioural change, •through education, labelling, efficiency standards and direct incentives.
Such initiatives would foster action on:•
reducing demand for high-emission goods and services•
switching to low-carbon technologies for power, heat •and transport, and
ensuring widespread uptake of energy-efficiency •measures.
Stern estimates that the excess of benefits over costs associated with stabilising CO2 at a level of 500–550ppm would yield a net present value of US$2.5 trillion.
Policy responses for adaptationClimate change is real, so in addition to stopping further rises in CO2 emissions, society must also adapt to the impacts that will occur. Stern identifies four key policies for governments:
provision of high-quality climate information services •(for better prediction of extreme weather)
introduction of building, land use and infrastructure •regulations that take climate change predictions into account
long-term planning for climate-sensitive public goods•
creation of a financial safety net for the vulnerable.•

8
international collective actionMany actions require international cooperation. Stern advocates:
agreement on a global emissions reduction framework•
using the EU’s emissions trading scheme as the hub of •a global carbon market, linking prices for carbon and reporting frameworks
scaling up capital flows to developing countries for •adaptation to climate change
cooperation on curbing deforestation•
cooperation on driving technological innovation and •diffusion.
The gloBAl deAl on climATe chAnge (2008) – key elemenTs
Recommendations for the deal are based on the need for global greenhouse gas emissions to peak by 2023 and then reduce so that by 2050 they are half the levels of 1990.2
Ultimately levels should stabilise at one tonne per capita per year on a global basis (an annual emission rate per person alive). This represents a reduction of 80% in real emissions by developed countries in the period to 2050. By 2050, the developing world will account for the greater part of global emissions and eight billion of the world’s predicted nine billion in population, therefore all nations will need to be involved in the process of emissions reductions.
To achieve this, most of the world’s electricity production will need to be decarbonised, and emissions from transport, land use, buildings and industry will need to be cut sharply. This will require major R&D investment on a global basis, and globally coordinated action on an unprecedented level to avoid duplication and assist scaling-up of initiatives.
The review advocates the following lines of action.
An international carbon market should be established, as this is the most effective, efficient and equitable way to reduce emissions.
There must be coordinated global support for carbon capture and storage technology.
New public–private partnerships must be set up to share risk efficiently.
2. www.lse.ac.uk/collections/granthamInstitute/publications/KeyElementsOfAGlobalDeal_30Apr08.pdf
Until 2020, developed countries should focus on delivering reductions without threatening economic growth and should design mechanisms for low-carbon technology transfer to the developing world. From 2020, developing countries should take responsibility for setting their own national targets.
Middle-income developing countries should take immediate action to stabilise and reverse emissions growth.
Reducing deforestation and land degradation should be pursued as a highly cost-effective method of compensating for emissions growth (because of the role of forests in sequestering carbon). In addition to this benefit, retaining forests has strong spin-off benefits in terms of biodiversity, environmental management and sustaining local communities.
There should be a global price for carbon, and tax and regulation or trading should be used to regulate this price and the response to the price. A regime of globally coordinated energy efficiency targets should be developed for all sectors of the economy.
Emission reductions should take place wherever they are cheapest – which is often in the developing world. Sector-specific efficiency targets and decarbonisation plans should be developed to facilitate this.
As many countries will face the impact of emissions for which they were not responsible, often where the original polluters have escaped responsibility, global support for adaptation in those countries must be implemented.
The Copenhagen 2009 Climate Change Negotiations must institute a credible global institutional structure to manage the international framework that this report outlines.

9The Carbon jigsaw
secTion 2:
emission rights accounting
‘Emission rights accounting’ was prepared for The Carbon Jigsaw by Deloitte. © Deloitte, 2009

10
An inTRoducTion To deloiTTe
Deloitte offers clients a broad range of services across our chosen areas of focus; Audit, Tax, Consulting and Corporate Finance. Our global, integrated approach combines insight and innovation from multiple disciplines with business and industry knowledge to help our clients excel anywhere in the world.
deloitte’s climate change and sustainability practice For company boards, executives, and management, the increasing global focus on issues of sustainability—such as carbon (greenhouse gas emissions), energy efficient technology, and water use—represent both opportunity and challenges. We help our clients to develop and execute effective strategies regarding climate change and sustainability. We help them to understand the impact of climate change regulation and relevant accounting and tax issues, and put in place sustainable property and carbon management strategies. We facilitate stakeholder engagement and behavioural change. We offer assistance for sustainability and carbon reporting and provide independent assurance of such reports. Deloitte’s climate change and sustainability practice focuses on responsible business practices that make good business sense.

11The Carbon jigsaw seCTion 2: eMission righTs aCCoUnTing
Cap-and-trade schemes are by far the predominant type of scheme in force today,1 with the European Union Greenhouse Gas Emission Trading Scheme (EU ETS), which started in 2005, being the largest scheme in the world. The EU ETS forms part of the EU’s initiative and overall commitment under the Kyoto Protocol to reduce emissions of greenhouses gases by 8% below 1990 levels by 2008–12.
This section focuses on the accounting and tax implications of the EU ETS cap-and-trade scheme.
1. Similar schemes are ‘baseline and credit schemes’ whereby, instead of receiving rights or allowances equal to a cap, participants are assigned a ‘baseline’, which establishes their emissions limit. They can emit without incurring additional costs up to the level of the baseline. If, at the end of the compliance year, a participant’s emissions are below its baseline, it receives ‘credits’ equal to the difference. If it has exceeded its baseline, however, it is required to purchase and surrender ‘credits’ equal to the difference. A key difference between the two types of schemes is that the baseline is not tradable.
A number of countries or economic areas around the world (eg the European Union) have, or are in the process of developing, schemes to encourage a reduction in the emission of greenhouse gases.
Such schemes are often based on a ‘cap-and-trade’ model whereby participants are allocated emission rights or allowances equal to a cap (a target level of emissions) and are permitted to trade those allowances.
As there is a finite limit of allowances allocated to participants in the scheme overall, any exchange of allowances between participants should come from installations with reduced emissions. Where participants have insufficient allowances to offset their target level of emissions they usually incur a financial penalty. A cap-and-trade scheme is, therefore, a mechanism to limit or cap emissions. Its effect is to restrict an activity that was previously unrestricted and to introduce a charge for greenhouse gas emissions. The objective is to increase the restriction over time (by a decreasing cap of permitted emissions), resulting in an increased ‘compliance’ cost for activities that were previously free, with the effect that entities are economically compelled to enter into emissions-reducing initiatives and actively reduce emissions.
introduction

12
in the eU eTs cap-and-trade scheme, the ‘scheme administrators’ (the governmental bodies of the eU Member states) set an overall cap on the amount of emissions that may be released during a specified time or commitment period in their Member state. The current ‘commitment period’ (known as ‘Phase ii’) runs from 2008 through 2012. The first commitment period (Phase i) ran from 2005 through 2007. The commitment period is further divided into annual ‘compliance years’.
The overall cap is implemented by issuing recognised ‘installations’ of an entity with allowances to emit – ‘installation’ being the word given to a carbon-dioxide-emitting unit or operation under the EU legislation. Each ‘emission allowance’ grants a right to emit a certain amount of regulated pollutant. Before a specified deadline following the compliance year, participants must offset their emissions by remitting to the scheme administrator allowances equal to their actual emissions.
Currently, the issue of emission allowances in the EU is governed by each Member State’s ‘National Allocation Plan’ (NAP). Each Member State administers its own scheme and determines the number of emission allowances granted free of charge to scheme participants and the number that will be sold or auctioned in the Member State’s domestic marketplace. These allocation plans also specify the treatment for ‘new entrants’, ie entities that enter into the emissions-regulated market after the start of the scheme. Currently the Member States submit their NAPs to the European Commission for commission approval, ie there is no EU-wide central cap.
Under the EU ETS, one emission allowance offsets the equivalent of one tonne of carbon dioxide (CO2). Emission allowances are actually issued by the end of February in each respective compliance year (ending in December). By April of the following year, participants have to surrender allowances equal to their level of emissions during the previous year to settle their obligation for that year. Participants are aware of the total number of allowances that will be allocated to them during any commitment period. For example, for the three years of Phase I (2005–7), the number of allowances to be received in each of the three years was fixed at the outset of that commitment period. Hence, participants may effectively borrow allowances from the following compliance year’s February allocation when settling their obligation for the preceding year (allowances for compliance year 2 can be used to settle the obligation for compliance year 1) and any unused emission allowances may be banked for use in future compliance years. In addition, participants are free to trade their emission allowances and – as evidenced by the market activity – actively do so.
At the beginning of each commitment period, the National Allocation Plan (NAP) announces the allowances to be allocated per installation in respect of the whole of that period, so entities might not acquire additional allowances in the market because sufficient allowances will be available to them for each phase overall.
Under the EU allocation plans, Member States currently allocate the majority of emission allowances free of charge to participants, with the remaining minority auctioned in the marketplace. During the current commitment period (2008–12), Member States are allowed to auction or sell up to 10% of emission allowances issued. The UK government performed its first successful auction in November 2008.2 The free allocation is intended to smooth the transition process for participants. It is expected that the percentage of allowances allocated free of charge will be reduced and the percentage of allowances that are auctioned will be increased over time. The overall cap will also be reduced over time, in order to achieve the desired reduction in overall emissions.
The EU ETS allows ‘project-based certificates’ to be remitted in lieu of emissions allowances up to a limited percentage of an entity’s emissions obligation. An example of such ‘project-based certificates’ is the certified emissions reduction (CER),3 verified and registered by the Clean Development Mechanism (CDM) as established under the United Nations programme for emissions reductions.4
Generally, third-party providers undertake these emissions-reducing projects in regions outside the jurisdiction of the EU ETS, in order to be able to sell the resulting certificates, on the open market, to scheme participants. Certificates typically trade at a lower price than emissions allowances, primarily because of the limitation on the number of certificates that may be remitted in lieu of allowances. For example, during Phase II, the UK government has set an 8% limit on the use of project credits at an installation level.5
2. For more details, visit www.defra.gov.uk/environment/climatechange/trading/eu/index.htm
3. Certified Emission Reductions (CERs) are climate credits (or carbon credits) issued by the Executive Board of the United Nation’s Clean Development Mechanism (CDM) for emission reductions achieved by certified CDM projects that have been verified by an environmental agency or department. The CDM operates under the guidance of the United Nations Framework Convention on Climate Change (UNFCCC). CERs can be used by operators of installations covered by the European Union Emission Trading Scheme (EU ETS) to comply with their obligations to surrender EU Allowances for the CO2 emissions of their installations.
4. The United Nations Framework Convention on Climate Change (UNFCCC).
5. For more details of the UK National Allocation Plan (NAP) during Phase II visit www.defra.gov.uk/environment/climatechange/trading/eu/pdf/nap-phase2.pdf
The eu eTs

13The Carbon jigsaw seCTion 2: eMission righTs aCCoUnTing
hisToRy of AccounTing develoPmenTs
The IASB’s International Financial Reporting Committee (IFRIC) issued an interpretation, IFRIC 3 Emission Rights, on the accounting for emission rights under a ‘cap-and-trade’ emission rights scheme in December 2004. The interpretation was to be applicable for financial reporting periods beginning on or after 1 March 2005, with earlier adoption encouraged, so that it could be implemented for the beginning of Phase I of the EU ETS,6 which had been the main driving force behind the development of the interpretation. IFRIC 3 met with considerable opposition, and so, at its June 2005 meeting, the IASB decided to withdraw it.7
In its withdrawal notice, the IASB affirmed that IFRIC 3 was an appropriate interpretation of the IFRS literature but acknowledged that in following existing IFRSs, IFRIC 3 created unsatisfactory measurement and reporting mismatches, as explained below.
6. The first compliance year ran from 1 January 2005 to 31 December 2005 as part of the first three-year commitment period (Phase I) running from 1 January 2005 to 31 December 2007.
7. The European Financial Reporting Group (EFRAG) issued negative endorsement advice on IFRIC 3, advocating that it did not meet all the requirements of the Regulation (EC) no. 1606/2002 of the European Parliament and of the Council on the application of international accounting standards because: ‘it is contrary to the “true and fair principle” set out in Article 16(3) of the Council Directive 83/349/EEC and Article 2(3) of Council Directive 78/660/EEC…’.
The TheoRy: how TRAding leAds To A ReducTion in co2 emissions Installation Y and installation Z both emit approximately 450 tonnes of CO2 per year. Both are given 400 allowances under the system for the allocation of allowances.
At the end of the first year, verification of installation Y’s emissions confirms that it has emitted 380Mt CO2. It has reduced its CO2 emissions, by installing an additional wind turbine rather than continuing to operate as it has previously and buying the additional allowances required to offset emissions. Y has therefore sold its surplus allowances on the carbon market.
Installation Z emitted 420Mt CO2, ie Z took no emissions-reducing measures as these were deemed too expensive. Additionally Z found it needed to increase production hence was required to buy additional allowances; these had been made available as installation Y had sold its surplus allowances. The net effect is that reduction of emissions occurs in the cheapest place, and CO2 is limited to the 400 allowances issued to both installations.
installation Y Allocation: 400
allowances
installation Z Allocation: 400
allowances
EU carbon market
National registry
National registry

14
ifRic 3 accounting
systematic basis over the compliance period for which the allowances are issued, regardless of whether those allowances continue to be held or sold.
IAS 20 also allows an accounting policy alternative. An •entity can choose not to recognise the allowance assets initially at fair value, but at a ‘nominal amount’ plus any expenditure directly attributable to preparing the asset for its intended use. Nominal value will be zero for a European Emissions Allowance (EUA).
IAS 38 also sets out two alternatives for subsequent •measurement of an intangible asset: the cost model and the revaluation model.
Under the cost model, intangibles are subsequently –measured at cost less amortisation10 and impairment.
The revaluation model can be adopted only where –the intangibles are traded on an active market, which is the case for EU emissions allowances. Under this model, the intangible asset is carried at a revalued amount (less any amortisation and impairment losses), which is its fair value at the date of the revaluation. Revaluation gains or losses are recognised outside profit or loss in other comprehensive income and accumulate in equity as a revaluation surplus. When the revaluation surplus is realised on sale/delivery of the allowances to the scheme administrator, a transfer from the revaluation surplus to retained earnings is made, not through profit or loss but by means of a direct reserve transfer.
As greenhouse gas emissions (GHGs) or carbon •equivalents are made, the emitter must recognise a liability for the obligation to deliver allowances equal to actual emissions. This liability is a provision within the scope of IAS 37 Provisions, Contingent Liabilities and Contingent Assets, and is measured at the best estimate of the expenditure required to settle the present obligation at the end of the reporting period. This will usually be the present market price of the number of allowances required to cover emissions made up to the end of the reporting period.
Offset of the intangible asset (for allowances held) and •the emissions liability (to deliver allowances to the value of emissions made) is not permitted.
IFRIC 3 includes an example of its possible accounting treatments. Please visit the IASB’s website to access IFRIC 3 and view the example.
10. For most allowances traded in an active market, no amortisation will be required as the residual value will be the same as cost and therefore the depreciable amount will be zero. If the market value of the allowances falls below cost, or other indicators of impairment exist, then the guidance in IAS 36 Impairment of Assets should be followed to determine whether the assets are impaired.
IFRIC 38 contains a fundamental income statement mismatch:
changes in the market value of emission allowances •held by an entity to offset its obligation are recognised in equity, not in the income statement, but
changes in the value of a company’s obligation to •deliver allowances to the scheme administrator, required by IFRSs to be recognised as a separate liability, are recognised in the income statement. The charge is based on the market value of the number of allowances required to offset emissions to date.
Hence an entity’s income statement is adversely affected, albeit that, economically, the allowances it holds may provide a full offset of its emission obligation.
Furthermore, dissenters to IFRIC 3 argue that accounting separately for an asset (for allowances held) and a liability (for the obligation to deliver allowances), ie on a gross basis, does not reflect the net economic position in which a participant in a scheme finds itself. Their view is that a scheme participant should recognise a liability only when it has produced emissions and holds insufficient allowances to offset them (or, recognise an asset when it holds allowances in excess of its requirements).
These reporting and measurement mismatches on application of the existing international accounting standards are explained fully as follows.
Under IFRS an emission right meets the definition of an •intangible asset, ie ‘an identifiable non-monetary asset without physical substance’ (IAS 38.8). Other examples of intangible assets9 include licences, permits or rights, such as drilling or mineral rights. An emissions right or allowance is no different: it is a contractual right to emit a specified quantity of CO2.
IAS 38 • Intangible Assets requires intangible assets to be recognised initially at cost when they are purchased (IAS 38.24).
An intangible asset may, however, be acquired free of •charge, or for nominal consideration, by way of a government grant, for example when a government transfers or allocates to an entity, free of charge, intangible assets such as airport landing rights, licences to operate radio or television stations, import licences or, as explained above, emissions allowances. Under IFRS, the difference between the amount paid for allowances (which, in the majority of cases, is nil) and their fair value is a government grant within the scope of IAS 20 Accounting for Government Grants and Disclosure of Government Assistance. On receipt of the allowances, this grant should be recognised as deferred income. It is subsequently released to income, on a
8. Although withdrawn, IFRIC 3 can still be viewed in the 2005s Standards eIFRS section of the IASB’s website: www.iasb.org.uk.
9. Note that IAS 38 includes a list of examples of intangible assets within its scope.
15The Carbon jigsaw seCTion 2: eMission righTs aCCoUnTing
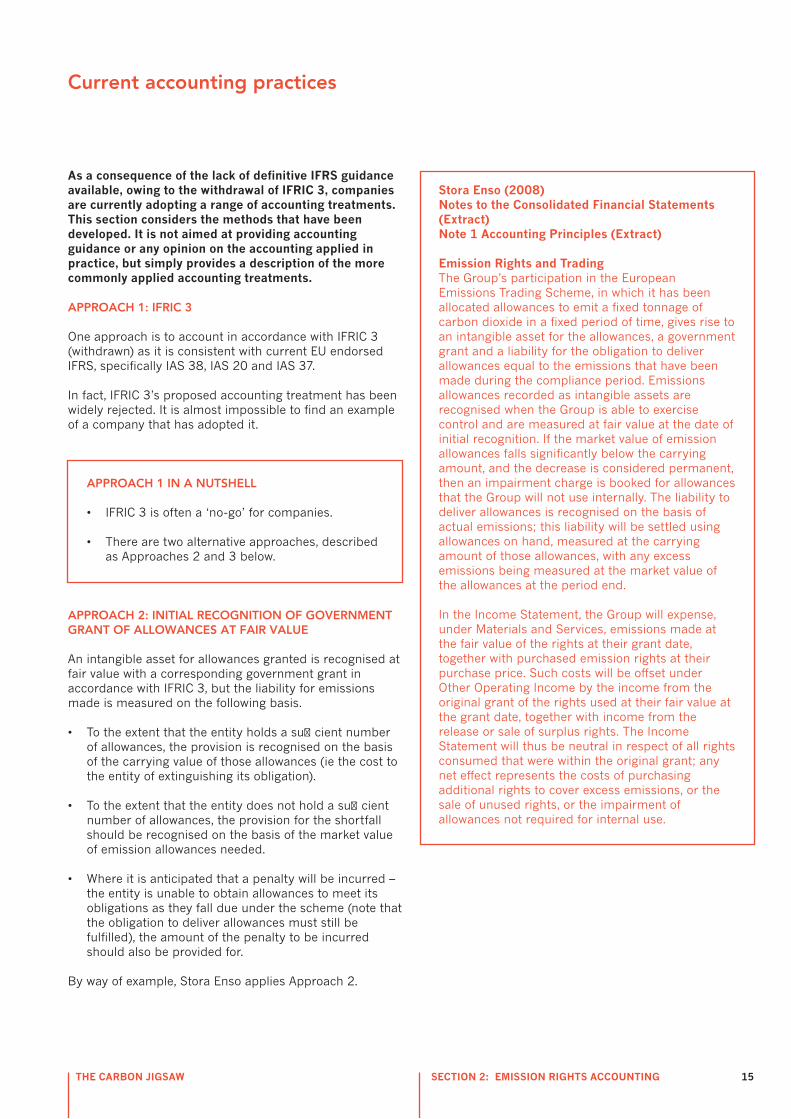
as a consequence of the lack of definitive iFrs guidance available, owing to the withdrawal of iFriC 3, companies are currently adopting a range of accounting treatments. This section considers the methods that have been developed. it is not aimed at providing accounting guidance or any opinion on the accounting applied in practice, but simply provides a description of the more commonly applied accounting treatments.
APPRoAch 1: ifRic 3
One approach is to account in accordance with IFRIC 3 (withdrawn) as it is consistent with current EU endorsed IFRS, specifically IAS 38, IAS 20 and IAS 37.
In fact, IFRIC 3’s proposed accounting treatment has been widely rejected. It is almost impossible to find an example of a company that has adopted it.
APPRoAch 1 in A nuTshell
IFRIC 3 is often a ‘no-go’ for companies. •
There are two alternative approaches, described •as Approaches 2 and 3 below.
APPRoAch 2: iniTiAl RecogniTion of goveRnmenT gRAnT of AllowAnces AT fAiR vAlue
An intangible asset for allowances granted is recognised at fair value with a corresponding government grant in accordance with IFRIC 3, but the liability for emissions made is measured on the following basis.
To the extent that the entity holds a sufficient number •of allowances, the provision is recognised on the basis of the carrying value of those allowances (ie the cost to the entity of extinguishing its obligation).
To the extent that the entity does not hold a sufficient •number of allowances, the provision for the shortfall should be recognised on the basis of the market value of emission allowances needed.
Where it is anticipated that a penalty will be incurred – •the entity is unable to obtain allowances to meet its obligations as they fall due under the scheme (note that the obligation to deliver allowances must still be fulfilled), the amount of the penalty to be incurred should also be provided for.
By way of example, Stora Enso applies Approach 2.
stora enso (2008) notes to the Consolidated Financial statements (extract) note 1 accounting Principles (extract)
emission rights and Trading The Group’s participation in the European Emissions Trading Scheme, in which it has been allocated allowances to emit a fixed tonnage of carbon dioxide in a fixed period of time, gives rise to an intangible asset for the allowances, a government grant and a liability for the obligation to deliver allowances equal to the emissions that have been made during the compliance period. Emissions allowances recorded as intangible assets are recognised when the Group is able to exercise control and are measured at fair value at the date of initial recognition. If the market value of emission allowances falls significantly below the carrying amount, and the decrease is considered permanent, then an impairment charge is booked for allowances that the Group will not use internally. The liability to deliver allowances is recognised on the basis of actual emissions; this liability will be settled using allowances on hand, measured at the carrying amount of those allowances, with any excess emissions being measured at the market value of the allowances at the period end.
In the Income Statement, the Group will expense, under Materials and Services, emissions made at the fair value of the rights at their grant date, together with purchased emission rights at their purchase price. Such costs will be offset under Other Operating Income by the income from the original grant of the rights used at their fair value at the grant date, together with income from the release or sale of surplus rights. The Income Statement will thus be neutral in respect of all rights consumed that were within the original grant; any net effect represents the costs of purchasing additional rights to cover excess emissions, or the sale of unused rights, or the impairment of allowances not required for internal use.
current accounting practices

16
APPRoAch 2 in A nuTshell
Allowances recognised at fair value if granted •(with a corresponding entry to government grant, at cost if purchased
Allowances subsequently measured at cost or •revalued amount
Liability recognized as incurred•
Government grant amortised on a systematic •basis over compliance period
Liability measured as follows:•
For allowances held, at carrying amount of those –allowances
For any shortfall, at the market value of –allowances required to meet shortfall
APPRoAch 3 – neT liABiliTy APPRoAch
No asset or deferred income is recognised when the allowances are initially received, because IAS 20’s accounting policy choice, ie that of recognising the grant at nominal amount, is applied (the nominal amount being zero in this case). Allowances granted to an entity are used to offset any liability arising as a result of carbon emissions. Hence, no accounting entries are required so long as the entity holds sufficient allowances to meet its emission obligations. Where the entity has no allowances or has a shortfall, a provision should be recognised on the basis of a best estimate of the cost to be incurred to meet its emission obligation, that is, at the present market price of the number of allowances it requires to cover for actual emissions at the balance sheet date. This will equal the cash cost, at that date, of obtaining the allowances it requires to meet its obligation.
By way of example, Centrica applies Approach 3.
Centrica plc (2008) notes to the financial statements 2. summary of significant accounting policies
eU emissions Trading scheme and renewable obligations certificates Granted CO2 emissions allowances received in a period are initially recognised at nominal value (nil value). Purchased CO2 emissions allowances are initially recognised at cost (purchase price) within intangible assets. A liability is recognised when the level of emissions exceeds the level of allowances granted. The liability is measured at the cost of purchased allowances up to the level of purchased allowances held, and then at the market price of allowances ruling at the balance sheet date, with movements in the liability being recognised in operating profit. Forward contracts for the purchase or sale of CO2 emissions allowances are measured at fair value, with gains and losses arising from changes in fair value recognised in the Income Statement. The intangible asset is surrendered at the end of the compliance period that reflects the consumption of economic benefit. As a result no amortisation is recorded during the period.
Purchased renewable obligation certificates are initially recognised at cost within intangible assets. A liability for the renewables obligation is recognised on the basis of the level of electricity supplied to customers, and is calculated in accordance with percentages set by the UK government and the renewable obligation certificate buyout price for that period. The intangible asset is surrendered at the end of the compliance period that reflects the consumption of economic benefit. As a result no amortisation is recorded during the period.

17The Carbon jigsaw seCTion 2: eMission righTs aCCoUnTing
APPRoAch 3 in A nuTshell
Allowances initially recognized at zero if granted •for free, at cost if purchased
Allowances subsequently measured at cost or •revalued amount
Liability recognised as incurred•
Liability measured as follows:•
For allowances held, at the carrying amount of –those allowances
For any shortfall, at the market value of –allowances required to meet shortfall
oTheR consideRATions
Timing of recognition of allowancesIFRIC 3 implies that emissions allowances are recognised on a year-by-year basis, when issued by the Member State to the entity, ie in February of each compliance year. Although it would seem preferable for allowances to be recognised as assets only when issued, an acceptable alternative would be for the entire period allocation (for example. the entire allocation for Phase I) to be recognised as an asset at the point at which the relevant authority finalises the allocation plan for allowances. This is because an entity knows at this date the total amount of allowances it will receive over the commitment period, and hence its behaviour and decision to purchase or sell allowances will take this into account.
This accounting policy choice introduces further variety into the application of Approaches 1 to 3 above. It is possible to get very different effects in profit or loss depending on which approach is used and whether allowances are recognised year-to-year or in full at the beginning of each phase. It is critical for entities to consider the pattern of their forecast emissions, the timing of any purchases and possible trading in allowances when making their policy choices, and it is advisable for them to project forward the potential impact, in profit or loss, of operational decisions they take in respect of their emissions allowances activity. Modelling the income statement profile under the various options may be beneficial. This fact in itself highlights the potential for manipulation of profit or loss created by the withdrawal of IFRIC 3 and lack of definitive guidance in this area.
forward contracts to purchase or sell allowancesSome contracts to buy or sell non-financial items may fall within the scope of the IFRSs on financial instruments. An emissions allowance is a non-financial item. Such contracts may be required to be accounted for as derivatives unless they can be concluded to be ‘own use’ contracts. In accordance with the applicable Standard, IAS 39 Financial Instruments: Recognition and Measurement, a contract to buy or sell a non-financial item qualifies as ‘own use’, and hence is exempted from derivative accounting, where it is entered into and continues to be held, for the purpose of the receipt of the non-financial item in accordance with the entity’s expected purchase, sale or use requirements (IAS 39.5).
A full analysis of the scope of exemption and the potential implications of accounting for contracts over emission allowances as derivatives under IAS 39 are beyond the scope of this section.

18
Nonetheless, it is important to point out that forward contracts to buy or sell European Emissions Allowances (EUAs) may qualify for treatment as derivatives within the scope of IAS 39, unless they are for the fulfilment of the entity’s own emissions obligations (and thereby qualify for what is known as the ‘own use’ exemption in IAS 39). Companies that use forward contracts more actively to enter into both purchases and sales, so as to optimise economically the ultimate cost of emissions allowances used to meet their obligations, or for purely speculative purposes, will find that the own use exemption cannot be applied. The derivative accounting rules under IAS 39 will require such contracts to be re-measured to fair value through profit and loss, resulting in volatility.
Business combinationsEmissions rights may be purchased as part of a business combination. It will be necessary to allocate a fair value to them as part of the purchase price allocation exercise under IFRS 3 Business Combinations, even if it is the acquirer’s accounting policy to recognise the allowances at cost. In addition, the acquirer and the supplier may have different accounting policies for allowances, hence consolidation adjustments may be required to reflect the acquirer’s accounting policy in the consolidated financial statements of the group.
Trading book versus ‘own use’ bookIFRIC 3 is written from the perspective of a participant in a scheme who has an obligation to the scheme administrator.
It does not consider how a trader/broker should account for allowances. The standard on intangible assets referred to above, IAS 38, does not apply to intangible assets held by an entity for sale in the ordinary course of business but refers to IAS 2 Inventories. IAS 2, in turn, specifies that commodity broker-traders should measure inventories at fair value less costs of selling, with changes recognised in profit or loss in the period of the change.
This exacerbates the debate about accounting for emissions allowances. Many polluters advocate that it should be equally possible for them to revalue their allowances through profit or loss.
A further dilemma may arise where a large utility group not only has carbon-dioxide-emitting installations (ie a generation business) but also a dealer/trade entity. This trading arm may be tasked with securing allowances and forward contracts over allowances at the best price available to ensure the least net cost of compliance for the group. There may be back-to-back contracts to buy/sell allowances between the trader and the generation business. Where the trader ‘net settles’ its forward contracts to buy allowances in the market, by default, there may be a knock-on net settlement of the intra-group contract, with the result that such contracts of the generation business will be accounted for as derivatives at fair value through profit or loss, creating additional volatility.

19The Carbon jigsaw seCTion 2: eMission righTs aCCoUnTing
The direct tax implications of eUas will depend upon the local tax law and the accounting treatment adopted by the company in question. This section discusses the UK corporation tax treatment of eUas accounted for under iFrs.
There is no specific UK tax legislation regarding the direct tax treatment of emission trading schemes and, unlike the tax authorities of a number of other countries in the European Union, the UK tax authorities have not published any formal guidance in this area.
In the absence of specific rules, the tax treatment of EUAs is in many cases likely to follow the accounting treatment, although some exceptions to this exist. In addition, it is possible, depending on the accounting treatment and the particular company’s circumstances, for the EUAs to fall in different parts of the tax UK code. This is considered in more detail below.
inTAngiBle AsseTs
One alternative is that EUAs fall to be treated as intangible fixed assets, not least as some of the alternative accounting treatments reflect EUAs as intangible assets.
Where EUAs are treated as intangible capital items under IFRS accounting (i.e. accounting approaches 1 and 2 above), it should be considered whether they should follow the specific intangible fixed assets regime for taxation purposes (Part 8, Corporation Tax Act 2009).
For an EUA to fall to be treated as an intangible or fixed asset for tax purposes, it must among other things be ‘acquired or created by the company for use on a continuing basis in the course of the company’s activities’. Since in many cases allowances are likely to be acquired and used within relatively short periods, for example 12 to 18 months or less, they may not be considered as being held ‘for use on a continuing basis’, in which case this regime would not apply.
Where the intangibles assets rules do apply, the income and deductions for tax purposes would follow the accounting treatment unless a specific election was made to apply the 4% straight-line treatment.
EUAs certainly have the ‘flavour’ of being a revenue item. For most businesses they are allocated and used on the basis of expected emissions from economic activity, and this would probably be directly linked to the production or operating activities of the enterprise. They are also likely to fail to satisfy the principles of constituting capital assets set out in cases such as Atherton v British Insulated and Helsby Cables Ltd [1925] 10TC155, as they do not represent expenditure incurred ‘with a view to bringing into existence an asset or an advantage for the enduring benefit of a trade’.
DeriVaTiVe ConTraCTs
In certain cases where a business has contracts that are accounted for as derivatives or where the underlying subject matter is a commodity, the relevant contracts could fall to be treated as derivative contracts under Part 7, Corporation Tax Act 2009. Examples of contracts that could fall within these rules are ERPAs (Emissions Reduction Purchase Agreements). The general rule for taxing derivative contracts under UK tax law is to follow the accounting treatment, although each case must be considered on an individual basis and exceptions to this exist.
geneRAl PRinciPles
If the EUAs or specific carbon contracts do not fall to be taxed as intangible fixed assets or derivative contracts, general principles will apply. Unless there is a specific rule to the contrary, the direct tax treatment should follow the accounting treatment and any associated credits or charges to the profit and loss account should be taxable or deductible accordingly.
cuRRenT exPeRience
Some industries such as the oil and gas industry have engaged in discussions with HMRC regarding the tax treatment of EUAs. Although HMRC has released no formal guidance, the overall themes of these discussions are in line with the principles set out above and include treating EUAs as the income and expense of the relevant trade.
TAx TReATmenT
In the absence of specific law and guidance, our taxation commentary for each accounting approach is based on the accounting position and tax law analysis and current practical experience described above. It is possible that HMRC could take a contrary position on review of a company’s annual corporation tax return.
Accounting approach 1Under the cost model (accounting approach 1), a liability in the form of deferred income is recognised in respect of the difference between the amount paid for the allowances and their fair value. This balance is then released to the profit and loss account over the compliance period (whether the intangible asset is held or sold). The credits arising in the profit and loss account as a result of this should be chargeable to tax as part of the trading profits of the company.
A provision for emissions is recognised, resulting in a debit to the profit and loss account. This charge should be tax deductible for tax purposes if it is incurred wholly and exclusively for the purposes of trade and is calculated on a specific basis.
direct tax treatment of transactions in emissions allowances

20
Accounting approach 2Accounting approach 2 will follow accounting approach 1 up to the point of the recognition of a provision for emissions. The tax treatment will follow as above accordingly.
Under the revaluation model of approach 2, a provision for emissions is recognised only where there is a shortfall in allowances to meet emissions obligations. This charge should be tax deductible, providing, as in accounting approach 1, it is incurred wholly and exclusively for the purposes of the trade and is specifically calculated.
Accounting approach 3Under accounting approach 3, a liability for emission allowances should be recognised only when there is a shortfall in allowances to meet emissions obligations. This charge should be tax deductible, providing it is incurred wholly and exclusively for the purposes of the trade and is specifically calculated.
issue of allowancesIn the main, the treatment for tax purposes of grants from UK government departments follows the accounting treatment under general principles. In some circumstances grant payments may be considered as chargeable to tax on receipt, eg Industrial Development Grants under Part 3, Corporation Tax Act 2009, but there does not appear to be any basis for EUAs issued to be taxable on receipt rather than following the profit and loss accounting treatment.
Purchasing allowancesTo the extent that allowances are purchased from UK government auctions or third parties, such transactions should be treated as a revenue expense. Consequently, companies purchasing allowances should receive tax relief on costs incurred as part of the purchase, providing they are incurred wholly and exclusively for the purposes of the trade.
Where a provision has been made for the purchase of allowances, the tax relief should follow the accounting treatment and a deduction should be taken when the provision is made and adjusted when the purchase takes place.
sale of allowancesAny profit or loss generated on the sale of allowances should be taxable or tax deductible under Schedule D Case I, providing any losses are incurred wholly and exclusively for the purposes of trade.
PenaltiesCurrently the penalties are €100 per tonne, so given that the market price of EUAs has in recent times been significantly lower than this level, the tax treatment of the penalties is likely for most to be a theoretical discussion, as it has been cheaper to buy in the market rather than incur the penalty.
If a company does, however, fail to surrender sufficient allowances to cover the emissions generated, it will be
subject to penalties. For UK tax purposes, punitive penalties received by a company in respect of non-compliance are generally not deductible for direct tax purposes. It is worth noting that this position is not consistent between EU Member States. Accordingly, companies may find the effective costs of paying penalties to be different in various countries, depending on whether these countries currently allow a direct tax deduction for penalties arising from the EU ETS.
Companies should be aware that although HMRC has historically resisted deductions for civil penalties incurred as part of a business’s trade, mainly on the ground of public policy (ie if the state levies a fine then the state should not subsidise it through a reduction of the tax liability) and on the basis of Sheppard v McKnight, this is not without challenge.
discussion
It is possible that a net tax charge could arise under accounting approaches 1 and 2 if a company holds more allowances than required, assuming those allowances are issued free of charge or at less than market value. This scenario will result in an excess of deferred income being released to the profit and loss account in the period compared with the charges made to the profit and loss account in respect of the emissions made. Accordingly, if a company expects to use fewer allowances than it has been allocated, it may be an advantage to adopt accounting approach 3, which does not require the recognition of deferred income and should result in a nil tax charge.
If an entity has a shortfall in allowances, under accounting approaches 1, 2 and 3 a liability should be set up for the value of the additional allowances required, with the P&L element being deductible as outlined above. This may result in a net tax deduction for emissions allowances if a greater number of allowances than are issued by the government are required.
Companies will be receiving a tax benefit in respect of the allowance expenses associated with greater emissions and a tax charge in respect of holding excess allowances. Therefore, the effective cost to a company of purchasing allowances from auctions or third parties will be net of tax. This will be more relevant as Phase III of the EU ETS is entered, when all allowances will be auctioned.
sTAmP duTy
The rules for imposition of a stamp duty and other transfer taxes differ between jurisdictions. Therefore, any potential liability will depend on the initial country where the allowance is issued and the countries where the trade is deemed to take place, as well as the form of the transfer.
The UK government does not currently levy stamp duty (or SDRT or SDLT) on the allocation, auction and transfer of permits in the UK.

21The Carbon jigsaw seCTion 2: eMission righTs aCCoUnTing
The VaT treatment of transactions in emissions allowances is not straightforward and depends on the details of the transaction in question. There are a number of special rules and scenarios that may give rise to a non-standard VaT result. some of the main issues to consider are outlined below; however, it is important to consider the facts of each case and the rules in the relevant jurisdictions.
geneRAl Rules wiThin The euRoPeAn union
Some consensus has been reached within the EU on the VAT treatment of trades of EUAs, but there are still differences in the VAT rules between Member States.
In general, the consensus within the EU is that the transfer of EUAs is the supply of a service for VAT purposes. The exact treatment will usually depend upon the location of the counterparties, as the following examples illustrate.
A trade involving the provision of EUAs between two •counterparties in the same country is generally subject to local VAT at the standard rate. Note, however, that special rules may apply, depending on the VAT treatment of trades on the relevant exchange (if applicable) and whether the country in question has implemented simplification measures (see below). These can override the usual VAT rules and create a different VAT result. For example, certain trades on exchanges in the UK are zero-rated under the Terminal Markets Order (TMO), even where both counterparties are established in the UK. Another possibility is that if the trade does not lead to the physical delivery of an allowance then it may be treated as an exempt financial service (please see below).
The supply of EUAs between counterparties in different •Member States is usually liable to VAT in the country where the recipient is established, provided that the recipient is ‘in business’ for VAT purposes. For most traders, this will mean there is no need to charge VAT on cross-border supplies within the EU, as VAT will be self-assessed by the counterparty purchasing the allowance, under the reverse-charge mechanism. Again there are exceptions: for example, if the recipient counterparty is a fund then it may not be able to demonstrate it is ‘in business’ for VAT purposes and VAT may be chargeable in the supplier’s country. There are also complications caused by the ‘force of attraction’ rules – please see below.
The supply of EUAs by an EU-based supplier to a •non-EU recipient should not attract VAT (subject to the ‘use and enjoyment’ provisions discussed below). If an EU business purchases EUAs from a counterparty outside the EU then it will usually need to account for VAT in its Member State under the reverse-charge mechanism. It may also incur VAT in the country of the supplier.
vARiATions To These Rules
There are various country-by-country exceptions to the rules set out above.
(i) simplification measuresSome countries have adopted measures to simplify VAT accounting on trades of EUAs (and similar allowances). In particular, these are aimed at eliminating the need for the seller of an allowance to charge VAT to a purchaser in the same country. Such measures are intended to prevent VAT fraud whereby a seller collects VAT from a purchaser and disappears without paying it to the tax authorities. The exact nature of the simplification measure varies by country: as mentioned above, the UK already zero-rates certain trades under the TMO, France has introduced a VAT exemption for certain trades of EUAs and the Netherlands has recently brought in optional reverse-charge provisions (whereby purchasers self-assess VAT on domestic transactions). Traders in emissions allowances should check the rules on a country-by-country basis, as this is a rapidly changing area. There is a risk that the recovery of VAT on the purchase of allowances could be blocked if there is VAT fraud in the supply chain. Therefore, businesses are strongly advised to implement robust checks over new and existing counterparts.
(ii) financial suppliesIn the UK, if a trade is not capable of leading to an actual transfer of an allowance to the recipient then the trade may be classified as a financial service for VAT purposes. This means that, depending on the location of the counterparties, it is potentially exempt from VAT. Although no VAT would need to be charged on the trade, the counterparty making the supply may suffer a disallowance of VAT on its costs. Many EU Member States apply similar rules; however, some countries exempt trades that do not actually lead to delivery, with the result that more transactions are potentially exempt.
(iii) force of attraction rulesCertain EU countries have special ‘force of attraction’ rules that apply when suppliers of the allowance have a branch in the recipient’s country. In this case, the supplier’s branch is deemed to have made the supply and local VAT is likely to be due, even if that branch had nothing to do with the trade. Where counterparties have a branch structure they are advised to seek further advice on these special VAT rules.
(iv) non-eu counterpartiesCounterparties established in countries outside the EU will need to follow the local VAT rules in those countries (assuming those countries have a VAT regime). These rules may be different from the general principles established in the EU. It is possible that non-EU counterparties will be required to charge local VAT (or an equivalent tax) on the trades. If the purchasing counterparty is unable to recover the VAT then it could be an additional cost of the trade and could significantly reduce or even eliminate the expected margin.
indirect tax treatment of transactions in emissions allowances

22
Sales of EUAs by EU businesses to non-EU counterparties will generally not be liable to VAT in the EU. Nonetheless, given that EUAs are intended for use in the EU, some Member States may invoke ‘use and enjoyment’ provisions. This would require businesses established in that Member State to account for local VAT on sales to non-EU counterparties. Depending on the reciprocal arrangements between the countries in question, the non-EU counterparty may not be able to recover the EU VAT incurred on the trade. It is a good idea to check the position on a country-by-country basis to see if these rules apply.
(v) initial issue of emissions allowancesThe initial issue of allowances free of charge by national authorities in the UK will usually be outside the scope of VAT. This is because there is no consideration paid for the allowance. In addition, the national authorities may not be acting in a business capacity when they issue the allowance.
ec sAles lisTs
From 1 January 2010 businesses established in the EU that make supplies of services to businesses in other Member States will need to record these on European Sales Lists. These are returns that are collated for statistical purposes and have historically been used only to record intra-EU sales of goods. It seems likely that intra-EU cross-border emissions trades will need to be recorded in such submissions, although no official clarification has been issued. This creates a new reporting requirement for many businesses. In the UK, EC Sales Lists cover calendar quarters and will need to be submitted four weeks after the quarter end, from 1 January 2010.
TRAdes of oTheR AllowAnces And ceRTificATes
It is difficult to generalise about the VAT treatment of allowances other than EUAs. The UK tax authorities have issued guidance confirming that the VAT rules that apply to EUAs also apply to other allowances, such as Certified Emission Reductions (CERs), and to green certificates such as Renewables Obligation Certificates (ROCs). Other countries take a different approach, however, and green certificates, in particular, are treated differently in different EU Member States.
It is certainly not possible to generalise about the VAT treatment of Verified Emission Reductions (VERs) owing to the lack of standardisation in the market. In some cases the purchase of VERs may not be liable to VAT, on the basis that they are similar to ‘charitable donations’; in other cases they are liable to VAT because the business receives some benefit or service in return for the payment.
fuTuRe develoPmenTs
In September 2005, following the withdrawal of IFRIC 3, the IASB added emission rights to its own project agenda acknowledging that, since developing a new approach would ‘require the amendment of one or more standards, it would be more appropriate and efficient for the Board to reconsider the accounting for cap and trade emission right schemes itself, rather than ask the IFRIC to continue its work on developing amendments to the relevant Standards’. In the light of requests from several national standard-setters to address the topic, and the fact that the Financial Accounting Standards Board (FASB) of the United States had added an Emissions Allowances project to its agenda, this topic has now become a joint project of the IASB and FASB. In the IASB’s most recent projected timetable,11 the IASB planned an exposure draft in the fourth quarter of 2009 with issue of an IFRS in 2010. As part of its project summary (last updated in November 2008) the IASB notes that it will also address the accounting of activities that an entity undertakes in contemplation of receiving tradable rights in future periods, eg certified emissions reductions (CERs).
At the date of writing (July 2009) the two Boards had discussed the accounting for emissions trading schemes only once, at their joint meeting in October 2008. This discussion was educational and no decisions were made. There has been no further debate on the topic. It appears that discussions on the financial crisis have trumped other subject matters on the IASB’s agenda and it may be the case that the emissions rights project will be delayed as a consequence. The IASB’s project summary update of November 2008 (available at www.iasb.org.uk) acknowledges the ‘increasing international use of emissions trading schemes and the considerable diversity in practice that appears to have arisen in the absence of authoritative guidance’, as is reflected in our summary of existing accounting practices above.
Nonetheless, the effect on financial reporting of emission-reducing initiatives appears to be here to stay. On 5 June 2009, DEFRA, the UK’s Department for Environment, Food and Rural Affairs, published its Consultation on Draft Guidance on How to Measure and Report your Greenhouse Gas Emissions.12 The Climate Change Act 2008 (CCA 2008) requires the UK government to publish this guidance in final form (taking into account responses to the June consultation paper) by 1 October 2009.
11. As as 1 July 2009.
12. Responses are due by 5 August 2009.
23The Carbon jigsaw seCTion 2: eMission righTs aCCoUnTing
A key provision in the Act is consideration of whether carbon footprint disclosures should be mandatory in annual reports for all UK companies. (They are currently voluntary and often included in the Corporate and Social Responsibility section of the front half of the financial statements as part of management’s commentary on the performance of the business).
This step would affect thousands of companies, not solely greenhouse-gas-emitting entities. It is DEFRA’s view that ‘measuring emissions (and disclosure) will…help organisations to understand their own climate change impacts and risks, as well as help them to achieve cost savings and improve resource efficiency’ (paragraph 1.5 of the Consultation), ie it will contribute to a reduction of emissions. The Act requires the UK government either to mandate carbon footprint reporting or explain to Parliament why it has not done so, by 6 April 2012.
It remains to be seen how effective Phase II of the EU ETS will prove to be. Experience from Phase I appears to show, on the basis of emissions to date, that the European market in emissions allowances is long, that is, there is a surplus of allowances. This highlights the key driver of the environmental benefits of any cap-and-trade scheme, which is the level of the cap.13
The UK government’s Climate Change Bill sets targets to reduce CO2 emissions by at least 26%–32% by 2020 – approximately equivalent to reducing greenhouse gases from the whole economy by 32%–37% , which goes beyond the EU’s proposals for 2020 (a 20% reduction in EU GHG emissions by 2020 from 1990 levels, increasing to 30% when there is an international climate agreement, as in the proposals referred to below).
On 23 January 2008, the European Commission published its draft proposals for the review of the EU ETS required under Article 30 of the EU Directive on the EU ETS. The role of the review is to develop the EU ETS in a positive way after 2012 and learn from experiences so far. Once agreed by the European Council and European Parliament, the changes will need to be transposed into UK law. DEFRA currently expects this to happen in 2010.
In summary, the UK, like the rest of Europe, is currently reviewing all its initiatives for meeting its emissions’ reductions targets. It is clear there will be increasing pressure on financial reporting to reflect how, and the extent to which, entities are exposed to costs of compliance in respect of climate change and greenhouse-gas-reducing initiatives.
13. See DEFRA’s report Appraisal of Years 1–4 of the UK Emissions Trading Scheme A Report by ENVIROS Consulting Limited December 2006 for more detail.
There is also evidence of a global swell of pressure to increase and standardise international guidance in this area. At the World Business Summit on Climate Change in Copenhagen in May 2009, the Climate Disclosure Standards Board (CDSB) issued an Exposure Draft of its framework for the inclusion of climate change data in mainstream reports.14 The market for climate change information and emissions-reducing projects is growing. The consequences for accounting and financial reporting cannot be underestimated.
14. The Climate Disclosure Standards Board (CDSB) was formed at the 2007 annual meeting of the World Economic Forum in Davos, Switzerland. The Board Members of CDSB are the Carbon Disclosure Project, CERES, the Climate Group, the Climate Registry, the International Emissions Trading Association, the World Economic Forum, the World Resources Institute.

24
fAcTs
Company A is a participant in a cap-and-trade scheme in which allowances are traded in an active market, as defined in IAS 38 Intangible Assets. The scheme operates for annual compliance periods that coincide with Company A’s reporting periods. On the first day of the first period, Company A is issued, free of charge, allowances for the year to emit 12,000 tonnes of carbon dioxide. The market price of the allowances on that day is CU10 per tonne, giving a fair value of CU120,000.15
After six months (by its interim reporting date), Company A has emitted 5,500 tonnes of carbon dioxide. It expects its emissions for the whole year to be 12,000 tonnes (ie equal to the allowances issued to it). The market price for allowances has risen to CU12 per tonne.
At the year-end, Company A measures its emissions for the year at 12,500 tonnes. On the last day of the year, it buys 500 allowances to cover the emissions in excess of the allowances it holds. At the year-end, the market price of allowances (which Company A pays for the extra 500 allowances) is CU11 per tonne.
Company A does not produce emissions in the course of making inventories (or other assets). Therefore the cost of producing emissions is recognised as an expense in profit or loss.
15. In this example, monetary amounts are denominated in currency units (CU).
AccounTing undeR The cosT model in iAs 38
accounting entries on the first day of the year
Company A makes the following accounting entry to record receiving the allowances free of charge:
Dr allowances (an intangible asset) CU120,000
Cr government grant (deferred income) CU120,000
To recognise the allowances at their fair value (12,000 tonnes at CU10 per tonne).
at the end of the first six months
Company A makes the following accounting entries in respect of the first six months of the year:
Dr government grant (deferred income) CU55,000
Cr income CU55,000
To recognise as income the portion of the government grant that offsets the cost of emissions in the period.16
Dr emissions expense CU66,000
Cr liability to deliver allowances CU66,000
To recognise the increase in the liability for emissions to date (5,500 tonnes measured at CU12 per tonne).
at the end of the year
Company A makes the following accounting entries in respect of the last six months of the year:
Dr government grant (deferred income) CU65,000
Cr income CU65,000
To recognise as income the remaining portion of the government grant.
Dr emissions expense CU71,500
16. In this example, Company A has chosen to amortise the deferred income using the proportion of actual emissions to estimated total emissions.
Appendix: illustrative example

25The Carbon jigsaw seCTion 2: eMission righTs aCCoUnTing
Cr liability to deliver allowances CU71,500
To recognise the increase in the liability for emissions to date (12,500 tonnes measured at CU11 per tonne, less the CU66,000 recognised at the interim reporting date).
Dr allowances (an intangible asset) CU5,500
Cr cash CU5,500
To recognise the purchase of an additional 500 tonnes of allowances at CU11 per tonne.
Company A will therefore report as follows:
income/expense recognised in profit or loss
First half second half Full year
CU CU CU
Government grant
55,000 65,000 120,000
Emissions expense
(66,000) (71,500) (137,500)
(11,000) (6,500) (17,500)
balance sheet
Date of allocation
interim date Year-end
CU CU CU
Assets
Allowances 120,000 120,000 125,500
Cash – – (5,500)
120,000 120,000 120,000
Liabilities
Liability to deliver allowances
– 66,000 137,500
Government grant
120,000 65,000 –
120,000 131,000 137,500
Equity – (11,000) (17,500)
accounting entries on settling the obligation
Company A continues to account for the allowances at cost less impairment and to re-measure its liability to deliver allowances until it makes the following accounting entries, when it settles the liability for emissions made in the year:
Dr liability to deliver allowances CU137,500
Cr allowances CU125,500
Cr profit or loss CU12,000
To recognise the settlement of the obligation.

26
at the end of the year
Company A makes the following accounting entries in respect of the last six months of the year:
Dr equity (revaluation surplus) CU12,000
Cr allowances (an intangible asset) CU12,000
To recognise the decrease in the fair value of the allowances held (12,000 tonnes whose price has decreased from CU12 to CU11 per tonne).
Dr government grant (deferred income) CU65,000
Cr income CU65,000
To recognise as income the remaining portion of the government grant.
Dr emissions expense CU71,500
Cr liability to deliver allowances CU71,500
To recognise the increase in the liability for emissions to date (12,500 tonnes measured at CU11 per tonne, less the CU66,000 recognised at the interim reporting date).
Dr allowances (an intangible asset) CU5,500
Cr cash CU5,500
To recognise the purchase of an additional 500 tonnes of allowances at CU11 per tonne.
Company A will therefore report as follows:
AccounTing undeR The RevAluATion model in iAs 38
In this example, the allowances are traded in an active market, as defined in IAS 38. Therefore, Company A can choose to use the revaluation model in IAS 38 to account for the allowances.
accounting entries on the first day of the year
Company A makes the following accounting entry to record receiving the allowances free of charge:
Dr allowances (an intangible asset) CU120,000
Cr government grant (deferred income) CU120,000
To recognise the allowances at their fair value (12,000 tonnes at CU10 per tonne).
at the end of the first six months
Company A makes the following accounting entries in respect of the first six months of the year:
Dr allowances (an intangible asset) CU24,000
Cr equity (revaluation surplus) CU24,000
To recognise the increase in the fair value of the allowances held (12,000 tonnes whose price has increased from CU10 to CU12 per tonne).
Dr government grant (deferred income) CU55,000
Cr income CU55,000
To recognise as income the portion of the government grant that offsets the cost of emissions in the period.
Dr emissions expense CU66,000
Cr liability to deliver allowances CU66,000
To recognise the increase in the liability for emissions to date (5,500 tonnes measured at CU12 per tonne).

27The Carbon jigsaw seCTion 2: eMission righTs aCCoUnTing
income/expense recognised in profit or loss
First half second half Full year
CU CU CU
Government grant
55,000 65,000 120,000
Emissions expense
(66,000) (71,500) (137,500)
(11,000) (6,500) (17,500)
Income/expense recognised directly in equity
24,000 (12,000) 12,000
Revaluation of allowances
balance sheet
Date of allocation
interim date Year-end
CU CU CU
Assets
Allowances 120,000 144,000 137,500
Cash – – (5,500)
120,000 144,000 132,000
Liabilities
Liability to deliver allowances
– 66,000 137,500
Government grant
120,000 65,000 –
120,000 131,000 137,500
Equity – (13,000) (5,500)
accounting entries on settling the obligation
Company A continues to re-measure the allowances and its liability to deliver allowances until it makes the following accounting entries, when it settles the liability for emissions made in the year:
Dr liability to deliver allowances CU137,500
Cr allowances CU137,500
To recognise the settlement of the obligation.
Company A may transfer its revaluation surplus of CU12,000 directly to retained earnings in accordance with paragraph 87 of IAS 38.

28

29The Carbon jigsaw
secTion 3:
carbon reporting and assurance
‘Carbon Reporting and Assurance’ was prepared for The Carbon Jigsaw by KPMG. © KPMG, 2009

30
kPmg’s cARBon seRvices: An inTRoducTion foR cARBon JigsAw
Climate change is forcing companies of all sizes to re-think the way they do business. Making the transition to low-carbon operations is far from straight forward.
KPMG’s Carbon Advisory Group has been brought together to help organisations make sense of and respond to the economic challenges of climate change.
Carbon is a broad topic that impacts a wide range of business issues. KPMG has the breadth and depth of skill to advise on a comprehensive suite of solutions which we tailor to our clients requirements. By combining skills from across the Audit, Tax and Advisory practices we are able to offer truly multi-disciplinary climate change support to our clients.
We have expertise in carbon measurement and reduction strategies, environmental taxes, sustainable IT, accounting policies for carbon, M&A in the renewable energy sector, carbon offsetting, adapting to policies such as the Carbon Reduction Commitment and many more carbon related topics. We pride ourselves in being able to give our solutions a commercial focus as well as realising environmental benefits.

31The Carbon jigsaw seCTion 3: Carbon rePorTing anD assUranCe
introduction
In the absence of a global agreement on climate change, mandatory and harmonised reporting under international standards is a long way off. So with a plethora of reporting standards covering different emission scopes, company and geographic boundaries, preparing to report emission data for the first time can be challenging but can also deliver many business benefits.
The pressure on companies to disclose greenhouse gas emissions data has never been so great and will continue to grow significantly over the next few years. The drivers for such reporting come from a variety of sources.
Increasingly, organisations are disclosing information in relation to their carbon performance. Driven by increasing regulation and wider stakeholder expectations, mandatory and voluntary reporting activities are under way in both the public and private sector.
As a minimum, disclosure may be that of greenhouse gas emissions1 but increasingly organisations are providing more qualitative information about climate risks and opportunities from both a mitigation and adaptation perspective as they review their business models for the impacts of climate change.
1.The definition of greenhouse gases can vary but often includes carbon dioxide (CO2), methane (CH4) and nitrous oxide (N2O) together with families of gases including hydro fluorocarbons (HFCs) and perflouorcarbons (PFCs). Each of these gases can be converted to a CO2 equivalent (CO2e) and total emissions are commonly communicated as g/kg/tonnes CO2e or just CO2 depending on the magnitude of emissions and the contribution of other non-CO2 gases

32
Regulatory drivers
counTRy cAse sTudies: uk And us
It is not the intention of this chapter to provide an exhaustive list of greenhouse gas (GHG) emissions reporting drivers country by country. Below are two tables giving some examples of schemes operating in the UK and US.
example legislation affecting uk organisationsThe UK’s leadership on carbon reduction (a legally binding commitment of a 34% reduction by 2020) will place additional monitoring and disclosure requirements on government (via carbon budgets) and business. See Table 1.
example legislation affecting us businessSee Table 2.
In addition to this legislation there are many voluntary schemes such as the California Climate Action Registry.5 Even if a company is not currently subject to mandatory emissions reporting, the regulatory environment is expanding and evermore entities will be required to report in the future. It is advisable for companies to start the process of understanding and reporting their carbon footprint now in order to be prepared for the future.
5. A programme of the California Registry, which tracks and registers voluntary projects that reduce emissions of GHGs http://www.climateregistry.org/
TRends
Now that voluntary efforts have tested the water, there is a trend towards setting more mandatory disclosure requirements. Current policy in the making under the UK Climate Change Act and the EPA’s 2 proposed Mandatory Greenhouse Gas Reporting scheme suggests that this trend will continue.
The number of companies that will be required to report is increasing; for example, the Carbon Reduction Commitment3 (CRC) in the UK now includes the non-energy-intensive sector.
The current disparate patchwork of national and regional regulation is likely to get more complex before simplifying. It is to be hoped that international climate negotiations taking place in December 2009 in Copenhagen4 will make some progress towards this but it is not likely to be achieved in the short term.
2. United States Environmental Protection Agency http://www.epa.gov/
3. http://www.defra.gov.uk/environment/climatechange/uk/business/crc/index.htm
4. http://en.cop15.dk/
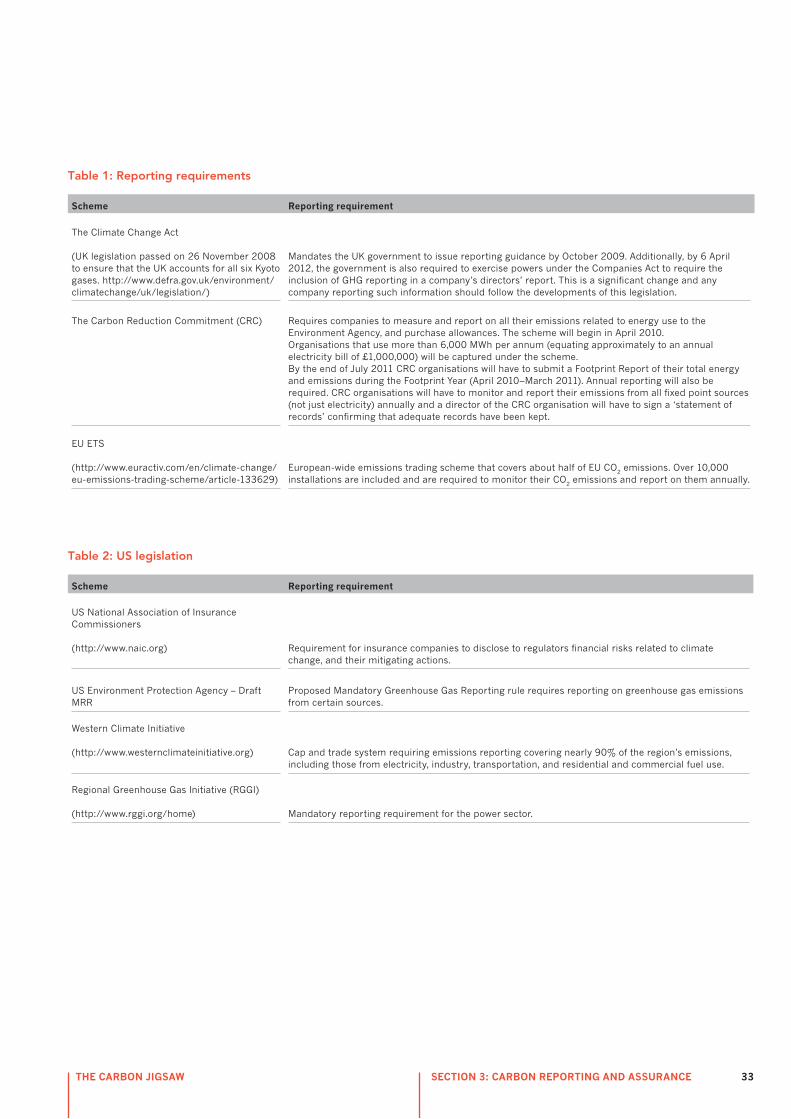
33The Carbon jigsaw seCTion 3: Carbon rePorTing anD assUranCe
Table 1: Reporting requirements
scheme reporting requirement
The Climate Change Act
(UK legislation passed on 26 November 2008 to ensure that the UK accounts for all six Kyoto gases. http://www.defra.gov.uk/environment/climatechange/uk/legislation/)
Mandates the UK government to issue reporting guidance by October 2009. Additionally, by 6 April 2012, the government is also required to exercise powers under the Companies Act to require the inclusion of GHG reporting in a company’s directors’ report. This is a significant change and any company reporting such information should follow the developments of this legislation.
The Carbon Reduction Commitment (CRC)
Requires companies to measure and report on all their emissions related to energy use to the Environment Agency, and purchase allowances. The scheme will begin in April 2010. Organisations that use more than 6,000 MWh per annum (equating approximately to an annual electricity bill of £1,000,000) will be captured under the scheme. By the end of July 2011 CRC organisations will have to submit a Footprint Report of their total energy and emissions during the Footprint Year (April 2010–March 2011). Annual reporting will also be required. CRC organisations will have to monitor and report their emissions from all fixed point sources (not just electricity) annually and a director of the CRC organisation will have to sign a ‘statement of records’ confirming that adequate records have been kept.
EU ETS
(http://www.euractiv.com/en/climate-change/eu-emissions-trading-scheme/article-133629)
European-wide emissions trading scheme that covers about half of EU CO2 emissions. Over 10,000 installations are included and are required to monitor their CO2 emissions and report on them annually.
Table 2: us legislation
scheme reporting requirement
US National Association of Insurance Commissioners
(http://www.naic.org) Requirement for insurance companies to disclose to regulators financial risks related to climate change, and their mitigating actions.
US Environment Protection Agency – Draft MRR
Proposed Mandatory Greenhouse Gas Reporting rule requires reporting on greenhouse gas emissions from certain sources.
Western Climate Initiative
(http://www.westernclimateinitiative.org) Cap and trade system requiring emissions reporting covering nearly 90% of the region’s emissions, including those from electricity, industry, transportation, and residential and commercial fuel use.
Regional Greenhouse Gas Initiative (RGGI)
(http://www.rggi.org/home) Mandatory reporting requirement for the power sector.

34
other drivers
summARy of BenefiTs
Energy savings – studies have shown that •measurement in itself induces lower energy use.
Improved performance – an adequate measurement •framework with forecasts allows performance to be managed effectively against the targets set.
Increased product awareness – measurement provides •a new source of customer information and market intelligence to allow informed decision making.
Improved relationships – increased dialogue, common •goals, and better understanding of expectations lead to stronger relationships with customers and suppliers.
Regulatory compliance – reliable measurement and •reporting are essential elements of ensuring compliance and avoidance of penalties under frameworks such as the EU Emissions Trading Scheme.
Informed investment planning – understanding an •organisation’s carbon impact will help to support commercial decisions in areas such as energy-related capital expenditure, emissions trading and investment in carbon reduction projects
The fuTuRe of disclosuRe
The measurement and reporting landscape over the next five to ten years is likely to be broad and dynamic and to involve a number of stakeholders and potentially competing initiatives. International harmonisation will be challenging because of uncertainty in the international climate change framework, and the emergence of a plethora of options with different scopes, coverage and associated bespoke methodologies.
Work is, however, underway to create more widely recognised standards. For example, the Climate Disclosure Standards Board (CDSB)7 is working to develop a globally accepted framework for corporate reporting on climate change. The CDSB was set up in response to increasing demands for standardised reporting guidelines on the inclusion of climate change information in mainstream reports. The guidelines will be contained in the CDSB framework, a draft of which is currently subject to consultation.
Investors are increasingly aware of the risks to business from climate change. This will put pressure on climate change reporting in the future to include more disclosure on physical, strategic and regulatory risks as well as GHG emissions data.
Extension of measurement activity into supply chains is also more likely. Organisations typically have a direct influence on less than 10% of the life cycle of their products. Engaging with suppliers and measuring the carbon footprints of products present new opportunities to influence the remaining 90%.
7. http://www.cdsb-global.org/
decision mAking And sTRATegic guidAnce
An understanding of a company’s carbon footprint helps identify the most cost-effective way to reduce emissions. Energy inefficiencies can be detected and better investment decisions can be made when considering energy-intensive capital expenditure.
invesToR PRessuRe
More investors are attaching a value premium to companies that incorporate climate change into their corporate strategies. Disclosure of corporate climate change information is being encouraged by the investor community to support better investor analysis and enhanced efficiency of capital allocation. For example, the Carbon Disclosure Project6 (CDP) works with shareholders and companies to disclose the GHG emissions and climate change risks of major companies. Hundreds of institutional investors, with over $50 trillion under management, have signed up. This pressure has led over 3000 of the world’s largest companies to publish emissions data by answering the CDP survey, which is then posted online for any stakeholder to view.
suPPly chAin PRessuRe
The majority of GHG emissions associated with a company’s product or service are often not directly controlled by the company but originate in the supply chain. The CDP Supply Chain project facilitates such disclosures. Companies that want to control emissions across their supply chain are starting to request information from suppliers. Companies unable to supply such data risk losing contracts to competitors that can.
consumeR PRessuRe
Competitive advantage can be gained by attracting green consumers who may be willing to pay a premium for environmentally friendly products particularly those that save energy and cost over their lifetime use. Robust climate change strategies are excellent marketing tools but the consumer is rightly becoming more discerning and mere rhetoric or ‘green-washing’ can lead to reputational damage if found to be lacking in substance. The burden of proof lies with the company, and having emissions reporting and product claims externally assured is a reliable way of demonstrating that the commitment is genuine. The same marketing can also lead to competitive advantage in the jobs market, particularly within an increasingly well-informed graduate employment market.
6. http://www.cdproject.net/

35The Carbon jigsaw seCTion 3: Carbon rePorTing anD assUranCe
how to measure and report
define what you are measuring and choose a standardCompanies can measure their performance on three different levels.
1. At company level: the challenge of measuring a company’s footprint begins with choosing the right reporting standard. It is important to use a recognised methodology, to ensure credibility. The most commonly used standards for voluntary reporting are the GHG Protocol8 and the ISO 14064.9
The GHG protocol frames the problem of measuring emissions by dividing them into three scopes covering direct emissions, indirect emissions and emissions outside a company’s direct ownership and control.
ISO 14064 (Parts 1, 2 & 3) is a family of three standards that specify principles and requirements for quantification and reporting of greenhouse gas (GHG) emissions and removals at the organisational level (Part 1), the project level (Part 2) and a standard for validation (Part 3).
Its companion standard, ISO 14065, details requirements for GHG validation or verification bodies for use in accreditation or other forms of recognition.
Most other guidance uses the GHG protocol and ISO 14064 as a foundation.
2. Specific reduction/efficiency projects typically include the following types.
Regulated projects: these are projects that qualify for credits for reducing GHG emissions (eg Clean Development Mechanism10).
Voluntary projects: these are aimed at delivering tradable carbon credits for the voluntary market. They are normally used by companies to offset their emissions. There are a range of offsetting standards that can be applied to offsets, such as the Gold Standard11 and the Voluntary Carbon Standard.12
8. An international accounting tool for government and business leaders to understand, quantify, and manage greenhouse gas emissions, the Greenhouse Gas Protocol (GHG Protocol) was jointly agreed in 1998 by the World Business Council for Sustainable Development (WBCSD) and the World Resources Institute (WRI). http://www.ghgprotocol.org/
9. ISO 14064 is an international standard that provides a framework enabling organisations to quantify and report on greenhouse gas emissions and removals. http://www.iso.org/iso/iso_catalogue/catalogue_tc/catalogue_detail.htm?csnumber=29516
10. An arrangement under the Kyoto Protocol allowing industrialised countries to invest in projects that reduce emissions in developing countries http://cdm.unfccc.int/about/index.html
11. http://www.cdmgoldstandard.org/
12. http://www.v-c-s.org/
Faced with a multitude of possible reporting approaches and lack of consistency across sectors, many organisations are unclear about the scope and measurement methodology to adopt and the relative merits of different methods.
Most companies are measuring their own ‘direct’ footprint. Difficulties arise when they start looking outside their own operations into their supply chains and the carbon footprint of products and services.
This simple four-stage process is designed to help companies plan an effective way to measure their footprint, reduce their emissions and report on their performance. In practice, the process is often an iterative process, with lessons learned from implementation feeding back into the original strategy.
Here we take you through the process, step-by-step.
sTeP 1: sTraTegY
Measurement and reporting are a vital part of a company’s overall carbon strategy. Therefore before starting a measurement exercise it is important to consider the overall objectives and drivers, to ensure that the exercise will cover the relevant areas.
outline your carbon reporting objectivesThese objectives should address the following questions.
What would be an appropriate baseline and what type •of targets do you want to set (eg absolute or relative)?
Does your reporting system allow you to track progress •against targets?
Should you, and are you able to, account for emissions •beyond your direct control?
What level of reporting do stakeholders expect of your •business?
Once measured, the carbon footprint should feed back into strategy to help define specific targets and future action.

36
Demonstrating action on climate change: companies are starting to report their own contribution to long-term sustainable emissions reductions.
In order for projects to be credible they should deliver long-term sustainable reductions that would not occur in a ‘business-as-usual’ scenario.
3. At product/service level there is most confusion around consistency and accuracy of approach. Measuring emissions from a product or service requires information from the entire life cycle – right back to the extraction of raw materials and right up to final disposal.
Requesting emissions information from suppliers and service providers can prove difficult as they may regard such data as sensitive, or they may not collect relevant information. Currently there are no established standards to measure product or service emissions. In the UK a standard, PAS 2050,13 for assessing the life cycle greenhouse gas emissions of goods and services has been developed by the British Standards Institute and the Carbon Trust, and this is gaining popularity as an approach to footprinting specific products.
13. http://www.bsigroup.com/en/Standards-and-Publications/Industry-Sectors/Energy/PAS-2050/
sTeP 2: defining BoundARies And souRces
set the organisational boundariesEach organisation must clearly define its reporting boundaries. There are a number of accepted ways to do this. Organisational boundaries define how a company will account for its own operations and those entities in which it has a stake. The GHG Protocol provides two approaches – equity-based or control-based responsibility for jointly owned facilities.14
In deciding on the appropriate approach, the main objective should be to cover the material impacts of the business. If significant areas outside the control of the company are identified, the goal should be to widen the reporting scope over time to include these areas.
develop an inventory of emissions – including all six greenhouse gasesMost standards advocate a tiered approach to developing an inventory of emissions – starting with a company’s own direct footprint and moving through to its extended footprint covering upstream and downstream activities.
Scope 1 covers direct emissions from your organisation. To determine the emissions under your control (eg fuel consumption for heat, power or company cars), information is required from various parts of the business, including, for example, facilities/estates management, procurement and travel management. It is necessary to win the support of all these departments to ensure that data are collected in an accurate and timely way.
Scope 2 covers emissions from the generation of purchased energy. These should be reported separately to avoid double counting. Remember that these emissions will be accounted for by the electricity generators themselves, as their own direct emissions.
Scope 3 covers third-party emissions created as a result of your activities. This is an optional reporting category, but it allows a company to report on all other emissions that it has an indirect hand in creating, such as employee commuting, business flights, and even upstream and downstream emissions. Companies should report on these when they are significant in comparison with their direct emissions.
14. http://www.ghgprotocol.org/standards/corporate-standard

37The Carbon jigsaw seCTion 3: Carbon rePorTing anD assUranCe
sTeP 3: dATA collecTion
Develop internal procedures and guidance for the departments that will need to provide data.
This process should include:
establishing data requirements – including format, •frequency, materiality, accuracy, and treatment of anomalies
establishing quality control/ monitoring procedures to •address reporting risks; information should be reviewed and challenged to expose any weaknesses in completeness or accuracy
creating employee incentives for accurate reporting.•
It is essential to gain board-level sponsorship and engage the right management team. This will help ensure that the individuals concerned are approaching the measurement and reporting task with the right levels of motivation, technical skills and clout.
Key performance indicators (KPIs) should be integrated into management reporting frameworks, to remind managers of the importance of the task and make sure it stays on their agenda. Inclusion of targets in individual’s objectives and performance management reviews can further embed the required behaviours.
sTeP 4: RePoRTing
confirm your baseline and targets The baseline and targets should be discussed and assessed when the initial strategy is created. After the emissions data have been collected they should be reassessed and defined, in accordance with the quality of data available and the message the organisation wishes to communicate to its stakeholders.
An historic baseline will demonstrate progress already made, but it is essential to disclose any assumptions and estimates that have been used to arrive at this historic picture; they may be based on less accurate information.
describe chosen boundaries and disclose assumptionsThe essential backbone of a report on GHG emissions is a clear description of the scope of reporting, the methodology used, and any key assumptions used in making calculations.
Assess and report on risks and opportunities from climate changeThe next step is to demonstrate an understanding of the risks and opportunities that climate change poses to the business as a whole and where possible to quantify their financial impacts, as well as how the company intends to deal with them.
Reporting an organisation’s carbon footprint internally is equally important and is often forgotten. Internal feedback on how local operations are performing, through internal benchmarking and progress reporting, can help to secure local buy-in and emissions reduction for what is often viewed as a corporate HQ requirement.
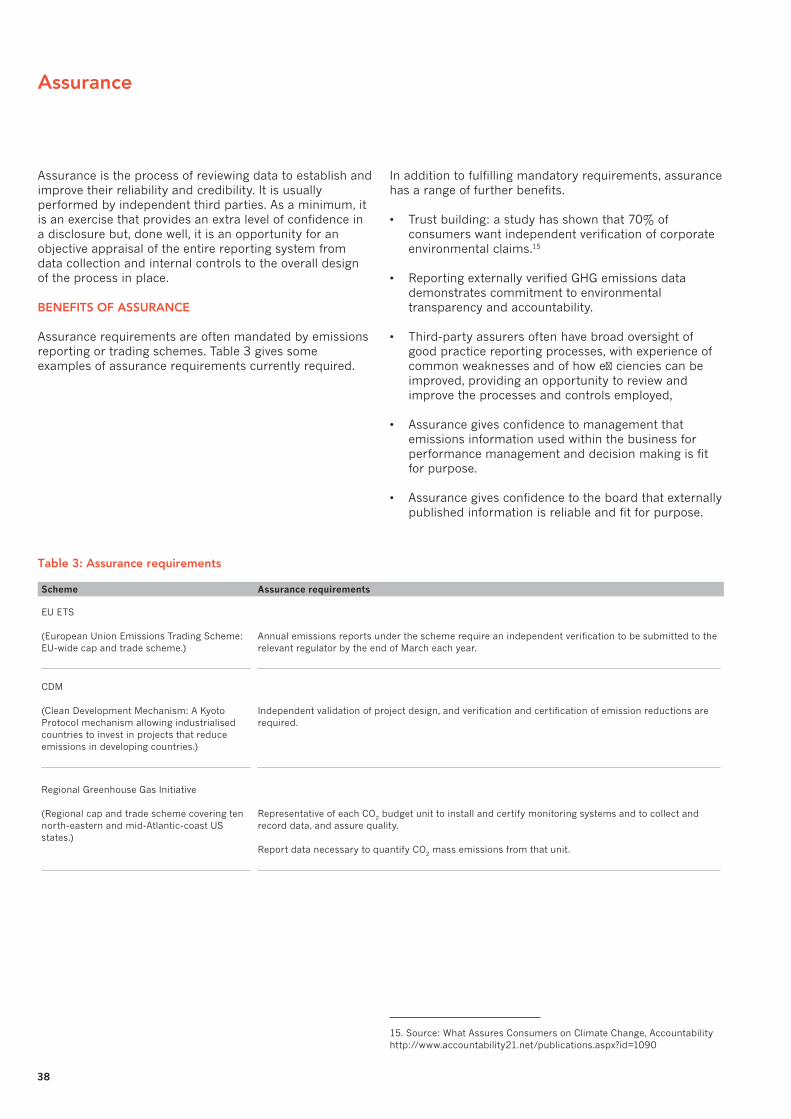
38
Assurance is the process of reviewing data to establish and improve their reliability and credibility. It is usually performed by independent third parties. As a minimum, it is an exercise that provides an extra level of confidence in a disclosure but, done well, it is an opportunity for an objective appraisal of the entire reporting system from data collection and internal controls to the overall design of the process in place.
BenefiTs of AssuRAnce
Assurance requirements are often mandated by emissions reporting or trading schemes. Table 3 gives some examples of assurance requirements currently required.
In addition to fulfilling mandatory requirements, assurance has a range of further benefits.
Trust building: a study has shown that 70% of •consumers want independent verification of corporate environmental claims.15
Reporting externally verified GHG emissions data •demonstrates commitment to environmental transparency and accountability.
Third-party assurers often have broad oversight of •good practice reporting processes, with experience of common weaknesses and of how efficiencies can be improved, providing an opportunity to review and improve the processes and controls employed,
Assurance gives confidence to management that •emissions information used within the business for performance management and decision making is fit for purpose.
Assurance gives confidence to the board that externally •published information is reliable and fit for purpose.
15. Source: What Assures Consumers on Climate Change, Accountability http://www.accountability21.net/publications.aspx?id=1090
Assurance
Table 3: Assurance requirements
scheme assurance requirements
EU ETS
(European Union Emissions Trading Scheme: EU-wide cap and trade scheme.)
Annual emissions reports under the scheme require an independent verification to be submitted to the relevant regulator by the end of March each year.
CDM (Clean Development Mechanism: A Kyoto Protocol mechanism allowing industrialised countries to invest in projects that reduce emissions in developing countries.)
Independent validation of project design, and verification and certification of emission reductions are required.
Regional Greenhouse Gas Initiative
(Regional cap and trade scheme covering ten north-eastern and mid-Atlantic-coast US states.)
Representative of each CO2 budget unit to install and certify monitoring systems and to collect and record data, and assure quality. Report data necessary to quantify CO2 mass emissions from that unit.

39The Carbon jigsaw seCTion 3: Carbon rePorTing anD assUranCe
AssuRAnce sTAndARds
There are a number of different assurance standards. The choice may be prescribed by a particular scheme, or a company that is voluntarily seeking assurance of its emissions may be able to select. The main assurance standards are shown in Table 4.
Table 4: The main assurance standards
assurance standard Description
ISAE 3000
(http://www.ifac.org/IAASB/ProjectHistory.php?ProjID=0008)
A non-financial assurance standard produced by the International Auditing and Assurance Standard Board (IAASB), which is commonly applied to environmental, social and sustainability information. The standard is currently being reviewed/updated and a specific standard for GHG assurance standard is being drafted.
AA1000 Assurance Standard
(http://www.accountability21.net/default2.aspx?id=1024)
An assurance standard for assessing compliance with the AA1000 corporate responsibility principles and reporting of sustainability information/data.
ISO 14064 Pt3 (http://www.iso.org/iso/catalogue_detail?csnumber=38381)
Provides verification/validation guidance for GHG emissions reports carried out in accordance with ISO 14064 Parts 1 and 2.

40
APPRoAches To AssuRAnce
Certain aspects should be agreed at the beginning of the assurance process.
The level of assuranceISAE 3000 defines two levels, reasonable assurance and limited assurance, as follows.
Reasonable assurance seeks a similar level of accuracy as required for a set of financial statements. It requires a potentially significant amount of testing and evaluation of underlying information sources and processes, depending on the robustness of the controls in place. The resulting assurance conclusion is positive, usually stating that the reported information is ‘fairly stated’.
Limited assurance is a lower level of assurance. It allows for a lesser amount of testing and evaluation of underlying information sources, which is reflected in the ‘work performed’ section of the external assurance report. The result is a negative conclusion, usually stating that ‘nothing has come to our attention to suggest that the reported information is not fairly stated’.
Limited assurance often suits organisations that are new to assurance, and want to gain an initial understanding of the robustness of their processes, before committing to reasonable assurance, which can be a more intensive process.
The objective of the assuranceSome of the options include:
assurance about emission quantities•
assurance that a specific project has deliver stated •reductions
assurance that disclosures meets all the requirements •for a particular scheme/standard/methodology
production of an internal report to management •containing recommendations on how the measurement and reporting processes can be improved.
The scope of assurance Some of the considerations include:
which GHGs are to be included •
whether the assurance is to cover both direct and •indirect emissions, and if the latter, the extent of indirect emissions to be included
identification of the organisational boundaries.•
Reporting and assurance criteria Typical criteria include completeness, accuracy, consistency and transparency. The assurance provider will also consider materiality, which may include a quantitative threshold if appropriate, but will also have qualitative aspects to ensure that information is being reported in a balanced way, and is consistent with the reporting criteria. A degree of professional judgement will always be used in assessing whether an issue is material to the assurance conclusions.
The fuTuRe of AssuRAnce
Independent assurance is increasingly becoming an important control mechanism for company management, including disclosure committees, audit committees and main boards. This requires an increasing level of scrutiny and robustness in the process, as expectations evolve.
Improvements are needed in the consistency of assurance, including the approach used and the way conclusions are expressed, to provide users with a clear understanding of what assurance means. Use of recognised international assurance standards is an important way of improving consistency. For example, CDSB is working with the IAASB to consider an appropriate assurance standard for the CDSB framework, and will provide further guidance in the near future.

41The Carbon jigsaw
secTion 4:
The world of carbon business

42

43The Carbon jigsaw seCTion 4: The worLD oF Carbon bUsiness
introduction
From these institutions, a whole range of organisations have evolved with the mission of managing and driving emission reductions at the regional level and nation/state level (eg the Carbon Trust in the UK, the European Environment Agency, the Department of Climate Change in Australia). Many businesses have emerged to manage the business that spins off from the emission trading mechanisms that form part of the Framework, such as the Clean Development Mechanism (CDM)and the Joint Implementation (JI). The CDM was established under the Kyoto Protocol to facilitate the transfer of clean technology from the developed countries to the developing ones; its objective is to fast track clean energy and services to the developing countries so that they can ‘leap frog’ the mistakes of the industrialised world in their development process. The JI is similar to the CDM but involves carbon reduction projects in former eastern bloc countries such as Russia. Because this mechanism takes 1990 as its baseline year for emission reduction, when the nations themselves did not exist, most of these countries have Kyoto targets that allow them to increase their emissions substantially. The companies that have been formed to service these initiatives may focus on selling carbon offsets, providing emission reduction strategies, trading in the carbon markets or selling research expertise for the evolving market.
At the third COP meeting, one of the first major developments that arose from the Kyoto Protocol was the European Union Emissions Trading Scheme (EUETS). This initiative has spawned an industry of companies that locate emissions-reduction opportunities, operate as trading houses for carbon credit exchange, and more generally provide the mechanisms required for countries and companies in the EUETS to buy and sell emissions rights and therefore fulfil their obligations under the scheme. Since this scheme was formed, several other trading regimes have developed globally and, in addition to this, there are an increasing number of companies that seek to measure, monitor, reduce and offset their carbon emissions voluntarily.
The objective of this briefing is to address some of the common questions that arise in relation to the carbon industry, and to explain some of the strategies that are available for companies wishing to reduce their carbon footprints.
As the governments of the world come to terms with climate change and its implications, business is coming under pressure both to reduce its carbon emissions and to report these emissions in a substantive way.
Some statistics about the carbon market and renewable energy:
the market for carbon emission allowances grew from •$8 billion in 2005 to $34 billion in 2006
greenhouse gas emission permits and credit trading •grew 41% in the same period globally
global renewables capacity increased by 14% between •2004 and 2005 compared with a 2% growth in coal-fired generation
the amount of solar energy harnessed grew by 60% in •the same 12-month period
installed wind power grew 50% between 2002 and •2005 globally.
In this environment, many organisations are currently working to develop reporting standards and processes to account for carbon emissions. In this section we examine the various institutions that oversee and regulate the carbon business world, and give explanations of some of the key terms in the world of carbon business.
oveRview of climATe chAnge RelATed insTiTuTions
The Intergovernmental Panel on Climate Change (IPCC) is responsible for scientific research about climate change and was established by the World Meteorological Organisation (WMO) and by the United Nations Environment Programme (UNEP).
Its membership includes governments of all WMO and UNEP member countries, scientists (who write for the IPCC) and individuals (it is a United Nations body.)
Climate change policy and debate are the remit of the United Nations Framework Convention on Climate Change (UNFCC). The UNFCC was established at the Rio Earth Summit in 1992 as a convention to create and implement protocols about carbon emission reductions. The UNFCC’s bilateral meetings are called COP meetings – Council of Parties. The next one, called COP15, will be held in Copenhagen in December 2009. Environment ministers from countries from all parts of the globe meet at each COP.
44
establishing a price for carbon
Most companies begin documenting their carbon footprint by focusing on direct emissions and emissions from electricity, because they are the simplest to manage. Several fundamental emissions sources that should be quantified include:
onsite fuel use•
onsite electricity use•
use of transport that the company owns.•
To get the key information to calculate a basic footprint, data should be collected from all utility meters and distances travelled by company vehicles should be documented. Consumption figures can be converted to CO2 by using existing guidelines such as those at the four sources listed here.
www.defra.gov.uk/environment/business/envrp/•conversion-factors.htm
www.ghgprotocol.org/calculation-tools•
www.iso.org/iso•
www.ipcc-nggip.iges.or.jp/public/gl/invs1.html•
Once the basic carbon footprint has been established it is possible to take steps to manage the emissions by setting efficiency reduction targets, identifying opportunities to achieve the targets, prioritising actions, and measuring and monitoring progress.
To produce a full carbon footprint, indirect emissions must be factored in, the boundary and scope of coverage must be established, and results may be verified by external ‘assessors’. Many companies then go on to publish their footprint in the public domain.
There are a number of key issues to consider when developing a carbon footprint.
Understand what you want to achieve – be clear on your objective. Is it to understand key emissions sources, go carbon neutral, reduce emissions by a specified amount, or define your footprint to investors? Clarity of purpose will make it easier to convince colleagues or boards to be involved.
Define the methodology – there are several different methodologies in operation globally. Problems arise when individuals across an organisation use different methods. This is particularly a problem when data are collected from different geographic locations. The GHG Protocol, developed by the World Resources Institute and the World Business Council for Sustainable Development, is a credible and widely used protocol.
Carbon pricing has been identified as a critical policy tool that governments can use for achieving carbon reductions. ‘Carbon price’ is a term for the value applied to each unit of carbon emissions.
There are various ways of establishing and applying a carbon price, through:
market prices per tonne of carbon in systems such as •the EUETS
taxation systems•
the ‘shadow price’ – which is the price governments •apply when they are costing future policy and projects, and costs in negative externalities that are not often included in the wider market price.
To date all estimations used by the most governments active in this field are based on the application of the social cost of carbon (where the cost to society of a tonne of additional carbon emissions is given a monetary value; this is also called the damage cost). Nonetheless, such estimates are very uncertain, and lack accuracy and precision. Another approach is to use the ‘marginal abatement cost’ method, which assesses the cost of reducing the next unit of carbon emitted. This method assumes that the more carbon that is abated, the more expensive it becomes. As technology changes, the cost of using this method will reduce. The other alternative is to take the existing market price as established via the EUETS.
whAT is A cARBon fooTPRinT?
This term describes the total amount of CO2 and other greenhouse gas emissions for which an individual or organisation is responsible.
In order to produce a reliable footprint, organisations should follow a structured process to make sure that all possible sources of emissions are identified. A popular way to do this is to group and report on emissions according to the level of control that an organisation has over them:
direct emissions that result from activities the •organisation controls, eg gas used to provide hot water for the workspace
emissions from the use of electricity•
indirect emissions from products and services, eg a •manufacturing company is indirectly responsible for the carbon that is emitted in the preparation and transport of the raw materials. Downstream emissions from the use and disposal of products can also be indirectly attributed to the organisation.

45The Carbon jigsaw seCTion 4: The worLD oF Carbon bUsiness
Specify the boundary and scope of coverage – be clear about whether the footprint includes emissions from partly owned subsidiaries or from leased assets. Consider whether reporting will include only CO2 or all greenhouse gases. Will emissions from supply chain activities be included?
Consider using one of the many external experts to guide the process – there are many companies that specialise in the process of guiding organisations in carbon emission reductions.
Ensure a strong group of colleagues is committed to the process. Data collection and commitment will be required, as will many participants and ‘champions’. There must be commitment at senior levels of the organisation so a solid business case must be developed to secure this commitment. Widely acknowledged business drivers include: reliance on resources that may become limited or more costly, interest from investors, exposure to regulatory risk and meeting customer requirements.
Be clear about the level of accuracy and the margin for error that your organisation will deem acceptable in the data collection process. Ensure this is communicated to staff. The accuracy of the footprint relies heavily on the accuracy of the data.
Instead of giving detailed data, it is often more important to inform your stakeholders about how climate change and carbon strategy are linked to an organisation’s business strategy, and to collect ‘top line data’ around this.
Ensure there is adequate, dedicated in-house expertise to guide the process. Even if external experts are used, internal personnel with a technical knowledge of the specifics of an organisation will be vital for ensuring accuracy of the footprint data.
Once an organisation has established its current carbon footprint, there are many sources of guidance as to how to reduce this footprint. Without commissioning consultants, there are various Web-based resources available free of charge, which are generic and applicable across continents. One such example is the Carbon Trust, the UK-based, government-funded organisation whose mission is to ‘accelerate the move to a low carbon economy by working with organisations to reduce carbon emissions and develop commercial low carbon technologies’ (www.carbontrust.co.uk).
Investors are increasingly requesting information on carbon risks and benefits in order to take climate change impacts into account when making investment decisions. The Carbon Disclosure Project (CDP) is a collaboration of around 400 institutional investors with a combined $57 trillion of assets under management. On their behalf, CDP seeks information on the business risks and opportunities presented by climate change and greenhouse gas emissions data from the world’s largest companies: 3,000 in 2008. As the information request is written on behalf of investors, who often hold shares in responding companies, corporations recognise the importance of responding (www.cdproject.net).

46
carbon offsetting has emerged as a way for organisations to cut their emissions indirectly.
Carbon offsets are generated from projects that reduce the amount of greenhouse gases entering the atmosphere. To qualify as an offset, the reduction achieved by a project must be in addition to any that would have happened in the absence of the project. As greenhouse gases emitted from any country mix together within the global atmosphere, it is possible to offset by purchasing credits, or paying for emissions reductions projects, in any country – the effect should be the same.
Carbon offsetting has become controversial for two reasons.
It has been used by many organisations as a way to •reduce their net emissions without taking action to reduce the actual emissions from their own everyday operations.
There have been some bogus projects – in hindsight •these were found either not to reduce emissions or not to be additional (ie companies were going to take the actions anyway).
Nonetheless, many successful projects and instances of technology transfer have resulted from the offsetting process, and exciting carbon reduction initiatives have come to fruition.
Companies buy offsets for compliance or for voluntary purposes. In the compliance market, offsets are acquired by organisations and governments to comply with their emission reduction targets set under the Kyoto protocol or the EU Emissions Trading Scheme. In addition, many organisations purchase offsets as a voluntary way to reduce their carbon emissions indirectly. This has resulted in the emergence of two distinct markets.
The voluntary offset market has grown rapidly in the last few years; here, clients are often very rigorous in their investigation of the details of the offset project. Companies that purchase offsets on the voluntary market are not mandated to do so, but are driven by corporate policy on commitment to energy reduction and reducing their environmental footprint.
The compliance market is a market for carbon based on the trading of emissions reductions or allowance units used for mandatory reporting programmes, such as the EU Emissions Trading Scheme. Companies that purchase offsets on this market are doing so because they are required to offset their ‘overshoot’ of emissions (their real emissions minus allowance level emissions).
ARe TheRe Any sTAndARds To guide The offseT mARkeT?
Because the standard of offset products has varied widely since their inception, and a number of standards have emerged to ensure that credits generated from emissions reduction projects are equivalent to each other. In the compliance market, standards are well defined because the UNFCC oversees the project. Methodologies have been established for calculating baseline emissions and monitor verification and certification of emissions reductions. In the voluntary market there is no equivalent. Instead there are a variety of standards and protocols.
Probably the best-regarded verification scheme is the one created by WWF, SSN and Helio International. The Gold Standard Foundation offers a quality label to CDM/JI and voluntary offset projects. Renewable energy and energy efficiency projects with sustainable development benefits are eligible. The Gold Standard is endorsed by 37 non-governmental organisations worldwide: see www.cdmgoldstandard.org
how To develoP A cARBon offseTTing sTRATegy
Any organisation that decides to start measuring its carbon footprint, and then takes steps to reduce the footprint will eventually consider the question of whether to offset residual emissions. The Climate Group is an organisation dedicated to making linkages between government and business to promote action on climate change. If offers a series of ‘top tips’ towards developing a rigorous offsetting strategy: www.theclimategroup.org
carbon offsetting
47The Carbon jigsaw seCTion 4: The worLD oF Carbon bUsiness
source www.ieta.org
Emissions trading evolved from a system that restricts the aggregate allowable amount of a pollutant and allows market forces continually to move the allowed emissions to the highest value used.
Market transactions are driven by relative prices of emission reduction opportunities among market participants. For example, a company with a low-cost opportunity to reduce emissions below its allocation of emission rights can sell these unneeded rights to a company with limited or uneconomic emission reduction opportunities.
A number of different forms of trading have evolved. The underlying theme of all is to provide entities with the flexibility to determine the most economic means of reducing emissions. Examples include the following.
Bubbles – where an entity with multiple emissions sources combine its total emissions targets from these multiple sources under one accounting entity. This creates flexibility to apply pollution control technologies to whichever source under the bubble has the most cost-effective pollution control options, while ensuring that the total amount of emissions under the bubble meets the overall environmental restrictions.
Offsets or ‘credit-based emission reduction trading’ schemes represent the next version of emissions trading. These systems are project-based, often incorporating non-capped industries and entities. This system allows entities that wish to increase their emissions to obtain offsetting reductions from entities that are not required to reduce their emissions. Offsets are created when an emitting company makes voluntary, permanent emission reductions that are legally recognised by a regulator as emission reduction credits or offsets. Those offsets are sold to new or expanding emission sources to ‘offset’ the new emissions. Regulators approve each trade; but they usually require that a percentage of the offsets be retired as a dividend to the environment.
Cap and Trade Programmes are more evolved forms of emissions trading. A regulatory authority establishes an aggregate cap on the emissions of a pollutant, this cap being a definite and permanent limit for a group of emitters. The allowed cap has usually been a fraction of the historic emissions from those sources. For example, the US Acid Rain Program instituted a 50% reduction from 1980 levels of sulphur dioxide (SO2) emissions from utilities, and the Ozone Transport Commission NOx Program imposed a 65% reduction from 1990 levels and is scheduled to achieve an 85% reduction after the next phase. Emission Allowances are units of trade created to account for the total emissions in the system (in the case of the US Acid Rain Program, one emission allowance equals the right to emit one ton/907kg of SO2). Trading occurs when an entity with excess allowances, liberated through actions or improvements made, sells them to an entity requiring allowances.
There are also two additional concepts involved with emissions trading, which can be combined with the above systems.
Baseline emission reduction trading systems are project-based, often incorporating non-capped industries and entities. This type of system allows an entity to reduce emissions voluntarily below an agreed baseline under ‘business as usual’. The accreditation system is based upon the delta between two emission forecasts: with and without the proposed project. The CDM relies on such a mechanism.
Rate-based (or relative) emissions trading focuses on the emission per unit of output rather than absolute emissions. This system is intended to promote increased efficiency without limiting growth of the underlying business. Within such a system entities that improve their efficiency beyond the target levels can trade the excess improvement with other companies. For example, Corporate Average Fleet Efficiency (or CAFE) standards in the US allow auto manufactures to make changes within their own fleet of vehicles to ensure an overall average improvement in gas mileage per vehicle sold.
emissions trading

48

49The Carbon jigsaw
secTion 5:
carbon law
‘Carbon law’ was prepared for The Carbon Jigsaw by Baker & McKenzie. © Baker & McKenzie, 2009

50
ABouT The AuThoRs
Baker & McKenzie is the world’s leading global law firm. We provide sophisticated, commercially realistic legal advice and services to many of the most dynamic and successful organisations in the world.
With more than 3,900 lawyers, supporting professionals and staff – located in 39 countries – we have the knowledge, resources and technology to consistently and seamlessly deliver the broad range of quality legal services required for international and local business activities.
Baker & McKenzie was the first law firm to recognise the importance of global efforts to address climate change and the importance of such legal developments to our clients. The future will be increasingly carbon constrained requiring major technological shifts and creating not only serious liabilities but presenting tremendous opportunities. For more than ten years, we have worked on numerous pioneering deals, including the first carbon contracts and the largest CDM transaction to date. From governments to financial and multilateral institutions — including the World Bank, EU, and UN — we continue to advise the world’s climate change policy and market makers.
We have assisted on the most number of climate change deals around the world, earning us the Top Legal Advisor on CDM/JI award from New Energy Finance in 2007 and 2008. Ours is the only firm repeatedly recognised by Environmental Finance as a legal leader in the carbon market, naming us the Best Law Firm for GHG Emissions Kyoto Project Credits (JI and CDM), Best Law Firm GHG Emissions Voluntary Markets and Best Law Firm GHG Emissions Australasian Markets in 2008. With our exhaustive knowledge and successful track record, Chambers Global Directory of Leading Lawyers 2008 and 2009 ranks our practice at the top.
Our firm has been at the forefront of global climate change law. And with deep local roots in 80 percent of the world economy, we understand how it interacts with existing domestic policies. Our fluent knowledge enables us to help regulators and institutions develop tools to build capacity and market infrastructure, including the United Nations Environment Program’s CDM legal guidebook and the EU Commission’s carbon trading registry.
We employ a holistic approach to carbon transactions, combining our capabilities in securities, finance, tax, M&A and public law to ensure efficient solutions for clients. Our more than 300 environment lawyers seamlessly collaborate across borders and practices, delivering innovative yet pragmatic advice on voluntary carbon and joint implementation markets. From development and financing of carbon projects, creation and purchase of voluntary emissions reductions to carbon credit actions, acquisitions and other transactions, we help first-to-market clients on creative and pioneering deals.
Our team has unparalleled legal knowledge on renewable and clean energy projects, from ethanol and biodiesel, to wind, solar and other renewables. Our unique insights and industry experience help clients efficiently and confidently address all aspects of project development and finance. With 69 offices in 39 countries, we advise developers, lenders and investors on the most intricate and market-defining deals in established and emerging markets around the world.
www.bakernet.com/climatechange www.cdmrulebook.org www.jirulebook.org

51The Carbon jigsaw seCTion 5: Carbon Law
introduction to carbon trading
Carbon trading schemes are generally created by laws that restrict the total quantity of greenhouse gases (GHGs) that can be emitted by companies, and then allow those companies to trade units of emission reductions among themselves. Companies that pollute beyond their allocated amount are required to purchase credits, which represent emission reductions occurring elsewhere in the economy – generally, from companies emitting less than their maximum allowance.
how does An offseT deAl occuR?
Some carbon trading schemes allow for trade in ‘offsets’. An offset credit represents an emission reduction that occurs in a sector where reductions in emissions were not required under the scheme. For example, an offset credit may be generated by planting trees which will absorb one tonne of CO2-e, or by flaring methane gas equivalent to one tonne of CO2-e from an underground coal mine or landfill site. Company B in the scenario above has the option to purchase offset credits (instead of Company A’s emission allowances) to comply with its regulatory obligations. Ultimately, this decision will be a commercial one for Company B based on the prices of each type of credit.
exAmPle
Two companies may each be permitted to emit 50 tonnes of carbon dioxide equivalent (CO2-e) in a given year. With minimal investment in new technology or the implementation of low-cost energy-efficiency strategies, Company A can reduce its emissions to 40 tonnes of CO2-e in one year. Company B, by contrast, may have sunk investments in large-scale infrastructure, making it prohibitively expensive to reduce its emissions below 60 tonnes of CO2-e in the same year.
Under a carbon trading scheme, Company A would be entitled to sell its excess emission allowances to Company B at the prevailing market price, permitting Company B to meet its regulatory obligations without reducing its own on-site emissions. Company A thereby profits from its investment in emission-reducing strategies. The overall objective of having just 100 tonnes CO2-e emitted by the two companies has been achieved, but with minimal cost to the economy or the competitiveness of the two firms involved.

52
international legal framework
Annex I Parties may also authorise legal entities (eg companies and non-governmental organisations) to participate in emissions trading.
cleAn develoPmenT mechAnism (cdm)
According to article 12 of the Kyoto Protocol, the CDM has the purpose of:
assisting developing countries in achieving sustainable •development and in contributing to the ultimate objective of the UNFCCC, and
assisting developed countries in achieving •compliance with their quantified emission limitation and reduction commitments.
It allows entities from Annex I (developed) Parties to develop emission-reducing projects in non-Annex I (developing) countries and generate CERs corresponding to the volume of emission reductions achieved by that project. Those CERs can then be traded in the global market or used for compliance under the Kyoto Protocol.
Project activities under the CDM must be:
hosted by non-Annex I Parties that have ratified the •Kyoto Protocol and established a designated national authority (DNA)
developed by public or private entities authorised by •the relevant host Party and Annex I Party involved in the project activity
validated by a designated operational entity (DOE) in •accordance with the CDM project eligibility and participation requirements, including the use of an approved baseline and monitoring methodology
registered by the CDM Executive Board after review by •a Registration and Issuance Team to ensure compliance with the international rules, and
once commissioned and operational, verified and •certified by a DOE as resulting in real, additional, measurable and verifiable reductions in greenhouse gas emissions below an approved business-as-usual baseline.
CERs issued by the Executive Board are sold and purchased under private commercial arrangements between the project participants and transferred between Annex I Parties via the international transaction log (ITL).1
1. For further details about the CDM rules, please see the CDM Rulebook at http://www.cdmrulebook.com
unfccc And The kyoTo PRoTocol
The United Nations Framework Convention on Climate Change (UNFCCC) is a multilateral convention aimed at stabilising greenhouse gas concentrations in the atmosphere at a level that would prevent dangerous anthropogenic interference with the climate system. Rather than setting binding targets, the UNFCCC sets an overall framework for intergovernmental efforts. It enjoys near-universal membership, with 192 countries having ratified it, and entered into force on 21 March 1994.
The Kyoto Protocol came into being on 11 December 1997 at the third Conference of the Parties to the UNFCCC, and entered into force on 16 February 2005. It places binding emission reduction targets on 37 developed countries (known as Annex I Parties), each of which is required to reduce its emissions by an average of 5.2% below 1990 baseline levels between 2008 and 2012. Details and rules about implementation of the Kyoto Protocol are contained in the Marrakesh Accords, which consist of decisions made by the Conference of the Parties in its seventh session, held at Marrakesh, Morocco in 2001.
flexiBle mechAnisms undeR The kyoTo PRoTocol
At the ’apex’ of the carbon market system is the compliance market created by the Kyoto Protocol. The Protocol creates three flexible mechanisms for use by countries in meeting their emissions targets:
emissions trading•
Clean Development Mechanism (CDM) and •
Joint Implementation (JI). •
emissions TRAding
The emissions trading mechanism is essentially a cap-and-trade system which allows for trading of allowances between countries with reduction targets. Only Annex I Parties to the Kyoto Protocol with reduction commitments may participate in such trading. The units that may be transferred, each equal to one tonne CO2-e, may be in the form of:
an assigned amount unit (AAU) issued by an Annex I •Party on the basis of its assigned amount pursuant to articles 3.7 and 3.8 of the Protocol
a removal unit (RMU) issued by an Annex I Party on the •basis of land use, land-use change and forestry activities under articles 3.3 and 3.4 of the Protocol
an emission reduction unit (ERU) generated by a JI •project under article 6 of the Protocol, or
a certified emission reduction (CER) generated from a •CDM project activity under article 12 of the Protocol.

53The Carbon jigsaw seCTion 5: Carbon Law
The largest proportion of CERs are generated in Asia. South America and Africa (particularly South Africa and Egypt) also account for some project-based credits, but these regions remain significantly underrepresented.
Although the Kyoto Protocol itself binds nation states only, the private sector is currently the dominant buyer in the project-based market. In addition to those entities, frequire credits to satisfy their own compliance obligations, other private market buyers include carbon procurement funds, banks and other financial institutions.
JoinT imPlemenTATion
The JI mechanism allows industrialised countries with greenhouse gas reduction commitments to fund emission reduction projects or projects that enhance removal of greenhouse gases by sinks in other industrialised countries, as an alternative to reducing emissions in their own countries. An Annex I Party can also authorise companies to participate in JI projects. The purpose of Joint Implementation is twofold:
to enable the transfer of activities, technologies and •techniques to countries hosting the projects; this contributes to sustainable development and to those countries’ commitments under the Kyoto Protocol, and
to reduce the costs of emission reductions for countries •funding the projects, bearing in mind that the global environmental impact of emission reductions is the same irrespective of their origin.
Article 6(1) of the Kyoto protocol requires that:
all parties to a JI project approve the project•
the reductions or removals achieved by the project are •additional to those that would have otherwise been achieved in its absence (in other words, the project would not be financially viable without carbon revenue streams and is not required under any law that is widely enforced), and
JI activities are only supplemental to emission •reduction initiatives in the investor country.
Parties that participate in JI projects generate emissions credits known as ERUs. ERUs can be purchased by a country to ensure compliance with its Kyoto targets or for further sale on the international emissions trading market. ERUs generated by JI projects are not ‘new’ carbon assets, but rather are converted from AAUs. This means that, before a country decides to host a JI Project, it needs first to be sure that it is not going to need the AAU for its own compliance purposes.
Ukraine and Russia dominate the JI market, each responsible in 2007 for approximately one third of the market share.2 Other countries – and not only in Eastern and Central Europe, but also New Zealand for instance – have also taken part in the market, although to a lesser extent.
PosT-2012 inTeRnATionAl AgReemenT
The first commitment period of the Kyoto Protocol expires in 2012. It is important to note, however, that the Protocol itself (including the CDM and JI) will not cease to exist after 31 December 2012. As an international agreement it has no sunset date, although post-2012 targets have not yet been established.
The Bali Action Plan devised at the thirteenth Conference of the Parties lays the groundwork for negotiations, to be concluded in Copenhagen in 2009 (at COP 15), on a future international agreement to commence after 2012. The Bali Action Plan gives some clues as to the nature of a post-2012 agreement. For instance, the document refers specifically to ‘cooperative sectoral approaches and sector-specific actions’, indicating that the first stage of emissions commitments by developing countries may be restricted to specific sectors (the steel or energy industries, for example). It was hoped that further progress towards a post-2012 plan would be made at the 2008 Poznan conference, but few significant developments emerged and the international community now awaits the results of the Copenhagen negotiations.
2. The World Bank, State and Trends of the Carbon Market 2008, http://siteresources.worldbank.org/NEWS/Resources/State&Trendsformatted06May10pm.pdf.

54
domestic legislative and policy frameworks
Despite encountering some fairly significant teething issues, the first phase of the Scheme experienced explosive growth and demonstrated to the international business community that significant opportunities are available in carbon markets. In 2007, the European market was worth over US$50 billion (€37 billion).
On 17 December 2008 the European Parliament adopted a proposal to amend the EU ETS Directive as part of a package of climate and energy proposals (the ‘Green Package’). The adopted package includes agreed text for a Directive governing Phase III of the EU ETS, which provides for a number of substantial amendments to the emissions trading scheme.6 The Phase III changes include, most notably, the expansion of the EU ETS to cover new sectors and gases, the harmonisation of allocation rules among member states and the adoption of auctioning as the primary method of allocation of allowances. The proposed changes are already having a significant effect on the CDM market, and may lead to long-term changes in the demand for CERs (and ERUs) in the EU ETS. Under the Green Package, the EC’s target for 2020 will vary depending on whether a ‘satisfactory’ post-2012 international agreement is reached.
If such agreement is reached, the EC will adopt a target of a 30% reduction in emissions below 1990 levels by 2020; if not, pledged reductions will be limited to 20% below 1990 levels. The Phase III ETS Directive will be formally adopted as European legislation in 2009 upon publication in the EU Official Journal. Member states will be obliged to implement certain (reporting) provisions in the Directive by the end of 2009, with further implementing measures required before the commencement of the third phase of the EU ETS in 2013 (which is expected to continue for eight years, until 2020).
6. See European Parliament legislative resolution of 17 December 2008 on the proposal for a Directive of the European Parliament and of the Council amending Directive 2003/87/EC so as to improve and extend the greenhouse gas emission allowance trading system of the Community (COM(2008)0016 - C6-0043/2008-2008/0013(COD)).
euRoPeAn union (eu)
eu eTsThe EU-153 took on a joint target under the Kyoto Protocol to reduce their collective emissions by at least 8% below 1990 levels in the Protocol’s first commitment period (2008–12). Within this overall target, each EU-15 member state has a differentiated reduction target; some are required to reduce emissions while others are allowed a limited increase. New member states have individual targets.4
In June 2000, the EU launched its European Climate Change Programme (ECCP), which aimed to identify and develop all the necessary elements of an EU strategy to implement the Kyoto Protocol and achieve the EU-15 joint target. The centrepiece of the ECCP is the EU Emissions Trading Scheme (EU ETS), which covers carbon dioxide (CO2) emissions from some 11,500 heavy emitters in the power generation and manufacturing sectors (accounting for approximately 40% of the EU’s annual emissions). In June 2008, the EU agreed to extend coverage of the EU ETS to include aviation, beginning in 2012. The EU ETS, which has operated since 2005, has essentially functioned as a trial market for the global carbon trading regime.
The EU Directive that implements the EU ETS5 requires that each participating country propose a National Allocation Plan. The Plan sets caps for those facilities (called ‘Installations’) that are caught by the Scheme. Installations are allocated ‘EU Allowances’ (EUAs) up to the level of the cap, with each EUA representing the right to emit one tonne of CO2-e. For Phase III of the EU ETS (2013–20), the use of NAPs will be replaced by a single EU-wide cap, distributed according to harmonised rules. Under the trading scheme, excess allowances held by Installations, as well as some credits generated through CDM and JI projects, are eligible to be traded and ultimately surrendered for compliance. Installations that exceed their individual limit are able to buy unused allowances from firms that have taken steps to cut their emissions. Each year, the Installations must surrender (essentially give back to the government) a number of emission allowances equivalent to their greenhouse gas emissions. Those Installations that exceeded their limit and did not buy spare allowances were fined €40 in the first phase (2005–7), and this penalty has increased to €100 for every excess tonne of CO2-e emitted for the second phase of the Scheme (2008–12).
3. The 15 Member States in the EU before the enlargement in 2004: Austria, Belgium, Denmark, Finland, France, Germany, Greece, Ireland, Italy, Luxembourg, Netherlands, Portugal, Spain, Sweden, United Kingdom. Note that the EU-27 does not have any formal, joint target.
4. Except Cyprus and Malta, which have no targets.
5. Directive 2003/87/EC of the European Parliament and of the Council of 13 October 2003 establishing a scheme for greenhouse gas emission allowance trading within the Community and amending Council Directive 96/61/EC (as amended).

55The Carbon jigsaw seCTion 5: Carbon Law
other eu policy/legislation
The EU has also developed a policy and regulatory framework designed to encourage the uptake of renewable energy. It has issued legislation requiring member states to implement national indicative targets for the generation of electricity from renewable energy sources7 and for the use of biofuels.8 Currently, an indicative EU-wide target is set which aims to facilitate the generation of 12% of gross national electricity consumption for each member state from renewable energy sources by 2010.
In response to the EU-level renewable energy policy, most member states (such as the UK, as discussed below), have developed their own renewable energy policy instruments.
Although recognising that many of the tools that promote energy efficiency, such as grants and tax incentives, fall within the domain of member states, the EC has taken a lead in developing strategies and legislation to achieve further energy efficiency in the region. On 17 December 2008, the European Parliament adopted a new Directive on the Promotion and use of Energy from Renewable Sources (New Renewables Directive) as part of the Green Package. This Directive, which will initially replace parts of, and eventually fully repeal, the existing Renewables Biofuels Directives, will enter into force 20 days after publication in the Official Journal of the EU. The new Directive aims to facilitate the achievement, by 2020, of an overall EU renewable energy target of 20% of electricity consumption and a 10% binding minimum renewable energy target for transport.
uk
eu eTs Each EU member state has put in place its own domestic legislation and policies that build on the ECCP measures or complement them, in order to enable them to meet their national targets. The UK’s Climate Change Programme, revised in 2006, sets out policies and priorities for action within the UK and internationally to enable the UK to achieve its legally binding national target of cutting greenhouse gas emissions by 12.5% from 1990 levels in the period 2008 to 2012. With the approval of the EU Green Package, the UK (like other EU member states) will be required to implement new domestic measures before the start of Phase III of the ETS in 2013.
7. Directive 2001/77/EC of the European Parliament and of the Council of 27 September 2001 on the promotion of electricity produced from renewable energy sources in the internal electricity market (Renewables Directive).
8. Directive 2003/30/EC of the European Parliament and of the Council of 8 May 2003 on the promotion of the use of biofuels or other renewable fuels for transport (Biofuels Directive).
climate change ActOn 26 November 2008, the UK Climate Change Act 2008 received Royal Assent. The Act creates a long-term legal framework to enable the UK to reduce carbon emissions and adapt to climate change. Among other things, the Act introduces a carbon budgeting system to cap emissions for five-year periods and sets a long-term emission reduction target to reduce emissions by at least 26% below 1990 levels by 2020 and at least 60% below 1990 levels by 2050.
carbon Reduction commitment (cRc)The Act also enables the UK government and devolved administrations to introduce new domestic emissions trading schemes through secondary legislation. The Act introduces a mandatory emissions trading scheme, known as the Carbon Reduction Commitment, which is aimed at reducing emissions from large, non-energy intensive organisations in the private and public sectors that fall outside the scope of the EU ETS. Organisations to be included in the scheme include large businesses and public sector organisations, such as government departments, universities, retailers, banks, water companies, hotel chains and local authorities. This will cover approximately 10% of economy-wide emissions.
Organisations will qualify for the CRC depending on whether they meet a defined threshold of electricity use. Participants will be required to monitor and report electricity use, and to purchase and surrender CRC allowances to cover emissions equivalent to that use. The scheme is scheduled to begin in April 2010, with a three-year introductory phase (involving simple fixed-price auctioning of allowances). The first capped phase will begin in 2013.
other uk policy/legislationTo meet its obligations under the EU Renewables Directive, the UK government has introduced the ‘Renewables Obligation’, which requires licensed electricity suppliers to source an increasing proportion of electricity from renewable sources. The government has recently announced its intention to extend the Renewables Obligation from its current end date of 2027 to at least 2037, as part of its new Renewable Energy Strategy. The immediate aim of the Strategy is to meet the UK’s target of 15% total renewable energy contribution to all electricity supplies by 2020 proposed by the EU in its Green Package. Other recent developments in renewable energy in the UK include the introduction of feed-in tariffs for small-scale electricity generation and financial incentives for renewable heat, both introduced with the passage of the Energy Act 2008. The UK has also implemented its obligations under the EU Biofuels Directive through the Renewables Transport Fuel Obligations Order. Under the Order, refiners, importers and any other suppliers of hydrocarbon oil are required to source a percentage of renewable transport fuels, which increases from year to year.

56
uniTed sTATes
state and national actionThe United States is one of the largest emitters of greenhouse gases in the world, and the only major developed nation that has not ratified the Kyoto Protocol. Shortly before finalisation of the Protocol in 1997, the US Senate unanimously passed the Byrd-Hagel Resolution, forcefully rejecting Kyoto and any other multilateral treaty that sought to impose mandatory caps on its domestic GHG emissions. The US position at the time was that to do so would be inequitable in circumstances where developing countries were not required to take on similar commitments. This policy line, which continued to be held under the Bush administration, has affected the reach of the Kyoto Protocol and the potential for US businesses to participate in global carbon markets. It has not, however, deterred American States from taking individual and collective action on climate change, with a number of voluntary and legislative regimes emerging at State/City level over the past ten years. More than half the states of the USA are now involved in ‘state to state’ carbon trading schemes.
The most significant of these include the following:
Chicago Climate exchange (CCX): a voluntary cap-and-trade scheme launched in 2003, under which companies, municipalities and other participants adopt a voluntary, but legally binding commitment to meet annual GHG emission reduction targets (which aim to reduce aggregate emissions by 6% below a set emissions baseline by 2010). To date, the exchange has more than 350 members, ranging from corporations such as Ford, DuPont and Motorola, to states and municipalities, educational institutions and farmers and their organisations.
regional greenhouse gas initiative: a regional cap-and-trade programme between ten north-east and mid-Atlantic states initially covering carbon dioxide emissions from power plants in the region. The initial target is to cap CO2 levels at 1990 levels by 2015 and reduce CO2 emissions by 10% by 2019. The scheme was formally launched on 1 January 2009.
western Climate initiative: a collaboration between the western states, including Arizona, California, New Mexico, Oregon, Utah, Washington and Montana, and certain Canadian Provinces to develop regional strategies to address climate change. The partner states set an overall regional goal to reduce GHG emissions by 15% below 2005 levels by 2020, and work on the market-based scheme design is currently underway.
Californian state initiatives: in 2006, California enacted the Global Warming Solutions Act 2006, which requires the California Air Resources Board to develop regulations and market mechanisms that will ultimately reduce California’s greenhouse gas emissions by 25% by 2020. Mandatory caps will begin in 2012 for significant sources
and ratchet down to meet the 2020 goals. The scheme further aims to reduce emissions to 80% below 1990 levels by 2050.
Outside these state- and city-based initiatives, over recent years there has been an ever-growing impetus, at industry and political levels, towards the federal regulation of GHG emissions in the US. Corporations and industry bodies, such as the US Climate Action Partnership (which includes many of the world’s largest companies, including Shell, Rio Tinto, GE, Alcoa, Ford Motors) are increasingly calling for real action on climate change, recognising the economic opportunities and competition benefits that emissions trading has to offer for lowest-cost abatement and technological initiative.
With the election of the Obama administration the US stands at the brink of significant change in relation to the climate change issue. President Obama has committed his government to the introduction of climate change legislation, including mandatory emission reduction targets and a national emissions trading scheme. As part of the ten-year, $150 billion, Obama–Biden ‘New Energy for America Plan’ President Obama has proposed the implementation of an economy-wide cap-and-trade programme to reduce greenhouse gas emissions by 80% below 1990 levels by 2050.
Given the change in administration, it appears inevitable that the United States will enact a federal climate change law that sets nationwide emission reduction targets and makes provision for the establishment of a national emissions trading scheme. The more pressing question for corporations is when such a scheme will be put in place. Depending on the targets established, a national emissions trading scheme is likely to create a significant market for carbon, and significant opportunities for American companies to achieve least-cost abatement and to commercialise new, efficient or alternative technologies.
other us policy/legislation In addition to the proposed cap-and-trade scheme, other features of the Obama–Biden ‘New Energy for America Plan’, include:
the provision of short-term relief to American families •to address rising petrol prices
assistance in the creation of five million new jobs by •strategically investing $150 billion over the next ten years to catalyse private efforts to build a clean energy future
plans to eliminate the United States’ dependency on •Middle Eastern and Venezuelan oil imports by 2019, including through the promotion of biofuels
a plan to put one million Plug-In Hybrid cars on the •road by 2015

57The Carbon jigsaw seCTion 5: Carbon Law
the development and deployment of clean coal •technologies, and
setting targets to ensure that 10% of the country’s •electricity comes from renewable sources by 2012, and 25% by 2025.
chinA
Participation in the kyoto marketsRecent estimates suggest that China has overtaken the US to become the largest emitter of carbon dioxide in the world. Under the Kyoto Protocol, China does not have a mandatory emissions reduction target. It is, however, an active participant in the global Clean Development Mechanism market. In late 2007, China launched a CDM Fund, to support trading of carbon emissions under the Kyoto Protocol. The fund aims to raise money for new projects and generate revenue from existing projects to support energy efficiency and clean power initiatives. According to recent United Nations data (January 2009), 1,314 projects have been registered under the Clean Development Mechanism (CDM), with annual average CER production of 244.7 million and expected CER tonnage of approximately 1.4 billion by 2012. In addition, 117 projects with expected CER production of 870 million tonnes await registration.
other chinese policy/legislationDespite not being bound by emission reduction targets under Kyoto, China has set its own climate change targets. In June 2007, China released its National Climate Change Programme, which adopts binding targets for renewable energy and energy efficiency.
By 2020, China aims to achieve:
20% reduction of energy consumption per unit GDP•
10% increase in the proportion of renewable energy •(including large-scale hydropower) in primary energy supply, and
20% improvement in energy efficiency. •
China’s central government has also given some indication that it may currently be considering introducing a national emissions trading scheme. On 6 March 2008, Mu Huaipeng, director of the Central Bank’s financial market department, said that ‘China has attained the necessary conditions for setting up a trading exchange for pollutant discharge permits’. On 6 June 2008, the Central Bank released a tentative draft emissions-trading proposal that could apply to various pollutants, including greenhouse gases. The draft emissions trading proposal suggests that China should determine a national goal for reducing pollution, have regional authorities determine quotas for businesses and put in place a system with controls at the national, provincial and city levels.
Several provincial and city-level governments have developed sulphur dioxide emissions trading schemes in order to achieve domestic air pollution abatement, and a number of exchanges have been set up to accommodate trades under these schemes. On 23 December 2008, the first Internet-based trade of a sulphur dioxide emission right was concluded on the Tianjin Emissions Exchange.
China has also developed a Renewable Energy Law, which came into effect on 1 January 2006. The law aims to boost China’s renewable energy capacity to 15% by 2020 and outlines a commitment to invest US$180 billion in renewable energy over this period. The law requires power grid operators to purchase all the electricity generated by approved renewable energy facilities located in its service area, and to provide grid-connection services and related technical support. To overcome the high costs of renewable energy power generation, compared with conventional power, the law establishes price support mechanisms, which vary for each type of renewable energy, and cost sharing arrangements. Additionally, the law offers financial incentives, such as a national fund to foster renewable energy development, and discounted lending and tax preferences for renewable energy projects. The PRC government has also set a national target to improve energy efficiency by 20% over 2005 levels by 2010, and several other individual targets to encourage the uptake of renewable energy technologies and energy efficiency measures.
JAPAn
emissions tradingJapan is the latest country to announce the proposed introduction of a mandatory domestic cap-and-trade emissions trading scheme. Voluntary emissions trading has been taking place in Japan for a number of years under schemes operated by the Japanese Ministry of Environment and the Japan Federation of Economic Organisations (the latter known as the ‘Keidranan Scheme’). In June 2008, the Japanese Prime Minister announced that Japan would introduce mandatory emissions trading on a trial basis as part of Japan’s announced policy plan to cut greenhouse gas emissions by between 60% and 80% by 2050. An outline of the emissions trading scheme was published in July 2008 and participants are now being solicited. At present, participation in the Trial ETS is completely voluntary, and no penalties will be imposed on participants that fail to achieve their emission reduction targets.
Independently of the national government’s coordinated efforts to combat global warming, the Tokyo metropolitan government has recently passed legislation9 that will introduce a mandatory ETS within the capital in April 2010. The cap-and-trade programme will impose carbon dioxide emission reduction targets on entities that
9. Which will revise the Tokyo Environmental Security Ordinance.

58
consume 1,500 kilolitres of crude oil equivalent per year. This is likely to affect approximately 1,300 large local business establishments. Through the Scheme’s introduction and strengthening of complementary policy measures, the Tokyo metropolitan government aims to achieve its target of cutting annual CO2 emissions in the capital by 25% – or 15 million tonnes – from 2000 levels by 2020.
The Japanese government has also recently enacted specific legislation to allow financial institutions to participate in emissions trading (which was not previously permitted under Japanese law), opening up significant opportunities for financial institutions in Japan’s growing carbon market.
other Japanese policy/legislationOn the policy front, Japan has announced a ‘Low-carbon Technology Plan’, through which the country will invest US$30 billion over the next five years, as well as the establishment of a financial mechanism called the ‘Cool Earth Partnership’ under which Japan will provide US$10 billion to assist the implementation of energy efficiency measures and renewable energy technologies in developing countries.
Once world-leader in the development of solar technologies, Japan has also set ambitious (though non-binding) solar energy generation goals that aim to achieve a tenfold increase in present generation by 2020 and an increase of forty times present levels by 2030. It is anticipated that meeting these targets will require the installation of a number of mega solar power generation facilities as well as uptake of solar technologies in more than 70% of newly built, privately owned homes. Japan has also committed to a number of demand-side abatement measures, including its pledge to replace all incandescent light bulbs with energy-efficient globes by 2012, create incentives for the development and use of energy-efficient technologies, and introduce mandatory energy efficiency requirements for residential and commercial buildings. The Japanese government also intends to consider the prospect of introducing tax incentives for restricting CO2 emissions from cars, household appliances and housing construction.
AusTRAliA
carbon Pollution Reduction schemeAustralia is currently undergoing a significant legal and political shift in its approach to climate change and the reduction of greenhouse gas (GHG) emissions. One of the Labor government’s first official acts when elected to power in late 2007 was to ratify the Kyoto Protocol, thereby drawing Australia into the existing Kyoto Protocol framework of mandatory emission reduction targets and flexible mechanisms with which to meet those targets. Australia is now required under international law to comply with its Kyoto target, which allows for an 8% increase in Australia’s greenhouse gas emissions above 1990 levels. It has also committed itself to a long-term target of reducing greenhouse gas emissions to 60% of 2000 levels by 2050. Although a recent assessment indicates that Australia is on course to comply with its 2012 Kyoto target, achieving compliance is dependent upon the success of a number of domestic greenhouse gas reduction measures.
The centrepiece of Australia’s greenhouse gas reduction strategy will be the introduction of a domestic cap-and-trade emissions trading scheme, which is scheduled to commence on 1 July 2010. Detailed design features of the ETS, which will be known as the Carbon Pollution Reduction Scheme (CPRS), are set out in the Federal government’s Carbon Pollution Reduction Scheme: Australia’s Low Pollution Future White Paper (the White Paper) which was released on 15 December 2008. The White Paper sets out the Federal government’s policy position in relation to a mid-term target range for national emissions (a 5% to 15% reduction below 2000 levels by 2020) and outlines the scheme architecture, including the assistance that will be provided to certain particularly affected industries and households to smooth the transition to a lower-carbon economy.
The White Paper confirms that the Scheme will have broad coverage, capturing approximately 75% of Australia’s emissions and imposing obligations upon around 1,000 entities in the stationary energy, transport, industrial processes and waste sectors. Fugitive emissions from oil and gas production will also be covered, with forestry covered on an opt-in basis. The agriculture sector will be considered for inclusion in 2013. Those facilities in covered sectors whose Scope 1 emissions are greater than 25,000 tonnes of CO2-e will be required to acquire and acquit permits under the Scheme. The government has indicated that legislation implementing the emissions trading scheme will be tabled in Parliament around mid-2009, following a public consultation on an exposure draft of the legislation which was released in March 2009. Early forward trades of emission reductions are already occurring in Australia in anticipation of the Scheme’s commencement.

59The Carbon jigsaw seCTion 5: Carbon Law
The CPRS will be underpinned by data collected under the National Greenhouse and Energy Reporting Act 2007 (Cth) (NGER Act). This Act, passed on 28 September 2007, imposes mandatory registration and reporting obligations on companies whose greenhouse gas emissions, energy consumption or energy production meet certain thresholds. The reporting year is based on a financial year, with the first reporting year having commenced on 1 July 2008.
other Australian policy/legislationThe uptake of renewable energy is promoted in Australia in several ways, both at the national and state level. The primary national incentive is a renewable energy target with tradeable renewable energy certificates. Australia has committed to ensuring that 20% of the country’s electricity supply comes from renewable energy by 2020. To fulfil this commitment, the government is establishing an expanded National Renewable Energy Target (NRET) scheme in cooperation with state and territory governments. Draft legislation to expand the existing Mandatory Renewable Energy Target (which had a goal of 9,500 gigawatt hours (GWh) of new renewable energy generation) was released by the Federal government and the Council of Australian Governments for public consultation in December 2008.
The changes set out in the draft legislation are proposed to take effect from 1 July 2009, with a proposed scheme end date of 1 January 2031. The proposed legislation sets out annual targets for renewable energy, expressed in gigawatt hours (GWh). The targets ramp up slowly each year from 2010, and more quickly from 2015 to 2020. The targets then plateau at 45,000 GWh until 2024, before ramping down to 23,000 GWh by 2030. There are no specific targets proposed for different types of renewable energy. Once developed, the Scheme will replace the existing Mandatory Renewable Energy Target and various state targets.
Other initiatives designed to complement the NRET Scheme include a $500 million Renewable Energy Fund, which will develop, commercialise and deploy renewable energy in Australia; $150 million for solar and clean energy research; and more than $500 million for the Solar Cities, National Solar Schools, and Green Precincts initiatives. To promote the uptake of solar energy, feed-in tariffs have recently been adopted by a number of state governments.
Energy efficiency regulation is another (relatively recent) development in Australian jurisdictions. Victoria and South Australia both have energy efficiency targets that are underpinned by legislation, while other states are in the process of developing such schemes. The Commonwealth, New South Wales, Victoria and Queensland all have energy efficiency reporting schemes underpinned by legislation.
new ZeAlAnd
emissions tradingShortly after the election to power of the National Party in November 2008, the incoming Prime Minister agreed to pass legislation immediately putting the nation’s forthcoming cap-and-trade carbon trading scheme on hold, pending a review of all proposed carbon reduction measures. The government has now announced that no such legislation will be passed. Instead, the Emissions Trading Scheme established under the previous Labour leadership (NZ ETS) will continue in its current form while a special select committee conducts a review of the scheme. Although the select committee review is considering alternatives to an ETS, post-election comments by the Prime Minister, John Key, and senior party members strongly suggest that the newly elected government intends to proceed with an ETS. The government has indicated that any amendments to the NZ ETS arising from the review will be passed into law by September 2009.
The cap-and-trade scheme as currently proposed covers all six greenhouse gases, but will be phased in sector by sector over five years, starting in 2008 with the forestry industry (which has been covered retrospectively as from January 2008). The stationary energy sector (which includes includes emissions from fuel consumption for electricity generation, fuels consumed in the manufacturing, construction and commercial sectors, and other sources like domestic heating )and industrial processes sector will be brought under the scheme in 2010, and it is proposed that a generous free allocation of permits be awarded to major industries that cannot pass on their emissions costs to cover price increases in electricity, gas and coal. Liquid fossil fuels (mainly transport) were originally intended to be brought into the scheme in 2009, however this date has been pushed back to 2011. There will be no free allocation of permits to the transport industry, as price increases will be passed through to consumers. Controversially, agriculture, waste and other emissions will not be covered until 2013. Agriculture alone is responsible for 49% of New Zealand’s total emissions, but the late start date is because the government is honouring previous representations to the sector that it would not tax agriculture before 2013. The proposed penalty for non-compliance is NZD 30 for each unit that is not surrendered by the due date.
It is intended that the NZ ETS will allow both sales to, and purchases from, international trading markets. There are some exceptions on acceptable unit types, for example, the proposed legislation specifically excludes CERs from nuclear projects, and temporary CERs from forestry CDM projects. There are also restrictions on the surrender of any imported AAUs after 2012. According to the nation’s climate change minister, linking the scheme will widen the market for carbon offsets available to local industry and help reduce carbon prices.

60

61The Carbon jigsaw
secTion 6:
climate futures
‘Climate Futures’ was prepared for The Carbon Jigsaw by Forum for the Future. © Forum for the Future, 2009

62
ABouT The AuThoRs
Forum for the Future – the sustainable development charity – works in partnership with over 120 leading organisations in business and the public sector. Our vision is of business and communities thriving in a future that’s environmentally sustainable, economically prosperous and socially just. We believe that a sustainable future can be achieved, that it is the only way business and communities will prosper, but that we need bold action now to make it happen. We play our part by inspiring and challenging organisations with positive visions of a sustainable future, finding innovative and practical ways to help realise those visions, training leaders to bring about change, and sharing success through our communications.
www.forumforthefuture.org
63The Carbon jigsaw seCTion 6: CLiMaTe FUTUres
Climate change will affect the very fo undations of society and so it will fundamentally change the context in which businesses work.
The scientific understanding of the physical impacts of climate change is advancing. We know much less, however, about how people, communities, countries and economies will respond to climate change – and, therefore, what climate change will mean for business.
Forum for the Future, the sustainable development group, together with HP Labs, the advanced research group of Hewlett Packard, have spent over a year looking at exactly that. The result was Climate Futures, which describes five different scenarios, all set in 2030, each responding to climate change in different ways. These scenarios are not predictions, but plausi-ble futures we can use to understand what to do now.
This section is organised into:
factors affecting the future (identifying seven factors •important to how global society responds to climate change)
five scenarios for 2030•
implications (with four key recommendations).•
introduction
64
factors affecting the future
5. The availability of natural resourcesClimate change is far from the only environmental issue that the world will face in the years to 2030. We will also have to deal with worsening resource shortages, with the supply of energy being a key variable. Energy policy may work with the grain of climate change policy, if it means that investment in renewable sources increases, or against it, if it makes coal irresistible. The availability of water, productive land, timber, marine fisheries and minerals could all falter and affect how the world responds to climate change. And against the backdrop of a rapidly expanding human population – another billion-and-a-half people on top of today’s 6.7 billion – we could see environmental refugees in much larger numbers than today.
6. The political response, at a national and international levelThe most immediate question in this area is whether there will be a successor to the Kyoto Protocol. In the medium term, if there is no settlement, then the separate initiatives of countries and regions such as the European Union will be all the more important. What priority will different countries give to climate change policy, and to what extent will other policy priorities conflict with it? Will policies be primarily market-based or more directly interventionist? What emphasis will be placed on changing citizen behaviour? Policy is one thing, and enforcement another – it is possible that laws are passed and treaties signed but not enforced, perhaps owing to poor governance. Eventually, if policy on reducing emissions falters, will the priority shift to adaptation measures?
7. The technologies that are developed and usedTechnology is an important shaper of the future response to climate change. To envisage possible futures, we needed to understand what new technologies might be developed and used that would help reduce greenhouse gas emissions, reduce the impact of climate change and help the world adapt to very different climatic conditions from those today. We thought about how energy is produced; methods of capturing and sequestering carbon; technologies to intervene directly in the climate system (geo-engineering); ways to improve efficiency; low-carbon mobility solutions; and options for reducing or ‘virtualising’ general consumption.
The success of any of these approaches will be determined by many factors, not just the availability of the technology. Levels of investment, the speed of technological development, the speed and extent of implementation, technical effectiveness and public acceptability of the technology are all important.
All these issues are played out differently in the five Climate Futures that follow.
we have created seven categories for the factors that will shape the future response to climate change.
1. The direct impacts of climate change
There are some details about climate change we do not yet know – how quickly we will be affected, exactly where different impacts will be felt or whether we are nearing a tipping point that will irreversibly change our climate for ever. Yet climate change is a scientific certainty. We know that over the medium and long term temperatures will rise, the frequency of storms will increase and rainfall patterns will shift, dousing some areas and leaving other areas parched. Ecosystems will be destabilised, ice caps and glaciers will melt and sea levels will rise. These impacts form the backdrop to all our scenarios.
2. Public attitudes to climate changeHow the public at large perceive climate change will have a profound influence over what governments, businesses and other institutions feel they can do. Attitudes will be informed by how climate change science is communicated, and how the issues are represented, discussed and responded to in public debate.
Will people be willing to change their behaviour? Do they trust what the media say? How visible are the impacts of climate change, both environmental and in terms of human suffering? Different answers to these questions are explored in the scenarios.
3. how the business community respondsTo what extent will businesses accept and promote the shift to a low-carbon economy? Will climate change be seen as an opportunity for new business as well as a risk to current models? There are a number of pathways for the future of business, each explored in a different scenario. There could be a renewed focus on efficiency and on developing the economy to create the wealth to deal with climate change. There could be a fundamental shift in business models towards a service economy. Or there could be a values-shift that completely changes the role of business in society. The alternatives are that business either becomes, in effect, an agency of government, or fights for autonomous survival.
4. The nature of the global economyAt the time of writing, the global economy faces great uncertainty. Climate change will affect the economy at least as much as the ‘credit crunch’ and the world’s response to climate change will depend on how national economies are set up. An economy that is globally very interconnected will have a different response to one that is regionally based. A partial retreat in globalisation is a very real prospect in the decades to come, and could lead to a decline in international cooperation. We will also see the emergence of powerful new economies and economic blocs. The economic models adopted by countries such as China, India, Brazil and Russia will be critical in shaping the response to climate change.

65The Carbon jigsaw seCTion 6: CLiMaTe FUTUres
five scenarios for 2030
scenARio one: efficiency fiRsT
Rapid innovation in energy efficiency and novel technologies have enabled a low-carbon economy with almost no need for changes in lifestyle or business practice.
The power of innovation has revolutionised the economy. A high-tech, low-carbon transformation of industry is delivering dramatic cuts in greenhouse gas emissions while managing to sustain economic growth. Across the world, innovative business solutions appear to sustain the insatiable demands of eight billion people to consume more, grow richer and live longer. The result is an increasingly individualistic, consumerist and fast-moving world. High levels of economic growth in the global economy for decades have been interrupted only by relatively minor downturns related to the availability of resources, and growth in the global South has been particularly marked.
Nonetheless, overall levels of growth mask a growing divide between rich and poor people. The world has seemed close to overheating for years, but somehow keeps going through developing novel efficiencies and more sophisticated ways of doing things, always adding to the complexity of systems. Some call this a golden age of technology and freedom, others call it a very shaky house of cards.
Illustrations of technological developments include:
artificially-grown flesh that feeds hundreds of millions •of people
massive desalination plants in the Middle East and •North Africa that soak up vast quantities of solar energy and irrigate the desert
supercomputers that advise governments on policy and •businesses on strategy and even influence personal lifestyle choices – accurately testing ideas against virtual societies
nanotechnology, which has developed to the point •where ‘smart dust’ is used for real-time environmental monitoring, security and disaster relief
the protection of America’s eastern seaboard from •storms by eco-concrete walls that generate power from waves and tidal surges.
Extrapolating from the factors outlined above, we created five possible scenarios.
Efficiency first – rapid innovation in energy efficiency and novel technologies have enabled a low-carbon economy with almost no need for changes in lifestyle or business practice.
Service transformation – a high price of carbon has ushered in a revolution in how people’s needs are satisfied.
Redefining progress – new priorities of ‘well-being’ and ‘quality of life’ are emerging across the world as more sustainable forms of living become established.
Environmental war economy – tough measures have been adopted to combat climate change, pushing markets to the very limit of what they can deliver.
Protectionist world – globalisation has gone into retreat and countries focus on security and access to resources at any cost.

66
scenARio Two: seRvice TRAnsfoRmATion
A high price of carbon has ushered in a revolution in how people’s needs are satisfied.
Carbon-emissions quotas are among the most important and expensive commodities in the world today, unleashing unprecedented levels of creativity across the global economy. Companies have rewritten their business models to meet underlying needs, often by selling services instead of products. This is a new type of consumerist world, one with a ‘share with your neighbour’ ethos. Europe led the way with its Energy Independence Initiative, driven first by concerns over energy security. The continent’s successful new models in infrastructure and business have been exported around the world. Today, washing machines are too costly, so advanced collective laundry services are more popular. Individual car ownership is unaffordable and undesirable, but rent-a-bike and rent-a-car are booming and mass public transit is hugely successful. Rental services – which offer maintenance and waste collection all-in-one – are widespread for electronic goods.
India is a service hub and has prioritised the roll out of ‘zeta-broadband’ to its villages, ranking it above investment in roads. The dramatic transformation in business has been painful for some, with rising unemployment in the old high-carbon sectors. The US legacy of individualism – from urban sprawl to cleantech innovation – has resulted in a comparative struggle to cope with the effects of stripping sources of carbon pollution out of its economy. Booming mega-cities are only just managing to cope and fuel poverty is a huge problem.
Illustrations of developments include:
NATO’s definition of the breaking of the 2020 Beijing •Climate Change Agreement as an attack on all its members, to be defended by military force
the abandonment of Central Australia and Oklahoma, •owing to water shortages, while climate-change extremist parties clamour for compensation
the world’s first Virtual Olympics – where athletes stay •at home, competing against each other in virtual space with billions of spectators
specialist companies that offer a ‘rent-a-molecule’ •business, lending a material to a manufacturer for return at the end of the product’s life
campaigns in China that have created a new generation •of patriotic vegetarians whose energy-efficient diet is cheap, tasty and popular.
scenARio ThRee: Redefining PRogRess
New priorities of ‘well-being’ and ‘quality of life’ are bubbling up across the world as more sustainable forms of living become established
This is a ‘well-being economy’ that highly values meaningful work, low-impact lifestyles, more time with family and friends, better health outcomes, creative educational experiences and a stronger sense of community. Countries prioritise economic and social resilience over the idea of economic growth. During the global depression of 2009–18, new forms of living were born out of necessity. Individuals were forced to scale down consumption and prioritise the satisfaction of immediate needs. Communities favoured local knowledge and looked to their own members to provide goods and services. As the world emerged from the depression, these new ways of living survived: from lower impact lifestyles to advanced networks that informally provided for needs at a local level.
This is not a post-capitalist society – people work, consume and profit in markets, but citizens view money as a means to different ends and active governments tightly regulate the economy. Nor do communities experience isolation, cut off from the outside world.
Mindsets are strongly connected worldwide through global communications – different cultures learn from one another, Eastern mindsets infuse with the West, and diverse faith communities find common cause in advocating simplified consumption patterns and more sustainable lives.
Nonetheless, happiness is not universal. ‘Free-riders’ – quick to abuse the goodwill of others – profit from collective agreements, plunder resources and exploit the vulnerable. Several large cities have set themselves up as ‘havens of real capitalism’ and some governments have adopted an aggressive ‘pro-growth’ stance. In the communities hit hardest by the depression, many poor and excluded people remain isolated, shunning offers of support in a daily struggle to survive.
Illustrations of developments include:
competition between countries to score highest in the •World Bank’s Well-being Index
a promise by South Korea’s President of ‘zero •economic growth’ while focusing resources on improving quality of life
the reduction of working hours – in the US most people •work 25 hours a week and do up to 10 hours voluntary work in their communities or online; the EU Working Time Directive sets a limit of 27.5 hours a week.

67The Carbon jigsaw seCTion 6: CLiMaTe FUTUres
ICT that allows people to monitor their fitness, stress •levels and emotional health, and to share details with friends; Empathy Engines are selling fast in China, allowing instantaneous sharing of emotions between dispersed families
‘slower solutions’, which are now status symbols – labels •proudly display how long products took to make
the mayor of Singapore’s daily scrutinisation of ‘hot •spot maps’ of suicide rates and prescriptions for anti-depressants, enabling real-time responses.
scenARio fouR: enviRonmenTAl wAR economy
Tough measures have been adopted to combat climate change, pushing markets to the very limit of what they can deliver.
This is a world that woke up late to climate change. Efforts to broker a post-Kyoto agreement faltered, and instead different regions of the world pursued their own priorities. As the environmental impacts began to increas e, however, the world started to come together. In 2017 a global pact was signed, but even so the global political community was forced into reactive strategies. Governments began to rely on hard policy to change how businesses worked and how people lived their lives. As time went on, the state took a stronger and stronger role, rationalising whole industry sectors to reduce their climate change impacts, and even putting ‘Carbon Monitors’ in people’s homes to watch their energy use.
Governments pushed markets to the very limit of what they could deliver. In different ways in different countries, economies were forcibly reorientated to focus on dealing with climate change, in much the same way that economies are forced to change in times of war. In most cases this has happened gradually, ratcheting up over time, with citizens surrendering control of their lives piecemeal rather than all at once, as trading regimes, international law, lifestyles and business have responded to the growing environmental crisis. And so in 2030, greenhouse gas emissions are beginning to decline, but the cost to individual liberty has been great.
Illustrations of developments include:
a requirement for licences to have children, in some •countries, awarded on a points system; climate-friendly behaviour earns extra points
government bans on personal car ownership and laws •to force citizens to replace convector ovens with microwaves; mechanisms to switch off kettles and washing machines automatically when households exceed their energy quotas
movement of populations – refugees from Bangladesh •and the Pacific make up 18% of New Zealand’s population, while others are being relocated to permanent settlements on the Antarctic Peninsula, which is projected to have a population of 3.5 million by 2040
the criminalising, in some countries, of publicly •questioning the existence of human-initiated climate change
an enormous rise in the price of oil, which exceeded •$400/barrel in 2022, making shipping and aviation prohibitively expensive, and leading to a collapse in international trade.
scenARio five: PRoTecTionisT woRld
Globalisation has gone into retreat and countries focus on security and access to resources at any cost.
Globalisation has entered a phase of historic retreat in this divided world. Despite the Climate Agreement of 2012, following accusations of ‘cheating’ in the carbon markets and the building of ‘secret’, undeclared power stations, cooperation collapsed into factionalism. A poorly coordinated response to climate change combined with violent resource wars has fractured the world into protectionist blocs.
Climate change acts as a ‘risk magnifier’ – adding to the strains on communities unprepared for its impact s. The resulting competition and conflict drive up prices, discourage trade, hamper long-term planning and spread disease, maintaining hunger and misery for millions. Mitigating further climate change is all but abandoned as the pressing needs of the current reality are prioritised. Governments focus on securing supplies – hoarding assets, curbing exports and protecting their own economies through high import tariffs. Violent factions and cyber-terrorists capitalise on the chaos to promote and fund their nationalist causes – scrambling for resources, paralysing communication networks, and launching occasional but devastating bio-chemical attacks.
Communications systems such as the Internet have fragmented. A small group of academics preserve a global network, their dream being to ‘re-unite’ the world. Yet the experience for many today is one of financial hardship and empty markets; rising nationalism and social unrest; restrictive security; and sustained conflict over precious supplies.

68
Illustrations of developments include:
conflicts over water, which have triggered devastating •bio-chemical warfare in the Middle East and Africa
wars over new sources of oil, gas and gold in the •melting North-West passage, which are being waged by soldiers fighting on behalf of both nations and businesses
an invitation to Morocco to join the EU in exchange for •exclusive access to solar energy supplies for Member States through to 2050
cyber-terrorism, whose agents target businesses from •safe havens in collapsed states, bankrupting two multinationals in a series of massive data thefts
protection rackets in which criminals levy ‘taxes’ in •European cities in return for protection from attack by rival gangs
new diseases and pandemics, incubated by a warmer •world, that force the closure of borders
the firm establishment of AsiaNet as a faster, cheaper, •more reliable alternative to the ‘American Web’.

69The Carbon jigsaw seCTion 6: CLiMaTe FUTUres
implications – ‘the climate change years’
explore opportunities for low-carbon technology, •supporting and monitoring innovation in this area
explore different drivers of technological development •– benefits to society and the environment may present commercial opportunities in the future.
Be PART of The soluTion
The response to climate change we see in 2009 is trivial compared with what is required. But taking action now can open up new paths of hope and opportunity. Businesses should:
not be paralysed by the scale of the challenge but should devote boardroom time to overcoming barriers to action
help create a positive future by lobbying for change, identifying new business opportunities, developing partnerships to find solutions and talking publicly about the importance of urgent action.
suPPoRT gloBAl AgReemenT
Policy on climate change developed now is more likely to use liberal market interventions – if we wait for climate change to get worse, tighter regulation is more likely. And if we wait to act on climate change, the global institutions we may need to help us could be undermined by the impacts of climate change. Furthermore, the longer we leave it to tackle climate change, the bigger the problem gets and the more likely it is that climate change policy will work against the grain of other policy. Businesses should:
support changes to markets now, to avoid tight •regulatory constraints later
support the ‘right kind’ of globalisation, by maintaining •fair global trade, fostering links between cultures and finding ways to share the proceeds of growth within and between countries
take a systematic view of the operating context and •design strategies for a climate-changing world, not just climate change.
It is impossible to predict the future, but forward-looking organisations can plan for different futures.
Indeed, we think this is essential if we are to navigate climate change successfully and promote sustainable development.
Our response to the scenarios is a set of five broad implications, derived from what some or all of the scenarios have in common, or based on insights gained throughout the process of building the scenarios.
PRePARe foR A RAdicAlly diffeRenT fuTuRe
We know that change is coming. As politics, society and attitudes transform in response to climate change, or as the climate system that we depend on transforms, ‘business as usual’ is not an option. Businesses should:
be open to the future – build long-term planning into •the business
not bet on one version of the future – long-term •strategies should acknowledge uncertainty and build in adaptability
prepare now – don’t wait for the crisis to intensify.•
seiZe oPPoRTuniTies foR leAdeRshiP
Addressing climate change offers companies opportunities for leadership that will benefit them and society. Businesses can:
look for leadership opportunities that give immediate •returns, such as driving carbon efficiency through the supply chain
acknowledge the long-term benefits of a leadership •position, for example in terms of branding or government relations
talk to investors about climate change, and emphasise •the long-term commercial necessity of taking action.
emBRAce TechnologicAl soluTions
Technology is an important part of the response to climate change. Although some technologies – energy-saving, renewables and ICT – look successful in a range of different futures, we cannot be sure which will be most effective. Businesses can:
plan to escape from high-carbon technology by •identifying what they are using and making plans to replace it

70

71The Carbon jigsaw
secTion 7:
The science of climate change

72

73The Carbon jigsaw seCTion 7: The sCienCe oF CLiMaTe Change
There is a vast body of conclusive evidence that the climate is changing and that the earth is warming.
Much has been written about climate change since the late 1990s’ in the last decade and a lot of the scientific comment has been either equivocal or too complex. As a result, there is a reasonable degree of confusion in the community about causes, about how and where impacts are occurring, and what the future holds. In addition to this, there have been ‘climate sceptics’ who not only query whether the climate is changing at all but also query whether, if it is changing, human activities are responsible for this.
Nonetheless, recently a consensus has emerged. There is a vast body of conclusive evidence that the climate is
changing and that the earth is warming. The latest United Nations Inter-governmental Panel on Climate Change (IPCC) findings provide overwhelming evidence of this. While there is still limited dispute about whether the change is anthropogenic, governments and supranational bodies such as the United Nations agree that significant evidence suggests the climate is changing owing to human activity and their policies are directed to encouraging behavioural change on the part of the wider community. The emphasis on change has been aimed primarily at the developed world, because it is the developed world that is responsible for the historic rise in greenhouse gas concentration in the atmosphere and should therefore bear the major responsibility for addressing the issue in the short term.
introduction
how the climate has changed Source: Intergovernmental Panel on Climate Change, Fourth Assessment, Climate Change 2007, Synthesis Report.

74
the Earth, approximately 70% of the energy stays on the planet, absorbed by land, oceans, plants and other things. The other 30% is reflected into space by clouds, snowfields and other reflective surfaces. Some of this energy escapes into space, but with the ‘enhanced’ greenhouse effect more of it is being reflected back down to earth, its escape blocked by the increased concentration of carbon dioxide, methane gas and other greenhouse gases in the atmosphere. As the concentration of these gases increases in the atmosphere, more heat is being trapped.
Scientists believe that if global average temperatures rise by no more than 2°C, we can avoid the most dangerous impacts of climate change. If temperatures exceed this 2°C rise, climate change will become critical. At a greenhouse gas concentration of 450 parts per million, it is generally accepted that it will be possible to stay below the 2°C threshold, which is considered the ‘tipping point’ at which catastrophic climate change would occur.
what is climate change?
Heat-trapping ‘greenhouse gases’ in the atmosphere let through short-wave radiation from the sun but absorb the long-wave heat radiation coming back from the Earth’s surface and re-radiate it. These gases act like a blanket – and keep the surface and the lower atmosphere about 33°C warmer than they would be without them. By pumping anthropogenic greenhouse gases into the atmosphere, human beings are altering the process by which naturally occurring greenhouse gases trap the sun’s heat before it can be released back to the atmosphere. About 80–90% of the Earth’s natural greenhouse effect is due to water vapour, a strong greenhouse gas.
It is predominantly the carbon dioxide concentration in the atmosphere that is increasing, owing to the burning of fossil fuel, deforestation and rainforest burning. This is the anthropogenic portion of the greenhouse effect, and it is believed by many scientists to be responsible for the global warming since the mid-19th century. When the sun’s rays hit the Earth’s atmosphere and the surface of
About 30% of incoming solar energy is reflected by the surface and the atmosphere.
Only a small amount of the heat energy emitted from the surface passes through the atmosphere directly to space. Most is absorbed by greenhouse gas molecules and contributes to the energy radiated back down to warm the surface and lower atmosphere. Increasing the concentrations of greenhouse gases increases the warming of the surface and slows loss of energy to space.
ATmosPheRe
suRfAce
sun
ATmooosssPPPhhheeeRRReee
ssuuRRRRffAAccee
The earth’s greenhouse effect
About half the solar energy absorbed at the surface evaporates water adding water vapour, the most important greenhouse gas, to the atmosphere. When the water condenses in the atmosphere it releases the energy that powers and produces rain and snow.

75The Carbon jigsaw seCTion 7: The sCienCe oF CLiMaTe Change
what are the greenhouse gases?
Relative potency of each greenhouse gas (global warming potential)
greenhouse gas Chemical name 2001 gwP
Carbon Dioxide CO2 1
Methane CH4 23
Nitrous Oxide N2O 296
Trifluoromethane (HFC-23)
CHF3 12,000
Pentafluoroethane HFC-125)
C2HF5 3,400
HFC-134a 1,300
HFC-143a 4,300
HFC-152a 120
HFC-227ea 3,500
HFC-236fa 9,400
Perfluoromethane CF4 5,700
Perfluoroethane C2F6 11,900
Sulfur Hexafluoride SF6 22,200
Carbon dioxide receives the greatest attention, but there are other greenhouse gases, which are more intense in their global warming potential per molecule.
Carbon dioxide and water vapour are the biggest contributing ‘greenhouse gases’, but methane, nitrous oxide and hydrofluorocarbons play a significant role as well. The warming effect of any one gas is a function of the amount of that gas released, its warming potential (determined by how sensitive it is to infrared radiation) and the length of time the gas exists in the atmosphere before it breaks down (light causes gases to break down to their component parts). Carbon dioxide receives the greatest focus in terms of climate change discussion because it has the greatest concentration in the atmosphere, and its concentration is increasing the most. But other greenhouse gases are more intense in their global warming potential per molecule, eg methane is 23 times as potent as carbon dioxide.

76
Human beings have been increasing the concentration of CO2 and other greenhouse gases in the atmosphere since the industrial revolution began, primarily through the burning of fossil fuels and long-term deforestation. This has resulted in the thickening of the greenhouse ‘blanket’.
Direct temperature records dating back to the middle of the last century are considered reliable enough to establish that recent years’ temperatures are warmer than any others, since direct measurements began. Global greenhouse gas emissions due to human activities rose an extraordinary 70% between 1970 and 2004.
what is causing climate change?
what human activities are responsible for climate change? Source: Intergovernmental Panel on Climate Change, Fourth Assessment, Climate Change 2007, Synthesis Report

77The Carbon jigsaw seCTion 7: The sCienCe oF CLiMaTe Change
what is the evidence of warming?
Although some evidence was available as long ago as a decade that global temperatures and sea levels were changing, it is only in the last few years that the evidence has mounted significantly.
The impacts that have been monitored the longest are:
the thawing of permafrost •
later freezing and earlier break-up of ice on rivers and •lakes
lengthening of mid- to high-latitude growing seasons •
poleward altitudinal shifts of plant and animal ranges•
decline of some plant and animal populations •
earlier flowering of trees•
earlier emergence of insects and earlier egg-laying in •birds
retreat of mountain glaciers•
bleaching of coral reefs•
changes in temperature, sea level and northern •hemisphere snow cover.

78
Extreme weather events have the most impact on people but trends are hard to prove, often because there are multiple causes.
Flooding events, caused by greater precipitation, are increasing; we would expect hurricanes and typhoons to increase in a warmer world but there is insufficient data as yet to prove direct causality. All weather events have multiple causes. Unfortunately, the extent to which greenhouse gases will warm the earth will become clear only when sufficient years of warming data distinguish a solid trend above other ‘noise’ and influences. In the meantime, scientists are cautious about predicting climate change impacts for different areas of the globe.
Nonetheless, there are impacts that the scientific community is prepared to predict. One of these is that a quarter of the world’s known animals and plants – more than a million species – will eventually die out because of the warming predicted for the next 50 years.
Paradoxically, northern Europe is predicted to become cooler. This is because, as the melting of ice from the far north accelerates, the ‘North Atlantic Thermohaline Circulation’ (which draws warm water from the tropics to Europe) is predicted to be ‘turned back’ by the volume of colder water that will flow from the increased melting at the northern polar regions. While scientists do not understand the mechanism well, they do not believe this will occur this century.
In terms of human impacts, there are many, quite conclusive impacts that are predicted:
low lying coastal cities (such as London and Shanghai), •and delta regions (such as Nile Delta, lower Bangladesh and parts of Florida) will be difficult to protect
more hot days and heat waves, which will lead to •increased heat-related deaths
fewer colder days, which will lead to net agricultural •gains for some part of the world
more intense precipitation events will lead to increased •flood, landslide, avalanche and mudslide damage
harsher and longer droughts in some parts of the world •(particularly Africa and Australia)
more intense tropical cyclones•
increased wild fires as a result of more severe droughts•
more variable Asian summer monsoons.•
what are the impacts of climate change?

79The Carbon jigsaw
secTion 8:
climate terminology

80
cARBon
When climate change literature refers to ‘carbon’ it is referring to the broad spread of all greenhouse gases, not just CO2. Although most political will is being directed at reducing the concentration of CO2 in the atmosphere, there is also considerable emphasis on reducing the use and/or creation of methane (generated by rotting vegetable matter) and of hydrofluorocarbons (HFCs) and perfluorocarbons (PFCs) (which are used as refrigerants). In turn, the various carbon markets globally conduct trade in all types of greenhouse gas (see ‘Carbon offsetting’, below).
cARBon dioxide
Carbon dioxide (CO2) is the most common of the greenhouse gases. Though relatively mild in its greenhouse potency compared with other gases, such as methane, this is the greenhouse gas that is growing most rapidly in the atmosphere. It is currently at a globally averaged concentration of approximately 387 ppm by volume in the Earth’s atmosphere. Atmospheric concentrations of CO2 fluctuate slightly with the change of the seasons, driven primarily by seasonal plant growth in the northern hemisphere. Concentrations of CO2 fall during the northern spring and summer as plants consume the gas, and rise during the northern autumn and winter as plants go dormant, die and decay. Carbon dioxide is used by plants during photosynthesis to make sugars, which may either be consumed again for energy or used as the raw material to produce polysaccharides, such as starch and cellulose, and proteins for plant growth and development. It is produced during normal physiological processes by plants, and by all animals, fungi and microorganisms that depend on living and decaying plants for food, either directly or indirectly. It is, therefore, a major component of the carbon cycle. Nonetheless, the reason why the quantity of CO2 is now growing so rapidly is that it is also generated as a by-product of the combustion of fossil fuels. This is the source of carbon dioxide that is worrying scientists most.
cARBon dioxide eQuivAlenT
Carbon dioxide equivalency is a quantity that describes, for a given mixture and amount of any greenhouse gas, the amount of CO2 that would have the same global warming potential when measured over a specified timescale (generally, 100 years). It is usually written as CO2e. Some greenhouse gases have a greater carbon ‘intensity’ than others and therefore a greater impact on climate change per molecule. Methane, for example, is 20 times as intense in its effect as CO2. The stock of greenhouse gases in the atmosphere is usually measured in terms of CO2, partly to make it easier to reckon its overall effect and partly because some of the gases degrade to CO2 over time. Carbon dioxide can linger in the atmosphere for about a hundred years.
cARBon offseTTing
Carbon offsetting has emerged as a way for organisations to cut their emissions indirectly. Carbon offsets are generated from projects that reduce the amount of greenhouse gases entering the atmosphere. To qualify as an offset, the reduction achieved by a project must be in addition to any that would have happened in the absence of the project. As greenhouse gases emitted from any country mix together within the global atmosphere, it is possible to offset by purchasing credits, or paying for emissions reductions projects, in any country – the effect should be the same.
cARBon fooTPRinT
This term describes the total amount of CO2 and other greenhouse gas emissions for which an individual or organisation is responsible. In order to produce a reliable footprint, organisations should follow a structured process to make sure that all possible sources of emissions are identified.
cARBon mARkeT TeRminology
Cap and Trade: national-level or regional-level trading systems whereby a limit, or ‘cap’, is imposed on the amount of greenhouse gas that companies can produce, and by which they are allowed to trade their quota with one another. Unused quotas would be sold on the market to companies that have overshot their capped limit.
Certified emission reductions (CERs) are emission reductions of a unit equal to one metric tonne of CO2 equivalent, which may be used by Kyoto Protocol Annex I countries when working towards meeting their binding emission reduction and limitation commitments under the Kyoto Protocol. CERS must come from projects that have been approved by the Clean Development Mechanism (CDM) executive board (a ten-member board which supervises the CDM).
Verified Emission Reductions (VERs) are generated by small-scale projects that are assessed and verified by third-party organisations rather than through the UN Framework Convention on Climate Change (UNFCCC). Their purpose is to offset emissions where compliance with binding targets is the not the primary motive. Projects can be relatively cheap and in any country, unlike CDM projects, which must be hosted in developing countries (Annex II, UNFCCC).

81The Carbon jigsaw seCTion 8: CLiMaTe TerMinoLogY
cARBon neuTRAl
This term is used to imply that the activity/company has net zero emissions. Because most entities will have caused emissions in their activities, to claim to be ‘carbon neutral’ organisations would need to purchase carbon offsets (see below) to achieve neutrality, that is, emission reduction undertaken elsewhere must be ‘commoditised as a credit’ and purchased by the emitting company as a ‘carbon offset’.
cARBon sink
A carbon sink is a reservoir that can absorb or ‘sequester’ CO2 from the atmosphere, and examples include forests, soils, peat, permafrost, ocean water, and carbonate deposits in the deep ocean. The type of carbon sink most often discussed is the forest. Plants and trees absorb CO2 from the atmosphere in photosynthesis, retain the carbon component as the building block of plant fibre and release oxygen back into the atmosphere. Therefore, long-lived, high-biomass flora, such as trees represent effective carbon sinks as long as they are maintained. The degree to which the positive impacts of ‘sinks’, whether forests or others, can be captured and used in an emissions trading context is still a matter of contentious debate at the Intergovernmental Panel on Climate Change (IPCC) and other forums.
ZeRo cARBon
Zero carbon refers to a realm where no carbon emissions are allowed. The term is increasingly being used in the built environment in relations to homes. A carbon-neutral process is one where any net carbon emissions can be ‘neutralised’ by offsetting, but offsetting is not acceptable in a zero-carbon situation.

TeCh-aF-Cjb
aCCa 29 Lincoln’s Inn Fields London WC2A 3EE United Kingdom / +44 (0)20 7059 5000 / www.accaglobal.com