Embed Size (px)
Citation preview

Accounting Conservatism and Corporate Reporting
in a High Information Asymmetry Environment:
Analysis of Initial Stock Offering Firms
Su Jin Kim
A thesis submitted to the School of Accounting and Finance, the University of Adelaide, in
fulfilment of the requirements for the degree of Doctor of Philosophy
May 2014

i
Table of Contents
Abstract ............................................................................................................................. v
Declaration ...................................................................................................................... vii
Acknowledgements ........................................................................................................ viii
Chapter One: Introduction ............................................................................................ 1
1.1 Background ............................................................................................................. 1
1.2 Research Objectives ................................................................................................ 4
1.3 Motivation ............................................................................................................... 7
1.4 Summary of Major Findings and Implications ....................................................... 9
1.5 Contribution .......................................................................................................... 12
1.6 Thesis Structure ..................................................................................................... 14
Chapter Two: Past Empirical Studies on Accounting Conservatism ...................... 17
2.1 Introduction ........................................................................................................... 17
2.2 Overview of Accounting Conservatism ................................................................ 18
2.3 Accounting Conservatism and Corporate Governance ......................................... 20
2.4 The Economic Consequences of Accounting Conservatism in the Stock Market 24
2.4.1 Conservatism and the Cost of Capital ............................................................ 24
2.4.2 Conservatism and Investment Efficiency ....................................................... 25
2.4.3 Conservatism and Risk of Failure .................................................................. 28
2.5 Conservatism in the Debt Market ......................................................................... 29
2.6 Conservatism in Different Litigious and Regulatory Environments .................... 33
2.7 Conservatism and Information Asymmetry ......................................................... 37
2.8 Criticism of Conservatism .................................................................................... 40
2.9 Defending Accounting Conservatism: the Role of Accounting Information ....... 42
2.10 Summary and Conclusion .................................................................................. 43

ii
Chapter Three: The Effect of Accounting Conservatism on IPO Firms ................. 44
3.1 Introduction ........................................................................................................... 44
3.2 Conceptual Framework and Hypotheses Development ........................................ 45
3.2.1 Accounting Conservatism of IPO Firms ........................................................ 45
3.2.2 Accounting Conservatism and IPO Underpricing .......................................... 47
3.2.3 Accounting Conservatism and Long-term Stock Return Performance of IPO
Firms ........................................................................................................................ 50
3.3 Research Methodology .......................................................................................... 54
3.3.1 Measurement of Accounting Conservatism for IPO Firms ............................ 54
3.3.2 Estimation of CSCOREs ................................................................................. 58
3.3.3 Accounting Conservatism and IPO Underpricing .......................................... 61
3.3.4 Accounting Conservatism and Post-Issue Stock Return Performance ........... 64
3.4 Sample Data and Descriptive Statistics ................................................................. 67
3.5 Empirical Analysis ................................................................................................ 70
3.5.1 Comparisons of CSCOREs between the pre-IPO and IPO year ..................... 70
3.5.2 Testing the Effect of Conservatism on IPO Underpricing ............................. 76
3.5.3 Conservatism and Long-term Stock Return Performance of IPO Firms ........ 80
3.5.4 Additional Tests for an Association between Conservatism and Long-term
Stock Return Performance of IPO Firms ................................................................ 84
3.5.5 Robustness Tests for the Association between Conservatism and Long-term
Stock Return Performance of IPO Firms ................................................................ 87
3.6 Summary and Conclusions .................................................................................... 90
3.7 Tables .................................................................................................................... 92
Chapter Four: The Effect of Accounting Conservatism of IPO Firms on their First
Seasoned Equity Offerings ......................................................................................... 116
4.1 Introduction ......................................................................................................... 116
4.2 Conceptual Framework and Hypotheses Development ...................................... 117
4.2.1 IPO Firms’ Accounting Conservatism and the Probability of Reissuing Stock
............................................................................................................................... 117
4.2.2 IPO Firms’ Accounting Conservatism and SEO Announcement Returns ... 119
4.2.3 IPO Firms’ Accounting Conservatism and SEO Underpricing.................... 121
4.2.4 IPO Conservatism and Post-Issue SEO Performance .................................. 123
4.3 Research Methodology ........................................................................................ 125
4.3.1 IPO Conservatism and the Probability of First Seasoned Equity Offering .. 125
4.3.2 The Effect of IPO Conservatism on SEO Announcement Returns .............. 128

iii
4.3.3 The Effect of IPO Conservatism on SEO Underpricing .............................. 131
4.3.4 IPO Conservatism and Post-SEO Stock Return Performance ...................... 132
4.4 Sample Data and Descriptive Statistics ............................................................... 134
4.5 Empirical Analysis .............................................................................................. 136
4.5.1 IPO Conservatism and the Probability of Issuing a SEO ............................. 136
4.5.2 IPO Conservatism and the Probability of Raising Funds through Divestitures
............................................................................................................................... 140
4.5.3 IPO Conservatism and SEO Announcement Returns .................................. 142
4.5.4 IPO Conservatism and SEO Underpricing .................................................. 147
4.5.5 IPO Conservatism and Long-term Stock Return Performance after SEO ... 150
4.6 Summary and Conclusions .................................................................................. 153
4.7 Tables .................................................................................................................. 156
Chapter Five: Accounting Conservatism and the Post-IPO Status of IPO Firms 180
5.1 Introduction ......................................................................................................... 180
5.2 Conceptual Framework and Hypotheses Development ...................................... 181
5.2.1 Accounting Conservatism and the Survival Rates of IPO Firms ................. 181
5.2.2 Accounting Conservatism and Acquisition Likelihood of IPO Firms ......... 183
5.3 Research Methodology ........................................................................................ 185
5.3.1 Cox Proportional Hazard Model .................................................................. 185
5.3.2 Multinomial Logit Regression Model .......................................................... 188
5.4 Sample Data and Descriptive Statistics ............................................................... 191
5.5 Empirical Analysis .............................................................................................. 193
5.5.1 Conservatism and the Post-Issue Status of IPO Firms: Delisting Rates and the
Probability of Becoming a Target ......................................................................... 193
5.5.2 Additional Tests: IPO Conservatism and the Probability of Corporate
Acquisitions and Acquisition Profitability ............................................................ 198
5.5.2.1 Conservatism and Post-IPO Acquisitions Activity ............................... 198
5.5.2.2 Research Design for the Analysis of Post-IPO Acquisitions Activity .. 199
5.5.2.3 Empirical Analysis of Post-IPO Acquisitions Activity ........................ 201
5.5.2.3.1 Descriptive Statistics.............................................................. 201
5.5.2.3.2 IPO Conservatism and the Probability of Acquiring Another
Firm ....................................................................................................... 203
5.5.2.3.3 IPO Conservatism and the Acquisition Profitability ............. 206
5.6 Summary and Conclusions .................................................................................. 208
5.7 Tables .................................................................................................................. 210

iv
Chapter Six: Conclusion ............................................................................................ 230
6.1 Summary of Findings .......................................................................................... 230
6.2 Contribution and Implications ............................................................................. 235
6.3 Potential Limitations ........................................................................................... 238
6.4 Suggestions for Future Research ......................................................................... 239
Reference List .............................................................................................................. 241
Appendix I: Measure of Accounting Conservatism by Khan and Watts (2009) .. 262
Appendix II: Variance Inflation Factor Analysis for the Regressions Provided in
Chapter 3 ..................................................................................................................... 263
Appendix III: Regression Analysis Testing the Effect of Conservatism on IPO
underpricing ................................................................................................................ 265
Appendix IV: Variance Inflation Factor Analysis for the Regressions Provided in
Chapter 4 ..................................................................................................................... 266
Appendix V: Variance Inflation Factor Analysis for the Regressions Provided in
Chapter 5 ..................................................................................................................... 270

v
Abstract
This thesis investigates whether Initial Public Offering (IPO) firms adopt a high degree
of conservatism in response to investors’ demand for high quality earnings and
subsequently experience increased capital market benefits. The accounting literature
suggests that the enforcement of timely loss recognition under a conservative reporting
policy can mitigate managerial opportunistic behavior reducing information
asymmetries between managers and outside investors (e.g., Watts 2002; LaFond &
Watts 2008). This thesis hypothesizes that such benefits of accounting conservatism
should be more pronounced for IPO firms because there is inherently high information
asymmetry in the IPO market. In particular, financial reports are one of the primary
information sources available for investors that provide information regarding a firm’s
past and expected future performance. As a result, the IPO environment provides an
important research setting to investigate the capital market consequences of accounting
conservatism.
Based on a large sample of U.S. IPO firms over the period from 1990 to 2010, this
thesis investigates whether the extent to which accounting conservatism adopted by IPO
firms can predict: (i) the well-documented IPO market anomalies, IPO underpricing and
IPO long-term stock return underperformance, (ii) the probability of seasoned equity
issue (SEO) in the post-IPO market and the costs associated with the SEO and (iii) the
longevity of IPO firms.
The empirical findings of this thesis suggest that firms adopt a higher degree of
conservatism prior to going public in response to high information asymmetry at the

vi
IPO and issuers adopting higher conservatism incur a lower indirect cost of going
public through less underpricing. The results also suggest that IPO issuers adopting
higher conservatism are less likely to reissue equity within five years of the IPO,
indicating that these firms do not have short-term cash needs soon after the IPO.
However, these firms are more likely to be able to issue their next equity financing on
more favorable terms by experiencing less SEO underpricing and better announcement
returns. Moreover, the results indicate that issuers adopting a higher degree of
conservatism face less risk of failure and survive longer in the stock market. In
particular, these firms are more likely to acquire another entity within five years of the
IPO and their acquisition announcement returns are positively associated with the
extent of conservatism adopted prior to going public.
This thesis makes a significant contribution to the literature on conservatism by
providing empirical evidence that: (i) IPO issuers adopting a higher degree of
conservatism experience various benefits that the capital markets offer in response to
less uncertainty and information asymmetry; and shows (ii) how conservatism can
contribute to resolving information asymmetry problems in the IPO market.
Specifically, this thesis has important implications for accounting standard setters,
policy makers and regulators associated with the IPO market. Against the recent
movements of the Financial Accounting Standards Board (FASB) toward fair value
accounting, the evidence in this thesis suggests that, in the absence of conservatism, the
information quality of financial statements may be jeopardized in the IPO environment,
leading to higher information asymmetry between firm insiders and outside investors.

vii
Declaration
I certify that this work contains no material which has been accepted for the award of
any other degree or diploma in my name in any university or other tertiary institution
and, to the best of my knowledge and belief, contains no material previously published
or written by another person, except where due reference has been made in the text. In
addition, I certify that no part of this work will, in the future, be used in a submission in
my name for any other degree or diploma in any university or other tertiary institution
without the prior approval of the University of Adelaide and where applicable, any
partner institution responsible for the joint award of this degree.
I give consent to this copy of my thesis, when deposited in the University Library,
being made available for loan and photocopying, subject to the provisions of the
Copyright Act 1968.
I also give permission for the digital version of my thesis to be made available on the
web, via the University’s digital research repository, the Library Search and also
through web search engines, unless permission has been granted by the University to
restrict access for a period of time.
------------------------------------------------- -------------------------------

viii
Acknowledgements
First and foremost, I deeply thank my supervisors, Associate Professor Alfred Yawson
and Professor Grant Richardson for their generous support, guidance and understanding
throughout the entire process of my Ph.D. Their great experience and invaluable
expertise helped me address various unexplored issues and moved the thesis forward
whenever I faced difficulties. They also greatly facilitated my motivation and
productivity in completing my thesis by closely monitoring my progress at all times,
and by encouraging me at the right time. Without their dedicated involvement, this
thesis would not have been completed. I would also like to express my special
appreciation to Professor Yossi Aharony for his guidance and tremendous mentoring,
especially in the early stage of my Ph.D.
I also wish to express my gratitude to the academic staff of the Business School for
their advice and support. Special thanks must go to Associate Professor Janice Loftus
for kindly giving her valuable time to answer my questions on various accounting
issues. I also thank Associate Professor Bryan Howieson for his generous support and
encouragement throughout the process. Thanks also go to my fellow Ph.D. students for
their invaluable friendship and support. I am especially grateful to Shan Li and Wayne
Chang for their technical assistance in sorting some of the dataset. I also acknowledge
the editorial assistance by Mollie Braybrook.
My deepest gratitude goes to my family. Special thanks go to my beloved husband,
Greg, for always being supportive, understanding and encouraging throughout the entire
process, especially providing me with great comfort and support whenever I was under

ix
pressure. Without his support and love, this thesis would certainly not have been
possible.
This thesis is dedicated to my loving parents who were devoted to teaching me the great
value of learning and who have always unconditionally supported and encouraged me
throughout my life. Their immense love and support truly helped me keep motivated to
learn and to complete my Ph.D.

1
Chapter One
Introduction
1.1 Background
Accounting standard-setters and scholars have offered various definitions of accounting
conservatism. Traditionally, the philosophy of accounting conservatism is commonly
referred to as “anticipate no profit, but anticipate all losses” (Watts 2002, p. 1). Basu
(1997, p. 7) interprets this adage as the accountant’s tendency to require a higher degree
of verification to recognize good news as gains than to recognize bad news as losses.
Under conservative accounting, the recognition of economic income is deferred until
expected gains are verifiable, while unexpected economic losses are reported
immediately after they become expected (Ball & Shivakumar 2005). The Statement of
Financial Accounting Concepts (SFAC) 21 defines conservatism as follows:
“Conservatism is a prudent reaction to uncertainty to try to ensure that
uncertainties and risks inherent in business situations are adequately considered.
Thus, if two estimates of amounts to be received or paid in the future are about
equally likely, conservatism dictates using the less optimistic estimates…”
(Financial Accounting Standard Board 1980).
Researchers refer to accounting conservatism as asymmetric timeliness of gains versus
losses and suggest that the greater the difference in the degree of verification required
1 SFAC 2 was superseded by SFAC 8 in September 2010. BC3.19 of the SFAC 8 states that prudence or
conservatism, which was the aspect of reliability in Concepts Statement 2, is no longer considered an
aspect of faithful representation because including either would be inconsistent with the concept of
neutrality.

2
for gains versus losses, the greater the level of conservatism (Basu 1997; García Lara &
Mora 2004; e.g., Ball & Shivakumar 2005; LaFond & Watts 2008; Khan & Watts 2009).
Accounting conservatism has been identified as being of two types: (1) unconditional
and (2) conditional conservatism. Unconditional conservatism is referred to as news
independent income conservatism because it results from accounting standards in place
which impose a predetermined understatement of the book value of net assets via
acceleration (delay) of expense (revenue) recognition that is independent of economic
news (Beaver & Ryan 2005; Chandra 2011). For example, unconditional conservatism
includes historical cost accounting, immediate expensing of the costs of most internally
developed intangibles and depreciation of property, plant, and equipment that is more
accelerated than economic depreciation (see Beaver & Ryan 2005).
Conditional accounting conservatism is referred to as news dependent income
conservatism because it requires immediate recognition of economic losses and deferral
of economic gains contingent on the new event involved (Chandra 2011). More
specifically, under conditional conservatism, book values are written down under
sufficiently adverse circumstance via impairment losses, but not written up under
favorable circumstances (Beaver & Ryan 2005). Examples of conditional conservatism
include impairment accounting for intangible and tangible assets or the application of
the lower-of-cost-or-market rule for inventory that requires immediate write-down as
losses when the market price declines below recorded cost, but price increases are
recognized in earnings only through sales transactions (see Beaver & Ryan 2005;
Monahan 2005; Liu 2010).

3
Investors are more concerned about inadequate disclosure and uncertainty in the event
of a bad news event because managers cannot be trusted to provide full disclosure of a
bad news event because of their own interests. On the other hand, managers have
greater incentives to disclose good news earnings voluntarily. As a result, full
disclosures of both good and bad news events are ensured when the manager commits
to a conditional conservative reporting policy that requires timely reporting of bad news
earnings (Guay & Verrecchia 2007; LaFond & Watts 2008). The accounting literature
(see Basu 1997; Ball & Shivakumar 2005; Beaver & Ryan 2005; Qiang 2007; Dhaliwal
et al. 2014) documents that contracting and monitoring concerns primarily induce
conditional conservatism. This is because timely loss recognition forces managers to
provide loss information that they are more reluctant to reveal in a timely fashion and
alleviates managers’ incentives to report upward-biased accounting numbers.
Accordingly, previous studies suggest that timely recognition of economic losses under
conditional conservatism is an important attribute of financial reporting quality,
reducing information asymmetry between managers and outside investors (Ball &
Shivakumar 2005; Roychowdhury & Watts 2007; Li 2008; Hui et al. 2009).
This thesis investigates the effect of accounting conservatism in the equity market
where there is high information asymmetry. In particular, this thesis provides important
insights into whether the issuers of Initial Public Offerings (IPOs) who adopt higher
conservatism, forgoing managerial incentives from reporting higher earnings,
experience increased stock market benefits. Previous studies on conservatism provide
evidence of various stock market benefits such as reducing the cost of equity capital,
reducing the risk of failure and the likelihood of experiencing future stock price crashes
and improving investment efficiency and information environment for outside investors

4
(e.g., LaFond & Watts 2008; Khan & Watts 2009; García Lara et al. 2010; Biddle et al.
2011; García Lara et al. 2011a; Watts & Zuo 2011; Biddle et al. 2012). When there is
higher information asymmetry, it becomes easier for managers to be less credible and to
manipulate accounting numbers, increasing demand for conservatism to mitigate
agency costs (LaFond & Watts 2008). Conditional conservatism is considered a
valuable tool for contracting purposes which aligns managerial incentives with those of
shareholders (Watts 2002; Cheng et al. 2014). Firm stakeholders such as investors,
creditors and suppliers demand a higher degree of conservatism to protect their wealth
against managers’ opportunistic behavior (see Hui et al. 2012). In particular, there will
be a higher demand for conservatism for IPO issuers because there are greater
incentives for managers to report more positive financial results around the IPO. Also,
it is more difficult for outside parties to detect earnings management by IPO firms due
to high information asymmetry. Therefore, this thesis focuses on conditional
conservatism that improves monitoring and contracting efficiencies where there is high
information asymmetry.2
1.2 Research Objectives
The main objective of this thesis is to investigate whether IPO firms adopt a higher
degree of conservatism in response to investors’ demand for high quality earnings to
reduce information asymmetries surrounding the IPO firms and build long-term stock
market credibility. Specifically, this thesis examines whether accounting conservatism
adopted by IPO firms can predict well-documented IPO market anomalies such as IPO
underpricing and IPO long-term stock return underperformance. Conservative reporting
2It is also difficult to measure unconditional conservatism in this thesis since unconditional conservatism
measures the relationship between accounting and market data and IPO firms do not have their market
value available prior to the IPO.

5
policy can address investors’ concerns about managerial opportunistic behavior by
providing more reliable accounting information, in particular where there is high
information asymmetry (see Guay & Verrecchia 2006; LaFond & Watts 2008; Dechow
et al. 2009). Good news disclosures help managers continue employment and boost
their wealth connected to firm value, while bad news disclosures are costly to managers
as they can lead to quick termination and wealth reduction (Kothari et al. 2009).
Accordingly, managers have greater incentives to withhold bad news, but to quickly
reveal good news to investors (Kothari et al. 2009). Such managerial opportunistic
behavior can intensify for IPO issuers due to high information asymmetry in the IPO
environment. However, if a more conservative reporting policy results in higher quality
financial statements reducing information asymmetry between insiders and outside
investors, issuers adopting higher conservatism will experience a lower level of IPO
underpricing and perform better in the post-issue stock market.
This thesis also examines whether IPO issuers adopting a higher degree of conservatism
obtain their next equity financing on more favorable terms via smaller underpricing and
higher announcement returns. Greater information asymmetry gives managers
opportunities to report earnings more aggressively and make investment decisions to
build their own wealth, leading to significant financial losses for investors (LaFond &
Watts 2008). Consequently, investors require compensation for such risk by lowering
their bid prices, resulting in higher expected returns and lower stock prices (Easley &
O'Hara 2004). Previous studies (e.g., Watts 2002; García Lara et al. 2011a) suggest that
reporting conservatism improves firms’ access to external funds and reduces the cost of
external financing by facilitating informative disclosure of bad news. Consequently,
issuers adopting higher conservatism, forgoing managerial incentives to manage their

6
earnings upward at the IPO, may be able to signal the quality of their accounting
information to outside investors and issue their first seasoned equity offering (SEO) on
more favorable terms. Moreover, in the face of less information uncertainty and
information asymmetry, investors will have higher demand for these issuers’ stock,
leading to higher stock returns in the post-SEO market.
Finally, this thesis investigates whether the extent of conservatism adopted by IPO
issuers can predict the longevity of IPO firms. Only high quality issuers with solid
earnings and growth potential will be concerned about their long-term prospects in the
stock market. Thus, these issuers will adopt a high degree of conservatism in response
to investors’ demand for higher quality earnings in the IPO market. However, low
quality issuers do not have the same incentives to adopt a high degree of conservatism
at the IPO year to increase their offer price to more than its intrinsic value and to
maintain a high market price soon after the IPO. This may suggest that issuers adopting
a high degree of conservatism are more likely to have less risk of failure and survive
longer in the post-issue stock market.
Overall, this thesis will provide valuable insights into whether conservatism contributes
to mitigating information asymmetry, reducing investment risks, and enhancing firm
value in the setting where accounting information is one of the most important
information sources available to outside investors.

7
1.3 Motivation
The Financial Accounting Standard Board (FASB) and the International Accounting
Standard Board (IASB) have opposed the notion of accounting conservatism and no
longer consider it as a desirable qualitative characteristic of accounting numbers in their
new joint conceptual framework (see Biddle et al. 2011; García Lara et al. 2011b).
They argue that conservatism introduces a bias of unknown magnitude into accounting
numbers and reduce investor insights into future cash flow growth options, increasing
information asymmetry among financial statement users.
The FASB has shifted its focus towards supporting fair values to achieve more
“neutrality of information” (Watts 2002). However, a number of accounting academics
have provided evidence on the equity and debt market contracting benefits of
accounting conservatism in various settings, urging the FASB to reconsider their
movement towards fair value accounting. In particular, these researchers suggest that
the role of accounting standards in equity valuation is only of secondary importance
because the primary purpose of financial statements is not to provide valuation
information to equity investors, but to promote and ensure efficient contracting, such as
performance measurement and stewardship (e.g., Ball 2001; Huijgen & Lubberink 2005;
Watts 2006; LaFond & Watts 2008; Kothari et al. 2010; Bushman et al. 2011). In
particular, they argue that financial statements should provide credible accounting
information that offers the foundation of the firm-specific information set available to
many different parties in the financial markets, forming a basis for outsiders to monitor
investment decisions. In response to the FASB’s and the IASB’s decision to remove
conservatism from their conceptual framework, this thesis investigates the influence of

8
accounting conservatism on the IPO market in order to contribute to the debate
surrounding conservatism.
The accrual accounting system under both the Generally Accepted Accounting
Principles (GAAP) and International Financial Reporting Standards (IFRS) permit
considerable discretion in recognizing the timing and amounts of revenue and expense
information (Kothari et al. 2009). In particular, the accounting regulation allowing IPO
firms to change their accounting choices via retroactive restatement for all the financial
statements presented in the offerings prospectus makes it easier for IPO firms to
manage their accounting numbers (Fan 2007). In a stock issue environment, outsiders
are generally less informed than insiders regarding the true value of the firm, leading to
higher information asymmetry between insiders and outside investors (e.g., Aharony et
al. 1993; Teoh et al. 1998a, 1998b; Jackson et al. 2002; Chadha 2003; Corwin 2003;
Roosenboom et al. 2003; DuCharme et al. 2004; Cormier & Martinez 2006). In
particular, the IPO environment makes it more difficult for investors to discover the
appropriateness of the accounting numbers due to the lack of other sources of
corroborative information (See Fan 2007).
The accounting literature suggests that conservative reporting policy reduces
information asymmetries between insiders and outside investors by enforcing timely
recognition of expected losses mitigating managerial opportunistic behavior (e.g., Watts
2002; LaFond & Watts 2008). Accordingly, previous studies suggest that investors
demand a higher degree of conservatism in a high information asymmetry environment
(LaFond & Watts 2008). This suggests that investors’ demand for conservatism will be
greater for IPO firms and thus issuers have greater incentives to adopt a higher degree

9
of conservatism in response to such investors’ demand. As a result, the IPO
environment offers a unique setting to empirically test whether accounting conservatism
mitigates information asymmetries between insiders and outside investors by providing
higher quality earnings information and what are the stock market benefits for the firms
adopting higher conservatism where there is high information asymmetry. However,
there is limited research on conservatism of IPO issuers. In particular, no studies, to the
best of my knowledge, have investigated the stock market benefits of IPO firms
adopting a higher degree of conservatism. Therefore, the evidence from this thesis will
provide important insights into how conservatism reduces information asymmetry and
whether firms experience stock market benefits associated with an increase in
conservatism in the U.S. IPO market.
1.4 Summary of Major Findings and Implications
This thesis employs a large sample of U.S. common stock initial offerings during the
sample period of 1990 to 2010 and its empirical analysis and findings are provided in
Chapters 3, 4 and 5. Further, Chapter 2 provides a comprehensive review of the extant
literature on accounting conservatism. It discusses various studies on how conservative
financial reporting facilitates shareholder-management contracting in the presence of
agency problems. The evidence suggests that firms adopting higher conservatism
experience several capital market benefits, such as a lower cost of capital, greater
investment efficiencies, a reduction in future stock price crashes, lower operating cash
flow downside risk and reduced bankruptcy risk (see e.g., García Lara et al. 2010;
Biddle et al. 2011; García Lara et al. 2011a; Watts & Zuo 2011; Biddle et al. 2012).

10
Chapter 2 also reviews prior research on how borrowing firms use conservative
accounting to mitigate bondholder-shareholder conflicts and how their conservative
reporting policy is affected by different litigious and regulatory environments. It also
discusses previous studies on the role of accounting conservatism in reducing
information asymmetry. In sum, previous studies provide empirical evidence on how
conservatism improves contracting efficiencies and reduces information asymmetry in
the capital markets and how firms adopting a higher degree of conservatism experience
various capital market benefits (e.g., LaFond & Watts 2008; Zhang 2008; Khan &
Watts 2009; García Lara et al. 2010; Biddle et al. 2011; García Lara et al. 2011a; Watts
& Zuo 2011; Biddle et al. 2012). However, the review of prior research reveals that
there is limited research on IPO issuers’ conservatism and its effect on stock market
benefits, despite the fact that there is inherently high information asymmetry and
increased importance of accounting information in the IPO environment.
Chapter 3 examines IPO firms’ conservatism in the pre- and post-periods of IPO and
investigates whether issuers’ conservatism is significantly associated with the degree of
underpricing and long-term stock return performance. Chapter 3 provides evidence that
IPO firms adopt a higher degree of conservatism in the pre-IPO year compared to the
IPO year, indicating that IPO firms on average adopt a higher degree of conservatism
prior to going public. The results also suggest that IPO firms adopting a higher degree
of conservatism prior to going public, experience significantly less IPO underpricing. A
negative association between conservatism and IPO underpricing implies a lower
indirect cost of going public borne by the issuing firm when it adopts a more
conservative reporting policy prior to going public.

11
The analysis of long-term stock return performance provides mixed results. IPO firms
adopting higher conservatism in the IPO year experience higher post-issue stock market
returns, consistent with the literature that conservatism enhances firm and equity values,
reducing information asymmetries for outside investors (see Watts & Zuo 2011).
However, IPO firms adopting a higher degree of conservatism in the pre-IPO year tend
to perform worse in the post-issue market. This result may indicate that firms expecting
poor performance in the after-market may adopt a higher degree of conservatism prior
to going public as a protection mechanism against potential litigation and regulatory
actions, suggesting that these firms may have a different reporting incentive to adopt
higher conservatism. Although the accounting literature, in general, suggests various
capital markets benefits associated with conservatism, whether a firm gains such
benefits or not may also depend on the particular reporting incentive it may have for
adopting a more conservative reporting policy.
Chapter 4 investigates whether the extent of conservatism adopted by IPO firms can
predict the probability of their SEO within five years of the IPO, SEO announcement
returns, SEO underpricing and post-SEO long-term stock return performance. The
findings of this chapter suggest that firms adopting a higher degree of conservatism in
the IPO year are less likely to reissue equity within five years of the IPO, indicating that
firms adopting higher conservatism do not have short-term cash needs soon after their
IPO. However, these firms experience less underpricing and better announcement
returns for the next equity financing within five years of their IPO. The results also
provide some evidence that pre-IPO year conservatism is positively associated with the
post-SEO stock return performance. Overall, these findings suggest that firms reporting

12
earnings more conservatively prior to going public are more likely to raise their next
seasoned equity on more favorable terms.
Chapter 5 examines the association between conservatism and the longevity of IPO
issuers. The results suggest that firms adopting a higher degree of conservatism in the
pre-IPO year face less risk of failure and survive longer in the stock market. Moreover,
IPO firms delisted from the stock exchange via mergers and acquisitions (M&As)
activity within five years of their IPO show a higher degree of conservatism in the pre-
IPO year relative to those that are involuntarily delisted. These results indicate that IPO
firms adopting a higher degree of conservatism prior to going public are better
investments for IPO investors as they are more likely to survive longer in the stock
market.
Further analysis reveals that IPO firms adopting higher conservatism in the pre-IPO
year are more likely to acquire another entity within five years of their IPO and their
acquisition announcement returns are positively associated with the extent of
conservatism adopted by firms in the pre-IPO year. These results could possibly
indicate that issuers going public to achieve growth via acquisitions adopt a higher
degree of conservatism prior to going public to reduce information asymmetry
surrounding the firm so that they can pursue a more efficient acquisition strategy in the
post-issue market.

13
1.5 Contribution
The findings in this thesis are important and relevant to both financial market and
accounting researchers because it explores the economic consequences of conservatism,
a financial reporting policy which has survived in accounting for many centuries and
which appears to have increased in the last 30 years (Watts 2002). In addition, this
thesis addresses the issue of how the quality of accounting earnings affects IPOs.
Accordingly, this thesis contributes to two streams of the literature. First, it adds to the
research on accounting conservatism. Second, it contributes to the limited research on
the role of accounting information in the IPO market.
A number of studies in accounting literature document that one of the primary benefits
of conservatism in the equity market is to improve information environments of the
firm by enforcing timely loss recognition that results in full disclosure of information
(see Guay & Verrecchia 2007; LaFond & Watts 2008). Studies on the informational
role of accounting conservatism suggest that it helps firms to reduce bankruptcy and
operating cash flow risks, decrease the cost of capital, increase firm value and improve
contracting and investment efficiencies (e.g., Guay & Verrecchia 2007; Suijs 2008;
Francis & Martin 2010; García Lara & García Osma 2010; Biddle et al. 2011; García
Lara et al. 2011a; Biddle et al. 2012). However, these studies, in general, do not
establish a direct link between the stock market benefits of conservatism and
information asymmetry. Rather, they conclude that the informational role of
conservatism leads to capital market benefits by showing that conservatism is
negatively associated with various measures of information asymmetry, such as stock
return volatility and bid-ask spread. However, this thesis employs the environment that

14
has been characterized by inherently high information asymmetries, namely, the IPO
market, as a research setting to investigate the informational benefits of accounting
conservatism in financial markets (e.g., Ibbotson 1975; Rock 1986; Welch 1989).
Consequently, the findings of this thesis should add value to the extant research on
conservatism by providing direct evidence on whether firms adopting a higher degree of
conservatism in a high information asymmetry environment experience increased stock
market benefits.
This thesis also makes a significant contribution to the literature on the IPO market.
Specifically, the IPO market has received a great deal of attention from researchers,
practitioners, the media and the public. When valuing an IPO firm, investors rely
heavily on financial statements for valuation without alternative sources of information
readily available to them. Prior literature suggests that IPO issuers have an exceptional
opportunity to boost reported earnings, with documented evidence of earnings
management (e.g., Aharony et al. 1993; Teoh et al. 1998a, 1998b; Jackson et al. 2002;
Roosenboom et al. 2003; DuCharme et al. 2004; Cormier & Martinez 2006). The
literature suggests that conservatism improves the quality of accounting information in
financial statements, reducing information asymmetry between managers and investors,
facilitating more efficient risk sharing and resulting in a higher firm value (Givoly &
Hayn 2000; Ball & Shivakumar 2005; Suijs 2008). Consequently, the findings of this
thesis should provide important implications for accounting standard setters, regulators
and policy makers associated with the IPO market by providing evidence on how
conservatism reduces information asymmetries in the IPO market, offering various
stock market benefits for issuers.

15
The FASB is now moving towards “mark-to-market” accounting without ensuring
verifiability of the market estimates. As a result, this thesis has important implications
for accounting standard setters and policy makers who proposed to remove
conservatism from the conceptual framework. Empirical evidence of this thesis
suggests that conservatism contributes to a reduction in information asymmetry in the
IPO market by providing higher quality accounting information for investors and as a
consequence, IPO issuers adopting higher conservatism experience various stock
market benefits. This means that the new conceptual framework without conservatism
may have adverse consequences in the IPO market, potentially intensifying problems
associated with information asymmetry. Therefore, this thesis suggests that accounting
standard setters and policy makers should reconsider their decision on removing
accounting conservatism form the conceptual framework.
1.6 Thesis Structure
The remainder of the thesis is structured as follows. Chapter 2 reviews the extant
literature on conservatism. It first introduces the key studies that provide a general
overview of conservatism and reviews past empirical and analytical research on various
areas that have a direct relevance to accounting conservatism, such as corporate
governance, contracting efficiency, different litigious and regulatory environments,
information asymmetry and capital markets consequences of conservatism. It also
addresses past studies that have raised issues about a decrease in value relevance of
earnings reported under conservatism and discusses the role of accounting information
in financial markets.

16
Empirical analyses and findings of this thesis are provided in Chapter 3, 4 and 5,
respectively. Specifically, Chapter 3 examines conservatism of IPO firms and its
association with IPO underpricing and post-issue long-term stock return performance.
Chapter 4 investigates the association between IPO issuers’ conservatism and the
probability of SEO, SEO announcement returns, SEO underpricing and post-SEO stock
return performance. Chapter 5 provides the longevity analysis of IPO firms and
investigates how IPO issuers’ conservatism affects firms’ survival rates. Chapter 5 also
investigates the association between IPO issuers’ conservatism and the probability of
acquiring another entity and acquisition announcement returns. Finally, Chapter 6
provides the summary and conclusion of the thesis.

17
Chapter Two
Past Empirical Studies on Accounting Conservatism
2.1 Introduction
The objective of this chapter is to provide an overview of the literature in order to
develop an understanding of the properties of conservatism and examine its effects and
implications in various respects. Large numbers of studies provide both analytical and
empirical evidence that conservatism contributes to reducing information asymmetry by
enforcing a revelation of loss information on a timely basis, and offers various capital
market benefits. However, the review of past studies reveals that there is only limited
evidence of the effect of conservatism in an IPO environment.
This chapter first introduces the overview of conservatism in Section 2.2. Section 2.3
reviews past research on the association between conservatism and corporate
governance. Section 2.4 provides a review of empirical studies investigating the
economic consequences of conservatism in the stock market, such as the effect of
conservatism on the cost of capital, investment efficiency and risk of failure. Section
2.5 reviews the studies on the impact of conservatism in the debt market and Section
2.6 considers the different litigious and regulatory environments. Section 2.7 examines
the informational role of conservatism. Section 2.8 addresses criticism of conservatism
and Section 2.9 discusses how conservatism satisfies the role of accounting information.
Finally, Section 2.10 summarizes and concludes the chapter.

18
2.2 Overview of Accounting Conservatism
Watts (2002) documents that conservatism in financial reporting arises for a number of
economic reasons, such as contracting use of accounting measures, shareholder
litigation and government regulation of financial reporting. If managerial compensation
is linked to reported earnings, then managers have incentives to withhold any
information that will adversely affect their compensation from reported earnings. Hence,
there is a contracting demand for conservatism as it requires more stringent
requirements for recognizing revenues and gains than for recognizing expenses and
losses. Debt holders and other creditors also demand conservatism as they require
timely recognition of information about bad news since the option value of their claims
is more sensitive to a decline in firm value than its increase. The increase in shareholder
litigation has also contributed to the emergence of conservatism because managers,
auditors and firms are much more likely to be sued for overstatements of earnings and
net assets than for understatements. A regulation explanation for conservatism suggests
that losses from overvalued assets are more observable and usable in the political
process than foregone gains, increasing incentives for regulators and standards-setters
to be more conservative.
Basu (1997) first empirically tests the asymmetric timeliness of earnings by regressing
accounting earnings on stock returns for the period 1963-1990. He finds that the slope
coefficient for negative returns is significantly higher than the slope coefficient for
positive returns, suggesting that the extent to which negative stock returns is reflected in
earnings is higher than that of positive stock returns. Further, Basu (1997) shows that
negative prior earnings changes have a greater tendency to reverse in the next period

19
than positive prior earnings changes. He claims that bad news has only a temporary
impact on the earnings time-series as earnings fully incorporate anticipated future losses
in the period they are expected. However, positive cash flows from good news events
are more persistent than earnings associated with bad news as capitalized value of the
good news is only partially reflected in current earnings and thus will also be reflected
in subsequent years after verification.
Similar studies by Givoly and Hayn (2000) and Ryan and Zarowin (2003) also analyze
the patterns of incremental earnings response to bad news relative to good news.
Consistent with Basu’s (1997) findings, they provide evidence that earnings reflect
current negative price changes more strongly than current positive price changes. In
particular, Givoly and Hayn (2000) examine the change in the time series pattern of
reporting conservatism and show that financial reporting became more conservative
over time during 1956-1999. García Lara and Mora (2004) also investigate the
differential speed with which good and bad news is incorporated into reported earnings
in France, Germany and the U.K. over the period 1990 to 1998. They show that the
contemporaneous association between earnings and returns is much stronger for bad
news than for good news and that the strong reaction to bad news is more pronounced
for firms with relatively low capitalization. However, Shroff et al. (2013) argue that
short-window returns measure good or bad news more accurately compared to long-
window returns that aggregate multiple events over the fiscal year such as annual
returns. Accordingly, they estimate good (bad) news as unusually high (low) three day
market adjusted returns for a firm. Consistent with previous studies, they find that there
is a significantly higher correlation between bad news and concurrent earnings than that
between good news and concurrent earnings.

20
2.3 Accounting Conservatism and Corporate Governance
Previous studies suggest that conservative financial reporting facilitates shareholder-
management contracting in the presence of agency problems. Lafond and
Roychowdhury (2008) argue that managers tend to be primary sources of information
about current and expected future firm performance. However, managers have
incentives to overstate the value they create by overstating current earnings and
expectations of future cash flows due to their limited horizons and liability, generating
agency costs. As a result, they argue that conservative reporting, tying their
compensation to changes in book value or earnings, effectively penalizes managers for
their value-reducing actions and defers their compensation until the benefits are realized.
They empirically test the extent to which managerial ownership affects conservative
reporting over the period 1994 to 2004 and find that managerial ownership is negatively
associated with conservatism. They argue that there is a higher demand for accounting
conservatism when managers’ equity stakes in the firm are lower because managers’
potential losses from declines in firm value due to bad managerial decisions are lower
than those of shareholders. Similarly, García Lara et al. (2009) also find that firms with
strong governance adopt a higher degree of conservatism, suggesting that the
acceleration in the recognition of bad news provides the board of directors with early
warning signals and that strong governance firms employ conservatism as a monitoring
mechanism.
Callen et al. (2010a) argue that anti-takeover legislation weakens corporate governance
by impeding the threat of hostile takeovers and thus provides an incentive for managers
to pursue personal goals rather than maximizing shareholder wealth. Accordingly, they

21
study changes in conservatism before and after the passage of anti-takeover legislation
and find that conservatism increases significantly after the passage of this legislation.
They also provide evidence that such a relation is more pronounced for firms with less
institutional holdings, suggesting that accounting conservatism plays a substitutive role
when the firm’s external governance environment is weak. On the other hand, Dhaliwal
et al. (2014) argue that product market competition mitigates agency conflicts because
greater flows of firm-specific information enable external monitoring by a firm’s
investors and consequently serves to constrain managers. They find that product
competition increases with conservatism, suggesting that product market competition
demands more conservative accounting information in order to achieve more efficient
contracting and to constrain managers from undertaking suboptimal decisions that can
lead to firm liquidation.
Beekes et al. (2004) and Ahmed and Duellman (2007) study whether conservatism
varies with the composition of the board of directors. They argue that if outside
directors improve accounting quality by mitigating management’s tendency to hide bad
performance, firms with a high proportion of outside board members should adopt a
higher degree of conservatism. They find that a proportion of outside directors is
positively associated with conservatism, suggesting that strong boards are likely to
understand the benefits of conservatism as a useful tool for directors in fulfilling
efficient contracting. García Lara et al. (2007) also find in the Spanish setting that firms
where the chief executive officer (CEO) has little influence over the functioning of the
board of directors, show a greater degree of accounting conservatism than firms where
the CEO has a high influence over the board. They argue that stronger corporate
governance results in a higher demand for conservatism as CEOs are more likely to

22
place a governance mechanism in place to prevent managers from hiding less favorable
information.
Krishnan and Visvanathan (2008) investigate whether audit committee members with
accounting expertise enhance accounting conservatism through their better monitoring
capability, driven by their knowledge base and economic incentives to protect their
reputation capital. They find that accounting experts on the audit committee are able to
effectively perform their monitoring function and promote conservative accounting, but
only when a firm has strong governance. They argue that the presence of accounting
expertise on the audit committee is ineffective with a weak board because the effect of
accounting expertise is undermined by a weak governance mechanism. On the other
hand, Ahmed and Duellman (2013) test whether overconfident managers who
systematically overestimate future returns from a firm’s investment projects adopt less
conservative accounting. They argue that overconfident managers accelerate gain
recognition and delay loss recognition by erroneously perceiving poorly performing
projects as positive net present value (NPV) projects and underestimating the
magnitude of potential losses. Accordingly, they find evidence that conservatism is
significantly and negatively associated with different measures of overconfidence.
However, they do not find any evidence to suggest that the negative association
between conservatism and overconfidence weakens in the presence of strong external
monitoring. They conclude that external monitors value certain attributes of
overconfident managers to avoid potential costs of conservative accounting that
managers may terminate profitable projects that have negative realization of cash flows
in earlier periods.

23
Bona-Sánchez et al. (2011) test whether the ownership share of the controlling owner
significantly affects the extent of conservatism adopted by firms. They investigate listed
Spanish firms with the presence of controlling owners that have different levels of
ownership and degrees of divergence between voting and cash flow rights. They find
that the higher the controlling owners’ ownership share, the lower the level of
conservatism. They suggest that as the ownership share of the controlling owner
increases, managerial incentives to share information with the dominant shareholders
also increase due to a larger portion of the firm’s capital being provided by that owner.
In such a case, information asymmetry between managers and shareholders is more
likely to be resolved by private communication channels, reducing the demand for
earnings conservatism. Ramalingegowda and Yu (2012) also study how ownership by
institutions affects firms’ conservative reporting policy. They argue that if institutional
investors understand and value the governance benefits of conservatism, they will
demand conservatism from managers. They find evidence that higher ownership by
monitoring institutions is associated with greater conservatism and that this positive
association is more pronounced among firms with more growth options and higher
information asymmetry because of greater difficulties associated with directly
monitoring these firms.
A recent study by Cheng et al. (2014) investigates whether hedge fund intervention in
their investment firms induces increases in conservatism, as hedge funds activists aim
to increase firm value by addressing agency conflicts through close monitoring and
improvements in investment firms’ corporate governance. Moreover, hedge funds
demand higher conservatism to reduce the risk of earnings overstatements because
hedge funds are usually holding an undiversified position and thus a revelation of an

24
earnings overstatement by the investment firm can be costly to hedge fund investors.
Consistent with this conjecture, they find evidence that firms adopt higher conservatism
after the intervention of the hedge fund activists. However, their results suggest that
increases in conservatism are limited to circumstances in which hedge funds have
relatively higher ownership and hold their investments for at least one year, allowing
sufficient amount of time to exert their monitoring effects on investment firms.
2.4 The Economic Consequences of Accounting Conservatism in the Stock Market
2.4.1 Conservatism and the Cost of Capital
Prior research provides evidence on the benefits of accounting conservatism in the stock
market in various aspects. García Lara et al. (2011a) find that the role of conservatism
in alleviating information asymmetry problems reduces the discount that markets apply
to firm value, leading to a negative association between conservatism and the cost of
capital. Artiach and Clarkson (2011) also report a negative association between
conservatism and the cost of capital but they argue that such a relationship is only
conditional on the firm’s informational environment as the marginal benefits of
conservatism are diminished in environments of low information asymmetry. However,
Li (2010) suggests that a country’s institutional structures are one of the most important
factors in determining its financial reporting system, arguing that variations in
accounting reporting practice is likely to be across countries rather than across firms or
industries within a country. Accordingly, Li (2010) conducts a country-level analysis of
the association between conservatism and the cost of capital and finds that the negative
association between conservatism and the cost of capital is stronger for countries with
lower board independence and lower anti-director rights.

25
Kim and Pevzner (2010) hypothesize that earlier recognition of economic bad news
under conservatism enables the market to perceive information delivered by more
conservative firms as being less biased and more accurate, while information delivered
by less conservative firms is perceived as being more optimistically biased. As a result,
for less conservative firms, investors discount possible optimistic bias in earnings
announcements for any undisclosed bad news. Their results suggest that the stock
market reacts more strongly to the good earnings news of more conservative firms than
to the good earnings news of less conservative firms, supporting the view that
conservatism contributes to improving the information flow to uninformed investors in
the stock market. Kim et al. (2013) investigate the effect of conservatism in the
seasoned equity offering (SEO) market. They argue that conservatism mitigates the
negative impact of information asymmetry between insiders and outside investors for
firms issuing SEOs by providing more verifiable accounting information for outside
investors and limiting managers’ ability to distort accounting information. Accordingly,
they find that firms adopting higher conservatism experience less price drop associated
with information asymmetry at the SEO announcement.
2.4.2 Conservatism and Investment Efficiency
Other researchers investigate the effect of conservatism on a firm’s investment
efficiencies. For example, García Lara et al. (2010) find evidence that firms with higher
conservatism invest less in years when over-investment is likely and invest more when
they operate in under-investment industries, in particular where aggregate-economy
investment is substantially low. They argue that conservatism mitigates under-
investment problems by facilitating a lower cost of external funding. Also,

26
conservatism deters managers from over-investing in underperforming projects by
forcing managers to reveal earnings consequences of their bad investment decisions on
a timely basis. Bushman et al. (2011) hypothesize that timely recognition of losses
influences investment behavior most strongly when managers face deteriorating
investment environments, but not in the face of increasing investment opportunities.
Accordingly, using cross-country data for twenty five countries, they find that
conservatism is significantly associated with investment spending only when
investment opportunities are declining. They argue that the asymmetric timeliness of
bad news earnings versus good news earnings that place emphasis on negative
outcomes under conservatism influence managerial behavior more strongly in situations
where managers face a deteriorating operating environment.
Francis and Martin (2010) investigate whether firms adopting a more conservative
reporting policy make more profitable acquisitions. They find evidence that
conservatism is positively associated with acquirers’ three day cumulative abnormal
returns and post-acquisition operating performance. They suggest that managers are less
likely to make investments in negative NPV projects under conservative accounting.
This is because conservatism ensures timely loss recognition resulting from
unprofitable acquisitions, encouraging managers to make quicker abandonment
decisions when acquisitions turn out to perform poorly. Similarly, Ahmed and
Duellman (2011) investigate if conservatism provides managers with ex ante incentives
to avoid negative NPV projects and ex post monitoring of investment decisions. They
argue that if conservatism mitigates agency problems associated with investment
decisions, firms adopting a more conservative policy should have higher future
profitability and take fewer and smaller special items charges and asset write-downs.

27
Their results show that more conservative firms have higher industry-adjusted operating
cash flows and gross profit margins and have a significantly lower likelihood of taking
special items charges than firms with less conservative accounting.
Healy et al. (1999) also find that there is a negative association between conservatism
and acquisition riskiness, but such a negative association disappears for firms without
accounting-based debt covenants. They argue that the threat of triggering accounting-
based debt covenants is a more important factor that induces firms to adopt higher
conservatism. Healy et al. (1999) provide an additional test on whether firms with
greater conservatism forgo riskier yet positive NPV acquisitions. Their results suggest
that more conservative firms tend not to make riskier acquisitions even if they are
positive NPV acquisitions, indicating that this is a potential cost of conservatism that
can result in less acquisitive firms. A more recent study by Kravet (2014) also provides
evidence that firms making less risky acquisitions adopt higher conservatism than those
making riskier acquisitions. However, the negative association is significantly weaker
for firms without accounting-based debt covenants. He suggests that conservatism is a
monitoring mechanism, specifically in conjunction with accounting-based covenants,
that reduces the likelihood of managers transferring wealth from debt holders to
shareholders by making riskier investments.
Louis et al. (2012) suggest that conservatism can mitigate the reduction in the value of
cash holdings, alleviating agency problems associated with excess cash that may
provide managers with the opportunity to engage in negative NPV projects. In
particular, they argue that timely loss recognition under conservatism mitigates
managers’ incentives to use their free cash flows to make new investments that could

28
destroy firm value. Accordingly, they find that the value of an additional dollar in cash
holdings increases with conservatism, suggesting that conservatism mitigates the value
destruction associated with cash holdings.
2.4.3 Conservatism and Risk of Failure
Kim and Zhang (2010) argue that conservatism makes bad news flow into the financial
market in a timelier manner, preventing bad news from being hidden and accumulated.
Accordingly, they find a positive association between conservatism and the reduction in
firm-specific crash risk. Their result suggests that timely loss recognition provides
shareholders and the board of directors with an early warning mechanism to promptly
identify unprofitable projects and force managers to discontinue such projects, reducing
the likelihood of a firm experiencing future stock price crashes. Similarly, Watts and
Zuo (2011) argue that a crisis period provides an interesting setting to test the
importance of conservatism in strengthening a firm’s funding ability. They investigate
how conservatism affected a firm’s valuation during the 2008 global financial crisis.
Their evidence suggests that conservatism is positively associated with the crisis period
stock returns and such an effect is more pronounced for firms with higher agency costs
associated with information asymmetry. They argue that more conservative firms
borrowed and invested more during the crisis period than less conservative firms, since
firms adopting more conservative financial reporting are more likely to obtain funding
from banks or other creditors during the crisis, substantially lessening firms’ financial
constraints during the period. However, they find that such results hold only during the
crisis-period because the effects of conservatism on changes in shareholder value is less

29
evident when times are good as firms are less likely to suffer from financial constraints
and potential underinvestment.
Biddle et al. (2012) provide evidence that conservatism significantly reduces
subsequent operating cash flow downside risk. They suggest that timely loss
recognition and risk revelations under conservatism enhance the efficiency of managers’
risk management activities as they facilitate external monitoring by outside stakeholders,
such as shareholders, debt holders, independent directors, auditors and regulators, thus
disciplining under-performing managers. Further, Biddle et al. (2011) also find that
conservatism is negatively associated with subsequent bankruptcy risk because
conservatism helps mitigate bankruptcy risk via its cash enhancing and informational
roles. They argue that the cash enhancing role of conservatism increases cash
availability from external sources and the informational role of conservatism lessens
information asymmetry, facilitating debt renegotiations when firms approach default on
their debt.
2.5 Conservatism in the Debt Market
Ahmed et al. (2002) argue that conservatism mitigates conflicts of interest over
dividend policy between shareholders and bondholders. They claim that conservative
accounting reduces the risk to bondholders of the firm paying excessive dividends to
shareholders as conservative accounting reduces the earnings and retained earnings
amounts used in debt contracts to constrain dividends. As a result, borrowing firms are
likely to use more conservative accounting when bondholder-shareholder conflicts over
dividend policy are potentially more severe. Also, bondholders are likely to require a

30
lower rate of return to compensate for the reduced risk of excessive dividend payments
for firms adopting more conservative accounting practices. They find consistent results
with their arguments that firms that potentially have higher bondholder-shareholder
conflicts over dividend policy are more likely to adopt higher conservatism and these
firms experience more favorable debt ratings.
Zhang (2008) also finds evidence that more conservative borrowers obtain lower
interest rates, suggesting that timely loss recognition makes financial covenants more
binding by capitalizing bad news, triggering covenant violations when the risk exceeds
the threshold set by lenders. Thus, lenders can take protective actions to reduce their
downside risk in the event of a covenant violation and are likely to reward more
conservative borrowers. Li (2010) also observes a negative association between
conservatism and interest rate, but such a relation is stronger in countries where
accounting covenants are widely used and creditor rights are properly protected.
However, Callen et al. (2011) argue that the contracting benefits of conservatism in the
debt market only exist in an environment with high information asymmetry in which
lenders are more uncertain about borrowers’ proclivity to appropriate lenders’ wealth.
They argue that reporting more conservatively, beyond what is mandated by GAAP, is
redundant in the low asymmetric information regime because the borrower will use
covenants alone to mitigate potential wealth transfers from debt to equity holders.
Accordingly, they find that more conservative financial reporting, combined with more
covenant restrictions, reduces the cost of debt only in the high information asymmetry
environment.

31
Haw et al. (2010) hypothesize that private equity firms with public debt provide more
conservative financial reporting than do those with private debt only. They argue that
bondholders demand a higher degree of conservatism from borrowers to protect their
debt value because bondholders are more likely to rely on the borrowers’ public
information than banks. As a result, the informational benefits from high quality
financial reporting are greater for bondholders. Their results show that private firms
with public debt adopt higher conservatism and private firms with high information
asymmetry and high credit risk have a greater increase in conservatism after their initial
bond issuance than their counterparts. They suggest that firms issuing public debt have
economic incentives to meet the stronger bondholders’ demand for conservative
accounting to access a lower cost of debt and more favorable contract terms.
Wittenberg-Moerman (2008) argues that conservatism decreases information
asymmetry in loan trading by increasing the amount and quality of information
available to secondary loan market participants. This is because timely loss recognition
allows uninformed loan traders who do not possess private sources of information
regarding the borrower to get a timelier and more precise evaluation of the borrower’s
traded loans. Accordingly, they provide evidence that conservatism reduces the bid-ask
spread at which loans are traded, suggesting that timely loss recognition decreases the
information advantage of informed traders, increasing the efficiency of the trading of
debt securities.
Beatty et al. (2008b) document that nearly two thirds of syndicated loan contracts
contain income escalators. Income escalators are systematic adjustments to covenants
thresholds that exclude a certain percentage of positive net income from covenant

32
calculations. They argue that there is a positive relation between conservatism and the
use of income escalators because when there are greater agency costs of debt, lenders
are more likely to incorporate income escalators to protect themselves, and
consequently, their demand for conservatism is higher. Consistent with their conjecture,
they provide evidence that conservatism measures are positively associated with the use
of an income escalator.
As discussed thus far, prior research suggests that conservatism plays a more important
role when there are higher agency costs of debt. However, other researchers argue that
when there are other mechanisms of mitigating debt holder-shareholder conflicts in
place, there is less demand for conservatism. For instance, Wang et al. (2011)
hypothesize that debt holders’ demand for conservatism decreases with the managerial
ownership of debt because managers with a higher ownership of debt have less
incentive to engage in asset substitution activities to expropriate wealth from debt
holders, mitigating the agency costs of debt. By using a CEO’s relative leverage
measured as the value of her deferred compensation and defined-benefits pension
divided by the market value of her stock and stock option ownership, they find that
conservatism is negatively associated with CEO relative leverage. Their results also
indicate that such negative association is largely concentrated in firms with higher
expected agency costs of debt, such as higher leverage, higher bankruptcy risk, fewer
tangible assets and more growth options.
Gigler et al. (2009), however, argue that it is unlikely that the demand for accounting
conservatism arises due to debt contracting considerations because conservatism can
increase the probability of false alarms and this would reduce the efficiency of debt

33
contracts. They claim that the disclosure of income increasing events will occur less
frequently in a more conservative regime due to the strict verifiability required for the
recognition of gains, but reports of income decreasing events would occur more
frequently under conservatism. As a result, such reports will have lower information
content because the lax verifiability required for reporting expected losses will convey
less information about the probability of the loss actually occurring.
2.6 Conservatism in Different Litigious and Regulatory Environments
Previous research hypothesizes that international differences in the demand for
accounting income may affect the way accounting incorporates economic income over
time. For example, Pope and Walker (1999) analyze differences in the timeliness of
income recognition between the U.S. and the U.K. GAAP financial reporting regimes
and show that earnings under the U.S. GAAP exhibit conservatism of slower
recognition of good news in earnings, relative to those under the U.K. GAAP. However,
they also suggest that if earnings are measured after extraordinary items, the U.K. firms
recognize bad news faster than U.S. firms since the U.K. firms have strong incentives to
classify bad news earnings components as extraordinary items.
Ball et al. (2000) relate timely recognition of economic losses in earnings to the
shareholder governance model of common and code law countries. By investigating a
sample of four common law countries (Australia, Canada, the U.K and the U.S.) and
three code law countries (France, Germany and Japan) during 1985-1995, they report
that code-law countries’ income in the sample is substantially less timely and less
conservative, on average, than common-law countries’ income. They attribute such

34
results to code-law accounting standards that give greater discretion to managers in
deciding when economic gains and losses are incorporated into earnings. Bushman and
Piotroski (2006) extend the study on the effect of cross-country variation in institutions
on conservatism by employing 38 countries for the period 1992-2001. Consistent with
Ball et al. (2000), their results suggest that firms in countries with strong investor
protection and high quality judicial systems reflect bad news in reported earnings
numbers in a more timely fashion than firms in countries characterized by low quality
judicial systems with weak investor protection.
Ball and Shivakumar (2005) compare earnings conservatism between private and public
firms in the U.K. to investigate how differences in the market demand for private and
public financial reporting affects earnings conservatism. They find evidence that timely
loss recognition is substantially less prevalent in private firms than in public firms,
suggesting that managers of private firms adopt a lower verification for recognizing
future economic gains and incorporate future economic losses in a less timely fashion.
This is because market demand for financial reporting quality is lower for private firms
and managers and auditors of private firms face lower litigation costs for supplying a
lower level of financial reporting quality.
Prior research also suggests that firms change the degree of conservatism in response to
changes in regulatory regimes. He et al. (2008) examine whether firms chose to react by
filing more conservative financial reports after the Sarbanes Oxley (SOX) Act was
introduced in 2002. They suggest that American Depositary Receipts (ADR) have
become more conservative during the post-SOX period due to the increased level of
monitoring and exposure to litigation risk in the post-SOX period. Similarly, Barth et al.

35
(2008) investigate the effect of the adoption of International Accounting Standards (IAS)
on earnings conservatism. Their result suggests that non-IAS firms recognize losses in a
less timely fashion compared to IAS firms because managers of non-IAS firms tend to
smooth earnings by delaying the effects of large negative earnings. The study on auditor
conservatism by Basu et al. (2000) also shows that the earnings audited by Big Eight
auditors are more conservative than those audited by non-Big Eight auditors. They
claim that Big Eight auditors have incentives to ensure that earnings are reported
conservatively due to their greater exposure to shareholder class-action lawsuits.
Kousenidis et al. (2009) examine changes in conservatism for Greek firms after the
market crisis of 1999. They suggest that increased legislation and the fear of litigation
in the post-crisis period forced firms to adopt more conservative accounting practices as
increased levels of conservatism emerged as a natural mechanism for investor
protection.
Other researchers suggest that firms adopt a higher degree of conservatism when they
face higher litigation risks and costs. Qiang (2007) provides evidence that litigation
induces conservatism as a firm’s litigation risk, measured as equity beta, share turnover,
market value, return skewness and annual return is positively associated with the degree
of conservatism. Bluck (2009) also finds that firms with greater ex-ante litigation risk
report more conservatively than firms with less litigation risk and that conservatism is
negatively associated with the incidence of actual litigation. Bluck (2009) argues that
managers of firms with greater ex-ante litigation risk use conservative financial
reporting to reduce future litigation costs because it becomes harder for the plaintiffs to
argue that bad news was delayed or the good news reported was misleading when the
firm is adopting conservative financial reporting. Similarly, Ettredge et al. (2012)

36
investigate the association between conservatism and the likelihood of securities class
action lawsuits alleging violations of U.S. GAAP and find that firms reporting
conservatively are less likely to be involved in investors’ class action lawsuits.
Using a sample of firms listed on the Toronto Stock Exchange, Chung and Wynn (2008)
find that firms with high liability coverage, measured as the sum of directors’ and
officers’ liability insurance and coverage and cash for indemnification, tend to report
less conservative earnings than firms with low coverage. They argue that managers
have an incentive to report conservative earnings when they face high litigation risks to
protect themselves from the expected litigation. However, managers can afford to adopt
a less conservative reporting policy when their expected legal liability is reduced via
directors’ and officers’ liability insurance and indemnification.
Huijgen and Lubberink (2005) argue that earnings reported by U.K. firms cross-listed
on U.S. stock exchanges are more conservative than those reported by domestically
listed firms. They suggest that the U.S. has a more severe litigation environment
compared to the U.K., increasing liability exposure for managers and auditors and an
incentive to commit to providing higher quality financial information. They report that
U.K. firms cross-listed in the U.S. report more conservative U.K. GAAP earnings
compared to those reported by their industry matched U.K. firms without a U.S. listing.
Donelson et al. (2012) provide evidence that timely revelation of bad news earnings is
negatively associated with litigation risk, regardless of whether the lawsuits are settled
or dismissed. Chandra (2011) argues that expensing research and development (R&D)
costs to a greater degree is the primary determinant of income conservatism for U.S.

37
technology firms and investigates their income conservatism. He finds that technology
firms’ earnings are significantly more conservative compared to other U.S firms,
suggesting that higher growth opportunities and the increased risk of technology firms
expose them to higher shareholder litigation risk, creating strong incentives for income
conservatism.
2.7 Conservatism and Information Asymmetry
The prior literature suggests that firms adopt a more conservative reporting policy in
response to an increase in information asymmetry. LaFond and Watts (2008) examine
the association between annual conservatism and changes in the information asymmetry
measures, such as the probability of an information-based trade (PIN) score and the bid-
ask spread. They find that PIN score changes in the preceding year are positively
associated with the annual conservatism measure, suggesting that changes in
information asymmetry lead to a higher degree of conservatism.
Khan and Watts (2009) estimate a firm-year measure of conservatism and show that
firms with higher conservatism scores have the characteristics associated with higher
information asymmetry, such as longer investment cycles, higher stock return volatility
and higher bid-ask spread. Consistent with this result, another study by Callen et al.
(2010b) reports that firms with a high degree of conservatism show higher leverage and
increased volatility of returns. Similarly, Jenkins et al. (2009) investigate if there is
variation in earnings conservatism across the business cycle in the U.S. from 1980 to
2003. They find that there is a higher degree of conservatism during economic
contractions because reporting firms respond to the increased demand for conservative

38
earnings by reporting more conservatively during economic contractions. García Lara et
al. (2011b) also argue that firms adopt higher conservatism as a reaction to high
information asymmetry in order to improve their future information environment.
Accordingly, they provide empirical evidence that conservatism decreases with a
reduction in bid-ask spread, stock return volatility, mean analysts’ earnings forecast
error and cost of equity capital and increases with the likelihood of observing increases
in expected credit risk.
Other researchers investigate the role of conservatism in reducing information
asymmetry. Hui et al. (2009) argue that the voluntary disclosure of financial
information through management forecasts is an important component of the
information environment surrounding a firm. Accordingly, they claim that conservatism
reduces the extent of information asymmetry between managers and shareholders if a
higher degree of conservatism decreases the quantitative management forecasts. They
find a significant negative association between the conservatism measures and the
frequency, specificity, and timeliness of management forecasts, suggesting that
accounting conservatism acts as a substitute for management forecasts. Li (2008)
provides evidence to show that analysts’ absolute forecast errors are negatively
associated with conservatism, suggesting that conservative accounting leads to less
uncertainty about the amount of earnings to be recognized in the presence of bad news
in a later period. Another study by Ettredge et al. (2012) investigates how firms reduce
the increased information risk following a reinstatement of previously overstated
earnings. They find that managers undertake increased conservatism after disclosing
overstatements of prior years’ earnings in order to directly address investors’ concerns
and restore credibility.

39
Hui et al. (2012) suggest that the importance of a firm’s economic performance to its
suppliers and customers leads to a stronger demand for conservatism since managers
have incentives to exploit their asymmetrically informed position, relative to other firm
stakeholders. As a result, a firm’s suppliers and its customers demand higher
conservatism to learn about poor performance more quickly. In particular, they incur
significant costs if the firm goes out of business, whereas they have lower potential
gains from the firm performing above expected levels. Accordingly, Hui et al. (2012)
provide empirical evidence that conservatism in firms’ accounting practices is
positively associated with the measures for the bargaining power of firms’ suppliers and
customers. They suggest that a firm meets the underlying demand for conservatism
from its suppliers and customers particularly when those stakeholders have bargaining
advantages.
Alam and Petruska (2012) investigate how fraud firms temporarily alter their
conservative accounting practices in order to reduce information asymmetry and
potentially regain investor confidence. They find that fraud firms show significantly
lower levels of conservatism compared to non-fraud firms in the pre-fraud period than
during the period they are manipulating their financial statements. Also, during the
public discovery of fraud, fraud firms’ conservatism levels are higher compared to pre-
fraud levels, as fraud firms exercise strategic discretion over conservative financial
reporting during periods of uncertainty and information asymmetry. Similarly, Mak et
al. (2011) examine earnings conservatism in the context of corporate refocusing
activities of U.K. firms. They suggest that poor economic performance with significant
negative news normally triggers restructuring decisions and thus there is increased
information asymmetry between managers and external investors about the firm’s

40
future strategy. They find evidence that refocusing firms adopt higher conservatism in
the refocusing announcement year and in the year following the announcement,
suggesting that the increased level of information asymmetry and agency conflicts
around refocusing events lead firms to adopt higher earnings conservatism.
2.8 Criticism on Conservatism
Penman and Xiao-Jun (2002) argue that conservative accounting can yield lower
quality earnings because conservatism creates a “hidden reserve” which can
subsequently be used to increase or reduce earnings, depending on the rate of growth in
investment. For instance, they argue that the immediate expensing of R&D
expenditures and advertising under conservative accounting can be used to change the
level of earnings later. This is because increasing R&D expenditures and advertising
will depress earnings, whereas decreasing them will increase earnings in subsequent
years. Rajan et al. (2007) also examine how conservatism may change the level of
earnings reported in financial statements. They argue that neutral (unbiased) accounting
rules should result in a return on investment (ROI) that equals the internal rate of return
(IRR) of a project that reflects economic profitability. However, they argue that
conservatism distorts ROI upward or downward relative to the underlying IRR because
conservatism and growth jointly distort ROI. Similarly, Monahan (2005) argues that
conservative measurement rules bias equity book value below equity market value and
conservative reporting practices such as immediate expensing of all R&D costs cause
an increase in goodwill and a corresponding decline in the value relevance of earnings.

41
Lee (2012) argues that a cumulative understatement of net assets in the balance sheet
and more timely recognition of losses versus gains in the income statement weaken the
appearance of the firms’ balance sheet strength and reduces a firm’s access to capital,
reducing its overall financial flexibility. Accordingly, Lee (2012) examines the
association between conservatism and various corporate financial activities such as cash
liquidity management, the decision to issue debt or equity and payout decisions that
proxy for firms’ financial flexibility. He argues that if conservatism facilitates financial
contracting, firms with greater reporting conservatism: (1) have better access to
financing and hold less precautionary cash, (2) raise capital through the debt market,
since issuing debt is less costly than equity, and (3) have greater ability to increase their
payout to shareholders either via dividend or through stock repurchases. Lee’s (2012)
results show that firms with greater reporting conservatism: (1) hold more cash and
accumulate more cash out of cash inflows, (2) are more likely to issue equity rather than
debt, and (3) show a smaller increase in dividends following positive cash changes.
They argue that these results indicate that firms reporting more conservatively
experience less financial flexibility in their future access to capital.
Chen et al. (2013) raise concerns about the reduced earnings predictability associated
with conservatism. They find that pricing multiples on more conservative earnings are
smaller than those on less conservative earnings, suggesting that market participants
evaluate less persistent earnings unfavorably, despite the positive effects of
conservatism in contracting and litigation. Guay and Verrecchi (2006) and Ladas and
Negakis (2009) also claim that an asymmetric accounting conservatism that reports bad
news in a timely manner, but good news in an untimely manner, may create information

42
inefficiencies being a potential cause of the distortion of the earnings-returns relation,
reducing value-relevance for users of financial statements.
2.9 Defending Accounting Conservatism: the Role of Accounting Information
Watts (2006) suggests that accounting’s comparative advantage in supplying
information to capital markets is to produce ‘hard’ verifiable numbers that provide
credible evidence on the outcome of previous investments and growth options of the
firm. LaFond and Watts (2008) argue that financial statements’ reporting of anticipated
losses and current and future cash flow realizations produce ‘hard’ verifiable numbers
that can serve as a benchmark for other sources of information in the market. In
particular, Ball (2001) claims that the discipline of knowing that actual outcomes will
be reported accurately will result in managers being more truthful in revealing non-
accounting information, such as more accurate publicly stated expectations in
management plans and forecasts. Kim and Zhang (2010) also suggest that conservative
accounting will make it more costly for managers to hide bad news or release
unverifiable good news because they will suffer a loss of reputation for credibility when
more credible “hard” information becomes available via audited financial statements.
Ball (2001) argues that the criteria for an optimal accounting system should not be a
simple correlation with stock prices because the resultant financial statements are then
merely duplicating existing prices, reporting change in the firm’s market value of equity
by marking to market the year-end balance sheet. In support of this view, Balachandran
and Mohanram (2006) suggest that the decline in value relevance cannot be attributed

43
to conservatism by providing evidence that firms with low values of conservatism
measures experience the greatest decline in value relevance.
2.10 Summary and Conclusion
This chapter reviews the extant literature on accounting conservatism. Previous studies
suggest that conservatism benefits different contracting parties in capital markets by
disciplining managers to provide more reliable information about their prediction of the
future performance of the firms. As a result, conservatism reduces information
asymmetry between managers, equity investors and other contracting parties, enabling
them to form more accurate expectations of future accounting income. In particular, a
large number of previous studies have investigated how firms reduce information
asymmetry via a conservative reporting policy and the capital market consequences for
these firms. Despite extensive studies being conducted on the informational role of
conservatism, there is limited research on the stock market benefits of conservatism in
the IPO environment where there is inherently high information asymmetry. In the IPO
market, there is inherently high information asymmetry and financial reports are one of
the most important financial information sources available to investors. Consequently,
the IPO market is an important research setting to study the informational role of
accounting conservatism. As a result, the evidence from this thesis will provide
important insights into how conservatism reduces information asymmetry and whether
firms experience stock market benefits associated with an increase in conservatism in a
high information asymmetry environment.
The next chapter examines IPO issuers’ conservatism and its association with two IPO
anomalies: (1) underpricing and (2) long-term stock return performance.

44
Chapter Three
The Effect of Accounting Conservatism on IPO Firms
3.1 Introduction
Chapter 2 reviewed prior literature on accounting conservatism and discussed the
capital market benefits of conservatism in various aspects. In particular, the literature
suggests that investors demand a higher degree of conservatism when there is high
information asymmetry between insiders and outside investors. There is generally
inherently high information asymmetry in the initial public offering (IPO) market. This
may suggest that IPO issuers adopting a higher degree of conservatism in response to
investors’ demand experience increased stock market benefits. Therefore, this chapter
examines IPO issuers' conservatism and how this conservatism affects IPO issuers in
the stock market. The objective of this chapter is to explore the following research
questions:
Do IPO issuers adopt a higher degree of conservatism prior to going public?
How does IPO issuers' conservatism change over time?
Do issuers adopting a higher degree of conservatism in the pre-IPO year
experience smaller IPO underpricing?
Does the extent to which conservatism adopted by the IPO issuer significantly
affect its post-issue stock return performance?
The remainder of the chapter is organized as follows. Section 3.2 develops the
conceptual framework and hypotheses. Section 3.3 provides the research methodology
designed to empirically test the hypotheses of this chapter. Section 3.4 describes the

45
sample data of this thesis and reports the descriptive statistics. The empirical results are
presented and discussed in Section 3.5. Finally, Section 3.6 summarizes and concludes
the chapter.
3.2 Conceptual Framework and Hypotheses Development
3.2.1 Accounting Conservatism of IPO Firms
Earnings management by IPO firms has been empirically supported by a number of
studies (e.g., Aharony et al. 1993; Teoh et al. 1998a, 1998b; Jackson et al. 2002;
Roosenboom et al. 2003; DuCharme et al. 2004; Cormier & Martinez 2006). Notably,
Teoh et al. (1998a) provide evidence that discretionary current accruals of IPO firms
are significantly larger than those of average non-IPO firms, suggesting that on average,
IPO firms engage in earnings management. However, more recent accounting studies
cast some doubt on earnings management of IPO firms. For example, Venkataraman et
al. (2008) examine the pre-IPO financial statements and find that pre-IPO accruals tend
to be negative and less than post-IPO accruals, finding no support for the inference in
Teoh et al. (1998b).
Ball and Shivakuma (2008) also point out that the discretionary current accruals
estimates of Teoh et al. (1998a) are biased by the unusually high growth of IPO firms.
They suggest that the use of IPO proceeds for investing in working capital items, such
as receivables and inventory, reduces operating cash flows relative to earnings, leading
to abnormally high positive accruals by definition (see also Aharony et al. 1993).
However, Lo (2008) addresses issues with Ball and Shivakuma's (2008) research
context that excludes firms where a direct comparison cannot be made between the IPO

46
financial statements and those filed with the U.K. Companies House.3 He claims that if
firms were to manage earnings, they would not engage in an activity too obvious to
detect, suggesting that firms that managed earnings would deliberately make the IPO
financial statements non-comparable in order to disguise their earnings management
activities.
IPO firms may have incentives to opportunistically manipulate earnings upward to
obtain a high price for their stock issue. However, issuers who engaged in earnings
management before the IPO face the risk of subsequent detection and hence litigation
and regulatory action (Shu et al. 2012). Under Section 11 of the Securities Act of 1933,
persons who buy stock in the IPO aftermarket are eligible to receive damages if they
can show reliance on a prospectus that contained an untrue statement of a material fact
or omitted to state a material fact (see TiniÇ 1988). Moreover, to recover damages, a
purchaser of an IPO can sue every person associated with the offering. Lowry and Shu
(2002) document that the potential costs of litigation are substantial for IPO firms. In
their sample, the average settlement payment was $3.3 million which amounts to up to
50% of the IPO proceeds raised. They suggest that the implicit costs of litigation are
also significant, which include reputation costs to the IPO firm and its managers, legal
fees and the opportunity cost of management time dedicated to the lawsuit.
Prior research suggests that accounting conservatism is expected to increase with the
firm's likelihood of litigation (see LaFond & Watts 2008). In particular, Watts (2002)
argues that management is given incentives to understate earnings and net assets when
3 The UK Companies Act requires private firms to file annual financial statements. When UK firms go
public, prospectuses generally include financials for the past three years. Firms are allowed to restate
their prior financials and any restatements are identified in the auditor's report of the prospectus (Ball &
Shivakumar 2008).

47
the likelihood of litigation increases because the expected litigation costs of
overstatement are higher than those of understatement (Watts 2002). Also, there is
higher quality reporting demanded of public firms by financial statement users and
consequentially, higher monitoring by auditors, boards, analysts, rating agencies, press
and litigants for issuers after they go public (Ball & Shivakumar 2008). As a result, IPO
issuers may report earnings more conservatively in response to such demand for higher
quality financial reporting and to protect themselves from the potential litigation they
may face after the IPO.
As discussed thus far, a review of the extant literature has provided mixed evidence
regarding the reporting quality of IPO firms, resulting in different predictions on the
extent of accounting conservatism of IPO issuers. Accordingly, this chapter examines
whether IPO firms adopt a higher degree of conservatism or report earnings more
aggressively prior to going public.
3.2.2 Accounting Conservatism and IPO Underpricing
Prior literature documents the phenomenon that firms going public experience large
positive returns, on average, on their first trading date (e.g., Ibbotson 1975; Beatty &
Ritter 1986; Rock 1986; Benveniste & Spindt 1989). A theoretical explanation for IPO
underpricing suggests that underpricing arises from information asymmetries among
participants in the IPO process (Boulton et al. 2011). Notably, Rock (1986) has offered
an equilibrium model for IPO underpricing in which uninformed investors face a
“winner's curse” when they submit an order for IPO shares. Informed investors
withdraw from the market when the issue is priced above its value. As a result,

48
uninformed investors are more likely to receive a full allocation of shares if the offering
is overpriced and a rationed allocation if it is not. Thus, firms are forced to underprice
their IPOs to compensate uninformed investors for this adverse selection. Beatty and
Ritter (1986) extend Rock’s research by showing that IPO underpricing increases in the
ex ante uncertainty of IPO firms that investors face when they submit a purchase order.
They argue that investors will be willing to submit a purchase order for an offering with
greater ex ante uncertainty, only if the issuer underprices its IPO by a greater amount
leaving more money on the table. Since it is more difficult for investors to predict the
actual initial return on a high-risk issue, the “winner's curse” problem will be intensified
for high-risk issuers.
Several researchers have found evidence that accounting information disclosed in the
IPO prospectus reduces information asymmetry, leading to a reduction in the level of
IPO underpricing. For example, Jog and McConomy (2003) show that voluntary
management earnings forecasts provided in the prospectus reduces the uncertainty faced
by uninformed investors and find that IPOs from these issuers are less underpriced.
Similarly, Leone et al. (2007) find that IPO underpricing is negatively associated with
the specificity of the use of IPO proceeds in the prospectus. In particular, they suggest
that such a negative association is significantly stronger for IPO firms employing less
prestigious investment banks as they have greater need to reduce information
asymmetry. Schrand and Verrecchia (2005) also argue that the greater the frequency of
information disclosed by a firm prior to the IPO, the lower the level of underpricing.
However, they find a positive relation between disclosure frequency and IPO
underpricing for internet firms, suggesting that internet firms utilize both underpricing

49
and information disclosures as tools to generate greater attention to becoming a
successful IPO.
Boulton et al. (2011) also study how country-level differences in earnings quality
influence IPO underpricing and find that firms going public in a country with better
earnings information experience significantly lower IPO underpricing. They use the
financial information of existing public firms to construct country-level earnings quality
measures rather than directly measuring the earnings quality of an IPO firm. As a result,
these measures cannot represent the earnings quality of IPO firms because there are
significant differences in earnings quality between existing public and IPO firms (Lin &
Tian 2012).
Lin and Tian (2012) argue that issuing firms have inherently different characteristics
due to the incentives associated with the offer price and the level of underpricing, as
well as potential reputation costs. Thus, they emphasize the benefits of studying one
country setting and examine the link between earnings quality and underpricing in
China. In particular, they employ accounting conservatism as a measure of earnings
quality and find that Chinese IPOs adopting higher conservatism are underpriced less
and such an effect is more pronounced for firms with high information asymmetry. This
result indicates that U.S. IPO issuers adopting a higher degree of conservatism
experience a lesser degree of underpricing compared to those reporting less
conservatively. However, Watts and Zuo (2011) argue that when there is less
information asymmetry there is less demand for conservatism, reducing incentives for
firms to adopt a higher degree of conservatism. Accordingly, when they investigate the
effect of conservatism on stock returns in the U.S. market before and after the 2008

50
financial crisis, they do not find evidence of a positive effect of conservatism when
times were good before the financial crisis.
U.S. firms provide relatively higher quality earnings given the strong legal and
institutional environment compared to China and this may suggest that the positive
effect of conservatism on IPO underpricing in China may not be pronounced in the U.S.
setting. However, there is generally high information asymmetry for IPO firms and thus
investors’ demand for conservatism will be higher for IPO issuers in the U.S. This may
suggest that issuers adopting a higher degree of conservatism in the U.S. may also
experience a lower indirect cost of going public by providing investors with higher
quality earnings information. Consequently, it is not evident whether conservatism
adopted by IPO issuers significantly affects the degree of underpricing in the U.S.
market. Therefore, this chapter empirically tests whether issuers adopting higher
conservatism experience a smaller degree of underpricing at the IPO.
3.2.3 Accounting Conservatism and Long-term Stock Return Performance of IPO
Firms
Extant research finds that IPO firms significantly underperform in the market in the
long-run (e.g., Ritter 1991; Loughran & Ritter 1995). While many researchers have
sought to explain such phenomena, earnings management by IPO firms have elicited
extensive academic investigation. Studies by Teoh et al. (1998a) and Teoh et al. (1998c)
suggest that issuers with unusually high levels of discretionary accruals in the IPO year
experience poor stock return performance in the subsequent three years after the IPO.
Following Teoh et al. (1998a; 1998c), several studies investigate earnings management
by IPO firms in the international setting and present consistent results. The main

51
argument of these studies is that IPO firms manipulate earnings upward before stock
issues, leading investors to form overly optimistic expectations regarding future post-
issue earnings (e.g., Jackson et al. 2002; Roosenboom et al. 2003; DuCharme et al.
2004; Cormier & Martinez 2006). However, their earnings do not maintain momentum
and the investors lose optimism, resulting in an ultimate price correction (e.g., Teoh et
al. 1998a).
More recent research, however, casts some doubt on the predictability of discretionary
accruals for stock returns. Ball and Shivakuma (2005) call the validity of discretionary
accruals estimates of IPO firms into question, claiming that high growth of IPO firms
makes accruals inherently high. Fan (2007) tests if issue-year discretionary accruals can
predict post-issue stock returns and finds no evidence of a monotonic decline in stock
returns from the smallest discretionary accruals portfolio (most conservative) to the
largest (most aggressive). Similarly, Shu et al. (2012) do not find a significant
association between discretionary accruals and long-run stock return performance of
IPO firms when examining how earnings management and managerial optimism affect
IPO valuation.
IPO issuers can communicate inside information about the firm's value to outside
investors by direct disclosure through accounting reports (Hughes 1986). Accounting
conservatism provides ‘hard’ verifiable numbers by reporting anticipated losses and
current and future cash flow realizations in financial statements (LaFond & Watts 2008).
As a result, IPO investors will have higher demand for conservatism as conservative
financial reporting can improve the credibility of financial statements in the IPO
prospectus. By adopting a higher degree of conservatism, an issuer can credibly signal

52
that the firm is a good investment to outside investors, especially as their performance
is realized in the long-run. In particular, Watts and Zuo (2011) suggest that better
managed firms with good corporate governance embrace more conservative financial
reporting. Consequently, high quality issuers associated with good governance will
adopt a higher degree of conservatism to signal the true value of the firm and to
credibly separate themselves from low-quality firms. As a result, investors may value
IPOs with higher conservatism more and it may manifest in their long-term stock return
performance.
Several studies have investigated the effect of conservatism on stock returns. For
example, Penman and Zhang (2002) measure accounting quality by changes in hidden
reserves created by conservative accounting in regards to inventory, research and
development and advertising expenses relative to net operating assets. They show that a
trading strategy, going long on high quality accounting (more conservative) stocks, and
shorting low quality (less conservative) stocks, earns an abnormal positive return.
Consistent with this finding, Kim and Pevzner (2010) observe that more conservative
firms experience a stronger stock market reaction to the revelation of their good
earnings news, while the stock market responds less negatively to their bad earnings
news. However, they point out that the magnitude of such benefits is small and suggest
that future research needs to focus on situations where the benefits of conservatism
could be larger.
Watts and Zuo (2011) also provide evidence that conservatism enhances borrowing
capacity and constrains managerial opportunism, leading firms with more conservative
financial reporting to experience less negative stock returns during a financial crisis.

53
However, they claim that the effects of conservatism are less evident in normal times,
as a financial crisis makes it much harder for firms to borrow, increasing demand for
verifiable accounting numbers (Watts & Zuo 2011). Such findings may suggest that the
positive effect of conservatism in the stock market may not be found when normal
times are under investigation. Furthermore, past studies have often claimed that
increasing conservatism is responsible for the decline in the value relevance of
accounting earnings and book values over time (see Balachandran & Mohanram 2011).
In particular, Kousenidis et al. (2009) show that the value relevance of earnings
increases when moving from a portfolio of low-conservatism firms to a portfolio of
medium-conservatism firms, but reverts and decreases when moving further to a
portfolio of high conservatism firms. Their findings indicate that extreme conservatism
distorts rather than enhances the value relevance of accounting information.
Furthermore, as previously discussed, if more risky issuers adopt higher conservatism
as insurance against potential litigation which they may face after the IPO, buying such
IPO issues may not be a good investment strategy in the long-term.
As the above discussion reveals, it is not absolutely clear whether IPO firms adopting a
higher degree of conservatism display better stock return performance in the long-term.
Consequently, this chapter empirically tests the extent to which accounting
conservatism adopted by IPO firms can predict their post-issue stock return
performance.

54
3.3 Research Methodology
3.3.1 Measurement of Accounting Conservatism for IPO Firms
Basu (1997) undertook the first study that developed a specific measure of conditional
conservatism by estimating asymmetric timeliness of earnings using a regression of
accounting earnings on annual stock returns. Basu’s (1997) measure of conditional
conservatism has been one of the most popular measures used so far. However, despite
its conceptual appeal and popularity, the validity of the model has been questioned by a
number of researchers (e.g., Dietrich et al. 2007; Givoly et al. 2007; Roychowdhury &
Watts 2007; Beatty et al. 2008a; Ball et al. 2010; Patatoukas & Thomas 2011a, 2011b).
More recently, Callen et al. (2010b) also proposed a measure of conditional
conservatism based on Vuolteenaho’s (2002) return decomposition model. This model
utilizes log-linear vector autoregressive regressions (VAR) where the log of stock
returns, the log of one plus return on equity and the log-book-to-market ratio are used as
three predictor variables. However, this thesis requires a non-market based measure to
estimate issuers’ conservatism in the pre-IPO year and as a consequence the methods
developed by Basu (1997) and Callen et al. (2010b) cannot be used due to the absence
of stock return data.
Other studies such as Givoly et al. (2000) and Ball and Shivakumar (2005) estimate
conservatism using non-returns based measures of news. Specifically, Givoly and
Hayn's (2000) model estimates the extent of conservatism by cumulating non-operating
accruals over five years. Givoly and Hayn (2000) propose that accumulation of negative
non-operating accruals is indicative of conservatism because a process of delaying
gains and accelerating losses under conservative accounting gradually makes the level

55
of accumulated accruals more negative. Recent applications of this model use average
non-operating accruals over three years (see e.g., Wang et al. 2009). However, this
thesis cannot employ this method to estimate IPO issuers' conservatism because of the
accounting data availability, since this method requires at least three years of
accounting data available before the IPO.
Ball and Shivakumar (2005) focus on the idea that accounting conservatism influences
the accruals component of earnings rather than the cash-flow component and develop a
model that exploits the likelihood that timely loss recognition occurs through
accounting accruals. Unlike Basu (1997), where stock returns are used as the proxy for
news, Ball and Shivakumar (2005) use positive and negative operating cash flows as
proxies for good and bad news, respectively. Accordingly, Ball and Shivakumar's (2005)
asymmetric accruals to cash-flow measure appears to be the only applicable method4 to
estimate firm-specific conservatism of IPO issuers, in particular, in the pre-IPO year
and is as follows:
ACCi = α0 + α1Di + β1CFOi + β2Di*CFOi + ei (1)
where ACCi is accruals and CFOi is cash flow from operations. Both are scaled by
beginning total assets and are obtained from the cash flow statements to avoid problems
with balance sheet data which can lead to an erroneous computation of accruals as
demonstrated in Hribar & Collins (2002) (see also Ball & Shivakumar 2008). Di is a
binary indicator variable taking the value of one if CFOi is negative and zero otherwise.
4 This thesis examines the effect of conditional conservatism. Thus, it does not discuss measures of
unconditional conservatism, such as the market-to-book measure by Beaver and Ryan (2000) and the
hidden reserve measure by Penman and Zhang (2002).

56
Ball and Shivakumar (2005) predict the coefficient for cash flow from operations, β1, to
be negative and the incremental coefficient for negative cash flows, β2, to be positive.
More specifically, β1 estimates the association between accruals and cash flows in
general and β2 measures the extent of earnings conservatism. Dechow (1994) argues
that realized cash flows can be a "noisy" measure of firm performance due to the
difference in the timing of cash outlays and inflows associated with the current period
sales. However, under the “matching principle” of accrual accounting, cash outlays
associated directly with revenues are required to be expensed in the period in which the
firm recognizes the revenue. Thus, accruals reduce the timing problems of cash flows
recognition in earnings and are negatively associated with cash flows (Dechow 1994;
Dechow et al. 1998). However, Ball and Shivakumar (2005) argue that conservatism
reduces the role of accruals in mitigating the timing problem of cash flows by enforcing
recognition of economic gains when realized and timely recognition of economic losses.
As a result, conservatism is a source of positive correlation between accruals and cash
flows. In particular, Ball and Shivakumar (2005) suggest that such an effect should be
greater in periods of negative cash flows because unrealized economic losses are more
likely to be recognized in earnings via accrued charges such as impairment losses.
To estimate a firm-year measure of conservatism, this thesis modifies Ball and
Shivakumar’s (2005) measure of asymmetric timeliness (equation 1). The modification
process follows Khan and Watts’s (2009) method of estimating firm-level conservatism
(see Appendix I). Khan and Watts (2009) expand the regression of asymmetric
timeliness, assuming that conservatism is a linear function of firm-specific
characteristics (size, market-to-book ratio and leverage) each year. They argue that
there is a negative association between firm size and conservatism as larger firms are

57
likely to be more mature and to have richer information environments, reducing a
contracting demand for conservatism. They suggest a positive association between MTB
and conservatism as asymmetric verification requirements for gains versus losses build
up a cumulative understatement of net assets relative to market values. Firm leverage
and conservatism are also expected to be positively associated. There are higher
incentives for more levered firms to adopt a more conservative reporting policy as
financially distressed firms are more likely to be sued and the likelihood of financial
distress increases with leverage (Khan & Watts 2009).
The following annual cross-sectional regression model is used to estimate a firm-year
measure of conservatism:
ACCi = α0 + α1Di + CFOi (μ1 + μ2sizei + μ3 MTBi + μ4Levi)
+ Di*CFOi (λ1 + λ2sizei + λ3MTBi + λ4Levi) + (δ1sizei + δ2MTBi + δ3Levi
+ δ4D*isizei + δ5D*iMTBi + δ6D*iLevi) +ei (2)
where ACCi are accruals, CFOi is cash flow from operations, Di takes the value of one if
CFOi is negative and zero otherwise, size is firm size which is computed as the natural
logarithm of total assets, Lev is defined as total debts divided by beginning total assets,
MTB is the market to book ratio, and ei is the residual.
Estimators of λi, i=1-4 obtained from running the above regression on a pooled sample
of firms are substituted into equation (3) to estimate firm-level conservatism of IPO
firms. The coefficients of μ1-4 explain the role of accruals in the mitigation of noise in
cash flows and μ1 is expected to have a negative sign. λ1-4 are incremental coefficients
for negative cash flows and λ1 is predicted to be positive since it estimates the extent of
asymmetric timeliness of earnings recognition under conservatism. The firm-year

58
conservatism score (CSCORE) is computed by substituting the firm-specific variables
into equation (3) and the higher the CSCORE, the higher the degree of conservatism.
Conservatism Score (CSCORE) = λ1 + λ2sizei + λ3 MTBi + λ4Levi (3)
CSCORE varies across firms and over time through cross-sectional variation in the
firm-year characteristics (size, market-to-book ratio and leverage) and λ1-4 obtained
from the annual regressions.
3.3.2 Estimation of CSCOREs
IPO issuers’ conservatism is measured using annual Compustat data for the period 1989
to 2005. Dechow et al. (1998) argue that using quarterly data can introduce
considerable measurement error into the empirical analysis due to seasonality in
quarterly data. The integral approach to quarterly reporting mandated under GAAP
requires firms to allocate estimated annual operating expenses to interim periods, based
on forecasted annual figures such as sales (Rangan & Sloan 1998). Consequently, as the
fiscal year progresses, estimates are revised and any estimation errors from earlier
quarters are likely to affect the earnings of the next quarter and this problem can be
intensified for the fourth quarter5 (Collins et al. 1984; Kross & Schroeder 1990; Rangan
& Sloan 1998). Rangan and Sloan (1998) suggest that such seasonality in quarterly
earnings is more severe for smaller firms because they tend to engage auditors only for
the annual numbers which are subject to a full audit. Furthermore, accruals measures
based on quarterly data can be significantly inflated since the difference between
earnings and cash flows are larger when the earnings measurement interval is shorter in
5 Fourth-quarter earnings are the difference between annual earnings and the sum of the earnings for the
first three quarters. As a result, errors or approximations relating to the first three quarters tend to be
incorporated into fourth-quarter earnings (Collins et al. 1984).
59
a given fiscal year. The size of IPO firms is smaller in general and this thesis utilizes
accruals to estimate regression coefficients required to measure firm-level conservatism.
Consequently, this thesis focuses on firm-level annual conservatism and equation (2) is
estimated annually over the entire Compustat population for the period 1989 to 2005 to
measure the pre- and post-IPO year CSCOREs of sample firms.
As shown in equation (3), regression coefficients of λ1-4 estimated from the annual
regressions of equation (2) are multiplied by the firm-year characteristics (size, MTB,
and Lev) to measure issuers’ CSCOREs. For example, the pre-IPO year CSCORE of a
firm which went public in 1990 is computed by multiplying its 1989 fiscal year size,
MTB, and Lev by the coefficients of λ2-4 obtained from the 1989 annual regression, plus
λ1. However, the pre-IPO fiscal year MTB is not available due to the absence of stock
price prior to going public. Thus, the closing price of the first trading day is used as the
stock price to calculate pre-IPO year MTB. All continuous variables are winsorized at
the 1st and 99
th percentiles to mitigate the effect of outliers.
Table 3-1 reports the Fama-Macbeth mean coefficients from the annual cross-sectional
regressions (equation 2) over the 1989-2005 period. Prior studies suggest that ∆SALES
(changes in sales) and PPE (fixed assets) are significantly associated with accruals (see
Jones 1991; Ball & Shivakumar 2006). Thus, ∆SALES and PPE are included in model 2
and 3 as control variables in the regression model. This thesis uses the annual
coefficients obtained from model 3 to compute the firm-year CSCORE.
[Insert Table 3-1 here]

60
As shown in Table 3-1, the magnitude of coefficients of interest (CFO*D, CFO*D*Size,
CFO*D*Lev, CFO*D*MTB) does not significantly differ across model 1 to 3. The
coefficient on CFO is negative and statistically significant at 1%, consistent with
previous findings reporting a negative association between accruals and cash flows
(Dechow et al. 1998; Ball & Shivakumar 2005). The coefficient on CFO*D is positive
and statistically significant at 1%, confirming the role of conservatism as attenuating
the negative association between accruals and cash flows by deferring the recognition
of economic gains until realized and enforcing timely recognition of economic losses.
In particular, the magnitude of coefficient on CFO*D is larger than that of CFO in all
three models, suggesting that firms are conservative, on average (Khan and Watts 2009;
Watts 2003a; Watts 2003b).
The key variables of interest, CFO*D*Size, CFO*D*Lev, and CFO*D*MTB also
provide results consistent with Khan and Watts (2009). The coefficient of CFO*D*Size
is negative (significant at 1%) in all equations, indicating that larger firms report less
conservatively. Similarly, the positive coefficients of CFO*D*Lev are statistically
significant at 1% - 5%, indicating that more levered firms adopt a higher degree of
conservatism. However, the coefficients on CFO*D*MTB in model 1 and 2 are
negative and not statistically significant in all models. Khan and Watts (2009) reported
a similar result and attributed it to the ‘buffer problem’ suggested by Rychowdhury and
Watts (2007). Specifically, Rychowdhury and Watts (2007) argue that the beginning
period MTB is expected to be negatively associated with conditional conservatism
when the estimation period is one year. It is because the prior year's unrecognized
increases in asset values (i.e. higher beginning MTB) reduce the necessity to recognize
asset value losses in the current period (being less conservative). Since the end-of-

61
period MTB is highly correlated with the beginning MTB, the end-of-period MTB is
also negatively associated with conditional conservatism at the annual horizon (see also
Khan & Watts 2009). Khan and Watts (2009) argue that although the direct positive
association between MTB and conservatism is not observed empirically, MTB should
still be included in the regression model when measuring conservatism since the
relevant research with past empirical evidence strongly suggests that conservatism is
significantly associated with end-of-period MTB.
3.3.3 Accounting Conservatism and IPO Underpricing
The following regression model is estimated to test the association between IPO issuers'
pre-IPO year conservatism and the degree of underpricing:
Underpricingi = α0 + β1 Pre_CSCOREi + β2 Levi, t-1 + β3 Integeri + β4 Agei
+ β5 Volatilityi + β6 Offersizei + β7 Nasdaqi + β8 ROAi, t-1+ β9 Underwriteri
+ β10 VC_Repi + β11 Auditori + ∑ Year dummies
+ ∑ Industry dummies + εi (4)
A description of each variable used in the regression model is provided in Table 3-2.
CSCORE measured in the pre-IPO year is Pre_CSCORE and its coefficient tests the
association between the extent of issuers' conservatism adopted in the pre-IPO year and
IPO underpricing. The vast majority of IPO studies suggest that information asymmetry
plays a key role in determining the level of IPO underpricing (e.g., Beatty & Ritter 1986;
Rock 1986; Koh & Walter 1989). Accordingly, the regression model includes as control
variables various factors that primarily proxy for information asymmetry, in particular
for IPO firms. Valuing an IPO is more difficult for younger firms as they have a shorter

62
history of operating in the market prior to IPO. Thus, there is higher information
asymmetry for younger firms and firm age (Age) is predicted to be negatively
associated with IPO underpricing (Ritter 1984; Loughran & Ritter 2004). Profitability
of a business (ROA) influences the level of information available about the firm as a
firm with higher profitability is willing to disclose more information to the public to
minimize undervaluation of their stock (Wallace & Naser 1995; Inchausti 1997). As a
result, there will be additional information available for firms with more profitable
operating history prior to IPO, reducing their need to underprice their initial stock offer.
The regression model also controls for firm leverage (Lev) following Lowry and Shu
(2002) who suggest that highly levered firms underprice their IPOs more as insurance
against potential litigation because they are exposed to higher litigation risk. Although
Lev is one of the inputs of CSCORE, it is still included as a control variable following
Kim et al. (2013). They test the association between CSCORE and the market reactions
to SEO announcements. In their regression model, they include the inputs of CSCORE
such as size, leverage and market-to-book ratio to alleviate the concern that it could be
difficult to discern the extent to which their results are driven by conservatism or by
firm characteristics that affect both CSCORE and the market reactions to SEO
announcements.6
Risky firms have higher information asymmetry between insiders and outside investors.
Following previous studies (Carter et al. 1998; Leone et al. 2007; Boulton et al. 2011),
stock return volatility (volatility) is included as a control variable to proxy for firm level
information asymmetry. Bradley et al. (2004) suggest that integer initial file prices
(Integer) are positively associated with IPO underpricing. They argue that firms with
6 Following Kim et al. (2013), if the inputs of CSCORE such as size, leverage and market-to-book ratio
are expected to significantly affect a dependent variable in the model specification based on the theory,
then this thesis includes them as control variables.

63
greater uncertainty are likely to have an integer offer price because the issuing firm and
its underwriter tend to negotiate from a set of rounded prices when there is higher after-
market price uncertainty. Previous studies (e.g., Lowry & Shu 2002; Leone et al. 2007)
also report that firms listed on the Nasdaq experience larger IPO underpricing because
these firms are harder to value due to their relatively higher risk and smaller size
(Corwin & Harris 2001). Thus, the regression model includes Nasdaq as one of the
control variables to proxy for the higher uncertainty surrounding Nasdaq firms.
Offersize is also included in the regression model to control for any significant
influence of IPO offer size on underpricing. Beatty and Ritter (1986) argue that small
offerings have substantially higher IPO underpricing due to higher ex ante uncertainty
associated with the smaller offerings (see also Barry & Brown 1984; TiniÇ 1988).
However, Michaely and Shaw (1994) find that the negative association between size
and underpricing is not maintained after controlling for the reputation of the underwriter.
They argue that reputable investment banks underwrite larger IPOs, but larger IPOs
need to be issued to a larger group of investors, requiring greater distribution efforts by
the investment banker which leads to larger IPO underpricing. Lowry and Shu (2002)
also find that firms with a larger offer size underprice their IPOs more because they are
subject to higher litigation risk. They suggest that litigation is economically feasible
when sued firms are significantly larger in terms of proceeds raised and market
capitalization after the IPO due to the fixed costs associated with filing a lawsuit (see
also Alexander 1991).
Prior literature suggests that a third-party monitoring certification by more reputable
underwriters, venture capitalists and auditors reduces the uncertainty about the value of

64
an IPO and the information asymmetry between insiders and outside investors by
adding credibility to the offering price of the issue (Carter & Manaster 1990; Datar et al.
1991; Megginson & Weiss 1991; Menon & Williams 1991; Michaely & Shaw 1994;
Carter et al. 1998; Copley & Douthett Jr 2002; Lewellen 2006; Nahata 2008). However,
Lowry and Shu (2002) propose the insurance effect of IPO underpricing, suggesting the
‘deep pocket’ theory that if the IPO firm does not have sufficient funds to meet all
damages payments, shareholders can seek the rest of the payments from the other
parties such as underwriters, venture capitalists or auditors under Section 11 of the
Securities Act of 1993. Accordingly, more reputable underwriters, venture capitalists
and auditors may underprice their IPOs by a greater amount to reduce their potential
litigation costs. Thus, the reputation measures of underwriter (Underwriter) and venture
capitalists (VC_Rep) and an indicator variable that takes the value of one if a firm’s
auditor is one of the Big Six auditors and otherwise zero (Auditor) are included as
control variables in the regression model to control for any effect of third-party
certification on IPO underpricing.
3.3.4 Accounting Conservatism and Post-Issue Stock Return Performance
Post-issue annual abnormal stock returns are calculated using buy-and-hold abnormal
returns (BHAR) and cumulative abnormal returns (CAR) relative to alternative
benchmarks: the monthly CRSP value-weighted index. Stock returns are measured for
the holding period of one to five years, starting from the issue month after adjusting for
the return on the first-trading day. However, when CSCORE is measured in the IPO
year, stock returns are measured three months after the IPO fiscal-year ends to allow for
a reporting lag (see Teoh et al. 1998a; Fan 2007). For IPOs that are delisted before the

65
holding period ends, the after-market period is truncated and the BHAR and CAR end
with CRSP’s last listing date (see Ritter 1991).
Post-issue buy and hold abnormal portfolio returns (BHAR) are calculated from the
cross-section of multi-month returns net of multi-month benchmark returns as follows:
BHARt ≡ ∑ [∏
∏
]
(5)
where Ri,t and Mi,t are monthly raw and benchmark returns and N is the number of
surviving firms in month T.
Post-issue cumulative abnormal portfolio returns (CAR) are computed from the event
time-series of firm-average monthly abnormal returns as follows:
CARt ≡ ∑ [∑ –
]
(6)
where Ri,t and Mi,t are monthly raw and benchmark returns and N is the number of
surviving firms in month T.
Loughran and Ritter (1995) argue that the Fama and French (1993) three-factor model
used in the time-series regressions with monthly portfolios returns have less power to
identify abnormal returns, especially when value-weighted portfolios returns are used.
Accordingly, this thesis employs a regression analysis to cross-sectionally test the
association between issuers' conservatism and their long-term stock return performance
after controlling for other known potential predictors. The following equation
represents the cross-sectional regression model and a description of each variable is
provided in Table 3-2:

66
BHARi or CARi = α0 + β1 CSCOREi + β2 Agei + β3 Underpricingi
+ β4 Underwriteri + β5 RDi + β6 ΔAsseti + β7 Cashi
+ ∑ Year dummies +
∑ Industry dummies + εi (7)
The main variable of interest is CSCORE and its coefficient tests whether the extent to
which conservatism is adopted by an IPO issuer can significantly predict its post-issue
stock return performance. CSCORE is measured both in the pre-IPO and IPO year.
Accounting variables are measured in the same fiscal year over which CSCORE is
measured for consistency. Following previous studies (Carter & Manaster 1990; Ritter
1991; Loughran & Ritter 2004) which suggest that firm age is a proxy for the risks of
the IPO firm, the regression model includes Age as a control variable. Prior research
also finds evidence that firms with higher IPO underpricing perform worse in the long-
run (e.g., Ritter 1991; Carter & Dark 1993; Krigman et al. 1999). Ritter (1991) suggests
that lower quality IPOs underprice their offer by a larger amount so as not to fully
exploit the market’s over-optimism at the time of the offering in order to avoid future
law suits. Thus, Underpricing is included as another control variable in the regression
model.
[Insert Table 3-2 here]
The regression model also controls for investment and growth characteristics of an IPO
by including the variables RD and ΔAsset. Eberhart et al. (2004) find that investors
experience significantly positive long-term abnormal stock returns following increases
in research and development (R&D) expenditures. On the other hand, Cooper et al.
(2008) suggest that firm asset growth is one of the strongest predictors of future returns,
reporting a strong negative correlation between a firm’s asset growth and subsequent

67
abnormal returns. Previous studies also suggest that more reputable underwriters market
higher quality IPOs with the prospects of better long-term performance to maintain their
credibility and protect their reputation in the IPO market (Megginson & Weiss 1991;
Michaely & Shaw 1994; Carter et al. 1998; Lewellen 2006). Thus, the regression
includes Underwriter as a control variable. The amount of cash and marketable
securities available (Cash) is also included in the regression model to proxy for the
financial condition of an IPO since low cash holdings are potential indicators of
financial distress and financial distress can lead to lower subsequent equity returns
(Billett et al. 2011).
3.4 Sample Data and Descriptive Statistics
This thesis utilizes the Securities Data Company’s (SDC) New Issues database to
identify all U.S. common stock initial public offerings during the period 1990 to 2005.
This thesis examines the post-IPO status and activities of IPO issuers such as their long-
term stock return performance, SEOs, M&As and their stock-market longevity.
Accordingly, this thesis adopts a period of five years after the IPO, following the
previous research on various post-IPO activities (e.g., Mikkelson et al. 1997; Jain &
Kini 1999; Bhabra & Pettway 2003; Harjoto & Turetsky 2006). Consequently, although
this thesis includes firms that went IPO from 1990 to 2005, the actual period under
investigation ends in 2010. Following previous IPO studies (e.g., Fan 2007; Lee &
Masulis 2011), unit issues, right issuers, spin-offs, ADRs, reverse LBOs, closed-end
funds, unit investment trusts, REITs, and IPOs with offer prices under $1 (“penny
stocks”) are excluded from the analysis. IPOs from the financial service sector (SIC
code 6XXX) and utility sector (SIC 49XX) are also excluded due to their significantly

68
different financial disclosure and regulation requirements relative to other sample firms
(see Lee & Masulis 2011). This leaves 3,795 IPOs identified during the sample period.
The detailed sampling process is reported in Table 3-3. To measure firm-level
conservatism, firms are required to have three variables available: (1) total assets (Size),
(2) leverage ratio measured as total debts divided by beginning total assets (Lev) and (3)
the market-to-book ratio (MTB). Such restrictions excluded a further 1,439 IPOs,
leaving 2,356 firms as the final sample for empirical analysis.
[Insert Table 3-3 here]
Table 3-4 (Panel A) reports descriptive statistics for the full IPO sample. The number of
observations of the post-IPO fiscal year is significantly higher than the pre-IPO year
since the pre-IPO year CSCOREs are measured only for 37% of the sample firms due to
lack of COMPUSTAT prospectus data available in the pre-IPO year. Table 3-4 (Panel
B) reports descriptive statistics for the sample firms that have CSCOREs available for
both the pre-IPO and IPO fiscal year. Finally, Table 3-4 (Panel C) reports descriptive
statistics of the variables that are measured only in the IPO year or that do not differ
between the pre-IPO and IPO year.
As reported in Table 3-4 (Panel A and B), CSCORE is significantly higher in the pre-
IPO year compared to that measured in the post-IPO fiscal year which suggests that IPO
firms adopt a higher degree of conservatism before they go public. Size, ΔAsset and
Cash significantly increased in the post-IPO year because the funds raised at the IPO
would have significantly increased the post-IPO total assets which include cash. Lev
significantly decreased in the post-IPO period, consistent with the previous finding that

69
newly listed firms significantly decrease their leverage with their IPO proceeds (see
Pagano et al. 1998).
[Insert Table 3-4 here]
RD significantly decreased in the post-IPO year, but 30% of the sample firms did not
incur any R&D expenditures. The mean and median RE are negative in both fiscal years,
consistent with the life-cycle theory that firms with low RE tend to be young firms
which raise external funds and invest all of their profits in their relatively abundant
investment opportunities (DeAngelo et al. 2010). The mean and median ROA are also
negative, suggesting that the profitability of IPO firms is low in general. However, both
RE and ROA significantly increased in the post-IPO year as compared to the pre-IPO
year, suggesting that firms experience increased profitability after the IPO.
In Table 3-4 (Panel C), the mean of VC_Rep, MTB and Underpricing is higher than the
median, indicating that its distribution is positively skewed. Integer, Nasdaq and
Auditor are dummy variables. Although it is not tabulated in Table 3-4 for brevity, out
of 2,356 sample firms, 423 IPOs had an integer offer price, 1,840 IPOs issued their
offerings on the NASDAQ and 2,175 IPOs used one of the Big Six auditors.

70
3.5 Empirical Analysis
3.5.1 Comparisons of CSCOREs between the pre-IPO and IPO year
Table 3-5 shows the IPO issuers’ CSCOREs from the pre-IPO year to five years after
the IPO. Table 3-5 (Panel A) reports changes in the mean and median CSCORE each
year and compares the pre-IPO CSCORE to the CSCOREs measured in the post-IPO
periods (year 0 to year 5). The mean and median pre-IPO year CSCORE (year-1) is
significantly higher than the IPO year (year 0) CSCORE at 1%. In particular, the pre-
IPO year CSCORE is significantly higher than the CSCOREs measured in year 0 to year
5 for all six years. These results provide strong evidence that IPO issuers adopt a higher
degree of conservatism before they go public. After the IPO, issuers’ conservatism
significantly declines in year 0 and this decline continues until year 1. Issuers'
conservatism starts increasing again in year 2 but shows no more significant changes
after year 3.
[Insert Table 3-5 here]
It is difficult to conclude that firms adopt a more conservative reporting policy prior to
going public based on the results obtained from Panel A since it only compares issuers’
CSCOREs measured between the pre- and post-IPO periods. As a result, Panel B
compares the mean and median CSCOREs between the IPO sample and non-issue
matched firms following Kothari et al. (2005). Kothari et al. (2005) provide the
specification of tests based on performance-matched, discretionary accrual measures.
They show that performance-matched measures enhance the reliability of inferences
from earnings management research, mitigating problems associated with the

71
correlation between accruals and a firm’s performance. Since conditional conservatism
is reflected in both earnings and accruals (see Ball & Shivakumar 2005), this thesis
adopts the approach of performance matching to identify non-issue matched firms. Each
sample firm is matched with another non-issue firm with the same three-digit SIC code
and the closest return on assets (ROA) in the same year. The ROA is measured as
income before extra-ordinary items divided by total assets. Matched firms are identified
separately for the pre-IPO and IPO year since the IPO is a major corporate event and
firms experience significant changes in terms of organizational, financial and capital
structure between the pre- and post-IPO year. CSCOREs of the IPO year matched firms
are computed for the period of six years from the event year (year 0 to year 5) to
examine whether changes in reporting conservatism after the IPO significantly differ
from those of the matched firms.
In Table 3-5 (Panel C), the performance matched non-issue firms are identified on the
basis of the non-issuer’s ROA that falls within 90 to 110 percent of the sample firm
following Denis and Kruse (2000). For example, if the non-issuer with the same three-
digit SIC code has a ROA less than 90% or greater than 110% of the issuer’s ROA, then
the non-issuer with the closest ROA is identified as a matched firm without matching
the SIC code.
The mean and median of the issuer’ CSCORE in year -1 is significantly higher
compared to the matched firms, indicating that the IPO issuers' conservatism in the pre-
IPO year is significantly higher than that of the non-issue matched firms. Ball and
Shivakumar (2008) claim that a higher level of scrutiny at the IPO from market
monitors and regulatory scrutiny increases the incentives for IPO issuers to provide

72
more conservative IPO prospectus data. This result is also consistent with
Venkataraman et al. (2008), who report that average pre-IPO accruals are negative and
less than post-IPO accruals. The issuers' mean CSCORE is also higher than the non-
issue matched firms in year 0, although the difference is not statistically significant. The
median of sample firms' CSCORE is significantly higher than that of the matched firms
in year 0. Taken together, this result supports the view that IPO firms do not engage in
earnings management, in particular in the pre-IPO and the IPO year. The mean
CSCORE of the matched firms in year 3, 4 and 5 is significantly higher than that of the
IPO sample firms which suggest that firms start moving away from conservatism and
reporting more aggressively two years after the IPO. However, this result needs to be
interpreted with some caution, as the median difference is not statistically significant.
As discussed above, the results provide evidence that issuers' conservatism changed
significantly between the pre- and post-IPO year. Prior literature documents that
accounting conservatism changes following changes in information asymmetry (Watts
2002; LaFond & Watts 2008). Although it may be expected that information asymmetry
reduces after the IPO and thus firms report less conservatively in the post-IPO year, this
thesis examines which specific factors lead IPO firms to significantly change their
conservatism from the pre- to post-IPO year. The following equation is developed for
the regression analysis and a description of each variable in the model is provided in
Table 3-2:
ΔCSCOREi or %ΔCSCOREi = α0 + β1 REi, t-1 + β2 Agei + β3 Inv_Cycle i, t-1
+ β4 Volatilityi + β5 Underwriteri + β6 VC_Repi
+ β7 Auditori + β8 Hightechi + ∑ Year dummies
+ ∑ Industry dummies + εi (8)
73
The dependent variable is ΔCSCORE (%ΔCSCORE) which measures changes in the
CSCORE between the pre-IPO and IPO year. The right-hand side variables are
suggested by prior literature as the major factors affecting accounting conservatism.
Previous studies (LaFond & Watts 2008; Khan & Watts 2009) suggest that
conservatism is expected to decrease with firm age (Age) because younger firms tend to
have more growth options that make the future cash flows less verifiable and produce
higher agency costs that lead to higher conservatism. Also, younger firms, particularly
in the IPO setting, have less data to aid in the valuation process, increasing the
complexity of estimating future cash flows and a suitable offer price (Krinsky &
Rotenberg 1989; Ritter 1991). Thus, younger IPO firms have a higher degree of
information asymmetry between managers and outside investors than do older firms,
increasing the demand for higher conservatism. Inv_cycle is a decreasing measure of
the length of the investment cycle measured as depreciation expenses scaled by
beginning total assets and is expected to be negatively associated with conservatism.
Longer investment cycles (i.e., smaller depreciation expenses relative to beginning total
assets) increase the difficulty in forecasting the magnitude and timing of future cash
flows, generating a higher demand for conservatism (Khan & Watts 2009).
DeAngelo et al. (2010) document that firms with high retained earnings (as a proportion
of total assets) tend to be more mature established firms with higher profitability. More
mature firms have richer information environments than young firms, reducing the need
for conservatism. Thus, conservatism is expected to decrease with RE. Volatility is also
included in the model because firms with higher stock return volatility have higher
information asymmetry between insiders and outside investors. Volatility is expected to
be positively associated with ΔCSCORE (LaFond & Watts 2008; Khan & Watts 2009).

74
Hightech is also predicted to have a positive association with ΔCSCORE. Firms in the
technology sector have higher litigation risk than non-technology firms (Field et al.
2005). As a result, firms from the high-tech industry are more likely to adopt a higher
degree of conservatism to protect themselves from potential litigation
(Ramalingegowda & Yu 2012). Thus, Hightech, a dummy variable that takes one if the
IPO firm is in the high-tech industry as defined in the SDC and otherwise zero, is
included as a control variable in the model.
Prior research indicates that the reputation of Underwriter, VC_Rep and Auditor can
affect changes in conservatism between the pre- and post-IPO year. Previous studies
suggest that IPO firms engaging more reputable third-party specialists are more likely
to have less information asymmetry between insiders and outside investors (Carter &
Manaster 1990; Megginson & Weiss 1991; Menon & Williams 1991; Carter et al. 1998;
Lewellen 2006; Jain & Kini 2008). Accordingly, there are less incentives for these
issuers to adopt higher conservatism, so Underwriter, VC_Rep and Auditor are expected
to be negatively associated with ΔCSCORE. On the other hand, more reputable third-
party specialists may enforce issuers to adopt a conservative reporting policy in the IPO
year due to their reputational capital at stake. They need to establish a trustworthy
reputation in the long-term because their survival, as well as future expected
profitability, is strongly influenced by their reputation and reputation is directly affected
by the post-IPO stock and accounting performance of the IPO firm they are working
with (Megginson & Weiss 1991; Nahata 2008). Accordingly, they have strong
incentives to ensure that IPO firms report earnings conservatively in the IPO year so
that these firms can maintain their earnings in the future. This suggests a positive
association between ΔCSCORE and Underwriter, VC_Rep and Auditor.

75
Table 3-6 provides the correlation matrix7 of the variables used in equation (8).
Contrary to the prediction, RE is positively correlated with ΔCSCORE, indicating that
IPO issuers with higher RE in the pre-IPO year tend to increase their conservatism in
the IPO year. However, their correlation is only 6.8% and statistically significant at
10%. Underwriter is positively correlated with Auditor at 38%, indicating that IPO
firms hiring more reputable underwriters tend to involve one of the Big Six auditors.
Other variables do not appear to have a high level of correlation between each other.
[Insert Table 3-6 here]
The results for the regression analysis are presented in Table 3-7. VC_Rep is negatively
and statistically significantly associated with both ΔCSCORE and %ΔCSCORE at 10%
and 5% respectively. Previous studies (Megginson & Weiss 1991; Nahata 2008) find
that VCs have higher incentives to closely monitor their portfolio firms to establish a
good reputation in the market given the highly networked nature of the venture capital
industry and the repeated need for funds. Furthermore, VCs have access to inside
information on the prospects of their portfolio firm (Jain & Kini 2008). Therefore,
reputable VCs can provide certification to outside investors that the offer price of the
issue is close to its "true" price, reducing the uncertainty about the quality of an issue
(see Megginson & Weiss 1991). Thus, IPO firms backed by more reputable VCs have
lower information asymmetry between insiders and outside investors and this
significantly reduces the need for these IPO firms to adopt a higher degree of
conservatism in the IPO year. As such, firms backed by more reputable VCs show
significant negative changes in CSCOREs between the pre and post-IPO year.
7Each variable in the regression model is tested for a variance inflation factor (VIF) and the results are
provided in Appendix II of the thesis. The mean VIF is 1.29 and each VIF reported is under 2, suggesting
that the model is not subject to multicollinearity (Kim & Purnanandam 2013).

76
The coefficient on Volatility is positive and statistically significant in both regressions,
implying that firms with higher stock return volatility following the IPO significantly
increase their conservatism in the post-IPO year in response to higher information
asymmetry. The coefficient on RE is negative and statistically significant, indicating
that IPO issuers with a larger amount of retained earnings are more likely to reduce
their conservatism in the IPO year compared to the pre-IPO year. However, the
coefficient remains statistically significant only in the model where the dependent
variable is %ΔCSCORE. Other variables do not appear to have a significant association
with issuers' changes in CSCOREs.
[Insert Table 3-7 here]
3.5.2 Testing the Effect of Conservatism on IPO Underpricing
To test whether conservatism adopted by issuers prior to going public positively affects
issuers' underpricing, equation (4) is estimated employing OLS regression analysis.
Table 3-8 reports the correlation matrix8 among the variables used in this model
specification. Prior research documents that IPO underpricing arises due to the
information asymmetries among the parties associated with the offering (Beatty &
Ritter 1986; Boulton et al. 2011). There is a relatively high correlation between
Underpricing and Volatility at 44%. Their high correlation is expected since Volatility
proxies for the degree of information asymmetry. The correlation between Offersize and
Underwriter is significantly high at 66%. Prior research also provides evidence of this
8VIF is tested for each variable and the results are provided in Appendix II of the thesis. The highest VIF
is only 1.71 in the regression which is obtained for Offersize.

77
positive relation and documents that both Offersize and Underwriter are important
factors affecting the degree of IPO underpricing (e.g., Carter & Manaster 1990; Carter
& Dark 1993; Carter et al. 1998). However, given their high correlation, the regression
estimation is repeated with only one of the variables included in the regression to ensure
that the results are not affected by their high correlation.
[Insert Table 3-8 here]
Table 3-9 (Panel A) reports the results for the regression analysis. The coefficient on
Pre_CSCORE is negative and statistically significant at 5% in both model 1 and 2,
suggesting that issuers adopting a higher degree of conservatism prior to going public
experience less IPO underpricing. Prior research suggests that accounting conservatism
plays a more significant role when there is higher information asymmetry (LaFond &
Watts 2008; García Lara et al. 2009; Lin & Tian 2012). To test such an effect, the
regressions are re-estimated separately for firms with high and low information
asymmetry.
Following previous studies (e.g., Frankel et al. 1995; LaFond & Watts 2008; Khan &
Watts 2009; Kim et al. 2013) which measure information asymmetry using stock return
volatility or bid-ask spread, sample firms are divided into high and low information
asymmetry groups based on both stock return volatility and bid-ask spread. Specifically,
if the issuer's stock return volatility measured over 30 days following the IPO is greater
than the median volatility of the entire sample firms, the issuer is placed into the high
information asymmetry group. If the issuer's volatility is lower than the median
volatility, it belongs to the low information asymmetry group. Similarly, bid-ask spread

78
is computed as [ask – bid / (ask + bid)/2] and measured over 30 days after the IPO. If
the IPO firm’s average bid-ask spread over this period is higher than the median bid-ask
spread of all sample firms, it is placed into the high-information asymmetry group. If
the IPO firm’s bid-ask spread is lower than the median bid-ask spread, it is placed into
the low information asymmetry group. For robustness tests, sample firms are also
divided into high and low information asymmetry groups based on the stock return
volatility and bid-ask spread measured over the entire post-IPO fiscal year. The results
are consistent and are presented in Appendix III.
Table 3-9 (Panel B) reports the regression results for the high information asymmetry
group. Stock return volatility was used as a measure of information asymmetry in
models 3 and 4, while models 5 and 6 employ the bid-ask spread measure of
information asymmetry. The regression results for the low information asymmetry
group are presented in Table 3-9 (Panel C) in which models 7 and 8 use the return
volatility measure of information asymmetry and models 9 and 10 use the bid-ask
spread.
[Insert Table 3-9 here]
The coefficient on Pre_CSCORE is negative and statistically significant at 5% in model
3 and 4 and at 1% in model 5 and 6. In particular, the magnitude of the coefficient on
Pre_CSCORE is larger than those estimated in model 1 and 2 (from -0.06 to -0.14 or -
0.19). However, the coefficient on Pre_CSCORE is not statistically significant in model
7, 8, 9 and 10 which implies that there is no significant association between issuers'
conservatism and underpricing for the low information asymmetry group. These results

79
provide evidence that the observed positive effect of issuers' conservatism on
underpricing is mainly driven by the IPO firms with higher information asymmetry.
Thus, the results suggest that IPO firms with higher information asymmetry benefit
more from adopting higher conservatism in the pre-IPO year by underpricing their IPOs
to a lesser extent.
Contrary to the prediction, the coefficient on Integer is negative and statistically
significant across model 1 to model 6. However, other studies such as Banerjee et al.
(2011), Boulton et al. (2011) and Lin and Tian (2012) find similar results. They argue
that the use of integer offer price tends to reduce the uncertainty in pricing the IPO
because discrete price sets reduce the amount of information required between the
negotiating parties associated with the offering (see also Harris 1991). Offersize is
positively associated with IPO underpricing in all models (except for model 7) which
lends support to Lowry and Shu (2002) that larger IPOs are underpriced more for the
higher potential litigation risk. The coefficient on Age is negative and statistically
significant in all regressions, consistent with the prediction that younger firms
underprice their IPOs to a greater extent.
Contrary to the prediction, Lev has a negative sign in Panel A and B. However, it is
consistent with Lin and Tian (2012) who also find evidence that leverage is negatively
associated with IPO underpricing. They argue that the monitoring role of leverage
deters management’s opportunistic behavior, reducing information asymmetry for the
IPO firm. Volatility is positively associated with IPO underpricing in all regression
models (statistically significant at 1%), confirming that more risky firms underprice
their IPOs to a greater extent. The coefficient on Nasdaq is positive and statistically

80
significant in Panel A and C, indicating that Nasdaq listed firms are underpriced to a
greater extent. However, for the fact that the coefficient remains statistically significant
only for the low information asymmetry group, the positive association between
Nasdaq and IPO underpricing holds only for IPO firms with less information
asymmetry. Other variables do not exhibit a significant association with IPO
underpricing.
3.5.3 Conservatism and Long-Term Stock Return Performance of IPO Firms
Sample firms are sorted into quartile portfolios based on their conservatism measured in
the pre-IPO and IPO year to test the association between issuers' conservatism and
long-term stock return performance. Q1 is the most conservative reporting earnings
portfolio and Q4 is the least conservative reporting earnings portfolio. Table 3-10
presents the Pre_CSCORE quartile portfolios and Table 3-11 provides Post_CSCORE
quartile portfolios. The sample mean and median abnormal stock returns are all
negative, consistent with previous findings of significant after-market
underperformance of IPO firms (e.g., Ritter 1991; Teoh et al. 1998a).
As presented in Table 3-10, the least conservative portfolio Q4 is the most
outperforming portfolio, whereas the most conservative portfolio Q1 is the worst-
performing portfolio for all five years of holding periods. In particular, there is a
monotonic decrease in the market-adjusted returns from Q4 to Q1 (except for the five
years return). However, the Post_CSCORE quartile portfolios show different results.
[Insert Table 3-10 here]

81
In Table 3-11, Q4 and Q1 are not the most outperforming or the worst performing
portfolio. In fact, Q2 appears to be the most outperforming portfolio across different
holding periods except for two years of returns. Nonetheless, it is difficult to draw
inferences from these results as there appears to be no systematic pattern across the
quartile market adjusted returns for different holding periods. Accordingly, this chapter
also performs a multivariate analysis by estimating regression equation (7) because
univariate analysis does not control for other effects on post-issue stock returns and thus
the evidence is only suggestive. The regressions are estimated separately for
Pre_CSCORE and Post_CSCORE analysis.
[Insert Table 3-11 here]
Table 3-12 reports the correlation matrix9
of independent variables used in the
regression model for the Pre_CSCORE analysis and Table 3-13 for the Post_CSCORE
analysis. There is a relatively higher correlation between Cash and RD at 43% in the
pre-IPO year and at 50% in the post-IPO year, suggesting that IPO firms with higher
cash holdings tend to invest more in R&D activities. However, other variables do not
appear to have a high level of correlation between each other.
[Insert Table 3-12 here]
[Insert Table 3-13 here]
9 Because some variables show a significantly high correlation, each coefficient is tested for VIF. The
results are provided in Appendix II of the thesis and there is no sign of multicollinearity in the regressions.

82
Table 3-14 reports the regression results testing the association between Pre_CSCORE
and issuers’ stock return performance based on buy-and-hold abnormal returns
(BHARs). The coefficient on Pre_CSCORE is negative in all models and is statistically
significant in one, two and three year BHARs regressions at 1 %, 10% and 5%,
respectively. Table 3-15 presents the regression results where the cumulative abnormal
returns (CARs) are used as a dependent variable in the equation. Consistent with the
results reported in Table 3-14, the coefficient on Pre_CSCORE is negative and
statistically significant in one, two and four year return regressions. Taken together,
these results indicate that issuers reporting earnings more conservatively in the pre-IPO
year tend to show lower post-issue stock returns at least for two years after the IPO.
[Insert Table 3-14 here]
[Insert Table 3-15 here]
Consistent with predictions, the coefficient on Underpricing is negative in all
regressions, indicating that issuers with larger initial returns show worse long-term
stock return performance. However, it remains statistically significant only for one and
two year BHAR and CAR regressions. The coefficient on Underwriter is positive and
statistically significant in all regressions (except for two and three year CAR
regressions), suggesting that IPOs underwritten by more prestigious underwriters tend
to perform better in the post-issue market. Cash also has a positive coefficient, showing
that the market perceives IPO firms with higher amount of cash holdings as a better
investment. However, the coefficients remain statistically significant only in the CAR
regressions (except for one year window regression).

83
The coefficient on ΔAssets is negative and statistically significant in CAR regressions
(except for four year regression) and in five year BHAR regression. The results are in
line with prior research that firms with higher asset growth experience subsequent
negative equity returns (Cooper et al. 2008). RD presents mixed results. Contrary to the
prediction, the coefficient on RD is negative and statistically significant in three and
four year BHAR regressions, while it is positive in all CAR regressions. However, its
coefficients are not statistically significant across different holding periods of returns.
Tables 3-16 and 3-17 report the regression results testing the association between the
Post_CSCORE and BHARs and the Post_CSCORE and CARs, respectively. The
coefficient on Post_CSCORE is positive and statistically significant in all regressions
except for two year CAR and one and two year BHAR regressions. Given that the
coefficient on Post_CSCORE is statistically significant for three to five year return
windows in both BHAR and CAR regressions, the results indicate that issuers adopting
a higher degree of conservatism in the post-IPO year show a higher long-term stock
return performance.
[Insert Table 3-16 here]
[Insert Table 3-17 here]
As for the control variables, Age is positively associated with issuers' stock returns but
is statistically significant only in five year BHAR, and four and five year CAR
regressions which provides some evidence that older firms tend to show a higher stock
return performance but mainly in the long-term. The coefficient on RD is also positive

84
in all regressions and remains statistically significant in all CAR regressions. This
finding indicates that IPO firms investing more in R&D activities in the post-IPO year
experience higher post-issue stock returns. However, it is only weak evidence as the
coefficient is not statistically significant across all return windows in BHAR regressions
except for one year. For brevity, the results for other control variables are not discussed
here because they are similar to the results obtained from the Pre_CSCORE regression
analysis.
3.5.4 Additional Tests for an Association between Conservatism and Long-Term
Stock Return Performance of IPO Firms
To examine whether the extent to which conservatism adopted by issuers in the pre-IPO
and IPO year jointly affects their after-market stock returns, sample firms are sorted
into four portfolios based on the level of their Pre_CSCORE and Post_CSCORE,
respectively. Sample firms whose CSCOREs are above the median CSCORE in both the
pre-IPO and IPO year are placed into the ‘CtoC’ (conservative to conservative)
portfolio. Sample firms whose CSCOREs are above the median CSCORE in the pre-
IPO year and below the median CSCORE in the IPO year are placed into the ‘CtoA’
(conservative to aggressive) portfolio. Sample firms whose CSCOREs are below the
median CSCORE in the pre-IPO year and above the median CSCORE in the IPO year
are placed into the ‘AtoC’ (aggressive to conservative) portfolio. Finally, sample firms
whose CSCOREs are below the median CSCORE both in the pre-IPO and IPO year are
placed into the ‘AtoA’ (aggressive to aggressive) portfolio. The portfolio returns are
presented in Table 3-18.

85
As reported in Table 3-18, despite the fact that firms go through significant changes
between the pre- and post-IPO period, 66% of the sample firms are placed in either the
‘CtoC’ or ‘AtoA’ portfolio. This is consistent with the previous studies which document
that accounting conservatism is the firm's reporting characteristic that is not expected to
drastically fluctuate from one reporting period to the next (see Watts 2002; Givoly et al.
2007). The ‘AtoC' portfolio shows the highest market-adjusted returns throughout
different holding periods. The ‘CtoC' portfolio records the second highest portfolio
returns and the 'CtoA' portfolio records the third highest returns, except for the one year
return window. The ‘AtoA' portfolio report negative returns for all return windows and
is the worst-performing portfolio.
[Insert Table 3-18 here]
Overall, these results suggest that issuers reporting earnings less conservatively in the
pre-IPO year but who increase their conservatism in the IPO year exhibit a higher return
performance in the post-issue stock market. On the other hand, issuers reporting
earnings aggressively both in the pre-IPO and IPO year significantly underperform in
the market and the other portfolios for all return windows.
Regression analysis is also employed and three additional dummy variables are
included in the regression models as indicators of three portfolios. Specifically, CtoC is
one if the sample firm is from the 'CtoC' portfolio and zero otherwise, AtoC is one if the
sample firm is from the ‘AtoC' portfolio and zero otherwise, and CtoA is one if the
sample firm is from the ‘CtoA' portfolio and zero otherwise. The base is the sample
firms from the ‘AtoA' portfolio.

86
The regression results are presented in Table 3-19 and Table 3-20 for BHARs and
CARs, respectively. The coefficient on AtoC is positive and statistically significant in
all BHAR and CAR regressions except for the one year return window in the CAR
regression. The coefficient on CtoC shows a negative sign in most regressions (in
particular CAR regressions) but is statistically significant only for the one year return
window. The coefficient on CtoA is not significant in any return regressions. These
results are consistent with the previous regressions results obtained when the
association between Pre_CSCORE (Post_CSCORE) and stock returns is examined in
the regression analysis. Taken together, these results provide evidence that IPO issuers
who report earnings less conservatively in the pre-IPO year, but increase their reporting
conservatism in the IPO year, experience higher post-issue stock return performance.
[Insert Table 3-19 here]
[Insert Table 3-20 here]
This result may indicate that firms that do not expect to perform well after the IPO
adopt a higher degree of conservatism in the pre-IPO year as a protection mechanism to
decrease the probability of future litigation. Previous studies suggest that conservatism
is positively associated with the probability of litigation (see Watts 2002; Khan & Watts
2009). High litigation risk firms are more likely to understate earnings and net assets
because there is a higher probability of a firm being sued when it overstates its earnings
and assets and subsequently suffers a loss in the value of its stock when the
overstatement is discovered (Khan & Watts 2009). Such an effect can be significantly
more pronounced for IPO firms in the pre-IPO year since investors can sue the firm to

87
recover damages after the IPO by showing their reliance on the IPO prospectus (e.g.,
TiniÇ 1988; Lowry & Shu 2002). However, the results also suggest that investors
recognize the benefits of conservative reporting by rewarding the IPO firms reporting
more conservatively in the IPO year in the long-term, as evidenced by higher long-term
stock returns associated with Post_CSCORE. However, provided that Pre_CSCORE
shows a strong negative association with post-issue stock returns, the litigation effect
appears to be dominant in the pre-IPO year.
3.5.5 Robustness Tests for the Association between Conservatism and Long-Term
Stock Return Performance of IPO Firms
Abnormal returns are sensitive to alternative measurement methodologies (e.g.,
Loughran & Ritter 2000). To test the robustness of the results, an alternative benchmark
is employed to compute abnormal returns. Prior literature suggests that selection bias is
reduced when the comparison of outcomes is performed using treated and control
subjects which are as similar as possible (Rosenbaum & Rubin 1983; Lee & Masulis
2011). For instance, Lee and Masulis (2011) argue that the propensity score matching
method provides a more reliable measure since constructing a control group based on
one or two factors is unlikely to be sufficient to eliminate the selection bias and
traditional sequential matching techniques that account for all the important factors are
cumbersome and inefficient.
Propensity scores are first estimated based on the four firm-characteristics: size (total
assets), the market-to-book ratio, leverage (total debts divided by total assets) and return

88
on assets.10
Thereafter, a non-issuer which has the closest propensity score with the
sample firm within the same two digit-SIC code is identified as a matched firm. If the
sample firm drops out, both sample and matched firms are assigned zero returns for the
remainder of the period. If the original matched firm drops out before the IPO sample
firm, the next best match is included for the remainder of the holding period. This
matching process continues until the benchmark return is available for the entire
holding period of the sample firm to avoid survivorship bias in the matched sample.
However, this matching procedure deteriorates the quality of matching. Specifically, in
the sample data, only 15% of the sample firms found a matched firm that was listed for
the entire return window of the sample firm. This means that the matching process had
to be continued for 85 percent of the sample firms until their benchmark return was
available for the entire holding period, resulting in a number of matched firms assigned
for one sample IPO. As a result, approximately half of the sample firms had more than
five matched firms identified and in some cases, the sample firm ended up with more
than 20 matched firms due to the severe delisting problem of the matched firms.
The delisting issue is inherent in any matching firm techniques. As a result, the thesis
employs the Fama-French size and book-to-market 5x5 (25) portfolios11
as a
benchmark as this method can provide benchmark returns over the entire return
windows without any missing data while still reflecting the firm-characteristics of the
sample firms. Consistent with the previous analysis, the regressions are performed to
10
Size, leverage and market-to-book ratio are the three most commonly used characteristics in the extant
literature for matching techniques (e.g., Eckbo & Norli 2005; Fama & French 1995, 1993). Return on
assets is also included following Kothari et al. (2005) suggesting that performance matching based on
return on assets enhances the reliability of inferences, in particular, from earnings management research.
Conservatism is measured based on both earnings and accruals as discussed in Section 3.5.1. Thus, return
on assets is also selected for the propensity score matching in this thesis. 11
Fama-French size and book-to-market 25 (5x5) portfolio returns are obtained from the data library of
the Kenneth R. French website:
<http://mba.tuck.dartmouth.edu/pages/faculty/ken.french/data_library.html>.

89
test the effects of Pre_CSCORE, Post_CSCORE and pre-to-post IPO year CSCORE on
post-issue stock returns. The regression results for the Pre_CSCORE analysis are
presented in Table 3-21, the Post_CSCORE in Table 3-22 and the pre-to-post IPO
CSCORE in Table 3-23.
The coefficient on Pre_CSCORE is negative in all regressions and is statistically
significant for one and two year return windows as shown in Table 3-21, indicating that
issuers adopting higher conservatism in the pre-IPO year do not perform well in the
aftermarket for two years. The coefficient on Post_CSCORE does not show a positive
sign in most regressions in Table 3-22, but it is also not statistically significant in any of
the regressions. As reported in Table 3-23, the coefficient on AtoC is positive and
statistically significant in all regressions which suggests that issuers reporting less
conservatively prior to going public but reporting more conservatively in the IPO year
perform significantly better in the post-issue stock market. Although the Post_CSCORE
regression analysis does not report consistent results, the results so obtained are broadly
consistent with the previous results, provided that Pre_CSCORE is negatively
associated with post-issue stock returns and the IPO firms from the 'AtoC' portfolio
significantly outperform for all return windows.
[Insert Table 3-21 here]
[Insert Table 3-22 here]
[Insert Table 3-23 here]

90
3.6 Summary and Conclusions
This chapter examined IPO issuers' conservatism and investigated how the
conservatism adopted by IPO issuers affected IPO underpricing and post-issue stock
return performance. The results of this chapter provide evidence that IPO issuers adopt
a higher degree of conservatism before they go public and the issuers' conservatism is
significantly higher than the matched non-issue firms, both in the pre-IPO and the IPO
year. These results indicate that IPO firms do not engage in earnings management by
adopting more aggressive reporting around the IPO process.
This chapter also finds that issuers' pre-IPO year conservatism is negatively associated
with IPO underpricing, suggesting that issuers reporting more conservatively prior to
going public underprice their IPO to a lesser extent. The result also reveals that the
positive effect of issuers' conservatism on underpricing is mainly driven by the IPO
firms with higher information asymmetry. This suggests that IPO firms with higher
information asymmetry benefit more from adopting higher conservatism in the pre-IPO
year by experiencing a lower indirect cost of issuing the IPO.
Finally, the results of this chapter indicate that IPO issuers reporting more
conservatively in the pre-IPO year experience worse aftermarket stock returns. This
result may reflect that IPO issuers who do not expect to perform well after the IPO
adopt higher conservatism in the pre-IPO year to protect themselves from potential
litigation risks. Investors can sue the firm to recover damages after the IPO by showing
their reliance on the IPO prospectus (see TiniÇ 1988). However, the results also
indicate that issuers reporting more conservatively in the IPO year show a better stock

91
return performance in the long-term. Consistent with this, the evidence further suggests
that a portfolio of firms reporting less conservatively in the pre-IPO year, but adopting
higher conservatism in the IPO year performs significantly better in the post-issue stock
market. These results are consistent across different return measurements and
benchmarks employed. Taken together, the results may indicate that investors recognize
the benefits of conservative reporting by rewarding the IPO firms reporting more
conservatively in the IPO year in the long-term. However, firms who do not expect to
perform well after the IPO adopt higher conservatism in the pre-IPO year due to their
higher potential litigation costs, indicating that the litigation effect appears to be
dominant in the pre-IPO year.
In the next chapter, this thesis examines the association between IPO issuers'
conservatism and their seasoned equity offering activity.

92
3.7 Tables
Table 3-1: Fama-Macbeth Mean Coefficients from CSCORE Annual Regressions
Independent Variables Model 1 Model 2 Model 3
CONSTANT -0.096*** -0.097*** -0.070**
(-3.753) (-3.811) (-2.153)
D -0.582*** -0.533*** -0.535***
(-7.434) (-6.348) (-5.936)
CFO -2.179*** -2.120*** -2.127***
(-6.611) (-6.556) (-6.570)
CFO*Size 0.089*** 0.083*** 0.087***
(5.155) (4.769) (4.846)
CFO*Lev -0.416*** -0.341*** -0.299**
(-5.023) (-2.793) (-2.142)
CFO*MTB 0.003 0.003 0.000
(0.663) (0.684) (0.014)
CFO*D 3.298*** 3.201*** 3.208***
(8.608) (8.616) (8.785)
CFO*D*Size -0.141*** -0.133*** -0.137***
(-7.954) (-7.430) (-7.533)
CFO*D*Lev 0.411*** 0.334*** 0.291**
(4.719) (2.636) (2.051)
CFO*D*MTB -0.002 -0.003 0.000
(-0.501) (-0.574) (0.069)
Size 0.005*** 0.005*** 0.005***
(3.583) (3.590) (2.718)
Lev -0.070*** -0.079*** -0.071**
(-3.283) (-3.032) (-2.103)
MTB 0.002*** 0.002** 0.002*
(3.107) (2.238) (1.885)
D*Size 0.034*** 0.031*** 0.032***
(7.655) (6.565) (6.104)
D*Lev -0.101*** -0.096*** -0.099**
(-3.356) (-2.970) (-2.556)
D*MTB -0.000 -0.000 -0.000
(-0.487) (-0.243) (-0.162)
ΔSALES 0.067*** 0.065***
(5.739) (5.391)
PPE -0.052***
(-5.860)
Adj. R2 33.30% 35.05% 35.63%
*** indicates significance at 1%. ** indicates significance at 5%. * indicates significance at 10%. This
table presents the mean coefficients from the Fama-Macbeth annual CSCORE regressions. Size is the
natural logarithm of total assets. MTB is the market-to-book ratio. Lev is short- and long-term debts
divided by beginning total assets. ACC is accruals obtained from cash flow statement. CFO is cash flow

93
from operations. ACC and CFO are both scaled by beginning total assets. D is a dummy variable taking
the value of one if CFO is negative and zero otherwise. ΔSALES is changes in sales divided by
beginning total assets. PPE is book value of fixed assets divided by beginning total assets. All
continuous variables are winsorised at the 1st and 99th percentiles. Adj_R2 is the average of the adjusted
R2 from the annual regressions estimated over the period 1989-2005.

94
Table 3-2 Variable Description
Variable Description
Pre_CSCOREi Conservatism measured in the pre-IPO year.
Post_CSCOREi Conservatism measured in the IPO year.
ΔCSCOREi Changes in CSCOREs between the pre and post-IPO year, computed as post-
IPO CSCORE minus pre-IPO year CSCORE.
%ΔCSCOREi
Percentage changes in CSCOREs between the pre and post-IPO year,
measured as post-IPO year CSCORE divided by pre-IPO year CSCORE,
minus 1.
Agei,t Natural log of one plus the difference between the year of going public and the
year of founding in year t where year t is the IPO year.
Auditori,t A dummy variable that equals one if the auditor is one of the Big 6 auditors
and otherwise zero.
Cashi,t Cash and marketable securities divided by beginning total assets measured in
year t where year t is the IPO year.
Hightechi,t A dummy variable that takes one if the IPO firm is in the high-tech industry as
defined in the SDC and otherwise zero.
Integeri,t A dummy variable that equals one if the offer price is an integer and zero
otherwise.
Inv_cyclei,t
Depreciation expenses scaled by beginning total assets in year t where year t is
the IPO year and thus is a decreasing measure of the length of the investment
cycle.
Levi,t Total debts divided by beginning total assets in year t where year t is the IPO
year.
MTBi,t Market to book ratio in year t where year t is the IPO year.
Nasdaqi ,t A dummy variable that equals to one if stock is listed on the NASDAQ and
otherwise zero.
Offersizei,t Natural logarithm of the number of IPO shares offered, multiplied by the offer
price.
RDi,t Expenditure on research and development divided by total beginning assets
measured in year t where year t is the IPO year.
REi,t Retained earnings divided by beginning total assets in year t where year t is the
IPO year.
ROAi,t Income before extraordinary items divided by beginning total assets measured
in year t where year t is the IPO year.
Sizei,t Natural logarithm of total assets in year t where year t is the IPO year.
Underpricingi,t First-day closing price divided by the final offer price, minus 1.
Underwriteri,t A ranking of the reputation of the lead underwriter on a 0-9 scale obtained from
the Jay Ritter's website <http://bear.warrington.ufl.edu/ritter/ipodata.htm>.
VC_Repi,t Lead VC's dollar market share of all venture-backed IPOs in the preceding
three calendar years and takes zero for non-VC backed IPOs.
Volatilityi,t Standard deviation of daily stock returns over the first 30 calendar days
following the offering.
ΔAssetsi,t Growth in total assets measured in year t where year t is the IPO year.

95
Table 3-3: Sample Construction
Sampling Process No of Firms
U.S. IPOs 6,510
Less penny stocks (1)
Less unit issues, right issues, spin-offs, ADRs, reverse LBOs,
closed-end funds, unit investment trusts and REITs (1,962)
Less financial and utility firms (486)
Less type of security not classified as common/ordinary
shares (257)
Less firms without CUSIP identifier (9)
Sub-Total 3,795
Less firms without conservatism scores (1,439)
Final IPO Sample 2,356

96
Table 3-4: Descriptive Statistics
Panel A. Full IPO Sample
Variables
N
Mean
Std. Dev.
Median
5th Percentile
95th Percentile
pre post
pre post post-pre
pre post
pre post post-pre
pre post
pre post
CSCORE
849 2339
0.935 0.680 -0.255***
0.539 0.405
0.811 0.565 -0.246***
0.287 0.306
1.842 1.336
Size
849 2339
17.637 18.049 0.412***
1.708 1.268
17.334 17.973 0.640***
15.291 15.912
20.731 20.413
Lev
849 2339
0.653 0.309 -0.344***
0.423 0.228
0.620 0.244 -0.376***
0.098 0.047
1.361 0.771
RD
566 1560
0.282 0.100 -0.183***
0.360 0.110
0.182 0.074 -0.108***
0.000 0.000
0.902 0.315
ROA
849 2339
-0.240 -0.050 0.191***
0.538 0.223
-0.014 0.026 0.040***
-1.179 -0.486
0.241 0.164
Cash
848 2338
0.269 0.402 0.134***
0.284 0.313
0.138 0.374 0.236***
0.002 0.007
0.844 0.908
ΔAssets
849 2339
1.420 3.376 1.956***
3.340 6.090
0.380 1.360 0.980***
-0.220 0.020
6.010 13.000
RE
849 2339
-0.861 -0.252 0.609***
1.563 0.552
-0.251 -0.060 0.191***
-3.605 -1.418
0.391 0.272
Inv_Cycle
849 2339
0.095 0.099 0.004
0.097 0.117
0.063 0.065 0.002
0.015 0.015
0.264 0.270
Panel B. IPO Sample with CSCOREs available both in the pre- and post-IPO year
Variables
N
Mean
Std. Dev.
Median
5th Percentile
95th Percentile
pre post
pre post post-pre
pre post
pre post post-pre
pre post
pre post
CSCORE
841 841
0.939 0.798 -0.142***
0.541 0.522
0.814 0.693 -0.121***
0.292 0.288
1.851 1.489
Size
841 841
17.657 18.622 0.965***
1.693 1.277
17.333 18.413 1.080***
15.463 16.904
20.729 21.074
Lev
841 841
0.605 0.351 -0.254***
0.762 0.677
0.386 0.106 -0.280***
0.000 0.000
2.144 1.350
RD
565 565
0.283 0.110 -0.173***
0.362 0.114
0.184 0.087 -0.096***
0.000 0.000
0.910 0.327
ROA
841 841
-0.244 -0.085 0.159***
0.541 0.244
-0.016 0.007 0.022***
-1.186 -0.619
0.241 0.155
Cash
841 841
0.270 0.410 0.140***
0.285 0.325
0.138 0.399 0.260***
0.002 0.006
0.853 0.909
ΔAssets
841 841
1.440 2.954 1.514***
3.370 5.110
0.380 1.230 0.850***
-0.220 -0.020
6.150 10.770
RE
841 841
-0.870 -0.381 0.488***
1.568 0.636
-0.259 -0.168 0.090***
-3.603 -1.838
0.389 0.215
Inv_Cycle
841 841
0.096 0.094 -0.001
0.098 0.106
0.064 0.064 0.000
0.015 0.016
0.266 0.257
Panel C. IPO year variables
N
Mean
Std. Dev.
Median
5th Percentile
95th Percentile
Age
2315
0.976
0.402
0.954
0.301
1.748
VC_Rep
2339
0.006
0.040
0.000
0.000
0.022
Underpricing
2324
0.234
0.393
0.111
-0.063
0.990

97
Table 3-4
(continued)
Panel C. IPO year variables N Mean Std. Dev. Median 5th Percentile 95th Percentile
MTB
2356
5.149
6.157
3.419
1.020
14.833
Offersize
2356
17.393
0.958
17.399
15.648
18.990
Underwriter
2339
7.296
2.118
8.000
2.000
9.000
Volatility
2320
0.047
0.022
0.042
0.021
0.093
Integer
2356
0.180
0.384
0.000
0.000
1.000
Auditor
2356
0.923
0.266
1.000
0.000
1.000
Nasdaq
2356
0.781
0.414
1.000
0.000
1.000
*** indicates significance at 1%. ** indicates significance at 5%. * indicates significance at 10%. All continuous variables are winsorized at the 1st and 99
th percentiles. A
description of each variable is provided in Table 3-2. Panel A presents descriptive statistics for the full IPO sample. Panel B reports descriptive statistics for the sample firms
that have CSCOREs available both in the pre-IPO and IPO fiscal years. Panel C reports descriptive statistics of the variables measured only in the IPO year. Difference in mean
between the pre-IPO and IPO year is tested by the t-test and the median difference by the Mann-Whitney test.

98
Table 3-5: Comparison of IPO Issuers' CSCOREs from the Pre-IPO Year until
Five Years after the IPO
Panel A. IPO firm Conservatism Scores (CSCORE)
year -1 year 0 year 1 year 2 year 3 year 4 year 5
Sample Mean 0.935 0.681 0.655 0.682 0.755 0.783 0.776
Δ Mean Each Year
-0.255*** -0.026** 0.027** 0.073*** 0.028 -0.008
t-stats (-12.606) (-2.272) (2.255) (4.904) (1.510) (-0.388)
Δ Mean relative to
year -1 -0.255*** -0.280** -0.253** -0.180*** -0.152*** -0.160***
t-stats (-12.606) (-14.092) (-12.267) (-8.284) (-6.480) (-6.918)
Sample Median 0.811 0.566 0.546 0.575 0.640 0.639 0.671
Δ in Median Each
Year -0.245*** -0.020*** 0.029 0.066*** -0.001 0.032
z-stats
(-15.7954) (-2.709) (1.395) (5.176) (-0.593) (0.952)
Δ in Median relative
to year -1 -0.245*** -0.265*** -0.236* -0.171*** -0.172*** -0.140***
z-stats (-15.795) (-17.027) (-14.541) (-10.058) (-8.987) (-8.058)
Panel B. Comparison of CSCORE between IPO firms and Non-IPO Performance Matched Firms
year -1 year 0 year 1 year 2 year 3 year 4 year 5
Mean of Sample
Firms 0.935 0.681 0.655 0.682 0.755 0.783 0.776
Mean of Performance
Matched Firms 0.830 0.678 0.674 0.689 0.789 0.832 0.846
Difference 0.105*** 0.002 -0.019 -0.007 -0.034* -0.049** -0.071***
t-stats (3.470) (0.158) (-1.454) (-0.439) (-1.828) (-2.065) (-2.820)
Median of Sample
Firms 0.811 0.566 0.546 0.575 0.640 0.639 0.671
Median of
Performance
Matched Firms
0.697 0.529 0.534 0.554 0.663 0.679 0.715
Difference 0.114*** 0.037*** 0.012* 0.021 -0.023 -0.040 -0.044
z-stats (5.704) (5.045) (1.883) (0.991) (-0.606) (-1.112) (-0.975)
Panel C. Comparison of CSCORE between IPO firms and Non-IPO 90-110% ROA Matched Firms
Mean of
90-110% ROA
Matched Firms
0.837 0.669 0.673 0.692 0.790 0.835 0.847
Difference 0.099*** 0.012 -0.018 -0.010 -0.035* -0.051** -0.072***
t-stats (3.172) (0.842) (-1.330) (-0.634) (-1.831) (-2.091) (-2.626)
Median of
90-110% ROA
Matched Firms
0.699 0.526 0.534 0.560 0.658 0.673 0.710
Difference 0.112*** 0.039*** 0.012** 0.015 -0.017 -0.033 -0.039
z-stats (5.809) (5.562) (2.389) (0.906) (-0.185) (-0.696) (-0.456)
Table 3-5 reports the issuers’ CSCOREs from the pre-IPO year to five years after the IPO. Panel A reports
changes in the mean and median CSCORE each year and also compares the mean and median CSCOREs

99
measured in the post-IPO periods (year zero to year five) to the pre-IPO CSCORE. In Panel B, the mean and
median CSCOREs of the IPO sample are compared to that of performance matched firms. Following Kothari et
al. (2005), performance matched firms are identified by finding non-issuers with the same three-digit SIC code
and the closest return on assets (ROA) in the same year. In Panel C, the performance matched non-issue firms
are identified on the basis of the non-issuer’s ROA that falls within 90 percent to 110 percent of the sample
firm without matching the non-issuer’s SIC code. For example, if the non-issuer with the same three-digit SIC
code has ROA less than 90% or greater than 110% of the issuer’s ROA, then the SIC code is disregarded and
the non-issuer with the closest ROA is identified as a matched firm. Difference in mean is tested by the t-test
and the median difference by the Mann-Whitney test. *** indicates significance at 1%. ** indicates
significance at 5%. * indicates significance at 10%.
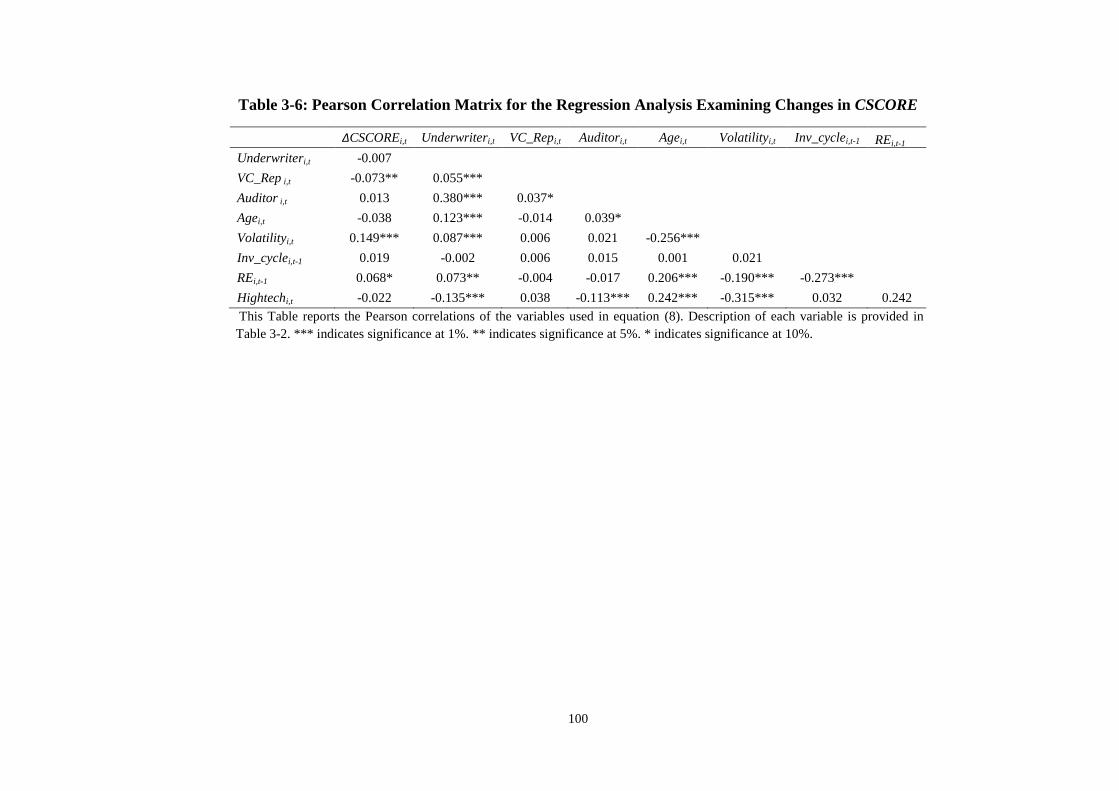
100
Table 3-6: Pearson Correlation Matrix for the Regression Analysis Examining Changes in CSCORE
ΔCSCOREi,t Underwriteri,t VC_Repi,t Auditori,t Agei,t Volatilityi,t Inv_cyclei,t-1 REi,t-1
Underwriteri,t -0.007
VC_Rep i,t -0.073** 0.055***
Auditor i,t 0.013 0.380*** 0.037*
Agei,t -0.038 0.123*** -0.014 0.039*
Volatilityi,t 0.149*** 0.087*** 0.006 0.021 -0.256***
Inv_cyclei,t-1 0.019 -0.002 0.006 0.015 0.001 0.021
REi,t-1 0.068* 0.073** -0.004 -0.017 0.206*** -0.190*** -0.273***
Hightechi,t -0.022 -0.135*** 0.038 -0.113*** 0.242*** -0.315*** 0.032 0.242
This Table reports the Pearson correlations of the variables used in equation (8). Description of each variable is provided in
Table 3-2. *** indicates significance at 1%. ** indicates significance at 5%. * indicates significance at 10%.

101
Table 3-7: The Regression Analysis for Changes in CSCORE
Dependent variable
Independent
Variable ΔCSCORE %ΔCSCORE
Underwriteri,t 0.008 0.022
(0.729) (1.182)
VC_Repi,t -0.389* -0.557**
(-1.680) (-2.127)
Auditori,t 0.026 -0.035
(0.421) (-0.332)
Agei,t 0.008 0.017
(0.175) (0.195)
Volatilityi,t 1.572*** 1.591*
(2.755) (1.712)
Inv_cyclei,t-1 -0.089 -0.321
(-0.193) (-0.579)
REi,t-1 -0.010 -0.093**
(-0.309) (-2.431)
Hightechi,t -0.007 0.035
(-0.169) (0.457)
Constant -0.277*** -0.284*
(-2.867) (-1.746)
Year Dummies Yes Yes
Industry Fixed Effects Yes Yes
F-Stats 32.044*** 18.080***
Adj. R2 18.1% 9.6%
Obs 809 809
The dependent variable ΔCSCORE is measured as IPO year
CSCORE minus pre-IPO year CSCORE. %ΔCSCORE is
percentage changes in CSCORE computed as IPO year
CSCORE divided by pre-IPO year CSCORE, minus 1. A
description of independent variables is provided in Table 3-2.
*** indicates significance at 1%. ** indicates significance at
5%. * indicates significance at 10%.

102
Table 3-8: Pearson Correlation Matrix for the Regression Analysis Examining the Effect of Conservatism on IPO Underpricing
Underpricingi,t Pre_
CSCOREi Integeri,t Underwriteri,t Offersizei,t VC_Repi,t Auditori,t Agei,t Levi,t-1 ROAi,t-1 Nasdaqi,t
Pre_
CSCOREi 0.048
Integeri,t -0.136*** -0.094***
Underwriteri,t 0.127*** -0.011 -0.168***
Offersizei,t 0.163*** 0.058* -0.174*** 0.662***
VC_Repi,t 0.005 0.033 -0.030 0.055*** 0.054**
Auditori,t 0.049** -0.062* -0.067*** 0.380*** 0.299*** 0.037*
Agei,t -0.165*** -0.124*** 0.006 0.123*** 0.151*** -0.014 0.039*
Levi,t-1 -0.123*** 0.074** -0.011 -0.115*** 0.077** -0.060* -0.041 0.173***
ROAi,t-1 -0.101*** -0.175*** 0.084** 0.051 0.102*** -0.030 -0.028 0.320*** -0.082**
Nasdaqi,t 0.120*** 0.171*** -0.041** 0.123*** -0.060*** 0.019 0.163*** -0.120*** -0.163*** -0.156***
Volatilityi,t 0.439*** 0.211*** -0.153*** 0.087*** 0.060*** 0.006 0.021 -0.256*** -0.122*** -0.313*** 0.195***
This table reports the Pearson correlations of the variables used in equation (4). A description of each variable is provided in Table 3-2. *** indicates significance at 1%. **
indicates significance at 5%. * indicates significance at 10%.

103
Table 3-9: Regression Analysis Testing the Effect of Conservatism on IPO Underpricing
Panel A. All Sample Firms Panel B. Firms with High Information Asymmetry Panel C. Firms with Low Information Asymmetry
Volatility Bid-Ask Volatility Bid-Ask
Independent
Variable Model 1 Model 2 Model 3 Model 4 Model 5 Model 6 Model 7 Model 8 Model 9 Model 10
Pre_CSCOREi -0.061** -0.062** -0.139** -0.139** -0.186*** -0.186*** -0.002 -0.005 0.015 0.014
(-2.005) (-2.037) (-2.174) (-2.176) (-2.994) (-2.998) (-0.128) (-0.303) (0.867) (0.818)
Integeri,t -0.054** -0.056** -0.145*** -0.147*** -0.110** -0.115** 0.003 0.001 -0.007 -0.008
(-2.506) (-2.566) (-3.290) (-3.261) (-2.355) (-2.435) (0.189) (0.057) (-0.501) (-0.520)
Offersizei,t 0.090*** 0.098*** 0.184*** 0.187*** 0.200*** 0.206*** 0.017 0.031*** 0.027** 0.033***
(3.470) (4.874) (3.403) (3.978) (3.633) (4.220) (1.176) (3.084) (2.149) (3.310)
Agei,t -0.116*** -0.116*** -0.277*** -0.277*** -0.243** -0.245** -0.028* -0.028* -0.038** -0.037**
(-3.323) (-3.317) (-2.868) (-2.875) (-2.534) (-2.569) (-1.727) (-1.743) (-2.391) (-2.360)
Levi,t-1 -0.100** -0.104** -0.116 -0.117 -0.126* -0.129* 0.006 0.001 0.009 0.007
(-2.337) (-2.441) (-1.566) (-1.583) (-1.716) (-1.764) (0.196) (0.034) (0.386) (0.290)
ROAi,t-1 -0.002 -0.002 -0.001 -0.001 -0.005 -0.004 0.013 0.012 0.054** 0.053**
(-0.045) (-0.059) (-0.029) (-0.024) (-0.116) (-0.092) (0.463) (0.423) (2.124) (2.133)
Nasdaqi,t 0.065* 0.067** 0.041 0.042 -0.034 -0.029 0.035** 0.039** 0.042*** 0.043***
(1.938) (2.029) (0.509) (0.526) (-0.307) (-0.269) (2.093) (2.355) (2.764) (2.861)
Volatilityi,t 6.996*** 7.011*** 6.986*** 6.983*** 6.337*** 6.331*** 6.607*** 6.608*** 2.579*** 2.589***
(6.790) (6.813) (3.975) (3.977) (4.056) (4.051) (7.262) (7.210) (3.435) (3.445)
Underwriteri,t 0.008 0.003 0.007 0.013* 0.005
(0.735) (0.157) (0.397) (1.922) (1.074)
VC_Repi,t 0.012 0.011 -0.320 -0.322 -0.399 -0.403 0.132 0.137 0.172** 0.174**
(0.094) (0.087) (-1.024) (-1.042) (-1.309) (-1.342) (1.293) (1.452) (2.099) (2.200)
Auditori,t 0.024 0.037 0.075 0.080 0.133 0.144 -0.027 -0.006 -0.007 0.002
(0.483) (0.776) (0.825) (0.905) (1.375) (1.531) (-0.865) (-0.190) (-0.236) (0.058)
Constant -1.539*** -1.640*** -2.958*** -2.988*** -3.166*** -3.236*** -0.422* -0.597*** -0.478** -0.549***
(-3.822) (-4.877) (-3.519) (-3.929) (-3.703) (-4.094) (-1.936) (-3.438) (-2.326) (-3.091)
Year Dummies Yes Yes Yes Yes Yes Yes Yes Yes Yes Yes
Industry Fixed Effects Yes Yes Yes Yes Yes Yes Yes Yes Yes Yes
F-Stats 8.770*** 9.379*** 7.097*** 7.623*** 7.161*** 7.731*** 6.246*** 6.779*** 3.059*** 3.257***
Adj. R2 26.3% 26.2% 23.3% 23.3% 23.3% 23.3% 16.7% 15.8% 11.7% 11.5%
Obs 807 807 423 423 432 432 386 386 378 378
The dependent variable Underpricing is measured as the first-day closing price divided by the final offer price, minus 1. A description of independent variables is provided in Table 3-2.
*** indicates significance at 1%. ** indicates significance at 5%. * indicates significance at 10%.

104
Table 3-10: Quartile Portfolio Returns Based on Pre_CSCORE
1 Year
Return
2 Year
Return
3 Year
Return
4 Year
Return
5 Year
Return Obs
Q1 -19.31% -16.69% -20.23% -22.70% -21.28% 215
Q2 -11.35% -14.41% -13.70% -18.65% -13.30% 215
Q3 -0.98% -4.56% -12.71% -17.53% -17.55% 214
Q4 0.24% 13.84% -1.93% -3.72% -6.64% 214
Mean -7.88% -5.48% -12.16% -15.66% -14.70% 858
Median -25.35% -42.26% -47.18% -48.34% -52.32%
Portfolio returns are calculated based on the average monthly buy and hold returns for a holding period of
one, two, three, four and five years from the IPO month excluding the returns on the first trading day and
are adjusted for the monthly CRSP value weighted index returns. All return variables are winsorized at 1st
and 99th
percentile.
Table 3-11: Quartile Portfolio Returns Based on Post_CSCORE
1 Year
Return
2 Year
Return
3 Year
Return
4 Year
Return
5 Year
Return Obs
Q1 -15.07% -17.97% -9.62% -13.44% -10.93% 585
Q2 -0.76% -21.86% -2.82% -10.35% -8.78% 585
Q3 -10.12% -8.84% -11.52% -24.75% -32.27% 585
Q4 -8.41% -15.61% -20.83% -18.17% -24.11% 584
Mean -8.58% -16.05% -11.22% -16.69% -19.06% 2339
Median -22.28% -40.31% -47.51% -52.02% -55.78%
Portfolio returns are calculated based on the average monthly buy and hold returns for a holding period of
one, two, three, four and five years, adjusted for the CRSP value-weighted index returns starting three
months after the IPO fiscal-year ends to allow for a reporting lag. All return variables are winsorized at
1st and 99
th percentile.

105
Table 3-12: Pearson Correlation Matrix for the Return Regressions with
Pre_CSCORE
Pre_CSCOREi Agei,t Cashi, t-1 ΔAssetsi, t-1 RDi, t-1 Underwriteri,t
Pre_CSCOREi
Agei, t -0.106***
Cashi, t-1 0.199*** -0.364***
ΔAssetsi, t-1 0.130*** -0.211*** 0.277***
RDi, t-1 0.156*** -0.241*** 0.433*** -0.051
Underwriteri,t 0.083** -0.195*** 0.282*** 0.188*** 0.082**
Underpricingi,t -0.005 0.072** 0.148*** 0.029 -0.012 0.135***
The accounting variables used for the Pre_CSCORE regressions analysis are obtained from the pre-IPO
fiscal year as only the pre-IPO fiscal year variables are available when the return window starts. ***
indicates significance at 1%. ** indicates significance at 5%. * indicates significance at 10%. All
continuous variables are winsorized at the 1st and 99
th percentiles. A description of variables is provided
in Table 3-2.
Table 3-13: Pearson Correlation Matrix for the Return Regressions with
Post_CSCORE
Post_CSCOREi Agei,t Cashi,t ΔAssetsi,t RDi, t Underwriteri,t
Agei,t -0.170***
Cashi t 0.230*** -0.346***
ΔAssetsi t 0.301*** -0.275*** 0.383***
RDi t 0.078*** -0.162*** 0.500*** 0.044**
Underwriteri,t 0.270*** -0.174*** 0.274*** 0.273*** 0.023
Underpricingi,t 0.024 0.123*** 0.019 -0.017 0.048** 0.135***
For the Post_CSCORE analysis, the return window starts three months after the IPO fiscal-year ends,
thus the regressions use the accounting variables of the IPO fiscal year. *** indicates significance at 1%.
** indicates significance at 5%. * indicates significance at 10%. All continuous variables are winsorized
at the 1st and 99
th percentiles. A description of variables is provided in Table 3-2.

106
Table 3-14: Regression Analysis Testing the Predictive Power of Pre_CSCORE for
Post-Issue Stock Returns (One to Five Years of BHARs)
Independent
Variable 1 year 2 years 3 years 4 years 5 years
Pre_CSCOREi -0.162*** -0.151* -0.160** -0.136 -0.059
(-3.309) (-1.876) (-2.052) (-1.565) (-0.631)
Agei,t 0.062 0.059 0.075 0.075 0.148
(1.068) (0.687) (0.840) (0.717) (1.337)
Cashi,t-1 0.002 0.096 0.217 0.167 0.191
(0.015) (0.563) (1.331) (0.996) (1.070)
ΔAssetsi,t-1 -0.014 -0.011 -0.013 -0.013 -0.020*
(-1.541) (-0.981) (-1.095) (-1.139) (-1.870)
RDi t-1 0.160 0.037 -0.205* -0.278** -0.168
(1.392) (0.227) (-1.877) (-2.142) (-1.014)
Underpricingi, t -0.232*** -0.210** -0.108 -0.141 -0.152
(-4.363) (-2.019) (-1.003) (-1.369) (-1.407)
Underwriteri,t 0.046*** 0.064*** 0.099*** 0.090*** 0.094***
(3.457) (3.180) (5.700) (5.158) (4.823)
Constant -0.270* -0.430** -0.793*** -0.746*** -0.965***
(-1.841) (-2.132) (-4.452) (-3.750) (-4.600)
Year Dummies Yes Yes Yes Yes Yes
Industry Fixed
Effects Yes Yes Yes Yes Yes
F-Stats 7.078*** 4.820*** 6.974*** 5.845*** 4.588***
Adj. R2 7.0% 4.9% 5.9% 5.7% 4.2%
Obs 808 808 808 808 808
This table reports the results of regression analysis testing the association between Pre_CSCORE and
post-issue stock returns. The dependent variable is the average monthly buy and hold abnormal returns
(BHARs) for the holding period of one, two, three, four and five years from the IPO month, excluding the
returns on the first trading day, adjusted for the monthly CRSP value weighted index returns. ***
indicates significance at 1%. ** indicates significance at 5%. * indicates significance at 10%. All
continuous variables are winsorized at the 1st and 99
th percentiles. A description of each variable is
provided in Table 3-2.

107
Table 3-15: Regression Analysis Testing the Predictive Power of Pre_CSCORE for
Post-Issue Stock Returns (One to Five Years of CARs)
Independent
Variable 1 year 2 years 3 years 4 years 5 years
Pre_CSCOREi -0.111** -0.140* -0.127 -0.197** -0.152
(-2.360) (-1.861) (-1.433) (-2.066) (-1.538)
Agei,t 0.093 0.064 0.083 0.121 0.149
(1.587) (0.766) (0.868) (1.185) (1.351)
Cashi,t-1 0.173 0.298* 0.366* 0.599*** 0.488**
(1.612) (1.788) (1.853) (2.874) (2.328)
ΔAssetsi,t-1 -0.025*** -0.025** -0.024* -0.025 -0.028*
(-2.925) (-2.037) (-1.702) (-1.624) (-1.715)
RDi t-1 0.168 0.160 0.338* 0.238 0.237
(1.423) (1.036) (1.748) (1.125) (1.115)
Underpricingi, t -0.213*** -0.344*** -0.130 -0.078 -0.058
(-2.708) (-3.168) (-1.087) (-0.620) (-0.435)
Underwriteri,t 0.042*** 0.024 0.039 0.054** 0.064**
(2.670) (1.095) (1.576) (2.014) (2.171)
Constant -0.319** -0.073 -0.206 -0.332 -0.422
(-2.027) (-0.320) (-0.819) (-1.220) (-1.452)
Year Dummies Yes Yes Yes Yes Yes
Industry Fixed
Effects Yes Yes Yes Yes Yes
F-Stats 4.689*** 3.054*** 2.636*** 2.404*** 2.125**
Adj. R2 6.8% 5.0% 4.3% 4.1% 4.2%
Obs 808 808 808 808 808
This table reports the results of regression analysis testing the association between Pre_CSCORE and
post-issue stock returns. The dependent variable is the average monthly cumulative abnormal returns
(CARs) for the holding period of one, two, three, four and five years from the IPO month, excluding the
returns on the first trading day, adjusted for the monthly CRSP value weighted index returns. ***
indicates significance at 1%. ** indicates significance at 5%. * indicates significance at 10%. All
continuous variables are winsorized at the 1st and 99
th percentiles. A description of each variable is
provided in Table 3-2.
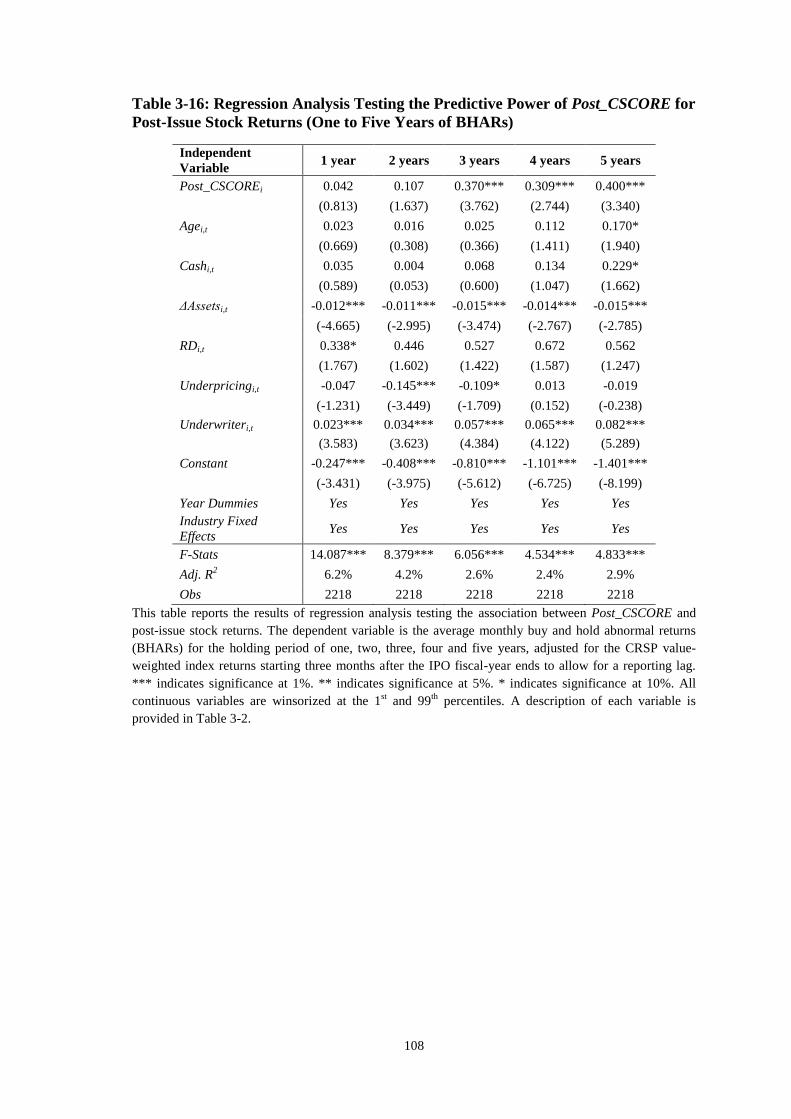
108
Table 3-16: Regression Analysis Testing the Predictive Power of Post_CSCORE for
Post-Issue Stock Returns (One to Five Years of BHARs)
Independent
Variable 1 year 2 years 3 years 4 years 5 years
Post_CSCOREi 0.042 0.107 0.370*** 0.309*** 0.400***
(0.813) (1.637) (3.762) (2.744) (3.340)
Agei,t 0.023 0.016 0.025 0.112 0.170*
(0.669) (0.308) (0.366) (1.411) (1.940)
Cashi,t 0.035 0.004 0.068 0.134 0.229*
(0.589) (0.053) (0.600) (1.047) (1.662)
ΔAssetsi,t -0.012*** -0.011*** -0.015*** -0.014*** -0.015***
(-4.665) (-2.995) (-3.474) (-2.767) (-2.785)
RDi,t 0.338* 0.446 0.527 0.672 0.562
(1.767) (1.602) (1.422) (1.587) (1.247)
Underpricingi,t -0.047 -0.145*** -0.109* 0.013 -0.019
(-1.231) (-3.449) (-1.709) (0.152) (-0.238)
Underwriteri,t 0.023*** 0.034*** 0.057*** 0.065*** 0.082***
(3.583) (3.623) (4.384) (4.122) (5.289)
Constant -0.247*** -0.408*** -0.810*** -1.101*** -1.401***
(-3.431) (-3.975) (-5.612) (-6.725) (-8.199)
Year Dummies Yes Yes Yes Yes Yes
Industry Fixed
Effects Yes Yes Yes Yes Yes
F-Stats 14.087*** 8.379*** 6.056*** 4.534*** 4.833***
Adj. R2 6.2% 4.2% 2.6% 2.4% 2.9%
Obs 2218 2218 2218 2218 2218
This table reports the results of regression analysis testing the association between Post_CSCORE and
post-issue stock returns. The dependent variable is the average monthly buy and hold abnormal returns
(BHARs) for the holding period of one, two, three, four and five years, adjusted for the CRSP value-
weighted index returns starting three months after the IPO fiscal-year ends to allow for a reporting lag.
*** indicates significance at 1%. ** indicates significance at 5%. * indicates significance at 10%. All
continuous variables are winsorized at the 1st and 99
th percentiles. A description of each variable is
provided in Table 3-2.

109
Table 3-17: Regression Analysis Testing the Predictive Power of Post_CSCORE for
Post-Issue Stock Returns (One to Five Years of CARs)
Independent
Variable 1 year 2 years 3 years 4 years 5 years
Post_CSCOREi 0.121** 0.101 0.287*** 0.161* 0.202**
(2.178) (1.414) (3.467) (1.803) (2.232)
Agei,t 0.021 0.039 0.077 0.145** 0.142**
(0.620) (0.855) (1.410) (2.379) (2.172)
Cashi,t 0.085 0.219*** 0.348*** 0.581*** 0.629***
(1.427) (2.699) (3.646) (5.408) (5.644)
ΔAssetsi,t -0.010*** -0.016*** -0.018*** -0.018*** -0.019***
(-3.379) (-3.633) (-3.519) (-3.228) (-3.180)
RDi,t 0.452** 0.494** 0.746** 0.816** 0.756**
(2.484) (1.983) (2.393) (2.306) (2.054)
Underpricingi,t -0.022 -0.016 0.045 0.049 0.072
(-0.444) (-0.274) (0.603) (0.568) (0.836)
Underwriteri,t 0.028*** 0.037*** 0.063*** 0.068*** 0.073***
(4.220) (3.975) (5.668) (5.561) (5.528)
Constant -0.328*** -0.436*** -0.843*** -0.933*** -0.953***
(-4.668) (-4.495) (-7.257) (-7.314) (-7.177)
Year Dummies Yes Yes Yes Yes Yes
Industry Fixed
Effects Yes Yes Yes Yes Yes
F-Stats 9.347*** 6.997*** 9.162*** 10.095*** 11.557***
Adj. R2 5.9% 4.5% 6.0% 6.4% 7.1%
Obs 2218 2218 2218 2218 2218
This Table reports the results of regression analysis testing the association between Post_CSCORE and
post-issue stock returns. The dependent variable is the average monthly cumulative abnormal returns
(CARs), adjusted for the CRSP value-weighted index returns starting three months after the IPO fiscal-
year ends to allow for a reporting lag. *** indicates significance at 1%. ** indicates significance at 5%. *
indicates significance at 10%. All continuous variables are winsorized at the 1st and 99
th percentiles. A
description of each variable is provided in Table 3-2.

110
Table 3-18: Market-Adjusted Returns of Portfolios Sorted Based on the Level of
Pre-to-Post IPO Year CSCORE
1 Year
Return
2 Years
Return
3 Years
Return
4 Years
Return
5 Years
Return Obs
CtoC -0.90% -3.85% 9.05% 4.74% 10.98% 275
CtoA 0.64% -4.09% 0.73% -1.20% 3.60% 145
AtoC 6.11% 0.52% 14.13% 7.87% 13.00% 145
AtoA -12.86% -14.61% -9.30% -14.87% -15.63% 276
Sample IPO firms are sorted into four portfolios based on the level of their CSCOREs in the pre-IPO and
IPO year. Sample firms whose CSCOREs are above the median CSCORE in the both pre-IPO and IPO
year are placed into the ‘CtoC’ portfolio. Sample firms whose CSCOREs are above the median CSCORE
in the pre-IPO year and below the median CSCORE in the IPO year are placed into the ‘CtoA’ portfolio.
Sample firms whose CSCOREs are below the median CSCORE in the pre-IPO year and above the median
CSCORE in the IPO year are placed into the ‘AtoC' portfolio. Sample firms whose CSCOREs are below
the median CSCORE both in the pre-IPO and IPO year are placed into the ‘AtoA’ portfolio. Portfolios
returns are calculated based on the average monthly BHARs for a holding period of one, two, three, four
and five years from the IPO month, excluding the returns on the first trading day and are adjusted for the
monthly CRSP value weighted index returns. All return variables are winsorized at 1st and 99
th percentile.

111
Table 3-19: Regression Analysis for Portfolio BHARs Sorted Based on the Level of
Pre-to-Post IPO Year CSCORE
Independent
Variable 1 year 2 years 3 years 4 years 5 years
C_Ci -0.198** -0.178 -0.111 0.007 0.126
(-2.531) (-1.212) (-0.868) (0.053) (0.864)
C_Ai -0.004 -0.123 0.033 -0.008 0.094
(-0.060) (-1.095) (0.259) (-0.071) (0.724)
A_Ci 0.192* 0.447** 0.350* 0.353** 0.479**
(1.681) (2.063) (1.863) (1.988) (2.346)
Agei,t 0.114 -0.011 0.058 0.050 0.138
(1.633) (-0.092) (0.514) (0.390) (0.927)
Cashi,t 0.208* 0.301 -0.054 -0.074 -0.028
(1.829) (1.572) (-0.285) (-0.425) (-0.148)
ΔAssetsi,t 0.015 0.000 0.010 0.005 0.010
(1.541) (0.016) (0.654) (0.345) (0.620)
RDi,t 0.079 0.766 0.607 0.055 0.200
(0.201) (1.126) (0.871) (0.093) (0.274)
Underpricingi,t -0.162* -0.157 -0.074 -0.150 -0.180
(-1.823) (-1.225) (-0.560) (-1.273) (-1.360)
Underwriteri,t 0.061*** 0.099*** 0.125*** 0.120*** 0.142***
(4.369) (4.218) (5.707) (5.652) (6.272)
Constant -0.657*** -0.807*** -1.167*** -1.133*** -1.488***
(-4.148) (-3.196) (-4.936) (-4.465) (-5.211)
Year Dummies Yes Yes Yes Yes Yes
Industry Fixed
Effects Yes Yes Yes Yes Yes
F-Stats 4.552*** 4.619*** 5.377*** 4.658*** 4.270***
Adj. R2 6.6% 7.2% 6.1% 4.8% 5.0%
Obs 834 834 834 834 834
This table reports the results of regression analysis testing whether there is a significant difference
in stock returns across the portfolios sorted, based on the level of pre-to-post IPO year CSCOREs.
CtoC is a dichotomous variable that takes one if a sample firm belongs to the portfolio ‘CtoC' and
zero otherwise, CtoA is a dichotomous variable that takes one if a sample firm belongs to the
portfolio ‘CtoA’ and zero otherwise and AtoC is a dichotomous variable that takes one if a sample
firm belongs to the portfolio ‘AtoC' and zero otherwise. Portfolio returns are calculated based on
the average monthly BHARs for the holding period of one, two, three, four and five years from the
IPO month, excluding the returns on the first trading day, and are adjusted for the CRSP value-
weighted index returns. A description of other variables is provided in Table 3-2. *** indicates
significance at 1%. ** indicates significance at 5%. * indicates significance at 10%. All
continuous variables are winsorized at the 1st and 99
th percentiles.

112
Table 3-20: Regression Analysis for Portfolio CARs Sorted Based on the Level of
Pre-to-Post IPO Year CSCORE
Independent
Variable 1 year 2 years 3 years 4 years 5 years
C_Ci -0.185** -0.172 -0.013 -0.001 0.008
(-2.520) (-1.552) (-0.103) (-0.007) (0.055)
C_Ai 0.044 -0.004 0.082 -0.077 -0.067
(0.698) (-0.042) (0.749) (-0.638) (-0.519)
A_Ci 0.153 0.251* 0.332** 0.397** 0.373**
(1.542) (1.799) (2.157) (2.449) (2.206)
Agei,t 0.137* 0.126 0.157 0.175 0.214*
(1.937) (1.291) (1.458) (1.501) (1.742)
Cashi,t 0.274** 0.446*** 0.453** 0.573*** 0.653***
(2.235) (2.695) (2.463) (2.909) (3.122)
ΔAssetsi,t 0.012 0.005 0.014 0.010 0.006
(1.402) (0.580) (1.305) (0.878) (0.479)
RDi,t -0.028 0.692 0.607 0.553 0.756
(-0.075) (1.234) (0.949) (0.807) (1.031)
Underpricingi,t -0.246*** -0.420*** -0.282** -0.231 -0.230
(-2.837) (-3.512) (-2.106) (-1.588) (-1.519)
Underwriteri,t 0.050*** 0.046** 0.060** 0.072** 0.079***
(3.023) (2.013) (2.285) (2.577) (2.583)
Constant -0.598*** -0.537** -0.741*** -0.866*** -0.924***
(-3.558) (-2.226) (-2.698) (-2.951) (-2.890)
Year Dummies Yes Yes Yes Yes Yes
Industry Fixed
Effects Yes Yes Yes Yes Yes
F-Stats 3.995*** 3.216*** 2.810*** 2.605*** 2.627***
Adj. R2 6.5% 6.7% 5.3% 5.0% 5.4%
Obs 834 834 834 834 834
This table reports the results of regression analysis testing whether there is a significant difference in
stock returns across the portfolios sorted based on the level of pre-to-post IPO year CSCOREs. CtoC is a
dichotomous variable that takes one if a sample firm belongs to the portfolio ‘CtoC' and zero otherwise,
CtoA is a dichotomous variable that takes one if a sample firm belongs to the portfolio ‘CtoA’ and zero
otherwise and AtoC is a dichotomous variable that takes one if a sample firm belongs to the portfolio
‘AtoC' and zero otherwise. Portfolio returns are calculated based on the average monthly CARs for the
holding period of one, two, three, four and five years from the IPO month, excluding the returns on the
first trading day and are adjusted for the CRSP value-weighted index returns. A description of other
variables is provided in Table 3-2 *** indicates significance at 1%. ** indicates significance at 5%. *
indicates significance at 10%. All continuous variables are winsorized at the 1st and 99
th percentiles.

113
Table 3-21: Regression Analysis for the Association between the Pre_CSCORE and
Post-Issue Stock Returns Adjusted for Fama-French Size and Market-to-Book 5x5
Portfolio Returns
Independent
Variable 1 year 2 years 3 years 4 years 5 years
Pre_CSCOREi -0.190*** -0.156* -0.117 -0.096 -0.004
(-3.998) (-1.942) (-1.533) (-1.144) (-0.048)
Agei,t 0.051 0.054 0.048 0.049 0.137
(0.903) (0.641) (0.539) (0.482) (1.247)
Cashi,t-1 0.089 0.333** 0.312* 0.318* 0.392**
(0.806) (1.980) (1.939) (1.922) (2.201)
ΔAssetsi,t-1 -0.015* -0.015 -0.016 -0.016 -0.026**
(-1.651) (-1.368) (-1.492) (-1.480) (-2.495)
RDi t-1 0.138 0.060 -0.166 -0.237* -0.120
(1.246) (0.382) (-1.554) (-1.934) (-0.754)
Underpricingi, t -0.200*** -0.197* -0.059 -0.090 -0.079
(-3.596) (-1.939) (-0.564) (-0.903) (-0.750)
Underwriteri,t 0.043*** 0.063*** 0.099*** 0.093*** 0.102***
(3.269) (3.133) (5.537) (5.149) (4.930)
Constant -0.203 -0.436** -0.854*** -0.850*** -1.178***
(-1.410) (-2.193) (-4.689) (-4.185) (-5.327)
Year Dummies Yes Yes Yes Yes Yes
Industry Fixed
Effects Yes Yes Yes Yes Yes
F-Stats 7.440*** 4.633*** 6.331*** 6.132*** 5.597***
Adj. R2 8.2% 5.3% 5.8% 6.3% 5.8%
Obs 809 809 809 809 809
This table reports the results of regression analysis testing the association between Pre_CSCORE and
stock returns. The dependent variable is the average monthly BHARs for the holding period of one, two,
three, four and five years from the IPO month, excluding the returns on the first trading day. The monthly
returns of 5x5 Fama-French portfolios formed on size and book-to-market are used as benchmark returns.
A description of each variable is provided in Table 3-2. *** indicates significance at 1%. ** indicates
significance at 5%. * indicates significance at 10%. All continuous variables are winsorized at the 1st and
99th
percentiles.

114
Table 3-22: Regression Analysis for the Association between the Post_CSCORE
and Post-Issue Stock Returns Adjusted for Fama-French Size and Market-to-Book
5x5 Portfolio Returns.
Independent
Variable 1 year 2 years 3 years 4 years 5 years
Post_CSCOREi -0.022 -0.021 0.078 -0.062 -0.056
(-0.445) (-0.329) (0.820) (-0.551) (-0.468)
Agei,t 0.010 -0.017 -0.014 0.086 0.122
(0.287) (-0.333) (-0.193) (1.094) (1.392)
Cashi,t 0.086 0.076 0.149 0.262** 0.366***
(1.516) (0.937) (1.328) (2.067) (2.638)
ΔAssetsi,t -0.011*** -0.012*** -0.014*** -0.013*** -0.015***
(-4.521) (-3.226) (-3.335) (-2.826) (-2.778)
RDi,t 0.308* 0.553** 1.034*** 1.033** 0.790*
(1.685) (2.076) (2.702) (2.466) (1.702)
Underpricingi,t -0.016 -0.106*** -0.034 0.058 0.039
(-0.448) (-2.596) (-0.523) (0.698) (0.498)
Underwriteri,t 0.018*** 0.022** 0.039*** 0.033** 0.048***
(2.951) (2.404) (3.020) (2.110) (3.061)
Constant -0.159** -0.158 -0.391*** -0.448*** -0.618***
(-2.267) (-1.549) (-2.713) (-2.760) (-3.610)
Year Dummies Yes Yes Yes Yes Yes
Industry Fixed
Effects Yes Yes Yes Yes Yes
F-Stats 8.983*** 8.411*** 6.947*** 7.035*** 6.023***
Adj. R2 4.1% 3.5% 3.0% 3.0% 2.9%
Obs 2218 2218 2218 2218 2218
This table reports the results of regression analysis testing the association between Post_CSCORE and
stock returns. The dependent variable is the average monthly BHARs for the holding period of one, two,
three, four and five years starting three months after the IPO fiscal-year ends to allow for a reporting lag.
The monthly returns of 5x5 Fama-French portfolios formed on size and book-to-market are used as
benchmark returns. A description of each variable is provided in Table 3-2. *** indicates significance at
1%. ** indicates significance at 5%. * indicates significance at 10%. All continuous variables are
winsorized at the 1st and 99
th percentiles.

115
Table 3-23: Regression Analysis for Fama-French Size and Market-to-Book 5x5
Portfolio Returns Sorted Based on the Level of Pre-to-Post IPO year CSCORE
Independent
Variable 1 year 2 years 3 years 4 years 5 years
C_Ci -0.226*** -0.130 -0.055 0.059 0.126
(-2.982) (-0.902) (-0.428) (0.457) (0.875)
C_Ai -0.049 -0.103 0.085 0.088 0.145
(-0.800) (-0.944) (0.653) (0.733) (1.088)
A_Ci 0.218** 0.445** 0.405** 0.415** 0.470**
(1.971) (2.136) (2.107) (2.369) (2.355)
Agei,t 0.090 -0.024 0.047 0.041 0.117
(1.340) (-0.212) (0.416) (0.329) (0.784)
Cashi,t 0.260** 0.365** 0.053 0.088 0.185
(2.337) (1.976) (0.275) (0.518) (0.986)
ΔAssetsi,t 0.014 -0.004 0.004 -0.003 0.001
(1.469) (-0.387) (0.268) (-0.244) (0.055)
RDi,t 0.109 0.816 0.812 0.356 0.498
(0.287) (1.225) (1.131) (0.611) (0.695)
Underpricingi,t -0.136 -0.108 -0.010 -0.086 -0.089
(-1.526) (-0.880) (-0.079) (-0.756) (-0.698)
Underwriteri,t 0.061*** 0.104*** 0.130*** 0.126*** 0.155***
(4.384) (4.468) (5.650) (5.809) (6.534)
Constant -0.610*** -0.892*** -1.308*** -1.307*** -1.705***
(-3.913) (-3.607) (-5.390) (-5.172) (-5.851)
Year Dummies Yes Yes Yes Yes Yes
Industry Fixed
Effects Yes Yes Yes Yes Yes
F-Stats 4.893*** 4.995*** 5.277*** 5.162*** 5.120***
Adj. R2 8.8% 7.8% 7.1% 6.1% 6.8%
Obs 834 834 834 834 834
This Table reports the results of regression analysis testing whether there is a significant difference in
stock returns across the portfolios sorted, based on the level of pre-to-post IPO year CSCOREs. CtoC is a
dichotomous variable that takes one if a sample firm belongs to the portfolio ‘CtoC' and zero otherwise,
CtoA is a dichotomous variable that takes one if a sample firm belongs to the portfolio ‘CtoA’ and zero
otherwise and AtoC is a dichotomous variable that takes one if a sample firm belongs to the portfolio
‘AtoC' and zero otherwise. Portfolio returns are calculated based on the average BHARs for the holding
period of one, two, three, four and five years from the IPO month, excluding the returns on the first
trading day, and are adjusted for the CRSP value-weighted index returns. A description of other variables
is provided in Table 3-2. *** indicates significance at 1%. ** indicates significance at 5%. * indicates
significance at 10%. All continuous variables are winsorized at the 1st and 99
th percentiles.

116
Chapter Four
The Effect of Accounting Conservatism of IPO Firms on their First
Seasoned Equity Offerings
4.1 Introduction
Chapter 3 examined the accounting conservatism of Initial Public Offering (IPO) firms
and investigated how conservatism benefits IPO firms in terms of IPO underpricing and
long-term post-issue stock return performance. Chapter 4 investigates how IPO firms’
conservatism affects their first seasoned equity offerings (SEOs). Specifically, this
chapter examines the following research questions:
Are IPO issuers who adopt a higher degree of conservatism more likely to return
to the equity market soon after their IPO?
Do IPO issuers who adopt a higher degree of conservatism experience better
stock returns when they make an announcement of their first SEO?
Do IPO issuers who adopt a higher degree of conservatism experience a less
degree of underpricing in their first SEO?
Does the extent of accounting conservatism adopted by the IPO issuers
significantly affect their post-SEO stock return performance?
The remainder of the chapter is organized as follows. Section 4.2 develops the
conceptual framework and hypotheses examined in this chapter. Section 4.3 provides
the methodology designed to empirically test the hypotheses. Section 4.4 describes the
sample and presents the descriptive statistics. Section 4.5 reports the empirical results
and Section 4.6 provides the summary and concluding remarks.

117
4.2 Conceptual Framework and Hypotheses Development
4.2.1 IPO Firms’ Accounting Conservatism and the Probability of Reissuing Stock
In the IPO setting, the lack of publicly available information increases information
asymmetry between insiders and outside investors, making it easier for issuers to
manage earnings through income-increasing adjustments. However, the capital market
imposes substantial costs on firms revealed to have manipulated earnings because
earnings performance after the IPO helps investors update their beliefs about the value
of the firm, resulting in a subsequent decline in the stock price (e.g., Aharony et al.
1993; Teoh et al. 1998a, 1998b; Jackson et al. 2002; Roosenboom et al. 2003;
DuCharme et al. 2004; Cormier & Martinez 2006)
Prior literature suggests that accounting conservatism reduces information asymmetries
by alleviating managers’ earnings management and improving a firm’s information
disclosure and investment efficiency (Watts 2002; Masulis et al. 2007; LaFond & Watts
2008). In particular, Guay and Verrecchia (2012) argue that conservative financial
reporting promotes a firm’s full disclosures by enforcing disclosures of both good and
bad news on a timely basis. This is because conservatism ensures that losses from bad
economic events are incorporated into earnings as soon as expected, while expected
gains from good economic events are voluntarily disclosed by managers through the
notes to the financial statements, conference calls and management guidance etc (see
Masulis et al. 2007). Accordingly, IPO firms that are expected to reissue soon after
their IPO may adopt a higher degree of conservatism to reduce information asymmetry
between insiders and outside investors and to enhance investors' perceptions of the firm

118
value so that they can ultimately raise the next seasoned equity financing on more
favorable terms.
Prior research shows that many IPO firms raise equity financing again soon after their
IPO (e.g., Welch 1989; Jegadeesh et al. 1993; Levis 1995). For example, Levis (1995)
documents that 22% of his IPO sample went SEO within five years after the IPO and
Jegadeesh et al. (1993) also show that 21% of their IPO sample reissue equity. Ching et
al. (2006) also report that 20-25% of IPO firms return to the market to make capital-
raising seasoned offerings in each of the three years following the IPO. Overall, these
studies indicate that a large number of firms have extra cash needs soon after they raise
equity financing via IPO. In particular, Teoh et al. (1998b) report that SEOs occur when
cash flows are declining, not when they are at a peak, claiming that issuers have an
incentive to boost their earnings to increase their offering proceeds. This is also
consistent with DeAngelo et al. (2010) who suggest that the primary motive for SEOs is
a near-term cash need.
IPO issuers adopting a higher degree of conservatism need to forgo the incentives
associated with reporting higher earnings around the IPO. This means that only high
quality issuers with strong earnings and growth potential will adopt a higher degree of
conservatism for their long-term prospects in the stock market. Consequently, IPO
issuers adopting a higher degree of conservatism may be less likely to experience a
near-term cash need soon after they raise the IPO proceeds. Therefore, the likelihood of
these firms reissuing equity soon after their IPO may be significantly lower compared
to those reporting earnings less conservatively. As discussed thus far, it is not clear
whether the extent to which conservatism is adopted by IPO issuers is significantly

119
associated with the probability of reissuing equity soon after their IPO. Consequently, it
is an empirical question as to whether firms adopting a higher degree of conservatism
are more likely or less likely to issue SEO in the first five years of operation subsequent
to the IPO. Thus, this chapter is devoted to addressing this issue.
4.2.2 IPO Firms’ Accounting Conservatism and SEO Announcement Returns
Previous studies provide evidence that the market reacts negatively to SEO firms with
poor quality earnings. For example, Rangan (1998) finds significantly higher
discretionary accruals around SEO announcement quarters and suggests that
discretionary accruals represents deliberate earnings management because issuing firms
experience earnings declines in subsequent years after the offer. Lee and Masulis (2009)
argue that when firms with poor accounting quality announce SEOs, investor
uncertainty about the value of issuers’ common stock rises and thus lowers investors’
demand for these equity issuers. In particular, they argue that poor accruals quality
creates more uncertainty for outside investors about a firm’s true performance,
regardless of whether it is created through earnings management or not. Shivakuma
(2000) also argues that SEO offering announcements signals earnings overstatement to
investors and causes investors to revise their beliefs about the future earnings of these
firms.
A more recent study by Kim et al. (2013) investigates whether firms reporting more
conservatively experience significantly higher SEO announcement returns. This study
finds that conservatism is positively associated with three-day announcement returns,
indicating that more conservative firms experience smaller price reductions at SEO

120
announcements. Kim et al. (2013) argue that firms adopting more conservative
accounting have lower information asymmetry between insiders and outside investors,
mitigating the agency costs around the SEO. Taken together, past studies suggest that
the market penalizes firms that manage earnings upward prior to the SEO by
significantly lowering its valuation of these firms subsequently (see Sloan 1996).
Therefore, if IPO firms expect to raise additional equity subsequent to the issue, they
may adopt a higher degree of conservatism around the IPO to signal their quality to
outside investors in order to achieve better terms in a subsequent seasoned offering.
This is because IPO firms with higher conservatism can increase investors’ demand in
their next equity issue by signalling to the market that they provide higher quality
earnings information through more conservative reporting. Consequently, IPO firms
with higher conservatism may experience better SEO announcement returns in their
next equity issue.
Kim et al.’s (2013) research is closely related to this thesis as it investigates the effect
of conservatism on the seasoned equity market. However, Kim et al.’s (2013) study
includes all SEO issuers in its sample and investigates the association between the
conservatism measured in the pre-SEO announcement year and announcement returns.
Consequently, Kim et al. (2013) cannot answer the question as to whether IPO issuers’
conservatism is significantly associated with their first SEO announcement returns.
Therefore, this chapter empirically investigates whether IPO firms adopting more
conservative accounting experience more positive market reaction around SEO
announcements.

121
4.2.3 IPO Firms’ Accounting Conservatism and SEO Underpricing
The vast majority of research on the capital market consequences of accounting
disclosures suggests that there are long-term benefits to building a reputation for
providing reliable accounting disclosures. These benefits include increases in stock
returns, institutional ownership, analyst following and stock liquidity, and a decrease in
cost of equity capital (e.g., Lang & Lundholm 1993; Botosan 1997; Healy et al. 1999;
Healy & Palepu 2001). In particular, Botosan (1997) argues that greater disclosure is
associated with a lower cost of equity capital because disclosure of private information
reduces a firm’s information asymmetry thereby increasing investors’ demand for its
securities and raising the current stock price. Francis et al.(2004) also find that firms
with higher accrual quality experience a lower cost of equity capital. This is because
high quality earnings enhance the ability of earnings to convey information about future
cash flows, reducing information risk for investors. Similarly, Francis et al. (2008) also
report that firms with greater voluntary disclosure incur a lower cost of capital.
However, they argue that such an effect disappears after controlling for earnings quality,
concluding that earnings quality is the direct cause for the reduced cost of capital and
that firms with good quality earnings provide higher levels of voluntary disclosure
(Francis et al. 2008).
The extant literature suggests that reporting conservatism facilitates firms’ access to
external funds by reducing the cost of those funds (see García Lara et al. 2010). García
Lara et al. (2011a) find that conservatism is negatively associated with expected stock
returns, suggesting that investors reward more conservative firms with a lower cost of
capital. They argue that conservative reporting which facilitates more informative

122
disclosure of bad news reduces the cost of capital by improving risk sharing across
investors. Artiach and Clarkson (2003) also find that conservatism is negatively
associated with the cost of equity capital. However, they argue that such benefits are
diminished in environments of low information asymmetry with high disclosure,
suggesting that the marginal impact of conservatism systematically declines as the
firm’s information environment improves. Li (2010) extends this research to the
international context and obtains consistent results, showing that country-year
conservatism measures are negatively associated with both the cost of equity and debt
capital. Taken together, previous studies suggest that more conservative reporting
contributes to a reduction in firms’ cost of capital by improving the quality of
accounting disclosures and reducing information asymmetries between insiders and
outside investors.
Prior research documents that SEOs are significantly underpriced and SEO
underpricing has been gradually increasing over time (e.g., Healy et al. 1999; Lowry &
Schwert 2002; Jog & McConomy 2003; Andrade & Stafford 2004; Donelson et al.
2012). Andrade and Stafford (2004) argue that the increase in SEO underpricing is due
to the fact that firms issuing seasoned equity more recently are subject to higher levels
of uncertainty than issuers in earlier periods. In particular, Huijgen and Lubberink
(2005) suggest that SEO underpricing results directly from the information asymmetry
among investors because it adversely affects the cost of equity capital. Accordingly,
prior literature suggests that the increase in uncertainty about the value of the equity
offer increases SEO underpricing (Corwin 2003; Huijgen & Lubberink 2005; Daske et
al. 2008). For example, Kim and Park (2005) find that SEO firms employing aggressive
accounting decisions using discretionary accruals in order to issue new shares at

123
inflated prices experience a larger degree of SEO underpricing. Consequently, IPO
firms reissuing shortly after their IPO may benefit in their follow-on equity financing
by adopting a higher degree of conservatism. This is because IPO firms with more
conservative earnings can signal the quality of their reported earnings to outside
investors, differentiating themselves from low quality IPOs with poor quality
accounting information. Thus, it will lead to greater investors’ demand when they come
back to the equity market for their next issue, reducing their need to underprice their
offer. Thus, this chapter investigates whether the extent to which conservatism is
adopted by IPO firms significantly affects the degree of underpricing in their first
seasoned equity offering.
4.2.4 IPO Conservatism and Post-Issue SEO Performance
A number of empirical studies report significant long-term underperformance of SEOs
relative to non-issuing firms (e.g., Loughran & Ritter 1995; Spiess & Affleck-Graves
1995; Loughran & Ritter 1997). These studies show that SEO firms experience low
post-issue stock returns because investors are over-optimistic about the earnings
potential of firms issuing stock and these firms take advantage of this overvaluation
(see also Cai & Loughran 1998). Teoh et al. (1998b) suggest that previously
documented post-issue stock return underperformance of SEO issuers is due to those
that manage earnings aggressively using discretionary current accruals prior to the offer.
Consistent with this view, Cohen and Zarowin (2010) provide evidence of significant
positive abnormal accruals in the year of SEO. In particular, they argue that SEO firms
do not only engage in accrual-based earnings management, but also real activities
manipulations by adjusting production costs and discretionary expenses. They suggest

124
that SEO firms that manage earnings around the offer tend to have better operating
performance than do their industry peers in the period preceding the SEO, but they
significantly underperform following the SEO.
IPO issuers can influence their offer price or the initial market valuation by
manipulating earnings upward. However, those who engage in earnings manipulation
will risk long-term reputational benefits for the prospect of their short-term gains as the
firm's performance is realized after the issue and thus the market discovers the true
quality of the issuer between the IPO and SEO. Consequently, IPO issuers who need to
return to the capital markets in the near future have strong incentives to provide higher
quality earnings to investors for long-term stock market benefits. LaFond and Watts
(2008) suggest that conservatism can serve as a mechanism to reduce information
asymmetry between firm insiders and outside investors by providing assurance to
investors that gains are not overstated and losses are not understated in financial
statements.
Higher information asymmetry increases risk to uninformed investors because only
informed investors can reweight their portfolio as they receive new private information
(Easley & O'Hara 2004). As a result, when investors recognize lower information
asymmetry for the equity issuer, their demand for this issuer’s stock will significantly
increase (see Botosan 1997). This may suggest that IPO issuers who will soon require
equity financing will report earnings more conservatively to reduce information
asymmetries and to develop a reputation for high-quality financial disclosures in the
capital market (see Dechow et al. 1996). As a result, IPO issuers with higher
conservatism reissue equity soon after their IPO may perform well in the stock market.

125
Thus, this chapter investigates whether the extent to which conservatism is adopted by
IPO issuers can predict the stock return performance in the post-SEO market.
4.3 Research Methodology
4.3.1 IPO Conservatism and the Probability of First Seasoned Equity Offering
A probit model is employed to test whether conservatism adopted by IPO issuers is
significantly associated with the probability of reissuing within five years subsequent to
the IPO and is as follows:
SEO_ni = α0 + β1 CSCOREi + β2 Cashi,t + β3 Levi,t + β4 AFTRETi+β5Tobins’qi
+ β6Agei,t + β7IPO_Underpricingi + β8 IPO_Underwriteri
+ ∑ Year dummies +
∑ Industry dummies + εi (1)
Equation (1) tests the association between SEO probability and IPO issuers’
conservatism. The dependent variable SEO_n is a binary indicator that takes the value
of one if an IPO firm reissues equity within n years subsequent to the IPO (where n=1,
2, 3, 4 and 5) and otherwise zero. The association between IPO firms’ conservatism and
the probability of reissuing is investigated from one to five years, subsequent to the IPO.
The investigation period ends five years after the IPO because the effect of
conservatism adopted around IPO will be diminished as the timing of the first seasoned
equity offering moves further away from the IPO (e.g., Mikkelson et al. 1997; Jain &
Kini 1999; Bhabra & Pettway 2003). CSCORE is measured both in the pre-IPO and
IPO year. Accounting variables are measured in the same fiscal year over which
CSCORE is measured for consistency. For example, when CSCORE is measured in the

126
pre-IPO year, all other accounting variables are also measured in the pre-IPO year. A
description of each variable used in the regression model is provided in Table 4-1.
[Insert Table 4-1 here]
The level of cash and marketable securities (Cash) and leverage ratio (Lev) are included
in the regression to control for the financial condition of an IPO firm. DeAngelo et
al.(2010) find that a majority of SEO issuers would have run out of cash in the year
after the offer without the proceeds received, suggesting that a near-term cash need is
the primary SEO motive. A debt reduction is also one of the well-known motivations
for equity financing (see Walker & Yost 2008), suggesting that firms with a greater
amount of debt need to raise capital soon after the IPO to pay down those debts.
The after-market valuation of an IPO may also affect a firm’s decision to equity finance
soon after their IPO since poor after-market valuation by investors may discourage
firms from issuing shares again soon. Thus, cumulative market-adjusted stock returns in
the 20-day trading periods after the IPO (AFTRET) and Tobin’s q (Tobins’q) are
included in the regression to control for the after-market performance and valuation of
an IPO, respectively (see Jegadeesh et al. 1993). DeAngelo et al.(2010) argue that most
of the firms conducting SEOs are young high-growth firms. In particular, they find that
the median SEO issuer in the full 1973-2001 sample is listed 5.1 years at the time of the
SEO and has a market-to-book (M/B) ratio of 71% above the industrial firm median.
Accordingly, the regression controls for a firm’s age (Age). However, the regression
does not include M/B ratio, since both M/B and Tobins’q are used as a proxy for growth
opportunities.

127
The regression also includes IPO underpricing (IPO_Underpricing) as a control
variable. Welch (1989) hypothesizes that high quality firms underprice their IPOs more
to distinguish themselves from low quality firms and to raise future external financing
on more favorable terms. Slovin et al. (1994) provide empirical evidence that is
consistent with Welch’s (1989) view that IPO underpricing is positively associated with
share-price response to a first seasoned equity offering. This implies that firms
underpricing their IPOs to a larger extent are more likely to have their first seasoned
equity offering soon after their IPO. However, Michaely and Shaw (1994) and Spiess
and Pettway (1997) do not find the result supporting Welch (1989). Rather, they find
evidence that the likelihood of seasoned equity offerings is inversely related to initial
return and that the decision to reissue is related to the firm’s success in the market in its
first years of public operation.
IPO underwriter rankings (IPO_Underwriter) are also included in the regression to
control for the quality of the IPO underwriter. Krigman et al. (2009) suggest that one of
the reasons why IPO firms switch their lead underwriter at the follow-on offering is to
hire more prestigious underwriters. Prior studies (e.g., Carter & Manaster 1990; Carter
et al. 1998) have documented the signalling hypothesis that prestigious underwriters
market larger and more established IPOs due to their reputation being at stake and that
higher quality (less risky) issuing firms signal their quality by employing more
prestigious underwriters. Accordingly, a third-party monitoring certification by more
reputable underwriters reduces the uncertainty about the value of an IPO and the
information asymmetry between insiders and outside investors (Carter & Manaster
1990; Datar et al. 1991; Megginson & Weiss 1991; Menon & Williams 1991; Michaely
& Shaw 1994; Carter et al. 1998; Copley & Douthett Jr 2002; Lewellen 2006; Nahata

128
2008). As a result, firms that are going to raise equity finance soon after their IPO may
employ more prestigious underwriters for their IPOs to increase their value by reducing
the information asymmetry between insiders and outside investors.
4.3.2 The Effect of IPO Conservatism on SEO Announcement Returns
Certain characteristics, such as the capital structure, financial condition, after-market
performance and valuation may affect a firm’s decision to raise SEO soon after the IPO.
Such an effect should be controlled in the regression testing the association between
IPO conservatism and the profitability of the first SEO to avoid omitted variables bias.
Consequently, to control for potential endogeneity, Heckman’s (2008) two-stage
estimation method is used in this chapter to test whether the degree of conservatism
measured at the IPO is significantly associated with the share price response to the
announcement, underpricing of the first seasoned equity offering and the post-SEO
stock return performance. Accordingly, Siougle (2007) suggests that there is a need to
control for self-selection bias in the case of SEO studies because the external financing
decision through a SEO is a firm’s natural self-selecting event. Equation (1) provided in
Section 4.3.1 is the first-stage probit regression model in which the inverse mills ratio
(IMR) is calculated for the second-stage regressions as shown in equation (2) through to
equation (4). The dependent variable used in the first-stage probit regression (equation
1) is a binary indicator that equals one if an IPO firm reissues equity within five years
subsequent to the IPO and otherwise zero.

129
CARi = α0 + β1 CSCOREi + β2 Volatility_Anni+ β3 Runupi+ β4 Mrunupi
+ β5SEO_Underwriteri+ β6 Time_IPOi+ β7 Relsizei
+ β8 IPO_Underpricingi+ β9IMRi+ ∑ Year dummies
+ ∑ Industry dummies + εi (2)
Equation (2) tests whether IPO firms’ conservatism is significantly associated with the
abnormal announcement returns of the first SEO. The dependent variable is CAR
measured as the three-day market-adjusted cumulative abnormal stock returns measured
in days -1 through +1 where day 0 is the SEO announcement date and the market return
is the CRSP value weighted index returns. Consistent with equation (1), CSCOREi is
measured both in the pre-IPO and IPO year and all accounting variables are measured
in the same fiscal year over which CSCOREi is measured. Table 4-1 provides a
description of each variable used in the regressions.
Firms with higher stock return volatility face higher uncertainty and risk exposure (see
Lee & Masulis 2009). Previous research (e.g., Frankel et al. 1995; Lang & Lundholm
2000) suggests that SEO firms with higher levels of uncertainty and information
asymmetry between insiders and outside investors prior to the offerings experience an
increase in cost of capital. Accordingly, firms with higher stock return volatility will
experience a negative stock price response to their SEO announcement. Thus, stock
return volatility, (Volatility_Ann) measured as a return volatility over the 60 trading
days ending 11 days prior to the SEO announcement, is included in the regression to
control for the effect of a firm’s stock return volatility on the price response around the
SEO announcement. Masulis and Korwar (2012) suggest that firms with relatively large
stock price run-ups prior to the offering announcements experience a larger negative
stock reaction, whereas the run-up in the stock market index is positively associated

130
with the announcement period stock returns. Accordingly, the regression also includes
both individual stock price run-ups (Runup) and market returns (Mrunup) as control
variables.
Prior researchers document the signalling hypothesis that high quality firms signal their
type by underpricing their initial issue of shares to receive a more favorable market
response to subsequent offerings (e.g., Allen & Faulhaber 1989; Grinblatt & Hwang
1989; Welch 1989; Slovin et al. 1994). Accordingly, IPO underpricing
(IPO_Underpricing) is included in the regression to control for the effect of IPO
underpricing on the SEO announcement returns. The regression also includes SEO
underwriter rankings (SEO_Underwriter) to proxy for the underwriter quality (see
Carter & Manaster 1990; Carter & Dark 1993).
Slovin et al.(1994) argue that the longer the time lapses between the IPO and the
subsequent equity offering, the greater the volume of public information released about
the firm, reducing uncertainty about the firm value. In particular, Walker and Yost
(2008) suggest that information asymmetry results in greater value loss in a SEO.
Accordingly, the regression includes the log of the number of days between the IPO and
the first SEO (Time_IPO) as a control variable. Similarly, Relsize, which measures the
size of the SEO as a fraction of the IPO size, is also included in the regression as a
control variable following Jegadeesh et al. (1993) who suggest that there is higher ex
ante uncertainty associated with smaller SEO offerings, relative to their IPO size (see
also Barry & Brown 1984; Beatty & Ritter 1986; TiniÇ 1988).

131
4.3.3 The Effect of IPO Conservatism on SEO Underpricing
Equation (3) is employed to test whether the extent to which conservatism is adopted by
IPO firms is negatively associated with the degree of underpricing in a subsequent
equity offering. Equation (3) is as follows:
SEO_Underpricingi = α0 + β1 CSCOREi + β2 Volatility_Issuei + β3CAR_6monthsi
+ β4 SEO_Underwriteri+ β5Relsizei
+ β6 Avr_Underpricingi + β7 NYSEi+ β8MV_SEOi
+ β9IMRi + ∑ Year dummies
+ ∑ Industry dummies+ εi (3)
Consistent with equation (2), inverse mills ratios (IMR) are calculated using equation (1)
as the first-stage probit regression. The dependent variable is SEO_Underpricing
measured as the closing price on the offer day, minus the offer price divided by the
offer price. Prior research shows that firms with high levels of uncertainty and
asymmetric information are more underpriced to compensate uninformed investors (e.g.,
Beatty & Ritter 1986; Rock 1986). Firm size and stock return volatility proxy for
information asymmetry prior to the offer (see Corwin 2003). Accordingly, the market
value at SEO (MV_SEO) and the stock return volatility over the 60 trading days ending
11 days prior to the SEO issue (Volatility_Issue) are included as control variables.
The regression also includes SEO_Underwriter as a control variable. Previous studies
suggest that more reputable underwriters reduce the uncertainty and information
asymmetry between informed and uninformed investors because they provide more
accurate information about the issuing firm to maintain their reputation (Carter &
Manaster 1990; Carter et al. 1998; Lewellen 2006). As discussed above, Relsize is also

132
included in the model to control for the level of uncertainty associated with the size of
the offering.
Kim and Park (2005) suggest that pre-offer stock market returns are negatively
associated with the degree of SEO underpricing because issuers who have experienced
a greater recent increase in their price expend less effort in bargaining over the offer
price with underwriters. Thus, the cumulative market adjusted return over 6 months,
ending the day prior to the issue (CAR_6months), is included as a control variable.
Corwin (2003) argues that factors affecting the degree of underpricing, such as the
relative bargaining positions of issuers, underwriters and investors depending on
business and industry cycles should affect both IPO and SEO underpricing.
Accordingly, an average IPO initial return during the same month as the SEO
(Avr_Underpricing) is included as a control variable. The regression also includes
NYSE as per previous studies reporting that the stocks listed on the NYSE exchange
tend to be less underpriced than NASDAQ issues (e.g., Lowry & Schwert 2002; Corwin
2003; Leone et al. 2007).
4.3.4 IPO Conservatism and Post-SEO Stock Return Performance
Equation (4) tests the association between IPO firms’ conservatism and post-SEO stock
return performance. A description of each variable12
in the regression is provided in
Table 4-1. Inverse mills ratios (IMR) are calculated based on equation (1).
12
Section 3.3.4 of the thesis provides the justification of the control variables used in the return
regressions.

133
R i, t= α0 + β1 CSCOREi + β2 Agei+ β3 SEO_Underpricingi+ β4 MV_SEOi
+ β5 Asset_growthi+ β6 R&Di+ β7 Cash_SEOi + β8 IMRi
+ ∑ Year dummies +
∑ Industry dummies + εi (4)
The dependent variable in the regression is the post-SEO annual abnormal stock returns
(Ri,t) measured by using buy-and-hold abnormal return (BHAR) and cumulative
abnormal return (CAR) relative to alternative benchmarks: monthly CRSP value-
weighted index and Fama-French size and market-to-book 5x5 portfolio returns.13
The
model includes Age and MV_SEO as control variables. Older firms have a longer
history of their operation in the market, thus these firms entail lower risks due to the
larger amount of information available (e.g., Carter & Manaster 1990; Ritter 1991;
Loughran & Ritter 2004). Similarly, firm size is also negatively associated with the
level of uncertainty about the firm value (Corwin 2003).
SEO_Underpricing is also included as a control variable following previous studies
which suggest a negative association between the degree of underpricing and the long-
term stock return performance (e.g., Ritter 1991; Carter & Dark 1993; Krigman et al.
1999). Lagged changes in total assets (Asset_growth) and research and development
expenditure (RD) proxy for the investment and growth characteristics of an issuing firm
and are included in the regression, following previous studies that suggest these
variables are a strong predictor of future stock returns (see Eberhart et al. 2004; Cooper
et al. 2008). Finally, Cash is also included in the regression to proxy for the financial
condition of an issuing firm (Billett et al. 2011).
13
A detailed description of how stock returns are measured is not discussed here since the methods used
in this chapter are consistent with those used and discussed in Chapter 3 of the thesis.

134
4.4 Sample Data and Descriptive Statistics
The Securities Data Corporation (SDC) Platinum database is utilized to obtain firms
that went IPO during the period 1990 to 2005 and reissued equity financing within five
years subsequent to the IPO from 1990 to 2010. Out of 2,356 IPO sample firms,14
855
firms went SEO within five years subsequent to the IPO. However, when the SEO
occurs in the same fiscal-year as the IPO it is difficult to examine the effect of IPO year
conservatism (Post_CSCORE) on their next equity financing. This is because
Post_CSCORE is measured after the SEO as conservatism in the IPO year is measured
after the IPO fiscal-year ends. As a result, when examining Post_CSCORE, 418 firms
that reissued equity within one year of their IPO are excluded from the sample, leaving
437 firms in the sample. When the pre-IPO year CSCORE is under analysis, there is no
need to exclude firms reissuing equity in the IPO year as the pre-IPO year CSCORE is
measured prior to their first SEO. Out of 855 IPO firms which reissued equity within
five years of their IPO, 313 firms have CSCORE measured in the pre-IPO year.
Table 4-2 provides the descriptive statistics of all the variables used in the empirical
analysis. Table 4-2 (Panel A) reports the variables measured in the pre-IPO year and
Table 4-2 (panel B) provides the variables measured in the IPO year.
[Insert Table 4-2 here]
The mean and median of Cash and IPO_Underpricing differ considerably from each
other, suggesting that they are both positively skewed. Although the mean and median
14
See Section 3.4 of the thesis for the detailed IPO sample selection process.

135
AFTRET have the opposite sign, they are both very close to zero, suggesting that the
IPO sample firms did not outperform the market, on average, in the one-month period
after the IPO. Table 4-2 (Panel C) reports the descriptive statistics of the variables
measured in the SEO announcement and issue year. The mean and median CSCORE
measured in the year prior to the SEO announcement (AnnCSCORE_SEO) are close to
those measured in the year prior to the SEO issue (IssCSCORE_SEO), reflecting the
fact that the sample firms issued their SEO in the same year as their announcement year
except for 11 firms. Due to these 11 firms, IssCSCORE_SEO is measured and
employed in the model specification where a dependent variable is measured after the
SEO issue to increase the precision of the regression analysis. Both AnnCSCORE_SEO
and IssCSCORE_SEO are available for 416 sample firms.
The mean of Asset_growth is higher than the median, indicating that Asset_growth is
positively skewed. Although it is not reported in Table 4-2 for brevity, the analysis of
sample data reveals that 23% of the sample firms experience more than a 100% increase
in the size of their assets in the SEO year. Cash_SEO, R&D, Relsize, and
SEO_Underpricing are also positively skewed. In particular, only 220 issuers reported
R&D, indicating that only half of the sample firms incurred R&D expenditures in the
SEO year. Both the mean and median Relsize are greater than one, suggesting that the
sample firms’ first SEO size is, on average, greater than their IPO size. In addition, the
mean IPO_Underpricing of 13.2% is higher than the mean SEO_Underpricing of 3.2%,
indicating that firms reissuing equity within five years of their IPO show a lower degree
of underpricing at their SEO compared to the level of underpricing they had at the IPO.

136
4.5 Empirical Analysis
4.5.1 IPO Conservatism and the Probability of Issuing a SEO
To examine the distribution of the sample based on their CSCORE, the sample firms are
sorted into quartiles based on PreCSCORE_IPO and PostCSCORE_IPO. The first
quartile (Q1) has the highest mean conservatism score and is the most conservative
earnings reporting group. The fourth quartile (Q4) has the lowest mean conservatism
score and is the least conservative earnings reporting group. The analysis of
PreCSCORE_IPO quartiles is reported in Panel A of Table 4-3 and PostCSCORE_IPO
in Panel B. In particular, 158 out of 313 firms (50%) went for SEO within one year of
their IPO in the PreCSCORE_IPO analysis and 223 out of 437 firms (51%) within two
years of their IPO in the PostCSCORE_IPO analysis. This indicates that half of the
sample IPO firms reissued equity at least in the first two years of their operation after
the IPO.
As reported in Panel A of Table 4-3, Q1 has the lowest number of IPO firms that
reissued equity within one to three years after the IPO. For four and five years
subsequent to the IPO, Q2 has the lowest number of firms and Q1 has the second lowest.
Q4 reports the largest number of firms that reissued equity all across one to five years
after the IPO. Accordingly, this result indicates that firms reporting less conservatively
in the pre-IPO year tend to come back to the equity market within one to five years
subsequent to the IPO.
[Insert Table 4-3 here]

137
Table 4-3 (Panel B) provides consistent results. Specifically, Q1 has the lowest number
of firms that reissued equity within two to five years of the IPO, while Q4 reports the
largest number of firms. There is a monotonic increase in the number of firms from Q1
to Q4 across different years. This result indicates that firms reporting less
conservatively in the IPO year tend to obtain equity financing again within five years
subsequent to the IPO. Frequent issuers are the firms that reissue equity more than once
within the five years of their IPO and there appears to be no systematic pattern across
the quartile of the Frequent Issuers sample.
A multivariate analysis is also employed to test the association between IPO
conservatism and the probability of next equity financing. Table 4-4 presents the
correlation matrix15
of independent variables used in the regression model for
PreCSCORE_IPO analysis and Table 4-5 for PostCSCORE_IPO analysis. As tabulated
in Table 4-4 and 4-5, Age is negatively correlated with Cash which is not consistent
with the life-cycle theory that young firms are in the growth-stage with lower operating
cash flow. DeAngelo et al. (2010) suggest that more mature firms selling stock tend to
have Altman Z-scores indicative of serious financial distress. Accordingly, this may
indicate that older private firms experiencing a cash short-fall may decide to go public
to raise cash, driving a negative correlation between Age and Cash in the dataset. The
reported correlation coefficients16
are not overly high as the higher correlations
obtained are those between Tobin’s q and IPO_Undepricing (at 38% in Table 4-4 and
15
The correlation between the conservatism scores and IPO characteristics, such as IPO underwriter and
IPO underpricing are provided and discussed in Section 3.5 of the thesis. 16
Each variable in the model is tested for a variance inflation factor (VIF) and provided in Appendix IV
of the thesis. All VIFs reported are below two, confirming that the model is not subject to
multicollinearity (see Kim & Purnanandam 2013).

138
44% in Table 4-5), Tobin’s q and Cash (at 35% in Table 4-5), and Lev and Cash (at -32.%
in Table 4-4 and -45% in Table 4-5).
[Insert Table 4-4 here]
[Insert Table 4-5 here]
The results for PreCSCORE_IPO regression analysis are presented in Table 4-6 and the
results for PostCSCORE_IPO are reported in Table 4-7. In Table 4-6, the coefficient on
PreCSCORE_IPO is negative in all regressions (SEO_1 to SEO_5), but is not
statistically significant. In Table 4-7, the coefficient on PostCSCORE_IPO is negative
and statistically significant at 1% in all regressions, suggesting that the extent of
conservatism adopted by a firm in the IPO year is negatively associated with the
probability of reissuing equity within two to five years subsequent to the IPO.
Consistent with this result, the coefficient on PostCSCORE_IPO is also negative and
statistically significant at 1% in the regression where SEO_Frequent is the dependent
variable, suggesting that the lower the conservatism in the IPO year, the higher the
probability of reissuing equity more than once within five years of the IPO.
[Insert Table 4-6 here]
[Insert Table 4-7 here]
The coefficients on Cash are negative, indicating that the higher the amount of cash, the
lower the probability of reissuing soon after the IPO. However, the coefficient is

139
statistically significant only in SEO_1 regression in PreCSCORE_IPO analysis and
SEO_2 and SEO_3 regression in PostCSCORE_IPO analysis. The coefficient on Lev is
positive and statistically significant in all regressions in PostCSCORE_IPO analysis
(except for the SEO_2 regression), indicating that the IPO firms with higher leverage in
the IPO year are more likely to go for equity financing again soon after their IPO.
However, the coefficient is not statistically significant in PreCSCORE_IPO analysis.
The coefficient on IPO_Underpricing is negative and statistically significant in SEO_2
to SEO_5 regressions in both PreCSCORE_IPO and PostCSCORE_IPO analysis. This
result suggests that firms underpricing their IPO less are more likely to issue SEO soon
after the IPO. This result is in line with Michaely and Shaw (1994) and Spiess and
Pettway (1997) who argue that the likelihood of SEO is related to the firm’s success in
the after-issue market rather than the degree of its initial return. The coefficient on
IPO_Underwriter is positive and statistically significant in all regressions in both
PreCSCORE_IPO and PostCSCORE_IPO analysis (except for SEO_1 regression). This
result suggests that firms employing more prestigious underwriters at the time of their
IPO are more likely to issue SEO soon after the IPO. Prior research finds that more
prestigious underwriters reduce information asymmetry for equity issuing firms by
adding credibility to the issue (e.g., Carter & Manaster 1990; Carter & Dark 1993;
Carter et al. 1998). Thus, firms that are going to reissue soon after their IPO may want
to reduce the information asymmetry by employing more prestigious underwriters to
raise the next equity financing on more favorable terms.
In the regression where SEO_Frequent is the dependent variable, only the coefficient
on Lev is positive and statistically significant in PostCSCORE_IPO analysis, suggesting
140
that firms with higher leverage in the IPO year are more likely to reissue equity more
than once within five years subsequent to the IPO. All other control variables do not
have a statistically significant coefficient.
4.5.2 IPO Conservatism and the Probability of Raising Funds through Divestitures
In this section, the thesis investigates the association between issuers’ conservatism and
the probability of raising funds through divestitures. The results from the previous
section are interpreted as IPO firms reporting more conservatively in the IPO year
having less need for extra financing within five years of their IPO. However, it is
possible that these IPO firms may use other means of raising cash instead of equity
financing such as divestment. Dhaliwal et al. (2014) document that divestment is an
important instrument that firms use to generate cash. As a result, this thesis conducts an
additional regression analysis testing the association between the PreCSCORE_IPO and
PostCSCORE_IPO and the probability of divestment. Divestment data is obtained from
the M&A module of the SDC database. The M&A transactions which occurred from
the period 1990 to 2010 and which were identified as having the same target as the
ultimate parent are matched against the IPO sample data. Out of 2,356 sample firms,
301 firms divested a subsidiary within five years subsequent to the IPO. The dependent
variable of the regressions is Div_n (where n=1, 2, 3, 4 and 5) that equals one if the firm
divested within n years subsequent to the IPO and otherwise zero.
Table 4-8 reports the results for PreCSCORE_IPO analysis and Table 4-9 for
PostCSCORE_IPO analysis. The coefficient on PreCSCORE_IPO is negative across all
regressions in Table 4-8, but statistically insignificant, suggesting that IPO firms’

141
conservatism in the pre-IPO year is not significantly associated with the probability of
divestment. The coefficient on PostCSCORE_IPO is negative and statistically
significant at 1% to 5% in all regressions in Table 4-9 (except for the Div_3 regression),
providing some evidence that the extent of conservatism adopted by firms in the IPO
year is negatively associated with the likelihood of divestiture within five years
subsequent to the IPO.
[Insert Table 4-8 here]
[Insert Table 4-9 here]
It is noted that the 2
for some of the regressions provided in Table 4-8 and Table 4-9 is
not statistically significant, rejecting the overall significance of these regressions.
However, this result at least confirms that the extent of IPO issuers’ conservatism is not
significantly associated with the probability of divestment subsequent to the IPO. This
also supports the previous finding that issuers adopting higher conservatism in the IPO
year are less likely to reissue equity within five years of the IPO due to their lower near-
term cash needs. As for the control variables, only the coefficient on Age remains
statistically significant across Div_2 to Div_5 regressions in the PreCSCORE_IPO
analysis, providing some evidence that younger IPO firms are more likely to go for
divestiture soon after their IPO.

142
4.5.3 IPO Conservatism and SEO Announcement Returns
The three-day cumulative abnormal stock returns (CARs) are measured around the SEO
announcement date. The SDC database does not provide the announcement dates
separately. Thus, following previous studies (e.g., Jegadeesh et al. 1993; Kim &
Purnanandam 2013; Kim et al. 2013), filing dates are used as a proxy for the
announcement dates. In particular, Kim and Purnanandam (2013) check the actual SEO
announcement dates for a sub-sample of 300 firms in 1993-2000 using Factiva search.
They find that 90% of SEOs make their announcements on the same day as their filing
dates. They also report that, out of the remaining 10%, the majority make
announcements a day before the filing date.
As shown in Table 4-10, sample firms are divided into quartiles based on their
CSCORE measured in the pre-IPO year (PreCSCORE_IPO) in Panel A, CSCORE
measured in the IPO year (PostCSCORE_IPO) in Panel B and CSCORE measured in
the year prior to the SEO announcement (AnnCSCORE_SEO) in Panel C. As can be
seen from the average conservatism scores from each quartile, Q1 is the most
conservative earnings reporting quartile and Q4 is the least conservative earnings
reporting quartile. The average announcement CAR provided in each panel of Table 4-
10 is negative, consistent with previous findings that IPO firms experience negative
announcement returns on average for their first SEO (e.g., Jegadeesh et al. 1993; Levis
1995).
As reported in Table 4-10 (Panel A), there appears to be no systematic pattern across
the PreCSCORE_IPO quartiles. In Panel B, Q4 reports the highest CAR while Q1

143
reports the lowest. However, there is no monotonic increase in the CARs from Q1 to
Q4, which makes it difficult to draw inferences from this result. Panel C provides the
CARs sorted based on AnnCSCORE_SEO quartile. There is a monotonic increase in the
CARs from Q1 to Q4, suggesting that the sample firms reporting more conservatively
in the year prior to the SEO announcement tend to experience more negative SEO
announcement returns. The results from the univariate analysis are only suggestive
because this does not control for other effects on the SEO announcement returns. Thus,
regression analysis is also employed to examine the association between IPO
conservatism and the SEO announcement returns.
[Insert Table 4-10 here]
Table 4-11 provides the correlation matrix for the variables used in the regression
analysis. PreCSCORE_IPO and PostCSCORE_IPO are positively correlated at 42%
and PostCSCORE_IPO and AnnCSCORE_SEO are also positively correlated at 52%,17
indicating that the IPO firms adopting a higher degree of conservatism in the pre-IPO
year also tend to adopt higher conservatism in the IPO year. Also, the firms reporting
earnings conservatively in the IPO year tend to show higher conservatism in the year
prior to their first SEO. Volatility_Ann is positively correlated with Runup at 43%
(statistically significant at 1%), indicating that the firms with higher stock return
volatility tend to experience higher stock returns prior to the announcements. All other
variables do not report a significantly high correlation.18
17
PreCSCORE_IPO, PostCSCORE_IPO and AnnCSCORE_SEO are not included in the same regression.
Thus, their correlation does not have an impact on the regression results. 18
VIF is checked for each coefficient and the results are provided in Appendix IV of the thesis. The
results show no indication of multicollinearity.

144
[Insert Table 4-11 here]
Table 4-12 provides the CAR regression results which control for selectivity using the
inverse mills ratios (IMR). The IMRs are obtained from the first stage regression of
equation (1) as provided in Section 4.3.1 of the thesis where the dependent variable is
SEO_5, a binary indicator that equals one if a firm reissues equity within five years of
the IPO and otherwise zero. The IMR is included in the second stage regressions
provided in Table 4-12. The coefficient on IMR is negative and statistically significant
at 5% in model 1, providing some evidence that the factors affecting the IPO firm’s
decision to issue SEO needs to be controlled when the SEO is conducted soon after the
IPO to avoid self-selection bias. Also, the negative coefficient on IMR indicates that
such unobservable factors simultaneously decreases the SEO decision and also reduces
the announcement returns.
The coefficient on PreCSCORE_IPO in model 1 is positive and statistically significant
at 5%, suggesting that the extent of conservatism adopted by issuers in the pre-IPO year
is positively associated with the announcement returns at their first SEO. As both the
mean and median CAR are negative, the result can be interpreted that firms adopting a
higher degree of conservatism prior to going public experience significantly less
negative returns to their first SEO announcement. However, the coefficient on
PostCSCORE_IPO is not statistically significant in model 2.
As reported in model 3, the coefficient on AnnCSCORE_SEO is also positive but not
statistically significant. This finding is not consistent with Kim et al. (2013) who find
that firms with a greater degree of conservative reporting in the year prior to the SEO

145
experience better SEO announcement returns. However, the sample of Kim et al. (2013)
consists of all SEO issuers while this thesis focuses on IPO firms issuing SEO within
five years of their IPO. Consequently, the results of this thesis suggest that the degree of
conservatism prior to the SEO does not have a significant effect on the valuation of
seasoned equity issues for issuers who come back to the equity market soon after their
IPO. Rather, the results suggest that the extent of conservatism adopted in the pre-IPO
year conveys more important information about the quality of SEO investment.
[Insert Table 4-12 here]
Consistent with Hui et al. (2012), the coefficient on Runup is negative and statistically
significant at 1% to 5% across all regressions, suggesting that firms with larger stock
price run-ups prior to announcements experience lower SEO announcement returns.
The coefficient on MRUNUP is positive and statistically significant at 1% to 5% in all
regressions, indicating that higher market returns prior to the SEO announcements lead
to better stock returns at the announcement. The coefficient on Avr_Underpricing is
negative and statistically significant at 5% in model 1, but it does not remain
statistically significant in any of the other regressions.
Previous studies suggest that conservatism reduces information asymmetry between
insiders and outside investors by providing verifiable “hard” accounting information
which limits managers’ ability to manage earnings (e.g., LaFond & Watts 2008; Khan
& Watts 2009). Kim et al. (2013) provide evidence that SEO issuers with greater
information asymmetry experience a more severe price reduction at SEO
announcements and that this negative association becomes significantly weaker for
issuers with a greater degree of conservatism. Following Kim et al. (2013), the

146
regressions are re-estimated by including the measures of information asymmetry to
examine whether the effect of conservatism becomes more pronounced when
information asymmetry is higher. Following previous studies (e.g., Frankel et al. 1995;
LaFond & Watts 2008; Khan & Watts 2009; Kim et al. 2013) that measure information
asymmetry using stock return volatility and bid-ask spread, the regression includes two
dummy variables DVolatility_Ann and DBidAsk_Ann and their interaction terms with
conservatism scores (PreCSCORE_IPO, PostCSCORE_IPO and AnnCSCORE_SEO).
DVolatility_Ann is assigned one if the firm’s standard deviation of daily stock returns
over the 60 trading days ending 11 days prior to the SEO announcement is above the
sample median and otherwise zero. DBidAsk_Ann is one if the firm’s average
percentage quoted bid-ask spreads measured as [ask - bid]/bid over the 60 trading days
ending 11 days prior to the SEO announcement date is above the sample median and
otherwise zero.
Table 4-13 (Panel A) provides the regression results for PreCSCORE_IPO, Panel B for
PostCSCORE_IPO and Panel C for AnnCSCORE_SEO after controlling for selection
bias. As provided in Panel A, the coefficient on PreCSCORE_IPO is positive and
statistically significant at 1% in model 1 and at 5% in model 2. This is consistent with
the previous results that the firms adopting higher conservatism in the pre-IPO year
experience significantly less negative announcement returns. However, the coefficient
on the interaction terms PreCSCORE_IPO*DBidAsk_Ann in model 1 and
PreCSCORE_IPO*DVolatility_Ann in model 2 are not statistically significant,
indicating that the positive association between PreCSCORE_IPO and SEO
announcement returns do not significantly differ between firms with high and low
information asymmetry.

147
[Insert Table 4-13 here]
As reported in Table 4-13 (Panel B and C), the coefficients on PostCSCORE_IPO in
model 3 and 4, and the coefficients on AnnCSCORE_SEO in model 5 and 6 are positive,
but none of them are statistically significant, consistent with the results from the
previous analysis. The coefficients on the interaction terms are also not statistically
significant in model 3 to model 6, providing no evidence that the association between
PostCSCORE_IPO (AnnCSCORE_SEO) and the SEO announcement returns
significantly changes when the sample firms are divided into a high and low
information asymmetry group. For brevity, the results for the control variables are not
discussed here, as they are consistent with those obtained in Table 4-12.
4.5.4 IPO Conservatism and SEO Underpricing
To test the association between IPO conservatism and underpricing of IPO issuers’ first
SEO, equation (3) is estimated as provided in Section 4.3.3 of the thesis. Table 4-14
provides the correlation matrix for the variables used in the regressions. The correlation
between CSCORE measured in the IPO year (PostCSCORE_IPO) and CSCORE
measured in the year prior to the SEO issue (IssCSCORE_SEO) is 48% and is
statistically significant at 1%, indicating that firms adopting higher conservatism in the
IPO year tend to adopt conservative reporting in the year prior to the SEO issue.19
The
correlation between SEO_Underwriter and MV_SEO is 46% and statistically significant
at 1%, suggesting that larger firms tend to employ more prestigious underwriters for
19
PostCSCORE_IPO and IssCSCORE_SEO are not included in the same regression model.

148
their SEO, consistent with Carter and Manaster (1990) and Carter and Dark (1993). All
other variables do not report a high correlation.20
[Insert Table 4-14 here]
Table 4-15 provides the regression results. The inverse mills ratios (IMR) are obtained
from equation (1). The coefficient on IMR is positive and statistically significant at 1%
in model 1, suggesting that some unobservable factors affecting the firm’s decision to
go IPO increase the degree of underpricing it experiences in the first SEO. The
coefficients on IMR are not statistically significant in model 2 and 3.
The coefficient on PreCSCORE_IPO in model 1 is negative and statistically significant
at 1%, suggesting that the conservatism adopted by firms in the pre-IPO year is
negatively associated with the degree of underpricing at the SEO within five years of
the IPO. However, the coefficients on PostCSCORE_IPO and IssCSCORE_SEO are not
statistically significant in model 2 and 3. Kim and Park (2005) provide evidence that the
firms that opportunistically manage earnings through discretionary accruals prior to the
SEO experience larger underpricing. This finding may indicate that the conservatism
adopted by firms prior to the SEO issue is negatively associated with the degree of
underpricing at the SEO. However, the results of this thesis indicate that only the pre-
IPO year conservatism is significantly associated with the degree of SEO underpricing,
suggesting that issuers adopting a higher degree of conservatism prior to going public
obtain their next equity financing on more favorable terms, experiencing a smaller
degree of underpricing.
20
Because some of the reported correlations are high, each regression is tested for the VIF and the results
are provided in Appendix IV of the thesis. The results do not show any sign of multicollinearity.

149
[Insert Table 4-15 here]
Contrary to the prediction, the coefficient on CAR_6months is positive indicating a
positive association between a recent stock price increase prior to SEO and SEO
underpricing. However, it is statistically significant only at 10% in model 1. The
coefficient on NYSE is negative, indicating that the firms listed on the NYSE experience
less underpricing. However, it remains statistically significant at 5% only in model 1.
The coefficient on MV_SEO is negative and statistically significant at 10% in model 2
and at 5% in model 3, suggesting that a firm’s market value prior to the SEO is
inversely related to the degree of underpricing.
Prior research suggests that conservatism plays a more important role when there is
higher information asymmetry (LaFond & Watts 2008; García Lara et al. 2009; Lin &
Tian 2012). In particular, Kim and Park (2005) provide evidence that the negative
association between discretionary accruals and SEO underpricing becomes more
significant for issuers with high information asymmetry. Consistent with the previous
analysis, the regressions are re-estimated by employing two information asymmetry
measures: DVolatility_Issue and DBidAsk_Issue21
to test whether the effect of IPO
firms’ conservatism on the underpricing of their first SEO becomes stronger when there
is high information asymmetry.
The regression results with the effect of information asymmetry are provided in Table
4-16. Panel A provides the results for PreCSCORE_IPO, Panel B for
PostCSCORE_IPO and Panel C for IssCSCORE_SEO. Consistent with the results from
21
A description of these variables is provided in Table 4-1 of the thesis.
150
Table 4-15, the coefficient on PreCSCORE_IPO is negative and statistically significant
at 5% in Panel A. However, the coefficient on PreCSCORE_IPO*DVolatility_Issue and
PreCSCORE_IPO*DBidAsk_Issue is not statistically significant, indicating that the
association between PreCSCORE_IPO and SEO_Underpricing does not significantly
differ for issuers with high information asymmetry. Similarly, none of the main
variables of interest is statistically significant in Panel B and Panel C, providing no
evidence on the effect of PostCSCORE_IPO and IssCSCORE_SEO on SEO
underpricing regardless of the level of information asymmetry. The results for the
control variables do not significantly differ from those reported in Table 4-15, apart
from the statistically significant and positive coefficient on BidAsk_Issue which
suggests that the IPO issuers with higher information asymmetry experience larger SEO
underpricing. However, the coefficient remains statistically significant at 10% only in
model 2 in the PreCSCORE_IPO analysis.
[Insert Table 4-16 here]
151
4.5.5 IPO Conservatism and Long-Term Stock Return Performance after SEO
Quartile portfolio returns are calculated based on PreCSCORE_IPO,
PostCSCORE_IPO, and IssCSCORE_IPO to perform a univariate analysis for the IPO
issuers’ post-SEO stock return performance. Stock returns are calculated based on the
average monthly buy-and-hold (BHAR) and cumulative abnormal returns (CAR) for a
holding period of one, two and three years from the SEO issue month, excluding the
returns on the first trading day. Returns are adjusted for the monthly CRSP value-
weighted index returns. Q1 is the most conservative reporting portfolio and Q4 is the
least conservative reporting portfolio. Analysis for PreCSCORE_IPO is provided in
Panel A, PostCSCORE_IPO in Panel B and IssCSCORE_IPO in Panel C of Table 4-17.
As reported in Table 4-17, the mean BHAR and CAR reported across different holding
periods are all negative, consistent with previous studies reporting significant long-term
underperformance of SEO issuers (e.g., Loughran & Ritter 1995; Spiess & Affleck-
Graves 1995; Loughran & Ritter 1997; Teoh et al. 1998b). There appears to be no
systematic pattern across the quartile returns either for BHAR or CAR in
PreCSCORE_IPO analysis, as provided in Panel A. For the PostCSCORE_IPO quartile,
Q1 reports higher BHARs and CARs than Q4 for all three years of holding periods
although there is no monotonic decrease from Q1 to Q4. Similarly, for the
IssCSCORE_SEO quartile, both BHARs and CARs of Q1 are higher than those of Q4
(except for 1 year BHAR) across different holding periods. However, there appears to
be no systematic pattern across the quartiles. A multivariate analysis is also conducted
by running regression equation (4) to control for other effects on the long-term stock
return performance of issuers.

152
[Insert Table 4-17 here]
Table 4-18 provides the correlation matrix22
for the variables used in the regressions.
There is a relatively higher correlation between Cash_SEO and R&D at 51%
(significant at 1%), indicating that IPO issuers holding larger amounts of cash in the
SEO year tend to incur larger R&D expenditures. All other variables do not report a
high correlation.
[Insert Table 4-18 here]
Table 4-19 provides the regression results testing the association between
PreCSCORE_IPO and the long-term stock return performance after the SEO. The
dependent variable is the monthly BHAR in panel A and C and the monthly CAR in
Panel B and D. The monthly CRSP value-weighted index returns are used as the
benchmark returns in Panel A and B and the Fama-French size and market-to-book 5x5
portfolio returns are used as the benchmark returns in Panel C and D. The coefficient on
IMR is negative and statistically significant in the PreCSCORE_IPO analysis (except
for 3 year return regressions). The coefficient on PreCSCORE_IPO is positive and
statistically significant in all regressions but only in Panel A and C. Also, the
regressions with a one year return window do not yield statistically significant F-stats.
Accordingly, these results provide only weak evidence that issuers adopting a higher
degree of conservatism in the pre-IPO year tend to show higher stock returns in the
post-SEO market.
22
All regressions are tested for the VIF and the results are provided in Appendix IV of the thesis. The VIF
reported for each coefficient confirms that the regressions are not subject to multicollinearity.

153
[Insert Table 4-19 here]
Table 4-20 provides the regression results testing the association between
PostCSCORE_IPO and long-term post-SEO stock returns. Table 4-21 provides the
results for the IssCSCORE_SEO analysis. The coefficient on PostCSCORE_IPO is not
statistically significant in any regressions in Table 4-20. In Table 4-21, the coefficient
on IssCSCORE_SEO is negative in all regressions but remains statistically significant
only in Panel A and three year CAR regression in Panel B. Note that the reported F-
stats in some regressions are not statistically significant, in particular, Panel C and D of
Table 4-20 and Table 4-21. The fact that there is considerable time lag between the IPO
and the first SEO may reduce the statistical power of the regression analysis being
tested. In sum, the results from Table 4-19 provide weak evidence that the conservatism
adopted by issuers in the pre-IPO year is positively associated with their post-SEO
stock returns.
The coefficient on Asset_growth is negative and statistically significant (mainly in
Table 4-19 Panel A and C), providing weak evidence of a negative association between
the level of growth in a firm’s assets and its stock return performance (see Cooper et al.
2008). The coefficient on MV_SEO is positive and statistically significant in Panel A of
Table 4-20 and Panel A and B of Table 4-21, providing some evidence that the size of
the firm is positively associated with its post-SEO stock return performance. However,
the coefficient on MV_SEO is negative in Table 4-19, but is statistically significant only
when two years of return window is under analysis.
[Insert Table 4-20 here]

154
[Insert Table 4-21 here]
4.6 Summary and Conclusions
This chapter investigated whether the extent of conservatism adopted by IPO issuers is
significantly associated with the probability of reissuing equity soon after their IPO. It
also tested whether IPO conservatism is significantly associated with SEO
announcement returns and SEO underpricing. This chapter also provided analysis of
post-SEO long-term stock return performance associated with IPO conservatism.
The results of this chapter provide evidence that issuers adopting higher conservatism in
the IPO year are less likely to reissue equity soon after their IPO. In particular, there
was no evidence found that the issuers with higher IPO conservatism raise external
funds through divestment, supporting the view that the IPO firms reporting more
conservatively do not have near-term cash needs soon after they raise the IPO proceeds.
This chapter also finds that the extent of conservatism adopted by IPO issuers in the
pre-IPO year is positively associated with the announcement returns at their first SEO.
Also, evidence is presented that firms with higher conservatism in the pre-IPO year
experience a less degree of underpricing in their first SEO. Taken together, these results
suggest that issuers reporting more conservatively in the pre-IPO year raise the next
equity financing on more favorable terms. Finally, the results in this chapter provide
weak evidence that issuers with higher conservatism in the pre-IPO year tend to show
higher post-SEO stock returns.

155
In summary, the findings of this chapter provide evidence that issuers reporting more
conservatively prior to going public are more likely to raise their next equity financing
on more favorable terms by experiencing less negative SEO announcement returns and
smaller SEO underpricing. The results also show that the previously reported
association between earnings conservatism prior to the SEO issue and the profitability
of SEO may not hold for firms reissuing soon after their IPO. For these issuers, the
evidence suggests that the quality of accounting earnings reported prior to the IPO may
signal more important information to investors.
In the next chapter, this thesis examines the association between IPO conservatism and
the longevity of IPO firms.

156
4.7 Tables
Table 4-1: Variable Description
Variable Definition
PreCSCORE_IPOi CSCORE measured in the pre-IPO fiscal year.
PostCSCORE_IPOi CSCORE measured in the IPO fiscal year.
AnnCSCORE_SEOi CSCORE measured in the pre-SEO announcement year.
IssCSCORE_SEOi CSCORE measured in the pre-SEO issue year.
AFTRETi,t Cumulative market-adjusted (CRSP value weighted index) stock returns in the
20-trading day periods after the IPO.
Agei,t Firm age in year t.
Asset_growthi,t Lagged changes in total assets measured in year t where year t is the SEO issue
year.
Avr_Underpricingi,t
An average IPO initial return during the same month as the SEO, where
monthly IPO underpricing estimates are obtained from Jay Ritter's Website at
<http://bear.cba.ufl.edu/ritter/ipoall.htm>.
BidAsk_Anni,t Average of percentage quoted bid-ask spreads measured as [ask - bid]/bid over
the 60 trading days ending 11 days prior to the SEO announcement date.
BidAsk_Issuei,t Average of percentage quoted bid-ask spreads measured as [ask - bid]/bid over
the 60 trading days ending 11 days prior to the date in which SEO is issued.
CARi,t
Three day market-adjusted cumulative abnormal stock returns measured in
days -1 through +1 where day 0 is the SEO announcement date and the market
return is the CRSP value weighted index returns.
CAR_6monthsi,t
Cumulative market-adjusted return over 6 months ending the day prior to the
issue, where market return is defined as the return on the CRSP value-weighted
index.
Cashi,t Cash and marketable securities divided by beginning total assets measured in
year t where year t is the IPO-year.
Cash_SEOi,t Cash and marketable securities divided by beginning total assets measured in
year t where year t is the SEO issue year.
DBidAsk_Anni,t
A dummy variable that takes the value of one if a firm’s average bid-ask
spreads measured as [ask - bid]/bid over the 60 trading days ending 11 days
prior to the SEO announcement date is above the sample median and otherwise
zero.
DBidAsk_Issuei,t
A dummy variable that takes the value of one if a firm’s average bid-ask
spreads measured as [ask - bid]/bid over the 60 trading days ending 11 days
prior to the date in which SEO is issued is above the sample median and
otherwise zero.
DVolatility_Anni,t
A dummy variable that takes the value of one if a firm’s daily stock return
volatility over the 60 trading days ending 11 days prior to the SEO
announcement is above the sample median and otherwise zero.
DVolatility_Issuei,t
A dummy variable that takes the value of one if a firm’s daily stock return
volatility over the 60 trading days ending 11 days prior to the SEO issue is
above the sample median and otherwise zero.
IMRi,t Inverse mills ratio obtained from equation (1) as provided in Section 4.3.1 of
the thesis.

157
Table 4-1
(Continued)
Variable Definition
IPO_Underpricingi,t The percentage difference between the offer price and the closing price on the
first day of trading.
IPO_Underwriteri,t A ranking of the reputation of the lead underwriter on a 0-9 scale obtained from
the Jay Ritter's website <http://bear.warrington.ufl.edu/ritter/ipodata.htm>.
Levi,t Total debts divided by beginning total assets measured in year t where year t is
the IPO-year.
Mrunupi,t Daily compounded market returns in the 60 trading days before the SEO
offering announcement.
MV_SEOi,t Logarithm of market capitalization on the day prior to the SEO offer defined as
the number of shares outstanding, multiplied by the price.
NYSEi,t An indicator variable that equals one if the firm was listed on NYSE at the
time of the offer and otherwise zero.
R&Di,t Research and development expenditure divided by beginning total assets
measured in year t where year t is the SEO issue year.
Relsizei,t Size of the SEO as a fraction of the IPO size.
Runupi,t Daily compounded individual stock returns in the 60 trading days before the
offering announcement.
SEO_Underpricingi,t Closing price on the SEO offer day minus the offer price divided by the offer
price.
SEO_Underwriteri,t SEO's underwriter’s reputation measures from the Jay Ritter's website
<http://bear.warrington.ufl.edu/ritter/ipodata.htm>.
Time_IPOi,t Log of the number of days between the IPO and the first SEO.
Tobin's qi,t Tobins'q measured in year t where year t is the IPO year.
Volatility_Anni,t Standard deviation of daily stock returns over the 60 trading days ending 11
days prior to the SEO announcement.
Volatility_Issuei,t Standard deviation of daily stock returns over the 60 trading days ending 11
days prior to the SEO issue.

158
Table 4-2: Descriptive Statistics
Panel A. Pre-IPO Year Variables
Variables mean median stdev 5th
percentile
95th
percentile obs
PreCSCORE_IPO 0.887 0.757 0.535 0.158 1.837 313
Cash 0.184 0.087 0.224 0.002 0.734 432
Lev 0.650 0.636 0.455 0.030 1.324 313
Panel B. IPO Year Variables
PostCSCORE_IPO 0.595 0.524 0.286 0.290 1.204 437
AFTRET 0.001 -0.002 0.168 -0.277 0.246 437
Age 1.014 0.954 0.385 0.477 1.747 435
Cash 0.244 0.155 0.247 0.007 0.821 434
IPO_Underpricing 0.132 0.065 0.224 -0.069 0.500 436
IPO_Underwriter 7.561 8.000 1.872 3.000 9.000 437
Lev 0.323 0.255 0.246 0.042 0.837 437
Tobin's q 2.770 2.125 2.621 0.527 6.939 431
Panel C. SEO Related Variables
Variables mean median stdev 5th
percentile
95th
percentile obs
AnnCSCORE_SEO 0.610 0.542 0.300 0.254 1.172 416
IssCSCORE_SEO 0.603 0.542 0.291 0.249 1.152 416
Asset_growth 0.944 0.346 1.799 -0.207 4.396 415
Avr_Underpricing 0.215 0.169 0.192 0.062 0.696 421
BidAsk_Ann 0.052 0.048 0.023 0.022 0.095 427
BidAsk_Issue 0.051 0.047 0.025 0.020 0.095 429
CAR_6months 0.431 0.347 0.649 -0.507 1.605 437
Cash_SEO 0.308 0.201 0.300 0.003 0.884 416
Mrunup 0.051 0.049 0.058 -0.044 0.155 416
MV_SEO 19.395 19.379 1.098 17.607 21.259 426
NYSE 0.140 0.000 0.35 0.00 1.00 437
R&D 0.171 0.101 0.209 0.000 0.640 220
Relsize 1.814 1.471 1.371 0.375 4.140 437
Runup 0.375 0.262 0.486 -0.114 1.334 437
SEO_Underpricing 0.032 0.019 0.047 -0.017 0.123 435
SEO_Underwriter 7.688 8.000 1.940 3.000 9.000 437
Volatility_Ann 0.038 0.034 0.015 0.019 0.071 426
Volatility_Issue 0.038 0.035 0.017 0.019 0.069 429
All continuous variables are winsorized at the 1st and 99
th percentiles .A description of each variable is provided
in Table 4-1. Panel A presents descriptive statistics for the variables measured in the pre-IPO and IPO year and
Panel B reports descriptive statistics for the variables measured in the SEO announcement and issue year.

159
Table 4-3: IPO Firms’ Accounting Conservatism and the Probability of Issuing a
Seasoned Equity Offering
Panel A. PreCSCORE_IPO and No of SEO Issuers within n years after IPO
Quartile Mean
CSCORE
1 Year
after
IPO
2 Years
after
IPO
3 Years
after
IPO
4 Years
after
IPO
5 Years
after
IPO
Frequent
Issuers
(>1)
No of IPO
Firms
Q1 1.62 27 53 61 70 76 36 215
Q2 1.03 34 54 63 63 66 26 215
Q3 0.70 44 63 70 73 77 24 214
Q4 0.39 53 74 84 90 94 46 214
Total Obs 158 244 278 296 313 132 858
Panel B. PostCSCORE_IPO and No of SEO Issuers within n years after IPO
Quartile Mean
CSCORE
2 Years
after
IPO
3 Years
after
IPO
4 Years
after
IPO
5 Years
after
IPO
Frequent
Issuers
(>1)
No of IPO
Firms
Q1 1.19 29 45 54 62 26 482
Q2 0.67 59 81 98 108 34 481
Q3 0.51 59 96 115 124 48 481
Q4 0.37 76 115 132 143 42 481
Total Obs 223 337 399 437 150 1925
Firms that went IPO during the period 1990 - 2005 are sorted into quartiles based on PreCSCORE_IPO (Panel
A) and PostCSCORE_IPO (Panel B). The first quartile (Q1) is the most conservative earnings reporting group
and the fourth quartile (Q4) is the least conservative earnings reporting group. Panel A shows the association
between the pre-IPO year CSCORE (PreCSCORE_IPO) and the probability of issuing a SEO within one to
five years after the IPO. Panel B reports the association between the IPO year CSCORE (PostCSCORE_IPO)
and the probability of issuing a SEO within two to five years after the IPO.

160
Table 4-4: Pearson Correlation Matrix for the Regression Analysis for PreCSCORE_IPO and the Probability of Issuing a SEO
PreCSCORE_IPOi Agei,t AFTRETi,t IPO_Underpricingi,t IPO_Underwriteri,t Cashi,t-1 Tobin's qi,t
PreCSCORE_IPOi Agei,t -0.135***
AFTRETi,t -0.081** 0.014
IPO_Underpricingi,t 0.065* -0.217*** -0.017
IPO_Underwriteri,t -0.012 0.076** 0.035 0.142***
Cashi,t-1 0.199*** -0.308*** -0.055 0.272*** 0.143***
Tobin's qi,t 0.070* -0.225*** 0.187*** 0.383*** 0.065* 0.246***
Levi,t-1 0.109*** 0.132*** -0.030 -0.072** -0.122*** -0.323*** -0.028
The accounting variables used for the PreCSCORE_IPO regression analysis are obtained from the pre-IPO fiscal year since PreCSCORE_IPO is also
measured over the pre-IPO year. *** indicates significance at 1%. **indicates significance at 5%. * indicates significance at 10%. All continuous
variables are winsorized at the 1st and 99
th percentiles. A description of each variable is provided in Table 4-1.

161
Table 4-5: Pearson Correlation Matrix for the Regression Analysis for PostCSCORE_IPO and the Probability of Issuing
a SEO
PostCSCORE_IPOi Agei,t AFTRETi,t IPO_Underpricingi,t IPO_Underwriteri,t Cashi,t Tobin's qi,t
PostCSCORE_IPOi Agei,t -0.163***
AFTRETi,t -0.112*** 0.009
IPO_Underpricingi,t 0.254*** -0.173*** -0.056**
IPO_Underwriteri,t 0.006 0.130*** 0.002 0.115***
Cashi,t 0.188*** -0.256*** 0.032 0.222*** -0.034
Tobin's qi,t 0.180*** -0.217*** 0.217*** 0.440*** 0.090*** 0.351***
Levi,t 0.005 0.270*** 0.005 -0.214*** 0.003 -0.445*** -0.300***
The accounting variables used for the PostCSCORE_IPO regression analysis are obtained from the IPO fiscal year as PostCSCORE_IPO is also measured
over the IPO year. *** indicates significance at 1%. **indicates significance at 5%. * indicates significance at 10%. All continuous variables are winsorized at
the 1st and 99
th percentiles. A description of each variable is provided in Table 4-1

162
Table 4-6: The Regression Analysis of PreCSCORE_IPO and the Probability of
Issuing a SEO
Dependent Variable
Independent
Variable SEO_1 SEO_2 SEO_3 SEO_4 SEO_5
SEO_
Frequent
PreCSCORE_IPOi -0.295 -0.084 -0.104 -0.085 -0.105 0.007
(-1.311) (-0.607) (-0.789) (-0.673) (-0.854) (0.045)
Cashi,t-1 -1.246** -0.274 -0.259 -0.318 -0.352 -0.244
(-2.483) (-0.788) (-0.845) (-1.082) (-1.226) (-0.706)
Levi,t-1 0.239 0.107 0.073 0.026 0.056 0.035
(1.248) (0.688) (0.521) (0.191) (0.413) (0.220)
AFTRETi,t 1.120 0.444 0.219 0.262 0.006 0.322
(1.275) (1.473) (0.758) (0.963) (0.024) (0.921)
Agei,t 0.256 0.145 0.058 0.025 0.050 0.249
(0.860) (0.801) (0.339) (0.151) (0.312) (1.209)
IPO_Underpricingi,t -0.860 -0.336* -0.310* -0.330* -0.378** -0.402
(-1.340) (-1.723) (-1.709) (-1.956) (-2.276) (-1.298)
IPO_Underwriteri,t 0.054 0.099** 0.098*** 0.102*** 0.080** 0.026
(0.495) (2.327) (2.650) (2.879) (2.333) (0.656)
Tobin's qi,t 0.059 0.018 0.009 0.001 0.019 0.011
(1.356) (0.809) (0.437) (0.071) (0.974) (0.438)
Constant -2.779*** -1.878*** -1.598*** -1.437*** -1.214*** -1.701***
(-2.651) (-4.368) (-3.983) (-3.690) (-3.218) (-3.920)
Year Dummies Yes Yes Yes Yes Yes Yes
Industry Fixed
Effects Yes Yes Yes Yes Yes Yes
χ2 35.652*** 57.378*** 69.950*** 68.752*** 66.549*** 64.190***
Pseudo_R2 15.3% 10.1% 9.8% 9.4% 9.3% 13.8%
Obs 683 683 683 683 683 683
This table reports the results of regression analysis testing the association between the PreCSCORE_IPO
and the probability of issuing a SEO within one to five years subsequent to the IPO. The dependent
variable is a binary variable SEO_n (where n=1 to 5) that is one if the IPO firm issued a SEO within n
years subsequent to the IPO and otherwise zero. SEO_Frequent is also a binary indicator that is one if the
IPO firm issued a SEO more than once within five years subsequent to the IPO and otherwise zero. The
accounting variables used (Cash and Lev) in the regression analysis are measured in the same period in
which the conservatism (CSCORE) is measured for consistency. A description of each variable is
provided in Table 4-1. *** indicates significance at 1%. **indicates significance at 5%. * indicates
significance at 10%. All continuous variables are winsorized at the 1st and 99
th percentiles.

163
Table 4-7: The Regression Analysis of PostCSCORE_IPO and the Probability of
Issuing a SEO
Dependent Variable
Independent
Variable SEO_2 SEO_3 SEO_4 SEO_5
SEO_
Frequent
PostCSCORE_IPOi -0.703*** -0.854*** -0.853*** -0.803*** -0.530***
(-4.282) (-5.562) (-5.891) (-5.756) (-2.980)
Cashi,t -0.497*** -0.315* -0.180 -0.188 -0.194
(-2.701) (-1.869) (-1.111) (-1.203) (-0.907)
Levi,t 0.182 0.355* 0.363** 0.299* 0.546**
(0.928) (1.921) (2.007) (1.679) (2.499)
AFTRETi,t 0.241 0.137 0.055 -0.038 -0.099
(1.167) (0.711) (0.295) (-0.204) (-0.385)
Agei,t -0.042 -0.094 -0.146 -0.099 0.032
(-0.426) (-1.024) (-1.642) (-1.134) (0.270)
IPO_Underpricingi,t -0.337** -0.395** -0.473*** -0.497*** -0.357
(-2.163) (-2.566) (-3.224) (-3.559) (-1.494)
IPO_Underwriteri,t 0.035* 0.045*** 0.059*** 0.062*** 0.027
(1.841) (2.597) (3.470) (3.758) (1.211)
Tobin's qi,t 0.030* 0.023 0.011 0.018 0.006
(1.848) (1.483) (0.693) (1.201) (0.258)
Constant -0.838*** -0.691*** -0.588*** -0.616*** -1.520***
(-3.800) (-3.368) (-2.995) (-3.218) (-5.687)
Year Dummies Yes Yes Yes Yes Yes
Industry Fixed
Effects Yes Yes Yes Yes Yes
χ2 86.999*** 119.666*** 132.249*** 140.112*** 105.013***
Pseudo_R2 5.5% 6.9% 7.3% 7.5% 9.6%
Obs 1888 1888 1888 1888 1888
This table reports the results of regression analysis testing the association between the
PostCSCORE_IPO and the probability of issuing a SEO within two to five years subsequent
to the IPO. The dependent variable is a binary indicator SEO_n (where n=2 to 5) that is one if
the IPO firm issued a SEO within n years subsequent to the IPO and otherwise zero.
SEO_Frequent is also a binary variable that is one if the IPO firm issued a SEO more than
once within five years subsequent to the IPO and otherwise zero. The accounting variables
used (Cash and Lev) in the regression analysis are measured in the same period in which the
conservatism (CSCORE) is measured for consistency. A description of each variable is
provided in Table 4-1. *** indicates significance at 1%. **indicates significance at 5%. *
indicates significance at 10%. All continuous variables are winsorized at the 1st and 99
th
percentiles.

164
Table 4-8: The Regression Analysis of PreCSCORE_IPO and the
Probability of Divestment
Dependent Variable
Independent
Variable Div_1 Div_2 Div_3 Div_4 Div_5
PreCSCORE_IPOi -0.298 -0.211 -0.103 -0.119 -0.084
(-1.162) (-1.221) (-0.706) (-0.852) (-0.600)
Cashi,t-1 -0.109 0.152 0.268 0.299 0.438
(-0.337) (0.484) (0.955) (1.100) (1.637)
Levi,t-1 -0.076 -0.074 -0.043 -0.107 -0.126
(-0.337) (-0.423) (-0.274) (-0.691) (-0.854)
AFTRETi,t 0.456 -0.382 -0.397 -0.404 -0.388
(1.084) (-1.182) (-1.373) (-1.435) (-1.384)
Agei,t -0.045 -0.454** -0.495*** -0.530*** -0.534***
(-0.149) (-2.089) (-2.578) (-2.870) (-2.963)
IPO_Underpricingi,t -0.294 -0.232 -0.180 -0.216 -0.244
(-0.893) (-1.040) (-1.058) (-1.303) (-1.560)
IPO_Underwriteri,t 0.032 0.063 0.067* 0.065* 0.064*
(0.521) (1.466) (1.714) (1.730) (1.825)
Tobin's qi,t 0.038* 0.003 -0.009 -0.009 0.001
(1.648) (0.112) (-0.433) (-0.456) (0.058)
Constant -1.623** -1.097** -0.995** -0.760* -0.734**
(-2.498) (-2.511) (-2.445) (-1.957) (-1.985)
Year Dummies Yes Yes Yes Yes Yes
Industry Fixed
Effects Yes Yes Yes Yes Yes
χ2 15.285 24.603** 18.300 22.594* 27.185**
Pseudo_R2 4.6% 4.9% 3.4% 3.8% 4.1%
Obs 683 683 683 683 683
This table reports the results of regression analysis testing the association between the
PreCSCORE_IPO and the probability of divestment within one to five years subsequent to the
IPO. The dependent variable is a binary variable Div_n (where n=1 to 5) that is one if the IPO
firm had a divesture within n years subsequent to the IPO and otherwise zero. The accounting
variables used (Cash and Lev) in the regression analysis are measured in the same period in
which the conservatism (CSCORE) is measured for consistency. A description of each variable
is provided in Table 4-1. *** indicates significance at 1%. **indicates significance at 5%. *
indicates significance at 10%. All continuous variables are winsorized at the 1st and 99
th
percentiles.

165
Table 4-9: The Regression Analysis of PostCSCORE_IPO and the
Probability of Divestment
Dependent Variable
Independent
Variable Div_2 Div_3 Div_4 Div_5
PostCSCORE_IPOi -1.476*** -0.582 -0.736** -0.904**
(-2.595) (-1.577) (-2.052) (-2.553)
Cashi,t 0.846* 0.461 0.244 0.023
(1.856) (1.265) (0.706) (0.069)
Levi,t 0.305 -0.054 -0.258 -0.227
(0.569) (-0.119) (-0.559) (-0.522)
AFTRETi,t 0.645 -0.391 -0.562 -0.519
(0.999) (-0.699) (-1.102) (-1.063)
Agei,t -0.042 -0.130 -0.262 -0.422*
(-0.120) (-0.513) (-1.109) (-1.825)
IPO_Underpricingi,t -0.374 -0.473 -0.653 -0.859*
(-0.554) (-1.126) (-1.432) (-1.893)
IPO_Underwriteri,t -0.117** -0.056 -0.038 -0.021
(-2.550) (-1.378) (-0.944) (-0.521)
Tobin's qi,t 0.014 0.037 0.039 0.051*
(0.312) (1.087) (1.201) (1.654)
Constant -0.312 -0.657 -0.337 -0.107
(-0.524) (-1.426) (-0.739) (-0.237)
Year Dummies Yes Yes Yes Yes
Industry Fixed
Effects Yes Yes Yes Yes
χ2 23.457** 10.579 11.843 17.344*
Pseudo_R2 10.3% 3.8% 4.2% 5.5%
Obs 1888 1888 1888 1888
This table reports the results of regression analysis testing the association
between the PostCSCORE_IPO and the probability of divestment within two to
five years subsequent to the IPO. The dependent variable is a binary variable
Div_n (where n=2 to 5) that is one if the IPO firm had a divesture within n years
subsequent to the IPO and otherwise zero. The accounting variables used (Cash
and Lev) in the regression analysis are measured in the same period in which the
conservatism (CSCORE) is measured for consistency. Description of each
variable is provided in Table 4-1. *** indicates significance at 1%. **indicates
significance at 5%. * indicates significance at 10%. All continuous variables are
winsorized at the 1st and 99
th percentiles.

166
Table 4-10: IPO Firms’ Accounting Conservatism and the SEO Announcement
Returns
Panel A. PreCSCORE_IPO and SEO Announcement CAR
Quartile PreCSCORE_IPO CAR (-1, 1) obs
Q1 1.62 -3.57% 78
Q2 0.98 -4.84% 78
Q3 0.65 -3.87% 78
Q4 0.32 -3.86% 79
All -4.04% 313
Panel B. PostCSCORE_IPO and SEO Announcement CAR
Quartile PostCSCORE_IPO CAR (-1, 1) obs
Q1 0.97 -3.61% 108
Q2 0.59 -2.81% 108
Q3 0.48 -3.47% 108
Q4 0.34 -2.69% 109
All -3.15% 433
Panel C. AnnCSCORE_SEO and SEO Announcement CAR
Quartile AnnCSCORE_SEO CAR (-1, 1) obs
Q1 1.02 -4.45% 103
Q2 0.62 -3.49% 103
Q3 0.48 -2.95% 103
Q4 0.31 -2.16% 104
All -3.26% 413
A description of each variable is provided in Table 4-1. CAR (-1,1) is the
three day market-adjusted cumulative abnormal stock returns measured in
days -1 through +1 around the SEO announcement. PreCSCORE_IPO is
CSCORE measured in the pre-IPO year. PostCSCORE_IPO is CSCORE
measured in the IPO year. AnnCSCORE_SEO is CSCORE measured in the
year prior to the first SEO announcement. CRSP value-weighted index
returns are used as the mark returns. All continuous variables are winsorized
at the 1st and 99
th percentiles.

167
Table 4-11: Pearson Correlation Matrix for the Regression Analysis of SEO Announcement Returns
PreCSCORE_
IPOi
PostCSCORE
_IPOi
AnnCSCORE_
SEOi
Volatility_
Anni,t Runupi,t Mrunupi,t SEO_Underwriteri,t Time_IPOi,t Relsizei,t
PreCSCORE
_IPOi
PostCSCORE
_IPOi 0.422***
AnnCSCORE
_SEOi 0.114 0.516***
Volatility
_Anni,t 0.051 0.153*** 0.295***
Runupi,t -0.059 0.030 0.139*** 0.426***
Mrunupi,t -0.060 -0.063 -0.120*** -0.046 0.298***
SEO_Underw
riteri,t -0.031 -0.006 0.017 -0.094** 0.027 0.070
Time_IPOi,t 0.053 0.068 0.159*** 0.105** 0.093** -0.025 -0.062
Relsizei,t -0.085 -0.076* 0.062 0.133*** 0.197*** 0.064 0.025 0.057
IPO_Underpr
icingi,t 0.043* 0.254*** 0.131*** 0.180*** 0.016 0.058 0.049 -0.020 0.121***
A description of each variable is provided in Table 4-1. All continuous variables are winsorized at the 1st and 99
th percentiles. *** indicates significance at 1%. **indicates
significance at 5%. * indicates significance at 10%.

168
Table 4-12: Regression Analysis Examining the Association between CSCOREs and
SEO Announcement Returns
Independent
Variable Dependent Variable: CAR(-1,1)
Model 1 Model 2 Model 3
PreCSCORE_IPOi 0.023**
(2.244)
PostCSCORE_IPOi 0.005
(0.335)
AnnCSCORE_SEOi
0.008
(0.676)
Volatility_Anni,t -0.048 -0.312 -0.229
(-0.219) (-1.302) (-0.926)
Runupi,t -0.026*** -0.016** -0.021***
(-3.242) (-2.172) (-2.929)
Mrunupi,t 0.222*** 0.130** 0.206***
(3.535) (2.269) (3.388)
SEO_Underwriteri,t -0.001 0.001 -0.001
(-0.455) (0.410) (-0.611)
Time_IPOi,t 0.014 0.007 0.002
(1.405) (0.588) (0.127)
Relsizei,t 0.004 -0.001 -0.001
(1.127) (-0.543) (-0.443)
Avr_Underpricingi,t -0.039** 0.003 0.010
(-2.240) (0.216) (0.617)
IMRi -0.140** 0.025 -0.016
(-2.143) (0.239) (-0.205)
Constant -0.006 -0.072 -0.025
(-0.125) (-0.939) (-0.355)
Year Dummies Yes Yes Yes
Industry Fixed Effects Yes Yes Yes
F-Stats 2.689*** 1.746** 2.091***
Adj. R2 13.1% 6.1% 8.0%
Obs 284 416 377
This table reports the results of regression analysis testing the
association between the PreCSCORE_IPO, PostCSCORE_IPO and
AnnCSCORE_SEO and the SEO announcement returns. The dependent
variable is CAR(-1,1): the SEO announcement returns measured as the
three-day market (CRSP value-weighted index) adjusted cumulative
abnormal stock returns measured in days -1 through +1 around the SEO
announcement. A description of each variable is provided in Table 4-1.
*** indicates significance at 1%. **indicates significance at 5%. *
indicates significance at 10%. All continuous variables are winsorized at
the 1st and 99
th percentiles.

169
Table 4-13: Regression Analysis Examining the Association between CSCOREs and
SEO Announcement Returns with the Effect of Information Asymmetry
Panel A. CSCORE in
the pre-IPO year
Panel B. CSCORE in the
IPO year
Panel C. CSCORE in
the pre-SEO year
Model 1 Model 2 Model 3 Model 4 Model 5 Model 6
PreCSCORE_IPOi 0.030*** 0.028**
(2.677) (2.528)
PostCSCORE_IPOi 0.002 0.005
(0.082) (0.187)
AnnCSCORE_SEOi 0.007 0.010
(0.387) (0.542)
DBidAsk_Anni,t 0.014 0.008 0.006
(0.923) (0.536) (0.389)
DVolatility_Anni,t -0.004 0.001 0.004
(-0.293) (0.093) (0.231)
PreCSCORE_IPOi
*DBidAsk_Anni,t -0.020
(-1.451)
PreCSCORE_IPOi
*DVolatility_Anni,t -0.012
(-0.897)
PostCSCORE_IPOi
*DBidAsk_Anni,t -0.011
(-0.448)
PostCSCORE_IPOi
*DVolatility_Anni,t -0.011
(-0.467)
AnnCSCORE_SEOi
*DBidAsk_Anni,t -0.013
(-0.592)
AnnCSCORE_SEOi
*DVolatility_Anni,t -0.016
(-0.690)
Runupi,t -0.019*** -0.016** -0.021*** -0.019*** -0.019*** -0.018***
(-2.900) (-2.368) (-3.519) (-3.136) (-2.789) (-2.650)
Mrunupi,t 0.162*** 0.157*** 0.141*** 0.137*** 0.194*** 0.194***
(3.075) (2.986) (2.729) (2.650) (3.115) (3.146)
SEO_Underwriteri,t -0.002 -0.002 0.001 0.001 0.000 0.001
(-1.000) (-1.133) (0.439) (0.326) (0.251) (0.293)
Time_IPOi,t 0.014 0.013 0.012 0.012 0.001 0.000
(1.536) (1.512) (1.046) (1.000) (0.030) (0.017)
Relsizei,t 0.000 0.001 -0.001 -0.001 0.001 0.001
(0.078) (0.354) (-0.650) (-0.621) (0.470) (0.462)
IPO_Underpricingi,t -0.018** -0.016* -0.033* -0.031 -0.034* -0.033*
(-2.082) (-1.810) (-1.679) (-1.564) (-1.743) (-1.747)
IMRi -0.157** -0.151** 0.062 0.060 0.023 0.033
(-2.480) (-2.407) (0.521) (0.510) (0.242) (0.347)
Constant 0.007 0.010 -0.115 -0.111 -0.063 -0.070
(0.162) (0.221) (-1.368) (-1.324) (-0.764) (-0.841)
Year Dummies Yes Yes Yes Yes Yes Yes

170
Table 4-13
(continued)
Panel A. CSCORE in
the pre-IPO year
Panel B. CSCORE in the
IPO year
Panel C. CSCORE in
the pre-SEO year
Model 1 Model 2 Model 3 Model 4 Model 5 Model 6
Industry Fixed Effects Yes Yes Yes Yes Yes Yes
F-Stats 2.481*** 2.619*** 2.143*** 2.177*** 2.072*** 2.121***
Adj. R2 11.6% 12.2% 7.9% 8.0% 8.7% 8.9%
Obs 284 284 416 416 377 377
This table reports the results of regression analysis testing the association between CSCOREs and the SEO
announcement returns with the effect of information asymmetry. The dependent variable is CAR (-1,1): the
SEO announcement returns measured as the three-day market (CRSP value-weighted index) adjusted
cumulative abnormal stock returns measured in days -1 through +1 around the SEO announcement. Panel A
provides the results for the PreCSCORE_IPO, Panel B for the PostCSCORE_IPO and Panel C for the
AnnCSCORE_SEO analysis. A description of each variable is provided in Table 4-1. *** indicates significance
at 1%. **indicates significance at 5%. * indicates significance at 10%. All continuous variables are winsorized
at the 1st and 99
th percentiles.

171
Table 4-14: Pearson Correlation Matrix for the Regression Analysis of SEO Underpricing
SEO_
Underpricingi,t
PreCSCORE
_IPOi
PostCSCORE
_IPOi
IssCSCORE
_SEOi
Volatility
_Issuei,t
CAR
_6monthsi,t
SEO
_Underwriteri,t Relsizei,t
AVR
_Underpricingi,t NYSEi,t
SEO_Underpricingi,t
PreCSCORE_IPOi 0.031
PostCSCORE_IPOi 0.081* 0.422***
IssCSCORE_SEOi 0.036 0.098 0.482***
Volatility_Issuei,t 0.086* 0.020 0.143*** 0.318***
CAR_6monthsi,t 0.054 0.015 0.063 0.120** 0.354***
SEO_Underwriteri,t -0.115** -0.036 -0.006 0.0122 -0.082* 0.050
Relsizei,t -0.024 -0.078 -0.076* 0.067 0.169*** 0.210*** 0.025
AVR_Underpricingi,t 0.004 -0.155*** -0.076* 0.184*** 0.251*** 0.045 0.066 0.203***
NYSEi,t -0.076* -0.220*** -0.173*** -0.1022** -0.279*** -0.081* 0.130*** -0.139*** 0.049
MV_SEOi,t -0.134*** -0.067 0.047 0.123** -0.007 0.146*** 0.459*** 0.143*** 0.159*** 0.334**
A description of each variable is provided in Table 4-1. All continuous variables are winsorized at the 1st and 99th percentiles. *** indicates significance at 1%. **indicates significance at 5%. *
indicates significance at 10%

172
Table 4-15: Regression Analysis Examining the Association between the CSCOREs
and SEO Underpricing
Independent
Variable
Dependent Variable:
SEO_Underpricing
Model 1 Model 2 Model 3
PreCSCORE_IPOi -0.018***
(-2.616)
PostCSCORE_IPOi 0.016
(1.540)
IssCSCORE_SEOi
0.005
(0.700)
Volatility_Issuei,t -0.068 0.050 0.242
(-0.432) (0.293) (1.464)
CAR_6monthsi,t 0.007* 0.003 -0.003
(1.690) (0.722) (-1.017)
SEO_Underwriteri,t -0.003 -0.002 -0.002
(-1.392) (-1.248) (-1.309)
Relsizei,t 0.001 0.000 0.001
(0.331) (0.151) (0.495)
AVR_Underpricingi,t -0.011 0.011 0.016
(-1.228) (0.991) (1.315)
NYSEi,t -0.011** -0.001 0.003
(-2.057) (-0.268) (0.574)
MV_SEOi,t 0.002 -0.005* -0.005**
(1.024) (-1.889) (-2.117)
IMRi 0.123*** -0.031 0.001
(2.697) (-0.503) (0.022)
Constant -0.036 0.144** 0.131**
(-0.657) (2.535) (2.407)
Year Dummies Yes Yes Yes
Industry Fixed
Effects Yes Yes Yes
F-Stats 2.475*** 2.103*** 2.821***
Adj. R2 12.7% 9.5% 11.0%
Obs 313 411 361
This Table reports the results of regression analysis testing
the association between the PreCSCORE_IPO,
PostCSCORE_IPO and IssCSCORE_SEO and SEO
underpricing. The dependent variable is the
SEO_Underpricing measured as the closing price on the SEO
offer day minus the offer price divided by the offer price. A
description of each variable is provided in Table 4-1. ***
indicates significance at 1%. **indicates significance at 5%.
* indicates significance at 10%. All continuous variables are
winsorized at the 1st and 99
th percentiles.

173
Table 4-16: Regression Analysis Examining the Association between CSCOREs and
SEO Underpricing with the Effect of Information Asymmetry
Panel A. CSCORE
in the pre-IPO year
Panel B. CSCORE in
the IPO year
Panel C. CSCORE in
the pre-SEO year
Model 1 Model 2 Model 3 Model 4 Model 5 Model 6
PreCSCORE_IPOi -0.015** -0.014**
(-1.982) (-2.027)
PostCSCORE_IPOi 0.024 0.025
(1.488) (1.559)
IssCSCORE_IPOi 0.006 0.005
(0.707) (0.583)
DVolatility_Issuei,t 0.003 0.006 0.003
(0.329) (0.629) (0.375)
DBidAsk_Issuei,t 0.018* 0.009
0.004
(1.799) (0.805)
(0.420)
PreCSCORE_IPOi
*DVolatility_Issuei,t -0.007
(-0.886)
PreCSCORE_IPOi
*DBidAsk_Issuei,t -0.009
(-1.104)
PostCSCORE_IPOi
*DVolatility_Issuei,t -0.011
(-0.704)
PostCSCORE_IPOi
*DBidAsk_Issuei,t -0.012
(-0.752)
IssCSCORE_SEOi
*DVolatility_Issuei,t 0.002
(0.161)
IssCSCORE_SEOi
*DBidAsk_Issuei,t
0.003
(0.218)
CAR_6monthsi,t 0.007* 0.006 0.003 0.003 -0.003 -0.003
(1.812) (1.473) (0.852) (0.880) (-0.846) (-0.914)
SEO_Underwriteri,t -0.003 -0.003 -0.002 -0.002* -0.002 -0.002
(-1.393) (-1.219) (-1.242) (-1.822) (-1.298) (-1.262)
Avr_Underpricingi,t -0.012 -0.016* 0.012 0.011 0.018 0.018
(-1.478) (-1.921) (1.072) (1.026) (1.505) (1.564)
NYSEi,t -0.011* -0.007 -0.001 -0.001 0.001 0.002
(-1.917) (-1.286) (-0.284) (-0.161) (0.265) (0.397)
MV_SEOi,t 0.002 0.003 -0.005* -0.005* -0.005** -0.005**
(0.880) (1.476) (-1.918) (-1.938) (-1.994) (-2.004)
IMRi 0.123*** 0.120*** -0.035 -0.036 0.002 0.007
(2.724) (2.711) (-0.549) (-0.546) (0.034) (0.118)
Constant -0.034 -0.064 0.145** 0.144** 0.129** 0.126**
(-0.624) (-1.193) (2.527) (2.324) (2.374) (2.323)
F-Stats 2.321*** 2.464*** 1.991** 2.616*** 2.684*** 2.883***
Adj. R2 12.9% 13.7% 9.6% 9.6% 10.6% 10.7%

174
Table 4-16
(continued)
Obs 313 313 411 411 361 361
This table reports the results of regression analysis testing the association between CSCOREs and
SEO underpricing with the effect of information asymmetry. The dependent variable is the
SEO_Underpricing measured as the closing price on the SEO offer day minus the offer price
divided by the offer price. Panel A provides the results for the PreCSCORE_IPO, Panel B for the
PostCSCORE_IPO and Panel C for the IssCSCORE_IPO analysis. A description of each variable
is provided in Table 4-1. *** indicates significance at 1%. **indicates significance at 5%. *
indicates significance at 10%. All continuous variables are winsorized at the 1st and 99
th
percentiles.

175
Table 4-17: Quartile Portfolio Returns based on PreCSCORE_IPO,
PostCSCORE_IPO and IssCSCORE_SEO
Panel A. PreCSCORE_IPO and Long-Term Stock Return Performance after SEO
BHAR CAR
PreCSCORE
_IPO 1 Year 2 Years 3 Years 1 Year 2 Years 3 Years obs
Q1 1.57 -6.00% -5.75% -4.99% -3.14% 0.24% 4.98% 51
Q2 0.91 -10.72% -29.09% -30.47% -15.80% -21.68% -15.35% 51
Q3 0.64 -1.74% -5.82% -18.67% -6.36% -8.10% 2.68% 50
Q4 0.33 -2.86% -18.19% -37.98% -3.81% -9.78% -23.20% 50
Mean -5.36% -14.74% -22.98% -7.30% -9.84% -7.70% 202
Panel B. PostCSCORE_IPO and Long-Term Stock Return Performance after SEO
BHAR CAR
PostCSCORE
_IPO 1 Year 2 Years 3 Years 1 Year 2 Years 3 Years obs
Q1 0.95 2.93% -6.46% -16.07% -1.79% -11.90% -7.29% 82
Q2 0.58 -9.66% -20.06% -28.32% -5.80% -9.98% -11.14% 81
Q3 0.46 -12.01% -27.85% -46.95% -10.65% -11.53% -14.28% 81
Q4 0.34 -5.06% -30.62% -42.88% -6.63% -12.85% -14.02% 81
Mean -5.92% -21.20% -33.50% -6.20% -11.56% -11.67% 325
Panel C. IssCSCORE_SEO and Long-Term Stock Return Performance after SEO
BHAR CAR
IssCSCORE
_SEO 1 Year 2 Years 3 Years 1 Year 2 Years 3 Years obs
Q1 1.07 -3.49% -5.46% -8.39% 0.41% 5.55% 7.54% 71
Q2 0.65 -14.26% -46.73% -61.23% -16.88% -37.20% -38.41% 71
Q3 0.49 -0.25% -22.17% -36.48% -4.93% -13.28% -14.99% 71
Q4 0.32 -2.94% -19.81% -36.19% -0.08% -5.27% -4.69% 71
Mean -5.24% -23.54% -35.57% -5.37% -12.55% -12.64% 284
Sample firms are sorted into quartile portfolios based on their PreCSCORE_IPO (Panel A),
PostCSCORE_IPO (Panel B) and IssCSCORE_SEO (Panel C). Q1 is the most conservative reporting
portfolio and Q4 is the least conservative reporting portfolio. Portfolio returns are calculated based on the
average monthly buy and hold (BHAR) and cumulative abnormal returns (CAR) for a holding period of one,
two and three years from the SEO issue month, excluding the returns on the first trading day and are
adjusted for the monthly CRSP value-weighted index returns. All return variables are winsorized at 1st and
99th
percentile.

176
Table 4-18: Pearson Correlation Matrix for the Regression Analysis for CSCOREs and Long-Term Stock Returns after the SEO
PreCSCORE
_IPOi
PostCSCORE
_IPOi IssCSCORE
_SEOi Agei,t SEO_Underpricingi,t MV_SEOi,t Asset_growthi,t R&Di,t
PreCSCORE_IPOi
PostCSCORE_IPOi 0.422***
IssCSCORE_SEOi 0.098 0.482***
Agei,t -0.135*** -0.163*** -0.088*
SEO_Underpricingi,t 0.028 0.077* 0.005 -0.023
MV_SEOi,t -0.086 0.014 0.119** 0.148*** -0.120***
Asset_growthi,t 0.023 0.061 0.003 -0.098** -0.107** 0.031
R&Di,t 0.154** 0.057 0.146** -0.278*** 0.084 -0.050 -0.134**
Cash_SEOi,t 0.097* 0.134*** 0.100** -0.320*** 0.059 -0.012 0.251*** 0.506***
A description of each variable is provided in Table 4-1. All continuous variables are winsorized at the 1st and 99
th percentiles. *** indicates significance
at 1%. **indicates significance at 5%. * indicates significance at 10%.

177
Table 4-19: Regression Analysis Examining the Association between PreCSCORE_IPO and SEO Long-Term Stock Returns
Panel A. BHAR Panel B. CAR Panel C. Fama-French BHAR Panel D. Fama-French CAR
Independent variable 1 year 2 years 3 years 1 year 2 years 3 years 1 year 2 years 3 years 1 year 2 years 3 years
PreCSCORE_IPOi 0.545** 0.564*** 0.348** 0.367 0.595*** 0.346 0.549** 0.513** 0.261* 0.368* 0.566** 0.295
(2.139) (2.773) (2.488) (1.627) (2.675) (1.286) (2.236) (2.509) (1.940) (1.703) (2.556) (1.157)
Agei,t -0.442 -0.112 0.049 -0.088 0.048 0.134 -0.517 -0.162 -0.008 -0.150 -0.002 0.075
(-1.373) (-0.415) (0.233) (-0.317) (0.148) (0.393) (-1.649) (-0.603) (-0.041) (-0.538) (-0.005) (0.230)
SEO_Underpricingi,t 0.455 0.740 1.054 2.110 3.297* 3.155 0.350 0.188 0.488 1.835 2.841 2.583
(0.325) (0.586) (0.893) (1.475) (1.799) (1.228) (0.255) (0.137) (0.449) (1.385) (1.517) (1.085)
MV_SEOi,t -0.017 -0.191** -0.053 -0.101 -0.262** -0.024 -0.047 -0.167* -0.030 -0.127 -0.236** 0.011
(-0.123) (-2.179) (-0.651) (-0.993) (-2.543) (-0.200) (-0.349) (-1.828) (-0.366) (-1.255) (-2.300) (0.096)
Asset_growthi,t -0.092** -0.083** -0.070** -0.060 -0.053 -0.017 -0.083** -0.074** -0.058* -0.054 -0.047 -0.008
(-2.570) (-2.490) (-2.143) (-1.509) (-1.311) (-0.334) (-2.304) (-2.144) (-1.757) (-1.311) (-1.146) (-0.168)
R&Di,t 0.047 -0.459 -0.434 -0.128 -0.194 0.371 -0.085 -0.384 -0.309 -0.194 -0.096 0.519
(0.054) (-0.899) (-1.124) (-0.191) (-0.295) (0.573) (-0.099) (-0.772) (-0.828) (-0.297) (-0.145) (0.844)
Cash_SEOi,t -0.402 -0.293 -0.025 -0.244 -0.419 -0.371 -0.462 -0.302 0.016 -0.276 -0.414 -0.316
(-1.041) (-0.871) (-0.086) (-0.678) (-1.024) (-0.807) (-1.234) (-0.895) (0.052) (-0.789) (-1.034) (-0.702)
IMRi -5.108** -4.554** -1.703 -3.042* -4.442** -1.954 -4.931** -3.815* -0.717 -2.904* -3.950** -1.302
(-2.220) (-2.096) (-1.423) (-1.863) (-2.354) (-0.940) (-2.209) (-1.714) (-0.616) (-1.827) (-2.081) (-0.640)
Constant 3.320 5.699** 1.474 3.371 6.787** 1.107 3.898 4.948* 0.626 3.861* 6.100** 0.196
(1.101) (2.147) (0.767) (1.478) (2.587) (0.374) (1.313) (1.789) (0.317) (1.713) (2.310) (0.068)
Year Dummies Yes Yes Yes Yes Yes Yes Yes Yes Yes Yes Yes Yes
Industry Fixed Effects Yes Yes Yes Yes Yes Yes Yes Yes Yes Yes Yes Yes
F-Stats 1.787* 3.100*** 28.500*** 1.357 3.841*** 14.608*** 1.179 2.063** 1.829* 0.959 1.995** 3.436***
Adj. R2 16.5% 16.7% 17.8% 8.6% 14.3% 7.1% 15.2% 13.3% 11.9% 7.7% 11.7% 4.9%
Obs 113 113 113 113 113 113 113 113 113 113 113 113
This table reports the results of regression analysis testing the association between PreCSCORE_IPO and the long-term stock returns after the SEO. The dependent variable is the market-
adjusted stock returns for the holding period of one to three years from the SEO issue month, excluding the returns on the first trading day. In Panel A, the stock returns are measured as the
buy-and-hold returns adjusted for the monthly CRSP value-weighted index returns. In Panel B, the stock returns are measured as the cumulative returns adjusted for the monthly CRSP value-
weighted index returns. In Panel C, the stock returns are measured as the buy-and-hold returns adjusted for the monthly Fama-French size and market-to-book 5x5 portfolio returns. In Panel
D, the stock returns are measured as the cumulative stock returns adjusted for the monthly Fama-French size and market-to-book 5x5 portfolio returns. A description of each variable is
provided in Table 4-1. *** indicates significance at 1%. **indicates significance at 5%. * indicates significance at 10%. All continuous variables are winsorized at the 1st and 99th percentiles.

178
Table 4-20: Regression Analysis Examining the Association between PostCSCORE_IPO and SEO Long-Term Stock Returns
Panel A. BHAR Panel B. CAR Panel C. Fama-French BHAR Panel D. Fama-French CAR
Independent variable 1 year 2 years 3 years 1 year 2 years 3 years 1 year 2 years 3 years 1 year 2 years 3 years
PostCSCORE_IPOi -0.065 0.155 0.210 0.053 -0.208 -0.127 -0.061 0.205 0.282 0.047 -0.169 -0.124
(-0.160) (0.381) (0.564) (0.185) (-0.594) (-0.314) (-0.154) (0.517) (0.826) (0.176) (-0.495) (-0.331)
Agei,t -0.421* -0.056 -0.103 -0.265* -0.089 -0.100 -0.385* -0.055 -0.064 -0.210 -0.067 -0.093
(-1.898) (-0.266) (-0.537) (-1.694) (-0.378) (-0.387) (-1.776) (-0.254) (-0.339) (-1.396) (-0.271) (-0.364)
SEO_Underpricingi,t -0.394 -1.245 -0.178 0.566 0.107 1.002 -0.905 -1.436 -0.451 0.068 -0.295 0.756
(-0.289) (-1.036) (-0.141) (0.528) (0.071) (0.536) (-0.700) (-1.149) (-0.361) (0.066) (-0.187) (0.411)
MV_SEOi,t 0.113* 0.122* 0.233*** 0.083 0.134 0.302*** 0.076 0.053 0.124* 0.050 0.094 0.252***
(1.673) (1.785) (3.192) (1.433) (1.528) (3.091) (1.131) (0.751) (1.710) (0.837) (1.028) (2.771)
Asset_growthi,t -0.039 -0.055 -0.057* -0.026 -0.031 -0.050 -0.037 -0.066* -0.055* -0.024 -0.038 -0.057
(-1.374) (-1.582) (-1.730) (-1.037) (-0.840) (-1.128) (-1.356) (-1.751) (-1.769) (-0.963) (-0.957) (-1.314)
R&Di,t -0.437 -0.509 -0.602* -0.580** -0.628 -0.682 -0.429 -0.528* -0.480 -0.547* -0.684 -0.663
(-1.490) (-1.613) (-1.887) (-1.996) (-1.319) (-1.230) (-1.455) (-1.791) (-1.501) (-1.791) (-1.393) (-1.215)
Cash_SEOi,t -0.063 0.328 0.362 -0.019 0.284 0.399 -0.058 0.338 0.315 0.006 0.311 0.425
(-0.219) (1.179) (1.364) (-0.091) (1.133) (1.369) (-0.212) (1.209) (1.202) (0.029) (1.247) (1.503)
IMRi 0.290 -0.900 -1.000 -0.302 1.310 0.301 0.653 -1.146 -0.765 -0.075 1.313 1.108
(0.104) (-0.378) (-0.454) (-0.166) (0.549) (0.110) (0.243) (-0.486) (-0.353) (-0.043) (0.555) (0.424)
Constant -1.619 -1.740 -3.731* -1.003 -3.043 -5.371* -1.178 -0.315 -1.967 -0.591 -2.344 -4.985*
(-0.750) (-0.807) (-1.904) (-0.604) (-1.199) (-1.951) (-0.554) (-0.147) (-1.010) (-0.353) (-0.916) (-1.945)
Year Dummies Yes Yes Yes Yes Yes Yes Yes Yes Yes Yes Yes Yes
Industry Fixed Effects Yes Yes Yes Yes Yes Yes Yes Yes Yes Yes Yes Yes
F-Stats 4.002*** 4.925*** 5.389*** 3.411*** 2.505*** 3.004*** 1.727* 1.697* 1.528 1.447 1.032 1.554
Adj. R2 9.2% 14.5% 19.4% 10.9% 10.1% 14.5% 6.7% 8.3% 7.2% 7.1% 5.6% 8.1%
Obs 187 187 187 187 187 187 187 187 187 187 187 187
This table reports the results of regression analysis testing the association between PostCSCORE_IPO and the long-term stock returns after the SEO. The dependent variable is the
market-adjusted stock returns for the holding period of one to three years from the SEO issue month excluding the returns on the first trading day. In Panel A, the stock returns are
measured as the buy-and-hold returns adjusted for the monthly CRSP value-weighted index returns. In Panel B, the stock returns are measured as the cumulative returns adjusted for the
monthly CRSP value-weighted index returns. In Panel C, the stock returns are measured as the buy-and-hold returns adjusted for the monthly Fama-French size and market-to-book 5x5
portfolio returns. In Panel D, the stock returns are measured as the cumulative stock returns adjusted for the monthly Fama-French size and market-to-book 5x5 portfolio returns. A
description of each variable is provided in Table 4-1. *** indicates significance at 1%. **indicates significance at 5%. * indicates significance at 10%. All continuous variables are
winsorized at the 1st and 99th percentiles.

179
Table 4-21: Regression Analysis Examining the Association between IssCSCORE_SEO and SEO Long-Term Stock Returns
Panel A. BHAR Panel B. CAR Panel C. Fama-French BHAR Panel D. Fama-French CAR
Independent variable 1 year 2 years 3 years 1 year 2 years 3 years 1 year 2 years 3 years 1 year 2 years 3 years
IssCSCORE_SEOi -0.466* -0.506** -0.429* -0.278 -0.387 -0.574* -0.372 -0.372 -0.321 -0.203 -0.255 -0.389
(-1.957) (-2.077) (-1.897) (-1.490) (-1.495) (-1.911) (-1.592) (-1.530) (-1.427) (-1.064) (-0.984) (-1.332)
Agei,t -0.430* -0.064 -0.109 -0.270* -0.098 -0.113 -0.392* -0.060 -0.068 -0.213 -0.074 -0.103
(-1.943) (-0.305) (-0.568) (-1.729) (-0.418) (-0.434) (-1.816) (-0.276) (-0.354) (-1.425) (-0.297) (-0.403)
SEO_Underpricingi,t -0.505 -1.452 -0.385 0.465 0.075 0.884 -0.989 -1.625 -0.655 -0.010 -0.303 0.699
(-0.348) (-1.214) (-0.308) (0.429) (0.050) (0.473) (-0.716) (-1.296) (-0.526) (-0.009) (-0.190) (0.378)
MV_SEOi,t 0.138* 0.158** 0.267*** 0.102* 0.149* 0.332*** 0.096 0.083 0.154** 0.064 0.103 0.273***
(1.967) (2.252) (3.621) (1.744) (1.810) (3.591) (1.362) (1.141) (2.111) (1.062) (1.182) (3.131)
Asset_growthi,t -0.040 -0.061* -0.064* -0.029 -0.029 -0.050 -0.037 -0.072* -0.062* -0.026 -0.036 -0.057
(-1.373) (-1.725) (-1.844) (-1.117) (-0.812) (-1.137) (-1.328) (-1.882) (-1.922) (-1.026) (-0.944) (-1.345)
R&Di,t -0.398 -0.475 -0.575* -0.560** -0.589 -0.632 -0.398 -0.506* -0.465 -0.533* -0.657 -0.629
(-1.417) (-1.571) (-1.870) (-1.989) (-1.261) (-1.177) (-1.384) (-1.776) (-1.505) (-1.772) (-1.353) (-1.175)
Cash_SEOi,t -0.074 0.369 0.414 -0.004 0.240 0.376 -0.069 0.388 0.383 0.019 0.275 0.404
(-0.256) (1.399) (1.568) (-0.020) (0.966) (1.265) (-0.252) (1.481) (1.490) (0.095) (1.121) (1.415)
IMRi 1.140 1.074 1.042 0.632 1.300 1.131 1.290 0.733 1.346 0.649 1.157 1.502
(0.630) (0.627) (0.646) (0.528) (0.848) (0.646) (0.724) (0.435) (0.844) (0.553) (0.757) (0.884)
Constant -2.340 -3.221* -5.231*** -1.717 -3.168 -6.114*** -1.726 -1.687 -3.477** -1.140 -2.327 -5.409***
(-1.436) (-1.787) (-3.170) (-1.276) (-1.557) (-2.866) (-1.050) (-0.932) (-2.100) (-0.814) (-1.115) (-2.665)
Year Dummies Yes Yes Yes Yes Yes Yes Yes Yes Yes Yes Yes Yes
Industry Fixed Effects Yes Yes Yes Yes Yes Yes Yes Yes Yes Yes Yes Yes
F-Stats 3.783*** 4.476*** 5.200*** 3.405*** 2.532*** 3.278*** 1.696* 1.566 1.421 1.505 1.076 1.722*
Adj. R2 10.6% 16.2% 20.5% 12.0% 11.1% 16.3% 7.6% 9.1% 7.7% 7.7% 6.0% 9.0%
Obs 187 187 187 187 187 187 187 187 187 187 187 187
This table reports the results of regression analysis testing the association between IssCSCORE_SEO and the long-term stock returns after the SEO. The dependent variable is the market-
adjusted stock returns for the holding period of one to three years from the SEO issue month excluding the returns on the first trading day. In Panel A, the stock returns are measured as the
buy-and-hold returns adjusted for the monthly CRSP value-weighted index returns. In Panel B, the stock returns are measured as the cumulative returns adjusted for the monthly CRSP value-
weighted index returns. In Panel C, the stock returns are measured as the buy-and-hold returns adjusted for the monthly Fama-French size and market-to-book 5x5 portfolio returns. In Panel
D, the stock returns are measured as the cumulative stock returns adjusted for the monthly Fama-French size and market-to-book 5x5 portfolio returns. A description of each variable is
provided in Table 4-1. *** indicates significance at 1%. **indicates significance at 5%. * indicates significance at 10%. All continuous variables are winsorized at the 1st and 99th percentiles.

180
Chapter Five
Accounting Conservatism and the Post-IPO Status of IPO Issuers
5.1 Introduction
Chapter 4 investigated: (i) the association between IPO conservatism and the
probability of issuers’ next equity financing within five years of the IPO; and (ii) the
effect of issuers’ conservatism on the degree of SEO underpricing, announcement
returns and long-term stock return performance. This chapter examines the association
between IPO conservatism and the longevity and post-issue M&A activities of IPO
issuers. Accordingly, this chapter investigates the following research questions:
Do IPO issuers adopting a higher degree of conservatism survive longer in the
stock market?
Are IPO issuers adopting a higher degree of conservatism more likely to be a
take-over target soon after their IPO?
Among the IPO issuers that remain listed in the stock market, are those adopting
a higher degree of conservatism more likely to acquire another entity and
experience higher acquisition announcement returns?
The remainder of this chapter is organized as follows. Section 5.2 develops the
conceptual framework and hypotheses. Section 5.3 provides the research methodology
designed to empirically test the hypotheses. Section 5.4 describes the sample and
presents the descriptive statistics. Section 5.5 reports the empirical results and Section
5.6 provides the summary and concluding remarks.

181
5.2 Conceptual Framework and Hypotheses Development
5.2.1 Accounting Conservatism and the Survival Rates of IPO Firms
Previous studies document that a large number of IPO firms fail to survive in the long-
term. For example, Jain and Kini (1999) report that 14% of their IPO sample that was
compiled for the period 1977 – 1990 were delisted within five years after the IPO due to
performance failure. Fama and French (2004) also suggest that the average percentage
of IPO firms delisted within ten years is 32% for 1973 – 1991. Further, Jain and Kini
(2008) track firms that went IPO during the period 1980 – 1997 and report that 29% of
their sample was delisted until the end of 2002. In particular, Fama and French (2004)
argue that there is a dramatic decline in the survival rates of newly listed firms due to
poor performance. Jain and Kini (1999) suggest that such high failure rates of IPOs are
caused by firms going public due to a significant drop in their growth prospects. They
argue that entrepreneurs seek to divest their holdings through an IPO prior to failure
when they see their growth prospects levelling off. Thus, these firms experience
subsequent declines in performance after the IPO and consequently fail to survive in the
stock market.
Demers and Joos (2007) argue that there is potentially a heightened role for accounting
information in the prediction of IPO failures as there is greater uncertainty associated
with the valuation of IPO firms in the absence of public trading history. Thus, earnings
information may be an important means of predicting the longevity of IPO firms.
Accordingly, IPO issuers may signal the quality and value of their firms via their
accounting earnings information as the true firm value is not observed by the public
(see Li et al. 2006). The extant literature on accounting conservatism suggests that early

182
recognition of bad news in the financial statements under conservatism is an important
attribute of financial reporting that improves earnings quality (Ball & Shivakumar 2005;
Dechow et al. 2009). Managers have more incentive to recognize the effects of good
news than bad news, in particular when there is high information asymmetry (see
LaFond & Watts 2008). However, conservatism reduces information asymmetry
between insiders and outside investors by curbing managers’ opportunistic behavior
through timely recognition of losses, alleviating earnings overstatements and improving
the verifiability of accounting information (LaFond & Watts 2008).
Kim and Zhang (2010) provide evidence that a greater extent of conservatism in
financial reporting significantly reduces the likelihood of a firm experiencing future
stock price crashes. They argue that conservative accounting limits the incentive and
ability of managers to withhold and accumulate adverse private information from
outside investors, leading to a lower future crash likelihood for conservative firms.
Biddle et al. (2012) also argue that conservatism ameliorates operating cash flow (OCF)
insufficiency and shortfalls by reducing payouts for compensation, dividends, interest
and taxes. This is because conservatism lowers earnings and net assets reported in the
financial statements and firms’ contracting terms are often based on accounting
numbers. As a result, Biddle et al. (2011) suggest that reporting conservatism enhances
cash flows for firms and reduces bankruptcy risk as better-informed investors and
trading partners provide more favorable financing and contracting terms for more
conservative firms.
High quality IPO firms with solid earnings streams and growth prospects may adopt a
higher degree of conservatism to build stock market credibility by providing outside

183
investors with higher quality earnings information. However, low quality IPO firms
may not have the same incentives to adopt a high degree of conservatism at the IPO
year. Rather, they have greater incentives to manage earnings upward in the IPO
process in order to receive higher cash proceeds than the true value of their offerings
and to maintain a high market price soon after their IPO. In fact, Li et al. (2006) find
that low quality IPO firms with weak fundamentals engage in aggressive earnings
management in the IPO process and subsequently experience higher delisting risk. As a
result, this may suggest that firms adopting a higher degree of conservatism, forgoing
managerial incentives to report positive financial results around the IPO, face less risk
of failure and survive longer in the stock market. Thus, this chapter investigates
whether the extent of conservatism adopted by IPO issuers can predict the longevity of
IPO firms in the stock market.
5.2.2 Accounting Conservatism and Acquisition Likelihood of IPO Firms
Previous studies document that many public firms are delisted as they are acquired soon
after their IPO (e.g., Jain & Kini 1999; Audretsch & Lehmann 2007). In particular,
Reuer and Shen (2003) suggest that IPO and M&A markets are not independent as
newly public firms show a higher propensity of being acquired. Audretsch and
Lehmann (2007) also document that firms sell soon after the IPO because bidders often
choose to acquire public targets rather than private targets when acquiring young firms
to engage in inter-industry transactions. For instance, Mikkelson et al. (1997) report
that 24% of the U.S. sample firms that went IPO during 1980-1983 are acquired or go
private within five years of the IPO, suggesting that many IPO delistings occur due to
take-overs. Other studies such as Jain and Kini (1999) and Jain and Kini (2008)

184
investigate IPO mergers for a longer sample period and find similar results, namely that
17% of IPO sample firms are acquired within five years after the IPO for 1977-1990
and 37% for 1980-1997.
Prior research suggests that the underperformance of IPOs is due to the merger of high
quality firms because acquisitions of high quality IPO firms decrease the number of
high value firms that remain listed in the stock market, reducing the average long-term
performance of IPOs (Lewis et al. 2000; Sentis 2009). For example, Bhabra and
Pettway (2003) find that merged IPO firms significantly outperform their matched firms
by size, industry and book-to-market ratio and that firms delisted due to performance
failure show extreme underperformance. They suggest that better performing IPO firms
become acquisition targets for their future growth opportunity while IPO firms with
poor performance fail to survive in the stock market. Similarly, Li et al. (2006) provide
evidence that merged or acquired IPO firms have stronger fundamentals and a higher
value compared to the failed firms since acquirers differentiate and recognize the
quality of their acquisition targets.
Literature on conservatism (e.g., LaFond & Watts 2008; Khan & Watts 2009) suggests
that investors demand a high degree of conservatism in a high information asymmetry
environment as they are more concerned about the likelihood of losses not being
incorporated into earnings. In particular, studies suggest that when there is high
information asymmetry, there is a greater demand for conservatism. Jain and Kini (1999)
argue that one of the most popular motives for going public is to obtain a market value
to facilitate the sale of the firm through a reduction in ownership or an immediate
acquisition. Consequently, IPO firms pursuing a merger soon after their IPO may adopt

185
a higher degree of conservatism in order to reduce information asymmetry about the
true value of the firm and to signal their quality to potential acquirers. Thus, this chapter
investigates whether IPO firms adopting a higher degree of conservatism have a higher
probability of being acquired subsequent to the IPO.
5.3 Research Methodology
5.3.1 Cox Proportional Hazard Model
This chapter utilizes the Cox proportional hazard model (Cox 1972) to examine the
association between IPO firm’s conservatism and occurrence of post-issue failure.
Hazard function hij(t), can be written as the following:
H(t) = H0(t) x exp(β1X1 + β2X2 + β3X3 +… + βkXk) (1)
where H0(t) is the baseline hazard function for time t, X1 ... Xk are a vector of
explanatory variables for firm i across time t and β1 ... βk are a vector of slope
coefficients to be estimated. By dividing both sides of equation (1) by H0(t) and taking
logarithms, the hazard ratio (HR) can be defined as:
ln
= β1X1 + β2X2 + β3X3 +… + βkXk (2)

186
The following Cox proportional hazards model is employed to test the association
between CSCORE and the probability of post-issue failure:
ln
= β1CSCOREt + β2REt + β3Aget + β4VCt + β5Levt + β6salesgt
+ β7MTBt + β8VOLt + β9MVt + β10OCFt + β11Auditort + β12RDt
+ β13Underwritert (3)
A description of each variable is provided in Table 5-1. All accounting variables used in
the regression analysis are measured in the same period in which CSCORE is measured
for consistency. For example, all accounting variables used in the regression in which
CSCORE is measured in the pre-IPO year will also be measured in the pre-IPO year.
[Insert Table 5-1 here]
Following previous research which suggests that the majority of IPO delistings occur
within five years from the IPO date (e.g., Jain & Kini 1999; Harjoto & Turetsky 2006),
this chapter adopts the duration of five years from the IPO date. The dependent variable
is the logarithm of the hazards ratio and the hazard is calculated as the number of
months from the IPO month to the failure month or 60 months (5 years), whichever is
earlier for each IPO firm. A statistically significant and negative β1 will imply that the
degree of conservatism is negatively associated with the likelihood of failure, while a
positive β1 means that the degree of conservatism has a positive association with the
likelihood of failure.
Most IPO studies provide evidence that IPO characteristics and firm-specific attributes
affect the chance of IPO survival (e.g., Hensler et al. 1997; Jain & Kini 1999; Harjoto

187
& Turetsky 2006; Li et al. 2006; Demers & Joos 2007). Firms with a higher level of
retained earnings tend to be more mature and established firms (see DeAngelo et al.
2010). Thus, IPO firms with higher retained earnings may survive longer in the market
compared to those with earnings deficits. Accordingly, retained earnings (RE) are
included as one of the independent variables in the regression. Ritter (1991) reports that
older and larger firms show a better stock return performance than younger and smaller
firms, suggesting that firm size and age are proxies for risk of IPO firms. In support of
Ritter (1991), Hensler et al. (1997) find that the survival time for IPOs increases with
age and size. Accordingly, the market value of the IPO firm (MV) and firm age (Age)
are also included as control variables.
The reputation of IPO underwriters (Underwriter) and the engagement of venture
capitalists (VC) are also included as independent variables following Jain and Kini
(1999). Specifically, Jain and Kini (1999) suggest that IPOs underwritten by more
prestigious banks will have a higher probability of survival due to the post-issue
monitoring services provided by the bank. They also argue that if more prestigious
investment banks select higher quality IPO firms, IPOs associated with more
prestigious investment banks will have a higher survival rate. Further, they suggest that
VC-backed IPO firms have an increased probability of survival because VCs actively
monitor managers through their participation on the board of directors. However, they
also point out that venture capitalists may seek out buyers for the IPO firms to cash out
of their position in the IPO firm.
Following previous studies (e.g., Altman 1968; Ohlson 1980) suggesting that the
financial condition of a firm is a strong predictor for the probability of bankruptcy, the

188
leverage ratio (Lev) and net operating cash flow (OCF) are included as control variables.
The regression model also includes sales growth (salesg), engagement of one of the Big
Six auditors (Auditor) and research and development expenditures (RD), motivated by
Demers and Joos (2007). Demers and Joos (2007) suggest that firms that are more
established in their product markets are expected to be less risky and to have a higher
survival rate than firms that have yet to produce substantial revenues which can be
proxied by sales growth. They also argue that IPO firms associated with more
prestigious auditors are less risky and are therefore less likely to fail since higher
quality firms employ higher quality auditors to signal their quality to the market at the
time of their IPO. Furthermore, Demers and Joos (2007) suggest that firms that are at a
more advanced stage of research and are spending more heavily on R&D at the time of
IPO are less likely to fail. Stock return volatility (VOL) and the market-to-book ratio
(MTB) are also included in the regression as control variables to proxy for risk and
growth opportunities (see Jain & Kini 1999; Jain & Kini 2008; Golubov et al. 2012).
5.3.2 Multinomial Logit Regression Model
Previous studies show that many public firms are acquired soon after their IPO,
suggesting that a large portion of IPO delistings do not only occur due to performance
failure, but also due to M&A activity (e.g., Jain & Kini 1999; Harjoto & Turetsky 2006;
Audretsch & Lehmann 2007). This makes it difficult to establish the association
between CSCORE and the longevity of IPO firms since the IPOs that are delisted due to
M&As have not necessarily gone out of the market, and thus need to be differentiated
from those delisted due to involuntary delistings. Also, one of the objectives of this
thesis is to examine whether IPO firms adopting higher conservatism are more likely to

189
be acquired soon after their IPO. Consequently, multinomial logit regression models are
employed to test the association between CSCORE and the three post-issue status of
IPO firms: survivors, merged and involuntary delistings simultaneously.
Consistent with the Cox proportional hazard model, the multinomial logit regressions
also use five year post-IPO-window (e.g., Mikkelson et al. 1997; Jain & Kini 1999;
Bhabra & Pettway 2003). The dependent variables represent the post-issue status of
IPO firms and are prepared based on the CRSP delistings code. Following Demers and
Joos (2007), firms that are assigned with a delisting code between 400 and 600,23
except
for 501, 502, 503 and 573,24
within five years of their IPO are defined as involuntary
delistings due to performance failure and have the code N (non-survivors). Firms with a
delisting code between 200 and 300 are defined as delistings due to M&As and are
assigned the code M (merged IPOs). These firms are cross-checked against the SDC
data base and their M&A announcement dates are obtained from the SDC. The
remaining IPO sample firms are assigned the code S (survivors). All the independent
variables are the same as those adopted in equation (3).
The outcome of survivors (S) is chosen as the base and is assigned 0, merged (M) and
involuntarily delisted (N) firms are assigned 1 and 2, respectively. The multinomial
logit models are as follows:
ln
ln
= β1.Xi (4)
23
A delisting code between 400 and 500 is assigned to liquidate firms. A delisting code between 500 and
600 is assigned to those that are delisted from the stock exchange for unfavorable reasons, such as a price
drop below acceptable level, insufficient capital or assets, bankruptcy or insolvency, failure to register
under the Securities Act, failure to meet equity requirements, not meeting exchange’s financial guidelines
for continued listing, for protection of investors and the public interest, and corporate governance
violation. 24
The delisting codes of 501, 502 and 503 denote exchange switches, while the delisting code 573
denotes going private.

190
ln
= ln
= β2.Xi (5)
where Xi is a vector of measured attributes for firm i and β is a vector of unknown
parameters.
Both sides of equation (4) and (5) are exponentiated and solved for the probabilities:
Pr(Yi=1) = Pr(Yi=0)∙ (6)
Pr(Yi=2) = Pr(Yi=0)∙ (7)
The sum of all probabilities (survivors=0, merged=1 and involuntary delistings=2) must
be equal to one: Pr(Yi=0) + Pr(Yi=0)∙ + Pr(Yi=0)∙ = 1
Both sides are divided by Pr (Yi=0), thus:
1 + +
Pr(Yi=0) =
=
∑
(8)
To obtain the probability of being merged (M, the case 1), equation (8) is substituted
into equation (6) as follows:
Pr(Yi=1) = Pr (Yi=0)∙ =
∑
∙ (9)
Similarly, the probability of being involuntarily delisted (N, the case 2) is obtained by
substituting equation (8) into equation (7) as follows:
Pr(Yi=2) = Pr (Yi=0)∙ =
∑
(10)

191
5.4 Sample Data and Descriptive Statistics
The sample firms consist of 2,356 U.S firms that went IPO during the period 1990 to
2005.25
This chapter examines the sample firms’ post-IPO status for five years after the
IPO and thus the sample period covers 1990 to 2010. However, 18 firms are excluded
from the sample because 15 firms are not listed in the CRSP database and three firms
have a delisting code of 573 and 333.26
As a result, the final sample of this chapter
consists of 2,338 IPO firms. Table 5-2 provides the post-issue status of IPO sample
firms. Within one year of the IPO, four firms went through involuntary delistings and
twenty seven firms were acquired. The number of firms delisted due to M&As and
involuntary delistings starts increasing significantly from two years of the IPO. For
example, the number of firms that are delisted due to M&As and involuntary delistings
increases from 27 to 197 and 4 to 77, respectively from one to two years of the IPO.
From two to three years of the IPO, there is another 100% (from 197 to 394) and 117%
(77 to 167) increase in the number of merged and involuntary delistings, respectively.
However, the delisting rates start decreasing from four years of the IPO. By the end of
the sample period of 5 years of the IPO, 58.8% IPO firms still survive in the stock
market, 28.9% are merged and 12.3% have been involuntarily delisted.
[Insert Table 5-2 here]
Table 5-3 provides the descriptive statistics of the variables used in the regression
analysis. The sample firms are divided into three groups: survivors, merged and
involuntary delisted depending on their post-IPO status within five years of their IPO.
25
See Section 3.4 of the thesis for details of the IPO sampling process. 26
CRSP delisting code of 333 is assigned to firms delisted due to the issue being exchanged primarily for
cash and 573 to those gone private.

192
The mean and median of each variable are compared among these three groups. Panel
A provides the mean analysis and Panel B the median analysis. The survivors report the
largest mean and median Pre_CSCORE. The merged firms have higher Pre_CSCORE
than the firms that are involuntarily delisted, but the difference is not statistically
significant. For Post_CSCORE, the firms that are involuntarily delisted show a higher
mean and median than the survivors, but the difference is statistically significant only
for the median. The merged firms score the lowest mean and median Post_CSCORE.
[Insert Table 5-3 here]
Firms which are involuntarily delisted within five years of their IPO report the highest
level of leverage (Lev) and the smallest amount of operating cash flow (OCF) both in
the pre-IPO and IPO year. The surviving IPOs show the highest mean and median Cash
both in the pre-IPO and IPO year. The mean and median retained earnings (RE) is
negative across all the three groups, both in the pre- and IPO year, reflecting the fact
that IPO sample firms tend to be young growth firms that incur larger amounts of
expenditures on different investment projects such as R&D activities. Firms that are
involuntarily delisted have smaller RE than both survivors and merged IPOs but only in
the IPO year. The merged firms incur the largest amount of R&D expenditures (RD) in
the IPO year, but the difference is statistically significant only for the median.
For other variables such as price to earnings per share (PE), the market-to-book ratio
(MTB) and the market value of the firm (MV), the surviving IPOs report the highest
mean and median, while the involuntary delisted firms record the lowest. The
involuntary delisted firms also experience the highest stock market volatility (VOL) and

193
the survivors report the smallest. For the IPO characteristic variables, the firms that are
involuntarily delisted within five years of their IPO show a lower degree of IPO
underpricing (Underpricing), engage underwriters with lower reputation measures
(Underwriter) and are younger (Age). Also, involuntarily delisted issuers have a smaller
number of firms that employ one of the Big Six auditors (Auditor) and that are backed
by VC (VC) relative to the surviving and merged IPO firms.
5.5 Empirical Analysis
5.5.1 Conservatism and the Post-Issus Status of IPO Firms: Delisting Rates and
the Probability of Becoming a Target
Table 5-4 reports the correlation matrix of the variables used in the regression analysis
testing the association between Pre_CSCORE and the longevity of IPO firms.27
Table
5-5 provides the correlation matrix for the Post_CSCORE regression analysis. As
shown in both Table 5-4 and 5-5, Underwriter is positively correlated with MV and
Auditor at 65% and 39% respectively, indicating that the sample IPO firms associated
with more reputable underwriters tend to have a higher market value and employ one of
the Big Six auditors. In Table 5-4, OCF and RD are negatively correlated at 61%. This
result is somewhat expected as the firms that invest heavily in R&D activities may have
less operating cash available in that fiscal year. However, the negative correlation
becomes smaller to 38% in the IPO year as provided in Table 5-5. The correlation
between VOL and Post_CSCORE is also relatively high at 52%. To ensure that the
variables that are relatively highly correlated with each other do not distort the
regression models, the Pre_CSCORE analysis regressions are rerun without MV and
27
Each variable used in the regression model is tested for VIF. The results are provided in Appendix V of
the thesis and indicate no sign of multicollinearity.

194
Underwriter and the Post_CSCORE regressions without Underwriter. The results do
not qualitatively change.
[Insert Table 5-4 here]
[Insert Table 5-5 here]
Table 5-6 provides the results for the Cox proportional hazards analysis. Panel A
reports the results for the Pre_CSCORE analysis and Panel B for the Post_CSCORE
analysis. Panel A-1 and B-1 tabulate the results for the hazard analysis five years after
the IPO, Panel A-2 and B-2 four years after the IPO and Panel A-3 and B-3 three years
after the IPO. The coefficient on Pre_CSCORE in Panel A are all negative and
statistically significant at 1% - 5%, indicating that the IPO firms adopting higher
conservatism in the pre-IPO year are less likely to fail within five years of their IPO and
their survival times are longer. However, as reported in Panel B, the coefficients on
Post_CSCORE are not statistically significant in any regressions.
The coefficients on Age are negative across all regressions, indicating that older IPO
firms have less risk of failure consistent with Ritter (1991). However, the coefficient
remains statistically significant, mainly in the Post_CSCORE analysis. Consistent with
predictions, the coefficients on Lev are positive and the coefficients on OCF are
negative and they are both statistically significant in all regressions. These results
indicate that the IPO firms with higher leverage and smaller amounts of operating cash
available are more likely to have higher failure risk within five years of their IPO. The
coefficients on VOL are also positive and statistically significant at 1% in all
195
regressions, suggesting that the IPO firms experiencing higher after-market stock return
volatility have higher risk of failure within five years of the IPO. The coefficients on
MV are negative and statistically significant in all regressions, suggesting that the
higher the market value of an issuer, the lower the risk of failure. The coefficients on
MTB are negative, showing that the IPO firms with higher growth opportunities tend to
have a lower risk of failure and survive longer in the stock market after the IPO.
However, the coefficients tend to remain statistically significant only in the
Post_CSCORE analysis.
[Insert Table 5-6 here]
Table 5-7 and 5-8 provide the multinomial logit regressions results. Panel A reports the
results for the post-IPO status of five years, Panel B four years and Panel C three years.
In Table 5-7, the coefficients on Pre_CSCORE are negative and statistically significant
in Logе(PN/PS) regressions (except for Panel C), indicating that the involuntarily
delisted IPOs adopted a significantly lower degree of conservatism in the pre-IPO year
compared to surviving IPOs. This result supports the previous findings reported in
Table 5-6 that IPO firms adopting higher conservatism in the pre-IPO year show higher
longevity in the post-issue market. Biddle et al. (2011) also investigate the association
between conservatism and bankruptcy risk. However, they find that conservatism is
negatively associated only with bankruptcy risk measures, but not with the probability
that firms actually file for bankruptcy. They argue that there are reduced incentives for
conservatism as firms enter into actual bankruptcy and conservatism does not have a
significant effect on the probability of bankruptcy filings by creditors. They suggest that
when firms face actual bankruptcy, bad news is already revealed and the early

196
recognition of further bad news is unhelpful in reducing information asymmetries
(Biddle et al. 2011). However, IPO firms have a relatively shorter history of listing and
operation in the market and do not have much public information available for investors.
Consequently, earnings information plays a more important role in the IPO setting and
the earnings reported under a more conservative policy reduce information asymmetries,
helping IPO firms survive longer in the stock market.
In the Logе(PM/PN) regressions, the coefficients on Pre_CSCORE are positive and
statistically significant at 1% - 5%, suggesting that firms that are merged within five
years of their IPO report more conservatively in the pre-IPO year relative to the firms
that are involuntarily delisted. However, the coefficients on Pre_CSCORE in the
Logе(PM/PS) regressions are not statistically significant, indicating that there is no
statistically significant difference in the degree of conservatism adopted by IPO
survivors and those that are merged within five years of their IPO. Taken together, these
results suggest that the firms adopting higher conservatism prior to going public are
more likely to survive longer in the post-issue stock market and have a higher
probability of being merged within five years of their IPO compared to those
involuntarily delisted from the stock exchange.
[Insert Table 5-7 here]
As reported in Table 5-8, the coefficients on Post_CSCORE are not statistically
significant in any regressions, indicating that the extent of conservatism adopted in the
IPO year is not significantly associated with the post-issue status of IPO firms. For
brevity, the results for the control variables are discussed only for those that yield

197
consistent results across Table 5-7 and 5-8. The coefficients on Age are negative and
statistically significant in all Logе(PN/PS) regressions, indicating that firms that are
involuntarily delisted are younger than the surviving IPOs. The coefficients on MTB are
also negative and statistically significant in all Logе(PM/PS) regressions (except for
Table 5-8 Panel C), suggesting that merged IPOs are more likely to have a lower
market-to-book ratio in the IPO year compared to the IPO survivors. The coefficients
on VOL in all Logе(PN/PS) and Logе(PM/PS) regressions are positive and statistically
significant (except for Table 5-7 Panel C), but negative in all Logе(PM/PN) regressions.
Taken together, these results suggest that involuntarily delisted IPOs are more likely to
experience higher stock return volatility in the IPO year compared to the surviving and
the merged IPO firms and that the merged IPO firms show higher stock return volatility
than the surviving IPOs.
The coefficients on OCF are negative and statistically significant in all Logе(PN/PS)
regressions and positive in Logе(PM/PN) regressions (except for Table 5-7 Panel B and
C). This result suggests that IPO firms that are involuntarily delisted have smaller
amounts of operating cash available, both in the pre-IPO and IPO year, compared to the
surviving IPOs. The merged IPOs also tend to have more operating cash available in
both fiscal years compared to the involuntarily delisted IPOs.
[Insert Table 5-8]

198
5.5.2 Additional Tests: IPO Conservatism and the Probability of Corporate
Acquisitions and Acquisition Profitability
5.5.2.1 Conservatism and Post-IPO Acquisitions Activity
Previous studies suggest that acquisitions play an important role in the growth of newly
public firms and one of the most important motives for an IPO is to facilitate post-IPO
M&A activity as a bidder (Brau & Fawcett 2006; Celikyurt et al. 2010). Celikyurt et al.
(2010) argue that an IPO benefits the firm by providing an infusion of capital including
cash and publicly traded stock which can be used as currency for subsequent M&A
activity and by reducing the uncertainty associated with the valuation of the firm.
Further, Hovakimian and Hutton (2010) suggest that having publicly traded stock
provides stock returns that provide information that is not otherwise available to
managers. By using this information, managers can more accurately assess the
profitability of the firms’ investment opportunities, in particular, the value of their
future acquisitions.
Hsieh et al. (2011) suggest that an IPO reduces valuation uncertainty which can lead to
suboptimal M&A policy and reduce the firm value, allowing the firm to pursue a more
efficient acquisition strategy. Accordingly, they find that pre-IPO valuation uncertainty
is negatively associated with the likelihood of an acquisition within five years of the
IPO and is positively associated with time spans between IPOs and subsequent
acquisitions. The previous results from Table 5-6, 5-7 and 5-8 suggest that the higher
the level of conservatism adopted by firms prior to going public, the higher the level of
longevity in the stock market. Accordingly, this result may indicate that IPO firms
reporting more conservatively survive longer in the stock market because their primary

199
motive for going public is to facilitate their future acquisitions. In other words, IPO
firms which go public for their future acquisitions adopt a higher degree of
conservatism to reduce the pre-IPO valuation uncertainty in order to achieve more
profitable post-issue acquisitions.
Francis and Martin (2010) find that acquirers adopting a higher degree of conservatism
experience larger acquisition announcement returns. They argue that conservative
accounting deters managers from over-investing in negative net present value projects,
since poor performing acquisitions will soon turn out to be bad investments due to the
timely loss recognition enforced under conservative accounting. Accordingly, this may
indicate that IPO firms adopting higher conservatism gain higher announcement returns
for the acquisitions they make soon after their IPO. Consequently, this thesis further
investigates whether IPO issuers adopting higher conservatism are more likely to
acquire another firm within five years of the IPO and experience higher announcement
returns for their acquisitions.
5.5.2.2 Research Design for the Analysis of Post-IPO Acquisitions Activity
Equation (11) represents the probit regression model which tests the association
between CSCORE and the acquisition probability and is as follows:
Acquisitioni,t = α0 + β1CSCORE i,t + β2 Sizei,t + β3 Levi,t + β4 OCFi,t
+ β5C&I ratei,t + β6 Return i,t + β7WCi,t + β8MTBi,t
+ β9PEi,t + εi (11)
A description of each variable in the regression model is provided in Table 5-1. The
dependent variable Acquisition is a binary indicator that takes the value of one if an IPO

200
firm acquires another firm within five years subsequent to the IPO and otherwise zero.
Accounting variables used in the regression where CSCORE is measured in the pre-IPO
year are also obtained in the pre-IPO year so that all accounting variables in the
regression are measured over the same period. The independent variables are motivated
by Hsieh et al. (2011).28
The variables include various IPO firm characteristics such as
the size of the firm (Size), leverage ratio (Lev), net operating cash flow (OCF),
abnormal stock returns in the IPO year (Return), non-cash working capital (WC), the
market-to-book ratio (MTB) and P/E ratio (PE). The regression also includes the spread
between the average Commercial and Industrial loan rate and the Fed rate (C&I rate)
that proxy for the costs of funding.
Equation (12) tests whether IPO issuers adopting higher conservatism experience higher
announcement returns for acquisitions made within five years of their IPO.
CAR i,t = α0 + β1CSCOREi + β2 MVi,t + β3 Tobins’qi,t + β4 Lev_acq i,t +β5FCFi,t
+ β6Runnupi,t + β7Rel_size i,t + β8All_cashCi,t + β9Stocki,t + β10Privatei,t
+ β11Diversifyi,t + β12Hightechi,t + εi (12)
The dependent variable is CAR measured as three day cumulative abnormal returns
where the event day is the acquisition announcement date and the CRSP value-weighted
returns are used as the market return. Consistent with the previous Section, CAR is
measured only for the IPO firms that acquire another firm within five years of their IPO.
The independent variables used in the regression model are motivated by Masulis et al.
(2007) and the description of each variable is provided in Table 5-1. The regression
28
The variable, Deregulation, a binary indicator that equals one in the year following an industry
deregulation event and otherwise zero based on Harford (2005), is not included in the regression model.
The sample firms of this thesis cover the firms that went IPO from 1990-2005. However, Harford’s (2005)
sample period only covers up to 1999.

201
model controls for bidder characteristics: (1) the size of the IPO firm (MV), (2)
Tobins’q (Tobins’q), (3) leverage ratio (Lev_acq), (4) free cash flow (FCF), and (5)
pre-announcement stock price runup (Runup). The model also controls for the deal
characteristics: (6) relative deal size (Rel_size), (7) method of payment; whether the
payment is made only by cash (All_cash) or partially stock financed (Stock), (8) the
target status; whether the target is a private firm (Private), and (9) industry relatedness
of the acquisition that indicates whether the acquisition is a diversifying acquisition or
not (Diversify), and (10) whether the bidder and the target are both from high-tech
industries (Hightech).
5.5.2.3 Empirical Analysis of Post-IPO Acquisitions Activity
5.5.2.3.1 Descriptive Statistics
Table 5-9 provides the descriptive statistics of IPO issuers making acquisitions within
five years of their IPO. Panel A reports the number of IPO firms going for acquisitions
within one to five years of their IPO. Out of 2,307 IPO firms that survive for at least
one year, 116 firms make corporate acquisitions. The number of IPO acquirers
increases every year and 339 firms, which represents 25% of the surviving IPOs, make
acquisitions within five years of their IPO. Panel B tabulates the distribution of
acquirers by their IPO year. The firms that went IPO in 1996 record the largest number
of IPOs that make acquisitions within five years of their IPO. These firms take, on
average, 584 days to acquire another firm after their IPO. In general, there are a larger
number of IPO firms making acquisitions in the 1990s compared to the 2000s. In
particular, out of the sample IPO firms that went public in 2001, only one issuer made
an acquisition in five years of the IPO. There are still a small number of 2002 and 2003

202
IPO issuers that make acquisitions after the IPO. This is consistent with research by
Celikyurt et al. (2010) and Hovakimian and Hutton (2010), providing evidence of a
significant decrease in the number of acquisitions by IPO firms in 2001 after the
collapse of the internet bubble. Such a phenomenon is also documented in the non-IPO
setting (see Moeller et al. 2004, 2005). The number of acquirers starts increasing again
from 2004. It is also noted that it takes 779 days on average for IPO issuers to make
their first corporate acquisition after the IPO.
[Insert Table 5-9 here]
Table 5-10 presents the descriptive statistics of the variables used in the regression
analysis testing the association between CSCORE and the probability and profitability
of the IPO firms’ acquisitions activity. Panel A and B provide the pre-IPO and IPO year
variables respectively and Panel C reports the acquisition announcement year variables.
As shown in Table 5-10, only 101 firms have Pre_CSCORE available, while
Post_CSCORE is measured for 329 firms out of 339 firms. In Panel B, the mean and
median of sample firms’ IPO year abnormal return (Return) is -0.2%, suggesting that
the IPO firms going for acquisitions tend to underperform the market on average in the
IPO year.
In panel C, the mean and median CAR are 2.8% and 1.6% respectively, indicating that
the IPO issuers acquiring another firm within five years of their IPO experience, on
average, positive abnormal announcement returns. Such positive CAR results are
relatively higher than that reported by previous studies. For example, Moeller et al.
(2004) documents the average bidder’s abnormal return across acquisitions between

203
1980 and 2001 as 1.1%, and Masulis et al. (2007) report 0.215% and 0.105% of mean
and median abnormal returns for the period 1990 to 2003. A more recent study by
Humphery-Jenner and Powell (2014) also finds that the average acquirers’ abnormal
returns are 1.31% based on the market-adjusted model for the period 1996 to 2008.
Although it is not reported in Table 5-10 for brevity, there are 70 firms that made
acquisition only by cash. In addition, there are only 13 firms that acquired private
targets. This is consistent with research by Hovakimian and Hutton (2010), suggesting
that IPO firms tend to pursue public targets that are larger, more liquid and have higher
valuation multiples. There are 211 issuers that made diversifying acquisitions,
consistent with the view that one important motivation for going public is to achieve
expansion by acquiring targets in different sectors (Celikyurt et al. 2010; Hovakimian
& Hutton 2010).
[Insert Table 5-10 here]
5.5.2.3.2 IPO Conservatism and the Probability of Acquiring Another Firm
Table 5-11 and 5-12 report the correlation matrix29
for the variables used in the
regression analysis. Table 5-11 provides the results for the Pre_CSCORE analysis and
Table 5-12 for the Post_CSCORE analysis. As shown in Table 5-11, the correlation
between Pre_CSCORE and C&I rate is relatively higher at 41%, indicating that when
the C&I loan rates are higher, IPO firms tend to adopt higher conservatism. All other
independent variables are not significantly correlated with each other.
29
Each variable in the model is tested for VIF. The results are provided in Appendix IV of the thesis and
indicate no sign of multicollinearity.

204
[Insert Table 5-11 here]
[Insert Table 5-12 here]
Table 5-13 (Panel A) provides the probit regression results. The coefficient on
Pre_CSCORE in model 1 is 0.409 and is statistically significant at 1%, suggesting that
firms adopting higher conservatism prior to going public are more likely to acquire
another firm within five years of their IPO. However, the coefficient on Post_CSCORE
is not statistically significant. Panel B provides the duration analysis using the Cox
Proportional Hazard model. The dependent variable (time_to_acquire) is the logarithm
of the number of months taken from the IPO month to either the acquisition
announcement month or 60 months, whichever is earlier for each IPO firm. Thus, the
dependent variable is the logarithm of the hazard ratio in this model specification in
which the hazard is defined as the probability of making acquisitions. Hence, positive
coefficients indicate that the acquisition is more likely to occur and the time to
acquisition is shorter (see Jain & Kini 2008). As shown in Panel B30
of Table 5-13, the
coefficient on Pre_CSCORE is positive and statistically significant at 5%, suggesting
that firms adopting higher conservatism prior to going public are more likely to make
acquisitions within five years of their IPO. This also suggests that, the higher the
conservatism adopted by IPO issuers in the pre-IPO year, the less the time that it takes
to make the first acquisitions after the IPO. The coefficient on Post_CSCORE is not
statistically significant, consistent with Panel A results.
30
The hazard ratios are not presented in the table for brevity.

205
The coefficients on Size in all regression models are positive and statistically significant
at 1% - 5%, indicating that the larger the IPO firm, the higher the probability that an
acquisition will occur within five years of the IPO. This result also suggests that larger
size IPOs tend to make acquisitions sooner than smaller IPOs. The coefficient on Lev is
negative and statistically significant in model 1 and 3, indicating that IPO firms with
higher leverage in the pre-IPO year are less likely to make acquisitions within five years
of the IPO. However, the coefficient on Lev is statistically significant and positive in
model 2 and 4 (the Post_CSCORE analysis). This result is not consistent with Hsieh et
al. (2011) that higher leverage is negatively associated with the probability of acquiring
other entities. However, this result could indicate that IPO issuers that have higher
leverage in the IPO year tend to borrow to make an acquisition within five years of their
IPO.
The coefficient on OCF is positive, showing that firms with larger amounts of operating
cash available tend to make acquisitions within five years of their IPO. However, the
coefficient remains statistically significant (1%) only in the Post_CSCORE analysis.
Consistent with previous studies (e.g., Harford 2005; Hsieh et al. 2011), the coefficients
on C&I rate are negative and statistically significant at 1% in the Pre_CSCORE
analysis, supporting the view that the C&I rate spread is a proxy for the costs of funding
and ease of financing and as a result a decrease in the rate of spread leads to an increase
in acquisition activity. The coefficients on MTB are positive and statistically significant
in all regressions (except for model 1), indicating that the larger the market-to-book
ratio, the higher the probability that an acquisition would occur within five years of the
IPO.
[Insert Table 5-13 here]

206
5.5.2.3.3 IPO Conservatism and Acquisition Profitability
Table 5-14 provides the correlation matrix31
for the variables used in the regression
analysis testing the association between CSCORE and acquisition profitability. All
variables in the regression model are not highly correlated with each other as they are
all below 30%.
[Insert Table 5-14 here]
Table 5-15 provides the regression results. The coefficient on Pre_CSCORE is positive
and statistically significant at 10%, providing weak evidence that firms adopting higher
conservatism prior to going public gain higher announcement returns for their
acquisitions made within five years of their IPO. However, the coefficient on
Post_CSCORE in Table 5-15 is positive and statistically significant at 5%, indicating
that IPO issuers adopting higher conservatism in the IPO year gain higher
announcement returns for their acquisitions.
Taken together, the results suggest that IPO issuers reporting more conservatively make
better post-issue corporate acquisitions. Francis and Martin (2010) suggest that
conservatism leads to more profitable acquisition decisions, in particular when there is
high information asymmetry as timely loss recognition under conservatism can help
prevent managers from undertaking value-destroying acquisitions out of self-interest.
Thus, this result lends support to Francis and Martin (2010) by providing empirical
evidence that IPO issuers adopting a higher degree of conservatism make more
31
The VIF for each regression variable is provided in Appendix V of the thesis. The results indicate no
sign of multicollinearity.

207
profitable acquisitions after IPO. In particular, the result has important implications in
that the reporting conservatism of IPO issuers conveys important information for their
acquisition activities in the post-issue market.
The coefficient on Stock is negative and statistically significant at 5% (only in model 1),
consistent with Masulis et al. (2007) that acquirers experience significantly negative
abnormal returns when they pay for their acquisitions with stock. The coefficient on
Diversify is also negative and statistically significant at 5% (only in model 2),
supporting the view that diversifying acquisitions tend to destroy shareholder value
because managers can acquire unrelated assets that potentially benefit their self-
interests rather than acquire those that can reduce the firm risk (Masulis et al. 2007).
Also, consistent with Masulis et al. (2007), the coefficient on Hightech is negative and
statistically significant at 5% (only in model 2), indicating that the acquisition
profitability is lower when technology firms are merged as it is more difficult for them
to integrate smoothly due to the complexities associated with human capital and
intellectual property.
[Insert Table 5-15 here]

208
5.6 Summary and Conclusions
This chapter investigates whether IPO firms adopting a higher degree of conservatism
show higher survival rates and whether the extent of conservatism adopted by IPOs
delisted due to M&As significantly differs from that of firms delisted due to involuntary
delistings. Further, this chapter investigates whether surviving IPOs which adopt higher
conservatism make acquisitions of other entities within five years of their IPO and
whether these firms experience higher acquisition announcement returns.
The results suggest that firms adopting a higher degree of conservatism prior to going
public face less risk of failure and survive longer in the stock market. Moreover, among
the IPO firms delisted from the stock market soon after the IPO, the issuers delisted due
to M&As adopt a higher degree of conservatism prior to going public compared to
those delisted due to involuntary delistings. However, the degree of conservatism
adopted by IPO survivors in the pre-IPO year does not significantly differ from that of
IPO issuers delisted due to M&As, after controlling for other known factors that have
an effect on the probability of being merged. Conservatism measured in the IPO year is
not significantly associated with the longevity of IPO issuers.
This chapter investigates whether the IPO survivors adopting a higher degree of
conservatism are more likely to make acquisitions soon after their IPO. The results
suggest that the extent of conservatism adopted by IPO issuers prior to going public is
significantly and positively associated with the probability of making acquisitions
within five years of the IPO. Further, this chapter also provides evidence that, the
higher the conservatism adopted by IPO issuers in the pre-IPO year, the less the time
209
that it takes to make their first acquisition after the IPO. Consistent with the longevity
analysis, the conservatism measured in the IPO-year is not significantly associated with
the probability of making acquisitions by IPO issuers.
This chapter also examines whether IPO firms adopting a higher degree of conservatism
experience significantly higher announcement returns for their acquisitions made within
five years of the IPO. The results suggest that both the pre-IPO and IPO year
conservatism are significantly and positively associated with the abnormal
announcement returns. However, the pre-IPO year conservatism analysis does not yield
strong statistical results, lending only weak support for the positive association between
pre-IPO year conservatism and acquisition profitability.
Taken together, the results for this chapter suggest that IPO firms adopting higher
conservatism prior to going public offer a superior investment for investors because
they are less likely to fail soon after the IPO. Finally, these firms are also more likely to
achieve substantial growth through value enhancing acquisitions soon after their IPO.
The next chapter provides the summary and conclusion of this thesis. It also discusses
the implications and contributions of this thesis.

210
5.7 Tables
Table 5-1: Variable Description
Variable Description
Pre_CSCOREi CSCORE measured in the pre-IPO year.
Post_CSCOREi CSCORE measured in the IPO year.
Agei,t Log of firm age in in year t where year t is the IPO year.
All_cashi,t Dummy variable that is one for purely cash-financed deals and zero otherwise.
Auditori,t A dummy variable that equals one if the auditor is one of the Big 6 auditors and otherwise
zero.
CARi,t
Three-day market-adjusted cumulative abnormal stock returns measured in days -1 through
+1 where day 0 is the acquisition announcement date and the market return is the CRSP
value weighted index returns.
C&I ratei,t Commercial and Industrial loan rates obtained from
<http://www.federalreserve.gov/releases/e2/e2chart.htm>.
Diversifyi,t Dummy variable that is one if acquirer and target do not share a two-digit industry and
otherwise zero.
Hightechi,t Dummy variable that is one if acquirer and target are both from high-tech industries as
defined in the SDC and otherwise zero.
FCFi,t
Free cash flow measured as operating income before depreciation minus interest expenses
minus income taxes minus capital expenditures, scaled by beginning total assets in year t
where year t is the acquisition announcement year.
Levi,t Total debts divided by beginning total assets in year t where year t is the IPO year.
Lev_acqi,t Total debts divided by beginning total assets in year t where year t is the acquisition
announcement year.
MTBi,t Market-to-book ratio in year t where year t is the IPO year.
MVi,t The natural logarithm of the market value of a firm at IPO.
OCFi,t Net Operating Cash flow divided by beginning total assets in year t where year t is the IPO
year.
PEi,t Market value of equity per share divided by earnings per share in year t where year t is the
IPO year.
Privatei,t Dummy variable that is one for private targets and otherwise zero.
RDi,t Research and Development expenditure divided by beginning total assets in year t where
year t is the IPO year.
REi,t Retained earnings divided by beginning total assets in year t where year t is the IPO year.
Rel_sizei,t Deal value (from the SDC) over bidder market value of equity.
Returni,t Average of returns net of CRSP value-weighted returns of firms in the IPO firm industry in
the IPO year.
Runupi,t Acquirer's buy-and-hold abnormal returns (BHAR) during the period from180 to11 days
prior to the announcement where the market index is the CRSP value-weighted returns.
Salesgi,t Changes in sales revenue in year t where year t is the IPO year.
Sizei,t The natural logarithm of the total assets of a firm at IPO in year t where year t is the IPO
year.
Stocki,t Dummy variable that is one for deals at least partially stock-financed and otherwise zero.
Time_to_acquirei,t Log of the number of months taken between the IPO and acquisition announcement date or
60 months whichever is earlier.

211
Table 5-1
(continued)
Variable Description
Tobin's qi,t Tobin's q measured as total assets minus book value of equity plus market value of equity
divided by total assets in year t where year t is the acquisition announcement year.
Underpricingi,t Closing price on the IPO offer day minus the offer price divided by the offer price.
Underwriteri,t IPO's underwriter’s reputation measures from the Jay Ritter's website
<http://bear.warrington.ufl.edu/ritter/ipodata.htm>.
VCi,t A dummy variable that equals one if an IPO is backed by VC and otherwise zero.
VOLi,t Stock return volatility in year t where year t is the IPO year.
WCi,t Non-cash working capital defined as net working capital minus cash and cash equivalents
divided by total assets in year t where year t is the IPO year.
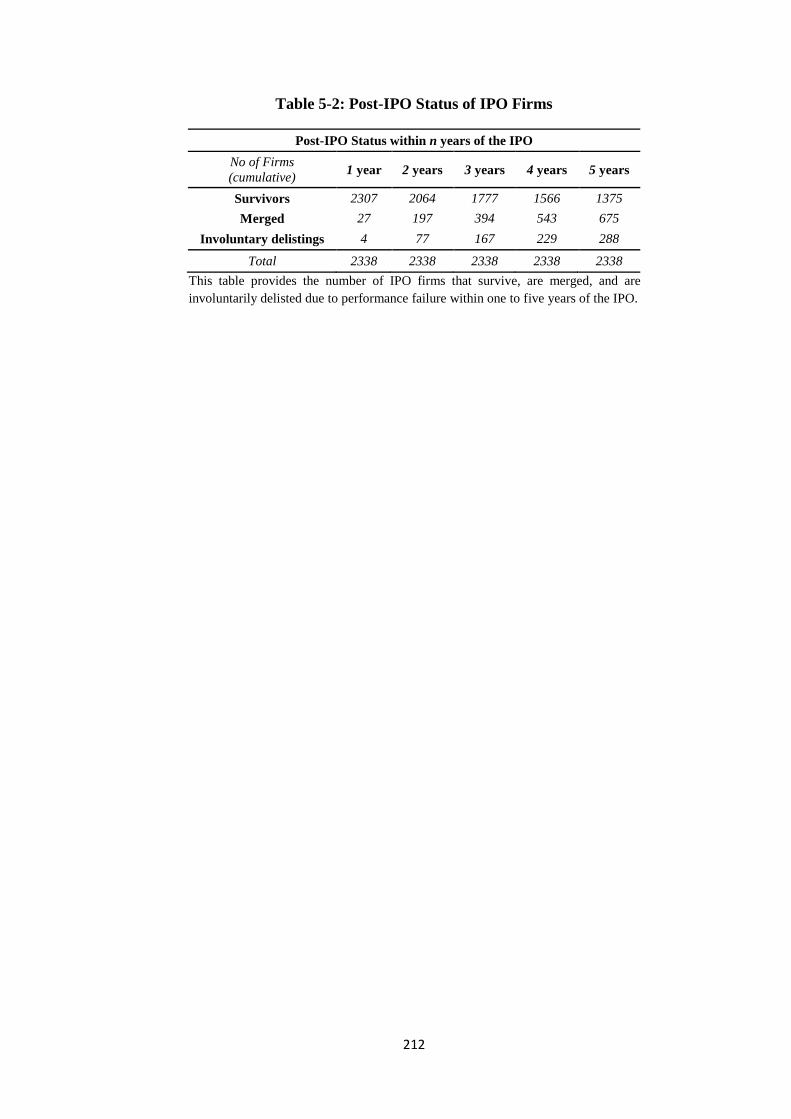
212
Table 5-2: Post-IPO Status of IPO Firms
Post-IPO Status within n years of the IPO
No of Firms
(cumulative) 1 year 2 years 3 years 4 years 5 years
Survivors 2307 2064 1777 1566 1375
Merged 27 197 394 543 675
Involuntary delistings 4 77 167 229 288
Total 2338 2338 2338 2338 2338
This table provides the number of IPO firms that survive, are merged, and are
involuntarily delisted due to performance failure within one to five years of the IPO.

213
Table 5-3: Descriptive Statistics
Panel A. Mean and Differences in Mean for Each Variable
Variable Survivors Merged Delisted obs Survivors -
Delisted
Survivors -
Merged
Merged -
Delisted
Panel A_1. Pre-IPO Year
Pre_CSCORE 0.972 0.906 0.875 837 0.098** 0.066* 0.031
Lev 0.646 0.650 0.734 809 -0.088** -0.004 -0.084**
RD 0.243 0.277 0.285 550 -0.042 -0.034 -0.008
RE -0.695 -0.865 -0.867 842 0.172 0.170* 0.002
OCF -0.050 -0.135 -0.200 819 0.150*** 0.086*** 0.064
Salesg 1.434 1.562 1.526 765 -0.091 -0.128 0.036
Panel A_2. IPO Year
Post_CSCORE 0.680 0.649 0.702 2277 -0.022 0.031** -0.053***
Lev 0.304 0.291 0.353 2198 -0.049*** 0.013 -0.062***
RD 0.093 0.099 0.082 1504 0.011 -0.006 0.017**
RE -0.193 -0.226 -0.329 0.77 0.136*** 0.033 0.103***
OCF 0.014 -0.018 -0.113 2228 0.127*** 0.032*** 0.095***
Salesg 1.100 1.195 1.188 2138 -0.088 -0.096 0.007
PE 20.888 15.357 9.476 2205 11.412*** 5.531* 5.881
VOL 0.044 0.047 0.052 2231 -0.008*** -0.004*** -0.005***
MTB 4.934 4.921 4.680 2229 0.253 0.012 0.241
MV 8.276 8.196 7.950 2235 0.326*** 0.081*** 0.245***
Panel A_3. IPO Characteristics
Underpricing 0.224 0.232 0.176 2234 0.048** -0.008*** 0.056***
Underwriter 7.596 7.466 6.079 2016 1.517*** 0.129*** 1.387***
Age 1.011 0.970 0.902 1998 0.109*** 0.041*** 0.068***
Auditor 0.955 0.952 0.841 2277 0.114*** 0.003*** 0.111***
VC 0.503 0.562 0.395 2277 0.108*** -0.059*** 0.167***
Panel B. Median and Differences in Median for Each Variable
Variable Survivors Merged Delisted Survivors -
Delisted
Survivors -
Merged
Merged -
Delisted
Panel B_1. Pre-IPO Year
Pre_CSCORE 0.898 0.793 0.773 837 0.126* 0.105 0.020
Lev 0.593 0.621 0.730 809 -0.137*** -0.028 -0.109***
RD 0.172 0.207 0.127 550 0.045** -0.035* 0.080***
RE -0.158 -0.353 -0.305 842 0.147* 0.195** -0.048
OCF 0.060 0.008 -0.069 819 0.128*** 0.051*** 0.077***
Salesg 0.322 0.494 0.521 765 -0.199 -0.172*** -0.028
Panel B_2. IPO Year
Post_CSCORE 0.576 0.538 0.613 2277 -0.037** 0.038** -0.075***
Lev 0.255 0.232 0.304 2198 -0.049*** 0.024 -0.072***
RD 0.071 0.081 0.043 1504 0.028** -0.011* 0.039***
RE -0.019 -0.059 -0.155 0.77 0.136*** 0.040** 0.096***
OCF 0.050 0.021 -0.075 2228 0.125*** 0.028*** 0.097***
Salesg 0.427 0.478 0.434 2138 -0.007 -0.051** 0.044*
PE 15.909 12.821 -1.007 2205 16.916*** 3.089** 13.828***
VOL 0.039 0.042 0.047 2231 -0.008*** -0.003*** -0.004***
MTB 3.532 3.465 3.242 2229 0.291** 0.067 0.223*
MV 8.269 8.162 7.886 2235 0.383*** 0.107*** 0.276***

214
Table 5-3
(continued)
Panel B_3. IPO Characteristics
Variable Survivors Merged Delisted Survivors -
Delisted
Survivors -
Merged
Merged -
Delisted
Underpricing 0.125 0.118 0.071 2234 0.054*** 0.007 0.047***
Underwriter 8.000 8.000 7.000 2016 1.000*** 0.000*** 1.000***
Age 1.000 0.954 0.903 1998 0.097*** 0.046** 0.051***
Auditor 1.000 1.000 1.000 2277 0.000*** 0.000 0.000***
VC 1.000 1.000 0.000 2277 1.000*** 0.000*** 1.000***
All continuous variables are winsorized at the 1st and 99
th percentiles. A description of each variable is
provided in Table 5-1. Panel A provides the mean of each variable for IPO survivors, IPOs that are merged
and IPOs that are involuntarily delisted respectively and compares the difference in mean across different
groups. Panel B provides the median analysis.

215
Table 5-4: Pearson Correlation Matrix for Regression Analysis Testing the Association between Pre_CSCORE and IPO Longevity
Pre_
CSCOREt REi,t-1 Agei,t
Under-
writeri,t VCi,t Levi,t-1 Salesgi,t-1 MTBi,t VOLi,t
MV_
IPOi,t OCFi,t-1 Auditori,t
REi,t-1 -0.199***
Agei,t -0.105*** 0.202***
Under-
writeri,t -0.008 0.032 0.136***
VCi,t 0.221*** -0.377*** -0.187*** 0.235***
Levi,t-1 0.065* -0.075** 0.082*** -0.155*** -0.157***
Salesgi,t-1 0.079** -0.114*** -0.284*** 0.082** 0.218*** -0.130***
MTBi,t -0.045 -0.080** -0.085*** 0.107*** 0.098*** 0.105*** 0.204***
VOLi,t 0.240*** -0.209*** -0.260*** -0.020 0.249*** -0.037* 0.264*** 0.188***
MV_
IPOi,t 0.082** -0.003 0.045** 0.653*** 0.143*** -0.099*** 0.082** 0.266*** 0.145***
OCFi,t-1 -0.170*** 0.626*** 0.270*** 0.048** -0.268*** -0.053** -0.315*** -0.145*** -0.361*** -0.030
Auditori,,t -0.055 -0.001 0.053** 0.388*** 0.207*** -0.094*** 0.057 0.059*** -0.016 0.266*** -0.010
RDi,t-1 0.179*** -0.587*** -0.233*** 0.012 0.305*** 0.011 0.140*** 0.164*** 0.221*** 0.023 -0.613*** 0.061**
The accounting variables used for the Pre_CSCORE regression analysis are obtained from the pre-IPO fiscal year since Pre_CSCORE is also measured over the pre-IPO year. ***
indicates significance at 1%. **indicates significance at 5%. * indicates significance at 10%. All continuous variables are winsorized at the 1st and 99
th percentiles. A description
of each variable is provided in Table 5-1.

216
Table 5-5: Pearson Correlation Matrix for Regression Analysis Testing the Association between Post_CSCORE and IPO Longevity
Post_
CSCOREt REi,t Agei,t
Under-
writeri,t VCi,t Levi,t Salesgi,t MTBi,t VOLi,t
MV_
IPOi,t OCFi,t Auditori,t
REi,t -0.180***
Agei,t -0.150*** 0.183***
Under-
writeri,t 0.027 0.055** 0.136***
VCi,t 0.108*** -0.264*** -0.187*** 0.235***
Levi,t -0.044** 0.079*** 0.265*** 0.020 -0.302***
Salesgi,t 0.241*** -0.135*** -0.278*** 0.084*** 0.187*** -0.164***
MTBi,t 0.210*** -0.110*** -0.085*** 0.107*** 0.098*** 0.040* 0.150***
VOLi,t 0.520*** -0.262*** -0.260*** -0.020 0.249*** -0.276*** 0.277*** 0.188***
MV_
IPOi,t 0.228*** 0.001 0.045** 0.653*** 0.143*** 0.002 0.175*** 0.266*** 0.145***
OCFi,t -0.249*** 0.596*** 0.286*** 0.210*** -0.174*** 0.148*** -0.262*** -0.055*** -0.366*** 0.126***
Auditori,,t -0.043** 0.037* 0.053** 0.388*** 0.207*** -0.027 0.053** 0.059*** -0.016 0.266*** 0.085***
RDi,t 0.070*** -0.483*** -0.180*** 0.056** 0.314*** -0.254*** 0.113*** 0.080*** 0.131*** -0.010 -0.379*** 0.074***
The accounting variables used for the Post_CSCORE regression analysis are obtained from the IPO fiscal year since Post_CSCORE is also measured over the IPO fiscal year. ***
indicates significance at 1%. **indicates significance at 5%. * indicates significance at 10%. All continuous variables are winsorized at the 1st and 99
th percentiles. A description of each
variable is provided in Table 5-1.

217
Table 5-6: Cox Proportional Hazards Model for IPO Longevity Analysis
Panel A. Pre_CSCORE Panel B. Post_CSCORE
Panel A-1. 5 years after
IPO
Panel A-2. 4 years after
IPO
Panel A-3. 3 years after
IPO Panel B-1. 5 years after IPO
Panel B-2. 4 years after
IPO
Panel B-3. 3 years after
IPO
Model 1 Model 2 Model 3 Model 4 Model 5 Model 6 Model 7 Model 8 Model 9 Model 10 Model 11 Model 12
Pre_
CSCOREi -0.924*** -0.830*** -0.795** -0.721*** -0.734** -0.667***
(-2.685) (-3.330) (-2.480) (-3.132) (-2.302) (-2.950)
Post_
CSCOREi
-0.075 -0.005 0.174 0.222 0.163 0.198
(-0.259) (-0.019) (0.630) (0.845) (0.591) (0.751)
REi,t-1 0.104 0.279 0.137 0.348** 0.146 0.356**
(0.522) (1.625) (0.702) (2.081) (0.752) (2.208)
REi,t
-0.085 -0.079 -0.065 -0.060 -0.038 -0.034
(-0.523) (-0.484) (-0.405) (-0.375) (-0.253) (-0.228)
Levi,t-1 0.733** 1.150*** 0.770** 1.175*** 0.834** 1.205***
(2.009) (4.434) (2.224) (4.579) (2.450) (4.940)
Levi,t
1.720*** 1.681*** 1.605*** 1.572*** 1.500*** 1.478***
(4.527) (4.412) (4.448) (4.368) (4.384) (4.345)
Salesgi,t-1 -0.046 -0.032 -0.038 -0.028 -0.033 -0.027
(-0.983) (-0.886) (-0.875) (-0.830) (-0.793) (-0.810)
Salesgi,t
-0.001 0.000 -0.012 -0.011 -0.001 -0.000
(-0.019) (0.013) (-0.307) (-0.282) (-0.019) (-0.004)
OCFi,t-1 -1.555*** -1.318*** -1.463*** -1.343*** -1.416*** -1.303***
(-3.013) (-3.348) (-2.999) (-3.615) (-2.967) (-3.602)
OCFi,t
-2.665*** -2.688*** -2.590*** -2.611*** -2.601*** -2.619***
(-5.501) (-5.456) (-5.788) (-5.767) (-5.903) (-5.883)
RDi,t-1 -0.781
-0.723 -0.799
(-0.985)
(-0.957) (-1.007)
RDi,t
-3.185*** -3.279*** -3.187*** -3.266*** -3.441*** -3.507***
(-3.062) (-3.166) (-3.231) (-3.338) (-3.563) (-3.679)

218
Table 5-6
(continued)
Panel A. Pre_CSCORE Panel B. Post_CSCORE
Panel A-1. 5 years after
IPO
Panel A-2. 4 years after
IPO
Panel A-3. 3 years after
IPO Panel B-1. 5 years after IPO
Panel B-2. 4 years after
IPO
Panel B-3. 3 years after
IPO
Model 1 Model 2 Model 3 Model 4 Model 5 Model 6 Model 7 Model 8 Model 9 Model 10 Model 11 Model 12
Agei,t -0.198 -0.524* -0.186 -0.448* -0.097 -0.405 -0.432* -0.465** -0.449** -0.477** -0.376* -0.397*
(-0.379) (-1.834) (-0.373) (-1.671) (-0.200) (-1.523) (-1.889) (-2.057) (-2.101) (-2.270) (-1.780) (-1.917)
VCi,t -0.253 -0.416* -0.287 -0.346 -0.210 -0.296 0.036 -0.009 0.015 -0.017 0.059 0.038
(-0.742) (-1.663) (-0.896) (-1.489) (-0.670) (-1.290) (0.203) (-0.056) (0.087) (-0.102) (0.362) (0.242)
MTBi,t -0.025 -0.042* -0.025 -0.039* -0.022 -0.036* -0.051** -0.049** -0.048** -0.046** -0.041** -0.040**
(-0.766) (-1.729) (-0.832) (-1.711) (-0.738) (-1.662) (-2.452) (-2.385) (-2.369) (-2.316) (-2.181) (-2.143)
VOLi,t 24.133*** 20.763*** 24.851*** 21.126*** 24.554*** 20.438*** 19.544*** 19.509*** 20.481*** 20.410*** 19.784*** 19.763***
(4.012) (4.589) (4.233) (4.962) (4.211) (4.919) (4.767) (4.753) (5.156) (5.138) (5.023) (5.020)
MVi,t -0.828**
-0.740* -0.833** -0.665*** -0.835*** -0.524** -0.644*** -0.613*** -0.698***
(-2.039)
(-1.912) (-2.163) (-2.668) (-4.228) (-2.238) (-3.546) (-2.667) (-3.953)
Auditori,t -0.573 -0.881*** -0.432 -0.924*** -0.497 -0.943*** -0.343 -0.373 -0.340 -0.361 -0.371 -0.390
(-1.052) (-2.951) (-0.794) (-3.241) (-0.963) (-3.526) (-1.272) (-1.373) (-1.391) (-1.469) (-1.557) (-1.643)
Under-
writeri,t -0.085
-0.071 -0.056 -0.050
-0.035 -0.025
(-1.077)
(-0.919) (-0.735) (-1.179)
(-0.879) (-0.632)
χ2 78.254*** 84.760*** 78.571*** 92.482*** 77.367*** 94.754*** 225.204*** 211.958*** 223.696*** 214.337*** 218.049*** 213.469***
Log
Likelihood -314.872 -659.854 -334.503 -696.845 -339.185 -707.368 -1229.778 -1230.470 -1299.518 -1299.859 -1319.547 -1319.719
Obs 434 671 434 671 434 671 1120 1120 1120 1120 1120 1120
This table provides the results for the Cox proportional hazard regression model testing the association between CSCORE and the risk of failure. Panel A reports the results
for the Pre_CSCORE analysis and Panel B for the Post_CSCORE analysis. The dependent variable in Panel A-1 and B-1 is the logarithm of the hazards ratio measured as
the number of months from the IPO month to the failure month or 60 months (five years), whichever is earlier for each IPO firm. The dependent variable in Panel A-2 and
B-2 is the logarithm of the hazards ratio measured as the number of months from the IPO month to the failure month or 48 months (four years), whichever is earlier for
each IPO firm. The dependent variable in Panel A-3 and B-3 is the logarithm of the hazards ratio measured as the number of months from the IPO month to the failure
month or 36 months (three years), whichever is earlier for each IPO firm. All accounting variables used in the regression analysis are measured in the same period in which
the conservatism (CSCORE) is measured for consistency. A description of each variable is provided in Table 5-1. *** indicates significance at 1%. **indicates
significance at 5%. * indicates significance at 10%. All continuous variables are winsorized at the 1st and 99
th percentiles.

219
Table 5-7: Multinomial Logit Regressions Testing the Association between Pre_CSCORE and Post-IPO Status of IPO Issuers
Panel A. 5 years after IPO Panel B. 4 years after IPO Panel C. 3 years after IPO
dependent variable dependent variable dependent variable
Independent
Variables Loge(PM/PS) Loge(PN/PS) Loge(PM/PN) Loge(PM/PS) Loge(PN/PS) Loge(PM/PN) Loge(PM/PS) Loge(PN/PS) Loge(PM/PN)
Pre_CSCOREi 0.130 -1.033** 1.163*** 0.053 -0.993** 1.047** 0.292 -0.700 0.992**
(0.626) (-2.569) (2.883) (0.242) (-2.301) (2.347) (1.206) (-1.481) (1.996)
Deficiti,t-1 -0.103 -0.001 -0.102 0.009 -0.020 0.029 0.019 0.032 -0.013
(-1.025) (-0.005) (-0.610) (0.082) (-0.116) (0.149) (0.150) (0.184) (-0.062)
Agei,t -0.244 -1.064** 0.820 -0.250 -1.667*** 1.417** -0.027 -1.223* 1.196
(-0.680) (-2.087) (1.515) (-0.624) (-3.111) (2.337) (-0.064) (-1.885) (1.644)
Underwriteri,t -0.049 -0.112 0.062 -0.014 -0.111 0.097 0.052 -0.177 0.229
(-0.642) (-0.986) (0.529) (-0.162) (-0.962) (0.741) (0.517) (-1.567) (1.595)
VCi,t -0.131 -0.637 0.506 -0.103 -0.901* 0.798* -0.056 -0.517 0.461
(-0.546) (-1.540) (1.186) (-0.405) (-1.920) (1.661) (-0.208) (-1.062) (0.889)
Levi,t-1 0.278 0.636 -0.358 0.129 0.474 -0.345 0.266 0.560 -0.294
(1.039) (1.420) (-0.764) (0.468) (0.997) (-0.672) (0.915) (1.056) (-0.506)
Salesgi,t-1 0.019 0.005 0.014 0.019 -0.010 0.029 0.014 0.014 -0.000
(0.926) (0.134) (0.365) (0.921) (-0.212) (0.620) (0.641) (0.301) (-0.004)
MTBi,t -0.050*** -0.021 -0.028 -0.049*** -0.011 -0.038 -0.041** -0.043 0.002
(-2.994) (-0.640) (-0.823) (-2.727) (-0.326) (-1.096) (-2.210) (-1.135) (0.054)
VOLi,t 7.768* 27.377*** -19.609** 8.614* 33.049*** -24.435*** 8.020 35.390*** -27.371***
(1.669) (3.725) (-2.560) (1.759) (4.248) (-2.929) (1.508) (4.012) (-2.827)
MVi,t 0.181 -0.617 0.798* 0.269 -0.386 0.655 0.105 -0.952* 1.057*
(0.664) (-1.405) (1.726) (0.935) (-0.801) (1.250) (0.320) (-1.673) (1.645)
OCFi,t-1 -0.120 -1.354*** 1.234** -0.437 -1.255** 0.818 -0.406 -1.154** 0.748
(-0.325) (-2.614) (2.194) (-1.093) (-2.274) (1.277) (-0.911) (-1.994) (1.049)
Auditori,t -0.503 -1.037 0.534 -0.483 -0.813 0.330 -0.827 -0.024 -0.804
(-0.844) (-1.531) (0.796) (-0.790) (-1.110) (0.426) (-1.363) (-0.032) (-0.995)

220
Table 5-7
(continued)
Panel A. 5 years after IPO Panel B. 4 years after IPO Panel C. 3 years after IPO
dependent variable dependent variable dependent variable
Independent
Variables Loge(PM/PS) Loge(PN/PS) Loge(PM/PN) Loge(PM/PS) Loge(PN/PS) Loge(PM/PN) Loge(PM/PS) Loge(PN/PS) Loge(PM/PN)
RDi,t-1 -0.102 -1.049 0.948 -0.010 -1.234 1.224 0.191 -1.024 1.215
(-0.229) (-1.022) (0.914) (-0.022) (-0.939) (0.903) (0.388) (-0.661) (0.752)
Constant -1.592 5.515* -7.106** -2.828 3.401 -6.229 -2.694 6.490 -9.185*
(-0.742) (1.686) (-2.115) (-1.261) (0.936) (-1.596) (-1.063) (1.557) (-1.955)
χ2 77.199*** 85.091*** 92.443***
Pseudo_R2 9.0%
9.7%
10.5%
Obs 517 517 517
This table provides the results for the multinomial logit regression model testing the association between Pre_CSCORE and the probability of survival,
failure and being merged within five years of the IPO. S represents survivors, M merged and N involuntarily delisted. Panel A reports the results for IPO
issuers that survive, are merged and involuntarily delisted within five years of the IPO and Panel B and C report the results for four and three years of the
IPO, respectively. All accounting variables used in the regression analysis are measured in the same period in which the conservatism (CSCORE) is
measured for consistency. A description of each variable is provided in Table 5-1. *** indicates significance at 1%. **indicates significance at 5%. *
indicates significance at 10%. All continuous variables are winsorized at the 1st and 99
th percentiles.

221
Table 5-8: Multinomial Logit Regressions Testing the Association between Post_CSCORE and Post-IPO Status of IPO
Panel A. 5 years after IPO Panel B. 4 years after IPO Panel C. 3 years after IPO
dependent variable dependent variable dependent variable
Independent
Variables Loge(PM/PS) Loge(PN/PS) Loge(PM/PN) Loge(PM/PS) Loge(PN/PS) Loge(PM/PN) Loge(PM/PS) Loge(PN/PS) Loge(PM/PN)
Post_CSCOREi -0.089 0.217 -0.305 -0.138 0.118 -0.256 0.065 0.004 0.061
(-0.389) (0.589) (-0.817) (-0.569) (0.302) (-0.621) (0.238) (0.009) (0.120)
Deficiti,t -0.147 -0.284 0.137 -0.078 -0.115 0.037 -0.049 -0.047 -0.002
(-0.942) (-1.349) (0.653) (-0.493) (-0.495) (0.147) (-0.285) (-0.194) (-0.008)
Agei,t -0.571*** -0.949*** 0.378 -0.515** -1.151*** 0.636* -0.435* -1.079*** 0.644
(-2.851) (-3.056) (1.180) (-2.385) (-3.407) (1.745) (-1.807) (-2.880) (1.552)
Underwriteri,t 0.008 -0.098* 0.106* 0.069 -0.047 0.116 0.067 -0.043 0.109
(0.176) (-1.725) (1.709) (1.338) (-0.779) (1.609) (1.138) (-0.633) (1.312)
VCi,t 0.139 -0.313 0.452* 0.196 -0.261 0.457 0.396** -0.186 0.582*
(0.885) (-1.267) (1.770) (1.173) (-0.975) (1.604) (2.115) (-0.624) (1.775)
Levi,t 1.183*** 2.110*** -0.927* 1.001*** 2.364*** -1.363*** 1.202*** 2.456*** -1.255**
(3.335) (4.418) (-1.949) (2.719) (4.824) (-2.613) (3.017) (4.850) (-2.181)
Salesgi,t -0.004 -0.036 0.032 0.007 -0.053 0.061 0.009 -0.076 0.085
(-0.215) (-0.840) (0.761) (0.379) (-1.104) (1.245) (0.419) (-1.515) (1.616)
MTBi,t -0.022** -0.037 0.015 -0.023** -0.041* 0.018 -0.020 -0.064** 0.044
(-2.076) (-1.641) (0.677) (-2.065) (-1.774) (0.754) (-1.629) (-2.383) (1.563)
VOLi,t 11.386*** 24.745*** -13.359** 13.672*** 30.506*** -16.835*** 12.794*** 34.645*** -21.851***
(2.878) (4.730) (-2.510) (3.301) (5.753) (-2.919) (2.762) (5.712) (-3.162)
MVi,t 0.218 -0.197 0.415 0.149 0.003 0.146 0.048 -0.286 0.334
(1.231) (-0.702) (1.407) (0.782) (0.010) (0.435) (0.225) (-0.832) (0.868)
OCFi,t -0.650 -3.524*** 2.874*** -0.433 -3.467*** 3.034*** -0.252 -3.986*** 3.735***
(-1.372) (-5.004) (4.329) (-0.898) (-4.794) (4.082) (-0.485) (-5.043) (4.434)
Auditori,t 0.135 -0.407 0.542 0.127 -0.562 0.689 0.009 -0.589 0.598
(0.354) (-1.110) (1.317) (0.309) (-1.439) (1.436) (0.019) (-1.512) (1.127)

222
Table 5-8
(continued)
Panel A. 5 years after IPO Panel B. 4 years after IPO Panel C. 3 years after IPO
dependent variable dependent variable dependent variable
Independent
Variables Loge(PM/PS) Loge(PN/PS) Loge(PM/PN) Loge(PM/PS) Loge(PN/PS) Loge(PM/PN) Loge(PM/PS) Loge(PN/PS) Loge(PM/PN)
RDi,t -0.071 -2.987** 2.917** -0.277 -2.377* 2.100 -0.861 -2.206 1.345
(-0.089) (-2.305) (2.260) (-0.333) (-1.745) (1.472) (-0.940) (-1.581) (0.883)
Constant -2.998** 0.025 -3.023 -3.344** -2.404 -0.940 -3.197** -0.856 -2.341
(-2.361) (0.012) (-1.464) (-2.466) (-1.097) (-0.400) (-2.105) (-0.348) (-0.862)
χ2 224.070*** 228.015*** 206.101***
Pseudo_R2 10.8%
10.9%
12.8%
Obs 1278 1278 1278
This table provides the results for the multinomial logit regression model testing the association between Post_CSCORE and the probability of survival,
failure and being merged within five years of the IPO. S represents survivors, M merged and N involuntarily delisted. Panel A reports the results for IPO
issuers that survive, are merged and involuntarily delisted within five years of the IPO and Panel B and C report the results for four and three years of the
IPO, respectively. All accounting variables used in the regression analysis are measured in the same period in which the conservatism (CSCORE) is
measured for consistency. A description of each variable is provided in Table 5-1. *** indicates significance at 1%. **indicates significance at 5%. *
indicates significance at 10%. All continuous variables are winsorized at the 1st and 99
th percentiles.

223
Table 5-9: IPO Firms Making Acquisitions within Five Years of the IPO
Panel A. Acquisition within n years after IPO
1 year 2 years 3 years 4 years 5 years
No. of acquirers
(cumulative) 116 186 248 299 339
percentage 5% 7% 14% 19% 25%
No. of Surviving IPOs 2307 2604 1777 1566 1375
Panel B. Yearly distribution of IPO firms' acquisitions
IPO year No of
firms Average time to acquire (No of days)
1990 12 638
1991 18 699
1992 33 1127
1993 33 805
1994 26 810
1995 32 798
1996 51 584
1997 31 451
1998 21 784
1999 23 623
2000 17 796
2001 1 1827
2002 4 566
2003 4 599
2004 14 703
2005 19 660
Total 339
Sample firms consist of U.S. firms that went IPO during the period of 1990 – 2005.
This chapter follows the IPOs that survived for five years at least after their IPO and
thus the sample period covers 1990-2010. Panel A reports the number of IPO
survivors that make acquisitions within five years of the IPO. Panel B provides the
distribution of IPO acquirers by their IPO year.
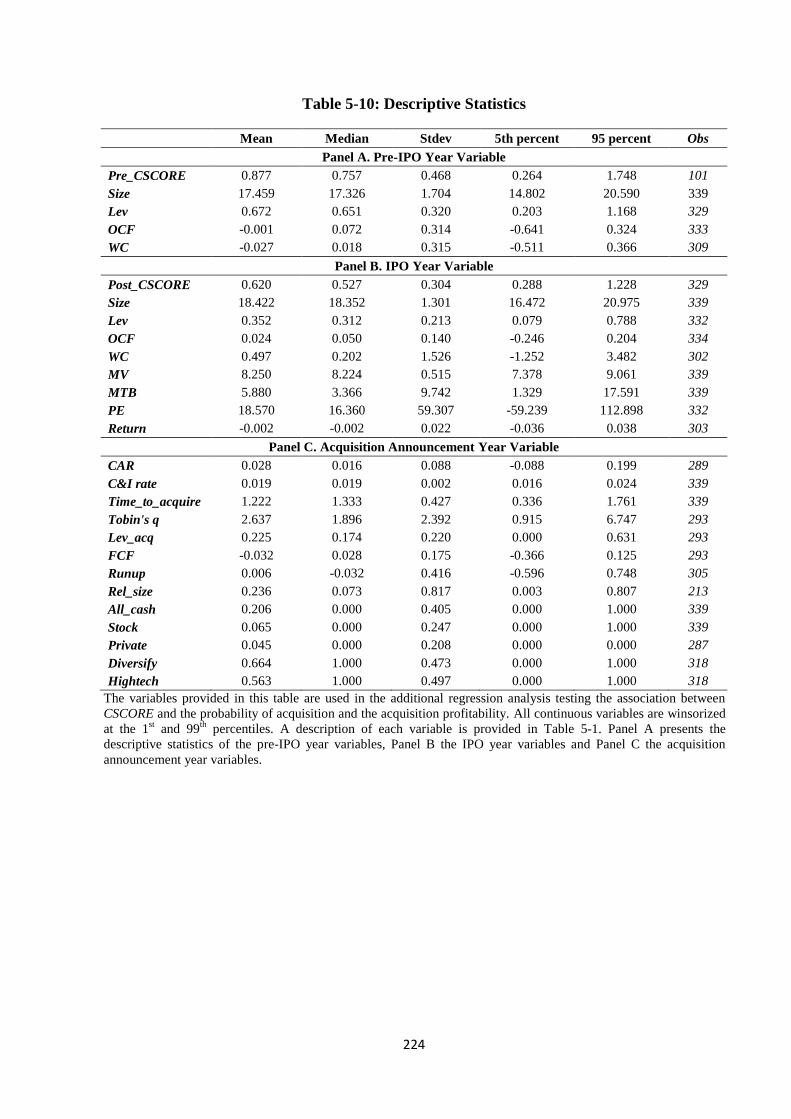
224
Table 5-10: Descriptive Statistics
Mean Median Stdev 5th percent 95 percent Obs
Panel A. Pre-IPO Year Variable
Pre_CSCORE 0.877 0.757 0.468 0.264 1.748 101
Size 17.459 17.326 1.704 14.802 20.590 339
Lev 0.672 0.651 0.320 0.203 1.168 329
OCF -0.001 0.072 0.314 -0.641 0.324 333
WC -0.027 0.018 0.315 -0.511 0.366 309
Panel B. IPO Year Variable
Post_CSCORE 0.620 0.527 0.304 0.288 1.228 329
Size 18.422 18.352 1.301 16.472 20.975 339
Lev 0.352 0.312 0.213 0.079 0.788 332
OCF 0.024 0.050 0.140 -0.246 0.204 334
WC 0.497 0.202 1.526 -1.252 3.482 302
MV 8.250 8.224 0.515 7.378 9.061 339
MTB 5.880 3.366 9.742 1.329 17.591 339
PE 18.570 16.360 59.307 -59.239 112.898 332
Return -0.002 -0.002 0.022 -0.036 0.038 303
Panel C. Acquisition Announcement Year Variable
CAR 0.028 0.016 0.088 -0.088 0.199 289
C&I rate 0.019 0.019 0.002 0.016 0.024 339
Time_to_acquire 1.222 1.333 0.427 0.336 1.761 339
Tobin's q 2.637 1.896 2.392 0.915 6.747 293
Lev_acq 0.225 0.174 0.220 0.000 0.631 293
FCF -0.032 0.028 0.175 -0.366 0.125 293
Runup 0.006 -0.032 0.416 -0.596 0.748 305
Rel_size 0.236 0.073 0.817 0.003 0.807 213
All_cash 0.206 0.000 0.405 0.000 1.000 339
Stock 0.065 0.000 0.247 0.000 1.000 339
Private 0.045 0.000 0.208 0.000 0.000 287
Diversify 0.664 1.000 0.473 0.000 1.000 318
Hightech 0.563 1.000 0.497 0.000 1.000 318
The variables provided in this table are used in the additional regression analysis testing the association between
CSCORE and the probability of acquisition and the acquisition profitability. All continuous variables are winsorized
at the 1st and 99
th percentiles. A description of each variable is provided in Table 5-1. Panel A presents the
descriptive statistics of the pre-IPO year variables, Panel B the IPO year variables and Panel C the acquisition
announcement year variables.

225
Table 5-11: Pearson Correlation Matrix for Regression Analysis Testing the Association between Pre_CSCORE and the
Probability of Acquisition
Pre_CSCOREi C&I ratei,t Returni,t WCi,t Levi,t-1 MTBi,t PEi,t OCFi,t-1
C&I ratei,t 0.410***
Returni,t -0.130*** 0.023
WCi,t -0.169*** -0.045** 0.025
Levi,t-1 0.065* -0.048** 0.018 -0.010
MTBi,t -0.020 0.017 0.019 -0.014 0.074***
PEi,t -0.042 -0.032 0.047** 0.061*** -0.011 -0.020
OCFi,t-1 -0.170*** -0.032 0.020 0.136*** -0.053** -0.068*** 0.211***
Sizei,t-1 -0.202*** 0.239*** 0.038* 0.337*** -0.021 -0.044** 0.023 0.361***
The accounting variables used for the Pre_CSCORE regression analysis are obtained from the pre-IPO fiscal year since Pre_CSCORE
is also measured over the pre-IPO year. *** indicates significance at 1%. **indicates significance at 5%. * indicates significance at
10%. All continuous variables are winsorized at the 1st and 99
th percentiles. A description of each variable is provided in Table 5-1.
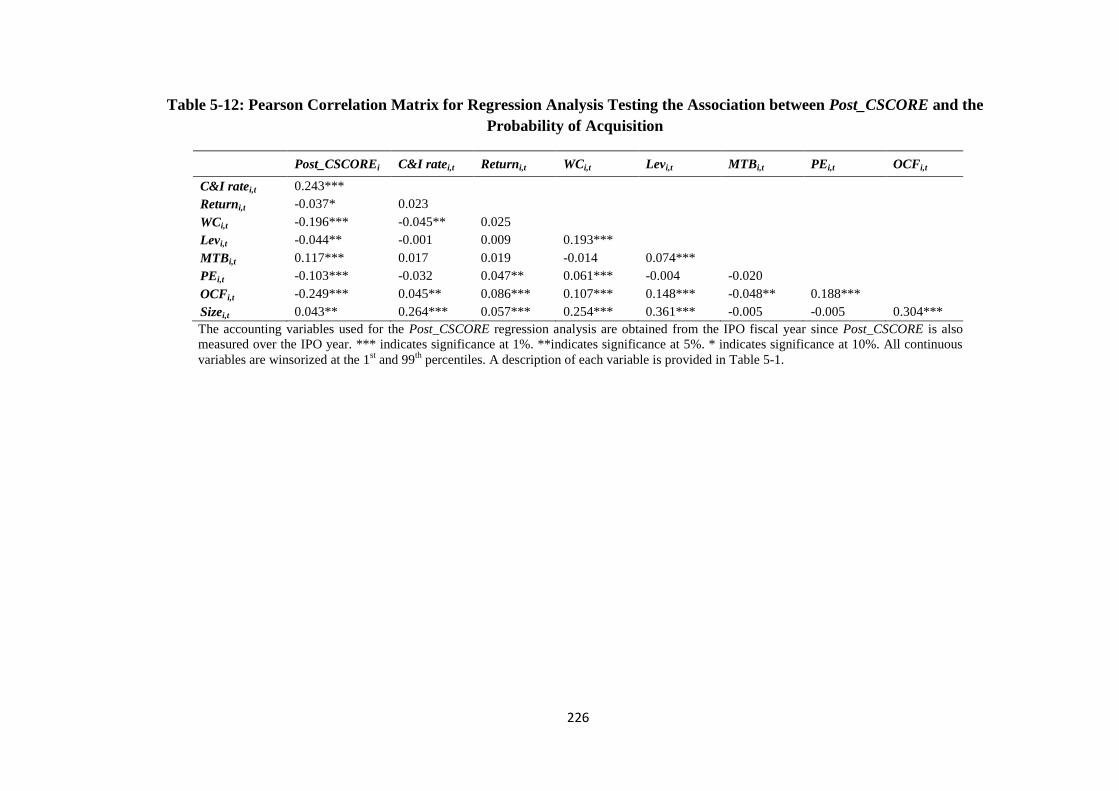
226
Table 5-12: Pearson Correlation Matrix for Regression Analysis Testing the Association between Post_CSCORE and the
Probability of Acquisition
Post_CSCOREi C&I ratei,t Returni,t WCi,t Levi,t MTBi,t PEi,t OCFi,t
C&I ratei,t 0.243***
Returni,t -0.037* 0.023
WCi,t -0.196*** -0.045** 0.025
Levi,t -0.044** -0.001 0.009 0.193***
MTBi,t 0.117*** 0.017 0.019 -0.014 0.074***
PEi,t -0.103*** -0.032 0.047** 0.061*** -0.004 -0.020
OCFi,t -0.249*** 0.045** 0.086*** 0.107*** 0.148*** -0.048** 0.188***
Sizei,t 0.043** 0.264*** 0.057*** 0.254*** 0.361*** -0.005 -0.005 0.304***
The accounting variables used for the Post_CSCORE regression analysis are obtained from the IPO fiscal year since Post_CSCORE is also
measured over the IPO year. *** indicates significance at 1%. **indicates significance at 5%. * indicates significance at 10%. All continuous
variables are winsorized at the 1st and 99
th percentiles. A description of each variable is provided in Table 5-1.

227
Table 5-13: Probit and Duration Regression Analysis Testing the Association
between CSCORE and the Probability of Making Acquisitions within Five Years of
the IPO
Panel A. Probit Model Panel B. Cox Proportional Hazard Model
Model 1 Model 2 Model 3 Model 4
Pre_CSCOREi 0.409*** Pre_CSCOREi 0.576**
(2.621)
(2.368)
Post_CSCOREi -0.198 Post_CSCOREi
-0.260
(-1.408)
(-1.115)
Sizei,t-1 0.143**
Sizei,t-1 0.240**
(2.520)
(2.533)
Sizei,t 0.116*** Sizei,t
0.206***
(2.702)
(2.860)
Levi,t-1 -0.313* Levi,t-1 -0.523*
(-1.862)
(-1.708)
Levi,t 0.324* Levi,t
0.547*
(1.691)
(1.719)
OCFi,t-1 0.085
OCFi,t-1 0.150
(0.448)
(0.415)
OCFi,t 1.216*** OCFi,t
2.050***
(4.811)
(4.563)
C&I ratei,t -86.387*** -19.579 C&I ratei,t -136.789*** -41.448
(-2.829) (-1.152)
(-2.617) (-1.444)
Returni,t 3.674 1.302 Returni,t 5.599 1.509
(1.497) (0.800)
(1.314) (0.540)
WCi,t 0.032 -0.022 WCi,t 0.038 -0.038
(0.812) (-0.796)
(0.604) (-0.925)
MTBi,t 0.003 0.012** MTBi,t 0.004* 0.018**
(1.483) (2.117)
(1.794) (2.117)
PEi,t -0.000 -0.000 PEi,t 0.000 -0.000
(-0.035) (-0.250)
(0.019) (-0.132)
Constant -2.162** -2.776***
(-2.181) (-3.869)
χ
2 22.022*** 65.073*** χ
2 25.363*** 66.165***
Pseudo_R2 4.0% 4.3% Log Likelihood -461.88 -1757.21
Obs 619 1656 Obs 619 1656
This table reports the regression results testing the association between CSCORE and the
probability of acquisitions. Panel A provides the results for the probit regression model in which
the dependent variable is Acquisition that equals one if the IPO firm makes acquisitions within five
years of the IPO and otherwise zero. Panel B provides the results for the Cox Proportional hazard
model. The dependent variable is the logarithm of the hazards ratio measured as the number of
months from the IPO month to the acquisition announcement month or 60 months (five years),
whichever is earlier for each IPO firm. All accounting variables used in the regression analysis are
measured in the same period in which the conservatism (CSCORE) is measured for consistency .A
description of each variable is provided in Table 5-1. *** indicates significance at 1%. **indicates
significance at 5%. * indicates significance at 10%. All continuous variables are winsorized at the
1st and 99
th percentiles.

228
Table 5-14: Pearson Correlation Matrix for Regression Analysis Testing the Association between CSCORE and Acquisition
Profitability
Post_
CSCOREi Tobin's qi,t Lev_acqi,t FCFi,t Runupi,t Rel_sizei,t All_cashi,t Stocki,t Privatei,t Diversifyi,t Hightechi,t
Pre_
CSCOREi
Tobin's qi,t -0.034
Lev_acqi,t 0.053 -0.218***
FCFi,t -0.245*** 0.066 -0.017
Runupi,t -0.087* 0.377*** 0.008 0.172***
Rel_sizei,t 0.071 -0.120** 0.168*** -0.046 -0.096*
All_cashi,t -0.036* -0.022 -0.037 0.086* 0.012 -0.118**
Stocki,t 0.017 0.232*** -0.121*** -0.054 0.054 0.034 -0.025
Privatei,t 0.010 0.018 -0.064 0.078 -0.017 0.036 0.060 -0.009
Diversifyi,t 0.044 0.041 0.089** -0.008 0.053 0.035 -0.008 -0.119*** 0.005
Hightechi,t 0.225*** 0.278*** -0.273*** -0.114** -0.066 0.021 0.046 0.125*** 0.024 -0.043
Pre_
CSCOREi 0.416*** 0.041 -0.009 -0.184** -0.114 0.203** 0.051 0.033 0.016 0.149** 0.290***
MVi,t 0.223*** 0.103** 0.046 -0.074* 0.008 0.016 0.040* 0.007 0.019 0.104** 0.121*** 0.067*
*** indicates significance at 1%. **indicates significance at 5%. * indicates significance at 10%. All continuous variables are winsorized at the 1st and 99
th percentiles. A description of each
variable is provided in Table 5-1.

229
Table 5-15. Regression Analysis Testing the Association between CSCORE and
Acquisition Profitability
Model 1 Model 2
Pre_CSCOREi 0.029*
(1.715)
Post_CSCOREi 0.033**
(2.072)
MVi,t -0.019 0.004
(-1.315) (0.394)
Tobin's qi,t 0.001 -0.003
(0.200) (-1.249)
Lev_acqi,t -0.014 -0.015
(-0.344) (-0.638)
FCFi,t -0.026 0.027
(-0.630) (0.889)
Runupi,t -0.032 -0.012
(-1.429) (-0.885)
Rel_sizei,t -0.002 0.002
(-0.362) (0.282)
All_cashi,t -0.024 -0.011
(-1.467) (-0.965)
Stocki,t -0.137** -0.024
(-2.567) (-1.064)
Privatei,t -0.005 -0.005
(-0.066) (-0.199)
Diversifyi,t -0.005 -0.025**
(-0.338) (-2.269)
Hightechi,t -0.029 -0.023**
(-1.493) (-1.970)
Constant 0.203 0.018
(1.660) (0.214)
F-Stats 1.644* 1.886**
Adj. R2 8.4% 3.7%
Obs 85 280
This table reports the regression results testing the association between CSCORE and the
acquisition profitability. The dependent variable is three-day cumulative abnormal stock returns
calculated using the CRSP value-weighted return as the market index .A description of each
variable is provided in Table 5-1. *** indicates significance at 1%. **indicates significance at
5%. * indicates significance at 10%. All continuous variables are winsorized at the 1st and 99
th
percentiles.

230
Chapter Six
Conclusion
6.1 Summary of Findings
This thesis investigates whether IPO firms adopt a high degree of conservatism in
response to investors’ demand for high quality earnings and whether these firms
subsequently experience stock market benefits in the post-issue market. The accounting
literature suggests that conservative reporting policy can mitigate managerial
opportunistic behavior by enforcing timely recognition of expected losses, thereby
reducing information asymmetries between managers and outside investors (e.g., Watts
2002; LaFond & Watts 2008). This thesis hypothesizes that the benefits of conservatism
should be more evident for IPO firms as there is inherently high information asymmetry
in the IPO market due to the lack of publicly available information for outside investors.
As a result, accounting information plays an important role in providing investors with
information regarding a firm’s past and expected future performance. Thus, the IPO
environment provides an important research setting to investigate whether firms adopt a
higher degree of conservatism in response to information asymmetry and whether the
firms adopting higher conservatism experience various stock market benefits by
providing investors with higher quality earning information.
Based on a large sample of U.S. common stock initial offerings during the period 1990
to 2010, this thesis investigates the extent to which accounting conservatism adopted by
IPO firms significantly affects: (1) IPO underpricing and long-term stock return

231
performance, (2) the probability of seasoned equity issue (SEO) in the post-IPO market
and the costs associated with the SEO, and (3) the longevity of IPO firms.
Chapter 3 examines changes in conservatism of IPO issuers and provides evidence that
the conservatism measured in the pre-IPO year is significantly higher than that
measured in the post-IPO periods. In addition, IPO issuers’ conservatism is
significantly higher than that of non-IPO performance matched firms both in the pre-
and IPO year, suggesting that IPO firms adopt a more conservative reporting policy, on
average, in response to high information asymmetry. Further, the results of Chapter 3
suggest that issuers’ pre-IPO year conservatism is significantly and negatively
associated with the degree of underpricing. However, this negative association holds
only for issuers with high information asymmetry, suggesting that the benefit of
adopting higher conservatism, namely a lower indirect cost of issuing the IPO, appears
to exist only for issuers suffering from high information asymmetry. Moreover, this
result also indicates that the extent to which conservatism affects IPO underpricing also
depends on the level of information asymmetry a firm is exposed to.
An analysis of IPO stock return performance is also provided in Chapter 3. When firms
are divided into four groups depending on the extent of their conservatism measured in
the pre-IPO and IPO year, Conservative to Conservative, Conservative to Aggressive,
Aggressive to Conservative and Aggressive to Aggressive, the result suggests that firms
reporting less conservatively in the pre-IPO year, but more conservatively in the IPO
year (Aggressive to Conservative group) perform significantly better in the stock market
over five years of return windows. This result is consistent across alternative return
measurements. This thesis hypothesized that firms adopting a higher degree of

232
conservatism would show better stock return performance as investors reward firms
providing higher quality accounting information, forgoing managerial incentives
associated with reporting higher earnings when there is higher information asymmetry.
However, the result indicates that issuers adopting higher conservatism in the pre-IPO
year do not perform well in the post-issue stock market, while those reporting more
conservatively in the IPO year outperform those with lower conservatism. This result
may indicate that IPO firms adopt a higher degree of conservatism for different
reporting incentives in the pre-IPO year. For instance, firms expecting poor
performance in the after-market may adopt a higher degree of conservatism prior to
going public to protect themselves from potential litigation after the issue. In such cases,
equity investors would not necessarily reward these firms for adopting higher
conservatism.
Chapter 4 investigates whether IPO firms adopting a higher degree of conservatism are
more likely to reissue equity soon after their IPO on more favorable terms. The result
suggests that issuers adopting a higher degree of conservatism are less likely to reissue
equity within five years of the IPO. This finding suggests that these issuers do not have
short-term cash needs after their IPO. To test whether issuers with higher conservatism
are less likely to raise cash again soon after their IPO, this chapter also investigates the
association between conservatism and the probability of divesting assets. The results
indicate that conservatism is not significantly associated with the divestiture probability,
supporting the view that IPO firms adopting higher conservatism do not have short-term
cash needs soon after their IPO. Findings of this chapter also suggest that the pre-IPO
year conservatism is significantly and positively associated with the SEO
announcement returns, showing that firms adopting a higher degree of conservatism

233
prior to going public experience less negative announcement returns for their next
seasoned equity financing within five years of their IPO. However, conservatism
measured in the IPO year and the year prior to the SEO announcement are not
significantly associated with SEO announcement returns.
Chapter 4 also examines whether issuers’ conservatism is significantly associated with
SEO underpricing. The result indicates that the pre-IPO year conservatism is
significantly and negatively associated with the degree of SEO underpricing. Further,
the analysis of post-SEO stock return performance provides weak evidence that firms
adopting a higher degree of conservatism in the pre-IPO year tend to perform better in
the post-SEO market. Finally, chapter 4 investigates whether the positive effect of IPO
issuers’ conservatism on SEO announcement returns and SEO underpricing
significantly changes depending on issuers’ level of information asymmetry. The results
indicate that information asymmetry does not significantly affect these associations.
Taken together, the results of Chapter 4 suggest that issuers adopting a higher degree of
conservatism prior to going public raise their next equity finance on more favorable
terms soon after their IPO and issuers experience such benefits regardless of the extent
of the information asymmetry.
Chapter 5 provides the longevity analysis of IPO firms. The results from the Cox
Proportional Hazard model indicate that firms adopting a higher degree of conservatism
in the pre-IPO year face less risk of failure and survive longer in the stock market.
Multinomial logit regressions are also employed to examine whether IPO issuers’
conservatism can predict the probability of getting delisted due to involuntary delistings
or being a takeover target within five years of their IPO. The results indicate that the

234
surviving IPO issuers are more likely to adopt higher conservatism in the pre-IPO year
relative to those that are involuntarily delisted. Additionally, firms who are delisted as a
takeover target are more likely to adopt a higher degree of conservatism in the pre-IPO
year relative to those that are involuntarily delisted. However, IPO year conservatism
fails to predict survival rates. Chapter 5 also investigates whether firms adopting a
higher degree of conservatism are more likely to acquire another entity within five
years of their IPO. The results suggest that firms adopting a higher degree of
conservatism in the pre-IPO year are more likely to acquire another firm and gain
higher acquisition announcement returns within five years of their IPO. This finding
could indicate that firms adopting a higher degree of conservatism in the pre-IPO year
demonstrate higher survival rates as a large portion of these firms choose to go public to
make efficient acquisitions as a public firm in the post-IPO market.
Prior research on IPOs suggests that firms have a specific motive for going public (see
Jain & Kini 1999). One potential explanation as to why firms go public is that firms
with high growth prospects go public to finance investments and to achieve expansion
by acquiring other entities (Brau & Fawcett 2006; Celikyurt et al. 2010). Another
potential explanation for going public is that entrepreneurs who see performance
declines in their investments seek to divest their holdings through an IPO prior to
failure (see Jain & Kini 1999). Accordingly, studies on IPO failure report that about one
third of IPO firms, on average, are delisted within five years of their IPO (e.g., Fama
and French 2004; Jain & Kini 2008, 1999). However, previous studies also document
that 17% to 37% of their IPO sample firms are delisted as they are acquired within five
years of their IPO (e.g., Audretsch & Lehmann 2007; Jain & Kini 2008, 1999;
Mikkelson et al. 1997). As a consequence, if an issuer has one of the aforementioned

235
motives for its public offering decision, it is more likely to be able to predict its post-
IPO outcome prior to going public. IPOs involve raising capital from outside investors
for a firm which was previously private (Jog & McConomy 2003). Consequently, IPO
issuers with good earnings potential and growth prospects will recognize the
importance of their long-term prospects in the stock market and thus have more
incentive to provide higher quality earnings to credibly signal their credentials to the
IPO market prior to going public. This can suggest that the pre-IPO earnings
information provided by issuers can convey important information about the quality of
an IPO. Consistent with this argument, the evidence of this thesis suggests that issuers
providing higher quality earnings information by adopting a more conservative
reporting policy in the pre-IPO year survive longer in the stock market, and issue their
seasoned equity offerings and acquire another entity after their IPO on more favorable
terms. In conclusion, the findings of this thesis support the view that pre-IPO
accounting information has direct relevance in predicting the post-IPO status and
performance of the issuing firm.
6.2. Contribution and Implications
This thesis makes a significant contribution to the literature on accounting conservatism
by providing empirical evidence that firms adopting a higher degree of conservatism
experience various benefits that capital markets offer in response to less uncertainty and
less information asymmetry. These findings also have an important implication for
accounting standard setters, policy makers and regulators associated with the IPO
market by suggesting that accounting conservatism can contribute to resolving
information asymmetry problems in the IPO market.

236
The majority of past research studying the stock return performance of IPO firms,
notably Teoh et al. (1998a), has attributed the significant underperformance of IPO
firms to earnings management. However, more recent studies suggest that IPO firms do
not engage in earnings management. In fact, Ball and Shivakumar (2008) find evidence
that U.K. firms report earnings more conservatively before they go public due to higher
monitoring by different parties, such as auditors, boards, analysts, rating agencies, the
press and litigants. Venkataraman et al. (2008) also find that pre-IPO accruals tend to
be negative and less than IPO year accruals. These studies call into question the validity
of discretionary accrual estimates used to measure earnings management by IPO firms.
Consequently, this thesis supports the view of Ball and Shivakumar (2008) and
Venkataraman et al. (2008) by providing further evidence that U.S. IPO issuers report
earnings more conservatively, on average, prior to going public. In particular, the
results of this thesis suggest that IPO issuers choose to adopt a more conservative
reporting policy in response to high information asymmetry, despite there being greater
incentives associated with reporting higher earnings before they go public.
The results of this thesis also suggest that IPO firms adopting a higher degree of
conservatism prior to going public experience various stock market benefits, such as
lower IPO underpricing, less negative SEO announcement returns, lower SEO
underpricing, higher survival rates and more profitable acquisitions. These findings all
indicate that the stock market benefits of adopting a higher degree of conservatism prior
to going public are long-term benefits that do not disappear soon after the IPO.
Conservative reporting policy is costly because managers have incentives to report
positive financial results to increase their compensation and enhance their reputations
for their job security. In particular, for IPO firms, managers have greater incentives to

237
opportunistically manage earnings upward prior to going public to positively affect
offer price. However, this thesis provides empirical evidence that IPO firms adopting a
higher degree of conservatism, forgoing managerial incentives associated with reporting
better financial results, gain various long-term stock market benefits. Consequently, this
thesis suggests that benefits associated with adopting a more conservative policy prior
to going public significantly outweigh the costs associated with reporting reduced
earnings under conservatism.
The FASB removed conservatism as a qualitative characteristic of financial reporting in
2010 because they argue that conservatism is inconsistent with neutrality. Contrary to
the view of the FASB and the IASB that conservatism biases accounting numbers and
compromises financial reporting quality, the findings of this thesis suggest that
conservatism reduces information asymmetry by providing outside investors with
higher quality accounting information, thereby enabling firms to gain various stock
market benefits in the IPO market. Accordingly, this thesis suggests that in the absence
of conservatism, information quality of financial statements may be jeopardized in the
IPO environment, leading to higher information asymmetry between firm insiders and
outside investors. Thus, this thesis raises the alarm in support of the proponents of
conservatism who urge that accounting standard setters and policy makers may need to
consider the costs of avoiding conservatism, especially when investors have
significantly less information available to them than do the managers of firms.

238
6.3. Potential Limitations
Givoly et al. (2007) advise that when measuring conservatism, a single measure of
conservatism should not be used. They argue that conservative reporting is driven by
the firm’s overall reporting system and using one measure of conservatism leads to only
focusing on one of many different features. As a result, this will not provide an accurate
assessment of the overall degree of conservatism exhibited by the reporting entity.
Therefore, they suggest that multiple measures of conservatism should be used to fully
capture the overall reporting conservatism of the firm. However, due to the lack of
market data available for IPO firms, in particular in the pre-IPO fiscal year, as discussed
in Section 3.3.1 of the thesis, this thesis employs a single measure of accounting
conservatism based on the modified Ball and Shivakumar’s (2005) asymmetric accruals
to cash-flow measure. However, unlike Basu’s (1997) asymmetric timeliness of
earnings measure that has recently been criticized in terms of its construct validity and
econometric properties (see Dietrich et al. 2007; Givoly et al. 2007), no study has yet
reported potential estimation error for the Ball and Shivakumar’s (2005) measure.
Furthermore, potential estimation issues associated with a single measure of
conservatism is inherent in any conservatism research being conducted in the setting
where the market data is not readily available, such as private and IPO firms.
This thesis also recognizes that it cannot be ruled out that the alternative explanation
that CSCOREs estimated in this thesis may proxy for other important factors than
conservatism such as governance mechanisms that may have a direct effect on IPO
firms and lead to better post-IPO outcomes.

239
6.4. Suggestions for Further Research
Future research could investigate the association between conservatism and earnings
management. It is often mistakenly thought that conservatism and earnings
management have a mirror effect. For instance, one may expect that firms reporting
earnings aggressively using high levels of discretionary accruals may be considered to
be adopting a less conservative policy. However, the association between conservatism
and earnings management represents an empirical question because firms adopting a
low degree of conservatism are not necessarily managing earnings. Similarly, firms
managing earnings downward via big bath charges are not necessarily adopting a
conservative accounting policy. Previous studies document that conservatism and
earnings management are different reporting attributes and need to be discriminated
(see Givoly & Hayn 2000; Watts 2002). This is because discretionary accruals used to
manipulate earnings upward or downward have to be reversed out in the near future,
while conservatism is a firm characteristic that is fixed over a fairly long period of time.
In particular, as discussed above, prior research on earnings management and
conservatism provides different empirical results on IPO studies. For instance, the
earnings management literature suggests that IPO firms manage their earnings upward
to positively affect their initial price (e.g., Teoh et al. 1998a; Teoh et al. 1998c).
However, the conservatism research literature provides evidence that firms report their
earnings more conservatively prior to going public (see Ball & Shivakumar 2008;
Venkataraman et al. 2008). Therefore, it would be interesting to examine how the
extent of conservatism is associated with earnings management and whether
conservatism reduces the probability of earnings management.

240
Future research could also investigate whether conservatism achieves efficient
contracting that provides optimal compensation for managers, aligning managerial
incentives with those of shareholders. Conservatism affects accounting measures used
in management compensation and employment contracts. Prior research suggests that
conservatism improves contracting efficiencies by enforcing more stringent rules
required for potentially favorable information that can cause positive bias to
management compensation (see e.g., Ahmed et al. 2002; Watts 2002). Specifically,
firms can prevent over-payments to managers and improve the efficiency of managerial
compensation by adopting a more conservative reporting policy that reduces the
reported amounts of net assets and earnings. However, no study thus far has examined
whether conservatism also results in management compensation contracting that
provides sufficient incentives for management. Reducing potential over-payment for
managers does not solely guarantee efficient compensation for contracting purposes.
Thus, future research could investigate whether conservatism leads to optimal
compensation that can achieve efficient contracting for managers.

241
Reference List
Aharony, J, Lin, C-J & Loeb, MP 1993, 'Initial public offerings, accounting choices,
and earnings management', Contemporary Accounting Research, vol. 10, no. 1, pp. 61-
81.
Ahmed, AS, Billings, BK, Morton, RM & Stanford-Harris, M 2002, 'The role of
accounting conservatism in mitigating bondholder-shareholder conflicts over dividend
policy and in reducing debt costs', The Accounting Review, vol. 77, no. 4, pp. 867-890.
Ahmed, AS & Duellman, S 2007, 'Accounting conservatism and board of director
characteristics: an empirical analysis', Journal of Accounting and Economics, vol. 43,
no. 2-3, pp. 411-437.
—— 2011, 'Evidence on the role of accounting conservatism in monitoring managers'
investment decisions', Accounting & Finance, vol. 51, no. 3, pp. 609-633.
—— 2013, 'Managerial overconfidence and accounting conservatism', Journal of
Accounting Research, vol. 51, no. 1, pp. 1-30.
Alam, P & Petruska, KA 2012, 'Conservatism, SEC investigation, and fraud', Journal of
Accounting and Public Policy, vol. 31, no. 4, pp. 399-431.
Alexander, JC 1991, 'Do the merits matter? A study of settlements in securities class
actions', Stanford Law Review, vol. 43, no. 3, pp. 497-598.
Allen, F & Faulhaber, GR 1989, 'Signalling by underpricing in the IPO market', Journal
of Financial Economics, vol. 23, no. 2, pp. 303-323.
Altman, EI 1968, 'Financial ratios, discriminant analysis and the prediction of corporate
bankruptcy', Journal of Finance, vol. 23, no. 4, pp. 589-609.
Andrade, G & Stafford, E 2004, 'Investigating the economic role of mergers', Journal of
Corporate Finance, vol. 10, no. 1, pp. 1-36.

242
Artiach, TC & Clarkson, PM 2011, 'Conservatism, disclosure and the cost of equity
capital', SSRN eLibrary.
Audretsch, DB & Lehmann, EE 2007, 'Mergers and acquisitions in IPO markets:
evidence from Germany', in NG Greg & R Luc (eds), International Mergers and
Acquisitions Activity Since 1990, Academic Press, Boston, pp. 169-179.
Balachandran, S & Mohanram, P 2011, 'Is the decline in the value relevance of
accounting driven by increased conservatism?', Review of Accounting Studies, vol. 16,
no. 2, pp. 272-301.
Balachandran, SV & Mohanram, PS 2006, Conservatism and the value relevance of
accounting information, working paper, Columbia Business School.
Ball, R 2001, Infrastructure requirements for an economically efficient system of public
financial reporting an disclosure, Brookings-Wharton Papers on Financial Services,
Brookings Institution Press.
Ball, R, Kothari, SP & Nikolaev, V 2010, 'Econometrics of the Basu asymmetric
timeliness coefficient and accounting conservatism', SSRN eLibrary.
Ball, R, Kothari, SP & Robin, A 2000, 'The effect of international institutional factors
on properties of accounting earnings', Journal of Accounting & Economics, vol. 29, no.
1, pp. 1-51.
Ball, R & Shivakumar, L 2005, 'Earnings quality in UK private firms: comparative loss
recognition timeliness', Journal of Accounting & Economics, vol. 39, no. 1, pp. 83-128.
—— 2008, 'Earnings quality at initial public offerings', Journal of Accounting &
Economics, vol. 45, no. 2/3, pp. 324-349.
Ball, R & Shivakumar, L 2006, 'The role of accruals in asymmetrically timely gain and
loss recognition', Journal of Accounting Research, vol. 44, no. 2, pp. 207-242.
Banerjee, S, Dai, L & Shrestha, K 2011, 'Cross-country IPOs: what explains differences
in underpricing?', Journal of Corporate Finance, vol. 17, no. 5, pp. 1289-1305.

243
Barry, CB & Brown, SJ 1984, 'Differential information and the small firm effect',
Journal of Financial Economics, vol. 13, no. 2, pp. 283-294.
Barth, ME, Landsman, WR & Lang, MH 2008, 'International accounting standards and
accounting quality', Journal of Accounting Research, vol. 46, no. 3, pp. 467-498.
Basu, S 1997, 'The conservatism principle and the asymmetric timeliness of earnings',
Journal of Accounting and Economics, vol. 24, no. 1, pp. 3-37.
Basu, S, Hwang, L & Jan, C-L 2000, 'Differences in conservatism between Big Eight
and non-Big Eight auditors', paper presented at Symposium on Auditing Research,
University of Illinois at Urbana-Champaign, September 7-9.
Beatty, A, Weber, J & Yu, JJ 2008a, 'Conservatism and Debt', Journal of Accounting
and Economics, vol. 45, no. 2–3, pp. 154-174.
—— 2008b, 'Conservatism and debt', Journal of Accounting and Economics, vol. 45,
no. 2-3, pp. 154-174.
Beatty, RP & Ritter, JR 1986, 'Investment banking, reputation, and the underpricing of
initial public offerings', Journal of Financial Economics, vol. 15, no. 1–2, pp. 213-232.
Beaver, WH & Ryan, SG 2000, 'Biases and lags in book value and their effects on the
ability of the book-to-market ratio to predict book return on equity', Journal of
Accounting Research, vol. 38, no. 1, pp. 127-148.
—— 2005, 'Conditional and unconditional conservatism: concepts and modeling',
Review of Accounting Studies, vol. 10, no. 2/3, pp. 269-309.
Beekes, W, Pope, P & Young, S 2004, 'The Link between earnings timeliness, earnings
conservatism and board composition: evidence from the UK', Corporate Governance:
An International Review, vol. 12, no. 1, pp. 47-59.
Benveniste, LM & Spindt, PA 1989, 'How investment bankers determine the offer price
and allocation of new issues', Journal of Financial Economics, vol. 24, no. 2, pp. 343-
361.

244
Bhabra, HS & Pettway, RH 2003, 'IPO prospectus information and subsequent
performance', Financial Review, vol. 38, no. 3, pp. 369-397.
Biddle, GC, Ma, ML & Song, FM 2011, 'Accounting conservatism and bankruptcy risk',
SSRN eLibrary.
Biddle, GC, Ma, ML & Song, FM 2012, 'The risk management role of accounting
conservatism for operating cash flows', SSRN eLibrary.
Billett, MT, Flannery, MJ & Garfinkel, JA 2011, 'Frequent issuers’ influence on long-
run post-issuance returns', Journal of Financial Economics, vol. 99, no. 2, pp. 349-364.
Bluck, R 2009, 'Does conservative accounting reduce litigation costs?', Accounting
Department, PhD thesis, University of Iowa.
Bona-Sánchez, C, Pérez-Alemán, J & Santana-Martín, DJ 2011, 'Ultimate ownership
and earnings conservatism', European Accounting Review, vol. 20, no. 1, pp. 57-80.
Botosan, CA 1997, 'Disclosure level and the cost of equity capital', The Accounting
Review, vol. 72, no. 3, pp. 323-349.
Boulton, TJ, Smart, SB & Zutter, CJ 2011, 'Earnings quality and international IPO
underpricing', Accounting Review, vol. 86, no. 2, pp. 483-505.
Bradley, DJ, Jr, JWC, Jordan, BD & Singh, AK 2004, 'Negotiation and the IPO offer
price: a comparison of Integer vs. non-integer IPOs', The Journal of Financial and
Quantitative Analysis, vol. 39, no. 3, pp. 517-540.
Brau, JC & Fawcett, SE 2006, 'Initial public offerings: an analysis of theory and
practice', The Journal of Finance, vol. 61, no. 1, pp. 399-436.
Bushman, RM & Piotroski, JD 2006, 'Financial reporting incentives for conservative
accounting: the influence of legal and political institutions', Journal of Accounting and
Economics, vol. 42, no. 1-2, pp. 107-148.

245
Bushman, RM, Piotroski, JD & Smith, AJ 2011, 'Capital allocation and timely
accounting recognition of economic losses', Journal of Business Finance & Accounting,
vol. 38, no. 1/2, pp. 1-33.
Cai, J & Loughran, T 1998, 'The performance of Japanese seasoned equity offerings,
1971-1992', Pacific-Basin Finance Journal, vol. 6, no. 5, pp. 395-425.
Callen, J, Chen, F, Dou, Y & Xin, B 2011, 'Asymmetry of information, wealth
appropriation, bank loan covenants and the signalling role of accounting conservatism',
SSRN eLibrary.
Callen, J, Guan, Y & Qiu, J 2010a, 'The market for corporate control and accounting
conservatism', SSRN eLibrary.
Callen, J, Segal, D & Ole-Kristian, H 2010b, 'The pricing of conservative accounting
and the measurement of conservatism at the firm-year level', Review of Accounting
Studies, vol. 15, no. 1, pp. 145-178.
Carter, R & Manaster, S 1990, 'Initial public offerings and underwriter reputation', The
Journal of Finance, vol. 45, no. 4, pp. 1045-1067.
Carter, RB & Dark, FH 1993, 'Underwriter reputation and initial public offers: the
detrimental effects of flippers', Financial Review, vol. 28, no. 2, pp. 279-301.
Carter, RB, Dark, FH & Singh, AK 1998, 'Underwriter Reputation, Initial Returns, and
the Long-Run Performance of IPO Stocks', The Journal of Finance, vol. 53, no. 1, pp.
285-311.
Celikyurt, U, Sevilir, M & Shivdasani, A 2010, 'Going public to acquire? The
acquisition motive in IPOs', Journal of Financial Economics, vol. 96, no. 3, pp. 345-
363.
Chadha, S 2003, 'Do insiders knowingly issue overvalued equity? Evidence from IPOs
that get delisted', SSRN eLibrary.
Chandra, U 2011, 'Income conservatism in the U.S. technology sector', Accounting
Horizons, vol. 25, no. 2, pp. 285-314.

246
Chen, LH, Folsom, D, Paek, W & Sami, H 2013, 'Accounting conservatism, earnings
persistence, and pricing multiples on earnings', Accounting Horizons, forthcoming.
Cheng, CSA, Huang, HH & Li, Y 2014, 'Hedge fund Intervention and accounting
conservatism', Contemporary Accounting Research, forthcoming.
Ching, KML, Firth, M & Rui, OM 2006, 'The information content of insider trading
around seasoned equity offerings', Pacific-Basin Finance Journal, vol. 14, no. 1, pp.
91-117.
Chung, HH & Wynn, JP 2008, 'Managerial legal liability coverage and earnings
conservatism', Journal of Accounting and Economics, vol. 46, no. 1, pp. 135-153.
Cohen, DA & Zarowin, P 2010, 'Accrual-based and real earnings management activities
around seasoned equity offerings', Journal of Accounting and Economics, vol. 50, no. 1,
pp. 2-19.
Collins, WA, Hopwood, WS & McKeown, JC 1984, 'The predictability of interim
earnings over alternative quarters', Journal of Accounting Research, vol. 22, no. 2, pp.
467-479.
Cooper, MJ, Gulen, H & Schill, MJ 2008, 'Asset growth and the cross-section of stock
returns', The Journal of Finance, vol. 63, no. 4, pp. 1609-1651.
Copley, PA & Douthett Jr, EB 2002, 'The association between auditor choice,
ownership retained, and earnings disclosure by firms making initial public offerings',
Contemporary Accounting Research, vol. 19, no. 1, pp. 49-75.
Cormier, D & Martinez, I 2006, 'The association between management earnings
forecasts, earnings management, and stock market valuation: evidence from French
IPOs', International Journal of Accounting, vol. 41, no. 3, pp. 209-236.
Corwin, SA 2003, 'The determinants of underpricing for seasoned equity offers',
Journal of Finance, vol. 58, no. 5, pp. 2249-2279.
Corwin, SA & Harris, JH 2001, 'The Initial Listing Decisions of Firms That Go Public',
Financial Management, vol. 30, no. 1, pp. 35-55.

247
Cox, DR 1972, 'Regression models and life-tables', Journal of the Royal Statistical
Society, Series B, vol. 34, no. 2, pp. 187-220.
Daske, H, Hail, L, Leuz, C & Verdi, R 2008, 'Mandatory IFRS reporting around the
world: early evidence on the economic consequences', Journal of Accounting Research,
vol. 46, no. 5, pp. 1085-1142.
Datar, SM, Feltham, GA & Hughes, JS 1991, 'The role of audits and audit quality in
valuing new issues', Journal of Accounting and Economics, vol. 14, no. 1, pp. 3-49.
DeAngelo, H, DeAngelo, L & Stulz, RM 2010, 'Seasoned equity offerings, market
timing, and the corporate lifecycle', Journal of Financial Economics, vol. 95, no. 3, pp.
275-295.
Dechow, P, Ge, W & Schrand, C 2009, 'Understanding earnings quality: A review of
the proxies, their determinants and their consequences', paper presented at 2009 Journal
of Accounting and Economics Conference, MIT Sloan School of Management.
Dechow, PM 1994, 'Accounting earnings and cash flows as measures of firm
performance : the role of accounting accruals', Journal of Accounting and Economics,
vol. 18, no. 1, pp. 3-42.
Dechow, PM, Kothari, SP & Watts, RL 1998, 'The relation between earnings and cash
flows', Journal of Accounting and Economics, vol. 25, no. 2, pp. 133-168.
Dechow, PM, Sloan, RG & Sweeney, AP 1996, 'Causes and consequences of earnings
manipulation: an analysis of firms subject to enforcement actions by the SEC',
Contemporary Accounting Research, vol. 13, no. 1, pp. 1-36.
Demers, EA & Joos, P 2007, 'IPO failure risk', Journal of Accounting Research, vol. 45,
no. 2, pp. 333-371.
Denis, DJ & Kruse, TA 2000, 'Managerial discipline and corporate restructuring
following performance declines', Journal of Financial Economics, vol. 55, no. 3, pp.
391-424.

248
Dhaliwal, D, Huang, S, Khurana, I & Pereira, R 2014, 'Product market competition and
conditional conservatism', Review of Accounting Studies, forthcoming.
Dietrich, J, Muller, K & Riedl, E 2007, 'Asymmetric timeliness tests of accounting
conservatism', Review of Accounting Studies, vol. 12, no. 1, pp. 95-124.
Donelson, DC, McInnis, JM, Mergenthaler, RD & Yu, Y 2012, 'The timeliness of bad
earnings news and litigation risk', The Accounting Review, vol. 87, no. 6, pp. 1967-1991.
DuCharme, LL, Malatesta, PH & Sefcik, SE 2004, 'Earnings management, stock issues,
and shareholder lawsuits', Journal of Financial Economics, vol. 71, no. 1, pp. 27-49.
Easley, D & O'Hara, M 2004, 'Information and the cost of capital', The Journal of
Finance, vol. 59, no. 4, pp. 1553-1583.
Eberhart, AC, Maxwell, WF & Siddique, AR 2004, 'An examination of long-term
abnormal stock returns and operating performance following R&D increases', The
Journal of Finance, vol. 59, no. 2, pp. 623-650.
Eckbo, BE & Norli, Ø 2005, 'Liquidity risk, leverage and long-run IPO returns', Journal
of Corporate Finance, vol. 11, no. 1–2, pp. 1-35.
Ettredge, M, Huang, Y & Zhang, W 2012, 'Does accounting conservatism deter
litigation?', SSRN eLibrary.
Ettredge, ML, Huang, Y & Zhang, W 2012, 'Earnings restatements and differential
timeliness of accounting conservatism', Journal of Accounting and Economics, vol. 53,
no. 3, pp. 489-503.
Fama, EF & French, KR 1993, 'Common risk factors in the returns on stocks and bonds',
Journal of Financial Economics, vol. 33, no. 1, pp. 3-56.
Fama, EF & French, KF 1995, 'Size and book-to-market factors in earnings and returns',
Journal of Finance, vol. 50, no. 1, pp. 131-155.
—— 2004, 'New lists: fundamentals and survival rates', Journal of Financial
Economics, vol. 73, no. 2, pp. 229-269.

249
Fan, Q 2007, 'Earnings management and ownership retention for initial public offering
Firms: theory and evidence', Accounting Review, vol. 82, no. 1, pp. 27-64.
Field, L, Lowry, M & Shu, S 2005, 'Does disclosure deter or trigger litigation?', Journal
of Accounting and Economics, vol. 39, no. 3, pp. 487-507.
Financial Accounting Standard Board 1980, Statement of Financial Accounting
Concepts No. 2, Qualitative characteristics of accounting Information, Norwalk, CT.
Francis, J, LaFond, R, Olsson, PM & Schipper, K 2004, 'Costs of Equity and Earnings
Attributes', The Accounting Review, vol. 79, no. 4, pp. 967-1010.
Francis, J, Nanda, D & Olsson, PER 2008, 'Voluntary Disclosure, Earnings Quality, and
Cost of Capital', Journal of Accounting Research, vol. 46, no. 1, pp. 53-99.
Francis, JR & Martin, X 2010, 'Acquisition profitability and timely loss recognition',
Journal of Accounting and Economics, vol. 49, no. 1-2, pp. 161-178.
Frankel, R, McNichols, M & Wilson, GP 1995, 'Discretionary disclosure and external
financing', The Accounting Review, vol. 70, no. 1, pp. 135-150.
García Lara, J, García Osma, B & Penalva, F 2009, 'Accounting conservatism and
corporate governance', Review of Accounting Studies, vol. 14, no. 1, pp. 161-201.
García Lara, JM & García Osma, B 2010, 'Accounting conservatism and firm
investment efficiency', SSRN eLibrary.
García Lara, JM, Garcia Osma, B & Penalva, F 2007, 'Board of directors' characteristics
and conditional accounting conservatism: Spanish evidence', European Accounting
Review, vol. 16, no. 4, pp. 725-755.
—— 2010, 'Conditional conservatism and firm investment efficiency', SSRN eLibrary.
—— 2011a, 'Conditional conservatism and cost of capital', Review of Accounting
Studies, vol. 16, no. 2, pp. 247-271.

250
—— 2011b, 'Information effects of conservatism in accounting', SSRN eLibrary.
García Lara, JM & Mora, A 2004, 'Balance sheet versus earnings conservatism in
Europe', European Accounting Review, vol. 13, no. 2, pp. 261-292.
Gigler, F, Kanodia, C, Sapra, H & Venugopalan, R 2009, 'Accounting conservatism and
the efficiency of debt contracts', Journal of Accounting Research, vol. 47, no. 3, pp.
767-797.
Givoly, D & Hayn, C 2000, 'The changing time-series properties of earnings, cash
flows and accruals: has financial reporting become more conservative?', Journal of
Accounting and Economics, vol. 29, no. 3, pp. 287-320.
Givoly, D, Hayn, CK & Natarajan, A 2007, 'Measuring reporting conservatism',
Accounting Review, vol. 82, no. 1, pp. 65-106.
Golubov, A, Petmezas, D & Travlos, NG 2012, 'When it pays to pay your investment
banker: new evidence on the role of financial advisors in M&As', The Journal of
Finance, vol. 67, no. 1, pp. 271-311.
Grinblatt, M & Hwang, CY 1989, 'Signalling and the pricing of new issues', The
Journal of Finance, vol. 44, no. 2, pp. 393-420.
Guay, W & Verrecchia, R 2006, 'Discussion of an economic framework for
conservative accounting and Bushman and Piotroski (2006)', Journal of Accounting &
Economics, vol. 42, no. 1-2, pp. 149-165.
—— 2007, 'Conservative disclosure', SSRN eLibrary.
Harford, J 2005, 'What drives merger waves?', Journal of Financial Economics, vol. 77,
no. 3, pp. 529-560.
Harford, J, Humphery-Jenner, M & Powell, R 2012, 'The sources of value destruction
in acquisitions by entrenched managers', Journal of Financial Economics, vol. 106, no.
2, pp. 247-261.

251
Harjoto, MA & Turetsky, HF 2006, 'Acquisition of IPO firms: cash-flow-based
measures of operating inefficiency', Advances in Accounting, vol. 22, pp. 167-199.
Harris, L 1991, 'Stock price clustering and discreteness', Review of Financial Studies,
vol. 4, no. 3, pp. 389-415.
Haw, I-M, Lee, JJ & Lee, W-J 2010, 'Debt financing and accounting conservatism in
private firms', SSRN eLibrary.
He, H, El-Masry, E-H & Wu, Y 2008, 'Accounting conservatism of cross-listing firms
in the pre- and post-Sarbanes Oxley periods', Advances in Accounting, vol. 24, no. 2, pp.
237-242.
Healy, PM, Hutton, AP & Palepu, KG 1999, 'Stock performance and intermediation
changes surrounding sustained increases in disclosure', Contemporary Accounting
Research, vol. 16, no. 3, pp. 485-520.
Healy, PM & Palepu, KG 2001, 'Information asymmetry, corporate disclosure, and the
capital markets: A review of the empirical disclosure literature', Journal of Accounting
and Economics, vol. 31, no. 1–3, pp. 405-440.
Hensler, DA, Rutherford, RC & Springer, TM 1997, 'The survival of initial public
offerings in the aftermarket ', Journal of Financial Research, vol. 20, no. 1, pp. 93-110.
Hovakimian, A & Hutton, I 2010, 'Merger-motivated IPOs', Financial Management, vol.
39, no. 4, pp. 1547-1573.
Hribar, P & Collins, DW 2002, 'Errors in estimating accruals: implications for empirical
research', Journal of Accounting Research, vol. 40, no. 1, pp. 105-134.
Hsieh, J, Lyandres, E & Zhdanov, A 2011, 'A theory of merger-driven IPOs', Journal of
Financial and Quantitative Analysis, vol. 46, no. 5, pp. 1367-1405.
Hughes, PJ 1986, 'Signalling by direct disclosure under asymmetric information',
Journal of Accounting and Economics, vol. 8, no. 2, pp. 119-142.

252
Hui, KW, Klasa, S & Yeung, PE 2012, 'Corporate suppliers and customers and
accounting conservatism', Journal of Accounting and Economics, vol. 53, no. 1–2, pp.
115-135.
Hui, KW, Matsunaga, S & Morse, D 2009, 'The impact of conservatism on
management earnings forecasts', Journal of Accounting and Economics, vol. 47, no. 3,
pp. 192-207.
Huijgen, C & Lubberink, M 2005, 'Earnings conservatism, litigation and contracting:
the case of cross-listed firms', Journal of Business Finance & Accounting, vol. 32, no.
7-8, pp. 1275-1309.
Humphery-Jenner, M & Powell, R 2014, 'Firm size, sovereign governance, and value
creation: evidence from the acquirer size effect', Journal of Corporate Finance, vol. 26,
no. 3, pp. 57-77.
Ibbotson, RG 1975, 'Price performance of common stock new issues', Journal of
Financial Economics, vol. 2, no. 3, pp. 235-272.
Inchausti, AG 1997, 'The influence of company characteristics and accounting
regulation on information disclosed by Spanish firms', European Accounting Review,
vol. 6, no. 1, pp. 45-68.
Jackson, SB, Wilcox, WE & Strong, JM 2002, 'Do initial public offering firms
understate the allowance for bad debts', Advances in Accounting, vol. 19, pp. 89-118.
Jain, BA & Kini, O 1999, 'The life cycle of initial public offering firms', Journal of
Business Finance & Accounting, vol. 26, no. 9/10, pp. 1280-1307.
—— 2008, 'The impact of strategic investment choices on post-issue operating
performance and survival of US IPO firms', Journal of Business Finance & Accounting,
vol. 35, no. 3/4, pp. 459-490.
Jegadeesh, N, Weinstein, M & Welch, I 1993, 'An empirical investigation of IPO
returns and subsequent equity offerings', Journal of Financial Economics, vol. 34, no. 2,
pp. 153-176.

253
Jenkins, DS, Kane, GD & Velury, U 2009, 'Earnings conservatism and value relevance
across the business cycle', Journal of Business Finance & Accounting, vol. 36, no. 9/10,
pp. 1041-1058.
Jog, V & McConomy, BJ 2003, 'Voluntary Disclosure of Management Earnings
Forecasts in IPO Prospectuses', Journal of Business Finance & Accounting, vol. 30, no.
1-2, pp. 125-168.
Jones, JJ 1991, 'Earnings management during import relief investigations', Journal of
Accounting Research, vol. 29, no. 2, pp. 193-228.
Khan, M & Watts, RL 2009, 'Estimation and empirical properties of a firm-year
measure of accounting conservatism', Journal of Accounting & Economics, vol. 48, no.
2/3, pp. 132-150.
Kim, BH & Pevzner, M 2010, 'Conditional accounting conservatism and future
negative surprises: an empirical investigation', Journal of Accounting and Public Policy,
vol. 29, no. 4, pp. 311-329.
Kim, EH & Purnanandam, A 2013, 'Seasoned equity offerings, corporate governance
and investments', Review of Finance, forthcoming.
Kim, J-B & Zhang, L 2010, 'Does accounting conservatism reduce stock price crash
risk? Firm-level evidence ', SSRN eLibrary.
Kim, Y, Li, S, Pan, C & Zuo, L 2013, 'The role of accounting conservatism in the
equity market: evidence from seasoned equity offerings', The Accounting Review, vol.
88, no. 4, pp. 1327-1356.
Kim, Y & Park, MS 2005, 'Pricing of seasoned equity offers and earnings management',
The Journal of Financial and Quantitative Analysis, vol. 40, no. 2, pp. 435-463.
Koh, F & Walter, T 1989, 'A direct test of Rock's model of the pricing of unseasoned
issues', Journal of Financial Economics, vol. 23, no. 2, pp. 251-272.
Kothari, SP, Leone, AJ & Wasley, CE 2005, 'Performance matched discretionary
accrual measures', Journal of Accounting and Economics, vol. 39, no. 1, pp. 163-197.

254
Kothari, SP, Ramanna, K & Skinner, D 2010, 'Implications for GAAP from an analysis
of positive research in accounting', Journal of Accounting and Economics, vol. 50, no.
2-3, pp. 246-286.
Kothari, SP, Shu, S & Wysocki, PD 2009, 'Do managers withhold bad news?', Journal
of Accounting Research, vol. 47, no. 1, pp. 241-276.
Kousenidis, DV, Ladas, AC & Negakis, CI 2009, 'Value relevance of conservative and
non-conservative accounting information', International Journal of Accounting, vol. 44,
no. 3, pp. 219-238.
Kravet, TD 2014, 'Accounting conservatism and managerial risk-taking: corporate
acquisitions', Journal of Accounting and Economics, forthcoming.
Krigman, L, Shaw, WH & Womack, KL 1999, 'The persistence of IPO mispricing and
the predictive power of flipping', The Journal of Finance, vol. 54, no. 3, pp. 1015-1044.
Krinsky, I & Rotenberg, W 1989, 'The valuation of initial public offerings',
Contemporary Accounting Research, vol. 5, no. 2, pp. 501-515.
Krishnan, GV & Visvanathan, G 2008, 'Does the SOX definition of an accounting
expert matter? The association between audit committee directors' accounting expertise
and accounting conservatism', Contemporary Accounting Research, vol. 25, no. 3, pp.
827-858.
Kross, W & Schroeder, D 1990, 'An investigation of seasonality in stock price response
to quarterly earnings announcements', Journal of Business Finance & Accounting, vol.
17, no. 5, pp. 649-675.
Lafond, R & Roychowdhury, S 2008, 'Managerial ownership and accounting
conservatism', Journal of Accounting Research, vol. 46, no. 1, pp. 101-135.
LaFond, R & Watts, RL 2008, 'The Information role of conservatism', Accounting
Review, vol. 83, no. 2, pp. 447-478.
Lang, M & Lundholm, R 1993, 'Cross-sectional determinants of analyst ratings of
corporate disclosures', Journal of Accounting Research, vol. 31, no. 2, pp. 246-271.

255
Lang, MH & Lundholm, RJ 2000, 'Voluntary disclosure and equity offerings: reducing
information asymmetry or hyping the stock?', Contemporary Accounting Research, vol.
17, no. 4, pp. 623-662.
Lee, G & Masulis, RW 2009, 'Seasoned equity offerings: quality of accounting
information and expected flotation costs', Journal of Financial Economics, vol. 92, no.
3, pp. 443-469.
—— 2011, 'Do more reputable financial institutions reduce earnings management by
IPO issuers?', Journal of Corporate Finance, vol. 17, no. 4, pp. 982-1000.
Lee, J 2012, 'The role of accounting conservatism in firms' financial decisions', SSRN
eLibrary.
Leone, AJ, Rock, S & Willenborg, M 2007, 'Disclosure of intended use of proceeds and
underpricing in initial public offerings', Journal of Accounting Research, vol. 45, no. 1,
pp. 111-153.
Levis, M 1995, 'Seasoned equity offerings and the short-and long-run performance of
initial public offerings in the UK', European Financial Management, vol. 1, no. 2, p.
125.
Lewellen, K 2006, 'Risk, reputation, and IPO price support', The Journal of Finance,
vol. 61, no. 2, pp. 613-653.
Lewis, CM, Seward, JK & Foster-Johnson, L 2000, Busted IPOs and windows of
misopportunity, Working Paper No. 00-06, Amos Tuck School of Business.
Li, J 2008, Accounting conservatism, information uncertainty and analysts' forecasts,
working paper, Tepper School of Business, Carnegie Mellon University.
Li, J, Zhang, L & Zhou, J 2006, Earnings management and delisting risk of initial
public offerings, AAA 2008 Financial Accounting and Reporting Section (FARS)
Paper, Simon School, University of Rochester.
Li, X 2010, 'Accounting conservatism and cost of capital: an international analysis',
SSRN eLibrary.
256
Lin, ZJ & Tian, Z 2012, 'Accounting conservatism and IPO underpricing: China
evidence', Journal of International Accounting, Auditing and Taxation, vol. 21, no. 2,
pp. 127-144.
Liu, ZF 2010, 'Shareholder litigation and the information role of accounting
conservatism', School of Business, PhD thesis, Queen's University.
Lo, K 2008, 'Earnings management and earnings quality', Journal of Accounting and
Economics, vol. 45, no. 2-3, pp. 350-357.
Loughran, T & Ritter, J 2004, 'Why has IPO underpricing changed over time?',
Financial Management (Blackwell Publishing Limited), vol. 33, no. 3, pp. 5-37.
Loughran, T & Ritter, JR 2000, 'Uniformly least powerful tests of market efficiency',
Journal of Financial Economics, vol. 55, no. 3, pp. 361-389.
Loughran, T & Ritter, JR 1995, 'The New issues puzzle', Journal of Finance, vol. 50,
no. 1, pp. 23-51.
—— 1997, 'The operating performance of firms conducting seasoned equity offerings',
Journal of Finance, vol. 52, no. 5, pp. 1823-1850.
Louis, H, Sun, AX & Urcan, O 2012, 'Value of cash holdings and accounting
conservatism', Contemporary Accounting Research, vol. 29, no. 4, pp. 1249-1271.
Lowry, M & Schwert, GW 2002, 'IPO Market Cycles: Bubbles or Sequential Learning?',
The Journal of Finance, vol. 57, no. 3, pp. 1171-1200.
Lowry, M & Shu, S 2002, 'Litigation risk and IPO underpricing', Journal of Financial
Economics, vol. 65, no. 3, pp. 309-335.
Mak, CY, Strong, N & Walker, M 2011, 'Conditional earnings conservatism and
corporate refocusing activities', Journal of Accounting Research, vol. 49, no. 4, pp.
1041-1082.
Masulis, RW, Wang, C & Xie, F 2007, 'Corporate Governance and Acquirer Returns',
The Journal of Finance, vol. 62, no. 4, pp. 1851-1889.

257
Megginson, WL & Weiss, KA 1991, 'Venture capitalist certification in initial public
offerings', Journal of Finance, vol. 46, no. 3, pp. 879-903.
Menon, K & Williams, DD 1991, 'Auditor credibility and initial public offerings', The
Accounting Review, vol. 66, no. 2, pp. 313-332.
Michaely, R & Shaw, WH 1994, 'The pricing of initial public offerings: tests of
adverse-selection and signaling theories', The Review of Financial Studies, vol. 7, no. 2,
pp. 279-319.
Mikkelson, WH, Megan Partch, M & Shah, K 1997, 'Ownership and operating
performance of companies that go public', Journal of Financial Economics, vol. 44, no.
3, pp. 281-307.
Moeller, SB, Schlingemann, FP & Stulz, RM 2004, 'Firm size and the gains from
acquisitions', Journal of Financial Economics, vol. 73, no. 2, pp. 201-228.
—— 2005, 'Wealth destruction on a massive scale? A study of acquiring-firm returns in
the recent merger wave', The Journal of Finance, vol. 60, no. 2, pp. 757-782.
Monahan, SJ 2005, 'Conservatism, Growth and the Role of Accounting Numbers in the
Fundamental Analysis Process', Review of Accounting Studies, vol. 10, no. 2-3,
2005/09/01, pp. 227-260.
Nahata, R 2008, 'Venture capital reputation and investment performance', Journal of
Financial Economics, vol. 90, no. 2, pp. 127-151.
Ohlson, JA 1980, 'Financial ratios and the probabilistic prediction of bankruptcy',
Journal of Accounting Research, vol. 18, no. 1, pp. 109-131.
Pagano, M, Panetta, F & Zingales, L 1998, 'Why do companies go public? An empirical
analysis', Journal of Finance, vol. 53, no. 1, pp. 27-64.
Patatoukas, PN & Thomas, JK 2011a, 'Comments on "On estimating conservatism" by
Kothari and Nikolaev', SSRN eLibrary.

258
—— 2011b, 'More evidence of bias in the differential timeliness measure of conditional
conservatism', SSRN eLibrary.
Penman, SH & Xiao-Jun, Z 2002, 'Accounting conservatism, the quality of earnings,
and stock returns', Accounting Review, vol. 77, no. 2, pp. 237-264.
Pope, PF & Walker, M 1999, 'International differences in the timeliness, conservatism,
and classification of earnings', Journal of Accounting Research, vol. 37, no. 3, pp. 53-
87.
Qiang, X 2007, 'The effects of contracting, litigation, regulation, and tax costs on
conditional and unconditional conservatism: cross-sectional evidence at the firm level',
Accounting Review, vol. 82, no. 3, pp. 759-796.
Rajan, M, Reichelstein, S & Soliman, M 2007, 'Conservatism, growth, and return on
investment', Review of Accounting Studies, vol. 12, no. 2-3, pp. 325-370.
Ramalingegowda, S & Yu, Y 2012, 'Institutional ownership and conservatism', Journal
of Accounting and Economics, vol. 53, no. 1/2, pp. 98-114.
Rangan, S 1998, 'Earnings management and the performance of seasoned equity
offerings', Journal of Financial Economics, vol. 50, no. 1, pp. 101-122.
Rangan, S & Sloan, RG 1998, 'Implications of the integral approach to quarterly
reporting for the post-earnings-announcement drift', The Accounting Review, vol. 73, no.
3, pp. 353-371.
Reuer, J & Shen, J-C 2003, 'The Extended merger and acquisition process:
understanding therole of IPOs in corporate strategy', European Management Journal,
vol. 21, no. 2, pp. 192-198.
Ritter, JR 1984, 'The "hot Issue" market of 1980', The Journal of Business, vol. 57, no.
2, pp. 215-240.
—— 1991, 'The long-run performance of initial public offerings', The Journal of
Finance, vol. 46, no. 1, pp. 3-27.

259
Rock, K 1986, 'Why new issues are underpriced', Journal of Financial Economics, vol.
15, no. 1/2, pp. 187-212.
Roosenboom, P, van der Goot, T & Mertens, G 2003, 'Earnings management and initial
public offerings: evidence from the Netherlands', International Journal of Accounting,
vol. 38, no. 3, p. 243.
Rosenbaum, PR & Rubin, DB 1983, 'The central role of the propensity score in
observational studies for causal effects', Biometrika, vol. 70, no. 1, pp. 41-55.
Roychowdhury, S & Watts, RL 2007, 'Asymmetric timeliness of earnings, market-to-
book and conservatism in financial reporting', Journal of Accounting & Economics, vol.
44, no. 1/2, pp. 2-31.
Ryan, SG & Zarowin, PA 2003, 'Why has the contemporaneous linear returns-earnings
relation declined?', Accounting Review, vol. 78, no. 2, p. 523.
Schrand, C & Verrecchia, RE 2005, 'Information disclosure and adverse selection
explanation for IPO underpricing', SSRN eLibrary.
Sentis, P 2009, 'Merging activity as rational explanation of long-run underperformance
of IPOs', Multinational Finance Journal, vol. 13, no. 1/2, pp. 201-228.
Shivakumar, L 2000, 'Do firms mislead investors by overstating earnings before
seasoned equity offerings?', Journal of Accounting and Economics, vol. 29, no. 3, pp.
339-371.
Shroff, PK, Venkataraman, R & Zhang, S 2013, 'The conservatism principle and the
asymmetric timeliness of earnings: an event-based approach', Contemporary
Accounting Research, vol. 30, no. 1, pp. 215-241.
Shu, P-G, Chiang, S-J & Lin, H-Y 2012, 'Earnings management, managerial optimism,
and IPO valuation', Journal of Behavioral Finance, vol. 13, no. 2, pp. 147-161.
Siougle, G 2007, 'Accounting information and the valuation of seasoned equity
offerings (SEOs)', The International Journal of Accounting, vol. 42, no. 4, pp. 380-395.

260
Sloan, RG 1996, 'Do stock prices fully reflect information in accruals and cash flows
about future earnings?', The Accounting Review, vol. 71, no. 3, pp. 289-315.
Slovin, MB, Sushka, ME & Bendeck, YM 1994, 'Seasoned common stock issuance
following an IPO', Journal of Banking & Finance, vol. 18, no. 1, pp. 207-226.
Spiess, DK & Affleck-Graves, J 1995, 'Underperformance in long-run stock returns
following seasoned equity offerings', Journal of Financial Economics, vol. 38, no. 3, pp.
243-267.
Spiess, DK & Pettway, RH 1997, 'The IPO and first seasoned equity sale: Issue
proceeds, owner/managers' wealth, and the underpricing signal', Journal of Banking &
Finance, vol. 21, no. 7, pp. 967-988.
Suijs, J 2008, 'On the value relevance of asymmetric financial reporting policies',
Journal of Accounting Research, vol. 46, no. 5, pp. 1297-1321.
Teoh, SH, Welch, I & Wong, TJ 1998a, 'Earnings management and the long-run market
performance of initial public offerings', The Journal of Finance, vol. 53, no. 6, pp.
1935-1974.
—— 1998b, 'Earnings management and the underperformance of seasoned equity
offerings', Journal of Financial Economics, vol. 50, no. 1, pp. 63-99.
Teoh, SH, Wong, TJ & Rao, GR 1998c, 'Are accruals during initial public offerings
opportunistic?', Review of Accounting Studies, vol. 3, no. 1, pp. 175-208.
TiniÇ, SM 1988, 'Anatomy of initial public offerings of common stock', Journal of
Finance, vol. 43, no. 4, pp. 789-822.
Venkataraman, R, Weber, JP & Willenborg, M 2008, 'Litigation risk, audit quality, and
audit fees: evidence from initial public offerings', Accounting Review, vol. 83, no. 5, pp.
1315-1345.
Vuolteenaho, T 2002, 'What drives firm-level stock returns?', The Journal of Finance,
vol. 57, no. 1, pp. 233-264.

261
Walker, MD & Yost, K 2008, 'Seasoned equity offerings: what firms say, do, and how
the market reacts', Journal of Corporate Finance, vol. 14, no. 4, pp. 376-386.
Wallace, RSO & Naser, K 1995, 'Firm-specific determinants of the comprehensiveness
of mandatory disclosure in the corporate annual reports of firms listed on the stock
exchange of Hong Kong', Journal of Accounting and Public Policy, vol. 14, no. 4, pp.
311-368.
Wang, C, Xie, F & Xin, X 2011, 'Managerial ownership of debt and accounting
conservatism', SSRN eLibrary.
Wang, RZ, Ó Hogartaigh, C & Van Zijl, T 2009, 'Measures of accounting conservatism:
a construct validity perspective', Journal of Accounting Literature, vol. 28, pp. 165-203.
Watts, RL 2002, 'Conservatism in accounting', SSRN eLibrary.
—— 2006, 'What has the invisible hand achieved?', Accounting & Business Research,
vol. 36, pp. 51-61.
Watts, RL & Zuo, L 2011, 'Accounting conservatism and firm value: evidence from the
global financial crisis', SSRN eLibrary.
Welch, I 1989, 'Seasoned offerings, imitation costs, and the underpricing of initial
public offerings', The Journal of Finance, vol. 44, no. 2, pp. 421-449.
Wittenberg-Moerman, R 2008, 'The role of information asymmetry and financial
reporting quality in debt trading: evidence from the secondary loan market', Journal of
Accounting and Economics, vol. 46, no. 2-3, pp. 240-260.
Zhang, J 2008, 'The contracting benefits of accounting conservatism to lenders and
borrowers', Journal of Accounting and Economics, vol. 45, no. 1, pp. 27-54.

262
Appendix I
Measure of Accounting Conservatism by Khan and Watts (2009)
Basu’s (1997) asymmetric timeliness measure is as follows;
Xi = α0 + α1Di + β1Ri + β2Di*Ri + ei (1)
where Xi is earnings, Ri is stock returns, Di is a dummy variable equal to one when R<0
and equal to zero otherwise, and ei is the residual.
Khan and Watts (2009) modify Basu’s model to estimate a firm-year measure of
conservatism. They assume that the asymmetric timeliness of gains versus losses is a
linear function of firm-specific characteristics each year: firm size (size), the market-to-
book ratio (MTB) and firm leverage (Lev). Accordingly, three variables are incorporated
into Basu’s (1997) regression model to estimate the conservatism expected for a given
level of size, MTB and Lev. The following equation is Khan and Watts’s annual cross-
sectional regression model:
Xi = α0 + α1Di + Ri (μ1 + μ2sizei + μ3MTBi + μ4Levi) + Di*Ri (λ1 + λ2sizei + λ3MTBi
+ λ4Levi) + (δ1sizei + δ2MTBi + δ3Levi + δ4Di*sizei + δ5Di*MTBi + δ6Di*Levi) + ei (2)
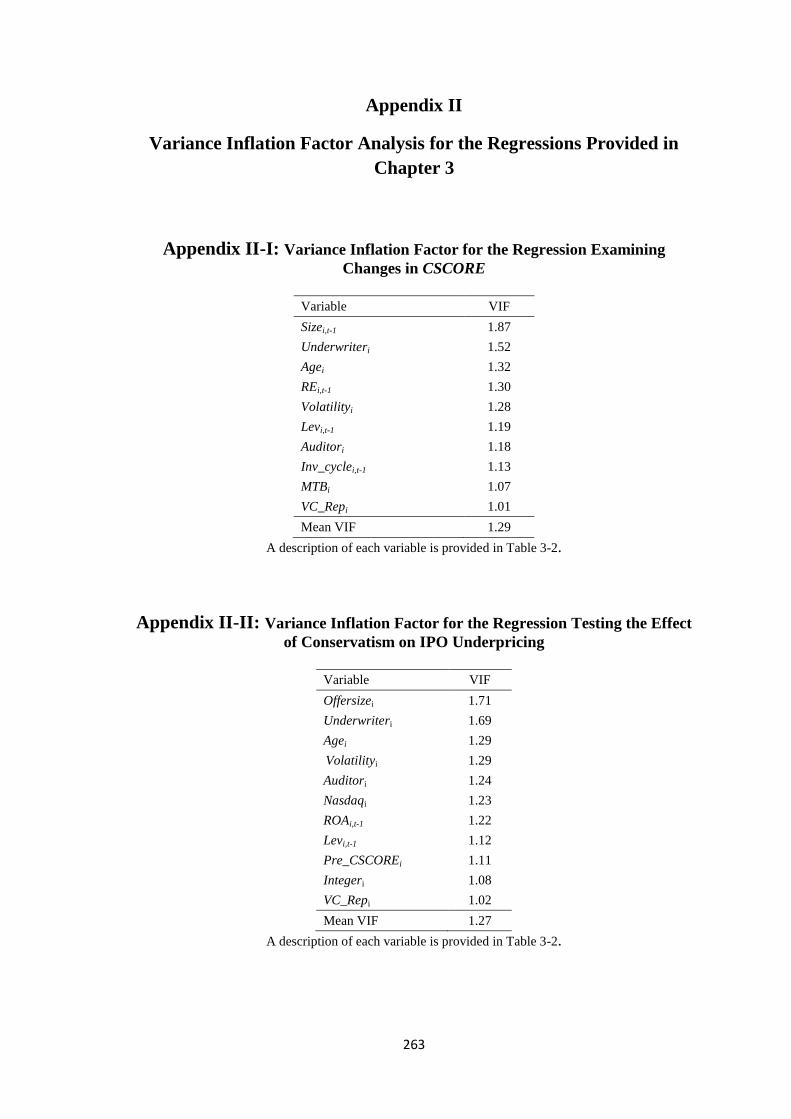
263
Appendix II
Variance Inflation Factor Analysis for the Regressions Provided in
Chapter 3
Appendix II-I: Variance Inflation Factor for the Regression Examining
Changes in CSCORE
Variable VIF
Sizei,t-1 1.87
Underwriteri 1.52
Agei 1.32
REi,t-1 1.30
Volatilityi 1.28
Levi,t-1 1.19
Auditori 1.18
Inv_cyclei,t-1 1.13
MTBi 1.07
VC_Repi 1.01
Mean VIF 1.29
A description of each variable is provided in Table 3-2.
Appendix II-II: Variance Inflation Factor for the Regression Testing the Effect
of Conservatism on IPO Underpricing
Variable VIF
Offersizei 1.71
Underwriteri 1.69
Agei 1.29
Volatilityi 1.29
Auditori 1.24
Nasdaqi 1.23
ROAi,t-1 1.22
Levi,t-1 1.12
Pre_CSCOREi 1.11
Integeri 1.08
VC_Repi 1.02
Mean VIF 1.27
A description of each variable is provided in Table 3-2.

264
Appendix II-III: Variance Inflation Factor for the Return Regressions with
Pre_CSCORE and Post_CSCORE
Panel A. Pre_CSCORE Model Panel B. Post_CSCORE Model
Variable VIF Variable VIF
Pre_CSCOREi 1.14 Post_CSCOREi 1.42
Cashi, t-1 1.73 Cashi, t 1.89
RDi, t-1 1.58 RDi, t 1.66
Underwriteri 1.29 Underwriteri 1.33
Agei 1.22 Agei 1.19
ΔAssetsi, t-1 1.20 ΔAssetsi, t 1.38
Underpricingi 1.11 Underpricingi 1.07
Mean VIF 1.26 Mean VIF 1.33
A description of each variable is provided in Table 3-2.

265
Appendix III
Regression Analysis Testing the Effect of Conservatism on IPO
Underpricing
Firms with High Information Asymmetry Firms with Low Information Asymmetry
Volatility Bid-Ask Volatility Bid-Ask
Independent
Variable Model 1 Model 2 Model 3 Model 4 Model 5 Model 6 Model 7 Model 8
Pre_CSCOREi -0.155** -0.156** -0.162*** -0.162*** -0.006 -0.006 -0.007 -0.008
(-2.385) (-2.397) (-2.635) (-2.637) (-0.440) (-0.439) (-0.515) (-0.565)
Integeri,t -0.123*** -0.127*** -0.119*** -0.120*** 0.009 0.009 -0.010 -0.010
(-3.007) (-3.070) (-2.870) (-2.888) (0.602) (0.604) (-0.619) (-0.637)
Offersizei,t 0.180*** 0.188*** 0.190*** 0.192*** 0.029** 0.028*** 0.028** 0.031***
(3.403) (4.094) (3.480) (4.040) (2.517) (3.023) (2.416) (3.075)
Agei,t -0.227** -0.228** -0.199** -0.200** -0.038** -0.038** -0.049*** -0.049***
(-2.503) (-2.530) (-2.115) (-2.136) (-2.242) (-2.245) (-2.906) (-2.878)
Levi,t-1 -0.124 -0.128* -0.136* -0.137* 0.011 0.011 0.023 0.022
(-1.613) (-1.677) (-1.738) (-1.776) (0.486) (0.495) (1.074) (1.032)
ROAi,t-1 0.005 0.005 -0.003 -0.003 0.006 0.006 0.026 0.027
(0.117) (0.112) (-0.063) (-0.065) (0.221) (0.218) (0.995) (1.047)
Nasdaqi,t 0.011 0.014 -0.054 -0.053 0.052*** 0.052*** 0.047*** 0.048***
(0.147) (0.182) (-0.575) (-0.567) (3.251) (3.266) (2.879) (2.925)
Volatilityi,t 6.257*** 6.259*** 6.287*** 6.288*** 3.320*** 3.318*** 2.759*** 2.766***
(4.207) (4.212) (4.370) (4.379) (4.411) (4.390) (3.702) (3.704)
Underwriteri,t 0.007 0.002 -0.000 0.004
(0.423) (0.125) (-0.070) (0.831)
VC_Repi,t -0.324 -0.329 -0.360 -0.362 0.195** 0.195** 0.201** 0.202**
(-1.088) (-1.121) (-1.230) (-1.253) (2.326) (2.324) (2.353) (2.423)
Auditori,t 0.006 0.018 0.079 0.082 0.039* 0.039 -0.035 -0.029
(0.069) (0.215) (0.879) (0.958) (1.685) (1.606) (-1.025) (-0.852)
Constant -2.788*** -2.876*** -2.922*** -2.949*** -0.522*** -0.518*** -0.444** -0.485***
(-3.407) (-3.898) (-3.480) (-3.892) (-2.884) (-3.172) (-2.374) (-2.702)
Year Dummies Yes Yes Yes Yes Yes Yes Yes Yes
Industry Fixed
Effects Yes Yes Yes Yes Yes Yes Yes Yes
F-Stats 8.885*** 9.144*** 7.782*** 8.352*** 3.876*** 4.052*** 2.899*** 3.125***
Adj. R2 23.6% 23.6% 24.0% 24.0% 15.0% 15.0% 13.2% 13.1%
Obs 449 449 447 447 361 361 363 363
The dependent variable Underpricing is measured as the first day closing price divided by the final offer price, minus 1.
Sample firms are divided into high and low information asymmetry groups based on the stock return volatility and bid-ask
spread measured over the entire IPO fiscal year. A description of independent variables is provided in Table 3-2. ***
indicates significance at 1%. ** indicates significance at 5%. * indicates significance at 10%.

266
Appendix IV
Variance Inflation Factor Analysis for the Regressions Provided in
Chapter 4
Appendix IV-I: Variance Inflation Factor for Regression Analysis of
PreCSCORE_IPO and the Probability of Issuing a SEO
Variable VIF
PreCSCORE_IPOi 1.76
Cashi,t-1 1.53
IPO_Underpricingi 1.45
Tobin's qi,t 1.38
Agei,t 1.26
Levi,t-1 1.24
IPO20_stocki 1.18
IPO_Underwriteri 1.18
Mean VIF 1.32
A description of each variable is provided in Table 4-1.
Appendix IV-II: Variance Inflation Factor for Regression Analysis of
PostCSCORE_IPO and the Probability of Issuing a SEO
Variable VIF
PostCSCORE_IPOi 1.72
Tobin's qi,t 1.58
Levi,t 1.44
IPO_Underpricingi 1.41
Cashi,t 1.40
IPO20_stocki 1.24
Agei,t 1.18
IPO_Underwriteri 1.08
Mean VIF 1.28
A description of each variable is provided in Table 4-1.

267
Appendix IV-III: Variance Inflation Factor for PreCSCORE_IPO
and SEO Announcement Returns Regression
Variable VIF
PreCSCORE_IPOi 1.07
Volatility_Anni 1.70
Runupi 1.51
IPO_Underpricingi 1.51
Relsizei 1.34
Mrunupi 1.20
Time_IPOi 1.18
SEO_Underwriteri 1.16
Mean VIF 1.23
A description of each variable is provided in Table 4-1.
Appendix IV-IV: Variance Inflation Factor for PostCSCORE_IPO
and SEO Announcement Returns Regression
Variable VIF
PostCSCORE_IPOi 1.13
Volatility_Anni 1.50
Runupi 1.48
Mrunupi 1.21
IPO_Underpricingi 1.14
Relsizei 1.11
SEO_Underwriteri 1.06
Time_IPOi 1.04
Mean VIF 1.17
A description of each variable is provided in Table 4-1.
Appendix IV-V: Variance Inflation Factor for AnnCSCORE_SEO
and SEO Announcement Returns Regression
Variable VIF
AnnCSCORE_SEOi 1.19
Volatility_Anni 1.41
Runupi 1.41
IPO_Underpricingi 1.10
Relsizei 1.06
Mrunupi 1.19
Time_IPOi 1.05
SEO_Underwriteri 1.02
Mean VIF 1.18
A description of each variable is provided in Table 4-1.

268
Appendix IV-VI: Variance Inflation Factor for
PreCSCORE_IPO and SEO Underpricing Regression
Variable VIF
PreCSCORE_IPOi 1.15
Volatility_Issuei 1.90
Relsizei 1.58
AVR_Underpricingi 1.57
MV_SEOi 1.50
NYSEi 1.48
CAR_6monthsi 1.30
SEO_Underwriteri 1.23
Mean VIF 1.30
A description of each variable is provided in Table 4-1.
Appendix IV-VII: Variance Inflation Factor for
PostCSCORE_IPO and SEO Underpricing Regression
Variable VIF
PostCSCORE_IPOi 1.19
Volatility_Issuei 1.41
Relsizei 1.21
AVR_Underpricingi 1.24
MV_SEOi 1.69
NYSEi 1.37
CAR_6monthsi 1.26
SEO_Underwriteri 1.30
Mean VIF 1.25
A description of each variable is provided in Table 4-1.
Appendix IV-VIII: Variance Inflation Factor for
IssCSCORE_SEO and SEO Underpricing Regression
Variable VIF
IssCSCORE_SEOi 1.16
Volatility_Issuei 1.49
Relsizei 1.12
AVR_Underpricingi 1.15
MV_SEOi 1.59
NYSEi 1.32
CAR_6monthsi 1.24
SEO_Underwriteri 1.34
Mean VIF 1.28
A description of each variable is provided in Table 4-1.

269
Appendix IV-IX: Variance Inflation Factor for PreCSCORE_IPO
and SEO Long-term Stock Returns Regression
Variable VIF
PreCSCORE_IPOi 1.10
Cash_SEOi 1.72
R&Di 1.60
Agei 1.54
Asset_growthi 1.30
MV_SEOi 1.16
SEO_Underpricingi 1.06
Mean VIF 1.31
A description of each variable is provided in Table 4-1
Appendix IV- X: Variance Inflation Factor for PostCSCORE_IPO
and SEO Long-term Stock Returns Regression
Variable VIF
PostCSCORE_IPOi 1.12
Cash_SEOi 1.72
R&Di 1.63
Agei 1.26
Asset_growthi 1.22
MV_SEOi 1.12
SEO_Underpricingi 1.04
Mean VIF 1.27
A description of each variable is provided in Table 4-1
Appendix IV-XI: Variance Inflation Factor for IssCSCORE_SEO
and SEO Long-term Stock Returns Regression
Variable VIF
IssCSCORE_SEOi 1.06
Cash_SEOi 1.52
R&Di 1.38
Agei 1.23
Asset_growthi 1.17
MV_SEOi 1.09
SEO_Underpricingi 1.01
Mean VIF 1.21
A description of each variable is provided in Table 4-1.

270
Appendix V
Variance Inflation Factor Analysis for the Regressions Provided in
Chapter 5
Appendix V-I: Variance Inflation Factor Analysis for the Regressions Testing the
Association between Conservatism and the Longevity of IPOs
Panel A. Pre_CSCORE
analysis Panel B. Post_CSCORE
analysis
Variable VIF Variable VIF
Pre_CSCOREi 1.24 Post_CSCOREi 1.58
Cashi,t-1 1.83 Cashi,t 1.56
Salesgi,t-1 1.24 Salesgi,t 1.22
Levi,t-1 1.20 Levi,t 1.29
REi,t-1 1.52 REi,t 1.48
RDi,t-1 1.55 RDi,t 1.35
Agei 1.29 Agei 1.27
MVi 1.62 MVi 2.15
MTBi 1.18 MTBi 1.18
VOLi 1.35 VOLi 1.65
Under
writeri 1.51
Under
writeri 1.91
VCi 1.45 VCi 1.43
Auditori 1.08 Auditori 1.12
Mean VIF 1.39 Mean VIF 1.48
A description of each variable is provided in Table 5-1.

271
Appendix V-II: Variance Inflation Factor Analysis for the Regressions Testing the
Association between Conservatism and the Acquisition probability
Panel A. Pre_CSCORE analysis Panel B. Post_CSCORE analysis
Variable VIF Variable VIF
Pre_CSCOREt 1.46 Post_CSCOREi 1.25
Sizei,t-1 1.65 Size i,t 1.42
Lev i,t-1 1.09 Lev i,t 1.15
Cashi,t-1 1.27 Cash i,t 1.25
C&I ratei 1.49 C&I ratei 1.14
WCi 1.23 WCi 1.17
PEi 1.04 PEi 1.05
Returni 1.06 Returni 1.02
MTBi 1.03 MTBi 1.03
Mean VIF 1.26 Mean VIF 1.17
A description of each variable is provided in Table 5-1.
Appendix V-III: Variance Inflation Factor Analysis for the Regressions Testing
the Association between Conservatism and Acquisition Announcement Returns
Panel A. Pre_CSCORE analysis Panel B. Post_CSCORE analysis
Variable VIF Variable VIF
Pre_CSCOREi 1.37 Post_CSCOREi 1.15
MVi 1.09 MVi 1.12
Tobin's qi 1.45 Tobin's qi 1.48
Lev_acqi 1.45 Lev_acqi 1.19
FCFi 1.20 FCFi 1.08
Runupi 1.40 Runupi 1.25
Rel_sizei 1.28 Rel_sizei 1.08
All_cashi 1.20 All_cashi 1.08
Stocki 1.21 Stocki 1.12
Privatei 1.07 Privatei 1.01
Diversifyi 1.11 Diversifyi 1.05
Hightechi 1.61 Hightechi 1.28
Mean VIF 1.29 Mean VIF 1.16
A description of each variable is provided in Table 5-1.