Embed Size (px)
Citation preview

American Accounting Association is collaborating with JSTOR to digitize, preserve and extend access to The AccountingReview.
http://www.jstor.org
Accounting Conservatism, the Quality of Earnings, and Stock Returns Author(s): Stephen H. Penman and Xiao-Jun Zhang Source: The Accounting Review, Vol. 77, No. 2 (Apr., 2002), pp. 237-264Published by: American Accounting AssociationStable URL: http://www.jstor.org/stable/3068897Accessed: 30-03-2015 10:56 UTC
Your use of the JSTOR archive indicates your acceptance of the Terms & Conditions of Use, available at http://www.jstor.org/page/info/about/policies/terms.jsp
JSTOR is a not-for-profit service that helps scholars, researchers, and students discover, use, and build upon a wide range of contentin a trusted digital archive. We use information technology and tools to increase productivity and facilitate new forms of scholarship.For more information about JSTOR, please contact [email protected].
This content downloaded from 137.99.100.26 on Mon, 30 Mar 2015 10:56:02 UTCAll use subject to JSTOR Terms and Conditions

THE ACCOUNTING REVIEW Vol. 77, No. 2 April 2002 pp. 237-264
Accounting Conservatism,
the Quality of Earnings, and
Stock Returns
Stephen H. Penman Columbia University
Xiao-Jun Zhang University of California, Berkeley
ABSTRACT: When a firm practices conservative accounting, changes in the amount of its investments can affect the quality of its earnings. Growth in investment reduces reported earnings and creates reserves. Reducing invest- ment releases those reserves, increasing earnings. If the change in investment is temporary, then current earnings is temporarily depressed or inflated, and thus is not a good indicator of future earnings. This study develops diagnostic measures of this joint effect of investment and conservative accounting. We find that these measures forecast differences in future return on net operating assets relative to current return on net operating assets. Moreover, these mea- sures also forecast stock returns-indicating that investors do not appreciate how conservatism and changes in investment combine to raise questions about the quality of reported earnings.
Keywords: earnings quality; conservative accounting; forecasting accounting rates of return; predicting stock returns.
Data Availability: Data are available from sources identified in the paper.
I. INTRODUCTION T This paper contributes to the stream of research on how accounting methods affect
the quality of earnings. While the academic and professional literature has not reached a consensus on the definition of quality of earnings, we define the term to
mean that reported earnings, before extraordinary items that are readily identified on the income statement, is of good quality if it is a good indicator of future earnings. Thus we
The comments of participants in workshops at Barclays Global Investors, Baruch College of CUNY, Columbia University, Cornell University, Georgetown University, the University of Michigan Quality of Earnings Conference, University of Minnesota, and Stanford University are appreciated, particularly those of Ilia Dichev, Tom Dyckman, John Elliott, Patricia Fairfield, Teri Yohn, and Paul Zarowin. We also appreciate comments of Mary Barth (associate editor) and anonymous reviewers.
Submitted December 1999 Accepted September 2001
237
This content downloaded from 137.99.100.26 on Mon, 30 Mar 2015 10:56:02 UTCAll use subject to JSTOR Terms and Conditions

238 The Accounting Review, April 2002
consider high-quality earnings to be "sustainable earnings," as often referred to in financial analysis (in Mulford and Comiskey [1996], for example). Correspondingly, when an ac- counting treatment produces unsustainable earnings, we deem those unsustainable earnings to be of poor quality.
Most of the research on the quality of earnings focuses on the effects of changes in accounting estimates (see Healy and Wahlen [1999] for a recent review). Estimates are applied in the accruals, so in order to identify poor-quality earnings, papers have investi- gated total accruals (as in Healy 1985), discretionary accruals (as in Jones 1991), and extreme accruals (as in Sloan 1996). This research characterizes managers as creating un- sustainable earnings, for example, by temporarily reducing estimates of bad debts or de- preciation (as in Teoh et al. 1998) or lowering loan loss reserves (as in Beaver and Engel 1996)-or lowering current earnings (and increasing future earnings) by overestimating restructuring charges (as in Moehrle 2002). If the effect is temporary, and so reverses later through a revision in the estimate, then reported earnings are of poor quality because current earnings are not a good indicator of future earnings. Under this view, applying accounting principles consistently from period to period leads to more sustainable earnings, and so reduces quality concerns.
This paper shows empirically that quality concerns can also arise if firms apply con- servative accounting consistently without any change in accounting methods or estimates.
By conservative accounting we mean choosing accounting methods and estimates that keep the book values of net assets relatively low. Therefore, LIFO accounting for inventories is conservative relative to FIFO (if inventory costs are increasing); expensing research and development (R&D) expenditures rather than capitalizing and amortizing them is conser- vative; depreciation methods that consistently use short estimated asset lives (so as to record depreciation in excess of economic depreciation) are conservative; and policies that con- sistently overestimate allowances for doubtful accounts, sales returns, or warranty liabilities are conservative.
Conservative accounting affects not only the quality of the numbers reported on the balance sheet, but also the quality of earnings reported on the income statement.' When the firm increases investment, conservative accounting leads to reported earnings that are indeed lower than they would have been had management made more liberal accounting choices. These lower earnings, however, create unrecorded reserves that provide managers with flexibility to report more income in the future. Management can increase these re- serves, and so reduce earnings, by increasing investment. Management can also release the reserves and create additional earnings, by subsequently reducing investment or reducing the rate of growth in investment. While the effect of the interaction of conservatism and investment is a mechanical one, it is not necessarily temporary; the temporary extent of the effect has to be ascertained. If the change in investment is temporary, then the induced change in earnings is also temporary and not indicative of subsequent earnings. Hence, the quality of earnings depends on the interaction between real activity and accounting policy, not merely on changes in accounting methods and estimates. These arguments suggest that managers can use the joint effect of real activity and accounting policy to manage earnings. However, the effect arises, intended or not. The effect is perverse-reducing investment
Indeed, earnings quality issues are interesting only when balance sheets are imperfect indicators of value. When balance sheets are marked-to-market so that book value is equal to value, earnings are of low quality as an indicator of future earnings; earnings are, in this case, simply changes in value, and changes in value are unin- formative about future earnings. Imperfect balance sheets shift the focus to the income statement as an indicator of value. The quality of earnings therefore becomes more important as an indicator of the future earnings, and thus of value. That quality does, however, depend on how the accountant measures the balance sheet, as explained below.
This content downloaded from 137.99.100.26 on Mon, 30 Mar 2015 10:56:02 UTCAll use subject to JSTOR Terms and Conditions

Penman and Zhang-Accounting Conservatism and Earnings Quality 239
reduces future earnings but, with conservative accounting, increases current earnings, mak- ing current earnings a poor indicator of future earnings.
We pose two research questions. First, does conservative accounting coupled with changes in investment lead to temporary changes in earnings? Second, does the stock market price these temporary earnings as if they were indeed unsustainable? The answer to the first question appears to be yes; the answer to the second is no. In carrying out the analysis, we develop metrics designed to assess whether the effect on earnings is temporary, and we suggest that these metrics can serve as tools for financial analysis and research into the quality of earnings.
Additional investment typically yields additional future earnings; therefore, to examine the sustainability of earnings, we focus on accounting rates of return-earnings relative to net assets that deflates earnings for new net investment. Focusing on accounting rates of return also serves our purpose of investigating the stock market's pricing of earnings of varying quality. Accrual-accounting residual income valuation models dictate that fore- casted earnings are evaluated relative to the book values that generate them. Residual in- come models therefore describe intrinsic equity values as determined by anticipated ac- counting rates of return. Pricing errors occur if the market, relying on an unsustainable current rate of return, forecasts future rates of return incorrectly.
Prior research has referred to this view of market inefficiency as "fixation" on reported earnings. In those terms, our evidence suggests that the market fixates on reported earnings, unaware that conservative accounting may lead to reported earnings of doubtful quality. Our paper views the analysis of earnings quality-and the identification of market fixa- tion-as a matter of financial statement analysis that uncovers information in the financial statements (beyond current earnings) about future earnings and equity values. Our study therefore contributes to the emerging empirical research on financial statement analysis and fundamental analysis, such as Ou and Penman (1989), Sloan (1996), Penman and Sougian- nis (1998), Lee et al. (1999), and Nissim and Penman (2001).
The paper is organized as follows. As a background to the analysis, the next section outlines the effects of conservative accounting and investment growth on accounting rates of return. Section III develops metrics for scoring firms on the degree of their conservative accounting and the quality of their earnings, and Section IV summarizes the data. Sections V and VI address the two research questions; Section V investigates whether we can use the quality scores that capture the effect of conservative accounting and investment to identify the sustainability of accounting rates of return, and Section VI documents the returns to taking positions in stocks based on the earnings quality scores. Section VII summarizes the study's conclusions.
II. CONSERVATISM, INVESTMENT, ACOCUNTING RATES OF RETURN, AND THE QUALITY OF EARNINGS
Definition of Conservatism Researchers have introduced a variety of definitions of conservative accounting. Some,
such as Basu (1997), define conservatism as the practice of reducing earnings (and writing down net assets) in response to "bad news," but not increasing earnings (and writing up net assets) in response to "good news." In the accounting-based valuation literature, re- searchers often refer to Feltham and Ohlson's (1995) characterization of conservative or "biased" accounting as an expectation that reported net assets will be less than market value in the long run. That definition classifies the accounting for anticipated positive net- present-value investments at historical cost as conservative accounting, because the analyst expects those investments to be carried at less than their value. Zhang (2000) models
This content downloaded from 137.99.100.26 on Mon, 30 Mar 2015 10:56:02 UTCAll use subject to JSTOR Terms and Conditions
240 The Accounting Review, April 2002
conservative accounting and valuation from this perspective. Beaver and Ryan (2000) sim- ilarly characterize conservatism (or bias) as a persistent difference between market value and book value that is distinct from temporary differences due to economic gains and losses that are recognized in book value gradually over time. Gjesdal (1999) distinguishes "eco- nomic profitability" from accounting profitability. He characterizes accounting as conser- vative if it assigns investments a carrying value that yields an expected accounting rate of return greater than the internal rate of return on their cost. Thus, for example, conservative accounting carries an asset whose value is equal to its historical cost (a zero net present value investment) at less than historical cost, as is the case with the immediate expensing of R&D and advertising costs.
Our notion of conservatism follows the latter definition; that is, conservative accounting is a biased application of historical cost accounting.2 For our purposes, however, we need not establish unbiased historical-cost carrying values of investments or unbiased allocations of investment cost to match against revenues. Rather, we examine conservatism in a relative sense. We consider one accounting practice (e.g., LIFO accounting) more conservative than a second accounting practice (FIFO accounting) if the first yields lower accumulated earn- ings (because of the relatively accelerated expensing of costs) and consequently lower carrying values than the second.
Effects of Conservatism and Investment on Rates of Return The effect of conservative accounting on accounting rates of return is clear. If net assets
do not change over a period, then conservative accounting has no effect on earnings in the numerator of a rate of return. (It is always the case, for example, that earnings are the same under accelerated depreciation and straight-line depreciation if property, plant, and equip- ment is unchanged over the period.) Because conservative accounting carries assets in the denominator at lower amounts, the rate of return is higher, however. Greenball (1969) shows that conservative accounting (bias) interacts with growth; conservative accounting reduces earnings when there is growth in net assets so that accounting rates of return are lower than in the no-growth case. Beaver and Ryan (2000) and Zhang (2001) model the interaction of conservatism and growth in a valuation context.
Our concern is not with the effects of conservatism and growth on accounting rates of return, but with the effects of the interaction between conservatism and changes in growth. Conservatism and growth do not necessarily affect the quality of earnings as we define the term. For example, if one expects a firm to maintain growth in net assets at the current level, then one expects future rates of return, ceteris Paribus, to be the same as the current rate of return. However, should management reduce investment in assets that are subject to conservative accounting, the firm's rate of return will increase. If this reduc- tion in investment is temporary, then so is the increase in the rate of return. In this case, the current rate of return will not be a good indicator of future rates of return.
We illustrate the effect on earnings of the interaction between conservative accounting and changes in investment with the case of LIFO accounting for inventories. The dollar effect of this interaction is transparent in the LIFO reserve disclosure in footnotes to U.S. financial statements. LIFO accounting is conservative because it carries inventories on the balance sheet at lower amounts than FIFO or at average cost methods if inventory prices
2 The Gjesdal (1999) concept is subsumed within the Feltham and OhIson (1995) and Beaver and Ryan (2000) concepts. However, the latter also include in the definition of conservative accounting the practice of recording positive net-present-value investments at unbiased historical cost to yield an accounting rate of return equal to the internal rate of return. Our characterization of conservatism does not involve this latter notion.
This content downloaded from 137.99.100.26 on Mon, 30 Mar 2015 10:56:02 UTCAll use subject to JSTOR Terms and Conditions

Penman and Zhang-Accounting Conservatism and Earnings Quality 241
have risen in the past. Accordingly, accounting rates of return are typically higher under LIFO. The LIFO reserve is the difference between LIFO and FIFO carrying values.' Cor- respondingly, the difference between LIFO and FIFO costs of goods sold is the change in the LIFO reserve. If purchases of inventories increase relative to sales (with continuing rising purchase prices), then earnings are lower under LIFO than in the no-growth case, and the LIFO reserve increases. Except for the case of the effect of extreme increases in purchase prices on cost of good sold, rates of return are also lower, for the denominator effect is typically greater than the earnings effect in the numerator. If dollar inventories decline (so that lower LIFO inventory costs flow into cost of goods sold), then LIFO yields higher earnings and rates of return. The LIFO reserve decreases, and earnings increase as the result of a real phenomenon: a decline in inventory. The buildup of the LIFO inventory creates the reserve, and the decline in inventory-known as LIFO dipping-is a liquidation of the reserve.
The same phenomena arise, although less transparently, from all forms of conservative accounting. Accelerated depreciation from using short, estimated asset lives (that reports lower net asset values) has no effect on earnings if depreciable assets are not growing, but reduces earnings (and, like LIFO, creates reserves) if investments in the assets increase, ceteris paribus.4 If investments decline, then accelerated depreciation creates earnings through the liquidation of reserves. Immediate expensing of R&D expenditures and adver- tising is conservative (setting knowledge assets and brand assets to zero on the balance sheet), but has no effect on earnings relative to capitalizing and amortizing the expenditures if the expenditures are not growing. However, increasing R&D investments and advertising, while immediately expensing the related costs, depresses earnings and increases reserves. Slowing R&D and advertising increases earnings and reduces reserves because the benefits from past expenditures are recognized without matching additional new expenditures.5 Be- cause the reserves created by conservative accounting are not recorded on the balance sheet, they are unrecorded "hidden" reserves that are released into earnings when investment growth slows. We refer to them as "unrecorded reserves."6
If a temporary change in investment leads to a temporary change in a reported ac- counting rate of return, then the current earnings will be a poor indicator of future earnings and, thus, earnings quality will be low. If an analyst accepts the current book rate of return as an unbiased indicator of future rates of return, then he will be misled. If investors value firms using current earnings as an input without appreciating that those earnings are un- sustainable, then market valuations will also be of low quality. But, if the analyst and investor penetrate the joint effect of conservative accounting and investment, then they will discover that reported earnings is a poor predictor of long-run "sustainable" profitability, and will value the firm appropriately.
Our empirical analysis, then, documents the incidence of temporary effects of the in- teraction of conservative accounting and investment on accounting rates of return, and asks whether the market pricing of stocks is consistent with investors' appreciating the quality of reported earnings in valuing stocks.
3 The SEC requires firms to calculate the LIFO reserve as the accumulated excess of the current cost of inventories over LIFO cost. With rapid inventory turnover, however, FIFO cost approximates current cost.
4 Conservative accounting reports lower earnings only in the growth case. Penman (2001, Chapter 17) gives examples of the effects of conservative accounting and growth described here.
I Baber et al. (1991) and Perry and Grinaker (1994) provide evidence that managers modify R&D expenditures to manage earnings.
6 The LIFO reserve is, of course, recorded in the footnotes of the 10-K, but not in the balance sheet.
This content downloaded from 137.99.100.26 on Mon, 30 Mar 2015 10:56:02 UTCAll use subject to JSTOR Terms and Conditions

242 The Accounting Review, April 2002
III. INDEXES OF CONSERVATISM AND EARNINGS QUALITY We use information from the financial statements to develop two indices of the quality
of earnings. The first index scores the degree to which the firm applies conservative ac- counting. The second index scores the quality of earnings that results from the joint effect of conservatism and changes investment activity.
Conservatism Index (C-Score) The C-score measures the effect of conservative accounting on the balance sheet. We
measure the C-score as the level of estimated reserves created by the conservatism, ER, relative to net operating assets:
ERat -
NOAit'
where i indicates firms and t indicates balance sheet dates.7 Net operating assets, NOA, is the book value of operating assets minus operating liabilities. That is, NOA equals assets minus liabilities, excluding financial assets and liabilities (financing debt and assets in which the firm invests excess cash). Balance sheets typically value these financial items at market value, or close to market value if interest rates change little, so conservative accounting does not affect such financial items.8 We subtract operating liabilities from operating assets in the NOA calculation to measure the net investment in operations. This netting recognizes that conservative accounting can affect both operating assets and operating liabilities.
A complete C-score calculates unrecorded reserves created by all operating items in the balance sheet-including bad-debt allowances, depreciation allowances, valuation al- lowances, deferred revenue, pension liabilities, and other estimated liabilities. We wish to distinguish earnings quality effects arising from changes in estimates (i.e., accounting ma- nipulation) from quality effects arising from permanent accounting policy and changes in investment. An allowance for bad debts, for example, might be "high" because of a per- manent policy of carrying net receivables at a conservative level or because of a temporary increase in the estimate of bad debts to reduce current income and increase future income. Because we cannot distinguish between the two effects for balance sheet items that are also subject to management's estimates, we construct a C-score based on the accounting treat- ment of three investments for which the accounting is relatively immune from managerial discretion after the expenditure has occurred: inventories, R&D, and advertising. The ac- counting for these items follows mandates from accounting regulators or (in the case of LIFO) an accounting choice that management (usually) does not change from period to period. Thus:
7 One might consider developing a C-score calculated as the estimated reserve relative to net operating assets plus the estimated reserve-then the estimated reserve would be expressed as a percentage of net operating assets that would have been reported had the firm not practiced conservative accounting. In this paper, however, we wish to compare the effect of changes in reserves on return on net operating assets, and this return is, of course, denominated in net operating assets.
8 In terms of Compustat item numbers, net operating assets is calculated as Common Equity (60: Common Equity + 227: Preferred Treasury Stock - 242: Preferred Dividends in Arrears) + Financial Obligations (34: Debt in Current Liabilities + 9: Total Long-Term Debt + 130: Preferred Stock - 227: Preferred Treasury Stock + 242: Preferred Dividends in Arrears) - Financial Assets (1: Cash and Short-Term Investments + 32: Investments and Advances - Other) + Minority Interest (38: Minority Interest on Balance Sheet). The procedures for reformu- lating financial statements to separate operating and financing activities are laid out in Penman (2001, Chapters 8, 9, and 10).
This content downloaded from 137.99.100.26 on Mon, 30 Mar 2015 10:56:02 UTCAll use subject to JSTOR Terms and Conditions

Penman and Zhang-Accounting Conservatism and Earnings Quality 243
Cit = (INVrS + RDreS
+ ADVres)/NOAit,
where the calculation for the three reserve components is as follows:
* Inventory reserve (INVirs) equals the LIFO reserve reported in the financial statement footnotes.
* R&D reserve (RDJeS) is calculated as the estimated amortized R&D assets that would have been on the balance sheet if R&D had not been expensed. We capitalize R&D expenditures, then amortize them using the industry coefficients estimated by Lev and Sougiannis (1996). In a sensitivity analysis, we also amortize using the sum-of- the-years-digits method over five years.
* Advertising reserve (ADViS) is the estimated brand assets created by advertising expenditures. We capitalize advertising expenses and then amortize them using a sum-of-the-year's digits method over two years. Bublitz and Ettredge (1989) and Hall (1993) indicate that advertising has a short useful life, typically one to two years.
We also calculate a subscore for each component of the reserve, the estimated reserve from that component relative to NOA.
Earnings Quality Indicator (Q-Score) Whereas the C-score measures the effect of conservative accounting on the balance
sheet, the Q-score measures the effect of conservative accounting on earnings in the income statement. Our Q-score is a combination of two measures. The first measure, QA, is cal- culated as:
QA = ERit _ ER,1 l it NOAi, NOAt- 1
That is, QA is the change in the firm's conservatism score, Cit. Thus, a firm's QA score is positive if it builds up its reserve at a rate faster than that of the growth in net operating assets, and negative if it builds its reserve at a slower rate. The second measure, QB, compares a firm's C-score to the median for its SIC two-digit industry code:
B = ERO - Industry median (ERA).
The Q-score combines these two measures:
t (0.5 x< Qi) + (0.5 x QB)
The Q-score does not ordinally rank firms on their earnings quality. Both "high" (positive) and "low" (negative) Q-scores can indicate that current earnings are of poor quality, and a Q-score of zero indicates good quality. We also calculate Q subscores from C-scores for inventories, R&D, and advertising.9
9 Both the C-score and Q-score might be adjusted for deferred tax effects of the alternative accounting. This is not important for our purposes; Q is measured before tax. We use the score only to assign firms to high- and low-Q groups.
This content downloaded from 137.99.100.26 on Mon, 30 Mar 2015 10:56:02 UTCAll use subject to JSTOR Terms and Conditions

244 The Accounting Review, April 2002
The change in estimated reserves measures the effect of conservative accounting and changes in investment on current earnings. To analyze the quality of the earnings, we focus on whether this effect is temporary. If a firm increased its reserve by growing investments but continued that growth in the future, then the effect would not be temporary. The QA
score is the change in estimated reserves divided by net operating assets. Thus, the score is determined by the growth rate in the estimated reserves relative to the growth rate in net operating assets (so that, if estimated reserves grow at the same rate as net operating assets, the score is 0). Therefore, we benchmark a change in a firm's reserve against the change in the firm's net operating assets in the QA measure. Accordingly, we posit that the growth in the reserve (unrecorded assets) is unusual if it differs from the growth in (recorded) net operating assets. With the QB measure, we posit that if a firm's buildup of reserves relative to net operating assets-its C-score-differs from the industry median, then the firm's C- score will likely revert toward the industry median in the future. That is, the portion of the firm's C-score that deviates from the industry median is likely to be temporary. If, for example, a firm with a high C-score subsequently reverts toward the median, then, upon this reversion, some of the firm's estimated reserves will flow into earnings. Because it is not clear ex ante which benchmark (the firm's prior-period conservatism score or the cur- rent-period industry median score) might best capture temporary earnings effects, we weight the two measures equally, and then, in sensitivity analysis, we change the weights from (0.5, 0.5) to (1, 0) and (0, 1), to investigate separately QA and QB. The overall Q-score, as weighted, is:
Qit =0.5 (Cit - Cit-1) + 0.5 (Ci, - Industry median Cit)
Cit - (0.5 Cit-I + 0.5 Industry median Cit).
The overall score can thus be interpreted as the "unexpected" C, where the expected C is a simple average of last period's C and the median C for the industry.
Of course, our analyses are joint tests of the effect of the conservatism-investment interaction on earnings quality and of the ability of our scoring measures to capture con- servatism and earnings quality. Thus, evidence that Q-scores identify unsustainable earnings will also validate a useful diagnostic tool, as an aid to financial statement analysis.
IV. SAMPLE SELECTION AND DESCRIPTION We calculated C-scores and Q-scores for NYSE and AMEX nonfinancial firms on the
combined Compustat Annual Industrial and Research files (which include nonsurvivors) for 1975-1997. We obtained monthly stock returns from the 1997 CRSP files. Our sample period begins in 1975 because, prior to that year, accounting data needed to construct the indices were missing from Compustat for a significant number of firms.
We were able to calculate net operating assets for 46,854 of the 46,955 firm-years for nonfinancial NYSE and AMEX firms with share price, shares outstanding, and book value of common equity data on Compustat at some time from 1975 to 1997. Of these, 46,122 firm-years had positive NOA, and there were sufficient data to compute C-scores for 38,540 firm-years. We deleted firm-years only if we could compute none of the three subscores from the Compustat data. When just one or two subscores were missing, we used industry median subscores (for two-digit SIC industry groups) as substitutes to calculate the overall C-score for that firm-year. The 38,540 firm-years included the following:
This content downloaded from 137.99.100.26 on Mon, 30 Mar 2015 10:56:02 UTCAll use subject to JSTOR Terms and Conditions

Penman and Zhang-Accounting Conservatism and Earnings Quality 245
Firm-years with one subscore 8,285
Firm-years with two subscores 19,258
Firm-years with three subscores 10,997
Total firm-years 38,540
Of these 38,540 firm-years, the LIFO reserve was available for 36,244, and 13,931 reported using LIFO; therefore, there were 22,313 non-LIFO cases (where the reserve is 0). We could calculate the R&D reserve for 25,357 firm-years, and the advertising reserve for 18,191 firm-years.
Table 1 summarizes the distribution of C-scores over firm-years. The median of 0.114 indicates that NOA would have been 11.4 percent higher for the typical firm if the ac- counting treatment of the three items had not created reserves. The mean of 0.313, relative to the median and upper percentile scores, indicates that C-scores are particularly large for a relatively small number of firms (i.e., they are positively skewed).
We were able to compute Q-scores for 32,343 firm-years, but we deleted 2,547 firm- years for firms with non-LIFO inventory methods and missing C subscores for both R&D and advertising. Table 1 gives the distribution of the final sample of 29,796 Q-scores. The median is close to 0. The scores for the upper percentiles indicate that a nontrivial per- centage of firms noticeably increased reserves during this period of considerable asset growth. Low Q-scores are smaller in absolute magnitude than high scores, but 40 percent of the firm-years reported liquidations of reserves.
TABLE 1 Distribution of Conservatism Index (C-Score) and Earning Quality Index (Q-Score) over
Firm-Years; 1975-1997a
C-Score Q-Score
Number of Firm-Years 38,540 29,796 Mean 0.313 0.099 Percentiles
95 0.576 0.219 90 0.413 0.139 75 0.236 0.059 60 0.153 0.025 Median 0.114 0.009 40 0.084 0.000 25 0.048 -0.010 10 0.014 -0.046 5 0.004 -0.075
a Section III of the text describes C-score and Q-score calculations. The C-score estimates the degree of under- statement of net operating assets from the conservative practice of LIFO accounting for inventories and the expensing of R&D and advertising expenditures. It is measured as the unrecorded reserve from conservative accounting relative to recorded net operating assets.
The Q-score indicates the extent to which earnings are affected by change of investment under conservative ac- counting. Positive Q-scores indicate the extent to which earnings are temporarily depressed by growth in investment in inventories, R&D, and advertising. Negative Q-scores indicate the extent to which earnings are temporarily inflated by a decline of investment in these three items.
This content downloaded from 137.99.100.26 on Mon, 30 Mar 2015 10:56:02 UTCAll use subject to JSTOR Terms and Conditions

246 The Accounting Review, April 2002
The mean first-order serial correlation of QA in the sample is 0.01, and that for Q1 is 0.61. In the cross-section, the mean Spearman rank correlation between QA and QA+I (in the subsequent year) is 0.10, decaying to 0.01 five years ahead. The mean Spearman rank correlation of Q1 with Q1+1 (in the subsequent year) is 0.88, decaying to 0.63 five years ahead. These statistics indicate that neither the QA nor the QB scores are permanent firm characteristics. However, they also indicate that, although the QB score does eventually revert toward the industry median, the QA score is very much a "one-time" feature, and so is more likely to capture the temporary effect on earnings that we wish to identify.
V. ANALYSIS OF THE QUALITY OF BOOK RATES OF RETURN If the Q-score identifies temporary effects on earnings, then a relatively high Q-score
should indicate current profitability that is lower than that expected in the future, and a relatively low Q-score should indicate current profitability that is higher than that expected in the future. We examine how Q-scores predict changes in core return on net operating assets from its current level. We define core return on net operating assets (RNOA) as:
Core RNOAIt = [Core operating incomeit X (1 - statutory tax rateit)]/average NOAt.
Core operating income is operating income before interest, special items, extraordinary items, and discontinued operations. Core operating income therefore excludes transparently temporary components of earnings, along with interest expense (which is not generated by operations and which is unaffected by conservative accounting). Thus, we focus on reported income that investors might identify as sustainable income from operations. We measure after-tax core operating income without allocating taxes between operating and financing activities. Our measure assumes that any difference between effective tax rates on operating income and statutory rates (calculated as the Federal rate plus 2 percent) is temporary.
To conduct the analysis, we sorted firms in each year, 1976-1996 and within each two- digit SIC industry, into ten equal-sized groups based on the core RNOA the firm reported that year. We retained only RNOA groups with at least three firms. Then, within each RNOA group, we further divided firms into three equal-sized groups based on their Q-scores. We refer to these as high, median, and low Q-score groups. Our analysis compares core RNOA in the grouping year with core RNOA realized in subsequent years for each Q group. The grouping by industry controls for the type of operations, so the differ- ences we observe in RNOA are more likely to be due to accounting effects than to differences in operations. The grouping also controls for the mean reversion in RNOA documented in Nissim and Penman (2001), so the observed relation between changes in RNOA over time and the Q-scores does not reflect this typical RNOA mean reversion.
Table 2 summarizes median core RNOA for the five years before and after the year of the grouping (Year 0) for each of these Q-score groups and for all firms together. The numbers in the table are means of the medians computed over the 21 calendar years from 1976 to 1996. Panel A of Figure 1 tracks these means for the high- and low-Q-score groups. Panel B tracks these same mean RNOAs after subtracting the median RNOA for all firms in that year to adjust for trends in median RNOA over time.
The results in Table 2 and Figure 1 indicate that, on average, Q-scores do discriminate on future core RNOA. The RNOA for high-Q groups are declining prior to Year 0, con- sistent with conservative accounting's increasing reserves and depressing earnings. The mean RNOA for these high-Q groups continues at about the same level, or slightly higher, after Year 0. The low-Q groups report lower mean RNOA than the high groups before Year 0, but by Year 0 their mean RNOAs are approximately the same as the high-Q groups'
This content downloaded from 137.99.100.26 on Mon, 30 Mar 2015 10:56:02 UTCAll use subject to JSTOR Terms and Conditions

Penman and Zhang-Accounting Conservatism and Earnings Quality 247
Uw I-C 0C --I o o oao o- ~o - oo :
ON o . o . o. - 0 9 o 0 9 00
6666 ooo 66emi 0 N m
0 IIc rt I I _- ON 0 - 0
0 ~ ~ ~ ~~ 0t~- 0 en CDN A ~~ooo?~ 00- T-0 -T i?
--0r- 09 0 - su ~ 6 6 6vNt?N m?oo 66i
oj 0 ON 0 0- 0 N n > O O--9 0 00 00 N O
:t > m N > o a-, t N _ Nt 0 0. ON
i-@Cl 1rE~- CD
0 Cl ot %
I~ei r--0 - 090 0 0
I 666 E o 000 I6e I o
<~~~~~~~~~~~~~~~~~~~~~~~~~I IIU
Nt~~~~~O
o - e a n r- 90 0
O ot - 000 a o g o t 6666 W 00 000 al N
X u: o s t m ~~~~~~Nt O o
I *; E I-- a I 0 O (N --0- 0 -? o i
N m ~~66o m6 66 ? -
Z I ooo. IoN o .
C> cl 9o 9en emo
s < N
o oC~t~t Cl> > fi
I
o o OoN
X ~ ~~ 0000 000 C0l0
0~~~~~~~~~~~~~-
'Si-Iru0
6662 36 8~ -0 = in 388
This content downloaded from 137.99.100.26 on Mon, 30 Mar 2015 10:56:02 UTCAll use subject to JSTOR Terms and Conditions

248 The Accounting Review, April 2002
- e CD 00 oo 00 Pu.
a seN 0 0
all S
0 O N oo W 0
- N en e
VI 00 en ,.
Q kn 0 Eenx
C-0 N r- all0 ON
t4-0
~0 C
*s:~~~~r al ,0. 0 0
N 0 m It ) It Nt O
N Z
0 ~ ~ ~~~m
| 0 en -t -0 O
o~~~~~ ,c Q .n -)0 00 r
0 S C) z
C>Co Q O Y
t5 = E 3 H AS
This content downloaded from 137.99.100.26 on Mon, 30 Mar 2015 10:56:02 UTCAll use subject to JSTOR Terms and Conditions

Penman and Zhang-Accounting Conservatism and Earnings Quality 249
FIGURE 1 Mean Core Return on Net Operating Assets (Core RNOA) for High and Low Q-Score Groups
over Five Years before and after the Q-Scoring Year, Year 0
Panel A: Tracks Core RNOA
Core RNOA
13.00% -
12.00%- A.
A. 11.00% '. ;A,- A. * --A--- HighQ
10.00% - - Low Q
9.00%
8.00% - -5 -4 -3 -2 -1 0 1 2 3 4 5
Year
Panel B: Tracks Core RNOA Adjusted for the Median Core RNOA of All Firms in that Year
Relative Core RNOA - median Core RNIOA subtracted to detrend
2.00% -
-.00 . A ,*-- vA
A. ---*--- High Q
?-?? Low Q -1.00% - _ _ _ _ _ _ _ _ _ _ _ _ _ _
-2.00% -
-5 -4 -3 -2 -1 0 1 2 3 4 5
Year
mean RNOAs (by construction of the tests). However, the mean RNOA for the low-Q groups subsequently deteriorates. Accordingly, the Q-score identifies, ex ante in Year 0, firms with low-quality earnings whose core RNOAs on average decline by the next year. By liquidating their reserves, these firms achieve an average core RNOA in Year 0 that is indistinguishable from the average RNOAs of the high-Q group and of all firms as a whole. The Q-score indicates, however, that this creation of earnings is temporary.
Table 2 reports two sets of significance tests. For the first set, we calculated median differences in core RNOA between Year 0 and each of the five years before and after Year 0 for high-Q, medium-Q, and low-Q groups, for each of the 21 years. The table reports the mean of these median differences over the 21 years, along with a t-statistic on those
This content downloaded from 137.99.100.26 on Mon, 30 Mar 2015 10:56:02 UTCAll use subject to JSTOR Terms and Conditions

250 The Accounting Review, April 2002
mean differences (based on a standard error of the mean estimated from the time series of median differences). The second set of t-tests is on means of differences across high- vs. low-Q groups' differences in core RNOA (computed between Year 0 and the relevant year). The two sets of t-statistics indicate that the mean RNOAs for the low-Q groups in the five years after Year 0 are statistically significantly less than that in Year 0, and that the drop in core RNOA after Year 0 is statistically greater for the low-Q group than for the high-Q group. These differences-more than 1 percent of net operating assets-are economically significant.10 Of the low-Q firms that survived through Year +1, untabulated results reveal that only 44.2 percent had increasing RNOA in Year +1, compared to 52.5 percent for high-Q firms.11 We repeated the analysis in Table 2 for the subperiods 1976-1982, 1983- 1989, and 1990-1996, with similar results in each period.12
Sensitivity Tests and Further Analysis We performed further tests to provide additional controls, to document the robustness
of the findings over time and over Q subscores, and to explore the phenomenon further. We summarize these tests below; more detail is available on request.
Control for Mean Reversion in Core RNOA We have attempted to control for the typical mean reversion of RNOA by comparing
the evolution of core RNOA across Q groups for firms first grouped on the level of core RNOA. However, some of the differential behavior of core RNOA across Q-score groups might be attributable to differential behavior of different levels of RNOA if Q-scores are strongly correlated with RNOA (and thus the ranking on Q-scores is effectively a ranking on RNOA). Untabulated analyses suggest this is not a problem. The median Spearman correlation between Q-scores and RNOA within RNOA groups is 0.00, the mean correlation is 0.10, and the 75th percentile of rank correlation is 0.42.13 We also repeated the analysis in Table 2, first with a ranking on core RNOA within each RNOA group, then splitting into three RNOA groups rather than on Q-scores. In contrast to the results reported in Figure 1 and Table 2, which are based on Q-score partitions, we observed little difference in the RNOA dynamics across these three RNOA groups, so mean reversion in RNOA cannot explain the results.
Analysis of Inventory, R&D, and Advertising Subscores We performed an analysis identical to that in Table 2, except that we used separate Q-
scores for inventory, R&D, and advertising. Results (not tabulated here) are similar for each subscore, so the results are not due to one particular accounting item.
We next estimated 21 annual linear regressions of one-year-ahead core RNOA (in t + 1) on core RNOA and Q-scores in the scoring year, t. Panel A of Table 3 shows that the positive mean estimated coefficient for the Q-score and its t-statistic indicate that the
Using the residual income valuation formula, a revision of forecasted RNOA of 1.3 percent per year for five years has considerable effect on the calculated value. For a classification of high-Q and low-Q firms into those with increasing and decreasing core RNOA in Year 1, the Chi-square statistic is 73.9, with a probability given no relationship between Q and subsequent profitability of less than 0.001.
12 Although firms in the same industry tend to have the same fiscal year-ends, they do vary. Thus, ranking firms as if their RNOAs were available at the same time is subject to a peeking-ahead bias. However, we repeated the analysis on firms with (the same) December 31 fiscal year-ends, with similar results.
13 The mean annual Spearman rank correlations between the Q-score and core RNOA over all firms was 0.08, and the mean for ranking within industry was 0.07. Thus, in addition to the low correlation between Q-score and core RNOA within RNOA groups, correlation between the Q-score and core RNOA is minimal even over all levels of RNOA.
This content downloaded from 137.99.100.26 on Mon, 30 Mar 2015 10:56:02 UTCAll use subject to JSTOR Terms and Conditions

Penman and Zhang-Accounting Conservatism and Earnings Quality 251
TABLE 3 Results of Regression Tests of the Ability of Q-Scores to Predict Year-Ahead Core RNOAa
Panel A: Overall Q-Score
RNOA t+1 = ao + ax, RNOA, + a2Q+ e,t+
First Third Mean Quartile Median Quartile
Intercept 0.016 0.009 0.018 0.022 (6.5 1**)
RNOA coefficient 0.800 0.782 0.813 0.846 (47.55**)
Q coefficient 0.096 0.054 0.103 0.136 (7.17**)
Panel B: Three Subscores for Inventory, Research and Development, and Advertising
RNOAt+ = ao + a, RNOA, + a2 Qinv + a3 Qrd + a4 Qadv + st+>
First Third Mean Quartile Median Quartile
Intercept 0.015 0.010 0.016 0.022 (6.39**)
RNOA coefficient 0.802 0.765 0.823 0.866 (43.56**)
Qainv coefficient 0.131 0.076 0.133 0.215 (6.18**)
Qrd coefficient 0.106 0.080 0.130 0.149 (5.15**)
Q-adv coefficient 0.082 0.007 0.071 0.195 (2.49*)
a ** Denotes significance at the 0.05 and 0.01 levels, respectively, using a two-tailed t-test. aWe estimated regression coefficients for 21 annual cross-sectional regressions, 1976 to 1996. The mean estimated coefficients from the 21 regressions appear in the table, along with those at the 25th percentile, the median, and the 75th percentile. The t-statistics (in parentheses) are calculated as the mean of the 21 estimated coefficients relative to their estimated standard errors.
RNOA is core return on net operating assets; Q is the Q-score that indicates temporary effects of conservatism and changes in investment on current earnings; Q-inv is the inventory subscore; Qrd is the research and devel- opment subscore; Q-adv is the advertising subscore.
Q-score improves forecasts of one-year-ahead RNOA over that from the current RNOA alone. Panel B reports the results of a similar analysis, after separating the Q-score into its three subscores. The results indicate that each subscore provides additional information about one-year-ahead RNOA, not only beyond current RNOA, but also relative to each other. 14
4 The mean Spearman rank correlation between the score for inventory (Q-inv) and those for R&D (Q-rd) and advertising (Q-adv), within industry, were 0.09 and 0.08, respectively. The correlation between Qrd and Q-adv was 0.1 1.
This content downloaded from 137.99.100.26 on Mon, 30 Mar 2015 10:56:02 UTCAll use subject to JSTOR Terms and Conditions

252 The Accounting Review, April 2002
Analysis of QA and Q8 The analyses in Tables 2 and 3 are based on a Q-score that weights QA and QB equally.
As explained in Section III, we intended both of these measures to identify temporary changes in reserves generated by conservative accounting. Additional tests reveal that both measures, QA and QB, are effective in forecasting future core RNOA. However, QA appears to be somewhat more effective than QB, consistent with our earlier conjecture that the lower serial correlation in QA than in QB indicated that QA better captures the temporary effect of the conservative accounting on earnings.
Specifically, we repeated the tests in Table 2 for both QA and QB. Although QA produced slightly stronger results than QB, both discriminate on changes in future core RNOA. The mean changes in core RNOA from Year 0 to Years +1 to +5 for the lowQA group were -0.95 percent, -1.03 percent, -1.19 percent, -1.16 percent, and -1.11 percent, respec- tively. For the lowQB group the mean changes for these five years were -0.68 percent, -0.99 percent, -1.42 percent, -1.49 percent, and -1.70 percent, respectively. All the t- statistics were of the same order as those reported in Table 2. For the high-Q groups, results were stronger for the QA metric, with mean core RNOA increasing by 0.65 percent in Year + 1 with a t-statistic of 1.78, significant at the 0.05 level for a one-tailed test. For QB, mean core RNOA increased by 0.26 percent in Year + 1 with a t-statistic of 0.65.
We also repeated the regression tests reported in Table 3 for QA and QB. The results are similar. The mean estimated coefficient for QA corresponding to that in Panel A of Table 3 was 0.212 (with a t-statistic of 6.34) and that for QB was 0.030 (with a t-statistic of 4.70). Mean coefficient estimates on RNOA were similar to those in Table 3. For both Q-scores, coefficients on all three subscores (corresponding to those in Panel B of Table 3) were significantly positive. Again, however, QA measures provided more explanatory power than QB measures.
Control for Growth in Net Operating Assets The QA-score captures the rate of change in estimated reserves relative to the rate of
change in net operating assets. By benchmarking growth in estimated reserves (from un- recorded assets) against growth in recorded assets, QA is designed to capture abnormal growth in estimated reserves. However, the QA growth measure is clearly affected by the growth in net operating assets.
Fairfield et al. (2001) show that growth in net operating assets reduces future profita- bility, and they argue that Sloan's (1996) observation that high (low) accruals are followed by lower (higher) profitability is due to the positive correlation between growth and accru- als. The negative effect of growth of net operating assets on future profitability can be attributed to new investment earning at a lower rate or to the effect of conservative ac- counting; new investment, amortized rapidly, reduces subsequent earnings. Although the latter explanation involves conservative accounting, we have a different feature of conser- vative accounting in mind.
Therefore, to ensure that our inferences are not solely attributable to differential growth in net operating assets, we estimated the cross-sectional regressions in Panel A of Table 3, adding the rate of growth in net operating assets as an additional explanatory variable. Growth in net operating assets indeed plays an incremental role in explaining one-year- ahead core RNOA (with a statistically significant negative mean estimated coefficient), but the Q-score still provides incremental information, with a positive mean coefficient of 0.039 and a significant t-statistic of 3.23.
This content downloaded from 137.99.100.26 on Mon, 30 Mar 2015 10:56:02 UTCAll use subject to JSTOR Terms and Conditions

Penman and Zhang-Accounting Conservatism and Earnings Quality 253
Further Analysis of the RNOA Changes Our analysis investigates whether core RNOA is temporarily affected by increases in
unrecorded reserves that depress earnings, and by the release of those reserves that increase earnings. Core RNOA equals core profit margin (core operating income/sales) multiplied by asset turnover (sales/net operating assets), following the standard DuPont decomposi- tion. To confirm that the effect was indeed an effect on earnings (and thus the profit margin) and not just a turnover effect, we examined the two components separately.
Table 4 reports core profit margins and asset turnovers for each of the five years before and after the Q-scoring year, for both high- and low-Q groups. As the accounting for inventories, R&D, and advertising does not affect depreciation and amortization, profit margins are before depreciation and amortization.
The average changes in profit margins from Year 0 to subsequent years are significantly different for the low-Q groups than for the high-Q groups. Profit margins increase for the high-Q groups, and decrease for low-Q groups.15 We also performed this analysis for core profit margins before R&D, and advertising expense (and depreciation and amortization). For the low-Q group, these margins declined in Year 0 on average, whereas those after R&D and advertising expenses increased. Thus, lower R&D and advertising expenditures turned otherwise decreasing mean margins into increasing margins.
Table 4 shows that mean asset turnovers increase after Year 0 for high-Q firms but decline for low-Q firms; thus, the Q-score predicts differences in changes in asset turnovers, as well as margins. Note, furthermore, that because the mean asset turnover for low-Q groups declines in Year 0 (reducing RNOA), the core RNOA created by low-Q firms in Year 0 appears to be a profit margin effect. The decline in asset turnovers for low-Q firms in Year 0 is driven by sales' increasing at a slower rate than net operating assets. Thus, the low-Q firms are increasing profit margins and maintaining core RNOA in Year 0 at the level of high-Q firms, on average, even though their sales growth is declining relative to the growth of their net operating assets. Furthermore, the decline in asset turnover subse- quently continues, on average. Asset turnovers for high-Q groups increase in Year 0. These results indicate that changes in turnover are related to earnings quality, as in Fairfield and Yohn (2001) but for different reasons, for that paper views changes in net operating assets (rather than Q) as a diagnostic of earnings quality.
Analysis of Changes in Investment To corroborate that changes in Q are indeed due to changes in investment, we tracked
the investment in inventory, R&D, and advertising. For these three items, changes in re- serves due to conservative accounting result from changes in dollar investments, so we tracked cumulative (compounded) growth rates of estimated reserves for high- and low-Q groups for years -5 to +5. The average growth rates for the low-Q groups declined in years up to and including Year 0, and were lower than those for high-Q firms. However, they subsequently converged toward the high-Q growth rates indicating that the slowing of investment growth up to Year 0 was indeed temporary, and thus increased earnings, profit margins, and RNOA temporarily.
There is one qualification to our interpretation of the results. Firms that reduce invest- ment or the rate of growth in investment can do so in anticipation of lower profitability of new projects. Therefore, the lower RNOA after Year 0 for low-Q firms may reflect lower
15 Regression tests similar to those in Table 3 support the inferences from Table 4. Also, of the firms that survived through Year +1, 49.8 percent of low-Q firms had increasing profit margins in Year +1, compared to 55.1 percent of high-Q firms.
This content downloaded from 137.99.100.26 on Mon, 30 Mar 2015 10:56:02 UTCAll use subject to JSTOR Terms and Conditions

254 The Accounting Review, April 2002
r-ooo > Cg
N N o CD cri N _1 00 * Y O o N o~~~~~~~~~~~~~~~~~~~C cD o .CO ,D ?
CD r 00 0COC 0 0 N N dO o
O 0
Q _-4 1
0 t O c0o 0. 6 6 -CcIt m ' Ceol
C-00 CD ON O= O OO y .C
? I W I8 m 00
0 0 It n CD _) 0 0 r ' 0
=
E
~~~~~~~~~~~~~~~~~CD ' cxt CD 0oE CD CD rY
E o > 1 ? o c o c m IN r ;- 't I 0 > ^ 1 ? | > & . cz ,, E . X |0
<! X o I ~~~~~~,c - CD a oN r- i 't 00 o I
Y eN"-- 0D 0ooooo N 00 aN W W) 00 C D 0D C t 0' 0 CD
rH ~ ~ ~ C~~ 00 Cl 0t I~ I nNNNNo
<c~~~~~~~~~~~~~~~~~~~~~~~ . - 3 . : 1 QE
t > c o N N o X c N Q r o =~~~~~~~~-o Q~~~~~~~~~~~~~~~~~~C CD O.N 11 11- O. 'N.
aN W)~~~~~~~~~~~~~~~~~
*eY,~~~~~~~~~~~C O CD CD CD(N< ^
: 3 4 | | o oc o o s N 0 N CD r- X XE
n O V): t cr N C o 0C0- CDCD0-r 1 -4004ii'0c C
04 C) 0 I, OON 00,-C W) t. -~~~~~~~~~~ I~~~~~~~~I
W) CD ~ ~ ~ ~ o0~)-
000 OO oo 0n O
'E S = a 3 X X C A a N CD ,-C O B '
CD I
Od4
Eci-- - a--'no a a N E
_ <, .m X 3 O e | t @ C) CD CD CD CD 00 C- C- C- ,- 6 ,o
Cn 0 A0 - o6 66Uii I -. I
cy ~~~ci~~~~ci tf~~~~CnC
In"-4~~~~~~~~t~~~i ~~~~ 0 --. i rid-- - - cir~~~~~~~~~~~~~~~~~t~~~~~ r-~~C Cn ~~~~~~~~~~~~~~~~~~~~~~~~~~C 0 0d -0Cn o666 6 ~~~~~~~~~~~~~Ci~~~~~~i~~~~i 6 In~~~~~+Z4 CnI
This content downloaded from 137.99.100.26 on Mon, 30 Mar 2015 10:56:02 UTCAll use subject to JSTOR Terms and Conditions

Penman and Zhang-Accounting Conservatism and Earnings Quality 255
project profitability. The finding that the decline in investment is temporary argues against this interpretation. Furthermore the conservatism effect is at work, ceteris paribus, by the construction of the accounting. In any case, an anticipated change in profitability from its current level for any reason indicates unsustainable current earnings, and the results indicate the Q-score identifies unsustainable earnings irrespective of the cause.
Survivorship We have presented the core RNOA for high- and low-Q groups for Years +1 to +5 as
those that an investor might predict by observing Q-scores in Year 0. However, the analysis is of ex post outcomes, and we included firms in the analysis for Years +1 to +5 only if they survived to the respective years. Therefore, we do not observe realizations of core RNOA for the nonsurvivors that would have been predicted ex ante. This is a problem only if survivorship differs over high- and low-Q groups.
The number of firms included in the analysis for each of these years appears at the bottom of Table 2.16 The survival rate for high-Q firms in Years +1 to +5 were 95.9 percent, 92.5 percent, 89.3 percent, 86.5 percent, and 83.8 percent, respectively-very sim- ilar to the corresponding rates for low-Q firms of 96.3 percent, 92.7 percent, 89.6 percent, 86.7 percent, and 83.8 percent, respectively. Of the high-Q firms that did not survive, 94.6 percent failed to survive because of merger and acquisition; the corresponding percentage for low-Q firms was only 82.5 percent. Thus, low-Q firms had a high percentage of firms that terminated for reasons other than mergers, such as liquidation, delisting, or suspension of trading.
VI. THE RETURNS TO QUALITY ANALYSIS We now investigate whether the stock market prices stocks as if it appreciates the
differential quality of earnings indicated by our Q-score. We take investment positions in stocks in the sample period based on their Q-scores and observe whether these positions earn differential returns, adjusting for conjectured risk differentials.
In each year from 1976 to 1995, and within each two-digit SIC industry code, we ranked the firms into ten equal-sized portfolios based on their Q-scores. Year 0 is the year we formed the portfolios. The portfolio formation date is three months after fiscal year- end, by which time the firm must file its annual reports with the SEC. We then calculated mean buy-and-hold returns for each portfolio for each year, -2 to +5, relative to this date. The computed returns include delisting returns for nonsurvivors. Table 5 reports mean raw returns and size-adjusted returns during the 20 years that the positions were taken. The grouping within industry controls for operating risk (to some degree), and the size adjust- ment controls for the stock return "size effect" that researchers (e.g., Fama and French 1992) conjecture is a premium for risk. We computed the size-adjusted returns by subtracting the raw (buy-and-hold) return on a size-matched, value-weighted portfolio formed from size-decile groupings supplied by CRSP.
The mean returns for years +1 to +5 in Table 5 are positively related to Q. The size- adjusted returns for portfolios 7-10 (the high-Q portfolios) are positive, and those for Year + 1 (in boldface) are significantly different from 0. Those for the low-Q portfolios 1-4 are considerably lower, and many are negative. The difference between the mean raw returns
16 The number of firms at the bottom of Table 2 for Years +2 to +5 overstates survivorship. Because the data period ended in 1997, data were not available for all of the Years +2 to +5 for firms with Year 0 rankings in 1993-1996. The survivorship rates that follow exclude the observations unavailable at the end of the sample period.
This content downloaded from 137.99.100.26 on Mon, 30 Mar 2015 10:56:02 UTCAll use subject to JSTOR Terms and Conditions

256 The Accounting Review, April 2002
TABLE 5 Mean Percentage Annual Stock Returns for Portfolios Formed on Q-Scores 1976-1995a
Year Relative to Year Q-Score Is Calculated (Year 0)
Q Portfolios -2 -1 0 1 2 3 4 5
Panel A: Raw Returns
Lowest Q 26.67 28.19 26.39 17.03 22.51 20.81 22.58 19.12 2 21.27 22.25 19.51 19.02 20.36 21.20 18.70 17.15 3 22.56 20.75 21.16 21.39 20.90 20.68 18.94 20.26 4 23.25 24.39 21.01 19.63 22.85 20.35 24.13 18.21 5 21.30 23.44 19.81 20.87 21.73 20.75 22.19 17.52 6 20.87 22.37 19.56 20.97 20.94 20.15 21.44 19.80 7 20.32 21.58 20.15 22.64 21.47 20.77 20.55 18.24 8 20.57 22.39 21.20 21.19 21.05 21.41 19.39 17.84 9 19.66 18.50 21.94 21.20 21.64 19.84 19.70 18.88
Highest Q 18.25 20.64 23.33 26.06 23.53 22.78 22.12 20.93
High - Low -8.41 -7.55 -3.06 9.03 1.02 1.98 -0.46 1.80
Significance 0.000 0.000 0.013 0.000 0.265 0.091 0.616 0.136
Panel B: Size-Adjusted Returns
Lowest Q 3.39 5.40 4.21 -3.17 -0.26 -0.09 -0.24 -0.06 2 0.08 0.72 -0.57 -0.66 0.48 1.58 -1.29 -0.22 3 2.33 0.72 1.21 1.72 1.35 1.05 -0.47 3.90 4 2.97 3.27 1.56 0.12 2.58 1.09 5.34 1.99 5 1.32 2.68 0.54 1.51 1.46 2.15 2.23 0.65 6 1.07 2.20 0.27 1.06 1.78 1.59 3.47 2.86 7 1.34 2.41 0.87 2.85 2.12 1.99 2.09 1.79 8 2.61 1.23 3.14 2.91 1.44 3.05 0.80 1.29 9 0.79 -0.12 2.10 2.76 2.40 1.02 0.39 2.06
Highest Q -0.42 0.19 2.34 5.78 1.80 2.38 2.63 2.90
High - Low -3.81 -5.21 -1.87 8.95 2.05 2.46 2.86 2.96
Significance 0.001 0.000 0.071 0.000 0.070 0.036 0.024 0.031
a We calculated buy-and-hold returns for each Q-score portfolio for each year, -2 to +5, in each scoring year, 1976-1995. Panel A reports the mean returns over the 20 years. Panel B reports the mean size-adjusted returns, computed by subtracting the raw (buy-and-hold) return on a size-matched, value-weighted portfolio formed from CRSP size-deciles.
The high-low return is the return from investing long in the highest Q portfolio and investing the same dollar amount short in the lowest Q portfolios, for 0 net investment. Significance tests are based on 5,000 replications of randomly assigning firms to Q portfolios. The significance levels for the high-low return are the frequency of observing returns equal to the positive (negative) return on the high-low investment strategy, or higher (lower), in the 5,000 replications. For the size-adjusted returns in Panel B, returns in boldface are those where we observed returns equal to or greater than the return reported (or equal to or less than the return reported if negative) less than 5 percent of times in 5,000 replications with random assignment of stocks to portfolios.
This content downloaded from 137.99.100.26 on Mon, 30 Mar 2015 10:56:02 UTCAll use subject to JSTOR Terms and Conditions

Penman and Zhang-Accounting Conservatism and Earnings Quality 257
for the highest Q and lowest Q portfolios in Year + 1 is 9.03 percent, or 8.95 percent on a size-adjusted basis. This is a return, before transaction costs, to a zero-net-investment strat- egy with the canceling of long and short positions in the highest- and lowest-Q portfolios. We assessed the statistical significance of these returns by randomly assigning firms to Q portfolios in 5,000 replications of the zero-net-investment strategy. The reported significance levels are the relative frequencies of observing the actual mean differences, or higher, in these replications. The results in Table 5 reveal that most of the return from going long on high-Q stocks and shorting low-Q stocks occurs in the first year after Year 0. Figure 2 indicates that this strategy would have yielded a positive return before transaction costs in every year except 1990.
Not only are the returns to the zero-net-investment strategy positive after Year 0, but they are also negative prior to Year 0. The difference in returns between high and low groups in Years -2 to 0 and Years +1 to +5 correspond to differences in the changes in core RNOA graphed in Figure 1. Over Years -2 to 0, the average median-adjusted core RNOA increases for low-Q firms (releasing reserves), compared to the decrease for high- Q firms (building up reserves), with a reversal of the pattern in Years +1 to +5. So these return reversals are consistent with the market interpreting the firms' reported earnings uncritically in Years -2 to 0, but correcting this mistake in subsequent years. It appears that the market fails, at least in part, to penetrate the earnings quality due to changes in reserves created by conservative accounting and changes in investment.
Sensitivity Tests and Further Analysis Implementation of the Trading Strategy
The trading strategy, as implemented in Table 5, may suffer from a "peeking-ahead" bias. We used Lev and Sougiannis's (1996) estimated coefficients to capitalize and amortize R&D, and these estimates use data from dates after we take positions in the stocks, at least for some years. Furthermore, in calculating the C-score, we substituted industry medians when certain subscores were missing, but median data are sometimes unavailable at the
FIGURE 2 Mean Size-Adjusted Return Differences between High-Q and Low-Q Portfolios in the Year
Following the Q-Scoring (Year t + 1), for Each Year, 1976-1995
Mean Size-Adjusted Return
0.3-
*2 0.2-
Of2ul. l il l o>l! l 0 d)0
._ C O r rD C m O Lo (O r o C) CD 1 CM CO t O
-0.1 Year
This content downloaded from 137.99.100.26 on Mon, 30 Mar 2015 10:56:02 UTCAll use subject to JSTOR Terms and Conditions

258 The Accounting Review, April 2002
ranking date due to different fiscal year-ends. The QB component of the Q-score also involves an industry comparison. Finally, because firms do not have the same fiscal year- ends, their Q-scores would not have been available at the same time for ranking relative to each other.
Accordingly, we repeated the tests reported in Table 5 after modifying the research design to eliminate each of these possible biases. We capitalized R&D, using a sum-of-the- year's digits method over five years to amortize capitalized expenditures. We used the prior year's industry median for calculating C-scores, and, when forming portfolios, we compared Q-scores only for firms with December 31 fiscal year-ends. With these modifications, the difference in size-adjusted returns between high- and low-Q portfolios in Year + 1 (with significance levels in parentheses) was 7.63 percent (0.000), and, for Years +2 to +5, the difference was 3.36 percent (0.018), 2.97 percent (0.020), 0.36 percent (0.516), and 3.92 percent (0.016), respectively, for the 58.8 percent of firm-years with December 31 fiscal year-ends. 17
Dealing with Possible Late Filers For the analysis in Table 5 we took positions in stocks three months after fiscal year-
end, based on the assumption that annual reports are publicly available by that time. Al- though the SEC requires firms to file their financial reports within those three months, some firms file late. Table 6 reports monthly mean size-adjusted returns for each month beginning four months after fiscal year-end. The returns are for the low-Q and high-Q portfolios in Table 5, and for the difference between the two. It is clear from the returns for month 5 onward that the Year + 1 returns in Table 5 are not due solely to returns in the fourth month after the fiscal year-end, when firms may still be reporting.
Table 6 also reports the number of quarterly earnings announcements in each month. The returns to long positions in high-Q firms and the canceling of short positions in the low-Q firms are relatively high in months 7 and 8 when second-quarter earnings for Year +1 would have been announced, and in months 10 and 11 when third-quarter earnings for that year would have been announced. This, like similar investigations of how apparent mispricing corrects itself (e.g., Freeman and Tse 1989; Bernard et al. 1997), suggests the market corrects its mispricing of forecasted earnings for Year +1 as those earnings are realized. The association of the returns with earnings reporting also supports the interpre- tation that the predicted returns are attributable to mispricing rather than to rewarding for risk. However, the association of the returns in Table 6 with earnings reporting months is imperfect; for months 4 and 5 when first quarter earnings would have been announced, the returns are relatively low, and returns in some months with relatively few announcements are positive and significant. Tests of returns around narrower windows surrounding subse- quent earnings announcements and analysts' forecast revisions would be necessary to draw more definitive conclusions.
Analysis of Potential Risk Proxies Risk is nearly always a potential alternative explanation for predictable abnormal re-
turns. Most of the return differences between high-Q and low-Q groups occur in Year + 1,
17 We also made a calculation for all firms irrespective of fiscal year-end, by forming portfolios every month based on firms with fiscal year-ends three months before, and then weighting the monthly portfolios equally (investing $1 each month). The mean, size-adjusted return difference (significance level) between high- and low-Q port- folios in Year + 1 was 15.27 percent (0.004) using equal weights, and 6.34 percent (0.072), 7.27 percent (0.056), -0.20 percent (0.460), and 5.79 percent (0.147) in Years +2 to +5, respectively. We obtained similar results by weighting monthly portfolios according to the number of firms in the month's ranking.
This content downloaded from 137.99.100.26 on Mon, 30 Mar 2015 10:56:02 UTCAll use subject to JSTOR Terms and Conditions

Penman and Zhang-Accounting Conservatism and Earnings Quality 259
N00 0- c) 44~
bs > ~O N ON > f
Cu~~~~~~~~~~~~~~~~~~C
00 0 c
E~~~c * | o cE,
0 S ol 1. 0 ^ ?E, E g ai O I
E < | 1~R~ - ? M d
z~~~~~~~~~~~~~~7
-~~~ CV C k
U E E w 4== tS~~~U C
I 4 q 00 Sc
0' ~~~~~~~~
e L. ~~~~~o " ~ ~ 4 r E
I -~~~~~0C 0 O)
0 0C -d
Cu ~ ~ ~ r (4 C C)1
I -~~~~~~~~~~~~~~~~~-
O~~~~~ -- 6 ~~~~~~~~~~~C
4-i
u0 C), C),
o ~~~~~~o~ U ~~~a
0 - 40
This content downloaded from 137.99.100.26 on Mon, 30 Mar 2015 10:56:02 UTCAll use subject to JSTOR Terms and Conditions
260 The Accounting Review, April 2002
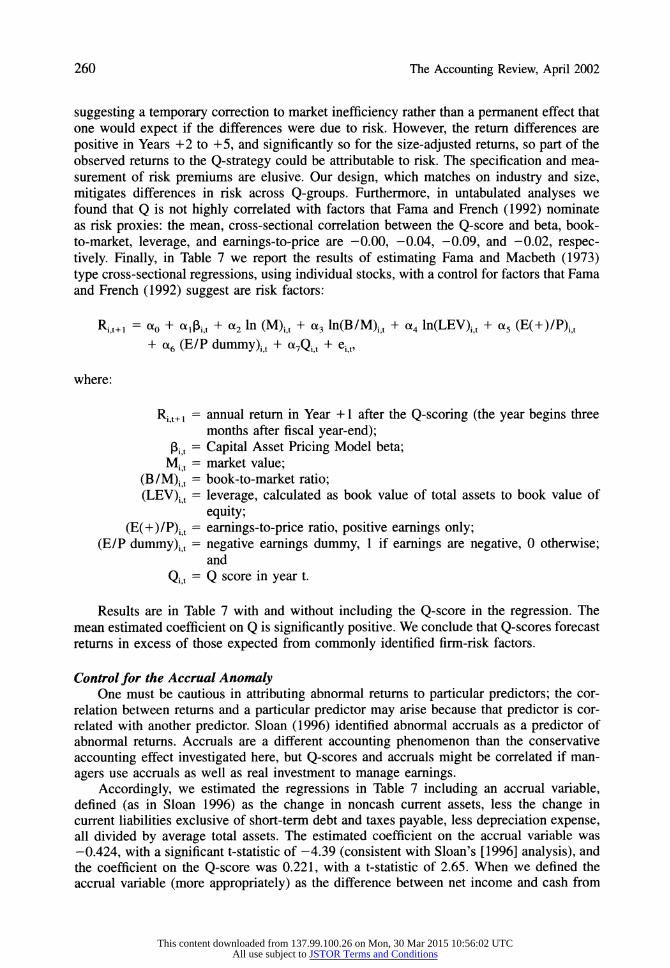
suggesting a temporary correction to market inefficiency rather than a permanent effect that one would expect if the differences were due to risk. However, the return differences are positive in Years +2 to +5, and significantly so for the size-adjusted returns, so part of the observed returns to the Q-strategy could be attributable to risk. The specification and mea- surement of risk premiums are elusive. Our design, which matches on industry and size, mitigates differences in risk across Q-groups. Furthermore, in untabulated analyses we found that Q is not highly correlated with factors that Fama and French (1992) nominate as risk proxies: the mean, cross-sectional correlation between the Q-score and beta, book- to-market, leverage, and earnings-to-price are -0.00, -0.04, -0.09, and -0.02, respec- tively. Finally, in Table 7 we report the results of estimating Fama and Macbeth (1973) type cross-sectional regressions, using individual stocks, with a control for factors that Fama and French (1992) suggest are risk factors:
Ri~t+ = ao + ajI3 + a2 In (M)it + a3 ln(B/M)ist + t4 ln(LEV)it + t5 (E(+)/P)it
+ a6 (E/P dummy)it + A7Qt + e
where:
Ri t+ I= annual return in Year +1 after the Q-scoring (the year begins three months after fiscal year-end);
Pit= Capital Asset Pricing Model beta; Mit= market value;
(B/M)i t= book-to-market ratio; (LEV)it = leverage, calculated as book value of total assets to book value of
equity; (E(+)/P)it = earnings-to-price ratio, positive earnings only;
(E/P dummy)it = negative earnings dummy, 1 if earnings are negative, 0 otherwise; and
Q t= Q score in year t.
Results are in Table 7 with and without including the Q-score in the regression. The mean estimated coefficient on Q is significantly positive. We conclude that Q-scores forecast returns in excess of those expected from commonly identified firm-risk factors.
Control for the Accrual Anomaly One must be cautious in attributing abnormal returns to particular predictors; the cor-
relation between returns and a particular predictor may arise because that predictor is cor- related with another predictor. Sloan (1996) identified abnormal accruals as a predictor of abnormal returns. Accruals are a different accounting phenomenon than the conservative accounting effect investigated here, but Q-scores and accruals might be correlated if man- agers use accruals as well as real investment to manage earnings.
Accordingly, we estimated the regressions in Table 7 including an accrual variable, defined (as in Sloan 1996) as the change in noncash current assets, less the change in current liabilities exclusive of short-term debt and taxes payable, less depreciation expense, all divided by average total assets. The estimated coefficient on the accrual variable was -0.424, with a significant t-statistic of -4.39 (consistent with Sloan's [1996] analysis), and the coefficient on the Q-score was 0.221, with a t-statistic of 2.65. When we defined the accrual variable (more appropriately) as the difference between net income and cash from
This content downloaded from 137.99.100.26 on Mon, 30 Mar 2015 10:56:02 UTCAll use subject to JSTOR Terms and Conditions

Penman and Zhang-Accounting Conservatism and Earnings Quality 261
TABLE 7 Mean Coefficient Estimates for Regressions of Year-Ahead Returns on Q-Scores and Factors
to Control for Risk 1976-1995a
Rit+l = ao + a3li, + a2 ln(M)i, + a3 ln(B/M)i, + a4 ln(LEV)i, + a5(E(+)/P)ist + a6 (E/P dummy)i, + a7Qi, + ei,
Q-Score Included Q-Score Not Included in the Regression in the Regression
Variable Definition Coefficients t-statistics Coefficients t-statistics
Constant Intercept 0.2601 5.680** 0.2740 6.017**
hi t Beta -0.0104 -0.573 -0.0009 -0.505
Ln(M)i t Size -0.0192 -3.333** -0.0185 -3.213**
Ln(B /M)it Book-to-market 0.0276 1.933 0.0251 1.724
Ln(LEV)i t Leverage 0.0491 2.634* 0.0430 2.227*
(E(+)/P)i t E/P 0.2878 1.435 0.2017 1.033
(E/P dummy)it Negative E dummy -0.0109 -0.322 -0.0083 -1.517
Qi't Q-score 0.2873 3.834**
*, ** Denotes significance at the 0.05 and 0.01 levels, respectively, using a two-tailed test. aRegression variables are as follows:
R =t+ I annual return in Year +1 after the Q scoring; the year begins three months after fiscal year- end;
= Capital Asset Pricing Model beta; Mi t = market value;
(B /M)i~t = book-to-market ratio; (LEV)it = leverage, calculated as book value of total assets to book value of equity;
(E(+)/P)i~t= earnings-to-price ratio, positive earnings only; (E/P dummy)it = negative earnings dummy, 1 if earnings are negative, 0 otherwise; and
Qit = Q score in year t. We estimated regression coefficients for each month of the sample period, where firms in the estimation for each month are those whose fiscal years ended three months earlier. Coefficients reported are mean regression estimates over 240 monthly cross-sectional regressions from 1976 tol995.
operations (divided by average total assets), the estimated coefficient on accruals was -0.302, with a t-statistic of -3.46, and that on the Q-score was 0.260, with a t-statistic of 3.12. We therefore conclude that the effect of the Q-score is incremental to that of accruals relative to total assets.
Analysis of Subscores We repeated the return tests substituting Q-scores calculated from C subscores: (1)
inventory accounting, (2) R&D, and (3) advertising. Substituting each subscore in separate regressions yielded results quite similar to those for the composite score. The mean, size- adjusted return for the zero-net-investment strategy in Year + 1 for the R&D subscore was 7.33 percent (significance level 0.000), 5.22 percent (0.000) for the inventory subscore, and 4.24 percent (0.000) for the advertising subscore. However, when we estimated regressions of the form in Table 7, but substituted the set of all three Q subscores for the overall Q- score in a single regression, the coefficient on the inventory subscore was not statistically
This content downloaded from 137.99.100.26 on Mon, 30 Mar 2015 10:56:02 UTCAll use subject to JSTOR Terms and Conditions

262 The Accounting Review, April 2002
significant. This result suggests that much of the information about future returns in the inventory subscore is captured by the R&D and advertising subscores.
Control for Growth in Net Operating Assets We also estimated regressions similar to those in Table 7 including both the Q-score
and growth in net operating assets as explanatory variables to see whether the result might be due to growth in net operating assets (which affects the QA score). The coefficient on the growth variable was -0.066 (with a t-statistic of -2.42) and that on the Q-score was 0.218 (with a t-statistic of 2.70). Thus, Q continues to play an incremental role in fore- casting stock returns, after controlling for growth in net operating assets.
Analysis of Q and QB
We also repeated the tests basing investment positions on either QA or QB. We were concerned that QB, a levels measure of the conservative accounting reserve (rather than a change variable like QA) might be correlated with risk factors or with other factors that predict returns. For example, reserves (and thus QB) depend on the accumulated amount of R&D investment relative to net operating assets and Chan et al. (2000) indicate that the market undervalues R&D. However, the zero-net-investment strategy using QA returned a size-adjusted return in Year + 1 of 8.19 percent (significance level 0.000), and 1.41 percent (0.160) in Year +2, and the QB-based strategy earned 5.69 percent (0.000) in Year + 1 and 2.37 percent (0.047) in Year +2.
VII. CONCLUSION Commentators sometimes claim that the practice of conservatism in accounting pro-
duces higher-quality earnings. Conservatism yields lower earnings, they say, and so prima facie these conservative earnings are of higher quality. However, conservative accounting with investment growth depresses earnings and accounting rates of return, and creates un- recorded reserves. Firms slowing investment release these reserves, creating earnings and higher rates of return. If the change in investment is temporary, then the effects on earnings and rates of return are temporary, leading to lower-quality-or less sustainable-earnings.
Using a constructed index of accounting conservatism and a constructed index of the quality of earnings, this study identifies poor-quality earnings that result from changes in investment coupled with conservative accounting. The quality index forecasts how future core return on net operating assets is likely to change from current levels, so our index provides an analysis tool to identify low-quality earnings.
The study also shows that quality scores incrementally predict future stock returns, before transaction costs, over the 1976-1995 period, after controlling for measures com- monly conjectured as risk proxies, and after controlling for growth in net operating assets and for accruals. These results suggest that the stock market did not penetrate the quality of earnings of firms with conservative accounting during the sample period. Accordingly, with the caveat that risk may not have been adequately controlled, the study indicates that a quality analysis of the form in the paper would have been rewarded with abnormal returns in the stock market during the sample period.
REFERENCES Baber, W., P. Fairfield, and J. Haggard. 1991. The effect of concern about reported income on dis-
cretionary spending decisions. The Accounting Review 66 (October): 818-829. Basu, S. 1997. The conservatism principle and the asymmetric timeliness of earnings. Journal of
Accounting and Economics 24: 3-37.
This content downloaded from 137.99.100.26 on Mon, 30 Mar 2015 10:56:02 UTCAll use subject to JSTOR Terms and Conditions
Penman and Zhang-Accounting Conservatism and Earnings Quality 263
Beaver, W., and E. Engel. 1996. Discretionary behavior with respect to allowances for loan losses and the behavior of security prices. Journal of Accounting and Economics 22: 177-206.
, and S. Ryan. 2000. Biases and lags in book value and their effects on the ability of the book- to-market ratio to predict book return on equity. Journal of Accounting Research 38 (Spring): 127-148.
Bernard, V., J. Thomas, and J. Wahlen. 1997. Accounting-based stock price anomalies: Separating market inefficiencies and risk. Contemporary Accounting Research (Summer): 89-136.
Bublitz, B., and M. Ettredge. 1989. The information in discretionary outlays: Advertising, research, and development. The Accounting Review 64 (January): 108-124.
Chan, L., J. Lakonishok, and T. Sougiannis. 2000. The stock market valuation of research and de- velopment expenditures. Journal of Finance 56 (December): 2431-2451.
Fairfield, P., J. Whisenant, and T. Yohn. 2001. Accrued earnings and growth: Implications for earnings persistence and market mispricing. Working paper, Georgetown University.
, and T. Yohn. 2001. Using asset turnover and profit margin to forecast changes in profitability. Review of Accounting Studies 6 (December): 371-385.
Fama, E., and J. Macbeth. 1973. Risk, return and equilibrium-Empirical tests. Journal of Political Economy 81 (May/June): 607-636.
, and K. French. 1992. The cross-section of expected stock returns. Journal of Finance 47: 427-465.
Feltham, J., and J. Ohlson. 1995. Valuation and clean surplus accounting for operating and financial activities. Contemporary Accounting Research 11 (2): 689-731.
Freeman, R., and S. Tse. 1989. The multiperiod information content of accounting earnings: Confir- mations and contradictions of previous earnings reports. Journal of Accounting Research 27 (Supplement): 49-79.
Gjesdal, F. 1999. A steady state growth valuation model: A note on accounting and valuation. Working paper, Norwegian School of Economics, Bergen, Norway.
Greenball, M. 1969. Appraising alternative methods of accounting for accelerated tax depreciation: A relative accuracy approach. Journal of Accounting Research 7: 262-289.
Hall, B. 1993. Industrial research during the 1980s: Did the rate of return fall? Brookings Papers on Economic Activity, Microeconomics: 289-344.
Healy, P. 1985. The effect of bonus schemes on accounting decisions. Journal of Accounting and Economics 7: 85-107.
, and J. Wahlen. 1999. A review of the earnings management literature and its implications for standard setting. Accounting Horizons 13 (December): 365-383.
Jones, J. 1991. Earnings management during import relief investigations. Journal of Accounting Re- search 29 (Autumn): 193-288.
Lee, C., J. Myers, and B. Swaminathan. 1999. What is the intrinsic value of the Dow? Journal of Finance 54: 1693-1741.
Lev, B., and T. Sougiannis. 1996. The capitalization, amortization, and value-relevance of R&D. Journal of Accounting and Economics 21: 107-138.
Moehrle, S. 2002. Do firms use restructuring charge reversals to meet earnings targets? The Accounting Review 77 (April): 397-414.
Mulford, C., and E. Comiskey. 1996. Financial Warnings. New York, NY: John Wiley & Sons. Nissim, D., and S. Penman. 2001. Ratio analysis and equity valuation: From research to practice.
Review of Accounting Studies 6: 109-154. Ou, J., and S. Penman. 1989. Financial statement analysis and the prediction of stock returns. Journal
of Accounting and Economics 14: 295-329. Penman, S., and T. Sougiannis. 1998. A comparison of dividend, cash flow, and earnings approaches
to equity valuation. Contemporary Accounting Research 15: 343-383. . 2001. Financial Statement Analysis and Security Valuation. New York, NY: McGraw-Hill.
Perry, S., and R. Grinaker. 1994. Earnings expectations and discretionary research and development spending. Accounting Horizons (December): 43-51.
This content downloaded from 137.99.100.26 on Mon, 30 Mar 2015 10:56:02 UTCAll use subject to JSTOR Terms and Conditions

264 The Accounting Review, April 2002
Sloan, R. 1996. Do stock prices fully reflect information in accruals and cash flows about future earnings? The Accounting Review 71: 289-315.
Teoh, S., T. Wong, and G. Rao. 1998. Are accruals during initial public offerings opportunistic? Review of Accounting Studies 3: 175-208.
Zhang, X. 2000. Conservative accounting and equity valuation. Journal of Accounting and Economics 29: 125-149.
. 2001. Accounting conservatism and the analysis of line items in earnings forecasting and valuation. Working Paper, University of California, Berkeley.
This content downloaded from 137.99.100.26 on Mon, 30 Mar 2015 10:56:02 UTCAll use subject to JSTOR Terms and Conditions