Embed Size (px)
Citation preview
Accounting Standards Harmonization and Financial Statement Comparability:Evidence from Transnational Information Transfer
Clare WangThe Wharton School
University of [email protected]
Current Version: January 2011
Abstract
This study investigates whether harmonization of accounting standards enhances thecomparability of �nancial information across countries. First, I statistically de�ne and linkcomparability to �rm value in a two-�rm, sequential information release framework. I thenempirically test the prediction that a �rm yet to announce earnings reacts more stronglyto the earnings announcement of a foreign �rm when both report under the same ratherthan di¤erent accounting standards. My analysis of abnormal price and volume reactionsfor a global sample of �rms supports this prediction. Next, in an attempt to control forthe e¤ects of changes in reporting quality, I use a di¤erence-in-di¤erences design aroundthe mandatory introduction of International Financial Reporting Standards (IFRS). I �ndthat mandatory adopters experience a signi�cant increase in market reactions to the releaseof earnings by voluntary adopters compared to pre-mandatory adoption. This increaseis not observed for non-adopters over the same period. Taken together, my study showsthat accounting standards harmonization facilitates transnational information transfer, andsuggests comparability as a direct mechanism.
I thank my dissertation committee members Brian Bushee, Luzi Hail, Catherine Schrand (Chair) and
Robert Verrecchia for their continuous and invaluable guidance. I also thank Gus De Franco, Wayne Guay,
Mirko Heinle, Ray Ke and Rick Lambert for their helpful comments. I gratefully acknowledge the �nancial
support from the Wharton School and the Connie K. Duckworth Endowed Doctoral Fellowship.

1 Introduction
This study seeks to enhance our understanding of �nancial statement comparability�s
bene�ts for market participants, asking whether harmonization of accounting standards
achieves comparability across countries. In a transnational intra-industry information
transfer context, I predict and �nd that a �rm�s price and volume reactions to a foreign
�rm�s earnings announcement are signi�cantly higher for �rms reporting under the same
rather than di¤erent accounting standards. The intuition is that when the underlying
measurement processes for accounting earnings are more correlated, i.e., when they are
more comparable, investors can better harness value-relevant information embedded in the
foreign �rm�s earnings signal.
Financial statement comparability has been recognized as an important characteristic of
�nancial reporting, improving the usefulness of accounting information. Broadly, economic
decision-making compares alternatives and accounting textbooks emphasize that �nancial
results cannot be evaluated in isolation. Libby, Libby and Short (2009, p.714), for example,
maintain that �[a]nalyzing �nancial data without a basis for comparison is impossible.�
The importance of �nancial statement comparability across �rms is further underscored
in valuation techniques such as price multiples, which are used extensively by investment
banks and institutional investors. Consequently, standard setters position comparability as a
central feature of the �nancial reporting system. Speci�cally, comparability is one of the four
�enhancing qualitative characteristics�of accounting information de�ned in the �rst phase of
the joint conceptual framework completed by the International Accounting Standards Board
(IASB) and the Financial Accounting Standards Board (FASB) (IASB, 2010; FASB, 2010).
Financial statement comparability, however, is inherently di¢ cult to de�ne and
operationalize. Even theoretically, the e¤ect of comparability on equity valuation is not
de�nitive. A few empirical studies investigate the role of comparability in di¤erent contexts
including a �rm�s overall information environment (e.g., De Franco, Kothari and Verdi, 2010;
Lang, Ma¤ett and Owens, 2010; Bradshaw, Miller and Serafeim, 2009), mutual fund holdings
1

(e.g., DeFond, Hu, Hung, and Li, 2009; Yu, 2010) and use of relative performance evaluation
(e.g., Wu and Zhang, 2010). Yet these studies provide mixed evidence and do not directly
address the e¤ect of comparability in equity valuation. Moreover, in studies that examine the
�rm�s own economic consequences to test the e¤ects of comparability, a �rst order reporting
quality e¤ect as an alternative explanation for the results is di¢ cult to rule out.
I propose a statistical de�nition of comparability, which allows me to motivate an equity
valuation role for comparability in a theoretical framework. My de�nition of comparability
relies on one descriptive feature of any accounting system: GAAP �nancial statements
measure �rm value with error (Barth, Clinch and Shibano, 1999; Christensen, 2010), which
I term accounting standards measurement error, or simply measurement error.1 I de�ne
�nancial statement comparability as the correlation between the measurement errors from
information signals across two �rms.2
I incorporate my de�nition of comparability into a two-�rm, sequential information
release framework and derive empirical predictions on the transfer of information from
a �rm�s earnings announcement to a �rm yet to announce earnings. The information
transfer context is useful for identifying the comparability e¤ect empirically as it is a
direct, short-window test of how one �rm�s information signal a¤ects the other �rm�s
valuation. I show that the non-announcing �rm�s market reactions to the announcing �rm�s
earnings report increase with the correlation between the measurement errors, as a higher
correlation allows investors to infer more information from the announcing �rm�s earnings
signal when valuing the non-announcing �rm. While these outcomes may seem intuitive, my
analysis highlights the constraints in a rational expectations framework (e.g., Holthausen
and Verrecchia, 1988) and the necessary modi�cations that deliver these predictions.
1Admittedly, equity valuation is just one of the objectives of �nancial reporting. The term �accountingstandards measurement error�does not imply that the sole objective of accounting standards is to measure�rm value.
2An equivalent way to convey this notion of comparability is the correlation between the measurementprocesses of true economic value across two �rms.
2
I test the prediction that comparability a¤ects the degree of information transfer in
two cross-border settings leveraging the ongoing global convergence towards International
Financial Reporting Standards (IFRS). Harmonization of accounting standards o¤ers a
powerful treatment e¤ect where the increase in correlation between measurement errors
should be signi�cant and visible based on a change of the entire system for preparing and
disclosing information. In theory, if two �rms with the same economic activities report
under the same standards, then the measurement errors should be perfectly correlated.3
If two �rms report under di¤erent standards, then the correlation between measurement
errors will depend on the speci�c standards. For example, one would expect the correlation
resulting from applications of IFRS and U.S. GAAP to be relatively high in comparison to the
correlation resulting from applications of IFRS and Greek GAAP.4 Consequently, I expect
that the non-announcing �rms�price and volume reactions to an earnings announcement by
the foreign �rm to be higher for �rms reporting under the same (more correlated) accounting
standards than for �rms reporting under di¤erent (less correlated) accounting standards.
However, there are at least two reasons why my predictions may not be borne out
empirically. First, extant literature shows that a mere switch to a common set of accounting
standards is not su¢ cient to change the properties of accounting numbers as a result of
countries� institutional framework and �rms�reporting incentives.5 Second, any observed
e¤ects are confounded by the reporting quality e¤ect of accounting standards, making it
3In general, any set of accounting standards accommodates accounting method choices. As a simpli�cationon the conceptual level, I assume that �rms make the same accounting method choices to yield perfectcorrelation in measurement errors under the same accounting standards. I do not intend to imply thatdescriptively no di¤erence in accounting method choices is associated with using the same standards. Myempirical tests (1) capture the extent to which the same accounting standards narrows down the set ofavailable accounting method choices and (2) employ cross-sectional analyses and di¤erence-in-di¤erencesdesign to partially account for the heterogeneity in method choices.
4Bae, Tan and Welker (2008) constructs a summary score of how local GAAP di¤er from IFRS on 21accounting dimensions. Greek GAAP di¤ers from IFRS on 17 dimensions while U.S. GAAP di¤ers fromIFRS on four dimensions only. Greek GAAP, for example, does not require a cash �ow statement, segmentreporting, or disclosure of the fair value of �nancial assets and liabilities.
5See Ball, Kothari and Robin, 2000; Ball, Robin and Wu, 2003; Leuz, Nanda and Wysocki, 2003;Burgstahler, Hail and Leuz, 2006.
3
di¢ cult to isolate the comparability e¤ect.
My empirical strategy pursues two distinct sets of tests to address these issues. First,
I perform a pooled sample levels analysis based on the traditional information transfer
research design.6 I examine market reactions for a sample of 575 earnings announcements
from global industry leaders for the period from 2001 to 2008. The main result is that
both abnormal price and volume reactions to earnings announcement are signi�cantly
higher for non-announcing �rms using the same standards in comparison to non-announcing
�rms using di¤erent standards. Further results from cross-sectional analyses highlight
the importance of legal enforcement and reporting incentives for achieving the desired
transnational comparability. In line with the notion that some �rms may simply adopt
IFRS as a label (Daske, Hail, Leuz and Verdi, 2009), the greater information transfer e¤ect
from using the same accounting standards is signi�cant only for announcing �rms domiciled
in countries with stricter enforcement regimes and stronger reporting incentives.
My second set of analyses exploits a unique institutional feature of country-level
mandatory IFRS adoption to isolate the comparability e¤ects from the reporting quality
e¤ects of accounting standards. Firms have voluntarily adopted IFRS as early as the 1990s for
reasons such as cross-listing. In theory, for this group of voluntary IFRS adopters (hereafter
voluntary adopters), the subsequent country-level mandatory IFRS adoption should not alter
the quality of their earnings signals. Holding the quality of the earnings signals constant, I
identify the comparability e¤ect by evaluating the time-series changes in market reactions for
a group of treatment �rms (i.e., mandatory IFRS adopters, hereafter mandatory adopters)
against a group of benchmark �rms (i.e., non-IFRS adopters, hereafter non-adopters). The
intuition is that while both groups observe the same earnings signal, only the treatment group
incurs a comparability bene�t by moving to the same accountings standards. Consequently,
6Examples include information transfer associated with earnings announcements (Firth, 1976; Foster,1981; Clinch and Sinclair, 1987; Freeman and Tse, 1992; Han and Wild, 1990; Ramnath, 2002; Thomas andZhang, 2008) and management forecasts of earnings (Baginski, 1987; Han, Wild and Ramesh, 1989; Pyo andLustgarten, 1990; Kim, Lacina and Park, 2008).
4
I perform a di¤erence-in-di¤erences analysis that compares the information transfer e¤ects
before and after the country-level mandatory IFRS adoption for a sample of 834 earnings
announcements from voluntary adopters. The main results, supported by both univariate
and multivariate analyses, show that non-announcing �rms that are mandatory adopters
experience signi�cant increases in market reactions to voluntary adopters�earnings signals
post-mandatory adoption. Non-adopters, meanwhile, do not experience these increases in
market reactions over the same period.
This study contributes to several strands of literature. First, it provides evidence on
the importance of comparability in general. Results from this study lend support to the
prediction that non-announcing �rm�s price and volume reactions to announcing �rm�s
information signal increase with the correlation across measurement errors of the signals.
There is limited evidence on the bene�ts of comparability in an equity valuation context
to date. This study de�nes comparability statistically and shows that better comparability
across information signals allows investors to better harness the additional signal in forming
price expectations.
This study also contributes to the stream of research that investigates the economic
bene�ts of mandatory IFRS adoption and is relevant to the ongoing policy deliberation
regarding the convergence of U.S. GAAP and IFRS. Speci�cally, my empirical test is a
joint test of two hypotheses: that accounting standards harmonization increases �nancial
statement comparability and that comparability plays an important role in equity valuation.
The IASB cites �higher quality, transparency and comparability�as primary objectives and
bene�ts of IFRS. While any reduction in the magnitude of measurement error represents a
reporting quality bene�t, the increase in correlation across measurement errors represents a
comparability bene�t. My research design aims to hold the reporting quality constant, thus
presenting clean evidence for the comparability bene�ts from harmonization of accounting
standards.
Finally, this study presents direct evidence on information transfer in a cross-country
5
setting. The scope of prior research has been limited almost exclusively to information
transfer between domestic �rms.7 However, as the global economy and capital markets
become more integrated, information released by �rms in one country becomes more relevant
for �rms domiciled in other countries. The magnitude of transnational information transfer is
expected to be a function of various institutional factors (Firth, 1996). This paper identi�es
and investigates in detail one of the institutional factors, namely accounting standards.
The subsequent section reviews extant literature and develops my hypotheses. Section
3 describes the sample and data. Section 4 delineates my research design for the levels
analyses and presents results for whether using the same accounting standards increases the
transnational information transfer e¤ects. Section 5 examines the same question using a
di¤erence-in-di¤erences approach. Section 6 tests the robustness of the results, and Section
7 concludes.
2 Background and Hypothesis Development
2.1 Financial Statement Comparability
While comparability is often advocated, direct examination of the comparability e¤ect
is nascent. De Franco et al. (2010) develop an output-based measure of comparability
based on the earnings and stock returns relation, capturing the similarity with which the
accounting systems of two �rms translate a given �rm�s economic shock. Their study �nds
that higher comparability lowers the cost of acquiring information and improves the overall
information environment for U.S. �rms. Bradshaw et al. (2009) measure comparability using
commonality of accounting choices, and �nd that the use of atypical accounting methods is
associated with larger analyst forecast errors and forecast dispersion. These two studies test
the e¤ect of comparability within a single set of accounting standards.
7Two exceptions are Firth (1996) and Alves, Pope and Young (2007). Firth (1996) shows the existence ofinformation transfers associated with earnings releases in a two-country context (U.S. and U.K.). Alves etal. (2007) �nd evidence for transnational information transfer associated with pro�t warnings for a sampleof European �rms.
6
Using mandatory IFRS adoption, several papers investigate the comparability e¤ect of
accounting standards harmonization and �nd mixed evidence. Beuselinck, Joos and Van
der Meulen (2008) present early evidence that mandatory IFRS adoption does not instantly
deliver improvement in earnings comparability across Europe in terms of the accruals �
cash �ow association. Most recently, Lang et al. (2010) use the De Franco et al. (2010)
measure and conclude that accounting comparability does not increase for IFRS adopters
relative to a benchmark group of non-adopters. They also �nd negative e¤ects on the �rms�
information environments, which suggests accounting standards harmonization does not
improve an analysts�ability to learn from inter-�rm comparisons. On the other hand, DeFond
et al. (2009) create two input-based measures (i.e., the reduction in the heterogeneity of
accounting standards in an industry and the increase in peer �rms using the same accounting
standards) and evaluate the comparability e¤ects from foreign investors�perspective. They
�nd that post-mandatory IFRS adoption, foreign mutual fund ownership increases for �rms
that experience large increases in comparability with other �rms in the same industry. Wu
and Zhang (2010) infer changes in �nancial reporting comparability through changes in the
use of relative performance evaluation (RPE). They �nd a post-adoption increase in the use
of RPE based on foreign peers�accounting information, consistent with mandatory IFRS
adoption enhances comparability for �rms in continental Europe.
Other studies indirectly shed light on the comparability e¤ect of accounting standards.
Daske, Hail, Leuz and Verdi (2008) �nd that mandatory IFRS adoption results in
increased capital market liquidity, but only in countries with strict enforcement regimes
and institutional environments that provide strong reporting incentives. While Daske et al.
(2008) conjecture that one reason for the increased liquidity is improved comparability, their
analysis �nds an insigni�cant e¤ect. Armstrong, Barth, Jagolinzer and Riedl (2010) �nd that
stock prices of EU �rms reacted positively to news during 2002 that IFRS would become
mandatory in 2005. In particular, their study �nds positive market reaction for �rms with
higher quality information pre-mandatory adoption, consistent with bene�ts arising from
7
comparability in addition to quality. Yu (2010) tests whether mandatory IFRS adoption
reduces home bias by examining the change in international mutual fund ownership. Her
study �nds that mutual fund ownership increases after mandatory adoption, and that the
increase is larger in countries where the distance between the mutual funds�home GAAP
and the adopting �rm�s home GAAP tends to be larger.
My study di¤ers from these studies in two respects. First, I investigate the e¤ects of
comparability in an equity valuation context and provide a simple theoretical framework
that formalizes the intuition. I de�ne improved comparability by an increase of correlation
between accounting standards measurement errors and show how it links to �rm value in
an information transfer setting. Second, my paper exploits a unique institutional feature
of country-level mandatory IFRS adoption to isolate the comparability e¤ect from the
reporting quality e¤ect of accounting standards. Using a di¤erence-in-di¤erences design
based on mandatory adopters and non-adopters�market reactions to earnings announcement
by voluntary adopters around the IFRS mandate, I attempt to hold the reporting quality
e¤ect constant and provide clean evidence on the comparability e¤ect of accounting standards
harmonization.
2.2 Hypothesis Development
To structure my empirical predictions, I statistically de�ne comparability and present a
simple theoretical characterization to motivate an equity valuation role for comparability in
an information transfer context. I adapt a two-�rm, sequential information release framework
from Holthausen and Verrecchia (1988, hereafter HV), and study one �rm�s market reactions
to earnings announcement by another �rm when both report under the same accounting
standards versus di¤erent accounting standards.
Consider a perfectly competitive and risk neutral market with two �rms (i = 1, 2). The
terminal values of both �rms (eVi) are normally distributed with mean �i and variance �2vi,and the terminal values are correlated with correlation coe¢ cient �v, which represents the
underlying economic link between the two �rms. Each �rm issues an earnings report ri,
8
which investors use to derive the price of each �rm. Reported earnings can be thought of as
the outcome of fundamental economic events coupled with the accounting for those events
(Dechow, Ge and Schrand, 2010; Fischer and Verrecchia, 2000). Thus, each earnings report
is garbled by an accounting standards measurement error denoted e�i, which is normallydistributed with mean 0 and variance �2�i and is independent of
eVi.8I operationalize comparability by asserting that measurement errors are correlated
across di¤erent accounting standards and interpret this correlation as �nancial statement
comparability. In particular, I denote �� to be the correlation between the measurement
errors across two accounting standards. For example, if the two �rms report under the same
standard, then �� = 1, and Cov [e�1;e�2] = ��1��2 by construction. This interpretation is
consistent with Barth et al. (1999) where the authors operationalize accounting standards
harmonization as identical measurement errors that are perfectly correlated. Under these
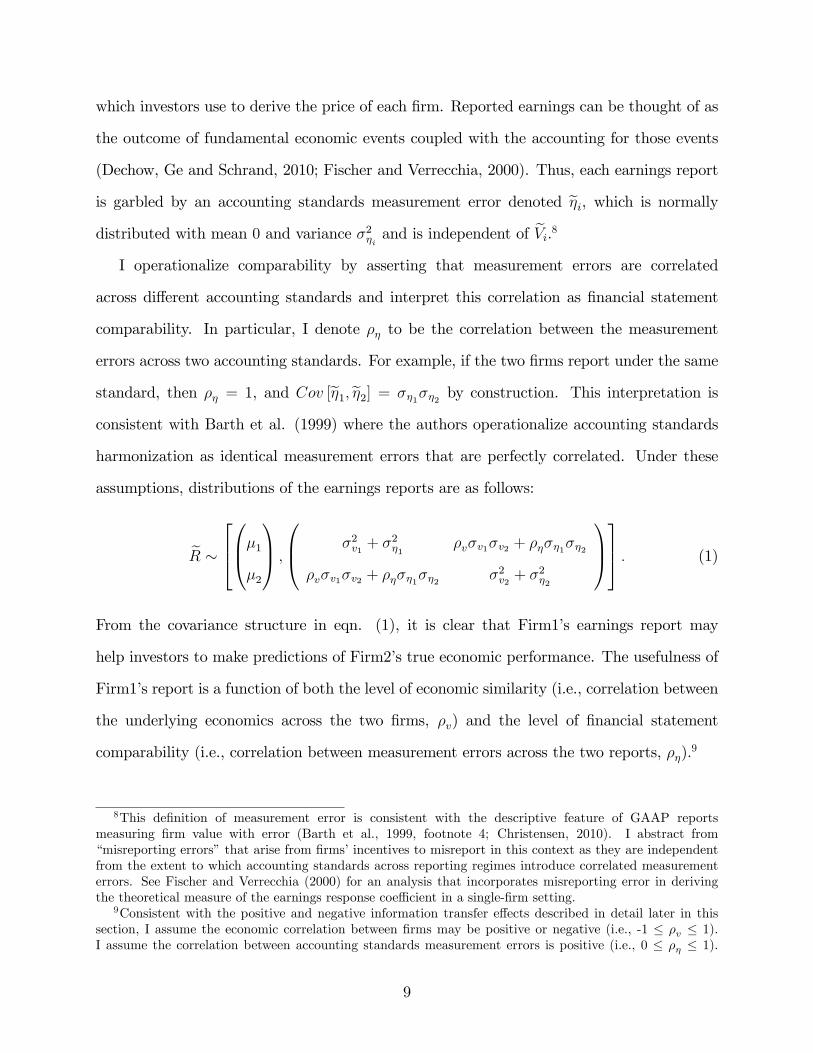
assumptions, distributions of the earnings reports are as follows:
eR �2640B@�1�2
1CA ;0B@ �2v1 + �
2�1
�v�v1�v2 + ����1��2
�v�v1�v2 + ����1��2 �2v2 + �2�2
1CA375 : (1)
From the covariance structure in eqn. (1), it is clear that Firm1�s earnings report may
help investors to make predictions of Firm2�s true economic performance. The usefulness of
Firm1�s report is a function of both the level of economic similarity (i.e., correlation between
the underlying economics across the two �rms, �v) and the level of �nancial statement
comparability (i.e., correlation between measurement errors across the two reports, ��).9
8This de�nition of measurement error is consistent with the descriptive feature of GAAP reportsmeasuring �rm value with error (Barth et al., 1999, footnote 4; Christensen, 2010). I abstract from�misreporting errors�that arise from �rms�incentives to misreport in this context as they are independentfrom the extent to which accounting standards across reporting regimes introduce correlated measurementerrors. See Fischer and Verrecchia (2000) for an analysis that incorporates misreporting error in derivingthe theoretical measure of the earnings response coe¢ cient in a single-�rm setting.
9Consistent with the positive and negative information transfer e¤ects described in detail later in thissection, I assume the economic correlation between �rms may be positive or negative (i.e., -1 � �v � 1).I assume the correlation between accounting standards measurement errors is positive (i.e., 0 � �� � 1).
9

Given the sequential reporting structure, without loss of generality, I assume Firm1
releases its earnings report at t = 1 before Firm2 releases its earnings report at t = 2.10
Figure 1, Panel A depicts the timeline of events. Figure 1, Panel B summarizes the price
function of Firm2 at each time period in the original HV model. In a rational expectations
framework, the price of Firm2 at Firm1�s earnings report date t = 1 is:
P t=12 = E[ ~V2j~r1 = r1] = �2 +�v�v1�v2�2v1 + �
2�1
(r1 � �1) : (2)
Eqn. (2) suggests that �nancial statement comparability, ��, plays no role in Firm2�s equity
valuation when Firm1 releases its earnings report at t = 1. The coe¢ cient on Firm1�s report
is a function of the underlying economic similarity, �v, and other variance terms. The absence
of �� is because the covariance between Firm2�s terminal value ~V2 and Firm1�s report ~r1 does
not depend on the correlation of measurement errors between the two �rms�reports.11 This
result is at odds with real world institutional settings, where information transfer e¤ect
occurs at t = 1 and �nancial reporting comparability plays a role. Consequently, I adapt the
framework in order to yield the possibility that measurement error correlation matters at t =
1. I obtain this result by introducing two additional assumptions to the HV model outlined
in Figure 1, Panel C. In short, the results relax the assumption of investors being perfectly
rational and allow for short-lived investors. While there are other potential approaches that
can deliver the same result, I believe my approach the most parsimonious.12
First, I assume that at period t = 2 when Firm2 releases its own report, investors price
Finally, I assume measurement error correlation is only relevant when there is an economic correlation, thatis: if �v = 0, then �� = 0 by construction.10I de�ne Firm1 as the announcing �rm and Firm2 as the non-announcing �rm and refer to these de�nitions
interchangeably for ease of exposition.11Figure 1, Panel B shows that �nancial statement comparability plays a role in Firm2�s equity valuation
when Firm2 releases its earnings report at t = 2. However, conducting empirical tests for the importance ofFirm1�s report at t = 2 su¤ers from weak power since the equity valuation e¤ects are likely to be dominatedby the information content of Firm2�s own report.12See Appendix A for an alternative explanation for why correlation may matter.
10
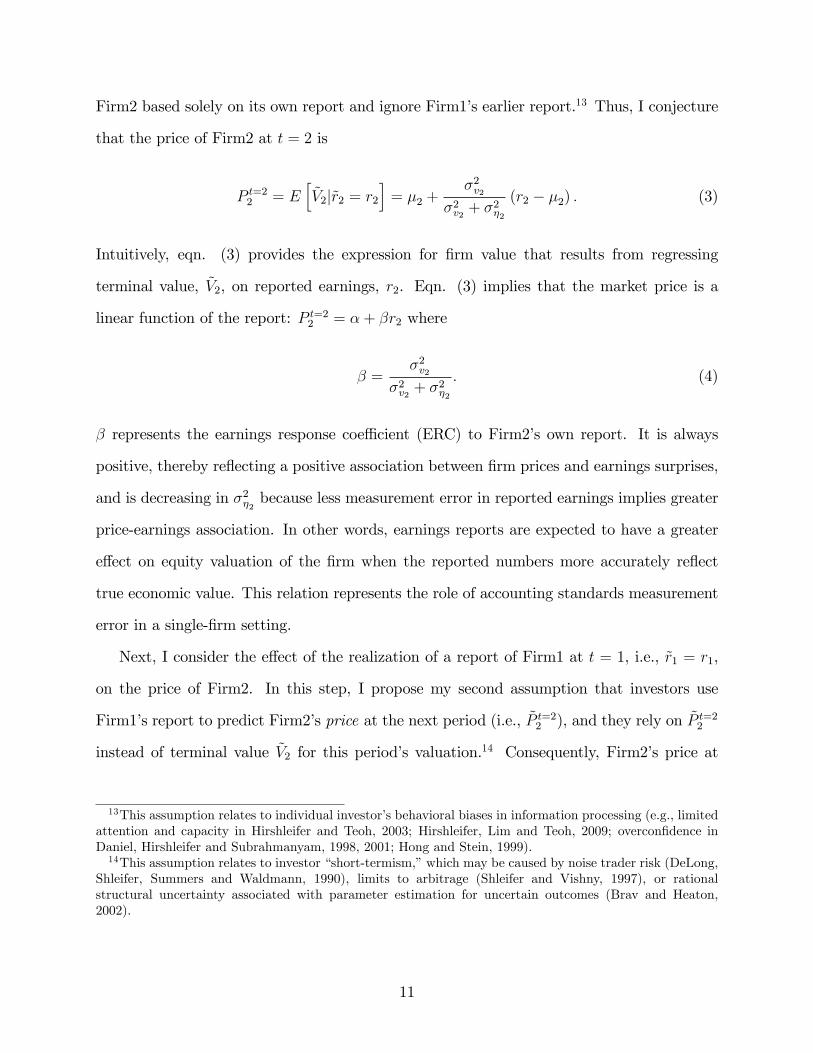
Firm2 based solely on its own report and ignore Firm1�s earlier report.13 Thus, I conjecture
that the price of Firm2 at t = 2 is
P t=22 = Eh~V2j~r2 = r2
i= �2 +
�2v2�2v2 + �
2�2
(r2 � �2) : (3)
Intuitively, eqn. (3) provides the expression for �rm value that results from regressing
terminal value, ~V2, on reported earnings, r2. Eqn. (3) implies that the market price is a
linear function of the report: P t=22 = �+ �r2 where
� =�2v2
�2v2 + �2�2
: (4)
� represents the earnings response coe¢ cient (ERC) to Firm2�s own report. It is always
positive, thereby re�ecting a positive association between �rm prices and earnings surprises,
and is decreasing in �2�2 because less measurement error in reported earnings implies greater
price-earnings association. In other words, earnings reports are expected to have a greater
e¤ect on equity valuation of the �rm when the reported numbers more accurately re�ect
true economic value. This relation represents the role of accounting standards measurement
error in a single-�rm setting.
Next, I consider the e¤ect of the realization of a report of Firm1 at t = 1, i.e., ~r1 = r1,
on the price of Firm2. In this step, I propose my second assumption that investors use
Firm1�s report to predict Firm2�s price at the next period (i.e., ~P t=22 ), and they rely on ~P t=22
instead of terminal value ~V2 for this period�s valuation.14 Consequently, Firm2�s price at
13This assumption relates to individual investor�s behavioral biases in information processing (e.g., limitedattention and capacity in Hirshleifer and Teoh, 2003; Hirshleifer, Lim and Teoh, 2009; overcon�dence inDaniel, Hirshleifer and Subrahmanyam, 1998, 2001; Hong and Stein, 1999).14This assumption relates to investor �short-termism,�which may be caused by noise trader risk (DeLong,
Shleifer, Summers and Waldmann, 1990), limits to arbitrage (Shleifer and Vishny, 1997), or rationalstructural uncertainty associated with parameter estimation for uncertain outcomes (Brav and Heaton,2002).
11
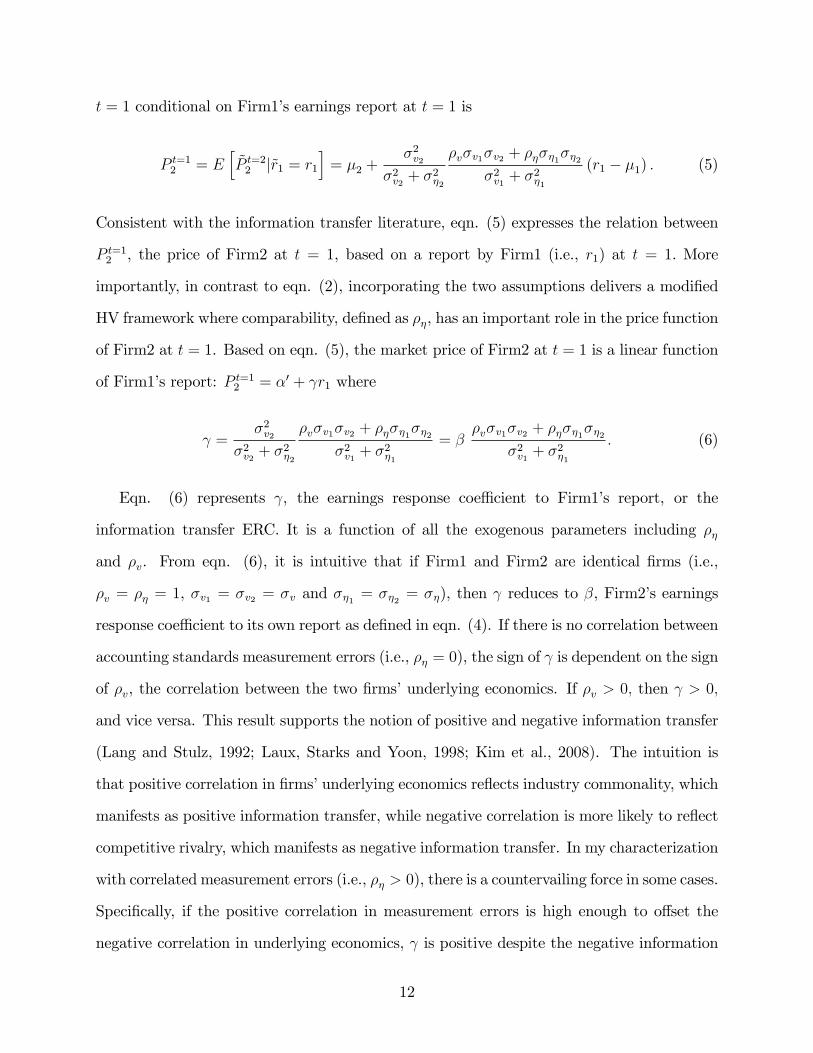
t = 1 conditional on Firm1�s earnings report at t = 1 is
P t=12 = Eh~P t=22 j~r1 = r1
i= �2 +
�2v2�2v2 + �
2�2
�v�v1�v2 + ����1��2�2v1 + �
2�1
(r1 � �1) : (5)
Consistent with the information transfer literature, eqn. (5) expresses the relation between
P t=12 , the price of Firm2 at t = 1, based on a report by Firm1 (i.e., r1) at t = 1. More
importantly, in contrast to eqn. (2), incorporating the two assumptions delivers a modi�ed
HV framework where comparability, de�ned as ��, has an important role in the price function
of Firm2 at t = 1. Based on eqn. (5), the market price of Firm2 at t = 1 is a linear function
of Firm1�s report: P t=12 = �0 + r1 where
=�2v2
�2v2 + �2�2
�v�v1�v2 + ����1��2�2v1 + �
2�1
= ��v�v1�v2 + ����1��2
�2v1 + �2�1
: (6)
Eqn. (6) represents , the earnings response coe¢ cient to Firm1�s report, or the
information transfer ERC. It is a function of all the exogenous parameters including ��
and �v. From eqn. (6), it is intuitive that if Firm1 and Firm2 are identical �rms (i.e.,
�v = �� = 1, �v1 = �v2 = �v and ��1 = ��2 = ��), then reduces to �, Firm2�s earnings
response coe¢ cient to its own report as de�ned in eqn. (4). If there is no correlation between
accounting standards measurement errors (i.e., �� = 0), the sign of is dependent on the sign
of �v, the correlation between the two �rms�underlying economics. If �v > 0; then > 0;
and vice versa. This result supports the notion of positive and negative information transfer
(Lang and Stulz, 1992; Laux, Starks and Yoon, 1998; Kim et al., 2008). The intuition is
that positive correlation in �rms�underlying economics re�ects industry commonality, which
manifests as positive information transfer, while negative correlation is more likely to re�ect
competitive rivalry, which manifests as negative information transfer. In my characterization
with correlated measurement errors (i.e., �� > 0), there is a countervailing force in some cases.
Speci�cally, if the positive correlation in measurement errors is high enough to o¤set the
negative correlation in underlying economics, is positive despite the negative information
12

transfer from the underlying competitive shift. Consequently, the sign of , the information
transfer ERC, is dependent on the interplay between the two correlation terms and the other
parameters chosen.
At the start of the period t = 0 with no consideration for any information signal, the
price of Firm2 is Eh~V2
i= �2. Thus, the stock price response of Firm2 to Firm1�s earnings
announcement is measured by
�2 = P t=12 � �2 (7)
=�2v2
�2v2 + �2�2
�v�v1�v2 + ����1��2�2v1 + �
2�1
(r1 � �1)
= (r1 � �1) ;
which is a linear function of Firm1�s earnings surprise.
My primary interest is in the relation between ��, the correlation between accounting
standards measurement errors, and , the information transfer ERC. Di¤erentiate with
respect to ��:@
@��=
�2v2��1��2��2v2 + �
2�2
���2v1 + �
2�1
� > 0: (8)
Consistent with intuition, higher correlation leads to an increase in the earnings association of
Firm1�s report for Firm2�s pricing since more can be learned from Firm1�s measurement error
about Firm2�s measurement error. Thus, the price response to earnings surprise is higher
for �rms reporting under the same accounting standards rather than di¤erent accounting
standards. This insight leads to the following hypothesis in alternative form and provides
the basis for my empirical tests with respect to price change.
H1: The magnitude of the price reaction to transnational earnings information transfers
is greater for �rm-pairs using the same accounting standards than for those using di¤erent
accounting standards.
Next, I characterize Firm2�s trading volume reaction to Firm1�s earnings report in the
same framework. While price change re�ects the change in expectations of the market as
13
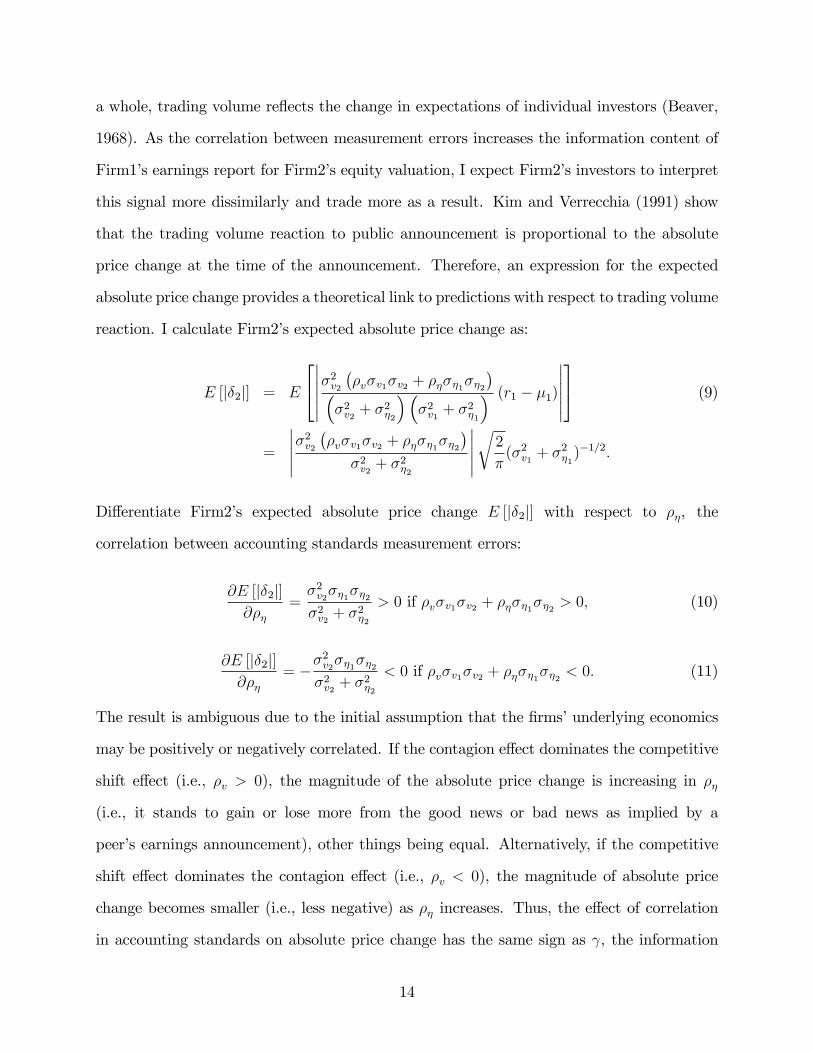
a whole, trading volume re�ects the change in expectations of individual investors (Beaver,
1968). As the correlation between measurement errors increases the information content of
Firm1�s earnings report for Firm2�s equity valuation, I expect Firm2�s investors to interpret
this signal more dissimilarly and trade more as a result. Kim and Verrecchia (1991) show
that the trading volume reaction to public announcement is proportional to the absolute
price change at the time of the announcement. Therefore, an expression for the expected
absolute price change provides a theoretical link to predictions with respect to trading volume
reaction. I calculate Firm2�s expected absolute price change as:
E [j�2j] = E
24�������2v2
��v�v1�v2 + ����1��2
���2v2 + �
2�2
���2v1 + �
2�1
� (r1 � �1)������35 (9)
=
������2v2��v�v1�v2 + ����1��2
��2v2 + �
2�2
�����r2
�(�2v1 + �
2�1)�1=2:
Di¤erentiate Firm2�s expected absolute price change E [j�2j] with respect to ��, the
correlation between accounting standards measurement errors:
@E [j�2j]@��
=�2v2��1��2�2v2 + �
2�2
> 0 if �v�v1�v2 + ����1��2 > 0; (10)
@E [j�2j]@��
= ��2v2��1��2�2v2 + �
2�2
< 0 if �v�v1�v2 + ����1��2 < 0: (11)
The result is ambiguous due to the initial assumption that the �rms�underlying economics
may be positively or negatively correlated. If the contagion e¤ect dominates the competitive
shift e¤ect (i.e., �v > 0), the magnitude of the absolute price change is increasing in ��
(i.e., it stands to gain or lose more from the good news or bad news as implied by a
peer�s earnings announcement), other things being equal. Alternatively, if the competitive
shift e¤ect dominates the contagion e¤ect (i.e., �v < 0), the magnitude of absolute price
change becomes smaller (i.e., less negative) as �� increases. Thus, the e¤ect of correlation
in accounting standards on absolute price change has the same sign as , the information
14
transfer ERC.
While the above calculations show ambiguous results, in real world institutional settings,
I expect �rms�earnings reports to be positively correlated on average (i.e., �v > 0). Existing
empirical evidence lends support to this parameter assumption. Extant literature suggests
that earnings announcements convey more industry-relevant information (contagion) than
market power information (competitive). Consequently, for my empirical tests, I assume
the e¤ect of correlation between accounting standards on absolute value price change to be
positive on average, which leads to the following hypothesis in alternative form.
H2: The magnitude of the volume reaction to transnational earnings information transfers
is greater for �rm-pairs using the same accounting standards than for those using di¤erent
accounting standards.
2.3 Cross-sectional Predictions
The two primary hypotheses are based on the maintained assumption that accounting
standards harmonization can e¤ectively increase the correlation across the accounting
standards measurement errors (i.e., increase �v). However, there are reasons why this
assumption may not be true. First, there are uncertainties regarding non-compliance and
proper enforcement. Based on a study of early users of IFRS, Street and Gray (2001) �nd
that �rms are not compliant in meeting even the easily observable disclosure requirements.
In addition, Burgstahler et al. (2006) conclude that lax enforcement can result in limited
compliance with the standards. Second and more importantly, a stream of literature
highlights the importance of �rms�reporting incentives, rather than accounting standards,
as key drivers of observed properties of accounting outputs (e.g., Ball et al., 2000; Ball et
al., 2003). Even with perfect enforcement, observed �rm reporting behavior is expected
to di¤er across �rms as long as accounting standards o¤er some discretion and �rms have
di¤erent reporting incentives. Finally, Ze¤ (2007) discusses how cultural issues interfere
with promoting worldwide �nancial statement comparability. Di¤erences in business and
�nancial culture, such as executive compensation package, organizational structure, and
15
degree of capital market development, impact �nancial statements preparation.
These arguments predict that countries� institutional structures, the economic
environment, and preparers�incentives play an important role in �nancial reporting. All else
being equal, �rms in countries with stricter enforcement regimes and institutional structures
that provide strong reporting incentives are less likely to adopt accounting standards without
changing reporting practices. As a result, reported earnings from these �rms are more
likely to provide information to other �rms through the increase in correlation between
measurement errors. This discussion leads to the following cross-sectional hypothesis in
alternative form.
H3: Post accounting standards harmonization, increases in transnational information
transfer e¤ects are greater for announcing �rms domiciled in countries with relatively stricter
enforcements and stronger reporting incentives.
Next, I examine whether the economic bene�ts of comparability vary based on
characteristics of the �rm-pair. First, as shown in eqn. (6), the magnitude of information
transfer e¤ects is positively associated with �v, the correlation coe¢ cient between the two
�rms�underlying economics. Within the global sample, I argue that �rms domiciled in the
EU countries have stronger economic ties and are more likely to face common economic
shocks due to greater political and economic integration in the region. Second, Tan, Wang
andWelker (2009) �nd that mandatory IFRS adoption attracts foreign analysts and improves
forecast accuracy. Given that overlap in information environment facilitates the transmission
and processing of the additional information signal, I expect the increase in analyst overlap
to improve information �ow and enhance investors�equity valuation. Therefore, my �nal
hypothesis in alternative form is as follows:
H4: Post accounting standards harmonization, increases in transnational information
transfer e¤ects are greater for �rm-pairs with stronger economic ties and overlap in analyst
coverage.
16

3 Sample and Data
As transnational information transfer is likely more di¢ cult to detect than domestic
information transfer (Firth, 1996), sample selection is an important consideration. A priori,
information transfer e¤ects are likely to exist only for an identi�able subset of �rms, rather
than for the population of all �rms (Foster, 1981). Consequently, I employ sampling
procedures that aims to maximize the power of detecting transnational information transfer.
I construct two separate samples for the levels analyses and changes analyses from a
�rm-year panel dataset. I collect the panel dataset at the intersection of Worldscope (for
�nancial data), Datastream (for price and volume data) and I/B/E/S (for analyst forecast
data) for all non-U.S. �rms.15 The sample covers �rms with �scal years ending on or after
January 1, 2001, through December 31, 2008. I divide �rms into the Fama French 30
industry groups and exclude regulated industries (i.e., #29 �nancials and #20 utilities) as
well as industries with less than 100 �rms (i.e., #3 tobacco products, #18 coal and #30
everything else).
For the levels analysis sample, I �rst identify the announcing �rms (i.e., Firm1) in each
industry year as the three largest �rms according to market value at the end of calendar
year. I use the size-based criteria since larger �rms�earnings surprises have greater potential
for conveying information on other �rms in the industry than do smaller �rms as they are
more likely to be related to information pertaining to the overall economy or industry sector
than to �rm-speci�c information (Atiase, 1985; Bamber, 1987; Freeman, 1987). Moreover,
larger �rms typically represent industry leaders, commanding higher visibility that increases
the e¤ectiveness of the information signal (Merton, 1987; Lehavy and Sloan, 2008).
I then identify the non-announcing �rms (i.e., Firm2) as the sample of �rms other than
the announcing �rms in the same industry year, but domiciled in a di¤erent country. I impose
additional requirements to maximize the power of the test. First, I require Firm2 to have
15International �rms that cross-list in the U.S. are included in the sample.
17

non-zero foreign sales for the year. Conceptually, two �rms in di¤erent countries but sharing
the same industry classi�cation need not be closely related (i.e., �v = 0) if the industry
concerned is primarily a localized business. In this scenario, earnings of one �rm may convey
little information about the pro�tability of another foreign �rm with the same SIC code. The
requirement on foreign sales attempts to ensure that the chosen Firm2 is a global businesses
competing in the same international product market, so that the pro�tability of Firm1
domiciled in another country is potentially related. Second, Firm2�s own earnings release is
not within two trading days after Firm1�s earnings release. If Firm2�s own announcement is
this close after Firm1�s announcement, then Firm2�s own announcement will contaminate the
results since a �rm�s own earnings announcement is arguably the most signi�cant information
release in a �rm�s information environment. Given the two �rms may have di¤erent �scal
year-end dates, the third requirement is that Firm1 and Firm2 have at least 182 days of
overlap in the �scal year.
Following this procedure, the levels analyses sample consists of 575 earnings
announcements by global industry leaders across eight �scal years, which results in 26,349
�rm-pair-year observations. Table 1, Panel A reports the breakdown by countries for
the number of announcement, unique announcing �rms and observations. The 575
announcements from 136 industry leaders are concentrated in Japan (22.3%) and the U.K.
(19.7%). Table 1, Panel B provides similar information for the non-announcing �rms. There
are 4,467 unique �rms from 46 countries with the largest concentration in the U.K. (17.3%)
and Canada (7.3%). Table 1, Panel C reports the sample composition by year and industry.
I construct the changes analyses sample using the same panel dataset with modi�ed
selection criteria for the announcing and non-announcing �rms. For the group of announcing
�rms, I begin with the entire group of voluntary adopters and impose a size requirement
of US$1 billion in market value. The intuition for the size screen is to ensure that
the announcing �rm has enough visibility in the industry and is followed by investors
and analysts. The selection procedures for the non-announcing �rms are identical to the
18

procedure for the levels analyses sample except voluntary adopters are excluded. In other
words, the non-announcing �rms are either mandatory adopter or non-adopters. To eliminate
the impact of sample composition in the changes analyses, I require each �rm-pair to have
at least one observation both before and after mandatory IFRS adoption.
The changes analyses sample consists of 834 earnings announcements by voluntary
adopters, which results in 20,997 �rm-pair-year observations.16 Table 1, Panel A reports
the breakdown by countries for the number of announcements, unique announcing �rms
and observations. The 834 announcements from 145 voluntary adopters are concentrated in
Germany (23.1%) and Switzerland (17.1%). Table 1, Panel B provides similar information
for the non-announcing �rms. There are 1,510 unique �rms covering 43 countries with the
largest concentration in the U.K. (15.7%) and France (10.7%). Table 1, Panel C reports the
sample composition by year, industry and the breakdown between treatment and benchmark
groups. 58.7% of the non-announcing �rms are mandatory adopters (i.e., treatment group)
and the remaining are non-adopters (i.e., benchmark group).
4 Levels Analyses for Global Sample
4.1 Research Design
My �rst set of empirical tests follows a traditional information transfer research design.
I model the market reaction of the non-announcing �rm (i.e., Firm2) by the following two
regression equations estimated at the �rm-pair-year level:
MktRea2t = �0 + �1Same12t + 1UE1t + 2Same12t � UE1t +P�kCtrlsk + "2t (12)
MktRea2t = �0+�1Comp_High12t+ 1UE1t+ 2Comp_High12t �UE1t+P�kCtrlsk+"2t
(13)
where MktRea2t stands for Firm2�s abnormal returns and abnormal volume reaction.
16As a result of the di¤erent sampling procedures, the two samples are fairly independent; there is onlyan approximately 10% overlap in terms of �rm-pair-year observations.
19
Firm2�s cumulative abnormal returns (CAR2t) are estimated using a two factor market
model for the (-1, +1) event window around Firm1�s earnings announcement day. The market
model parameters are estimated over the period from 21 to 220 days before the announcement
using returns from a value-weighted local market portfolio and a value-weighted world
portfolio. The world market factor in addition to the standard market model aims to
account for the heterogeneity in capital markets integration. The (-1, +1) event window
is de�ned to accommodate the di¤erences across international time zones, which may cause
Firm1�s announcement to reach Firm2 earlier or later in calendar time than the day of
the announcement. Firm2�s abnormal trading volume (AVOL2t) is the natural logarithm of
average daily turnover during the event window, and scaled by the median daily turnover
during the estimation period. Daily turnover is de�ned as shares of Firm2 traded during
day t divided by total shares outstanding of Firm2 during day t.
I operationalize my de�nition of �nancial statement comparability, the correlation across
accounting standards measurement errors (i.e., ��), using two proxies. First, I use an
indicator variable (SAME) equal to one when Firm1 and Firm2 use the same accounting
standards and zero otherwise. While this measure has theoretical appeal in that it re�ects
�� = 1 when �rms use the same accounting standards, the measure is overly strict in cases
when �rms use di¤erent accounting standards by always assigning �� = 0. In other words,
it does not allow for variations in the degree of di¤erences across standards. To address this
concern, I devise a second proxy based on the GAAP distance measure developed by Bae et
al. (2008) and modi�ed by Yu (2010). The Bae et al. (2008) measure is a summary score of
how local GAAP di¤ers from IFRS on 21 accounting dimensions. Bae et al. (2008) consider
two accounting standards as similar when both rules comply with IFRS or when both rules
follow local GAAP that are non-compliant with IFRS. It is unclear, however, that a pair of
non-compliant local GAAP should be considered more similar to each other than a pair of
local GAAP where only one complies with IFRS. I thus adopt the modi�cation proposed by
Yu (2010). Yu (2010) considers two non-compliant local GAAP to be similar only if the two
20
countries are from the same legal origin. The result is a measure of accounting standards
correlation across all country-pairs with a scale from 0 to 21. I use an indicator variable
COMP_HIGH equal to one if the accounting standards correlation measure is above the
sample median and zero otherwise.
The coding of these two accounting standards correlation variables involves two steps.
First, I construct a �rm-year panel with an accounting standards variable. I begin with
information from the �Accounting Standards Followed��eld in Worldscope and follow the
IFRS, U.S. GAAP and local GAAP coding based on Appendix A in Daske et al. (2009).
As the Worldscope classi�cation is prone to error, I augment the data with the hand-coded
classi�cations from Daske et al. (2009). Second, for each �rm-pair-year observation, I
compare the accounting standards variables and construct the SAME and COMP_HIGH
correlation variables. Table 1, Panel C provides the distribution of the accounting standards
correlation variable. In the years prior to 2005, there are very few observations where the
announcing and non-announcing �rms are using the same accounting standards, with the
few observations attributed to voluntary IFRS adoption or cross-listing. After mandatory
adoption by the EU in 2005, the number of observations using the same accounting standards
steadily increases. As a result, observations that use the same standards account for
approximately 20% of the total sample. By construction, observations that use more
correlated accounting standards account for approximately 50% of the total sample.
Departing from early information transfer studies that use announcing �rm�s abnormal
return as a measure of potential information transfer, I follow recent literature and use
unexpected earnings derived from consensus analyst forecasts. The use of this direct measure
is advantageous, reducing the likelihood of inferring information transfer e¤ects when they
might actually be attributable to mis-speci�cation of the returns generating model (Frost,
1985). Moreover, the unexpected earnings measure maps directly into the theoretical
framework (i.e., r1 � �1 in eqn. (7)). I measure unexpected earnings for the announcing
�rm (UE1t) as the di¤erence between the actual earnings per share (EPS) announced and
21
the most recent median analyst EPS forecast before earnings announcement, scaled by the
absolute value of the median EPS forecast.17 When evaluating the volume reaction, I replace
UE1t with the absolute value of UE1t as volume tests are non-directional. 1, the coe¢ cient
on UE1t captures the information transfer ERC (i.e., in eqn. (7)) for �rm-pairs using
di¤erent accounting standards or having lower accounting standards correlation. The sum of
1 and 2 captures the information transfer ERC (i.e., in eqn. (7)) for �rm-pairs using the
same accounting standards or having higher accounting standards correlation. My primary
hypothesis predicts that 2 is positive, which suggests that, all else being equal, �rm-pairs
using the same accounting standards or having higher accounting standards correlation show
greater information transfer e¤ects.
I include several control variables that in�uence the magnitude of transnational
information transfer. I categorize the control variables into four groups. The �rst
group relates to the characteristics of the announcing �rm (i.e., Firm1). It is commonly
acknowledged that the potential for information transfer is generally greater for earnings
announcements that embody new information for the announcer itself (i.e., have greater
information content). More importantly, there is evidence that the information content of
earnings announcement varies across countries (DeFond, Hung and Trezevant, 2007) and that
IFRS adoption increases the information content of earnings announcements (Landsman,
Maydew and Thornock, 2010). Thus, I include CAR_1 , the magnitude of Firm1�s reaction
to its own earnings announcement and predict the coe¢ cient on CAR_1 to be positive. Hayn
(1995) �nds negative earnings are less informative. Thus, I include an indicator variable
LOSS_1 equal to one if the reported EPS is negative, and zero otherwise. I expect the
coe¢ cient on LOSS_1 to be negative. I control for the size of Firm1, SIZE_1 , measured
17Most studies use stock price as the de�ator for unexpected earnings. I do not use stock price, as 1)changes in stock price due to macroeconomic conditions during the period may in�uence the results; and 2)conservative measurement practice in some countries may induce arti�cially low unexpected earnings de�atedby price. For robustness, I run all of the tests using �scal year end stock price as a de�ator; the results arequalitatively the same.
22

as the natural logarithm of the market value of equity at the end of �scal year. I make no
prediction with respect to the sign of the coe¢ cient given there are con�icting arguments
and evidence from prior literature. Han and Wild (2000) �nd information transfer e¤ects
are inversely related to �rm size, for example, while Asthana and Mishra (2001) document
a positive association. I include the reporting lag, ANNLAG_1 , computed as the time
from Firm1�s �scal year end to the earnings announcement reported by I/B/E/S. Based on
�ndings in DeFond et al. (2007), I predict the coe¢ cient on the reporting lag to be negative.
The second group of control variables relates to characteristics of the non-announcing �rm
(i.e., Firm2). I control for the size of Firm2, SIZE_2 , measured as the natural logarithm
of the market value of equity at the end of last calendar year. Prior research documents an
inverse relation between the size of the non-announcing �rm and the price response to an
announcing �rm�s earnings surprise (e.g., Graham and King, 1996; Han and Wild, 2000). I
therefore predict the coe¢ cient on Firm2�s size to be negative. I control for the amount of
information production and dissemination by NUMEST_2 , which is the number of analyst
forecasts for Firm2 and predict a positive coe¢ cient (De Fond et al., 2007). I control for
LEV_2 , the ratio of Firm2�s total debt to total assets, as di¤erences in the level of debt
�nancing across �rms may a¤ect the observed stock price reaction to signi�cant events.
Finally, I capture the di¤erences in growth of Firm2 by including the book-to-market ratio,
BM_2 , computed as the book value of equity divided by the market value of equity.
The third group of control variables is measured at the �rm-pair level. I compute CORR,
the correlation between the daily returns of Firm1 and Firm2 in the prior year to mitigate
the concern that the empirical tests are capturing the co-movement of the returns of �rms
within the same industry (Longin and Solnik, 2001). Second, since Firm1 and Firm2 may
have di¤erent �scal year-end dates, I calculate FYOVLP as the number of overlapping days
in the �scal year. I predict both coe¢ cients for the �rm-pair controls to be positive. The
fourth and last group of control variables includes indicator variables to control for country,
industry, year and month �xed e¤ects.
23
4.2 Empirical Results
Table 2, Panel A reports descriptive statistics for all variables. On average, the
announcing �rms are larger than the non-announcing �rms. Table 2, Panel B shows the
pair-wise correlation between all variables used in the regression. The main variables of
interest, SAME and COMP_HIGH, are not highly correlated with any other variables.
These two proxies for correlation in accounting standards measurement error have a
correlation of 0.48. CAR1 and CAR2 are positively correlated, consistent with the earlier
assumption that information transfer e¤ects are positive on average.
Table 3 presents the regression results from estimations of equations (12) and (13). First,
I estimate two benchmark models as a baseline to con�rm the validity of my sampling
procedure. The domestic benchmark model is based on a separated constructed domestic
sample.18 Results corroborate with extant literature that an information transfer e¤ect
exists: the coe¢ cient of UE 1 (i.e., information transfer ERC) of 0.0059 is positive and
signi�cant (t-stat = 2.75). This coe¢ cient is larger but similar in magnitude to the coe¢ cient
of 0.0050 reported for U.S. domestic �rms� information transfer e¤ects from management
earnings forecasts (Kim et al., 2008). The transnational benchmark model is estimated
based on the global sample. In contrast to the domestic benchmark model, the information
transfer e¤ect is muted on average (i.e., the coe¢ cient for UE 1 is insigni�cant).
The next four columns present the main results. In Model 1, I include the accounting
standards correlation variables: the SAME indicator variable and also an interaction term
SAME*UE 1. The coe¢ cient for UE 1, 1, is insigni�cant, which implies no observable
transnational information transfer e¤ect when �rms report under di¤erent accounting
standards. The coe¢ cient on the interaction, SAME*UE 1, 2, captures the di¤erence in
information transfer between �rms using the same accounting standards and �rms using
18For the same announcing �rms described earlier, I choose a group of non-announcing �rms in the samecountry. The non-announcing �rms are not required to have non-zero foreign sales. All other samplingprocedures remain constant.
24
di¤erent accounting standards and it is positive and signi�cant (t-stat = 1.67). Therefore,
the sum of the two coe¢ cients, 1 + 2, is the coe¢ cient for the information transfer e¤ect
between two �rms reporting under the same standards and it is positive and signi�cant.
Model 2 incorporates the control variables and the inferences remain the same. Signs of
control variables are largely consistent with predictions. In Models 3 and 4, I replace the
SAME indicator variable with the COMP_HIGH indicator variable and the results are
stronger. 2, the coe¢ cient on the interaction COMP_HIGH*UE 1, is positive and signi�cant
(t-stat = 2.30 and t-stat = 2.27) for Model 3 and Model 4, respectively. The evidence is
consistent with H1 that the magnitude of information transfer is signi�cantly greater when
�rms report under the same rather than di¤erent accounting standards.
Table 4 presents regression results from estimations of equations (12) and (13) with
abnormal volume as the dependent variable. The overall inferences are similar to those
of the price reaction tests but the statistical signi�cance is weaker in magnitude. The
two benchmark model analyses present evidence for a domestic information transfer e¤ect
but not a transnational information e¤ect. In Models 1 and 2, 2, the coe¢ cient on the
interaction SAME* jUE 1j, is directionally positive but statistically insigni�cant. In the next
two columns, 2, the coe¢ cient on the interaction COMP_HIGH* jUE 1j, is positive and
signi�cant (t-stat = 2.19 and t-stat = 1.93) for Model 3 and Model 4, respectively. Overall,
the results lend some support toH2 that non-announcing �rms�volume reactions are stronger
when the announcing �rm reports under the same or more correlated standards.
Tables 5 and 6 report the results for the cross-sectional analyses for abnormal price
and volume reactions, respectively. I divide the sample into various two-group partitions
and perform a joint estimation of two separate equations (i.e., one for each group) using
a seemingly unrelated regression (SUR) model.19 In the interest of brevity, I report only
19This is also referred to as a multivariate regression model, which is a special case of the seeminglyunrelated regression model where the data matrices are group speci�c data sets on the same set of variables.See Chapter 10 of Greene (2008) for details of this estimation method.
25
the results from using the COMP_HIGH measure of accounting standards correlation.
Results from using the SAME proxy are largely similar. The �rst two partitioning variables
test H3 based on the announcer�s home country characteristics. The legal enforcement
partition is based on the rule of law variable for the year 2005 from Kaufmann, Kraay and
Mastruzzi (2007) and the reporting incentives partition is based on the aggregate earnings
management score from Leuz et al. (2003).20 Results from the price reaction tests are
consistent with H3 : the positive e¤ect of a greater information transfer from using the same
accounting standard is signi�cant only for announcers domiciled in countries with strict legal
enforcement and strong reporting incentives. The bene�t is muted if the announcer domiciles
in a lax enforcement or weak incentives country. The joint estimation procedure allows me to
conduct statistical tests of the coe¢ cients on the interaction term COMP_HIGH*UE 1. The
di¤erence is both positive and signi�cant (i.e., �2 = 9.45 for the legal enforcement partition
and �2 = 6.73 for the reporting incentives partition). Results from the volume reaction
tests are largely consistent, albeit weaker in magnitude. This evidence is consistent with the
established view that merely adopting the same accounting standards does not necessarily
change the properties of accounting reports.
The next two partitioning variables test H4 based on �rm-pair characteristics. The
economic integration partition is based on whether the announcing �rm and non-announcing
�rm are both EU member states.21 The price reaction test lends some support to the
prediction that the information transfer bene�ts from accounting standards harmonization
are stronger for �rms with closer economic links. The volume reaction test does not provide
evidence consistent with my predictions. The last partition relies on the assumption that
overlap in �rms�information environment facilitates the transmission and processing of the
20While there are overlaps in the two partitioning variables, di¤erences exist for a few important countries.For example, Germany and Switzerland are categorized as strict legal enforcement but weak reportingincentives, while France is categorized as lax legal enforcement but strong reporting incentives.21I include Norway and Switzerland in the EU classi�cation although they are not o¢ cial member states
of the European Union.
26
additional information signal. I partition the sample into two groups based on whether there
is at least one overlapping sell-side analyst. The volume reaction test provides evidence
consistent with the prediction, while the price reaction test is insigni�cant. The weaker
results may be attributed to low test power, as only approximately 10% of the sample has
overlapping sell-side analysts.
5 Changes Analyses around the IFRS Mandate
5.1 Research Design
My second set of tests pursues a di¤erent empirical strategy aiming to isolate the
comparability e¤ects (i.e., �v, correlation between measurement errors) from the reporting
quality e¤ects (i.e., �2�1, magnitude of measurement errors in the information signal) of
accounting standards harmonization embedded in information transfer. Instead of pooling
transnational information transfer e¤ects from various countries over time, I focus on a
group of announcing �rms where the reporting quality e¤ect is expected to be constant in
the speci�c setting. Firms voluntarily adopted IFRS as early as in the 1990s for various
reasons. In theory, the quality of the voluntary adopter�s earnings signal (i.e., �2�1) does not
change around the mandatory adoption period. Holding the quality of the earnings signals
constant, I am able to isolate the comparability e¤ect by evaluating the time-series changes
in market reactions for a group of treatment �rms (i.e., mandatory adopters) against a
group of benchmark �rms (i.e., non-adopters). The intuition for this di¤erence-in-di¤erences
approach is that while both groups observe the same earnings signal; only the treatment
group incurs a comparability bene�t by moving to the same accountings standards.
I divide the �rm-pair observations into four groups: treatment pre, treatment post,
benchmark pre and benchmark post. I perform a joint estimation of four separate equations
(i.e., one for each group) using a seemingly unrelated regression (SUR) model. Each
regression equation takes the form:
MktRea2t = �+ UE1t +P�kCtrlsk + "2t (14)
27
where MktRea stands for the abnormal price and volume reaction of the non-announcing
�rm. UE1t and the vector of Ctrlsk are identically de�ned as in equations (12) and (13).
The di¤erence-in-di¤erences analysis examines both univariate market reactions and ,
the earnings response coe¢ cients. All else being equal, mandatory IFRS adoption will add
comparability bene�ts only to �rms in the treatment group. Therefore, I predict will rise
more for the treatment group following mandatory IFRS adoption than for the of the
benchmark group which continues to use local GAAP. The di¤erence-in-di¤erences analysis
tests the prediction that ( treatmentpost � treatmentpre ) > ( benchmarkpost � benchmarkpre ).
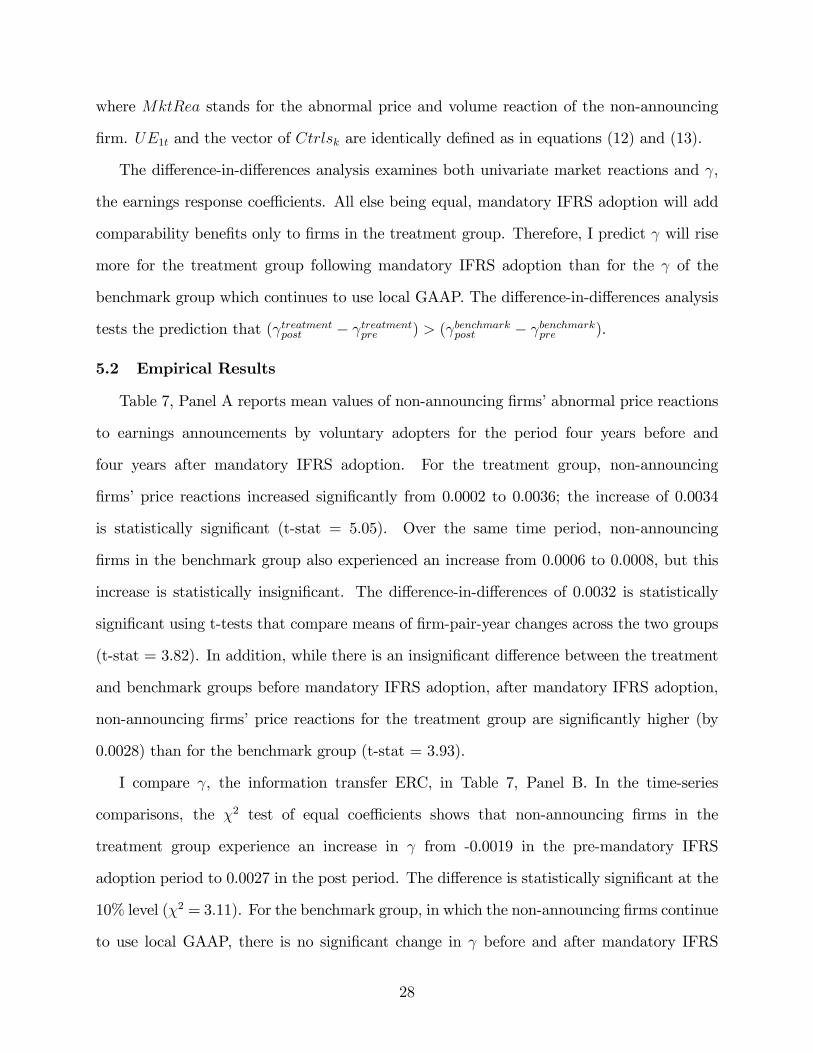
5.2 Empirical Results
Table 7, Panel A reports mean values of non-announcing �rms�abnormal price reactions
to earnings announcements by voluntary adopters for the period four years before and
four years after mandatory IFRS adoption. For the treatment group, non-announcing
�rms�price reactions increased signi�cantly from 0.0002 to 0.0036; the increase of 0.0034
is statistically signi�cant (t-stat = 5.05). Over the same time period, non-announcing
�rms in the benchmark group also experienced an increase from 0.0006 to 0.0008, but this
increase is statistically insigni�cant. The di¤erence-in-di¤erences of 0.0032 is statistically
signi�cant using t-tests that compare means of �rm-pair-year changes across the two groups
(t-stat = 3.82). In addition, while there is an insigni�cant di¤erence between the treatment
and benchmark groups before mandatory IFRS adoption, after mandatory IFRS adoption,
non-announcing �rms�price reactions for the treatment group are signi�cantly higher (by
0.0028) than for the benchmark group (t-stat = 3.93).
I compare , the information transfer ERC, in Table 7, Panel B. In the time-series
comparisons, the �2 test of equal coe¢ cients shows that non-announcing �rms in the
treatment group experience an increase in from -0.0019 in the pre-mandatory IFRS
adoption period to 0.0027 in the post period. The di¤erence is statistically signi�cant at the
10% level (�2 = 3.11). For the benchmark group, in which the non-announcing �rms continue
to use local GAAP, there is no signi�cant change in before and after mandatory IFRS
28
adoption. The di¤erence in the time-series changes between the treatment group and control
group is signi�cant at the 5% level (�2 = 5.59). In the cross-sectional comparison, prior to
mandatory IFRS adoption, there is no di¤erence in the magnitude of information transfer
between the treatment group and the benchmark group. This �nding is consistent with my
expectations since both groups are using local GAAP. After mandatory IFRS adoption, the
treatment group that adopted IFRS exhibits greater information transfer e¤ects than the
benchmark group that continued to use local GAAP. The di¤erence is statistically signi�cant
at the 1% level (�2 = 9.72).
Table 8 presents results for abnormal volume reaction as the dependent variable using
the same research design. The evidence reveals similar trends as in the price reaction
test. Together, the results are consistent with my hypothesis: holding the quality of the
information signal constant, there is a signi�cant increase in information transfer from
voluntary adopters to mandatory adopters post-mandatory IFRS adoption. This e¤ect is
not present non-adopters. The evidence provides strong support that �nancial statement
comparability e¤ects, and not reporting quality e¤ects, drive the greater information
transfers post-mandatory IFRS adoption.
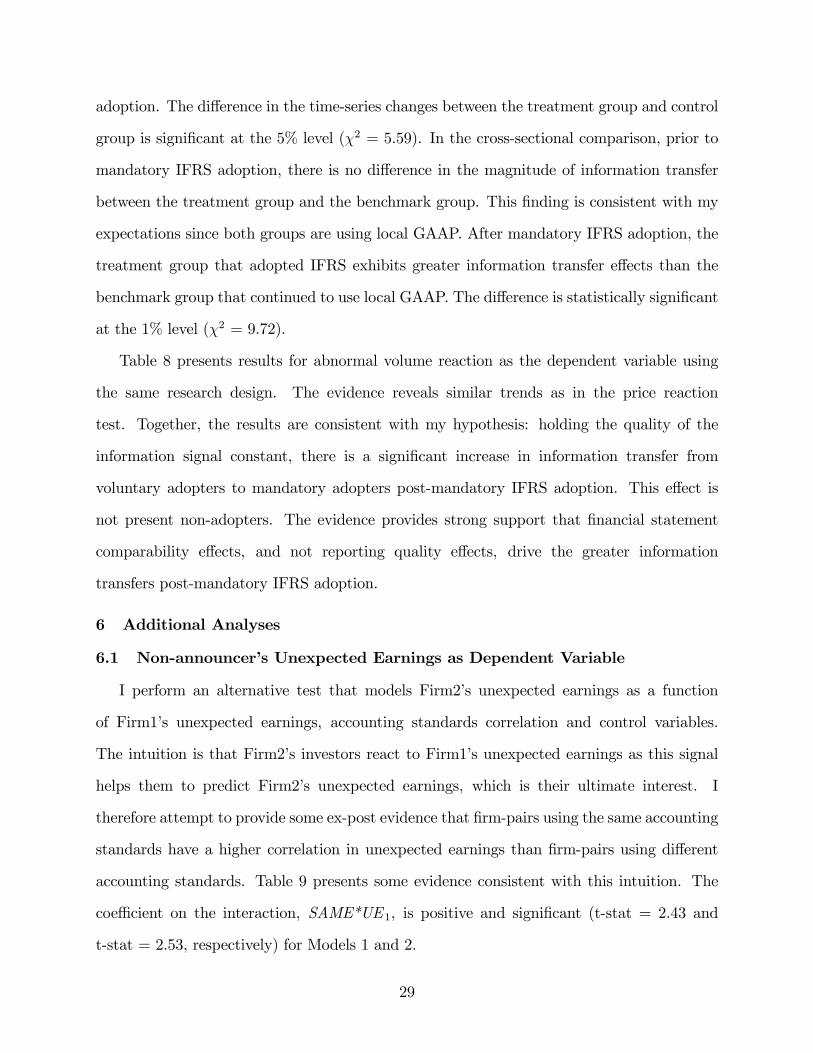
6 Additional Analyses
6.1 Non-announcer�s Unexpected Earnings as Dependent Variable
I perform an alternative test that models Firm2�s unexpected earnings as a function
of Firm1�s unexpected earnings, accounting standards correlation and control variables.
The intuition is that Firm2�s investors react to Firm1�s unexpected earnings as this signal
helps them to predict Firm2�s unexpected earnings, which is their ultimate interest. I
therefore attempt to provide some ex-post evidence that �rm-pairs using the same accounting
standards have a higher correlation in unexpected earnings than �rm-pairs using di¤erent
accounting standards. Table 9 presents some evidence consistent with this intuition. The
coe¢ cient on the interaction, SAME*UE 1, is positive and signi�cant (t-stat = 2.43 and
t-stat = 2.53, respectively) for Models 1 and 2.
29

6.2 E¤ect of First Announcers
Extant literature shows that the timing of announcements can in�uence inferences in
information transfer studies. The information contained in the earnings announcement of
the �rst reporter may be greater than subsequent reporting �rms as it is more di¢ cult to
forecast the earnings for the �rst reporter in any �scal year. Consequently, many studies focus
on the e¤ect of the �rst few announcers. A di¢ culty of this focus, however, is that the �rms
must have the same �scal year-ends. In cross-country studies, imposing this requirement
substantially reduces the sample size, as di¤erent countries have di¤erent and clustered �scal
year-end dates (e.g., March for Japan and June for Australia). Therefore, in my primary
analysis, I do not rely on the e¤ect of the �rst announcer, but rather focus on the industry
leaders de�ned by size.
Nonetheless, to investigate this potential timing e¤ect, I replicate Tables 3 and 4 based on
a di¤erent sampling procedure for the announcing �rms. First, I limit the global sample to
December �scal year-end �rms. I subsequently rank these �rms in each industry by market
value and take the top 10% largest �rms. Within this group, I choose the three earliest
announcing �rms and match with all possible non-announcing �rms. Results based on this
alternative sampling procedure are similar to my current analysis and consistent with the
hypothesis. My results are thus robust to the �rst announcer e¤ect.
6.3 Importance of Economic Link
I repeat the main analyses (Tables 3, 4, 7 and 8) with randomly selected non-announcing
�rms from di¤erent industries. The objective of this placebo test is to show that my
results are not driven by higher price and volume reactions solely due to IFRS adoption.
Untabulated results exhibit no similar patterns in information transfer for the placebo tests,
thus con�rming that the results presented are not mechanical. This evidence also highlights
the importance of the underlying economic link in achieving the desired comparability
bene�ts.
30

7 Conclusion
This study investigates whether harmonization of accounting standards enhances �nancial
statement comparability, de�ned as an increase in the correlation between measurement
errors across two �rms� information signals. I test this question jointly with predictions
from a modi�ed HV model, that this correlation increases a non-announcing �rm�s price and
volume reactions to a foreign �rm�s earnings announcement. By linking comparability to
the information transfer ERC, my study shows that accounting standards harmonization
facilitates transnational information transfer, and suggests comparability as a direct
mechanism.
My inferences are based on empirical results from two cross-border settings. First,
employing a levels analysis for a global sample, I �nd that the non-announcing �rms�
abnormal price and volume reactions to an earnings announcement by the foreign �rm are
signi�cantly higher if �rms report under the same rather than di¤erent standards. Next,
I use a di¤erence-in-di¤erences design around mandatory introduction of IFRS. I �nd that
mandatory adopters experience a signi�cant increase in market reactions to the release of
earnings by voluntary adopters post-mandatory adoption. This increase is not observed for
non-adopters over the same period. As the quality of voluntary adopters�earnings signals is
likely to remain stable around mandatory adoption, my results are unlikely due to increases
in reporting quality.
31

References
Alves, P., Pope, P., Young, S., 2007. International information transfers: an analysis ofEuropean companies. Working paper, Lancaster University.
Armstrong, C., Barth, M., Jagolinzer, A., Riedl, E. J., 2010. Market reaction to the adoptionof IFRS in Europe. The Accounting Review 85, 31-61.
Asthana, S.C., Mishra, B.K., 2001. The di¤erential information hypothesis, �rm size, andearnings information transfer: An empirical investigation. Journal of Business Research 53,37-47.
Atiase, R.K., 1985. Predisclosure information, �rm capitalization, and security price behavioraround earnings announcements. Journal of Accounting Research 23, 21-36.
Bae, K-H., Tan, H.P., Welker, M., 2008. International GAAP di¤erences: The impact onforeign analysts. The Accounting Review 83, 593-628.
Baginski, S.P., 1987. Intraindustry information transfers associated with managementforecasts of earnings. Journal of Accounting Research 25, 196-216.
Ball, R., Kothari, S.P., Robin, A., 2000. The e¤ect of international institutional factors onproperties of accounting earnings. Journal of Accounting and Economics 29, 1-51.
Ball, R., Robin, A., Wu, J.S., 2003. Incentives versus standards: properties of accountingincome in four East Asian countries. Journal of Accounting and Economics 36, 235-270.
Bamber, L. 1987. Unexpected earnings, �rm size, and trading volume around quarterlyearnings announcements. The Accounting Review 62, 510-32.
Barth, M.E., Clinch, G., Shibano, T., 1999. International accounting harmonization andglobal equity markets. Journal of Accounting and Economics 26, 201-235.
Beaver, W.H., 1968. The information content of annual earnings announcements. Journal ofAccounting Research 6, 67-92.
Beuselinck, C., Joos, P., Van der Meulen, S., 2007. International earnings comparability.Working Paper, Tilburg University.
Bradshaw, M.T., Miller, G.S., Serafeim, G., 2009. Accounting method heterogeneity andanalysts�forecasts. Working paper, Boston College.
Brav, A., Heaton, J.B., 2002. Competing theories of �nancial anomalies. Review of FinancialStudies 15, 575-606.
Burgstahler, D.C., Hail, L., Leuz, C., 2006. The Importance of reporting incentives: Earningsmanagement in European private and public Firms. The Accounting Review 81, 983-1017.
Christensen, J., 2010. Accounting errors and errors of accounting. The Accounting Review85, 1827-1838.
32
Clinch, G.J., Sinclair, N.A., 1987. Intra-industry information releases: A recursive systemsapproach. Journal of Accounting and Economics 9, 89-106.
Daniel, K.D., Hirshleifer, D., Subrahmanyam, A., 1998. Investor psychology and securitymarket under- and overreactions. Journal of Finance 53, 1839-1885.
Daniel, K.D., Hirshleifer, D., Subrahmanyam, A., 2001. Overcon�dence, arbitrage, andequilibrium asset pricing. Journal of Finance 56, 921-965.
Daske, H., Hail, L., Leuz, C., Verdi, R.S., 2008. Mandatory IFRS reporting around theworld: Early evidence on the economic consequences. Journal of Accounting Research 46,1085-1142.
Daske, H., Hail, L., Leuz, C., Verdi, R.S., 2009. Adopting a label: Heterogeneity in theeconomic consequences of IFRS adoptions. Working Paper, University of Pennsylvania.
Dechow, P., Ge, W., Schrand, C., 2010. Understanding earnings quality: A review of theproxies, their determinants and their consequences. Journal of Accounting and Economics,forthcoming.
DeFond, M., Hu, X., Hung, M.Y., Li, S., 2009. The impact of IFRS Adoption on US mutualfund ownership: The role of comparability. Working paper, University of Southern California.
DeFond, M., Hung, M.Y., Trezevant, R., 2007. Investor protection and the informationcontent of annual earnings announcement: International evidence. Journal of Accountingand Economics 43, 37-67.
De Franco, G., Kothari, S.P., Verdi R.S., 2010. The bene�ts of �rm comparability. WorkingPaper, Massachusetts Institute of Technology.
DeLong, J.B., Shleifer, A., Summers, L.H., Waldmann, R.J.,1990. Noise trader risk in�nancial markets. Journal of Political Economy 98, 703�738.
Dye, R., 1990. Mandatory versus voluntary disclosures: The cases of �nancial and realexternalities. The Accounting Review 65, 1-24.
Financial Accounting Standards Board, 2010. Concepts Statement No.8. FinancialAccounting Standards Board.
Firth, M.A., 1976. The impact of earnings announcements on the share price behavior ofsimilar type �rms. Economic Journal 86, 296�306.
Firth, M.A., 1996. The transmission of corporate �nancial information across nationalborders and equity market linkages. Review of Accounting Studies 1, 309-337.
Fischer, P.E., Verrecchia, R.E., 2000. Reporting bias. The Accounting Review 75, 229-245.
Foster, G., 1981. Intra-industry information transfer associated with earnings releases.Journal of Accounting and Economics 3, 201-232.
33

Freeman, R.N., 1987. The association between accounting earnings and security returns forlarge and small �rms. Journal of Accounting and Economics 9, 195-228.
Freeman, R.N., Tse, S., 1992. An earnings prediction approach to examining intercompanyinformation transfers. Journal of Accounting and Economics 15, 509-523.
Frost, C.A, 1995. Intraindustry information transfer: An analysis of research methods andadditional evidence. Review of Quantitative Finance and Accounting 5, 111-126.
Graham, R.C., King, R.D., 1996. Industry information transfers: The e¤ect of informationenvironment. Journal of Business Finance and Accounting 23, 1289-1306.
Greene, W.H., 2008. Econometric Analysis, 6th edition. Pearson Prentice Hall, Upper SaddleRiver, NJ.
Han, J., Wild, J., Ramesh, K., 1989. Managers� earnings forecasts and intra-industryinformation transfers. Journal of Accounting and Economics 11, 3-33.
Han, J., Wild, J., 1990. Unexpected earnings and intra-industry information transfers:Further evidence. Journal of Accounting Research 28, 211-219.
Han, J., Wild, J., 2000. Predisclosure information, �rm capitalization, and earningsinformation transfers . Journal of Business Research 49, 273-288.
Hayn, C., 1995. The information content of losses. Journal of Accounting and Economics 20,125-153.
Hirshleifer, D., Lim, S.S., Teoh, S.H., 2009. Driven to distraction: Extraneous events andunderreaction to earnings news. Journal of Finance 64, 2289-2325.
Hirshleifer, D., Teoh, S.H., 2003. Limited attention, information disclosure, and �nancialreporting. Journal of Accounting and Economics 36, 337-386.
Holthausen, R.W., Verrecchia, R.E., 1988. The e¤ect of sequential information releases onthe variance of price changes in an intertemporal multi-asset market. Journal of AccountingResearch 26, 82-106.
Hong, H., Stein, J.C., 1999. A uni�ed theory of underreaction, momentum trading andoverreaction in asset markets, Journal of Finance 54, 2143-2184.
International Accounting Standards Board, 2010. The Conceptual Framework for FinancialReporting. International Accounting Standards Board.
Kaufmann, D., Kraay, A., Mastruzzi, M., 2007. Governance Matters VI: Aggregate andIndividual Governance Indicators 1996�2006. Washington, DC: The World Bank.
Kim, O., Verrecchia, R.E., 1991. Trading volume and price reaction to public announcements.Journal of Accounting Research 29, 302-321.
34

Kim, Y., Lacina, M., Park, M., 2008. Positive and negative information transfers frommanagement earnings forecasts. Journal of Accounting Research 46, 885-908.
Landsman, W., Maydew, E., Thornock, J., 2010. The information content of annual earningsannouncements and mandatory adoption of IFRS. Working paper, University of NorthCarolina at Chapel Hill.
Lang, L.H.P., Stulz, R.M., 1992. Contagion and competitive intra-industry e¤ects ofbankruptcy announcements: An empirical analysis. Journal of Financial Economics 32,45-60.
Lang, M.H., Ma¤ett, M., Owens, E., 2010. Earnings comovement and accountingcomparability: the e¤ects of mandatory IFRS adoption. Working paper, University of NorthCarolina at Chapel Hill.
Laux, P., Starks, L.T., Yoon, P.S., 1998. The relative importance of competitionand contagion in intra-industry information transfers: An investigation of dividendannouncements. Financial Management 27, 5-16.
Lehavy, R., Sloan, R.G., 2008. Investor recognition and stock returns. Review of AccountingStudies 13, 327-361.
Leuz, C., Nanda, D., Wysocki, P.D., 2003. Earnings management and investor protection:an international comparison. Journal of Financial Economics 69, 505-527.
Libby, R., Libby, P.A., Short, D.G., 2009. Financial Accounting, 6th edition.McGraw-Hill/Irwin, New York, NY.
Longin, F., Solnik, B., 2001. Extreme correlation of international equity markets. Journal ofFinance 56, 649-676.
Merton, R.C., 1987. A simple model of capital market equilibrium with incompleteinformation. Journal of Finance 42, 483-510.
Pyo, Y., Lustgarten, S., 1990. Di¤erential intra-industry information transfer associated withmanagement earnings forecasts. Journal of Accounting and Economics 13, 365-379.
Ramnath, S., 2002. Investor and analyst reactions to earnings announcements of related�rms: An empirical analysis. Journal of Accounting Research 40, 1351-1376.
Shleifer, A., Vishny, R.W., 1997. The limits of arbitrage. Journal of Finance 52, 35-55.
Street D.L., Gray S.J., 2001. Observance of International Accounting Standards: Factorsexplaining non-compliance by companies referring to the use of IAS. ACCA ResearchMonograph.
Tan, H., Wang, S., Welker, M., 2009. Foreign analyst following and forecast accuracy aroundmandatory IFRS adoptions. Working paper, University of Waterloo.
35
Thomas, J., Zhang, F., 2008. Overreaction to intra-industry information transfers? Journalof Accounting Research 46, 909-949.
Wu, J.S., Zhang, I., 2010. Accounting integration and comparability: Evidence from relativeperformance evaluation around IFRS adoption. Working paper, University of Rochester.
Yu, G., 2010. Accounting standards and international portfolio holdings: Analysis ofcross-border holdings following mandatory adoption of IFRS. Working paper, HarvardUniversity.
Ze¤, S.A., 2007. Some obstacles to global �nancial reporting comparability and convergenceat a high level of quality. The British Accounting Review 39, 290-302.
36

37
APPENDIX A
In this appendix, I briefly discuss another approach that could result in accounting standards
measurement error correlation playing a role at Firm1’s report date. The key assumption in this
approach is there is a real externality from reporting, i.e., Firm2 will alter its distribution of cash
flows as a result of Firm1’s report (Dye, 1990). The intuition is that if the measurement errors are
more correlated, then Firm2's manager can better infer Firm1’s underlying cash flows and
competitive positions from Firm1’s report. As a result, Firm2’s manager will more likely to alter
Firm2's operations in response to Firm1’s report. Consequently, there will be an immediate value
effect reflected in Firm2’s equilibrium pricing at the announcement of Firm1’s report. This change
results from altering the actual distributions of Firm2’s cash flows, not just investors’ perceptions of
these cash flows.
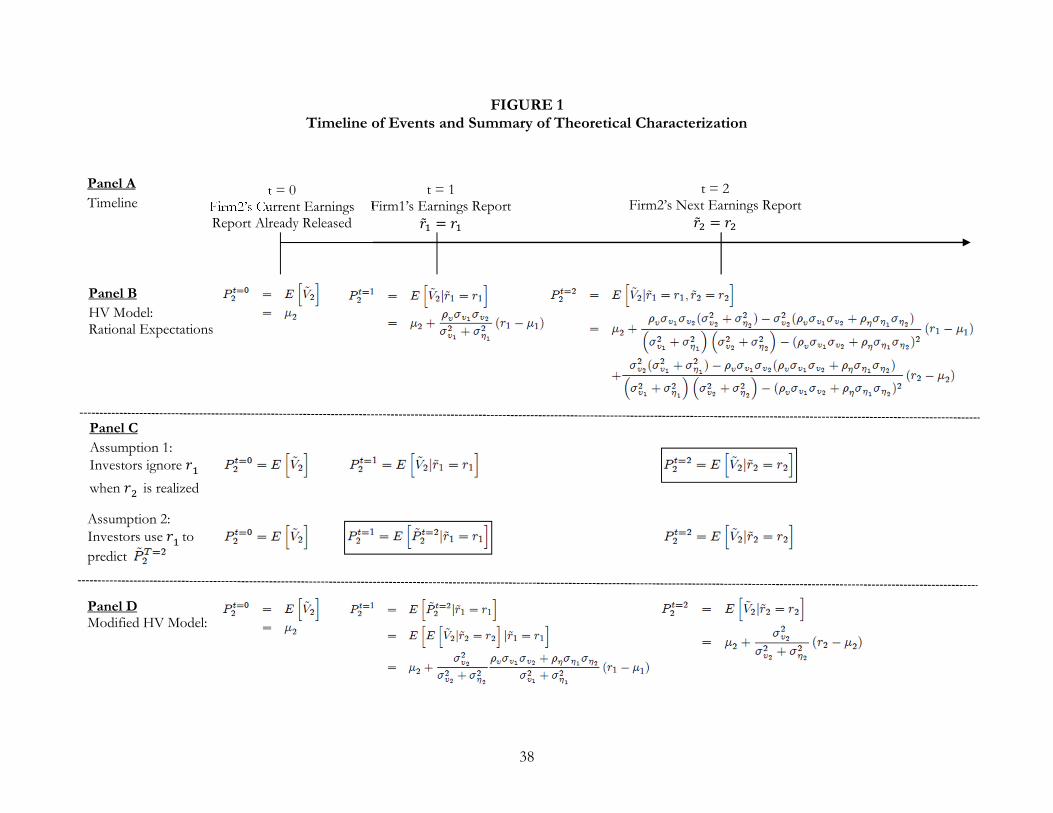
38
FIGURE 1 Timeline of Events and Summary of Theoretical Characterization
�̃� � ��
t = 2 Firm2’s Next Earnings Report
�̃� � ��
t = 1 Firm1’s Earnings Report
Panel B
HV Model: Rational Expectations
t = 0 Firm2’s Current Earnings Report Already Released
Panel C
Assumption 1: Investors ignore �
�
when ��
is realized
Assumption 2: Investors use �
� to
predict
Panel D Modified HV Model:
Panel A
Timeline
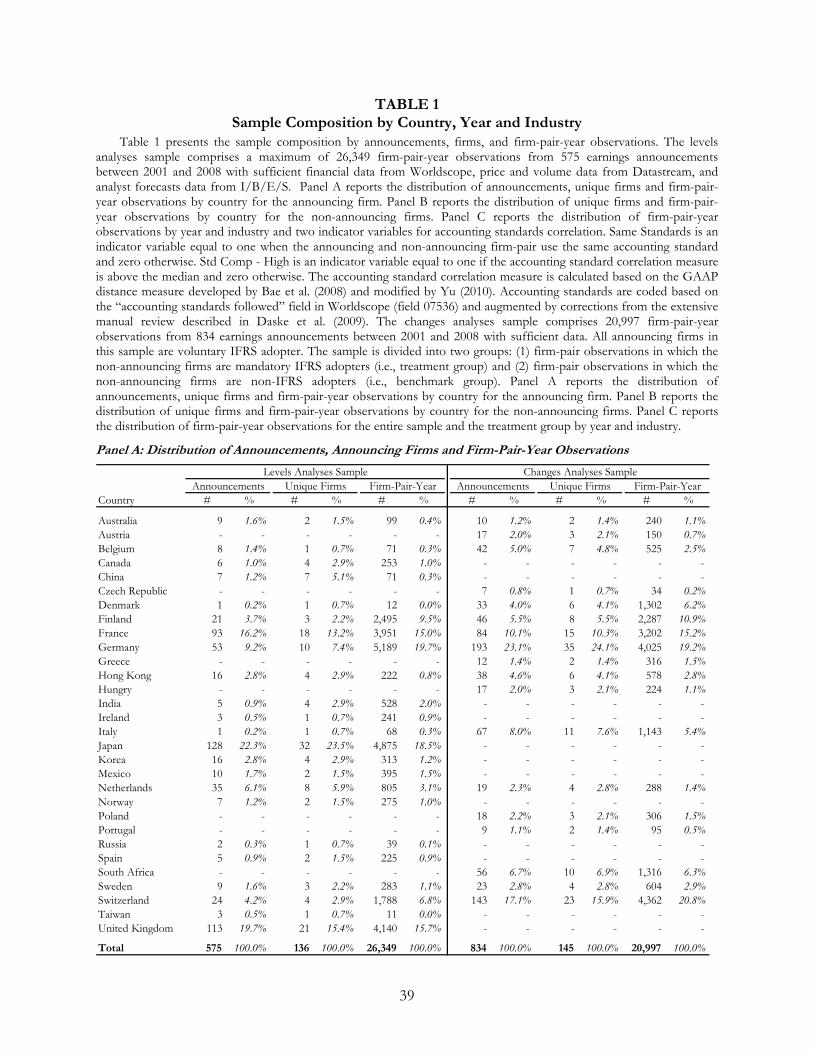
39
TABLE 1 Sample Composition by Country, Year and Industry
Table 1 presents the sample composition by announcements, firms, and firm-pair-year observations. The levels analyses sample comprises a maximum of 26,349 firm-pair-year observations from 575 earnings announcements between 2001 and 2008 with sufficient financial data from Worldscope, price and volume data from Datastream, and analyst forecasts data from I/B/E/S. Panel A reports the distribution of announcements, unique firms and firm-pair-year observations by country for the announcing firm. Panel B reports the distribution of unique firms and firm-pair-year observations by country for the non-announcing firms. Panel C reports the distribution of firm-pair-year observations by year and industry and two indicator variables for accounting standards correlation. Same Standards is an indicator variable equal to one when the announcing and non-announcing firm-pair use the same accounting standard and zero otherwise. Std Comp - High is an indicator variable equal to one if the accounting standard correlation measure is above the median and zero otherwise. The accounting standard correlation measure is calculated based on the GAAP distance measure developed by Bae et al. (2008) and modified by Yu (2010). Accounting standards are coded based on the “accounting standards followed” field in Worldscope (field 07536) and augmented by corrections from the extensive manual review described in Daske et al. (2009). The changes analyses sample comprises 20,997 firm-pair-year observations from 834 earnings announcements between 2001 and 2008 with sufficient data. All announcing firms in this sample are voluntary IFRS adopter. The sample is divided into two groups: (1) firm-pair observations in which the non-announcing firms are mandatory IFRS adopters (i.e., treatment group) and (2) firm-pair observations in which the non-announcing firms are non-IFRS adopters (i.e., benchmark group). Panel A reports the distribution of announcements, unique firms and firm-pair-year observations by country for the announcing firm. Panel B reports the distribution of unique firms and firm-pair-year observations by country for the non-announcing firms. Panel C reports the distribution of firm-pair-year observations for the entire sample and the treatment group by year and industry.
Panel A: Distribution of Announcements, Announcing Firms and Firm-Pair-Year Observations
Levels Analyses Sample Changes Analyses Sample
Announcements Unique Firms Firm-Pair-Year Announcements Unique Firms Firm-Pair-Year
Country # % # % # % # % # % # %
Australia 9 1.6% 2 1.5% 99 0.4% 10 1.2% 2 1.4% 240 1.1%
Austria - - - - - - 17 2.0% 3 2.1% 150 0.7%
Belgium 8 1.4% 1 0.7% 71 0.3% 42 5.0% 7 4.8% 525 2.5%
Canada 6 1.0% 4 2.9% 253 1.0% - - - - - -
China 7 1.2% 7 5.1% 71 0.3% - - - - - -
Czech Republic - - - - - - 7 0.8% 1 0.7% 34 0.2%
Denmark 1 0.2% 1 0.7% 12 0.0% 33 4.0% 6 4.1% 1,302 6.2%
Finland 21 3.7% 3 2.2% 2,495 9.5% 46 5.5% 8 5.5% 2,287 10.9%
France 93 16.2% 18 13.2% 3,951 15.0% 84 10.1% 15 10.3% 3,202 15.2%
Germany 53 9.2% 10 7.4% 5,189 19.7% 193 23.1% 35 24.1% 4,025 19.2%
Greece - - - - - - 12 1.4% 2 1.4% 316 1.5%
Hong Kong 16 2.8% 4 2.9% 222 0.8% 38 4.6% 6 4.1% 578 2.8%
Hungry - - - - - - 17 2.0% 3 2.1% 224 1.1%
India 5 0.9% 4 2.9% 528 2.0% - - - - - -
Ireland 3 0.5% 1 0.7% 241 0.9% - - - - - -
Italy 1 0.2% 1 0.7% 68 0.3% 67 8.0% 11 7.6% 1,143 5.4%
Japan 128 22.3% 32 23.5% 4,875 18.5% - - - - - -
Korea 16 2.8% 4 2.9% 313 1.2% - - - - - -
Mexico 10 1.7% 2 1.5% 395 1.5% - - - - - -
Netherlands 35 6.1% 8 5.9% 805 3.1% 19 2.3% 4 2.8% 288 1.4%
Norway 7 1.2% 2 1.5% 275 1.0% - - - - - -
Poland - - - - - - 18 2.2% 3 2.1% 306 1.5%
Portugal - - - - - - 9 1.1% 2 1.4% 95 0.5%
Russia 2 0.3% 1 0.7% 39 0.1% - - - - - -
Spain 5 0.9% 2 1.5% 225 0.9% - - - - - -
South Africa - - - - - - 56 6.7% 10 6.9% 1,316 6.3%
Sweden 9 1.6% 3 2.2% 283 1.1% 23 2.8% 4 2.8% 604 2.9%
Switzerland 24 4.2% 4 2.9% 1,788 6.8% 143 17.1% 23 15.9% 4,362 20.8%
Taiwan 3 0.5% 1 0.7% 11 0.0% - - - - - -
United Kingdom 113 19.7% 21 15.4% 4,140 15.7% - - - - - -
Total 575 100.0% 136 100.0% 26,349 100.0% 834 100.0% 145 100.0% 20,997 100.0%
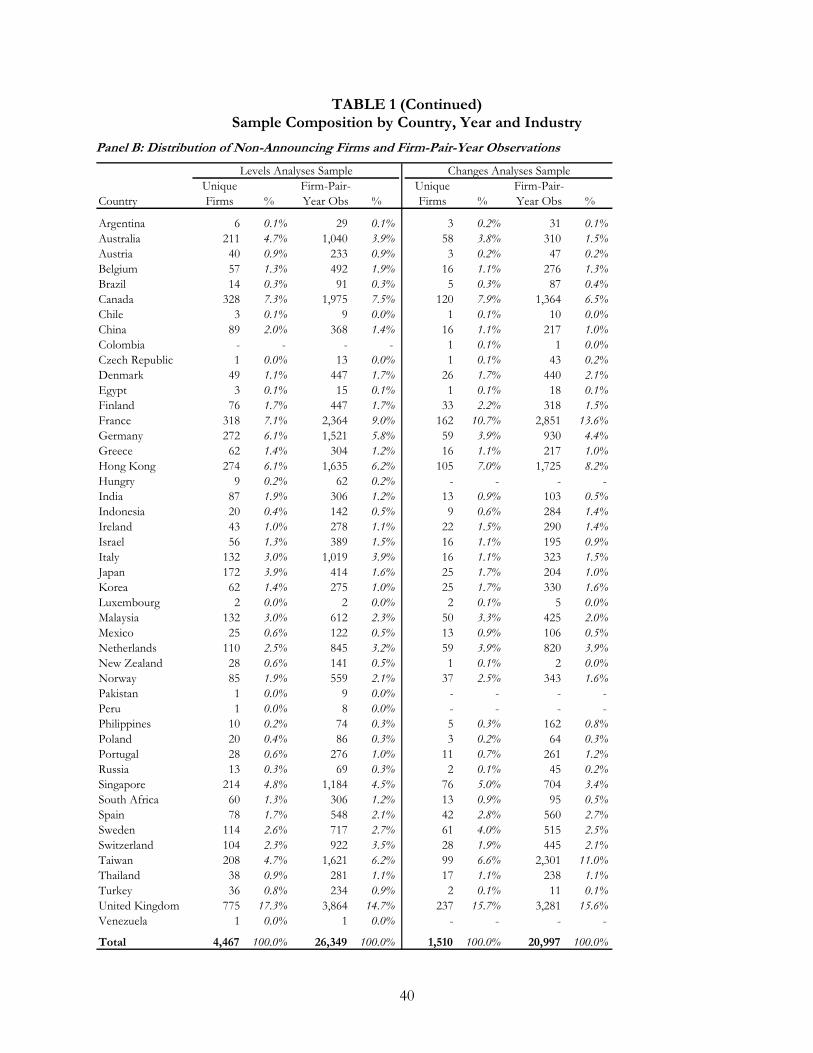
40
TABLE 1 (Continued) Sample Composition by Country, Year and Industry
Panel B: Distribution of Non-Announcing Firms and Firm-Pair-Year Observations
Levels Analyses Sample Changes Analyses Sample
Unique Firm-Pair- Unique Firm-Pair-
Country Firms % Year Obs % Firms % Year Obs %
Argentina 6 0.1% 29 0.1% 3 0.2% 31 0.1%
Australia 211 4.7% 1,040 3.9% 58 3.8% 310 1.5%
Austria 40 0.9% 233 0.9% 3 0.2% 47 0.2%
Belgium 57 1.3% 492 1.9% 16 1.1% 276 1.3%
Brazil 14 0.3% 91 0.3% 5 0.3% 87 0.4%
Canada 328 7.3% 1,975 7.5% 120 7.9% 1,364 6.5%
Chile 3 0.1% 9 0.0% 1 0.1% 10 0.0%
China 89 2.0% 368 1.4% 16 1.1% 217 1.0%
Colombia - - - - 1 0.1% 1 0.0%
Czech Republic 1 0.0% 13 0.0% 1 0.1% 43 0.2%
Denmark 49 1.1% 447 1.7% 26 1.7% 440 2.1%
Egypt 3 0.1% 15 0.1% 1 0.1% 18 0.1%
Finland 76 1.7% 447 1.7% 33 2.2% 318 1.5%
France 318 7.1% 2,364 9.0% 162 10.7% 2,851 13.6%
Germany 272 6.1% 1,521 5.8% 59 3.9% 930 4.4%
Greece 62 1.4% 304 1.2% 16 1.1% 217 1.0%
Hong Kong 274 6.1% 1,635 6.2% 105 7.0% 1,725 8.2%
Hungry 9 0.2% 62 0.2% - - - -
India 87 1.9% 306 1.2% 13 0.9% 103 0.5%
Indonesia 20 0.4% 142 0.5% 9 0.6% 284 1.4%
Ireland 43 1.0% 278 1.1% 22 1.5% 290 1.4%
Israel 56 1.3% 389 1.5% 16 1.1% 195 0.9%
Italy 132 3.0% 1,019 3.9% 16 1.1% 323 1.5%
Japan 172 3.9% 414 1.6% 25 1.7% 204 1.0%
Korea 62 1.4% 275 1.0% 25 1.7% 330 1.6%
Luxembourg 2 0.0% 2 0.0% 2 0.1% 5 0.0%
Malaysia 132 3.0% 612 2.3% 50 3.3% 425 2.0%
Mexico 25 0.6% 122 0.5% 13 0.9% 106 0.5%
Netherlands 110 2.5% 845 3.2% 59 3.9% 820 3.9%
New Zealand 28 0.6% 141 0.5% 1 0.1% 2 0.0%
Norway 85 1.9% 559 2.1% 37 2.5% 343 1.6%
Pakistan 1 0.0% 9 0.0% - - - -
Peru 1 0.0% 8 0.0% - - - -
Philippines 10 0.2% 74 0.3% 5 0.3% 162 0.8%
Poland 20 0.4% 86 0.3% 3 0.2% 64 0.3%
Portugal 28 0.6% 276 1.0% 11 0.7% 261 1.2%
Russia 13 0.3% 69 0.3% 2 0.1% 45 0.2%
Singapore 214 4.8% 1,184 4.5% 76 5.0% 704 3.4%
South Africa 60 1.3% 306 1.2% 13 0.9% 95 0.5%
Spain 78 1.7% 548 2.1% 42 2.8% 560 2.7%
Sweden 114 2.6% 717 2.7% 61 4.0% 515 2.5%
Switzerland 104 2.3% 922 3.5% 28 1.9% 445 2.1%
Taiwan 208 4.7% 1,621 6.2% 99 6.6% 2,301 11.0%
Thailand 38 0.9% 281 1.1% 17 1.1% 238 1.1%
Turkey 36 0.8% 234 0.9% 2 0.1% 11 0.1%
United Kingdom 775 17.3% 3,864 14.7% 237 15.7% 3,281 15.6%
Venezuela 1 0.0% 1 0.0% - - - -
Total 4,467 100.0% 26,349 100.0% 1,510 100.0% 20,997 100.0%
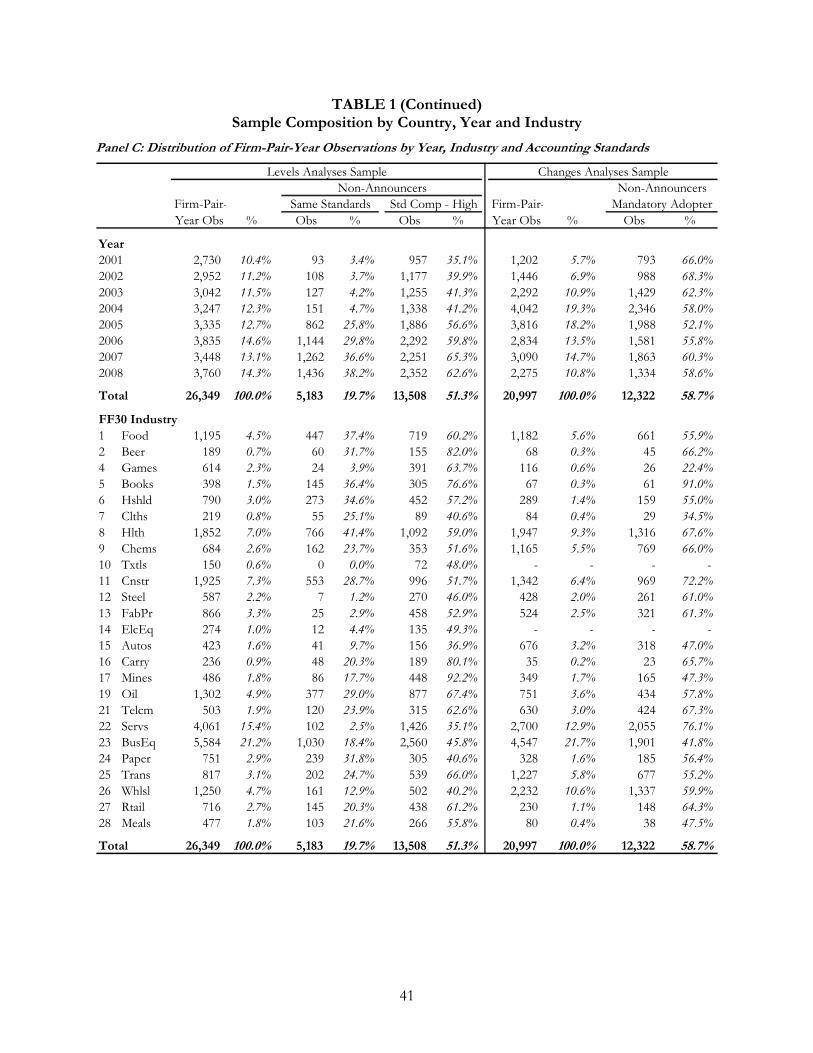
41
TABLE 1 (Continued) Sample Composition by Country, Year and Industry
Panel C: Distribution of Firm-Pair-Year Observations by Year, Industry and Accounting Standards
Levels Analyses Sample Changes Analyses Sample
Non-Announcers Non-Announcers
Firm-Pair- Same Standards Std Comp - High Firm-Pair- Mandatory Adopter
Year Obs % Obs % Obs % Year Obs % Obs %
Year
2001 2,730 10.4% 93 3.4% 957 35.1% 1,202 5.7% 793 66.0%
2002 2,952 11.2% 108 3.7% 1,177 39.9% 1,446 6.9% 988 68.3%
2003 3,042 11.5% 127 4.2% 1,255 41.3% 2,292 10.9% 1,429 62.3%
2004 3,247 12.3% 151 4.7% 1,338 41.2% 4,042 19.3% 2,346 58.0%
2005 3,335 12.7% 862 25.8% 1,886 56.6% 3,816 18.2% 1,988 52.1%
2006 3,835 14.6% 1,144 29.8% 2,292 59.8% 2,834 13.5% 1,581 55.8%
2007 3,448 13.1% 1,262 36.6% 2,251 65.3% 3,090 14.7% 1,863 60.3%
2008 3,760 14.3% 1,436 38.2% 2,352 62.6% 2,275 10.8% 1,334 58.6%
Total 26,349 100.0% 5,183 19.7% 13,508 51.3% 20,997 100.0% 12,322 58.7%
FF30 Industry
1 Food 1,195 4.5% 447 37.4% 719 60.2% 1,182 5.6% 661 55.9%
2 Beer 189 0.7% 60 31.7% 155 82.0% 68 0.3% 45 66.2%
4 Games 614 2.3% 24 3.9% 391 63.7% 116 0.6% 26 22.4%
5 Books 398 1.5% 145 36.4% 305 76.6% 67 0.3% 61 91.0%
6 Hshld 790 3.0% 273 34.6% 452 57.2% 289 1.4% 159 55.0%
7 Clths 219 0.8% 55 25.1% 89 40.6% 84 0.4% 29 34.5%
8 Hlth 1,852 7.0% 766 41.4% 1,092 59.0% 1,947 9.3% 1,316 67.6%
9 Chems 684 2.6% 162 23.7% 353 51.6% 1,165 5.5% 769 66.0%
10 Txtls 150 0.6% 0 0.0% 72 48.0% - - - -
11 Cnstr 1,925 7.3% 553 28.7% 996 51.7% 1,342 6.4% 969 72.2%
12 Steel 587 2.2% 7 1.2% 270 46.0% 428 2.0% 261 61.0%
13 FabPr 866 3.3% 25 2.9% 458 52.9% 524 2.5% 321 61.3%
14 ElcEq 274 1.0% 12 4.4% 135 49.3% - - - -
15 Autos 423 1.6% 41 9.7% 156 36.9% 676 3.2% 318 47.0%
16 Carry 236 0.9% 48 20.3% 189 80.1% 35 0.2% 23 65.7%
17 Mines 486 1.8% 86 17.7% 448 92.2% 349 1.7% 165 47.3%
19 Oil 1,302 4.9% 377 29.0% 877 67.4% 751 3.6% 434 57.8%
21 Telcm 503 1.9% 120 23.9% 315 62.6% 630 3.0% 424 67.3%
22 Servs 4,061 15.4% 102 2.5% 1,426 35.1% 2,700 12.9% 2,055 76.1%
23 BusEq 5,584 21.2% 1,030 18.4% 2,560 45.8% 4,547 21.7% 1,901 41.8%
24 Paper 751 2.9% 239 31.8% 305 40.6% 328 1.6% 185 56.4%
25 Trans 817 3.1% 202 24.7% 539 66.0% 1,227 5.8% 677 55.2%
26 Whlsl 1,250 4.7% 161 12.9% 502 40.2% 2,232 10.6% 1,337 59.9%
27 Rtail 716 2.7% 145 20.3% 438 61.2% 230 1.1% 148 64.3%
28 Meals 477 1.8% 103 21.6% 266 55.8% 80 0.4% 38 47.5%
Total 26,349 100.0% 5,183 19.7% 13,508 51.3% 20,997 100.0% 12,322 58.7%
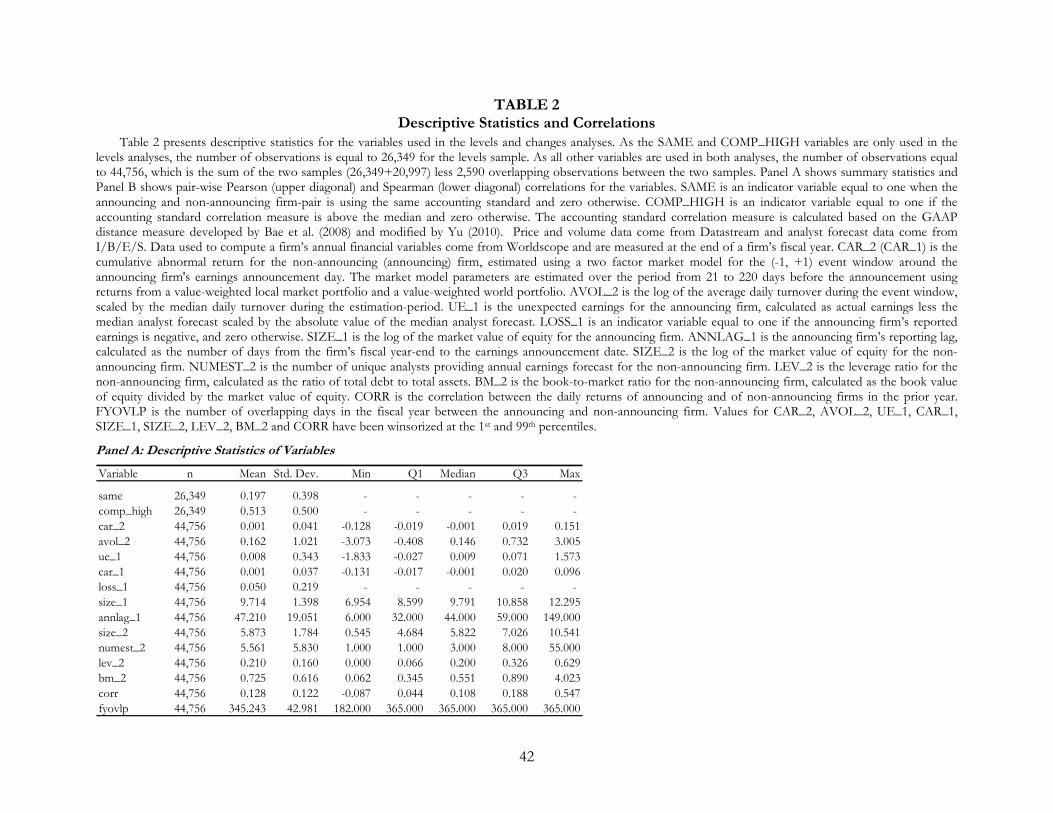
42
TABLE 2 Descriptive Statistics and Correlations
Table 2 presents descriptive statistics for the variables used in the levels and changes analyses. As the SAME and COMP_HIGH variables are only used in the levels analyses, the number of observations is equal to 26,349 for the levels sample. As all other variables are used in both analyses, the number of observations equal to 44,756, which is the sum of the two samples (26,349+20,997) less 2,590 overlapping observations between the two samples. Panel A shows summary statistics and Panel B shows pair-wise Pearson (upper diagonal) and Spearman (lower diagonal) correlations for the variables. SAME is an indicator variable equal to one when the announcing and non-announcing firm-pair is using the same accounting standard and zero otherwise. COMP_HIGH is an indicator variable equal to one if the accounting standard correlation measure is above the median and zero otherwise. The accounting standard correlation measure is calculated based on the GAAP distance measure developed by Bae et al. (2008) and modified by Yu (2010). Price and volume data come from Datastream and analyst forecast data come from I/B/E/S. Data used to compute a firm’s annual financial variables come from Worldscope and are measured at the end of a firm’s fiscal year. CAR_2 (CAR_1) is the cumulative abnormal return for the non-announcing (announcing) firm, estimated using a two factor market model for the (-1, +1) event window around the announcing firm's earnings announcement day. The market model parameters are estimated over the period from 21 to 220 days before the announcement using returns from a value-weighted local market portfolio and a value-weighted world portfolio. AVOL_2 is the log of the average daily turnover during the event window, scaled by the median daily turnover during the estimation-period. UE_1 is the unexpected earnings for the announcing firm, calculated as actual earnings less the median analyst forecast scaled by the absolute value of the median analyst forecast. LOSS_1 is an indicator variable equal to one if the announcing firm’s reported earnings is negative, and zero otherwise. SIZE_1 is the log of the market value of equity for the announcing firm. ANNLAG_1 is the announcing firm’s reporting lag, calculated as the number of days from the firm’s fiscal year-end to the earnings announcement date. SIZE_2 is the log of the market value of equity for the non-announcing firm. NUMEST_2 is the number of unique analysts providing annual earnings forecast for the non-announcing firm. LEV_2 is the leverage ratio for the non-announcing firm, calculated as the ratio of total debt to total assets. BM_2 is the book-to-market ratio for the non-announcing firm, calculated as the book value of equity divided by the market value of equity. CORR is the correlation between the daily returns of announcing and of non-announcing firms in the prior year. FYOVLP is the number of overlapping days in the fiscal year between the announcing and non-announcing firm. Values for CAR_2, AVOL_2, UE_1, CAR_1, SIZE_1, SIZE_2, LEV_2, BM_2 and CORR have been winsorized at the 1st and 99th percentiles.
Panel A: Descriptive Statistics of Variables
Variable n Mean Std. Dev. Min Q1 Median Q3 Max
same 26,349 0.197 0.398 - - - - -
comp_high 26,349 0.513 0.500 - - - - -
car_2 44,756 0.001 0.041 -0.128 -0.019 -0.001 0.019 0.151
avol_2 44,756 0.162 1.021 -3.073 -0.408 0.146 0.732 3.005
ue_1 44,756 0.008 0.343 -1.833 -0.027 0.009 0.071 1.573
car_1 44,756 0.001 0.037 -0.131 -0.017 -0.001 0.020 0.096
loss_1 44,756 0.050 0.219 - - - - -
size_1 44,756 9.714 1.398 6.954 8.599 9.791 10.858 12.295
annlag_1 44,756 47.210 19.051 6.000 32.000 44.000 59.000 149.000
size_2 44,756 5.873 1.784 0.545 4.684 5.822 7.026 10.541
numest_2 44,756 5.561 5.830 1.000 1.000 3.000 8.000 55.000
lev_2 44,756 0.210 0.160 0.000 0.066 0.200 0.326 0.629
bm_2 44,756 0.725 0.616 0.062 0.345 0.551 0.890 4.023
corr 44,756 0.128 0.122 -0.087 0.044 0.108 0.188 0.547
fyovlp 44,756 345.243 42.981 182.000 365.000 365.000 365.000 365.000
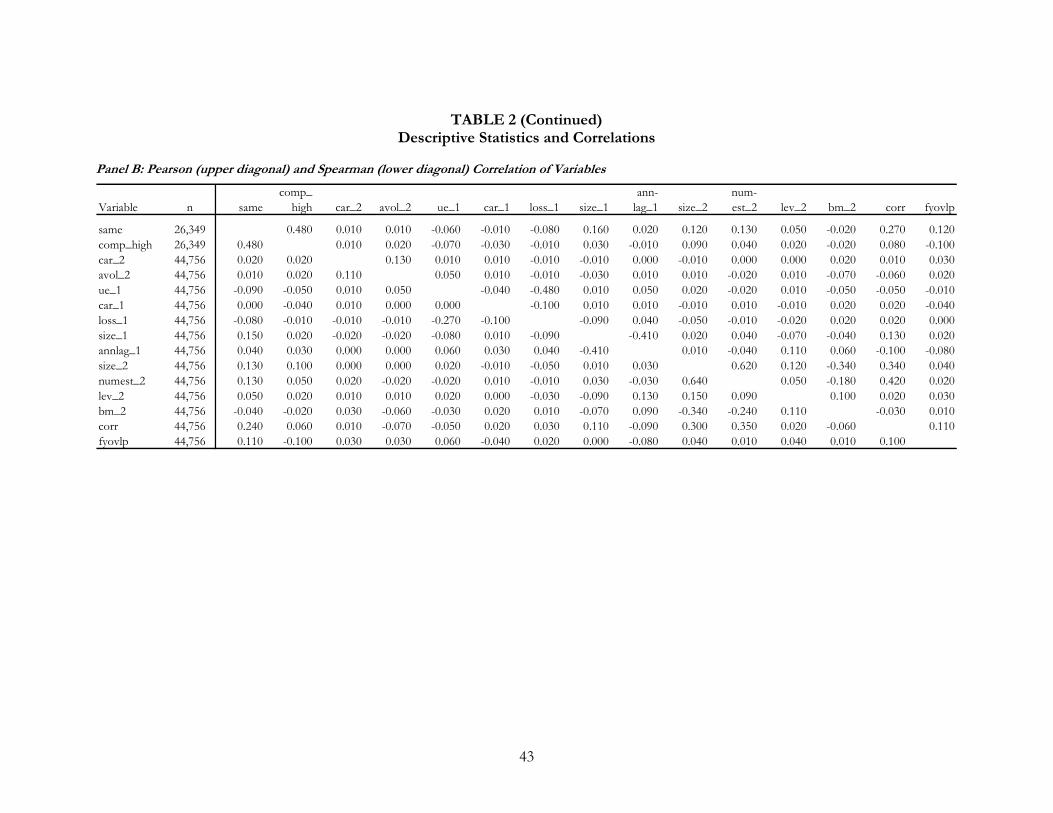
43
TABLE 2 (Continued) Descriptive Statistics and Correlations
Panel B: Pearson (upper diagonal) and Spearman (lower diagonal) Correlation of Variables
comp_ ann- num-
Variable n same high car_2 avol_2 ue_1 car_1 loss_1 size_1 lag_1 size_2 est_2 lev_2 bm_2 corr fyovlp
same 26,349 0.480 0.010 0.010 -0.060 -0.010 -0.080 0.160 0.020 0.120 0.130 0.050 -0.020 0.270 0.120
comp_high 26,349 0.480 0.010 0.020 -0.070 -0.030 -0.010 0.030 -0.010 0.090 0.040 0.020 -0.020 0.080 -0.100
car_2 44,756 0.020 0.020 0.130 0.010 0.010 -0.010 -0.010 0.000 -0.010 0.000 0.000 0.020 0.010 0.030
avol_2 44,756 0.010 0.020 0.110 0.050 0.010 -0.010 -0.030 0.010 0.010 -0.020 0.010 -0.070 -0.060 0.020
ue_1 44,756 -0.090 -0.050 0.010 0.050 -0.040 -0.480 0.010 0.050 0.020 -0.020 0.010 -0.050 -0.050 -0.010
car_1 44,756 0.000 -0.040 0.010 0.000 0.000 -0.100 0.010 0.010 -0.010 0.010 -0.010 0.020 0.020 -0.040
loss_1 44,756 -0.080 -0.010 -0.010 -0.010 -0.270 -0.100 -0.090 0.040 -0.050 -0.010 -0.020 0.020 0.020 0.000
size_1 44,756 0.150 0.020 -0.020 -0.020 -0.080 0.010 -0.090 -0.410 0.020 0.040 -0.070 -0.040 0.130 0.020
annlag_1 44,756 0.040 0.030 0.000 0.000 0.060 0.030 0.040 -0.410 0.010 -0.040 0.110 0.060 -0.100 -0.080
size_2 44,756 0.130 0.100 0.000 0.000 0.020 -0.010 -0.050 0.010 0.030 0.620 0.120 -0.340 0.340 0.040
numest_2 44,756 0.130 0.050 0.020 -0.020 -0.020 0.010 -0.010 0.030 -0.030 0.640 0.050 -0.180 0.420 0.020
lev_2 44,756 0.050 0.020 0.010 0.010 0.020 0.000 -0.030 -0.090 0.130 0.150 0.090 0.100 0.020 0.030
bm_2 44,756 -0.040 -0.020 0.030 -0.060 -0.030 0.020 0.010 -0.070 0.090 -0.340 -0.240 0.110 -0.030 0.010
corr 44,756 0.240 0.060 0.010 -0.070 -0.050 0.020 0.030 0.110 -0.090 0.300 0.350 0.020 -0.060 0.110
fyovlp 44,756 0.110 -0.100 0.030 0.030 0.060 -0.040 0.020 0.000 -0.080 0.040 0.010 0.040 0.010 0.100
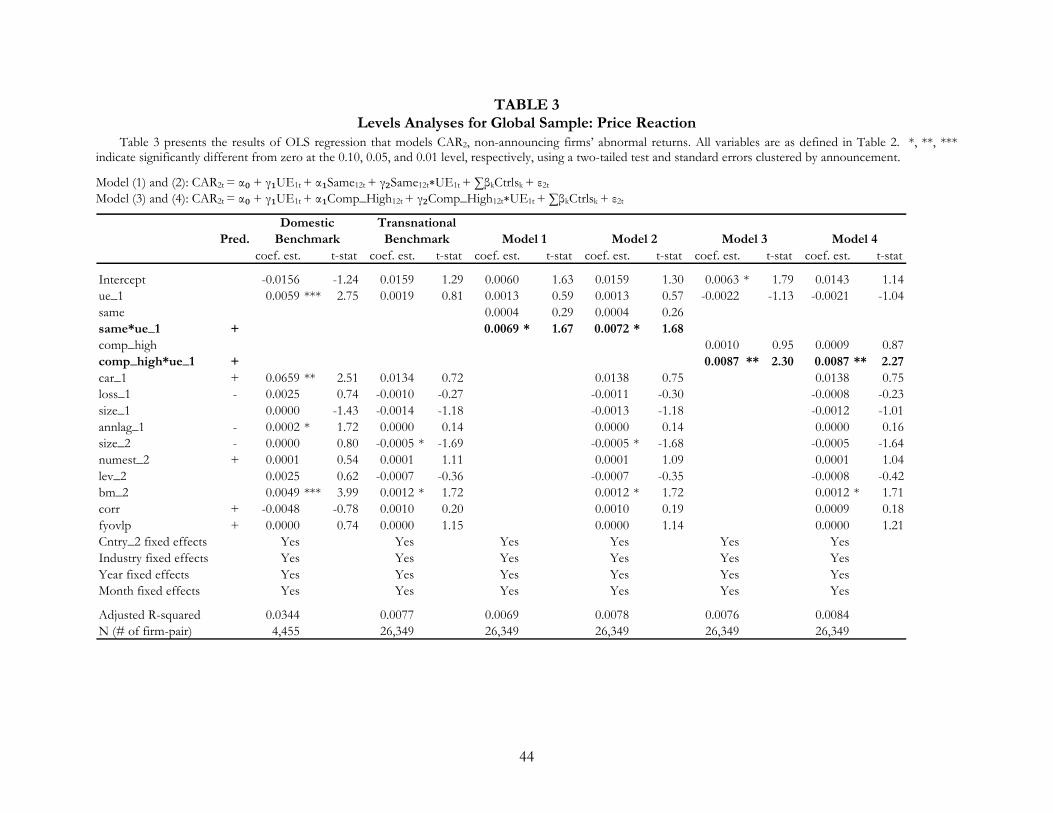
44
TABLE 3 Levels Analyses for Global Sample: Price Reaction
Table 3 presents the results of OLS regression that models CAR2, non-announcing firms’ abnormal returns. All variables are as defined in Table 2. *, **, *** indicate significantly different from zero at the 0.10, 0.05, and 0.01 level, respectively, using a two-tailed test and standard errors clustered by announcement.
Model (1) and (2): CAR2t = α₀ + γ₁UE1t + α₁Same12t + γ₂Same12t∗UE1t + ∑βkCtrlsk + ε2t
Model (3) and (4): CAR2t = α₀ + γ₁UE1t + α₁Comp_High12t + γ₂Comp_High12t∗UE1t + ∑βkCtrlsk + ε2t
Domestic Transnational
Pred. Benchmark Benchmark Model 1 Model 2 Model 3 Model 4
coef. est. t-stat coef. est. t-stat coef. est. t-stat coef. est. t-stat coef. est. t-stat coef. est. t-stat
Intercept -0.0156 -1.24 0.0159 1.29 0.0060 1.63 0.0159 1.30 0.0063 * 1.79 0.0143 1.14
ue_1 0.0059 *** 2.75 0.0019 0.81 0.0013 0.59 0.0013 0.57 -0.0022 -1.13 -0.0021 -1.04
same 0.0004 0.29 0.0004 0.26
same*ue_1 + 0.0069 * 1.67 0.0072 * 1.68
comp_high 0.0010 0.95 0.0009 0.87
comp_high*ue_1 + 0.0087 ** 2.30 0.0087 ** 2.27
car_1 + 0.0659 ** 2.51 0.0134 0.72 0.0138 0.75 0.0138 0.75
loss_1 - 0.0025 0.74 -0.0010 -0.27 -0.0011 -0.30 -0.0008 -0.23
size_1 0.0000 -1.43 -0.0014 -1.18 -0.0013 -1.18 -0.0012 -1.01
annlag_1 - 0.0002 * 1.72 0.0000 0.14 0.0000 0.14 0.0000 0.16
size_2 - 0.0000 0.80 -0.0005 * -1.69 -0.0005 * -1.68 -0.0005 -1.64
numest_2 + 0.0001 0.54 0.0001 1.11 0.0001 1.09 0.0001 1.04
lev_2 0.0025 0.62 -0.0007 -0.36 -0.0007 -0.35 -0.0008 -0.42
bm_2 0.0049 *** 3.99 0.0012 * 1.72 0.0012 * 1.72 0.0012 * 1.71
corr + -0.0048 -0.78 0.0010 0.20 0.0010 0.19 0.0009 0.18
fyovlp + 0.0000 0.74 0.0000 1.15 0.0000 1.14 0.0000 1.21
Cntry_2 fixed effects Yes Yes Yes Yes Yes Yes
Industry fixed effects Yes Yes Yes Yes Yes Yes
Year fixed effects Yes Yes Yes Yes Yes Yes
Month fixed effects Yes Yes Yes Yes Yes Yes
Adjusted R-squared 0.0344 0.0077 0.0069 0.0078 0.0076 0.0084
N (# of firm-pair) 4,455 26,349 26,349 26,349 26,349 26,349
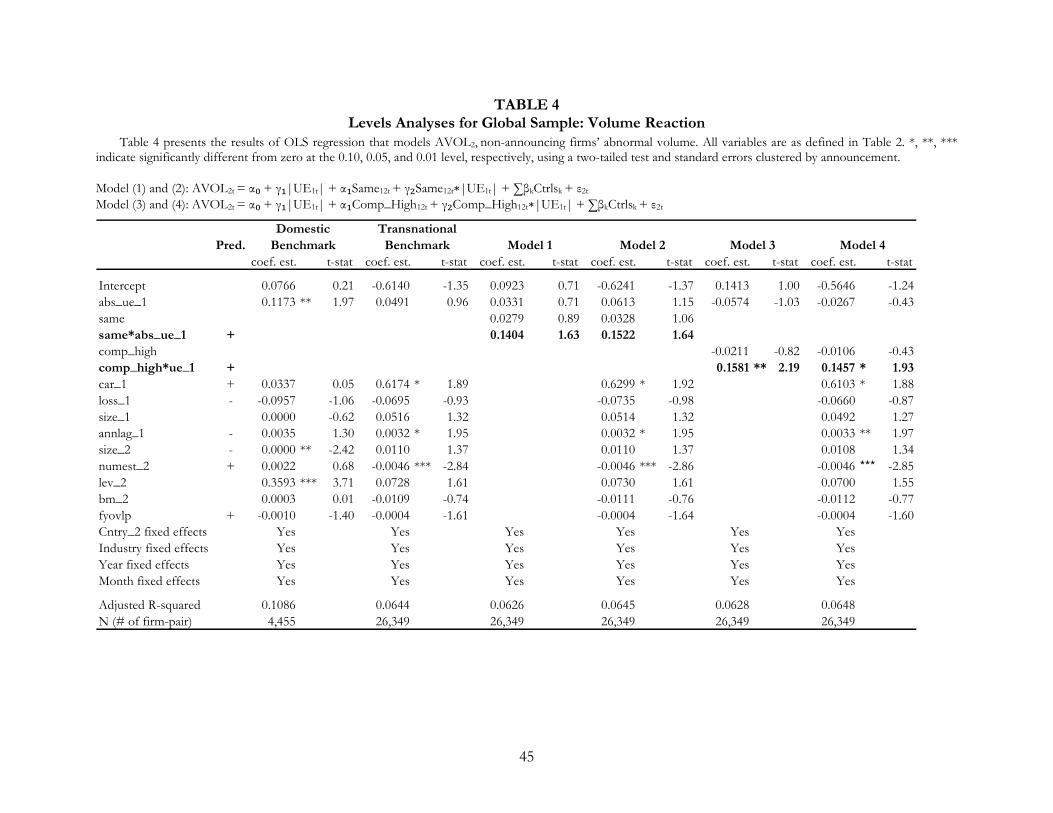
45
TABLE 4 Levels Analyses for Global Sample: Volume Reaction
Table 4 presents the results of OLS regression that models AVOL2, non-announcing firms’ abnormal volume. All variables are as defined in Table 2. *, **, *** indicate significantly different from zero at the 0.10, 0.05, and 0.01 level, respectively, using a two-tailed test and standard errors clustered by announcement.
Model (1) and (2): AVOL2t = α₀ + γ₁|UE1t| + α₁Same12t + γ₂Same12t∗|UE1t| + ∑βkCtrlsk + ε2t
Model (3) and (4): AVOL2t = α₀ + γ₁|UE1t| + α₁Comp_High12t + γ₂Comp_High12t∗|UE1t| + ∑βkCtrlsk + ε2t
Domestic Transnational
Pred. Benchmark Benchmark Model 1 Model 2 Model 3 Model 4
coef. est. t-stat coef. est. t-stat coef. est. t-stat coef. est. t-stat coef. est. t-stat coef. est. t-stat
Intercept 0.0766 0.21 -0.6140 -1.35 0.0923 0.71 -0.6241 -1.37 0.1413 1.00 -0.5646 -1.24
abs_ue_1 0.1173 ** 1.97 0.0491 0.96 0.0331 0.71 0.0613 1.15 -0.0574 -1.03 -0.0267 -0.43
same 0.0279 0.89 0.0328 1.06
same*abs_ue_1 + 0.1404 1.63 0.1522 1.64
comp_high -0.0211 -0.82 -0.0106 -0.43
comp_high*ue_1 + 0.1581 ** 2.19 0.1457 * 1.93
car_1 + 0.0337 0.05 0.6174 * 1.89 0.6299 * 1.92 0.6103 * 1.88
loss_1 - -0.0957 -1.06 -0.0695 -0.93 -0.0735 -0.98 -0.0660 -0.87
size_1 0.0000 -0.62 0.0516 1.32 0.0514 1.32 0.0492 1.27
annlag_1 - 0.0035 1.30 0.0032 * 1.95 0.0032 * 1.95 0.0033 ** 1.97
size_2 - 0.0000 ** -2.42 0.0110 1.37 0.0110 1.37 0.0108 1.34
numest_2 + 0.0022 0.68 -0.0046 *** -2.84 -0.0046 *** -2.86 -0.0046 *** -2.85
lev_2 0.3593 *** 3.71 0.0728 1.61 0.0730 1.61 0.0700 1.55
bm_2 0.0003 0.01 -0.0109 -0.74 -0.0111 -0.76 -0.0112 -0.77
fyovlp + -0.0010 -1.40 -0.0004 -1.61 -0.0004 -1.64 -0.0004 -1.60
Cntry_2 fixed effects Yes Yes Yes Yes Yes Yes
Industry fixed effects Yes Yes Yes Yes Yes Yes
Year fixed effects Yes Yes Yes Yes Yes Yes
Month fixed effects Yes Yes Yes Yes Yes Yes
Adjusted R-squared 0.1086 0.0644 0.0626 0.0645 0.0628 0.0648
N (# of firm-pair) 4,455 26,349 26,349 26,349 26,349 26,349
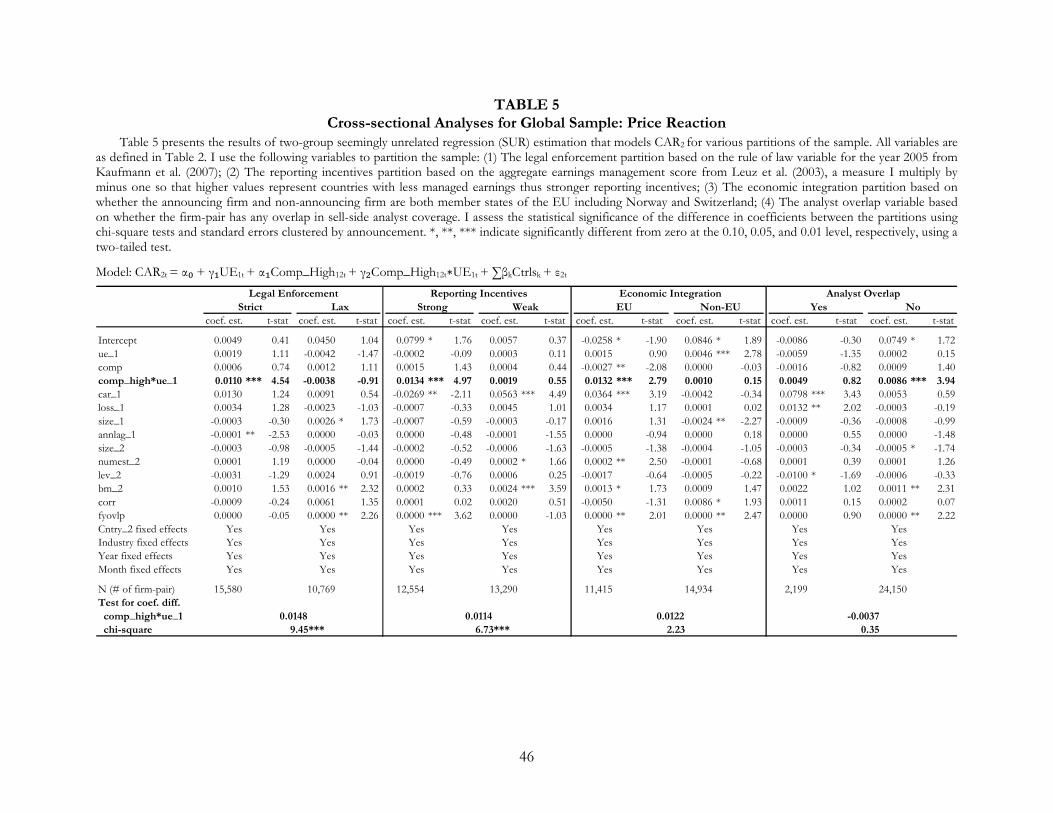
46
TABLE 5 Cross-sectional Analyses for Global Sample: Price Reaction
Table 5 presents the results of two-group seemingly unrelated regression (SUR) estimation that models CAR2 for various partitions of the sample. All variables are as defined in Table 2. I use the following variables to partition the sample: (1) The legal enforcement partition based on the rule of law variable for the year 2005 from Kaufmann et al. (2007); (2) The reporting incentives partition based on the aggregate earnings management score from Leuz et al. (2003), a measure I multiply by minus one so that higher values represent countries with less managed earnings thus stronger reporting incentives; (3) The economic integration partition based on whether the announcing firm and non-announcing firm are both member states of the EU including Norway and Switzerland; (4) The analyst overlap variable based on whether the firm-pair has any overlap in sell-side analyst coverage. I assess the statistical significance of the difference in coefficients between the partitions using chi-square tests and standard errors clustered by announcement. *, **, *** indicate significantly different from zero at the 0.10, 0.05, and 0.01 level, respectively, using a two-tailed test.
Model: CAR2t = α₀ + γ₁UE1t + α₁Comp_High12t + γ₂Comp_High12t∗UE1t + ∑βkCtrlsk + ε2t
Legal Enforcement Reporting Incentives Economic Integration Analyst Overlap
Strict Lax Strong Weak EU Non-EU Yes No
coef. est. t-stat coef. est. t-stat coef. est. t-stat coef. est. t-stat coef. est. t-stat coef. est. t-stat coef. est. t-stat coef. est. t-stat
Intercept 0.0049 0.41 0.0450 1.04 0.0799 * 1.76 0.0057 0.37 -0.0258 * -1.90 0.0846 * 1.89 -0.0086 -0.30 0.0749 * 1.72
ue_1 0.0019 1.11 -0.0042 -1.47 -0.0002 -0.09 0.0003 0.11 0.0015 0.90 0.0046 *** 2.78 -0.0059 -1.35 0.0002 0.15
comp 0.0006 0.74 0.0012 1.11 0.0015 1.43 0.0004 0.44 -0.0027 ** -2.08 0.0000 -0.03 -0.0016 -0.82 0.0009 1.40
comp_high*ue_1 0.0110 *** 4.54 -0.0038 -0.91 0.0134 *** 4.97 0.0019 0.55 0.0132 *** 2.79 0.0010 0.15 0.0049 0.82 0.0086 *** 3.94
car_1 0.0130 1.24 0.0091 0.54 -0.0269 ** -2.11 0.0563 *** 4.49 0.0364 *** 3.19 -0.0042 -0.34 0.0798 *** 3.43 0.0053 0.59
loss_1 0.0034 1.28 -0.0023 -1.03 -0.0007 -0.33 0.0045 1.01 0.0034 1.17 0.0001 0.02 0.0132 ** 2.02 -0.0003 -0.19
size_1 -0.0003 -0.30 0.0026 * 1.73 -0.0007 -0.59 -0.0003 -0.17 0.0016 1.31 -0.0024 ** -2.27 -0.0009 -0.36 -0.0008 -0.99
annlag_1 -0.0001 ** -2.53 0.0000 -0.03 0.0000 -0.48 -0.0001 -1.55 0.0000 -0.94 0.0000 0.18 0.0000 0.55 0.0000 -1.48
size_2 -0.0003 -0.98 -0.0005 -1.44 -0.0002 -0.52 -0.0006 -1.63 -0.0005 -1.38 -0.0004 -1.05 -0.0003 -0.34 -0.0005 * -1.74
numest_2 0.0001 1.19 0.0000 -0.04 0.0000 -0.49 0.0002 * 1.66 0.0002 ** 2.50 -0.0001 -0.68 0.0001 0.39 0.0001 1.26
lev_2 -0.0031 -1.29 0.0024 0.91 -0.0019 -0.76 0.0006 0.25 -0.0017 -0.64 -0.0005 -0.22 -0.0100 * -1.69 -0.0006 -0.33
bm_2 0.0010 1.53 0.0016 ** 2.32 0.0002 0.33 0.0024 *** 3.59 0.0013 * 1.73 0.0009 1.47 0.0022 1.02 0.0011 ** 2.31
corr -0.0009 -0.24 0.0061 1.35 0.0001 0.02 0.0020 0.51 -0.0050 -1.31 0.0086 * 1.93 0.0011 0.15 0.0002 0.07
fyovlp 0.0000 -0.05 0.0000 ** 2.26 0.0000 *** 3.62 0.0000 -1.03 0.0000 ** 2.01 0.0000 ** 2.47 0.0000 0.90 0.0000 ** 2.22
Cntry_2 fixed effects Yes Yes Yes Yes Yes Yes Yes Yes
Industry fixed effects Yes Yes Yes Yes Yes Yes Yes Yes
Year fixed effects Yes Yes Yes Yes Yes Yes Yes Yes
Month fixed effects Yes Yes Yes Yes Yes Yes Yes Yes
N (# of firm-pair) 15,580 10,769 12,554 13,290 11,415 14,934 2,199 24,150
Test for coef. diff.
comp_high*ue_1 0.0148 0.0114 0.0122 -0.0037
chi-square 9.45*** 6.73*** 2.23 0.35
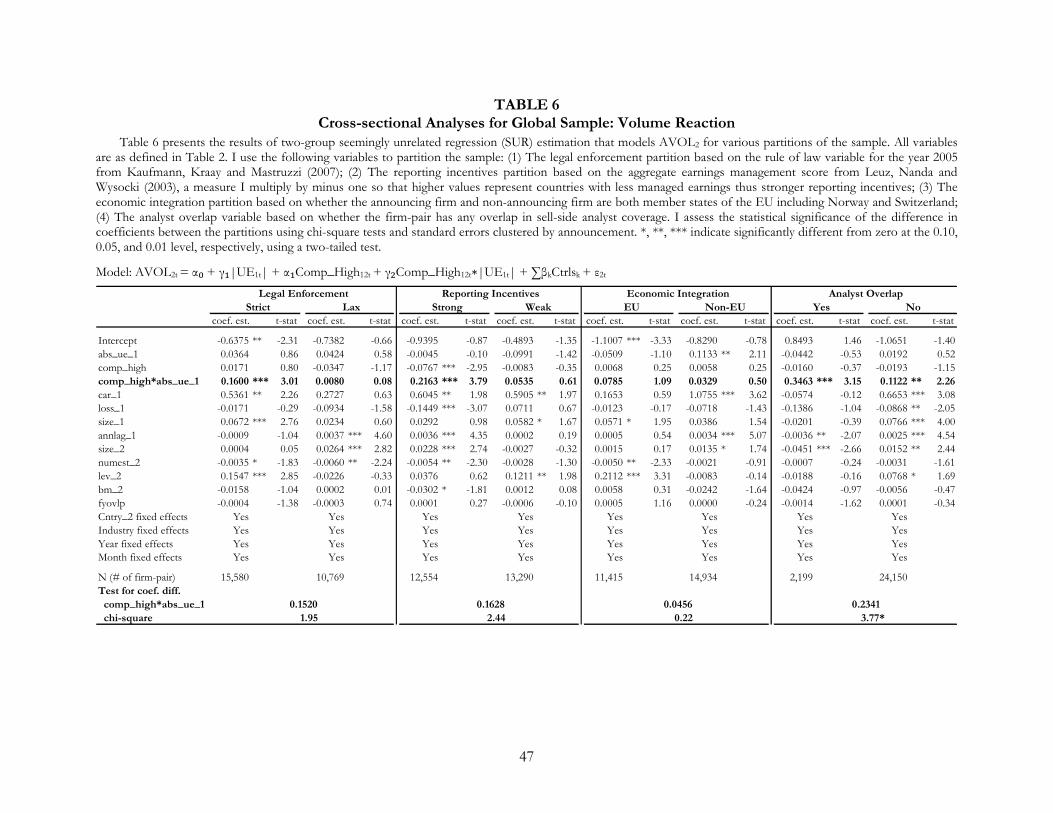
47
TABLE 6 Cross-sectional Analyses for Global Sample: Volume Reaction
Table 6 presents the results of two-group seemingly unrelated regression (SUR) estimation that models AVOL2 for various partitions of the sample. All variables are as defined in Table 2. I use the following variables to partition the sample: (1) The legal enforcement partition based on the rule of law variable for the year 2005 from Kaufmann, Kraay and Mastruzzi (2007); (2) The reporting incentives partition based on the aggregate earnings management score from Leuz, Nanda and Wysocki (2003), a measure I multiply by minus one so that higher values represent countries with less managed earnings thus stronger reporting incentives; (3) The economic integration partition based on whether the announcing firm and non-announcing firm are both member states of the EU including Norway and Switzerland; (4) The analyst overlap variable based on whether the firm-pair has any overlap in sell-side analyst coverage. I assess the statistical significance of the difference in coefficients between the partitions using chi-square tests and standard errors clustered by announcement. *, **, *** indicate significantly different from zero at the 0.10, 0.05, and 0.01 level, respectively, using a two-tailed test.
Model: AVOL2t = α₀ + γ₁|UE1t| + α₁Comp_High12t + γ₂Comp_High12t∗|UE1t| + ∑βkCtrlsk + ε2t
Legal Enforcement Reporting Incentives Economic Integration Analyst Overlap
Strict Lax Strong Weak EU Non-EU Yes No
coef. est. t-stat coef. est. t-stat coef. est. t-stat coef. est. t-stat coef. est. t-stat coef. est. t-stat coef. est. t-stat coef. est. t-stat
Intercept -0.6375 ** -2.31 -0.7382 -0.66 -0.9395 -0.87 -0.4893 -1.35 -1.1007 *** -3.33 -0.8290 -0.78 0.8493 1.46 -1.0651 -1.40
abs_ue_1 0.0364 0.86 0.0424 0.58 -0.0045 -0.10 -0.0991 -1.42 -0.0509 -1.10 0.1133 ** 2.11 -0.0442 -0.53 0.0192 0.52
comp_high 0.0171 0.80 -0.0347 -1.17 -0.0767 *** -2.95 -0.0083 -0.35 0.0068 0.25 0.0058 0.25 -0.0160 -0.37 -0.0193 -1.15
comp_high*abs_ue_1 0.1600 *** 3.01 0.0080 0.08 0.2163 *** 3.79 0.0535 0.61 0.0785 1.09 0.0329 0.50 0.3463 *** 3.15 0.1122 ** 2.26
car_1 0.5361 ** 2.26 0.2727 0.63 0.6045 ** 1.98 0.5905 ** 1.97 0.1653 0.59 1.0755 *** 3.62 -0.0574 -0.12 0.6653 *** 3.08
loss_1 -0.0171 -0.29 -0.0934 -1.58 -0.1449 *** -3.07 0.0711 0.67 -0.0123 -0.17 -0.0718 -1.43 -0.1386 -1.04 -0.0868 ** -2.05
size_1 0.0672 *** 2.76 0.0234 0.60 0.0292 0.98 0.0582 * 1.67 0.0571 * 1.95 0.0386 1.54 -0.0201 -0.39 0.0766 *** 4.00
annlag_1 -0.0009 -1.04 0.0037 *** 4.60 0.0036 *** 4.35 0.0002 0.19 0.0005 0.54 0.0034 *** 5.07 -0.0036 ** -2.07 0.0025 *** 4.54
size_2 0.0004 0.05 0.0264 *** 2.82 0.0228 *** 2.74 -0.0027 -0.32 0.0015 0.17 0.0135 * 1.74 -0.0451 *** -2.66 0.0152 ** 2.44
numest_2 -0.0035 * -1.83 -0.0060 ** -2.24 -0.0054 ** -2.30 -0.0028 -1.30 -0.0050 ** -2.33 -0.0021 -0.91 -0.0007 -0.24 -0.0031 -1.61
lev_2 0.1547 *** 2.85 -0.0226 -0.33 0.0376 0.62 0.1211 ** 1.98 0.2112 *** 3.31 -0.0083 -0.14 -0.0188 -0.16 0.0768 * 1.69
bm_2 -0.0158 -1.04 0.0002 0.01 -0.0302 * -1.81 0.0012 0.08 0.0058 0.31 -0.0242 -1.64 -0.0424 -0.97 -0.0056 -0.47
fyovlp -0.0004 -1.38 -0.0003 0.74 0.0001 0.27 -0.0006 -0.10 0.0005 1.16 0.0000 -0.24 -0.0014 -1.62 0.0001 -0.34
Cntry_2 fixed effects Yes Yes Yes Yes Yes Yes Yes Yes
Industry fixed effects Yes Yes Yes Yes Yes Yes Yes Yes
Year fixed effects Yes Yes Yes Yes Yes Yes Yes Yes
Month fixed effects Yes Yes Yes Yes Yes Yes Yes Yes
N (# of firm-pair) 15,580 10,769 12,554 13,290 11,415 14,934 2,199 24,150
Test for coef. diff.
comp_high*abs_ue_1 0.1520 0.1628 0.0456 0.2341
chi-square 1.95 2.44 0.22 3.77*

48
TABLE 7 Changes Analyses around the IFRS Mandate: Price Reaction
Table 7 presents the difference-in-differences analyses based on firm-pair observations from the treatment group (announcing firms are voluntary IFRS adopters and non-announcing firms are mandatory IFRS adopters) and the benchmark group (announcing firms are voluntary IFRS adopters and non-announcing firms are non-IFRS adopters) with data available both pre- and post-mandatory IFRS adoption. Panel A reports mean values of the dependent variable (CAR2) and the number of observations. I assess the statistical significance of the difference-in-differences values by comparing means of changes across the two groups using t-tests. Panel B reports γ, the information transfer ERC, for each group estimated jointly using seemingly unrelated regression (SUR) with all control variables described in the levels analyses. I assess the statistical significance of the difference in coefficients using chi-square tests and standard errors clustered by announcement. *, **, *** indicate significantly different from zero at the 0.10, 0.05, and 0.01 level (two-tailed), respectively.
Panel A: Univariate CAR2 Comparison
Panel B: SUR Estimation – γ Comparison Model: CAR2t = α + γUE1t + ∑βkCtrlsk + ε2t
2001 - 2004
Pre-Mandatory
Adoption
2005 - 2008
Post-Mandatory
Adoption Difference t-stat
(a) (b) (b) - (a)
(i) 0.0002 0.0036 0.0034 *** 5.05
n = 5,556 n = 6,766
(ii) 0.0006 0.0008 0.0002 0.23
n = 3,426 n = 5,249
Difference (i) - (ii) -0.0003 0.0028*** 0.0032 *** 3.82
t-stat -0.41 3.93
Firm1: Voluntary Adopters
Firm2: Mandatory Adopters
Firm1: Voluntary Adopters
Firm2: Non-Adopters
2001 - 2004
Pre-Mandatory
Adoption
2005 - 2008
Post-Mandatory
Adoption Difference chi-square
(a) (b) (b) - (a)
(i) -0.0019 0.0027 0.0046 * 3.11
n = 5,556 n = 6,766
(ii) 0.0015 -0.0036 -0.0051 2.59
n = 3,426 n = 5,249
Difference (i) - (ii) -0.0034 0.0063*** 0.0097 ** 5.59
chi-square 0.91 9.72
Firm1: Voluntary Adopters
Firm2: Mandatory Adopters
Firm1: Voluntary Adopters
Firm2: Non-Adopters
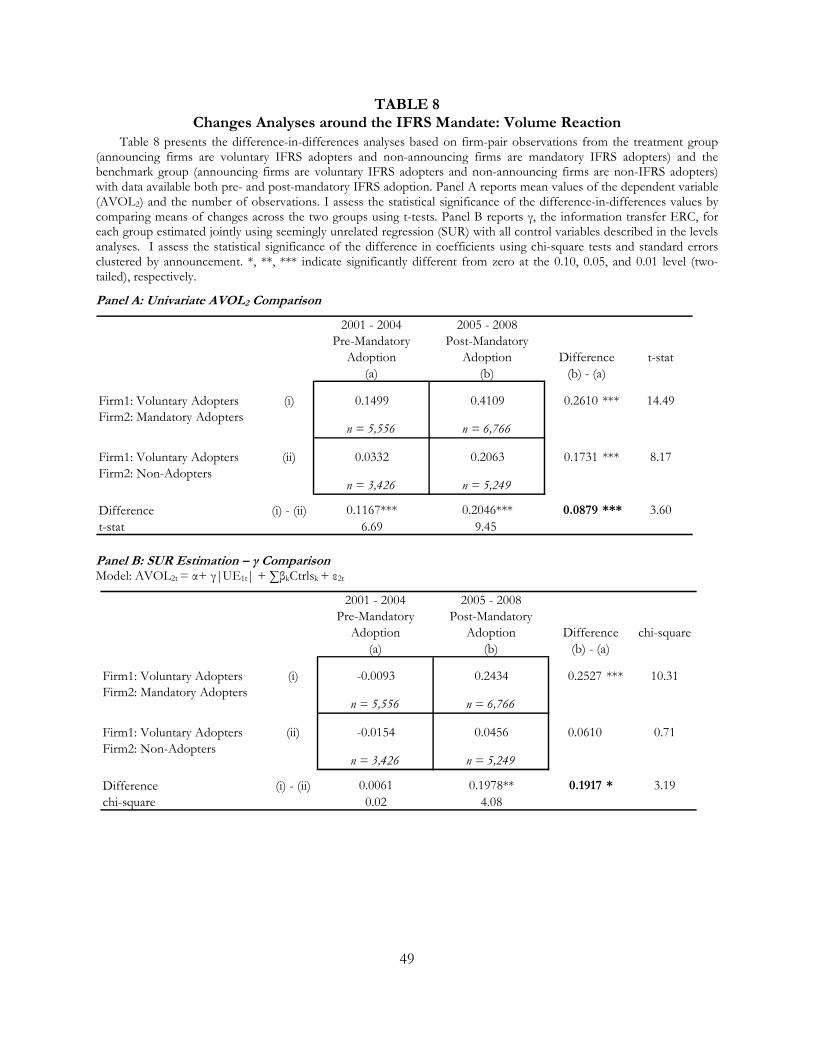
49
TABLE 8 Changes Analyses around the IFRS Mandate: Volume Reaction
Table 8 presents the difference-in-differences analyses based on firm-pair observations from the treatment group (announcing firms are voluntary IFRS adopters and non-announcing firms are mandatory IFRS adopters) and the benchmark group (announcing firms are voluntary IFRS adopters and non-announcing firms are non-IFRS adopters) with data available both pre- and post-mandatory IFRS adoption. Panel A reports mean values of the dependent variable (AVOL2) and the number of observations. I assess the statistical significance of the difference-in-differences values by comparing means of changes across the two groups using t-tests. Panel B reports γ, the information transfer ERC, for each group estimated jointly using seemingly unrelated regression (SUR) with all control variables described in the levels analyses. I assess the statistical significance of the difference in coefficients using chi-square tests and standard errors clustered by announcement. *, **, *** indicate significantly different from zero at the 0.10, 0.05, and 0.01 level (two-tailed), respectively.
Panel A: Univariate AVOL2 Comparison
Panel B: SUR Estimation – γ Comparison Model: AVOL2t = α+ γ|UE1t| + ∑βkCtrlsk + ε2t
2001 - 2004
Pre-Mandatory
Adoption
2005 - 2008
Post-Mandatory
Adoption Difference t-stat
(a) (b) (b) - (a)
(i) 0.1499 0.4109 0.2610 *** 14.49
n = 5,556 n = 6,766
(ii) 0.0332 0.2063 0.1731 *** 8.17
n = 3,426 n = 5,249
Difference (i) - (ii) 0.1167*** 0.2046*** 0.0879 *** 3.60
t-stat 6.69 9.45
Firm1: Voluntary Adopters
Firm2: Mandatory Adopters
Firm1: Voluntary Adopters
Firm2: Non-Adopters
2001 - 2004
Pre-Mandatory
Adoption
2005 - 2008
Post-Mandatory
Adoption Difference chi-square
(a) (b) (b) - (a)
(i) -0.0093 0.2434 0.2527 *** 10.31
n = 5,556 n = 6,766
(ii) -0.0154 0.0456 0.0610 0.71
n = 3,426 n = 5,249
Difference (i) - (ii) 0.0061 0.1978** 0.1917 * 3.19
chi-square 0.02 4.08
Firm1: Voluntary Adopters
Firm2: Mandatory Adopters
Firm1: Voluntary Adopters
Firm2: Non-Adopters

50
TABLE 9 Additional Analyses: Correlation in Unexpected Earnings
Table 9 presents the results of OLS regression to test the correlation of unexpected earnings between the firm-pairs for the levels analyses sample. UE_2 is the unexpected earnings for the non-announcing firm, calculated as actual earnings less the median analyst forecast scaled by the absolute value of the median analyst forecast measured at the announcing firm’s earnings announcement date. All other variables are as defined in Table 2. *, **, *** indicate significantly different from zero at the 0.10, 0.05, and 0.01 level, respectively, using a two-tailed test and standard errors clustered by announcement.
Model (1) and (2): UE2t = α₀ + γ₁UE1t + α₁Same12t + γ₂Same12t∗UE1t + ∑βkCtrlsk + ε2t
Model (3) and (4): UE2t = α₀ + γ₁UE1t + α₁Comp_High12t + γ₂Comp_High12t∗UE1t + ∑βkCtrlsk + ε2t
Domestic Transnational
Pred. Benchmark Benchmark Model 1 Model 2 Model 3 Model 4
coef. est. t-stat coef. est. t-stat coef. est. t-stat coef. est. t-stat coef. est. t-stat coef. est. t-stat
Intercept -0.9735 ** -1.97 -0.5826 -3.98 -0.3526 -3.31 -0.5401 -3.74 -0.3714 -3.37 -0.5524 -3.72
ue_1 0.0197 ** 2.40 0.1767 3.02 0.1507 2.66 0.1467 2.54 -0.0130 -0.56 -0.0217 * -0.93
same -0.0583 *** -1.87 -0.0922 *** -2.87
same*ue_1 + 0.3067 ** 2.43 0.3144 ** 2.53
comp_high 0.1574 1.73 0.1531 1.64
comp_high*ue_1 + 0.0423 0.36 0.0454 0.38
corr + 0.3938 ** 2.09 0.6155 *** 5.90 0.6566 *** 6.16 0.6202 *** 5.91
fyovlp + 0.0020 1.19 0.0001 0.37 0.0001 0.41 0.0001 * 0.33
anaovlp + 0.0151 *** 3.40 0.0028 1.06 0.0027 0.99 0.0029 1.07
Cntry_2 fixed effects Yes Yes Yes Yes Yes Yes
Industry fixed effects Yes Yes Yes Yes Yes Yes
Year fixed effects Yes Yes Yes Yes Yes Yes
Month fixed effects Yes Yes Yes Yes Yes Yes
Adjusted R-squared 0.0459 0.0644 0.0626 0.0645 0.0628 0.0648
N (# of firm-pair) 4,455 26,349 26,349 26,349 26,349 26,349