Embed Size (px)
Citation preview

Accurate Multiplex Polony Sequencing of an Evolved Bacterial Genome
Jay Shendure, Gregory J. Porreca, Nikos B. Reppas, Xiaoxia Lin, John P. McCutcheon.
Abraham M. Rosenbaum, Michael D. Wang, Kun Zhang, Robi D. Mitra, George M. Church
Science 2005 vol 309, pg 1728-32

Authors- BA 1973: Duke University- PhD 1984 :Harvard University- Professor of Genetics at Harvard Medical School- Director of the Harvard/MIT DOE Genomes-to-Life Center- Director of the Harvard/MIT/WashU NHGRI CEGSGeorge M. Church
Jay Shendure - MD-PhD Student in the Church Lab

Background - Sanger Sequencing
• Developed By Fredrick Sanger
• Uses ddNTPs to block DNA synthesis
• DNA fragments run in gel and analyzed

Sequence analysis - Then
• Use radioactively labeled dNTPs
• Run samples in four columns
• Expose your film• Manually determine
sequence
www.carnegieinstitution.org

Sequence analysis - Now
• Use fluorescently labeled ddNTPs
• Run samples together in a capillary
• Fluorescence detected with a laser
• Computer determines sequence
www.jgi.doe.gov

The Problem
• Electrophoretic methods may very well be reaching their limits
• New sequencing method need to be developed if we are to achieve the goal of the $1000 genome

The Problem
• Electrophoretic methods may very well be reaching their limits
• New sequencing method need to be developed if we are to achieve the goal of the $1000 genome
• The Solution: Use a cyclic array method

Step One: Generate DNA Fragments
Fig. 1a
• Genomic DNA is sheared into ~1kb fragments (purified from a gel)
• Circularized using an “universal linker” containing Mme1 cut sites
• Rolling circle amplification
• Mme1 is a downstream cutter, digestion results in 17-18 bps genomic DNA tags flanking the linker
• Universal sequences are then ligated to the 5’ and 3’ ends of the fragment

Step Two: Emulsion PCR
Fig. 1b
• Critically dilute DNA into PCR mix containing 1µm paramagnetic beads containing one of the PCR primers
• Make water-oil emulsion, creates mini reaction chambers containing 1 bead and single DNA fragment
• PCR reactions will result in each bead being coated in a single fragment

Step Three: Enrichment & Monolayering
Fig. 1c
• Non-magnetic, low density “capture” beads allow for enrichment of amplified fraction of PCR beads via centrifugation
• Beads are then immobilized and mounted for automated sequencing

Step Four: Cycles of Sequencing and Imaging
Fig. 1d
• Sequencing is done in automated cycles
• Computer algorithm identifies each bead and determines which color it is fluorescing each round

How Sequencing Works
• Beads are incubated with one of four anchor primers flanking the genomic DNA tags
• Excess primer is washed away
Supplementary Fig. 7a+b

How Sequencing Works
• Next a mixture of degenerate nonamers are ligated to the anchor primer
• Each is specific only at one position the “query position” and is labeled with a different fluorphore
• Excess nonamers are washed away
Supplementary Fig. 7a+b
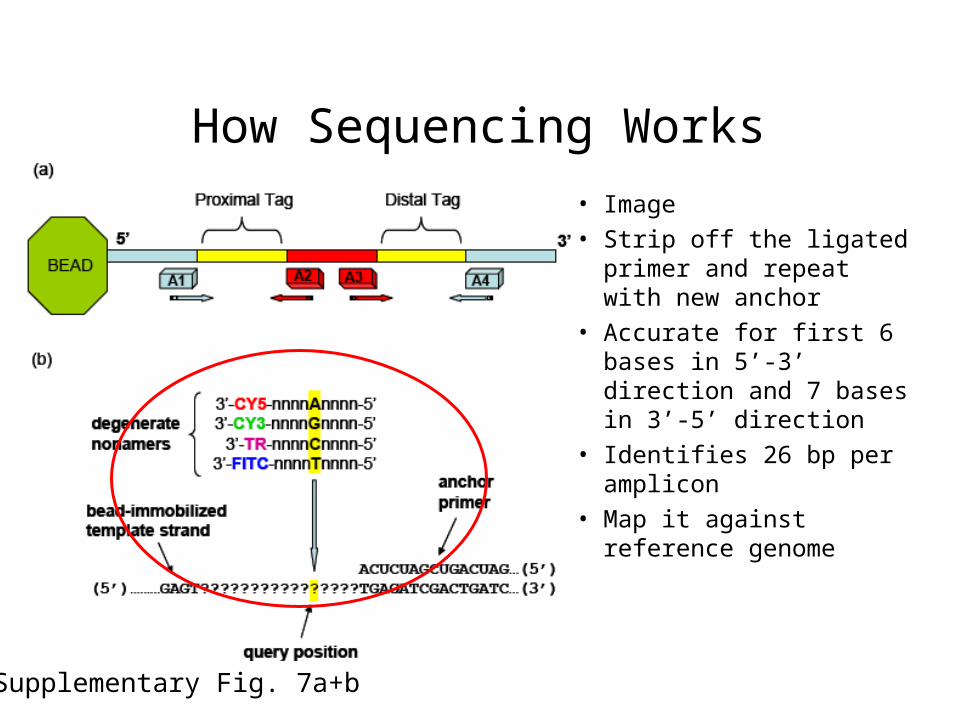
How Sequencing Works
• Image
• Strip off the ligated primer and repeat with new anchor
• Accurate for first 6 bases in 5’-3’ direction and 7 bases in 3’-5’ direction
• Identifies 26 bp per amplicon
• Map it against reference genome
Supplementary Fig. 7a+b
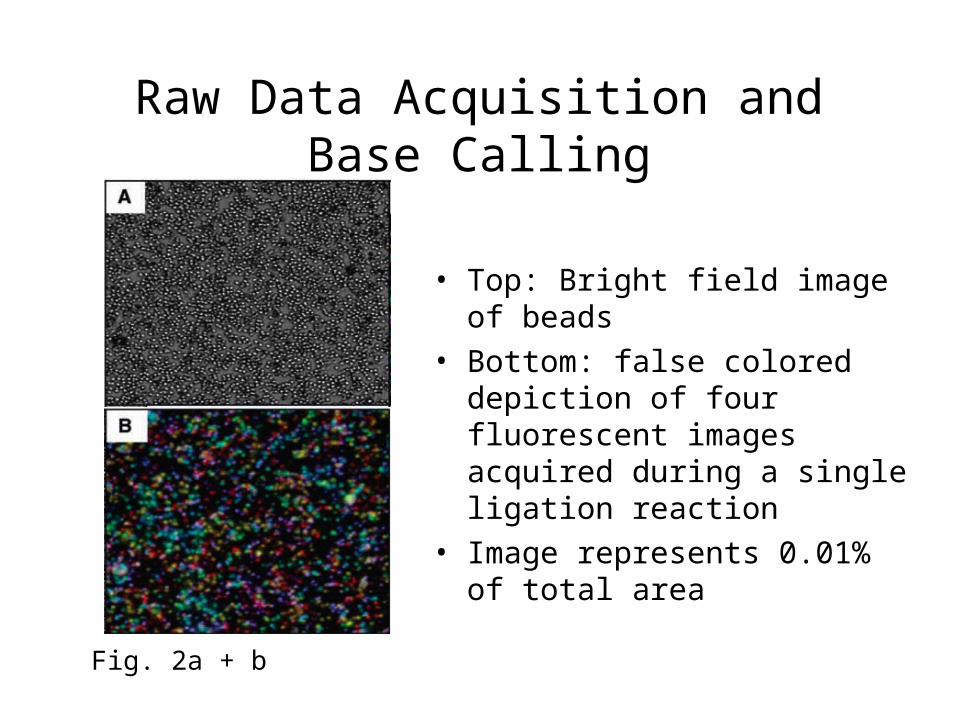
Raw Data Acquisition and Base Calling
Fig. 2a + b
• Top: Bright field image of beads
• Bottom: false colored depiction of four fluorescent images acquired during a single ligation reaction
• Image represents 0.01% of total area

Raw Data Acquisition and Base Calling
Fig. 2c
• Tetrahedral representation of the data obtained from a single image cycle
• Data points clustered around the 4 potential base calls for a single position on the amplicon

Results
Table 1
• ~1.16 million of 1.6 million reads were accurately mapped to reference genome
• ~30.1 million bases of resequencing data with raw accuracy of 99.7%
• 91.4% of genome covered

Results
Table 1• 100 random single nucleotide changes (SNC) were added to the
reference sequence
• Data represents 2 independent sets of SNC
• Were able to identify all the SNC present in the dataset when there was at least 2x coverage
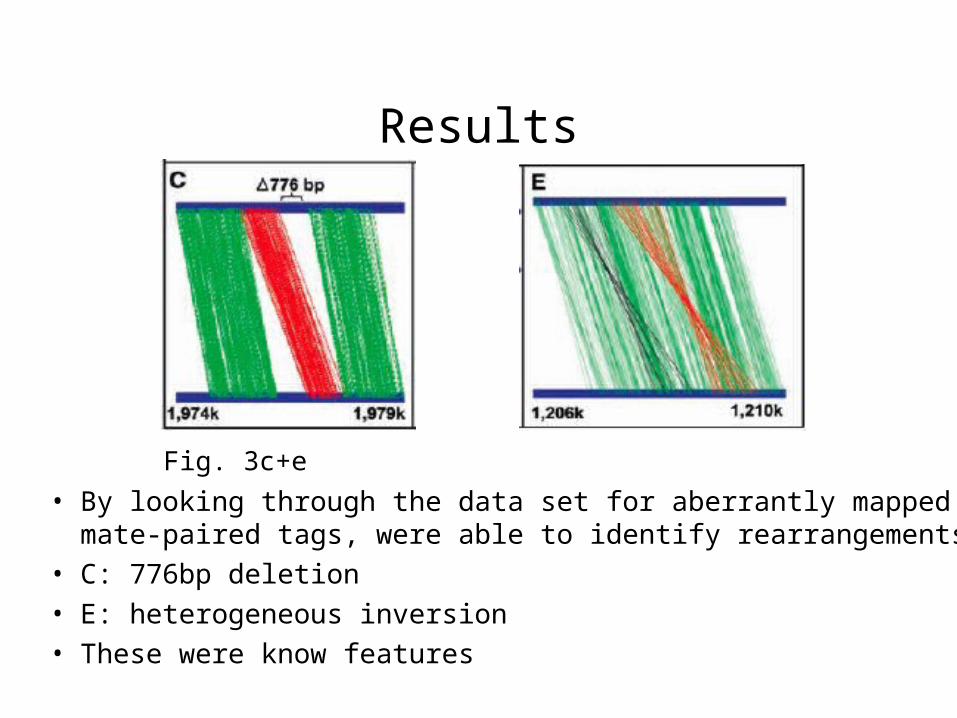
Results
• By looking through the data set for aberrantly mapped mate-paired tags, were able to identify rearrangements
• C: 776bp deletion • E: heterogeneous inversion • These were know features
Fig. 3c+e

Results
• Detected 3 novel polymorphisms in the evolved strain
• These were confirmed by Sanger sequencing
Table 2

Conclusions
• Current high-throughput centers sequence at a rate of 20 bases per instrument second and at a cost of $1.00 per kb
• This method has an overall sequence rate of ~140 bp/s and a cost of $0.08 per kb, in house enzyme production could drop this number even lower
• Open source technology.
• Reasonably cheap to set up equipment ~ $140,000

![Functional characterization of enhancer evolution in the ...shendure-web.gs.washington.edu/documents/klein_genbio...MOCO v9 motif database [32]usingFIMO[33]and identified an enrichment](https://img.pdfslide.net/doc/110x75/60c414ccc9bd9547075ccc8b/functional-characterization-of-enhancer-evolution-in-the-shendure-webgs-.jpg)