Embed Size (px)
Citation preview

1
ACE MDC project approaches to understanding pathway cost
Context:
As part of Wave 2 of the ACE Programme, five projects across England tested the viability of the
Multidisciplinary Diagnostic Centre (MDC) model as an approach to improving outcomes for patients
presenting with non-specific but concerning symptoms. Programme learning is now contributing to
the development of Rapid Diagnostic Centres (RDC) in England, with national guidance anticipated in
the coming months.
The ACE programme’s formal evaluation of the MDC concept has demonstrated that a non-site-
specific symptom-based referral pathway has value as an approach for diagnosing cancer, with a
cancer conversion rate of 8% recorded at programme level. Importantly, as shown in the recently
published MDC summary report, the MDC’s value can be evidenced across a range of interrelated
pathway elements, with examples including:
Although some elements, such as the impact on patient outcomes, will require longer-term
evaluation, the pathway clearly offers benefit across several areas; it is therefore appropriate to take
a broad view of the MDC when assessing its value as a model.
However, to date, evaluation of the MDC model omits one important aspect; that of pathway cost and
the overall cost effectiveness of the intervention. An understanding of cost plays a central part in
developing, implementing and sustaining an effective care pathway, but assessing the cost
effectiveness of the MDC at a programme level has presented a significant and ongoing challenge.
This article addresses the challenges associated with achieving a full and rigorous evaluation of MDC
cost effectiveness, before describing some of the practical approaches employed at a project level to
understand pathway cost. Additionally, comparator data already collated as part of the ACE
programme may also be informative and helpful in supporting local planning assumptions regarding
pathway development.
This is the third in a series of ACE articles which aim to provide accessible real-world solutions for
those considering the implementation of similar pathways in their areas.

2
The challenge to conducting an economic evaluation
To assess the cost effectiveness of a healthcare intervention, it is necessary to understand what would
have happened in its absence; ideally, within the same set of circumstances and timeframe. In the
case of an economic evaluation, this assessment allows a judgement to be made on the cost and
benefit of an approach when compared to ‘usual care’, and whether the change represents an
improvement. To capture the full cost of the MDC intervention, this analysis would include activity
during the MDC, its wider impact on patient outcomes, and any subsequent contact with healthcare
services.
Cost effectiveness analysis of referral pathways for diagnosing symptomatic cancer is under-
researched1 and an ACE Programme review conducted in 2018 found no available studies on the cost
effectiveness of comparable pathway models, including those relating to the Danish Diagnostic
Centres. This scarcity of research arguably reflects the difficulty in developing a sufficiently robust
comparator cohort for this pathway, as has been the case with the economic evaluation of the MDC
model. This is largely associated with the MDC approach being unique in several ways, including its:
• focus on patients with non-specific symptoms: collecting data on comparable, historic case
records is challenging and, in some cases, impossible due to difficulties in identifying
appropriate patients and tracking them across separate care pathways;
• inclusion of cancer and non-cancer diagnoses: as the MDC includes a broad range of clinical
diagnoses, including a potentially diverse range of malignant and benign diseases, identifying
appropriate ‘usual care’ comparators is complicated;
• patient-led diagnostic decision-making: as every patient’s diagnostic route is tailored to meet
individual need, identifying a suitable comparator amongst more defined, process-led
pathways is challenging;
• differing approaches across pilot pathways: whilst pathway variation was a deliberate
element of the model’s evaluation and should be seen as a positive aspect of the MDC, subtle
differences in approach within the ACE Programme have added an additional element of
complexity.
Although it is possible to build viable comparators for some of these pathway elements in isolation,
achieving a complete, fully representative comparator for the pathway continues to be problematic.
Example 1 below provides details of the challenge of building a national comparator.
Example 1: Work was undertaken by the ACE Programme to describe the existing diagnostic experience for
patients presenting with non-specific symptoms by assessing records from the National Cancer Diagnosis Audit
(NCDA, 2014). A presentation of these analyses is available from: https://encr.eu/sites/default/files/2018-ENCR-
Conference/Clare%20Pearson_NCDA_ENCR_final.pdf
The resulting analyses provide important national context for MDCs and present a compelling case for change
by highlighting the disparity in the diagnostic pathway between patients with non-specific symptoms and those
with ‘alarm’ symptoms of a particular cancer. This work is intended to be the subject of a future research paper.
However, as the data relates to cancer cases only and uses data from a different time period (2014 diagnoses
only), the dataset is of limited value as a MDC comparator because it provides an incomplete picture of pathway
activity and is therefore insufficient to support a full economic evaluation.
1 Hamilton W, Walter FM, Rubin G, Neal RD. Improving early diagnosis of symptomatic cancer. Nature Reviews Vol 13, 2016 pp.740-9.

3
Building a viable MDC comparator at project-level
Projects were required to develop local comparator datasets as part of their work to support the
development of a thorough comparator for programme evaluation. A stepped wedge approach was
chosen by programme evaluators, which required a percentage of a project’s local primary care
practices to collect sample records (of theoretically eligible patients) for several months prior to a
staggered MDC implementation. Full implementation would be phased across an area, therefore
producing both comparator and operational data for analysis.
However, in practice, all five MDC projects found this approach to be too difficult to implement
successfully; this was often due to:
• insufficient resource within primary care to prioritise and/or complete sample records for
patients subsequently accessing different care pathways; and
• ethical concerns about creating unwanted variation in patient access to local care, despite
their eligibility for referral (i.e. temporarily introducing a postcode lottery)
Consequently, retrospective clinical audit (based on case notes or primary care data extraction) was
adopted as the default approach. This activity centred on the identification of patients whose referral
records contained reference to a pre-determined set of non-specific symptoms, thereby creating
project-specific comparator records:

4
Variable quality and completeness, and differing audit timeframes within the projects’ collated data,
have limited its use as a programme-level comparator. However, project comparator data is still
informative and may be helpful to support general assumptions regarding cost and impact, as part of
pathway planning and development at a local level. A complete summary of the MDC comparator data
is attached as Appendix A.
Example 2 provides details of the potential insights provided by partial MDC comparator data.
Example 2: When focusing exclusively on cancer diagnoses, a comparison between Airedale’s comparator
cohort and its MDC data indicates the following similarities and distinctions:
Description Comparator cohort MDC cohort
Cancer cases 61 cases 25 cases
Patient median age 70 years 72 years
Comorbidities at referral 61% (mild) 12% (moderate / severe)
57% (mild) 12% (moderate / severe)
% GP referral 64% 92%
% emergency presentation 23% 7%
Number of diagnostic tests by date of clinical diagnosis (average)
1.7 tests per patient 1.5 tests per patient
% CT scan (any type) as 1st main imaging in MDC
65% 96%
Referral to 1st seen (GP cases only) 7 days (median) 3 days (median)
Referral to diagnosis communicated to patient (GP cases only)
22 days (median) 17 days (median)
Although data limitations must be acknowledged, and the data is specific to the Airedale approach only, the
above comparison suggests that the introduction of the MDC has a positive impact on several operational factors
amongst a patient cohort with similar characteristics. Importantly, these are seen across several aspects of the
pathway, including:
- an increase in planned GP referral;
- a reduction in emergency presentation;
- a reduction in the average number of diagnostic tests undertaken; and
- a reduction in pathway interval times.
Potential approaches to estimating cost:
In all instances, it is necessary to consider pathway scale and anticipated volumes, as these factors
influence any attempts to calculate cost. This is another challenging aspect of the evaluation, as many
factors can complicate these calculations, including the difficulties in estimating the prevalence of
non-specific symptoms within a given population, and varying levels of pathway awareness and
referral activity within primary care communities (both nationally and within local populations).

5
Attempts at programme-level to estimate referral rates for the MDC projects have been complicated
by these variables but also by distinctions regarding differing project approaches and launch dates.
Consequently, there are too many local permutations to enable the calculation of a robust,
standardised referral rate to apply to a generalised population.
However, projects have been considering impact and cost at a local level and, although each project
has addressed the subject differently, a number of approaches can be detected. By applying one or
more of these methods creatively, projects have been able to provide information in support of local
business planning and long-term pathway sustainability.
Therefore, in the absence of comprehensive guidance on these areas, it may be more practical to
consider a scenario-based approach to estimating cost; local assumptions can then be tested and
reviewed during the implementation and establishment of these pathways and through their ongoing
interaction with other services.
1. Cost avoidance / improved pathway efficiency
Cost avoidance has been used by some projects as the basis for exploring and estimating MDC cost
benefit, as it is reasonable to expect that the introduction of the MDC pathway will impact upon
several aspects of patient care, each with quantifiable effects. This scenario-based approach has
already been demonstrated in the earlier example regarding Airedale.
For example, the NCDA data show that patients with non-specific symptoms often have more primary
care consultations than those with alarm symptoms (3+ consultations; 21% vs 32% ‘vague’) and are
more often diagnosed via emergency presentation (16% vs 34% ‘vague’). Therefore, the introduction
of a planned pathway for rapidly addressing clinical concern should have a tangible impact on non-
elective activity, so it is reasonable to expect a reduction in this area.
Similarly, positive impacts may also be demonstrated in the number of primary care consultations
prior to referral, which have been shown to be higher amongst this patient group in the NCDA
analyses.
Example 3 below provides details of a similar approach used by the London MDC project.
2. Direct pathway comparison
In addition to using the ACE evaluation findings and the NCDA data, projects have conducted local
audits to corroborate the data at a local level. In many cases, these audits have focused on specific
referral pathways for tumour groups associated with a high proportion of MDC diagnoses (e.g. Upper
GI; Lower GI cancers).
It is important to acknowledge that focusing on individual site-specific referral routes will
underrepresent MDC activity and potential impact, as any modelling would also need to account for
the broad range of cancer and non-cancer conditions detected. Indeed, this is one of the benefits of
the MDC approach. A focused pathway comparison would, however, provide a solid starting point for
cost modelling and would enable planning assumptions to be based on local activity. It would also
reflect overall pathway activity, including patients with non-cancer diagnoses and ‘all clear’ results.
By conducting a direct pathway comparison and reviewing this information in conjunction with ACE /
NCDA counterpoints, local areas may be able to form initial judgments regarding MDC impact on
patient activity, diagnostic testing and, ultimately, on cost benefit versus ‘usual care’.

6
Although the overall approach may be the same, MDC projects have employed different mechanisms
to achieve such a comparison. For example,
• Leeds MDC have used Patient Level Information & Costing System (PLICS) data to compare
MDC activity with that of existing Upper and Lower GI pathways. By looking at several pathway
elements, including ward time, telephone consultation, use of diagnostics, and MDT activity
required to support the system, Leeds have been able to cost individual elements of the
pathway, demonstrating reductions in usage and cost in several areas including diagnostic
resources and overnight admissions.
• London and Greater Manchester MDCs audited the referral records of patients with non-
specific symptoms within specified 2WW referral pathways (Upper/Lower GI and
Gastroenterology respectively), before using this information to form comparative
judgements.
Example 3 – London MDC: NCDA and local audit data
By using the ACE NCDA data analyses and corroborating it with their own audit of local Upper & Lower GI
pathways, London MDC have been able to quantify the impact of the MDC upon a range of service areas.
• The proportion of patients referred onto Upper & Lower GI pathways with non-specific symptoms was
calculated at an average of 19% during their 3-month audit period (ranging between 19-29%); NCDA data
indicated that similar proportions (28%) of patients with non-specific symptoms were diagnosed via 2 Week
Wait (2WW) pathways. Therefore, business planning assumed that a comparable reduction within these
tumour-specific referral pathways would be seen, as patients would be referred into the new MDC pathway
instead. A subsequent reduction on 2WW capacity, and an increase in associated 2WW conversion rates
was also anticipated.
• A similar assumption was made regarding rates of emergency presentation; NCDA analyses suggest that
approximately one third (33%) of patients with non-specific symptoms are diagnosed via this route, so the
MDC’s would trigger a reduced level of activity in this area. Benefits for the patient and a potential reduction
in costs associated with non-elective care tariffs were expected.
• An operational cost was calculated for London’s MDC service, with a ‘per patient’ cost achieved by
comparing the overall service cost against the projected annual number of referrals for this service.
o The referral volume was modelled on monthly referrals into the MDC, an inferred rate based on
activity during the pathway audit, and an annual referral rate scenario (low/medium/high)
informed by historic CCG suspected cancer referral trends*
o The total operational cost was calculated by applying NHS standard tariff costs to staffing and
diagnostics, before factoring in the anticipated annual referral volume**.
By incorporating these elements of potential MDC impact, and comparing it to ‘usual care’, London MDC were
also able to model scenarios relating to total avoidable cost, both for the audit data they collated and for an
extrapolated annual figure for the area.
*Advice on estimating demand and capacity volumes will be addressed as part of future national guidance.
**Further information on workforce and pathway configuration (for all MDC projects) is available in the ACE
Wave 2 Qualitative Evaluation. Information relating to MDC diagnostic testing will be the subject of a future
research paper, in addition to featuring in future national guidance.
7
Conclusions:
Further analyses regarding diagnostic activity and impact within the MDC are planned for the coming
months, with the intention of future peer review publication. This will provide additional detail
regarding reported levels of MDC diagnostic testing and will also be of value to understanding likely
costs associated with operating a MDC model, especially when combined with existing data on staffing
configuration and the pathway’s potential impact on aspects of the wider healthcare system.
In the interim, the options described in this article have been utilised by pilot projects to estimate cost
and benefit, and similar scenario-based approaches may support the development of workable,
assumptive planning.
Dave Chapman
ACE Programme Lead (MDC)
July 2019
The ACE Programme: working collaboratively to support innovation in cancer services
Programme management
supported by Cancer Research UK
1
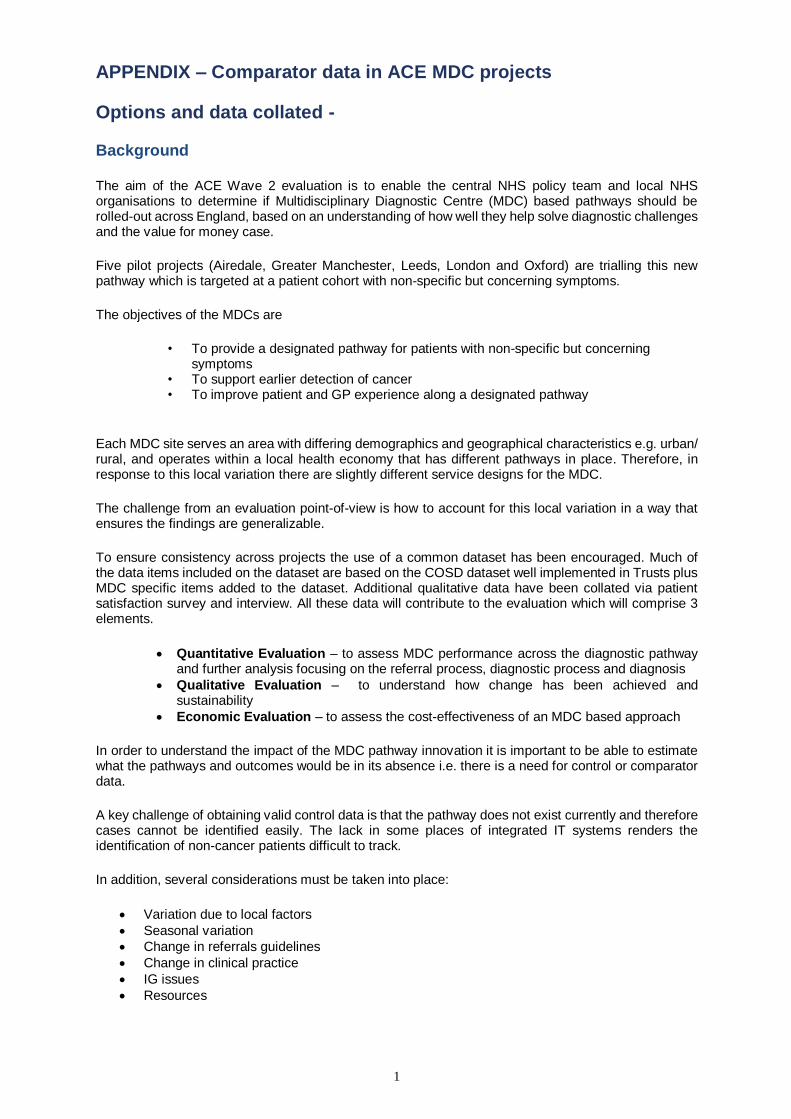
APPENDIX – Comparator data in ACE MDC projects
Options and data collated -
Background
The aim of the ACE Wave 2 evaluation is to enable the central NHS policy team and local NHS organisations to determine if Multidisciplinary Diagnostic Centre (MDC) based pathways should be rolled-out across England, based on an understanding of how well they help solve diagnostic challenges and the value for money case.
Five pilot projects (Airedale, Greater Manchester, Leeds, London and Oxford) are trialling this new pathway which is targeted at a patient cohort with non-specific but concerning symptoms.
The objectives of the MDCs are
• To provide a designated pathway for patients with non-specific but concerning symptoms
• To support earlier detection of cancer • To improve patient and GP experience along a designated pathway
Each MDC site serves an area with differing demographics and geographical characteristics e.g. urban/ rural, and operates within a local health economy that has different pathways in place. Therefore, in response to this local variation there are slightly different service designs for the MDC.
The challenge from an evaluation point-of-view is how to account for this local variation in a way that ensures the findings are generalizable.
To ensure consistency across projects the use of a common dataset has been encouraged. Much of the data items included on the dataset are based on the COSD dataset well implemented in Trusts plus MDC specific items added to the dataset. Additional qualitative data have been collated via patient satisfaction survey and interview. All these data will contribute to the evaluation which will comprise 3 elements.
• Quantitative Evaluation – to assess MDC performance across the diagnostic pathway and further analysis focusing on the referral process, diagnostic process and diagnosis
• Qualitative Evaluation – to understand how change has been achieved and sustainability
• Economic Evaluation – to assess the cost-effectiveness of an MDC based approach
In order to understand the impact of the MDC pathway innovation it is important to be able to estimate what the pathways and outcomes would be in its absence i.e. there is a need for control or comparator data.
A key challenge of obtaining valid control data is that the pathway does not exist currently and therefore cases cannot be identified easily. The lack in some places of integrated IT systems renders the identification of non-cancer patients difficult to track.
In addition, several considerations must be taken into place:
• Variation due to local factors
• Seasonal variation
• Change in referrals guidelines
• Change in clinical practice
• IG issues
• Resources

2
Options considered to collate comparator data
The following methods were considered to minimise confounding factors whilst considering the practicalities of collecting suitable data. Each of the approaches has advantages and disadvantages.
Run-in period
Description
The use of a ‘run-in period’ prior to the MDC going live in which patients who would be eligible for the service are identified, and follow the usual care pathway. Outcomes are compared between these patients and those presenting after the introduction of the multidisciplinary pathway. This represents a time-series study (historical controls) which allows comparison before and after the new service but does not consider confounding factors that may occur over time e.g. change in diagnostic capacity.
This approach requires GPs to identify patients that present with vague symptoms and bespoke data collection to track patients.
Advantage
Allows full-set of benchmarking data against which to assess pathway performance.
Disadvantages
Delays the ‘go live’ date of the MDC pathway as data are collected over a suitable period (e.g. 3 months) prior to its commencement.
Approach does not correct for extraneous confounding factors e.g. changes in diagnostic capacity that may change over time.
Information governance/ethics approvals may need to be addressed.
It requires gaining agreement for GPs to collect data on patients prior to implementation of MDC.
Audit
Description
Baseline comparator data can be obtained by auditing retrospectively patients who were referred to the Trust with suspected cancer. Patients that initially presented with vague symptoms could be identified and their referral and diagnostic pathway reviewed.
Advantages
Provides some benchmarking data against which to assess pathway performance.
Disadvantages
Previously recorded data for the controls are likely to be inferior and missing some information.
May not be possible to identify patients whom presented with serious but concerning symptoms.
Approach does not correct for extraneous confounding factors e.g. changes in diagnostic capacity that may change over time.
Information governance issues need to be addressed.
Significant time/resource to conduct audit.

3
Stepped wedge design
Description
The stepped wedge design can be viewed as the ‘gold standard’ approach as it corrects for time and population confounders. In the current context where pilot sites plan to introduce several areas to the MDC, this can be done in series, with each sub-area collecting baseline run-in data before the introduction of the MDC pathway. This design gives the opportunity for robust comparisons with the potential to take account of confounding factors.
Advantages
Allows full-set of benchmarking data to be collected whilst correcting for time and population cofounders.
Disadvantages
Delays the ‘go live’ date of the MDC pathway as data are collected over a suitable period (e.g. 3 months) prior to its commencement.
Information governance/ethics approvals may need to be addressed.
It requires gaining agreement for GPs to collect data on patients prior to implementation of MDC.
Performance measures
Description
Recognising the challenges of identifying suitable control/comparator data, an alternative approach is to set minimum performance metrics against which MDCs are assessed. Performance criteria could be set to assess the efficiency and effectiveness of the overall pathway in terms of process and outcome measures e.g. threshold conversion and detection rates and time to diagnosis.
Advantages
Provides a means to assess the performance of all cancer pathways. Enables comparisons to be made with other/future pathways.
Disadvantages
Does not allow direct comparison outcomes under the current system.
It may be difficult to get different Trusts to acknowledge the criteria as valid.
Comparators by MDC pilot sites
While many sites considered a few options to collate comparator data including a stepped wedge design, they resorted to conduct clinical audit as a backup. The stepped wedge design proved difficult to implement.
The following section reports on the main findings of each pilots including key findings.

4
Airedale
Methodology
• The records of patients diagnosed with cancer across 2 week-wait (SCR), A&E, Clinical Upgrade, dental practice and non-fast track breast covering all pathways were retained.
• Data (Dec 2015 to Sept 2016) were extracted from the hospital system (PPM (precision practice management) and SystemOne) but a very small number of notes might have been requested if the systems were not clear.
Results Cohort details 61 records were retained for analysis, 37 males and 24 females, with an age range of 19-90 and median age of 70 years old. Figure 1: Age distribution
Performance, comorbidity and symptoms
Their performance record was reported as 1 ‘restricted in physically strenuous activity, but able to walk’ in 37% of cases. As 2 ‘Able to walk and capable of all self-care, but unable to carry out any work. Up and about more than 50% of waking hours’ in 26% of cases and 23% of cases had a worst performance recorded with score of 3 and 4.
The majority 61% presented with mild comorbidity and 12% had moderate or severe comorbidity with hypertension, asthma and COPD being the top three main comorbidities reported. Diabetes, Osteoarthritis, Transient ischaemic attack, Previous cancers were also reported. The main reported symptoms were weight loss (66%), abdominal pain (38%) and nausea/appetite loss (36%). 31% cases experienced these symptoms for more than 3 months prior to referral. Reported weight loss length was only available in 23 cases and of these 56% had experienced weight loss for more than 3 months. Referral routes 39 cases were referred by GPs, while 14 were emergency presentations and 8 were secondary care referrals. Diagnostic test Considering all diagnostic tests given as part of the diagnostic pathway, the most common was CT with 67 occurrences, 23 endoscopies and 14 chest X-rays, 29 other diagnostic tests were used. Patients had an average of 2.35 diagnostic tests (N:61). Outcomes
0
5
10
15
20
25
0-49 50-59 60-69 70-79 80-89 90+
Nu
mb
er o
f ca
ses
Age band
Age band distribution

5
Table 1: Broad cancer types
Broad cancer types N
Upper GI 20
Lung 19
Lower GI 8
Urology 5
Haematology 4
Other -include CUP 4
Skin 1
Total 61
Stage 12 (20%) were early stage and 47 (80%) were late stage, 2 were not staged. Treatment Table 2; Treatment by broad cancer types
Broad cancer type
Surgery Teletherapy Chemotherapy Specialist palliative
care
Active monitoring
Best supportive
care Total
Upper GI 3 4 7 1 5 20
Lung 1 8 6 1 3 19
Lower GI 1 4 1 2 8
Urology 3 2 5
Haematology 4 4
Secondary 3 1 4
Skin 1 1
Total 7 1 25 15 2 11 61
Table 3: Treatment by stage
Stage Surgery Teletherapy Chemotherapy Specialist palliative
care
Active monitoring
Best supportive
care Total
1 3 2 3 8
2 1 1 1 1 4
3 3 8 1 1 13
4 1 15 12 1 5 34
No stage 1 1 2
Total 7 1 25 15 2 11 61
Interval times Table 4: Interval times (Median)
Interval time (Median) (days) (range) (N)
Referral route Referral to date first seen Referral to first diagnostic
test* Referral to diagnosis
communicated to patient
GP referral 7 (0-35) (N:39) 8 (0-47) (N:33) 22 (2-56) (N:39)
Secondary referral
2 (0-12) (N:8) 4 (0-19) (N:5) 15.5 (0-33) (N:8)
Emergency 0 (0-28) (N:13) 1 (0-7) (N:13) 8 (0-20) (N:13)
*In 8 of the cases the diagnostic tests were done prior to the referral, they were mainly CT and one colonoscopy.

6
Key points
• Details of the cohort performance, symptoms, outcomes are reflective of those expected within a cohort of patients with non-specific but concerning symptoms and therefore add to the evidence related these patients.
• The cases recording are all cancer cases and therefore do not allow overall assessment of the MDC pathway however their referrals via 3 routes and differences in the interval times highlight the variations in referrals for patient with non-specific but concerning symptoms in the absence of a clear pathway.
• Treatments results are broadly in line with the type of cancers and stages reported.
• Despite the relatively fast interval time reported, only 20% of patients present at early stage highlight possibly the nature of the disease or delays prior to presentation 21 cases are either emergency presentations or secondary referrals.
Greater Manchester Methodology
• The records of patients referred initially as tumour specific 2 week-wait (SCR) referrals across specialties were retained.
• Data (Apr 2016 to Sept 2016 (Wythenshawe Hospital) and Mar 2016 to July 2016 (Royal Oldham Hospital)) were extracted from notes and hospital referral systems were reviewed.
Results
Oldham
Cohort details 43 records were retained for analysis, 14 males and 29 females, with an age range of 21-88 and median age of 69 years old. Figure 3: Age distribution
Performance, comorbidity, and symptoms
Data on performance and comorbidity were not available. The main reported symptoms were weight loss (49%), abdominal pain (16%), nausea/appetite loss (5%). Length of symptoms duration was only available for 10 cases and of those 30% had experienced symptoms for more than 3 months. The length of weight loss prior referral was only available for 9 cases with 45% having experience weight loss for more than 3 months. The number of primary care consultation for symptoms was recorded as 1 for most of the cohort
0
2
4
6
8
10
12
0-49 50-59 60-69 70-79 80-89
Nu
mb
er o
f ca
ses
Age band
Age band distribution

7
except one case who had 2 but 21 cases were recorded as having one secondary care consultation for the symptoms, 14 for having 2 and 5 for having 3. Referral routes All 43 cases were referred by GPs. Diagnostic tests Considering all diagnostic tests given as part of the diagnostic pathway the most common was endoscopy with 45 occurrences, 18 CT (various types) and 2 ultrasounds and other diagnostic tests were used. Patients had an average of 1.5 diagnostic tests (N:38) in primary care and 1.8 (N:38) in secondary care. Outcomes Two cases were diagnosed with cancer (upper GI and other (CUP)) and 34 cases were diagnosed with a non-cancer diagnosis. The overall number and types of disease are presented below. Table 6: Details of non-cancer diseases diagnosed
Disease type N
K44.9 Diaphragmatic hernia without obstruction or gangrene 11
D50.8 Other iron deficiency anaemias 4
K21.0 Gastro-oesophageal reflux disease with oesophagitis 3
K29.6 Other gastritis 2
K29.7 Gastritis 2
R63.4 Abnormal weight loss 2
A09.9 Gastroenteritis and colitis of unspecified origin 1
D50.9 Iron deficiency anaemia, unspecified 1
D64.9 Anaemia, unspecified 1
K22.7 Barrett oesophagus 1
K25.9 Gastric ulcer 1
K29.8 Duodenitis 1
K31.8 Other specified diseases of stomach and duodenum 1
K57.3 Diverticular disease of large intestine without perf or abscess 1
K80.1 Calculus of gallbladder with other cholecystitis 1
R10.1 Pain localized to upper abdomen 1
Stage Cancer stage data were not available but both cancer cases were referred to palliative care as first treatment. Interval times Table 7: Interval times (Median)
Interval times (median in days) (range) (N)
Referral first seen Referral to first diagnostic test
Referral to clinical diagnosis
GP referral – all cases 11 (1-29) (43) 14 (6-36) (38) 27 (6-82) (39)

8
Wythenshawe
Cohort details 50 records were retained for analysis, 18 males and 32 females, with an age range of 16-92 and median age of 67.5 years old. Figure 4: Age distribution
Performance, comorbidity, and symptoms
Data on performance and comorbidity were not available.
The main reported symptoms were weight loss (48%), abdominal pain (26%), nausea/appetite loss (16%). Length of symptom duration was recorded as being more than 3 months in 67% of the cases
No information on the number of primary care visits made for the symptoms was available but 33 cases had one secondary care visit while 6 cases had 2 and, 8 had more than 3 visits.
Referral routes All 50 cases were referred by GPs. Diagnostic tests Considering all diagnostic tests given as part of the diagnostic pathway the most common was endoscopies with 32 occurrences, 29 CT (various types) and 14 ultrasounds and other diagnostic tests were used. Patients had an average of 1.2 diagnostic tests in primary care (N:30) and 2 in secondary care (N:46). Outcomes Five cases of cancer were diagnosed four upper GI tract and one lower GI. 41 cases were diagnosed with at least one non-cancer disease. The overall number and types of disease are presented below. Table 7: Details of non-cancer diseases diagnosed
Disease type N
K44.9 Diaphragmatic hernia without obstruction or gangrene 8
D50.8 Other iron deficiency anaemias 7
K57.3 Diverticular disease of large intestine without perforation or abscess 7
K29.7 Gastritis 6
K29.6 Other gastritis 4
K31.7 Polyp of stomach and duodenum 3
K63.5 Polyp of colon 3
0
2
4
6
8
10
12
14
0-49 50-59 60-69 70-79 80-89 90+
Nu
mb
er o
f ca
ses
Age band
Age band distribution

9
A09.9 Gastro-enteritis and colitis 2
D50.9 Iron deficiency anaemia 2
K22.7 Barret oesophagus 2
K64.9 Haemorrhoids 2
N84.0 Polyp corpus uteri 2
D73.8 Benign splenic lesion 1
K20.X Oesophagitis 1
K29.8 Duodenitis 1
K50.0 Crohn’s disease 1
K52.9 Gastroenteritis and colitis 1
K59.0 Constipation 1
K62.3 Rectal prolapse 1
K80.2 Gallstones 1
K92.2 Gastro-intestinal haemorrhage, unspecified 1
L03.3 Cellulitis 1
M54.5 Lower back pain 1
N83.2 Benign ovarian cyst 1
R59.9 Enlarged benign lymph nodes 1
Stage Staging data is available in one case only and it is a late stage Treatment Table 8: Treatment by broad cancer types
Broad cancer type
Surgery Teletherapy Chemotherapy Specialist palliative
care
Active monitoring
Best supportive
care Total
Upper GI 1 2 1 4
Lower GI 1 1
Total 1 1 2 1 5
Interval times Table 9: Interval time (Median)
Interval time (Median in days) (range) (N)
Referral to date first
seen Referral to first diagnostic test
Referral to clinical diagnosis
Referral – all cases 13 (4-28) (47) 20 (7-131) (43) 44 (23-108) (17)
Referral - non- cancer and ‘all clear’ only
14 (4-28) (42) 20 (7-131) (38) 46.5 (33-108) (12)
Table 10: Mean time for cancer cases only
Interval time (Mean in days) (range) (N)
Referral to first seen Referral to first diagnostic test
Referral to clinical diagnosis
Referral to diagnosis communicated to
patients
10 (8-14) (5) 18 (9-28) (5) 27 (23-31) (5) 36 (25-56) (4)
Key points
• The cases recording are cancer and non-cancer cases. It does allow a representation of the referral pathway for both however the referrals were all 2 WW referrals and do not apply fully as comparators for the overall assessment of the MDC pathway.

10
• Overall data on symptoms are informative but the length of time of reported symptoms to GP to referral is limited.
• Data on diagnostic tests undertake in the primary care and secondary are informative as potential comparator.
• Both Oldham and Wythenshawe audits prove useful source of information in term of non-cancer diagnoses; i.e.: details of their symptoms and diagnostic tests.
Leeds Methodology
• The records of patients referred initially as tumour specific 2 week-wait (SCR) (upper GI and hepato-pancreato-biliary referrals) were retained.
• Data (Apr 2016 to Apr 2017) were extracted from the hospital system (PPM) and notes were also reviewed.
Results Cohort details 47 records were retained for analysis, 20 males and 27 females, with an age range of 29-91 and median age of 75 years old. Figure 2: Age distribution
Performance, Comorbidity and symptoms
Data on performance and comorbidity were not available The main reported symptoms were weight loss (66%), nausea/appetite loss (13%), abdominal pain (6%). Delays on reported symptom to referral were not available. Referral routes All 47 cases were referred by GPs. Diagnostic tests Based on all diagnostic tests, the most common test was endoscopy (72%) followed by CT (25%) there were records of chest X-rays, ultrasound and other diagnostics tests as well. Patients had an average of 1.5 diagnostic tests (N:35). Outcomes
0
5
10
15
20
25
0-49 50-59 60-69 70-79 80-89 90+
Nu
mb
er o
f ca
ses
Age band
Age band distribution

11
Based on the outcome status, three cases were diagnosed with cancer (lower GI, lung and other including CUP), one case had an in-situ carcinoma of the cervix and 35 had a ‘all test clear’ diagnosis, 8 needed further tests. Stage Stage was available for three cases and they were all late stage. Interval times Table 5: Interval times (Median)
Interval time (Median) (days) (range) (N)
Referral to date first
seen Referral to first diagnostic test*
Referral to clinical diagnosis
GP referral – all cases 11.5 (1-36) (38) 10 (0-36) (33) (pre-
referral 1) 14 (1-64) (38)
GP referral diagnosis ‘all clear only’
12 (1-36) (35) 10 (0-36) (32) 14 (1-64) (35)
Number of cancer cases are too small to allow calculation of interval times. Treatments Treatment data were recorded for two cases and there were surgery and chemotherapy. Key points
• Age distribution of the cohort selected present is biased by a high proportion of 70-79.
• Reported symptoms are as expected in a cohort of non-specific but concerning symptoms but lengths of symptoms are not given neither are performance or comorbidity data.
• Data on diagnostic tests show that most of the records underwent an endoscopy in line with the upper GI tract referrals selected for the audit.
• Interval times are short – the median time for referral to first diagnostic test is shorter that the median for referral to first indicating that some of the patients might have been referred as direct access. The clinical diagnostics are based on the endoscopies/CT results hence the
• short interval time of referral to diagnosis.
London
Method
Retrospective audit of 2 WW referrals for suspected upper GI tract cancer in North Middlesex (date of referral 2016) and BRUHT (date of referral 2016/2017).
North Middlesex
Results
Cohort details
31 records were retained for analysis, 18 males and 13 females, with an age range of 22-88 and median age of 60 years old.

12
Figure 5: Age distribution
Performance, comorbidity, and symptoms
No data on performance were given. 11 records had a comorbidity score 27 and 10 of those were recorded as mild.
The main reported symptoms were weight loss (55%), abdominal pain (26%). Length of symptoms was recorded as more than 3 months in 67% of the cases.
Referral routes All 31 cases were referred by GPs. Diagnostic tests Of the 24 of cases with a record of diagnostic test, endoscopy was the main diagnostic test with 100% of cases recorded – only one diagnostic test was reported by case. Outcomes No cancer cases were available, and no details of non-cancer cases were recorded although 20 cases had a date of clinical diagnosis. Interval times Table 11: Interval time (Median)
Stage Not applicable Treatment Not applicable
0
1
2
3
4
5
6
7
8
0-49 50-59 60-69 70-79 80-89
Nu
mb
er o
f ca
ses
Age band
Age band distribution
Interval time (Median in days) (range) (N)
Referral to date first
seen Referral to first diagnostic test
Referral to clinical diagnosis
GP referral – all cases 11 (0-50) (27) 39 (21-180) (24) 84.5 (19-180) (20)

13
BRUHT
Results
Cohort details
40 records were retained for analysis, 18 males and 22 females, with an age range of 26-86 and median age of 61.5 years old. Figure 6: Age distribution
Performance, comorbidity, and symptoms Only 20 cases had a performance score and most of them had a ‘0’ score ‘Able to carry out all normal activity without restriction.
The main reported symptoms were weight loss (50%), abdominal pain (42.5%) and nausea/appetite loss (10%). Length of symptoms duration was recorded for 15 cases as was the length of weight loss duration and in both cases 46% of patients experience symptoms duration and weight loss for more than 3 months prior to referral.
Referral routes 37 cases were referred by GP and 3 were emergency. Diagnostic tests Overall the main diagnostic test was endoscopy with 25 occurrences, 19 CT were recorded, 11 Ultrasound and 10 others including Chest X-rays. Patients had an average of 1.6 diagnostic tests (N:31) Outcomes Three cases of cancer were recorded two were upper GI, one unspecified. Interval times Data on the 28 days standard were available for 33 cases, 30% were under 28 days and 70% were over. One cancer was under 28 days (26 days), one above (65 days) and third case did not have any relevant data. Median referral to diagnosis was 49 days (8-285). Stage Data on stage were not available
0
2
4
6
8
10
12
0-49 50-59 60-69 70-79 80-89
Nu
mb
er o
f ca
ses
Age band
Age band distribution

14
Treatment Data in treatment were not available.
Key points
• Age band distributions are similar in both audits – NMUH and BRUHT and despite not being an expected distribution of cancer cases, it has a wider cover in term of age band – the number of cases under 49 is high in both audits may be reflective of a younger population in London.
• Data on symptoms are complete and expected of the cases presenting with non-specific but concerning symptoms with a certain amount of data on the length of symptom before referral.
• Diagnostic tests data show that endoscopy is the imaging test in both audits consistent with suspected upper GI tract referrals.
• Interval times presented on NMUH data show that the 2 WW target is achieved in term of referral to first seen but that patients experienced a long wait to clinical diagnosis (median of 88.5 days) – the data do not include any cancer diagnosis – Interval times are limited to referral to diagnosis (median of 49 days). The 28 days interval has been calculated and 30% of the cases were given a diagnosis within 28 days.
Oxford
Method
The data were from an EMIS extraction provided by the Oxfordshire CCG. Cases were selected by looking for any patient who had presented with one or more of the SCAN symptoms in the 2 years before SCAN became available (Mar 2015 – Mar 2017) and was diagnosed with cancer. Referral routes were any available to the GP during that time.
Results
Cohort details
661 records were retained for analysis, 302 males and 359 females, with an age range of 40-98 and median age of 71 years old.
Figure 7: Age distribution
0
50
100
150
200
250
40-49 50-59 60-69 70-79 80-89 90+
Nu
mb
er o
f ca
ses
Age band
Age band distribution

15
Performance, comorbidity, and symptoms
Data on performance and comorbidity were not available.
The main reported symptoms were pain (78%), fatigue (17%), weight loss (11%). Length of symptoms was recorded as less than three months in 32% of cases and more than 3 months in 67% of the cases. The recording of symptoms was by individual symptom from the time it was initially recorded by the GP to the referral to secondary care. The overall data are presented below. Table 12: Length of first reporting of symptoms to GP before referral to referral secondary care
Symptom type
Length of time Weight Loss Pain Nausea and
vomiting Fatigue Loss of appetite
Less than a week 3 12 1
0 to four weeks 11 21 5 8 1
Between 5 and 12 weeks 20 74 8 10 6
Between 3 and 6 months 11 69 10 16 1
More than 6 months 30 340 21 76 2
Not applicable 586 145 617 550 651
Total 661 661 661 661 661
Referral routes All 661 cases were referred by GPs.
The number of consultations for the symptoms prior to referral to secondary care was recorded and data are presented below: Table 13: Number of GP consultations by symptom type
Symptom type
Number of consultations
Weight loss Pain Nausea and
vomiting Fatigue Loss of appetite
1 47 268 32 76 9
2 12 96 8 27 1
3 5 60 2 2
4 6 25 5
5 2 23 1
6 1 17 2
7 13
8 1 1
9 2
10 2
11 3
12 1
13 1
14 2
19 2
22 1
N/A 586 145 617 550 651
Total 661 661 661 661 661
Additional data on the overall number of primary and secondary care encounters for each patient were given however they are not symptom specific (Table 14).

16
Table 14: Primary and secondary care visits (for symptoms and others) in the 2 years prior to diagnosis
Average (days) Median(days) Range (days)
Primary care total number care encounters* 41.7 34 0-263
Secondary care total number care encounters** 0.9 0 0-9
* PrimCareTot – total number of primary care encounters in the two years before the cancer diagnosis (please note these are consultations for any reason, not necessarily the patient’s non-specific symptom(s)). **SecCareTot – total number of secondary care encounters in the two years before the cancer diagnosis (please note these are
consultations for any reason, not necessarily the patient’s non-specific symptom(s)).
Figure 8: Symptoms by age bands
Referral routes All 661 cases were referred by GPs. Data on types of referral was available for 283 cases included situ-cases other than breast. Only the cancer diagnoses and breast in situ cases were retained in the figure below. Figure 9: First referral routes of broad cancer types diagnosed
0.0
10.0
20.0
30.0
40.0
50.0
60.0
70.0
80.0
90.0
Weight loss Pain Nausea andvomiting
Fatigue Loss of appetite
Per
cen
tage
Symptom
Symptom by age band
40-49
50-59
60-69
70-79
80-89
90+
0%
20%
40%
60%
80%
100%
120%
Proportion of TWW and urgent/routine referral by cancer types
Two week wait
urgent and routine(inc other)

17
Diagnostic test No data on diagnostic tests were given Outcomes All cases were cancer cases and details of cancer types are given below Table 15: Details of cancer types diagnosed
Cancer type N
Urology 134
Lower GI 82
Breast 73
Upper GI 73
Lung 69
Skin cancer NMSC 54
Haematology 46
Gynae 43
Skin 29
Head and neck 15
Central nervous system 10
Other 9
Breast (in situ) 8
Bone and soft tissue 6
Urology (in situ) 4
Lower GI (in situ) 2
Central nervous system met 1
Gynae (in situ) 1
Lower GI/ Upper GI 1
Skin in situ 1
Total 661
Table 16: Cancer types by symptoms
Cancer type Weight
loss Pain
Nausea & vomiting
Fatigue Appetite
loss Total
Urology 11 106 7 19 2 134
Lower GI 10 68 3 8 3 82
Breast 54 6 19 73
Upper GI 16 58 9 7 1 73
Lung 15 51 5 10 69
Skin cancer NMSC 5 39 6 13 54
Haematology 6 34 1 13 3 46
Gynae 3 40 3 3 43
Skin 5 22 5 1 29
Head and neck 1 11 1 3 15
Central nervous system 1 6 2 3 10
Other 9 1 1 9
Breast (in situ) 3 5 8
Bone and soft tissue 1 5 6
Urology (in situ) 4 1 4
Lower GI (in situ) 2 2
Central nervous system met 1 1
Gynae (in situ) 1 1
Lower GI/ Upper GI 1 1 1
Skin in situ 1 1 1
Total 75 516 44 111 10 661

18
Table 17: Cancer types by age bands
Age band
Cancer type 40-49 50-59 60-69 70-79 80-89 90+ Total
Urology 12 17 27 47 25 6 134
Lower GI 1 10 20 20 26 5 82
Breast 13 22 18 9 7 4 73
Upper GI 6 13 19 23 9 3 73
Lung 4 3 17 28 15 2 69
Skin cancer NMSC 4 13 17 13 7 54
Haematology 5 6 7 13 14 1 46
Gynae 7 7 11 13 2 3 43
Skin 2 7 3 8 9 29
Head and neck 5 3 3 2 2 15
Central nervous system 1 1 4 3 1 10
Other 2 4 1 2 9
Breast (in situ) 1 1 5 1 8
Bone and soft tissue 3 1 1 1 6
Urology (in situ) 1 1 2 4
Lower GI (in situ) 1 1 2
Central nervous system met 1 1
Gynae (in situ) 1 1
Lower GI/ Upper GI 1 1
Skin in situ 1 1
Total 52 100 154 191 128 36 661
Interval times Table 18: Interval times (Median)
*Referral is referred as referral 1 in the data, as is the diagnosis – data without a referral routes are not included.
Stage No data on stage were given Treatment No data on treatment
Key points
• Despite the large number of records retained for the audit, the limited number of data items as well as clarity (symptoms, length of symptoms between GP representations and referral and types of cancer) limits the potential analysis and usefulness of the data.
• The age distribution is normal and representative of cancer distribution in the general population although it does not include any cases below the age of 40.
• Many of the reported cancers are not typical of those expected for patients presenting with non-specific but concerning symptoms and likely to be due to the criteria used to select the records- i.e.: any referral with at least one non-specific but concerning symptom considered in the SCAN which does not exclude additional symptoms more often associated with a well-defined suspected cancer pathway. However, when considering those presenting with the weight loss they are predominantly upper GI tract, lung and lower GI tract. A very large proportion of cases are reported as having presented with pain.
• Referral routes (2ww, urgent, routine) are recorded for 283 cases as well as the pathway
Interval time (Median in days) (range) (N)
Referral* to diagnosis*
2ww referral 67 (2-1020) (116)
Urgent-routine 294 (0-997) (151)
19
although there is a lack of clarity as to whether the referral and diagnosis dates are related the recorded referral routes.
• The length of time between the symptoms being reported to the GP and referral as well as the number of consultations for each symptom are informative
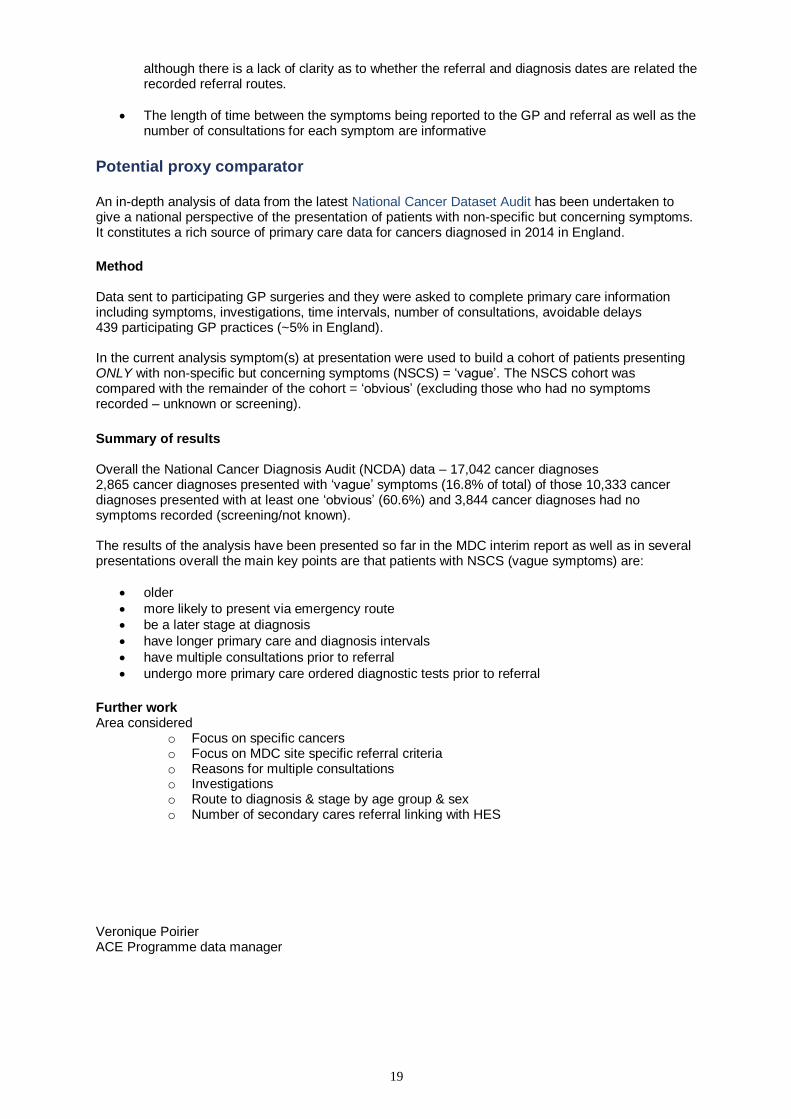
Potential proxy comparator
An in-depth analysis of data from the latest National Cancer Dataset Audit has been undertaken to give a national perspective of the presentation of patients with non-specific but concerning symptoms. It constitutes a rich source of primary care data for cancers diagnosed in 2014 in England.
Method Data sent to participating GP surgeries and they were asked to complete primary care information including symptoms, investigations, time intervals, number of consultations, avoidable delays 439 participating GP practices (~5% in England). In the current analysis symptom(s) at presentation were used to build a cohort of patients presenting ONLY with non-specific but concerning symptoms (NSCS) = ‘vague’. The NSCS cohort was compared with the remainder of the cohort = ‘obvious’ (excluding those who had no symptoms recorded – unknown or screening).
Summary of results Overall the National Cancer Diagnosis Audit (NCDA) data – 17,042 cancer diagnoses 2,865 cancer diagnoses presented with ‘vague’ symptoms (16.8% of total) of those 10,333 cancer diagnoses presented with at least one ‘obvious’ (60.6%) and 3,844 cancer diagnoses had no symptoms recorded (screening/not known). The results of the analysis have been presented so far in the MDC interim report as well as in several presentations overall the main key points are that patients with NSCS (vague symptoms) are:
• older
• more likely to present via emergency route
• be a later stage at diagnosis
• have longer primary care and diagnosis intervals
• have multiple consultations prior to referral
• undergo more primary care ordered diagnostic tests prior to referral
Further work Area considered
o Focus on specific cancers o Focus on MDC site specific referral criteria o Reasons for multiple consultations o Investigations o Route to diagnosis & stage by age group & sex o Number of secondary cares referral linking with HES
Veronique Poirier ACE Programme data manager