Embed Size (px)
DESCRIPTION
Quantifying CMAQ Simulation Uncertainties of Particulate Matter in the Presence of Uncertain Emissions Rates. Wenxian Zhang, Marcus Trail, Alexandra Tsimpidi , Yongtao Hu , Athanasios Nenes , and Armistead Russell CMAS Annual Conference Oct 17, 2012. RD83479901. Acknowledgements. - PowerPoint PPT Presentation
Citation preview
Quantifying CMAQ Simulation Uncertainties of Particulate Matter in the
Presence of Uncertain Emissions Rates
Wenxian Zhang, Marcus Trail, Alexandra Tsimpidi, Yongtao Hu, Athanasios Nenes, and Armistead Russell
CMAS Annual ConferenceOct 17, 2012

Acknowledgements
• U.S. EPA• Southern Company/ Georgia Power• Phillips 66
RD83479901
Overview• Uncertainties in regional air quality models• Method for uncertainty analysis - Monte Carlo method - Reduced-form model based on high-order DDM sensitivity analysis
• Quantification of uncertainties in simulated PM2.5 concentrations due to uncertain emissions
• Quantification of uncertainties in model response to emissions control in the presence of uncertain emissions
• Quantification of uncertainties in first-order sensitivities of PM2.5 due to emission uncertainties
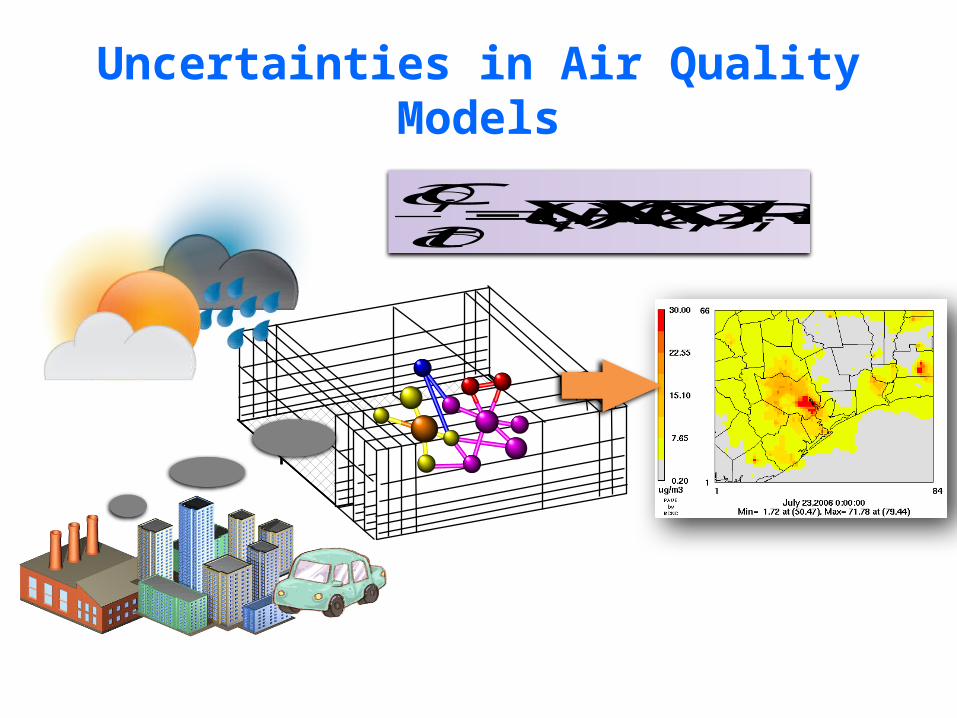
Uncertainties in Air Quality Models
ERCKuCt
Ciii
i
)()(
Original AQM
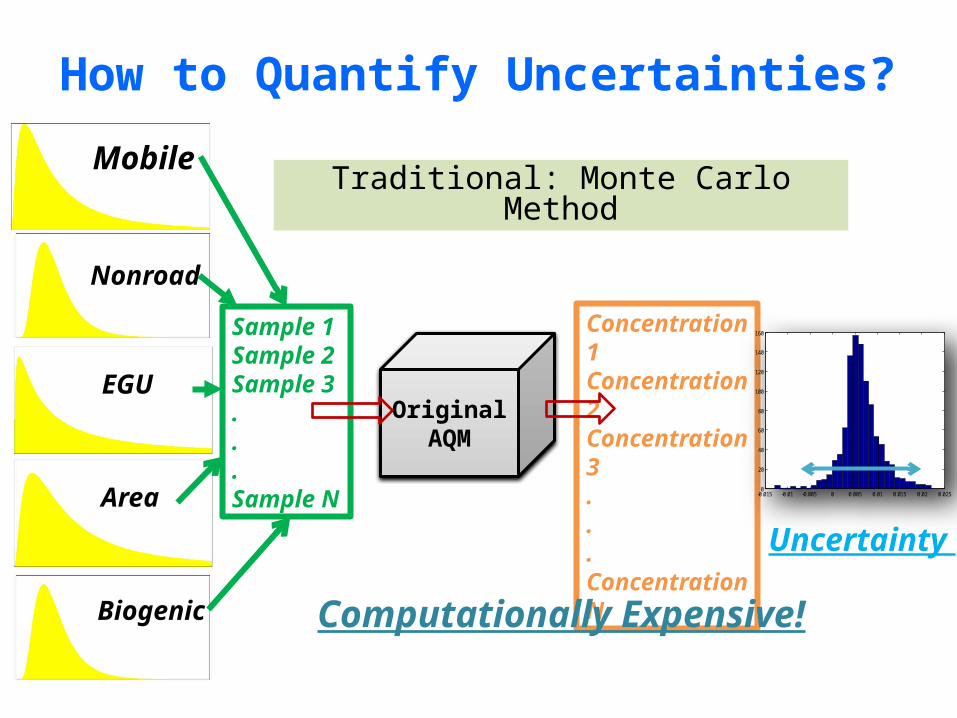
How to Quantify Uncertainties?
Concentration 1Concentration 2Concentration 3...Concentration N
Sample 1Sample 2Sample 3...Sample N -0.015 -0.01 -0.005 0 0.005 0.01 0.015 0.02 0.025
0
20
40
60
80
100
120
140
160
Computationally Expensive!
Uncertainty
Traditional: Monte Carlo Method
Nonroad
Mobile
EGU
Area
Biogenic
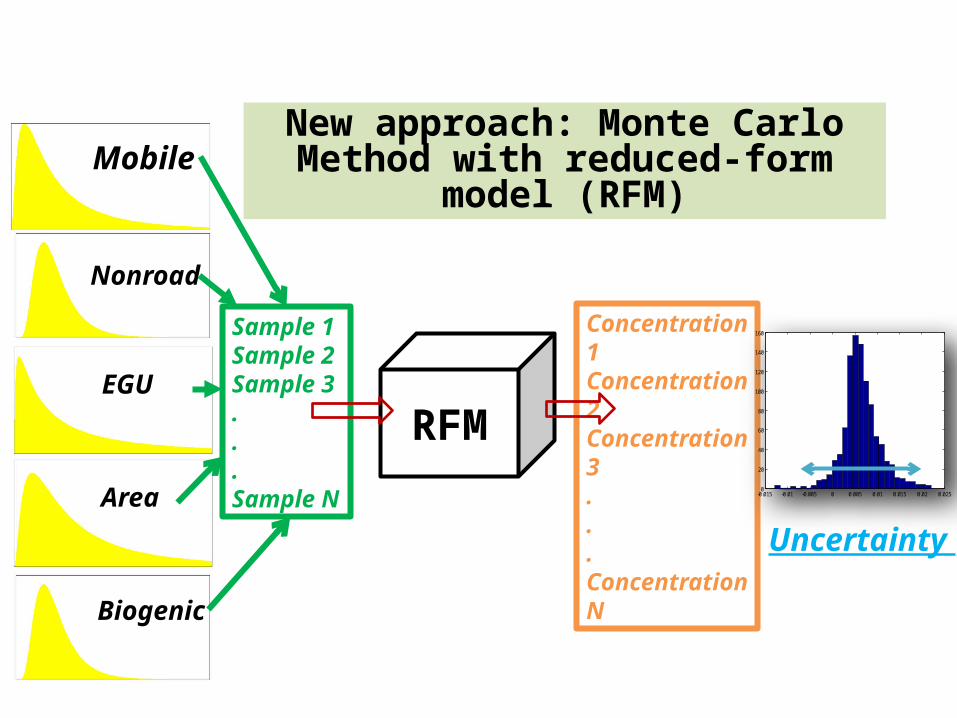
RFM
Concentration 1Concentration 2Concentration 3...Concentration N
Sample 1Sample 2Sample 3...Sample N
New approach: Monte Carlo Method with reduced-form model (RFM)
-0.015 -0.01 -0.005 0 0.005 0.01 0.015 0.02 0.0250
20
40
60
80
100
120
140
160
Uncertainty
Nonroad
Mobile
EGU
Area
Biogenic
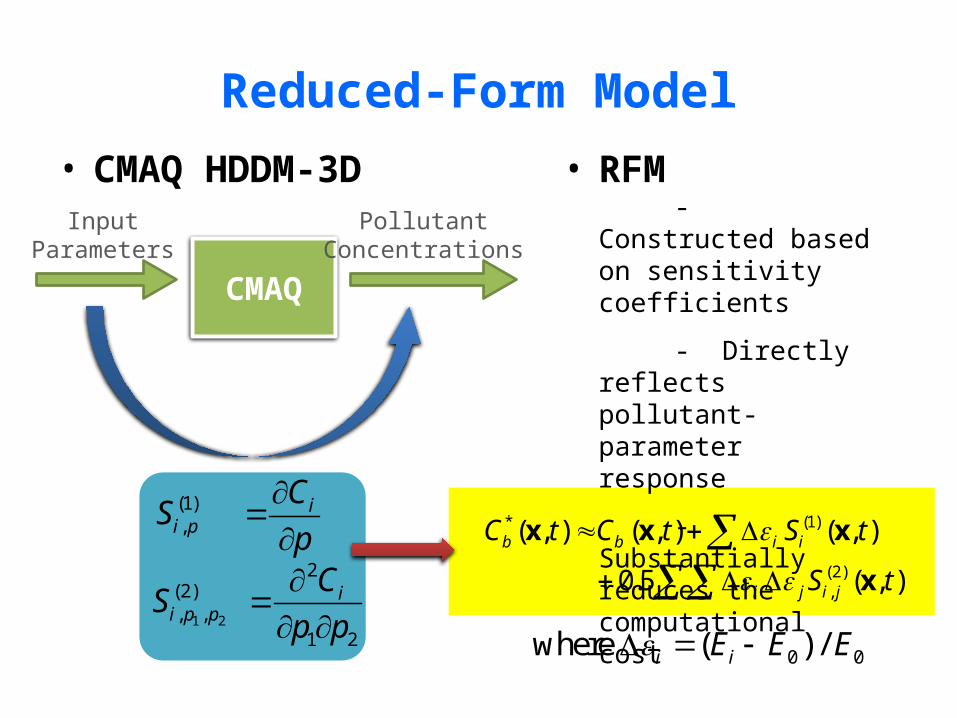
Reduced-Form Model
* (1)
(2),
( , ) ( , ) ( , )
0.5 ( , )
b b i i
i j i j
C t C t S t
S t
x x x
x
• CMAQ HDDM-3D
CMAQ
InputParameters
PollutantConcentrations
(1), ii p
CS
p
1 2
2(2), ,
1 2
ii p p
CS
p p
• RFM - Constructed based on
sensitivity coefficients
- Directly reflects pollutant-parameter response
- Substantially reduces the computational cost
0 0where ( ) /i iE E E

Evaluation of RFM
[Zhang et al., 2012 GMD]
Nitrate concentration with 50% reductions in domain-wide NOx
Nitrate concentration with 50% reductions in domain-wide SO2
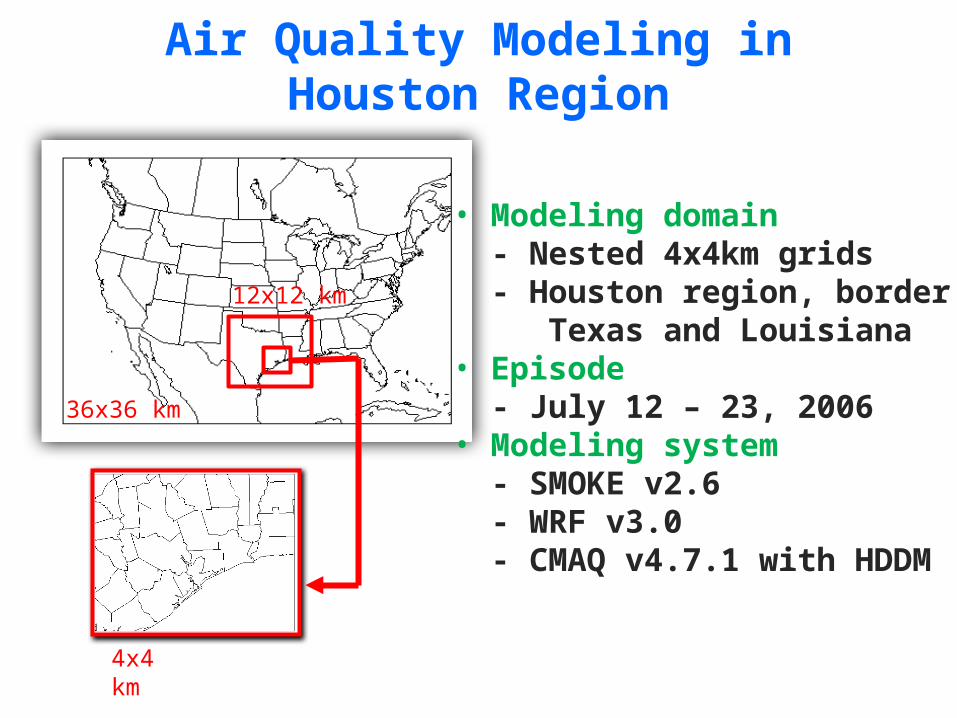
Air Quality Modeling in Houston Region
36x36 km
12x12 km
4x4 km
• Modeling domain - Nested 4x4km grids - Houston region, border of Texas and Louisiana• Episode - July 12 – 23, 2006• Modeling system - SMOKE v2.6 - WRF v3.0 - CMAQ v4.7.1 with HDDM
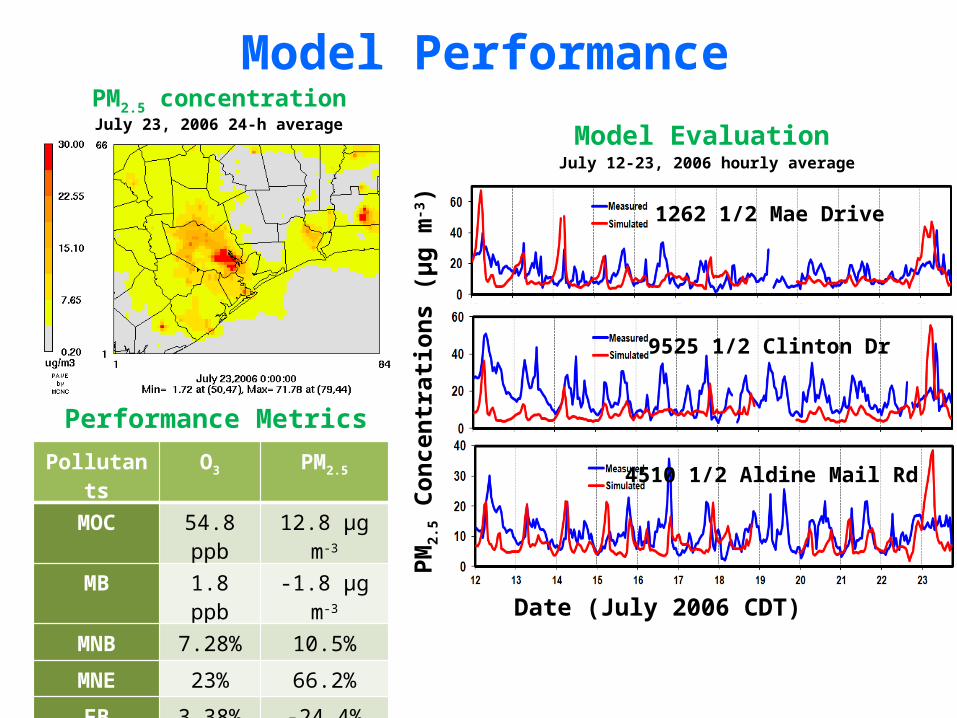
Model PerformancePM2.5 concentrationJuly 23, 2006 24-h average
9525 1/2 Clinton Dr
1262 1/2 Mae Drive
4510 1/2 Aldine Mail Rd
Date (July 2006 CDT)
PM2.
5 Con
cent
ratio
ns (μ
g m
-3)
Model EvaluationJuly 12-23, 2006 hourly average
Pollutants O3 PM2.5
MOC 54.8 ppb 12.8 μg m-3
MB 1.8 ppb -1.8 μg m-3
MNB 7.28% 10.5%
MNE 23% 66.2%
FB 3.38% -24.4%
FE 22.26% 51%
Performance Metrics

Emission Uncertainties and Sampling• Log-normal distribution• Emission uncertainty factors [ E / f, E x f ]
• Random sampling with N = 1000
Source Categories
Source Categories
Uncertainty Factors
References
EGU 1.03 Napelenok, 2011
Mobile 2 Hanna et al., 2001
Non-road 1.5 Chi et al., 2010
Area 2 Hanna et al., 2001
Biogenic 3 Hanna et al., 2005
E/E
0
Sampling Results
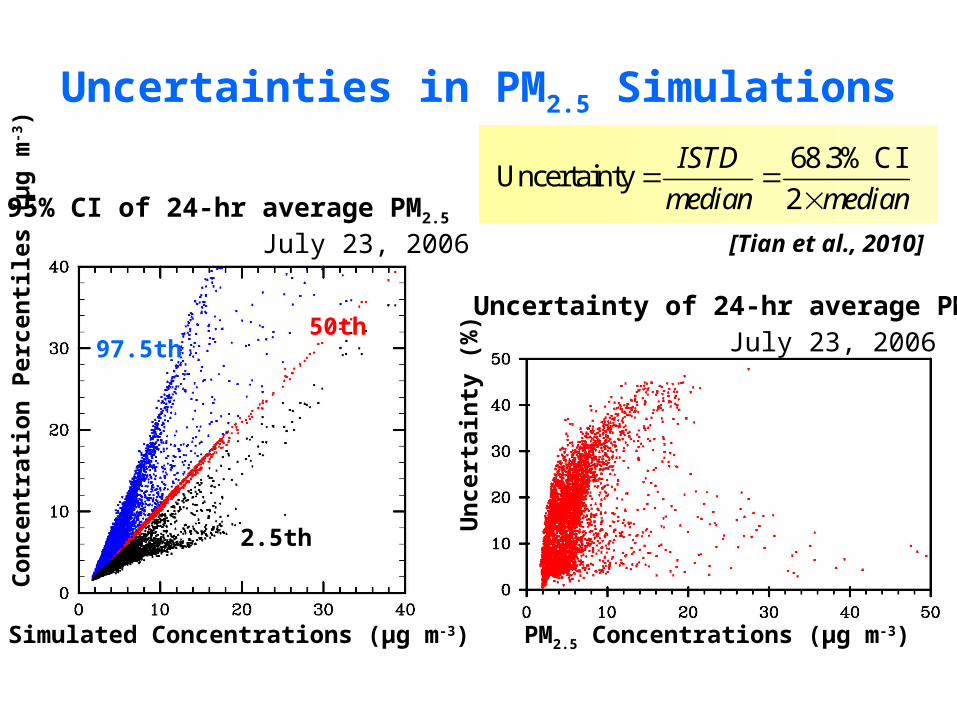
Uncertainties in PM2.5 Simulations
PM2.5 Concentrations (μg m-3)
Unc
erta
inty
(%)
Simulated Concentrations (μg m-3)
Con
cent
ratio
n Pe
rcen
tiles
(μg
m-3
)
2.5th
97.5th50th
95% CI of 24-hr average PM2.5
July 23, 2006
Uncertainty of 24-hr average PM2.5
July 23, 2006
68.3% CIUncertainty
2
ISTD
median median
[Tian et al., 2010]
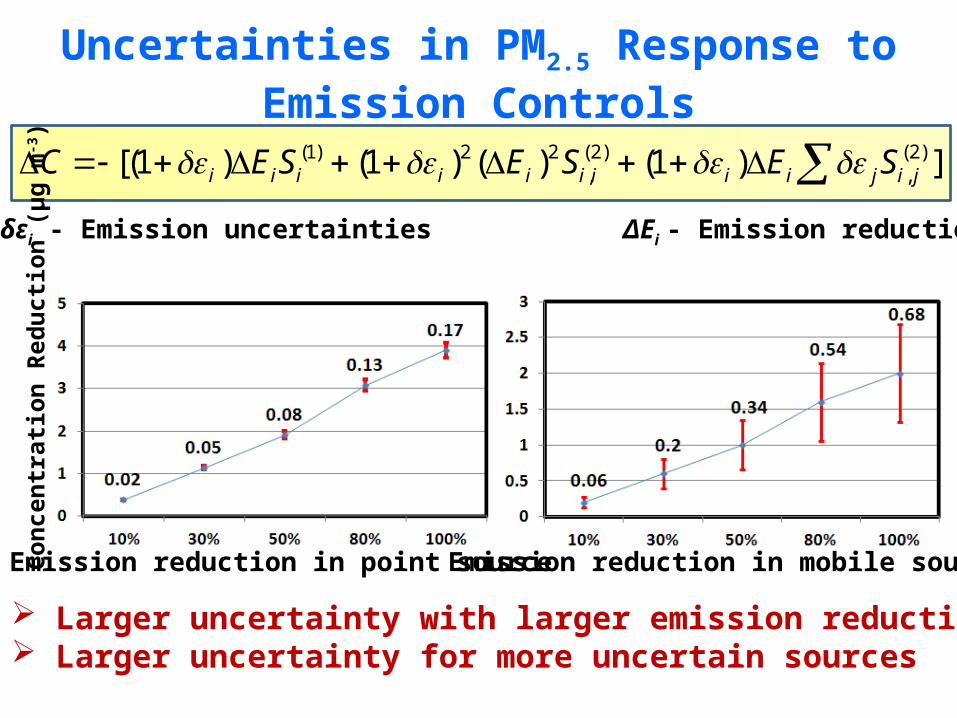
Uncertainties in PM2.5 Response to Emission Controls
Emission reduction in point source Con
cent
ratio
n Re
ducti
on (μ
g m-
3)
(1) 2 2 (2) (2), ,[(1 ) (1 ) ( ) (1 ) ]i i i i i i i i i j i jC E S E S E S
Emission reduction in mobile source
Larger uncertainty with larger emission reduction Larger uncertainty for more uncertain sources
δεi - Emission uncertainties ΔEi - Emission reduction
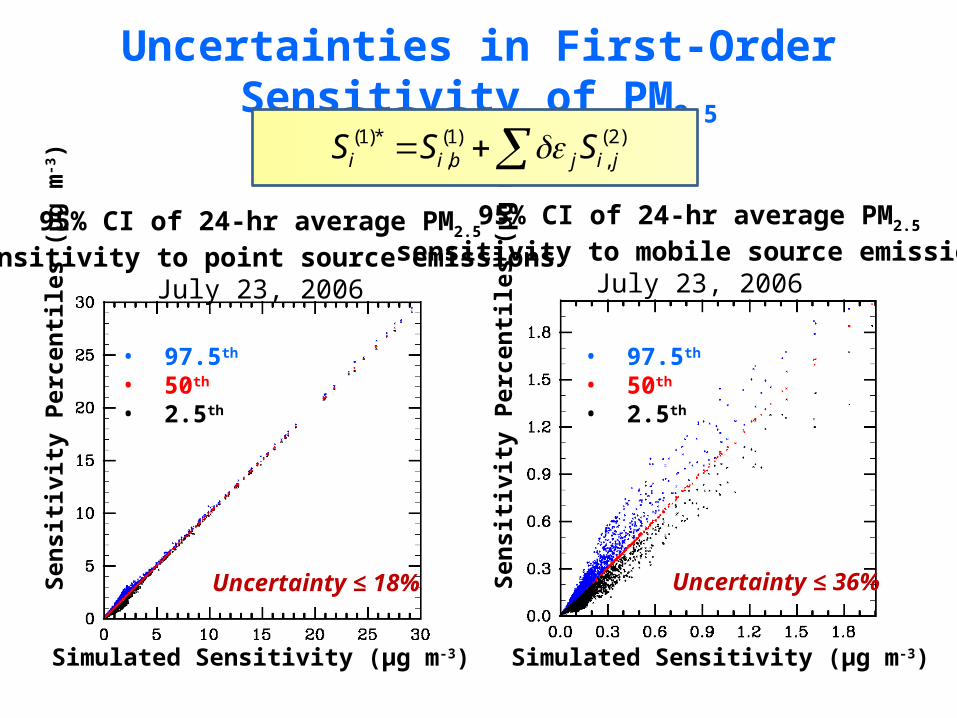
Uncertainties in First-Order Sensitivity of PM2.5
95% CI of 24-hr average PM2.5
sensitivity to point source emissionsJuly 23, 2006
Sen
sitiv
ity P
erce
ntile
s (μ
g m-
3)
Simulated Sensitivity (μg m-3)
• 97.5th
• 50th
• 2.5th
95% CI of 24-hr average PM2.5
sensitivity to mobile source emissionsJuly 23, 2006
• 97.5th
• 50th
• 2.5th
Sen
sitiv
ity P
erce
ntile
s (μ
g m-
3)
Simulated Sensitivity (μg m-3)
(1)* (1) (2), ,i i b j i jS S S
Uncertainty ≤ 36%Uncertainty ≤ 18%

Summary• Reduced-form model has been constructed using first- and
second-order sensitivities obtained from CMAQ-HDDM-3D• Quantified emission-associated uncertainties of simulated 24-hr
average PM2.5
- Lower than 45% in the presence of assumed emission inventory uncertainties - Does not capture upset emission biases - Can be easily applied to different combinations of emission uncertainties• Quantified uncertainties of emission control response - Higher uncertainties with larger emission reductions - Higher uncertainties for more uncertain emissions
• Quantified uncertainties of first-order PM2.5 sensitivities
- Dependent on the uncertainty of the sensitivity parameter
• Future studies - Bias analysis using observations - Control strategy optimization

Questions?